waste recycling - international solid waste association · this law was designed to enhance solid...
TRANSCRIPT

International Conference on Solid Waste 2011 Moving Towards Sustainable Resource Management
Waste Recycling
200 Proceedings of the International Conference on Solid Waste 2011- Moving Towards Sustainable Resource Management,
Hong Kong SAR, P.R. China, 2 – 6 May 2011
COST RECOVERY MECHANISM TO ENHANCE SOLID WASTE MANAGEMENT IN BAYAWAN CITY, PHILIPPINES: EXPERIENCES AND POTENTIALS
J.D. Boorsma 1*, R.G. Gaudiel 2, J.G. Paul 3 1 Deutsche Gesellschaft für Internationale Zusammenarbeit (GIZ), Bayawan City, Philippines
2 Local Government Unit, Mayors Office, Bayawan City, Philippines 3AHT Group AG, GIZ-AHT Project Office SWM4LGUs, Iloilo, Philippines * Corresponding author. Tel: +63(0)354300187, Fax: +63(0)355310728,
E-mail: [email protected]
ABSTRACT Waste disposal remains a challenge for many municipalities in the Philippines. Main reasons are restricted funds in combination with lack of knowledge and low grade solid waste management (SWM) systems. The presented paper applies Full Cost Accounting (FCA) for the Bayawan City SWM system and discusses issues and impacts of a newly applied “Pay-As-You-Throw” (PAYT) system. Results show that by requesting a minimal fee for waste collection, a significant waste diversion increase for all types of waste materials except for residuals can be obtained. The most substantial diversion is observed for bio-waste whereas the collection rate of such materials declined from 62 to 16 percent in 2010. With an average organic content of 60 percent, PAYT can be considered as a key option to improve the waste disposal situation in the Philippines. Furthermore, the municipality can enhance the profitability of their SWM centre by inviting 3rd party users for waste disposal and by exploring options for recovery of Resource Derived Fuels (RDF).
Keywords: Philippines, Cost recovery, Waste diversion, Full cost accounting, Pay-As-You-Throw
Introduction
In the Philippines, the latest renewal of the waste management legislation dates back to January 2001, when Republic Act 9003, known as the Ecological Solid Waste Management Act of the Philippines, was released. This law was designed to enhance solid waste management (SWM) for the various stakeholders on all levels of intervention. It especially aimed to support local Solid Waste Management (SWM) systems of the primarily tasked Local Government Units (LGU). However, evaluating the actual effects reached so far, the efficiency of law implementation seems questionable since sector development remains rather slow and most municipalities are far behind the set legal targets in their implementation schedules.
Bayawan City is a medium size City with a population of 110,250 [1] located at the southern tip of Negros Island. As in many other cities in the Philippines, Bayawan was challenged with various waste management problems. Consequently, the city drafted a SWM plan which manifests proposed SWM programs and interventions for a time span of 10 years. This plan included the implementation of a municipal SWM centre and a refinancing mechanism by users. In April 2010, Bayawan City inaugurated the Bayawan City Waste Management and Ecology Centre. With this, approximately 35 percent of the population are provided with SWM services. For this part of the community, the “Pay-As-You-Throw” (PAYT) principle was proposed and validated within a new local ordinance. With the new PAYT mechanism, waste diversion for various types of waste is encouraged likewise. The largest waste diversion can be realized by reducing the amount of bio-waste collected since such waste components were dominating prior to introduction of PAYT. By reducing the amounts of bio-waste, considerable cost savings result for both collection and disposal. Furthermore, amounts of leachate and gas produced in the landfill can be reduced. Hence, the LGU constructed a new landfill to provide the needed barriers and protection measures in order to prevent environmental impacts. To safeguard sustainable operation of the landfill and municipal SWM services, the LGU proposed a new policy which integrates mechanisms to enhance waste segregation and to increase material recovery. Full Cost Accounting (FCA) was used as a tool to identify the actual cost incurred for SWM. FCA together with the revenues generated by the PAYT scheme enables the LGU to review the actual cost scenario. Based on the experiences made with PAYT, enhancement measures are proposed to further increase waste diversion effects and system profitability.

Proceedings of the International Conference on Solid Waste 2011- Moving Towards Sustainable Resource Management,
Hong Kong SAR, P.R. China, 2 – 6 May 2011 201
Materials and Methods
Framework for Full-Cost-Accounting
For the majority of municipalities in the Philippines, the understanding for total expenditures of SWM and the need to refinance municipal services to sustain SWM systems is rather meagre. The actual money available for SWM services is often based on the outcome of budget negotiations. FCA is considered as a useful tool to clarify system and service costs and to support planning and SWM budgeting. Other reasons to apply FCA are: (a) to identify hidden costs, (b) to trace and reform inefficiencies of a program, (c) to evaluate scenarios considering financial aspects and potential environmental impacts on SWM and (d) to investigate the potential for implementing new and innovative systems, especially to secure refinancing based on user fees whereby citizens participation and incentives for waste reduction at source are provided likewise [2]. Figure 1, represents the approach used to form the FCA in Bayawan City.
Figure 3. Schematic overview of the Full Cost Accounting (FCA) applied in Bayawan City (adapted from [2])
Limitations
Data collection in the Philippines is a rather challenging task. Often, data are not collected in a proper manner and if collected follow ups are seldom performed on a regular basis. With regard to the waste characterization studies (WACS) performed in the years 2003 and 2009 there were discrepancies observed in the end of pipe (EOP) data. Probably these discrepancies were caused since a 3 day characterisation was used instead of the 7 day characterisation in 2003. It is very plausible that people do not use every collection schedule offered to throw their waste. Therefore, the EOP data from 2009 were disregarded in this study and the actual data from the newly installed weighbridge was used. However, the waste generation data from 2009 show no significant difference if compared with data from the 2003 survey for most relevant

202 Proceedings of the International Conference on Solid Waste 2011- Moving Towards Sustainable Resource Management,
Hong Kong SAR, P.R. China, 2 – 6 May 2011
parameters. During these assessments, samples were taken from selected waste generators to analyse amounts of biodegradable, recyclable, residual and special wastes in weight and volume and to provide the needed extrapolations and projections to support SWM planning.
Results and Discussion
Bayawan City spends around a quarter of a million US dollars annually for providing municipal SWM services to the community. Main part of this budget is utilized for waste disposal followed by waste collection. With the new PAYT, the LGU is now enabled to generate income. The average collected amount within the years 2009 and 2010 is approximately $5,000. Besides, the desired waste diversion occurred within this time period as well, whereby visible changes in the waste composition of collected waste were observed. A sharp decline for both biodegradable and recyclable materials resulted after PAYT implementation. In the following paragraphs, the PAYT scheme in place is discussed together with various encountered issues during implementation.
Table 3. Overview of SWM costs per activity
Allocation per Activity 20103 (in US$1)
Particular Reduction at Source
Collection Composting Disposal2 Total
Salaries & Wages 24,687 36,093 22,944 10,751 94,475 Vehicle & Equipt Oper & Maint. Cost 880 17,141 6,026 13,636 37,684 Buildings & Grounds Maintenance - - 4,527 17,427 21,955 Utilities and other Indirect Costs 2,597 6,059 6,534 12,672 27,872 Depreciation of Capital Outlay 796 5,907 7,713 28,307 42,724 Amortization of Back-end costs - - 442 5,492 5,934 Depreciation of Up-front costs - - 676 676 1,352 Contingency 3,186 7,172 5,376 9,786 25,520 Total 32,146 72,373 54,248 98,748 257,515
1. Exchange rate: 1US$=44PHP. 2. Includes monitoring and aftercare. 3. includes planning and management costs.
Pricing garbage by the bag
Revenues from the local users have to be regarded as an important source to justify the establishment and financing of new projects and to operate improved SWM services in a sustainable way. The implemented PAYT scheme requires that Bayawan City citizens purchase one sticker per garbage bag (cement size bag, approximately 25 litres) disposed. Each has a sticker which can be acquired at authorized selling centres for a price of more or less US $ 0.05. The system in place generates annually revenues of roughly US$ 5,000. With this, the cost recovery percentage so far reaches only 2 percent of the total SWM budget. However, increase of fees can be gradually implemented later on. At this development stage it seems more important to gain social acceptability of residents first.
Impacts and issues
During the last years, several changes and modifications were made in the SWM system of Bayawan City. The most significant ones are the implementation of waste segregation at source and the PAYT. PAYT is not only limited to recycling, it also encourages to compost and to reduce waste at source. Since the year 2006, waste segregation at source is strictly implemented by the LGU. A large portion of the biodegradable waste is now composted at household level due to the new policy. During the period 2003-2010 the amount of biodegradable waste collected could be reduced almost by half from 4.4 to 2.5 tons/day whereby the overall organic waste collection decreased from 62 to presently 16 percent. With that, related negative
Proceedings of the International Conference on Solid Waste 2011- Moving Towards Sustainable Resource Management,
Hong Kong SAR, P.R. China, 2 – 6 May 2011 203
environmental impacts such as leachate and landfill gas production can be minimized as well. Furthermore, since the last waste characterisation from 2003, the amounts of recyclables drastically dropped. The amounts were reduced from almost half ton a day to presently 37 kg/day. Main reasons behind may be the significant change in the amount of recyclables collected at source by the private sector as well as the change in definition and markets of recyclables over time.
Without intervention, one would expect all types of waste to increase due to economical development, population growth and urbanization. However, during the period 2003 to 2009 only the amounts of residuals collected increased from 721 to 1,771 kg/day. This increase is higher compared to the increase in the generation of residuals over the years. This can be attributed to the efforts of the municipality to enhance general collection efficiency but also due to the efforts for awareness raising among residents. Besides, the municipality increased enforcement activities in line with the new policy. Consequently, people became more aware and shifted away from former common practices like burying and burning of waste.
Conclusions
In developing economies, financing solid waste management systems is one of the main hindering aspects to enhance systems and to provide sustainability. Common reasons mentioned for failures to enhance SWM systems are the lack of financial resources and expertise as well as other, more pressing development needs. Often decision makers are unaware of legal and environmental issues and lack knowledge regarding SWM systems. The applied Full Cost Accounting (FCA) assists decision makers to better understand constraints and benefits of their SWM systems by clarifying budget needs and system components in a transparent and comprehensive manner.
The introduced Pay-As-You-Throw (PAYT) system proved useful during the first implementation phase in 2009 and 2010. Although the LGU charges citizens only with minimal fees so far, the new sticker system motivates users to actively avoid waste generation at source, for example through composting, reuse or selling of materials, hereby justifying the efforts of the LGU related to PAYT. The largest waste diversion was noticed on the decreasing collection of biodegradable waste, whereas the collection rate for such materials decreased from over 60 percent to 16 percent in the time period 2003 to 2010. With this reduction, pressure on the waste disposal facility is minimized by reducing the volume of waste disposal. Likewise, emissions of leachate and gas can be reduced. Furthermore, a sharp drop was noticed for recyclable materials as well. Main reasons for this change are enhanced waste segregation at source, the increase of formal waste markets, improved conditions for the informal sector and the new PAYT scheme.
In order to improve income and sustainability of the new waste management centre, it is recommended that the municipality drafts an ordinance to establish tipping fees for residual waste acceptance. Based on that, the municipality can share the disposal costs with 3rd parties. As a result, the price per ton waste delivered to the waste management centre could be decreased. Additionally, the municipality needs to explore options for recovery of Refuse Derived Fuels.
The results of this research show that the implemented PAYT resulted in far reduced organic waste disposal at household level so far. Hence, it is hoped that the PAYT scheme can be replicated for planning purposes and SWM system enhancements in other municipalities in the Philippines as well.
Acknowledgements
The authors wish to thank Bayawan City and the German Development Cooperation (GIZ) which provided the means to conduct and to present this research. Special thanks go to the various involved offices and employees from Bayawan City who provided data and valuable background information.
References [1] National Statistic Office. 2008. 2007 Census of Population. Manila, Philippines. [2] Karagiannidis A, Xirogiannopoulou A, Tchobanoglous G. 2008. Full cost accounting as a tool for the
financial assessment of Pay-As-You-Throw schemes: A case study for the Panorama municipality, Greece. Waste Management 28: 2801-2808.
204 Proceedings of the International Conference on Solid Waste 2011- Moving Towards Sustainable Resource Management,
Hong Kong SAR, P.R. China, 2 – 6 May 2011
ULTRASOUND TECHNIQUES FOR CONTROL AND QUANTITATIVE MEASUREMENTS IN DENSITY SEPARATION OF POLYOLEFINS
S.A. Sanaee *, M.C.M. Bakker
Delft University of Technology, Delft, the Netherlands * Corresponding author. Tel: +31152787029, FAX: +31152788162,
E-mail: [email protected]
ABSTRACT Ultrasound techniques were investigated for the purpose of monitoring and performing quantitative measurements on polyolefin particles inside the opaque magnetic fluid of a magnetic density separator (MDS). A commercial medical imaging system with real-time capability was adapted to confirm the potential of ultrasound sensor array technology for MDS. An image processing routine was developed to determine the distribution of polyolefin particles over the depth of the MDS channel. Next, alternative imaging methods were implemented in Matlab and evaluated for their potential performance in an MDS application using raw ultrasound data sets. Laboratory experiments show that alternative methods can be more robust and deliver improved resolution in the ultrasound images.
Keywords: Polyolefin waste, Magnetic density separation, Ultrasound imaging
Introduction
The amount of European plastic consumption is steadily increasing, and already in 2005 an amount of 53 Mton plastics were produced. About a third of these materials were polyolefins. Obviously, there are both environmental and economical motives for recycling these materials. However, polyolefins are quite close in mass density and therefore advanced density separation technology is required to produce output products with high purity. A breakthrough technology called Magnetic Density Separation (MDS) is being developed to separate different types of polyolefins from complex waste streams [1]. In MDS, a mixture of plastic particles flow in a channel of magnetic fluid. A strong static magnetic field is applied from the top to create a gradient in the liquid’s mass density. Particles of similar mass densities separated from the mixture results in different product streams in one single step. An on-line monitoring system is required to visualize the moving particles and to assess the separation performance. However, the magnetic fluid is opaque and optical camera systems proved not applicable. In this study, ultrasound technology was employed to monitor moving plastic particles and to provide quantitative information such as the particles distribution along the channel depth. The adapted medical ultrasound technology demonstrated real-time monitoring capabilities and image processing was conducted on the video streams to determine the particles distribution. The commercial imager is dedicated to medical purposes and is optimised for acoustic impedances of human and animal tissues. It may therefore not be the best technology for the industrial MDS environment. Therefore, research was performed into the potential of alternative imaging algorithms with an eye towards industrial application. For this purpose, raw ultrasound datasets were scanned on non-moving polyolefin objects which provided the input for the imaging algorithms.
Materials and Methods
A commercial medical imaging machine with matched probe was used to capture a video stream of ultrasound images of the flowing particles inside the MDS channel. A linear ultrasound probe of 128 elements with an aperture of 35 mm was excited with a centre frequency of 5 MHz. To allow for its usage inside the flowing liquid the original array casing was replaced by a more hydrodynamic casing. Two batches of plastics were used in the tests that were taken from polyolefin waste of electrical and electronic equipment (WEEE). The first was a batch of high density polyethylene and the other was polypropylene. These high and low high density polyolefin batches were separated using alcohol sink-float separation to density ranges of 900-910 kg/m 3 and 940-950 kg/m 3 respectively. The magnetic fluid flow was maintained at a velocity of 10 cm/s. Separate experiments were done for the low and the high density fractions where the ultrasound images were captured in real-time by the medical imager. Each video stream was imported into the computer and the individual frames were processed in Matlab to determine the particles distribution with respect to depth. All the captured images showed a background noise that varied with depth due to the focus of the sensor probe. The noise is related to small air bubbles and dust particles carried in the flow. Therefore, a non-linear background noise threshold had to be determined based on the
Proceedings of the International Conference on Solid Waste 2011- Moving Towards Sustainable Resource Management,
Hong Kong SAR, P.R. China, 2 – 6 May 2011 205
first few frames where no particles were yet observed. Using this threshold, the number of pixels with intensity above the noise was counted for each row as an indication of the particles distribution across the depth of the channel. This procedure was carried out for all the captured frames in the video stream.
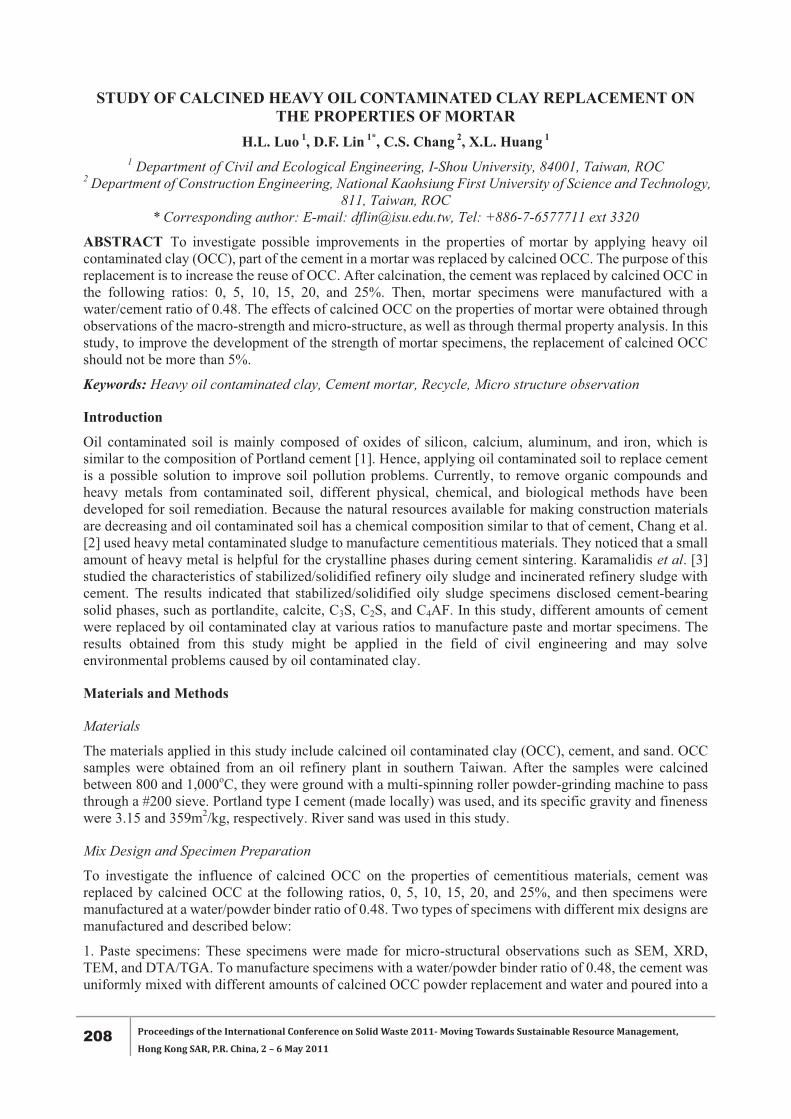
A semi-manual data acquisition setup was developed for scanning a complete dataset of 128 2 measurements. The complete dataset contains all the measurements that are possible, and is obtained by sequentially employing all possible permutations when one sensor element acts as transmitter while all others act as individual receivers. The array elements were excited by an Ultimo pulser/receiver and the signals were recorded by an AD board. The receiving elements were switched automatically through a matrix-switch, operated through a LAN interface with a computer while the transmitting element was changed manually between each scan Various subsets can be extracted from the complete dataset to test different imaging algorithms. Using less data principally means less information, but in return the algorithm becomes proportionally faster since less data needs to be processed. Imaging algorithms tested in this study are the Synthetic Aperture Focusing Technique (SAFT), Stolt migration and plane wave imaging. Conventional SAFT employs pulse-echo measurements, acquired along a synthetic array [2], and produces lateral resolution by using a delay-and-sum processing in the time domain. Stolt or ( k� � ) migration is a calculation-efficient method which employs the Fourier transform to approximate the solution to the wave equation [3]. In plane wave imaging, all the array elements are excited simultaneously so the image is covered by a single plane wave transmission. A test object made from two thin plastic plates was used to evaluate the performance of the algorithms. A cross-section view of the test object is shown in Fig. 2(a). The plates are few centimetres long and symmetrically positioned. A pulse-echo subset was extracted from the complete dataset and was processed by the SAFT and Stolt methods. In addition, a plane wave subset was extracted which was processed by the plane wave imaging method.
Results
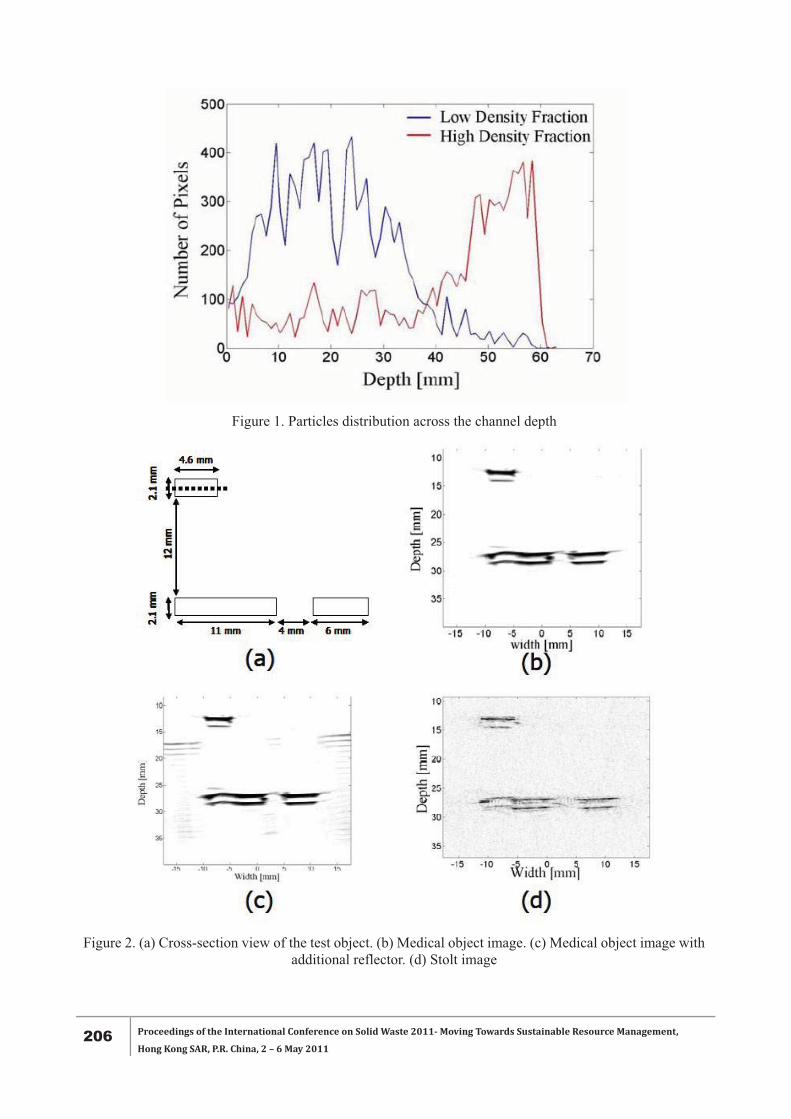
Figure 1. shows the particles distribution over depth of the MDS channel obtained by real-time ultrasound video stream. The offset in the distributions of low density and high density polyolefins is clear. This validates the principal of the MDS that creates two separate product streams. Also visible is that the distributions partly overlap for which there are two possible explanations. Firstly, gas bubbles may have attached to the heavier plastics, making them float at the depth of the lighter fraction. The second possibility is the occasional occurrence of flow turbulence. These issues should be resolved by further development of the MDS technology, but they were identified using the ultrasound technology. The ultrasound also allows the MDS operator to choose its cut point for the extraction of the two products depending on the desired quality of the products, which is essentially an online tuning capability for MDS.
The imaging methods were compared on the basis of robustness and detail of the obtained images. In the first test a small object was fully immersed and the medical imager settings such as gain level, depth range and dynamic range were optimized to get the best image shown in Fig. 2(b). Note that this optimization adjustment is crucial and typical practice in medical ultrasound applications. Next, a strong reflector was placed just below the object while the other conditions were kept the same. The reflector resulted in additional strong artefacts such as the horizontal stripes in Fig. 2(c). These artefacts were due to multiple wave reflections from the interior of the reflector and these are wrongly reconstructed by the medical imaging software. The same scenario was tested with a manually scanned dataset and the Stolt migration and the result is shown in Fig. 2(d). This image is not affected by the presence of the reflector. This proven robustness against strong reflecting objects is important because under operational MDS conditions there is no time to continuously regain optimum machine settings.
The details generated by the different imaging methods are compared by plotting in Fig. 3 the pixel intensities along the dashed line indicated through the top plastic object in Fig. 2(a). The Stolt method blurred the object edges at -20 dB. This blur is better suppressed by the plane wave method that uses more data at the cost of 140 times more computation time. The blur can be reduced even further with the plane wave method by suppressing the causally unrelated data during imaging at the additional cost of 4 times more computational effort. The SAFT method gave the best performance and enhanced the signal-to-noise-ratio in the image by 10 dB. To that end the SAFT algorithm restricted the aperture angle by giving less weight to large angles that are associated with less energetic reflections which relatively add more noise than straight reflections.
206 Proceedings of the International Conference on Solid Waste 2011- Moving Towards Sustainable Resource Management,
Hong Kong SAR, P.R. China, 2 – 6 May 2011
Figure 1. Particles distribution across the channel depth
Figure 2. (a) Cross-section view of the test object. (b) Medical object image. (c) Medical object image with
additional reflector. (d) Stolt image

Proceedings of the International Conference on Solid Waste 2011- Moving Towards Sustainable Resource Management,
Hong Kong SAR, P.R. China, 2 – 6 May 2011 207
Figure 3. Image reconstruction details for different methods. Red: Stolt, Black: plane wave imaging, Blue:
improved plane wave imaging, Green: SAFT
Conclusions
The potential of ultrasound technology for monitoring and quantitative analysis of polyolefin plastic waste particles in ferro fluid was studied. The commercial imaging system showed real-time performance but the quality of its images depends largely on continuous manual optimization of the machine settings. Alternative imaging methods were investigated using raw ultrasound data sets. It was shown that the alternatives may be more robust and that the obtained image details become better when employing more data at the cost of substantially more computational effort.
Acknowledgements
This research was financially supported by the European commission in the framework of FP7 collaborative project “Magnetic sorting and ultrasound sensor technology for production of high purity secondary polyolefins from waste (W2Plastic)”.
References [1] Website of W2Plastics, 2008: http://www.w2plastics.eu [2] K. J. Langenberg. 1986. Synthetic aperture focusing technique signal processing. NDT International.
19: 177-189. [3] R. Stolt. 1978. Migration by Fourier transform. Geophysics. 43: 23-48.
208 Proceedings of the International Conference on Solid Waste 2011- Moving Towards Sustainable Resource Management,
Hong Kong SAR, P.R. China, 2 – 6 May 2011
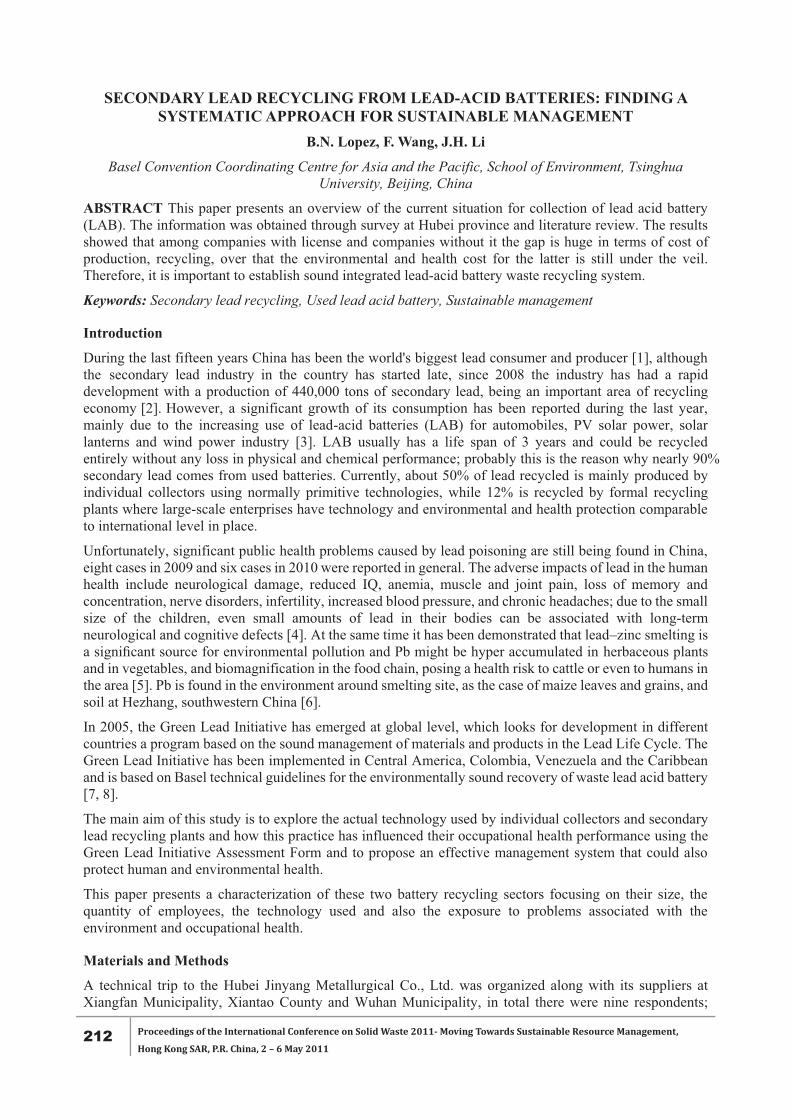
STUDY OF CALCINED HEAVY OIL CONTAMINATED CLAY REPLACEMENT ON THE PROPERTIES OF MORTAR
H.L. Luo 1, D.F. Lin 1*, C.S. Chang 2, X.L. Huang 1 1 Department of Civil and Ecological Engineering, I-Shou University, 84001, Taiwan, ROC
2 Department of Construction Engineering, National Kaohsiung First University of Science and Technology, 811, Taiwan, ROC
* Corresponding author: E-mail: [email protected], Tel: +886-7-6577711 ext 3320
ABSTRACT To investigate possible improvements in the properties of mortar by applying heavy oil contaminated clay (OCC), part of the cement in a mortar was replaced by calcined OCC. The purpose of this replacement is to increase the reuse of OCC. After calcination, the cement was replaced by calcined OCC in the following ratios: 0, 5, 10, 15, 20, and 25%. Then, mortar specimens were manufactured with a water/cement ratio of 0.48. The effects of calcined OCC on the properties of mortar were obtained through observations of the macro-strength and micro-structure, as well as through thermal property analysis. In this study, to improve the development of the strength of mortar specimens, the replacement of calcined OCC should not be more than 5%.
Keywords: Heavy oil contaminated clay, Cement mortar, Recycle, Micro structure observation
Introduction
Oil contaminated soil is mainly composed of oxides of silicon, calcium, aluminum, and iron, which is similar to the composition of Portland cement [1]. Hence, applying oil contaminated soil to replace cement is a possible solution to improve soil pollution problems. Currently, to remove organic compounds and heavy metals from contaminated soil, different physical, chemical, and biological methods have been developed for soil remediation. Because the natural resources available for making construction materials are decreasing and oil contaminated soil has a chemical composition similar to that of cement, Chang et al. [2] used heavy metal contaminated sludge to manufacture cementitious materials. They noticed that a small amount of heavy metal is helpful for the crystalline phases during cement sintering. Karamalidis et al. [3] studied the characteristics of stabilized/solidified refinery oily sludge and incinerated refinery sludge with cement. The results indicated that stabilized/solidified oily sludge specimens disclosed cement-bearing solid phases, such as portlandite, calcite, C3S, C2S, and C4AF. In this study, different amounts of cement were replaced by oil contaminated clay at various ratios to manufacture paste and mortar specimens. The results obtained from this study might be applied in the field of civil engineering and may solve environmental problems caused by oil contaminated clay.
Materials and Methods
Materials
The materials applied in this study include calcined oil contaminated clay (OCC), cement, and sand. OCC samples were obtained from an oil refinery plant in southern Taiwan. After the samples were calcined between 800 and 1,000oC, they were ground with a multi-spinning roller powder-grinding machine to pass through a #200 sieve. Portland type I cement (made locally) was used, and its specific gravity and fineness were 3.15 and 359m2/kg, respectively. River sand was used in this study.
Mix Design and Specimen Preparation
To investigate the influence of calcined OCC on the properties of cementitious materials, cement was replaced by calcined OCC at the following ratios, 0, 5, 10, 15, 20, and 25%, and then specimens were manufactured at a water/powder binder ratio of 0.48. Two types of specimens with different mix designs are manufactured and described below:
1. Paste specimens: These specimens were made for micro-structural observations such as SEM, XRD, TEM, and DTA/TGA. To manufacture specimens with a water/powder binder ratio of 0.48, the cement was uniformly mixed with different amounts of calcined OCC powder replacement and water and poured into a

Proceedings of the International Conference on Solid Waste 2011- Moving Towards Sustainable Resource Management,
Hong Kong SAR, P.R. China, 2 – 6 May 2011 209
2.54×2.54×2.54 cm mold in three layers. Then, the specimens were taken out of the mold, left at room temperature for 24 hours, and cured in water for different curing times.
2. Mortar specimens: These specimens were mainly made for the compressive test. To manufacture specimens with a water/powder binder ratio of 0.485, the cement was uniformly mixed with different amounts of calcined OCC powder replacement, sand with powder binder/sand ratios of 1 to 2.75, and water and poured into a 5×5×5 cm mold in three layers. Then, the specimens were taken out from the mold, left at room temperature for 24 hours, and cured in water for 3, 7, 14, 28, 56, and 90 days.
Results and Discussion
Compressive Strength Test
Figure 1 shows the compressive strengths obtained for mortar specimens with 0 to 25% calcined OCC replacements and cured for 3, 7, 14, 28, 56, and 91 days. As shown in the figure, the compressive strength of the mortar decreased with increasing amounts of calcined OCC replacement at different curing ages. Moreover, when the calcined OCC replacements were higher than 5%, the compressive strengths of the mortar specimens did not continue to develop after a curing time of more than 28 days. However, for the case of 5% calcined OCC replacement, the compressive strength of the specimens increased continuously and was higher than that of the control group (0% calcined OCC replacement) at 96 days. In this study, when considering the compressive strength as a factor, the optimal amount of calcined OCC replacement is suggested to be 5%.
XRD Analysis
XRD analysis can provide the chemical compositions of OCC before and after calcination. To present the effects of different amounts of calcined OCC replacement on the hydration products of paste specimens, as illustrated in Figure 2, the crystalline structure of quartz (SiO2) was observed at 2θ of 20.94o, 60.24o, and 68.54o. The intensities of the diffraction peak increased with increasing amounts of calcined OCC replacement, especially for the 20 and 25% replacements. The authors compared the spectra of paste specimens with 5% calcined OCC replacement for different curing ages to the JCPDS (Joint Committee of Powder Diffraction Standards) database and noticed that the compositions of those specimens were very close to those of control group, which implies that the hydration products of specimens with 5% calcined OCC were similar to those of the control group.

210 Proceedings of the International Conference on Solid Waste 2011- Moving Towards Sustainable Resource Management,
Hong Kong SAR, P.R. China, 2 – 6 May 2011
SEM Analysis
SEM was used to observe the micro-structure of the pastes, such as the appearance of hydration products, crystalline texture, pore distribution, and physical characteristics [4]. As illustrated in Figure 3, the main hydration product was C-S-H gel, accompanied by CH, AFm, and Aft crystals as well as unhydrated gypsum, for specimens with different amounts of calcined OCC replacement when cured for 7 days. The structures of the hydration products were loose with distributed pores and unhydrated cement particles, which provide evidence of the early strength without full development for the paste specimens. Moreover, as shown in Figure 3(f), euhedral crystals with snow-like hexahedrons were formed for the 25% calcined OCC replacement paste. These crystals were crystallized in a cavity without touching each other. The structures were stacked loosely, which proves that the 7-day early compressive strength of specimens with 25% calcined OCC replacement was low compared to that of the control group.
Figure 3. The SEM analysis for specimens with different amounts of calcined OCC replacement when
cured for 7 days.
TEM Analysis
TEM was used to observe the micro-structure and compactness of the hydration products for paste specimens with different amounts of calcined OCC replacement when cured for 7 and 56 days. Figure 4 shows TEM images of specimens cured for 7 days. As illustrated in the figure, loose micro-structures of hydration products were noted for specimens with different amounts of replacements. Moreover, the crystal structures were connected by acicular crystals. Comparing these observations with the SEM images suggests that the C-S-H gel was the main hydration product for specimens cured for 7 days.
Figure 4. The TEM analysis for specimens with different amounts of calcined OCC replacement when
cured for 7 days.
Conclusions
This paper presented one possible way to recycle oil contaminated clay for the replacement of cement in paste and mortar. The weight loss of calcined OCC at temperatures between 800 and 900oC was about 7.5%. The weight loss after the calcination of OCC was mainly due to the resolved montmorillonite, kaolinite, and pyrite and led to the production of monoclinic silicate. Moreover, the development of the compressive strength of specimens with 5% calcined OCC replacement was similar to that of the control group. The strengths were even higher than that of the control group for a curing time of more than 56 days. The observations from SEM and TEM analyses show that the micro-structures of specimens with 5% calcined OCC replacement, when cured for 56 days, were similar to that of the control group.

Proceedings of the International Conference on Solid Waste 2011- Moving Towards Sustainable Resource Management,
Hong Kong SAR, P.R. China, 2 – 6 May 2011 211
References [1] H.L. Bohn, B.L. McNeal and G.A. O'Connor. 2001. Soil Chemistry, John Wiley & Sons, New York. [2] J.E. Chang, L.C. Chiang, H.C. Lu, P.H. Shih and Y.K. Chang. 2003. Study of materials with
recycling of heavy metal containing sludge. The 18th Solid Waste Management Conference, Taichung, Taiwan, p.4-29.
[3] A.K. Karamalidis, V. Psycharis, I. Nicolis, E. Pavlidou, S. Benazeth, and E.A. Voudrias. 2008. Characterization of stabilized/solidified refinery oily sludge and incinerated refinery sludge with cement using XRD, SEM and EXAFS. J. Environ. Sci. Health - Part A. 43(10): 1144-1156.
[4] A.P. Kirchheim, V. Fernàndez-Altable, P.J.M. Monteiro, D.C.C. Dal Molin, and I. Casanova. 2009. Analysis of cubic and orthorhombic C3A hydration in presence of gypsum and lime. J. Mate. Sci. 44(8): 2038-2045.
212 Proceedings of the International Conference on Solid Waste 2011- Moving Towards Sustainable Resource Management,
Hong Kong SAR, P.R. China, 2 – 6 May 2011
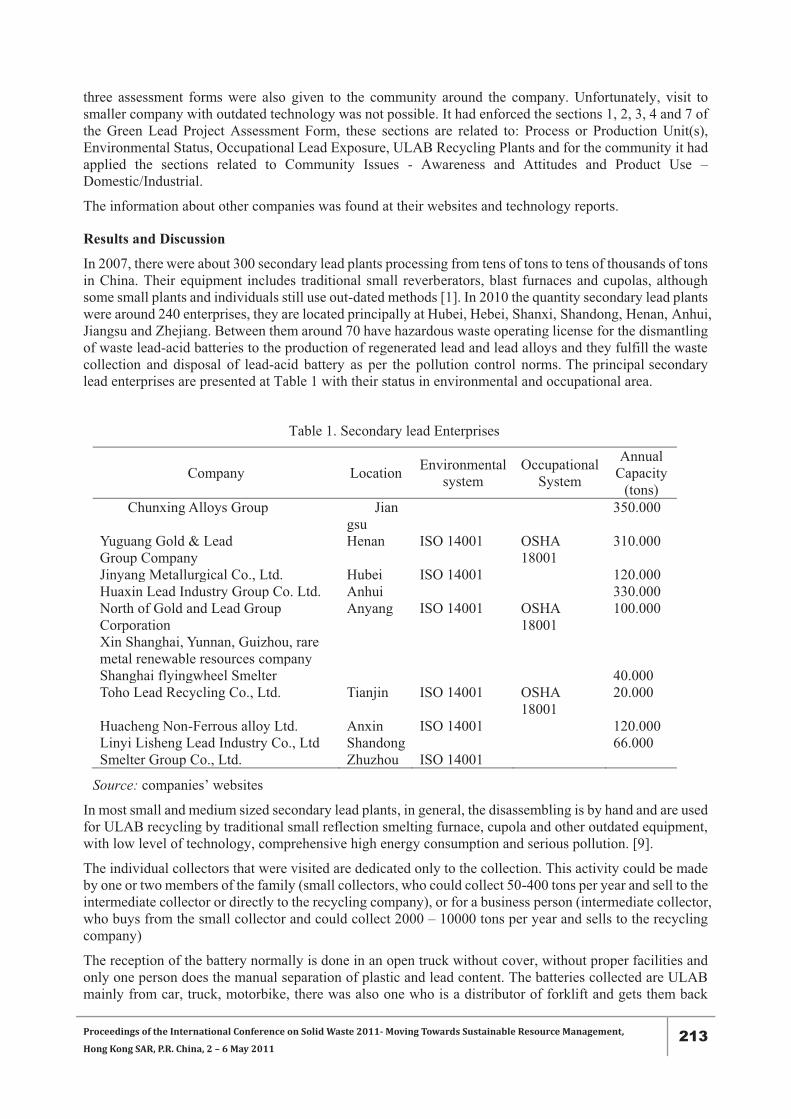
SECONDARY LEAD RECYCLING FROM LEAD-ACID BATTERIES: FINDING A SYSTEMATIC APPROACH FOR SUSTAINABLE MANAGEMENT
B.N. Lopez, F. Wang, J.H. Li
Basel Convention Coordinating Centre for Asia and the Pacific, School of Environment, Tsinghua University, Beijing, China
ABSTRACT This paper presents an overview of the current situation for collection of lead acid battery (LAB). The information was obtained through survey at Hubei province and literature review. The results showed that among companies with license and companies without it the gap is huge in terms of cost of production, recycling, over that the environmental and health cost for the latter is still under the veil. Therefore, it is important to establish sound integrated lead-acid battery waste recycling system.
Keywords: Secondary lead recycling, Used lead acid battery, Sustainable management
Introduction
During the last fifteen years China has been the world's biggest lead consumer and producer [1], although the secondary lead industry in the country has started late, since 2008 the industry has had a rapid development with a production of 440,000 tons of secondary lead, being an important area of recycling economy [2]. However, a significant growth of its consumption has been reported during the last year, mainly due to the increasing use of lead-acid batteries (LAB) for automobiles, PV solar power, solar lanterns and wind power industry [3]. LAB usually has a life span of 3 years and could be recycled entirely without any loss in physical and chemical performance; probably this is the reason why nearly 90% secondary lead comes from used batteries. Currently, about 50% of lead recycled is mainly produced by individual collectors using normally primitive technologies, while 12% is recycled by formal recycling plants where large-scale enterprises have technology and environmental and health protection comparable to international level in place.
Unfortunately, significant public health problems caused by lead poisoning are still being found in China, eight cases in 2009 and six cases in 2010 were reported in general. The adverse impacts of lead in the human health include neurological damage, reduced IQ, anemia, muscle and joint pain, loss of memory and concentration, nerve disorders, infertility, increased blood pressure, and chronic headaches; due to the small size of the children, even small amounts of lead in their bodies can be associated with long-term neurological and cognitive defects [4]. At the same time it has been demonstrated that lead–zinc smelting is a significant source for environmental pollution and Pb might be hyper accumulated in herbaceous plants and in vegetables, and biomagnification in the food chain, posing a health risk to cattle or even to humans in the area [5]. Pb is found in the environment around smelting site, as the case of maize leaves and grains, and soil at Hezhang, southwestern China [6].
In 2005, the Green Lead Initiative has emerged at global level, which looks for development in different countries a program based on the sound management of materials and products in the Lead Life Cycle. The Green Lead Initiative has been implemented in Central America, Colombia, Venezuela and the Caribbean and is based on Basel technical guidelines for the environmentally sound recovery of waste lead acid battery [7, 8].
The main aim of this study is to explore the actual technology used by individual collectors and secondary lead recycling plants and how this practice has influenced their occupational health performance using the Green Lead Initiative Assessment Form and to propose an effective management system that could also protect human and environmental health.
This paper presents a characterization of these two battery recycling sectors focusing on their size, the quantity of employees, the technology used and also the exposure to problems associated with the environment and occupational health.
Materials and Methods
A technical trip to the Hubei Jinyang Metallurgical Co., Ltd. was organized along with its suppliers at Xiangfan Municipality, Xiantao County and Wuhan Municipality, in total there were nine respondents;
Proceedings of the International Conference on Solid Waste 2011- Moving Towards Sustainable Resource Management,
Hong Kong SAR, P.R. China, 2 – 6 May 2011 213
three assessment forms were also given to the community around the company. Unfortunately, visit to smaller company with outdated technology was not possible. It had enforced the sections 1, 2, 3, 4 and 7 of the Green Lead Project Assessment Form, these sections are related to: Process or Production Unit(s), Environmental Status, Occupational Lead Exposure, ULAB Recycling Plants and for the community it had applied the sections related to Community Issues - Awareness and Attitudes and Product Use – Domestic/Industrial.
The information about other companies was found at their websites and technology reports.
Results and Discussion
In 2007, there were about 300 secondary lead plants processing from tens of tons to tens of thousands of tons in China. Their equipment includes traditional small reverberators, blast furnaces and cupolas, although some small plants and individuals still use out-dated methods [1]. In 2010 the quantity secondary lead plants were around 240 enterprises, they are located principally at Hubei, Hebei, Shanxi, Shandong, Henan, Anhui, Jiangsu and Zhejiang. Between them around 70 have hazardous waste operating license for the dismantling of waste lead-acid batteries to the production of regenerated lead and lead alloys and they fulfill the waste collection and disposal of lead-acid battery as per the pollution control norms. The principal secondary lead enterprises are presented at Table 1 with their status in environmental and occupational area.
Table 1. Secondary lead Enterprises
Company Location Environmental system
Occupational System
Annual Capacity
(tons) Chunxing Alloys Group Jian
gsu 350.000
Yuguang Gold & Lead Group Company
Henan ISO 14001 OSHA 18001
310.000
Jinyang Metallurgical Co., Ltd. Hubei ISO 14001 120.000 Huaxin Lead Industry Group Co. Ltd. Anhui 330.000 North of Gold and Lead Group Corporation
Anyang ISO 14001 OSHA 18001
100.000
Xin Shanghai, Yunnan, Guizhou, rare metal renewable resources company
Shanghai flyingwheel Smelter 40.000 Toho Lead Recycling Co., Ltd. Tianjin ISO 14001 OSHA
18001 20.000
Huacheng Non-Ferrous alloy Ltd. Anxin ISO 14001 120.000 Linyi Lisheng Lead Industry Co., Ltd Shandong 66.000 Smelter Group Co., Ltd. Zhuzhou ISO 14001
Source: companies’ websites
In most small and medium sized secondary lead plants, in general, the disassembling is by hand and are used for ULAB recycling by traditional small reflection smelting furnace, cupola and other outdated equipment, with low level of technology, comprehensive high energy consumption and serious pollution. [9].
The individual collectors that were visited are dedicated only to the collection. This activity could be made by one or two members of the family (small collectors, who could collect 50-400 tons per year and sell to the intermediate collector or directly to the recycling company), or for a business person (intermediate collector, who buys from the small collector and could collect 2000 – 10000 tons per year and sells to the recycling company)
The reception of the battery normally is done in an open truck without cover, without proper facilities and only one person does the manual separation of plastic and lead content. The batteries collected are ULAB mainly from car, truck, motorbike, there was also one who is a distributor of forklift and gets them back

214 Proceedings of the International Conference on Solid Waste 2011- Moving Towards Sustainable Resource Management,
Hong Kong SAR, P.R. China, 2 – 6 May 2011
from his customers. Three classes of rain shelters were found - completely close (a room in house, a small deposit with or without window), with rain shelter (open at sides) and open air. The storage places were found far from the district, but normally the workers live near it.
The majority of the collectors did not know about the legislation, including effluent standards. The effluent generated is acid water and disposed without treatment and protection to soil or ground water leaking. Only one intermediate collector has a designated acid zone for its disposal.
This activity has been practiced for 5 to 13 years by farmers, or businessmen who also collect other kinds of recycling materials (plastic, cables, cans, shoes, among others) and they employ temporary workers and depending on the quantity of ULAB. The working time is continuous from Monday to Sunday. The employer informs the workers the health risk but they do not have any hygiene policy nor occupational nurse and health clinic in the vicinity. The normal protection used by the workers are protective gloves and plastic apron, the changing clothes regime is not established and some special clothes are used just by two individual collectors. The majority of the workers living in the premise itself do not wash the clothes there. The areas for eating and storage are normally segregated except for few odd cases, who have some kitchen appliances such as rice cooker and electric plate in the same place were the batteries are stored. The floor of the storage place is normally cement but for two places where it was uncovered soil. The acid is poured off before selling to the intermediate collector; only one small collector sells the batteries with acid. They do not recondition the batteries, and their only job is collection and selling. The transportation to the recycling company could be done by themselves or by the company.
With respect to the awareness in the community people in and around the recycling company, including those at a store, a restaurant and in a school were interviewed. Their knowledge level about ULAB contamination was that it is harmful to human health; at the restaurant, they knew about one case of child lead poisoning. They have never attended an awareness class about lead; normally the ULAB is given to the repairing plant, they do not have any idea about any incentive programs for returning used batteries for recycling. No comments were generated about what should be done with ULAB, how the problem of lead contamination from ULAB should be solved, waste disposal programs, promotion of a sustainable environmentally sound and socio-economically acceptable solution to the recycling of ULAB.
The batteries that they are personally using is for the motorbike, used in transportation, they have one or two at home, just for their use, the life span is between 2-3 years, bought from a repairing plant or registered supplier, they are aware of the health hazards associated with lead exposure, one resopndent is aware about the risk to children, another just know a little about the problems of lead.
Conclusions
Although the companies who possess the license for recycling secondary lead are one third of the total of the enterprises, the other two third of them possess low level of technology resulting in risk for the health, environmental pollution and unhealthy competition of secondary lead businesses. It is also important to pay attention to the individual collectors and their way of doing the collection and pre-treatment before selling to the recycling companies. Therefore, the establishment of a sound integrated waste lead-acid battery recycling system should be imminent, in order to make comprehensive utilization of hazardous waste containing lead, turning waste into wealth for everyone, so that hazardous waste are turned into new resources.
Acknowledgements
Hubei Jinyang Metallurgical Co., Ltd. for their support during the field trip.
References [1] H.Y. Chen, A.J. Li, D.E. Finlow. 2009. The lead and lead-acid battery industries during 2002 and
2007 in China. Journal of Power Sources 11: 22–27 [2] S.G. Wang. 2009. Attention to Details Achieves an Environmental Model in the Secondary Lead
Corporates. Resources Recycling N.10 (in Chinese) [3] Y.Chang, X.X.Mao, Y.F.Zhao, S.L.Feng, H.Y. Chen, D. Finlow. 2009. Lead-acid battery use in the
development of renewable energy systems in China. Journal of Power Sources 191: 176–183

Proceedings of the International Conference on Solid Waste 2011- Moving Towards Sustainable Resource Management,
Hong Kong SAR, P.R. China, 2 – 6 May 2011 215
[4] IARC Monographs on the Evaluation of Carcinogenic Risks to Humans: Inorganic and Organic Lead Compounds. Volume 87. International Agency for Research on Cancer. World Health Organization
[5] Q. Cai, M.L. Long, M. Zhu, Q.Z. Zhou, L. Zhang, J. Liu. 2009. Food chain transfer of cadmium and lead to cattle in a lead–zinc smelter in Guizhou, China. Environmental Pollution 157: 3078–3082
[6] X.Y. Bi, X.B. Feng, Y.G. Yang, X.D. Li, G.P.Y. Shin, F.L. Li, G.L. Qiu, G.H. Li, T.Z. Liu, Z.Y. Fu. 2009. Allocation and source attribution of lead and cadmium in maize (Zea mays L.) impacted by smelting emissions. Environmental Pollution 157: 834–839.
[7] Basel Convention, Green Lead Initiative. 2006. Project for the Determination of a Regional Strat egy for the Environmentally Sound Recovery of Used Lead Acid Batteries (ULAB) in Central America, Colombia, Venezuela and the Caribbean.
[8] Technical guidelines for the environmentally sound management of waste lead acid battery. Secretariat of the Basel Convention. 2003 www.basel.int
[9] X.Z.Li. 2009. Effort to build a new green model for Secondary Lead Industry. Resources Recycling N. 9 (in Chinese)

216 Proceedings of the International Conference on Solid Waste 2011- Moving Towards Sustainable Resource Management,
Hong Kong SAR, P.R. China, 2 – 6 May 2011
ANALYTICAL CHALLENGES IN SECONDARY RESOURCES PROCESSING: SUBSIEVE AND THERMOGRAVIMETRY CONSTRAINTS FOR A COMPOSITE FINES
SAMPLE I.O. Ogunniyi 1*, D.R. Groot 2
1Metallurgical and Materials Engineering, Federal University of Technology, Akure, Nigeria. 2Materials Science and Metallurgical Engineering, University of Pretoria, South Africa.
*Corresponding Author. Tel: +234 8132970816; Email: [email protected]
ABSTRACT Secondary resource stream can be very composite in constitution and the procedure for reliable chemical and physical analysis therefore unconventional. Some analytical constraints of end-of-life printed circuit board (PCB) were presented herein. With review of fundamental principles and experimental analysis, analytical techniques established with simpler materials samples, namely, thermo-gravimetric analysis, cyclosizing and laser diffraction volume size analysis techniques, were pragmatically shown to be inapplicable for the PCB comminution fines sample. Basic calculations combined with SEM micrography shows that dS (equivalent sphere diameter) obtained under laser subseive sizing will be misleading when correlated with the dA (sieve aperture nominal diameter). The cyclosizer subsieve size analysis technique also can be disqualified from basic theoretical analysis. Under thermogravimetry experimental analysis with air or inert atmosphere, many reactions occur simultaneously, so that obtaining precise inflexions to enable useful characterisation of constituents was frustrated. Organic constituent quantitation of PCB fines sample still requires development of appropriate methodology. The constraints of these techniques were all traced to the composite constitution and very diverse morphology of the grinded PCB sample. This work will help in narrowing down the range of analytical techniques for this peculiar WEEE stream, thus avoiding resource wastage in trying out various techniques for certain analytical task or the worst case of using misleading results.
Keywords: Printed circuit board, Subsieve, Cyclosizer, Laser diffraction, Thermogravimetry
Introduction
The printed circuit boards (PCB) in end-of-life electronics contains many base and precious metal values, in proportions far greater than many natural deposits of such metals, along with other material constituents such as plastics and ceramics. The metallic values typically make about 40 % of the composition of PCB [1]. Typical compositions from various authors were included elsewhere [2]. The metallic values make the recycling of PCB economically inviting. However, the diversity of the valuable content comes with the challenge of complex chemical and physical material characterizations. The important feature that must be characterized in various stages of operations in the PCB resource recovery depends on the specific scenario. For monetary valuation of a crushed batch for sale to a smelter as a non-ferrous charge supplement, the challenge can be obtaining a fair and reliable assay of specific target metal contents. In environmental concern, the challenge can be only for the determination and quantification of certain constituents declared hazardous. For decision on probable physical processing approach, particle morphology such as particle size distribution and liberation can be the critical information. With the diversity of the analytical tasks, various analytical techniques commonly employed for less complex material samples such as TGA, DTA, MS, ICPOES, XRD have been generally recommended and some effectively employed for PCB analysis [2, 3]. However the PCB sample is very composite in constitution and the procedure for reliable analysis of its sample can be very unconventional. Many techniques may not be readily assumed as applicable simply because it has been widely employed with other material samples. It is therefore important to have a work reporting applicability of specific techniques. This will help in analytical decision making in working with the PCB to narrow down the range of techniques for consideration, avoid wastage of time, material and financial resources on unnecessary test analyses when faced with certain analytical demands, and ultimately to avoid using misleading results from techniques that gives inaccurate values. Three techniques were considered in this report: laser diffraction volume-based size analysis, cyclosizer – also a size analysis technique, and thermogravimetry for organic constituents’ analysis. Review of the analytical principles of these techniques and result of test analysis were presented, in assessing these techniques for PCB sample analysis.
Proceedings of the International Conference on Solid Waste 2011- Moving Towards Sustainable Resource Management,
Hong Kong SAR, P.R. China, 2 – 6 May 2011 217
Analytical Principles
Cyclosizer
The basic operating principle of the hydrocyclone [4] is employed in the Warman cyclosizer subsieve analysis device [5]. The cyclosizer is one of the most widely used subsieve analysis techniques in the mineral processing industry [4], consists of five inverted cyclone with reducing suspension inlet diameters which creates increasing tangential inlet velocities. Each separates at fixed particle sizes based on variation in centrifugal forces acting on particles of varying masses. The centrifugal force, F, acting on a particle of mass (m) in a circular motion with radius (r) and tangential velocity (V) is given by the expression:
F = mV2/r = ρνV2/r where ρ and ν are the material density and the particle volume respectively. For different particles describing the same circular motion, variation in the centrifugal forces acting on the particles depends on variation in masses between the particles, which results from either variation in density (material) or size (volume) of the particles. The system is therefore actually separating based on mass differences. To achieve size based separation, density must be constant, and vice versa. That is, for a sample containing particles of the same material but of different sizes, size separation can be done, while for a sample containing particles of the same size but of different materials, material separation can be done. But for a sample containing particles of different sizes and of assorted materials, particles of having the same mass can differ widely in size and in material. A small dense material can have the same mass as a bigger particle of a less dense material. Mass-based separation of particles of such sample will neither produce fractions based on size nor based on material type. This PCB comminution fines sample represents such a sample and even worse; with very wide diversity of particle shapes. The cyclosizer will therefore not be applicable for PCB fines sample subsieve analysis.
Laser Diffraction Size Analysis
The laser diffraction subsieve size analysis as employed in the Malvern Master Sizer and the Microtrac instruments, among others, employs laser beam to determine the volume of particle in a very dilute flowing pulp. The success of this instrumentation is due to improvement in electronics, computation and specific laser diffraction size analysis theories. Particle size distribution down to 1 µm and below can be obtained fast and with high precision (reproducibility). However, the particle size is calculated as the volume equivalent sphere nominal diameter (dS) – the diameter of a sphere whose volume equals to the volume of the particle as determined from the laser diffraction analysis. Volume-equivalent sphere nominal diameter gives satisfactory data in many routine applications such as in relative particle indication in powder forming, in mineral processing dense media characterization, and many clearly defined material samples. To the question of how applicable is this technique in PCB comminution size analysis, a microscopic size analysis of the PCB fines sample will provide a useful check for assessing the laser diffraction based size data.
Thermogravimetric Analysis
In a task requiring quantitative analysis of the organic constituent of PCB, thermogravimetry (TG), along with other thermal techniques such as differential thermal analysis (DTA) can be considered as applicable. In principle, the analysis entails a continuous determination of change in mass of a sample while slowly increasing its temperature over a specific range in a controlled atmosphere [6]. In oxygen atmosphere for instance, the fractional content of a specific organic compound in the sample will be determined as the fractional change in mass of the sample that occurs at the temperature corresponding to that at which such compound undergoes combustion reaction in oxygen. For a compound that volatilises at a known temperature, the fractional change in mass of a sample at that temperature in an inert atmosphere will be taken as the fraction of such compound in the sample. In essence, the technique will achieve both qualitative and quantitative analysis. Given this straightforward analytical rationale and the general range of known applications, these techniques could be considered as applicable in determining the organic fraction of a crushed or ground PCB sample. However, when dealing with an unfamiliar matrix such as the PCB, a sweeping recommendation based on general principle may be hasty. With the peculiar material constituent
218 Proceedings of the International Conference on Solid Waste 2011- Moving Towards Sustainable Resource Management,
Hong Kong SAR, P.R. China, 2 – 6 May 2011
of the PCB sample, it is necessary to investigate the applicability of this technique. Test TGA analysis of PCB presented herein is informative in making definite conclusion.
From this review of basic principles, it can be concluded that the cyclosizer technique will not apply to PCB fines sample size analysis. For the laser diffraction size analysis and the thermogravimetric techniques, some test analyses are considered necessary.
Methodology
Assorted end-of-life populated printed circuit boards from PCs, cellphones, radio equipment and switchboards were obtained. Components such as capacitors, liquid crystal displays and batteries which are usually rich in hazardous substances [7] were first removed from the boards before comminution. The size reduction was done in stages using table guillotine and close circuit swing hammer mill, in four stages, starting from 20 mm closed fine crushing, followed by closed comminution again at 8 mm, 5 mm and 2 mm screens. Liberated materials and components were screen out at each stage, such that fragments with unliberated copper traces, solders still locked in the board vias, pin insertions, board fibres and resins were in the last stage of comminution. The −1180 µm fractions from each comminution collected and screened with a stack of sieves to obtain the −75 μm PCB comminution fines sample. This is further screened with the 38 μm sieve to obtain the −75 μm and −75 + 38 µm fraction. Sample of the −75 + 38 µm PCB comminution fines fraction was taken, mounted with a clear cold setting thermosetting resin and polished with the electropolisher. The section was observed with a Nikon Eclipse ME600 light microscope at 100 times magnification under dark field illumination to enhance particle boundary definition. A micrograph of the section was taken via the VDU (visual display unit). For the test thermogravimetric analysis, the Mettler Toledo thermal analyzer with the STARe software was employed. A sample size of 20 mg was used; actual mass to microgram accuracy indicated by the instrument. The analysis was performed both in air and nitrogen, from room temperature to 800 oC, in steps of 10 oC/min. The plots of mass variation with temperature were presented together with the derivative plots.
Results and Discussion
Laser Diffraction versus Microscopy Size Analysis of PCB Fines Sample
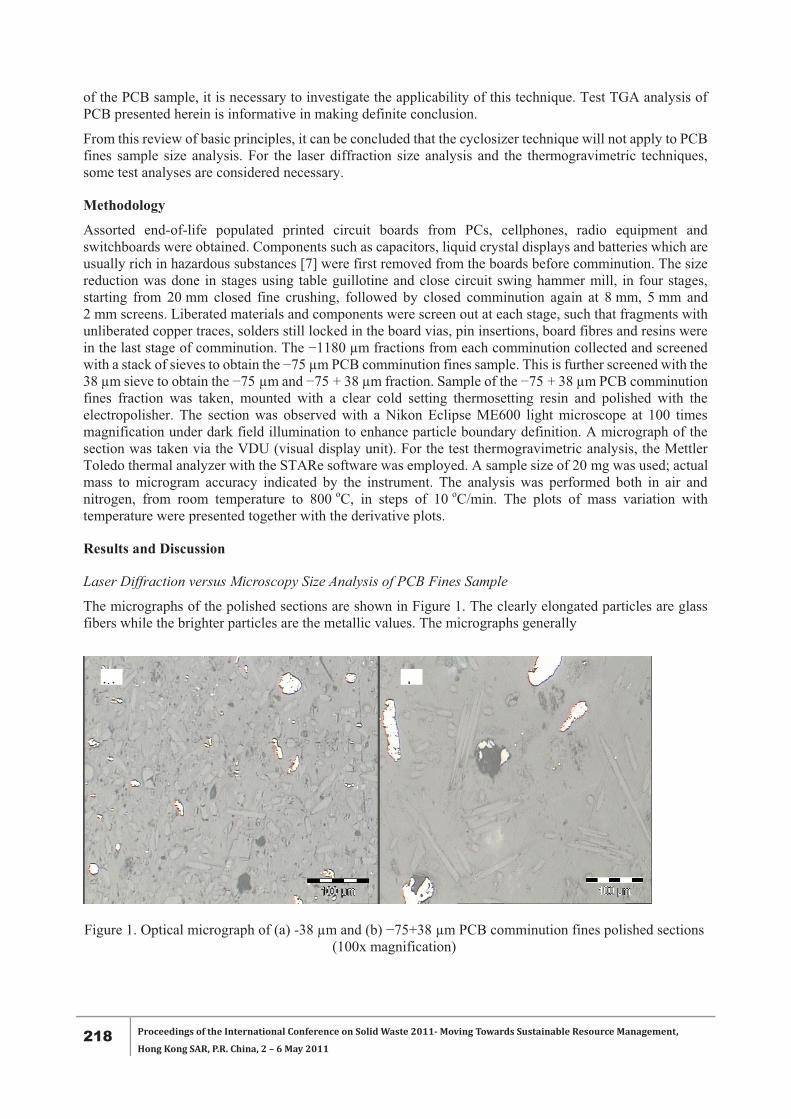
The micrographs of the polished sections are shown in Figure 1. The clearly elongated particles are glass fibers while the brighter particles are the metallic values. The micrographs generally
Figure 1. Optical micrograph of (a) -38 μm and (b) −75+38 µm PCB comminution fines polished sections (100x magnification)
deiti
Proceedings of the International Conference on Solid Waste 2011- Moving Towards Sustainable Resource Management,
Hong Kong SAR, P.R. China, 2 – 6 May 2011 219
show the diversity of particle shapes in the PCB sample. Assuming a glass fibre particle has a diameter of 35 µm and 80 µm long (as is common in the micrographs in Figure 1). It will be expected in sieve analysis to reports to the -38 micron fraction, being below the 38 µm in at least two dimensions. The equivalent sphere diameter (dS) based on laser diffraction volume analysis will be returned as 53.7 µm. This follows from equating the volume of a cylindrical particle to that of its volume equivalent sphere as:
where h is the length and dA is the aperture diameter of a cylindrical particle, while dS is the diameter of the sphere of equivalent volume. Substituting for dA and h as 35 µm and 80 µm respectively gives the dS. Hence a particle considered as subsieve in conventional sieve analysis will not be returned as such based on the laser diffraction size analysis. The data will generally tend to imply coarser particles overlapping into the size distribution determined from sieve analysis. To merge laser diffraction size analysis data with the sieve analysis data to produce a comprehensive particle size distribution down to particles a few microns in diameter will not make much sense. Conversion of laser diffraction sizes data to sieve analysis data has been suggested [8], but such procedure will apply to samples of consistent constitution. For samples containing particles relatively homogeneous in material and shape, and with high circularity shape factor, such approach may give a useful data set. Hence, the diversity of particle shapes, particularly, particles with very low circularity shape factor, is the major constraint in employing laser diffraction subsieve technique to PCB size analysis.
Thermogravimetry for Organic Constituent Analysis
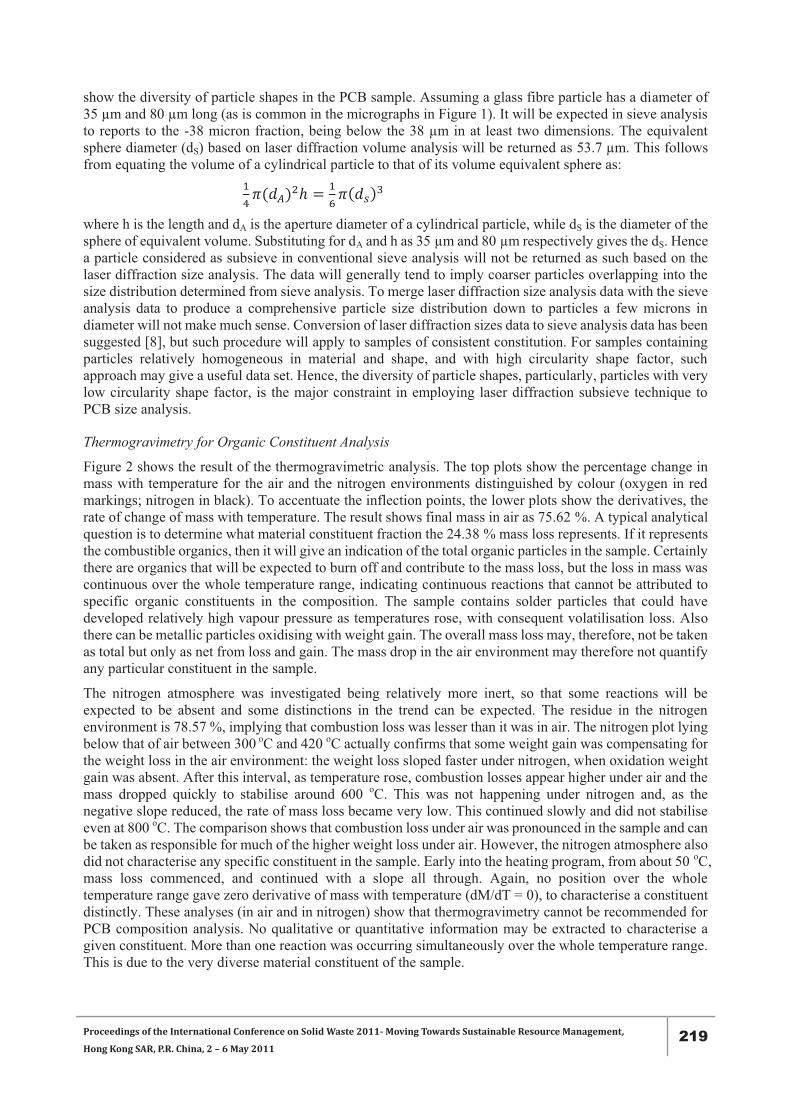
Figure 2 shows the result of the thermogravimetric analysis. The top plots show the percentage change in mass with temperature for the air and the nitrogen environments distinguished by colour (oxygen in red markings; nitrogen in black). To accentuate the inflection points, the lower plots show the derivatives, the rate of change of mass with temperature. The result shows final mass in air as 75.62 %. A typical analytical question is to determine what material constituent fraction the 24.38 % mass loss represents. If it represents the combustible organics, then it will give an indication of the total organic particles in the sample. Certainly there are organics that will be expected to burn off and contribute to the mass loss, but the loss in mass was continuous over the whole temperature range, indicating continuous reactions that cannot be attributed to specific organic constituents in the composition. The sample contains solder particles that could have developed relatively high vapour pressure as temperatures rose, with consequent volatilisation loss. Also there can be metallic particles oxidising with weight gain. The overall mass loss may, therefore, not be taken as total but only as net from loss and gain. The mass drop in the air environment may therefore not quantify any particular constituent in the sample.
The nitrogen atmosphere was investigated being relatively more inert, so that some reactions will be expected to be absent and some distinctions in the trend can be expected. The residue in the nitrogen environment is 78.57 %, implying that combustion loss was lesser than it was in air. The nitrogen plot lying below that of air between 300 oC and 420 oC actually confirms that some weight gain was compensating for the weight loss in the air environment: the weight loss sloped faster under nitrogen, when oxidation weight gain was absent. After this interval, as temperature rose, combustion losses appear higher under air and the mass dropped quickly to stabilise around 600 oC. This was not happening under nitrogen and, as the negative slope reduced, the rate of mass loss became very low. This continued slowly and did not stabilise even at 800 oC. The comparison shows that combustion loss under air was pronounced in the sample and can be taken as responsible for much of the higher weight loss under air. However, the nitrogen atmosphere also did not characterise any specific constituent in the sample. Early into the heating program, from about 50 oC, mass loss commenced, and continued with a slope all through. Again, no position over the whole temperature range gave zero derivative of mass with temperature (dM/dT = 0), to characterise a constituent distinctly. These analyses (in air and in nitrogen) show that thermogravimetry cannot be recommended for PCB composition analysis. No qualitative or quantitative information may be extracted to characterise a given constituent. More than one reaction was occurring simultaneously over the whole temperature range. This is due to the very diverse material constituent of the sample.
220 Proceedings of the International Conference on Solid Waste 2011- Moving Towards Sustainable Resource Management,
Hong Kong SAR, P.R. China, 2 – 6 May 2011
Figure 2. Plots of TG analysis and the derivatives for PCB fines sample under air and nitrogen
Conclusions
The composite constitution of PCB makes many well established techniques inapplicable for many analytical tasks routinely performed with simpler sample systems. The cyclosizer will not be able to achieve size based separation due to variation in material types and shapes. The laser diffraction data gives inflated sizes overlapping into sieve analysis data. Thermogravimetry data does not identify nor quantify any specific organic constituent due to multiple reactions occurring together. These analytical tasks for this sample still requires methodology development, however, this work provide reference for narrowing down range of analytical techniques for this peculiar WEEE stream, thus avoiding resource wastage in trying out inapplicable techniques or the worst case of using misleading results.
References [1] E.Y.L. Sum. 1991. The recovery of metals from electronic scrap. JOM. 43/4:7 – 11 [2] I.O. Ogunniyi, M. K. G. Vermaak and D.R. Groot. 2009. Chemical composition and liberation
characterization of printed circuit board comminution fines for beneficiation investigations. Waste Management. 29: 2140 – 2146.
[3] Jihanzi Li, S. Puneet, G. Zong and Z. Hong-Chao. 2004. Printed circuit board recycling: a state of the art survey. IEEE Transaction on Electronics Packaging Manufacturing. 27/1: 33 – 42.
[4] B.A. Wills. 2006. Will’s Mineral Processing Technology, Elsevier, UK, p. 97. [5] Finch, J.A.. and M. Leroux. 1982. Fine sizing by cyclosizer and micro-sieve. CIM Bullettin. 75 (Mar):
235. [6] H.H. Willard, L. L. Merritt, J.A. Dean and F.A. Settle. 1988. Instrumental methods of analysis,
Wardsworth Inc, California, p. 767. [7] EU, 2003. Directive 2002/95/EC of the European parliament and of the council on the restriction of
the use of certain hazardous substances in electrical and electronic equipment. Official Journal of the European Union. l37/19: EN (13.2.2003).
[8] L.G. Austin and I. Shah. 1983. A method for interconversion of microtract and sieve size distributions. Powder Technology. 35: 271 – 278.
Proceedings of the International Conference on Solid Waste 2011- Moving Towards Sustainable Resource Management,
Hong Kong SAR, P.R. China, 2 – 6 May 2011 221
BIODEGRADATION BEHAVIOUR OF RECYCLED POLYETHYLENE/CELLULOSE MICROFIBER FROM COTTON FABRIC WASTE FILMS
D. Aht-Ong 1, D. Atong 2, A. Sirimuangjinda 3, C. Pechyen 3, 4* 1Department of Materials Science, Faculty of Science, Chulalongkorn University, Pathumwan, Bangkok,
10330, Thailand 2National Metal and Materials Technology Center, Thailand Science Park, Pathumthani, 12120, Thailand
3Department of Packaging and Materials Technology, Faculty of Agro-Industry, Kasetsart University, Bangkok, 10900, Thailand
4Center for Advanced Studies in Agriculture and Food, KU Institute for Advanced Studies, Kasetsart University, Bangkok 10900, Thailand (CASAF, NUR-KU, Thailand)
*Corresponding author E-Mail: [email protected] Tel.: +662-562-5295; Fax: +662-562-5046
ABSTRACT This work involved a study of polymer-fiber composites as biodegradable packaging made from recycled polyethylene (r-PE) and chemical-treated cotton fabric waste micro fibers. A compatibilizer, polyethylene-graft-maleic anhydride (PE-g-MA), was used to improve properties of the composites. Factors affecting composite properties was investigated % fiber loading. The fiber composites were prepared by melt-blending technique. The materials were first mixed by a twin-screw extruder and shaped into samples by an extrusion blow molding machine. The samples were then characterized for mechanical, and morphological properties. It was found that properties of the composites were improved by adding the compatibilizer. Optimum properties of the composites were found at 30% (wt%) cellulose microfiber loading. It was also revealed that tensile strength and modulus was found to increase as the % fiber loading was increased. The SEM indicates the change in the morphological structure of r-PE/Cellulose microfiber film. With this time will leave a porous matrix of recycled polyethylene, while synthetic polymer such as polyolefin will slowly degrade in parallel with the fiber part.
Keywords: Biodegradation, Recycled polyethylene, Cellulose microfiber, Cotton fabric waste
Introduction
Plastics cause serious environmental problems. Although they are not intrinsically dangerous, they take up a huge amount of space in landfills and they are made from a nonrenewable resource, namely fossil fuels. For these reasons it is important that, where possible, plastics are recycled. Recycled plastic can be used for anything that virgin plastic is used for except the packaging of food. The development of new technologies to prepare composites from post-consumer polymers as matrixes and natural fiber as reinforcement phases and the better understanding of their chemical, physical, and mechanical interactions will increase their aggregated value and application in the production of consumer goods and consequently reduce their environmental impact as waste materials. Cellulose fibers have been increasingly used in the production of composites in the last years because of their inherent advantages, such as low cost, renewability, biodegradability, abundance, and high specific strength [1,2]. The objective of the present work was to develop composite films based on r-PE and cellulose microfiber from cotton fabric waste, and to evaluate physical, chemical, mechanical and biodegradation properties of these films.
Experimental
Materials and Processing
Powder of recycle polyethylene with melting temperature of 135�C was obtained from MMP Packaging Group (Thailand). Cotton fabric waste was obtained from Phairojweaving Co., Ltd. with the average length of 5 mm. Polyethylene-grafted-Maleic Anhydride or PE-g-MA (MB 100D) was obtained from Creative Polymers Co., Ltd. (Thailand). Cellulose micro-fiber, from cotton fabric waste was treated in a chemical method, where 100.0 g of cellulose micro-fiber was transferred into 2.0 M Hydrochloric (HCl) solution (500 mL) warmed to 80�C for 4 hours. The slurry was then filtered and thoroughly washed with distilled water until the wash water was neutral. The resulting cellulosic fibers were air-dried, and added to 250.0 mL sodium hydroxide (NaOH) in a 60�C water bath for 4 hours. The micro-fiber were then filtered and washed with distilled water. r-PE/Cellulose micro-fiber film was melt-blended with recycle polyethylene, polyethylene-g-maleic anhydride and pretreatment cellulose micro-fiber in a internal mixer. Recycle
222 Proceedings of the International Conference on Solid Waste 2011- Moving Towards Sustainable Resource Management,
Hong Kong SAR, P.R. China, 2 – 6 May 2011
polyethylene/Cellulose micro fiber blend ratio was fixed at 80 wt% of r-PE and 20 wt% of cellulose micro-fiber. Cellulose micro-fiber loadings were from 10, 20 and 30 wt%. For composites with the addition of PE-g-MA, the amount of PE-g-MA was fixed at 10 wt% based on cellulose micro-fiber weight. Melt temperature and mixing torque were recorded during the mixing periods.
Testing and Analysis
The mechanical properties of r-PE/Cellulose micro-fiber film were determined using an INSTRON universal-testing machine (model 8801). Tests were carried out according to ASTM standards D882-95a. Specimens submitted to tensile tests were cut and the composite intact fracture surface was analyzed in JEOL JSM5310 scanning electron microscopy (SEM). The surface functional groups and structure were studied by FTIR spectroscopy in Perkin Elmer System 2000 (FT-IR). The biodegradability of different r-PE/Cellulose micro-fiber film was determined by exposing the sample to compost area. In this study, the degradation of the film was evaluated by measuring its weight loss, which refers to the breaking of a molecular bond causing the loss of a side group of the overall chain.
Results and Discussion
Mechanical properties
Mechanical properties of studied composites are summarized in Table 1. Grafting process of cellulose micro-fiber with PE-g-MA presented higher tensile strength results than without grafting (not show here). The amount of added reinforcement contributes to variation of the tensile modulus as indicated in Table 1. Fibers insertion can contribute to the modulus increase, because the Young’s modulus of the fibers is higher than the thermoplastic modulus. However, to obtain a significant increase, a good interfacial bond between fiber and matrix is necessary. r-PE/PE-g-MA/ (30%) cellulose microfiber composite film presents higher average values for tensile strength and tensile modulus in comparison to r-PE. This increase in tensile modulus occurred as a consequence of the grafting process [2,3].
Table 1. Mechanical properties of the difference of cellulose microfiber loading in composite film
Specimens Tensile strength (MPa) Tensile modulus (MPa) % Elongation A 1.62�0.63 603�21.21 4.12�1.45
A-B-(10%)C 1.91�0.94 790�18.56 3.01�0.98 A-B-(20%)C 4.96�1.02 875�13.09 1.78�2.31 A-B-(30%)C 9.90�0.66 1132�17.87 1.35�1.14
A = r-PE, B = PE-g-MA, and (%) C = cellulose microfiber in wt.%.
Experimental results in Table 1 may be explained by the interaction observed between fiber and matrix during the mixture process. The grafting cellulose presented better tensile strength and adhesion between fiber and matrix than the non-grafting cellulose, confirming that cellulose grafting with PE-g-MA improves the adhesion between fiber and matrix. Composites presented lower elongation in comparison to the r-PE (Table 1), which confirms the reinforcement in the matrix. However the reinforcement of the non-grafting cellulose was not effective enough to increase resistance. The reinforcement in matrix with cellulose grafting presented lower elongation than non-grafting cellulose, due to interfacial adhesion, confirming that fibers grafting treatment improves the fiber and matrix adhesion. This can be confirmed by the fracture surface analysis.
Surface and Physical Properties
The reason for the use of PE-g-MA as a compatibilizer is based on two factors: first, the ester forming ability of anhydride groups with hydroxyl groups on cellulose micro-fiber, and the hydrogen-bond-forming ability between the carboxyl groups of hydrolyzed maleic anhydride and hydroxyl groups on fiber; second, the good compatibility between grafted PE chains and the PE phase. It is evident in Figure 2, that there are two characteristic peaks of r-PE/Cellulose micro-fiber composites, with those at 3200 cm-1 to 3400 cm-1 attributed to C-O-H bond stretching, and that near 1634 cm-1 attributed carboxyl/ester group formed between fiber and PE-g-MA and starch and PE-g-MA after the addition of compatibilizer [1,3].
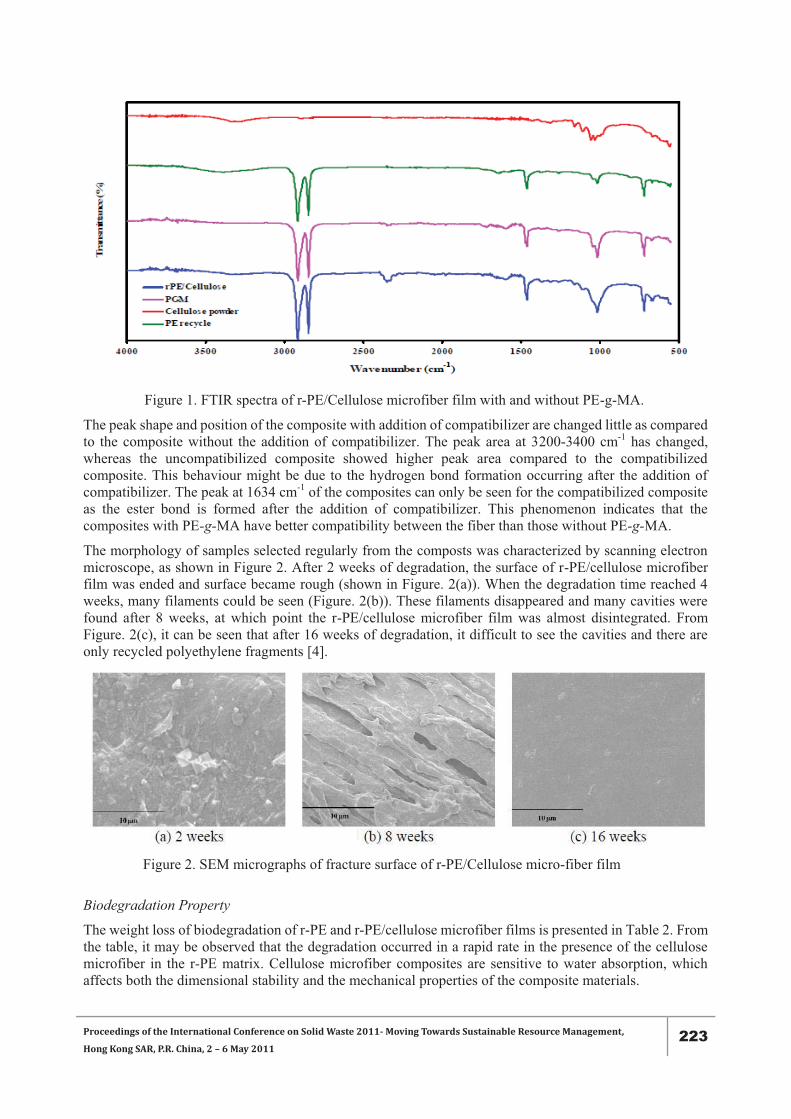
Proceedings of the International Conference on Solid Waste 2011- Moving Towards Sustainable Resource Management,
Hong Kong SAR, P.R. China, 2 – 6 May 2011 223
Figure 1. FTIR spectra of r-PE/Cellulose microfiber film with and without PE-g-MA.
The peak shape and position of the composite with addition of compatibilizer are changed little as compared to the composite without the addition of compatibilizer. The peak area at 3200-3400 cm-1 has changed, whereas the uncompatibilized composite showed higher peak area compared to the compatibilized composite. This behaviour might be due to the hydrogen bond formation occurring after the addition of compatibilizer. The peak at 1634 cm-1 of the composites can only be seen for the compatibilized composite as the ester bond is formed after the addition of compatibilizer. This phenomenon indicates that the composites with PE-g-MA have better compatibility between the fiber than those without PE-g-MA.
The morphology of samples selected regularly from the composts was characterized by scanning electron microscope, as shown in Figure 2. After 2 weeks of degradation, the surface of r-PE/cellulose microfiber film was ended and surface became rough (shown in Figure. 2(a)). When the degradation time reached 4 weeks, many filaments could be seen (Figure. 2(b)). These filaments disappeared and many cavities were found after 8 weeks, at which point the r-PE/cellulose microfiber film was almost disintegrated. From Figure. 2(c), it can be seen that after 16 weeks of degradation, it difficult to see the cavities and there are only recycled polyethylene fragments [4].
Figure 2. SEM micrographs of fracture surface of r-PE/Cellulose micro-fiber film
Biodegradation Property
The weight loss of biodegradation of r-PE and r-PE/cellulose microfiber films is presented in Table 2. From the table, it may be observed that the degradation occurred in a rapid rate in the presence of the cellulose microfiber in the r-PE matrix. Cellulose microfiber composites are sensitive to water absorption, which affects both the dimensional stability and the mechanical properties of the composite materials.
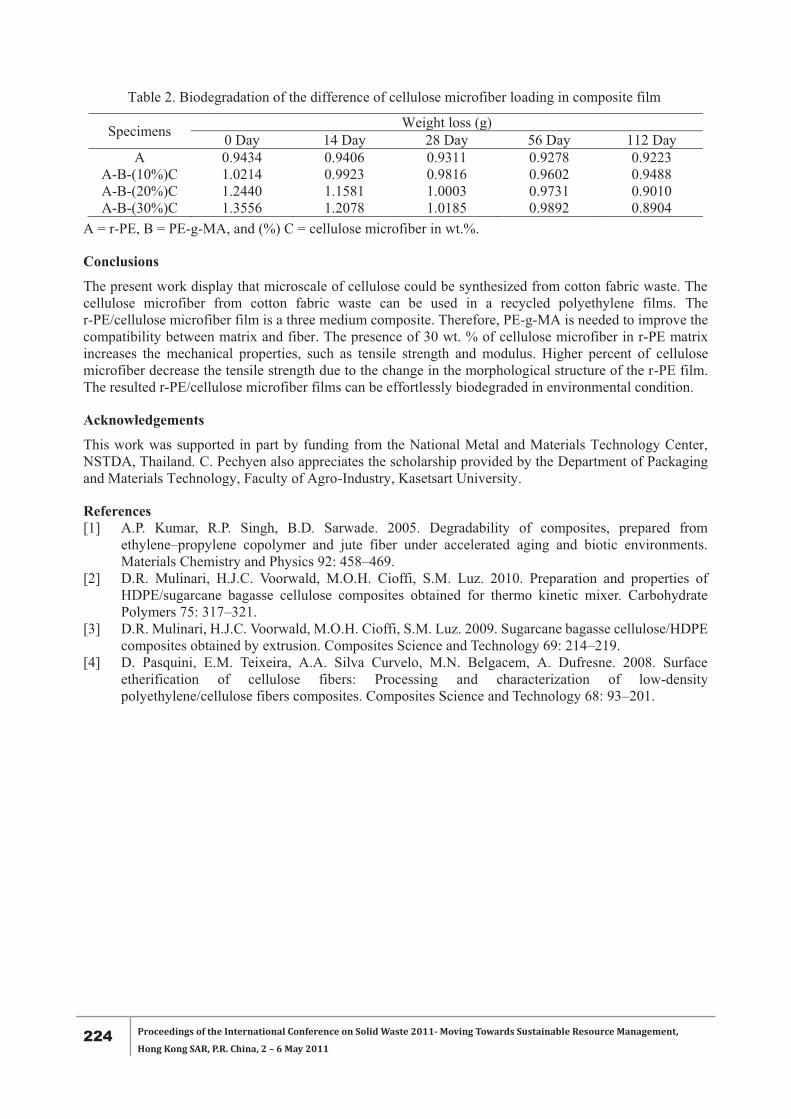
224 Proceedings of the International Conference on Solid Waste 2011- Moving Towards Sustainable Resource Management,
Hong Kong SAR, P.R. China, 2 – 6 May 2011
Table 2. Biodegradation of the difference of cellulose microfiber loading in composite film
Specimens Weight loss (g) 0 Day 14 Day 28 Day 56 Day 112 Day
A 0.9434 0.9406 0.9311 0.9278 0.9223 A-B-(10%)C 1.0214 0.9923 0.9816 0.9602 0.9488 A-B-(20%)C 1.2440 1.1581 1.0003 0.9731 0.9010 A-B-(30%)C 1.3556 1.2078 1.0185 0.9892 0.8904
A = r-PE, B = PE-g-MA, and (%) C = cellulose microfiber in wt.%.
Conclusions
The present work display that microscale of cellulose could be synthesized from cotton fabric waste. The cellulose microfiber from cotton fabric waste can be used in a recycled polyethylene films. The r-PE/cellulose microfiber film is a three medium composite. Therefore, PE-g-MA is needed to improve the compatibility between matrix and fiber. The presence of 30 wt. % of cellulose microfiber in r-PE matrix increases the mechanical properties, such as tensile strength and modulus. Higher percent of cellulose microfiber decrease the tensile strength due to the change in the morphological structure of the r-PE film. The resulted r-PE/cellulose microfiber films can be effortlessly biodegraded in environmental condition.
Acknowledgements
This work was supported in part by funding from the National Metal and Materials Technology Center, NSTDA, Thailand. C. Pechyen also appreciates the scholarship provided by the Department of Packaging and Materials Technology, Faculty of Agro-Industry, Kasetsart University.
References [1] A.P. Kumar, R.P. Singh, B.D. Sarwade. 2005. Degradability of composites, prepared from
ethylene–propylene copolymer and jute fiber under accelerated aging and biotic environments. Materials Chemistry and Physics 92: 458–469.
[2] D.R. Mulinari, H.J.C. Voorwald, M.O.H. Cioffi, S.M. Luz. 2010. Preparation and properties of HDPE/sugarcane bagasse cellulose composites obtained for thermo kinetic mixer. Carbohydrate Polymers 75: 317–321.
[3] D.R. Mulinari, H.J.C. Voorwald, M.O.H. Cioffi, S.M. Luz. 2009. Sugarcane bagasse cellulose/HDPE composites obtained by extrusion. Composites Science and Technology 69: 214–219.
[4] D. Pasquini, E.M. Teixeira, A.A. Silva Curvelo, M.N. Belgacem, A. Dufresne. 2008. Surface etherification of cellulose fibers: Processing and characterization of low-density polyethylene/cellulose fibers composites. Composites Science and Technology 68: 93–201.
Proceedings of the International Conference on Solid Waste 2011- Moving Towards Sustainable Resource Management,
Hong Kong SAR, P.R. China, 2 – 6 May 2011 225
BIOSURFACTANT PRODUCTION POTENTIAL OF NEW MICROBIAL ISOLATES IN COMBINATION OF DISTILLERY WASTE WITH OTHER INDUSTRIAL WASTES
K.V. Dubey 1*, P.N. Charde 1, S.U. Meshram 2, A.S. Shanware 3, R. Yosef 4, A.A. Juwarkar 5
1 Sevadal Mahila Mahavidyalaya, Sakkardara Square, Nagpur-440009, India 2Post Graduate Teaching Dept. of Microbiology; Rashtrasant Tukdoji Maharaj (RTM) Nagpur University,
LIT Campus, Nagpur-440010, India 3 Rajiv Gandhi Biotechnology Centre, Rashtrasant Tukdoji Maharaj (RTM) Nagpur University, LIT
Campus, Nagpur-440010, India 4 International Birding and Research Centre P.O. Box 774, Eilat 88106, (Israel) 5Environmental
Biotechnology Division, National Environmental Engineering Research Institute (NEERI), Nehru Marg, Nagpur-440015, India
*Correspondingauthor.Tel:+91-0712-2292728, Fax:+(91)-(712)-2705037, E-mail: [email protected]
ABSTRACT Present study aims to replace the use of water for biosurfactant production from distillery waste (DW) by using DW in combination with other industrial wastes viz. curd whey waste (WW), fruit processing waste (FPW) and sugar industry effluent (SIE) in 1:1:1proportion of DW: WW: FPW and DW: WW: SIE. Four bacterial cultures - BS-A, BS-J, BS-K and BS-P, all isolated from lube oil and distillery spent wash contaminated soil were used.These isolates have the potential to produce biosurfactant from each of the individual wastes and their combinations. Biomass and biosurfactant yields were higher in both the combinations of DW with other wastes compared to that in individual waste and the yields of biosurfactants improved in the range of 18-41%. Reduction in COD of the combined wastes was in the range of 20-54 %. Reduction in total sugars, N and P levels were in the rangeof 77-86%, 58-71% and 45-59%, respectively. This study has shown the benefits of combining DW with other wastes without supplementing DW with precious water for biosurfactant production by the isolates to achieve improved cost-effective production of biosurfactant with concomitant reduction in otherwise pollutiing wastes.
Keywords: Biosurfactant, Distillery waste, Curd whey, Sugar industry effluent, Combined wastes
Introduction
In the past few decades, biosurfactants have gained increased attention and are thought to be the potential candidate to replace synthetic surfactants in the future [1]. In view of its multifaceted benefits compared to synthetic surfactants, it is necessary to develop a cost-effective process technology for biosurfactant production so that application of biosurfactant in environmental remediation can be realized. It has been demonstrated thatfermentation medium can represent almost 30% of the cost for a microbial fermentation 2]. Earlier, we have reported various aspects of cost-effective production of biosurfactant from 1:3 diluted distillery waste, developed a new technique for recovery of di-rhamnolipid biosurfactant from fermented DW and its application in the removal of heavy metals from contaminated soil [3-5]. We have introduced DW as a new fermentation medium for biosurfactant production; however, DW as such cannot be used without dilution with water (1:3 proportions) due to the presence of large amount of sulphate ions, which inhibits the growth of biosurfactant producing microbial cultures [3]. Use of water, does not seem to be a sound practice if cost-effective strategy for biosurfactant production has to be developed using DW as substrate. This paper describes a comparative account on using different combinations of DW with other industrial wastes (to replace water) as no-cost medium for production of biosurfactant by four different newly isolated microbial cultures.
Materials and Methods
Collection, Processing and Physico-chemical Characterization of Industrial Waste Water for BiosurfactantProduction
Fresh distillery wastes (DW), whey waste (WW), fruit processing waste (FPW) and sugar industry effluent (SIE) were collected for biosurfactant production from the respective industries. Among these wastes, curd whey was processed to remove casein before use [3]. Physico-chemical characterization of these wastes was
226 Proceedings of the International Conference on Solid Waste 2011- Moving Towards Sustainable Resource Management,
Hong Kong SAR, P.R. China, 2 – 6 May 2011
performed before incubation (control) and after recovery of biosurfactant as per the standard methods. Total sugars were estimated by the method of Dubois et al., [6]. Total nitrogen and phosphate were estimated by using semi-micro Kjeldahl, and vanadomolybdo phosphoric acid colorimetric methods, respectively, and COD by closed reflux titrimetric method [7].
Isolation and Screening of BiosurfactantProducing Microorganisms
Biosurfactant producing microorganisms were isolated from soil (contaminated with lube oil and distillery spent wash) collected from spent wash pumping device of a distillery unit by culture enrichment technique [3]. Efficient biosurfactant producing isolates were screened on the basis of stability of foam, emulsification index, surface tension (ST) measurements, and bio surfactant yield [3-4].
Physico-chemical Characterization of DW and other Industrial Wastesalone and in Combination before and during Bio surfactantProduction
DW (diluted with tap water in 1:3 ratio), WW, SIE and FPW (100 ml of each) were sterilized in 250 ml Erlenmeyer flasks at 121o C and 15 lb/inch2 pressure for 20 minutes and then inoculated with the microbial isolates BS-A, BS-J, BS-K, and BS-P under aseptic conditions. Similarly below given sets of combinations of DW with other industrial wastes were sterilized and inoculated with these cultures for biosurfactant production: i). DW was combined with WW and SIE (DW: WW: SIE) in 1:1:1 ratio & ii) DW with WW and FPW (DW: WW: FPW) in 1:1:1 ratio. These flasks were incubated in a gyro rotatory shaker for 120 hours and after an interval of 24 hours of incubation, biomass yield in terms of cfu/ml, biosurfactant yield, reduction in ST and COD were monitored before and after biosurfactant recovery from individual wastes and combined wastes [3-4].
Statistical Analysis
All the experimental data are expressed in terms of arithmetic averages obtained from three replicates, and the analyses were done using Sigma Plot software, version 8.02 (SPSS Inc., UK).
Results and Discussion
Sources of Distillery and other Liquid Wastes for BiosurfactantProduction and their Physico-chemical Characteristics
To evolve a suitable combination of DW with other industrial wastes for biosurfactant production, DW and different types of other waste waters, such as SIE, WW, and FPW were collected. The DW had high COD, sugar and nitrogen levels as compared to WW, followed by FPW and SIE (Table 1). Results have shown that individually FPW and SIE with lower COD, sugar and nitrogen levels cannot be suitable for biosurfactant production however, these wastes can be combined with DW in a specific ratio and such a reconstitution can avoid the use of precious water required for biosurfactant production from distillery waste. Moreover, dilution of DW with SIE will be more desirable as the distillery and sugar factory are situated near to each other, minimisingtransportation of SIE to biosurfactant production site In case of curd whey, transport will be needed without any special cold storage tanks as continued fermentation of curd whey by indigenous lactic acid bacteria will produce more of lactic acid which is a substrate for biosurfactant production. The waste from fruit processing industry (FPW) was used for biosurfactant production.
Isolation and Screening of BiosurfactantProducing Microorganism and Industrial Wastes asSubstrates for Bio surfactantProduction
For isolation and screening of biosurfactant producing microorganisms, the phenomenon of reduction of ST of the culture medium and emulsification index was selected as described earlier [3]. Based on the results of these screening criteria, four isolates designated as BS-A, BS-J, BS-K and BS-P, were screened from 23 different types of microbial cultures obtained from lube oil and distillery spent wash contaminated soil which was collected from spent wash pumping device of a distillery unit (data not shown). Use of industrial wastes such as DW, WW, SIE and FPW for biosurfactant production by new microbial isolates was studied to form a basis of using these wastes as potential alternative fermentative medium formulations for
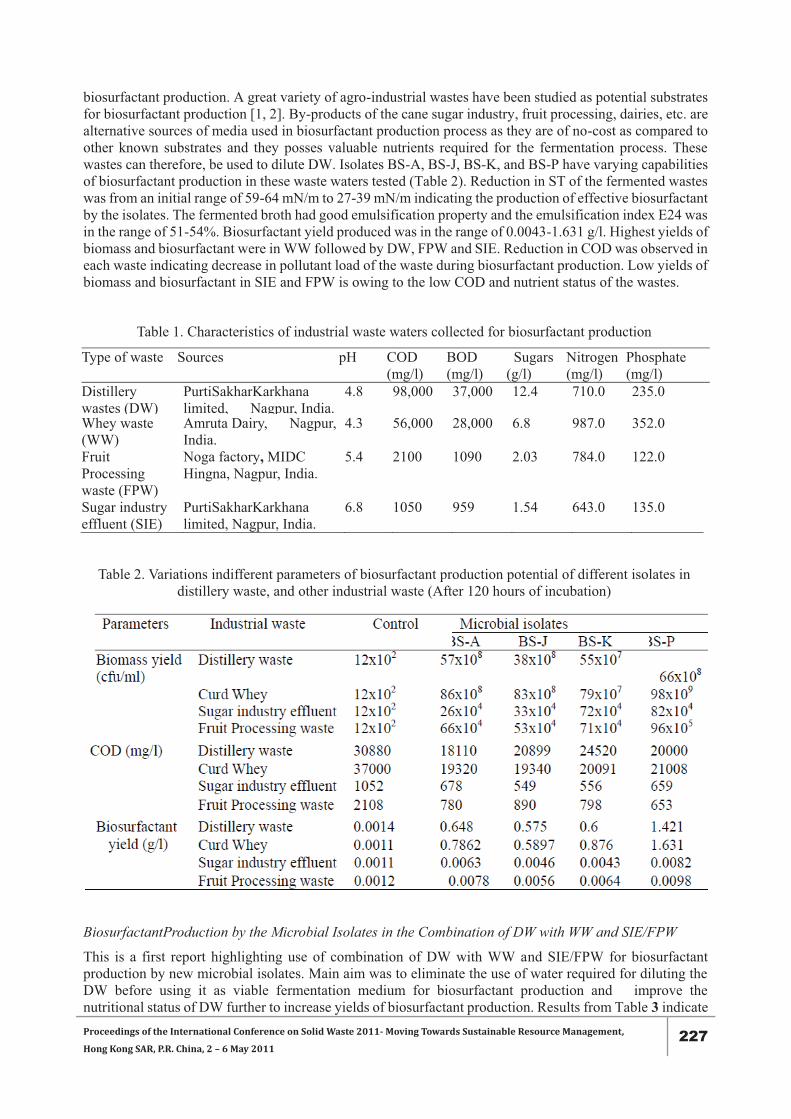
Proceedings of the International Conference on Solid Waste 2011- Moving Towards Sustainable Resource Management,
Hong Kong SAR, P.R. China, 2 – 6 May 2011 227
biosurfactant production. A great variety of agro-industrial wastes have been studied as potential substrates for biosurfactant production [1, 2]. By-products of the cane sugar industry, fruit processing, dairies, etc. are alternative sources of media used in biosurfactant production process as they are of no-cost as compared to other known substrates and they posses valuable nutrients required for the fermentation process. These wastes can therefore, be used to dilute DW. Isolates BS-A, BS-J, BS-K, and BS-P have varying capabilities of biosurfactant production in these waste waters tested (Table 2). Reduction in ST of the fermented wastes was from an initial range of 59-64 mN/m to 27-39 mN/m indicating the production of effective biosurfactant by the isolates. The fermented broth had good emulsification property and the emulsification index E24 was in the range of 51-54%. Biosurfactant yield produced was in the range of 0.0043-1.631 g/l. Highest yields of biomass and biosurfactant were in WW followed by DW, FPW and SIE. Reduction in COD was observed in each waste indicating decrease in pollutant load of the waste during biosurfactant production. Low yields of biomass and biosurfactant in SIE and FPW is owing to the low COD and nutrient status of the wastes.
Table 1. Characteristics of industrial waste waters collected for biosurfactant production
Type of waste Sources pH COD (mg/l)
BOD (mg/l)
Sugars (g/l)
Nitrogen (mg/l)
Phosphate (mg/l)
Distillery wastes (DW)
PurtiSakharKarkhana limited, Nagpur, India.
4.8 98,000 37,000 12.4 710.0
235.0
Whey waste (WW)
Amruta Dairy, Nagpur, India.
4.3 56,000 28,000 6.8 987.0 352.0
Fruit Processing waste (FPW)
Noga factory, MIDC Hingna, Nagpur, India.
5.4 2100 1090 2.03 784.0 122.0
Sugar industry effluent (SIE)
PurtiSakharKarkhana limited, Nagpur, India.
6.8 1050 959 1.54 643.0 135.0
Table 2. Variations indifferent parameters of biosurfactant production potential of different isolates in distillery waste, and other industrial waste (After 120 hours of incubation)
BiosurfactantProduction by the Microbial Isolates in the Combination of DW with WW and SIE/FPW
This is a first report highlighting use of combination of DW with WW and SIE/FPW for biosurfactant production by new microbial isolates. Main aim was to eliminate the use of water required for diluting the DW before using it as viable fermentation medium for biosurfactant production and improve the nutritional status of DW further to increase yields of biosurfactant production. Results from Table 3 indicate
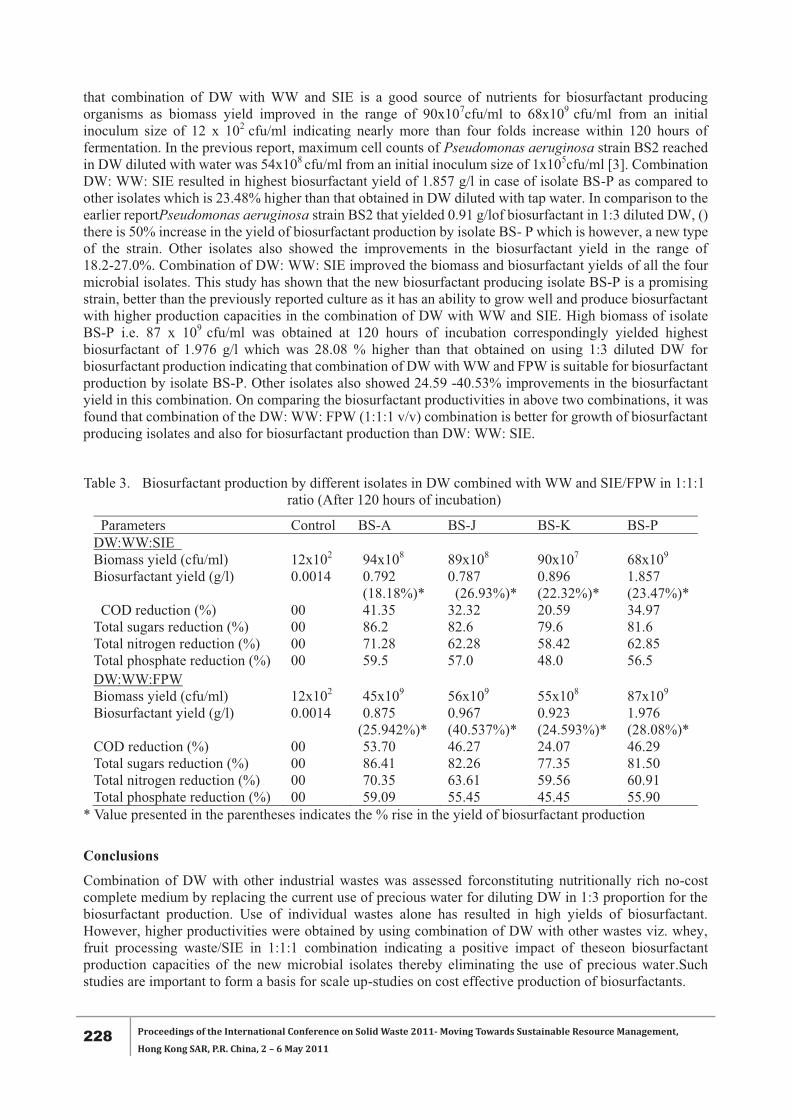
228 Proceedings of the International Conference on Solid Waste 2011- Moving Towards Sustainable Resource Management,
Hong Kong SAR, P.R. China, 2 – 6 May 2011
that combination of DW with WW and SIE is a good source of nutrients for biosurfactant producing organisms as biomass yield improved in the range of 90x107cfu/ml to 68x109 cfu/ml from an initial inoculum size of 12 x 102 cfu/ml indicating nearly more than four folds increase within 120 hours of fermentation. In the previous report, maximum cell counts of Pseudomonas aeruginosa strain BS2 reached in DW diluted with water was 54x108 cfu/ml from an initial inoculum size of 1x10⁵cfu/ml [3]. Combination DW: WW: SIE resulted in highest biosurfactant yield of 1.857 g/l in case of isolate BS-P as compared to other isolates which is 23.48% higher than that obtained in DW diluted with tap water. In comparison to the earlier reportPseudomonas aeruginosa strain BS2 that yielded 0.91 g/lof biosurfactant in 1:3 diluted DW, () there is 50% increase in the yield of biosurfactant production by isolate BS- P which is however, a new type of the strain. Other isolates also showed the improvements in the biosurfactant yield in the range of 18.2-27.0%. Combination of DW: WW: SIE improved the biomass and biosurfactant yields of all the four microbial isolates. This study has shown that the new biosurfactant producing isolate BS-P is a promising strain, better than the previously reported culture as it has an ability to grow well and produce biosurfactant with higher production capacities in the combination of DW with WW and SIE. High biomass of isolate BS-P i.e. 87 x 109 cfu/ml was obtained at 120 hours of incubation correspondingly yielded highest biosurfactant of 1.976 g/l which was 28.08 % higher than that obtained on using 1:3 diluted DW for biosurfactant production indicating that combination of DW with WW and FPW is suitable for biosurfactant production by isolate BS-P. Other isolates also showed 24.59 -40.53% improvements in the biosurfactant yield in this combination. On comparing the biosurfactant productivities in above two combinations, it was found that combination of the DW: WW: FPW (1:1:1 v/v) combination is better for growth of biosurfactant producing isolates and also for biosurfactant production than DW: WW: SIE.
Table 3. Biosurfactant production by different isolates in DW combined with WW and SIE/FPW in 1:1:1 ratio (After 120 hours of incubation)
Parameters Control BS-A BS-J BS-K BS-P DW:WW:SIE Biomass yield (cfu/ml) 12x102 94x108 89x108 90x107 68x109 Biosurfactant yield (g/l) 0.0014 0.792
(18.18%)* 0.787 (26.93%)*
0.896 (22.32%)*
1.857 (23.47%)*
COD reduction (%) 00 41.35 32.32 20.59 34.97 Total sugars reduction (%) 00 86.2 82.6 79.6 81.6 Total nitrogen reduction (%) 00 71.28 62.28 58.42 62.85 Total phosphate reduction (%) 00 59.5 57.0 48.0 56.5 DW:WW:FPW Biomass yield (cfu/ml) 12x102 45x109 56x109 55x108 87x109 Biosurfactant yield (g/l) 0.0014 0.875
(25.942%)* 0.967 (40.537%)*
0.923 (24.593%)*
1.976 (28.08%)*
COD reduction (%) 00 53.70 46.27 24.07 46.29 Total sugars reduction (%) 00 86.41 82.26 77.35 81.50 Total nitrogen reduction (%) 00 70.35 63.61 59.56 60.91 Total phosphate reduction (%) 00 59.09 55.45 45.45 55.90
* Value presented in the parentheses indicates the % rise in the yield of biosurfactant production
Conclusions
Combination of DW with other industrial wastes was assessed forconstituting nutritionally rich no-cost complete medium by replacing the current use of precious water for diluting DW in 1:3 proportion for the biosurfactant production. Use of individual wastes alone has resulted in high yields of biosurfactant. However, higher productivities were obtained by using combination of DW with other wastes viz. whey, fruit processing waste/SIE in 1:1:1 combination indicating a positive impact of theseon biosurfactant production capacities of the new microbial isolates thereby eliminating the use of precious water.Such studies are important to form a basis for scale up-studies on cost effective production of biosurfactants.
Proceedings of the International Conference on Solid Waste 2011- Moving Towards Sustainable Resource Management,
Hong Kong SAR, P.R. China, 2 – 6 May 2011 229
Acknowledgements
Authors acknowledge University Grants Commission (UGC), New Delhi, India, for financial support.
References [1] S. Maneerat. 2005. Production of biosurfactants using substrates from renewable resources.
Songklanakarin J. Sci. Technol. 27: 675-683. [2] L. R. Rodrigues, J. A. Moldes, R. Teiseini, and R. Oliveira. 2006. Kinetic study of fermentative
biosurfactant production by Lactobacillus strains. Biochem. Eng. J. 28: 109-116. [3] K. V. Dubey and A. A. Juwarkar. 2001. Distillery and curd whey wastes as viable alternative sources
for biosurfactant production. World J. Microbiol. Biotechnol. 17: 61-69. [4] K. V. Dubey, A. A. Juwarkar and S. K. Singh. 2005. Adsorption-desorption process using activated
carbon for recovery of biosurfactant from distillery waste. Biotechnol Progress 21: 860-867. [5] A. A. Juwarkar, A. Nair, K. Dubey, S.K. Singh and S. Devotta. 2007. Biosurfactant technology for
remediation of cadmium and lead contaminated soil. Chemosphere 68: 1996-2002. [6] M. Dubois, K. A. Gilles, J. K. Hamilton, P. A. Rubero, and F. Smith. 1956. Colorimetric method for
determination of sugars and related substances. Analy. Chem. 28: 31-46. [7] APHA, AWWA, WPCF. 1989. Standard Methods for Examination of Water and Wastewater, 17thedn.
New York, USA: APHA, AWWA, WPCF. ISBN 0-87553-161-X.

230 Proceedings of the International Conference on Solid Waste 2011- Moving Towards Sustainable Resource Management,
Hong Kong SAR, P.R. China, 2 – 6 May 2011
CHARACTERISTICS OF POROUS CERAMICS PRODUCED FROM WASTE DIATOMITE AND WATER PURIFICATION SLUDGE
K.L. Lin *, J.C. Chang, J.L. Shie
Department of Environmental Engineering, National Ilan University, 26047, Taiwan, R. O. C. * Corresponding author. Tel: +886-3-9357400 ext 749, Fax: +886-3-9364277, E-mail: [email protected]
ABSTRACT This study investigated and analyzed the effects of heating temperature on the properties of porous ceramics produced from waste diatomite and water purification sludge. The TCLP leaching concentrations of each material were within the R. O. C. EPA’s current regulatory threshold values. Furthermore, as the heating temperature increased, the amount of water absorption by the porous ceramics was declined. Scanning electron microscopy and mercury porosimetry demonstrated that the water purification sludge ash bonded the diatomite powder together into relatively strong monoliths without significantly reducing the volume of internal pores especially at temperature between 1200 and 1270oC. From this study, the higher mechanical strength and high water absorption capacity of porous ceramics proved them as water-retaining materials that can be used in pavements.
Keywords: Diatomite, Water purification sludge, Sintering, Porous ceramics, Water absorption
Introduction
The annual production of waste diatomite in Taiwan is 4,713 ktonnes. High-grade diatomaceous earth that contains a approximately 95% of diatomite (SiO2·nH2O) is less abundant in nature and mostly contains alumina and other impurities such as alkaline earth elements, alkaline metals, iron and organic components. It contains several fine microscopic pores, cavities and channels. Accordingly, this material has a low thermal conductivity, relatively high melting-point, chemical inertness and small grain size. Moreover, owing to its relatively low cost and abundance, it is used extensively as a filler, filtering aid, abrasive, insulating material, conventional catalyst support and as membrane [1-3]. The annual production of sludge by 29 purification treatment plants for drinking water in Taiwan is 166,000 tonnes. Currently, sanitary landfills are frequently used for disposing of this sludge, but rapid urbanization has made locating suitable landfill sites were increasingly difficult [4]. Increasing demand for natural resources and a scarcity of environmentally acceptable solid waste disposal sites are motivating numerous municipalities in Taiwan to consider resource recovery as an alternative.
Porous ceramics can combine high permeability with good mechanical, thermal, and chemical stability, which are attractive for a wide range of industrial applications [5,6]. The purpose of this investigation is to demonstrate the method for producing the porous ceramic monoliths can be produced from diatomite and water purification sludge. The effect of the temperature on the density and the mechanical stability of the porous monoliths will be discussed and an optimal range of temperatures for the preparation of porous materials from diatomite and water purification sludge will be identified.
Materials and Methods
Materials
The waste diatomite and water purification sludge used was collected from the food-processing industry and water purification industry located in Taipei County, Taiwan.
Production of Compacted Sintered Porous Ceramics from both Materials
The waste diatomite and the sludge samples were oven-dried at 105oC for 24 hours and ground in a ball mill to form fine powders suitable for pressing. The powder samples were mixed with each other to prepare a known mass percentage of sludge in diatomite in different concentration of sludge (0.0-20.0% by mass) to produce porous ceramics samples. The compacted specimens were put in a platinum plate and ignited in an electrically heated furnace, using a heating rate of 5oC/min. The ignited samples were then sintered at temperatures between 1000oC and 1270oC, for 120 minutes to produce porous ceramics samples.
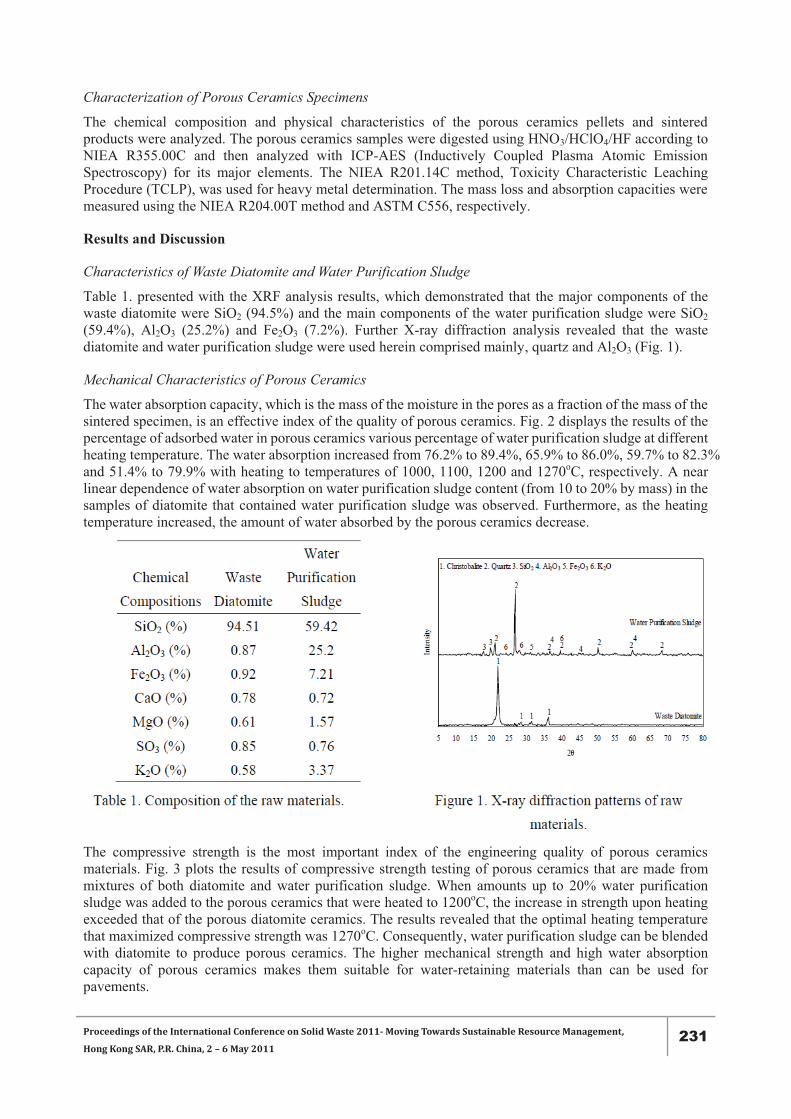
Proceedings of the International Conference on Solid Waste 2011- Moving Towards Sustainable Resource Management,
Hong Kong SAR, P.R. China, 2 – 6 May 2011 231
Characterization of Porous Ceramics Specimens
The chemical composition and physical characteristics of the porous ceramics pellets and sintered products were analyzed. The porous ceramics samples were digested using HNO3/HClO4/HF according to NIEA R355.00C and then analyzed with ICP-AES (Inductively Coupled Plasma Atomic Emission Spectroscopy) for its major elements. The NIEA R201.14C method, Toxicity Characteristic Leaching Procedure (TCLP), was used for heavy metal determination. The mass loss and absorption capacities were measured using the NIEA R204.00T method and ASTM C556, respectively.
Results and Discussion
Characteristics of Waste Diatomite and Water Purification Sludge
Table 1. presented with the XRF analysis results, which demonstrated that the major components of the waste diatomite were SiO2 (94.5%) and the main components of the water purification sludge were SiO2 (59.4%), Al2O3 (25.2%) and Fe2O3 (7.2%). Further X-ray diffraction analysis revealed that the waste diatomite and water purification sludge were used herein comprised mainly, quartz and Al2O3 (Fig. 1).
Mechanical Characteristics of Porous Ceramics
The water absorption capacity, which is the mass of the moisture in the pores as a fraction of the mass of the sintered specimen, is an effective index of the quality of porous ceramics. Fig. 2 displays the results of the percentage of adsorbed water in porous ceramics various percentage of water purification sludge at different heating temperature. The water absorption increased from 76.2% to 89.4%, 65.9% to 86.0%, 59.7% to 82.3% and 51.4% to 79.9% with heating to temperatures of 1000, 1100, 1200 and 1270oC, respectively. A near linear dependence of water absorption on water purification sludge content (from 10 to 20% by mass) in the samples of diatomite that contained water purification sludge was observed. Furthermore, as the heating temperature increased, the amount of water absorbed by the porous ceramics decrease.
The compressive strength is the most important index of the engineering quality of porous ceramics materials. Fig. 3 plots the results of compressive strength testing of porous ceramics that are made from mixtures of both diatomite and water purification sludge. When amounts up to 20% water purification sludge was added to the porous ceramics that were heated to 1200oC, the increase in strength upon heating exceeded that of the porous diatomite ceramics. The results revealed that the optimal heating temperature that maximized compressive strength was 1270oC. Consequently, water purification sludge can be blended with diatomite to produce porous ceramics. The higher mechanical strength and high water absorption capacity of porous ceramics makes them suitable for water-retaining materials than can be used for pavements.
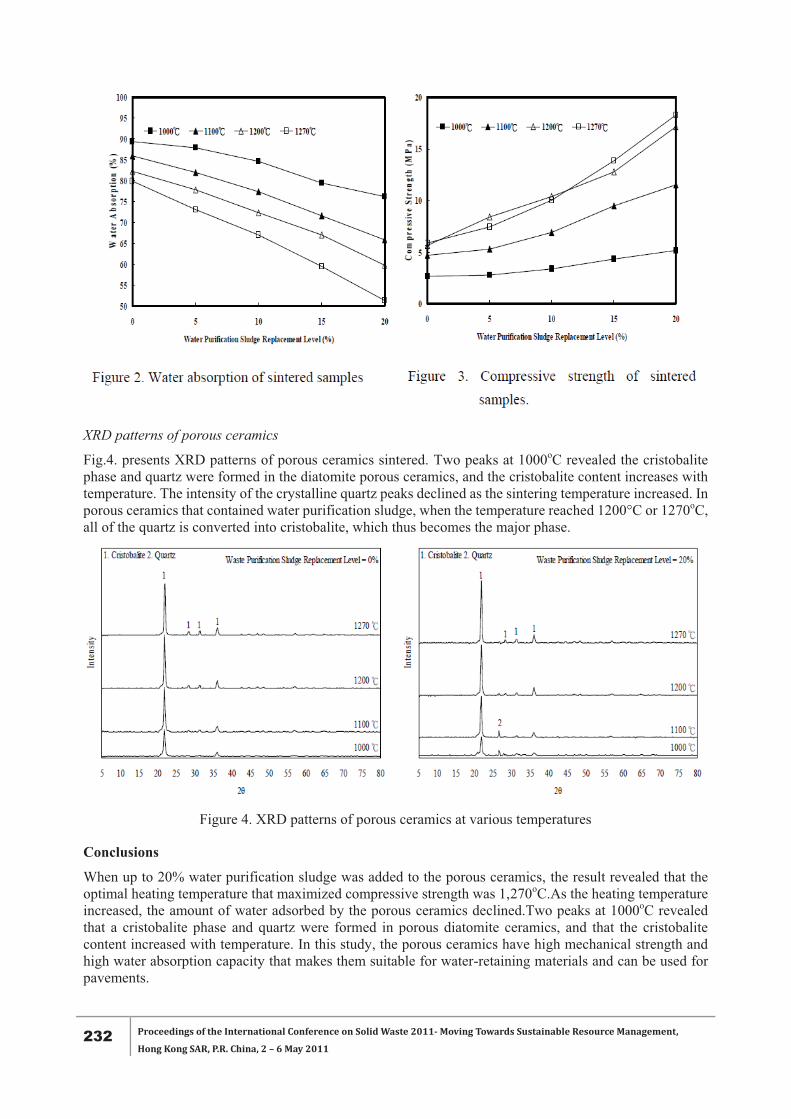
232 Proceedings of the International Conference on Solid Waste 2011- Moving Towards Sustainable Resource Management,
Hong Kong SAR, P.R. China, 2 – 6 May 2011
XRD patterns of porous ceramics
Fig.4. presents XRD patterns of porous ceramics sintered. Two peaks at 1000oC revealed the cristobalite phase and quartz were formed in the diatomite porous ceramics, and the cristobalite content increases with temperature. The intensity of the crystalline quartz peaks declined as the sintering temperature increased. In porous ceramics that contained water purification sludge, when the temperature reached 1200°C or 1270oC, all of the quartz is converted into cristobalite, which thus becomes the major phase.
Figure 4. XRD patterns of porous ceramics at various temperatures
Conclusions
When up to 20% water purification sludge was added to the porous ceramics, the result revealed that the optimal heating temperature that maximized compressive strength was 1,270oC.As the heating temperature increased, the amount of water adsorbed by the porous ceramics declined.Two peaks at 1000oC revealed that a cristobalite phase and quartz were formed in porous diatomite ceramics, and that the cristobalite content increased with temperature. In this study, the porous ceramics have high mechanical strength and high water absorption capacity that makes them suitable for water-retaining materials and can be used for pavements.

Proceedings of the International Conference on Solid Waste 2011- Moving Towards Sustainable Resource Management,
Hong Kong SAR, P.R. China, 2 – 6 May 2011 233
Acknowledgements
The authors would like to thank the National Science Council of Taiwan No. NSC 98-2621-M-197-001 and the DoIT of the Ministry of Economic Affairs of Taiwan, for financially supporting this research under Contract No. 99-EC-17-A10-S1-151.
References [1] Vasconcelos, P.V. Labrincha, J.A. and Ferreira, J. M. F. (1998), Porosity development of diatomite
layers processed by tape casting. Ceram. Int. 24 (6), 447–454. [2] Vasconcelos, P.V. Labrincha, J. A. and Ferreira, J. M. F. (2000), Permeability of diatomite layers
processed by different colloidal techniques. J. Euro. Soc. 20, 201–207. [3] Zhang, X., Liu, X., & Meng, G. (2005), Sintering kinetics of porous ceramics from natural diatomite.
J. Am. Ceram. Soc. 88 (7), 1826–1830. [4] Weng, C. H., Lin, D. F., & Chiang, P. C. (2003), Utilization of sludge as brick materials. Adv. Environ.
Res. 7, 679–685. [5] Greil, P. (2002), Advanced Engineering Ceramics. Adv. Mat. 14 (10), 709–716. [6] Akhtar, F. Vasiliev, P. O. and Bergstrom, L. (2009), Hierarchically porous ceramics from diatomite
powders by pulsed current processing. J. Am. Ceram. Soc. 92 (2), 338–343.
234 Proceedings of the International Conference on Solid Waste 2011- Moving Towards Sustainable Resource Management,
Hong Kong SAR, P.R. China, 2 – 6 May 2011
AN EXPERIMENTAL SCHOOL PROTOTYPE: ENGAGING CHILDEN’S SENSES IN 3R (REDUCE, REUSE & RECYCLE) LEARNING
S.Y. Kong *, Naziaty , S.P. Rao
Department of Architecture, University of Malaya, Malaysia * Corresponding author: E-mail: [email protected], Tel: +60123010369
ABSTRACT This paper presents an experimental school prototype (hereafter designated as “The Eco-Literacy School) for Malaysia. The study employed a qualitative method to develop a set of design strategies to engage children’s senses in 3Rs (Reduce, Reuse & Recycle) learning. Research team conducted an in-depth study involving a series of interviews and workshop discussions with a panel of professional architects as well as academic staff in the Faculty of Built Environment at University of Malaya to gather the relevant data. The findings suggested that the concept of ‘turning waste into educational space’ by integrating 3Rs program into the learning environment. Additionally, the findings explored innovative building materials and technology in school construction. A synthesis of the findings revealed that the potential use of learning environment to guide children towards pro-environmental behaviour. These findings offer significant contribution towards educational facilities reform in the tropics.
Keywords: Eco-Literacy School, Senses, 3R, Children, Malaysia
Introduction
Waste management is a daunting task in many developing countries. In Malaysia, the economic boom in recent years has led to rapid urbanisation and consumption-oriented lifestyle among its citizens [1]. Education of young children is a potential way of addressing this issue.The current 3R program in Malaysia is infused into the children’s daily learning subjects [2]. The-day to-day 3R learning happens through the abstract representation in a featureless classroom. Children are dependent upon reading as their primary source of learning without any real sensory experience. This is in contrast to Weston’s writings [3] who argued that the multisensory experience can help tremendously in molding the children’s pro-environmental behaviour. Baines [4] further explained that if children invoke more than one sense over a period of time, they can retain what they have learned for a longer period. However, multisensory learning can only be successful if careful thoughts are given to the learning environment.
Reggio Emilia’s education approach identifies three educators in a classroom at anytime, namely the teacher, the children and the environment [5]. Our surroundings can contribute to children’s learning if we treat the environment as an important element in children’s education [6]. This potential use of environment as “the third teacher” is not fully explored in Malaysian school system. In fact, the concept of “Factory Model” [7] prevails in public school design. These school buildings are designed to meet the budget and merely function as a shelter “for the act of teaching/learning to take place” [8]. It deprives our children of a creative, imaginative and multisensory learning space.How can we engage children’s senses in 3Rs learning? How do we translate 3Rs program into the learning environment? This research is addressed to these questions by examining the innovative alternations to the current prevailing school system in Malaysia.
Materials and Methods
Qualitative Methodology
The qualitative method involves a series of interviews and workshop discussions with a panel of professional architects and academic staffs in the Faculty of Built Environment at University of Malaya. It is conducted as an experimental project with a primary school prototype as the research outcome. The qualitative research explores various design strategies and options in search of new architectural ideas for a primary school.
Data Collection and Analysis
A design brief stating the focus of the research was established to investigate the use of sensory architecture in supporting 3Rs education. Open and semi-structured interviews were conducted with academic staffs in the Faculty of Built Environment to develop design concept and ideas through a series of conceptual

Proceedings of the International Conference on Solid Waste 2011- Moving Towards Sustainable Resource Management,
Hong Kong SAR, P.R. China, 2 – 6 May 2011 235
sketches. These sketches were then turned into 2D/3D drawings and cardboard study model. The school prototype design was continually developed and refined through a series of workshop discussion with a panel of experts consisting of senior lecturers and practicing architects. The panel of experts reviewed the research project to give professional input on design, constructability, feasibility and practicality.
Researcher’s Relationship to the Data
The study was initiated and conducted by the Principal Investigator (PI). The PI spent a significant amount of time with the academic staffs in the Faculty of Built Environment, during which time and efforts were made to gain input for multisensory design. The medium of communication were idea sketches, 2D/3D drawings and study model. The PI is a qualified LEED Accredited Professional (LEED AP) with architectural background. The PI has worked on various conceptual design projects involving sensory architecture in both academic and professional field.
Results and Discussion
The Concept of “Turning Waste into Educational Space”
The research team identified the concept of “turning waste into educational space” for the proposed Eco-Literacy School in Malaysia. It is a unique way of designing and constructing by using reclaimed and salvaged materials that otherwise will end up in the landfill. The school buildings will serve as a “3D textbook” that reflects the lessons of Reduce, Reuse and Recycle. It promotes the integration of children’s senses in 3Rs education and encourages self-discovery and hands-on learning.
The 3Rs concept begins with the construction process that consists of two phases. The building professionals and contractor will design and construct the concrete frame as the main permanent structure or known as the ‘Skeleton’ in Phase I. Crushed concrete from nearby demolition projects provide a rich source of recycled aggregate for foundation and concrete work. The local community will then be involved in Phase II for landscaping and installation of wall cassettes as the “Skin” or infill. The shelf-like wall cassettes are specially designed to store recyclable materials like bottles and aluminium cans that students brought from their homes (Figure 3). In addition, the school is designed with the ‘kit-of-parts’ approach that facilitates deconstruction at the end of its life cycle. Most of the architectural components can be assembled and dissembled easily for reuse and recycling purpose in the future. This would ensure that the materials are continuously in active service and diverted from the landfill.
Reduce
The Eco-Literacy School is designed to be different from the conventional buildings to assist learning about ‘Reduce’. Effective use of materials and spaces minimises waste of resources. Traditional roof only served as a shelter, but the roof garden in Eco-Literacy School is able to collect and filter rainwater for toilet flushing, improve the thermal insulation and provide extra opportunity for children to engage with nature. The sensory experience guides the children towards creative way of ‘doing more with less’. It promotes minimization of waste through resource efficiency.
Reuse
The concept of ‘Reuse’ is reflected in the installation of second-hand windows and doors that have been salvaged from nearby demolition project. Children learn to appreciate or conserve resources and reuse things that others may regard as waste. Incorporating reclaimed materials in the school design is able to engage the sense of touch in children’s learning. Constant use and contact with these reclaimed architectural components encourages the children to be creative in finding new uses and applications for discarded items.
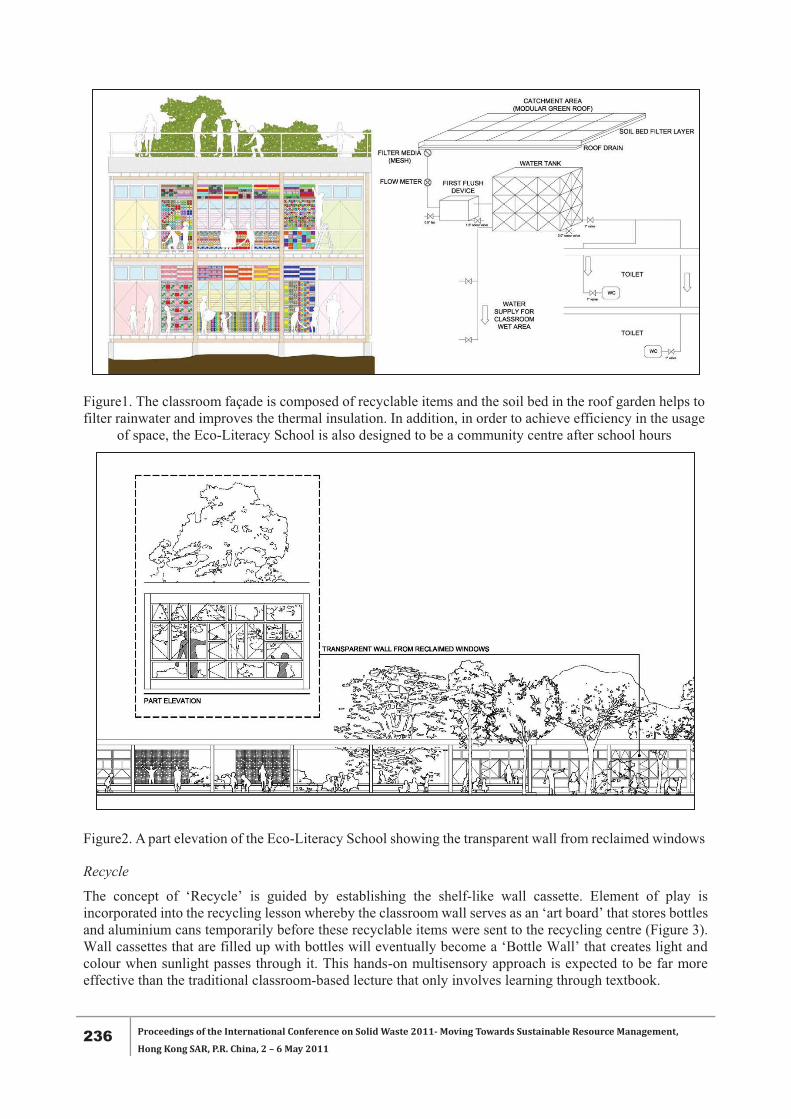
236 Proceedings of the International Conference on Solid Waste 2011- Moving Towards Sustainable Resource Management,
Hong Kong SAR, P.R. China, 2 – 6 May 2011
Figure1. The classroom façade is composed of recyclable items and the soil bed in the roof garden helps to filter rainwater and improves the thermal insulation. In addition, in order to achieve efficiency in the usage
of space, the Eco-Literacy School is also designed to be a community centre after school hours
Figure2. A part elevation of the Eco-Literacy School showing the transparent wall from reclaimed windows
Recycle
The concept of ‘Recycle’ is guided by establishing the shelf-like wall cassette. Element of play is incorporated into the recycling lesson whereby the classroom wall serves as an ‘art board’ that stores bottles and aluminium cans temporarily before these recyclable items were sent to the recycling centre (Figure 3). Wall cassettes that are filled up with bottles will eventually become a ‘Bottle Wall’ that creates light and colour when sunlight passes through it. This hands-on multisensory approach is expected to be far more effective than the traditional classroom-based lecture that only involves learning through textbook.
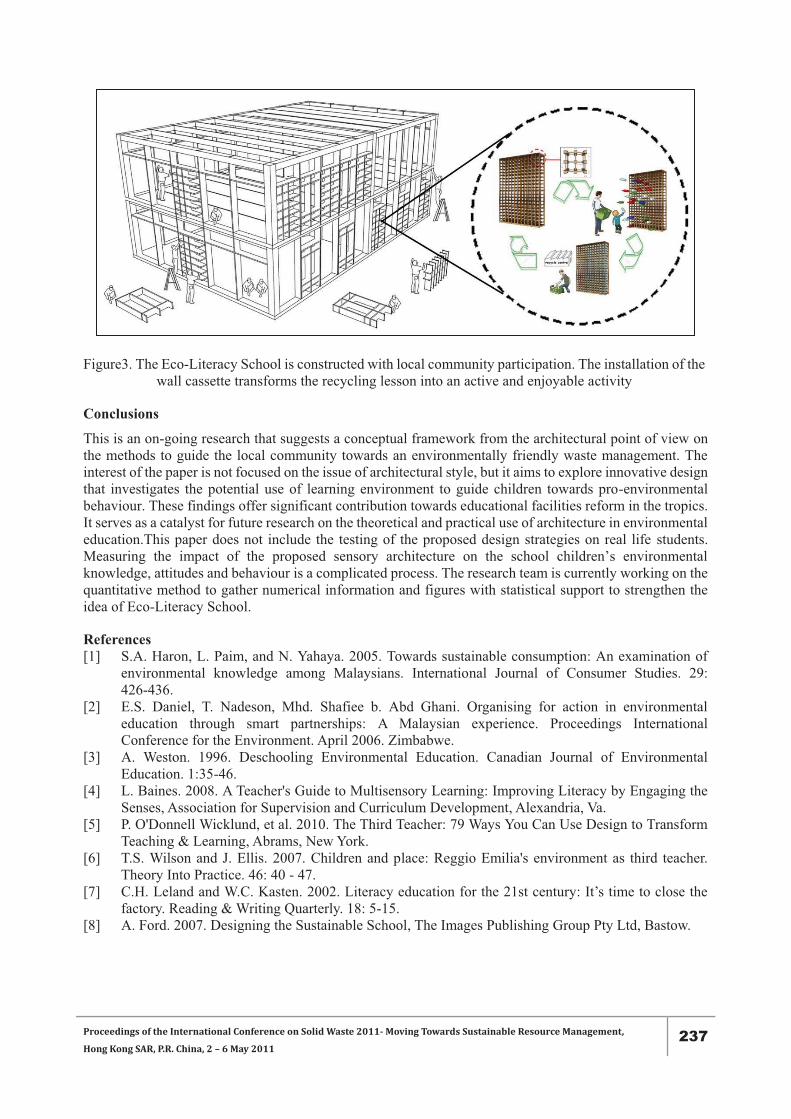
Proceedings of the International Conference on Solid Waste 2011- Moving Towards Sustainable Resource Management,
Hong Kong SAR, P.R. China, 2 – 6 May 2011 237
Figure3. The Eco-Literacy School is constructed with local community participation. The installation of the wall cassette transforms the recycling lesson into an active and enjoyable activity
Conclusions
This is an on-going research that suggests a conceptual framework from the architectural point of view on the methods to guide the local community towards an environmentally friendly waste management. The interest of the paper is not focused on the issue of architectural style, but it aims to explore innovative design that investigates the potential use of learning environment to guide children towards pro-environmental behaviour. These findings offer significant contribution towards educational facilities reform in the tropics. It serves as a catalyst for future research on the theoretical and practical use of architecture in environmental education.This paper does not include the testing of the proposed design strategies on real life students. Measuring the impact of the proposed sensory architecture on the school children’s environmental knowledge, attitudes and behaviour is a complicated process. The research team is currently working on the quantitative method to gather numerical information and figures with statistical support to strengthen the idea of Eco-Literacy School.
References [1] S.A. Haron, L. Paim, and N. Yahaya. 2005. Towards sustainable consumption: An examination of
environmental knowledge among Malaysians. International Journal of Consumer Studies. 29: 426-436.
[2] E.S. Daniel, T. Nadeson, Mhd. Shafiee b. Abd Ghani. Organising for action in environmental education through smart partnerships: A Malaysian experience. Proceedings International Conference for the Environment. April 2006. Zimbabwe.
[3] A. Weston. 1996. Deschooling Environmental Education. Canadian Journal of Environmental Education. 1:35-46.
[4] L. Baines. 2008. A Teacher's Guide to Multisensory Learning: Improving Literacy by Engaging the Senses, Association for Supervision and Curriculum Development, Alexandria, Va.
[5] P. O'Donnell Wicklund, et al. 2010. The Third Teacher: 79 Ways You Can Use Design to Transform Teaching & Learning, Abrams, New York.
[6] T.S. Wilson and J. Ellis. 2007. Children and place: Reggio Emilia's environment as third teacher. Theory Into Practice. 46: 40 - 47.
[7] C.H. Leland and W.C. Kasten. 2002. Literacy education for the 21st century: It’s time to close the factory. Reading & Writing Quarterly. 18: 5-15.
[8] A. Ford. 2007. Designing the Sustainable School, The Images Publishing Group Pty Ltd, Bastow.
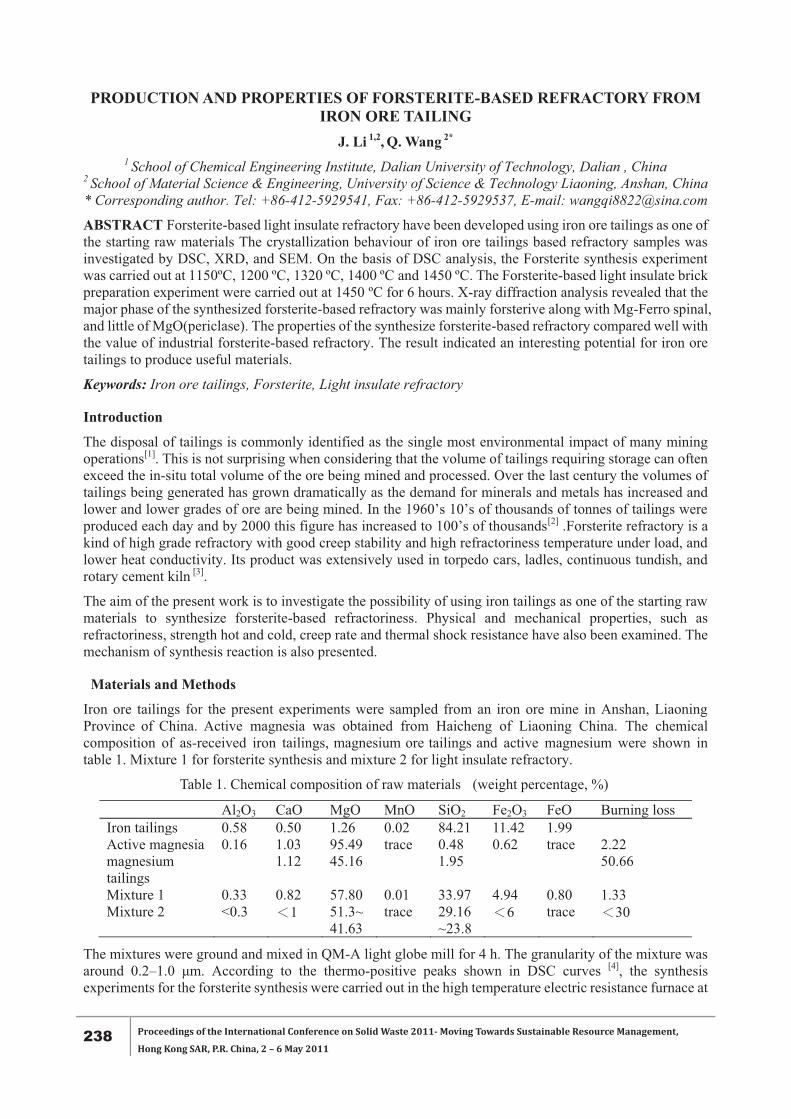
238 Proceedings of the International Conference on Solid Waste 2011- Moving Towards Sustainable Resource Management,
Hong Kong SAR, P.R. China, 2 – 6 May 2011
PRODUCTION AND PROPERTIES OF FORSTERITE-BASED REFRACTORY FROM IRON ORE TAILING
J. Li 1,2, Q. Wang 2* 1 School of Chemical Engineering Institute, Dalian University of Technology, Dalian , China
2 School of Material Science & Engineering, University of Science & Technology Liaoning, Anshan, China * Corresponding author. Tel: +86-412-5929541, Fax: +86-412-5929537, E-mail: [email protected]
ABSTRACT Forsterite-based light insulate refractory have been developed using iron ore tailings as one of the starting raw materials The crystallization behaviour of iron ore tailings based refractory samples was investigated by DSC, XRD, and SEM. On the basis of DSC analysis, the Forsterite synthesis experiment was carried out at 1150ºC, 1200 ºC, 1320 ºC, 1400 ºC and 1450 ºC. The Forsterite-based light insulate brick preparation experiment were carried out at 1450 ºC for 6 hours. X-ray diffraction analysis revealed that the major phase of the synthesized forsterite-based refractory was mainly forsterive along with Mg-Ferro spinal, and little of MgO(periclase). The properties of the synthesize forsterite-based refractory compared well with the value of industrial forsterite-based refractory. The result indicated an interesting potential for iron ore tailings to produce useful materials.
Keywords: Iron ore tailings, Forsterite, Light insulate refractory
Introduction
The disposal of tailings is commonly identified as the single most environmental impact of many mining operations[1]. This is not surprising when considering that the volume of tailings requiring storage can often exceed the in-situ total volume of the ore being mined and processed. Over the last century the volumes of tailings being generated has grown dramatically as the demand for minerals and metals has increased and lower and lower grades of ore are being mined. In the 1960’s 10’s of thousands of tonnes of tailings were produced each day and by 2000 this figure has increased to 100’s of thousands[2] .Forsterite refractory is a kind of high grade refractory with good creep stability and high refractoriness temperature under load, and lower heat conductivity. Its product was extensively used in torpedo cars, ladles, continuous tundish, and rotary cement kiln [3].
The aim of the present work is to investigate the possibility of using iron tailings as one of the starting raw materials to synthesize forsterite-based refractoriness. Physical and mechanical properties, such as refractoriness, strength hot and cold, creep rate and thermal shock resistance have also been examined. The mechanism of synthesis reaction is also presented.
Materials and Methods
Iron ore tailings for the present experiments were sampled from an iron ore mine in Anshan, Liaoning Province of China. Active magnesia was obtained from Haicheng of Liaoning China. The chemical composition of as-received iron tailings, magnesium ore tailings and active magnesium were shown in table 1. Mixture 1 for forsterite synthesis and mixture 2 for light insulate refractory.
Table 1. Chemical composition of raw materials (weight percentage, %)
Al2O3 CaO MgO MnO SiO2 Fe2O3 FeO Burning loss Iron tailings 0.58 0.50 1.26 0.02 84.21 11.42 1.99 Active magnesia 0.16 1.03 95.49 trace 0.48 0.62 trace 2.22 magnesium tailings
1.12 45.16 1.95 50.66
Mixture 1 0.33 0.82 57.80 0.01 33.97 4.94 0.80 1.33 Mixture 2 <0.3 1 51.3~
41.63 trace 29.16
~23.8 6 trace 30
The mixtures were ground and mixed in QM-A light globe mill for 4 h. The granularity of the mixture was around 0.2–1.0 μm. According to the thermo-positive peaks shown in DSC curves [4], the synthesis experiments for the forsterite synthesis were carried out in the high temperature electric resistance furnace at
Proceedings of the International Conference on Solid Waste 2011- Moving Towards Sustainable Resource Management,
Hong Kong SAR, P.R. China, 2 – 6 May 2011 239
1150ºC, 1200ºC, 1320ºC, 1400ºC and 1450ºC. The mineral constituent and microstructure of the samples were detected by XRD (Rigaku RINT-2500V, Japan) and SEM (JSM 6480LV, JEOL, Japan).
For the preparation of Forsterite-based light insulate brick, the raw material is the mixture of iron tailing, active magnesia powder and magnesium tailings. About 5 pensent of solid combustible were mixed into the mixture to ensure the higher porosity and lower volume concentration. A mixture of the micro silica and active magnesia was used as the bond to ensure the intensity of the wet and semi-finished adobe. The adobes were dried both in atmosphere and at 110 for 12 hours. The sinter temperature was at 1450 for 6 hours. The bulk density and porosity were measured by Archimedes method using water as a medium. The refractoriness under load was measured at a pressure of 0.02Mpa. The compressive strength and the rupture strength were measured according to China national standard method GB/T 5072—2008.
Results and Discussion
Reaction process of forsterite synthesis
The XRD curves of forsterite samples synthesized at different sintering temperature were shown in Fig 1. From that we can infer the generative process of forsterite’s formation. When the sintering temperature is lower than 1150ºC, the concentrated solution of magnesium and iron (Mg1-XFeXO) was formed, the reaction velocity was very slow. When sintering temperature reached to 1200ºC, the reaction getting aggravated, there are large amount of Mg1-XFeXO being formed, meanwhile there are magnesium ferrite formed. At a sintering temperature of 1320ºC, there are fayalites formed, and the quantity of Mg1-XFeXO getting reduced. From 1320 1400ºC, Fe2O3 disappeared, there are MgSiO3 and forsterite being formed obviously, and the quantity of fayalite getting decreased. When the sintering temperature reached to 1450ºC, there are Fe3O4 being formed, while fayalite was disappeared, Mg1-XFeXO appeared again and the quantity of forsterite getting increased. Thus the proper sintering tempreture of forsterite synthesis should be at about 1450
Figure 1. X-ray diffraction patterns of synthesized Forsterite sample at different sintering temperature (1) 1150 , (2)1200 , (3)1320 , (4)1400 and (5)1450 .●MgSiO3 ■Mg2SiO4 □Mg1-XFeXO ○SiO2
▲Si24O4 FeO Fe1.58SiO4
Properites of synthesized forsterite-based light insulate bricks
The SEM graph of the synthesized forsterite-based light insulate bricks sample was shown in Fig 2. And the element components of different points on the sample were shown in Table 2. The properties of Forsterite-based light insulate bricks are summarized in Table 2. Properties of industrial light insulate bricks are also included in Table 3 for comparison [5].
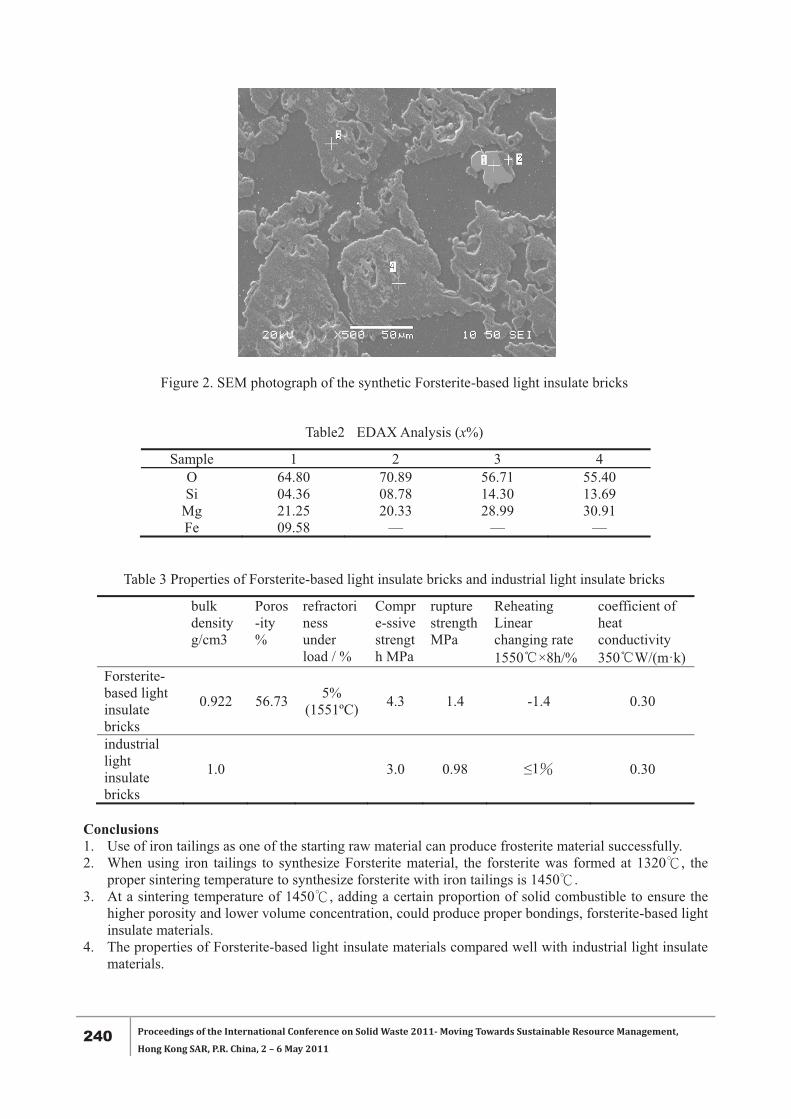
240 Proceedings of the International Conference on Solid Waste 2011- Moving Towards Sustainable Resource Management,
Hong Kong SAR, P.R. China, 2 – 6 May 2011
Figure 2. SEM photograph of the synthetic Forsterite-based light insulate bricks
Table2 EDAX Analysis (x%)
Sample 1 2 3 4 O 64.80 70.89 56.71 55.40 Si 04.36 08.78 14.30 13.69
Mg 21.25 20.33 28.99 30.91 Fe 09.58 — — —
Table 3 Properties of Forsterite-based light insulate bricks and industrial light insulate bricks
bulk density g/cm3
Poros-ity %
refractoriness under load / %
Compre-ssive strength MPa
rupture strength MPa
Reheating Linear changing rate 1550 ×8h/%
coefficient of heat conductivity 350 W/(m·k)
Forsterite- based light insulate bricks
0.922 56.73 5% (1551ºC) 4.3 1.4 -1.4 0.30
industrial light insulate bricks
1.0 3.0 0.98 ≤1 0.30
Conclusions 1. Use of iron tailings as one of the starting raw material can produce frosterite material successfully. 2. When using iron tailings to synthesize Forsterite material, the forsterite was formed at 1320 , the
proper sintering temperature to synthesize forsterite with iron tailings is 1450 . 3. At a sintering temperature of 1450 , adding a certain proportion of solid combustible to ensure the
higher porosity and lower volume concentration, could produce proper bondings, forsterite-based light insulate materials.
4. The properties of Forsterite-based light insulate materials compared well with industrial light insulate materials.
Proceedings of the International Conference on Solid Waste 2011- Moving Towards Sustainable Resource Management,
Hong Kong SAR, P.R. China, 2 – 6 May 2011 241
Acknowledgements
This work was supported by the National Natural Science Foundation of China (No. 50874061).
References [1] S.G.Vick, 1990. Interational Commission on Large Dams. In: International Symosium on Safety and
Rehabilitation of Tailings Dms, 23 May 1990, Vol.1. Sydney, p. 339. [2] A. Jakubik, G. McKenna, and A. Robertson. 2003. Stabilisation of Tailings Deosits: International
Experience. In proeedings of Mining and the nvironment III, 25-28 May, 2003. Sudbury, Ontario, Canada. p.26.
[3] Matthew B D, Mitchell, Jackson D, James P F, 1998. Preparation and characterisation of forsterite (Mg2SiO4) aerogels.Journal of Non-Crystalline Solids, (225): 125–129.
[4] LI Jing, WANG Qi. The synthesis process of forsterite refractory by iron ore tailings. 2009. Journal of Environmental Sciences. supplement. p. s92-95.
[5] Xu P K,Wei G Z, 2005. New Process Technology for Refractory. Beijing: Metallurgy Industry Press. P.46–47. (in chinese)
242 Proceedings of the International Conference on Solid Waste 2011- Moving Towards Sustainable Resource Management,
Hong Kong SAR, P.R. China, 2 – 6 May 2011
MICROSTRUCTURAL STUDY OF CULLET-CLAY BRICK FROM RECYCLE GLASS
Md.R. Sahar *, M.M. Razi, K.A. Samah, M.S. Rohani
AOMRG Lab, Physics Department, Faculty of Science, Universiti Teknologi Malaysia, 81310 Skudai, Johor, Malaysia
*Corresponding author. Tel: +60127381709, Fax: +6075566162, E-mail: [email protected]
ABSTRACT A series of ceramic based on (x) cullet-(100-x) clay has successfully been made by slip casting followed by sintering at 900°C with 40≤ x ≤80 wt%. The content of the ceramic has been measured by EDX (Energy Dispersive X-ray) analysis while the phase occurrence has been determined by XRD (X-ray Diffraction) technique. It is found that the ceramic contains largely of Si, Na and Al while the phase is dominated by the occurrence of Al2SiO5 (Kyanite) and SiO2 as a minor phase. The microstructural morphology can be described by the well distributed of kyanite agglomerate with SiO2 dispersed in the matrix. The area density of their agglomeration is very much dependence on the cullet content, where the higher the cullet, the lower the area density.
Keywords: Incinerated paper, Glass cullet, Microstructure, Physical properties
Introduction
The issues regarding to the disposal of glass waste or cullet has gained a lot of attention especially from the environmental point of view. It has been known that the use of cullet in the manufacturing process of new glass will cause less pollution effect as well as reducing the manufacturing cost of about 2.5-3.0% [1]. Besides, it can also help to reduce the release of green house gases such as CO2, SO2 and NOx to the minimal level [2]. Thus the search for new ceramics that incorporating cullet with other material seems to be unavoidable.
Red clay brick which contains large amount of iron oxides are very stiff and rigid [3]. Normally, the fabrication of this material would take the temperature up to 900-1150°C [4]. The major crystalline phases of these materials are calcite, clinichlore, muscovite and quartz [5]. These bricks exhibits good physical and mechanical properties thus are normally use for construction [6-7].
However, there is not many attempt has been reported to compose new ceramic based on the mixture of cullet and clay. In our earlier study [8-9], it has been shown that these new ceramics can be formed with higher density, higher hardness, lower drying shrinkage, less water absorption and other good physical qualities [7, 10]. It is therefore the aim of this paper to report the latest development on the cullet- clay brick from recycle glass. The study will be focused on the microstructural point of view and the result will be discussed with respect to the cullet content.
Material and Methods
Cullet is firstly crushed into small pieces before being grounded into a relatively fine powder by using ball milling for 4 hours. Cullet and clay are then each sieved at a size of 100µm. A proportional amount of cullet and clay are mixed together according to Table 1. The mixture is then undergoes the milling process for 15 minutes to ensure the homogeneity. 40 wt% of water is then added into the mixture to form slurry before being soaked for 1 day. After that the mixture is slip casted into a mould for 2 days at room temperature before being sintered at 900ºC for 1 hour where a solid and hard brick will be obtained.
Energy Dispersive of X-ray (EDX) analysis is used to determine the actual content of the ceramic while the phase occurrence and crystal phases are investigated using X-ray Diffraction (XRD) technique. The microstructural morphology of cullet-clay brick samples is obtained by observing their flat surface under Scanning Electron Microscope (SEM).
Results and Discussion
From Table 1, it can be seen that as the cullet content is increased the color of brick obtained is changing from dark brown to whitish. The changing in color of the brick might indicate that there are lots of transition elements in the mixture [9]. However, it should be noted out that the individual percentage of these elements
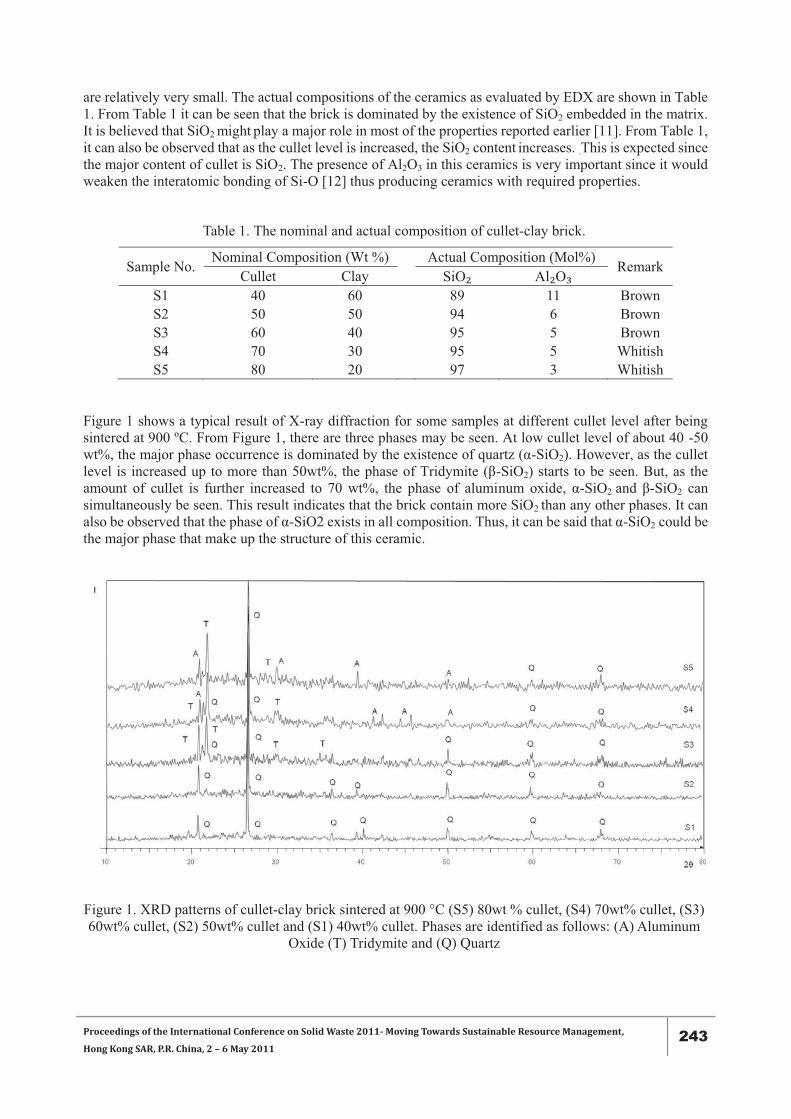
Proceedings of the International Conference on Solid Waste 2011- Moving Towards Sustainable Resource Management,
Hong Kong SAR, P.R. China, 2 – 6 May 2011 243
are relatively very small. The actual compositions of the ceramics as evaluated by EDX are shown in Table 1. From Table 1 it can be seen that the brick is dominated by the existence of SiO2 embedded in the matrix. It is believed that SiO2 might play a major role in most of the properties reported earlier [11]. From Table 1, it can also be observed that as the cullet level is increased, the SiO2 content increases. .This is expected since the major content of cullet is SiO2. The presence of Al2O3 in this ceramics is very important since it would weaken the interatomic bonding of Si-O [12] thus producing ceramics with required properties.
Table 1. The nominal and actual composition of cullet-clay brick.
Sample No. Nominal Composition (Wt %) Actual Composition (Mol%) Remark Cullet Clay SiO Al O
S1 40 60 89 11 Brown S2 50 50 94 6 Brown S3 60 40 95 5 Brown S4 70 30 95 5 Whitish S5 80 20 97 3 Whitish
Figure 1 shows a typical result of X-ray diffraction for some samples at different cullet level after being sintered at 900 ºC. From Figure 1, there are three phases may be seen. At low cullet level of about 40 -50 wt%, the major phase occurrence is dominated by the existence of quartz (α-SiO2). However, as the cullet level is increased up to more than 50wt%, the phase of Tridymite (β-SiO2) starts to be seen. But, as the amount of cullet is further increased to 70 wt%, the phase of aluminum oxide, α-SiO2 and β-SiO2 can simultaneously be seen. This result indicates that the brick contain more SiO2 than any other phases. It can also be observed that the phase of α-SiO2 exists in all composition. Thus, it can be said that α-SiO2 could be the major phase that make up the structure of this ceramic.
Figure 1. XRD patterns of cullet-clay brick sintered at 900 °C (S5) 80wt % cullet, (S4) 70wt% cullet, (S3) 60wt% cullet, (S2) 50wt% cullet and (S1) 40wt% cullet. Phases are identified as follows: (A) Aluminum
Oxide (T) Tridymite and (Q) Quartz
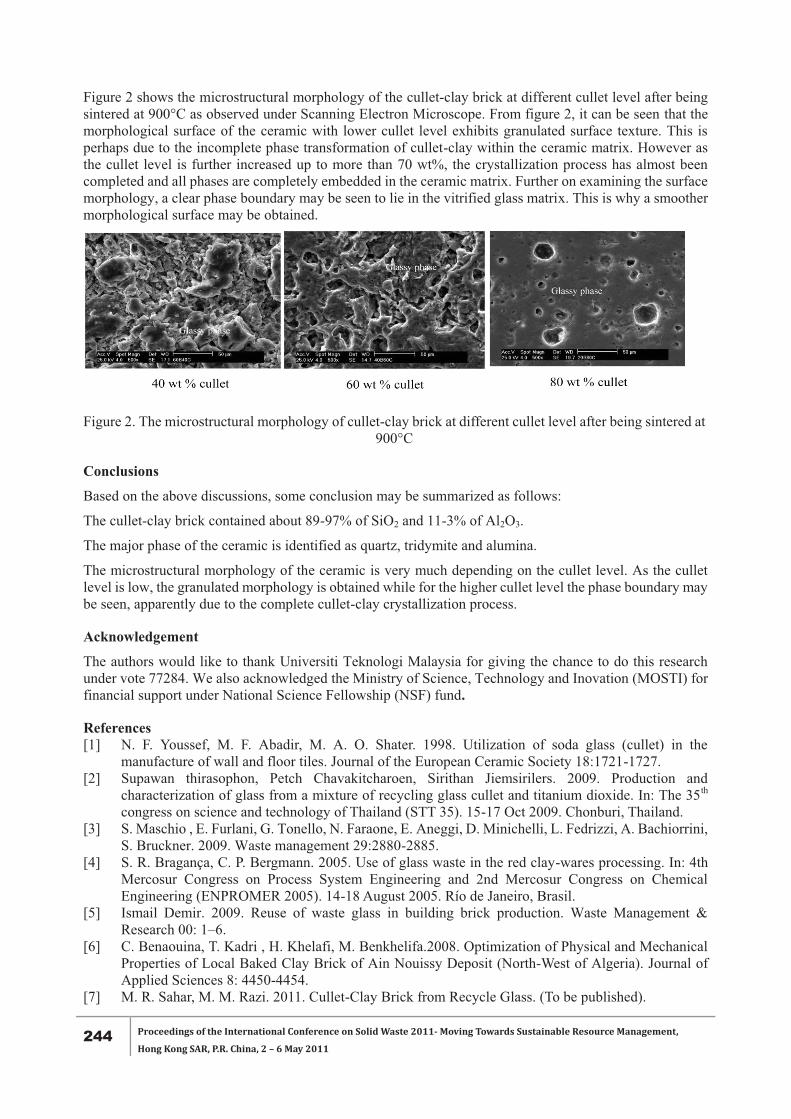
244 Proceedings of the International Conference on Solid Waste 2011- Moving Towards Sustainable Resource Management,
Hong Kong SAR, P.R. China, 2 – 6 May 2011
Figure 2 shows the microstructural morphology of the cullet-clay brick at different cullet level after being sintered at 900°C as observed under Scanning Electron Microscope. From figure 2, it can be seen that the morphological surface of the ceramic with lower cullet level exhibits granulated surface texture. This is perhaps due to the incomplete phase transformation of cullet-clay within the ceramic matrix. However as the cullet level is further increased up to more than 70 wt%, the crystallization process has almost been completed and all phases are completely embedded in the ceramic matrix. Further on examining the surface morphology, a clear phase boundary may be seen to lie in the vitrified glass matrix. This is why a smoother morphological surface may be obtained.
Figure 2. The microstructural morphology of cullet-clay brick at different cullet level after being sintered at 900°C
Conclusions
Based on the above discussions, some conclusion may be summarized as follows:
The cullet-clay brick contained about 89-97% of SiO2 and 11-3% of Al2O3.
The major phase of the ceramic is identified as quartz, tridymite and alumina.
The microstructural morphology of the ceramic is very much depending on the cullet level. As the cullet level is low, the granulated morphology is obtained while for the higher cullet level the phase boundary may be seen, apparently due to the complete cullet-clay crystallization process.
Acknowledgement
The authors would like to thank Universiti Teknologi Malaysia for giving the chance to do this research under vote 77284. We also acknowledged the Ministry of Science, Technology and Inovation (MOSTI) for financial support under National Science Fellowship (NSF) fund.
References [1] N. F. Youssef, M. F. Abadir, M. A. O. Shater. 1998. Utilization of soda glass (cullet) in the
manufacture of wall and floor tiles. Journal of the European Ceramic Society 18:1721-1727. [2] Supawan thirasophon, Petch Chavakitcharoen, Sirithan Jiemsirilers. 2009. Production and
characterization of glass from a mixture of recycling glass cullet and titanium dioxide. In: The 35th congress on science and technology of Thailand (STT 35). 15-17 Oct 2009. Chonburi, Thailand.
[3] S. Maschio , E. Furlani, G. Tonello, N. Faraone, E. Aneggi, D. Minichelli, L. Fedrizzi, A. Bachiorrini, S. Bruckner. 2009. Waste management 29:2880-2885.
[4] S. R. Bragança, C. P. Bergmann. 2005. Use of glass waste in the red clay-wares processing. In: 4th Mercosur Congress on Process System Engineering and 2nd Mercosur Congress on Chemical Engineering (ENPROMER 2005). 14-18 August 2005. Río de Janeiro, Brasil.
[5] Ismail Demir. 2009. Reuse of waste glass in building brick production. Waste Management & Research 00: 1–6.
[6] C. Benaouina, T. Kadri , H. Khelafi, M. Benkhelifa.2008. Optimization of Physical and Mechanical Properties of Local Baked Clay Brick of Ain Nouissy Deposit (North-West of Algeria). Journal of Applied Sciences 8: 4450-4454.
[7] M. R. Sahar, M. M. Razi. 2011. Cullet-Clay Brick from Recycle Glass. (To be published).
Proceedings of the International Conference on Solid Waste 2011- Moving Towards Sustainable Resource Management,
Hong Kong SAR, P.R. China, 2 – 6 May 2011 245
[8] Rambaldi, E., Carty, W. M., Tucci, A., Esposito, L. 2007. Using waste glass as a partial flux substitution and pyroplastice deformation of a porcelain stoneware tile body. Ceramics International 33: 727-733.
[9] Munirah Mohd Razi, Md. Rahim Sahar, Mohd Nor Md Yusuf. 2010. Physical Properties of New Cullet-Clay Ceramic. In 2010 National Conference on Physics. 27-30 Oct 2010, Perak, Malaysia.
[10] Vorrada Loryuenyong, Thanapan Panyachai, Kanyarat Kaewsimork, Chatnarong Siritai. 2009. Effects of recycle glass substitution on the physical and mechanical properties of the clay bricks. Waste Management 29:2717-2721.
[11] Safuan Ahmad Fauzi. 2010. A cullet-kaolin ceramic from recycle glass. Master thesis, Universiti Teknologi Malaysia, Malaysia.
[12] M. Oliveira, S. Agathopoulos, J.M.F. Ferreir. 2002. The influence of BaO additives on the reaction of Al2O3–SiO2 ceramics with molten Al and Al–Si alloys. Acta Materialia 50:1441–1451.
246 Proceedings of the International Conference on Solid Waste 2011- Moving Towards Sustainable Resource Management,
Hong Kong SAR, P.R. China, 2 – 6 May 2011
EFFECT OF PROPERTIES OF SINTERED GLASS-CERAMICS FABRICATED FROM SOLAR PANEL WASTE GLASS
K.L. Lin *, C.J. Cheng
Department of Environmental Engineering, National Ilan University, 26047, Taiwan, R.O.C. * Corresponding author. Tel: +886-3-9357400ext 749, Fax: +886-3-9364277, E-mail:[email protected].
ABSTRACT The mass of waste solar panels in Taiwan is 191,186 kg per year. The recycling of waste glass from solar panels, therefore, is an important issue. This investigation evaluated the feasibility of converting solar panel waste glass into new glass-ceramic materials, using DTA and XRD. The crystallized phases were cordierite, anorthite, parawollastonite and pyroxene. As the material was heated to 600°C and then to 850°C, the hardness and degree of crystallization of the glass-ceramic samples slowly increased. Experimental results demonstrate that the degree of crystallization of the glass-ceramic samples increased with hardness. The activation energy of crystal growth was 22.42 kJ mol -1. Density, hardness, and flexural strength were strongly correlated with each other and increased with the degree of crystallization of all sintered samples. This indicates that solar panel waste glass is indeed suitable for the glass-ceramic materials.
Keywords: Solar panel, Glass, Glass-ceramic, Crystallization, Hardness
Introduction
The solar panels that are manufactured in Taiwan represent 25% of the global output, making Taiwan the second largest producer in the world. However, large amounts of waste, such as solar panel waste glass, are produced during the manufacturing process. The improper disposal of these waste products would pollute the environment. As much as 1000 tonnes of waste solar panel glass is produced in Taiwan annually [1]. It includes waste solar panel glass from defective panels as well as residue from the manufacturing process. Although rapid industrial development and improvements in living standards have accompanied an increase in the amount of waste glass produced, little of it is reused or recycled, posing a serious threat to natural resources and the ecosystem.
The sintering process comprises thermal treatment to bind and compact particles coherently, to improve their strength and other engineering properties. Thermal heating destroys organic residue and stabilizes inorganic material and metals by incorporating oxides of the elemental constituents into a ceramic-like material [2-4]. Importantly, solar panel waste glass is a potentially valuable source of major oxides, including CaO, Na2O, Fe2O3, Al2O3, MgO and SiO2. However, an approach for recovering solar panel waste glass is still needed. Such a scheme would improve recovery and reduce environmental impact [5]. Sintering involves thermal treatment to bond particles to each other and thereby compact them, improving their strength and other engineering properties. The glass-ceramic samples then underwent a series of tests to determine their quality.
Materials and Methods
Materials
The solar panel waste glass was obtained from a solar panel manufacturing plant in central region of Taiwan.
Experimental methods
To elucidate the feasibility of reusing solar panel waste glass to produce glass-ceramic tiles. The molded specimens were oven-dried at 105°C (ASTM D 2216) for 24 h, and then heated to the desired temperature (600, 650, 700, 750, 800 and 850°C), at a rate of 5°C min-1. This temperature was maintained for 2 h to bake the samples, which were thereafter cooled to room temperature. At least three samples were tested in each experiment.
Proceedings of the International Conference on Solid Waste 2011- Moving Towards Sustainable Resource Management,
Hong Kong SAR, P.R. China, 2 – 6 May 2011 247
Analytical methods
The glass-ceramic samples underwent a series of tests, including water absorption, bulk density and hardness (China National Standard (CNS) 3299) tests, to evaluate their quality.
Table 1. Presents the chemical composition of the solar panel waste glass
Results and Discussion
Characteristics of Solar Panel Waste Glass
The pH and density of the solar panel waste glass were 10.64 and 2.4 g cm-3, respectively. Table 1 shows the XRF analysis demonstrates that the major constituents of the solar panel waste glass were SiO2 (75.9%), CaO (6.2%), Na2O(8.5%), Fe2O3 (0.3%), Al2O3 (0.1%), MgO (2.9%) and Ag (0.5%). The mineralogical composition was determined from an X-ray diffraction pattern. XRD indicated that the glass was entirely non-crystalline. The TCLP leaching concentrations of solar panel waste glass all satisfied the current regulatory thresholds that were set by the ROC EPA.
Activation Energy for Crystal Growth of Solar Panel Waste Glass
The DTA crystallization plots for solar panel waste glass that was produced at heating rates of 5, 10, 15 and 20°C min-1. The respective exothermic peak temperatures, Tp , were 430, 490, 570 and 630°C. The exothermic peak temperature, Tp, increased with heating rate. The activation energy is determined using the approach of Kissinger [15]. A linear plot of ln (φ/Tp
2)) against 1000/Tp is obtained, and the activation energy of crystal growth was 22.42 kJ mol -1.
Physical and Mechanical Properties of Glass-ceramic Samples
Table 2 shows the density, microhardness and degree of crystallization of the sintered samples. The firing temperature also influences particle density. The densities of the sintered samples were in the range 2.14–2.55 g cm-3. Analytical results reveal that increasing temperature increased the density of the glass ceramics.The Vickers hardness values of the glass-ceramic samples that were heated to 600, 650, 700, 750, 800 and 850°C (Table 2). The density and hardness of the samples that were sintered at 850°C exceeded those of the glass-ceramic samples. The hardness results demonstrate that increasing the temperature at which the solar panel waste glass was treated increased the hardness of the glass ceramics.
The analytical results reveal that the degree of crystallization of glass-ceramic samples increased with hardness. Density and hardness were strongly mutually correlated, and increased with the degree of crystallization of all sintered samples. Accordingly, the density of the sintered glass-ceramic samples increased with the amount of crystalline phase there in. The trend in micro-hardness is consistent with the expectations based on crystallization results. Furthermore, sintering at high temperatures improved the mechanical properties, by strongly densifying all of the samples.

248 Proceedings of the International Conference on Solid Waste 2011- Moving Towards Sustainable Resource Management,
Hong Kong SAR, P.R. China, 2 – 6 May 2011
Table 2. Physical and mechanical properties of glass- ceramics samples
XRD Patterns of Glass-ceramic Samples
The XRD patterns in Fig. 1 were identical to each other, revealing no significant change with sintering temperature in the range 800–850oC. No secondary phase was observed in the samples because detection of a minor phase by X-ray diffraction is extremely difficult. However, X-ray diffraction revealed that the main crystalline phase in the glass-ceramic samples that had been treated at temperatures of 800–850°C were cordierite, anorthite, parawollastonite and pyroxene.
Figure 1. XRD patterns of glass-ceramic samples
Conclusions
In this investigation, glass-ceramics are fabricated under the following operating conditions: This investigation evaluated the feasibility of converting solar panel waste glass into new glass-ceramic materials, using DTA and XRD. The crystallized phases were cordierite, anorthite, parawollastonite and pyroxene. As the heating temperature was increased to 600°C and then to 850°C, the hardness and degree of crystallization of the glass-ceramic samples increased slowly. Experimental results suggest that the degree of crystallization of the glass-ceramic samples increased with hardness. The activation energy of crystal growth was 22.42 kJ mol -1. Density, hardness, and flexural strength values were closely correlated with each other, and increased with the degree of crystallization of all sintered samples.

Proceedings of the International Conference on Solid Waste 2011- Moving Towards Sustainable Resource Management,
Hong Kong SAR, P.R. China, 2 – 6 May 2011 249
Acknowledgements
The authors would like to thank for the Department of Industrial Technology (DoIT) of the Ministry of Economic Affairs of the Republic of China, Taiwan, for financially supporting this research under Contract No. 99-EC-17-A10-S1-151.
References [1] Liao, Y. H., 2009. A study on the material flow and management of solar cell and panel in Taiwan,
Master thesis, Institute of Environmental Engineering and Management (in Chinese). [2] Yurkov, A. L., Sarkisyan, T. A., Ivanov, D. A., Bradt, R. C., 1997. Final stages of sintering of ceramic
materials: effect of residual porosity and microstructure on mechanical characteristics of surface. Ceram. Int. 23; 389-399.
[3] Marchlewski, P. A., Olszyna, A. R., Kurzydlowski, K. J., Ralph, B., 1999.Grain growth in high-purity alumina ceramics sintered from mixtures of particles of different sizes, Ceram. Int. 25; 157-163.
[4] Lin, K. L., Luo, H. L., 2009. The sintering characteristics of pavement tile blended with waste catalyst. Int. J. Pav. Res. Technol. 2; 68-74.
[5] Cheng, T. W., Chen, Y. S., 2003. On formation of CaO–Al2O3–SiO2 glass–ceramics by vitrification of incinerator fly ash. Chemosphere. 51; 817-824.
[6] Erol, M., Ku¨cu¨kbayrak, S., Ersoy-Mericboyu, A., 2009. The influence of the binder on the properties of sintered glass-ceramics produced from industrial wastes. Ceram. Int. 35; 2609–2617.
250 Proceedings of the International Conference on Solid Waste 2011- Moving Towards Sustainable Resource Management,
Hong Kong SAR, P.R. China, 2 – 6 May 2011
APPLICATION OF MODIFIED CLAY MINERAL WASTE MATERIAL FOR THE REMOVAL OF CADMIUM (II) IN WATER
Y.N. Jiang 1, Z.Q. Lin 1, H.D. Ruan 1*, S.Y. Lai 2, C.F. Yu 1, C.H. Lee 1, Z. Wu 1 1 Environmental Science Program, Division of Science and Technology, United International College,
Beijing Normal University-Hong Kong Baptist University, Zhuhai, P. R. China 2 Department of Chemistry, Hong Kong Baptist University, Kowloon Tong, Hong Kong
*Corresponding author: Tel: +86 756 3620 609, Fax: +86 756 3620 888, E-mail: [email protected]
ABSTRACT A modified clay mineral waste material (MCMWM) as an adsorbent for the removal of cadmium (II) from water was investigated in this study. The physical, chemical and mineralogical properties of MCMWM were characterized using scanning electron microscopy (SEM) coupled with energy dispersive X-ray analysis (EDX), X-ray diffraction (XRD), Fourier transform infrared spectroscopy (FTIR), nitrogen absorption BET for specific surface area (SSA) and pore size distribution (PSD); whereas the concentration of Cd (II) ions in solution was measured using inductively coupled plasma optical emission spectroscopy (ICP-OES). The results revealed that the particle size of MCMWM ranged from less than a few to tens of micrometers in diameter and the specific surface area was 5.6 m2/g. The surface was rough and had structural defects. Different types of external and internal pores including micro-, meso- and macropores were observed. The MCMWM contained mainly 2:1 clay minerals with montmorillonite, illite, feldspar, chlorite and quartz being the major minerals. Three types of feldspars, namely Na-feldspar, K-feldspar and Ca-feldspar and calcium hydroxide were found. In addition, heavy metals including arsenic, cadmium, chromium, mercury and lead were detected but their concentrations were lower than the limitation levels of the Dutch Standards for these heavy metals in soils. Cadmium (II) adsorption by MCMWM in the solid-liquid interface was efficient as more than 90% of Cd (II) ions in solution were adsorbed within half hour of mixing with MCMWM. The amount of Cd (II) ions absorbed increased but the rate of adsorption decreased with increasing concentration of Cd (II) ions in the solution. The results also indicated that the process parameters, such as pH of the solution, shaking time, and adsorbate concentration, affected the adsorption capacity of MCMWM for the removal of Cd (II) ions in water. The Cd (II) adsorption capacity was found to relate to the surface structure and chemistry of MCMWM, including SSA, PSD, surface defect, charge, ionic strength and bonding.
Keywords: Adsorption, Cadmium, Modified clay mineral waste material (MCMWM), Surface and structural defects
Proceedings of the International Conference on Solid Waste 2011- Moving Towards Sustainable Resource Management,
Hong Kong SAR, P.R. China, 2 – 6 May 2011 251
ANALYSIS OF SUBSTITUTION EFFECTS OF RECYCLING PRODUCTS FROM FOOD WASTE
H.Y. Lin *, B.Z. Huang
Department of Environmental Management, Chaoyang University of Technology, Taichung City, Taiwan * Corresponding author: E-mail: Tel: +886-4-23323000 x4513
ABSTRACT Food waste can be recycled for materials or energy, which not only eases the pollution and burden of final disposal but also mitigates the depletion of associated raw materials. It is essential for the authority to have an evaluation of treatments, both in environmental impacts and cost effectiveness, before recycling. Environmental impacts are generally analyzed by life cycle assessment software, which typically focuses on the impacts of the entire life cycle of a product/technology and thus prefers products/technologies with fewer impacts in total. This might lead to recycled products substituting raw products with high original impacts disfavored. To rectify this defect, procedures of substitution effects analysis are established in this study. Five treatments including swine feeding, dried poultry feeds, compost, anaerobic fermentation and incineration, have been evaluated by applying local data in Taiwan. The results indicated compost and swine feeding have better substitution effects than others.
Keywords: Substitution effects, Food waste, Life cycle analysis, Cost analysis
Introduction
Food waste is a primary component of municipal solid waste (MSW). Due to its composition, typically biodegradable organic matters of high moisture, neither landfilling nor incineration is an appropriate treatment. In addition, food waste may be recycled for materials or energy, which not only eases the pollution and burden of final disposal but also mitigates the depletion of associated raw materials. Common recycling or disposal treatments of food waste, including swine feeding (SF), dried poultry feeds(DPF), compost, anaerobic fermentation(AF) and incineration and landfill(IL), are analyzed in this study for their cost effectiveness and environmental impacts.
Cost effectiveness can be analyzed by the collected accounting and maintenance data of each recycling technology, while environmental impacts can be evaluated via life cycle analysis (LCA) tools. Typically, LCA tools provide impacts of specific categories or lump sum information of a product regarding its environmental impacts during the entire life cycle. For food waste recycling, detailed description of LCA can be found in former literature [1]. However, results of typical LCA sometimes prefer the recycled products to take place of regular products with low industry specific pollutions. To rectify this defect, procedures of substitution effects analysis are established in this study.
Materials and Methods
To demonstrate the developed procedures clearly, three sections, including system boundary, cost effect analysis and environmental impact evaluation are described as follows.
System Boundary
Typically, LCA is applied to determine an alternative with less environmental impacts for a production plan, e.g. using recycled or raw aluminum for producing beverage cans. In this manner, a product and its functions are determined in advance while alternatives of materials/processes to manufacture this product are flexible. However, the MSW authority usually has an opposite order to evaluate environmental impacts of MSW components to be recycled. Composition of MSW is often steady and recyclable components have various treatment ways depending on the final uses. If LCA is used to evaluate impacts of recycling products by typical system boundary, i.e. the entire life cycle of a recycling product, the results may not reflect the substitution effects of a recycling product objectively and thus recycling product applied in a low industry specific impacts are preferred. To overcome this defect, a definition including substitution effects of recycling product to the regular product is suggested in this study. Figure 1 illustrates an example of swine feeds (SF) to demonstrate the system definition of substitution effects applied in this study. Two swine feeds, regular and recycled from food waste, are evaluated by LCA respectively. The substitution effect of a recycling product is evaluated by its life cycle impacts minus the avoided impact that regular
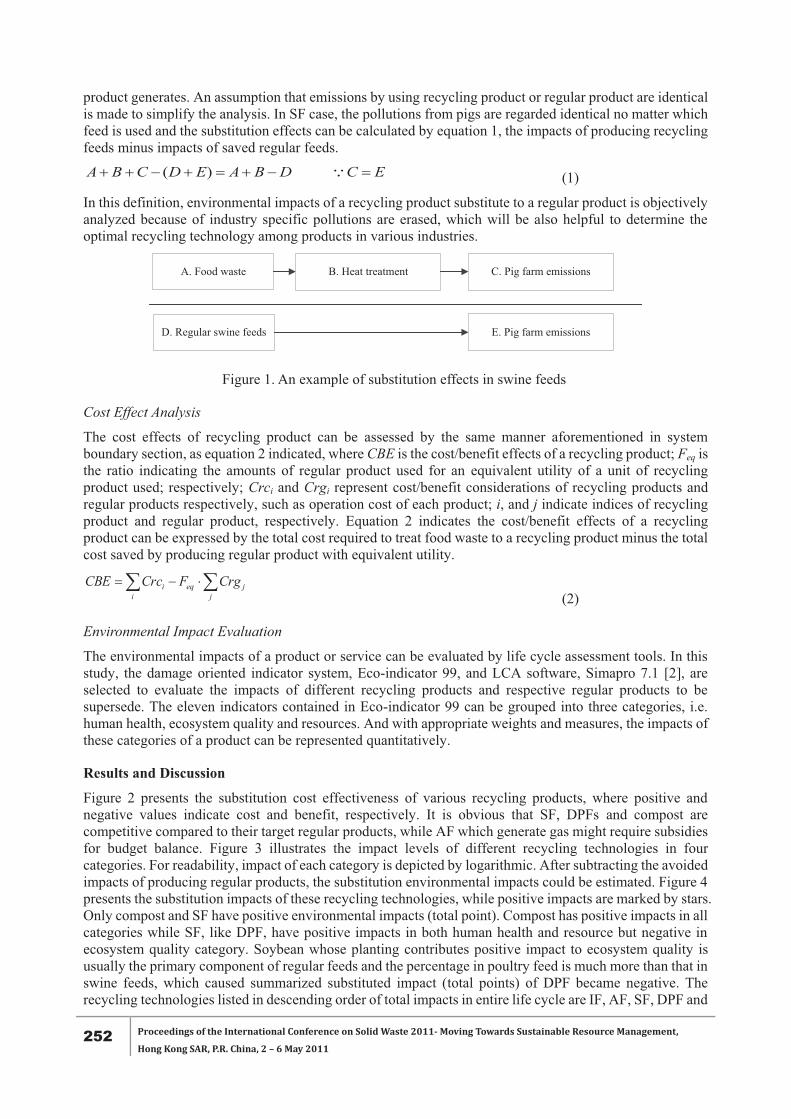
252 Proceedings of the International Conference on Solid Waste 2011- Moving Towards Sustainable Resource Management,
Hong Kong SAR, P.R. China, 2 – 6 May 2011
product generates. An assumption that emissions by using recycling product or regular product are identical is made to simplify the analysis. In SF case, the pollutions from pigs are regarded identical no matter which feed is used and the substitution effects can be calculated by equation 1, the impacts of producing recycling feeds minus impacts of saved regular feeds.
ECDBAEDCBA �������� � )( (1)
In this definition, environmental impacts of a recycling product substitute to a regular product is objectively analyzed because of industry specific pollutions are erased, which will be also helpful to determine the optimal recycling technology among products in various industries.
A. Food waste B. Heat treatment C. Pig farm emissions
D. Regular swine feeds E. Pig farm emissions
Figure 1. An example of substitution effects in swine feeds
Cost Effect Analysis
The cost effects of recycling product can be assessed by the same manner aforementioned in system boundary section, as equation 2 indicated, where CBE is the cost/benefit effects of a recycling product; Feq is the ratio indicating the amounts of regular product used for an equivalent utility of a unit of recycling product used; respectively; Crci and Crgi represent cost/benefit considerations of recycling products and regular products respectively, such as operation cost of each product; i, and j indicate indices of recycling product and regular product, respectively. Equation 2 indicates the cost/benefit effects of a recycling product can be expressed by the total cost required to treat food waste to a recycling product minus the total cost saved by producing regular product with equivalent utility.
� ���i j
jeqi CrgFCrcCBE (2)
Environmental Impact Evaluation
The environmental impacts of a product or service can be evaluated by life cycle assessment tools. In this study, the damage oriented indicator system, Eco-indicator 99, and LCA software, Simapro 7.1 [2], are selected to evaluate the impacts of different recycling products and respective regular products to be supersede. The eleven indicators contained in Eco-indicator 99 can be grouped into three categories, i.e. human health, ecosystem quality and resources. And with appropriate weights and measures, the impacts of these categories of a product can be represented quantitatively.
Results and Discussion
Figure 2 presents the substitution cost effectiveness of various recycling products, where positive and negative values indicate cost and benefit, respectively. It is obvious that SF, DPFs and compost are competitive compared to their target regular products, while AF which generate gas might require subsidies for budget balance. Figure 3 illustrates the impact levels of different recycling technologies in four categories. For readability, impact of each category is depicted by logarithmic. After subtracting the avoided impacts of producing regular products, the substitution environmental impacts could be estimated. Figure 4 presents the substitution impacts of these recycling technologies, while positive impacts are marked by stars. Only compost and SF have positive environmental impacts (total point). Compost has positive impacts in all categories while SF, like DPF, have positive impacts in both human health and resource but negative in ecosystem quality category. Soybean whose planting contributes positive impact to ecosystem quality is usually the primary component of regular feeds and the percentage in poultry feed is much more than that in swine feeds, which caused summarized substituted impact (total points) of DPF became negative. The recycling technologies listed in descending order of total impacts in entire life cycle are IF, AF, SF, DPF and
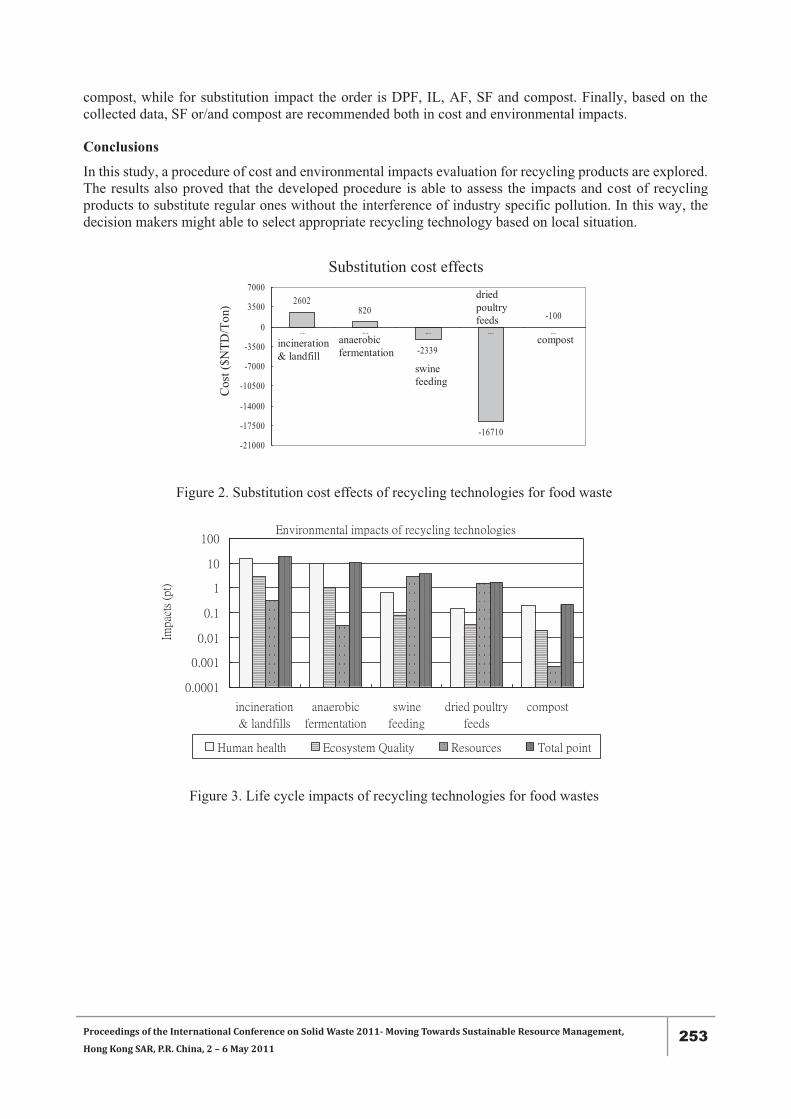
Proceedings of the International Conference on Solid Waste 2011- Moving Towards Sustainable Resource Management,
Hong Kong SAR, P.R. China, 2 – 6 May 2011 253
compost, while for substitution impact the order is DPF, IL, AF, SF and compost. Finally, based on the collected data, SF or/and compost are recommended both in cost and environmental impacts.
Conclusions
In this study, a procedure of cost and environmental impacts evaluation for recycling products are explored. The results also proved that the developed procedure is able to assess the impacts and cost of recycling products to substitute regular ones without the interference of industry specific pollution. In this way, the decision makers might able to select appropriate recycling technology based on local situation.
2602820
-2339
-16710
-100
-21000
-17500
-14000
-10500
-7000
-3500
0
3500
7000
Substitution cost effects
incineration & landfill
anaerobic fermentation
swine feeding
dried poultry feeds
compost
Cos
t ($N
TD/T
on)
Figure 2. Substitution cost effects of recycling technologies for food waste
Figure 3. Life cycle impacts of recycling technologies for food wastes
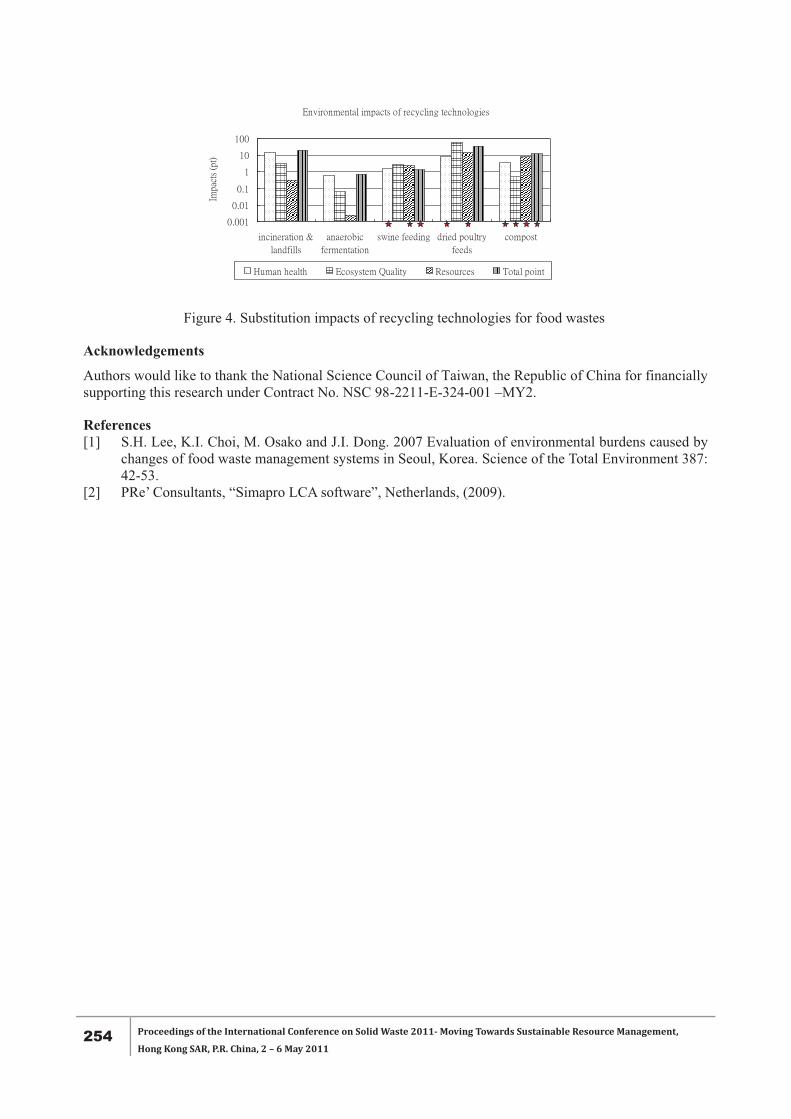
254 Proceedings of the International Conference on Solid Waste 2011- Moving Towards Sustainable Resource Management,
Hong Kong SAR, P.R. China, 2 – 6 May 2011
Figure 4. Substitution impacts of recycling technologies for food wastes
Acknowledgements
Authors would like to thank the National Science Council of Taiwan, the Republic of China for financially supporting this research under Contract No. NSC 98-2211-E-324-001 –MY2.
References [1] S.H. Lee, K.I. Choi, M. Osako and J.I. Dong. 2007 Evaluation of environmental burdens caused by
changes of food waste management systems in Seoul, Korea. Science of the Total Environment 387: 42-53.
[2] PRe’ Consultants, “Simapro LCA software”, Netherlands, (2009).
Proceedings of the International Conference on Solid Waste 2011- Moving Towards Sustainable Resource Management,
Hong Kong SAR, P.R. China, 2 – 6 May 2011 255
WASTE SEPARATION AND RECYCLING IN CHINA C. Deng 1, L. Jiang 2, R. Chen 1, J. Ding 1
1 China Urban Construction Design & Research Institute, Beijing, China 2 Environmental protection bureau, Hezhou, Guangxi province, China
* Corresponding author. Tel: +86 01064815820, Fax: +86 01064812751, E-mail: [email protected]
ABSTRACT This paper summarizes waste separation practices of several developed countries. introduces and analyzes waste separation experiments carried out in Beijing, Shanghai and Guangzhou, and propose a three-level waste separation plan: 1) separate waste from different districts of a city; 2) separate waste bins in the street; 3) separate waste bags at home based on the characteristics of China’s waste and its collection system, as well as on the distribution and treatment patterns.
Key words: Municipal solid waste, Waste separate, Recycling of resources, Separate bag collection
Introduction
China has been trying to separately collect waste for about 20 years. The city of Shanghai started to collect waste using separate bags in the middle 1980s, which marked the first attempt of separate collection in China. In 1992, the State Council of China issued the Management Ordinance for City Landscape and Environment Sanitation, which requires that “Municipal Solid Waste(MSW) should be separately collected, transported and treated”. In April, 2000, China’s Ministry of Construction (MOC) identified 8 cities including Beijing and Shanghai as pilot cities for the waste separation experiment. The program divided domestic waste into 3 categories and separately collected them: the organic, the recyclable and the hazardous waste. In 2004, MOC issued another standard called the Classification and Evaluation Standard for Municipal Solid Waste CJJ/T 102 2004 , which divided MSW into 6 categories: 1) the recyclable; 2) large items; 3) compost waste; 4) combustible waste; 5) hazardous waste and 6) other waste. Today, most cities in China adopt a simpler classification system based on the MOC standard, which separate waste into 3 categories: the recyclable, the unrecyclable and the hazardous waste. Still, a few cities in northern China adopt another system that separates waste into 2 kinds: the dry waste and the wet waste.
Though we have been testing separate collection of municipal solid waste for a long time, the result is not satisfying. In most cities of China, the separate waste collecting bins in the streets don’t really serve for the purposes they were designed for. The slogan of “separate collection” has lost its appeal. Some people even argue about whether waste separation is necessary or not in China.
There are many reasons for such challenges, the main one being that the waste separation system we currently use is not practicable or effective enough. In order to establish an effective separation system, we need to learn from the successful experience of those who did well in this field. On the other hand, we need to analyze the characteristics of municipal solid waste in China, the source distribution pattern and the end treatment methods.
Waste separation in Germany, Japan & Taiwan
The “Three Color Waste Bins” System in Germany
Germany adopts a “three color waste bins” system to separately collect waste. There are 3 colors of waste bins: the gray bin, the yellow bin and the brown bin.
The gray waste bins are for unrecyclable waste such as coal cinder, light bulbs, rubber, road cleaning waste and plastic buckets without the blue-point mark.
The yellow waste bins are for recyclable wrappings with the blue-point mark, such as aluminum wrappings, plastic wrappings, metal containers and other compound wrapping materials.
The brown waste bins are for organic waste that can be composted.
In addition to these waste bins, there are other containers used to store waste that can be directly recycled, like glass, paper, clothes and shoes, etc. These containers are further divided to store different kinds of
256 Proceedings of the International Conference on Solid Waste 2011- Moving Towards Sustainable Resource Management,
Hong Kong SAR, P.R. China, 2 – 6 May 2011
waste when needed.
Waste Separation System in Japan
In most parts of Japan, waste is separated into 4 categories: regular waste, combustible waste, incombustible waste and large it mems.
Regular waste refers to kitchen waste, waste paper, grasses and woods, wrappings, leather products, containers, glass, tableware, bottles that can’t be recycled or reused, rubber products, plastics and clothes except the white cotton shirts.
Combustible waste refers to newspapers, flyers, advertisement sheets, paper boxes, magazines, books and brochures, and fabrics such as blankets, cotton shirts or cotton bed sheets.
Incombustible but recyclable waste refers to bottles made of iron or aluminum, brown or transparent bottles and other bottles that can be directly reused.
Large items (usually with a length > 0.5m) that can be crushed, including small electric appliances, furniture, bicycles, ceramics and other bulk items.
The Mandatory Waste Separation Program in Taiwan
A mandatory waste separation plan has been put into practice in Taiwan since 1994 by the Environmental Protection Agency of Taiwan. This program separates municipal solid waste in 3 categories: 1) waste that can be reused as resources, mainly refers to the recyclable waste; 2) kitchen waste, i.e. organic waste from the kitchen; 3) ordinary waste such as wrappings, old clothes, waste paper, etc.
Statistics show that in 1995, one year after the plan’s implementation, on average Taiwan’s monthly waste has reduced by 14.15% in quantity compared to that of 1993, the recycled waste has increased by 51.36%, and the recycled kitchen waste has increased by 90.35%. Due to the mandatory waste separation plan, the quantity of recycled resources and recycled kitchen waste has witnessed large increases.
What Can We Learn
The waste separation systems mentioned above have been put into practice for many years, and have achieved success to a certain degree. We look into these systems and find some common features that they share:
They all have simple and easy-to-use separation methods. The above systems divide municipal solid waste into 3 or 4 categories, and it’s easy to tell the differences among different categories. For example, one simple rule Japan uses in waste separation is that whether the waste can be burned or not. And in Taiwan, kitchen waste is separated as a single category. In Germany, you can separate wrappings and throw them into different bins only by checking whether there are blue-point marks on them.
The separation system is closely connected with the end treatment technologies. In Japan, municipal solid waste is mainly treated by incineration plants, as a result it divides waste into the combustible, the incombustible and 2 other categories. In Germany, bio-treatment takes a large proportion in waste treatment besides incineration, so their separation system meets the needs of those bio-treatment plants to provide organic waste for composting. In Taiwan, municipal solid waste is also mainly treated by incineration plants. Their system separates kitchen waste as a single category, which makes it convenient for the incineration process because kitchen waste contains large quantity of water.
It is noticeable that in the afore-mentioned systems, separate collection are mostly carried out mainly in urban residential blocks.rather than in streets or other locations, because the quantity of waste produced in the former is much larger than that in the latter.
It is important to separately collect recyclable or reusable waste. Germany, Japan and Taiwan all emphasize the importance of recycling. In Germany, the blue-point mark is used to indicate recyclable wrappings. Japan and Taiwan also requires recyclable waste to be separately collected and recycled.

Proceedings of the International Conference on Solid Waste 2011- Moving Towards Sustainable Resource Management,
Hong Kong SAR, P.R. China, 2 – 6 May 2011 257
Factors for Consideration in China’s Waste Separation
Characteristics of Municipal Solid Waste in China
The design of waste separation systems must be based on the characteristics of the waste. Due to a unique waste collection system in China, the characteristics of domestic waste are different from that of European countries or of other Asian countries.
The definition of “waste” is slightly different in China, where “waste” usually refers to the substance remained after a distributed for-profit recycling system which has recycled waste of economic value, such as paper and bottles, and such remaining substance contains mostly un-recyclable, useless things of low economic value. While in western countries, “waste” usually refers to the waste before such distributed for-profit recycling system separates the economically valuable recyclables.
China’s waste has relatively high water and organic content. Kitchen waste (leftover food, vegetable leaves, etc) accounts for a large proportion in municipal solid waste, thus the water content is high. In developed countries, there is usually a specific way to treat kitchen waste. For example, in America, kitchen waste is crushed directly in the kitchen and then flushed down the disposal into municipal sewage pipe. When kitchen waste is mixed with other solid waste, it’ll get stale quickly, which makes waste separation, transportation and treatment more difficult.
High ash content. In most cities in northern China coal is the primary fuel for heating in the winter. In many under-developed areas, people also use coal for cooking. Moreover, China is now experiencing a rapid construction period, when lots of construction waste and home decoration waste are mixed with the municipal solid waste. All these factors contribute to a high ash content in the waste.
The Waste Source Distribution Pattern
In China’s cities, most of the municipal solid waste is from residential areas. Companies and institutions produce relatively less waste. According to surveys in Shanghai and Nanchang, waste from residential areas accounts for 77% and 67% of the total quantity in the two cities respectively.
Table 1. Waste sources in Pudong district, Shanghai 2007
combustible residue restaurant street institution residence Total
Quantity t/d 100 315 48 182 223 2918 3786
Percentage % 2.64 8.32 1.26 4.81 5.90 77.07 100
Note: Residue refers to substance from incineration plants and bio-treatment plants which need to be landfilled eventually.
Table 2 Waste sources in Nanchang, Jiangxi province 2004
residence institution restaurant mobile population market stree
t Total
Quantity t/d 1177 346 51 75 86 20 1755 Percentage
% 67.07 19.71 2.91 4.27 4.90 1.14 100
Waste should be separated at their source. Considering the source distribution pattern mentioned above, we should prioritize waste separation in residential areas, while not overlooking offices, markets and restaurants.

258 Proceedings of the International Conference on Solid Waste 2011- Moving Towards Sustainable Resource Management,
Hong Kong SAR, P.R. China, 2 – 6 May 2011
The Connection Between Waste Characteristics and end Treatment Technology
The characteristics of waste determine what kind of technology we should use to treat the waste. Proper match between waste and treatment technology can improve the efficiency and lower the cost. Table 3 lists three major treatment technologies and their application guides.
Table 3. Major treatment technologies and their application guides
Incineration Bio-treatment Landfill
Technical principle
� Burn and decompose in high temperature
� Heat utilization (power generation
� Biodegraded by microbes
� Products used in agriculture
� water-proof and air-tight engineering
� Leachate and landfill gas treatment
Requirement of waste
Low-heat-value 4200kJ/kg
Biodegradable organic content 40% Low water content
Suitable waste
High heat-value waste such as paper and plastics
Organic waste such as kitchen waste and garden waste
Inorganic waste with low water content and low heat-value
Through comparison of these major treatment technologies we can find out that: A) Incineration technology is good for waste with lots of high heat-value materials such as paper and
plastics; B) Bio-treatment technology is good for waste with high organic content; C) Landfill technology is good for waste with less plastics and organic matters.
China's Current Recycling System
The major reason why the "recyclable" and "non-recyclable" classification systems that widely used in most cities failed is that China already has a unique and mature recycling system, in which, homeless people, scavengers and professional recyclers extracts most of the recyclable materials (mainly for plastics and paper) at households, street waste bins, transfer station and even landfill sites, and sell them to professional recycling station for money. This has long become a labor-intensive industry. With this system, waste recycling is done at a bottom-up way without any of the government intervention.
Judging from China’s actualities, such waste recycling system will remain strong in a very long time to come, therefore, it would be a waste of resources to try to set up collection bins specifically for recyclables.
Separation System Based on Sources and End Treatment Technologies
The Principle for Waste Separation
Based on the analysis above, we propose the following principles that help identify and design waste separation:
(1) To ensure the separation is simple and easy and the categories are easy to apply;
(2) Separation from the source, with priority at residential areas;
(3) To make it clear that the purpose of waste separation is to facilitate the treatment of solid waste.
The System of “Separate Waste Streams in the Region, Separate Waste Bags at Households, Separate Waste Bins at Streets”
(1) Separate streams in the region: solid waste from different regions should be collected and transported
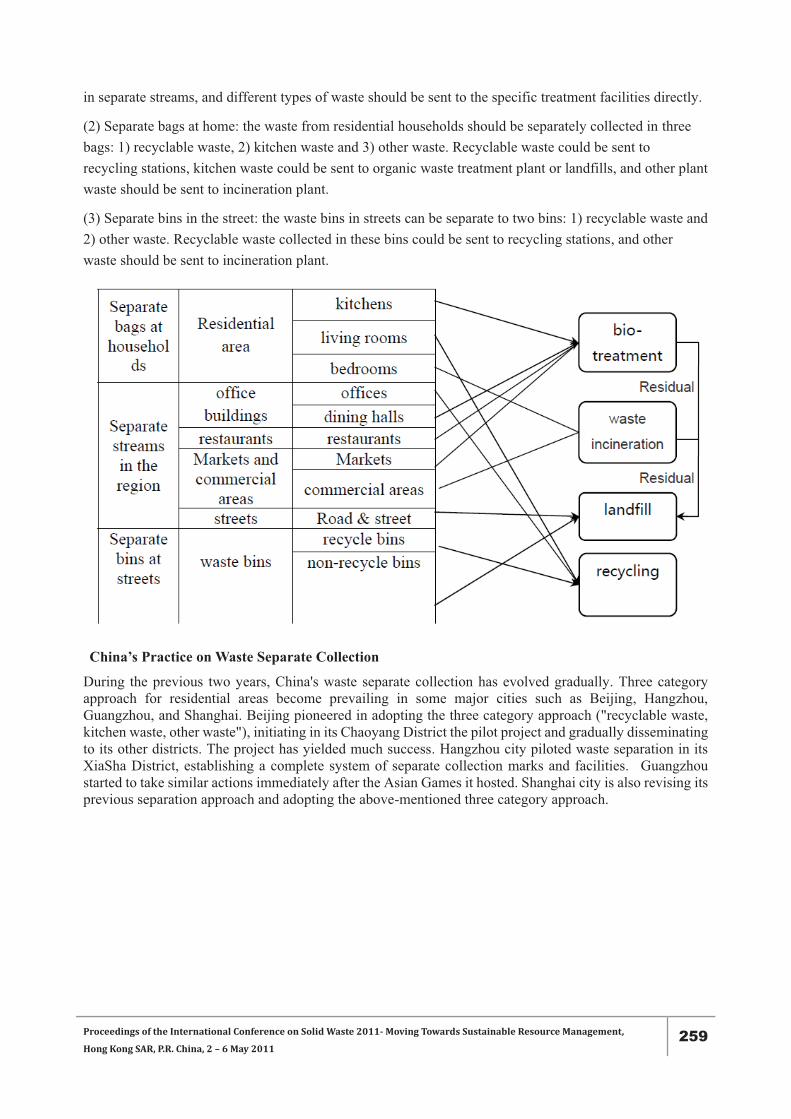
Proceedings of the International Conference on Solid Waste 2011- Moving Towards Sustainable Resource Management,
Hong Kong SAR, P.R. China, 2 – 6 May 2011 259
in separate streams, and different types of waste should be sent to the specific treatment facilities directly.
(2) Separate bags at home: the waste from residential households should be separately collected in three bags: 1) recyclable waste, 2) kitchen waste and 3) other waste. Recyclable waste could be sent to recycling stations, kitchen waste could be sent to organic waste treatment plant or landfills, and other plant waste should be sent to incineration plant.
(3) Separate bins in the street: the waste bins in streets can be separate to two bins: 1) recyclable waste and 2) other waste. Recyclable waste collected in these bins could be sent to recycling stations, and other waste should be sent to incineration plant.
China’s Practice on Waste Separate Collection
During the previous two years, China's waste separate collection has evolved gradually. Three category approach for residential areas become prevailing in some major cities such as Beijing, Hangzhou, Guangzhou, and Shanghai. Beijing pioneered in adopting the three category approach ("recyclable waste, kitchen waste, other waste"), initiating in its Chaoyang District the pilot project and gradually disseminating to its other districts. The project has yielded much success. Hangzhou city piloted waste separation in its XiaSha District, establishing a complete system of separate collection marks and facilities. Guangzhou started to take similar actions immediately after the Asian Games it hosted. Shanghai city is also revising its previous separation approach and adopting the above-mentioned three category approach.
260 Proceedings of the International Conference on Solid Waste 2011- Moving Towards Sustainable Resource Management,
Hong Kong SAR, P.R. China, 2 – 6 May 2011
OPTIMIZING THE PRODUCTION OF POZZOLANA USING HIGH CALORIFIC WASTES
M.Y. Mensah
Department of Chemical Engineering, Kwame Nkrumah University of Science and Technology (KNUST) Kumasi, Ghana
Tel: +233 208537903, E-mail: [email protected]
ABSTRACT Pozzolanic materials including specific types of clay, rice husks and bamboo ash are widespread in many localities of Ghana. Against the background of relative expensive nature of ordinary Portland cement (OPC), which is the dominant type of cement used in developing countries like Ghana, coupled with the perennial shortages in its supply, pozzolana offers a potentially cheaper, locally available supplement. The local production of pozzolana has been limited in terms of the technology as well as available alternative fuels, which in Ghana has been largely from palm kernel shells.
The use of high calorific solid recovered fuels (SRF) in the cement industry has been on the ascendancy as an alternative fuel material to conventional fuels. Its usage has the ability to reduce increasing high calorific wastes generated at the household levels and the total greenhouse gases worldwide. The use of the RDF´s can also serve the emerging conventional cement industry as an alternative fuel.
This study focuses on further development and use of waste plastics, in this case, polyethylene, as the alternative fuel embedded in the local clay for the production of pozzolana. For the process optimization, variables including nodule shape, residence time of nodules, material type and mixing ratios as well as process temperature control are to be considered for the pozzolana production.
Keywords: Pozzolana, Clay, Refuse derived fuels, Process optimization

Proceedings of the International Conference on Solid Waste 2011- Moving Towards Sustainable Resource Management,
Hong Kong SAR, P.R. China, 2 – 6 May 2011 261
EFFECT OF CONSTRUCTION WASTE CHARGING SCHEME ON WORK PRACTICES AT CONSTRUCTION SITES IN HONG KONG
C.S. Poon 1*, A.T.W. Yu 2, A. Wong, R. Yip 1, L. Jaillon 1 1 Department of Civil and Structural Engineering, The Hong Kong Polytechnic University, Hung Hom,
Kowloon, Hong Kong SAR, China 2 Department of Building and Real Estate, The Hong Kong Polytechnic University,
Hung Hom, Kowloon, Hong Kong SAR, China * Corresponding author. Tel: +852 27666024, E-mail: [email protected]
ABSTRACT Waste management in the building industry in Hong Kong has become an important environmental issue as Hong Kong is running out of space for managing the increasing amount of construction and demolition (C&D) wastes. In December 2005, the Hong Kong Government implemented the Construction Waste Disposal Charging Scheme (CWDCS) to encourage reduction of C&D waste requiring disposal. To assess the impact of the CWDCS on the construction industry and the trade practices of construction workers, a study was conducted after 3-years implementation of the CWDCS via a questionnaire survey in the building industry. This paper reports the study results and shows the changes of work practices that were observed in building construction projects since the implementation of the CEDCS. The study results reveal the effectiveness of the CWDCS on imposing changes on site practices was limited. Improvement in waste reduction and management was seen in some but negligible in the others. These points to the need to have other measures, such as inclusion of waste reduction requirements in contractual clauses and government regulations, to bring to effect the waste reduction objectives.
Keywords: Construction and demolition waste, Polluter-pays-principle, Waste disposal charging scheme, Hong Kong
Introduction
For the past two decades, the Hong Kong Government has implemented various measures to enhance the management of construction waste in Hong Kong [1-2]. The construction waste disposal charging scheme (CWDCS) introduced in December 2005 is regarded as one of the most important policies aiming to reduce wastes going to Hong Kong’s landfills [3]. The CWDCS also aims to encourage contractors to consider recycling and reusing C&D waste. According to the Scheme, disposal of construction waste is subject to a charge of HK$125/tonne of waste sent to landfills, HK$100/tonne sent to sorting facilities and HK$27/tonne sent to public fill reception facilities. It was expected that the implementation of the CWDCS will stimulate changes among the participants of the construction industry. Construction works are separated into various work trades handled by different workforces on construction sites. This paper reports the results of study on assessing the influence of the CWDCS on the work practices of the major construction work trades.
Methodology
The research was carried out by means of a questionnaire survey. The design of the questionnaire addressed mainly the change of practices among building professionals of various work trades to respond to the implementation of the CWDCS since 2005. The questionnaire targeted to capture the views and behaviour of the respondents pertaining to the following issues: Percentage reduction of C&D waste of the specified work trades; Percentage of change in the level of reuse/recycling of C&D waste generated by the specified work
trades.
The survey was administered by distributing the questionnaire to 319 target professionals who were working in the areas of construction project management, construction operation and project finance. The respondents could be broadly classified into the following disciplines: Project manager (representing project management stream); Engineer (site agent is included in this group, representing site operation stream); and Quantity surveyor (representing project finance stream).
The survey was conducted in 2009 and 109 completed questionnaires were received. The response rate was 34%. Out of the total 109 returned questionnaires 89 were valid responses. Forty-seven percent of the

262 Proceedings of the International Conference on Solid Waste 2011- Moving Towards Sustainable Resource Management,
Hong Kong SAR, P.R. China, 2 – 6 May 2011
respondents identified themselves as project/construction managers, 25% were quantity surveyors, 20% were engineers and 11% were under other categories involved with building projects.
Results and Analysis
Construction Waste Generation
The questionnaire survey aimed to reveal the perception of the respondents regarding the change of construction waste generation in all major work trades after the implementation of the CWDCS. Figure 1 shows that most of the respondents had the impression that “no change” had taken place in relation to the generation of construction waste in the process of major subcontract works. It was a clear message that the respondents had the overwhelming view that the methods of construction in major subcontract work trades have not been changed due to the implementation of the CWDCS.
The results show little change was observed in the steel and metal work trade and the earthwork trade. The perception on percentages of waste generation increase and decrease is almost balanced in work trades like Wet-finishes (16.8% - 16.8% = 0), and Dry-finishes (16.7% - 12.0% = 4.7% decrease). The wet-finishing and dry-finishing trades are generally regarded as the major contributors of construction waste. The findings of this survey concur with such perception. The results disappointedly revealed that very little improvement in net waste reduction was found in these two major work trades after 3 years of implementation of the CWDCS.
The “Preliminary” related work trades include site cleaning, removal of package materials and the left-over materials for protection works, and they had been directly affected by the implementation of the CWDCS. But the results of the survey show only an unexpectedly small waste reduction of 5.4% (30.5% - 25.1%), which is an indication that frontline workers involved in the preliminary work trades showed only marginal changes, or facilities provided for sorting works were not sufficient. Comparably, larger waste reductions were found in Formwork Installation/stripping and Concrete Work trades with values of 16.5 (36.1% - 19.4%) and 13.6% (32.5% - 18.9%) respectively. Many researchers have proven that construction waste generated from formwork installation/stripping and in-situ concreting can be significantly reduced by the use of precast concrete elements. The findings concur with those of the previous studies [4-5].
Figure 1. Percentage of change in waste generation in major work trades after implementation of CWCDS
Level of Reuse and Recycling
In Hong Kong, most of the inert construction wastes generated from excavation works that have been sorted on site are re-used as backfilling materials. The surplus is removed to other construction projects as filling materials or dumped in public fills as filling materials for reclamation works. Demolished concrete and excavated rock are collected and crushed for use as recycled aggregates. Most of the non-inert waste from building sites, such as vegetation, timber and packaging are disposed of in landfills.
The survey results in Figure 2 reveal that after the implementation of the CWDCS, there were 29%, 30% and 16% of construction waste generated from excavation, concrete work and wet-finishing work trades
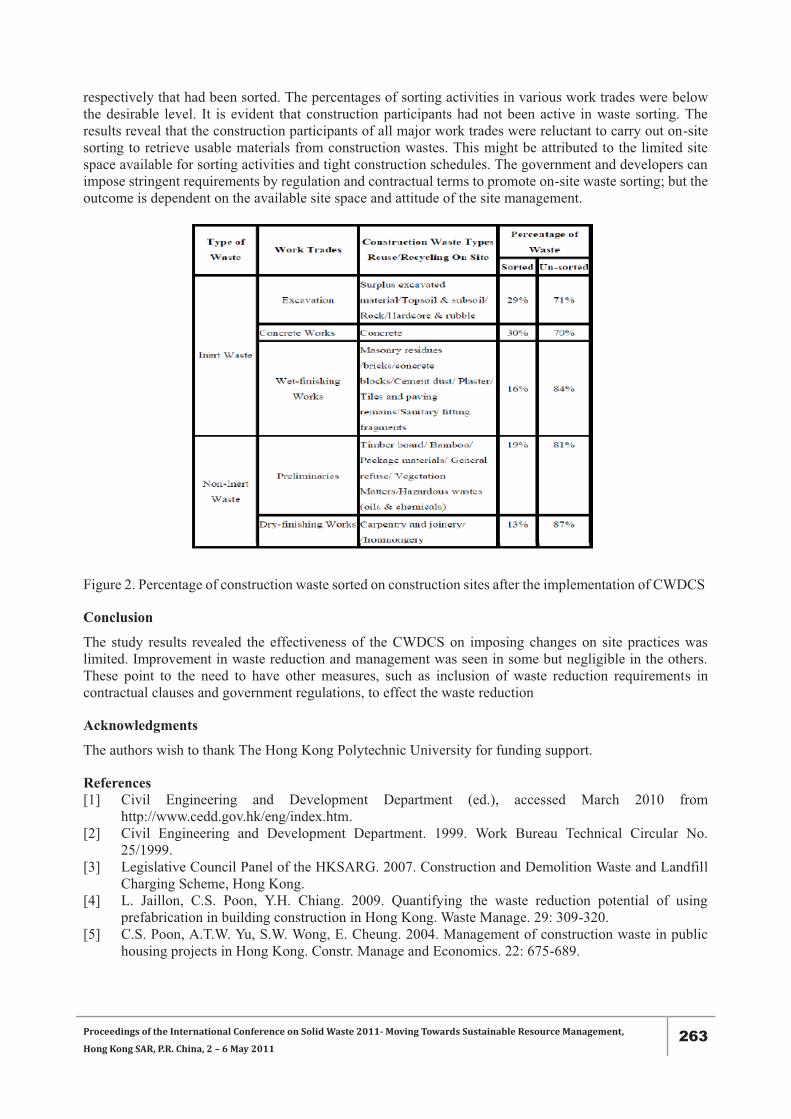
Proceedings of the International Conference on Solid Waste 2011- Moving Towards Sustainable Resource Management,
Hong Kong SAR, P.R. China, 2 – 6 May 2011 263
respectively that had been sorted. The percentages of sorting activities in various work trades were below the desirable level. It is evident that construction participants had not been active in waste sorting. The results reveal that the construction participants of all major work trades were reluctant to carry out on-site sorting to retrieve usable materials from construction wastes. This might be attributed to the limited site space available for sorting activities and tight construction schedules. The government and developers can impose stringent requirements by regulation and contractual terms to promote on-site waste sorting; but the outcome is dependent on the available site space and attitude of the site management.
Figure 2. Percentage of construction waste sorted on construction sites after the implementation of CWDCS
Conclusion
The study results revealed the effectiveness of the CWDCS on imposing changes on site practices was limited. Improvement in waste reduction and management was seen in some but negligible in the others. These point to the need to have other measures, such as inclusion of waste reduction requirements in contractual clauses and government regulations, to effect the waste reduction
Acknowledgments
The authors wish to thank The Hong Kong Polytechnic University for funding support.
References [1] Civil Engineering and Development Department (ed.), accessed March 2010 from
http://www.cedd.gov.hk/eng/index.htm. [2] Civil Engineering and Development Department. 1999. Work Bureau Technical Circular No.
25/1999. [3] Legislative Council Panel of the HKSARG. 2007. Construction and Demolition Waste and Landfill
Charging Scheme, Hong Kong. [4] L. Jaillon, C.S. Poon, Y.H. Chiang. 2009. Quantifying the waste reduction potential of using
prefabrication in building construction in Hong Kong. Waste Manage. 29: 309-320. [5] C.S. Poon, A.T.W. Yu, S.W. Wong, E. Cheung. 2004. Management of construction waste in public
housing projects in Hong Kong. Constr. Manage and Economics. 22: 675-689.

264 Proceedings of the International Conference on Solid Waste 2011- Moving Towards Sustainable Resource Management,
Hong Kong SAR, P.R. China, 2 – 6 May 2011
RECYCLING OF GLASS DERIVED FROM CATHODE RAY TUBES AS FINE AGGREGATES IN CEMENT MORTAR
T.C. Ling, C.S. Poon *
The Hong Kong Polytechnic University, Hong Kong
* Corresponding author. Tel: +852 27666024, E-mail: [email protected]
ABSTRACT The management and disposal of waste cathode ray tubes (CRT) derived from computer monitors and old television (TV) sets is an increasingly important environmental problem facing many advanced municipalities. In Hong Kong, about 6 million sets of computers are currently being used and about 20% of the stocks are replaced annually. Some of them are discarded even before the end of their useful life. It is known that when CRT glass is disposed of in landfills, lead could be leached from the crushed glass and contaminates ground water. Therefore, finding better solutions to manage and recycle CRT glass are crucial in order to reduce the environmental threats. This paper presents the results of an experimental study to investigate the potential use of crushed CRT glass as a substitute of fine aggregates in cement mortar. The CRT glass used was an acid treated funnel glass obtained from dismantled CRT derived from discarded computer monitors and old TV sets. The results demonstrate that it is feasible to utilize up to 100% CRT glass as fine aggregates to substitute sand in the production of cement mortar. The cement mortar prepared with 100% CRT glass achieved an average compressive strength of 49 MPa at 90 days, and showed innocuous behaviour in the alkali-silica reaction test. The alkaline medium in the cement mortar was able to immobilise and prevent the leaching of lead. CRT glass in mortar was found to be an effective material used to protect against radiation.
Keywords: Cathode ray tubes, Recycled glass, Lead, Cement mortar, Recycling
Introduction
The management of discarded cathode ray tubes (CRT) which are key components in computer monitors and televisions (TV) has become a major environmental problem worldwide. The glass derived from the rear part (funnel) of a CRT is classified as hazardous waste due to its high-lead content [1]. If the funnel CRT glass waste is not properly handled or simply disposed of in landfills, the hazardous materials (lead) from the broken funnel glass will lead to serious pollution of the environment and may pose a risk to public health.
In Hong Kong, there are about 6 million computers currently being used and about 20% of these are replaced annually. It is estimated that more than 490,000 old TV sets and CRT monitors are discarded from households every year due the widespread use of flat screen LCD and LED replacements. Since 2003, a pilot CRT recovery programme has been launched by the Environmental Protection Department (EPD) to reduce the quantity of these hazardous wastes to be discarded at landfills. Nearly 150,000 waste computers and computer accessories have been recovered at the collection services. Some of these computers were repaired and donated to the needy. However, the supply of the discarded CRT monitors and TV sets exceeds the demand of the second-hand market; hence the majority of these harmful wastes still need to be disposed of at landfills [2].
This study investigates the potential use of acid-treated CRT funnel glass as a substitute for natural aggregates in cement mortar. The fresh and hardened properties of the mortar mixes containing 0%, 25%, 50%, 75% and up to 100% crushed CRT glass are investigated. The potential expansion due to alkali-silica reaction, shielding properties and leachability of lead from the mortar are also evaluated.
Materials and Methods
ASTM Type I ordinary Portland cement and fly ash complying with ASTM class F ash were used as the cementitious materials in this study. Natural river sand having a particle size of less than 5 mm and a fineness modulus of 2.09 was used as the natural fine aggregate. The cathode ray tube (CRT) glass used in this study was crushed funnel glass sourced from a CRT Recycling Centre located locally. The CRT glass used was obtained by a process of crushing, acid washing and water rinsing. Before the crushed glass was
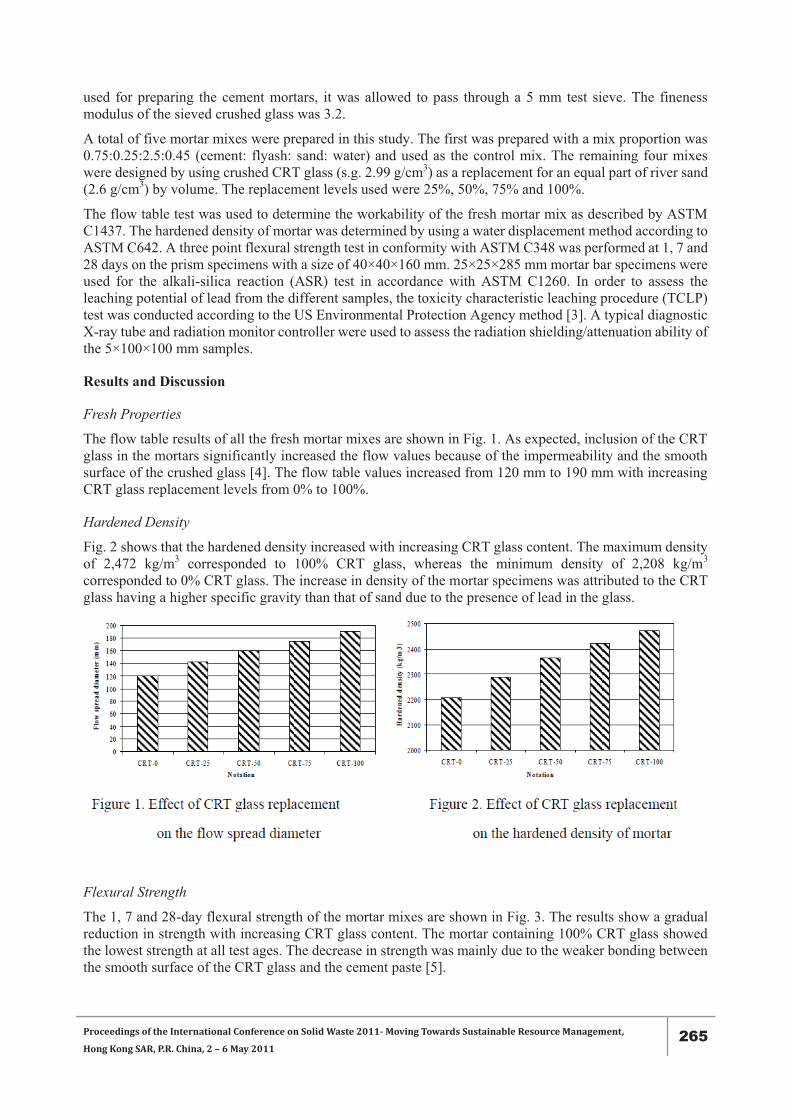
Proceedings of the International Conference on Solid Waste 2011- Moving Towards Sustainable Resource Management,
Hong Kong SAR, P.R. China, 2 – 6 May 2011 265
used for preparing the cement mortars, it was allowed to pass through a 5 mm test sieve. The fineness modulus of the sieved crushed glass was 3.2.
A total of five mortar mixes were prepared in this study. The first was prepared with a mix proportion was 0.75:0.25:2.5:0.45 (cement: flyash: sand: water) and used as the control mix. The remaining four mixes were designed by using crushed CRT glass (s.g. 2.99 g/cm3) as a replacement for an equal part of river sand (2.6 g/cm3) by volume. The replacement levels used were 25%, 50%, 75% and 100%.
The flow table test was used to determine the workability of the fresh mortar mix as described by ASTM C1437. The hardened density of mortar was determined by using a water displacement method according to ASTM C642. A three point flexural strength test in conformity with ASTM C348 was performed at 1, 7 and 28 days on the prism specimens with a size of 40×40×160 mm. 25×25×285 mm mortar bar specimens were used for the alkali-silica reaction (ASR) test in accordance with ASTM C1260. In order to assess the leaching potential of lead from the different samples, the toxicity characteristic leaching procedure (TCLP) test was conducted according to the US Environmental Protection Agency method [3]. A typical diagnostic X-ray tube and radiation monitor controller were used to assess the radiation shielding/attenuation ability of the 5×100×100 mm samples.
Results and Discussion
Fresh Properties
The flow table results of all the fresh mortar mixes are shown in Fig. 1. As expected, inclusion of the CRT glass in the mortars significantly increased the flow values because of the impermeability and the smooth surface of the crushed glass [4]. The flow table values increased from 120 mm to 190 mm with increasing CRT glass replacement levels from 0% to 100%.
Hardened Density
Fig. 2 shows that the hardened density increased with increasing CRT glass content. The maximum density of 2,472 kg/m3 corresponded to 100% CRT glass, whereas the minimum density of 2,208 kg/m3 corresponded to 0% CRT glass. The increase in density of the mortar specimens was attributed to the CRT glass having a higher specific gravity than that of sand due to the presence of lead in the glass.
Flexural Strength
The 1, 7 and 28-day flexural strength of the mortar mixes are shown in Fig. 3. The results show a gradual reduction in strength with increasing CRT glass content. The mortar containing 100% CRT glass showed the lowest strength at all test ages. The decrease in strength was mainly due to the weaker bonding between the smooth surface of the CRT glass and the cement paste [5].
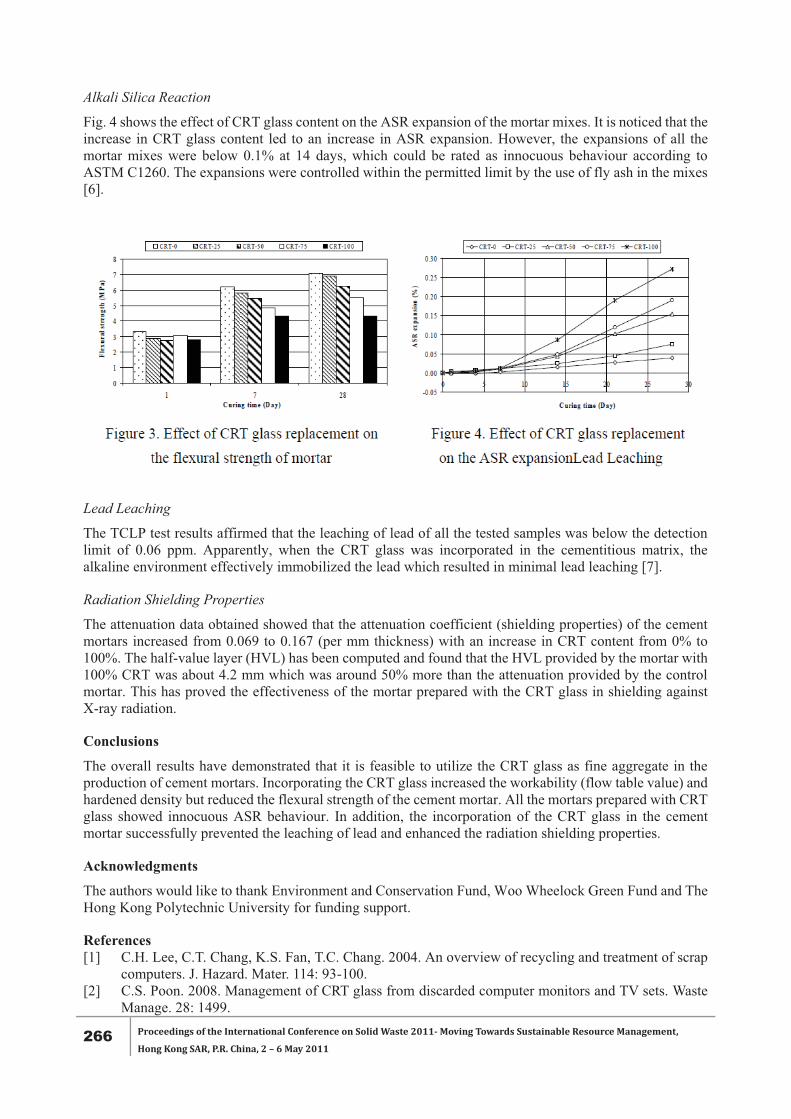
266 Proceedings of the International Conference on Solid Waste 2011- Moving Towards Sustainable Resource Management,
Hong Kong SAR, P.R. China, 2 – 6 May 2011
Alkali Silica Reaction
Fig. 4 shows the effect of CRT glass content on the ASR expansion of the mortar mixes. It is noticed that the increase in CRT glass content led to an increase in ASR expansion. However, the expansions of all the mortar mixes were below 0.1% at 14 days, which could be rated as innocuous behaviour according to ASTM C1260. The expansions were controlled within the permitted limit by the use of fly ash in the mixes [6].
Lead Leaching
The TCLP test results affirmed that the leaching of lead of all the tested samples was below the detection limit of 0.06 ppm. Apparently, when the CRT glass was incorporated in the cementitious matrix, the alkaline environment effectively immobilized the lead which resulted in minimal lead leaching [7].
Radiation Shielding Properties
The attenuation data obtained showed that the attenuation coefficient (shielding properties) of the cement mortars increased from 0.069 to 0.167 (per mm thickness) with an increase in CRT content from 0% to 100%. The half-value layer (HVL) has been computed and found that the HVL provided by the mortar with 100% CRT was about 4.2 mm which was around 50% more than the attenuation provided by the control mortar. This has proved the effectiveness of the mortar prepared with the CRT glass in shielding against X-ray radiation.
Conclusions
The overall results have demonstrated that it is feasible to utilize the CRT glass as fine aggregate in the production of cement mortars. Incorporating the CRT glass increased the workability (flow table value) and hardened density but reduced the flexural strength of the cement mortar. All the mortars prepared with CRT glass showed innocuous ASR behaviour. In addition, the incorporation of the CRT glass in the cement mortar successfully prevented the leaching of lead and enhanced the radiation shielding properties.
Acknowledgments
The authors would like to thank Environment and Conservation Fund, Woo Wheelock Green Fund and The Hong Kong Polytechnic University for funding support.
References [1] C.H. Lee, C.T. Chang, K.S. Fan, T.C. Chang. 2004. An overview of recycling and treatment of scrap
computers. J. Hazard. Mater. 114: 93-100. [2] C.S. Poon. 2008. Management of CRT glass from discarded computer monitors and TV sets. Waste
Manage. 28: 1499.
Proceedings of the International Conference on Solid Waste 2011- Moving Towards Sustainable Resource Management,
Hong Kong SAR, P.R. China, 2 – 6 May 2011 267
[3] U.S. Environmental Protection Agency. Test Method 1311, Toxicity Characteristic Leaching Procedure (TCLP). Specifications of the Committee on Analytical Reagents of the American Chemical.
[4] S.C. Kou, C.S. Poon. 2009. Properties of self-compacting concrete prepared with recycled glass aggregate. Cem. Concr. Compos. 31: 107-113.
[5] T.C. Ling, C.S. Poon, Properties of architectural mortar prepared with recycled glass with different particle sizes. Mater. Desg. 32: 2675-2684.
[6] G. Lee, T.C. Ling, Y.L. Wong, C.S. Poon. 2011. Effects of crushed glass cullet sizes, casting methods and pozzolanic materials on ASR of concrete blocks. Constr. Build. Mater. 25: 2611-2618.
[7] J.W. Phair, J.S.J. Van Deventer. 2001. Effect of silicate activator pH on the leaching and mineral material characteristics of waste-based inorganic polymers. Mineral. Eng. 14: 289-304.
268 Proceedings of the International Conference on Solid Waste 2011- Moving Towards Sustainable Resource Management,
Hong Kong SAR, P.R. China, 2 – 6 May 2011
THE MICROSTRUCTURE AND PHYSICAL PROPERTIES OF CERAMIC-BASED INCINERATED PAPER-CULLET-CLAY
Md.R. Sahar 1*, K.A. Samah 1, M.M. Razi 1, M.S. Rohani 1
Advance Optical Material Research Group Lab, Physics Department, Faculty of Science, Universiti Teknologi Malaysia, 81310 Skudai, Johor, Malaysia
*Corresponding author. Tel: +60127381709, E-mail: [email protected]
ABSTRACT A series of ceramic based on (x) incinerated recycle paper - (80-x) cullet – 20 Kaolin clay (where 4510 �� x wt%) has successfully been made by slip casting technique followed by sintering at 1000�C. The actual composition of ceramic is analyzed using Energy Dispersive of X-Ray (EDAX) while the phase existence is determined using X-Ray Diffractometer (XRD) technique. Their micro structural morphology is observed under Scanning Electron Microscope (SEM) and the physical properties are measured in term of their thermal shrinkage and hardness. It is found that the ceramic contain mostly of Silica and the phase is dominated by the existence of Quartz (SiO2), Wollastonite (CaSiO3) and Anorthite (Ca(Al2SiO8)). The SEM micrograph shows that the morphology is dominated by the existence of granular structure, and then become smoother as the cullet level is further increased. It is also found out that the thermal shrinkage is in the range 18% to 6.5% while the hardness is in the range of 152MPa to 1.463GPa depending on composition.
Keywords: Incinerated paper, Glass Cullet, Microstructure and physical properties
Introduction
The issues regarding to the disposal of the municipal solid wastes (MSW) had receive a lot of attention especially from the environmental point of view. Because of that, any activity that will enable its reduction and valorization is almost welcome [1]. According to report [2], cullet is a major contribution to the municipal solid waste (MSW) collection. As has been demonstrated by other researcher [3-4], these cullet can be used as a fluxing agent in ceramic production such as stoneware, tiles, bricks concrete and cement. It can also reduce the sintering temperature when mixing with clay [5]. Consequently, cullet appears to be a suitable raw material for ceramic bodies since it contained of SiO2, CaO, Na2O and Al2O3 [6].
The mixture of cullet with incinerate paper waste is very promising since they are composed of refractory materials [6]. It has recently been demonstrated these mixtures, when added with red clay give products with properties that meet industrial standards [7]. Thus, it is clear that much work has to be done to promote increase the usage of cullet in different areas.In the present study, the compositional, microstructure and crystal phases of the ceramic-based cullet- incinerated paper- Kaolin clay will be discussed in detailed. The thermal shrinkage and hardness of the sample also will be presented.
Materials and Methods
A proportional amount of cullet, incinerated recycle paper and Kaolin clay of 100m3 in size are mixed together according to the composition given in Table 1. The mixture is then homogenized using ball milling for 1 hrs before a 100 wt% of water is added as a binder to form slurry. Slurry is then slipped cast in a mould made of plaster of Paris followed by drying for 5 hrs at room temperature. Then it is heat treated at 100�C for 24 hrs before being sintered at 1000�C for 2 hrs to finally get the white ceramic sample.
The actual composition of the sample is determined using Energy dispersive analysis of X-ray (EDAX). The phase occurrence is determined by X-ray Diffractometer using Cu K � radiation. Meanwhile, the microstructural morphology is observed by using Scanning Electron Microscope (SEM). The thermal shrinkage of sample is obtained by measuring the diameter ratio of the pre-sintered to the after sintered sample. The hardness is determined using a Vickers test (DVK-2, Matsuzawa Precision Machine) with an indentation of 49N for 10s.
Results and Discussion
Table 1 shows the actual composition of oxides as analyzed by EDAX. As shown in Table 1, the majorelements are SiO2 , Al2O3 and CaO while others such as Na2O, K2O are relatively very small. This
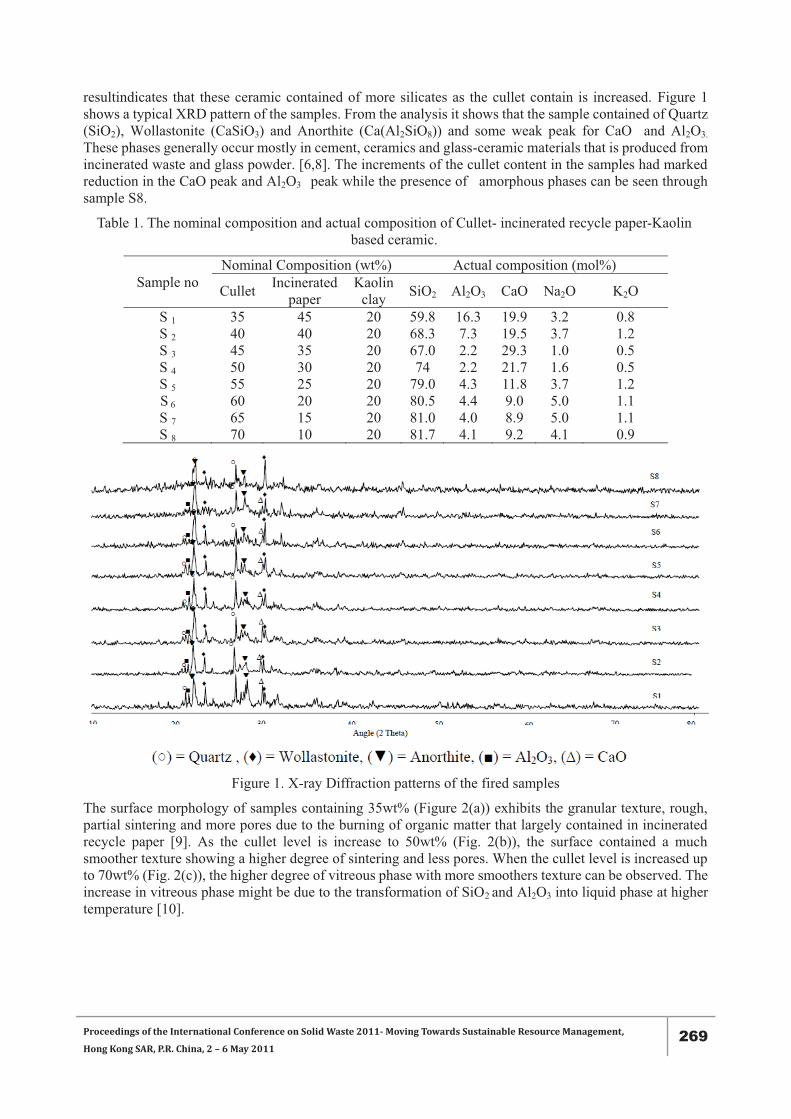
Proceedings of the International Conference on Solid Waste 2011- Moving Towards Sustainable Resource Management,
Hong Kong SAR, P.R. China, 2 – 6 May 2011 269
resultindicates that these ceramic contained of more silicates as the cullet contain is increased. Figure 1 shows a typical XRD pattern of the samples. From the analysis it shows that the sample contained of Quartz (SiO2), Wollastonite (CaSiO3) and Anorthite (Ca(Al2SiO8)) and some weak peak for CaO and Al2O3. These phases generally occur mostly in cement, ceramics and glass-ceramic materials that is produced from incinerated waste and glass powder. [6,8]. The increments of the cullet content in the samples had marked reduction in the CaO peak and Al2O3 peak while the presence of amorphous phases can be seen through sample S8.
Table 1. The nominal composition and actual composition of Cullet- incinerated recycle paper-Kaolin based ceramic.
Sample no Nominal Composition (wt%) Actual composition (mol%)
Cullet Incinerated paper
Kaolin clay SiO2 Al2O3 CaO Na2O K2O
S 1 35 45 20 59.8 16.3 19.9 3.2 0.8 S 2 40 40 20 68.3 7.3 19.5 3.7 1.2 S 3 45 35 20 67.0 2.2 29.3 1.0 0.5 S 4 50 30 20 74 2.2 21.7 1.6 0.5 S 5 55 25 20 79.0 4.3 11.8 3.7 1.2 S 6 60 20 20 80.5 4.4 9.0 5.0 1.1 S 7 65 15 20 81.0 4.0 8.9 5.0 1.1 S 8 70 10 20 81.7 4.1 9.2 4.1 0.9
Figure 1. X-ray Diffraction patterns of the fired samples
The surface morphology of samples containing 35wt% (Figure 2(a)) exhibits the granular texture, rough, partial sintering and more pores due to the burning of organic matter that largely contained in incinerated recycle paper [9]. As the cullet level is increase to 50wt% (Fig. 2(b)), the surface contained a much smoother texture showing a higher degree of sintering and less pores. When the cullet level is increased up to 70wt% (Fig. 2(c)), the higher degree of vitreous phase with more smoothers texture can be observed. The increase in vitreous phase might be due to the transformation of SiO2 and Al2O3 into liquid phase at higher temperature [10].
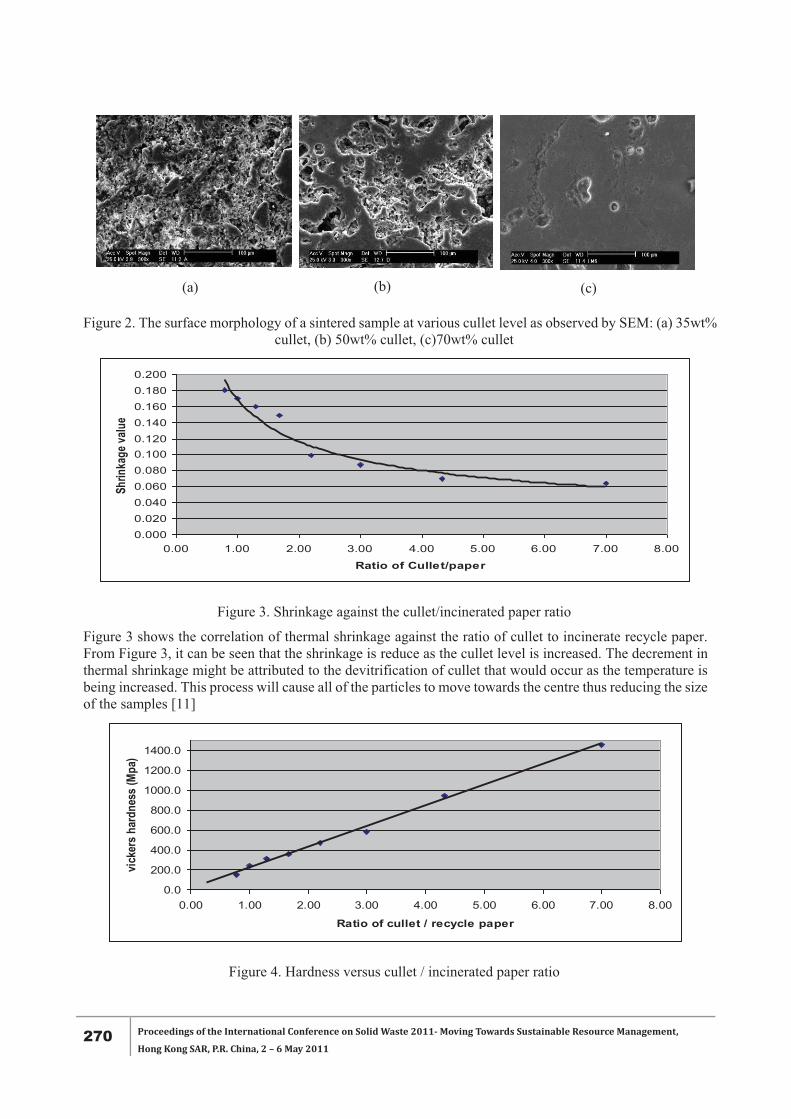
270 Proceedings of the International Conference on Solid Waste 2011- Moving Towards Sustainable Resource Management,
Hong Kong SAR, P.R. China, 2 – 6 May 2011
Figure 2. The surface morphology of a sintered sample at various cullet level as observed by SEM: (a) 35wt%
cullet, (b) 50wt% cullet, (c)70wt% cullet
Figure 3. Shrinkage against the cullet/incinerated paper ratio
Figure 3 shows the correlation of thermal shrinkage against the ratio of cullet to incinerate recycle paper. From Figure 3, it can be seen that the shrinkage is reduce as the cullet level is increased. The decrement in thermal shrinkage might be attributed to the devitrification of cullet that would occur as the temperature is being increased. This process will cause all of the particles to move towards the centre thus reducing the size of the samples [11]
Figure 4. Hardness versus cullet / incinerated paper ratio
0.0000.0200.0400.0600.0800.1000.1200.1400.1600.1800.200
0.00 1.00 2.00 3.00 4.00 5.00 6.00 7.00 8.00
Ratio of Cullet/paper
Shrin
kage
valu
e
0.0
200.0
400.0
600.0
800.0
1000.0
1200.0
1400.0
0.00 1.00 2.00 3.00 4.00 5.00 6.00 7.00 8.00
Ratio of cullet / recycle paper
vick
ers
hard
ness
(Mpa
)
(c) (b) (a)
Proceedings of the International Conference on Solid Waste 2011- Moving Towards Sustainable Resource Management,
Hong Kong SAR, P.R. China, 2 – 6 May 2011 271
Figure 4 shows the plot of hardness against the cullet/incinerated paper ratio. From Figure 4, it can be seen that the hardness increases as the cullet content is increased. This result indicates that the ceramic becomes more compact as the cullet level is increased. This is true since at this stage, the glass phase vitrified in the ceramic matrix [12]. The micrograph at higher cullet level also confirms this result.
Conclusion
From the result and discussion, some conclusion can be made as follows:-
The Ceramic-Based Incinerated Paper-Cullet-Kaolin clay has successfully been prepared.
EDAX analysis shows that the ceramic contained largely SiO2 , Al2O3 and CaO.
The major phase occurrence are Quartz (SiO2), Wollastonite (CaSiO3) and Anorthite (Ca(Al2SiO8)).
The microstructural morphology shows that ceramic with higher cullet level exhibit a smoother surface.
The thermal shrinkage and hardness of this ceramic are found to be compositional dependence.
Acknowledgements
The authors would like to thank Universiti Teknologi Malaysia for giving the chance to do this research under Vot 78520. We also wish to thank Ministry of Science, Technology and Innovation for provide financial support under National Science Fellowship fund.
References [1] Fauziah S.H., and Simon, C., and Agamuthu, P. 2004. Municipal solid waste management in
Malaysia - possibility of improvement, Malaysian. Journal of Science. 23: 61-70. [2] Karamberi A, Moutsatsou A. 2005. Participation of coloured glass cullet in cementitious materials.
Cement and Concrete Composites. 27:319–27. [3] Vorrada Loryuenyong a,b, Thanapan Panyachai a, Kanyarat Kaewsimork a, Chatnarong Siritai. 2009.
Effects of recycled glass substitution on the physical and mechanical properties of clay brick,. Waste Management. 29: 2717-2721.
[4] Caijun Shi, Keren Zheng . 2007. A review on the use of waste glasses in the production of cement and concrete. Resources, Conservation and Recycling.52: 234–247.
[5] Kae-Long Lin. 2007. The effect of heating temperature of thin film transistor-liquid crystal display (TFT-LCD) optical waste glass as a partial substitute partial for clay in eco-brick. Cleaner Production.15: 1755-1759.
[6] L. Asquini, E. Furlani, S. Bruckner, S. Maschio. 2008. Production and characterization of sintered ceramics from paper mill sludge and glass cullet. Chemosphere. 71: 83-89.
[7] S. Maschio , E. Furlani, G. Tonello, N. Faraone, E. Aneggi, D. Minichelli, L. Fedrizzi, A. Bachiorrini, S. Bruckner. 2009. Fast firing of tiles containing paper mill sludge, glass cullet and clay. Waste management. 29: 2880-2885.
[8] L. Barbieri , A. Karamanov, A. Corradi, I. Lancellotti, M. Pelino b, J. Ma. Rincon. 2008. Structure, chemical durability and crystallization behavior of incinerator-based glassy systems. J. of Non-Crystalline Solids. 354:521-528.
[9] S. Maschio , E. Furlani, G. Tonello, N. Faraone, E. Aneggi, D. Minichelli, L. Fedrizzi, A. Bachiorrini, S. Bruckner. 2009. Fast firing of tiles containing paper mill sludge, glass cullet and clay. Waste management. 29: 2880-2885.
[10] S. A. Pauzi. 2011. A Cullet-Kaolin ceramic from recycle glass. Msc thesis, Universiti Teknologi Malaysia, Malaysia
[11] Holt, Erika E. 2001.Early age autogenous shrinkage of concrete. VTT Publications. 446: 184 -193 [12] M. R. Sahar*, K.A. Samah. 2011. Physical and Mechanical Properties of Ceramic-Based Recycled
Paper-Cullet-Clay. Journal of Materials Science and Engineering, USA (In Press).

272 Proceedings of the International Conference on Solid Waste 2011- Moving Towards Sustainable Resource Management,
Hong Kong SAR, P.R. China, 2 – 6 May 2011
BENEFICIAL USE OF OYSTER SHELLS POWDERS IN CONCRETE: INFLUENCE ON THE MECHANICAL STRENGTH PROPERTIES
C. Engelaere, F. Becquart *, M. Boutouil
Laboratoire de Recherche sur les Matériaux et sur la Construction Ecole Supérieure d’Ingénierie et Travaux de la Construction de Caen Campus 2 – 1 Rue Pierre et Marie Curie – 14610 Epron - FRANCE
* Corresponding author: E-mail: [email protected]; Tel: +33 (0) 231462310
ABSTRACT This study explores the impact of partial replacement of sand with oyster shells powder (OSP) on the concrete mixtures properties and the mechanical performances of such partially recycled concrete. The oyster shells (OS) were undergone a preliminary treatment in order to be cleared of main organic components. Physical and chemical properties of OS were determined. Five concrete mixtures were formulated. The sand fractions incorporated into concrete were respectively replaced in mass proportion by 10, 30, 40 and 60 % of OSP. Water content was determined for a slump fixed to 7.5 cm ± 1.5 cm. The concrete mechanical performances were evaluated at five curing times: 2, 7, 28, 90 and 180 days. Results were compared with a control concrete. The compression tests results show a reduction of the compressive strength of concrete with increasing proportion of incorporated powders. However for low substitution rates (below 30 %), loss of resistance are limited compared to the normal concrete. The valorization of such materials in sustainable construction seems possible.
Keywords: Oyster shell powder, Concrete, Compressive strength, Sustainable construction
Introduction
West side of France is a big producer of oysters in Europe, and considering the made productions, the shell wastes increase more and more. A management of these is essential because of their olfactive nuisances and their increasing volume. Valuations exist. The current fields of beneficial use are liming, foods for poultry, decoration products, cosmetics or pharmaceuticals. Some research works study the interest of these recycled materials for concrete [1--4]. The waste recovery from marine shells to civil engineering materials could confer to the shellfish products a possible higher value-added. The objectives of this work were the determination of main OS physical and chemical characteristics and the characterization of concrete mixtures which contain OSP.
Materials and Methods
Material Properties
Concrete was made with type I Portland cement (CEM I 52.5 N CE PM-CP2 NF), smooth sand and crushed aggregates. OS added to concrete were treated in order to be cleared of main organic materials. Specific operations of washing, dripping, drying were done, and also milling and sorting in order to obtain a powder (0 - 500 µm). Ignition method was applied according to XP P94-047 French standard. Remaining organic materials quantity was estimated at 3 %. Raw OS chemical composition was analyzed by inductively coupled plasma atomic emission spectrometer (ICP). Composition is noted in
Table 4. Calcium is the major element in OS (94.2 %). Sulfur and magnesium are present at 4.6 % and 0.6 % respectively. Other ions are present at concentrations less than 0.6 %. Powder of raw OS was analyzed by X-ray diffractometer. The patterns for OS exhibited peaks characteristic of CaCO3 as Figure 4.
Table 4. ICP Analysis of raw oyster shell (%)
Ca S Mg Sr K Si Fe Al Zn Mn Cu As Se Cr
94.2 4.6 0.6 Detected tracks

Proceedings of the International Conference on Solid Waste 2011- Moving Towards Sustainable Resource Management,
Hong Kong SAR, P.R. China, 2 – 6 May 2011 273
Figure 4. XRD analysis of raw oyster shell
Physical properties of concrete aggregates were tested according to NF EN 1097-6 and NF EN 933-1. Table 5 shows physical characteristics of these different materials. Preparation and filling of cylindrical moulds (11 x 22 cm) were made according to NF EN 12390-2. Specimens were compacted by vibrating table and were removed from the mold after 24 h. Samples were cured in water at a temperature of 20°C ± 2°C until the testing date.
Table 5. Physical characteristics of concrete granulates
d/D (mm) Specific gravity
Absorption ratio (WA24) (%) F.M.
Smooth sand 0/4 2.67 0.2 2.1
Crushed aggregate 4/6 6/10
2.52 2.60
1.0 0.7
- -
Oyster shell 0/0.5 2.84 11.5 -
Concrete Mix Proportions
Mixture proportions were proposed to investigate concrete behavior modifications with variation of OS rate. Compositions (
Table 6) were obtained with Dreux-Gorisse method. A compressive strength of 40 MPa was aimed at 28 days. The target base slump of concrete between 6 and 9 cm was fixed. No admixture was used in concrete. Concrete was formulated with sand variation and OS substitution rate variation. The concrete D0 is a C40/50 control concrete mixture with water/cement ratio at 0.5. Water content of other mixtures was determined by 7.5 ± 1.5 slump tests.
Measurements of Fresh and Hardened Concrete Properties
To determinate the consistency of fresh concrete, slump test was done following NF EN 12350-2. Hardened concrete compressive strength was performed following NF EN 12390-3. The measured values were determined from a minimal number of five samples at 2, 7, 28, 90 and 180 days.
Table 6. Proportions of concrete mixtures
IdentificationWater (W)
Cement (C)
OS powder
Sand (S)
Crushed aggregates 1
(G1)
Crushed aggregates 2
(G2) SR*
Unit weight (kg/m3) % D0 202.5 405 0 622 137 1034 0 D10 Adjusted 405 62 560 137 1034 10 D30 Adjusted 405 187 436 137 1034 30 D40 Adjusted 405 249 373 137 1034 40 D60 Adjusted 405 373 249 137 1034 60
*Substitution Rate
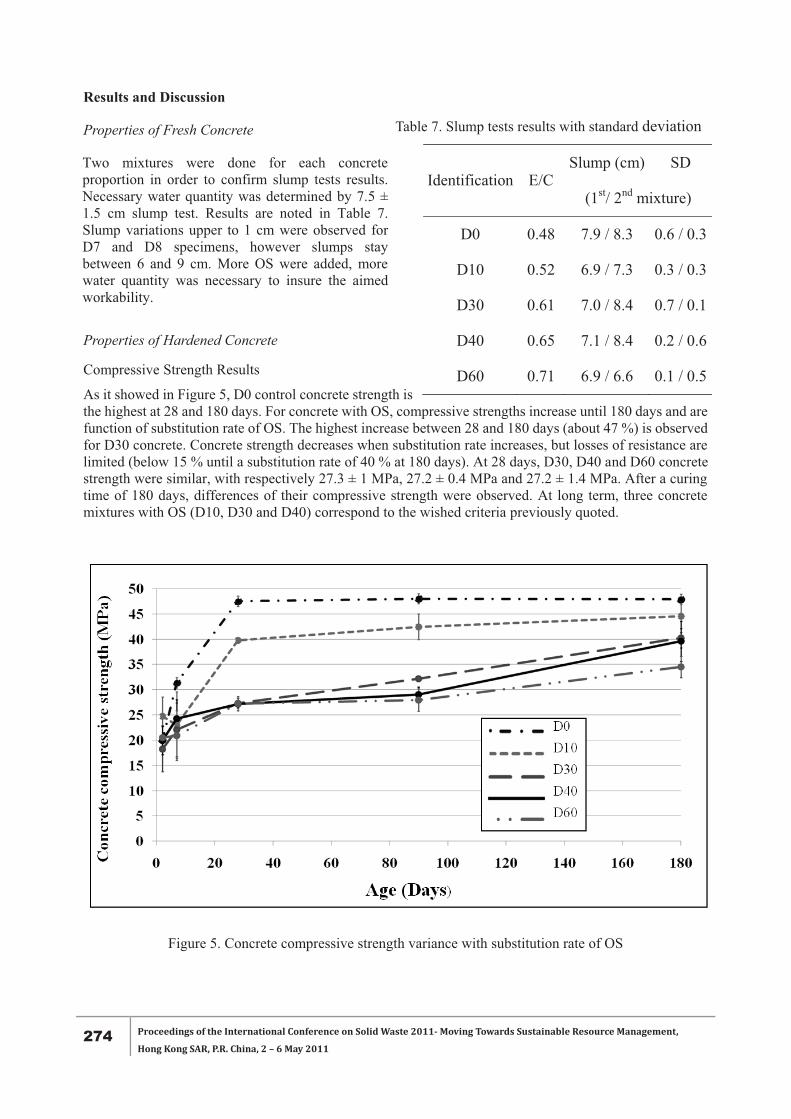
274 Proceedings of the International Conference on Solid Waste 2011- Moving Towards Sustainable Resource Management,
Hong Kong SAR, P.R. China, 2 – 6 May 2011
Results and Discussion
Properties of Fresh Concrete
Properties of Hardened Concrete
Compressive Strength Results
As it showed in Figure 5, D0 control concrete strength is the highest at 28 and 180 days. For concrete with OS, compressive strengths increase until 180 days and are function of substitution rate of OS. The highest increase between 28 and 180 days (about 47 %) is observed for D30 concrete. Concrete strength decreases when substitution rate increases, but losses of resistance are limited (below 15 % until a substitution rate of 40 % at 180 days). At 28 days, D30, D40 and D60 concrete strength were similar, with respectively 27.3 ± 1 MPa, 27.2 ± 0.4 MPa and 27.2 ± 1.4 MPa. After a curing time of 180 days, differences of their compressive strength were observed. At long term, three concrete mixtures with OS (D10, D30 and D40) correspond to the wished criteria previously quoted.
Figure 5. Concrete compressive strength variance with substitution rate of OS
Identification E/C Slump (cm) SD
(1st/ 2nd mixture)
D0 0.48 7.9 / 8.3 0.6 / 0.3
D10 0.52 6.9 / 7.3 0.3 / 0.3
D30 0.61 7.0 / 8.4 0.7 / 0.1
D40 0.65 7.1 / 8.4 0.2 / 0.6
D60 0.71 6.9 / 6.6 0.1 / 0.5
Two mixtures were done for each concrete proportion in order to confirm slump tests results. Necessary water quantity was determined by 7.5 ± 1.5 cm slump test. Results are noted in Table 7. Slump variations upper to 1 cm were observed for D7 and D8 specimens, however slumps stay between 6 and 9 cm. More OS were added, more water quantity was necessary to insure the aimed workability.
Table 7. Slump tests results with standard deviation
Proceedings of the International Conference on Solid Waste 2011- Moving Towards Sustainable Resource Management,
Hong Kong SAR, P.R. China, 2 – 6 May 2011 275
Conclusions
OS composition is mainly calcite (CaCO3). The OSP has an absorption coefficient about 11 %. This high value has a significant direct impact on the necessary water quantity to obtain the aimed workability. Beyond 28 days, compressive strengths of concretes with OS increase until 180 days. It appears thus necessary to wait this curing time to observe the complete evolution of the compressive strength. The main conclusion is that the concrete strength decreases with the substitution rate, but with a limited resistance loss for a substitution rate below 40 %. These first results are very encouraging, especially that no adjuvant was used for the different mixtures. In parallel research works are in progress about the heat treatment impact of oyster shells on their chemical and mineralogical properties and their positive impact as component in concrete mixtures.
Acknowledgements
The authors would like to thank the assistance of OVIVE Company in France for the OS provision.
References [1] E-I. Yang, S-T Yi. and Y-M Leem. 2005. Effect of oyster shell substituted for fine aggregate on
concrete characteristics: Part I. Fundamental properties. Cement and Concrete Research 35: 2175 - 2182.
[2] E-I Yang, M-Y Kim, H-G Park and S-T Yi. 2009. Effect of partial replacement of sand with dry oyster shell on the long-term performance of concrete. Construction and Building Materials, doi:10.1016/j.conbuildmat.2009.10.032.
[3] G.L. Yoon, B-T. Kim, B-O. Kim and S-H Han. 2003. Chemical-mechanical characteristics of crushed oyster-shell. Waste Management 23: 825-834.
[4] H. Yoon, S. Park, K. Lee and J. Park. 2004. Oyster shell as substitute for aggregate in mortar. Waste Management and research, 22: 158-170.

276 Proceedings of the International Conference on Solid Waste 2011- Moving Towards Sustainable Resource Management,
Hong Kong SAR, P.R. China, 2 – 6 May 2011
SOME PROPERTIES OF CEMENT-COPPER TAILINGS PASTES AND MORTARS O. Onuaguluchi *, Ö. Eren
Eastern Mediterranean University, Famagusta, Via Mersin 10, Turkey * Corresponding author. Tel: +90 3926302026, E-mail: [email protected]
ABSTRACT The use of industrial wastes such as fly ash, silica fume, slag and etc. as cementitious materials in mortar and concrete have undergone considerable development and notable successes have been achieved. However, the quest for more effective waste management approaches, cleaner environment and sustainability in construction materials usage makes it imperative that the utilization of other types of wastes be explored. This paper reports the results of a research aimed at studying the effect of copper tailings on some fresh and hardened properties of cement pastes and mortars. Various mortar mixes were prepared with different proportions of copper tailings ranging from 0 to 15% as a cement replacement material. The results revealed a longer setting time, higher paste consistency and mortar workability loss compared to the control mix. For the mechanical strength tests, higher compressive strength and abrasion resistance were obtained at 5% replacement level while a slightly lower compressive, flexural strength and abrasion resistance compared to the control were recorded for the rest of the mixes.
Keywords: Workability, Setting time, Compressive strength, Flexural strength, Abrasion
Introduction
Two major wastes, tailings and slag are produced during the processing of copper from its ore. Copper tailings are piles of waste rocks obtained during cycles of crushing, powdering and froth flotation process to separate copper from its ore while slag is produced during furnace smelting of copper concentrate to further remove contained impurities. Some research studies have shown that copper slag can be used as a concrete making material. However, copper tailings which are produced in higher quantities have not received considerable attention as a cement replacement material.
Therefore, this study investigated the use of copper tailings as a partial cement substitute in pastes and mortars. To attain this goal, the influence of different level of cement substitution with copper tailings on paste consistency, setting time and mortar flow were determined. Furthermore, mechanical properties such as compressive, flexural strength, and abrasion resistance were also evaluated.
Materials and Methods
Materials
The binders utilized in preparing paste and mortar mixes in this study were Portland slag cement CEM III/A (Class 32.5N) and copper tailings obtained from an abandoned processing facility at Lefke, Cyprus. Properties of these binders are shown in Table 1.0. For the preparation of mortar specimens, ASTM C 778 [1] specified standard sand was used.
Table 1. Chemical and physical properties of cement and copper tailings
Components
SiO2
(%)
Al2O3
(%)
Fe2O3
(%)
CaO
(%)
MgO
(%) SO3
(%)
LOI
(%)
Specific
gravity
Fineness
(cm2/g)
Absorption
(%)
Cement 29.15 7.34 2.42 50.04 3.99 1.97 1.65 2.97 3440.0 -
Tailings 11.2 - 85.3 - - - - 4.29 537.0 13.82
Proceedings of the International Conference on Solid Waste 2011- Moving Towards Sustainable Resource Management,
Hong Kong SAR, P.R. China, 2 – 6 May 2011 277
Mix Proportions for Paste and Mortar
The water-binder ratios utilized for the pastes was dependent on the findings from the consistency tests while a standard water-binder ratio of 0.485 according to ASTM C 109-08 guideline [1] was used for cement and mortar mixes incorporating copper tailings at cement replacement levels of 0, 5, 10 and 15%. In each of the mortar mix, the sand/binder mass ratio was 2.75, while for each cement substitution level; three specimens with the following dimensions 50x50x50 mm and 40x40x160 mm were cast for the determination of compressive strength, flexural strength and abrasion resistance tests respectively.
Consistency, Setting Time and Workability of Mortars
Using BS EN 196-3 [2] specification, the water demand and setting time of cement incorporating different percentages of copper tailings were evaluated. To evaluate effect on workability, flow of mortar mixes according to ASTM C 1437-07 [1] guideline was determined immediately after mixing.
Compressive and Flexural Strength of Mortar
Compressive and flexural strength of all the mortar mixes were determined after 90 days of storage in the curing room using ASTM C 109-08 and ASTM C 348-08 contained in [1] as a guide.
Modified Abrasion and Impact Test
The abrasion and impact resistance was evaluated using the Los Angeles abrasion apparatus, according to ASTM C 535-09 specification [1]. Broken flexural strength test specimens in conjunction with twelve 50 mm diameter steel balls were subjected to 500 revolutions and mass loss determined after every 100 revolution.
Results and Discussion
Consistency of Pastes, Setting Time and Workability of Mortars
Table 1 shows that the quantity of water required for the preparation of paste specimens increased as more cement is substituted with copper tailings. From the same table, it could be seen that cement mortars containing copper tailings demonstrated a lower workability when compared to the control. The degree of flow loss became more pronounced as the substitution level of cement with copper tailings increased. This higher water demand and flow loss witnessed is attributed to the porous nature of the copper tailings particles.
Table 2. Some fresh properties of pastes and mortars
Mix Paste Water demand
(%) Paste final setting
(minutes) Mortar flow
(%) C0 32.00 340 99.50 C5 32.50 384 92.25
C10 33.80 415 75.75
C15 34.00 435 56.25
The results in Table 2 further highlighted the delay in the final set time of mortars as the substitution level of cement with copper tailings increased. This occurrence is partly due to the dilution of the cement matrix and the delay of the hydration process caused by the presence of heavy metals in the tailings. However, compared to the severe copper slag induced delay in setting time reported by Ayano and Sakata [3], this copper tailings had a moderate impact on the cement hydration process.
Compressive and Flexural Strength of Mortars
The results in Figure 1a shows that after 90 days, the highest compressive strength among all the mixes was obtained at 5% cement replacement with copper tailings, however, further increase in cement substitution

278 Proceedings of the International Conference on Solid Waste 2011- Moving Towards Sustainable Resource Management,
Hong Kong SAR, P.R. China, 2 – 6 May 2011
led to lower strength. The observed increase in strength at 5% replacement level may be traced to the absorption of some of the mixing water by the porous tailings particles thereby reducing the water/binder ratio slightly. However, at 10 and 15% cement substitution level, cement dilution and the less workable mixes impacted the mechanical strength negatively.
On the other hand, Figure 1b indicated that both the control and 5% cement replacement samples had almost equivalent flexural strengths while a decrease in flexural strength as the cement substitution level increased was also seen. Based on these findings and the suggestions by Al-Jabri et al. [4] that at low water/binder ratios of 0.5 and 0.6, 5% replacement of cement with copper slag yielded a marginally lower but similar compressive strength as the control mixture, it seems that copper tailings gives a much better performance.
Figure 1. Compressive and Flexural strength of mortars
Modified Abrasion and Impact Resistance
Several factors such as aggregate type, compressive, flexural strength and etc. have been shown to influence the abrasion and impact resistance of mortars and concretes. In this study, the highest resistance (Figure 2) was obtained in mortar specimens with 5% replacement of cement by copper tailings. This mortar mix had the highest compressive strength, and this result seems to suggest that compressive strength has a major impact on degradation. The effect of compressive strength on abrasion resistance has equally been reported by Fernando and Said [5].
Figure 2. Modified Los Angeles abrasion and impact resistance of mortars
0
10
20
30
40
50
60
70
80
100 200 300 400 500
Wei
ght l
oss (
%)
Number of revolutions
0
5
10
15
20
25
30
35
C0 C5 C10 C15
Com
pres
sive
stre
ngth
(MPa
)
Cement replacement level with copper tailings (%)
90 days
0
2
4
6
8
10
12
C0 C5 C10 C15Fl
exur
al st
reng
th (M
Pa)
Cement replacement level with copper tailings (%)
90 days

Proceedings of the International Conference on Solid Waste 2011- Moving Towards Sustainable Resource Management,
Hong Kong SAR, P.R. China, 2 – 6 May 2011 279
Conclusions
The results presented in this paper suggest that despite drawbacks such as loss of workability and increased setting time, the enhanced mechanical properties of mortars incorporating copper tailings at 5% substitution level suggests that there is a huge potential for the utilization of this waste material for the partial replacement of cement in mortars. The use of this waste material as a cementitious binder will help in reducing the environmental menace associated with its disposal.
References [1] ASTM Standard Test Methods (2009). In: Annual book of ASTM Standards, Concrete and
Aggregates, Vol. 04.02, ASTM International, West Conshohocken, PA, United States [2] BS EN 196: Part 3. (2005). Methods of testing cements: Determination of setting times and
soundness. British Standard Institution (BSI), London [3] Ayano T, Sakata, K. (2000). Durability of concrete with copper slag fine aggregate. American
Concrete Institute Special Publication (ACI SP-192) pp 141–158 [4] Al-Jabri, K. S., Taha, R. A., Al-Hashmi, A., Al-Harthy, A. S. (2006). Effect of copper slag and cement
by-pass dust addition on mechanical properties of concrete. Construction and Building Materials Journal 20: 322–331
[5] Fernando, P.T., Said, J. (2010). Resistance to acid attack, abrasion and leaching behavior of alkali-activated mine waste binders. Materials and Structures Journal 44: 487-498

280 Proceedings of the International Conference on Solid Waste 2011- Moving Towards Sustainable Resource Management,
Hong Kong SAR, P.R. China, 2 – 6 May 2011
MINIMIZING ON-SITE CONSTRUCTION WASTE THROUGH PREFABRICATION IN HONG KONG
H.P. Yuan 1*, J.L. Hao 2, A.R. Chini 3
1 Dept. of Building and Real Estate, The Hong Kong Polytechnic University, Hong Kong. 2 Dept. of Architectural Science, Ryerson University, Toronto, Canada.
3 Rinker School of Building Construction, University of Florida, FL, USA. *Corresponding author. Email: [email protected], Phone: 852-27664306
ABSTRACT In Hong Kong, the landfill disposal of construction waste (CW) alone cost the government more than HK$200 million annually and takes up valuable landfill space. The need to reduce CW is imperative. It is suggested that prefabrication could function as a technology for minimizing CW. However, how CW can be minimized through prefabrication in the particular context of Hong Kong still deserves more investigation. This study therefore aims to examine the ways of prefabrication to minimize CW. The data were mainly collected via questionnaire among practitioners in Hong Kong. Based on the results, the relationship between waste generation and prefabrication application was expounded. The findings showed that (1) concrete and timber boards are the major on-site waste; (2) CW caused by improper preparation and handling can be greatly reduced by prefabrication; (3) although prefabrication can minimize CW, most respondents do not regard this as the main reason for adopting prefabrication; (4) governmental policies can promote the use of prefabrication.
Keywords: Construction waste, Waste minimization, Prefabrication, Hong Kong
Introduction
Over the past few years, the generation of construction waste (CW) has been increasing in Hong Kong. The total amount of CW generation was around 20 million tonnes in 2004. CW was a main component of the waste being dumped in landfills which made up 38% in 2004 [1]. The Environmental Protection Department of Hong Kong (HKEPD) stated that landfills and public filling areas would be filled up in 6 to 10 years and by mid 2006 respectively, if there is still no improvement in CW minimization. Thus, a simple solution to the severe problem is to prevent the production of CW. Prefabrication, as a key construction technology, can prevent the generation of CW. Currently, there are many precast elements, including precast facade, semi-precast slab and precast cladding, which are widely adopted in public projects of Hong Kong. The main aim of this study is to investigate minimizing CW by prefabrication in the Hong Kong’s construction industry. For the successful attainment of this research aim, the following issues are explored: (1) how prefabrication can minimize CW in Hong Kong? (2) investigation of government policies on adoption of prefabrication; and (3) implications of the findings to Hong Kong’s construction sector.
Research Methodology
A questionnaire was designed for data collection. The questionnaire consisted of two parts including Part I – general information and Part II – opinions on minimizing CW on-site through prefabrication. In the questionnaire, ten questions were designed to facilitate data collection. In the survey, 300 questionnaires were emailed to the professionals in the construction industry in Hong Kong including architects, contractors, clients, professors, government staff and consultants. These professionals were selected from their companies’ websites for the main survey. 40 completed questionnaires were returned and the response rate was about 13%. The response rate was relatively low but can be reasonable considering the normal responding rate in the construction industry. A 5-point Likert scale was used to obtain the respondents’ opinions. In the questionnaire, respondents were required to assign an appropriate rating on a scale of 1 to 5, “1” representing “strongly disagree”, “2” representing “disagree”, “3” indicating “neutral”, “4” representing “agree” and “5” meaning “strongly agree”. The mean scores of all items were calculated based on the following equation:
Proceedings of the International Conference on Solid Waste 2011- Moving Towards Sustainable Resource Management,
Hong Kong SAR, P.R. China, 2 – 6 May 2011 281
Where Sj is the weights of the degree of important (1, 2, 3, 4, 5), and fij is the corresponding frequencies of the degree of importance j of factor i. After calculating the mean scores, the relative important indexes (IND) were calculated by dividing MSi with the maximum MSi.
Findings and Discussions
Q1. What kind of CW can be commonly found on site? [(a) brick and block (b) concrete (c) plaster (d) ready-mix cement (e) steel bars (f) timber board (g) tiles]
This question aims to identify the typical types of CW that are commonly found on site in Hong Kong. The findings show that concrete is the most common CW on site. Timber board is the second, followed by brick and block, plaster, tiles and ready-mix cement. The last type of CW is steel bars. The findings indicate that concrete, timber board, and brick and block are the most common type of waste found on site. According to Poon et al. [2], timber formwork, wet trades, and concrete work are the first, second and third waste generators respectively. As brick and block belongs to the procedure of wet trades, the results are more or less in accord with the findings of Poon et al. [2]. It is therefore believed that there is more need to reduce the generation of these types of CW.
Q2. Can prefabrication minimize the kinds of waste listed below? [(a) brick and block (b) concrete (c) plaster (d) ready-mix cement (e) steel bars (f) timber board (g) tiles]
According to the findings, timber board and ready-mix cement are the second and third among the CW. It is then followed by tiles, brick and block, and plaster. The last one is steel bars. As mentions in Q1, concrete and timber board are the CW that are most commonly found on site. Thus, it shows that these wastes can be minimized by prefabrication effectively. This is because the trades of timber formwork and concrete work can be avoided on site when prefabrication is adopted. With reference to Tam et al. [3], the percentage of reduction on plastering could be 100%. However, in this study, the score for reducing plastering by prefabrication is only 3.575.
Q3. Do you agree that the following issues are the main causes of CW generation on site? [(a) improper preparation and handling (b) incorrect processing (c) lack of waste management plan (d) misuse (e) over-ordering (f) poor storage (g) poor workmanship (h)variation in design]
Findings indicate that lack of waste management plan is the main cause of CW. The second and third priorities are the improper preparation and handling and the variations in design at the construction stage. It is then followed by poor workmanship, poor storage and incorrect processing and misuse. The least priority is the over-ordering. Thus, it is believed that waste management plan is an essential factor for the minimization of CW. According to Poon et al. [4] and Cheung et al. [5], improper preparation and handling is one of the major causes of CW. In this research, it shows that improper preparation and handling is the second cause. The workers’ skills should be focused as many wastes are generated due to the poor working skills. Training should be provided for workers to educate them the appropriate working procedures and materials handling skills.
Q4. Do you agree that prefabrication can overcome the following problems? [(a) improper preparation and handling (b) incorrect processing (c) lack of waste management plan (d) misuse (e) over-ordering (f) poor storage (g) poor workmanship (h) variation in design at construction stage]
The findings show that 68% of the respondents agreed that poor workmanship could be overcome by prefabrication and the score is 3.7. The second priority is over-ordering that achieved a score of 3.6. The third is improper preparation and handling, followed by lack of waste management plan, poor storage, misuse, incorrect processing. The last one is variations in design at the design stage. Reasons given for CW generation are poor workmanship as the first and improper preparation and handling as the third and both involve workers’skills. As the building process involve workers’ skills, their skills can affect the generation of CW directly. By adopting prefabrication, involvement of workers could be minimized.

282 Proceedings of the International Conference on Solid Waste 2011- Moving Towards Sustainable Resource Management,
Hong Kong SAR, P.R. China, 2 – 6 May 2011
Q5. Do you agree the following factors affecting the choice of construction method? [(a) available equipment (b) client’s requirement (c) construction cost (d) construction time (e) familiarity with the construction technology (f) production of waste (g) quality (h) site space]
Findings show that construction time, construction cost and client’s requirement with score over 4 are the main concerns when choosing construction methods, followed by familiarity with the construction technology, site space, quality and available equipment. The last one is the production of waste which only scores 3.225. Most respondents agreed construction time and construction cost are the main factors. This is because these factors can affect project cost significantly. The shorter the construction time, the more the profit they can earn. It is recommended that government should provide more incentives on waste minimization or a fine should be levied if large amount of waste is produced by the projects.
Q6. Does the method of prefabrication satisfy the following factors? [(a) available equipment (b) client’s requirement (c) construction cost (d) construction time (e) familiarity with the construction technology (f) production of waste (g) quality (h) site space]
Findings show that most of respondents believe that the construction time is reduced if prefabrication is adopted. The score of this item is 4.025. The second priority is quality and the third one is production of waste. The last one is availability of equipment. Adopting prefabrication also helps achieve high quality. The reason is that as the precast elements are manufactured in a factory, the quality could be easily controlled. Also, most respondents agree the adoption of prefabrication can minimize the CW significantly.
Q7. Do you agree that the following issues are the main reasons for the implementation of prefabrication? [(a) better quality (b) integrated with building services (c) reduce labour force (d) shorter construction time (e) waste reduction]
Findings exhibit that the main reason is shorter construction time which receives a score of 4.075. The second and the third reasons are reducing labor forces and better quality respectively, followed by the reasons of waste reduction and integrated with building services. It is found that waste reduction is not a main reason when respondents choose the implementation of prefabrication. Although CW could be minimized by prefabrication, respondents seldom concern this benefit. They are seldom aware of the CW generated. The attitude of the construction professionals toward waste should be thus improved.
Q8. Do you think it is difficult to achieve dimensional coordination in prefabrication?
The purpose of this question is to investigate whether dimensional coordination is difficult to achieve in prefabrication in order to examine whether prefabrication produce waste due to dimensional dis-coordination. Findings show that 45% of the respondents either agree or strongly agree with the statement. 20% of the respondents believe the statement is neutral while 35% either disagree or strongly disagree with the statement. According to Poon et al. [4], dimensional dis-coordination can result in excessive off-cuts. Therefore, dimensional coordination is very important as it can avoid CW generation. It is therefore recommended that dimensional coordination should be ensured at the design stage to minimize the cutting waste during construction.
Q9. Do you agree that the adoption of prefabrication would increase after the implementation of Construction Waste Disposal Charging Scheme? Why?
Findings of this question show that 45% of the respondents either agree or strongly agree that the adoption of prefabrication would increase. 37.5% of the respondents do not have any opinions. 17.5 % of respondents disagree with the statement. The mean score for this question is 3.4. The Construction Waste Disposal Charging Scheme (CWDCS) has become effective on December 1, 2005. Readers are referred to [6] for details of the charge of CWDCS.
Q10. Do you think that the incentives (exempted from GFA and SC) set out by the government can promote the use of prefabrication? Why?
62.5% of the respondents either agree or strongly agree with the statement. 27.5% of the respondents do not have any opinions on the statement. Only 10% of the respondents disagree with the statement. From the

Proceedings of the International Conference on Solid Waste 2011- Moving Towards Sustainable Resource Management,
Hong Kong SAR, P.R. China, 2 – 6 May 2011 283
positive perspective, respondents agree incentives set out by the government could promote the use of prefabrication. A respondent stated that “because any incentives or penalties enforced by the government would encourage or force the stakeholders to reduce the waste”. Respondents also pointed out developers could increase their profits as there would be more saleable area after using prefabrication. Therefore, developers are more willing to use more prefabricated components and prefabrication would become client’s requirement. This benefit outweighs all other reasons.
Conclusions
Prefabrication has been perceived as a solution to effectively minimize CW generation. However, there are still many problems while implementing it. The results reveal that (1) concrete and timber boards were the major wastes generated on-site; (2) waste caused by improper preparation and handling could be minimized by prefabrication effectively; (3) although prefabrication could minimize CW, the respondents did not think this benefit as the main reason for implementing prefabrication in construction; (4) government policies could promote the use of prefabrication. These findings show obviously both the potential and barriers of applying prefabrication in Hong Kong.
References [1] L.C. Tsoi, C.K. Lam and K.K. Ho. 2005. Monitoring of solid waste in Hong Kong waste statistics for
2004. Waste Reduction Group of the Environmental Protection Department. [2] C.S. Poon, A.T.W. Yu and L. Jaillon. 2004a. Reducing building waste at construction sites in Hong
Kong. Construction Management and Economics. 22: 461-470. [3] V.W.Y. Tam, C.M. Tam and L.Y. Shen. 2004. Comparing material wastage levels between
conventional in-situ and prefabrication construction in Hong Kong. Journal of Harbin Institute of Technology (New Series). 11: 548-551.
[4] C.S. Poon, A.T.W. Yu, S.W Wong and E. Cheung. 2004b. Management of construction waste in public housing projects in Hong Kong. Construction Management and Economics. 22: 675-689.
[5] C.M. Cheung, K.W. Wong, C.N. Fan and C.S. Poon. 1993. Reduction of Construction Waste: Final Report, Hong Kong Polytechnic University and Hong Kong Construction Association, Hong Kong.
[6] EPD (Environment Protection Department). 2008. Government waste disposal facilities for construction waste and charge level. (http://www.epd.gov.hk/epd/misc/cdm/scheme.htm).
284 Proceedings of the International Conference on Solid Waste 2011- Moving Towards Sustainable Resource Management,
Hong Kong SAR, P.R. China, 2 – 6 May 2011
EFFECTS OF IONIC STRENGTH AND PH ON PHOSPHATE ADSORPTION BY MODIFIED CLAY MINERAL WASTE MATERIAL
Y.N. Jiang 1, H.D. Ruan 1*, S.Y. Lai 2, C.F. Yu 1, C.H. Lee 1, Z. Wu 1, X. Chen 1, S. He 1 1 Environmental Science Program, Division of Science and Technology, United International College,
Beijing Normal University-Hong Kong Baptist University, Zhuhai, P. R. China 2 Department of Chemistry, Hong Kong Baptist University, Kowloon Tong, Hong Kong
*Corresponding author: Tel: +86 756 3620 609, Fax: +86 756 3620 888, E-mail: [email protected]
ABSTRACT The effects of ionic strength and pH on phosphate (P) adsorption by modified clay mineral waste material (MCMWM) were investigated at pH values of 3, 5, 6, 7 and 9 with P concentrations of 10, 20, 40, 100 and 200 mg/L in solution. The P adsorption was rapid at the early stage with 95% of P in solution being adsorbed for the 10 mg/L P in solution at higher pH range within 0.5 h. The amount of P adsorbed increased with increasing ionic strength. The amount of P adsorbed increased as pH values increased from 3 to 9 for P adsorption at 10 mg/L. For other series of P concentrations in the solution, variable trends were obtained due to the rates of P adsorption being affected by pH associated with the effect of ionic strength. The maximum amounts of P adsorbed and the highest percentages of P adsorbed were obtained at pH 9 for all levels of P concentrations in solution, and at pH 7 for the lower P concentrations in solution. Calcium ion was found to form a bridge for P adsorption in solution and this has been conformed by the present study as the increases in the amount of P adsorbed at high pH values was related to the performance of Ca in favoring P to be adsorbed either onto the surfaces or incorporated into the structural bonds of MCMWM. Ionic strength, pH and modification process were the three important factors that influenced P adsorption in solution.
Keywords: Ionic strength, Modified clay mineral waste material (MCMWM), pH, Phosphate adsorption
Proceedings of the International Conference on Solid Waste 2011- Moving Towards Sustainable Resource Management,
Hong Kong SAR, P.R. China, 2 – 6 May 2011 285
CONSTRUCTION WASTES - TOWARDS SUSTAINABLE RESOURCE MANAGEMENT IN INDIA
S.K. Ghosh 1*, A. Aich 2 1 Mechanical Engineering, Jadavpur University &
International Society of Waste Management, Air and Water ( ISWMAW), Kolkata, India 2 Department of Municipal Affairs, Govt of West Bengal, Kolkata, India
* Corresponding author. Tel: +919830044464 , Fax: +9133 24146207, E-mail: [email protected]
ABSTRACT Indian construction industry is highly employment intensive and accounts for approximately 50% of the capital outlay in successive 5-Year Plans. The Projected investment in this industrial sector continues to show a growing trend. Construction activity leads to generation of solid wastes, which include sand, gravel, concrete, stone, bricks, wood, metal, glass, plastic etc. Out of 48 million metric tones (MMT) solid wastes generated in India, the contribution of construction and demolition (C&D) waste is nearly 25% annually. The management of C&D waste is a major concern for town planners due to it’s increasing quantum, continuing shortage of dumping sites, increase in transportation and disposal cost, poor awareness level of the stakeholders on C&D recycling and above all growing concern about pollution and environmental deterioration.
In India, nearly 50% of the C&D waste is being re-used and recycled constituting bricks, tiles, wood, metals, glass, plastic etc. but rest 50% are mostly used in landfills. C&D waste recycled products are not proved as financially viable as of now in India. It is common for large projects to pile such wastes on road, resulting traffic congestion. C&D waste from small generators like individual house, find its way into the nearby municipal bin/vat/waste storage depot, making the municipal waste heavy and degrading its quality for treatment like composting or energy recovery. In cities like Mumbai, Delhi and Kolkata efforts have been taken to initiate C&D waste management. Maharashtra has taken a pioneering step and notified the “Maharashtra Non-Biodegradable Solid Waste (Proper Scientific Collection, Sorting and Disposal in Areas of the Municipal Corporation) Rules, 2006” wherein reuse of this waste is included in the action plan. The Action Plan, inter alia, prescribes separate collection and disposal of debris and bulk waste. Each city needs to have its own mechanism for collection and disposal of waste from bulk waste producers and construction debris. Municipal Corporation of Greater Mumbai notified the “Construction, Demolition and De-silting waste (Management and Disposal) Rules”. The Municipal Corporation of Delhi has carried out a feasibility study on use of C&D waste in road and embankment construction. In Kolkata some assorted efforts in road construction has been implemented by recycling C&D wastes. Adequate data on C&D waste characteristics and management in India is not available. There are a number of ongoing research projects.
The existing municipal solid waste (management and handling) rules 2000 needed to address the C&D waste management. The awareness level and availability of customized green technology for C&D waste re-use and recycling need to be improved to make a sustainable move in India. Quality standards for the products thus produced have to be developed and monitored by Bureau of Indian Standards.
KeywordS : Quantum, Disposal cost, Degrading, Rules, Quality standards
Introduction
Wastes are materials which are discarded after use at the end of their intended life-span. Waste management is a collective activity involving segregation, collection, transportation, re-processing, recycling and disposal of various types of wastes. Sustainable waste management involves managing waste in an environmentally sound, socially satisfactory and a techno-economically viable manner. Sustainability of waste management, which involves laying emphasis on reuse, recycling and recovery of resources from dry and recyclable waste, is the key to providing a continuous and effective service that satisfies the needs of all the stakeholders and end users. Waste management differs for different types of wastes and for wastes in different geographical locations such as urban, rural and hilly areas. Construction and demolition waste is generated whenever any construction /demolition activity takes place, such as, building roads, bridges, fly over, subway, remodeling etc. It consists mostly of inert and non-biodegradable material such as concrete,
286 Proceedings of the International Conference on Solid Waste 2011- Moving Towards Sustainable Resource Management,
Hong Kong SAR, P.R. China, 2 – 6 May 2011
plaster, metal, wood, plastics etc. A part of this waste comes to the municipal stream. Indian construction industry is highly employment intensive and accounts for approximately 50% of the capital outlay in successive 5-Year Plans. The Projected investment in this industrial sector continues to show a growing trend.
Rapid economic growth is leading to urbanization and industrialization generating waste which is adversely effecting the environment. The percentage of India's population living in cities and urban areas from 14%, at the time of independence, has almost doubled to 27.8%. Urbanisation has shown faster rates of growth. India had crossed the billion marks at the turn of the century and is expected to accelerate even further and by 2021 India's population is expected to increase to 1.35 billion and 40% of Indians will be living in urban areas. According to the United Nation's estimate, about 90% of future growth will take place in cities. In 2030, when the global population will have risen from currently 6.5 to 8.2 billion people, about 60% of all humans will live in cities. The per capita of MSW generated daily, in India ranges from about 100 gms in small towns to 500 gms in large towns with an estimated increase @1%-1.33% annually.
The Central Pollution Control Board (CPCB) made a survey of 59 cities in India during the year 2004-05 to assess the existing status of MSW management which included 35 metro cities and 24 State capitals. Based on this study and on census data of 2008, the MSW generation in the country has been estimated to be 0.573 (MMT/d) in the year 2008. About 42 MMT of solid waste are generated annually by the urban population in India now. The average collection efficiency for MSW in Indian cities is nearly 72.5% and around 70% of the cities lack adequate waste transport capacity. The range and complexity of the issues involved in Waste Management is enormous in India.
The average collection efficiency of municipal solid waste ranges from 22% to 60%. The highest per capita waste generation was in the city of Kochi (0.67 kg/capita/day) and the lowest was (0.17-0.19 kg/c/day) in Kohima, Imphal and Nashik. The waste characterization showed that municipal solid wastes typically contain 51 % of organic waste, 17% recyclables, 11% hazardous and 21% inert.
Recycling of demolition waste was first carried out after the second World War in Germany to tackle the problem of disposing large amounts of demolition waste caused by the war and simultaneously generate raw material for reconstruction. Considerable research has been carried out in U.S.A, Japan, U.K, France, Germany, Denmark, India, China etc. for recycling concrete, masonry & bricks, bituminous and other constituents of waste from Construction Industry. These studies have demonstrated possibility of using construction waste to substitute new materials of recycling.
C & D Waste - Present Situation in India
Construction activity leads to generation of solid wastes, which include sand, gravel, concrete, stone, bricks, wood, metal, glass, plastic etc. Out of 48 million metric tones (MMT) solid wastes generated in India, the contribution of construction and demolition (C&D) waste is nearly 25% annually. The management of C&D waste is a major concern for town planners due to it’s increasing quantum, continuing shortage of dumping sites, increase in transportation and disposal cost, poor awareness level of the stakeholders on C&D recycling and above all growing concern about pollution and environmental deterioration.
In India, nearly 50% of the C&D waste is being re-used and recycled constituting bricks, tiles, wood, metals, glass, plastic etc. but rest 50% are mostly used in landfills. C&D waste recycled products are not proved as financially viable as of now in India. C&D wastes are heavy, having high density, often bulky and occupy considerable storage space either on the road or communal waste bin/container. It is common for large projects to pile such wastes on road, resulting traffic congestion. At present, private contractors remove this waste to privately owned low-lying land for a price or more commonly, dump it in an unauthorized manner along roads or other public land. Small quantities of construction and demolition waste usually get mixed with domestic waste due to lack of segregated storage and collection facilities. C&D waste from small generators like individual house, find its way into the nearby municipal bin/vat/waste storage depot, making the municipal waste heavy and degrading its quality for treatment like composting or energy recovery.
It is estimated that the construction industry in India generates about 10-12 million tons of waste annually. Projections for building material requirement of the housing sector indicate a shortage of aggregates to the extent of about 55,000 million cu.m. An additional 750 million cu.m. aggregates would be required for
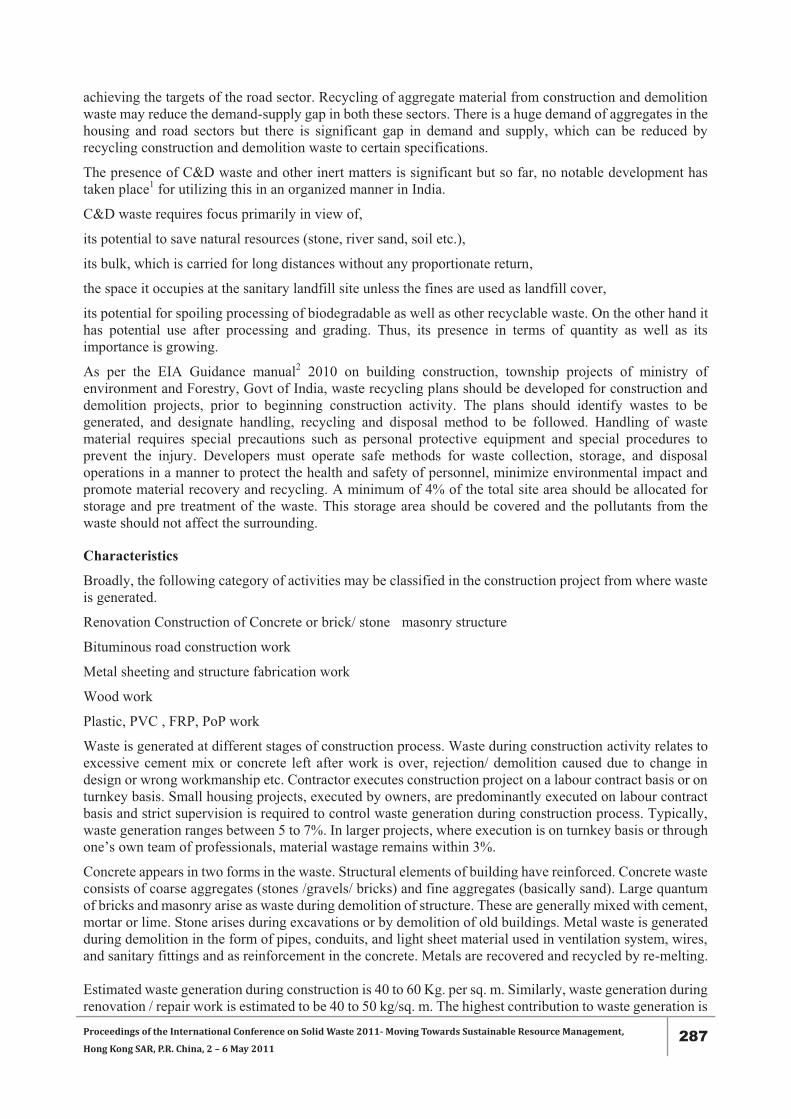
Proceedings of the International Conference on Solid Waste 2011- Moving Towards Sustainable Resource Management,
Hong Kong SAR, P.R. China, 2 – 6 May 2011 287
achieving the targets of the road sector. Recycling of aggregate material from construction and demolition waste may reduce the demand-supply gap in both these sectors. There is a huge demand of aggregates in the housing and road sectors but there is significant gap in demand and supply, which can be reduced by recycling construction and demolition waste to certain specifications.
The presence of C&D waste and other inert matters is significant but so far, no notable development has taken place1 for utilizing this in an organized manner in India.
C&D waste requires focus primarily in view of,
its potential to save natural resources (stone, river sand, soil etc.),
its bulk, which is carried for long distances without any proportionate return,
the space it occupies at the sanitary landfill site unless the fines are used as landfill cover,
its potential for spoiling processing of biodegradable as well as other recyclable waste. On the other hand it has potential use after processing and grading. Thus, its presence in terms of quantity as well as its importance is growing.
As per the EIA Guidance manual2 2010 on building construction, township projects of ministry of environment and Forestry, Govt of India, waste recycling plans should be developed for construction and demolition projects, prior to beginning construction activity. The plans should identify wastes to be generated, and designate handling, recycling and disposal method to be followed. Handling of waste material requires special precautions such as personal protective equipment and special procedures to prevent the injury. Developers must operate safe methods for waste collection, storage, and disposal operations in a manner to protect the health and safety of personnel, minimize environmental impact and promote material recovery and recycling. A minimum of 4% of the total site area should be allocated for storage and pre treatment of the waste. This storage area should be covered and the pollutants from the waste should not affect the surrounding.
Characteristics
Broadly, the following category of activities may be classified in the construction project from where waste is generated.
Renovation Construction of Concrete or brick/ stone masonry structure
Bituminous road construction work
Metal sheeting and structure fabrication work
Wood work
Plastic, PVC , FRP, PoP work
Waste is generated at different stages of construction process. Waste during construction activity relates to excessive cement mix or concrete left after work is over, rejection/ demolition caused due to change in design or wrong workmanship etc. Contractor executes construction project on a labour contract basis or on turnkey basis. Small housing projects, executed by owners, are predominantly executed on labour contract basis and strict supervision is required to control waste generation during construction process. Typically, waste generation ranges between 5 to 7%. In larger projects, where execution is on turnkey basis or through one’s own team of professionals, material wastage remains within 3%.
Concrete appears in two forms in the waste. Structural elements of building have reinforced. Concrete waste consists of coarse aggregates (stones /gravels/ bricks) and fine aggregates (basically sand). Large quantum of bricks and masonry arise as waste during demolition of structure. These are generally mixed with cement, mortar or lime. Stone arises during excavations or by demolition of old buildings. Metal waste is generated during demolition in the form of pipes, conduits, and light sheet material used in ventilation system, wires, and sanitary fittings and as reinforcement in the concrete. Metals are recovered and recycled by re-melting. Estimated waste generation during construction is 40 to 60 Kg. per sq. m. Similarly, waste generation during renovation / repair work is estimated to be 40 to 50 kg/sq. m. The highest contribution to waste generation is

288 Proceedings of the International Conference on Solid Waste 2011- Moving Towards Sustainable Resource Management,
Hong Kong SAR, P.R. China, 2 – 6 May 2011
due to demolition of buildings. Demolition of Pucca and Semi-Pucca buildings, on an average generates 500 & 300 kg/ sq.m. of waste respectively. C&D waste is complex due to the different types of building materials being used but in general may comprise the following materials:
Major components
Cement concrete
Bricks
Cement plaster
Steel (from RCC, door/window frames, roofing support, railings of staircase etc.)
Rubble
Stone (marble, granite, sand stone)
Timber/wood (especially demolition of old buildings)
Minor components
Conduits (iron, plastic)
Pipes (GI, iron, plastic)
Electrical fixtures (copper / aluminum wiring, wooden baton, bakelite/plastic switches, wire insulation)
Panels (wooden, laminated)
Others (glazed tiles, glass panes, polyethylene sheets)
Recycling & Reuse of C&D Waste at present in India
While some of the items like bricks, tiles, wood, metal etc. are re-used and recycled, constituting about 50% of the C&D waste. The fine dust like material (fines) from C&D waste is presently not being used and thus wasted. In more than 95% cases wastes like Bricks, metal, wood, plastics and Glass of C&D wastes have demand in market. There are contractors whose business focus is only such C&D. The return on those waste are not very low.
The use of these materials basically depends on their separation and condition of the separated material. A majority of these materials are durable3 and therefore, have a high potential of reuse. It would, however, be desirable to have quality standards for the recycled materials. Construction and demolition waste can be used in the following manner. But partially these are being utilized in the same way as under.
Reuse (at site) of bricks, stone slabs, timber, conduits, piping railings etc. to the extent possible and depending upon their condition.
Sale / auction of material which can not be used at the site due to design constraint or change in design.
Plastics, broken glass, scrap metal etc. can be used by recycling industries.
Rubble, brick bats, broken plaster/concrete pieces etc. can be used for building activity, such as, leveling, under coat of lanes where the traffic does not constitute of heavy moving loads.
Larger unusable pieces can be sent for filling up low-lying areas.
Fine material, such as, sand, dust etc. can be used as cover material over sanitary landfill.
Basic method of recycling of concrete and masonry waste is to crush the debris to produce a granular product of given particle size. Plants for processing of demolition waste are differentiated based on mobility, type of crusher and process of separation. There are three types of recycling plants Viz. Mobile, Semi-Mobile and Stationary plant. In the Mobile plant, the material is crushed and screened and ferrous impurities are separated through magnetic separation. The plant is transported to the demolition site itself and is suited to process only non-contaminated concrete or masonry waste.
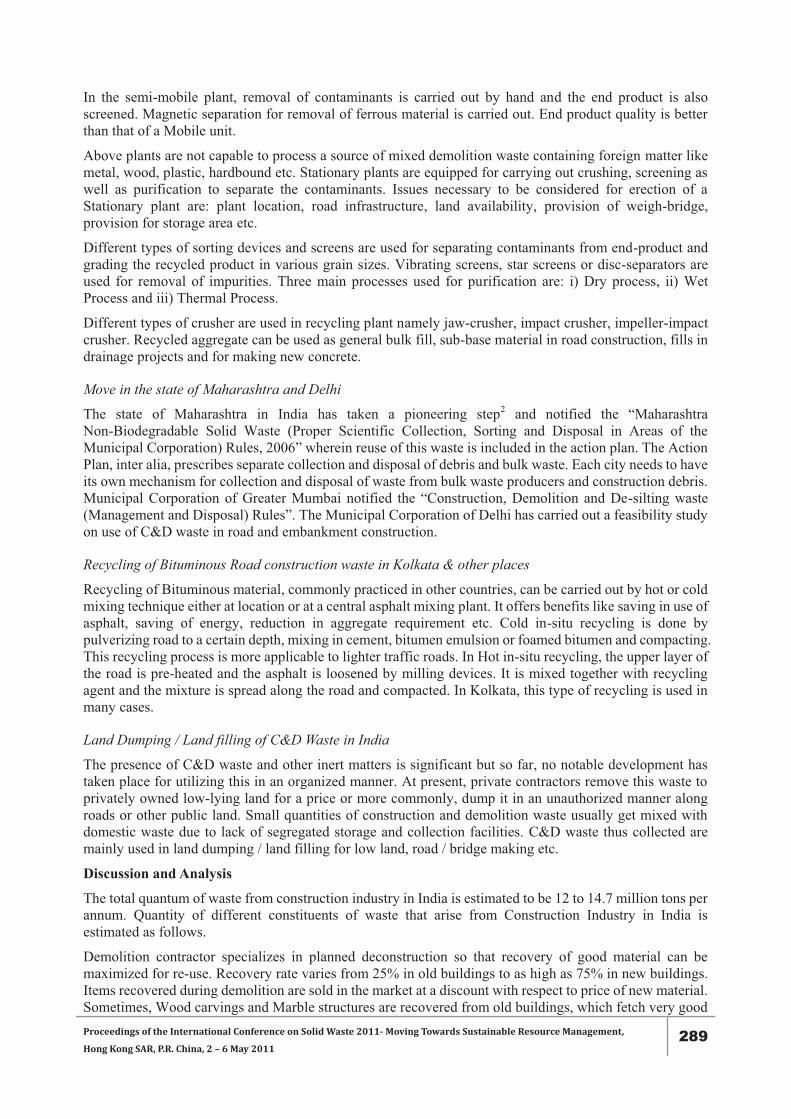
Proceedings of the International Conference on Solid Waste 2011- Moving Towards Sustainable Resource Management,
Hong Kong SAR, P.R. China, 2 – 6 May 2011 289
In the semi-mobile plant, removal of contaminants is carried out by hand and the end product is also screened. Magnetic separation for removal of ferrous material is carried out. End product quality is better than that of a Mobile unit.
Above plants are not capable to process a source of mixed demolition waste containing foreign matter like metal, wood, plastic, hardbound etc. Stationary plants are equipped for carrying out crushing, screening as well as purification to separate the contaminants. Issues necessary to be considered for erection of a Stationary plant are: plant location, road infrastructure, land availability, provision of weigh-bridge, provision for storage area etc.
Different types of sorting devices and screens are used for separating contaminants from end-product and grading the recycled product in various grain sizes. Vibrating screens, star screens or disc-separators are used for removal of impurities. Three main processes used for purification are: i) Dry process, ii) Wet Process and iii) Thermal Process.
Different types of crusher are used in recycling plant namely jaw-crusher, impact crusher, impeller-impact crusher. Recycled aggregate can be used as general bulk fill, sub-base material in road construction, fills in drainage projects and for making new concrete.
Move in the state of Maharashtra and Delhi
The state of Maharashtra in India has taken a pioneering step2 and notified the “Maharashtra Non-Biodegradable Solid Waste (Proper Scientific Collection, Sorting and Disposal in Areas of the Municipal Corporation) Rules, 2006” wherein reuse of this waste is included in the action plan. The Action Plan, inter alia, prescribes separate collection and disposal of debris and bulk waste. Each city needs to have its own mechanism for collection and disposal of waste from bulk waste producers and construction debris. Municipal Corporation of Greater Mumbai notified the “Construction, Demolition and De-silting waste (Management and Disposal) Rules”. The Municipal Corporation of Delhi has carried out a feasibility study on use of C&D waste in road and embankment construction.
Recycling of Bituminous Road construction waste in Kolkata & other places
Recycling of Bituminous material, commonly practiced in other countries, can be carried out by hot or cold mixing technique either at location or at a central asphalt mixing plant. It offers benefits like saving in use of asphalt, saving of energy, reduction in aggregate requirement etc. Cold in-situ recycling is done by pulverizing road to a certain depth, mixing in cement, bitumen emulsion or foamed bitumen and compacting. This recycling process is more applicable to lighter traffic roads. In Hot in-situ recycling, the upper layer of the road is pre-heated and the asphalt is loosened by milling devices. It is mixed together with recycling agent and the mixture is spread along the road and compacted. In Kolkata, this type of recycling is used in many cases.
Land Dumping / Land filling of C&D Waste in India
The presence of C&D waste and other inert matters is significant but so far, no notable development has taken place for utilizing this in an organized manner. At present, private contractors remove this waste to privately owned low-lying land for a price or more commonly, dump it in an unauthorized manner along roads or other public land. Small quantities of construction and demolition waste usually get mixed with domestic waste due to lack of segregated storage and collection facilities. C&D waste thus collected are mainly used in land dumping / land filling for low land, road / bridge making etc.
Discussion and Analysis The total quantum of waste from construction industry in India is estimated to be 12 to 14.7 million tons per annum. Quantity of different constituents of waste that arise from Construction Industry in India is estimated as follows.
Demolition contractor specializes in planned deconstruction so that recovery of good material can be maximized for re-use. Recovery rate varies from 25% in old buildings to as high as 75% in new buildings. Items recovered during demolition are sold in the market at a discount with respect to price of new material. Sometimes, Wood carvings and Marble structures are recovered from old buildings, which fetch very good
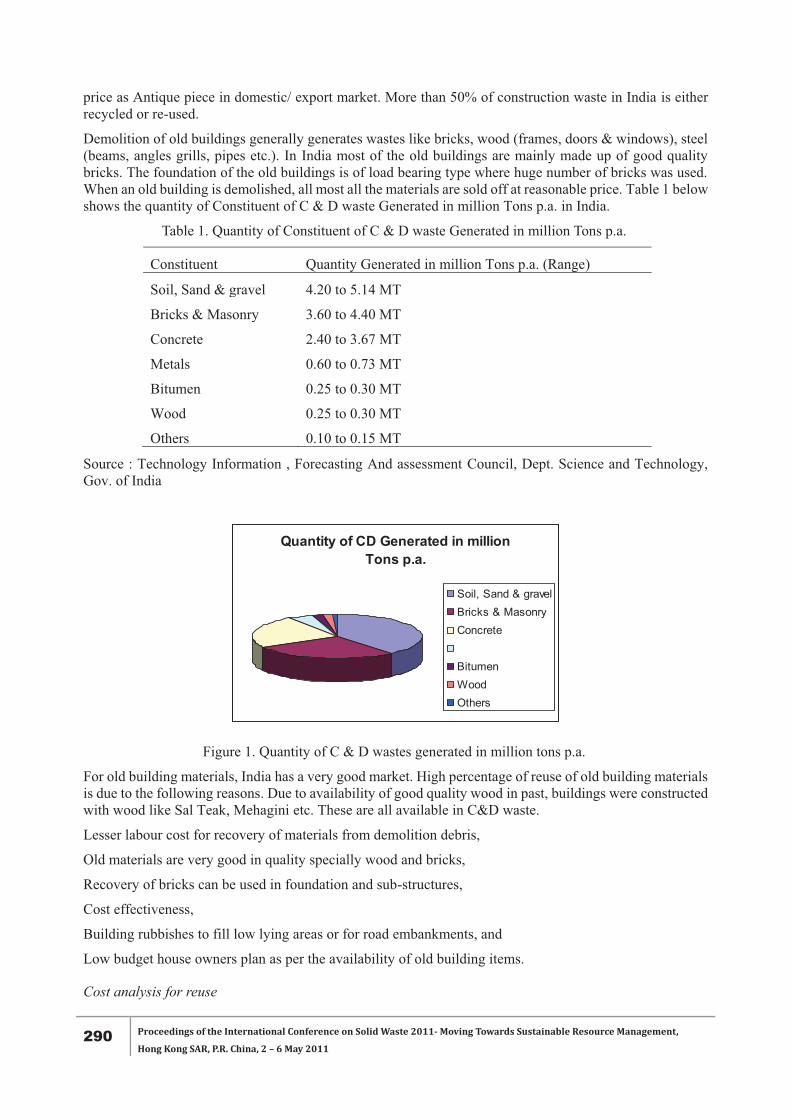
290 Proceedings of the International Conference on Solid Waste 2011- Moving Towards Sustainable Resource Management,
Hong Kong SAR, P.R. China, 2 – 6 May 2011
price as Antique piece in domestic/ export market. More than 50% of construction waste in India is either recycled or re-used.
Demolition of old buildings generally generates wastes like bricks, wood (frames, doors & windows), steel (beams, angles grills, pipes etc.). In India most of the old buildings are mainly made up of good quality bricks. The foundation of the old buildings is of load bearing type where huge number of bricks was used. When an old building is demolished, all most all the materials are sold off at reasonable price. Table 1 below shows the quantity of Constituent of C & D waste Generated in million Tons p.a. in India.
Table 1. Quantity of Constituent of C & D waste Generated in million Tons p.a.
Constituent Quantity Generated in million Tons p.a. (Range)
Soil, Sand & gravel 4.20 to 5.14 MT
Bricks & Masonry 3.60 to 4.40 MT
Concrete 2.40 to 3.67 MT
Metals 0.60 to 0.73 MT
Bitumen 0.25 to 0.30 MT
Wood 0.25 to 0.30 MT
Others 0.10 to 0.15 MT
Source : Technology Information , Forecasting And assessment Council, Dept. Science and Technology, Gov. of India
Figure 1. Quantity of C & D wastes generated in million tons p.a. For old building materials, India has a very good market. High percentage of reuse of old building materials is due to the following reasons. Due to availability of good quality wood in past, buildings were constructed with wood like Sal Teak, Mehagini etc. These are all available in C&D waste.
Lesser labour cost for recovery of materials from demolition debris,
Old materials are very good in quality specially wood and bricks,
Recovery of bricks can be used in foundation and sub-structures,
Cost effectiveness,
Building rubbishes to fill low lying areas or for road embankments, and
Low budget house owners plan as per the availability of old building items.
Cost analysis for reuse
Quantity of CD Generated in million Tons p.a.
Soil, Sand & gravelBricks & MasonryConcrete
BitumenWoodOthers
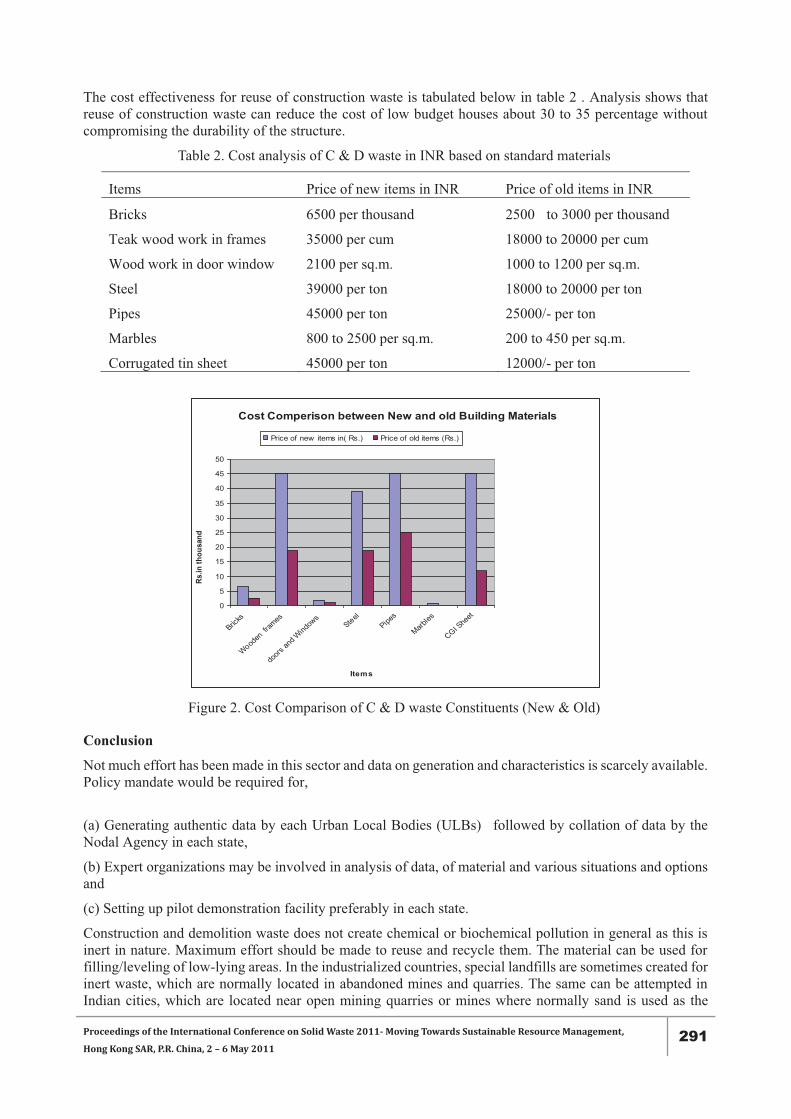
Proceedings of the International Conference on Solid Waste 2011- Moving Towards Sustainable Resource Management,
Hong Kong SAR, P.R. China, 2 – 6 May 2011 291
The cost effectiveness for reuse of construction waste is tabulated below in table 2 . Analysis shows that reuse of construction waste can reduce the cost of low budget houses about 30 to 35 percentage without compromising the durability of the structure.
Table 2. Cost analysis of C & D waste in INR based on standard materials
Items Price of new items in INR Price of old items in INR
Bricks 6500 per thousand 2500 to 3000 per thousand
Teak wood work in frames 35000 per cum 18000 to 20000 per cum
Wood work in door window 2100 per sq.m. 1000 to 1200 per sq.m.
Steel 39000 per ton 18000 to 20000 per ton
Pipes 45000 per ton 25000/- per ton
Marbles 800 to 2500 per sq.m. 200 to 450 per sq.m.
Corrugated tin sheet 45000 per ton 12000/- per ton
Figure 2. Cost Comparison of C & D waste Constituents (New & Old)
Conclusion
Not much effort has been made in this sector and data on generation and characteristics is scarcely available. Policy mandate would be required for, (a) Generating authentic data by each Urban Local Bodies (ULBs) followed by collation of data by the Nodal Agency in each state,
(b) Expert organizations may be involved in analysis of data, of material and various situations and options and
(c) Setting up pilot demonstration facility preferably in each state.
Construction and demolition waste does not create chemical or biochemical pollution in general as this is inert in nature. Maximum effort should be made to reuse and recycle them. The material can be used for filling/leveling of low-lying areas. In the industrialized countries, special landfills are sometimes created for inert waste, which are normally located in abandoned mines and quarries. The same can be attempted in Indian cities, which are located near open mining quarries or mines where normally sand is used as the
Cost Comperison between New and old Building Materials
0
5
10
15
20
25
30
35
40
45
50
Bricks
Wooden
fram
es
doors
and W
indow
sSteel
Pipes
Marbles
CGI She
et
Items
Rs.in
thou
sand
Price of new items in( Rs.) Price of old items (Rs.)
292 Proceedings of the International Conference on Solid Waste 2011- Moving Towards Sustainable Resource Management,
Hong Kong SAR, P.R. China, 2 – 6 May 2011
filling material. However, proper sampling of the material for its physical and chemical characteristics has to be done for evaluating its use under the given circumstances. Of course, transportation cost is a point of constraint.
The concerned civic authorities can make a plan for gainful use of construction debris. The low lying areas may be mapped which need to be filled up for the purpose of building activity and a contingency plan may be prepared. Disposal of C&D waste may be made using the mapping whenever a demolition or construction activity takes place.
There should be a proper institutional mechanism to take care of the collection, transportation, intermediate storage (if necessary), utilisation and disposal of the construction and demolition waste. Appropriate rule should be framed and implemented. It is essential that proper accountability is fixed and official information is readily available regarding day to day situation. Private enterprise can be gainfully employed for the collection and transportation of the waste. A public-private–partnership (PPP) scheme may be a possible mechanism of implementation of C&D waste management in India.
C&D waste requires focus primarily in view of (i) its potential to save natural resources (stone, river sand, soil etc.), (ii) its bulk, which is carried for long distances without any proportionate return (iii) the space it occupies at the sanitary landfill site unless the fines are used as landfill cover, (iv) its potential for spoiling processing of biodegradable as well as other recyclable waste. On the other hand it has potential use after processing and grading.
Followings are the recommendations made to the government of India in the Manual on MSW Management, Ministry of Urban Development, Govt of India.
Data should be generated on C&D Waste generation and its characteristics.
Separation of C&D waste should be promoted at source and an institutional mechanism for waste collection should be established involving the informal sector who can be trained to separate the waste into categories and also do some amount of use, reuse and reprocessing like making tiles from crushed construction debris.
Charges should be levied on C&D waste generators.
Environmentally friendly technologies should be adopted for waste utilization of C&D.
Standards for C&D should be formulated for waste utilization.
Technical and institutional support should be made available for good data analysis and for evolving ways for use of C&D waste.
Policy support, guidelines and regulatory arrangement should be made.
Amendment should be made to the existing MSWM Rules 2000 to include and address the C&D waste with guidelines for its collection, utilization and safe disposal.
References 1. Report of the Committee to Evolve Road Map on Management of Wastes in India, Ministry of
Environment and Forests, New Delhi, March 2010. 2. Manual on MSW Management, Ministry of Urban Development, 2005, New Delhi. 3. Environmental Impact Assessment Guidance Manual, Ministry of Environment and Forests,
New Delhi, February 2010.