uc marine council santa barbara coastal lter - nsf nutrient export coefficient modeling in...
Post on 19-Dec-2015
215 views
TRANSCRIPT

UC Marine CouncilUC Marine Council Santa Barbara Coastal LTER - NSF
Nutrient Export Coefficient Modeling in Nutrient Export Coefficient Modeling in Mediterranean Coastal StreamsMediterranean Coastal Streams
Timothy H. Robinson, Al Leydecker, Arturo A. Keller and John M. MelackTimothy H. Robinson, Al Leydecker, Arturo A. Keller and John M. MelackBren School of Environmental Science & ManagementBren School of Environmental Science & Management
University of California, Santa Barbara, USAUniversity of California, Santa Barbara, USA
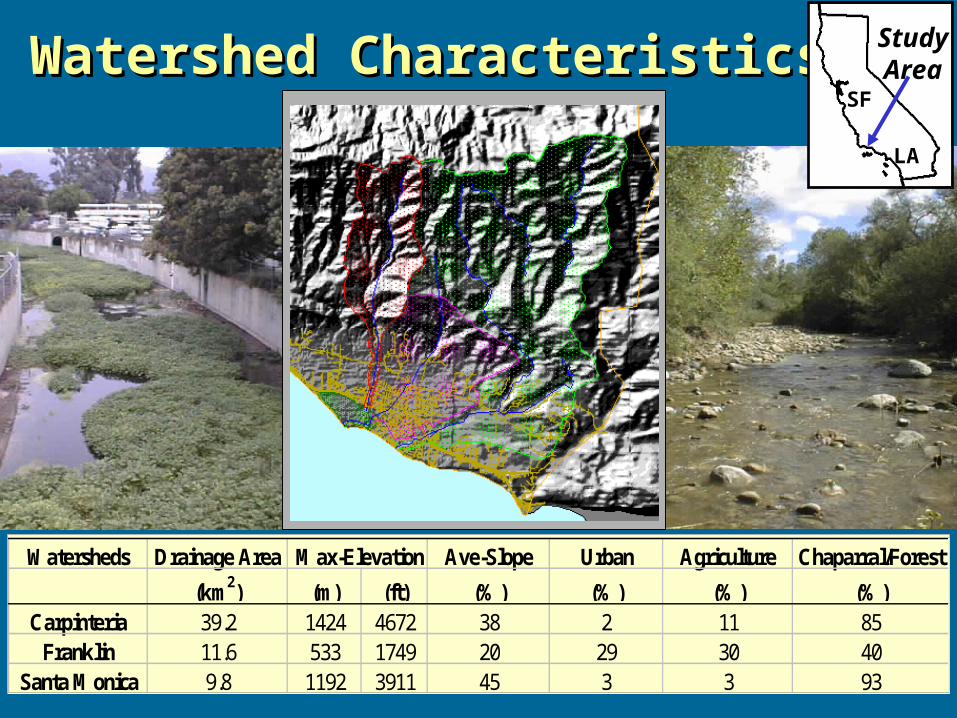
Watersheds Drainage Area Max-Elevation Ave-Slope Urban Agriculture Chaparral/Forest
(km2) (m) (ft) (%) (%) (%) (%)Carpinteria 39.2 1424 4672 38 2 11 85
Franklin 11.6 533 1749 20 29 30 40Santa Monica 9.8 1192 3911 45 3 3 93
Watershed CharacteristicsWatershed Characteristics StudyArea
LA
SF

Climatic Regime
0
5
10
15
20
25
Sept
OctNov
Dec Jan
Feb Mar
AprM
ayJu
nJu
lAug
Avg
Mo
nth
ly P
reci
pit
atio
n,
cm Downtown Santa Barbara, 30 mSan Marcos Pass, 671 m
0
50
100
150
200
250
1955 1960 1965 1970 1975 1980 1985 1990 1995 2000
An
nu
al
Ra
infa
ll,
cm
Downtown Santa Barbara, 30 mSan Marcos Pass, 671 m

Analyzing for: Ammonium (NH4
+), Nitrate (NO3-), Total Dissolve
Nitrogen (TDN), Phosphate (PO43-), Total Particulate
Carbon (TPC), Total Particulate Nitrogen (TPN), Total Particulate Phosphate (TPP), Total Suspended Sediments (TSS) and major ions at selected locations
Specifics:
Frequency: • Regular sampling:
Once every 2 weeks during the dry seasonOnce a week during the wet season
• Storm sampling:Every hour on the rising limb of the hydrographEvery 2-4 hours on the falling limb of the hydrograph
Project duration: WY2001, WY2002 and WY2003

Annual Basin Nutrient ExportWater Year 2001 and 2002
0
2
4
6
8
10
Franklin Carpinteria Santa Monica
Nit
rate
Exp
ort
(kg
-N h
a-1yr
-1)
20012002
0.0
0.5
1.0
1.5
Franklin Carpinteria Santa Monica
Ph
os
ph
ate
Ex
po
rt (
kg
-P h
a-1
yr-1
) 2001
2002
0
2
4
6
8
Franklin Carpinteria Santa Monica
PO
N E
xp
ort
(k
g-N
ha
-1y
r-1)
20012002
0
5
10
15
20
25
Franklin Carpinteria Santa Monica
An
nu
al D
isc
ha
rge
(c
m y
r-1)
2001
2002

Abbreviation key:• L – Nutrient Export (loss) (mass area-1 time-1)• E – Export Coefficient Function• – Watershed Response Variable• LU – Land use• S – Soils
Nutrient Export Coefficient ModelNutrient Export Coefficient Model(NEC-M)(NEC-M)
• P – Precipitation • A – Land Use Area • I – Nutrient input rate• K – Down Stream Distance-Decay Function• k and – Coefficients
• t – Time• d – Distance Traveled Downstream • v – Average Velocity Traveled Downstream• Datm – Atmospheric deposition
AAGISGISEE
IIInterviewInterview
IILiteratureLiterature
KKLiteratureLiterature
)(LUE tkeK
kk ttd/vd/v
LULUGISGIS
DKIAEL atmiiii
DDatmatm
LTERLTER
DDatmatmLiteratureLiterature
S+PS+P
L

Sampling Site Locations
WY2001WY2002WY2003
Land Use:•Chaparral/Forest•Avocado•Greenhouse•Nursery•Residential•Commercial

Spatial Extent of Land Use Class (A)
Land Use Area % Target % Secondary % Impervious
# Class (hectares) Land Use Land Use Surface
1 Chaparral/Forest 1873 100 0 0
1 Chaparral/Forest 1210 100 0 0
1 Chaparral/Forest 902 100 0 0
2 Avocado 747 36 42 (Chap/For) 7
3 Greenhouse 17 97 3 (Chap/For) 68
4 Nursery 80 47 21 (Avo) / 12 (Chap/For) 11
5 Residential 6 100 0 30
6 Commercial 32 91 9 (Chap/For) 77
6

Nutrient Export WY2002
Hourly time-step Hydrology:
• Pressure Transducer• Observed stage• HEC-RAS
Stream Chemistry Modeling
0.0
0.2
0.4
0.6
0.8
1.0
1.2
1.4
9/16 12/25 4/4 7/13 10/21
Cu
mu
lati
ve E
xpo
rt (
kmo
ls)
0.00
0.05
0.10
0.15
0.20
0.25
0.30
0.35
0.40
Flo
w (
m3 s-1
)
NH4
NO3
PO4
flow
Chaparral/Forest

E – Export Coefficient Function – Watershed Response VariableS – SoilsP – Precipitation
Nutrient Export Coefficient (E)Nutrient Export Coefficient (E)
EE
LUE LULUGISGIS S+P S+P
0
500
1000
1500
2000
2500
Franklin Carpinteria Santa Monica
nit
rate
(µM
)
baseflow
stormflow
0
10
20
30
40
50
Franklin Carpinteria Santa Monica
ph
osp
hat
e (S
RP
, µM
)
baseflow
stormflow
1
10
100
1000
10000
5-Jan 15-Jan 25-Jan 4-Feb 14-Feb 24-Feb 6-Mar
cu
mu
lati
ve
ex
po
rt(k
mo
l)
0
1
2
3
4
5
6
7
8
dis
ch
arg
e (
m3
s-1)
flow
TDN
NO3
PO4
NH4
WY 2001 Franklin Creek

Scaling the Export Coefficient ()
• Storm to Storm relationships.
• Volume Weighted Mean Concentrations vs. Cumulative Rainfall.
• Volume Weighted Mean Concentrations vs. Rainfall/Runoff Ratio.
• Topographic Index (TI): variable source area.
• Antecedent Soil Moisture Content: SSURGO soils data, texture->porosity, infiltration rates, evapotranspiration rates, depth to impervious layer, etc.
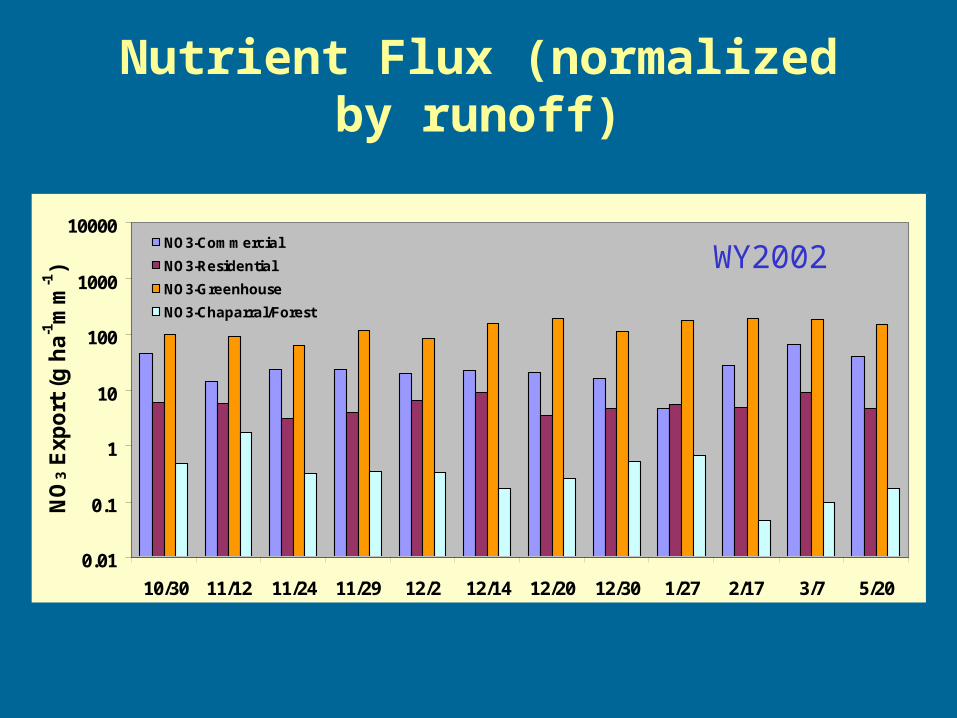
Nutrient Flux (normalized by runoff)
0.01
0.1
1
10
100
1000
10000
10/30 11/12 11/24 11/29 12/2 12/14 12/20 12/30 1/27 2/17 3/7 5/20
NO
3 E
xpo
rt (
g h
a-1m
m-1)
NO3-Commercial
NO3-Residential
NO3-Greenhouse
NO3-Chaparral/Forest
WY2002

y = 227.45Ln(x) + 1046.6
R 2 = 0.52
y = -91.22Ln(x) + 114.48
R 2 = 0.71
0
500
1000
1500
0.0 0.1 0.2 0.3 0.4 0.5 0.6 0.7 0.8 0.9 1.0
Runoff/Rainfall Ratio
VW
M C
on
ce
ntr
ati
on
(µ
M)
NO3
PO4
Greenhouse
VWM vs. Runoff/RainfallVWM vs. Runoff/Rainfall

Conclusions
• High frequency storm sampling is critical.
• Nutrient Export Coefficients in Mediterranean climates must be a function that is related to the watershed runoff response and not a single annual term.
• Analysis of the final year of data will solidify scaling techniques in NEC-M.
• Future work: implement the model in the study watersheds and test its portability in a catchment outside of the area (e.g. Spain).
QuestionsQuestions
Thank you !Thank you !

Nutrient Watershed Flux
0
2,000
4,000
6,000
8,000
10,000
12,000
Santa Monica Franklin Carpinteria
Nu
trie
nt
Lo
adin
g (
kg/y
r)
NH4-N
NO3-N
DON-N
PO4-P

Linkage – Stream Network & Chemistry
Arc Hydro Geodatabase: geometric network representation of the connectivity of surface water
• HydroNetwork• HydroEdge• HydroJunctions• SchematicLinks+Nodes• HydroPointEvent• HydroLineEvent
NH4 NO3 PO4
Location ID LTER # date time uM uM uMCarpinteria @ Calle Ocho CP00 30001 3-Oct-02 18:50 2.8 257.8 1.9Carpinteria @ Vedder's CP05 30002 3-Oct-02 12:20 0.5 26.3 3.4Carpinteria @ 6 St. manhole CP20 30003 3-Oct-02 19:10 1.7 139.3 3.6Carpinteria @ Casitas Village drain CP30 30004 3-Oct-02 18:40 114.0 0.7 187.5Franklin @ Carpinteria Ave FK00 30005 3-Oct-02 20:05 5.2 1712.9 6.0Franklin @ Meadow View ramp FK03 30006 3-Oct-02 19:50 0.7 2227.2 2.9Franklin @ Meadow View drain FK04 30007 3-Oct-02 19:55 5.3 666.7 125.5Franklin @ Girls Club on Foothill FK06 30008 3-Oct-02 19:40 1.0 2180.7 1.1
Drainage Network + Sampling Points
Visual Basic for Application:MS Excel/Access:
DEM analysis

Measuring Stream Flow
Staff Gauges and Pressure TransducersSurveying the Cross-Sections
Developing Rating Curves

Nutrient LoadingDevelopment of a Nutrient Flux Model
StreamChemistry
ObservedStage
PTStage
(5-min)
ObservedFlow
PTFlow
(5-min)
StreamChemistry
Stage-Discharge Relationship(HEC-RAS)
Flow(hourly)Flow
(hourly)
StreamChemistry(hourly)
Identify: Baseflow, Peakflow..
Nut. Conc.
Flow(hourly)
StreamChemistry
(model/obs)
Nut. Flux(conc/flow)
AnnualAnnualNutrient LoadingNutrient Loading
ObservedFlow
(hourly)
Linear extrapolation

Precipitation WY2002
Cumulative Storm Storm Rainfall Rainfall Duration(date) (mm) (hours)10/30 10.2 711/12 45.7* 3811/24 40.6 411/29 10.2 1012/2 7.6 512/14 5.1 312/20 10.2 612/30 22.9* 341/27 12.7 52/17 10.2 153/7 5.1 65/20 5.1 2
* Two short pulses during the time period.

Nutrient Flux (normalized by runoff)
0.1
1
10
100
1000
10/30 11/12 11/24 11/29 12/2 12/14 12/20 12/30 1/27 2/17 3/7 5/20
PO
4 E
xpo
rt (
g h
a-1m
m-1)
PO4-Commercial
PO4-Residential
PO4-Greenhouse
PO4-Chaparral/Forest
WY2002

Attenuation (K)Attenuation (K)
KKLiteratureLiterature
tkeK
kk ttD/VD/V
• Distance from stream • Distance from basin outlet• Type of riparian corridor• Dispersal Area and Trapping
Likelihood (BI Index)

VWM vs. Cumulative RainfallVWM vs. Cumulative RainfallVWM - Volume Weighted Mean
Trendline for NO3y = 3.9245x + 463.75
R2 = 0.42
0
500
1000
1500
0 20 40 60 80 100 120 140 160 180 200
Cumulative Rainfall (mm)
VW
M C
on
ce
ntr
ati
on
(µ
M) NO3
PO4
Greenhouse

VWM vs. Cumulative RainfallVWM vs. Cumulative Rainfall
R 2 = 0.38
0
20
40
60
80
100
0 20 40 60 80 100 120 140 160 180 200
Cumulative Rainfall (mm)
VW
M C
on
ce
ntr
ati
on
(µ
M) NO3
PO4
Residential
0
500
1000
1500
0 20 40 60 80 100 120 140 160 180 200
VWM - Volume Weighted Mean

VWM vs. Runoff/RainfallVWM vs. Runoff/Rainfall
y = 0.1293x -0.7348
R 2 = 0.5155
0
5
10
15
0.00 0.01 0.02 0.03 0.04 0.05 0.06 0.07 0.08
Runoff/Rainfall Ratio
VW
M C
on
ce
ntr
ati
on
(µ
M)
NO3
PO4
Chaparral/Forest