lter meeting 2012
TRANSCRIPT
Slide 1 of 11
Changes in zooplankton phenology at stn MC 1984-2010
Heather Anne Wright
LTER-MC MareChiara meeting
18. October.2012
Changes in zooplankton phenology [email protected]
Slide 2 of 11
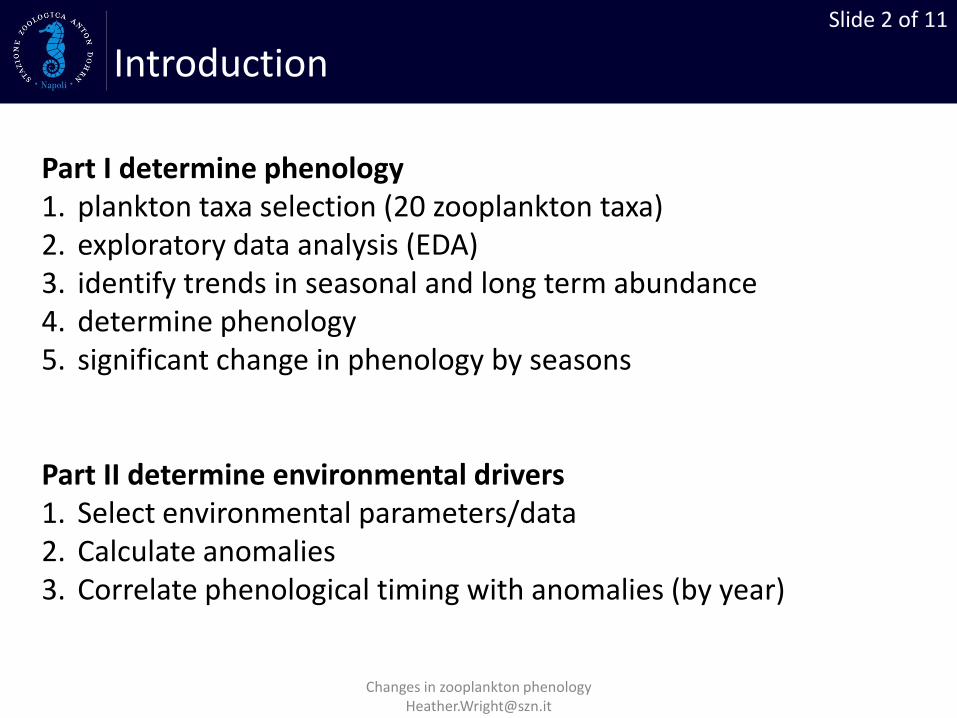
Part I determine phenology 1. plankton taxa selection (20 zooplankton taxa) 2. exploratory data analysis (EDA) 3. identify trends in seasonal and long term abundance 4. determine phenology 5. significant change in phenology by seasons Part II determine environmental drivers 1. Select environmental parameters/data 2. Calculate anomalies 3. Correlate phenological timing with anomalies (by year)
Changes in zooplankton phenology [email protected]
Introduction
Slide 3 of 11
Changes in zooplankton phenology [email protected]
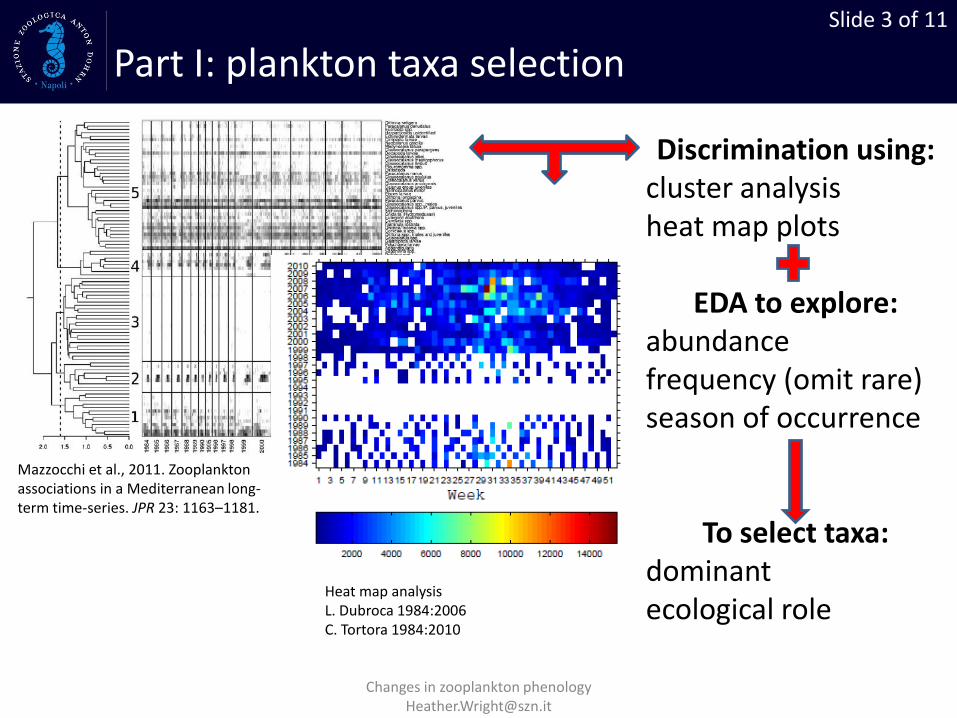
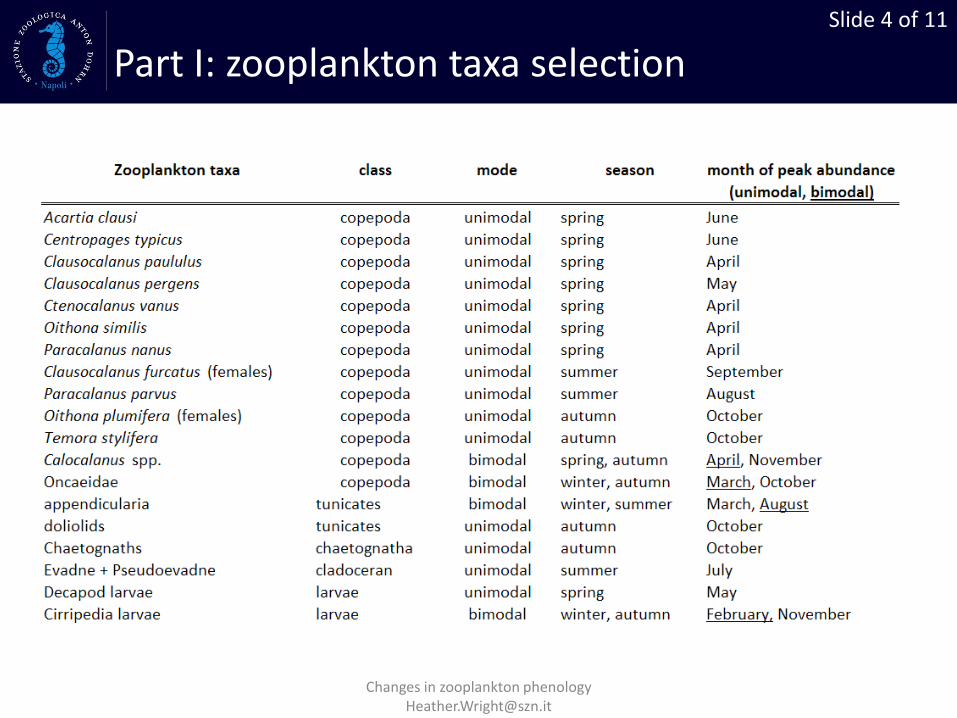
Part I: plankton taxa selection
Mazzocchi et al., 2011. Zooplankton associations in a Mediterranean long-term time-series. JPR 23: 1163–1181.
Heat map analysis L. Dubroca 1984:2006 C. Tortora 1984:2010
Discrimination using: cluster analysis heat map plots
EDA to explore:
abundance frequency (omit rare) season of occurrence
To select taxa:
dominant ecological role
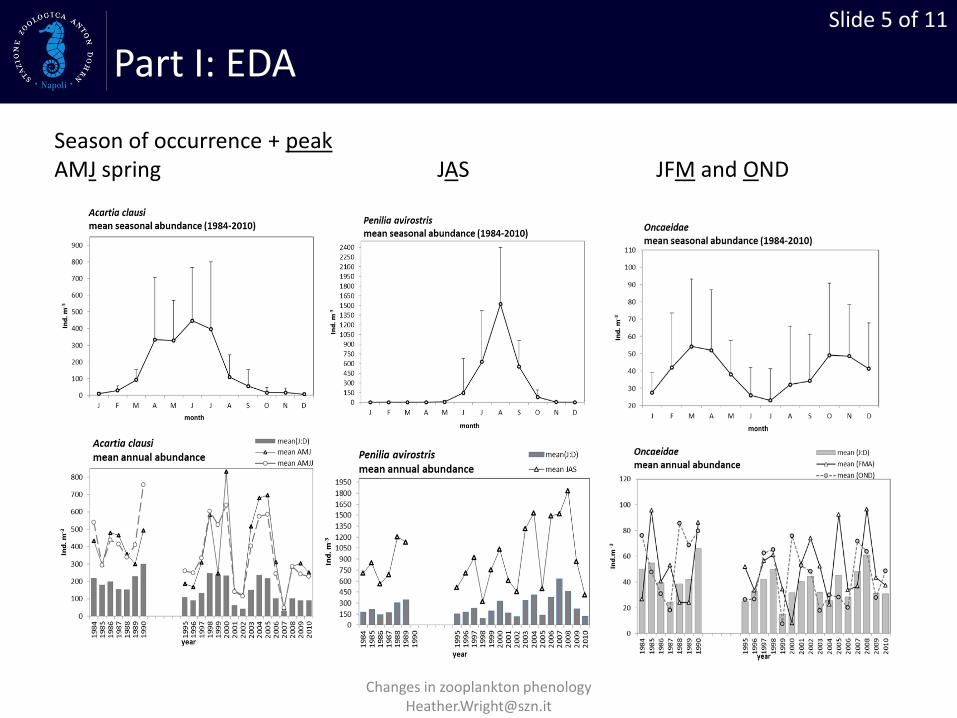
Slide 5 of 11
Changes in zooplankton phenology [email protected]
Part I: EDA
Season of occurrence + peak AMJ spring JAS JFM and OND
Slide 6 of 11
Changes in zooplankton phenology [email protected]
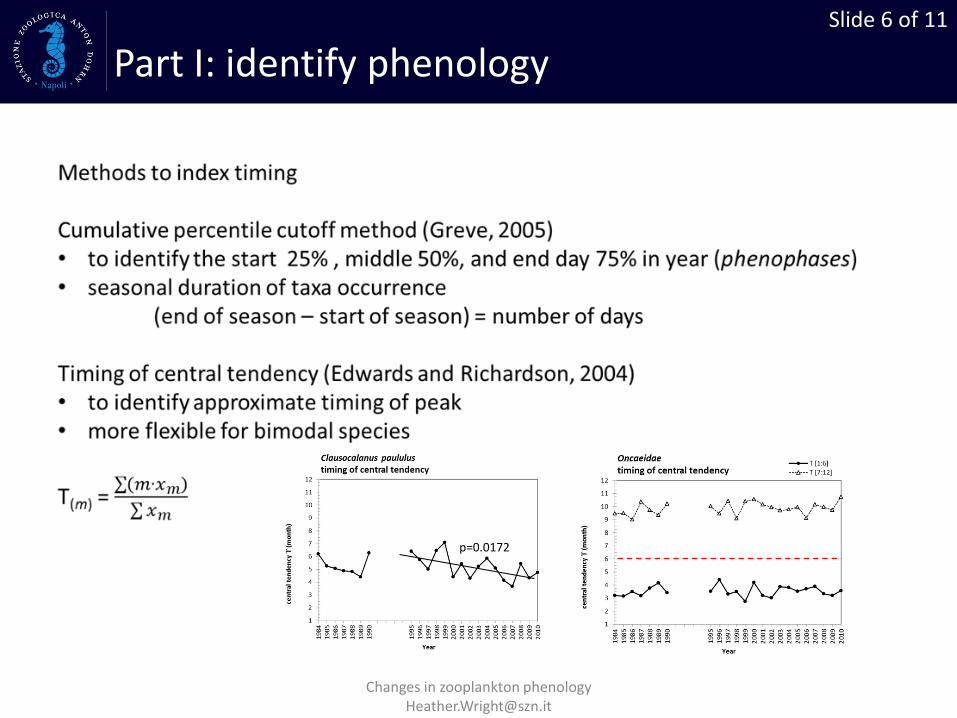
Part I: identify phenology
p=0.0172
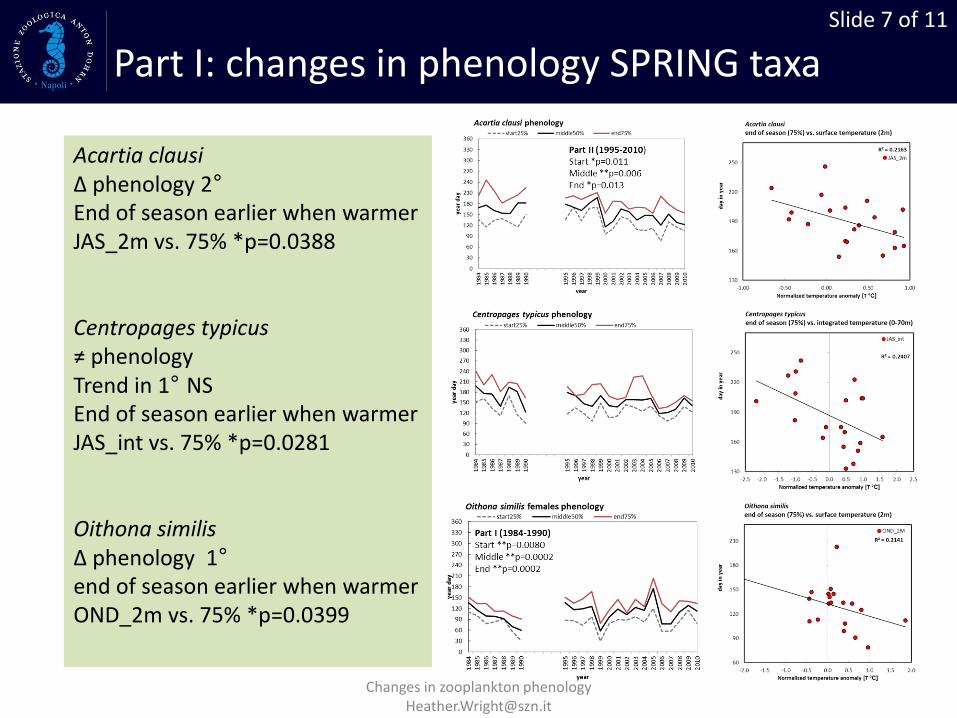
Slide 7 of 11
Changes in zooplankton phenology [email protected]
Part I: changes in phenology SPRING taxa
Acartia clausi ∆ phenology 2° End of season earlier when warmer JAS_2m vs. 75% *p=0.0388 Centropages typicus ≠ phenology Trend in 1° NS End of season earlier when warmer JAS_int vs. 75% *p=0.0281 Oithona similis ∆ phenology 1° end of season earlier when warmer OND_2m vs. 75% *p=0.0399
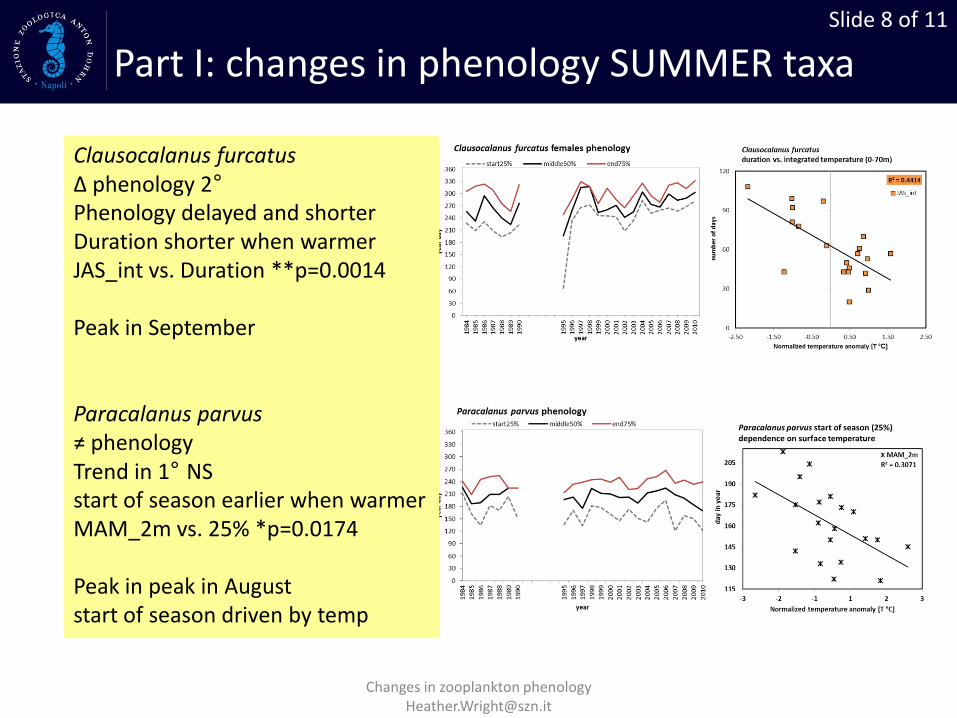
Slide 8 of 11
Changes in zooplankton phenology [email protected]
Part I: changes in phenology SUMMER taxa
Clausocalanus furcatus ∆ phenology 2° Phenology delayed and shorter Duration shorter when warmer JAS_int vs. Duration **p=0.0014 Peak in September Paracalanus parvus ≠ phenology Trend in 1° NS start of season earlier when warmer MAM_2m vs. 25% *p=0.0174 Peak in peak in August start of season driven by temp
Slide 9 of 11
Changes in zooplankton phenology [email protected]
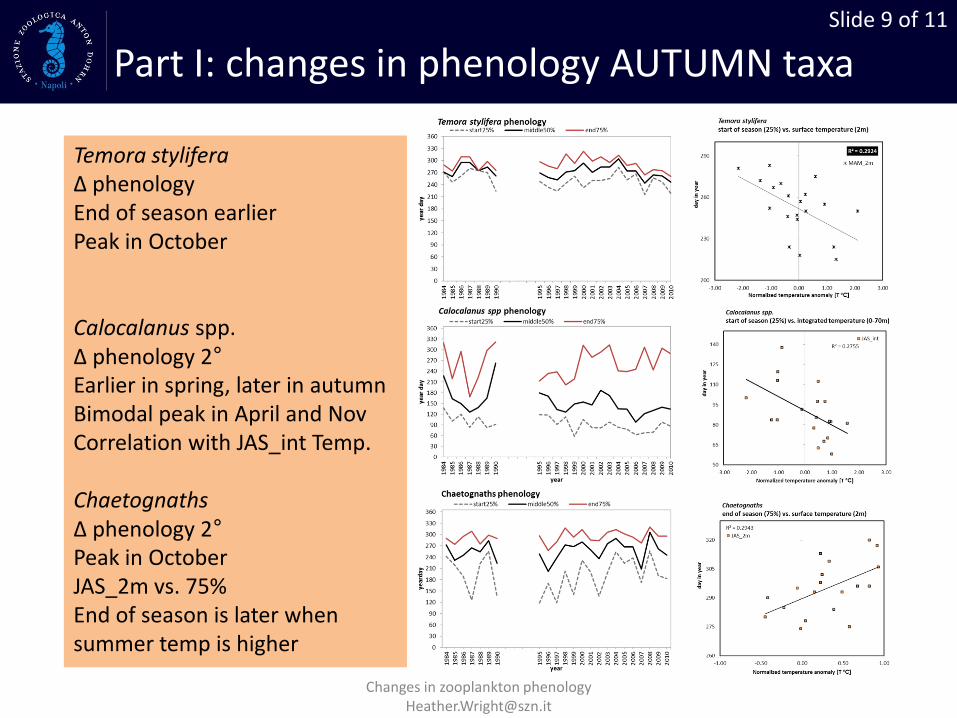
Part I: changes in phenology AUTUMN taxa
Temora stylifera ∆ phenology End of season earlier Peak in October Calocalanus spp. ∆ phenology 2° Earlier in spring, later in autumn Bimodal peak in April and Nov Correlation with JAS_int Temp. Chaetognaths ∆ phenology 2° Peak in October JAS_2m vs. 75% End of season is later when summer temp is higher
Slide 10 of 11
Changes in zooplankton phenology [email protected]
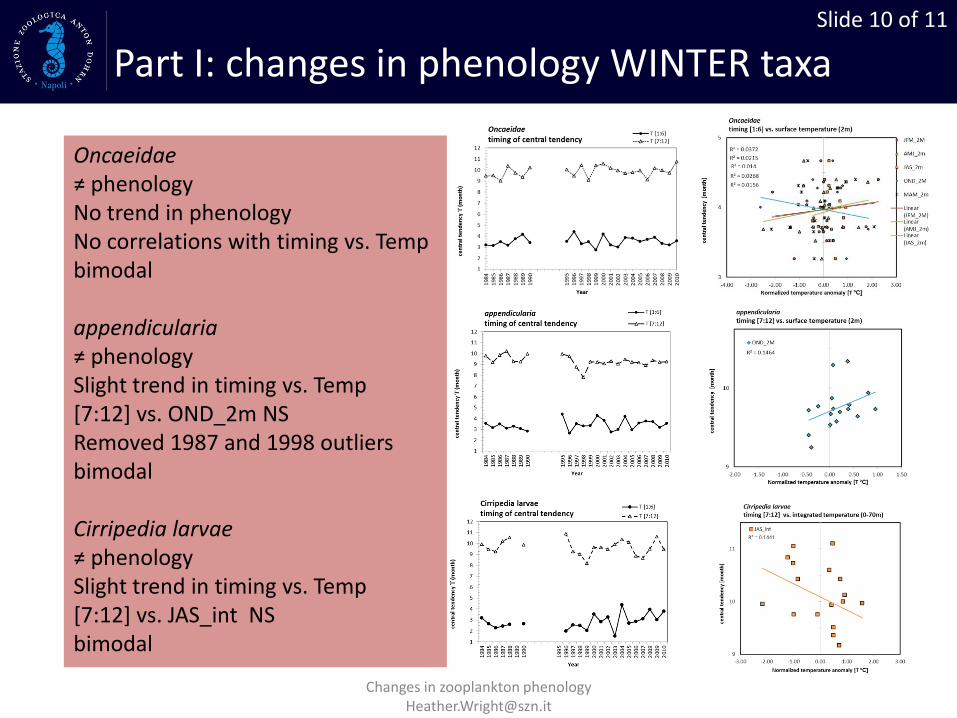
Oncaeidae ≠ phenology No trend in phenology No correlations with timing vs. Temp bimodal appendicularia ≠ phenology Slight trend in timing vs. Temp [7:12] vs. OND_2m NS Removed 1987 and 1998 outliers bimodal Cirripedia larvae ≠ phenology Slight trend in timing vs. Temp [7:12] vs. JAS_int NS bimodal
Part I: changes in phenology WINTER taxa
Slide 11 of 11
Changes in zooplankton phenology [email protected]
Summary of results (in progress)
Spring taxa: End of season is significantly correlated with temperature anomalies in summer and Autumn. Taxa with a June peak are correlated with JAS (summer) temperature and taxa with a October peak are correlated with OND (autumn) temperature. Summer taxa: Start of season in earlier and duration is shorter when temperature anomalies are above average. Taxa with an August peak are significantly correlated with spring MAM temp. Autumn taxa: End of season is earlier for T.stylifera when temp anomalies are higher, but the end of season later when warmer for other species. Not a consistent trend in Autumn taxa Winter taxa: No significant changes in phenology. All selected winter zooplankton taxa are bimodal.
Slide 12 of 11
Changes in zooplankton phenology [email protected]
Acknowledgements
LTER-MC and MECA – for sampling and data Grazia Mazzocchi, SZN – director of studies Adriana Zingone , SZN– internal advisor Diana Sarno, SZN – phytoplankton taxonomy Francesca Margiotta, SZN-MECA Enzo Saggiomo, SZN-MECA Laurent Dubroca , IFRMER– external collaborator Cristina Tortora, SZN – post-doc, collaborator
Slide 13 of 11
Changes in zooplankton phenology [email protected]
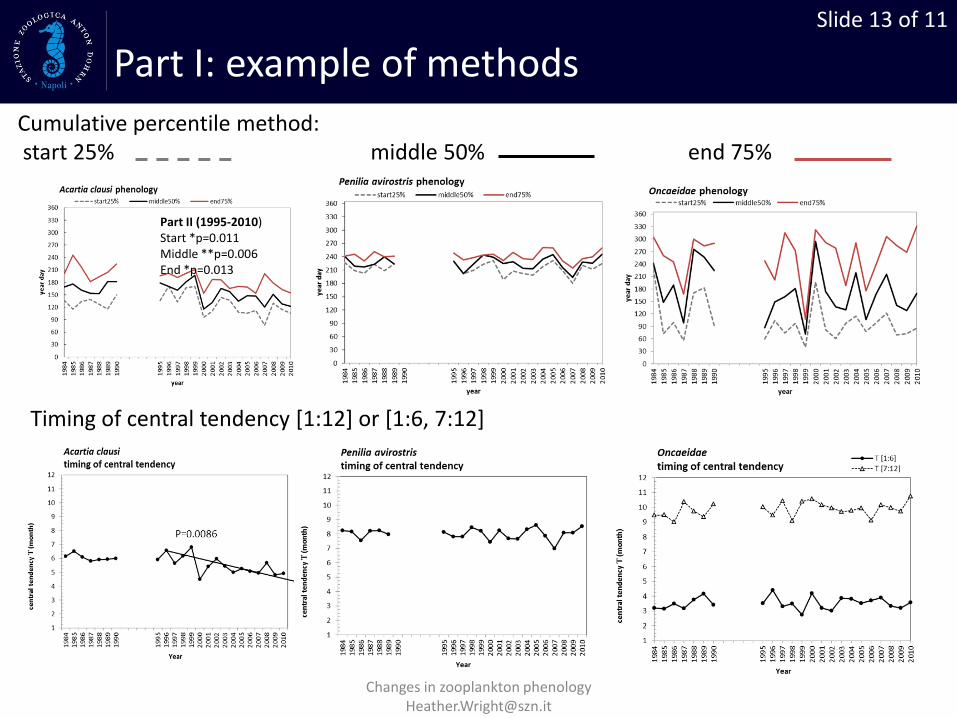
Part I: example of methods
Part II (1995-2010) Start *p=0.011 Middle **p=0.006 End *p=0.013
Cumulative percentile method: start 25% middle 50% end 75%
Timing of central tendency [1:12] or [1:6, 7:12]
Slide 14 of 11
Changes in zooplankton phenology [email protected]
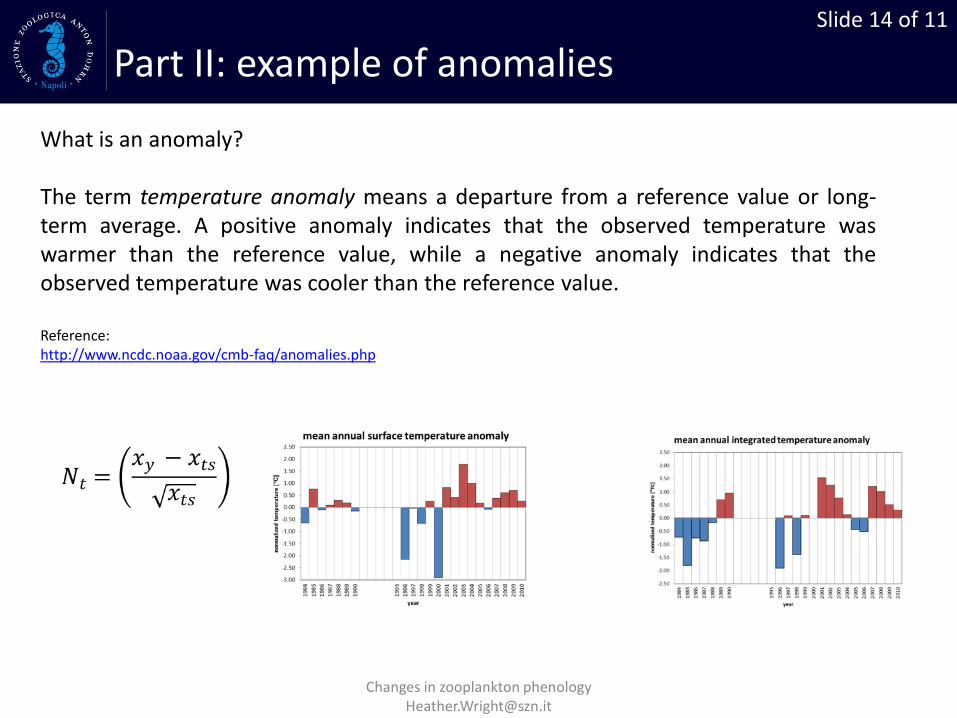
Part II: example of anomalies
What is an anomaly? The term temperature anomaly means a departure from a reference value or long-term average. A positive anomaly indicates that the observed temperature was warmer than the reference value, while a negative anomaly indicates that the observed temperature was cooler than the reference value. Reference: http://www.ncdc.noaa.gov/cmb-faq/anomalies.php