tuberculosis in the region of the americas 2009 · francis morey, mercianna moxey, ... rodríguez,...
TRANSCRIPT

Tuberculosis in the Region of the Americas 2009
E P I D E M I O L O G Y, C O N T R O L A N D F I N A N C I N G
R E G I O N A L R E P O R T


Tuberculosis in the Region of the Americas 2009
E P I D E M I O L O G Y, C O N T R O L A N D F I N A N C I N G
R E G I O N A L R E P O R T

The Pan American Health Organization welcomes requests for permission to reproduce or translate its publications, in part or in full. Applications and inquiries should
be addressed to Editorial Services, Area of Knowledge Management and Communications (KMC), Pan American Health Organization, Washington, D.C., U.S.A. The
Área de Vigilancia de la Salud, Prevención y Control de Enfermedades, Proyecto de Enfermedades Transmisibles, Programa de Tuberculosis will be glad to provide the
latest information on any changes made to the text, plans for new editions, and reprints and translations already available.
© Pan American Health Organization, 2011. All rights reserved.
Publications of the Pan American Health Organization enjoy copyright protection in accordance with the provisions of Protocol 2 of the Universal Copyright
Convention. All rights are reserved.
The designations employed and the presentation of the material in this publication do not imply the expression of any opinion whatsoever on the part of the
Secretariat of the Pan American Health Organization concerning the status of any country, territory, city or area or of its authorities, or concerning the delimitation
of its frontiers or boundaries.
The mention of specifi c companies or of certain manufacturers’ products does not imply that they are endorsed or recommended by the Pan American Health
Organization in preference to others of a similar nature that are not mentioned. Errors and omissions excepted, the names of proprietary products are distinguished
by initial capital letters.
All reasonable precautions have been taken by the Pan American Health Organization to verify the information contained in this publication. However, the published
material is being distributed without warranty of any kind, either expressed or implied. The responsibility for the interpretation and use of the material lies with the
reader. In no event shall the Pan American Health Organization be liable for damages arising from its use.
Available also in Spanish with the title:
“La tuberculosis en la Región de las Américas: Informe regional. Epidemiología, control y fi nanciamiento”
ISBN 978-92-75-31655-9
PAHO HQ Library Cataloguing-in-Publication Data
Pan American Health Organization
Tuberculosis in the Region of the Americas 2009: Regional Report
Washington, D.C.: PAHO, © 2011
ISBN: 978-92-75-11655-5
I. Title
1. TUBERCULOSIS - epidemiology
2. COMMUNICABLE DISEASE PREVENTION - methods
3. EPIDEMIOLOGY - statistics & numeral data
4. COMMUNICABLE DISEASE CONTROL - economics
5. EPIDEMIOLOGIC SURVEILLANCE - trends
6. AMERICAS
NLM WF.DA1
Printed in PRISA Ltda.
La Paz, BOLIVIA

3Tuberculosis in the Region of the Americas 2009
Table of Contents
Abbreviations 5Acknowledgements 6Summary / Key Points 7Introduction 9
Chapter 1: Regional Burden and Trends of Tuberculosis 11 1.1. Incidence 11
1.2. Prevalence 15
1.3. Mortality 15
1.4. MDR-TB / XDR-TB 16
1.5. TB/HIV 17
Chapter 2: Progress in TB control 21 2.1. Case notifi cation 22
2.1.1. Cases by treatment history 22
2.1.2. Cases by site of disease 22
2.1.3. Cases by bacteriology 23
2.1.4 Cases by sex and age group 24
2.1.5. Childhood Tuberculosis 27
2.2. Case Detection 28
2.3. Treatment outcomes 29
2.4. Laboratory strengthening 31
Smear microscopy 31
Culture testing 31
DST 31
2.5. Management of drug-resistant (MDR-) TB 33
2.6. Collaborative TB/HIV activities 36
Chapter 3: Progress towards Global Targets for Reductions in Disease Burden 39 3.1. Incidence 40
3.2. Prevalence 40
3.3. Mortality 40
3.4. Case detection 40
3.5. Treatment success 40
Chapter 4: Tuberculosis and Poverty 43 GNI per capita and TB incidence 43
Chapter 5: Financing for TB control 45 Available funds and funding gap in the Region 46
Cost per patient 51
Chapter 6: Conclusions 53


5Tuberculosis in the Region of the Americas 2009
Abbreviations
AIDS Acquired Immunodefi ciency Syndrome
ART Antiretroviral Therapy
CDR Case Detection Rate
CNR Case Notifi cation Rate
CPT Co-Trimoxazole Preventive Therapy
DOT Directly Observed Treatment
DOTS The Basic Package That Underpins the Stop TB Strategy
DRS Drug Resistance Surveillance or Survey
DST Drug Susceptibility Testing
EQA External Quality Assurance
GLC Green Light Committee
GNI Gross National Income
HIV Human Immunodefi ciency Virus
IPT Isoniazid Preventive Therapy
MDG Millennium Development Goal
MDR-TB Multidrug-Resistant Tuberculosis
NTP National Tuberculosis Control Programme or equivalent
TB Tuberculosis
UNAIDS Joint United Nations Programme on HIV/AIDS
WHO World Health Organization
XDR-TB Extensively Drug-Resistant TB

6 Tuberculosis in the Region of the Americas 2009
Acknowledgements
This Regional report on tuberculosis in the Ameri-
cas 2009 was produced by Florian Marx with support
from Mehran Hosseini and Christopher Fitzpatrick
and led by Mirtha del Granado, Regional Advisor for
TB in AMRO/PAHO with the support of Rafael López
and Yamil Silva of the Regional TB Program.
The data used were the same as were collected,
analyzed and presented in the Global Tuberculosis
Control WHO Report 2010 from the Americas. Our
WHO colleagues from the Stop TB Department, es-
pecially those in the TME team, were fully involved in
that process. At the Regional and country levels, the
following PAHO staff were also involved: Mirtha del
Granado, Rafael López, Yamil Silva, Rodolfo Rodrí-
guez, Alfonso Tenorio and Adriana Bacelar Gomes.
For the data collection, the following country
staff from national TB programs were involved:
Christian Acosta, Shalauddin Ahmed, Xochil
Alemán de Cruz, Mirian Álvarez, Raúl Álvarez, Alister
Antoine, Wiedjaiprekash Balesar, Stefano Barbosa
Codenotti Draurio Barreira, María del Carmen Ber-
múdez, Jaime Bravo, Marta Isabel Calona de Abrego,
Martín Castellanos Joya, Kenneth Castro, Gemma
Chery, Roger Duncan, Mercedes F. España Cedeño,
Ed Ellis, Victor Gallant, Julio Garay Ramos, Christian
García Calavaro, Jennifer George, Margarita Godoy,
Alexis Guilarte, Rosalinda Hernández Munoz, Jorge
Iñiguez, Alina Jaime, Ronala Jamanca Shuan, Héctor
Oswaldo Jave Castillo, Carla Jeff ries, Eva Lewis Fuller,
Cecilia Lyons De Arango, María Josefa Llanes Cor-
dero, Andrea Yvette Maldonado Saavedra, Francisco
Maldonado, Marvin Maldonado, Raúl Marcelo Man-
jón Tellería, R.A. Manohar Singh, Belkys Marcelino,
Ada Martínez Cruz, Celia Martínez de Cuellar, Zeidy
Azofeifa Mata, Pearl Mc Millan, Mery Mercedes,
Leilawati Mohammed, Jeetendra Mohanlall, Evelyn
Morales, Yndira Morales, Ernesto Moreno Naranjo,
Francis Morey, Mercianna Moxey, Miriam Nogales
Rodríguez, Persaud Nordia, Pablo Pacheco, E. Areli
Paredes García, Tomasa Portillo, Bob Pratt, Dottin
Ramoutar, Anna Esther Reyes Godoy, Leonarda
Reyes, Paul Ricketts, Adalberto Rodríguez, María
Rodríguez, Jorge Rodríguez-De Marco, David Rodrí-
guez Pérez, Nilda Romero, Orlando Sequeira, Clarita
Torres, Zulema Torres Gaete, Christopher Ulisses
Trujillo García, William Turner, Melissa Valdez, Reina
Valerio, Daniel Vázquez, Michael Williams, Oritta
Zachariah, Nydia Zelaya and Elsa Zerbini.

7Tuberculosis in the Region of the Americas 2009
Summary / Key PointsThis report is intended to provide a comprehen-
sive and up-to-date assessment of the burden of
tuberculosis and the situation of TB control in the
Americas. Its main results are as follows:
1. In 2009, there were an estimated 272,000 in-
cident TB cases in the Region of the Americas,
equivalent to 29 cases per 100,000 population.
The number of incident TB cases was 9,000 less
than in 2008. Both, absolute number and rate
of incident TB cases in 2009 were lowest in the
Americas compared to all other WHO regions.
More than two-third (69%) of the Region’s esti-
mated number of TB cases in 2009 occurred in
South America (Andean countries: 39%; other
countries: 30%); 14% occurred in the Carib-
bean, 12% in Mexico and Central America and
only 5.4% in Northern America.
2. In 2009, there were an estimated 36,400 HIV
positive incident TB cases in the Americas,
13% of all incident TB cases. More than half
of the incident HIV positive TB cases in the
Region occurred in Brazil. At country level, HIV
prevalence varied between 0.2% and 32% of
incident TB cases.
3. There were an estimated 6,300 MDR-TB cases
among notifi ed TB cases in the Region of the
Americas in 2009. Six countries (Peru, Brazil,
Mexico, Ecuador, Dominican Republic and
Haiti) accounted for 80% of all estimated MDR-
TB cases in the region. At country level, the
estimated prevalence of MDR-TB varied be-
tween 1% and 7% of notifi ed new TB cases and
between 4% and 27% of notifi ed re-treatment
cases. By the end of 2009, at least one case of
extensively drug-resistant TB (XDR-TB) was
reported in eight countries.
4. In 2009, a total of 228,000 TB cases were notifi ed
in the Americas, of whom 168,000 were new
pulmonary TB (PTB) cases. Of these, 134,000
(80%) were confi rmed by any laboratory
method and 119,000 (52%) were new sputum
smear-positive PTB cases. The proportion of
new PTB cases with bacteriological confi rma-
tion varied considerably at country level.
5. A total of 9,900 new TB cases notifi ed in 2009
were children (age 0-14 years), 4.8% of all new
TB cases notifi ed. Nearly one fi fth of all child-
hood TB cases were smear-positive.
6. A total of 109,000 new sputum smear-positive
TB cases were treated in the 2008 cohort. Of
those, 77% were successfully treated (i.e.
cured or treatment completed). The propor-
tion of unfavourable treatment outcomes
(i.e. death, failure or default) varied at country
level between 8% and 33% of TB cases treated
in the 2008 cohort.
7. A total of 17 countries reported data on labo-
ratory capacity and external quality assurance
(EQA) of laboratories for 2009. All reporting
countries except Jamaica had at least one or
more laboratories providing smear microscopy
available per 100,000 population. Capacity for
culture testing was below target (i.e. at least
one laboratory providing culture testing per
1,000,000 population) in 8 out of 17 reporting
countries, and capacity for drug susceptibility
testing (DST) was below target (i.e. at least
one laboratory providing DST per 5,000,000
population) in most of the reporting countries.
Laboratory inclusion in external quality assess-
ment varied considerable and performance in
most of the labs included was reasonable.
8. Data for 2009 submitted by 14 countries
indicate that the overall proportion of TB cases
who received DST was 16% of notifi ed new
and 32% of notifi ed re-treatment TB cases.
There was a linear association between the
coverage of DST and the detection of MDR-TB
in re-treatment cases. DST resulted in 2,900
MDR-TB cases detected in the Americas, 46%
of MDR-TB cases that were estimated among
notifi ed TB cases. More than 85% of MDR-TB
cases were notifi ed in South America (Andean:
66%; Other: 20%). In the Caribbean, diagnostic
capacity for MDR-TB is still low and no case
reports were submitted from Haiti and Do-
minican Republic in 2009, which may explain
the low number of MDR cases detected in this
subregion. By the end of 2009, 3,200 MDR-TB
cases received second-line treatment (GLC:
1,100).
9. In 2009, around 90,000 TB cases notifi ed in the
Americas were tested or knew their HIV status,
43% of all notifi ed TB cases for whom data
were available. A total of 15,200 notifi ed TB
cases were HIV positive, 17% of those tested
or with known HIV status. South America

8 Tuberculosis in the Region of the Americas 2009
(countries other than Andean) accounted for
the highest total number of HIV positive TB
cases, whereas the proportion of HIV positive
TB cases was highest in the Caribbean. The
proportion of HIV positive TB cases receiving
antiretroviral treatment (ART) has consistently
increased over the past fi ve years – up to 83%
in 2009. In 2008, at least 47,800 HIV positive
people were screened for TB in the Americas.
Data from 12 countries suggest that 4.0% of
HIV positive people were screened for TB and
nearly 1.8% received isoniazid preventive
therapy. Reliable assessment of trends for TB
screening and IPT among people living with
HIV will require better data completeness and
improved reporting.
10. The target for incidence has been met in the
Americas as a whole as incidence is has been
declining in all fi ve subregions over the past
fi ve years. The target of halving prevalence
relative to the year 1990 has been met in all
subregions, except for the Caribbean, where
it is expected to be met shortly after 2015.
The target of halving mortality has been met
in all subregions. Case detection is constantly
increasing in the Americas reaching 79% in
2009. The range of progress towards the tar-
get for treatment success varies widely in the
Americas. There are currently 16 countries in
the Americas making limited or no progress in
treatment success rates.
11. Poverty is an important driver of the burden
of tuberculosis – in the Americas and globally.
There is a consistent negative log-linear rela-
tionship between Gross national income (GNI)
per-capita and estimated TB incidence in the
countries in 2009.
12. Countries have been increasingly reporting
data on fi nancial aspects in recent years. For
2010, 27 countries reported on budget and
24 on expenditures. Most included the use of
general health services (hospitalization and
supervised treatment at health centers).
13. Available funds for TB control increased
until 2009 in the 16 countries included in the
fi nancial analysis, followed by a small decline
in 2010 but preliminary budgets for 2011
envision an increase to USD 235 million, due
to important increases in Brazil, Peru and
Mexico. Most funding is channeled to the
DOTS component of the Stop TB Strategy fol-
lowed by MDR-TB, with low proportions to TB/
HIV. Funding sources are mainly governments
(85%) followed by the Global Fund (12%). In
four countries (Chile, Colombia, Honduras and
Jamaica) 100% of the fi nancing is domestic.
Haiti and Paraguay are the ones most depen-
dent on external fi nancing.
14. Despite availability of more funds, there is
a funding gap for TB activities in the Region
of USD 20 million across all aspects except
acquisition of fi rst-line drugs. The trend in
some countries is for the gap to narrow (e.g.
Colombia, Guatemala and Honduras) and in
others the contrary (e.g. Bolivia and Panama).
15. The cost per treated patient in the Region
varies widely (USD 68 in Haiti vs. USD 4,662
in Jamaica). The infl uencing factors identifi ed
are the country’s income level (higher income
countries are more costly), the treatment
model (out-patient vs. in-patient) and the
number of patients treated. Further analysis is
needed including cost-eff ectiveness.

9Tuberculosis in the Region of the Americas 2009
Introduction
The purpose of this report is to provide a
comprehensive and up-to-date assessment of the
burden of tuberculosis (TB) and the situation of
TB control in the Americas. It is produced by the
Regional TB Program of the Pan American Health
Organization (PAHO).
The report is structured in six chapters where
the Regional TB burden and trends are presented,
the progress in TB control and to global targets is
reported, TB and poverty discussed, a fi nancial
analysis done and conclusions drawn.
The analysis for this report is based on the TB
data submitted by countries of the Americas to
PAHO and WHO during the 2010 TB data collection
for the Global Tuberculosis Control Report. The fi -
nancial analysis was done taking into consideration
16 countries that have reported data more or less
consecutively from 2006 on. They represent 85% of
the TB burden in the Region.
An overview of the Region of the Americas and
the fi ve subregions used in this report are shown on
the following page (10).
Subregions of the Americas for the present report

10 Tuberculosis in the Region of the Americas 2009
NORTHERN AMERICA (EXCEPT MEXICO)
TOTAL (2 countries) 348.232.000
Canada 33.573.000
United States 314.659.000
CARIBBEAN
TOTAL (13 countries) 40.488.000
Antigua and Barbuda 88.000
Bahamas 342.000
Barbados 256.000
Cuba 11.204.000
Dominican Republic 10.090.000
Grenada 104.000
Haiti 10.033.000
Jamaica 2.719.000
Puerto Rico 3.982.000
Saint Kitts and Nevis 52.000
Saint Lucia 172.000
Saint Vicent and the Grenadines 109.000
Trinidad and Tobago 1.339.000
MEXICO AND CENTRAL AMERICA
TOTAL (8 countries) 151.348.000
Belize 307.000
Costa Rica 4.579.000
El Salvador 6.163.000
Guatemala 14.027.000
Honduras 7.466.000
Mexico 109.610.000
Nicaragua 5.743.000
Panama 3.454.000
SOUTH AMERICA (ANDEAN)
TOTAL (5 countries) 126.896.000
Bolivia (Plurinational State of) 9.863.000
Colombia 45.660.000
Ecuador 13.625.000
Peru 29.165.000
Venezuela (Bolivarian Republic of) 28.583.366
SOUTH AMERICA (OTHERS)
TOTAL (7 countries) 261.972.000
Argentina 40.276.000
Brazil 193.734.000
Chile 16.970.000
Guyana 762.000
Paraguay 6.349.000
Suriname 520.000
Uruguay 3.361.000
Country population by subregion, the Americas 2009

11Tuberculosis in the Region of the Americas 2009
Chapter 1: Regional Burden and Trends of Tuberculosis
This chapter is intended to provide an up-to-
date overview of the regional burden of tuberculo-
sis (TB) in the Americas in 2009. It is divided into fi ve
sections: Incidence, Prevalence, Mortality, MDR-TB
and TB/HIV.
The section on incidence describes the burden
of TB in terms of estimated numbers of incident TB
cases at regional subregional and country level. It
includes an overview of the Top 10 countries with
the highest absolute number of estimated incident
TB cases and of the Top 10 countries with the high-
est rate of TB cases per 100,000 of the population.
Further, a detailed overview of the 1990-2009
trends in estimated incidence at country level is
provided in this section.
The section on TB prevalence provides a brief
snapshot of estimated numbers of prevalent TB
cases in the region.
TB mortality remains an important indicator of
disease burden. The section shows absolute num-
bers and rates of deaths due to TB among HIV nega-
tive TB cases as well as an estimate of additional TB
deaths occurring among people living with HIV/
AIDS. Further, trends in absolute numbers of deaths
due to TB in fi ve countries with the highest number
of incident TB cases are presented.
The section on MDR-TB/XDR-TB describes the
burden of multi- and extensively drug-resistant TB
in the Region of the Americas.
Besides presenting the MDR-TB burden estimates
based on estimated incident TB cases (2008), this
report focuses on proportions of MDR-TB among
notifi ed TB cases in 2009. This is in line with a recent
policy shift by the WHO, which takes account of the
fact that estimates on MDR-TB on the basis of noti-
fi cation data are more useful for drug-resistant TB
planning and management purposes.
The section includes an overview of the Top 10
countries with the highest estimated absolute num-
ber of MDR-TB cases among notifi ed TB cases and
those with the highest proportion (rate) of MDR-TB
among notifi ed TB cases.
Finally, the section on TB/HIV includes an
estimate of the number of incident HIV positive
TB cases in the Region. This section includes an
overview of the Top 10 countries with the highest
absolute number of incident HIV positive TB cases
and those with the highest estimated prevalence of
HIV among incident TB cases. It further includes a
description of the relationship between the preva-
lence of HIV in TB cases and the prevalence of HIV in
the general population
1.1. Incidence
In 2009, there were an estimated 272,000
incident TB cases in the Region of the Americas
(equivalent to 29 cases per 100,000 population). TB
incidence decreased between 2008 and 2009 by
approximately 9,000 incident cases. This refl ects a
continuation of the decreasing trend in regional TB
incidence in the region observed since the 1990s.
Both, absolute number of incident cases and inci-
dence rate are lowest compared to all other WHO
regions (Figure 1).
In 2009, more than two-thirds (69%) of the
region’s estimated number of TB cases occurred in
South America (Andean: 39%; other countries: 30%);
14% occurred in the Caribbean, 12% in Mexico and
Central America and 5.4% in Northern America.
The estimated rate of incident TB cases per
100,000 of the population was highest in the
Caribbean (79 per 100,000) and lowest in Northern
America (4 per 100,000). During the recent years,
incidence rates are declining in all 5 subregions
(Figure 2).
FIGURE 1
Trends in TB incidence in six WHO regions and globally
0
50
100
150
200
250
300
350
400
WorldWPRSEA
EUREMRAMRAFR
1990 1995 2000 2005
TB
in
cid
en
ce (
pe
r 1
00
.00
0 p
op
ula
tio
n)

12 Tuberculosis in the Region of the Americas 2009
1990 1995 2000 20050
30
60
90
120
150
South America (Other)
South America (Andean)
Mexico & Central America
Caribbean
Northern America
FIGURE 2
Trends in TB incidence in fi ve subregions of the
Americas
FIGURE 3
Estimated TB incidence in the Region of the Americas, 2009
The geographical distribution of estimated TB
incidence in the Americas is shown in Figure 3.
Eight countries accounted for 80% of all inci-
dent TB cases in the Americas in 2009 (see: Box 1).
Incidence rates were higher than 100 per 100,000 in
Haiti, Bolivia, Suriname, Peru and Guyana (Figure 4).

13Tuberculosis in the Region of the Americas 2009
BOX 1
Top 10 countries by estimated (absolute) numbers
of incident TB cases
(Highlighted in red: 80% of the regional burden)
Country Incident TB cases % Cumulative
1. Brazil 87.000 32% 32%
2. Peru 33.000 12% 44%
3. Haiti 24.000 9% 53%
4. Mexico 19.000 7% 60%
5. Colombia 16.000 6% 66%
6. Bolivia 14.000 5% 71%
7. USA 13.000 5% 76%
8. Argentina 11.000 4% 80%
9. Venezuela 9.500 3% 83%
10. Ecuador 9.300 3% 87%
Others 36.577 13% 100% 0 50 100 150 200 250
Others
Panama
Honduras
Guatemala
Ecuador
Dominican Republic
Guyana
Peru
Surinam
Bolivia (Plurinational State of)
Haiti 238
140
135
113
112
70
68
62
58
48
20
FIGURE 4
Top 10 countries by estimated TB incidence per
100,000 population

14 Tuberculosis in the Region of the Americas 2009
Northern America
TB
in
cid
en
ce
(pe
r 1
00
.00
0 p
op
ula
tio
n)
1990 1995 2000 2005
0
2
4
6
8
10
12
14United States
Canada
0
20
40
60
80
100
120
140
Panama
Nicaragua
Mexico
Honduras
Guatemala
El Salvador
Costa Rica
BelizeMexico & Central America
1990 1995 2000 2005T
B i
nc
ide
nc
e
(pe
r 1
00
.00
0 p
op
ula
tio
n)
FIGURE 5
Estimated TB incidence in countries by subregions of the Americas, 2009
5a) 5b)
0
5
10
15
20
25
30
OthersTrinidad and Tobago
Puerto RicoJamaicaCuba
Caribbean II
1990 1995 2000 2005
TB
in
cid
en
ce
(pe
r 1
00
.00
0 p
op
ula
tio
n)
5d)
0
50
100
150
200
250
300Haiti
Dominican Republic
Caribbean I
1990 1995 2000 2005
TB
in
cid
en
ce
(pe
r 1
00
.00
0 p
op
ula
tio
n)
5c)
0
50
100
150
200
250
300
350
Venezuela
Peru
Ecuador
Colombia
BoliviaSouth America (Andean)
1990 1995 2000 2005
TB
in
cid
en
ce
(pe
r 1
00
.00
0 p
op
ula
tio
n)
0
20
40
60
80
100
120
140
160
UruguaySurinameParaguay
GuyanaChileBrazilArgentina
South America (Other)
1990 1995 2000 2005
TB
in
cid
en
ce
(pe
r 1
00
.00
0 p
op
ula
tio
n)
5e) 5f)
Trends in TB incidence varied considerably at
country level, and there is uncertainty of trends in
TB over time in some of the countries (Figure 5 a-f).
Incidence seems falling or stable since the 1990s in
the majority of the countries, whereas few countries
witnessed an increase in estimated incidence.
Among those were Surinam, Guyana (until 2006)
and Trinidad and Tobago (Figure 5 d-f).

15Tuberculosis in the Region of the Americas 2009
1.2. Prevalence
In 2009, there were an estimated 340,000 preva-
lent TB cases in the Americas, equivalent to 37 per
100,000 population.
The estimated number of prevalent TB cases was
122,000 (36% of the total regional estimate) in the
South America Andean subregion, 109,000 (32%) in
the other countries of South America, 50,000 (15%)
in Mexico & Central America, 44,000 (13%) in the
Caribbean and 16,000 (5%) in Northern America.
1.3. Mortality
In 2009, an estimated 19,000 deaths occurred
among HIV negative TB cases in the Region of the
Americas, 2.1 per 100,000 population, respectively.
0
5
10
15
20
25
South America (Other)
South America (Andean)
Mexico & Central America
Caribbean
Northern America
TB
Mo
rta
lity
(pe
r 1
00
.00
0 p
op
ula
tio
n)
1990 1995 2000 2005
FIGURE 6
Trends in estimated mortality in fi ve subregions of
the Americas
The mortality rate was 10.3 per 100,000 in the
Caribbean – nearly 5 times that of the total regional
estimate (Figure 6).
Sixty percent of all estimated deaths due to TB
(12,000) occurred in South America.
In most of the countries with a high per-capita
burden of TB, the trend in estimated TB deaths is
declining since the early 1990s (Figure 7). Mortality
in Haiti has not been declining since 1990 and the
current decline is uncertain.
In addition to deaths due to TB in HIV negative
people, there were an estimated 4,600 deaths among
HIV positive TB cases in the region. Thus, the total num-
ber of TB deaths in the Americas was nearly 25,000, or
2.7 deaths per 100,000 population, respectively.
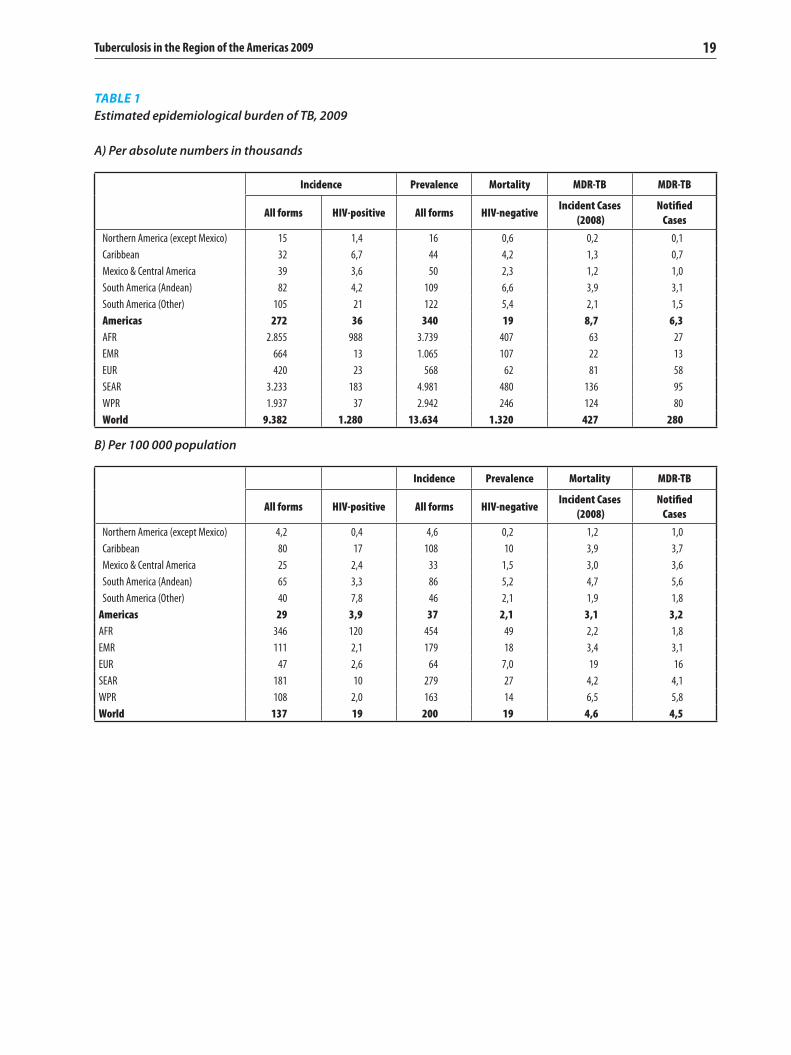
Data on estimated TB incidence, prevalence and
mortality in the Region of the Americas are sum-
marised in Table 1.
Nu
mb
er
of
TB
de
ath
s
1990 1995 2000 20050
2000
4000
6000
8000
10000
12000
14000
16000
Colombia
Mexico
Haiti
Peru
Brazil
FIGURE 7
Trends in estimated numbers of TB deaths in
selected countries with high TB burden

16 Tuberculosis in the Region of the Americas 2009
1.4. MDR-TB / XDR-TB
In 2009, there were an estimated 6,300 MDR-TB
cases among notifi ed TB cases in the Region of the
Americas. The estimated prevalence of MDR-TB
among notifi ed pulmonary TB cases was 3%.
Six countries (Peru, Brazil, Mexico, Ecuador,
Dominican Republic and Haiti) accounted for 80%
of all estimated MDR-TB cases in the region (Box 2).
At country level, the estimated prevalence of
MDR-TB varied between 1% and 7% of new TB cases
and between 4% and 27% of re-treatment cases
(Figure 8).
By the end of 2009, at least one case of exten-
sively drug-resistant TB (XDR-TB) was reported in
8 countries: Argentina, Brazil, Canada, Colombia,
Ecuador, Mexico, Peru and the United States.
BOX 2
Top 10 countries by estimated MDR-TB cases among
notifi ed TB cases (new and re-treatment), 2009
(Highlighted in red: 80% of the regional burden)
CountryEst. MDR-TB
cases%
Cumulative
%
1. Peru 2300 36% 36%
2. Brazil 1100 17% 54%
3. Mexico 700 11% 65%
4. Ecuador 360 6% 71%
5. Dominican Republic 310 5% 76%
6. Haiti 331 5% 81%
7. Argentina 270 4% 85%
8. Colombia 210 3% 88%
9. Bolivia 110 2% 90%
10. USA 91 1% 92%
Others 526 8% 100%
FIGURE 8
Top 10 countries by estimated prevalence of MDR-
TB among notifi ed TB cases, 2009
0% 5% 10% 15% 20% 25% 30%
Others
Colombia
Haiti
Honduras
Venezuela
Argentina
Dominican Republic
Mexico
Peru
Ecuador
Guatemala
New TB cases
Re-treatment TB cases
27%
3%
24%
5%
24%
5%
22%
2%
20%
7%
15%
2%
14%
1%
12%
2%
12%
2%
12%
2%
6%
1%

17Tuberculosis in the Region of the Americas 2009
1.5. TB/HIV
In 2009, there were an estimated 36,400 HIV
positive incident TB cases in the Region of the
Americas, 13% of all incident TB cases. The rate of
HIV positive incident TB cases was 3.9 per 100,000
population.
More than half of all incident HIV positive TB
cases occurred in Brazil (Box 3).
The estimated prevalence of HIV among inci-
dent TB cases was 21% in the Caribbean, 20% in the
subregion of South America (other than Andean),
9% in the subregions of Northern America and
Mexico/Central America and 5% in the subregion of
South America (Andean).
At country level, HIV prevalence varied between
0.2% and 32% of estimated incident TB cases in
2009. It was 25% or higher in fi ve countries: Suri-
nam, Jamaica, Trinidad and Tobago, Guyana and
Haiti (Figure 9).
The prevalence of HIV correlated linearly with the
estimated prevalence of HIV/AIDS in the overall popu-
lation (Figure 10; page 18), suggesting that the burden
of TB/HIV is closely related to the overall burden of HIV
in the countries, and underlining the importance of TB
and HIV inter-program collaboration.
BOX 3
Top 10 countries by estimated numbers of HIV
positive incident TB cases, 2009
(Highlighted in red: 80% of the regional burden)
CountryEst. TB-HIV
cases%
Cumulative
%
1. Brazil 19000 52% 52%
2. Haiti 5900 16% 68%
3. Guatemala 1600 4% 73%
4. Colombia 1500 4% 77%
5. USA 1300 4% 81%
6. Mexico 960 3% 83%
7. Venezuela 960 3% 86%
8. Ecuador 820 2% 88%
9. Argentina 740 2% 90%
10. Dominicana Republic 610 2% 92%
Others 3007 8% 100%
FIGURE 9
Top 10 countries by estimated prevalence of HIV
among incident TB cases, 2009
(Countries with at least n=100 incident TB cases only)
32%
30%
29%
28%
25%
22%
19%
18%
16%
12%
6%
0% 5% 10% 15% 20% 25% 30% 35%
Others
El Salvador
Uruguay
Guatemala
Belize
Brazil
Haiti
Guyana
Trinidad and Tabago
Jamaica
Suriname

18 Tuberculosis in the Region of the Americas 2009
FIGURE 10
Correlation between estimated HIV prevalence in the general population and estimated HIV prevalence in
incident TB cases, 2009
(Highlighted in red: countries with est. HIV prevalence >1% in the general population)
Est
ima
ted
HIV
pre
va
len
ce i
n t
he
po
pu
lait
on
(%)
Estimated prevalence of HIV in incident TB cases (%)
SurinameGuyana
JamaicaHaiti
Trinidad and Tobago
Belize R2= 0,53
Barbados
Bahamas
0 5 10 15 20 25 30 35 40 45 50
0
1
2
3
4
5
19Tuberculosis in the Region of the Americas 2009
TABLE 1
Estimated epidemiological burden of TB, 2009
A) Per absolute numbers in thousands
B) Per 100 000 population
Incidence Prevalence Mortality MDR-TB MDR-TB
All forms HIV-positive All forms HIV-negativeIncident Cases
(2008)
Notifi ed
Cases
Northern America (except Mexico) 15 1,4 16 0,6 0,2 0,1
Caribbean 32 6,7 44 4,2 1,3 0,7
Mexico & Central America 39 3,6 50 2,3 1,2 1,0
South America (Andean) 82 4,2 109 6,6 3,9 3,1
South America (Other) 105 21 122 5,4 2,1 1,5
Americas 272 36 340 19 8,7 6,3
AFR 2.855 988 3.739 407 63 27
EMR 664 13 1.065 107 22 13
EUR 420 23 568 62 81 58
SEAR 3.233 183 4.981 480 136 95
WPR 1.937 37 2.942 246 124 80
World 9.382 1.280 13.634 1.320 427 280
Incidence Prevalence Mortality MDR-TB
All forms HIV-positive All forms HIV-negativeIncident Cases
(2008)
Notifi ed
Cases
Northern America (except Mexico) 4,2 0,4 4,6 0,2 1,2 1,0
Caribbean 80 17 108 10 3,9 3,7
Mexico & Central America 25 2,4 33 1,5 3,0 3,6
South America (Andean) 65 3,3 86 5,2 4,7 5,6
South America (Other) 40 7,8 46 2,1 1,9 1,8
Americas 29 3,9 37 2,1 3,1 3,2
AFR 346 120 454 49 2,2 1,8
EMR 111 2,1 179 18 3,4 3,1
EUR 47 2,6 64 7,0 19 16
SEAR 181 10 279 27 4,2 4,1
WPR 108 2,0 163 14 6,5 5,8
World 137 19 200 19 4,6 4,5


21Tuberculosis in the Region of the Americas 2009
Chapter 2: Progress in TB control
are used for reporting, and this report follows this
change.
Monitoring of treatment outcomes is one of the
major components of the Stop TB strategy. The cor-
responding section in this report focuses on treat-
ment outcomes at the regional, subregional and
country level. Treatment outcomes at the regional
level are stratifi ed by site of TB (i.e. pulmonary vs.
extra-pulmonary), HIV status and MDR-TB. Rather
than using treatment success rate, the rate of un-
favourable treatment outcomes is used to allow for
country comparison. This takes into account the
fact that the proportion of undocumented or not
evaluated treatment outcomes diff ers between
countries, which has a greater impact on treat-
ment success rates than on rates of unfavourable
outcomes.
The chapter ends with sections for two major
challenges to TB control. The section on manage-
ment of drug-resistant TB focuses on the scale-up
of MDR-TB control measures (trainings, guidelines)
at country-level, the coverage of drug-susceptibility
testing (DST), case detection of MDR-TB, and the
provision of second-line treatment. The section
on collaborative TB/HIV activities considers both,
progress in reducing the burden of HIV/AIDS
among TB cases through provision of HIV test-
ing, co-trimoxazol preventive therapy (CPT) and
antiretroviral treatment (ART), and the progress
in reducing the burden of TB among HIV positive
individuals through screening and provision of
isoniazid-preventive therapy.
This chapter presents data on the current situa-
tion and recent progress of TB control in the Region
of the Americas. It is divided into six subsections:
Case notifi cation, Case Detection, Treatment Out-
comes, Laboratory strengthening, Management of
drug-resistant TB and TB/HIV collaborative activi-
ties.
Trends in tuberculosis case notifi cation are
driven by various factors including changes in
case fi nding eff orts (e.g. increase in the number of
health facilities that provide TB services), changes
in recording and reporting systems (e.g. changes in
case defi nitions, expanding reporting to the private
sector) and underlying TB incidence (e.g. HIV-driven
increase in TB case notifi cations).
If carefully collected and analysed, notifi cation
data can provide valuable insights into the oc-
currence and the characteristics of TB in diff erent
groups of cases (i.e. by TB site, smear result, sex
and age groups), which may have important im-
plications for TB control. A particular subsection is
devoted to the notifi cation of childhood TB in the
Americas.
The case detection rate (CDR), defi ned as the
ratio of notifi ed TB cases and the number of esti-
mated incident TB cases is used to estimate the
proportion of incident TB cases with access to TB
control under the DOTS strategy. It is one of the
major target indicators for global TB control. The
WHO has recently moved away from reporting CDR
among sputum smear-positive TB cases. Instead,
estimates of case detection rates for all forms of TB

22 Tuberculosis in the Region of the Americas 2009
0% 5% 10% 15% 20% 25%
HaitiGuatemala
UruguayColombia
CanadaVenezuela
El SalvadorCosta Rica
CubaParaguay
HondurasMexico
SurinameBolivia
ArgentinaDominican Republic
NicaraguaBrazilChilePeru
JamaicaPanamaEcuador
Trinidad and TabagoGuyana
3%4%
5%5%
6%6%
7%7%7%7%
8%8%8%8%
10%10%
12%12%12%
13%13%
14%15%
19%22%
FIGURE 12
Proportion of notifi ed re-treatment TB cases by
country1, 2009
FIGURE 11
Overview of TB cases notifi ed in the Region of the
Americas, 2009
2.1. Case notifi cation
In 2009, a total of 228,000 TB cases were notifi ed
in the Region of the Americas, equivalent to a rate
of 24 per 100,000 population. A breakdown of TB
cases notifi ed in 2009 is shown in Figure 11.
2.1.1. Cases by treatment history Of all TB cases notifi ed in 2009, around
206,000 (90%) were new cases and 22,000
(10%) were re-treatment cases, classifi ed as re-
lapse cases (10,000), re-treatment after failure
(6,000), re-treatment after default (1,000) or
other types of re-treatment (5,000).
The proportion of notifi ed re-treatment TB
cases varied at country level1 between 3% and
27% (Figure 12).
2.1.2. Cases by site of disease Of the 206,000 new TB cases notifi ed in
2009 in the Americas, 168,000 (82%) were
pulmonary TB (PTB) cases and 33,000 (16%)
were extra-pulmonary TB (EPTB) cases. For the
remaining 5,000 TB cases (2%), the site of the
disease was not reported.
The proportion of new EPTB cases was
higher than average in Northern America
(22%; Canada: 32%), whereas new TB cases in
the Caribbean were more frequently PTB cases
(88%). The proportion of EPTB cases varied at
country level between 4% and 32% (Figure 13).
The high variation in the proportion of EPTB
cases across countries may be due to diff er-
ences in case defi nitions or diagnostic capacity.
1 Countries with at least 100 TB cases notifi ed in 2009
Males
74.000 (62%)Females
45.000 (38%)
New smear +
PTB cases
119.000 (71%)*
New smear -
PTB cases
36.000 (21%)*
New PTB cases
168.000 (82%)New EPTB cases
33.000 (16%)
New TB cases
206.000 (90%)Re-treatment TB cases
22.000 (10%)
TB cases notifi ed
228.000
* Percentages do not add to 100% due to TB cases without data
PTB=Pulmonary TB; EPTB=Extrapulmonary TB

23Tuberculosis in the Region of the Americas 2009
2.1.3. Cases by bacteriology
Of the 168,000 new PTB cases notifi ed the
Americas in 2009, nearly 134,000 (80%) were
confi rmed by any laboratory method. Of
those, 119,000 were new smear-positive PTB
cases, equivalent to a notifi cation rate of new
smear-positive PTB cases of 13 per 100,000
population.
At subregional level, the proportion of PTB
cases with bacteriologically confi rmation was
lowest in the Caribbean and South America
(other) subregion (each 68%). It was very high
in the South American Andean subregion,
suggesting either data error, over-reporting
of smear-and culture positive PTB cases or
underreporting of smear-/culture negative
PTB cases (Figure 14).
At country-level, the proportion of new
pulmonary TB cases with bacteriological
confi rmation varied between 62% and 107%
of new PTB cases (Figure 14).
Countries approaching or exceeding 100%
might be subject to data error, probably due
to inclusion of lab-confi rmed extra-pulmonary
TB cases in the numerator.
0% 5% 10% 15% 20% 25% 30% 35%
Jamaica
Suriname
Trinidad and Tobago
Guatemala
Uruguay
Haiti
Guyana
Honduras
Nicaragua
Paraguay
Argentina
Cuba
Ecuador
Brazil
Dominican Republic
Mexico
Venezuela
Peru
Colombia
Panama
El Salvador
United States
Bolivia
Costa Rica
Chile
Canada
4%
5%
7%
7%
10%
10%
11%
12%
12%
13%
13%
14%
14%
14%
15%
18%
18%
19%
19%
19%
20%
21%
21%
21%
25%
32%
FIGURE 13
Proportion of notifi ed extrapulmonary TB cases of
all TB cases by country, 2009
0
10%
20%
30%
40%
50%
60%
70%
80%
90%
100%S
ou
th A
me
rica
(O
the
r)
So
uth
Am
eri
ca (
An
de
an
)
Me
xico
& C
en
tra
l Am
eri
ca
Ca
rib
be
an
No
rth
ern
Am
eri
ca
AM
ER
ICA
S
Jam
aic
a
Pa
na
ma
Ha
iti
Bra
zil
Ve
ne
zue
la
Arg
en
tin
a
El S
alv
ad
or
Uru
gu
ay
Nic
ara
gu
a
Do
min
ica
n R
ep
ub
lic
Ho
nd
ura
s
Cu
ba
Pa
rag
uay
Gu
yan
a
Un
ite
d S
tate
s
Ca
na
da
Ch
ile
Su
rin
am
e
Trin
ida
d a
nd
To
ba
go
Me
xico
Gu
ate
ma
la
Pe
ru
Bo
livia
Co
sta
Ric
a
Ecu
ad
or
Co
lom
bia
sputum result unknown
sputum smear-negative
sputum smear-positive bacteriological confirmation (any method)
109%105%
100%99% 97%
94% 94%91% 91% 90% 88%
83% 82% 80% 80% 78% 78% 77% 77%72% 70% 69% 67%
64% 63% 62%
80%84%
68%
88%
97%
68%
FIGURE 14
Sputum smear results 2009, percentages of all new pulmonary TB cases notifi ed, 2009*
(Countries sorted by % of cases with bacteriological confi rmation)
*Two countries exceeding 100% - probably due to inclusion of extrapulmonary cases in the numerator: Columbia 109%; Ecuador 105%

24 Tuberculosis in the Region of the Americas 2009
2.1.4. Cases by sex and age group
Of the 119,000 new sputum smear-positive
TB cases notifi ed in the Region of the Americas
in 2009, nearly 74,000 (62%) were male and
45,000 (38%) were female.
Figure 15 shows the age and sex distribution
of TB cases in the Americas in absolute num-
bers and relative per 100,000 of the popula-
tion.
Numbers of sputum smear-positive TB cases
in men and women are highest in younger age
groups, i.e. between 15 and 34 years. The rate
of TB in men remains high with increasing age
in adulthood whereas in women, TB occurs at
highest rates in young adult age.
The age and sex distribution of TB varies
considerably by subregion (Figure 16). In
Northern, Mexico & Central and South America
(Andean and Other combined), rates of tuber-
culosis increase with age or show a second
peak in old age, whereas in the Caribbean, TB
is predominantly a disease of young adults of
working age. In Northern America, the rates
of smear-negative disease and smear-positive
disease are comparable, whereas in the other
subregions smear-positive TB is much more
common than smear-negative TB (Figure 16).
Looking at the percent decline in sputum
smear-positive TB notifi cation rates in diff er-
ent age groups suggests that the dynamics
of TB over time vary in diff erent parts of the
Americas (Figure 17). In South America (An-
dean and Other combined), the decline in TB
rates between the time periods 1997-1999
and 2007-2009 was higher in younger age
groups than in the old. This might indicate
both, reduced transmission in the young and a
shift of the TB epidemic from younger towards
older age (Figure 17). In the Caribbean, the
decline in TB notifi cation rates occurs mainly
in children and older age groups, whereas in
young age groups the decline is negligible,
indicating that transmission has not been re-
duced in the young. The dual HIV-TB epidemic
might be an underlying factor of this fi nding.
Of note, TB notifi cation rates have increased
in young women aged 15-24 in the Caribbean
(Figure 17).
The percent-decline of smear-positive TB
in Northern America and Mexico & Central
America was highest in mid-adult age (i.e. ≥ 35
years; data not shown).
FIGURE 15
Age and sex distribution of smear+, smear- and extrapulmonary TB cases in the Americas, 2009
(a: absolute number of TB cases by age and sex; b: TB cases per 100,000 individuals of the same sex and age group)
Note: The three case types in absolute numbers (left side) may not be comparable due to diff erent numbers of countries reporting.
ss+
ss-
EP
Ab
so
lute
nu
mb
er
of
rep
ort
ed
ca
se
s
Male Female
0
2000
4000
6000
8000
10000
12000
14000
>6555-6445-5435-4425-3415-240-14>6555-6445-5435-4425-3415-240-14
AMERICAS
15a)
ss+
ss-
EP
Pe
r 1
00
.00
0 p
op
ula
tio
n
Male
AMERICAS
Female
0
5
10
15
20
25
>6555-6445-5435-4425-3415-240-14>6555-6445-5435-4425-3415-240-14
15b)

25Tuberculosis in the Region of the Americas 2009
FIGURE 16
Sex and age distribution of new smear-positive TB cases in subregions of the Americas, 2009
(a: absolute number of TB cases by age and sex; b: TB cases per 100,000 individuals of the same sex and age group)
Note: The three case types in absolute numbers (left side) may not be comparable due to diff erent numbers of countries reporting.
ss+
ss-
EP
Ab
so
lute
nu
mb
er
of
rep
ort
ed
ca
se
s
Male Female
NORTHERN AMERICA
0
100
200
300
400
500
600
700
800
>6555-6445-5435-4425-3415-240-14>6555-6445-5435-4425-3415-240-14
ss+
ss-
EP
Pe
r 1
00
.00
0 p
op
ula
tio
n
NORTHERN AMERICA
FemaleMale
0,0
0,5
1,0
1,5
2,0
2,5
3,0
3,5
4,0
>6555-6445-5435-4425-3415-240-14>6555-6445-5435-4425-3415-240-14
ss+
ss-
EP
Ab
so
lute
nu
mb
er
of
rep
ort
ed
ca
se
s
Male Female
CARIBBEAN
0
100
200
300
400
500
600
>6555-6445-5435-4425-3415-240-14>6555-6445-5435-4425-3415-240-14
ss+
ss-
EP
Pe
r 1
00
.00
0 p
op
ula
tio
n
Male Female
CARIBBEAN
0
5
10
15
20
25
>6555-6445-5435-4425-3415-240-14>6555-6445-5435-4425-3415-240-14
ss+
ss-
EP
Ab
so
lute
nu
mb
er
of
rep
ort
ed
ca
se
s
Male Female
MEXICO & CENTRAL AMERICA
0
500
1000
1500
2000
2500
>6555-6445-5435-4425-3415-240-14>6555-6445-5435-4425-3415-240-14
ss+
ss-
EP
Pe
r 1
00
.00
0 p
op
ula
tio
n
Male Female
MEXICO & CENTRAL AMERICA
0
5
10
15
20
25
30
35
40
45
>6555-6445-5435-4425-3415-240-14>6555-6445-5435-4425-3415-240-14
ss+
ss-
EP
Pe
r 1
00
.00
0 p
op
ula
tio
n
Male Female
SOUTH AMERICA (Andean and other combined)
0
5
10
15
20
25
30
35
40
45
>6555-6445-5435-4425-3415-240-14>6555-6445-5435-4425-3415-240-14
ss+
ss-
EP
Ab
so
lute
nu
mb
er
of
rep
ort
ed
ca
se
s
Male Female
SOUTH AMERICA (Andean and other combined)
0
2000
4000
6000
8000
10000
12000
>6555-6445-5435-4425-3415-240-14>6555-6445-5435-4425-3415-240-14

26 Tuberculosis in the Region of the Americas 2009
FIGURE 17
Relative decline in smear-positive TB case notifi cation rates in the time period 2007-2009 vs. 1997-1999 (pooled)
in South America (Andean & Other combined; 17a) compared to the Caribbean (17b)
0
10
20
30
40
50
60
70
>6555-6445-5435-4425-3415-240-14>6555-6445-5435-4425-3415-240-14
% d
ec
lin
e i
n c
ase
no
tifi
ca
tio
n r
ate
s,
19
97
-19
99
vs.
20
07
-20
09
Male
SOUTH AMERICA
Female
-10
0
10
20
30
40
50
60
70
>6555-6445-5435-4425-3415-240-14>6555-6445-5435-4425-3415-240-14
Male
CARIBBEAN
Female
% d
ec
lin
e i
n c
ase
no
tifi
ca
tio
n r
ate
s,
19
97
-19
99
vs.
20
07
-20
09
17a)
17b)

27Tuberculosis in the Region of the Americas 2009
2.1.5. Childhood Tuberculosis
In 2009, a total of 9,900 new TB cases in chil-
dren (age 0-14 years) were notifi ed in the Region
of the Americas, equivalent to 5% of all new TB
cases notifi ed.
More than half of the children were notifi ed
in South America (Andean: 1,800/ 18%; Other:
3,700/37%). In the Caribbean, 1,900 children
(19%) were notifi ed with TB, of which Haiti
accounted for 1,800 (18%) cases. In Mexico &
Central America 1,700 (17%) and in Northern
America 700 (7%) childhood TB cases were
notifi ed.
Nearly one fi fth, 19%, of the TB cases notifi ed
in children was smear-positive, 57% of the
cases were smear-negative, and 24% were
extra-pulmonary TB cases.
The notifi cation rate of childhood TB in the
Americas was 4.3 per 100,000 children. In the
Caribbean, the notifi cation rate of childhood
TB per 100,000 children was highest compared
to all other subregions in the Americas and 4
times higher than the regional rate (Figure 18).
The proportion of notifi ed childhood TB
cases varied at the country level between 1
and 20% of all new cases, and between 0%
and 15% of all new smear-positive TB cases,
respectively (Figure 19a,b). The variation in
the proportion of childhood TB cases across
the countries may refl ect diff erences in case
fi nding practice (e.g. contact tracing) as well
as under- or over-diagnosis of childhood (and/
or adult) TB.
Ne
w T
B c
ase
s p
er
10
0,0
00
ch
ild
ren
4,3
1,0
18,0
3,8
4,7
5,5
0
2
4
6
8
10
12
14
16
18
20
South America
(Other)
South America
(Andean)
Mexico &
Central America
CaribbeanNorthern
America
AMERICAS
New cases, 0-14 años
New ss+ cases, 0-14 años
FIGURE 18
Notifi cation rates of childhood TB in the Region of
the Americas and fi ve subregions, 2009
Chilhood TB cases, % of all new TB cases
0% 5% 10% 15% 20%
PeruCuba
SurinameDominican Republic
ChileEcuador
Puerto RicoGuyana
BrazilMexico
UruguayBolivia
HondurasNicaragua
United States of AmericaCanada
BelizeTrinidad and Tobago
ColombiaJamaica
VenezuelaGuatemalaArgentinaCosta RicaParaguay
PanamaBahamas
HaitiEl Salvador 20%
13%12%
10%10%
9%9%9%
8%8%
7%6%6%6%6%
5%5%5%
4%4%4%
3%3%3%3%
2%2%2%
1%
Chilhood TB cases, % of all new TB cases
15%10%
8%6%
4%
3%
3%
3%
3%3%
3%2%
2%2%2%
2%2%
2%2%
1%
1%
1%1%
1%
0%
0 5 10 15 20
United States of America
Peru
El Salvador
Canada
Uruguay
Chile
Honduras
Venezuela
Brazil
Panama
Mexico
Suriname
Paraguay
Dominican Republic
Trinidad and Tabago
Argentina
Ecuador
Haiti
Guyana
Colombia
Bolivia
Belize
Bahamas
Jamaica
Guatemala
FIGURE 19
Childhood TB cases as proportion of all new TB
cases notifi ed, 2009
19a: All new TB cases
19b: New smear-positive TB cases

28 Tuberculosis in the Region of the Americas 2009
2.2. Case Detection
The case detection rate (CDR) for all TB cases
has been steadily increasing in the Region of the
Americas over the past years, i.e. from 69% in 1995
to 79% in 2009 (Table 2; Figure 20).
The estimate for CDR in 2009 was highest in
Northern America (89%) and lowest in the Carib-
bean* (62%; Table 2).
1995 1996 1997 1998 1999 2000 2001 2002 2003 2004 2005 2006 2007 2008 2009
Northern America
(except Mexico)87 88 86 87 87 86 88 89 87 85 88 86 88 86 89
Caribbean 40 47 55 52 50 52 48 50 57 57 58 58 58 62 62
Mexico & Central
America43 57 62 62 60 62 63 62 60 60 68 69 73 77 80
South America
(Andean)72 68 69 71 71 73 73 73 70 72 71 76 74 77 77
South America (Other) 78 74 73 79 72 72 74 77 76 81 78 80 79 80 82
AMERICAS 69 70 71 74 69 70 70 72 72 76 75 76 76 78 79
AFR 38 41 38 41 40 38 38 40 41 43 42 44 45 47 48
EMR 23 27 24 41 30 25 28 32 34 38 47 51 59 60 62
EUR 62 69 76 76 76 76 77 79 76 79 79 81 80 79 78
SEAR 53 56 47 46 52 50 48 50 53 55 58 62 63 64 66
WPR 41 43 43 41 41 41 42 42 51 60 66 69 71 71 70
World 46 49 46 46 47 45 45 47 49 53 56 59 60 61 62
TABLE 2
Case detection rates (%) for all TB cases, 1995-2009
FIGURE 20
Case Detection Rate (all cases) in the Region of the Americas, 1995 - 2009
Case detection at country level varied consider-
ably in 2009 (Figure 21).
Very high CDRs, especially those exceeding
100% (e.g. Chile, Cuba), might be due to a scale-up
in case fi nding eff orts to fi nd prevalent cases or
rather indicate under-estimation (and the need for
revision) of TB incidence.
65%
70%
75%
80%
85%
200920082007200620052004200320022001200019991998199719961995
69%70%
75%
79%
*Low case detection rate in the Caribbean was due mainly to the low case detection rate in Haiti and in the Dominican Republic (see: Figure 21)

29Tuberculosis in the Region of the Americas 2009
FIGURE 21
Case Detection Rate (all cases) in countries of the Americas, 2009
(Countries with at least n=100 incident TB cases only)
0%
20%
40%
60%
80%
100%
120%
140%
Suri
nam
e
Gu
atem
ala
Ecu
ado
r
Do
min
ican
Rep
ub
lic
Hai
ti
Bo
livia
Ho
nd
ura
s
Ven
ezu
ela
Arg
enti
na
Co
lom
bia
Bel
ize
Jam
aica
Para
gu
ay
Bra
zil
Un
ited
Sta
tes
of A
mer
ica
Gu
yan
a
Trin
idad
an
d T
abag
o
Nic
arag
ua
Co
sta
Ric
a
El S
alva
do
r
Can
ada
Pan
ama
Uru
gu
ay
Peru
Mex
ico
Cu
ba
Ch
ile
133%
117%
99% 96% 96% 96% 94% 94% 92% 91% 91% 90% 89% 86%78% 77% 73% 71% 70% 68% 68%
63% 61% 60%51%
AMERICAS (79%)
33%25%
FIGURE 22
Top 10 countries by unfavourable treatment
outcome rates (%), 2008 cohort
(Countries with cohort size less than 100 cases excluded)
0% 10% 20% 30% 40%
Others
Brazil
Uruguay
Colombia
Guatemala
Venezuela
Ecuador
Chile
Panama
Guyana
Trinidad and Tabago
Died Failed Defaulted
33%
24%
20%
16%
16%
16%
15%
15%
15%
15%
11%
2.3. Treatment outcomes
In the Region of the Americas, a total of 109,000
new sputum smear-positive TB cases were treated
in the 2008 cohort.
Of those, 77% were successfully treated (i.e.
cured or treatment completed). Trends in treatment
outcomes in the Region remained relatively stable
over the past years (Figure 23).
In Northern America, the treatment success
rate was 83%. Only 2.4% of successfully treated
cases were reported as “cured”, whereas 81% were
reported as “completed” (Table 3).
Mexico & Central America reached a treatment
success rate of 85% - highest in the Americas. The
treatment success rate was lowest in the South
America (other than Andean) subregion (70%), with
cure rates of 35% only (Table 3).
The proportion of unfavourable treatment
outcomes (i.e. death, failure or default) varied at
country level between 8% and 33% of TB cases
(Figure 22).
Stratifi ed analysis of treatment outcomes by
sputum smear, HIV and MDR-TB status revealed
that death and treatment default rates are high par-
ticularly among HIV positive TB cases in the Region
(2007 cohort; Figure 24).
Of note, in the Americas, only 91% of cases noti-
fi ed were included in the 2008 treatment cohort,
and inclusion was very low in Haiti (29%, Table 3).
This suggests that overall treatment success might
be lower and higher inclusion should be ensured
in the future, in order to obtain valid estimates on
treatment outcomes.

30 Tuberculosis in the Region of the Americas 2009
FIGURE 23
Region of the Americas: Trend in new smear-positive treatment outcome, 1994-2008
TABLE 3
New smear-positive treatment outcomes of the 2008 cohort
Not evaluated
Defaulted
Failed
Died
Completed
Cured
0%
20%
40%
60%
80%
100%
200820072006200520042003200220012000199919981997199619951994
Nº
notifi ed
Nº
registered
%
registeredCured Completed Died Failed Defaulted
Not
evaluated
Northern America (except Mexico) 5230 4628 88% 2,4% 81% 8,9% 0% 1,7% 6,2%
Caribbean 11498 3312 29% 70% 6,3% 5,0% 1,5% 7,4% 9,8%
Mexico & Central America 19448 19509 100% 80% 5,3% 5,7% 1,1% 5,8% 2,3%
South America (Andean) 37957 34822 92% 76% 4,3% 3,9% 1,4% 6,9% 7,2%
South America (Other) 45726 46733 102% 35% 35% 5,1% 0,5% 8,6% 16%
AMERICAS 119.859 109.004 91% 56% 21% 5,0% 0,9% 7,2% 10%
AFR 595.184 576.775 97% 70% 10% 5,5% 1,7% 6,7% 5,9%
EMR 166558 166.719 100% 74% 13% 2,4% 0,9% 5,2% 4,0%
EUR 105238 127.087 121% 49% 14% 7,3% 9,0% 5,7% 15%
SEAR 1.007.382 1.011.353 100% 84% 3,8% 4,0% 1,7% 4,9% 1,4%
WPR 661923 656.570 99% 89% 3,2% 2,0% 0,7% 1,3% 3,9%
World 2.656.147 2.647.511 100% 79% 6,9% 3,9% 1,7% 4,5% 4,2%
FIGURE 24
Region of the Americas: Matched analysis of treatment outcomes by smear status, HIV status and MDR, 2007 cohort
(N=17 countries reporting all case types; cohort size is shown on x-axis next to case category)
Not evaluated
Defaulted
Failed
Died
Completed
Cured
0%
20%
40%
60%
80%
100%
All (829)MDRRetreatmentNew ss-/EPNew ss+
HIV+ (70)HIV- (5395)HIV+ (466)HIV- (9448)HIV+ (1184)HIV-(34114)

31Tuberculosis in the Region of the Americas 2009
2.4. Laboratory strengthening
Strengthening of laboratory capacity and per-
formance is a priority for TB control in the Region
of the Americas and elsewhere. Regional targets for
laboratory capacity are shown in Box 4. A total of 17
countries reported data on laboratory capacity and
external quality assurance (EQA) of laboratories for
2009 (Figure 25), accounting for 73% of all estimated
incident TB cases in the region.
Smear microscopy All reporting countries except Jamaica had
at least one or more laboratories providing
smear microscopy available per 100,000
population (Table 4). The proportion of smear
microscopy laboratories with external quality
assurance (EQA) varied between 9% and 100%
(Figure 25a). Performance of laboratories was
acceptable in most countries except Venezu-
ela, were only 34% of laboratories included in
EQA showed adequate results (Table 4).
Culture testing Capacity for culture testing was below target
in 8 out of 17 reporting countries (Table 4).
EQA was fully implemented in fi ve countries,
partially in two and marginally in three of the
17 reporting countries. Most of the labs in-
cluded in EQA showed adequate performance
in 2009 (Figure 25b).
DST Capacity for drug-susceptibility testing was
below target in most of the reporting coun-
tries. Eleven out of 17 countries had in total
one laboratory providing DST available. 2009
(Figure 25c).
BOX 4
Region of the Americas: Targets for TB laboratory
capacity in the countries
At least 1 laboratory providing smear microscopy per 100,000 population
At least 1 laboratory providing culture testing per 1,000,000 population
At least 1 laboratory providing DST per 5,000,000 population
Labs without EQALabs with EQA, adequate performanceLabs with EQA, non-adequate performance
0%
20%
40%
60%
80%
100%
Arg
en
tin
a
Gu
ya
na
Jam
aic
a
Bra
zil
Ve
ne
zue
la
Me
xic
o
Ch
ile
Ho
nd
ura
s
Do
min
ica
n R
ep
ub
lic
Pa
rag
ua
y
Nic
ara
gu
a
Gu
ate
ma
la
Pa
na
ma
Co
lom
bia
Ec
ua
do
r
Bo
liv
ia
El
Sa
lva
do
r
FIGURE 25
EQA coverage and results in TB laboratories
providing smear microscopy (a), culture (b) and
DST (c; page 27), 2009
(17 ountries with available data)
25 a) Smear microscopy*
*The labels above the bars show total numbers of smear laboratories.
The bars in dark grey show the percentage of laboratories included in EQA in
countries that did not report performance results.
*The labels above the bars show total numbers of culture laboratories; Jamaica
not included, because no labs providing culture available.
25 b) Culture*
Labs with EQA, non-adequate performance
7 10 2 26 16 50 62 12 19 1286 5 8 119 224 1 5
Labs with EQA, adequate performance Labs without EQA
0%
20%
40%
60%
80%
100%
Pa
rag
ua
y
Gu
ya
na
Bra
zil
Arg
en
tin
a
Pa
na
ma
Ho
nd
ura
s
Co
lom
bia
Ve
ne
zue
la
Gu
ate
ma
la
Me
xic
o
Ch
ile
Ec
ua
do
r
Bo
liv
ia
Nic
ara
gu
a
El
Sa
lva
do
r
Do
min
ica
n R
ep
ub
lic

32 Tuberculosis in the Region of the Americas 2009
DST performance was adequate in all these
laboratories in 2009, except for the one in Honduras
(Figure 25c). Colombia had four DST laboratories
available showing good performance. Several
laboratories were available in Argentina, Brazil and
Mexico, with partial inclusion in EQA (Figure 25c).
In 2009, laboratories providing DST were not yet
available in Jamaica and Guyana.
TABLE 4
Laboratory capacity for smear microscopy, culture and DST in the Americas, 2009
Notes: - no data available for countries in Northern America
- highlighted in red: estimates for laboratory below the criteria set for the Region (see: bow 4, p. 26)
- percentage of labs with adequate performance refers to all labs that were included in EQA
Country
Smear microscopy Culture DST
# labs per 100,000
population
% labs with EQA
% labs with adequate
perfor-mance
# labs per 1,000,000
population
% labs with EQA
% labs with adequ.
performance
# labs per 5,000,000
population
% labs with EQA
% labs with adequate
performance
Cari
bbea
n Dominican
Rep.2,0 75% 97% 0,7 100% 100% 0,5 100% 100%
Jamaica 0,1 33% 0% - - - - - -
Mex
ico
&
Cent
ral A
mer
ica
El Salvador 3,2 100% 100% 1,6 100% 100% 0,8 100% 100%
Guatemala 1,7 96% 96% 0,9 8% 100% 0,4 100% 100%
Honduras 1,9 64% 100% 0,7 0% - 0,7 100% 0%
Mexico 1,1 54% no data 0,6 52% 78% 0,6 8% 100%
Nicaragua 3,3 91% 84% 0,3 100% 100% 0,9 100% 100%
Panama 1,7 98% 98% 2,3 0% - 1,4 100% 100%
Sout
h Am
eric
a
(And
ean)
Bolivia 5,2 100% 85% 2,6 100% 85% 0,5 100% 100%
Colombia 5,3 99% 90% 28,2 2% 100% 0,4 100% 100%
Ecuador 2,3 100% 95% 1,2 100% 100% 0,4 100% 100%
Venezuela 2,0 43% 34% 0,7 5% 100% 0,2 100% 100%
Sout
h Am
eric
a
(Oth
er)
Argentina 1,8 9% 0% 3,0 0% - 2,0 75% 92%
Brazil 2,1 39% 70% 1,2 0% - 1,1 61% 93%
Chile 1,7 57% 96% 2,9 64% 75% 0,3 100% 100%
Guyana 2,8 19% 100% 1,3 0% - - - -
Paraguay 1,6 77% 96% 0,8 0% - 0,8 100% 100%
Total 2,2 61% 75% 3,6 9% 88% 0,9 63% 93%
Labs without EQALabs with EQA, adequate performanceLabs with EQA, non-adequate performance
0%
20%
40%
60%
80%
100%
Me
xic
o
Bra
zil
Arg
en
tin
a
Pa
rag
ua
y
Ch
ile
Ve
ne
zue
la
Ec
ua
do
r
Co
lom
bia
Bo
liv
ia
Pa
na
ma
Nic
ara
gu
a
Ho
nd
ura
s
Gu
ate
ma
la
El
Sa
lva
do
r
Do
min
ica
n R
ep
ub
lic
25 c) Drug susceptibility testing (DST)
*The labels above the bars show the total number of DST laboratories.

33Tuberculosis in the Region of the Americas 2009
2.5. Management of drug-resistant (MDR-) TB
Prevention and control of drug-resistant TB is
one of the objectives of the Regional Strategic Plan,
targeting that 100% of the countries are engaged
in detecting and treating 85% of MDR-TB cases in
integrated management within DOTS by the year
2015.
By the end of 2009, NTP in 16 countries in the Re-
gion of the Americas had conducted trainings and
15 had published national guidelines specifi cally
for the management of drug-resistant TB (table 5).
Progressive implementation of drug susceptibil-
ity testing for previously treated TB cases is a prior-
ity for all countries, especially those with medium
to high prevalence of MDR-TB.
Data for 2009 submitted by 14 countries indicate
that the proportion of TB cases who received DST
was 16% of notifi ed new and another 32% of notifi ed
re-treatment TB cases. Data on DST submitted by 11
countries suggest a linear association between the
coverage of DST in re-treatment cases and the case
detection* of MDR-TB (Figure 26).
There are currently three groups of countries in
the region: One group that does not perform DST (or
does not have data available) in re-treatment cases;
the 2nd where DST coverage is still less than 50% of
re-treatment cases associated with low case detection
rates* of MDR-TB; and the 3rd where DST coverage is
high: Those countries report more re-treatment MDR
cases than estimated (Figure 26).
This implies that improving DST coverage
among re-treatment cases results in higher case de-
tection of MDR-TB cases: DST among re-treatment
cases should be top priority in order to detect MDR-
TB cases and treat them accordingly.
FIGURE 26
DST coverage and MDR-TB case detection rate* in re-treatment cases, 2009
Reported re-treatment MDR-T cases, as % of estimated re-treatment MDR cases
Mexico
Honduras Peru
Paraguay
CubaVenezuela
El Salvador
Colombia
Chile
R2=0,58Bolivia
0% 25% 50% 75% 100% 125% 150% 175% 200%
0%
10%
20%
30%
40%
50%
60%
70%
80%
90%
100%
DS
T c
ove
rag
e, r
etre
atm
ent
case
s (%
)
*Case detection rate of MDR-TB cases is here expressed as the number of MDR-TB cases reported divided by the number of MDR-cases estimated among notifi ed TB cases. Note
that CDR is usually based on estimated incident cases as the denominator.

34 Tuberculosis in the Region of the Americas 2009
In 2009, DST resulted in 2,900 MDR-TB cases in the
Americas, 46% of the 6,300 MDR-TB cases that were
estimated among notifi ed TB cases, respectively.
Of these 2,900 MDR-TB cases, 1,000 (34%) were
new and 1,100 (38%) were re-treatment cases.
Treatment history was not reported in the remain-
ing 800 (28%).
More than 85% of the MDR-TB cases were noti-
fi ed in South America (Andean: 66%; Other: 20%).
In the Caribbean, diagnostic capacity for MDR-TB is
still low (see: 2.4.) and no case reports were submit-
ted from Haiti and Dominican Republic in 2009,
which explains the low number of MDR cases in this
subregion (Figure 27).
By the end of 2009, second-line treatment was
approved by the Green Light Committee (GLC) in 15
countries of the Americas3. In 2009, around 3,200 MDR-
TB cases received second-line treatment (GLC: 1,100).
The number of MDR-TB cases in whom second-line
treatment was started is higher than the number of re-
ported MDR-TB cases due to the fact that second-line
treatment in some countries was newly introduced
and off ered to cases notifi ed in previous years.
An overview of TB cases estimated, reported and
enrolled in second-line treatment in the countries is
given in Figure 28 & Table 5.
Case detection and the proportion of patients
receiving second-line drugs are still low in some
countries with high estimated numbers of MDR-TB
cases in 2009. Among those were Brazil, Mexico,
Dominican Republic, Haiti and Argentina.
3 Belize, Bolivia, Colombia, Costa Rica, Dominican Republic, Ecuador, El Salvador, Guatemala, Haiti, Honduras, Mexico, Nicaragua,
Paraguay, Peru and Uruguay
Nu
mb
er
of
MD
R-T
B c
as
es
0
500
1000
1500
2000
2500
3000
3500
South
America
(Other)
South
America
(Andean)
Mexico &
Central
America
CaribbeanNorthern
America
MDR-TB cases estimated among notified TB cases, undetected
MDR-TB cases detected
132
0%
3
20%
256
63%
1925
38%
568
FIGURE 27
Numbers of MDR-TB cases estimated and reported
in the fi ve subregions, 2009*
*Red percentages: MDR case detection rate
Nu
mb
er o
f MD
R-T
B c
ases Estimated MDR cases, not reported
Reported MDR cases, not on second-line treatment
Reported MDR cases on second-line treatment
0
500
1000
1500
2000
2500
Trin
idad
and
Tab
ago
El S
alva
dor
Can
ada
Chi
le
Nic
arag
ua
Guy
ana
Para
guay
Pana
ma
Hon
dura
s
Vene
zuel
a
Uni
ted
Stat
es o
f Am
eric
a
Boliv
ia
Gua
tem
ala
Colo
mbi
a
Arg
entin
a
Hai
tí
Dom
inic
an R
epub
lic
Ecua
dor
Mex
ico
Braz
il
Peru
FIGURE 28
MDR-TB cases estimated among notifi ed TB cases, reported and treated, 2009

35Tuberculosis in the Region of the Americas 2009
TABLE 5
MDR-TB cases estimated among notifi ed TB cases, reported and enrolled in second-line treatment, availability of
MDR guidelines, trainings and DST in the countries, 2009
Source of
estimate
Est. MDR-TB
cases among
notifi ed cases
MDR-TB
cases
reported
% of
estimate
MDR TB cases
on second-line
treatment
MDR
guidelines
MDR
trainings
DST
available
Peru DRS, 2006 2549 1578 62% 1856 NO YES YES
Brazil DRS, 1996 1175 449 38% 398 YES YES YES
Mexico DRS, 1997 779 11 1% 18 YES YES YES
Ecuador DRS, 2002 393 156 40% 452 YES YES YES
Dominican Rep. DRS, 1995 352 0 0% 93 YES YES YES
Haitíi model 331 0 0% 0 NO NO NO
Argentina DRS, 2005 289 89 31% YES YES YES
Colombia DRS, 2000 240 110 46% 90 NO YES YES
Guatemala DRS, 2002 118 230 195% 28 YES YES YES
Bolivia DRS, 1996 135 60 44% 37 NO YES YES
United States DRS, 2007 127 114 90% 114 YES YES YES
Venezuela DRS, 1999 89 21 24% 21 YES YES YES
Honduras DRS, 2004 77 4 5% 5 YES YES YES
Panama model 58 8 14% 0 YES YES YES
Paraguay DRS, 2001 54 6 11% 7 YES YES NO
Guyana model 39 0 0% 0 NO NO NO
Nicaragua DRS, 2006 35 0 0% 0 YES NO YES
Chile DRS, 2001 27 23 85% YES YES YES
Canada DRS, 2008 16 18 113% NO NO NO
El Salvador DRS, 2001 13 2 15% 2 YES YES YES
Trinidad and Tobago model 12 0 0% 0 NO NO NO
Costa Rica DRS, 2005 8 0 0% NO NO NO
Suriname model 5 1 20% 1 NO NO NO
Jamaica model 5 0 0% 0 YES NO NO
Belize model 3 1 33% NO NO NO
Cuba DRS, 2005 3 3 100% NO NO NO
Uruguay DRS, 2005 2 0 0% 1 NO NO NO
Bahamas model 1 0 0% NO NO NO
Saint Lucia model 1 0 0% 0 NO NO NO

36 Tuberculosis in the Region of the Americas 2009
2.6. Collaborative TB/HIV activities
The growing HIV epidemic represents a great
challenge to TB control programs in the Region of
the Americas. The Regional Strategic Plan aims at
strengthening TB and HIV/AIDS collaborative activi-
ties in order to improve monitoring and evaluation,
decreasing the TB burden in people living with HIV
and decreasing the burden of HIV in patients with
TB. For the latter, provision of voluntary counseling
and HIV testing for TB patients is one of the major
priorities.
In 2009, around 90,000 TB cases notifi ed in the
Americas were tested or knew their HIV status, 43%
of all notifi ed TB cases for whom data were available.
Testing rates remained relatively stable between
39% and 44% over the past years (Figure 29).
In 2009, a total of 15,200 notifi ed TB cases were
HIV positive, 17% of those tested.
Rates of TB/HIV co-infection have likewise re-
mained stable over the past 5 years (Figure 29).
South America (countries other than Andean)
accounted for the highest total number of HIV posi-
tive TB cases, whereas the proportion of HIV positive
TB cases was highest in the Caribbean (Figure 30).
The proportion of TB cases tested was highest in
the Caribbean (63%) and in Northern America (58%),
where the rate of HIV positive TB cases was lowest
(10%; Figure 30).
The highest absolute number of HIV positive TB
cases was reported from Brazil. Some countries with
high numbers of notifi ed TB cases had low HIV test
coverage, such as Mexico, Bolivia and Argentina
(Figure 34)
% tested (of TB cases notified)
% HIV positive (of TB cases tested)
39%
43%44% 44%
43%
16%14%
16%17% 17%
0%
10%
20%
30%
40%
50%
200931
(84%)
200833
(100%)
200730
(99%)
200631
(98%)
200526
(76%)
FIGURE 29
HIV testing and test results in TB cases notifi ed in
the Americas, 2005 - 2009
The numbers under each year show the numbers of countries
reporting data on HIV testing followed by the % of estimated
HIV positive TB cases accounted for by reporting countries.
0
20000
40000
60000
80000
100000
120000
South
America
(Other)
6 (99,5%)
South
America
(Andean)
5 (100%)
Mexico &
Central
America
8 (100%)
Caribbean
10 (100%)
Northern
America
2 (100%)
TB cases without documented HIV test result
43%
22%
38%
11%
39%
15%
63%
21%58%
10%
TB cases tested HIV negative
TB cases tested HIV positive
FIGURE 30
HIV testing and test results for TB cases in fi ve
subregions of the Americas, 2009
Black percentages: Proportion of TB cases tested among
notifi ed TB cases. Red percentages: Proportion of HIV positive
TB cases among tested TB cases. The numbers under each
region shows the numbers of countries reporting data on HIV
testing followed by the % of estimated HIV positive TB cases
accounted for by reporting countries (Haiti 2008 data included)

37Tuberculosis in the Region of the Americas 2009
In 2009, the proportion of HIV positive TB
cases receiving antiretroviral treatment (ART) in
the Americas was 73% (Figure 31). Data submitted
by 13 countries suggest that the proportion of HIV
positive TB cases receiving co-trimoxazol preven-
tive therapy (CPT) has increased over the past fi ve
years – up to 83% in 2009. However, data on CPT
are diffi cult to interpret, given the low number of
countries reporting (Figure 31). Data on ART and
CPT by subregions indicate that the coverage of
both is very low in the Caribbean (CPT: 10%; ART
12%) and low in the Andean countries of South
America (CPT: 21%; ART 35%; Figure 32). However,
there is a considerable uncertainty of the estimates
given the low numbers of countries reporting data.
Screening for TB among people living with HIV
is a further priority for TB control in the Americas
and worldwide. In 2008, at least 47,800 HIV positive
people were screened for TB in the Region of the
Americas. Data from 12 countries suggest that 4
% of HIV positive people were screened for TB and
nearly 2% received isoniazid preventive therapy
(IPT; Figure 33). The rate of estimated HIV positive
people screened for TB was highest in Cuba (18%),
Haiti (15%) and Guyana (15%), and less than 3% in
all other countries with available data.
The lower rate of HIV positive people screened
for TB in 2009 is due to missing data from Haiti
(Figure 33).
Reliable assessment of trends for TB screening
and IPT among people living with HIV will require
better data completeness and improved reporting
by countries in the forthcoming years.
HIV positive TB cases on ARTHIV positive TB cases on CPT
No data
10%12%
21%
35%
60%
89%92%
52%
0%
10%
20%
30%
40%
50%
60%
70%
80%
90%
100%
South America
(Other)
CPT: 2 (2%)
ART: 5 (96%)
South America
(Andean)
CPT: 1 (10%)
ART: 5 (100%)
Mexico &
Central
America
CPT: 6 (95%)
ART: 7 (99%)
Caribbean
CPT: 5 (89%)
ART: 8 (90%)
Northern
America
CPT: 0 (0%)
ART: 0 (0%)
FIGURE 32
Provision of CPT and ART among HIV positive TB
cases in fi ve subregions, 2009*
0%
10%
20%
30%
40%
50%
60%
70%
80%
90%
100%
2009CPT: 14 (12%)ART: 25 (76%)
2008CPT: 16 (28%)ART: 28 (89%)
2007CPT: 11 (26%)ART: 21 (85%)
2006CPT: 9 (1%)
ART: 17 (57%)
2005CPT: 5 (1%)
ART: 11 (52%)
HIV positive TB cases on ART
28%
88%
29%
94%
37%
70%
45%
67%
83%
73%
HIV positive TB cases on CPT
FIGURE 31
Provision of CPT and ART among HIV positive TB
cases notifi ed in the Americas, 2005 - 2009*
Personas VIH-positivas sometidas a tamizaje de TB
Personas VIH-positivas que recibieron TPI
% o
f e
sti
ma
ted
nu
mb
er
of
pe
op
le l
ivin
g w
ith
HIV
1,8%2,2%
1,5%1,8%
1,0%
2,6%
3,9%4,3%
4,0%
1,6%
0%
1%
2%
3%
4%
5%
6%
7%
8%
9%
10%
2009SCR: 10 (11%)IPT: 11 (14%)
2008 SCR: 12 (30%)IPT: 11 (32%)
2007SCR: 11 (27%)IPT: 12 (30%)
2006SCR: 3 (1%)IPT: 4 (2%)
2005SCR: 6 (27%)
IPT: 5 (8%)
FIGURE 33
Screening for TB and IPT in people living with HIV/
AIDS in the Americas, 2005 – 2009*
* The numbers under each year or region (horizontal axis) show the numbers of
countries reporting data followed by the percentage of estimated HIV positive TB
cases accounted for by reporting countries.

38 Tuberculosis in the Region of the Americas 2009
0
5000
10000
15000
20000
25000
30000
35000
40000
45000
50000
Bar
bad
os
Bah
amas
Be
lize
Jam
aica
Suri
nam
e
Trin
idad
an
d T
abag
o
Co
sta
Ric
a
Uru
gu
ay
Cu
ba
Gu
yan
a
Can
ada
Pan
ama
El S
alva
do
r
Nic
arag
ua
Par
agu
ay
Ch
ile
Gu
atem
ala
Ho
nd
ura
s
Do
min
ican
Re
pu
blic
Ecu
ado
r
Ven
ezu
ela
Arg
enti
na
Bo
livia
Un
ited
Sta
tes
of
Am
eric
a
Co
lom
bia
Hai
ti
Mex
ico
Per
u
Bra
zil
TB cases without HIV test result
TB cases with negative HIV test result
TB cases with positive HIV test result
49%
36%
21%
65%
43%61%
12% 2%
73%45% 47% 55% 65%
0% 10% 45% 95% 86% 37% 62% 96% 95% 100% 94% 82% 64% 95% 100% 100%
FIGURE 34
HIV testing and test results in TB cases notifi ed in the Americas, 2005 - 2009*
Percentages: Proportion of notifi ed TB cases with a documented HIV test result

39Tuberculosis in the Region of the Americas 2009
Chapter 3: Progress towards Global Targets for Reductions in Disease Burden
The chapter further shows a detailed overview
on the country-specifi c progress towards the targets
for incidence, prevalence, mortality, case detection
rate and treatment success rate. However, judgment
on country-specifi c progress is complex and any
interpretation on the basis of the classifi cation given
should be made with caution.
The purpose of this chapter is to provide a recent
update on the regional, subregional and country
progress towards the international targets for TB
control in the Americas, specifi ed in the Millennium
Development Goal 6 and the Stop TB Partnership
(Table 6). The chapter shows a 2015 projection of TB
incidence, prevalence and mortality in the Region
of the Americas as a whole and at the level of the
fi ve subregions, including a projection of when
these targets had been met or will probably be met
in the future.
Millennium Develoment Goal (MDG) 6:
Relevant targets and indicatorsStop Tuberculosis Targets
MDG 6:
Combat HIV/AIDS, malaria and other Diseases
Target 6c:
To have halted by 2015 and begun to reverse the incidence of malaria and
other major diseases
Indicator 6.9:
Prevalence and death rates associated with tuberculosis
Indicator 6.10:
Proportion of tuberculosis cases detected and cured under DOTS
By 2015:
The global burden of TB (disease prevalence and deaths) will be reduced by
50% relative to their 1990 levels.
DOTS: Case detection rate (CDR; for all cases and smear-positive cases
specifi cally) will be 84% and treatment success rate will be 87%.
By 2050:
The global incidence of TB disease will be less than 1 case per million
population per year.
TABLE 6
International Targets for TB control (Source: Stop TB Partnership)

40 Tuberculosis in the Region of the Americas 2009
TB
in
cid
en
ce
(pe
r 1
00
00
0 p
op
ula
tio
n)
AMERICAS
South America (Andean)
South America (Other)Mexico & Central America
Caribbean
Northern America
3,0%
0
30
60
90
120
150
2005200019951990
3,9%
3,3%
3,8%
5,6%5,3%
TB
pre
va
len
ce
(pe
r 1
00
00
0 p
op
ula
tio
n)
AMERICAS
South Americas (Andean)
South America (Other)Mexico & Central America
Caribbean
Northern America
0
50
100
150
200
250
20152005200019951990
Target
2003
2016
200120052005
2000
TB
mo
rta
lity
(pe
r 1
00
00
0 p
op
ula
tio
n)
AMERICAS
South Americas (Andean)
South America (Other)Mexico & Central America
Caribbean
Northern America
0
5
10
15
20
25
20152005200019951990
Target
20091999
199720022001
2000
FIGURE 35
Projection of TB incidence (a), prevalence (b) and
mortality (c) in the Americas
35a)
Percentages indicate the 2005-2009 annual decline in TB
incidence, assuming a constant rate of decline.
35b)
Right: Year in which the target had been (or will be) met.
35c)
Right: Year in which the target had been (or will be) met.
3.1. Incidence
Between 2005 and 2009, TB incidence has been
decreasing at an annual rate of 3.8% in the Region
of the Americas as a whole and between 3.0% and
5.6% in the fi ve subregions (Figure 35a). Incidence
has been declining or stable in all countries except
for Suriname where incidence increased between
2005 and 2009 at an annual rate of 7.5% (Table 7).
3.2. Prevalence
There is a continuous decline of TB prevalence
in the Region of the Americas. The target of halving
prevalence relative to the year 1990 has been met
in all subregions, except for the Caribbean, where it
is expected to be met shortly after 2015 assuming
a constant rate of decline (Figure 35b). Limited or
no progress towards the target for prevalence was
made in 13 countries (Table 7).
3.3. Mortality
TB associated mortality in HIV negative TB cases
is constantly declining in the Americas and by 2009
all subregions have met the target for 2015 (Figure
35c). Limited or no progress towards the target for
mortality was made in 11 countries (Table 7).
3.4. Case detection
By 2009, most countries have met the target or
made considerable progress towards the target for
case detection. Limited or no progress was made in
11 countries (Table 7).
3.5. Treatment success
The range of progress towards the target for
treatment success varies widely in the Americas.
There are currently 13 countries making limited
or no progress in treatment success (2008 cohort;
Table 7).

41Tuberculosis in the Region of the Americas 2009
Goal Reverse TB incidence
by 2015Halve TB prevalence rate,
from 1990 to 2015
Halve TB mortality rate,
from 1990 to 2015
Detect 84% of TB cases
Successfully treat ≥87% of TB cases
Indicator % annual change in TB
incidence, 2005 to 2009% of the 2015
target met% of the 2015
target met% CDR (all forms),
2009
% treatment success rate
(new smear-positive cases, 2008)
Antigua and Barbuda 0,0 -251 -247 67 100
Argentina -3,9 115 128 67 44
Bahamas -4,3 78 76 89 74
Barbados 0,0 151 168 89 100
Belize 0,0 -22 -169 72 83
Bolivia -3,0 89 89 64 84
Brazil -3,3 126 155 86 71
Canada -2,2 103 100 93 78
Chile -6,5 138 139 130 72
Colombia -2,2 79 88 70 76
Costa Rica -3,6 137 181 93 89
Cuba -8,2 173 193 120 88
Dominican Republic -4,0 132 149 60 75
Ecuador -4,9 129 134 51 78
El Salvador -5,9 132 163 92 91
Grenada 0,0 115 180 120 33
Guatemala -1,1 44 33 33 83
Guyana -0,7 49 120 90 69
Haiti -3,4 42 67 - -
Honduras -10,9 111 113 68 85
Jamaica 0,0 -17 -64 78 64
Mexico -7,0 169 191 99 85
Nicaragua -4,8 139 166 90 89
Panama 0,0 41 110 94 79
Paraguay 0,0 -32 -300 78 81
Peru -5,4 153 182 97 82
Puerto Rico 0,0 135 136 89 63
Saint Kitts and Nevis -0,5 108 170 84 80
Saint Lucia 0,0 40 10 41 94
Saint Vincent and the Grenadines
0,0 124 143 34 100
Suriname 7,5 -104 -100 25 59
Trinidad and Tobago 0,0 -107 -70 89 67
United States -5,9 144 147 89 85
Uruguay 0,0 52 64 96 83
Venezuela 0,0 8 -7 68 83
Have met the targetConsiderable progress
Limited progressNo progress
No data
TABLE 7
Overview of country progress towards the targets for TB control in 2009
(See footnotes for defi nitions and explanations.)
FOOTNOTES:- For TB incidence (all forms), “Have met the target” is defi ned as a statistically signifi cant decline between 2005 and 2009, no progress is defi ned as a statistically signifi cant increase
between 2005 and 2009 - For TB prevalence and mortality (excluding TB deaths in HIV-co-infected patients, where HIV is the underlying cause of death), “Have met the target” is defi ned as having met 100 percent
or more of the 2015 target; “considerable progress” as having reached 75-99 percent; “limited progress” as having met 50-74 percent; and “no progress” as having met less than 50 percent of the 2015 target; a negative percentage indicates that prevalence is higher in 2009 than it was in 1990. A percentage above 100 indicates that the target was exceeded already.
- For the TB case detection rate (all forms), “Have met the target” is defi ned as a rate of at least 84 percent (equal to the 2015 target); “considerable progress” as a rate between 70 (equal to the 2005 target for case detection) and 83 percent; “limited progress” as a rate between 50 and 69 percent; and “no progress” as a rate below 50 percent.
- For TB treatment success (new smear-positive cases), “Have met the targets” is defi ned as a rate of at least 87 percent (equal to the 2015 target); “considerable progress” as a rate between 80 and 87 percent, “limited progress” as a rate between 60 and 85 percent; and “no progress” as a rate below 60 percent.
- (-) indicates missing data or no cases.


43Tuberculosis in the Region of the Americas 2009
Chapter 4: Tuberculosis and Poverty
Poverty is an important driver of the burden of
tuberculosis – in the Region of the Americas and
globally. Public Health measures aiming to reduce
poverty are therefore likely to reduce TB incidence.
The net eff ect of reducing poverty on the trend in
TB incidence is diffi cult to predict, given that other
risk factors for TB infection and disease, such as
urbanization, smoking, diabetes, HIV/AIDS and air
pollution diff er widely and are now increasing in
many countries.4
It has been shown that the DOTS strategy, as
intervention, is an important tool for reducing TB
mortality and prevalence.
However, its eff ect on TB incidence remains un-
certain. It has been shown that in some countries in
Latin America, the decrease in incidence coincided
with the implementation of TB control programs.*
4 See:
- Dye et al., Trends in tuberculosis incidence and their determinants in 134 countries, Bulletin WHO 2009 Sep
- Lönnroth et al., Drivers of tuberculosis epidemics: the role of risk factors and social determinants, Soc Sci Med. 2009 Jun
However, a direct relationship between the DOTS
strategy and TB incidence is diffi cult to establish be-
cause of overlapping eff ects of social and economic
development in the countries.* Therefore, unless
poverty and vulnerable people’s lives are improved,
TB incidence will unlikely continue to (rapidly)
decline.
GNI per capita and TB incidenceIn the Region of the Americas, there is a consis-
tent negative log-linear relationship between Gross
national income (GNI) per-capita and the estimated
TB incidence in the countries in 2009 (Figure 36).
The data suggest that there is no association
between GNI per-capita and each of the following:
smear-positive case detection rate (Figure 37a) and
treatment success rate (Figure 37b).
*USA - United States of America; CAN - Canada; TTO - Trinidad and Tobago; ATG - Antigua and Barbuda; MEX – Mexico; ARG - Argentina; KNA - Saint Kitts and Nevis; CHL - Chile;
URY - Uruguay; VEN - Venezuela; PAN - Panama; CRI - Costa Rica; BRA - Brazil; LCA - Saint Lucia; VCT - Saint Vincent and the Grenadines;
COL - Colombia; DMA - Dominica; PER - Peru; DOM - Dominican Republic; ECU - Ecuador; GRD - Grenada; JAM - Jamaica; SLV - El Salvador; GTM - Guatemala; PRY - Paraguay;
BOL - Bolivia; HND - Honduras; NIC - Nicaragua
FIGURE 36
Relation between GNI per capita, PPP (current international $) and estimated TB incidence rate per 100,000
population (left), and expected reduction in TB incidence by increase in GNI per capita (right), 2009*
Note: GNI per capita based on purchasing power parity (PPP). PPP GNI is gross national income (GNI) converted to international dollars using purchasing power parity
Source: World Bank, International Comparison Program database

44 Tuberculosis in the Region of the Americas 2009
FIGURE 37
Relation between GNI per capita, PPP (current international $) and (a) Case detection rate (new smear-positive cases*
(b) Treatment success rate (new smear-positive cases)*
Note: GNI per capita based on purchasing power parity (PPP). PPP GNI is gross national income (GNI) converted to international
dollars using purchasing power parity
Source: World Bank, International Comparison Program database
37a
* USA - United States of America; CAN - Canada; TTO - Trinidad and Tobago; ATG - Antigua and Barbuda; MEX – Mexico; ARG - Argentina; KNA - Saint Kitts and Nevis; CHL - Chile;
URY - Uruguay; VEN - Venezuela; PAN - Panama; CRI - Costa Rica; BRA - Brazil; LCA - Saint Lucia; VCT - Saint Vincent and the Grenadines;
COL - Colombia; DMA - Dominica; PER - Peru; DOM - Dominican Republic; ECU - Ecuador; GRD - Grenada; JAM - Jamaica; SLV - El Salvador; GTM - Guatemala; PRY - Paraguay;
BOL - Bolivia; HND - Honduras; NIC - Nicaragua
37b

45Tuberculosis in the Region of the Americas 2009
Chapter 5: Financing for TB control
Since 2004, WHO has been collecting tubercu-
losis control budget data for the 36 countries of the
Region of the Americas through the PAHO regional
offi ce. The number of countries that have sent
Year of data
collection
Number of countries
Financial reports
received*
Budget CostUse of
general health-care
servicesYear Complete Partial None Year Complete Partial None
2004 36 21 2004 17 3 1 2003 10 4 7 1
2005 36 26 2005 16 5 5 2004 15 3 8 14
2006 36 29 2006 19 3 7 2005 16 2 11 23
2007 36 28 2007 20 3 5 2006 19 3 6 22
2008 36 30 2008 18 7 5 2007 13 9 8 20
2009 36 34 2009 22 2 10 2008 20 1 13 27
2010 36** 34***2010 27 4 3
2009 24 3 7 272011**** 23 6 5
Thanks to the eff orts of the National Tuberculo-
sis Programs (NTPs), many of which have adopted
the WHO planning and budgeting tool, the number
of countries with complete budget reports has
risen from 17 in 2004 to 27 in 2010. The number of
countries with complete expenditure reports has
also risen from 10 in 2004 to 24 in 2010; however,
the quality of these data could still be improved.
Most (27) countries continue to report the use of
general health services.
This report analyzes the funds available for tu-
berculosis control. TB control expenditures involve
use of the available funds plus the cost of using the
general health services. The available funds can
come from a variety of sources, among them the
government and other sources such as loans, the
Global Fund, and other donor agencies, such as
USAID, GDF, or DFID, and the fi gures are prospective
data that generally refl ect the NTPs’ strategic plans.
The cost of using general health services refl ects
TABLE 8
Budget data received, cost and use of general health-care services, The Americas 2004-2010
Notes:
*”Financial reports received” means any data reported in the fi nancing sections of the electronic data collection form
**35 member states and Puerto Rico
***Dominica and Haiti did not submit fi nancial reports in 2010.
****preliminary budget
fi nancial data has risen since 2004 from 21 (58% of
the total) to 34 (94%) in 2009 and 2010 (Table 8).
These 34 countries account for 99% of the Region’s
tuberculosis burden.
the cost for TB patients when they are hospitalized
or go to a health facility to receive their medication
during supervised treatment. Calculation of the
costs of using the general health services is based
on the information reported by the countries on
the number of times that a TB patient must go to
the health center during treatment (supervised
treatment), the estimated percentage of patients
hospitalized in a year, the estimated number of
days that the patient remains hospitalized, and (if
they exist) the number of hospital beds assigned
exclusively to TB patients.
This report also analyzes the funding gap for TB
control. A funding gap occurs when the required
budget is greater than the amount of funds avail-
able. The required budget is defi ned as the one that
refl ects the total fi nancial needs of the TB control
program. The data are prospective, generally re-
fl ecting the NTPs’ strategic plans and excluding the
cost of using the general health services.

46 Tuberculosis in the Region of the Americas 2009
Available funds and funding gap in the Region
Given the existence of variations among the
countries that report complete budget data every
year, the regional data presented are based on the
16 countries that have reported data more or less
General Health
services
Others/Surveys/O
perational research
PPM/PAL/ACSM/CTBC
TB/HIV
MDR-TB
DOTS
0
50
100
150
200
250
201120102009200820072006
Mill
ion
s - U
SD
The available funds for TB control increased
until 2009, when they reached US$ 142 million--$
232 million with expenditures for general health
services (Figure 38). Despite a slight reduction in
2010, preliminary budgets anticipate an increase in
2011 and will reach US$ 235 million. It remains to be
seen whether these budget fi gures will materialize
in the current fi nancial climate.
For these 16 countries, most fi nancing for the
NTPs is centered on the DOTS strategy, followed by
MDR-TB (Figure 38). The relatively low proportion
of funds available for collaborative TB-HIV activities
may refl ect the little importance that national TB
FIGURE 38
Available Funds for TB Control, by strategic line, 16 selected countries, 2006-2011
consecutively from 2006 to 2011; the exceptions are
shown in Figure 38. These 16 countries account for
85% of the Region’s tuberculosis burden and are the
object of this analysis.
and HIV programs give to coinfection. Although
they are not part of the NTP budget, general
health services represent a signifi cant demand for
resources.
Including the expenditures for general health
services, governments are the principal source
of fi nancing for TB control (Figure 39 and Table
9)—corresponding to 86% of the total cost in 2010
and 2011. The Global Fund, which in 2004 fi nanced
just 8% of total costs, will fi nance 15% of them in
2010 and 2011. Donations from sources other than
the Global Fund will be lower in 2010 and 2011
compared to previous years.

47Tuberculosis in the Region of the Americas 2009
Global fund
Grants (Excluding
Global Fund)
Loans
Government, general
health care services
Government
(excluding loans)
Mill
ion
s - U
SD
0
50
100
150
200
250
201120102009200820072006
FIGURE 39
Available Funds for TB Control, by source of funding, 16 selected countries, 2006-2011
NTP
budget
Avaliable funding
Gap
Costs of
utilization
of general
health-care
services
Total TB
control Costs
Government
(excluding
loans)
Loans
Grants
(excluding
Global Fund)
Global
Fund
Brazil 62.9 50.4 0.0 2.8 4.1 5.6 42.1 104.9
Mexico 14.2 11.7 0.0 0.0 0.0 2.5 16.2 30.4
Dominican Republic 9.5 2.1 0.0 0.1 2.6 4.7 6.5 16.1
El Salvador 6.1 3.0 0.0 0.0 0.0 3.1 1.1 7.2
Bolivia (Plurinational State of) 4.9 1.0 0.0 0.0 0.1 3.8 6.7 11.6
Colombia 4.9 4.5 0.0 0.0 0.0 0.4 4.6 9.5
Paraguay 4.3 0.9 0.0 0.0 1.0 2.4 0.8 5.1
Honduras 2.7 0.9 0.0 0.0 1.7 0.1 0.8 3.4
Panama 0.7 0.2 0.0 0.0 0.0 0.5 – –
Nicaragua(b) 0.3 0.2 0.0 0.0 0.1 0.0 0.9 1.2
Jamaica 0.1 0.1 0.0 0.0 0.0 0.0 0.6 0.7
Chile – – – – – – – –
Ecuador – – – – – – – –
Guatemala – – – – – – 0.8 –
Haiti – – – – – – – –
Peru – – – – – – 1.4 –
TABLE 9
NTP budget, available funding, costs of utilization of general health-care services and total TB control costs, 16
selected countries, 2011, US$ millions
Notas: – Incomplete or unavailable data
(a) All amounts are in nominal US$; amounts may therefore diff er from the WHO Global TB Report 2010, in which many amounts were reported in constant 2010 US$.
(b) Includes only the budget for fi rst- and second-line drugs

48 Tuberculosis in the Region of the Americas 2009
All others
Peru
Mexico
Guatemala
Dominican Republic
Brazil
Mil
lio
ns
- U
SD
0
50
100
150
200
250
201120102009200820072006
FIGURE 40
Available Funds for TB Control, by country, 16 selected countries, 2006-2011
PPM/PAL /IO/Surveys
ACSM/CTBC
MDR-TB
TB/HIV
Others
Staff
Management
Laboratory
First line drugs
Mil
lon
s -
US
D
0
5
10
15
20
25
30
35
40
20112010200920082007
FIGURE 41
Funding gaps reported by NTPs, by strategic line, 16 selected countries, 2007-2011
In absolute terms, the US$ 77 million increase
in available funds between 2006 and 2011 is due
mainly to the almost US$ 28 million increase in Bra-
zil (Figure 40). 2010 and 2011 Peru data show that
country seems to pursue its TB control activities
with signifi cant funds, albeit less than in 2008 and
Despite the progress that many countries have
made in fi nancing their NTPs, the Region is facing
a funding gap of more than US$ 20 million per year
2009 perhaps. Mexico’s expenditure in 2010 and
2011 will be almost double that of 2009, due, ac-
cording to its reports, not to an increase in the NTP
budget but to more extensive use of the general
health services.
(Figure 41). The gap applies to all categories except
fi rst-line tuberculosis medicines.

49Tuberculosis in the Region of the Americas 2009
FIGURE 42
NTP Budgets and available funding in 16 slected countries, 2006-2011
8 63 1 10
ColombiaBrazil ChileBolivia (Plurinational State of)
NTP Budgets and available funding in 16 slected countries, 2006-2011
GuatemalaEcuador El SalvadorDominicana Republic
MexicoHonduras JamaicaHaiti
PeruPanama ParaguayNicaragua
2006 2008 2010 2012
1 34 0 3
12 16 8 11
3 3 2 0
4 3 0 17
0 1 0 1
1 2 5 83
0 0 1 10
36,742,4
1,9
4,3
1,9
4,3
1,9
1,9
4,31,94,3
1,9
4,3
1,9
1,9
1,9
4,3
1,9
4,3
1,9
4,3
1,9
4,3
1,9
4,3
1,9
1,94,3
2006 2008 2010 2012 2006 2008 2010
NTP budget Available funding NTP budget in 2011 Available funding in 2011
2012 2006 2008 2010 2012
The trend in the available funds with respect to
the required budget varies markedly within the Re-
gion (Figure 42). Colombia, Guatemala, and Honduras
have been progressively narrowing the funding gap.
For the rest of the countries selected, the gap persists
or is widening. In Bolivia, for example, the availability
of funding has been declining since 2007, leaving a
gap of almost 76% of the budget in 2011; in Panama,
the gap represents 71% of the 2011 budget.
According to the information provided by the
countries, the required budgets and available funds
in Chile, the Dominican Republic, Guatemala, Haiti,
Honduras, and Nicaragua are expected to increase
in 2010 and 2011. Mexico is expected to see reduc-
tions in the NTP budget and available funds for the
same period. In Jamaica, the required budget and
available funds have been declining since 2008.

50 Tuberculosis in the Region of the Americas 2009
5 At the time of data collection
Government, general health care services
Grants (excluding Global Fund)
Global Fund
Government (excluding loans)
% of available funding0% 20% 40% 60% 80% 100%
Haiti
Paraguay
Peru
Dominicana Republic
Ecuador
Panama
Nicaragua
Brazil
Guatemala
Bolivia
Mexico
El Salvador
Jamaica
Honduras
Colombia
Chile
FIGURA 43
Sources of funding for TB control, 16 selected countries, 2010
c) This fi gures could be more than 100% in case that more funds were received after data reported on 2009
(d) Includes only the budget for fi rst- and second-line drugs
(e) Includes only funds received for fi rst- and second-line drugs and laboratory supplies
In 2010, 14 out of the 16 selected countries
resorted largely to domestic fi nancing (Figure 43).
Bolivia, Brazil, Ecuador, Guatemala, Mexico, Nicara-
gua, and Panama have domestic fi nancing to cover
over 80%; Chile, Colombia, Honduras, and Jamaica
Close observation of the relationship between
required budgets, available funds, and funds
received in 2009 (Table 10) shows that the funds ac-
tually received substantially exceeded the available
funds anticipated for Haiti; this points to a possible
fi nance 100% domestically5. In 2010, the countries
most dependent on external fi nancing were Haiti
and Paraguay. A breakdown of the preliminary 2011
budgets by funding source and gap is available in
Table 9.
weakness in the country’s planning and budgeting
process. Conversely, in the case of Paraguay, only
half of the anticipated funds were received; this
could indicate problems in the mobilization of
resources.

51Tuberculosis in the Region of the Americas 2009
NTP BudgetAvaliable Funds
(a)
Received Funds
(b)
Available Funds as %
of the NTP budget
Received funds as %
of available funds (c)
Peru 83.4 36.8 – 44% –
Brazil 62.5 57.0 58.5 91% 103%
Mexico 16.8 15.1 11.1 90% 74%
Ecuador 16.2 9.2 – 57% –
Colombia 9.2 4.4 3.9 48% 89%
El Salvador 7.5 3.4 3.4 45% 100%
Guatemala 7.0 6.1 4.2 87% 69%
Dominican Republic 6.6 4.1 4.1 62% 100%
Paraguay 4.1 2.4 1.3 59% 54%
Bolivia (Plurinational State of) 3.1 1.9 3.0 61% 158%
Haiti 1.3 0.2 0.5 15% 250%
Honduras 1.1 1.1 1.0 100% 91%
Nicaragua(d) 0.3 0.3 0.2 100% 67%
Panama 0.2 0.1 – 50% –
Chile 0.1 0.1 – 100% –
Jamaica(e) 0.1 0.1 0.1 100% 100%
TABLE 10
NTP budget, Available funds and Received funds in 2009 (Millions -v USD)
Notes: – Incomplete or unavailable data
Cost per patient
The cost per treated patient (Figure 44) varies
widely in the Region, from US$ 68 in Haiti to US$
4,662 in Jamaica. These variations can be explained
a) Based on 2009 reported data
b) Based on received funds on 2009, reported in 2010.
c) This fi gures could be more than 100% in case that more funds were received after data reported on 2009
(d) Includes only the budget for fi rst- and second-line drugs
(e) Includes only funds received for fi rst- and second-line drugs and laboratory supplies.
by a country’s income level or treatment model (out-
patient versus in-patient). In general, the cost of a TB
patient is higher in the higher-income countries.

52 Tuberculosis in the Region of the Americas 2009
FIGURE 44
Cost per TB patient treated with fi rst-line drugs, by income level, 16 selected countries, 2009
However, the number of treated patients also
is important. Brazil, a high-income country (the
Region’s third highest after Chile and Mexico), has
the Region’s highest number of patients, and its av-
erage cost per patient is similar to that of medium-
to-high–income countries.
The treatment model also infl uences the cost
per patient. The countries with the highest cost per
patient are Guatemala and Jamaica, where a high
percentage of TB patients are hospitalized.
The cost per patient in Ecuador, the third highest
in the group of countries shown in Figure 44, is due
to high health-worker costs per patient. PPM, PAL,
and ACSM activities represent an important part of
the costs in El Salvador, Panama, and the Dominican
Republic compared with the rest of the countries in
the Region.
It is diffi cult to judge the cost per patient in iso-
lation. A low cost per patient may point to good use
of resources or a cost underestimate, while a high
cost may point to general ineffi ciencies or a better
quality of patient care. An analysis not only of the
cost but of the cost-eff ectiveness ratio in low- and
high-income countries could yield information on
the most suitable approach for achieving the best
possible results with the limited resources available
for TB control in the Region.

53Tuberculosis in the Region of the Americas 2009
Chapter 6: Conclusions
This chapter summarizes the main conclusions
on TB epidemiology, control and fi nancing in the
Americas that can be drawn from this report:
1. The current epidemiological burden of TB in
the Americas is concentrated mainly in South
America and the Caribbean (mainly Haiti and
Dominican Republic). Of all countries in the
region, Haiti currently witnesses by far the
highest rate of incident TB cases per 100,000
population.
2. TB incidence, prevalence and mortality contin-
ue to decline in the Americas. However, some
countries in South America and the Caribbean
currently make little or no progress in reach-
ing the targets for TB control. TB incidence is
currently increasing in Suriname and Trinidad
and Tobago. There is currently uncertainty
of trends in TB over time in some countries.
Strengthening recording and reporting sys-
tems in those countries is necessary in order
to obtain more reliable data to evaluate trends
of TB over time.
3. The prevalence of HIV in incident TB cases
is higher than 20% in some countries with
a high general prevalence of HIV/AIDS in
the population. Especially these countries,
many of which are situated in the Caribbean,
require strengthening of TB and HIV/AIDS col-
laborative activities in order to fi ght the dual
epidemic. Eff orts to reach a higher coverage
of voluntary counseling and testing of TB
patients for HIV on one side and of TB screen-
ing and preventive therapy in HIV positive
individuals on the other side are needed.
4. Progressive implementation of drug suscep-
tibility testing for previously treated TB cases
should be priority for all countries, especially
those with estimated medium to high preva-
lence of MDR-TB. Improving DST coverage
among re-treatment cases is likely to result
in higher case detection of MDR-TB cases.
Improved testing should go hand in hand
with expanded second-line treatment and
monitoring of treatment outcomes in MDR-TB
cases in the forthcoming years.
5. There is a considerable variation in the
countries with regard to the proportion of
pulmonary TB cases with bacteriological con-
fi rmation in 2009. Strengthening of laboratory
coverage and services for smear microscopy,
culture and DST is required to ensure both:
bacteriological confi rmation and adequate
treatment of TB cases.
6. Treatment success among sputum smear-
positive TB cases in the Americas is still below
the global target of 85%. Some countries
report unexpected high rates of unfavorable
treatment outcomes that deserve further
investigation and action.
7. TB funding has been increasing in the Region
but there is still a funding gap present that
needs to be addressed. Governments are the
main funders of TB activities some countries still
have high dependency of external sources like
the Global Fund. Distribution of funding is still
uneven among the diff erent components of the
Stop TB strategy. Further analysis to better un-
derstand the wide variation of cost per patient
costs and cost eff ectiveness are needed.
