towards geo decision support systems for renewable energy ... · all these activities tremendously...
TRANSCRIPT

2014 4
Naveen Kumar Sidda
Towards Geo DecisionSupport Systems for
Renewable EnergyOutreach
Departamento
Director/es
Informática e Ingeniería de Sistemas
López Pellicer, Francisco JavierZarazaga Soria, Francisco Javier
Director/es
Tesis Doctoral
Autor
Repositorio de la Universidad de Zaragoza – Zaguan http://zaguan.unizar.es
UNIVERSIDAD DE ZARAGOZA
Departamento
Director/es
Naveen Kumar Sidda
TOWARDS GEO DECISION SUPPORTSYSTEMS FOR RENEWABLE
ENERGY OUTREACH
Director/es
Informática e Ingeniería de Sistemas
López Pellicer, Francisco JavierZarazaga Soria, Francisco Javier
Tesis Doctoral
Autor
2013
Repositorio de la Universidad de Zaragoza – Zaguan http://zaguan.unizar.es
UNIVERSIDAD DE ZARAGOZA

Departamento
Director/es
Director/es
Tesis Doctoral
Autor
Repositorio de la Universidad de Zaragoza – Zaguan http://zaguan.unizar.es
UNIVERSIDAD DE ZARAGOZA

TOWARDS GEO DECISION SUPPORT
SYSTEMS FOR RENEWABLE ENERGY
OUTREACH
Naveen Kumar Sidda
PhD DISSERTATION
RESEARCH ADVISIORS Dr. Francisco Javier Lopez-Pellicer
Dr. Francisco Javier Zarazaga-Soria
December 2013
Computer Science and Systems Engineering Department
Universidad de Zaragoza, Spain

ii

iii
"A visionary mind is like a ride in a forest, it has to be sharp to explore best path to
reach the destination whereas a conventional mind is like a ride on a highway,
programmed to a set of speed limits and diversion boards. I thrive to be a visionary."
-Naveen Sidda

iv

v
Acknowledgements
This thesis owes its existence to the help, support and inspiration from many people. In first place, I would like to express heartfelt appreciation and gratitude to my supervisor Dr. F. Javier Zarazaga-Soria for his wisdom and expert guidance from the very first day of the meeting till the last day of the final defence and Dr. Francisco J. Lopez-Pellicer for his sharp and constructive criticisms, keeping me sane amidst the stress-infested thesis days and for keeping my mind at peace. I am profoundly grateful to Mr. Borja A. Espejo García computer science expert for his expertise, time and cooperation that contributed substantial in developing the tool and also for his efforts in documentation the tool technical design. I would like to thank to all the members of Advanced Information Systems Laboratory (IAAA) of the Computer science and System Engineering Department of the University of Zaragoza, and its spin-off GeoSpatiumLab for their support and assistance which brought the whole project together. Very special thanks to Covadonga, Walter and Aneta for helping me with the bureaucratic procedures and making my stay pleasant and happy. I would like to extend my thanks to Dr. Pedro R. Muro-Medrano for giving me permissions to go ahead with the work and the thesis. Finally, I would like to thank all the thesis evaluation experts and people who reviewed my thesis. I also take the opportunity to owe sincere gratitude to my family for continuous and unconditional support of all my undertakings and scholastic.

vi
vii
Resumen
La Tierra se encuentra afectada por numerosos fenómenos tales como los desastres
naturales, sobre urbanización, contaminación, etc. Todas estas actividades afectan
enormemente a los recursos naturales del planeta llevando a la escasez de los mismos. Un
tema especialmente relevante es el uso exhaustivo de energía fósil y su impacto negativo
sobre nuestro medio ambiente. Resulta de este modo fundamental la búsqueda de nuevos
recursos energéticos limpios para satisfacer nuestras necesidades y reducir la
dependencia de recursos energéticos fósiles. La transformación de una infraestructura de
generación de energía basada en recursos fósiles a otra basada en recursos energéticos
renovables tales como eólica, solar y energía hidroeléctrica llevará a un mejor
mantenimiento del medio ambiente ya que supondrá poco o ningún efecto en el
calentamiento global por las emisiones, y a una reducción de la dependencia de fuentes de
energía fósil. Las energías renovables son una fuente natural de energía que tiene
importantes beneficios ya que proporciona un sistema de producción de energía confiable,
con precios de la energía estables, puestos de trabajo especializados, y beneficios
económicos y el medio ambiente.
La energía solar es una de las mejores energías renovables. El sol es la fuente natural y
fundamental de la existencia humana sobre la tierra y afecta a todos los procesos
químicos, físicos y biológicos. Una hora de la energía del sol en la tierra es suficiente para
alimentar a todo el planeta durante un año. La energía del sol o la radiación solar y su
presencia geográfica determinan posibles inversiones en energía solar y las estrategias de
desarrollo de las mismas. De este modo es esencial para poder proporcionar respuestas
relacionadas con el "qué, quién, cuando y donde". Por ejemplo: ¿Cuál es el perfil de trabajo
que mejor adapta a una posición gerencial de las energías renovables? ¿Dónde está el mejor
lugar para invertir en huertos solares y/o parques eólicos? ¿En qué fecha se registra la más
alta productividad? ¿Por qué este lugar no es apto para proyectos hidráulicos? ¿Por qué hay
un bajón en la radiación solar en el año 2000 frente a 2012? Etc.
En general, la toma de decisiones es el proceso de seleccionar la mejor opción viable de un
conjunto de posibles maneras de hacer las cosas. Los Sistemas de Soporte de Decisión (del
inglés Decision Support System, DSS) constituyen un ecosistema cognitivo que facilita la
interacción entre los seres humanos y los datos para facilitar de forma profunda,
significativa y útil la creación de soluciones efectivas en tiempo y costes. Grandes
almacenamientos de Datos (Data warehousing), procesos de Extracción, Transformación y
Carga (del inglés Extract Transform and Load, ETL) y la Inteligencia de Negocios (del
ingles Business Intelligence, BI) son aspectos tecnológicos clave vinculados a la toma de
decisiones. Además, la toma de decisiones en el contexto de la energía solar depende de
Sistemas de Información Geográfica. Aunque la energía del Sol está disponible en todo el
mundo, es evidente que la energía solar es más abundante cerca de los trópicos. Por
ejemplo, una inversión en plantas de energía fotovoltaica en lugares cerca de los trópicos y
del ecuador requerirá menos tiempo para su amortización. Dependiendo de la ubicación
geográfica y las condiciones climáticas, la intensidad solar varía. Por esta razón, es
importante seleccionar la ubicación adecuada que optimice la inversión teniendo en
cuenta factores como la intensidad de la radiación solar, clima, tierras aptas y economía.
Hay modelos como Global atlas y SimuSOLAR que dan información de idoneidad sobre la
viii
radiación solar y las ubicaciones. Sin embargo, estos modelos están restringidos a
expertos, cubren áreas geográficas limitadas, no son aptos para casos de uso diferentes de
los inicialmente previstos, y adolecen de falta de informes detallados e intuitivos para el
público en general. El desarrollo de una cartografía extensa sobre la relación de zonas de
sol y de sombra es un trabajo muy complejo que involucra diversos conceptos y retos de
ingeniería, necesitando de la integración de diferentes modelos de datos, de calidad y
cantidad heterogéneas, con limitaciones presupuestarias, etc.
El objetivo de los trabajos de investigación desarrollados ha sido establecer la
arquitectura de software para el desarrollo de Sistemas de Soporte de Decisión en el
ámbito de las energías renovables en general, y de la energía solar en particular. La
característica clave de este enfoque de arquitectura de software es ser capaz de
proporcionar Sistemas de Soporte de Decisión que ofrezcan servicios de bajo coste ("low
cost") en este contexto. Hagamos una analogía. Imagínese que usted está buscando
comprar o alquilar una casa en España. Quiere analizar las características del edificio (por
ejemplo dimensiones, jardín, más de una edificación en la parcela) y su entorno (por
ejemplo, conexiones, servicios). Para realizar esta tarea puede utilizar los datos gratuitos
proporcionados por la Oficina Virtual del Catastro de España junto con imágenes libres de
un proveedor de ortofotografías (por ejemplo PNOA, Google o Bing) y datos contextuales
libres procedentes de otros organismos locales, regionales y/o nacionales (por ejemplo el
Ayuntamiento de Zaragoza, el Gobierno de Aragón, el proyecto Cartociudad). Si alguien
integra todos estos orígenes de datos en un sistema (por ejemplo el cliente del servicio de
mapas de la Infraestructura de Datos Espaciales de España, IDEE), tiene un Sistema de
Soporte de Decisión "low cost" para comprar o alquilar una casa. Este trabajo de
investigación tiene como objetivo el desarrollo de un enfoque de arquitectura de software
que podría proporcionar un Sistema de Soporte de Decisión "low cost" cuando los
consumidores necesitan tomar decisiones relacionadas con las energías renovables, en
particular sistemas de energía solar, como podría ser la selección de la mejor opción para
instalar un sistema solar, o decidir una inversión en una granja solar comunitaria.
Una parte importante de este proceso de investigación ha consistido en el análisis sobre la
idoneidad de las tecnologías vinculadas a Grandes almacenamientos de Datos y procesos
de Extracción, Transformación y Carga para almacenar y procesar gran cantidad de datos
históricos referentes a la energía, e Inteligencia de Negocios para la estructuración y
presentación de informes. Por otro lado, ha sido necesario centrar el trabajo en modelos
de negocio abierto (infraestructura de servicios web, modelos de datos 3D, técnicas de
representación de datos sobre zonas de sol y sombra, y fuentes de datos) para el
desarrollo económico del producto. Además, este trabajo identifica casos de uso donde los
Sistemas de Soporte de Decisión deben ser el instrumento de resolución de problemas de
mercado y de problemas científicos. Por lo tanto, esta tesis tiene como objetivo enfatizar y
adoptar las tecnologías citadas para proponer un Sistema de Soporte de Decisión completo
para un mejor uso potencial de las energías renovables.

ix
Abstract
Earth is affected by various natural phenomena such as natural calamities, disasters and
human actions like urbanization, pollution, etc. All these activities tremendously affect the
earth’s natural resources leading to shortage of resources. One such major issue is exhaustive
usage of fossil energy and its adverse impact on our environment. Therefore, it is imperative to
seek for secondary clean energy resources to meet our needs and reduce the dependence on
fossil energy resources. Transforming from fossil energy infrastructure to clean renewable
energy resources such as wind, solar and hydro will be environment friendly as there is little or
no global warming emissions and reduces dependence on fossil energy sources. Renewable
energy is a natural source of energy that has substantial benefits as it provides a reliable
energy system, stable energy prices, jobs, economic benefits and is environmentally friendly.
Solar energy is one of the best forms of renewable energy. The sun is the natural and vital
source of human existence on the earth and it impacts all chemical, physical and biological
processes. One hour of the sun’s energy on the earth is enough to power the entire planet for
a year. Sun’s energy or solar radiation and its geographical presence determine potential solar
energy investments and development strategies. In this way it is essential to be able to
provide answers related to the “what, which, when & where”. For example, which job profile
best suits a renewable energy managerial position? Where is the best place to invest in both
solar and wind farms? When was the last time highest productivity recorded? Why is this
location not suitable for hydro projects? Why is there a dip in solar radiation in year 2000
versus 2012? Etc.
In general, decision-making is the process of selecting the best viable option from a set of
different possible ways of doing things. Decision Support System (DSS) is a cognitive ecosystem
that facilitates deep, meaningful and useful interaction between humans and data for cost and
time effective solutions. Data warehousing, Extract Transform and Load (ETL), Business
Intelligence (BI) are key information technologies concepts derived for decision-making. In
addition, decision-making in the solar energy context depends on Geographic Information
Systems. Even though the sun´s energy available worldwide, it is evident that solar energy is
more abundant near the tropics. For example, an investment into photovoltaic (PV) power
plants in places near to the tropics and the equator will require less time for amortization.
Depending on the geographical location and climatic conditions, solar intensity varies. For this
reason, it is important to select suitable optimized location considering all factors such as solar
radiation intensity, climate, suitable land and economics. There are models like Global atlas
and SimuSOLAR that give solar radiation and site suitability information. Nevertheless, these
models are restricted to experts, cover limited geographical areas, are unadoptable to
different use cases, and lack of detailed intuitive reports to the general public. The
development of extensive mapping of sun-shadow is very complex as it involves diverse
concepts, engineering challenges, integrating various data models of different quality and
quantity, budget constraints, etc.
The objective of the research work developed has been to set forth the software architecture
of Renewable Energy Decision Support System (REDSS) for renewable energy in general and
solar energy in particular. The key characteristic of this software architecture approach is to be

x
able to provide “low cost” Decision Support System services in this context. Let us make an
analogy. Imagine that you are looking for buying or renting a house in Spain. You want to
analyse the characteristics of the building (e.g. dimensions, garden, more than one building in
the parcel) and its environment (e.g. connections, services). For performing this task you can
use the free data provided by the Spanish Cadastral office in conjunction with free imagery
from an ortophoto provider (e.g. PNOA, Google or Bing) and free contextual data from other
local, regional and national Government’s agencies (e.g. the Zaragoza City Council, the Aragon
government, the Cartociudad project). If someone integrates all these data sources in a system
(e.g. the Spanish Spatial Data Infrastructure map client), you have a “low cost” Decision
Support System for buying or renting a house. This objective of this research work is proposing
software architecture approach that could provide a “low cost” Decision Support System. This
proposed model helps the consumers in acquainting and selecting the best option for installing
a solar system or deciding an investment in a community solar farm.
Significant part of this research process is focused on investigation on the technologies like
Data warehousing and Extract Transform and Load to store and to process huge amount of
historical data and Business Intelligence for structuring and reporting. On the other hand,
focusing on open business models (web services infrastructure, 3D data models, sun and
shadow casting techniques and data sources) for the economical development of the product.
Also, this work identifies use cases where Decision Support Systems should be instrumental in
solving market and scientific problems. Therefore, this thesis has aimed to emphasize and
imbibe the above technologies to propose one complete Decision Support System for best
potential use of renewable energy.

xi
Contents
Acknowledgements ............................................................................................................................ iii
Resumen ................................................................................................................................................ vii
Abstract ................................................................................................................................................... ix
Contents .................................................................................................................................................. xi
List of Tables ....................................................................................................................................... xiv
List of Figures ....................................................................................................................................... xv
Nomenclature ................................................................................................................................... xvii
Chapter 1 Introduction ....................................................................................................................... 1
1.1 Motivation ............................................................................................................................................................. 5
1.2 Research objective ............................................................................................................................................. 8
1.3 Research questions ............................................................................................................................................ 9
1.4 Contributions ....................................................................................................................................................... 9
1.5 Methodology ...................................................................................................................................................... 10
1.6 Scope ..................................................................................................................................................................... 13
1.7 Thesis structure ................................................................................................................................................ 14
Chapter 2 State-of-art sun-shadow models ...............................................................................17
2.1 Introduction ....................................................................................................................................................... 17
2.2 Sun models.......................................................................................................................................................... 20
2.3 Shadow models ................................................................................................................................................. 21
2.4 Spatial Sun-Shadow models ....................................................................................................................... 22
2.5 Solar radiation data sources ..................................................................................................................... 24
2.6 Spatial data and its sources ....................................................................................................................... 25
2.7 Summary ............................................................................................................................................................. 26
Chapter 3 Decision Making Ecosystem .......................................................................................27
3.1 General scheme for expeditious management plan ........................................................................ 27
3.2 Workflow management ............................................................................................................................... 28
3.3 Pragmatic process .......................................................................................................................................... 29
3.4 Data sources framework.............................................................................................................................. 31
3.5 Digital earth 3D city model ........................................................................................................................ 33
3.5.1 Requirements analysis ................................................................................................................. 33
3.5.2 Matching necessities and availability .................................................................................... 33
3.5.3 Data construction and/or acquisition ................................................................................... 33
3.5.4 Quality and Quantity check ........................................................................................................ 35
3.6 Summary ............................................................................................................................................................. 36
Chapter 4 Renewable Energy Decision Support System (REDSS) .....................................37
4.1 Characterizing REDSS ................................................................................................................................. 37
4.2 Components ....................................................................................................................................................... 42
4.2.1 Data sources for 3D modelling ................................................................................................. 42
4.2.2 Sun cube ............................................................................................................................................. 43
4.2.3 Shadow cube .................................................................................................................................... 43

xii
4.2.4 Solar reports..................................................................................................................................... 43
4.3 Users ...................................................................................................................................................................... 44
4.4 Unique points about the model proposed ............................................................................................ 47
4.4.1 Eclectic approach ........................................................................................................................... 47
4.4.2 Layered structure and intuitive reports ............................................................................... 47
4.4.3 Diverse applications ...................................................................................................................... 48
4.4.4 Co-creation solution ...................................................................................................................... 48
4.4.5 Mix-and-Match approach ............................................................................................................ 48
4.5 Emerging sun-shadow application areas ............................................................................................ 48
4.5.1 Solar power grid ............................................................................................................................. 48
4.5.2 Global warming ............................................................................................................................... 48
4.5.3 Electric cars charging station .................................................................................................... 49
4.5.4 Greenhouse crop ............................................................................................................................ 49
4.5.5 Solar energy for architectures and designers .................................................................... 49
4.6 Spatial Business Intelligence for emerging application areas ................................................... 49
4.7 Value propositions for sun shadow use cases..................................................................................... 49
4.7.1 Tourist maps .................................................................................................................................... 50
4.7.2 Sun-shadow navigation services ............................................................................................. 50
4.7.3 Plant studies ..................................................................................................................................... 50
4.7.4 Architects and Urban planners ................................................................................................. 50
4.7.5 Site suitability .................................................................................................................................. 51
4.8 Summary ............................................................................................................................................................. 51
Chapter 5 Design and Implementation .......................................................................................53
5.1 Study area ........................................................................................................................................................... 53
5.2 Energy2people .................................................................................................................................................. 53
5.3 Design ................................................................................................................................................................... 56
5.3.1 Web scraper ..................................................................................................................................... 57
5.3.2 Interpolation .................................................................................................................................... 58
5.3.3 Future work in ETL ....................................................................................................................... 59
5.3.4 Spatial data warehouse................................................................................................................ 60
5.3.5 Future work in SDW design ....................................................................................................... 62
5.4 Implementation ............................................................................................................................................... 66
5.4.1 ETL ....................................................................................................................................................... 66
5.4.2 SOLAP .................................................................................................................................................. 76
5.4.3 Web application .............................................................................................................................. 80
5.5 Qualitative assessment ................................................................................................................................. 83
5.6 Summary ............................................................................................................................................................. 88
Chapter 6 Conclusion ........................................................................................................................89
6.1 Contributions .................................................................................................................................................... 90
6.2 Future work ....................................................................................................................................................... 91
6.2.1 Eclectic approaches ....................................................................................................................... 91
6.2.2 Wind component ............................................................................................................................ 91
6.2.3 Dimensions ....................................................................................................................................... 92
6.2.4 Solar intensity .................................................................................................................................. 92
6.2.5 Checkerboard graphs ................................................................................................................... 92
6.2.6 Interoperability ............................................................................................................................... 93

xiii
Bibliography .........................................................................................................................................95

xiv
List of Tables
Table 1: Different sources of energy and their CO2 emissions (Maaßen et.al 2011) .................... 2 Table 2: Solar radiation sources (Upington Solar Park 2011). ........................................................... 24 Table 3: Suggested technology for 3D data based on the application requirements (Zhenhua
and Ioannis 2009) ...................................................................................................................................... 30 Table 4: Data sources and various application areas (Omar and Ayhan 2009) ........................... 31

xv
List of Figures
Figure 1: Profile analytics for decision makers .......................................................................................... 3 Figure 2: Decision-making architecture (Passionned Group 2013) ................................................... 5 Figure 3: Applying technology to scientific data ........................................................................................ 6 Figure 4: Research methodology ................................................................................................................... 11 Figure 5: Overall basic architecture of the REDSS ................................................................................... 13 Figure 6 : Abstract sequential view of the chapters. ............................................................................... 14 Figure 7: Context maturity verses Model maturity ................................................................................. 18 Figure 8: DSS as a solution for model and context maturity ................................................................ 19 Figure 9: Importance of DSS for various sun-shadow use cases (Inspired from GoGeomatics
2013). ............................................................................................................................................................. 20 Figure 10: General scheme for expeditious management plan .......................................................... 28 Figure 11: Illustrates the stages involved in making the digital earth model .............................. 34 Figure 12: 3D model of the Zaragoza city ................................................................................................... 35 Figure 13: BI modules for REDSS (Olszak and Ziemba 2007). ............................................................ 39 Figure 14: Conceptual Architecture of REDSS ecosystem ..................................................................... 41 Figure 15: Illustrates decomposing architectures into components .............................................. 42 Figure 16: Star schema for Shadow cube .................................................................................................... 44 Figure 17: User maturity verses Data maturity ........................................................................................ 45 Figure 18: Star schema for Wind atlas ......................................................................................................... 46 Figure 19: Venn diagram for Wind and Solar energy location............................................................ 47 Figure 20: Interface of Energy2people application. ............................................................................... 54 Figure 21: Multiple options to analyse the solar radiation data ........................................................ 55 Figure 22: Data flow diagram. ......................................................................................................................... 56 Figure 23: Load process in detail. .................................................................................................................. 57 Figure 24: Scraper class diagram.................................................................................................................. 58 Figure 25: Interpolation process class diagram. ...................................................................................... 59 Figure 26: ETL using ESRI-Shapefiles. .......................................................................................................... 60 Figure 27: Application example: Zaragoza. ................................................................................................ 60 Figure 28: SDW conceptual model................................................................................................................ 61 Figure 29: SDW logic model ............................................................................................................................ 62 Figure 30: Abstraction of the future goal. ................................................................................................... 63 Figure 31: Future SDW logic model. ............................................................................................................. 63 Figure 32: Future SDW logic model .............................................................................................................. 64 Figure 33: Aggregate tables design ............................................................................................................... 65 Figure 34: Business logic class diagram. ..................................................................................................... 66 Figure 35: Web Scraper configuration file. ................................................................................................ 67 Figure 36: How Scraper interacts with the NASA website. .................................................................. 68 Figure 37: First NASA website page. ............................................................................................................. 69 Figure 38: Second NASA website page. ........................................................................................................ 70 Figure 39: The text file with the renewable energy data. ..................................................................... 70 Figure 40: Interpolation configuration file. ............................................................................................... 72 Figure 41: Example of interpolations levels. ............................................................................................. 72 Figure 42: The summary of the Interpolation process. ......................................................................... 73 Figure 43: Graphic summarizing Load process. ....................................................................................... 74 Figure 44: ETL flow implementation in Geokettle .................................................................................. 75 Figure 45: A graphic view of the implemented cube. ............................................................................. 77 Figure 46: XML file of the implemented cube............................................................................................ 78 Figure 47: XML file with the future spatial dimension. ......................................................................... 79

xvi
Figure 48: NREL single zoom visualization (top) Energy2people multi zoom visualization
(bottom). ....................................................................................................................................................... 85 Figure 49: Energy2people multiscale geographical representation of data ................................. 86 Figure 50: Energy2People visualization formats .................................................................................... 87 Figure 51: Graphical relationship of thesis chapters, questions (Q) & contributions (C) ........ 89 Figure 52: Checkerboard graphs for Global Horizontal Irradiance (Kaku and Potter 2009). 93

xvii
Nomenclature
BI Business Intelligence
BPM Business Process Management
CSS Cascading Style Sheets
DAO Data Access Object
DSS Decision Support System
DEM Digital Elevation Models
DTM Digital Terrain Models
DNI Direct Normal Irradiance
DOM Document Object Model
ER Entity Relationship
ETL Extract Transform and Load
GRASS Geographic Resources Analysis Support System
GHI Global Horizontal Irradiance
HOLAP Hybrid Online Analytical Processing
HTTP Hypertext Transfer Protocol
IEA International Energy Agency
IRENA International Renewable Energy Agency
JAI Java Advanced Imaging
JAK Java API for KML
LIDAR Light Detection and Ranging
MDX Multidimensional Expressions
MOLAP Multidimensional Online Analytical Processing
MCDA Multi Criteria Decision Analysis
NASA National Aeronautics and Space Administration
NREL National Renewable Energy Laboratory
OLAP Online Analytical Processing
xviii
OGC Open Geospatial Consortium
PV Photovoltaic
QA Quality Assurance
QC Quality Check
ROLAP Relational Online Analytical Processing
REDSS Renewable Energy Decision Support System
SDI Spatial Data Infrastructures
SDW Spatial Data Warehouse
SOLAP Spatial Online Analytical Processing
SRID Spatial Reference System Identifier
SPA Sun position Algorithm
VGI Volunteered Geographic Information
Chapter 1
INTRODUCTION
Earth is affected by various natural phenomena such as natural calamities, disasters and by
human actions like urbanization, pollution, etc. All these activities tremendously affect earth’s
natural resources leading to shortage of resources. One such major issue is exhaustive usage of
fossil energy and its adverse impact on our environment (Jinux and Somani 2010). Therefore, it
is imperative to seek for secondary clean energy resources to meet our needs and reduce the
dependence on fossil energy resources. As per the Table 1, transforming from fossil energy
infrastructure to clean renewable energy resources such as wind, solar and hydro will be
environment friendly as there is little global warming emissions and reduces dependence on
fossil energy sources. Renewable energy is a natural source of energy that has substantial
benefits as it provides reliable energy system, stable energy prices, jobs, economic benefits
and is environmentally friendly (Ren and Xue 2010). Essentially, there are two kinds of
renewable energy sources: continuous (biomass, geothermal, and hydro) and intermittent
(solar and wind) (C2es 2012).
The study on energy resources and their environmental impact is very essential for the
development of a sustainable society (Jordanger et al. 2005). Current energy production is
mainly depended on fossil energy, which is the main source for emission of green house gases
such as CO2 (Maaßen et.al 2011). This is evident from Table 1; it also shows different sources
of energy and their estimated CO2 emissions. The use of renewable energy spares
conventional energy resources such as oil, coal, and natural gas from over exhaustion and
reduces environmental pollution (Zhao and Ma 2011).
Just like any other sources, usage of renewable energies also has its own benefits and
limitations. Renewable energy sources are clean and environmental friendly, freely available
abundant regenerative resources (Goel et al. 2010). These resources can even generate power
in remote areas with zero or low negative impact on the environment and has substantial
benefits on health, climate and economy (Mohideen 2012). On other hand, it is not
economical to transport renewable energy to longer distance; it is not a stable supply source,
which results in demand and supply imbalance (Jinxu and Somani 2010, Nagaraj 2012). In
addition, frequent changes in renewable energy policies and natural calamities affects on
renewable energy farms and eventually on the commercial aspects of the industry (Xia and Xia
2010). However, as per the Key World Energy Statistics from the International Energy Agency
(IEA), there is steady increase in usage of renewable energy, which shows as a positive sign for
development in this sector (International Energy Agency 2011).

INTRODUCTION 2
Technology Capacity/configuration/fuel Estimate (gCO2/kW
h) Wind 2.5MW, offshore 9
Hydroelectric 3.1 MW. reservoir 10 Wind 1.5 MW, onshore 10 Biogas Anaerobic digestion 11
Hydroelectric 300 kW, run-of-river 13 Solar thermal 80 MW, parabolic trough 13
Biomass Forest wood Co-combustion with hard coal 14 Biomass Forest wood steam turbine 22 Biomass Short rotation forestry Co-combustion with hard
coal 23
Biomass Forest wood reciprocating engine 27 Biomass Waste wood steam turbine 31 Solar PV Polycrystalline silicone 32 Biomass Short rotation forestry steam turbine 35
Geothermal 80 MW, hot dry rock 38 Biomass Short rotation forestry reciprocating engine 41 Nuclear Various reactor types 66
Natural gas Various combined cycle turbines 443 Fuel cell Hydrogen from gas reforming 664
Diesel Various generator and turbine types 778 Heavy oil Various generator and turbine types 778
Coal Various generator types with scrubbing 960 Coal Various generator types without scrubbing 1050
Table 1: Different sources of energy and their CO2 emissions (Maaßen et.al 2011)
As per the Table 1, solar energy is one of the best forms of renewable energy. Sun is the
natural and vital source of human existence on the earth and it impacts all chemical, physical
and biological processes. One hour of the sun’s energy on the earth is enough to power the
entire planet for a year (Sharpe 2003). Sun’s energy or solar radiation and its geographical
presence are measure to determine potential solar energy investments and development
strategies (Shunbao et.al 2012). Solar energy is one of the eco-friendly energy production
technologies, which reduces greenhouse gas emissions and improves environmental
conditions of the society (Hohmeyer 1994, Al Otaibi and Al Jandal 2011). Besides, sun being an
energy source, it also has very interesting relation with earth and objects on the surface of the
earth. The idea of connecting and mapping this interesting relationship led to formulate the
central research theme of this thesis. The sun’s position, it’s casting shadows, its topological
relation; mapping this data to the topographic data is vital for various existing uses like
photovoltaic cells and also for various other application scenarios presented in this thesis.
In general, decision-making is process of selecting the best viable option from a set of different
possible ways of doing things. Profile analytics is a way to analyse, assess a dataset, a person
or a product based on the profile historic for decision-making (Schiaffino and Amandi 2009).
Profile analytics can be defined as analysing historical records to identify data patterns and
behaviours over a period of time and location for decision-making process. For example, to
hire a professional for a job, usually requirements will be number of years of experience, past
records, kinds of projects, valuable contributions made in the projects, location and
3 INTRODUCTION
qualifications. Location is also a very important to hasten the progress of decision-making. For
some key positions in a project, international experience is must as it adds value to the
business. Whereas, for roles like field engineers, it is important to hire local people for various
reasons like local language proficiency, better ground truth expertise etc. To screen for best
candidate, Human Resources team needs all historical records of the candidature to analyse
the performance, eligibility criteria and values. In addition, a historical trend of a person is also
necessary for internal programs like Performance Improvement Plan to monitor and improve
the performance of an employee (University of Texas, 2013). Similar mechanism applies to
datasets as well for getting expected results and budget estimation. Likewise, study on
spatiotemporal characteristics of the data should aid in having different views on data for agile
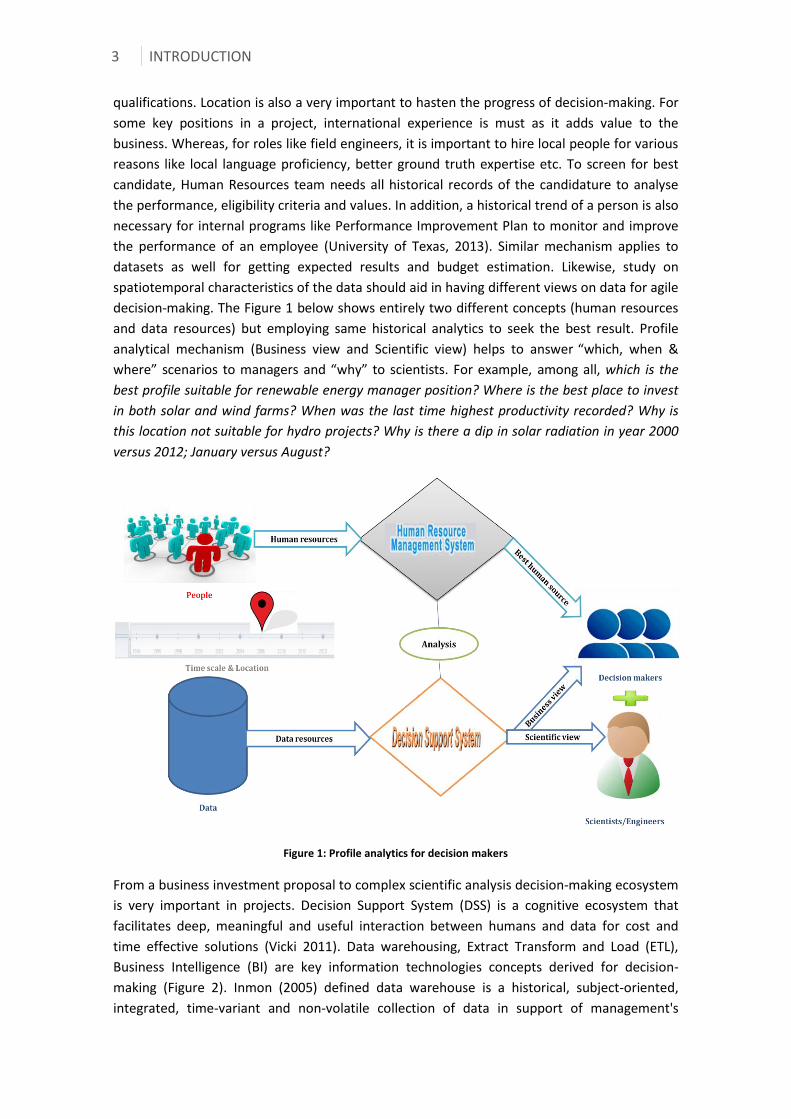
decision-making. The Figure 1 below shows entirely two different concepts (human resources
and data resources) but employing same historical analytics to seek the best result. Profile
analytical mechanism (Business view and Scientific view) helps to answer “which, when &
where” scenarios to managers and “why” to scientists. For example, among all, which is the
best profile suitable for renewable energy manager position? Where is the best place to invest
in both solar and wind farms? When was the last time highest productivity recorded? Why is
this location not suitable for hydro projects? Why is there a dip in solar radiation in year 2000
versus 2012; January versus August?
Figure 1: Profile analytics for decision makers
From a business investment proposal to complex scientific analysis decision-making ecosystem
is very important in projects. Decision Support System (DSS) is a cognitive ecosystem that
facilitates deep, meaningful and useful interaction between humans and data for cost and
time effective solutions (Vicki 2011). Data warehousing, Extract Transform and Load (ETL),
Business Intelligence (BI) are key information technologies concepts derived for decision-
making (Figure 2). Inmon (2005) defined data warehouse is a historical, subject-oriented,
integrated, time-variant and non-volatile collection of data in support of management's

INTRODUCTION 4
decision making process. Various authors like Vijayendra and Meiliu (2013) defined ETL is a
process to extract data from diverse data sources, transform the extracted data as per the
operational needs and load the transformed data in data warehouse. BI is defined as
technology for data gathering, storing, analysing and dissemination of the information for
timely and fact-based decisions (Barone et al. 2010). BI functionality broadly includes the
activities of decision support systems, query and reporting, Online Analytical Processing
(OLAP), statistical analysis, forecasting, and data mining (Ciobanu et al. 2010). Inatlas1 is a
company based in Barcelona which is trying to analyze and categorical present all the business
data of Spain to its stakeholders. However the company is still evolving to efficiently handle
the big data and translate the data into meaningful information. Translating the analyzed
results into something the science and business community can understand is challenging. This
can be achieved by imbuing BI functions in any decision-making ecosystem. DSS based on BI
functions such as data aggregation, large-scale integration, and analytical capabilities enables
data trends, quick computation of complex views facilities business managers to reach a
decision (Tong et al. 2008). Thus many management decisions and scientific analysis can be
significantly influenced by DSS which is based on BI functions as this strategically analyses the
profiles for guiding decision-making.
The adoption of BI functions to the spatial domain yields interesting results for decision-
makers (Bédard et al. 2001). On a fundamental level, location based information technology;
identifying spatiotemporal patterns are compelling assets for most of the projects. For
example, there will be several scientific and business factors that need to be considered in
setting up renewable energy plants. In a given area, it is necessary to delve for factors such as
best energy source, site selection, operation and maintenance costs. On other hand, scientific
analysis like the areas with a good amount of solar radiation, average wind speeds, etc are
location and time dependent. Martinot (2002) and Twiddle and Weir (2006) highlighted
inappropriate selection of location and technical risks of wind farms that are damaging the
nature around the wind farms and vice versa. Thereby, before venturing into the projects
location based information technology is vital to study the ground truth and for further
investments. As per Facebook Chief Operating Officer Sheryl Sandberg “Local is huge, it’s the
holy grail of the Internet. The problem with local businesses is that they’re not very tech savvy.
Something like 40% of them have no web presence at all.” (Techcrunch 2012). Therefore
breakthrough developments in geospatial technologies and the increasing availability of
Spatial Data Infrastructures (SDI) make geoinformation a business and a decisional element to
the management (Bejar et.al 2012). Hence, it is important to have a management plan to
factor in practical and feasible data sources, in building geo application for various application
scenarios. Rivest et.al (2003) aforesaid that geo applications are not well developed for
decision making as they are often used at the operational level. BI functions like OLAP, which is
a very popular category of decision-making tools, have facilities for interactive and intuitive
exploration and analysis of data with multi view capabilities (Bédard et al 2001). To properly
understand technologies rudiments (BI, Data warehouse, ETL) for both business and scientific
data analysis, one must start with the right kind of conception. These technologies leverages
to answer questions like "Would this technology help me to make my analysis fast to socialize
1 http://www.inatlas.com/en/about_inAtlas
5 INTRODUCTION
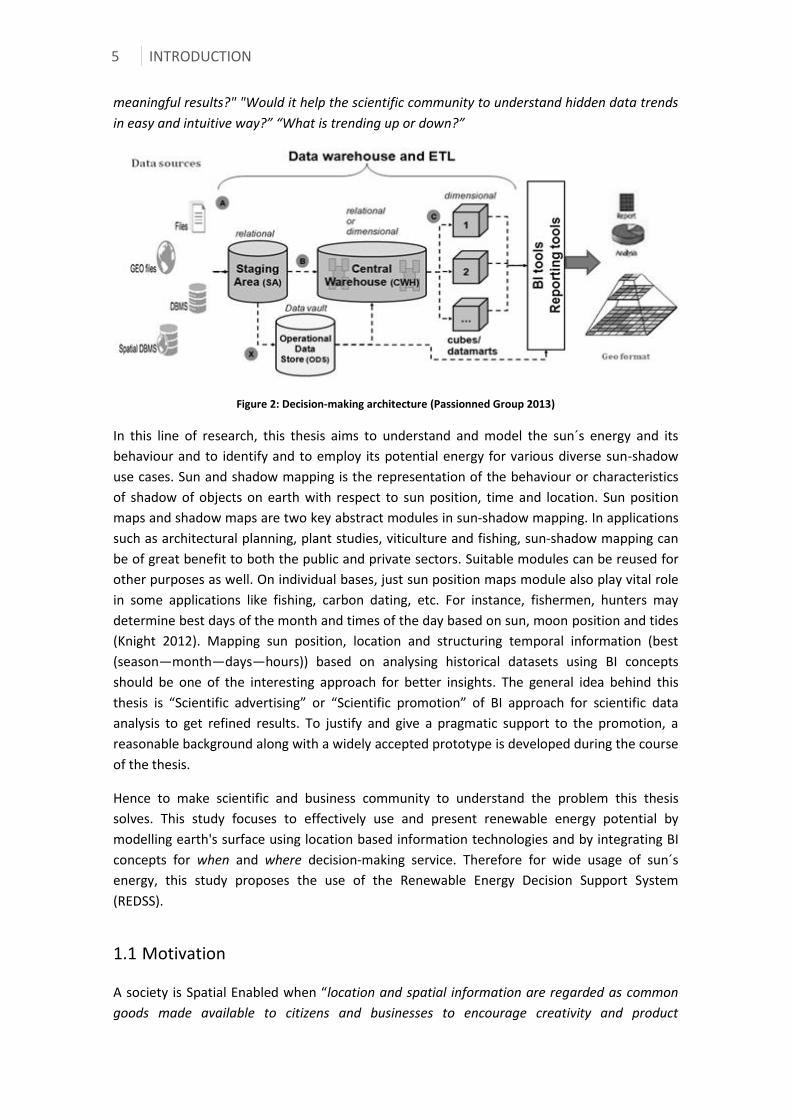
meaningful results?" "Would it help the scientific community to understand hidden data trends
in easy and intuitive way?” “What is trending up or down?”
Figure 2: Decision-making architecture (Passionned Group 2013)
In this line of research, this thesis aims to understand and model the sun´s energy and its
behaviour and to identify and to employ its potential energy for various diverse sun-shadow
use cases. Sun and shadow mapping is the representation of the behaviour or characteristics
of shadow of objects on earth with respect to sun position, time and location. Sun position
maps and shadow maps are two key abstract modules in sun-shadow mapping. In applications
such as architectural planning, plant studies, viticulture and fishing, sun-shadow mapping can
be of great benefit to both the public and private sectors. Suitable modules can be reused for
other purposes as well. On individual bases, just sun position maps module also play vital role
in some applications like fishing, carbon dating, etc. For instance, fishermen, hunters may
determine best days of the month and times of the day based on sun, moon position and tides
(Knight 2012). Mapping sun position, location and structuring temporal information (best
(season—month—days—hours)) based on analysing historical datasets using BI concepts
should be one of the interesting approach for better insights. The general idea behind this
thesis is “Scientific advertising” or “Scientific promotion” of BI approach for scientific data
analysis to get refined results. To justify and give a pragmatic support to the promotion, a
reasonable background along with a widely accepted prototype is developed during the course
of the thesis.
Hence to make scientific and business community to understand the problem this thesis
solves. This study focuses to effectively use and present renewable energy potential by
modelling earth's surface using location based information technologies and by integrating BI
concepts for when and where decision-making service. Therefore for wide usage of sun´s
energy, this study proposes the use of the Renewable Energy Decision Support System
(REDSS).
1.1 Motivation
A society is Spatial Enabled when “location and spatial information are regarded as common
goods made available to citizens and businesses to encourage creativity and product

INTRODUCTION 6
development” (Florczyk 2012). Applying state-of-art and cross-functional technologies to
transform scientific data into value added information. Scientific data is highly valuable for
both the research studies and enterprise solutions. For example, fields such as environmental
science are multidisciplinary fields which deal with different subjects, problems, data,
technologies and people. A holistic DSS as proposed in this thesis is vital to study the behavior
of the scientific data. Spatial enabled DSS focus on investigating mechanism by learning from
historical data trends and spatiotemporal patterns for intellectual traction over complex
subjects. Figure 3 highlights important technical advancements which will help to reveal
interesting patterns and hidden trends in the scientific data. In relation to the main theme of
this thesis, some computer science technologies like data cubes for spatial data and visual
abstraction, interactive reports, analytical tools are discussed. These concepts are primarily
designed and used to reveal business facts and figures for the managerial team. On the other
side, it also has potential to reveal scientific data behaviors over time and location and reasons
for the behavior. Like explained in the above section (Figure 1) data behaviors are very
important for investments, stakeholders demand and management studies whereas study on
reasons behind the data behaviors are vital for scientific analysis and further technical
developments.
Figure 3: Applying technology to scientific data

7 INTRODUCTION
Analysing air quality data is a tedious process as it requires considerable processing of raw
observation/model data before they can be used for decision-making process (Husar and
Hoijarvi 2007). Hypothesize use case explanation based on the method posed in this thesis for
monitoring air quality, modelling the air quality at different geographical levels (city—
province--country), and its patterns at different time periods. This kind of modelling will reveal
the variations of the air quality hierarchical in a structured format. In addition, it helps in
prioritizing the locations that needs immediate attention and planning preventive measures to
control the air pollution. To figure out the reasons behind the behaviors might need much
deeper analysis and the complexity varies and depends on case-to-case and need bases. For
the air quality modelling, it is important to integrate data about the traffic density, industries
in and around etc. In support of making proposed technology more convincing, this thesis
presents a short description about a real time project called Tambora developed by the staff of
University of Leipzig (Borel and Steller 2012). Tambora is a study on climatic trends based on
historical climatology database. These kinds of research depend on the study of historical
variations and trends hence it is important to collect and integrate diverse and big data. Data
maintenance and storage is definitely a major challenge and that is clearly identified and
addressed in Tambora. This thesis also identifies that the communication of scientific
information (visualization techniques) in more easy and understandable format is very
important and necessary. Extracting and presenting the requested information with minimal
response time from big datasets is not an easy task. Overall, there are various other challenges
such as data consistency, storing, maintenance, updating, scalability, processing requested
information, latency effects, communication strategies and interactive reports that are need to
be addressed for a complete application. Empowering scientific applications like Tambora with
technologies like BI will make scientists and business people for making faster, productive and
sustainable decision-making. Thus, this thesis is strongly motivated by empowering BI
capabilities to scientific data analysis will definitely be a path-breaker for substantive and
sustainable results.
On the other aspect, Open business concept was also a strong motivation for this thesis. Open
business is an economical approach to business activities as this is based on Open source
software’s, tools, Web 2.0, free data sources, crowd souring, open standards and open
innovation (Gao and Zhang 2013). Data and software infrastructure is the key essence for the
development of any project idea or application. There are several factors such as budget,
headcount, time and infrastructure that one should consider while executing a project.
Estimation of project budget, duration and finding right funding source is very challenging
from a business perspective. Projects with very limited budget, start-up companies seek
economical methods to serve the purpose or initially to prove their technical capabilities. For
such projects, free software, open tools, open data play instrumental role in achieving the
business and technical goals. Thus, this thesis aims to imbibe all these (technology + open
business) concepts to REDSS. REDSS can be developed by modelling the earth’s surface for
ground truth, sun position and BI concepts such as layered structuring and intuitive reports for
sun-shadow knowledge-based component. Due to limitations stated in Section 1.5 REDSS
concept posed in thesis primarily focus on modelling sun energy and its radiation.
The Sun’s radiation is a freely available resource throughout the whole planet. Even though
the sun´s energy available worldwide, it is evident that solar energy is more abundant near the

INTRODUCTION 8
tropics (Maaßen et al. 2011). Depending on geographical location and climatic conditions, solar
intensity will vary. Therefore, an investment into applications like photovoltaic (PV) power
plants in places near to tropics and equator rich with solar intensity will be profitable and
require less time for amortization.
Primarily, it is important to acquaint and select suitable optimized location considering all
factors such as solar radiation intensity, climate, suitable land and economics. There are
models like Global atlas (IRENA 2013) and SimuSOLAR (2012) that give solar radiation and site
suitability information. Nevertheless, these models are restricted to experts, cover limited
geographical areas, are unadoptable to different use cases and lack of detailed intuitive
reports to the general public. However, extensive mapping of sun-shadow is very complex as it
involves diverse concepts, engineering challenges in integrating various data models of
different quality and quantity, financial considerations, etc.
1.2 Research objective
The objective of this research is to set forth the software architecture of Renewable Energy
Decision Support Systems in general and solar energy in particular. The key characteristic of
this software architecture approach is to be able to provide “low cost” DSS services in this
context. Let us make an analogy. Imagine that you are looking for buying or renting a house in
Spain. You want to analyse the characteristics of the building (e.g. dimensions, garden, more
than one building in the parcel) and its environment (e.g. connections, services). For
performing this task you can use the free data provided by the Spanish Cadastral office2 in
conjunction with free imagery from an ortophoto provider (e.g. PNOA3, Google4 or Bing5) and
free contextual data from other local, regional and national Government’s agencies (e.g. the
Zaragoza City Council6, the Aragon government7, the Cartociudad project8). If someone
integrates all these data sources in a system (e.g. the Spanish Spatial Data Infrastructure map
client9), you have a “low cost” Decision Support System for buying or renting a house. This
research work has as objective the development of a software architecture approach that
could provide a “low cost” Decision Support System when consumers need to make a decision
related to renewable energies, in particular solar energy systems, such as selecting the best
option for installing solar energy systems or deciding an investment in a solar garden.
As a significant part of this research process is the investigation on technologies like Data
warehousing to store huge amount of historical data, ETL to load the transformed data and BI
for structuring and reporting. On the other hand, focusing on Open business model, for
economical development of the product requires web service infrastructure, 3D data models,
2 https://www.sedecatastro.gob.es/ 3 http://www.ign.es/PNOA/ 4 http://maps.google.es/ 5 http://www.bing.com/maps/ 6 http://idezar.zaragoza.es/ 7 http://sitar.aragon.es/ 8 http://www.cartociudad.es/ 9 http://www.idee.es/

9 INTRODUCTION
Sun and shadow casting techniques and data sources. In the end, this work also identifies use
cases where DSS should be instrumental in solving market and scientific problems. Therefore,
this thesis aims to emphasis and adopt these technologies to propose one complete DSS for
best potential using of renewable energy.
1.3 Research questions
To accomplish the research objective, a detailed study on advantages and limitations of
existing sun-shadow solutions is made to identify the product gap. Then, investigating on the
various cross-domain technologies that can address the identified research questions is
studied.
Develop a methodological framework based on the above-stated assertions to guide end users
in their enterprise and scientific projects.
The whole intention behind the thesis is as stated above and a set of research questions is laid
beneath to fulfil the intention by answering them chapter by chapter.
Questions related to data:
Q1. How to choice best data making approach in creating cost-effective geo models?
Questions related to technology:
Q2. What is the product gap in existing approaches and solutions for sun-shadow
mapping?
Q3. How to assimilate and adopt Data warehousing and BI concepts for renewable energy?
Q4. How to structure and organize sun and shadow data?
Q5. What are the significant differences between the method proposed and other existing
global services?
Questions related to use cases:
Q6. What are the use cases of REDSS?
Q7. What are the benefits of REDSS to general public and experts?
1.4 Contributions
This research work aims to propose and design “World-class” DSS for renewable energy, in
specific to solar energy. To give a tangible or visible form to the contribution and approach
advocated, a web application that is based on principles of BI and Open business model is been
developed. The web application not only provides advanced location data but also offers
platform for some interesting local business avenues such as target advertisements or future
business investments. The word “World-class” is quite a substantial contribution to this thesis.
INTRODUCTION 10
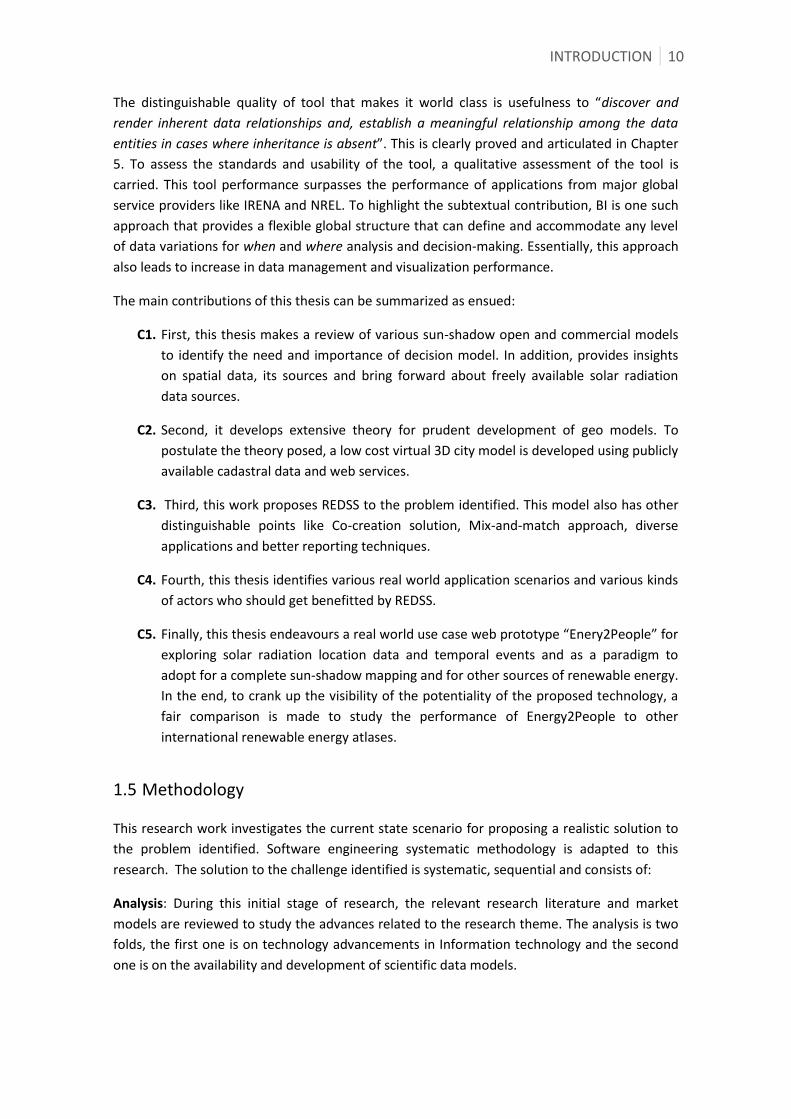
The distinguishable quality of tool that makes it world class is usefulness to “discover and
render inherent data relationships and, establish a meaningful relationship among the data
entities in cases where inheritance is absent”. This is clearly proved and articulated in Chapter
5. To assess the standards and usability of the tool, a qualitative assessment of the tool is
carried. This tool performance surpasses the performance of applications from major global
service providers like IRENA and NREL. To highlight the subtextual contribution, BI is one such
approach that provides a flexible global structure that can define and accommodate any level
of data variations for when and where analysis and decision-making. Essentially, this approach
also leads to increase in data management and visualization performance.
The main contributions of this thesis can be summarized as ensued:
C1. First, this thesis makes a review of various sun-shadow open and commercial models
to identify the need and importance of decision model. In addition, provides insights
on spatial data, its sources and bring forward about freely available solar radiation
data sources.
C2. Second, it develops extensive theory for prudent development of geo models. To
postulate the theory posed, a low cost virtual 3D city model is developed using publicly
available cadastral data and web services.
C3. Third, this work proposes REDSS to the problem identified. This model also has other
distinguishable points like Co-creation solution, Mix-and-match approach, diverse
applications and better reporting techniques.
C4. Fourth, this thesis identifies various real world application scenarios and various kinds
of actors who should get benefitted by REDSS.
C5. Finally, this thesis endeavours a real world use case web prototype “Enery2People” for
exploring solar radiation location data and temporal events and as a paradigm to
adopt for a complete sun-shadow mapping and for other sources of renewable energy.
In the end, to crank up the visibility of the potentiality of the proposed technology, a
fair comparison is made to study the performance of Energy2People to other
international renewable energy atlases.
1.5 Methodology
This research work investigates the current state scenario for proposing a realistic solution to
the problem identified. Software engineering systematic methodology is adapted to this
research. The solution to the challenge identified is systematic, sequential and consists of:
Analysis: During this initial stage of research, the relevant research literature and market
models are reviewed to study the advances related to the research theme. The analysis is two
folds, the first one is on technology advancements in Information technology and the second
one is on the availability and development of scientific data models.

11 INTRODUCTION
Problem specification: After the analysis stage, this fends foundation for the motivation and
challenges that need to be addressed in this line of research.
Conceptualisation: Eclectic approach is proposed to the challenge identified during the
conceptualisation stage.
Implementation: The challenge identified and the approach proposed is vast and complex. To
give a tangible benefit of the conceptualized architecture led to implementation and
development of a web application for exploring solar radiation.
Evaluation: The web application developed was submitted to an International Space Apps
contest conducted by National Aeronautics and Space Administration (NASA). This is a global
competition where 9,000 people, 83 cities and 44 countries participated. The application was
evaluated and recognized by a group of NASA scientists and other experts in renewable energy
sector. On the other hand, the tool developed is qualitatively compared with the
functionalities of other global energy atlas from International Renewable Energy Agency
(IRENA) and National Renewable Energy Laboratory (NREL).
Figure 4: Research methodology

INTRODUCTION 12
This thesis attempts to propose DSS for effective use of renewable energy sources. In light of
proposing technical solution, this work deals with various diverse subjects such as Information
technology, Geoinformatics and Renewable energy. However, when time, expertise and
resources are constraints, selection of technology and strategic execution must be done
carefully to realize the potential gains. As can be infer from the Figure 4, each stage of the
research plays vital role and are executed step-by-step. Essentially, it is classified in three main
stages: Requirement analysis or product gap, Design solution and Evaluation.
In the early stage of research (Stage 1 Chapter 1 & 2), a deep dive into the renewable energy
theoretical concepts and existing models are made to determine the requirements between
demand and supply on the current capabilities of the available models. Since business is about
economics, calculations, time, profits and losses, this thesis also proposed a concept called
Expeditious management plan for economical development of geo applications (Chapter 3).
After the analysis of the product gap in renewable energy field, next important step is to
identify the desired outcome and the process or technological approach to achieve the desired
outcome. In this process, this thesis identifies capabilities of Data warehousing and BI that will
provide the best process to fill the product gap. The technical advantages and capabilities
offered by these concepts are laid while characterizing the REDSS (Chapter 4).
Conceptual designs outlines desired features and layered architecture of the model. Based on
the cross-domain technology, a conceptual model (Stage2, Chapter 4) was developed to
address the product gap identified in Stage 1. In addition, various uses cases of the model
were identified and discussed in detail.
Combining the concepts, user requirements, functionality gap into a prototype (Stage 3,
chapter 5) was followed by qualitative assessment of the prototype compared to the other
major global services. Prototyping involves implementation of conceptual design to one of the
use cases highlighted in the thesis. The qualitative evaluation is based on a set of tool
performance evaluation parameters and served to:
Identify potential product gains in terms of tool performance and user experience with
the new design solution and developed prototype.
Discover more interesting views and mining more information than other existing
tools.
Explore more on visualization capabilities for different sections of users.
Generate more ideas for product improvement and development.
Conceptual model, prototype and empirical evaluations allowed addressing research objective
and research questions raised in the thesis. Since this research topic is vast and complex there
is a great deal of scope for recommendations, addition of more product features and future
work on the problem identified and user requirements (Chapter 6).

13 INTRODUCTION
1.6 Scope
The research will provide DSS for renewable energy using BI functions and geo data models as
shown in below conceptual Figure 5. However, most of the REDSS is based on theoretical
account since the data models involved are diverse, expensive and have very limited access to
freely available datasets. Similarly modelling diverse datasets are much complex, requires lot
of man-hours and engineering efforts which is much beyond the scope and time of this thesis.
Future work section in this thesis highlights various challenges, enhancements that can be
done to REDSS. Each of the future work list highlighted has potential to be a thesis topic for
engineering, post graduation and management studies. Broadly, below are some of the points
that limit the scope of the research.
Figure 5: Overall basic architecture of the REDSS
Data models: As shown in Figure 5, REDSS holistic ecosystem depends on various models such
as 3-dimensonal (3D) building models (a very detailed model which should also includes
external projections of the building), high resolution Digital Elevation Models (DEM), some
uses cases will also need other external data models like climate, solar, wind, vector data,
textual files etc.
Data quality: Quality Assurance (QA) and Quality Check (QC) on the in-house data models and
other external data models are quite challenging and tedious. For example, to prepare very
detailed 3D models, a very high resolution of satellite data and meticulous expert efforts are
required. It is not only a tedious process but also very expensive to procure high-resolution
satellite data. Imagine the expenses and human efforts required, if the 3D modelling has to be
done for an entire city, a region or a country. Though there are other alternative economical
methods but their quality results will not be a good match for some use cases like sun and
shadow navigation services. However the Chapter 3 of the thesis proposes an expeditious
management plan for developing low cost data models from free available data which may be
“good-enough” for some projects.
INTRODUCTION 14
Algorithms: Several algorithms and mathematical models need to be involved for complete
REDSS model. To cast sun position, its movement at different places on earth at different times
in a day requires sophisticated sun position algorithm. Shadow simulation with respect to sun
position, location and objects is very challenging because it has to work with diverse models
for expecting ground realistic results. QA and QC check mechanism on these algorithms, data
models efficiency and accuracy in both manual and automatic mode need a complex software
set up and expertise. Though there are good numbers of existing algorithms such as r.sun
module from Geographic Resources Analysis Support System (GRASS) 10 software but the
challenge still remains in customize and integrating the existing ones into one such complex
ecosystem.
Testing: Different uses cases may need different levels of data quality, simple to complex
computing algorithms, database, graphical user interface and other software infrastructure. All
these complex infrastructure needs to go through proper software and data testing
mechanism for realistic outcome.
Diverse concepts: REDSS is based on various concepts such as Renewable energy,
Geoinformatics, Computer science and Business management. One who deals with REDSS
complex model should be an expert who has experience in all the fields or group of people of
varying expertise in each field.
1.7 Thesis structure
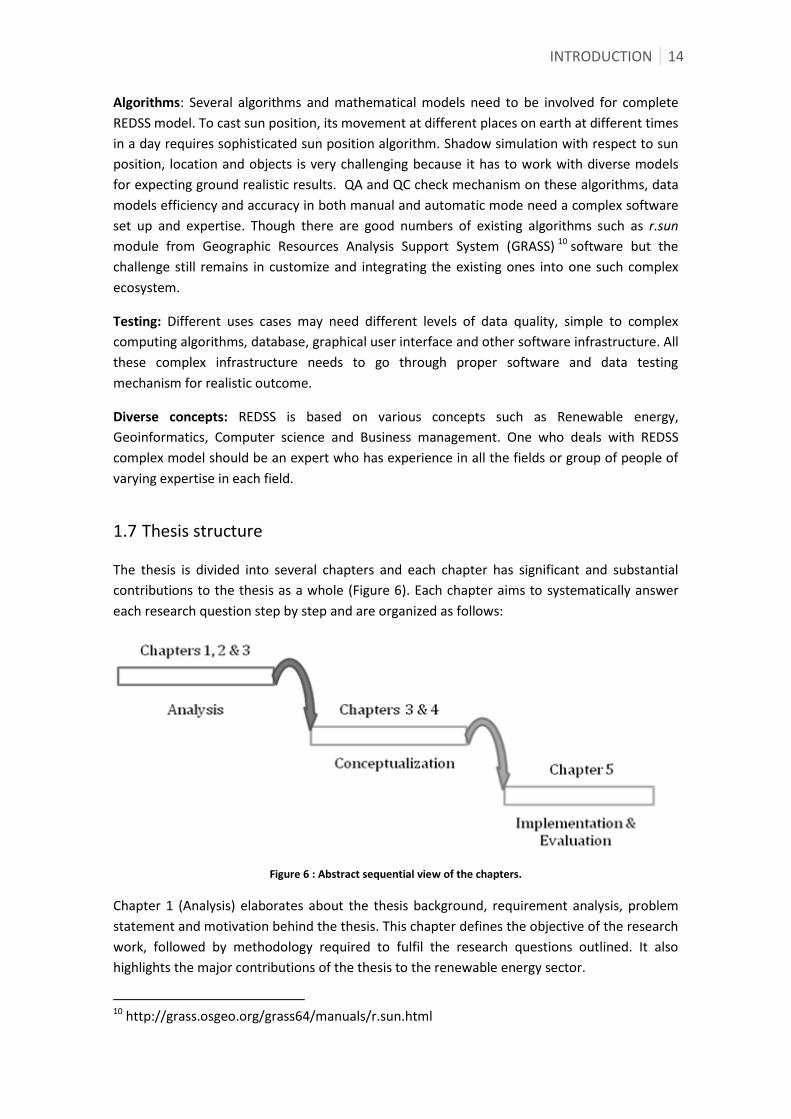
The thesis is divided into several chapters and each chapter has significant and substantial
contributions to the thesis as a whole (Figure 6). Each chapter aims to systematically answer
each research question step by step and are organized as follows:
Figure 6 : Abstract sequential view of the chapters.
Chapter 1 (Analysis) elaborates about the thesis background, requirement analysis, problem
statement and motivation behind the thesis. This chapter defines the objective of the research
work, followed by methodology required to fulfil the research questions outlined. It also
highlights the major contributions of the thesis to the renewable energy sector.
10 http://grass.osgeo.org/grass64/manuals/r.sun.html

15 INTRODUCTION
Chapter 2 (Analysis) reviews and categorises the existing sun-shadow models for requirement
analysis. Essentially this chapter is divided into 4 different sections Sun models, Shadow
models, Sun-shadow models and spatial data and it sources. Finally, in the end of the chapter,
the need to have a decision model for better understanding of renewable resources is
explained.
Chapter 3 (Analysis & Conceptualization) presents framework for extensive list of different
methods and data sources that are available in the geo market. The central important part of
the chapter is to illustrate in detail economical development of 3D data models after careful
reviewing of the framework proposed. These 3D data models indeed will be used in future
encompass out-and-out sun-shadow mapping.
Chapter 4 (Conceptualization) presents the detailed architecture and application use case
scenarios of REDSS. This chapter plays a fundamental role in the thesis as this is the gateway
for the solution to the problem identified and the future work. First, characterizing of the
model and significance of the each component of the REDSS is explained in detail. Further, it
highlights several key points of the REDSS model and its importance in real world applications.
Chapter 5 (Implementation & Evaluation) manifests the potential of the approach proposed in
the previous chapter. A web application is designed and developed to show the solar radiation
at different geographical areas, for different days, months and years. The web application
hierarchical stores humongous historical data and presents the data on graphical formats such
as maps, chart and tables. A brief qualitative assessment is made to test the distinguishable
quality of the approach proposed with other global tools in the market.
Finally, Chapter 6 concludes the thesis results, summarises the contributions and suggests
important future recommendations.


Chapter 2
STATE-OF-ART SUN-SHADOW MODELS
One of the important goals of this chapter is to do a research on the existing approaches and
solutions for sun-shadow infrastructure for analysing developing potentials. Sections (2.1 to
2.4) gave an overall idea required to introduce new product after reviewing existing models
and market potential. As a supplementary to this chapter (Section 2.5 and 2.6) discuss about
the type of solar radiation data sources, spatial data and its various data sources. Availability of
right data sources, diverse and big data challenges, data quality and proper infrastructure to
handle the data are major obstacles to most of projects. Hence, last section speaks about data
and its sources which is the essence of any project or application. It focuses on the data
sources and types that are particularly related to the thesis. After studying on the data
challenges and product gap paved way to lay foundation for proposing and designing REDSS.
Subsequently next chapter extensively tries addressing data making process by proposing a
framework called “expeditious management plan”. Summary section concludes the chapter.
2.1 Introduction
A preliminary assessment of the problem is discussed on bases of the Context, Model and
Solution. This chapter discusses about the technical situation (Context), existing technologies
(Model), data and a better approach (Solution) to address the research objective. Figure 7
plots the relationship between Model maturity and Context maturity to understand the
problems.
From the thesis point of view, Model maturity primarily focuses on three types of models: Sun,
Shadow and Sun-Shadow models. Sun model shows the sun´s position and its intensity of solar
radiation with respect to ground co-ordinates. Shadow model displays the shadow position
with respect to sun position. Sun and shadow model forecast sun positions and casting shadow
simulation for the ground objects. Although shadow and sun-shadow models are technical
similar as in both cases casting of the shadows is based on sun position. However in sun-
shadow model, quality of data, diverse data models, sun position and shadow casting
algorithms involved need to more mature and accurate to address more complex contexts.
Functionalities and limitations define the maturity of the model required for particular
context. For example some programming libraries such as SPA (Sun position Algorithm) from
NREL11 belong to Sun model but have potential to evolve and be adapted to Sun-shadow
model.
Context maturity: Schilit et al (1994) defined Context as “Knowledge about the user’s and IT
device’s state, including surroundings, situation, and to a less extent, location”. Context is
classified into four categories: Computing context, User context, Physical context and Time
context (Chen and Kotz 2000).
11 http://rredc.nrel.gov/solar/codesandalgorithms/spa/
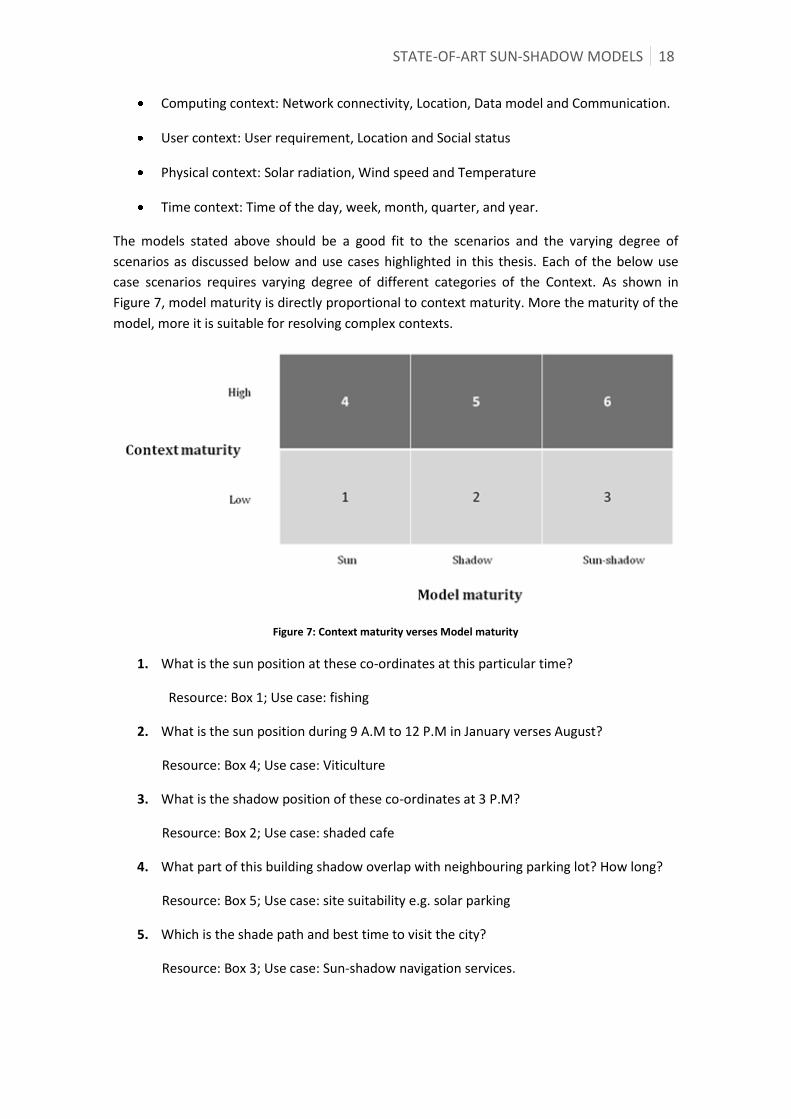
STATE-OF-ART SUN-SHADOW MODELS 18
Computing context: Network connectivity, Location, Data model and Communication.
User context: User requirement, Location and Social status
Physical context: Solar radiation, Wind speed and Temperature
Time context: Time of the day, week, month, quarter, and year.
The models stated above should be a good fit to the scenarios and the varying degree of
scenarios as discussed below and use cases highlighted in this thesis. Each of the below use
case scenarios requires varying degree of different categories of the Context. As shown in
Figure 7, model maturity is directly proportional to context maturity. More the maturity of the
model, more it is suitable for resolving complex contexts.
Figure 7: Context maturity verses Model maturity
1. What is the sun position at these co-ordinates at this particular time?
Resource: Box 1; Use case: fishing
2. What is the sun position during 9 A.M to 12 P.M in January verses August?
Resource: Box 4; Use case: Viticulture
3. What is the shadow position of these co-ordinates at 3 P.M?
Resource: Box 2; Use case: shaded cafe
4. What part of this building shadow overlap with neighbouring parking lot? How long?
Resource: Box 5; Use case: site suitability e.g. solar parking
5. Which is the shade path and best time to visit the city?
Resource: Box 3; Use case: Sun-shadow navigation services.
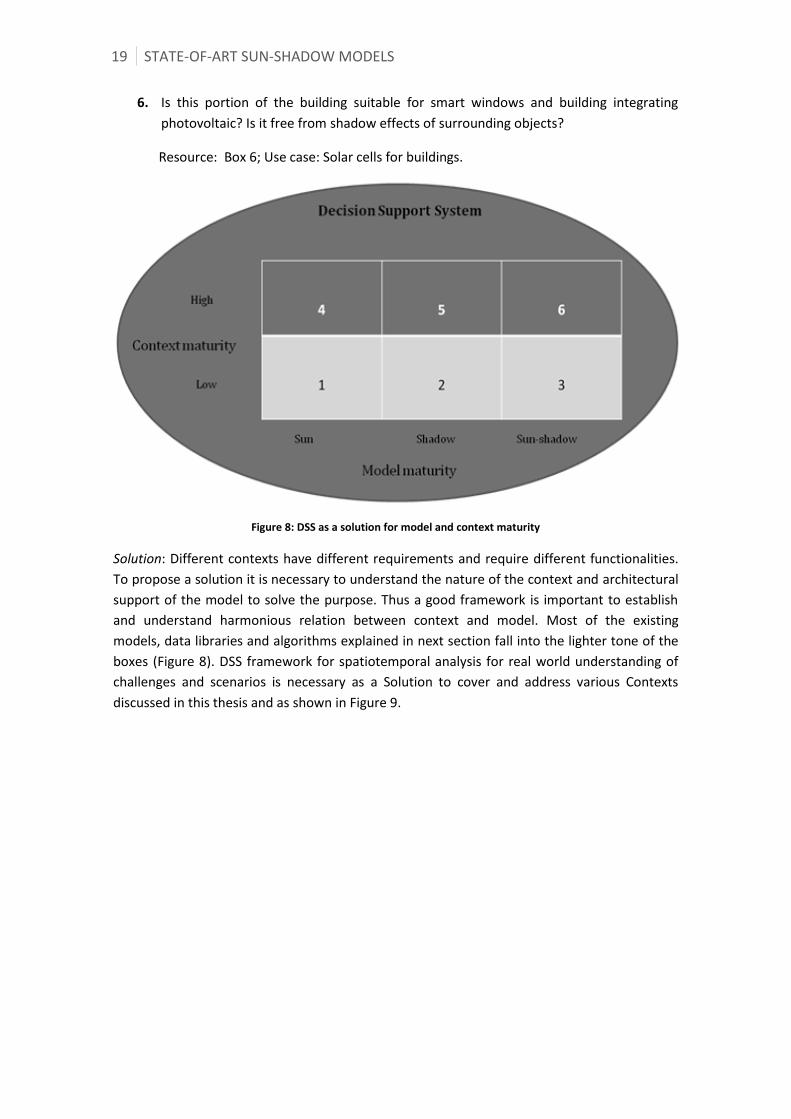
19 STATE-OF-ART SUN-SHADOW MODELS
6. Is this portion of the building suitable for smart windows and building integrating
photovoltaic? Is it free from shadow effects of surrounding objects?
Resource: Box 6; Use case: Solar cells for buildings.
Figure 8: DSS as a solution for model and context maturity
Solution: Different contexts have different requirements and require different functionalities.
To propose a solution it is necessary to understand the nature of the context and architectural
support of the model to solve the purpose. Thus a good framework is important to establish
and understand harmonious relation between context and model. Most of the existing
models, data libraries and algorithms explained in next section fall into the lighter tone of the
boxes (Figure 8). DSS framework for spatiotemporal analysis for real world understanding of
challenges and scenarios is necessary as a Solution to cover and address various Contexts
discussed in this thesis and as shown in Figure 9.

STATE-OF-ART SUN-SHADOW MODELS 20
Figure 9: Importance of DSS for various sun-shadow use cases (Inspired from GoGeomatics 2013).
2.2 Sun models
Challenges
Sun path temporal fragmentation per the user’s choice and events is one of the primary
challenges in sun models. Also, on the fly graphical breakdown of the Sun’s path and also its
radiation data based on the timeline and time segments to map various temporal events in a
day are some of the challenges identified in this model.
Techniques
There are different interesting and influential sun position algorithms such as Spencer, SPA,
Vant-Hull etc. These algorithms are either directly implemented or developed into the models
to calculate the Sun’s path based on the Sun Azimuth and Altitude, Date, Time and Location.
Blanco-Muriel et al. (2001) proposes PSA algorithm for sun position and compares with
various existing algorithms: Spencer, Pitmann, Vant-Hull, Walraven and Michalsky.
Based on their analysis, PSA algorithm is simpler and easier to compute and track the
sun position with higher accuracy.
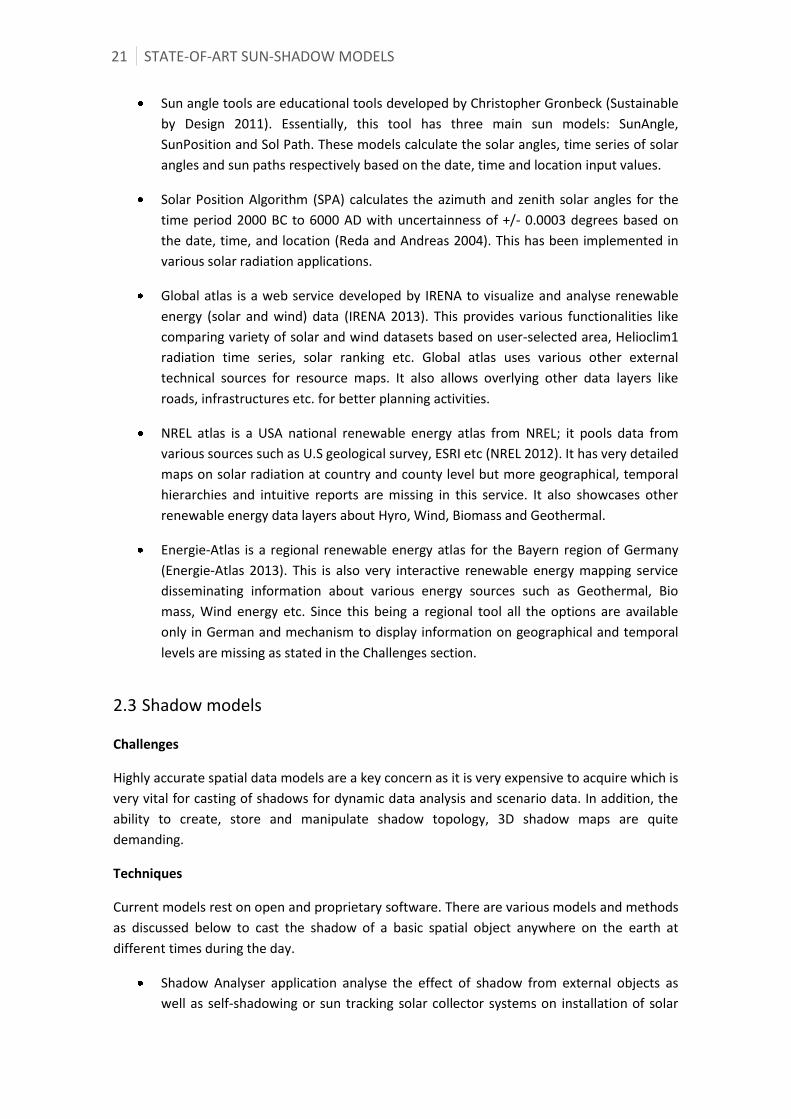
21 STATE-OF-ART SUN-SHADOW MODELS
Sun angle tools are educational tools developed by Christopher Gronbeck (Sustainable
by Design 2011). Essentially, this tool has three main sun models: SunAngle,
SunPosition and Sol Path. These models calculate the solar angles, time series of solar
angles and sun paths respectively based on the date, time and location input values.
Solar Position Algorithm (SPA) calculates the azimuth and zenith solar angles for the
time period 2000 BC to 6000 AD with uncertainness of +/- 0.0003 degrees based on
the date, time, and location (Reda and Andreas 2004). This has been implemented in
various solar radiation applications.
Global atlas is a web service developed by IRENA to visualize and analyse renewable
energy (solar and wind) data (IRENA 2013). This provides various functionalities like
comparing variety of solar and wind datasets based on user-selected area, Helioclim1
radiation time series, solar ranking etc. Global atlas uses various other external
technical sources for resource maps. It also allows overlying other data layers like
roads, infrastructures etc. for better planning activities.
NREL atlas is a USA national renewable energy atlas from NREL; it pools data from
various sources such as U.S geological survey, ESRI etc (NREL 2012). It has very detailed
maps on solar radiation at country and county level but more geographical, temporal
hierarchies and intuitive reports are missing in this service. It also showcases other
renewable energy data layers about Hyro, Wind, Biomass and Geothermal.
Energie-Atlas is a regional renewable energy atlas for the Bayern region of Germany
(Energie-Atlas 2013). This is also very interactive renewable energy mapping service
disseminating information about various energy sources such as Geothermal, Bio
mass, Wind energy etc. Since this being a regional tool all the options are available
only in German and mechanism to display information on geographical and temporal
levels are missing as stated in the Challenges section.
2.3 Shadow models
Challenges
Highly accurate spatial data models are a key concern as it is very expensive to acquire which is
very vital for casting of shadows for dynamic data analysis and scenario data. In addition, the
ability to create, store and manipulate shadow topology, 3D shadow maps are quite
demanding.
Techniques
Current models rest on open and proprietary software. There are various models and methods
as discussed below to cast the shadow of a basic spatial object anywhere on the earth at
different times during the day.
Shadow Analyser application analyse the effect of shadow from external objects as
well as self-shadowing or sun tracking solar collector systems on installation of solar
STATE-OF-ART SUN-SHADOW MODELS 22
energy equipment (Shadow Analyser 2011). For energy calculations, it has a provision
to manual input the climatic parameters. It also allows texture, but only for
visualization purpose. This analyser is suitable for very small areas but it might not
work for larger areas.
The model on the Find my shadow website calculates the height and position of the
sun anywhere in the world on any day and plots the shadows cast by the sun at
different times of the day (Find my shadow 2011). Based on Astronomy, calculations
can be made to find where the sun is relative to the earth's orbit and relative to you on
the earth's surface. It also allows us to see the shadows cast by objects. Sun’s Position
and shadow Length charts show position of the sun at the sunrise, sunset, hourly
position, it also displays length and direction of object shadow with respect to sun
position.
Gnomon model is a modelling tool implemented with the Easy Java Simulations
framework (ComPADRE 2011). It is distributed as a ready-to-run (compiled) Java
archive. This is a part of the Open Source Physics Project and is designed to make it
easier to access, modify, and generate computer models. It simulates the shadow cast
by a gnomon (the part of a sundial that casts the shadow) over the course of a day for
any day of the year and any latitude on Earth.
GRASS has two Sun modules namely r.sunmask and r.sun (Markus and Helena 2012,
Nguyen and Pearce 2010). r.sunmask module is used to cast shadow maps and,
calculates the Sun position using the SOLPOS2 algorithm from NREL. r.sun module is
used to calculate solar radiation maps.
2.4 Spatial Sun-Shadow models
Challenges
The complexity in synthesizing and integrating sun path model, spatial models and other
dynamic models like the solar radiation, climate is immense. Also, structuring of hierarchical
spatial databases is also quite complex and tedious.
Techniques
Many companies and research groups have been dealing with the models to cast the shadows
based on the sun’s path and geo location. All these models are dependent on the
characteristics of the building and ground DEM models.
Sunscapes is about the solar envelopes and the analysis of DEMs (Morello and Ratti
2009). This paper discusses about the Solar Envelope introduced by Knowles and
introduces isosolar surfaces. The authors propose isosolar techniques for casting more
easily and accurate shadows in complex urban areas based on image processing of
urban DEMs.

23 STATE-OF-ART SUN-SHADOW MODELS
The shadow-casting algorithm computes shadows for an arbitrary angle of lighting and
shadow volumes from DEM (Ratti and Richens 1999). It calculates shadows from the
sun for any given latitude, time of year, and time of day, using the usual astronomical
formulae. Sunlight parameters are derived from DEM by Image processing macros.
They are simple to write and impressively fast in urban areas depending on the
number of pixels in the image, but not on the geometric complexity.
HELIOS: Solar rights analysis system for apartment buildings objective is to
quantitatively compute the sunshine duration by using horizontal sun-path diagram
method and vertical sun-path diagram method (i.e. WALDRAM diagram method and
3D shadow diagram method) (Seong et al. 2006). This work also shows analytical
methods and considers various geometric parameters of the building characteristics.
Authors also presented necessary mathematical formulae and algorithms required to
develop the model.
Huellasolar is a Spanish sun maps portal that provides the online, desktop and
professional suite for viewing and for basic analysis of the solar radiations, sunlight
conditions for major Spanish cities (Huellasolar 2012).
Hofierka and Kanuk (2009) proposed a methodology based on open-source solar
radiation tools (r.sun solar radiation model and PVGIS estimation utility) and 3D city
models for assessment of photovoltaic potential in urban areas.
The Sun shadow applet is an interactive applet that displays the length and direction of
the shadow of a building, wall, tree for any location, date and time based on the height
of the objects (Giesen 2011). It also has other applets like the “Azimuth, Latitude, Hour
Angle, Declination” and “Elevation and Azimuth Applet”.
Tridicon Solar provides automatic creation of solar potential cadastre and also colour
classification of solar potential (Tridicon 2012). Site solar potential and shadow
calculations are based on aerial photographs, building footprints and Light Detection
and Ranging (LIDAR) data sources. Tridicon Solar allows users to perform calculations
on the digital map using address information like street names and house numbers.
SimuSOLAR calculates solar potential of building roof or citywide analysis based on the
3D city models (SimuSOLAR 2012). This application provides information on
orientation, inclination, size of roof surface, radiation amount per year, CO2 savings
and yield per year for each roof. Nevertheless, this is limited to only few cities in
Germany and Switzerland.
Sun area is an application that calculates solar potential from city to roof area on the
basis of aircraft scanner data and stereoscopic aerial photographs (Sun area 2012). To
calculate the solar potential of a roof, angle of the roof, its alignment and shade are
considered. Solar suitability, power, CO2 reductions, investment volume are calculated
by Sun area method. Just like SimuSOLAR, data and analysis is limited to German cities.
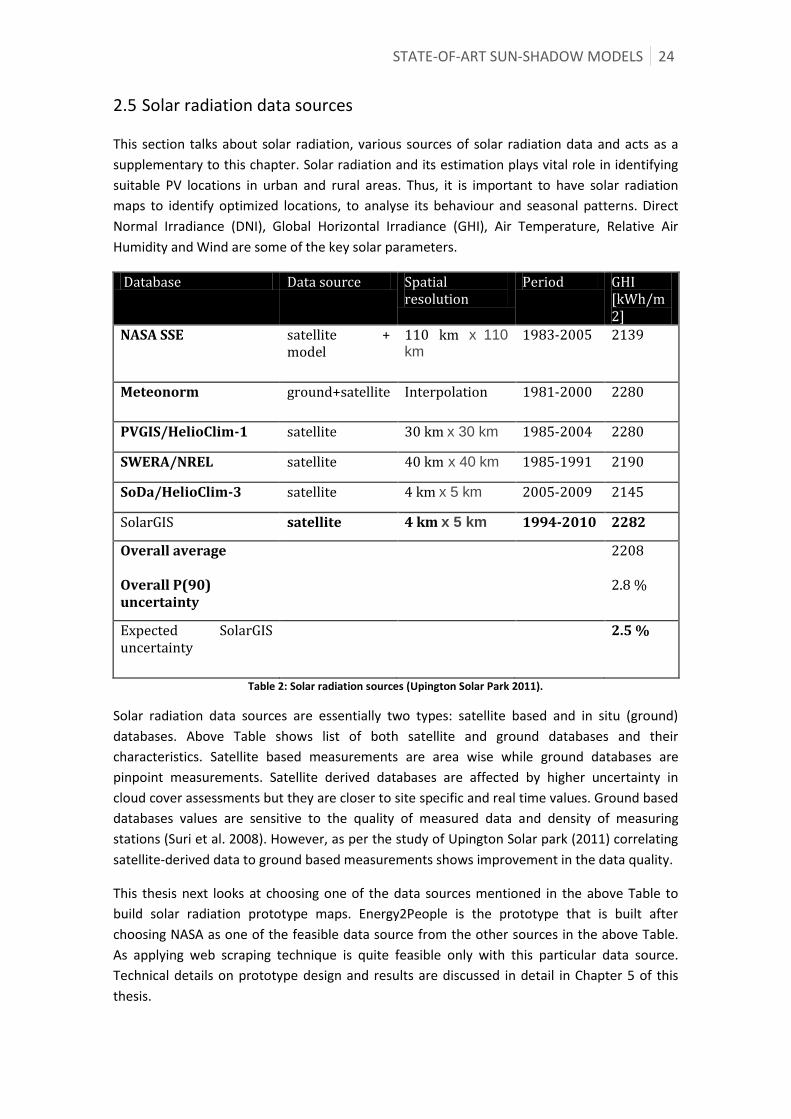
STATE-OF-ART SUN-SHADOW MODELS 24
2.5 Solar radiation data sources
This section talks about solar radiation, various sources of solar radiation data and acts as a
supplementary to this chapter. Solar radiation and its estimation plays vital role in identifying
suitable PV locations in urban and rural areas. Thus, it is important to have solar radiation
maps to identify optimized locations, to analyse its behaviour and seasonal patterns. Direct
Normal Irradiance (DNI), Global Horizontal Irradiance (GHI), Air Temperature, Relative Air
Humidity and Wind are some of the key solar parameters.
Database Data source Spatial resolution
Period GHI [kWh/m2]
NASA SSE satellite + model
110 km x 110 km
1983-2005 2139
Meteonorm ground+satellite Interpolation 1981-2000 2280
PVGIS/HelioClim-1 satellite 30 km x 30 km 1985-2004 2280
SWERA/NREL satellite 40 km x 40 km 1985-1991 2190
SoDa/HelioClim-3 satellite 4 km x 5 km 2005-2009 2145
SolarGIS satellite 4 km x 5 km 1994-2010 2282
Overall average Overall P(90) uncertainty
2208 2.8 %
Expected SolarGIS uncertainty
2.5 %
Table 2: Solar radiation sources (Upington Solar Park 2011).
Solar radiation data sources are essentially two types: satellite based and in situ (ground)
databases. Above Table shows list of both satellite and ground databases and their
characteristics. Satellite based measurements are area wise while ground databases are
pinpoint measurements. Satellite derived databases are affected by higher uncertainty in
cloud cover assessments but they are closer to site specific and real time values. Ground based
databases values are sensitive to the quality of measured data and density of measuring
stations (Suri et al. 2008). However, as per the study of Upington Solar park (2011) correlating
satellite-derived data to ground based measurements shows improvement in the data quality.
This thesis next looks at choosing one of the data sources mentioned in the above Table to
build solar radiation prototype maps. Energy2People is the prototype that is built after
choosing NASA as one of the feasible data source from the other sources in the above Table.
As applying web scraping technique is quite feasible only with this particular data source.
Technical details on prototype design and results are discussed in detail in Chapter 5 of this
thesis.

25 STATE-OF-ART SUN-SHADOW MODELS
2.6 Spatial data and its sources
Resource management is one of the key components of a project. Finding the right sources
and the optimal usage of these resources will economically benefit an organization. The
growing interactions with spatial data and its substantial usage in various domains makes it
increasingly significant in making initiative analysis, planning and collaborative decisions, from
managers, geo-scientists and to the common public (Goodchild 2009). From the study laid out
by Rajani (1996) to the recent study by Goodchild (2008), it is evident that spatial data is
widely being used for basic operations like visualization and querying rather than for modelling
or advanced analysis. Technical people along with the managers, who are not technical, need a
management plan in place to familiarize with the spatial data sources. Such plans not only
illustrate the merits and demerits of each method, but also facilitate choosing of the right
sources and in some scenarios, employing the merits of one source to another for a controlled
and effective resource planning.
Spatial data collection is very expensive (Krek 2003) and a vital component for mapping
activities. A survey held in Spain demonstrates that spatial data re-use by the companies, rates
Geoinformatics as one of the most active options (Aporta 2011). In addition, studies such as
Morten (2011) and GITA (2005) show that the sharing of data at no cost or paying a reasonable
amount saves human effort, time and financial resources for the project.
There are various data collection techniques for building the data models required by a
project. Remote Sensing, Photogrammetry, Surveying and Cartographic digitization techniques
employ their principles in creating the spatial data (Khagendra and Robert 1991, Omar and
Ayhan 2009). On the other hand, concepts like Spatial portals (Voyager 2011), SDI (GeoGratis
2011), spatial data providers like (KCSC 2011, SEC 2010, NEO 2011), and freelancing sites12 are
some of the platforms that provide no or low price data through web services or the data can
be downloaded in their standard formats. Further, EuroGEOSS is working on a project to
provide access not only to the data but also to various analytical models that can be re-used
for other application domains (EuroGEOSS 2011). In addition, Goodchild and Glenon (2010)
discussed crowd sourcing and Volunteered Geographic Information (VGI) as a source during
natural catastrophes. In these cases, the quality of data produced by the volunteers is equally
good or even better than that of the authoritative sources. Crowd sourcing applications like
Waze13 and, disaster response programs like the Sandy Humanitarian OpenStreetMapotosm14
are playing substantial role in generating spatial data. Social networking sites such as, Twitter
turns humans into sensors that provide real time community based data for natural disasters,
elections, games, etc. Thus, these entire users driven public services altogether brings in a new
addition to the data sources.
12 http://freegisdata.rtwilson. com/ 13 https://world.waze.com/ 14 http://sandy.hotosm.org/

STATE-OF-ART SUN-SHADOW MODELS 26
2.7 Summary
This chapter outlines various existing approaches and solutions in sun-shadow mapping. This
analysis identified the need, importance and the scope of improvement. Intuitive reporting
and detailed data structuring were lacking from the above-discussed models to address the
Context. A systematic and holistic sun-shadow approach received lower priority, which needs
to be addressed. Besides, most of the models are more confined to experts. The reach of sun-
shadow information was not made available to the public, where there are large benefits as
discussed in next chapters. A user friendly and powerful model in terms of ease of use,
reporting structure, data analysis and levels of aggregation to accommodate variations is
absent to all sections of the users. Dynamic integration of other heterogeneous models like
weather and climate were missing, which is essential for local insights and ground realities.
This work had identified DSS for renewable energy is feeble by the existing products and sees
substantial market opportunity as a Solution. This thesis also identifies Open business model
(software, data) as an economical asserts as development cost decreases by using existing
infrastructure, quality increases as user rely on the infrastructure that have been tested
already in various use cases and product time-to-market will be fast. Therefore, next chapter
as well focuses and discuss on open business model, management plan to do projects
economically.
On preliminary bases, to showcase the spatial BI approach, Energy2People prototype is built
which fits in Sun model category. Technical and conceptual details on this web services are
discussed in subsequent chapters. As a main objective of this thesis, to formulate DSS
(Solution) to address the key identifications and challenges (Model maturity and Context
maturity) as discussed in this chapter.

Chapter 3
DECISION MAKING ECOSYSTEM
This chapter presents Expeditious management plan, Workflow and Pragmatic concepts
(Section 3.1, 3.2 & 3.3). These concepts help to identify required data sources and define
workflow to choice best data making approach in creating cost-effective geo models. As
discussed in the Scope section of the introduction chapter, data quality and right data sources
limits the scope of the project. In order to resolve the problem to some extent, this chapter
presents the Data source framework (Section 3.4). This framework highlights the sources and
methodology from creating new data to spatial data sharing methods. Based on the
management concepts proposed and data sources framework, development of 3D digital
model of Zaragoza city (Section 3.5) is presented. Finally, the 3D digital model of Zaragoza city
will be used for various applications use cases in general and renewable energy studies in
particular.
3.1 General scheme for expeditious management plan
This section identifies a general management pattern for choosing a better data source taking
into account several aspects related with the objectives of the project used as an application
example in this chapter. A plan is a set of sequential steps along with the resources required to
accomplish an objective (Washington and Lees 2004). Further, a contextual concept called
pattern would also be a valuable and highly complementary to the plan concept. Martin (1997)
provides an insightful definition of a pattern “An idea that has been useful in one practical
context and will probably be useful in others”. Apart from solving specific problems, patterns
are also used in providing architectural outlines that may be reused in the development
process of a program (Gamma et al. 1995). The expeditious management plan described is the
result of deriving and incorporating plan and pattern concepts into geo-management for fast,
efficient and an economical way of building geo applications. This section discusses a solution
in geo project management by structuring it into three rudimentary components (Figure 10):
Workflow management, Pragmatic process and Data sources framework.
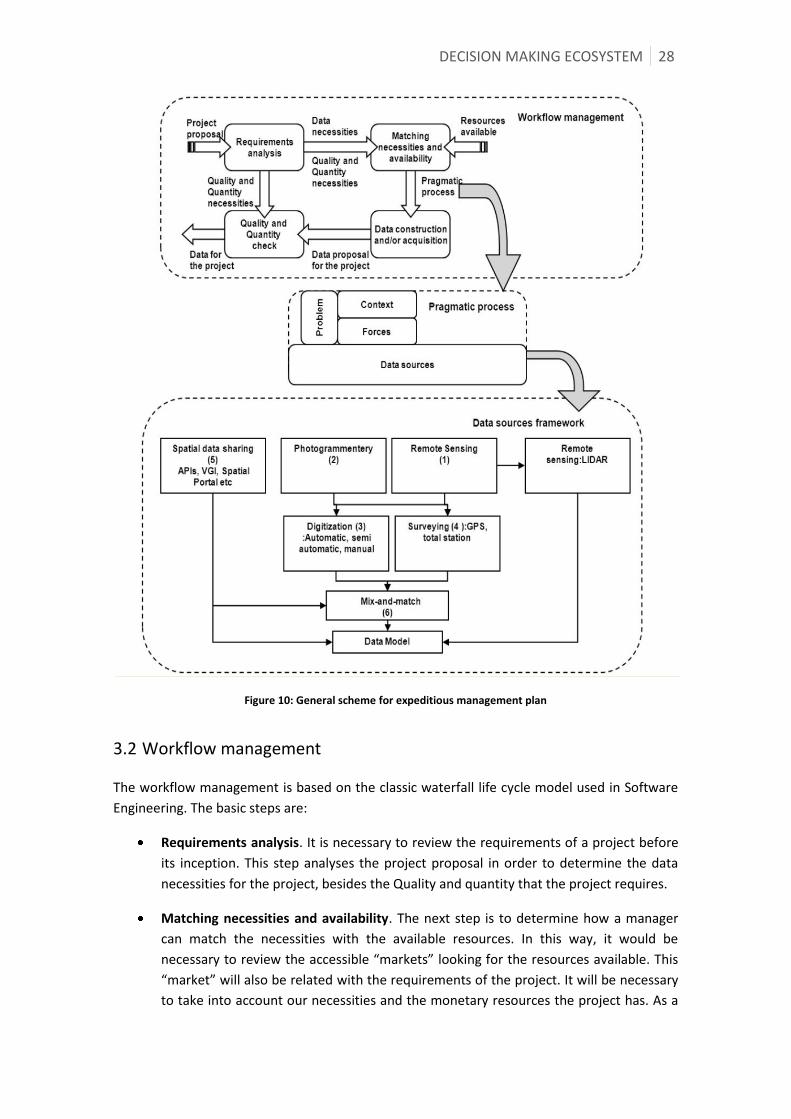
DECISION MAKING ECOSYSTEM 28
Figure 10: General scheme for expeditious management plan
3.2 Workflow management
The workflow management is based on the classic waterfall life cycle model used in Software
Engineering. The basic steps are:
Requirements analysis. It is necessary to review the requirements of a project before
its inception. This step analyses the project proposal in order to determine the data
necessities for the project, besides the Quality and quantity that the project requires.
Matching necessities and availability. The next step is to determine how a manager
can match the necessities with the available resources. In this way, it would be
necessary to review the accessible “markets” looking for the resources available. This
“market” will also be related with the requirements of the project. It will be necessary
to take into account our necessities and the monetary resources the project has. As a

29 DECISION MAKING ECOSYSTEM
result, a Framework path will be selected in order to determine the data resources
that will be used, and the data transformation processes to be applied. This
Framework path is a part of the Pragmatic process and Data sources framework
explained in the later sections.
Data construction and/or acquisition. By applying resource selection and
transformation processes established by the Framework path, the Workflow
management will provide a Data source proposal to be used for achieving the
objectives of the project.
Quality and Quantity check. Finally, before providing the data for the project, it will be
necessary to check the proposal in order to fulfil the Quality and quantity that the
project requires.
3.3 Pragmatic process
This process aids in selecting a data source that is minimalist, beneficial and useful to the
project. It is based on the following components:
Problem: Extending the software management viewpoint to Geo application leads to
identification of the problem which is in two folds:
(1) Context: The context in which the application has to be developed is based on its
objective and factors such as quality of data, method of acquiring the data,
timeframe, financial and human resources available. As per our application
objective, we develop 3D city models by reducing the process cost in terms of data
acquisition time and cost of the data.
(2) Forces: Constraints, like the availability of data, time, it’s fitness for use,
technology support, and costs to procure the data are some of the forces or
setbacks in an application development. Such forces in our project are the
unavailability of LIDAR data as per the project schedule, study area and the price of
data.
Based on the definition of the problem the data sources can be selected. We found a way to
achieve the objective of our application through the mix and match approach as described in
the sections below:
Data sources: Based on the problem identified, we present different approaches in obtaining
the data for building the digital earth below:
(1) Accessing the external datasets without hassles of creating and maintaining the
data by exploring readymade data using spatial portals, web services or other data
sharing technologies. For example, consider the Environmental mapping case
discussed in the above section.
(2) Using the existing readymade resources as base data can be made compatible by
deciding on the right mix of services and tools. For instance, NATO operations in

DECISION MAKING ECOSYSTEM 30
Libya15 or Hurricane application16 build spatial data from one source as base data
and non-spatial data from other sources. Online tools like GeoCommons17 where
users can make an analysis and visualize maps of one’s own data, various available
datasets and base maps. It also has a provision to download or integrate on the
websites. Likewise, in portals like Map tools18 programmers and users can find
various open source web tools, desktop tools, source codes and many other
potential resources that come handy in during building of applications.
(3) Choosing economically data collection techniques as compiled by the respective
authors. For example, (Table 3): portrays various 3D optical acquisition methods
based on the application requirements, (Table 4): shows the most suitable data
methods for various application domains. However, they may not be copper-
bottomed but they give an approximate idea.
(4) Mix and match approaches: The application objective can also be achieved by
making use of the benefits of any or all three approaches stated above. For
instance, the Geo marketing case explained in our earlier section or the concept
behind the Google Earth builder19. This approach is named as Mix-and- match and
explained in detail in the next section.
Number Application requirements Suggested techniques
1 3D data accuracy P
2 3D data details LS
3 Fully automated 3D data retrieval 3DCR/LS
4 Nighttime operation 3DCR/LS
5 Low equipment cost P/V/3DCR
6 Portability P/V/3DCR
7 Long measurement range LS
Note: P=photogrammetry; V=videogrammetry; 3DCR= 3D camera ranging; and LS= Laser
scanning.
Table 3: Suggested technology for 3D data based on the application requirements (Zhenhua and Ioannis 2009)
15 http://www.guardian.co.uk/news/datablog/interactive/2011/may/23/libyanatobombingnoflyzone 16 http://crisislanding.appspot.com/ 17 http:// geocommons.com/ 18 http://www.maptools.org/ 19 http://www.google.com/enterprise/earthmaps/builder.html

31 DECISION MAKING ECOSYSTEM
Table 4: Data sources and various application areas (Omar and Ayhan 2009)
3.4 Data sources framework
This Framework has been structured around the research on the optimized data sources to get
the desired readymade data or to customize already existing data for the project. In this
process six basic elements have been identified:
(1) Remote Sensing: Remote sensing is the science to sense and record information of
a remote object or area without any physical contact. Khagendra and Robert
(1991) state that this technology offers us a wide range of data sources from low
resolution to high-resolution satellite images. Studies such as Cary (2009) say that
optimal technologies like the LIDAR provide point data, which is used for widely
used in many building roof and terrain modelling (Verma et.al 2006). Undoubtedly,
this data source provides the best results. Nevertheless, factors like the cost
involved, unavailability of data for our study area and requirement of specialized
software and hardware to handle the enormous data were a setback.
(2) Photogrammetry: Photogrammetry is a scientific technique to measure and
determine the properties of the object, and to add 3D dimensional (height) co-
ordinates to the 2D objects. The studies of Zhenhua and Ioannis (2009) and NCHRP
(2003) state that the data obtained by the Photogrammetry methods are accurate,
updated and flexible. These characteristics of a data source provide a good option
in achieving the objective. Nevertheless, complimentary web service for accessing
orthophotos could be a better option to ease the project resources.
(3) Digitization: Digitization is the process of converting raster data (satellite/aerial
images) to vector data (line, points, polygons) for mapping and other ground truth
activities. The NCHRP (2003) report explains that this technique gives an accuracy
of five to 50 feet; it is less expensive and faster than other conventional methods.
Converting the paper maps to spatial data using automatic, semi automatic and

DECISION MAKING ECOSYSTEM 32
manual methods, can be an option for some applications. As mentioned in the
above section, the advent of specialized software such as R2V20 and WinTopo21
saves a lot of human effort and time. As a secondary option, this could be
combined to the photogrammetric technique to obtain the plain metric and height
data.
(4) Surveying: Surveying is the technique to measure horizontal distances, height,
direction and angles of the physical features of the Earth. The NCHRP (2003) report
says that, this approach could be beneficial for projects limited to smaller study
areas or when the data needs to be updated. Surveying element gives highly
accurate data (it is the best fit for urban application).
(5) Spatial data sharing: The fundamental principle behind the concepts: spatial data
infrastructure, open source, interoperability, web services fosters the idea of
sharing data. Shared data can be used by different people for a multitude of
applications scenarios (GSDI 2011). This not only saves time, money and human
resources but also avoids the duplication effort involved in creating and managing
data. Spatial portals provide a platform in finding a dataset in a faster and efficient
fashion (Winnie and Jan 2005). All these concepts aid in discovering and
integrating the apt data sources for the quick building of applications.
(6) Mix and match approaches: Google Earth builder22 uses this approach to upload
and manage data from various sources to form a custom map. This is a good
example of the mix and match approach. Creating new data would exhaust
resources. As highlighted earlier, the discovery of the data that fits or base data
that is close to the objective can be tailored by using any of the methods
mentioned above to make it fit for the purpose of the project. For example, the
case wherein, if the base data that is discovered through spatial portals or any
other sources is incomplete to meet the application objectives. This can be
completed or improved by discovering related web services, right mix of web
services, spending minimal resources in field survey on the pivotal area of our
study for updating or enhancing or purchasing the data component that is required
to complete the dataset. In this way instead of preparing the data from scratch, a
mix-and-match approach may subdue project resources. Empirically, this approach
saves resources and boosts efficiency. The 3D model that is developed in next
section shows the 2D cadastral data discovered via web services used as base data,
which is eventually enhanced to generate a 3D model.
20 http://www.ablesw.com/r2v/ 21 http://wintopo.com/ 22 http://www.google.com/enterprise/earthmaps/builder.html
33 DECISION MAKING ECOSYSTEM
3.5 Digital earth 3D city model
The pattern presented in the previous section has been used to obtain a 3D model of the
Zaragoza city, Spain. This 3D model is going to be used in the development of a project that
has as its main objective: the construction of the 3D information that will represent the
shadows of the city at different times in a day, and different days in a year. This information
will be used in different domains such as in the models of which analysis the spread of
pollution in the air (that are affected by differences in temperature), selection of the location
of solar panels on buildings, or tourist routes (different tourist routes depending on the season
and time of the day).
The Workflow management proposal has been applied to this particular problem by
developing the task presented in the following steps.
3.5.1 Requirements analysis
As mentioned earlier, the 3D model can be used in the development of a project that has to
provide 3D information to represent the shadows of the city at different times in a day, and
different days in a year, potential location for installation of PV etc. This information is not
going to be used directly for visualization, so its adjustment to the real appearance is not a
requirement. In addition, the relevant information that the project requires is the volume of
each building (height, width and length). The granularity has to be at the building level because
it will be necessary to analyse the building connections and dependencies.
3.5.2 Matching necessities and availability
In order to select the Data sources, experiment and discover the source using the Mix-and-
match element of the Data source framework. Cartociudad service is used to get the number
of floors of the buildings and to obtain the coordinates of each building (Cartociudad 2010).
Nevertheless, the problem with this approach was that the accuracy of the information
provided by Cartociudad is not homogeneous and does not have the same quality in all
geographic areas, which eventually did not give the desired accuracy for use in an urban
setting. Revamping this approach by analysis of various existing services like the
OpenStreetMap, Cartociudad and Catastro, the Cadastre WMS (Catastro 2010) was selected:
Catastro results were closer to the ground truth and gave an uniform quality of data necessary
for the urban environment.
3.5.3 Data construction and/or acquisition
The 3D model for Spanish urban areas of Zaragoza has been sequential developed as shown in
the flow diagram (Figure 11) and as the steps described below:
Extraction: The map data of Zaragoza city was procured by making requests to the Cadastre
database by OGC WMS service for buildings (CONSTRU) and building with labels
(TXTCONSTRU) layers, which contains necessary information for the 3D modelling.
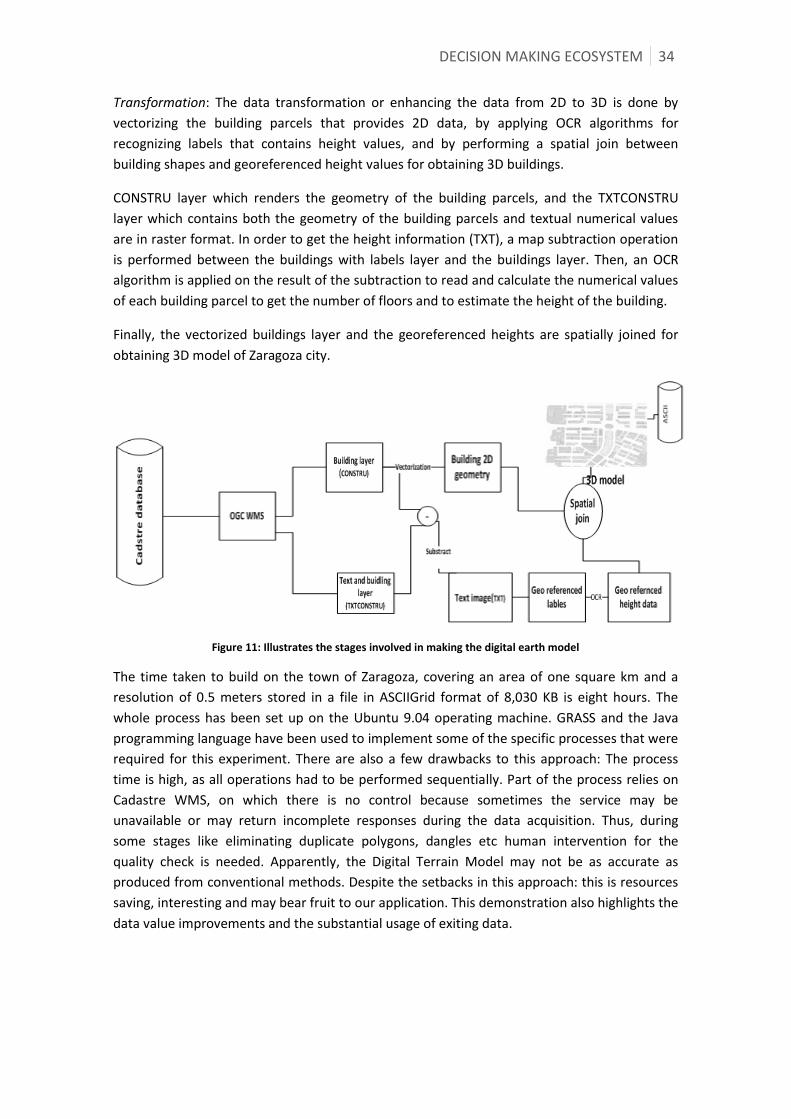
DECISION MAKING ECOSYSTEM 34
Transformation: The data transformation or enhancing the data from 2D to 3D is done by
vectorizing the building parcels that provides 2D data, by applying OCR algorithms for
recognizing labels that contains height values, and by performing a spatial join between
building shapes and georeferenced height values for obtaining 3D buildings.
CONSTRU layer which renders the geometry of the building parcels, and the TXTCONSTRU
layer which contains both the geometry of the building parcels and textual numerical values
are in raster format. In order to get the height information (TXT), a map subtraction operation
is performed between the buildings with labels layer and the buildings layer. Then, an OCR
algorithm is applied on the result of the subtraction to read and calculate the numerical values
of each building parcel to get the number of floors and to estimate the height of the building.
Finally, the vectorized buildings layer and the georeferenced heights are spatially joined for
obtaining 3D model of Zaragoza city.
Figure 11: Illustrates the stages involved in making the digital earth model
The time taken to build on the town of Zaragoza, covering an area of one square km and a
resolution of 0.5 meters stored in a file in ASCIIGrid format of 8,030 KB is eight hours. The
whole process has been set up on the Ubuntu 9.04 operating machine. GRASS and the Java
programming language have been used to implement some of the specific processes that were
required for this experiment. There are also a few drawbacks to this approach: The process
time is high, as all operations had to be performed sequentially. Part of the process relies on
Cadastre WMS, on which there is no control because sometimes the service may be
unavailable or may return incomplete responses during the data acquisition. Thus, during
some stages like eliminating duplicate polygons, dangles etc human intervention for the
quality check is needed. Apparently, the Digital Terrain Model may not be as accurate as
produced from conventional methods. Despite the setbacks in this approach: this is resources
saving, interesting and may bear fruit to our application. This demonstration also highlights the
data value improvements and the substantial usage of exiting data.

35 DECISION MAKING ECOSYSTEM
3.5.4 Quality and Quantity check
The revision of the data generated in the previous step satisfies the requirements for the
project and as presented in the section Requirements analysis:
The information created can be represented graphically by “overlaying” an aerial
photograph over the structures created (Figure 12). However, it is not an aesthetic
view of the city, but could be enough according to the project requirements.
The information has been built as a raster file that represents a digital terrain model
that which includes the buildings. With this information, it is possible to know the
volume of each building (height, width and length).
Figure 12: 3D model of the Zaragoza city
The above 3D city model has been briefly compared with an analogous 3D representation
based on LIDAR data. In this way, the free LIDAR data provided by the Gipuzkoa province in
Spain (Gipuzkoa 2011) is used for this task. The LIDAR data of grid one square km was
processed in an hour by a computer machine. Likewise, the use of our approach on the same
area grid has taken five hours. The time taken to process the LIDAR data is exceptionally fast.
Nonetheless, considering parameters like the availability of data, cost and time involved in
procuring the data, expertise, the software and hardware infrastructure required is much
more demanding. Apparently, LIDAR data gives a very high quality and is dense however, a
good enough solution like the one demonstrated in this paper will be sufficient for some digital
earth applications.

DECISION MAKING ECOSYSTEM 36
3.6 Summary
This chapter emphasized on expeditious plan and the usage of existing potential sources and
the benefits outweighing creation of a new dataset. To postulate the theory proposed, low
cost development of virtual 3D city model of Zaragoza city is demonstrated. In overall, this
chapter proposes a framework that allows a technical and managerial team to choice the best
data source for creating cost-effective geo models. However, there are a few glitches and legal
issues if the applications are developed for some commercial purpose when using some
services like the Google Maps service. Each approach discussed in the above sections could be
appropriate depending on the modelling context and forces. This chapter also proposed some
management concepts in relation to choosing data sources that could be directly integrated
into Geo environment and could be enough for the benefit of the public and business markets.
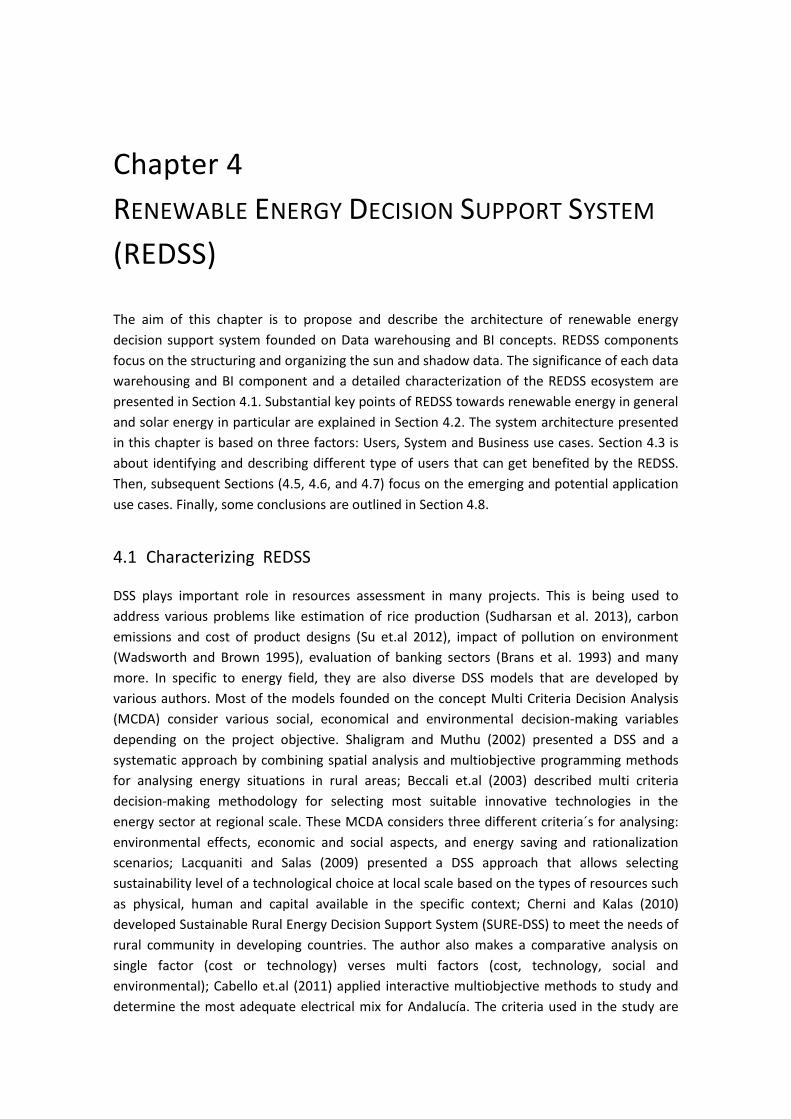
Chapter 4
RENEWABLE ENERGY DECISION SUPPORT SYSTEM
(REDSS)
The aim of this chapter is to propose and describe the architecture of renewable energy
decision support system founded on Data warehousing and BI concepts. REDSS components
focus on the structuring and organizing the sun and shadow data. The significance of each data
warehousing and BI component and a detailed characterization of the REDSS ecosystem are
presented in Section 4.1. Substantial key points of REDSS towards renewable energy in general
and solar energy in particular are explained in Section 4.2. The system architecture presented
in this chapter is based on three factors: Users, System and Business use cases. Section 4.3 is
about identifying and describing different type of users that can get benefited by the REDSS.
Then, subsequent Sections (4.5, 4.6, and 4.7) focus on the emerging and potential application
use cases. Finally, some conclusions are outlined in Section 4.8.
4.1 Characterizing REDSS
DSS plays important role in resources assessment in many projects. This is being used to
address various problems like estimation of rice production (Sudharsan et al. 2013), carbon
emissions and cost of product designs (Su et.al 2012), impact of pollution on environment
(Wadsworth and Brown 1995), evaluation of banking sectors (Brans et al. 1993) and many
more. In specific to energy field, they are also diverse DSS models that are developed by
various authors. Most of the models founded on the concept Multi Criteria Decision Analysis
(MCDA) consider various social, economical and environmental decision-making variables
depending on the project objective. Shaligram and Muthu (2002) presented a DSS and a
systematic approach by combining spatial analysis and multiobjective programming methods
for analysing energy situations in rural areas; Beccali et.al (2003) described multi criteria
decision-making methodology for selecting most suitable innovative technologies in the
energy sector at regional scale. These MCDA considers three different criteria´s for analysing:
environmental effects, economic and social aspects, and energy saving and rationalization
scenarios; Lacquaniti and Salas (2009) presented a DSS approach that allows selecting
sustainability level of a technological choice at local scale based on the types of resources such
as physical, human and capital available in the specific context; Cherni and Kalas (2010)
developed Sustainable Rural Energy Decision Support System (SURE-DSS) to meet the needs of
rural community in developing countries. The author also makes a comparative analysis on
single factor (cost or technology) verses multi factors (cost, technology, social and
environmental); Cabello et.al (2011) applied interactive multiobjective methods to study and
determine the most adequate electrical mix for Andalucía. The criteria used in the study are

RENEWABLE ENERGY DECISION SUPPORT SYSTEM (REDSS) 38
yearly costs and the vulnerability factors. Hunt et.al (2013) stated the importance of DSS and
developed robust DSS called OUTDO for assessment of energy sources. OUTDO framework is
developed on MCDA concept and by integrating with various other external calculation
models. This model helps to answer questions like "What is the best source of electricity for a
given location in UK?", "Which boiler/gasfier technology should be used?”. Most of these
models based on MCDA and present the data at one single level either at local or regional
level. However, REDSS proposed in this thesis adopted different technological approach
altogether and has a scope to present the results and solutions in a discrete way. For example,
answers to the following questions should produce different analytical view, “Which is the
widely used energy source at this particular location over last 5 years?" "Which is the best
boiler/gasfier technology in city X vs city Y, and why?” “Which energy source produces best
output at local, regional and national level?” Below sections present the technological
elements behind REDSS and its components.
Data warehouses and BI are designed to deal with global, homogeneous dataset by structuring
data into multi-levels for rapid multi exploration and analyses to aid decision-makers. BI offers
following technological structure modules that are associated with data procurement along
with storing (ETL tools and data warehouses) and information technologies to structure,
analyses and presentation of data (OLAP techniques and data mining) (Olszak and Ziemba
2007, Bédard et al. 2001):
ETL: This module is primarily responsible to retrieve data from one or more data sources, to
transfer the extracted data and to load in data warehouses.
Data warehouses: This module is central repository of data for storing huge amounts of data
extracted from various data sources. Spatial Data Warehouse (SDW) is extension of data
warehouse that provide support to store, index, query and analyse spatial data.
Data mining: The functional objective of this module is to transform the extracted data to
more meaningful, understandable structure to discover various patterns in the data.
OLAP: is analytical category of BI, which let users access, analyse, ad hoc inquiring and
business reporting for visualizing information that is stored in data warehouses.
Presentation layer/Reporting: This module serves the functionality to delivery and format
information on graphic and multimedia interfaces to users.
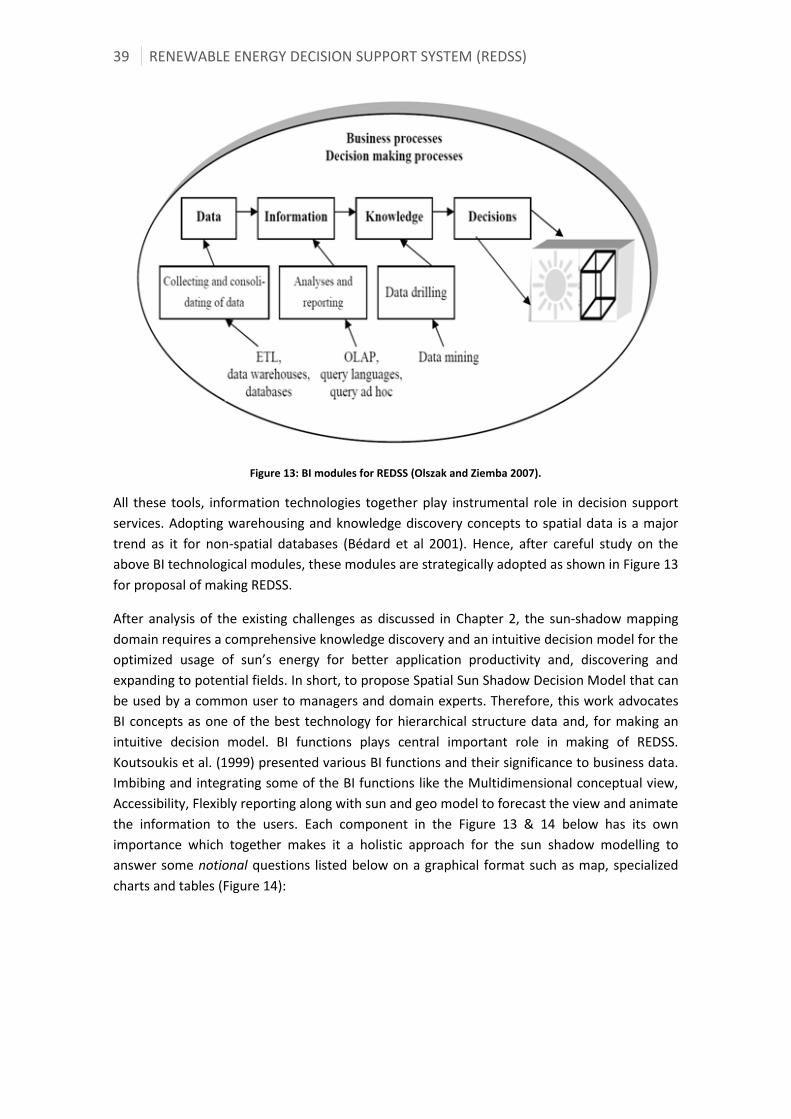
39 RENEWABLE ENERGY DECISION SUPPORT SYSTEM (REDSS)
Figure 13: BI modules for REDSS (Olszak and Ziemba 2007).
All these tools, information technologies together play instrumental role in decision support
services. Adopting warehousing and knowledge discovery concepts to spatial data is a major
trend as it for non-spatial databases (Bédard et al 2001). Hence, after careful study on the
above BI technological modules, these modules are strategically adopted as shown in Figure 13
for proposal of making REDSS.
After analysis of the existing challenges as discussed in Chapter 2, the sun-shadow mapping
domain requires a comprehensive knowledge discovery and an intuitive decision model for the
optimized usage of sun’s energy for better application productivity and, discovering and
expanding to potential fields. In short, to propose Spatial Sun Shadow Decision Model that can
be used by a common user to managers and domain experts. Therefore, this work advocates
BI concepts as one of the best technology for hierarchical structure data and, for making an
intuitive decision model. BI functions plays central important role in making of REDSS.
Koutsoukis et al. (1999) presented various BI functions and their significance to business data.
Imbibing and integrating some of the BI functions like the Multidimensional conceptual view,
Accessibility, Flexibly reporting along with sun and geo model to forecast the view and animate
the information to the users. Each component in the Figure 13 & 14 below has its own
importance which together makes it a holistic approach for the sun shadow modelling to
answer some notional questions listed below on a graphical format such as map, specialized
charts and tables (Figure 14):

RENEWABLE ENERGY DECISION SUPPORT SYSTEM (REDSS) 40
Sun-shadow navigation services:
(1) What is the shadow’s position at this particular place from 9 A.M to 11 A.M?
(2) What is the optimized sun’s path to move from Point A to Point B (for solar
vehicles and tourists)?
Performance analysis:
(1) Why is the performance of the two photovoltaic systems of the same model
different?
(2) What spatial parameters impact the performance of the photovoltaic systems?
Site Suitability:
(1) Which area in the building and orientation receives the longest duration of sunlight
for window solar cells for generating electricity?
(2) What is the best time to photo shoot at this place?
Optical dating:
(1) How much sunlight exposure is there in this area?
(2) How long ago minerals were last exposed to sunlight?
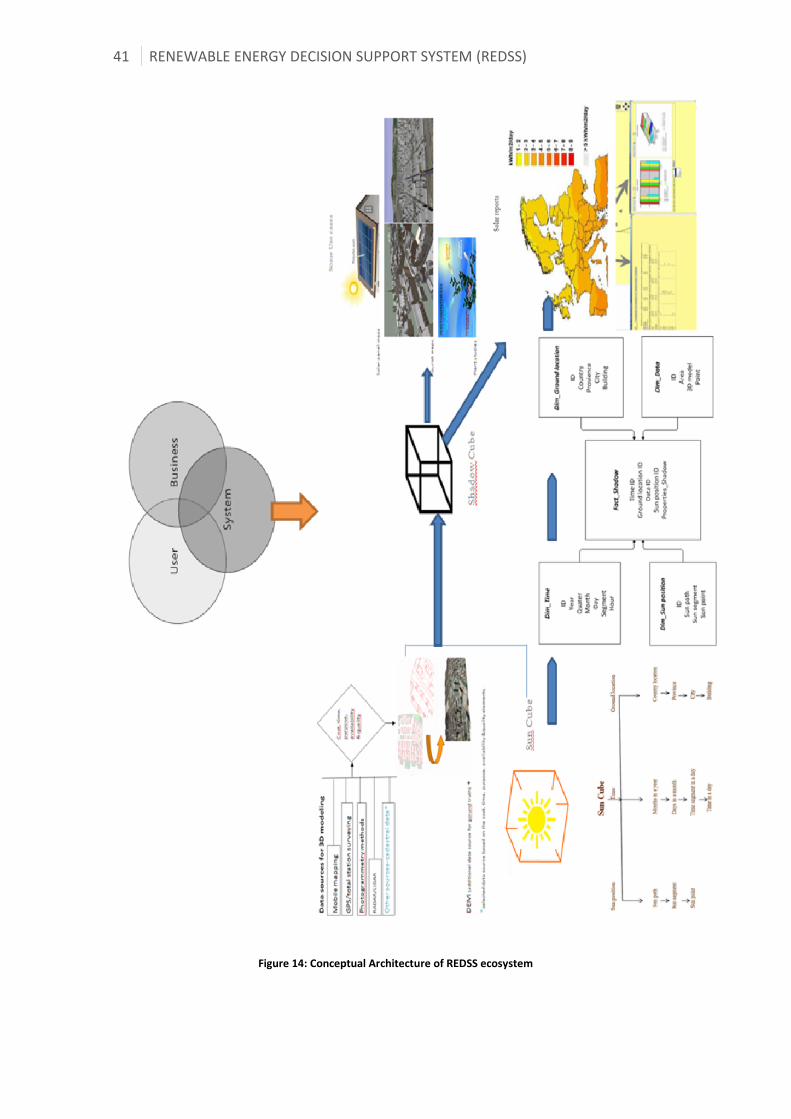
41 RENEWABLE ENERGY DECISION SUPPORT SYSTEM (REDSS)
Figure 14: Conceptual Architecture of REDSS ecosystem
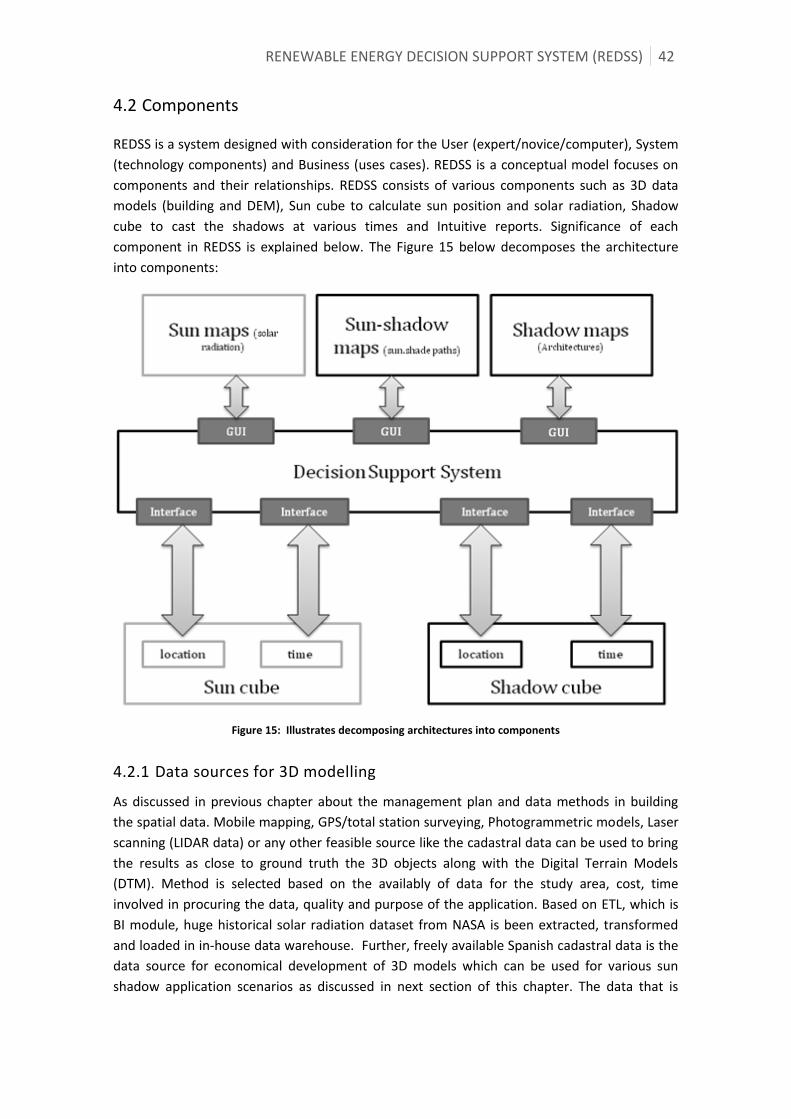
RENEWABLE ENERGY DECISION SUPPORT SYSTEM (REDSS) 42
4.2 Components
REDSS is a system designed with consideration for the User (expert/novice/computer), System
(technology components) and Business (uses cases). REDSS is a conceptual model focuses on
components and their relationships. REDSS consists of various components such as 3D data
models (building and DEM), Sun cube to calculate sun position and solar radiation, Shadow
cube to cast the shadows at various times and Intuitive reports. Significance of each
component in REDSS is explained below. The Figure 15 below decomposes the architecture
into components:
Figure 15: Illustrates decomposing architectures into components
4.2.1 Data sources for 3D modelling
As discussed in previous chapter about the management plan and data methods in building
the spatial data. Mobile mapping, GPS/total station surveying, Photogrammetric models, Laser
scanning (LIDAR data) or any other feasible source like the cadastral data can be used to bring
the results as close to ground truth the 3D objects along with the Digital Terrain Models
(DTM). Method is selected based on the availably of data for the study area, cost, time
involved in procuring the data, quality and purpose of the application. Based on ETL, which is
BI module, huge historical solar radiation dataset from NASA is been extracted, transformed
and loaded in in-house data warehouse. Further, freely available Spanish cadastral data is the
data source for economical development of 3D models which can be used for various sun
shadow application scenarios as discussed in next section of this chapter. The data that is

43 RENEWABLE ENERGY DECISION SUPPORT SYSTEM (REDSS)
extracted from external sources and stored in in-house data warehouse has been significantly
used in developing the web application and 3D models in this thesis.
4.2.2 Sun cube
It is the extension of the OLAP cube used in the data warehousing concepts, which is used for
analysing the business data. Sun cube based on the concepts of OLAP is used to interactively
analyse the solar energy pattern by roll-up, drill down operations of an OLAP cube. In principle,
the Sun cube consists of four dimensions: Sun position (sun path- sun segment-sun point),
Data (Area-3Dmodel-point), Time (yearly-quarterly/seasonal-monthly-weekly-daily-hourly) and
Ground location (county-province-city-building/co-ordinates) to analysis the data for various
applications and detailed reports generated by Shadow cube (Figure 15). Sun cube also
hierarchically structures and present the solar radiation data both on map and charts.
Energy2People is one such application, which is designed to store and present the huge
amount of solar radiation data derived from NASA. Technical details on the Energy2People are
discussed in Chapter 5 of this thesis.
4.2.3 Shadow cube
In line with Sun cube, Shadow cube is also based on the concepts of OLAP. These BI
technologies will analyse the data structured in the Sun and shadow cubes to answer various
use cases scenarios like the questions listed above. Shadow cube for shadow simulation takes
the input from the Sun cube for sun position and the 3D data models plus DTM as ground data
for analysing and generating the hierarchically reports in all the dimensions as shown in the
star schema of the Shadow cube (Figure 16). The expected output of this cube is shadow maps
of an object, a location and a region. In analogous to topology which is of spatial relation of the
geometric objects, shadow topology maps should also reveal spatial relations of shadows.
4.2.4 Solar reports
These are hierarchical reports in the form of chat, tables and maps based on the concepts of
Presentation layer of BI. In this study, along with the graphical interfaces, spatial interface is
also considered for more realistic sun-shadow data analysis. These reports will be structured
report based on the solar ranking system. Solar ranking for the ground locations are evaluated
based on the two criteria's, one is the time period for which the sunlight available and
intensity of solar radiation. Reports are presented hierarchically (country, province, city,
coordinates) and time wise (yearly, seasonal, quarterly, monthly, daily and hourly). Based on
the processed inputs from Sun, Shadow cube components reports are generated. Sun and
shadow reports helps the management team to analysis the ground truth intuitively for quick
and apt decisions in prioritizing and choosing the city, site location etc of the solar projects in
Business Process Management (BPM), forecasting, budgeting, management of reports etc.

RENEWABLE ENERGY DECISION SUPPORT SYSTEM (REDSS) 44
Dim_Time
IDYear
Quater Month
Day Segment
Hour
Dim_Data
IDArea
3D modelPoint
Dim_Sun position
IDSun path
Sun segmentSun point
Dim_Ground location
IDCountry
ProvienceCity
Building
Fact_Shadow
Time IDGround location ID
Data IDSun position ID
Properties_Shadow
Figure 16: Star schema for Shadow cube
4.3 Users
REDSS gathers and analyse information regarding location and their renewable energy
characteristics, in order to develop deeper and more effective strategic decision-making.
Target users for REDSS is essentially divided into three categories: Expert users like architects,
agriculturists etc, Novice users that refers to general public and, Computer systems, as this
application can be integrated with other applications. REDSS mechanism is designed to
address various ranges of cases scenarios such as scenario-based maintainability assessment,
situational awareness, impact analysis, comparative studies, and navigation services. REDSS
provides platform to view and analysis data from global perspective to local perspective. It
provides provision to interact and chose the hierarchy of information layers as one navigates
the hierarchy. The limited technical knowledge of general public or senior management can be
addressed by interactive charts and reports. As these reports cognitively aids all sections of
users to understand the information easy and clearly. The intuitive hierarchical decomposition
of information provides highly valuable input to the identification and selection of location.

45 RENEWABLE ENERGY DECISION SUPPORT SYSTEM (REDSS)
Figure 17: User maturity verses Data maturity
As shown in Figure 17, REDSS primarily concerns two different dimensions: User maturity and
Data maturity. Based on the technical level of understanding and requirements, User maturity
deals with three kinds of users such as Novice users, Computers and Experts. Different projects
have different data requirements depending on budget, quality, quantity, availability and ease
of use. Based on these factors, Data maturity is categorised into two different levels: High and
Low.
Novice:
1. Question: What is the available solar radiation for my province?
Resource: Box 1.
2. Question: What is the solar radiation available for my roof top? Best position to install
PV plant?
Resource: Box 4
Computer:
1. Question: What is the weather report and best time to fish for tomorrow at this
location?
Resource: Box 2
2. Question: What are popular tourist’s spots in the city and sun path to visit the all the
spots?
Resource: Box 5
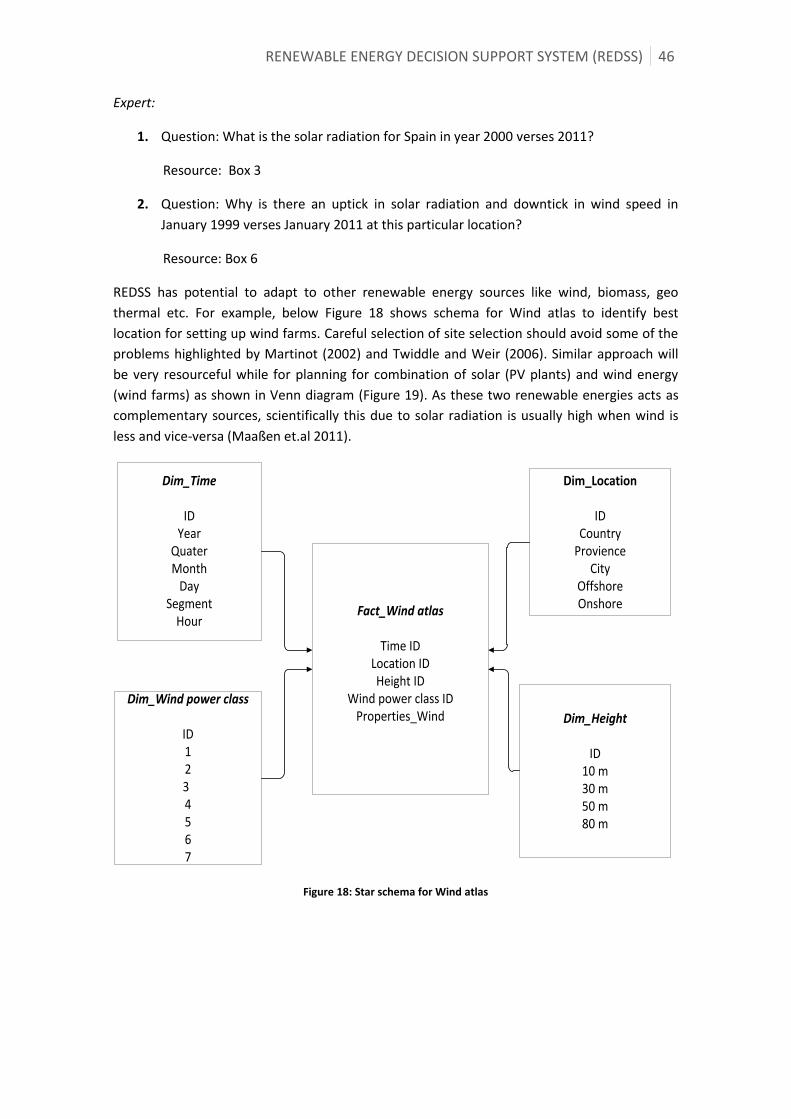
RENEWABLE ENERGY DECISION SUPPORT SYSTEM (REDSS) 46
Expert:
1. Question: What is the solar radiation for Spain in year 2000 verses 2011?
Resource: Box 3
2. Question: Why is there an uptick in solar radiation and downtick in wind speed in
January 1999 verses January 2011 at this particular location?
Resource: Box 6
REDSS has potential to adapt to other renewable energy sources like wind, biomass, geo
thermal etc. For example, below Figure 18 shows schema for Wind atlas to identify best
location for setting up wind farms. Careful selection of site selection should avoid some of the
problems highlighted by Martinot (2002) and Twiddle and Weir (2006). Similar approach will
be very resourceful while for planning for combination of solar (PV plants) and wind energy
(wind farms) as shown in Venn diagram (Figure 19). As these two renewable energies acts as
complementary sources, scientifically this due to solar radiation is usually high when wind is
less and vice-versa (Maaßen et.al 2011).
Dim_Time
IDYear
Quater Month
Day Segment
Hour
Dim_Height
ID10 m30 m50 m 80 m
Dim_Wind power class
ID12
34567
Dim_Location
IDCountry
ProvienceCity
OffshoreOnshoreFact_Wind atlas
Time IDLocation IDHeight ID
Wind power class IDProperties_Wind
Figure 18: Star schema for Wind atlas

47 RENEWABLE ENERGY DECISION SUPPORT SYSTEM (REDSS)
Figure 19: Venn diagram for Wind and Solar energy location.
4.4 Unique points about the model proposed
4.4.1 Eclectic approach
The model introduces the benefits of non-spatial technologies like BI to gain better
understanding of the spatial domain. Concepts like the Sun cube, Shadow cube: shadow
topology, shadow maps, solar ranking, interactive and detailed reports using drill down and
roll up operations are derived from BI to help us to understand and plan the complex spatial
problems in a comprehensive way. Further, this model analyse location based historical data,
which will be useful for studies like global dimming and brightening.
4.4.2 Layered structure and intuitive reports
This is the key module in the model for disseminating situational awareness, which is useful for
experts, novice users and computer machines. The intuitive drill down reports give a very quick
insight along the sun position, time, data and ground location by just click of a mouse. The
detailed reports which are just numbers derived from the user-preferred combination based
on application requirements can be easily elucidated by novice users. Depending on the
project requirements, the layered structuring can be easily integrated with the other external
system as part of the database or as a database whole.

RENEWABLE ENERGY DECISION SUPPORT SYSTEM (REDSS) 48
4.4.3 Diverse applications
Solar energy can be widely used as either main energy or additional source of energy in
various fields. Identifying the solar energy needs in various diverse existing applications to the
latest developments either as a subpart or as an integral part of the application.
4.4.4 Co-creation solution
Interacting and innovate with the domain expertise on the feasibility of this model in
enhancing the product. For example, this model can be vital for the transportation sectors (sun
and the shade path for solar vehicles and tourists), electric car charging stations powered by
solar panels, right time and best location for film/photo shoot, Fishing: source location and
time, Optical dating, weather information system etc.
4.4.5 Mix-and-Match approach
Envisaging the possibility of this model not just as a stand-alone domain application but also by
integrating with other applications like weather information application (sun geo position+
weather information+ local time), fishing, tourism application (sun and shadow route), as a
subpart of the applications for enhancing and to give users rich application experience.
4.5 Emerging sun-shadow application areas
Below are presented some of the emerging and interesting areas in the solar energy sector
that need significant technical attention to yield the best outcome.
4.5.1 Solar power grid
Demand for power supply has substantially increased due to the growing number of
consumers and shortage of resources to generate adequate power. Conventional sources of
energy like coal and petroleum are getting exhausted and thus leading to an imbalance ratio of
demand to supply. Solar power grid reduces dependency on the conventional sources of
energy, usage of free available sun energy for uninterrupted power supply, reduces the
inefficient usage of power like theft of power, less vulnerable to unfavourable climatic
conditions, which interrupts the power supply. Solar panels can also be a standalone set up
especially in remote and rural areas of emerging nations individually without the need to
connect them to the state/national electricity grids, which reduces the transmission and
infrastructure costs.
4.5.2 Global warming
Scant of fossil fuels to meet the power and fuel demands of the consumer, the burning of
these fossil fuels is also responsible for global warming by releasing greenhouse gases into the
atmosphere. So, a study on the Solar grids for electricity as stated above and electric cars that
work on solar energy as explained below will help to reduce the global warming for a better
living.

49 RENEWABLE ENERGY DECISION SUPPORT SYSTEM (REDSS)
4.5.3 Electric cars charging station
Electric cars that run on electricity are generated from solar panels. They can be recharged at
parking areas, at any business areas or we can also set up a personal recharge unit at home.
Unlike the conventional fuel cars, they do not release any harmful gases into the atmosphere.
4.5.4 Greenhouse crop
In the study led by Yao and Su (2011), parameters like the solar radiation data, geographic
location and sunshine hours are used to calculate the average daily global solar radiation,
which is required for the greenhouse crops like spinach, lettuce, greenhouse tomatoes etc.
The authors also show the spatial distribution of global source energy in China for the
greenhouse crop production.
4.5.5 Solar energy for architectures and designers
Sattrup, PA and Strømann-Andersen (2011) investigated the effect of temporal and spatial
dimensions of solar access in the urban environment. Calculating and mapping the impact of
thermal energy performance is based on the orientation of the building, window size,
structure and material properties of the building.
4.6 Spatial Business Intelligence for emerging application areas
BI tools are designed to combine operational data with analytical tools in a flexible manner to
communicate analysed business information to planners and decision makers (Negash 2004).
Reporting, dashboards, scoreboards, OLAP, data mining, process mining, business
performance management analytics and predictive analytics are the functions of the BI (OGC
2012). There are several essential components of proactive BI. One of it is the Geoinformatics
(Langseth and Vivatrat 2003). Applying BI analytical and structured functions to the spatial
data for the spatial analytical solution is Spatial BI. There are various emerging spatial markets
such as public safety, health care, weather etc. that take advantage of BI for analysing the
spatial and business data. Hence, this study proposes implementation of Spatial BI to deal with
the key challenges presented in the previous chapters and for the use cases proposed below.
4.7 Value propositions for sun shadow use cases
There is complexity and difficulty involved in calculating shadows in extensive urban areas
because of the undulations of the Earth's surface, complex roof design and high-rise
neighbouring areas (Seong et al. 2006). However, the advent and development in 3D
modelling, LIDAR data etc. are widely used in many applications to collect and provide ground
truth results for a better and effective solution. To select an economical spatial data solution is
again challenging. There are various methods like Mobile mapping, GPS/total station
surveying, Photogrammetric, Laser scanning or any other feasible source like the cadastral
data. The method is usually selected based on factors such as the availability of required data,

RENEWABLE ENERGY DECISION SUPPORT SYSTEM (REDSS) 50
data size and type, cost, time involved in procuring the data, as well as the quality and purpose
of the application.
On the other hand, there are substantial benefits that can be achieved through research in
designing real time sun-shadow applications. These applications need some add on,
integrated, updated, reliable models like the weather, cloud, soil and other seasonal data for
out and out real time results in applications like carbon dating, fishing, viticulture etc.
Below are some of the use cases that are identified, which may be useful for different user’s
interest and benefits.
4.7.1 Tourist maps
The G20 (2012) recognizes for the first time Travel and Tourism as a key and vital player in the
development and economic recovery of the nation. Essentially, these maps show all the tourist
destinations around the user location and the path to reach the destinations. It guides and
navigates the users to the tourist locations along with the shortest and Sun-shadow navigation
services from a user’s location to the destination. Sun/Shadow path meandering depends on
the user’s choice of path and destination. Users will have choice to select two paths: Sun path
or shadow path depending on the user's interest, time and seasons. Based on the ground and
building DEM, the model proposed generates the sun path where users want to enjoy the
sunlight. Likewise, it also shows the shadow path based on the user-preferred timings, start
and end points. It can also be used to spot nearby shade parking lots, sunny/shade cafe
restaurant based on the user's choice. All the models will have the provision to give the user
feedback, which help in improving the model.
4.7.2 Sun-shadow navigation services
As mentioned above, Sun- shadow paths can be used as a navigation source for solar vehicles
powered by solar energy. Sun path meandering, for example, if a person wants to travel during
the daytime from Barcelona to Madrid, user can reserve the (Sun/shade) seat based on the
sun shadow information available along the route.
4.7.3 Plant studies
Solar radiation plays a vital role for plants healthy growth and yield. Shade plants like tea,
coffee plantation or plants that grow from their leaves or roots such as chard do not require
much sunlight. On the other hand, Sun-demanding plants like rice need more exposure to the
sunlight and this should not be hindered by the neighbouring plants or other features like hills,
trees or shrubs. Viticulture where topography and sunlight plays a predominant role for grape
yards, this model can be used for sun plants, shade plant, carbon dating and greenhouse crop
location studies based on the number of sunshine hours and the geographic location.
4.7.4 Architects and Urban planners
UCLA (2012) researchers led a study on the development of solar cells for windows to
generate electricity. The model proposed will aid the Architectures and Urban planners for

51 RENEWABLE ENERGY DECISION SUPPORT SYSTEM (REDSS)
effective use of the solar cells for smart windows and building integrated photovoltaic, as this
model provides the height of the surrounding buildings/ground features, shadow simulation
maps, 3D shadow maps, shadow topology and solar radiation available in site area by intuitive
comprehensive reports.
4.7.5 Site suitability
The decision model determines optimized location for various applications like carbon credits,
film/photo shoot, fishing and viticulture. Furthermore for solar panel performance analysis
and installation for solar: cities, power plants, water distillation plant, pumps for farmers,
power for metro stations, rooftop solar panels, mobile charging stations etc. It can also be
used to compare the performance of the solar systems at different geographical regions and
analyse the reasons behind the differences in performances. The model takes various ground
parameters like the DEM (ground and building), sunshine hours and days, height of the source
building with respect to the neighbouring buildings or any other structures like the hills into
consideration to get unhindered sunshine for the solar panels to generate maximum output.
4.8 Summary
This chapter presents the entire ecosystem of REDSS and its various application scenarios and,
various kinds of actors who should get benefited by REDSS. REDSS is designed and developed,
keeping in mind, different sections of users from general public to experts. In this line of
research, a web service called Energy2people has been developed as a REDSS prototype for
validating the feasibility of this approach. The architecture and characteristics of this REDSS
application will be presented in the next chapter. By introducing BI concepts to renewable
energy field, this research opens different way of structuring, organizing and presenting the
information. In addition, this thesis works also focused on application use cases and envisaging
new avenues that could be beneficial to the society.

Chapter 5
DESIGN AND IMPLEMENTATION
This chapter contains the pragmatic part of the solution and implementation of conceptual
model for one particular uses case. Section 5.1 talks about the study area and data. Section 5.2
explains technical functionalities and application highlights of the tool. Section 5.3 talks in
detail about the design behind the application. To assess the standards and usability of the
tool, a qualitative assessment of the tool methodology is compared to the other international
market tools in Section 5.4.
5.1 Study area
The freely available global data is procured from NASA website23. Since this is prototyping and
experimenting with the proposed approach, so the data has been limited to countries of
Iberian Peninsula (Andorra, Portugal and Spain). Due to resources and time constrains, limited
the data as the main challenge is to highlight the technology to address the problem identified
in this thesis. However, handling, structuring and presenting these counties solar radiation
data is also very challenging and complex. The technological approach proposed in this thesis
provides tremendous scope to upscale the data from an area specific database to global
database.
5.2 Energy2people
Energy2people is economically built based on the open source infrastructure and open source
data (NASA). Energy2people application was recognized and bestowed by NASA as one of the
best “Renewable Energy Explorer” in the International Space App challenge 201324.
Energy2people is a multiscale renewable energy explorer based on the concepts of BI for when
and where analysis. Application´s functionality and geo-oriented web interfaces are designed
for both experts and naïve users. As this application is combination of hierarchal exploring
techniques on large historical datasets with strong multi scale visualization capabilities. Hence,
this visualization-centric application helps users to select best solar location by probing
different geographical and temporal levels. This is possible by structuring and storing publicly
available NASA data into various levels ranging from local ecosystem to global ecosystem. This
particular application disseminates the solar radiation for country level to a city level along
23 https://eosweb.larc.nasa.gov/cgi-bin/sse/[email protected] 24 http://spaceappschallenge.org/project/energy2people/

DESIGN AND IMPLEMENTATION 54
different time periods based on the user choices and options available on the left side of the
map canvas (Figure 20 & Figure 21).
Figure 20: Interface of Energy2people application.
Application highlights:
Eclectic approach: Incorporating BI concepts for solar energy.
Structuring humongous datasets into multi-levels for rapid multi exploration and
analyses to aid decision-makers.
Improved visualization techniques on data granularity compared to existing online
tools from NREL (The solar power prospector), IRENA (Global Atlas).
Hierarchical visualization and exploration of data on graphical formats such as dynamic
map, specialized charts and tables for more advanced location data.
Reports are presented hierarchically (country, province, city, coordinates) and time
wise (yearly, seasonal, quarterly, monthly, daily and hourly).
Optimized latency.
Location based content from single energy carrier to multiple energy carriers.
Web enabled.
Data decomposition views on map format provide support for analysing effects of data
changes over location and time scale
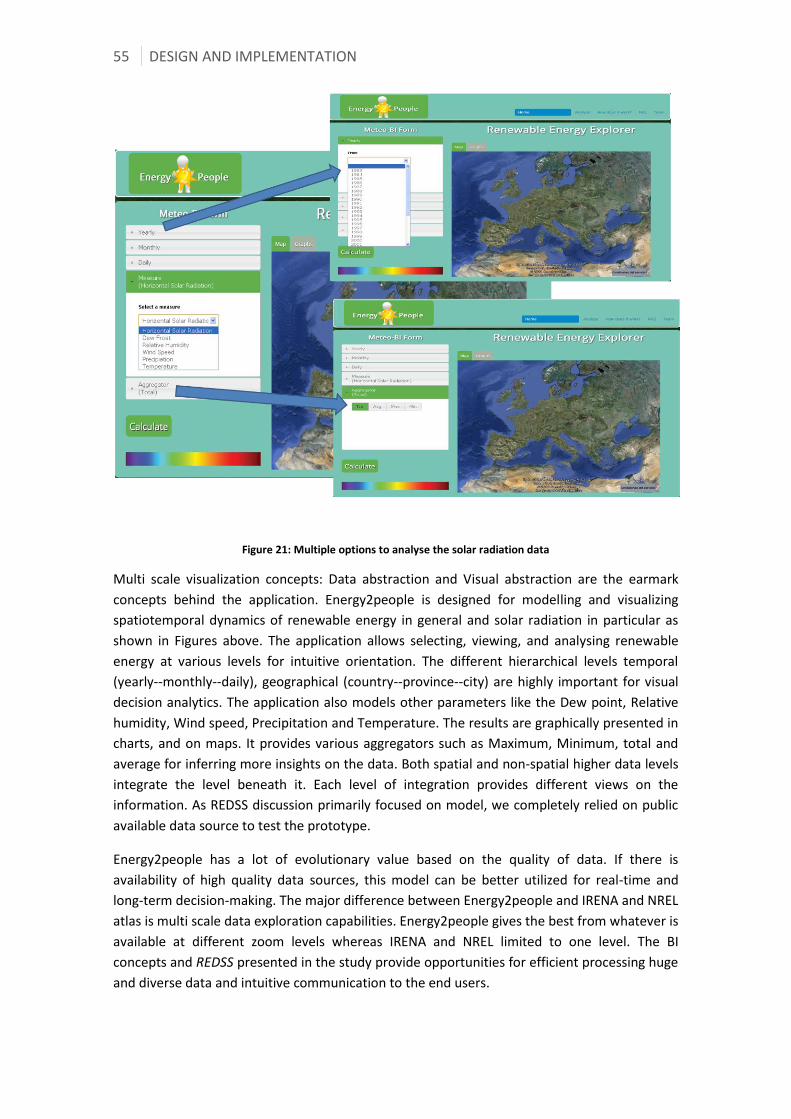
55 DESIGN AND IMPLEMENTATION
Figure 21: Multiple options to analyse the solar radiation data
Multi scale visualization concepts: Data abstraction and Visual abstraction are the earmark
concepts behind the application. Energy2people is designed for modelling and visualizing
spatiotemporal dynamics of renewable energy in general and solar radiation in particular as
shown in Figures above. The application allows selecting, viewing, and analysing renewable
energy at various levels for intuitive orientation. The different hierarchical levels temporal
(yearly--monthly--daily), geographical (country--province--city) are highly important for visual
decision analytics. The application also models other parameters like the Dew point, Relative
humidity, Wind speed, Precipitation and Temperature. The results are graphically presented in
charts, and on maps. It provides various aggregators such as Maximum, Minimum, total and
average for inferring more insights on the data. Both spatial and non-spatial higher data levels
integrate the level beneath it. Each level of integration provides different views on the
information. As REDSS discussion primarily focused on model, we completely relied on public
available data source to test the prototype.
Energy2people has a lot of evolutionary value based on the quality of data. If there is
availability of high quality data sources, this model can be better utilized for real-time and
long-term decision-making. The major difference between Energy2people and IRENA and NREL
atlas is multi scale data exploration capabilities. Energy2people gives the best from whatever is
available at different zoom levels whereas IRENA and NREL limited to one level. The BI
concepts and REDSS presented in the study provide opportunities for efficient processing huge
and diverse data and intuitive communication to the end users.

DESIGN AND IMPLEMENTATION 56
Energy2people can be categorized as a dual play application as it acts as a both expert and
non-expert system. As expert system this allows to deep dive into all spheres of solar radiation
data for scientific data analysis. And as non expert system it provides user friendly intuitive
interacting and visualization capabilities. This work also sees as BI concepts as a substantial
approach to other environmental studies such as hydrology, pollution etc. This decision model
will accommodate different ground truth scenarios in which anyone from experts to the
common public may wish to view and manipulate the renewable energy data. A detailed
comparison between these tools to Energy2people is made in the Section 5.5.
5.3 Design
This section presents the technical design behind Energy2People application. The ETL process,
SDW and the web application are designed to develop the application. Espejo García (2013)
contains more details on technical explanation and implementation part of the application.
ETL: Figure 22 shows the Data flow diagram involved in ETL process. It illustrates three
different processes of ETL: extract, transform and load. The Stage storage is where data is
transformed before loading it in the data warehouse. In this case, an interpolation (bilinear)
function is applied in order to enrich the data resolution and for wider coverage. Then, the
data is load in the SDW, the central repository of Energy2People.
Figure 22: Data flow diagram.
Figure 23 illustrates the processes that must be run to obtain the final snowflake schema in the
SDW. A Temporal Dimension table must be created to support temporal queries in the web
application. After creation of Temporal Dimension table, it is necessary to join fact table with
the dimension tables, so this joining process is considered to be necessary to achieve the goal.
Finally, at this point of the load process, some data is stored in various tables. Considering that
the SDW size is going to be a critical point, all redundancies between tables must be removed
and a final process is created to do loading task.
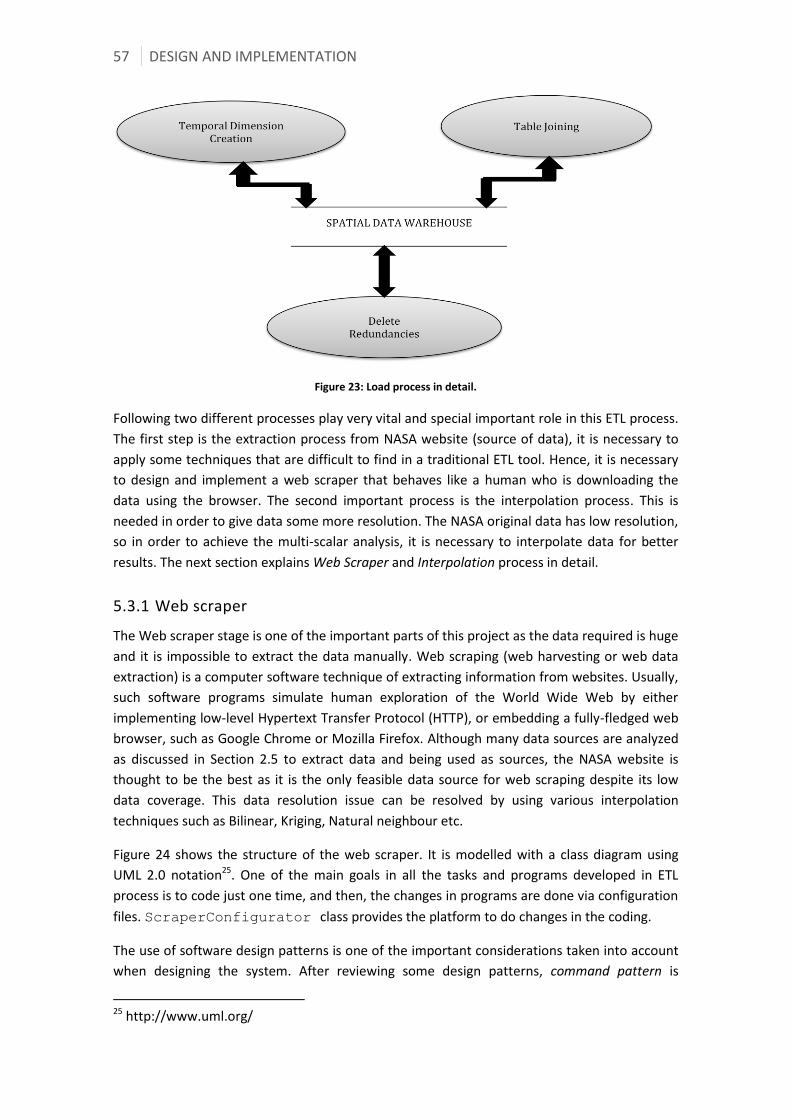
57 DESIGN AND IMPLEMENTATION
Figure 23: Load process in detail.
Following two different processes play very vital and special important role in this ETL process.
The first step is the extraction process from NASA website (source of data), it is necessary to
apply some techniques that are difficult to find in a traditional ETL tool. Hence, it is necessary
to design and implement a web scraper that behaves like a human who is downloading the
data using the browser. The second important process is the interpolation process. This is
needed in order to give data some more resolution. The NASA original data has low resolution,
so in order to achieve the multi-scalar analysis, it is necessary to interpolate data for better
results. The next section explains Web Scraper and Interpolation process in detail.
5.3.1 Web scraper
The Web scraper stage is one of the important parts of this project as the data required is huge
and it is impossible to extract the data manually. Web scraping (web harvesting or web data
extraction) is a computer software technique of extracting information from websites. Usually,
such software programs simulate human exploration of the World Wide Web by either
implementing low-level Hypertext Transfer Protocol (HTTP), or embedding a fully-fledged web
browser, such as Google Chrome or Mozilla Firefox. Although many data sources are analyzed
as discussed in Section 2.5 to extract data and being used as sources, the NASA website is
thought to be the best as it is the only feasible data source for web scraping despite its low
data coverage. This data resolution issue can be resolved by using various interpolation
techniques such as Bilinear, Kriging, Natural neighbour etc.
Figure 24 shows the structure of the web scraper. It is modelled with a class diagram using
UML 2.0 notation25. One of the main goals in all the tasks and programs developed in ETL
process is to code just one time, and then, the changes in programs are done via configuration
files. ScraperConfigurator class provides the platform to do changes in the coding.
The use of software design patterns is one of the important considerations taken into account
when designing the system. After reviewing some design patterns, command pattern is
25 http://www.uml.org/

DESIGN AND IMPLEMENTATION 58
thought to be the most appropriate as structuring and sequential arranging is better in this
particular pattern. The command pattern is a behavioral design pattern in which an object is
used to represent and encapsulate all the information needed to call a method at a later time.
The commands in this application are: NasaScraper, TextFileParser and
StageLoader. They are invoked by the Facade class that executes first NasaScraper,
followed by TextFileParser and finally StageLoader.
Figure 24: Scraper class diagram.
5.3.2 Interpolation
The problem with NASA low data resolution and the project objective of having multi-scalar
analysis are taken into account when this system is designed. Summarizing, this class is
designed to solve the low resolution problem. Although, some different interpolation
algorithms exist, its implementation should be transparent to other classes. So, an interface is
used to achieve this goal.
Figure 25 shows the program structure of the Interpolation process. It is modelled with a class
diagram using UML 2.0 notation. One of the main goals in all tasks and programs developed in
ETL process is to code just one time and then, different changes in programs are done via
configuration files. InterpolationConfigurator class is a responsible configuration
file.
The use of software design patterns is one of the points taken into account when designing
this system. After reviewing some design patterns, facade pattern is thought to be the most
appropriate. Facade pattern is a structural design pattern that provides a simplified interface
to a larger body of code, such as a class library.

59 DESIGN AND IMPLEMENTATION
Figure 25: Interpolation process class diagram.
In conclusion, this design will provide the configurability achieved in the ETL processes. What it
means that a person without programming knowledge would be able to change Interpolation
behaviour without “touching” any code.
5.3.3 Future work in ETL
This section describes ETL process that do not appear in final system functionality, but that is
designed and implemented during the last phase of the project. But some changes must be
done in order to improve the performance. So, in this phase, it is tried to use a data warehouse
with a native spatial support. For example, with this new approach, some spatial files such as
ESRI-shapefiles, Geography Markup Language (GML), and Keyhole Markup Language (KML) etc
can be stored in the SDW.
Figure 26 illustrates the extraction, transformation and loading of data from ESRI Shapefiles
sources to SDW. The ESRI-Shapefile, or simply a shapefile, is a popular geospatial vector data
format for geographic information system software from Environmental Systems Research
Institute (ESRI)26. Shapefiles spatially describe vector features: points, lines, and polygons
representing, for example, water wells, rivers, roads and lakes. Each item usually have
associated non-spatial attributes such as name, classification type etc. These Shapefiles can
contain data that is not relevant in final application, so before loading data in the SDW, these
fields are removed in the extract/transform process.
26 http://www.esri.com/software/cityengine/features

DESIGN AND IMPLEMENTATION 60
Figure 26: ETL using ESRI-Shapefiles.
Once spatial data is load in SDW, new operations can be executed. These operations, for
example, can be used to separate data from different administrative units into data marts
where data can be analysed faster because of its smaller size.
Figure 27: Application example: Zaragoza.
Figure 27 shows the change between data models (SDW model and data mart model) to
achieve a more powerful multi-scale analysis. Taking advantage of administrative names
stored in SDW, the data marts can contain only data from a particular province, region or city.
This last approach maximizes possibilities to speed-up the analysis depending on the zone
displayed on the map.
5.3.4 Spatial data warehouse
The design of a data warehouse is quite different from designing relational database. While in
the relational databases, the Entity Relationship (ER)27 diagram is used, whereas in data
warehouse projects, dimensional modelling is the most appropriate technique. The two main
features of this modelling type is the possibility to use OLAP to query the data warehouse and
the goal of a de-normalized schema instead of the normalized, which is preferred in ER
modelling.
27 http://msdn.microsoft.com/en-us/library/bb955303.aspx

61 DESIGN AND IMPLEMENTATION
Conceptual Model: The first step in data warehouse modelling is the conceptual design. Data
is represented according to the data cube model. This model has four main concepts:
Fact: It is a concept that is relevant for the decisional process. For example, in this
project the facts are the solar radiation and the wind speed.
Measure: A numerical property of the fact. For example, in this project the measures
are the quantity of solar radiation and the quantity of wind speed.
Dimension: A property of a fact described which respect to a finite domain. In the
context of this project, a spatial dimension composed by a Latitude Dimension and a
Longitude Dimension, and a temporal dimension, is necessary to characterize the
facts.
Hierarchy: The elements of a dimension can be organized as a hierarchy, a set of
parent-child relationships, typically where a parent member summarizes its children.
For example, the year member is the parent of the month member, and month is the
parent of the day member.
Figure 28 shows the conceptual modelling of the SDW used in Energy2People. Although only
two dimensions are marked, in reality there are three dimensions. Latitude and Longitude can
be seen as two different dimensions in the SpatialDimension.
Figure 28: SDW conceptual model
Logic Model: From the conceptual design, it is necessary to determine the logical schema of
data. At this point, different models to represent multidimensional data can be used. These
models are based on relational technologies (ROLAP), relational technologies with spatial
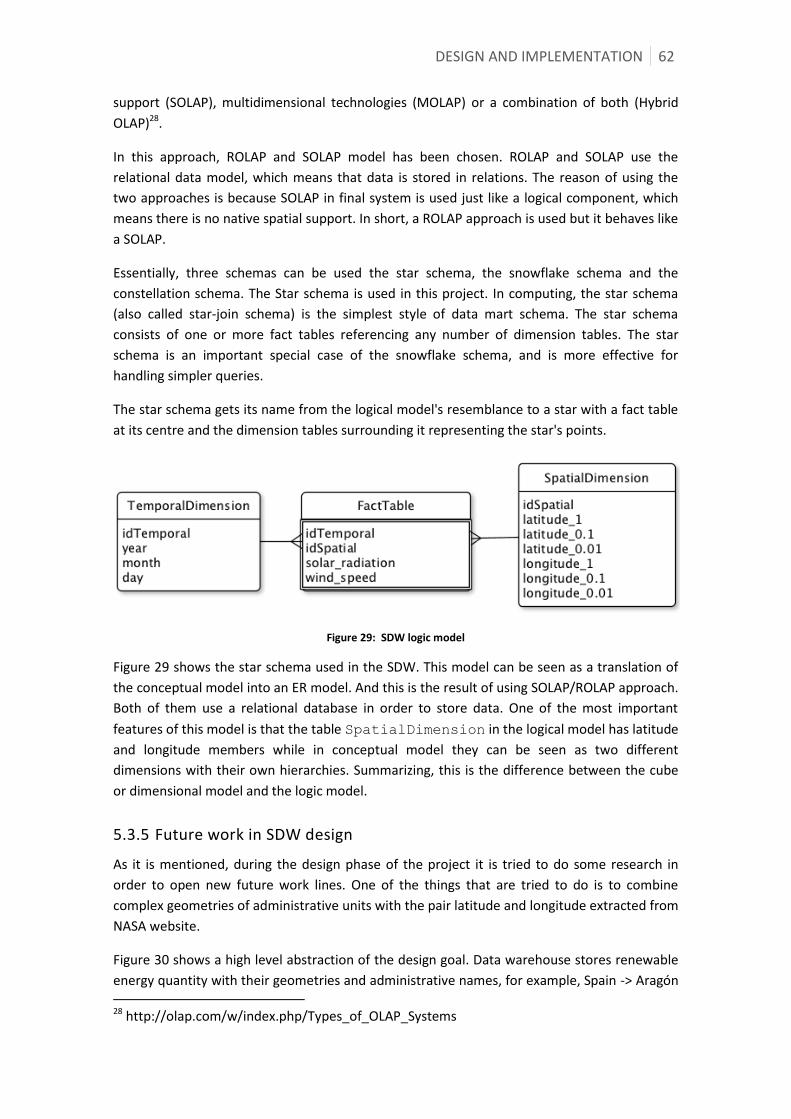
DESIGN AND IMPLEMENTATION 62
support (SOLAP), multidimensional technologies (MOLAP) or a combination of both (Hybrid
OLAP)28.
In this approach, ROLAP and SOLAP model has been chosen. ROLAP and SOLAP use the
relational data model, which means that data is stored in relations. The reason of using the
two approaches is because SOLAP in final system is used just like a logical component, which
means there is no native spatial support. In short, a ROLAP approach is used but it behaves like
a SOLAP.
Essentially, three schemas can be used the star schema, the snowflake schema and the
constellation schema. The Star schema is used in this project. In computing, the star schema
(also called star-join schema) is the simplest style of data mart schema. The star schema
consists of one or more fact tables referencing any number of dimension tables. The star
schema is an important special case of the snowflake schema, and is more effective for
handling simpler queries.
The star schema gets its name from the logical model's resemblance to a star with a fact table
at its centre and the dimension tables surrounding it representing the star's points.
Figure 29: SDW logic model
Figure 29 shows the star schema used in the SDW. This model can be seen as a translation of
the conceptual model into an ER model. And this is the result of using SOLAP/ROLAP approach.
Both of them use a relational database in order to store data. One of the most important
features of this model is that the table SpatialDimension in the logical model has latitude
and longitude members while in conceptual model they can be seen as two different
dimensions with their own hierarchies. Summarizing, this is the difference between the cube
or dimensional model and the logic model.
5.3.5 Future work in SDW design
As it is mentioned, during the design phase of the project it is tried to do some research in
order to open new future work lines. One of the things that are tried to do is to combine
complex geometries of administrative units with the pair latitude and longitude extracted from
NASA website.
Figure 30 shows a high level abstraction of the design goal. Data warehouse stores renewable
energy quantity with their geometries and administrative names, for example, Spain -> Aragón 28 http://olap.com/w/index.php/Types_of_OLAP_Systems

63 DESIGN AND IMPLEMENTATION
-> Zaragoza. However, the data marts contain only latitude/longitude pairs and renewable
energy quantity.
Figure 30: Abstraction of the future goal.
Figure 31 shows the conceptual model of this approach. It can be infer from the figure below
that SpatialDimension (the right one) has a hierarchy composed of four geometries. The
smallest geometry is the point. In this case, the point is not a pair latitude/longitude but a
geographical point. Likewise as a geometrical representation for province, region and country
levels (adm_unit_level_3, adm_unit_level_2 and adm_unit_level_1).
Figure 31: Future SDW logic model.
The new SDW constructed need this conceptual modelling because in some decisions levels,
knowing the name and the geometry of the administrative unit is really important, but when
going deeper in the analysis, aggregations of huge amounts of points provides more
meaningful insights on the data.

DESIGN AND IMPLEMENTATION 64
Figure 32: Future SDW logic model
The Figure 32 shows the logical model that is designed to be implemented in future. This
model presents a snowflake schema. With this model, questions like, “How much solar
radiation is available in Zaragoza for the last 20 years?” can be answered. What it allows is
powerful new analytical features in the system.
Aggregate tables design: When the system requirements demand high performance and low
latency it is not just enough to design a good SDW. New strategies must be taken, and one of
them is the use of aggregate tables. The aggregate table is essentially a pre-computed
summary of the data in the fact table (Hyde, 2009).
Although Energy2People version does not contain any aggregate tables, during the last phase
of the project it is studied the impact of using this strategy in the system. For example, if the
number of rows in the FactTable is about 2,737,500,000 (30 years × (365 o 366 days) × A
matrix of 500×500 points), this can result in low performance and high latency. To resolve this
problem, it is necessary to design some aggregate tables.
The main problem of using this approach is that aggregate tables are an actually materialized
view which means they are using physical space in the server. The Figure 33 shows an example
of two aggregate tables that will be implemented in a future.

65 DESIGN AND IMPLEMENTATION
Figure 33: Aggregate tables design
Web Application
Service layer: Once SDW and OLAP cubes are designed, it is necessary to access data via web.
This can be done in two ways as stated below:
1. The Business logic retrieves data from a XMLA server.
2. The Business logic requests data from a REST API that abstracts data layer with the
multidimensional model.
The second option is considered feasible as it provides easy access to the data and reduces the
latency effects. First of all, it is important to describe what a REST API service is. REST defines a
set of architectural principles by which one can design the Web services that focus on a system
resources, including how resource states are addressed and transferred over HTTP by a wide
range of clients written in different languages. If measured by the number of Web services
that use it, REST has emerged in the last few years as a predominant Web service design
model. In fact, REST has huge impact on the web that it has mostly displaced SOAP and WSDL
based interface design because it's a considerably simpler style to use (Rodriguez, 2008).
So the reason behind using this approach is that queries that are available in the OLAP cube
are pre-defined. So, giving some intuitive URLs, all queries can be mapped. In Energy2People
system, service layer can be seen as mapping between requests via URLs and Multidimensional
Expressions (MDX) queries. Every request triggers a MDX query that will retrieve data from
data warehouse or data marts.
The future goal of this REST service is to provide a simple API, where any developers could use
to develop new models using renewable energy data and cubes.
Business logic: As it is mentioned in the design section, a class diagram is used to design web
application. It is also said that two main design patterns are used, the Facade pattern and the

DESIGN AND IMPLEMENTATION 66
DAO pattern. This brings a powerful capacity of scaling new functionality in the future because
these patterns are used to abstract details of implementation to other system classes.
Figure 34 shows a more extensive class diagram than the presented in the main document. It is
also a high level diagram because there are some levels of private methods that are
considered to add noise to the schema. The fact is that as there is only one developer in this
project the communication of designs have been always developed in high level without
detailing some implementation details that are usually changed.
Figure 34: Business logic class diagram.
Two classes that do not appear in main document are the StyleCreator class and
StyleChooser class. KMLRender class uses these classes in order to create some specific
styles in the KML file, and the StyleChooser selects one of these styles for each one of the
data.
Finally, it must be said that in the last phase of the project some other functionalities are
studied in order to improve system. One of these functionalities is the support of the GeoJSON
format. Thanks to the design, the addition of this new class does not modify the behaviour and
the structure of the rest of the components of the system.
5.4 Implementation
This section describes the implementation part of the solution. The implementation is divided
into three tasks such as ETL implementation, SOLAP and web application.
5.4.1 ETL
The ETL process is implemented using Java programming language and Geokettle tool. Other
frameworks such as Spring Batch29 are analysed to address the implementation goals but they
29 http://docs.spring.io/spring-batch/
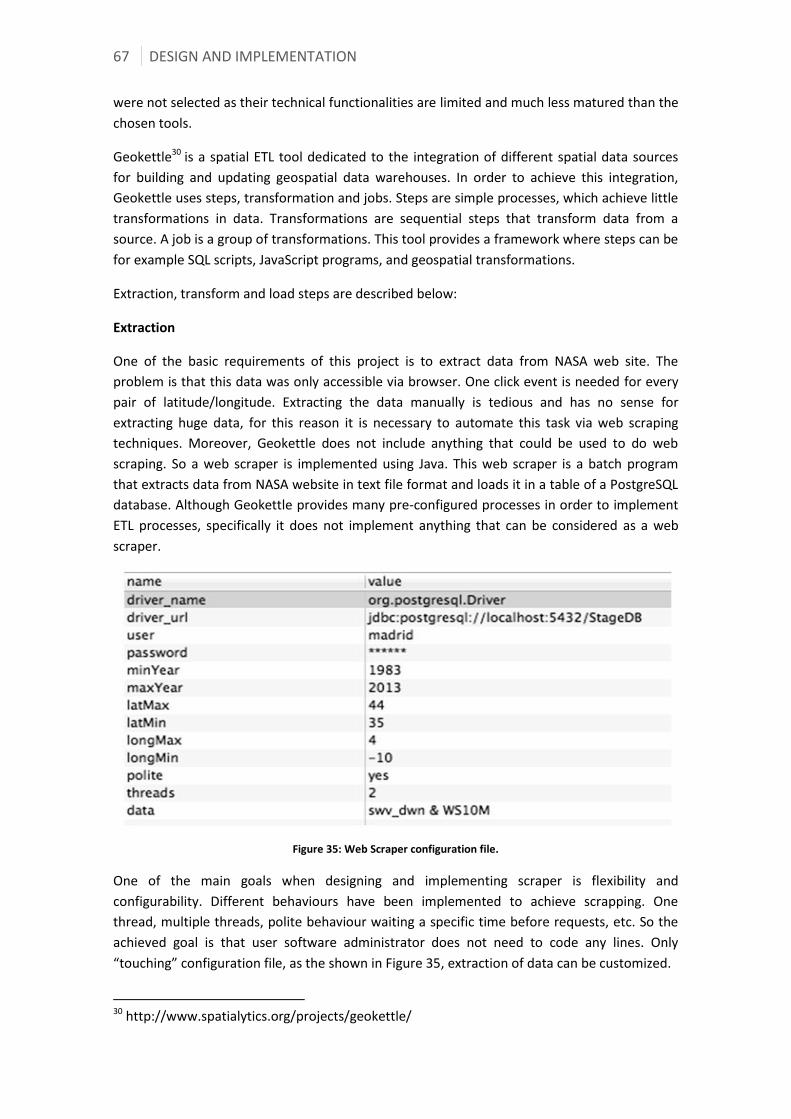
67 DESIGN AND IMPLEMENTATION
were not selected as their technical functionalities are limited and much less matured than the
chosen tools.
Geokettle30 is a spatial ETL tool dedicated to the integration of different spatial data sources
for building and updating geospatial data warehouses. In order to achieve this integration,
Geokettle uses steps, transformation and jobs. Steps are simple processes, which achieve little
transformations in data. Transformations are sequential steps that transform data from a
source. A job is a group of transformations. This tool provides a framework where steps can be
for example SQL scripts, JavaScript programs, and geospatial transformations.
Extraction, transform and load steps are described below:
Extraction
One of the basic requirements of this project is to extract data from NASA web site. The
problem is that this data was only accessible via browser. One click event is needed for every
pair of latitude/longitude. Extracting the data manually is tedious and has no sense for
extracting huge data, for this reason it is necessary to automate this task via web scraping
techniques. Moreover, Geokettle does not include anything that could be used to do web
scraping. So a web scraper is implemented using Java. This web scraper is a batch program
that extracts data from NASA website in text file format and loads it in a table of a PostgreSQL
database. Although Geokettle provides many pre-configured processes in order to implement
ETL processes, specifically it does not implement anything that can be considered as a web
scraper.
Figure 35: Web Scraper configuration file.
One of the main goals when designing and implementing scraper is flexibility and
configurability. Different behaviours have been implemented to achieve scrapping. One
thread, multiple threads, polite behaviour waiting a specific time before requests, etc. So the
achieved goal is that user software administrator does not need to code any lines. Only
“touching” configuration file, as the shown in Figure 35, extraction of data can be customized.
30 http://www.spatialytics.org/projects/geokettle/

DESIGN AND IMPLEMENTATION 68
Figure 36: How Scraper interacts with the NASA website.
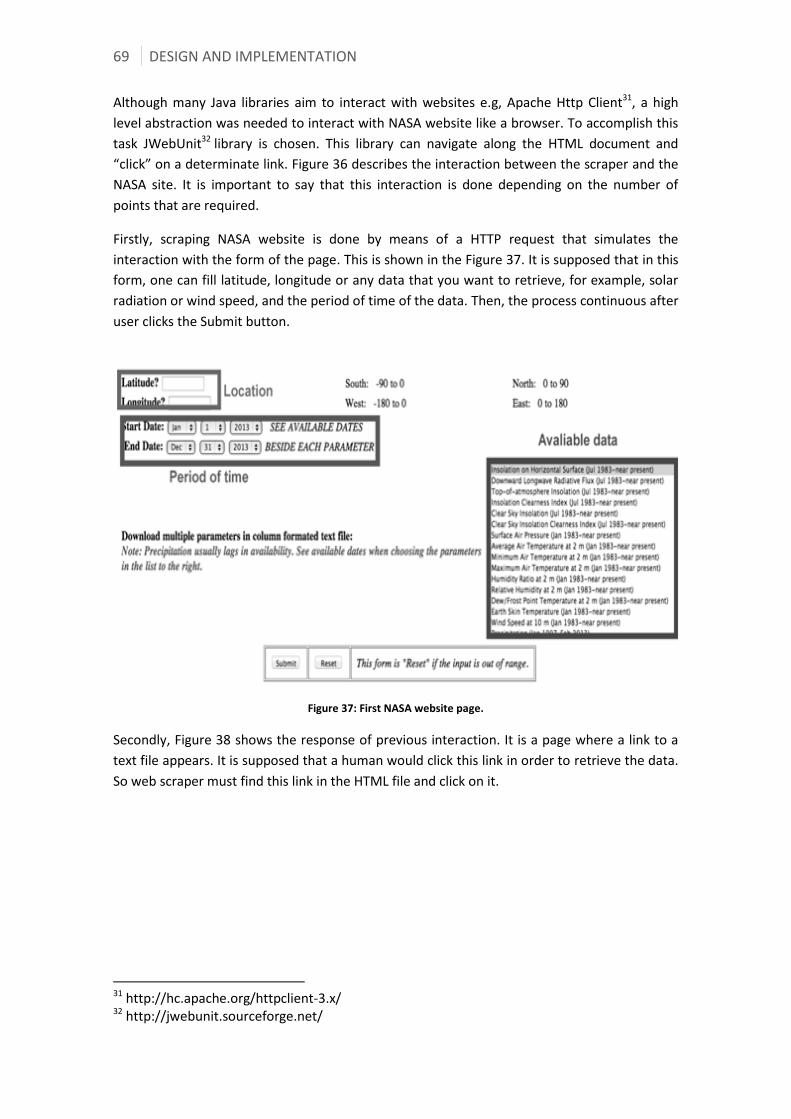
69 DESIGN AND IMPLEMENTATION
Although many Java libraries aim to interact with websites e.g, Apache Http Client31, a high
level abstraction was needed to interact with NASA website like a browser. To accomplish this
task JWebUnit32 library is chosen. This library can navigate along the HTML document and
“click” on a determinate link. Figure 36 describes the interaction between the scraper and the
NASA site. It is important to say that this interaction is done depending on the number of
points that are required.
Firstly, scraping NASA website is done by means of a HTTP request that simulates the
interaction with the form of the page. This is shown in the Figure 37. It is supposed that in this
form, one can fill latitude, longitude or any data that you want to retrieve, for example, solar
radiation or wind speed, and the period of time of the data. Then, the process continuous after
user clicks the Submit button.
Figure 37: First NASA website page.
Secondly, Figure 38 shows the response of previous interaction. It is a page where a link to a
text file appears. It is supposed that a human would click this link in order to retrieve the data.
So web scraper must find this link in the HTML file and click on it.
31 http://hc.apache.org/httpclient-3.x/ 32 http://jwebunit.sourceforge.net/

DESIGN AND IMPLEMENTATION 70
Figure 38: Second NASA website page.
Finally, a text file, as the shown in the Figure 39, is returned by NASA website. Now, scraper
must download it and let other processes, to store this data in a staging place where some
specific transformations can be applied.
Figure 39: The text file with the renewable energy data.

71 DESIGN AND IMPLEMENTATION
Once data and metadata are retrieved, the program implemented stores the data in the table
where the transformations are going to be executed. This process uses JDBC to connect with
DBMS, in this case PostgreSQL. JDBC is a Java-based data access technology (Java Standard
Edition platform) from Oracle Corporation. This technology is an API for the Java programming
language that defines how a client can access a database. It provides methods for querying
and updating data in a database.
Transform
The table where the web scraper loads the data is known as the staging area in ETL processes.
Here, any kind of transformations can be done in order to clean and normalize the data. As it is
mentioned in previous sections, the global coverage of NASA website data is on 1° latitude by
1° longitude grid. This data resolution is considered too low in order to build an analysis tool.
So, an interpolation process must be executed.
Java Advanced Imaging (JAI) is a Java platform extension API that provides a set of object-
oriented interfaces that support a simple, high-level programming model that allows
developers to create their own image manipulation routines.
One of the main goals when designing and implementing interpolation process is flexibility and
configurability. Different behaviours have been implemented to achieve interpolation, for
example, one thread, multiple threads, different database schemas, the same schema, several
years, one year, etc. The interpolation of data can be customized quite easily just by
“touching” the configuration file. In order to simplify the execution, only one year data (1990)
is considered and interpolated. The rest of the years would be the same as the system
resources are not enough to interpolate for all 30 years.
Figure 40 illustrates the configuration file that has been developed. Many parameters can be
configured but the most important are:
DBMS parameters: name of the driver, DBMS URL, user and password
Bounding box: Maximum latitude and longitude next to their minimums
Mathematical parameters: Number of decimals, type of interpolation

DESIGN AND IMPLEMENTATION 72
Figure 40: Interpolation configuration file.
As NASA data resolution is 1º, and after some study on the problem a resolution of 0.01ºis
considered to be appropriate in order to test the possibilities of multi-scale analysis. Indeed, in
future new interpolations techniques must be experimented and implemented depending on
the project requirements. To achieve this goal one interpolation technique (Bilinear) is
randomly selected and implemented and then the resolution of data can be changed using the
configuration file. Figure 41 presents two levels of data interpolations.
Figure 41: Example of interpolations levels.
The Figure 42 illustrates the transformation developed in Energy2People in a simplified
schema. Before the transformation data only exists in the StagingTable. Transformation phase
executes interpolation process in order to obtain the InterpolatedStagingTable that is the
previous step before the load phase. TheInterpolatedStagingTable has 10,000 times more rows
than the StagingTable.
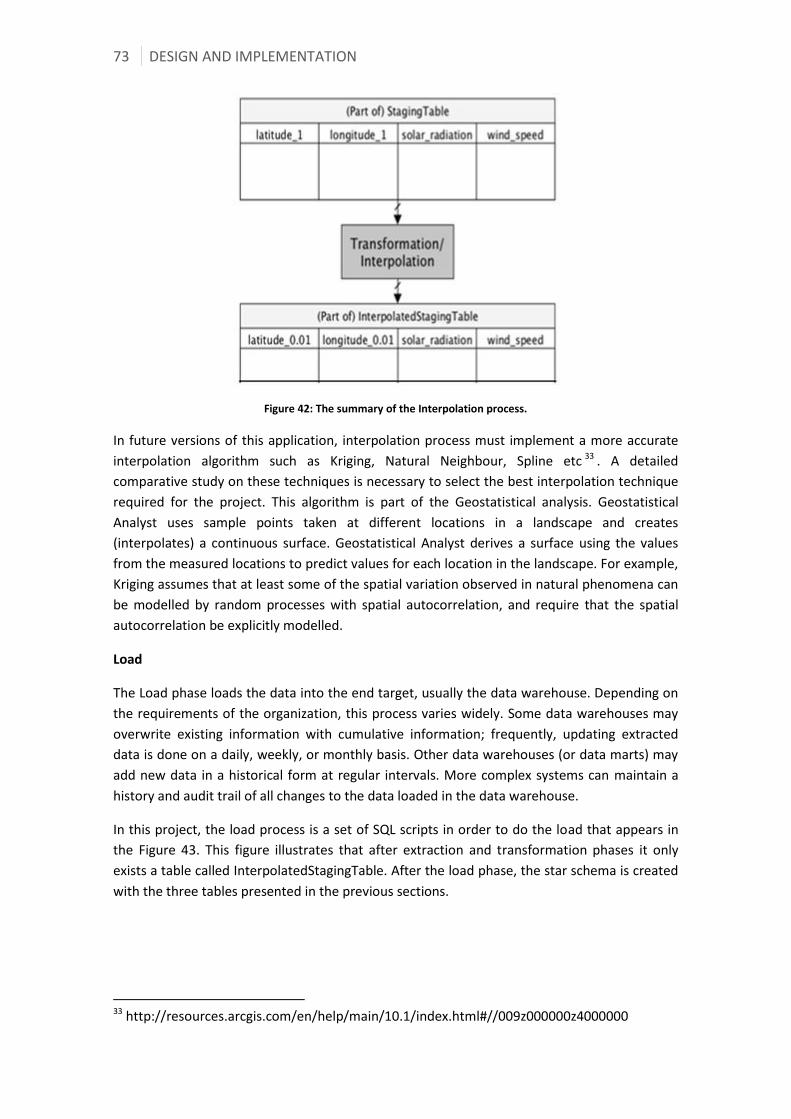
73 DESIGN AND IMPLEMENTATION
Figure 42: The summary of the Interpolation process.
In future versions of this application, interpolation process must implement a more accurate
interpolation algorithm such as Kriging, Natural Neighbour, Spline etc 33 . A detailed
comparative study on these techniques is necessary to select the best interpolation technique
required for the project. This algorithm is part of the Geostatistical analysis. Geostatistical
Analyst uses sample points taken at different locations in a landscape and creates
(interpolates) a continuous surface. Geostatistical Analyst derives a surface using the values
from the measured locations to predict values for each location in the landscape. For example,
Kriging assumes that at least some of the spatial variation observed in natural phenomena can
be modelled by random processes with spatial autocorrelation, and require that the spatial
autocorrelation be explicitly modelled.
Load
The Load phase loads the data into the end target, usually the data warehouse. Depending on
the requirements of the organization, this process varies widely. Some data warehouses may
overwrite existing information with cumulative information; frequently, updating extracted
data is done on a daily, weekly, or monthly basis. Other data warehouses (or data marts) may
add new data in a historical form at regular intervals. More complex systems can maintain a
history and audit trail of all changes to the data loaded in the data warehouse.
In this project, the load process is a set of SQL scripts in order to do the load that appears in
the Figure 43. This figure illustrates that after extraction and transformation phases it only
exists a table called InterpolatedStagingTable. After the load phase, the star schema is created
with the three tables presented in the previous sections.
33 http://resources.arcgis.com/en/help/main/10.1/index.html#//009z000000z4000000
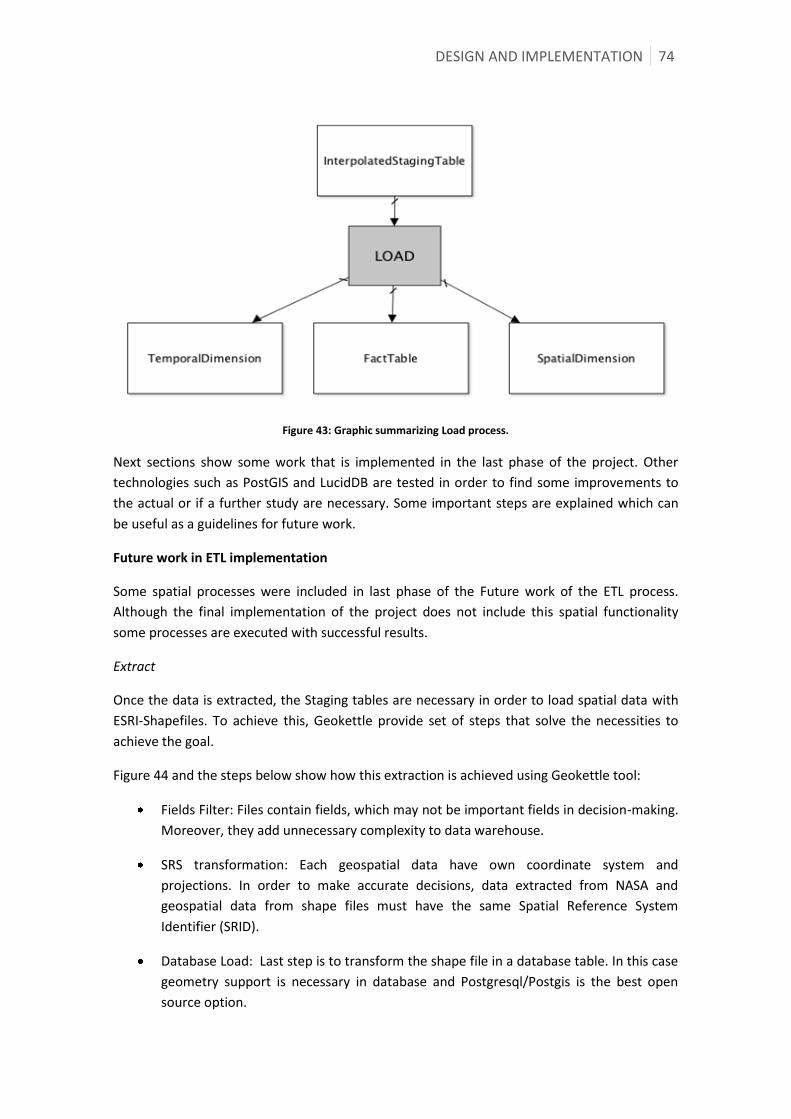
DESIGN AND IMPLEMENTATION 74
Figure 43: Graphic summarizing Load process.
Next sections show some work that is implemented in the last phase of the project. Other
technologies such as PostGIS and LucidDB are tested in order to find some improvements to
the actual or if a further study are necessary. Some important steps are explained which can
be useful as a guidelines for future work.
Future work in ETL implementation
Some spatial processes were included in last phase of the Future work of the ETL process.
Although the final implementation of the project does not include this spatial functionality
some processes are executed with successful results.
Extract
Once the data is extracted, the Staging tables are necessary in order to load spatial data with
ESRI-Shapefiles. To achieve this, Geokettle provide set of steps that solve the necessities to
achieve the goal.
Figure 44 and the steps below show how this extraction is achieved using Geokettle tool:
Fields Filter: Files contain fields, which may not be important fields in decision-making.
Moreover, they add unnecessary complexity to data warehouse.
SRS transformation: Each geospatial data have own coordinate system and
projections. In order to make accurate decisions, data extracted from NASA and
geospatial data from shape files must have the same Spatial Reference System
Identifier (SRID).
Database Load: Last step is to transform the shape file in a database table. In this case
geometry support is necessary in database and Postgresql/Postgis is the best open
source option.

75 DESIGN AND IMPLEMENTATION
Figure 44: ETL flow implementation in Geokettle
Transform
Spatial Stage Table: Some transformations could be carried out, but they are beyond the scope
of the project. For example, the name of the different administrative units could be translated
in different languages in order to provide a multi language support.
Load
After transforming data, load data in data warehouse, according to the models presented in
design sections, is the last step in the ETL.
Next steps:
Four tables with geospatial data of different administrative levels.
A table with renewable energy measures, time and location where these measures
take place.
The load process has different steps. All of them are SQL scripts whose goal is to load all data
with a snowflake schema of data warehouse and a star schema in the case of data marts.
Spatial Dimension Loading
To create table ‘Spatial Dimension Level 4’ with distinct pairs latitude/longitude and
“Coordinate” column extracted from ‘NASA Stage Table’.
To create two new columns in ‘Spatial Dimension Level 4’. First with a primary key,
second one is going to point one of the tables obtained from shape files.
To do a spatial join between ‘Spatial Dimension Level 4’ and ‘Spatial Dimension Level
3’.
Fact Table Load:
Create table “Fact Table”.
Insert renewable energy measures and create foreign keys pointing to ‘Spatial
Dimension Level 4’ and ‘’Temporal Dimension”.
At these point data warehouse is created with a snowflake schema.
DESIGN AND IMPLEMENTATION 76
Once the SDW is deployed, it is recommended to divide it in data marts. A data mart is the
access layer of the data warehouse environment that is used to get data out to the users. The
data mart is a subset of the data warehouse that is usually oriented to a specific business line
or team. Data marts are small slices of the data warehouse. Whereas data warehouses have an
enterprise-wide depth, the information in data marts pertains to a single department.
LucidDB34 is the DMBS that is used to implement data marts. LucidDB is a column-oriented
DBMS, and aggregations are computed faster than relational DBMS. LucidDB is an open source
RDBMS purpose–built entirely for data warehousing and BI. It is based on architectural
cornerstones such as column-store, bitmap indexing and hash/join aggregation.
In data marts, information is inside the last administrative level (local level), so geometries are
not necessary and latitude/longitude pairs are enough to do an accurate analysis.
Dividing data warehouse into some data marts, a faster access can be observed. The technical
reason is because of the less number of rows in the table FactTable. This can be a really
important point for future improvements and further studies. For example, cities like Zaragoza
and Barcelona can have their own data mart with their own data.
5.4.2 SOLAP
After the ETL process, a SDW is deployed and the next step is to build OLAP cubes. Mondrian35
is considered the best and feasible option because of its good documentation support and the
growing community. The problem with Mondrian is that is not a real spatial-enabled OLAP. But
this project has demonstrated, with conceptual modelling, an OLAP cube implemented with
Mondrian can be used as logic SOLAP. Also during the phase of the project, GeoMondrian36 is
used to implement as a more powerful SOLAP. However, the response latency is not
considered good enough and a further detailed study on implementation can be considered
for future work.
In order to implement logical model, Mondrian uses schemas. A schema defines a multi-
dimensional database. It contains a conceptual model, cubes, hierarchies, and members, and a
mapping of this model onto a physical model.
The conceptual model consists of the constructs used to write queries in MDX language: cubes,
dimensions, hierarchies, levels, and members.
The physical model is the source of the data that is presented through the logical model. It is
typically a star schema, which is a set of tables in a relational database.
The most important components of a schema are:
A cube is a collection of dimensions and measures in a particular subject area.
A measure is a quantity that user interested in measuring.
34 http://www.luciddb.org/html/main.html 35 http://mondrian.pentaho.com/ 36 http://www.spatialytics.org/projects/geomondrian/

77 DESIGN AND IMPLEMENTATION
A dimension is an attribute, or set of attributes, by which you can divide measures into
sub-categories.
A member is a point within a dimension determined by a particular set of attribute
values. For example, 1997, 2012, 5 (May) and 31 are members of the Time Hierarchy.
A hierarchy is a set of members organized into a structure for convenient analysis.
A level is a collection of members that have the same distance from the root of the
hierarchy.
A dimension is a collection of hierarchies that discriminate on the same fact table
attribute.
Figure 45 presents the final schema in a graphical way. It can be seen that the main parts that
are described in conceptual design phase are present in this figure.
Figure 45: A graphic view of the implemented cube.
But what Mondrian really uses in order to retrieve data and communicate with the physical
data layer is a XML file. In this file, the schema with its measures, dimensions, hierarchies and
their levels are defined. Figure 46 shows the final XML file that is executed in the project. It
seems clear that XML file represents the multidimensional model that differentiates an OLAP
cube between other alternative data structures.

DESIGN AND IMPLEMENTATION 78
Figure 46: XML file of the implemented cube.

79 DESIGN AND IMPLEMENTATION
SOLAP Future Work
GeoMondrian37 is the first implementation of a native SOLAP server. It provides a consistent
integration of spatial objects into the OLAP data cube structure, instead of fetching them from
a separate spatial database, web service or GIS file. GeoMondrian provides integration of
spatial and non-spatial data types at a lower level. It directly interfaces with the Mondrian
OLAP server and extends the capabilities of the OLAP server to handle spatial data. The OLAP
server, in turn, uses a spatially enable database system, for example, PostGIS, as storage for
data and to execute data queries. The OLAP server’s responsibility is to translate Spatial OLAP
queries issued by the user into sequences of SQL queries that are being evaluated by the
underlying database engine. The extensions that GeoMondrian provides only enable support
for spatial data types but do not change the strategies used by Mondrian to evaluate OLAP
queries. “This prevents these systems from efficiently answering queries on complex spatial
dimension hierarchies, such as non-strict dimension hierarchies.”(Barltzer, 2011)
Figure 47 shows how the SpatialDimension is defined when using this kind of native SOLAP. In
this case, as it is described in design section, a snowflake schema is modelled, and in the
schema this is represented with joins between tables. It is also important to point that in the
levels, it is defined a property of the type Geometry. This allows Geomondrian to retrieve
geometry columns from the SDW.
Figure 47: XML file with the future spatial dimension.
37 http://www.spatialytics.org/projects/geomondrian/

DESIGN AND IMPLEMENTATION 80
Aggregate table’s implementation
Unlike many OLAP servers, Mondrian does not store the data on disk: it just works on the data
in the RDBMS, and when it reads a piece of data, it stores in its cache. This greatly simplifies
the process of installing Mondrian, but it puts limits on Mondrian's performance when
Mondrian is applied to a huge dataset (Hyde, 2009).
Aggregate tables are a way to improve Mondrian's performance when the fact table contains a
huge number of rows: a million or more. An aggregate table is essentially a pre-computed
summary of the data in the fact table. An aggregate table coexists with the base fact table, and
contains pre-aggregated measures built from the fact table. It is registered in Mondrian's
schema, so that Mondrian can choose whether to use the aggregate table rather than the fact
table, if it is applicable for a particular query. Designing aggregate tables is a fine art. There is
extensive research, empirical and theoretical materials available on the web pertain to
different ways to structure aggregate tables. A fact table can have zero or more aggregate
tables. Every aggregate table is associated with just one fact table. It aggregates the fact table
measures over one or more of the dimensions. The problem of aggregate tables is that they
are materialized views. A materialized view is a database object that contains the results of a
query, what it means that they are using space in the DBMS and space is usually an expensive
resource in BI projects because of humongous information that is involved.
Primarily, there are three important steps in order to implement aggregate tables: To create
the aggregate table, to populate the aggregate table and to reference the aggregate table in
Mondrian Schema.
5.4.3 Web application
The service layer, the business logic layer and the presentation layer with their corresponding
technologies are presented below.
Service Layer
Once SDW and SOLAP are implemented, the next step us to implement data access layer. As it
is mentioned in previous sections, an REST API, which abstracts the multidimensional model,
provides the connection between business logic layer and data layer. To implement this
service, a framework called Jersey is selected. The reason for using this framework is that it
extends and simplifies the JAX-RS API, the standard Java API to create RESTful Services.
Moreover Jersey is open source and provides a lot of documentation support.
Resources are the key parts that compose a RESTful Web service. Manipulating resources
using HTTP methods like GET, POST, PUT, and DELETE. Anything in the application can be a
resource, in this case renewable energy data. In JAX-RX, each resource is implemented using
the pattern Plain Old Java Object using @Path annotation to compose their identifier. A
resource can also have sub resources.

81 DESIGN AND IMPLEMENTATION
There are some more annotations that help to implement this layer:
• @Context: annotate to inject the contextual objects such as Request,
Response, UriInfo, ServletContext, and so on.
• @Path("{v1}"): This is the @Path annotation combined with the root
path "/rest" that forms part of the URI.
• @PathParam ("measure"): This annotation injects the parameters into the
path, measure (wind speed and solar radiation), in this case. Other available
annotations are @FormParam, @QueryParam, and so on.
• @Produces: Multiple MIME types are supported for responses. In
Energy2People case, application/json will be the default MIME type.
At this point data warehouse, OLAP cube and the API REST are implemented. This implies that
an important part of the backend is implemented. Now, it is necessary to implement a
business logic layer where retrieved data can be processed and used to provide map
visualization or to complete a financial or ecological model. These layers are implemented in
Java programming language. Finally, a presentation layer, where users can interact with the
application, is provided. This last layer is implemented using web technologies such as HTML,
JavaScript and CSS.
Business Logic Layer
The business logic layer uses service layer to retrieve data required from the user when user
interacts with presentation layer. Once the data is retrieved, different operations can be
applied to enrich the data. As mentioned in Design section, logic is divided in different classes.
They all are implemented in Java. To simplify the description of its implementation, they are
divided in DAO, visualization and model.
DAO: The Data Access Object (DAO) pattern is chosen to design access to service layer. More
details of this chosen are described in Design section. The selection of JSON format to return
data from service layer is considered to be a good choice because of its lightness and the
support in Java language.
Summarizing the functionality of this part of the system, the implementation of
RenewableEnergyDaoImpl converts the user request via in an APIRESTcall. To implement
connection with the API REST, Jersey Library is used. Once data is retrieved in JSON format,
this is mapped into a JSONArray object from the JSON library for Java. At this point, the data is
sent to the Facade class, which is also implemented in Java. This class can now send the
data to the KmlRenderor to the EcoFinancialModel class.
Visualization: If user is interacting with the map in the presentation layer, when data is
retrieved from data layer, it is converted to KML. To implement this functionality two java
libraries are essential: Java API for KML (JAK) and JSON library for Java. The JSON library for
Java is used to turn the input stream from the service layer into java objects, in this case
JSONObject and JSONArray.

DESIGN AND IMPLEMENTATION 82
The main goal of the Java API for KML (JAK) is to provide automatically generated
full reference implementation of the KML object model defined by OGC's KML standard and
Google's GX extensions. It is an object orientated API that enables the convenient and easy use
of KML in existing Java environments.
On one hand, KML provides a powerful way to display georeferenced data on Google Earth. It
is an XML notation for expressing geographic annotation and visualization within Internet-
based, two-dimensional maps and three-dimensional earth browsers. KML was developed for
use with Google Earth. KML became an international standard of the Open Geospatial
Consortium (OGC) in 2008. It specifies a set of features (place marks, images, polygons, 3D
models, textual descriptions, etc.) for display in Google Earth, Google Maps and Mobile, or any
other geospatial software implementing the KML encoding. Each place always has a longitude
and latitude. Other data can make the view more specific, such as tilt, heading, altitude, which
together define a "camera view" along with a timestamp or time span. KML shares some of the
same structural grammar as GML.
On the other hand, one of the problems of using KML as output format is the size of resulting
file. This results in high latency, but Apache Software Foundation provides a library called
Commons IO, which speeds up the file serialization. Then, it is send to presentation layer.
During the last phase of the project, some other kinds of formats were also tired, in particular,
GeoJSON. GeoJSON is a format for encoding a variety of geographic data structures. A
GeoJSON object may represent geometry, a feature, or a collection of features. GeoJSON
supports the following geometry types: Point, LineString, Polygon, MultiPoint, MultiLineString,
MultiPolygon, and GeometryCollection. Features in GeoJSON contain a geometry object and
additional properties, and a feature collection that represents a list of features.
Model: The model presented in the next lines is developed is based on the reading of several
sources, and simplicity in the implementation. The system requirements do not specify
complex models, just the possibility to add models to the retrieved data. With these models,
the Energ2People project aims to provide a simple and fast translation between data units.
In the future versions of this project, quality of these models must be improved in order to
have better findings and accurate results.
Presentation Layer
In presentation layer user can interact with the application for functional and usability
requirements. The technologies that are used and their mission are explained below:
Hypertext Markup Language (HTML), the mark-up language used to create documents on the
World Wide Web. HTML defines the structure and layout of a Web document by using a
variety of tags and attributes.
JavaScript, jQuery and AJAX: JavaScript is an interpreted computer programming language
implemented as part of web browsers so that client-side scripts could interact with the user,
control the browser, communicate asynchronously, and alter the document content that was
displayed. Ajax is a group of interrelated web development techniques used on the client-side
83 DESIGN AND IMPLEMENTATION
to create asynchronous web applications. JQuery38 is a multi-browser JavaScript library
designed to make it easier to navigate a document, select Document Object Model (DOM)
elements, to handle events and some other features.
Cascading Style Sheets (CSS) and Twitter bootstrap: CSS is a style sheet language used for
describing the presentation look and formatting of a document written in a markup language.
In order to standardize development of interface components, Twitter bootstrap39 has been
used beside jQuery-UI. Twitter Bootstrap is a free collection of tools for creating websites and
web applications.
Google Maps: The Google Maps JavaScript API lets Google Maps geo content you embed in
any of the web pages. This JavaScript library has great importance in this project for spatial
dissemination of data on the web. This web application uses Google geo component to send
Ajax requests to business logic layer. When zooming or panning on the map, new data is
retrieved. When this occurs, the business logic transforms the data in the KML files that can be
displayed on the map. Otherwise, if the user uses menu to apply a model to the data, the table
displays the results. These results are sent to the presentation layer in JSONformat.
Thus, all these technologies played significant and important role in design and
implementation of the Energy2People application.
5.5 Qualitative assessment
Although a quantitative study on the performance of the tools would provide better insights
for assessing on improvement areas, due to several constrains such as limited control over the
technical details of other software architectures presented in this section and also due to
stipulated time, the assessment of the tool has been made qualitatively. Following the
guidelines presented in Spencer et al. (2003), some arbitrary indicators pertained to design,
analysis and reporting are presented which will help in assessing features of the tool presented
in this chapter. This comparison assessment allows the tool approach to cross-reference with
other existing tools and to add pragmatic support to the theory proposed in the thesis. Since,
this is a brief assessment of the tool; eight attributes that are considered as the most relevant
from thesis point of view, general software engineering and user perspective. Assessment
attributes are Data granularity, Visualization, Reports, Data coverage, Services, Data sources,
Latency and Ease of use. Like mentioned in earlier chapter, we choose two global player tools
from NREL40 and IRENA41 and, a region tool called Energie-Atlas Bayern42. A brief comparison
to these tools with our tool (Energy2people) is laid below and as shown in the Table 5.
38 http://jquery.com/ 39 http://getbootstrap.com/ 40 http://maps.nrel.gov/re_atlas 41 http://www.irena.org/globalatlas/ 42http://geoportal.bayern.de/energieatlas-karten
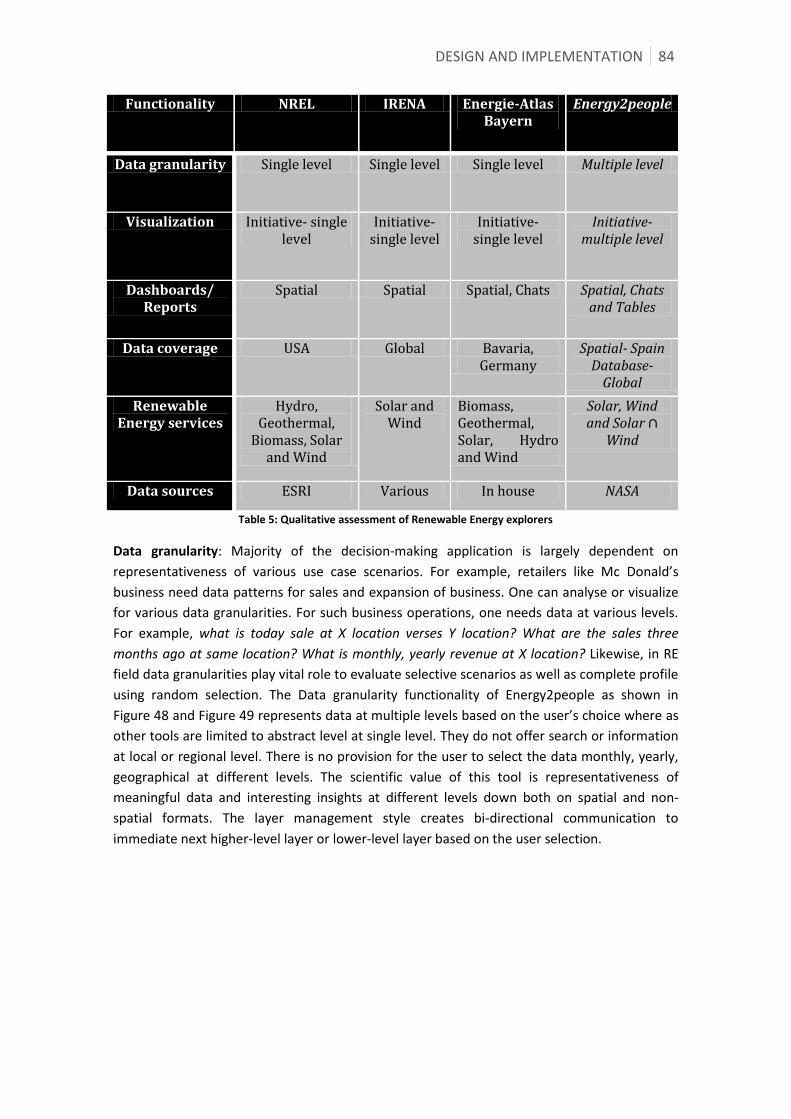
DESIGN AND IMPLEMENTATION 84
Functionality NREL IRENA Energie-Atlas Bayern
Energy2people
Data granularity Single level Single level Single level Multiple level
Visualization Initiative- single level
Initiative- single level
Initiative- single level
Initiative- multiple level
Dashboards/ Reports
Spatial Spatial Spatial, Chats Spatial, Chats and Tables
Data coverage USA Global Bavaria, Germany
Spatial- Spain Database-
Global
Renewable Energy services
Hydro, Geothermal,
Biomass, Solar and Wind
Solar and Wind
Biomass, Geothermal, Solar, Hydro and Wind
Solar, Wind and Solar ∩
Wind
Data sources ESRI Various In house NASA
Table 5: Qualitative assessment of Renewable Energy explorers
Data granularity: Majority of the decision-making application is largely dependent on
representativeness of various use case scenarios. For example, retailers like Mc Donald’s
business need data patterns for sales and expansion of business. One can analyse or visualize
for various data granularities. For such business operations, one needs data at various levels.
For example, what is today sale at X location verses Y location? What are the sales three
months ago at same location? What is monthly, yearly revenue at X location? Likewise, in RE
field data granularities play vital role to evaluate selective scenarios as well as complete profile
using random selection. The Data granularity functionality of Energy2people as shown in
Figure 48 and Figure 49 represents data at multiple levels based on the user’s choice where as
other tools are limited to abstract level at single level. They do not offer search or information
at local or regional level. There is no provision for the user to select the data monthly, yearly,
geographical at different levels. The scientific value of this tool is representativeness of
meaningful data and interesting insights at different levels down both on spatial and non-
spatial formats. The layer management style creates bi-directional communication to
immediate next higher-level layer or lower-level layer based on the user selection.
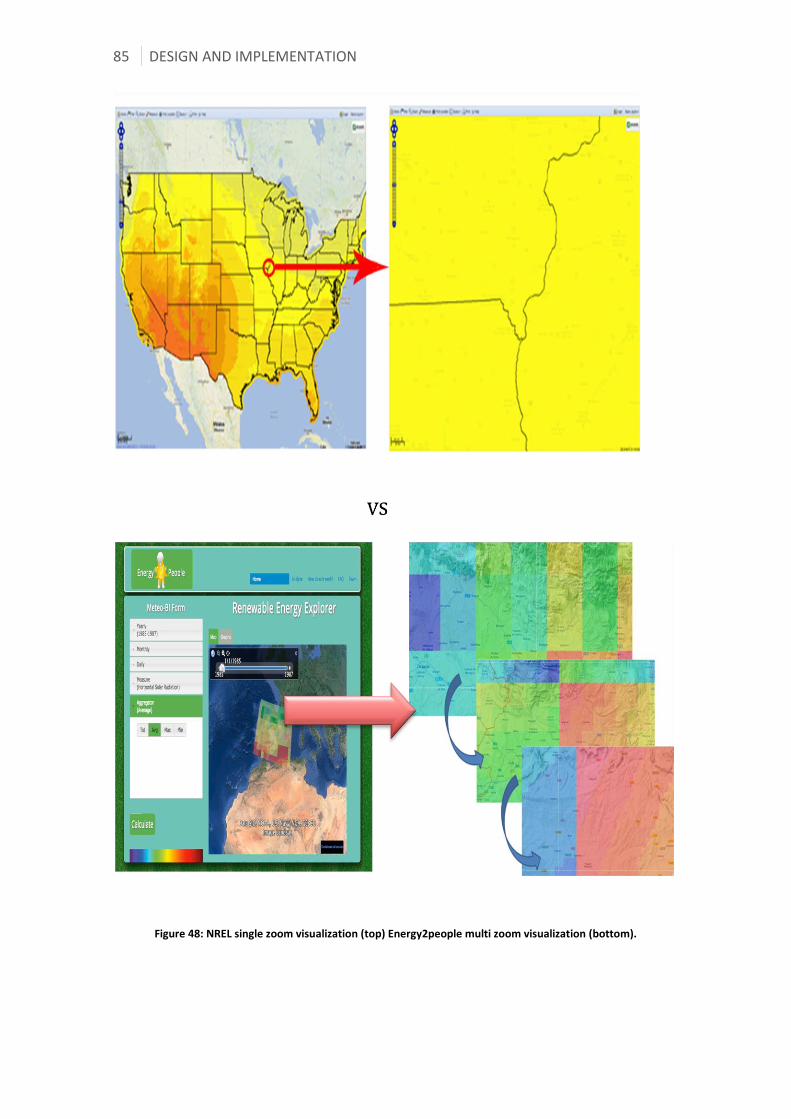
85 DESIGN AND IMPLEMENTATION
Figure 48: NREL single zoom visualization (top) Energy2people multi zoom visualization (bottom).

DESIGN AND IMPLEMENTATION 86
Visualization: Visualization attribute of the tool helps to visualize the data and change
scenarios on a spatial format. Spatial environment is like virtual interaction points to the real
world and plays instrumental to understand the data. All the tools are well designed to
visualize the data at abstract level. For example as shown in Figure 48, NREL atlas provides
very good information at country level (USA) but assessing the data under circumstances like
time scale, location levels is clearly absent in all the tools. On the other hand, Eneryg2people
puts additional efforts of representation the data in relation to time and location at various
levels. This tool (Figure 49) allows decomposition of the ground truth scenarios into various
geographical levels and delivers multiple change scenarios to answer when and where context.
This layered styled approach invokes spatial layers both upwards and downwards. This creates
a really interesting heat maps of what is the information at various geographical levels. Break
information into various hierarchical level based on the available assets could be interesting
for various stakeholders like local public, remote investor, and national to local level
politicians. Energy2people is not just search and discovery engine but also offers platform for
some interesting avenues likes target advertisements or future business investments etc.
Figure 49: Energy2people multiscale geographical representation of data
Dashboards/Reports: Important aspect of any application will be projection of the results to
an initiative reporting format for all sections of the users. Huge amount of data that needs to
be condensed and generating reports are imperative. Keeping in mind, multiple requirements
of various stakeholders, education, and experience levels of the people, Energy2people
reporting formats are designed as shown in Figure 50. All the tools present the data spatially
(on a map) which is one of the best and easy ways of understand complex data dynamics.
However, proposed approach sees users deserve little extra luxury to understand more about
the data and thus provides the provisions for interactive charts and tables as well.

87 DESIGN AND IMPLEMENTATION
Figure 50: Energy2People visualization formats
Data coverage: To have a strong and global user base, high quality and wide data coverage is
very essential. NREL has a complete coverage for USA, while IRENA has global coverage as this
a consortium for various international renewable energy experts and companies. Energie-Atlas
Bayern is a regional data portal for Bavaria, Germany. Energy2people is a prototype to
demonstrate the technology approach proposed in the thesis as the application relies on free
available data from NASA, which has global coverage. Since this is a prototype, the application
data coverage is limited to the Iberian Peninsula but provides information from city level to
country level or any area based on the random selection of users.
Services: NREL and Energie-Atlas Bayern provide services to most of the renewable energy
sources such as Hydro, Geothermal, Biomass, Solar and Wind. IRENA provides extensive data
only for solar and wind. Energy2people also provides for solar and wind. In addition, this tool
provides best location and temporal data for both solar and wind. This is one of the
distinguishable characteristics of the tool.
Data sources: Different tools procure data from various data sources and providers as shown
in the table. Energy2people relies on NASA data source.
Latency: This is one quality that determines the performance of the tool and users satisfaction.
Diverse data sets in different data formats, huge data volume, maintenance and update of
data is very tedious and quite challenging. All these factors affect data response time to the
users. This is much evident in the IRENA tool as this portal is based on diverse data sources and
has global data coverage. The values portrayed in the table are just based on human
observation. So, this comparison cannot claim the data values are perfect.

DESIGN AND IMPLEMENTATION 88
Ease of use: All these tools interfaces are user-friendly expect for Energie-Atlas Bayern in
which the options are available only in German. As this is a regional based tool mostly for the
local community.
5.6 Summary
This chapter presents the Energy2people functionalities for exploring solar radiation location
data and temporal events. A detailed discussion on the technical design behind the tool is also
presented. As highlighted in the Contribution section of the First chapter, the distinguishable
quality of tool is, “it discovers and renders inherent data relationships and, establish a
meaningful relationship among the data entities in cases where inheritance is absent”. A
qualitative assessment is made to study the performance of the Energy2people to the other
international renewable energy atlases. Application highlights (Section 5.1), technical
explanation, tool interface and functionalities figures especially Figure 48 will technical justify
the contribution statement and product gap identified in the thesis.

Chapter 6
CONCLUSION
Web map services, Geo processing services and concepts like SDIs, Spatial portals,
Interoperability and VGI revolutionize by opening new opportunities in discovering and
combining multiple potential sources for developing applications. Based on the available open
resources, technology and importance of renewable energy this thesis proposes a
methodological framework to guide end users in their scientific and enterprise pursuance. This
study has also highlighted interesting research areas that should be beneficial to both the
public and private sectors. In this line of experimentation, the Energy2People is developed to
showcase the layered structuring and intuitive reports proposed in this thesis. For future work
has to be focused on full-blown REDSS to have a robust sun-shadow mapping environment.
REDSS should include all 3D building models, DEM, modelling of sun position and casting of
shadows. This decision model should animate different ground truth scenarios in which
anyone from experts to the common public may wish to view and manipulate the spatial sun-
shadow data analyses for various application scenarios discussed in this thesis.
Figure 51: Graphical relationship of thesis chapters, questions (Q) & contributions (C)
Figure 51 hold up to view the relationship between the research questions and contributions
highlighted in the first chapter of this thesis and also as below. Each research question was
answered chapter by chapter to fulfil the research objective.
The whole intention behind the thesis is as stated below and a set of research questions is laid
beneath to fulfil the intention and is answered chapter by chapter as shown in Figure 51.
Develop a methodological framework based on the above-stated assertions to guide end users
in their enterprise and scientific projects.

CONCLUSION 90
Questions related to data:
Q1. How to choice best data making approach in creating cost-effective geo models?
Questions related to technology:
Q2. What is the product gap in existing approaches and solutions for sun-shadow
mapping?
Q3. How to assimilate and adopt Data warehousing and BI concepts for renewable energy?
Q4. How to structure and organize sun and shadow data?
Q5. What are the significant differences between the method proposed and other existing
global services?
Questions related to use cases:
Q6. What are the use cases of REDSS?
Q7. What are the benefits of REDSS to general public and experts?
6.1 Contributions
Chapter 1 has presented the need and importance of profile analytics for decision-making.
From a personal profile screening to selection of complex huge dataset profiling play
instrumental role in choosing the resources for the project. This chapter touch based on
different profiling examples and associated technology in analysing the data. This chapter
stress more on the importance of the technology exploration for scientific and business
studies.
Chapter 2 (C1) has made a deep dive into Sun-shadow mapping ecosystem to know the current
developments and areas that need significant improvements with involvement of state-of-the-
art technologies. Ecosystem includes the various open source and commercial data models,
software libraries, algorithms that are used in the industry and academia. After reviewing the
current state scenario, profile analytical approach is lacking and this is the clear motivation
behind proposing a DSS based on BI to scientific data and to focus particular in renewable
energy field.
Chapter 3 (C2) has been specially focused on economical plan of developing web solutions for
geo market. The central contribution from this chapter is to highlight tangible benefits of the
existing potential data and expeditious patterns for the digital earth model. To give a
pragmatic support to the theory posed in this chapter, a low cost development of virtual 3D
city model using publicly available cadastral data and web services is showcased.
Chapter 4 (C3 & C4) has laid out the motivation and the literature knowledge that has been
acquired from the first two chapters of this thesis led to propose REDSS which is the key and
main contribution from this thesis. This thesis sees REDSS not just as an application or
conceptual data model but also as a decision-making solution for both scientific and business

91 CONCLUSION
studies. REDSS profound objective is to propose a web service that will accommodate various
spatiotemporal ground truth when and where scenarios, in which an expert user to common
public can perform from the ground up sun- shadow data analyses.
Chapter 5 (C5) unfolded Energy2People a web application which has been evaluated and
recognised by NASA scientists and experts. This is a major pragmatic contribution from this
thesis to be recognised by NASA as a one of the best matter-of-fact approach for “Renewable
Energy Explorer”. The tool fits in Open business model as this economical built on open source
components and free available data source. As mentioned earlier this tool as a “World class”
on par with or above international standard web services. The distinguishable quality of tool is,
“it discovers and renders inherent data relationships and, establishes a meaningful relationship
among the data entities in cases where inheritance is absent” (Figure 48).
The thesis ends with the presentation of Energy2people prototype that is based on BI
approach. This thesis takes pride in working with diverse and complex topics nevertheless
could able to come up with a solution (REDSS/Energy2people). As the selected thesis topic is
vast and complex it leaves for lot of scope for avenues of research. As mentioned earlier in the
thesis, the future work list mentioned below has potential to be a thesis topic for Computer
sciences, Geoinformatics, Renewable energy science students.
6.2 Future work
Sun-shadow mapping is very vast and complex subject. It involves various concepts from
different subjects like Astronomy, Physics, Environment, Computer science and Location based
information technology. Integrating concepts from various fields to build a complete sun
shadow-mapping environment opens up great possibilities for taking this further. Due to
limited availability of resources, time constraints and other factors, REDSS proposed cannot be
developed fully-fledged and this leaves to have substantial scope for future work. Below are
some important highlights that need immediate attention in making use of complete clean
energy sources. In addition, few technical future work points are also highlighted in the Design
and Implementation section of Chapter 5. All these are very demanding but at the same should
be very interesting for various real world use cases such as PV plants (installation cost, site
selection, estimation of useful rooftop area), sun and shadow paths etc.
6.2.1 Eclectic approaches
As in relation to future work, it will be interesting to delve on eclectic approaches for
integrating diverse models for developing the digital earth model and also on the automation
of QC on the data to explore the possibility of improving the quality of data for analytical and
sophisticated applications.
6.2.2 Wind component
As discussed in this thesis, mapping solar energy has lot of benefits especially for PV plants.
Discovering best location for both wind energy and solar radiation should be interesting
finding for the project. As mentioned earlier in this thesis, wind energy and solar radiation act
CONCLUSION 92
as complimentary sources. As per theory, to set-up these renewable energy sources does not
require much water which is also a plus point for choosing these clean energy resources.
Considering all these points in finding optimal suitable location will be challenging but the
results should add great economical value to the existing system.
6.2.3 Dimensions
The Sun and Shadow cubes proposed in this thesis have several dimensions and has its own
significance to each dimension and hierarchical levels. These cubes can be expanded more in
terms of intuitiveness, functionality, analysing, economics etc. For example, it could be
interesting to the PV plant decision makers to have a dimension based on type of PV. Standard
Crystalline Silicon (c-Si), Cadmium-telluride, Copper-indium-gallium-selenide (CIGS) are some
of which categorized with conversion efficiency ranging from 20 % down to 7 % (Agugiaro et al.
2012).
6.2.4 Solar intensity
It will be very interesting to have one single equation for solar intensity, which considers all
atmospheric parameters such as Temperature, Dew point, WindSpeed, Humidity, Skycover,
and Precipitation. As used in Energy2People, NASA provides data to all these parameters. It
would be really interesting for PV applications, if a relation to all these atmospheric
parameters to the solar radiation data were established. Further, improvement on the data
quality and data coverage of these parameters will be more useful for PV applications.
6.2.5 Checkerboard graphs
Cubes for solar radiation will play significant role in site selection which is explained in this
thesis. Adding, Checkerboard graphs will be very interesting graph plot for each atmospheric
parameter (Temperature, Dew point, WindSpeed, Humidity, Skycover, and Precipitation) along
with solar radiation data as faces of the cube. Figure 51 shows the checkerboard for solar
radiation data of a particular region along the year and month. Adopting such plotting to data
cube for temporal hierarchical (Month---Week---day) structuring on each face the Data cube
could yield interesting patterns for more intuitive decision-making.

93 CONCLUSION
Figure 52: Checkerboard graphs for Global Horizontal Irradiance (Kaku and Potter 2009).
6.2.6 Interoperability
As this thesis encompass on Open business models, open data and SDIs. Interoperability
should be one of the interesting areas for the computer science experts to research on the
interoperability capabilities for software development and the Geo BI solutions. Furtherance,
to emphasis on this particular area, an oral presentation was presented at the Spatial Data
Infrastructures conference (JIIDE 2013)43.
43 http://www.jiide.org/


95 BIBLIOGRAPHY
Bibliography
Al Otaibi, A and Al Jandal, S., 2011. Solar photovoltaic power in the state of Kuwait. 37th IEEE
Photovoltaic Specialists Conference (PVSC), 19-24.
Florczyk, A, F., 2012. Search improvement within the Geospatial web in the context of Spatial
Data Infrastructures. PhD Dissertation. Computer science and Engineering department,
University of Zaragoza, Zaragoza, Spain.
Aporta., 2011. Characterization Study of the Infomediary Sector [online]. Available from:
http://www.ontsi.red.es/ontsi/en/estudios-informes/characterization-study-infomediary-
sector-june-2011 [Accessed 20 August 2011].
Agugiaro, G., Nex, F., Remondino, F., De Filippi, R., Droghetti, S., and Furlanello, C., 2012. Solar
Radiation estimation on building roofs and web-based solar cadastre. ISPRS Ann. Photogramm.
Remote Sens. Spatial Inf. Sci., I-2, 177-182.
Barltzer, O., 2011. Computational Methods for Spatial Olap. Halifax : Dalhousie University.
Barone, D., Yu, E., Won, J., Jiang, L., and Mylopoulos, J., 2010. Enterprise modeling for business
intelligence. In: Proc. PoEM'10.
Beccali,M., Cellura,M and Mistretta, M., 2003. Application of the Electre method at regional
level for the diffusion of renewable energy technology. Renewable Energy. Vol. 28, 2063-2087.
Bédard, Y., Merrett, T., and Han J., 2001. Fundamentals of spatial data warehousing for
geographic knowledge discovery. Geographic Data Mining and Knowledge Discovery. Taylor &
Francis. 53-73.
Bejar, R.,Latre., M, A., Lopez-pellicer, F, J., Nogueras-iso, J., Zarazaga-soria, F.J., and Muro-
Medrano, P.R., 2012. SDI-Based Business Processes: A Territorial Analysis Web Information
System in Spain. Computers and Geosciences. Vol. 46, 66-72.
Blanco-Muriel, M., Alarcon-Padilla Diego, C., and Lopez Moratalla Teodoro., 2001. Computing
the solar vector. Solar Energy, 431- 441.
Brans, J.-P., Marescha, B and Mertens, D.,1993. BANKS: a decision support system for the
evaluation of the complex international banking sector. International Conference on Systems
Engineering in the Service of Humans. vol 1, 659-663.
Cabello,J, M., Luque,M.,Miguel,F., Ruiz,A. B and Ruiz, F., 2011. A multiobjective interactive
approach to determine the optimal electricity mix in Andalucía (Spain). Spanish Society of
Statistics and Operations Research (TOP).
Catastro, 2010. Catastro [online]. Available from:
http://ovc.catastro.meh.es/Cartografia/WMS/ServidorWMS.aspx?request=getcapabilities
[Accessed 11 November 2010].

BIBLIOGRAPHY 96
Cartociudad, 2010. Cartociudad [online]. Available from
http://www.cartociudad.es/portal/1024/index.htm/ [Accessed 20 October 2010].
Cary, T., 2009. New Research Reveals Current and Future Trends in LIDAR Applications. Earth
Imaging Journal. Vol 1, 8-9.
Chen, G and Kotz, D., 2000. A Survey of Context-Aware Mobile Computing Research,
Dartmouth College, Hanover, NH.
Ciobanu, V., Pop, F., Popescu, D and Cristea, V., 2010. A Distributed Approach to Business
Intelligence Systems Synchronization. 12th International Symposium on Symbolic and Numeric
Algorithms for Scientific Computing (SYNASC).
ComPADRE., 2011. Gnomon Model [online]. Available from: http://www.compadre.org
[Accessed 3 May 2011].
C2es., 2012. Center for Climate and Energy Solutions [online]. Available from:
http://www.c2es.org/energy/source/renewables [Accessed 2 November 2012].
Energie-Atlas., 2013. Energie-Atlas Bayern [online]. Available from:
http://geoportal.bayern.de/energieatlas-karten [Accessed 9 April 2013].
Espejo García, B, A., 2013. Energy4People: Sistema de soporte para la toma de decisiones en el
dominio de las energías renovables orientado al usuario no experto. Proyecto Fin de Carrera,
Escuela de Ingeniería y Arquitectura, Universidad de Zaragoza, Zaragoza, Spain.
EuroGEOSS., 2011. EuroGEOSS [online]. Available from:
http://www.eurogeoss.eu/about/Pages/WP2.aspx/ [Accessed 11 April 2011].
Find my shadow., 2011 [online]. Available from: http://findmyshadow.com [Accessed 9 March
2011].
Gamma, E., Richard, H., Ralph, J., and John, V., 1995. Design Patterns: Elements of Reusable
Object-Oriented Software. Addison-Wesley. ISBN 0-201-63361-2.
Gao, H and Zhang, Wen-song., 2013. Research on coupling intellectual property and open
business model. International Conference on Management Science and Engineering (ICMSE),
864-869.
Geogratis., 2011. Geogratis [online]. Available from:
http://geogratis.cgdi.gc.ca/geogratis/en/index.html/ [Accessed 4 October 2011].
Goel, A., Jamdagni, R,P and Mishra, N,K., 2010. New hope for clean energy through exploring
space. Recent Advances in Space Technology Services and Climate Change (RSTSCC). pp.87-89.
GoGeomatics., 2013. How Valuable is Geospatial Information in Canada? Gogeomatics
Magazine [online]. Available from: http://www.gogeomatics.ca/magazine/how-valuable-is-
geospatial-information-in-canada.htm#! [Accessed 1 October 2013].
97 BIBLIOGRAPHY
Gipuzkoa., 2011. Gipuzkoa [online]. Available from: http://b5m.gipuzkoa.net/url5000/es/
[Accessed June 27 2011].
GITA., 2005. Free or Fee: The Governmental Data Ownership Debate [online]. Available from:
www.gita.org/resources/whitepapers/Free_or_fee.pdf/ [Accessed March 10, 2011].
Goodchild, M.F., 2008. The use cases of digital earth. International Journal of Digital Earth,
1(1): 31-42.
Goodchild, M.F., 2009. Geographic information systems and science: today and tomorrow.
Annals of Geographical Information Science, 15(1): 3–9.
Goodchild, M.F., and Glennon, A.J., 2010. Crowdsourcing geographic information for disaster
response: a research frontier. International Journal of Digital Earth, 3(3): 231-241.
GSDI., 2010. GSDI [online]. Available from: http://www.gsdi.org/ [Accessed 14 November
2010].
G20., 2012. World Tourism Organization [online]. Available from: http://www2.unwto.org/.
[Accessed 30 July 2012].
Hofierka, J.,and Kaňuk J., 2009. Assessment of photovoltaic potential in urban areas using
open-source solar radiation tools. (A. Sayigh, Ed.). Renewable Energy, 30 (10): 2206-2214.
Hohmeyer, O.H., 1994. Solar energy and job creation benefits of photovoltaics in times of high
unemployment. IEEE Photovoltaic Specialists Conference - 1994, IEEE First World Conference on
Photovoltaic Energy Conversion.
Huellasolar., 2011. Huellasolar [online]. Available from: http://www.huellasolar.com/
[Accessed 3 July 2011].
Hyde J., 2009. Developing OLAP solutions with Mondrian/JasperAnalysis. Mondrian 3.0.4
Technical Guide.
Husar,R,B and Hoijarvi, K., 2007. DataFed: Mediated web services for distributed air quality
data access and processing. In proceeding of: Geoscience and Remote Sensing Symposium,
IGARSS 2007.
Inmon, W,H., 2005., Building the Data Warehouse, Wilsey, Pages 576.
IRENA, 2013. IRENA [online]. Available from: http://irena.org/GlobalAtlas/about.html
[Accessed 2 May 2013].
Su ,J, C, P., Chu, C and Wang, Yu-Te., 2012. A decision support system to estimate the carbon
emission and cost of product designs. International Journal of Precision Engineering and
Manufacturing. 13(7): 1037-1045.
Jinxu, D., and Somani, A., 2010. A Long-Term Investment Planning Model for Mixed Energy
Infrastructure Integrated with Renewable Energy. Green Technologies Conference.
BIBLIOGRAPHY 98
Jordanger,E., SINTEF Energy Research - Norway Bakken, B, H., Holen, A, T., Helseth, A and
Botterud, A., 2005. Energy distribution system planning -methodologies and tools for multi-
criteria decision analysis. 18th International Conference and Exhibition on Electricity
Distribution, 2005, CRIED 2005.
Cherni, J, A and Kalas, N., 2010. A Multi-criteria Decision-Support Approach to Sustainable
Rural Energy in Developing Countries. Handbook on Decision Making Intelligent Systems
Reference Library. Vol 4, 143-162.
Hunt,,J, D., Alcántara, R, B and David Hanbury, D., 2013. A new integrated tool for complex
decision making: Application to the UK energy sector. Decision Support Systems. 54(3): 1427-
1441.
Kaku, K and Potter, C, W., 2009. Creating High-Resolution Solar Information from Satellite
Imagery and Numerical Weather Prediction Modelling. Solar09, the 47th ANZSES Annual
Conference, Townsville, Queensland, Australia.
KCSC., 2011. KCSC [online]. Available from: http://www.kcsc.or.kr/ikcsc/new/english/main.jsp/
[Accessed 2 May 2011].
International Energy Agency., 2011. Key World Energy Statistics, France, Head of
Communication and Information Office. Paris: Stedi Media.
Khagendra, T and Robert, C, B., 1991. Primary and Secondary Methods of Data Collection in
GIS/LIS. Surveying and Land Information Systems, 51(3): 162-170.
Krek, A., 2003. What are the transaction costs and why do they matter? 6th AGILE proceedings,
Lyon, France.
Koutsoukis, N-S., Mitra, G and Lucas, C., 1999. Adapting on-line analytical processing for
decision modelling: the interaction of information and decision technologies, Decision Support
Systems, 26 (1):1 – 30.
Lacquaniti, P and Salas, S., 2009. Energy from biomass: decision support system for integrating
sustainability into technology assessment. Energy and Sustainability II. Vol 121. Pages 560.
Langseth, J and Vivatrat, N., 2003. Why Proactive Business Intelligence is a Hallmark of the
Real-Time Enterprise: Outward Bound. Intelligent Enterprise, 5(18: )34-41.
Maaßen, M., Rübsamen, M and Perez, A., 2011. Photovoltaic Solar Energy in Spain.
International Finance and Economics.
Markus, N., and Helena, M., 2012. Open Source GIS: A GRASS GIS Approach. Third Edition. The
International Series in Engineering and Computer Science: Springer, New York.
Martin, F., 1997. Analysis Patterns: Reusable Objects Models. Addison-Wesley. Reading, MA.
Martinot,E., 2002. Grid-based Renewable Energy in Developing Countries: Policies, Strategies
and Lessons from the GEF. World Renewable Energy Policy and Strategy Forum, Berlin,
Germany.

99 BIBLIOGRAPHY
Morten, L., 2011. Assessing Social and Economic Benefits in the Context of SDI and PSI. INSPIRE
2011 conference, Edinburgh, UK.
Morello, E., and Ratti, C., 2009. Sunscapes: Solar envelopes and the analysis of urban DEMs.
Computers Environment and Urban Systems, 33(1):26-34.
Mohideen, R., 2012. The implications of clean and renewable energy development for gender
equality in poor communities in South Asia, Technology and Society in Asia (T&SA), IEEE
Conference.
Nagaraj, R., 2012. Renewable energy based small hybrid power system for desalination
applications in remote locations, Power Electronics (IICPE), IEEE 5th India International
Conference.
NCHRP (National Cooperative Highway Research Program), 2003. Quality and Accuracy of
Positional Data in Transportation. Transportation Research Board: National Academies Press.
NEO., 2011. NEO [online]. Available from:
http://neo.sci.gsfc.nasa.gov/blog/2013/08/19/welcome-to-new-neo/ [Accessed 10 August
2013].
Negash S., 2004. Business Intelligence. Communications of the AIS, Vol 13, 177-195.
Nguyen, H, T and Pearce, J, M., 2010. Estimating potential photovoltaic yield with r.sun and the
open source Geographical Resources Analysis Support System. Solar Energy. 84(5): 831-843.
NREL., 2012. NREL atlas [online]. Available from: http://maps.nrel.gov/re_atlas [Accessed 12
th May 2012].
OGC., 2012. OGC [online]. Business Intelligence. Available from:
http://www.opengeospatial.org/domain/geobi [Accessed 15th May 2012].
Olszak, MC., and Ziemba, E., 2007. Approach to Building and Implementing Business
Intelligence Systems. Interdisciplinary Journal of Information, Knowledge, and Management.
Vol (2), 135-148.
Omar, M., and Ayhan, C., 2009. Accuracy and cost comparison of spatial data-acquisition
methods for the development of geographical information systems. Journal of Geography and
Regionnal Planning, 2 (9):235–242.
Passionned Group., 2013. WHAT IS ETL, EXTRACT TRANSFORM AND LOAD? [online]. Available
from: http://www.passionned.com/data-integration/etl-extract-transform-and-load/
Rajani, P., 1996. Simple models reflect GIS market segmentation, GIS World, Vol. 9(12), 130.
Ratti, C and Richens, P., 1999. Urban texture analysis with image processing techniques. In:
Augenbroe, G. and Eastman, C., eds. Computers in Building: Proceedings of CAAD Futures 99.
Boston: Kluwer Academic, 49-64.

BIBLIOGRAPHY 100
Reda, L and Andreas., A, 2004. Solar Position Algorithm for Solar Radiation Applications. Solar
Energy. Vol. 76(5), 577-589.
Ren, S., and Xue H., 2010. The monetary quantitative methods of environmental and health
benefits of renewable energy. 2010 International Conference on Environmental Science and
Information Application Technology (ESIAT). Vol.3, 17-18.
Rivest, S., Bedard, Y., Proulx, MJ.,and Nadeau, M., 2003. SOLAP: A New Type of User interface
to Support Spatio-temporal Multidimensional Data Exploration and Analysis. Workshop ISPRS,
Quebec, Canada.
Rodriguez, A., 2008. IBM [online]. Available from: http://www.ibm.com [Accessed 2 May
2012].
Sattrup, P, A., and Strømann-Andersen, J., 2011. A methodological study of environmental
simulation in architecture and engineering: Integrating daylight and thermal performance
across the urban and building scales. SimAUD 2011 Symposium on Simulation in Architecture
and Urban Design conference proceedings. San Diego, USA, 115-123.
Schiaffino, S., and Amandi, A., 2009. Intelligent user profiling. In: M. Bramer (Ed.), Artificial
intelligence—an international perspective. Berlin: Springer. 193–216.
Schilit, B., Adams, N., and Want, R., 1994. Context-aware computing applications. Proceedings
of the 1st International Workshop on Mobile Computing Systems and Applications. Los
Alamitos, CA: IEEE.
SEC., 2010. Dirección General del Catastro (SEC) [online]. Available from:
https://www.sedecatastro.gob.es/ [Accessed 8 October 2010].
Seong, YB., Lim, JH., Yeo, MS., Goh, ID., and Kim, KW., 2006. HELIOS: Solar rights analysis
system for apartment buildings, Solar Energy. 80 (6):723-741.
Shadow Analyzer, 2011 [online]. Available from:
http://www.drbaumresearch.com/prod38.htm [Accessed 12 April 2011].
Shaligram, P and Muthu,C., 2002. Integrated Rural Energy Decision Support Systems. Decision
Support Systems for Sustainable Development. 167-181.
Sharpe, L., 2003. Bring me sunshine [building-integrated photovoltaics]. IEEE Review. 49 (1):
46- 49.
Shunbao, L., Lin J., and Hongwei, Z., 2012. Estimation of Spatial Distribution of Solar Energy
Resources in China. Communications in Information Science and Management Engineering, 25-
28.
SimuSOLAR.,2012. Solarpotenzial- Analyse [online]. Available from: http://www.simusolar.de/
[Accessed 6 April 2012].
Knight, J, A., 2012. Solunar [online]. Available from:
http://www.solunar.com/the_solunar_theory.aspx [Accessed 19 July 2012].
101 BIBLIOGRAPHY
Spencer, L., Ritchie J., Lewis, J and Dillon, L., 2003. Quality in qualitative evaluation: a
framework for assessing research evidence [monograph online]. London: Cabinet Office.
Available from: www.gsr.gov.uk/evaluating_policy/era_papers/qual_eval.asp.
Sudharsan,D., Adinarayana,J., Raji Reddy,D., Sreenivas,G., Ninomiya,S., Hirafuji,M., Kiura,T.,
Tanaka,K., Desai,U. B and Merchant S. N., 2013. Evaluation of weather-based rice yield models
in India. International Journal of Biometeorology. Vol 57, 107-123.
Sun area., 2012. Sun area [online]. Available from: http://www.sun-area.net/SUN-
AREA.8.0.html [Accessed 6 April 2012].
Giesen, J., 2011. Sun Shadow Applet [online]. Available from:
http://www.jgiesen.de/sunshadow [Accessed 3 May 2011].
Suri, M., Huld, T., Dunlop, E.D., and Cebecauer, T., 2008. Geographic Aspects of Photovoltaics
in Europe: Contribution of the PVGIS Website. IEEE Journal of selected Topics in Applied Earth
Observations and Remote Sensing, 1(1): 34-41.
Sustainable by Design., 2011. Sun angle tools [online]. Available from:
http://susdesign.com/tools.php [Accessed 6 March 2011].
Borel, F and Steller, H., 2012. Tambora – die Entstehung einer virtuellen Forschungsumgebung.
In: B.I.T.online 15(5): 423-430.
Techcrunch.com., 2012. Techcrunch [online]. Available from: http://techcrunch.com/2012/07/
26/earnings-call-facebook/ [Accessed 11 August 2012].
Tong, G., Cui, K., and Song, B., 2008. The research & application of Business Intelligence system
in retail industry. IEEE International Conference on Automation and Logistics. 87-91.
Tridicon., 2012. Tridicon [online]. Available from: http://www.tridicon.de/software/tridicon-
solar/ [Accessed 2 December 2012].
Twidell, J and Weir, T., 2006. Renewable Energy Resources. 2nd ed., London: Taylor & Francs
Group.
UCLA. , 2012. UCLA researchers create highly transparent solar cells for windows that generate
electricity. UCLA newsroom [online]. Available from:
http://newsroom.ucla.edu/portal/ucla/ucla-researchers-create-highly-236698.aspx. [Accessed
25 July 2012].
University of Texas., 2013. Human Resources [online]. Available from:
http://www.utdallas.edu/hrm/er/pm/improvementplans.php5 [Accessed 12 March 2013].
Verma, V., Kumar, R., and Hsu, S., 2006. 3D Building Detection and Modeling from Aerial LIDAR
Data. IEEE Computer Society Conference on Computer Vision and Pattern Recognition, vol.2,
2213,2220, 2006 doi: 10.1109/CVPR.2006.12
Vicki, L, S., 2011. Decision Support Systems for Business Intelligence, 2nd Edition. John Wiley &
Sons. ISBN: 978-0-470-43374-4. Pages 453.

BIBLIOGRAPHY 102
Vijayendra, N.,and Meiliu, Lu., 2013. A web-based ETL tool for data integration process. The
6th International Conference on Human System Interaction (HSI).
Voyager., 2011. Voyager [online]. Available from: http://voyagergis.com/ [Accessed 4
October 2011].
Upington Solar park., 2011. Site Assessemnt of Solar Resource. GeoModel Solar. Referecne No.
58-01/2011 rev.2.
Wadsworth, R,A and Brown, M, J., 1995. A spatial decision support system to allow the
investigation of the impact of emissions from major point sources under different operating
policies. Water, Air, and Soil Pollution. Vol 85, 2649-2654.
Washington, R., Lees, D., 2004. Utility-based plan insertion for continuous resources. IEEE
International Conference on Robotics and Automation (ICRA), vol.3, 2993-2999.
Winnie, T., and Jan, S., 2005. Spatial Portals: Gateways to Geographic Information. Redlands,
CA: ESRI Press.
Xia, X.,and Xia, J., 2010. Evaluation of Potential for Developing Renewable Sources of Energy
to Facilitate Development in Developing Countries. Power and Energy Engineering Conference
(APPEEC), Asia-Pacific.
Yao, Y., Su, G., Deng, F., and Luo, W., 2011. Estimation of Solar Radiation for Greenhouse
Production in China. Power and Energy Engineering Conference (APPEEC), Asia-Pacific.
Zhao, W., and Ma, Y., 2011. Research on solar energy technologies for the ecological
architecture. 6th International Forum on Strategic Technology (IFOST), 452-455.
Zhenhua, Z., and Ioannis, B., 2009. Comparison of Optical Sensor-Based Spatial Data Collection
Techniques for Civil Infrastructure Modeling. J. Comput. Civ. Eng. 23(3):170-177.