tools and techniques for data science
TRANSCRIPT

Tools and Techniques for Data Science
Ajay Ohri15 Nov 2016
I.T.S. Engineering College

Introduction

Instructor : Ajay Ohri author of two books on R*12 years in analytics
http://linkedin.com/in/ajayohri
*and 4 books on poetry

Know your Instructor
● Author "R for Business Analytics"
● Author “ R for Cloud Computing”
● Founder "Decisionstats.com"
● University of Tennessee, Knoxville MS (courses in statistics and computer science)
● MBA (IIM Lucknow,India-2003)
● B.Engineering (DCE 2001) http://linkedin.com/in/ajayohri

Know your Instructor
As Featured in● IBM Big Data
http://ibmdatamag.com/author/aohri/
● Social Media Todayhttp://www.socialmediatoday.com/content/blogger-week-ajay-ohri
● Programmable Webhttps://www.programmableweb.com/profile/ajayohri
● Wiredhttp://www.wired.com/2014/08/algorithmia/
● ReadWriteWebhttp://readwrite.com/2011/06/01/an-app-store-for-algorithms
● KDNuggetshttp://www.kdnuggets.com/2014/05/guide-to-data-science-cheat-sheets.htmlhttp://www.kdnuggets.com/2014/06/interview-ingo-mierswa-rapidminer-analytics-turning-points.html http://linkedin.com/in/ajayohri

Know your Instructor
As Featured in
● All Analyticshttp://www.allanalytics.com/author.asp?section_id=1408&doc_id=233454
● AnalyticVidhyahttp://www.analyticsvidhya.com/blog/2015/02/interview-expert-ajay-ohri-founder-decisionstats-com/
● AnalyticsIndiaMaghttp://analyticsindiamag.com/interview-ajay-ohri-author-r-for-business-analytics/
● Data Mining Bloghttp://www.dataminingblog.com/data-mining-research-interview-ajay-ohri/
● Trade Briefshttp://www.indiatelecombrief.com/index.php/from-the-editors-desk/51839-patent-wars-in-mobile-software
● Cool Avenueshttp://www.coolavenues.com/career-tips/make-promising-career-in-database-mining-analytics
http://linkedin.com/in/ajayohri

Ground Rules
please
ask questions in enduse chat window
take notes

•
•–
•––

Agenda
Definition of Data ScienceCloud Computing and Big DataTools in Data ScienceTechniques in Data Science

Definition of Data Science

What is data science ?Hacking ( Programming) + Maths/Statistics + Domain Knowledge = Data Science
http://drewconway.com/zia/2013/3/26/the-data-science-venn-diagram

What is a Data Scientist ?a data scientist is simply a data analyst living in california
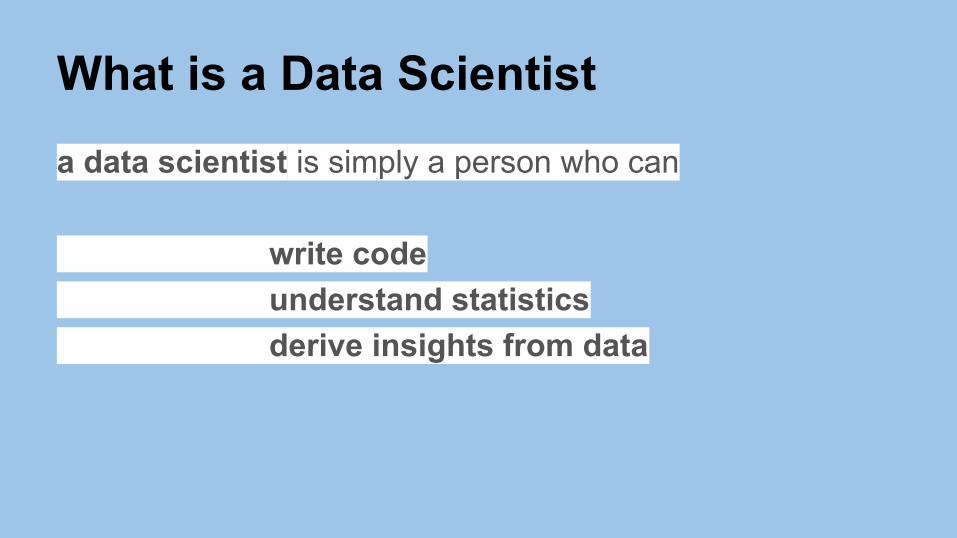
What is a Data Scientista data scientist is simply a person who can
write code understand statistics derive insights from data

Oh really, is this a Data Scientist ?a data scientist is simply a person who can write code = in R,Python,Java, SQL, Hadoop (Pig,HQL,MR) etc
= for data storage, querying, summarization, visualization
= how efficiently, and in time (fast results?)
= where on databases, on cloud, servers
and understand enough statistics
to derive insights from data so business can make decisions

Cheat Sheets for Data Scientistshttp://www.kdnuggets.com/2014/05/guide-to-data-science-cheat-sheets.htmla data scientist is simply a person who can write code in a few languages (primarily R, Python and SQL) for data querying, manipulation , aggregation, and visualization using enough statistical knowledge to give back actionable insights to the business for making decisions.
Since this rather practical definition of a data scientist is reinforced by the accompanying words on a job website for “data scientists” , ergo, here are some tools for learning the primary languages in data science- Python, R and SQL. A cheat sheet or reference card is a compilation of mostly used commands to help you learn that language’s syntax at a faster rate.

Cloud Computing1. the practice of using a network of remote servers hosted on the Internet to store, manage, and process data, rather than a
local server or a personal computer.
http://csrc.nist.gov/publications/nistpubs/800-145/SP800-145.pdf

Cloud Computing1. the practice of using a network of remote servers hosted on the Internet to store, manage, and process data, rather than a
local server or a personal computer.
http://csrc.nist.gov/publications/nistpubs/800-145/SP800-145.pdf

Cloud Computing

Introduction to Big Dataextremely large data sets that may be analysed computationally to reveal patterns, trends, and associations, especially relating to human behaviour and interactions.
Big data is a term that describes the large volume of data – both structured and unstructured – that inundates a business on a day-to-day basis. But it’s not the amount of data that’s important. It’s what organizations do with the data that matters. Big data can be analyzed for insights that lead to better decisions and strategic business moves.
http://www.sas.com/en_us/insights/big-data/what-is-big-data.html
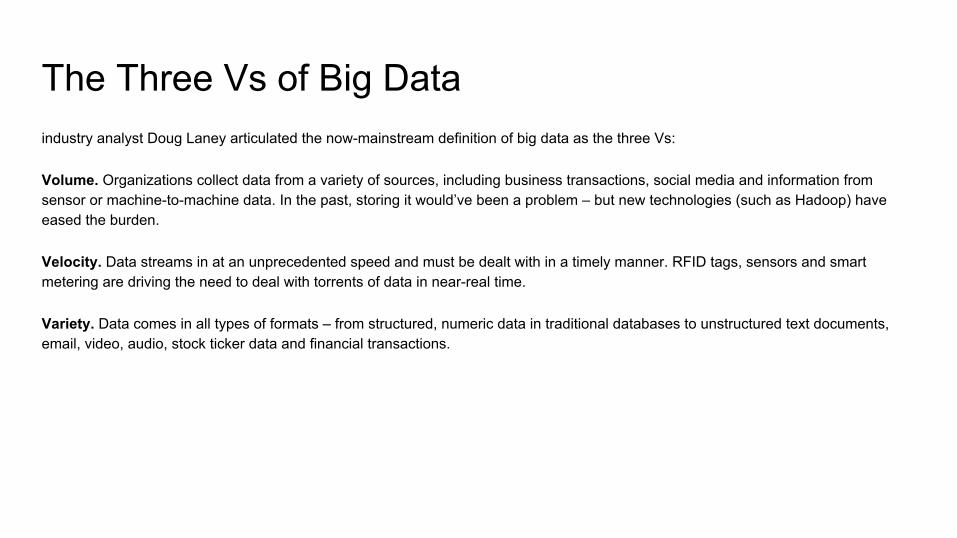
The Three Vs of Big Dataindustry analyst Doug Laney articulated the now-mainstream definition of big data as the three Vs:
Volume. Organizations collect data from a variety of sources, including business transactions, social media and information from sensor or machine-to-machine data. In the past, storing it would’ve been a problem – but new technologies (such as Hadoop) have eased the burden.
Velocity. Data streams in at an unprecedented speed and must be dealt with in a timely manner. RFID tags, sensors and smart metering are driving the need to deal with torrents of data in near-real time.
Variety. Data comes in all types of formats – from structured, numeric data in traditional databases to unstructured text documents, email, video, audio, stock ticker data and financial transactions.

Big Data Factshttp://www.ibmbigdatahub.com/infographic/four-vs-big-data

Understanding HadoopThe Apache Hadoop software library is a framework that allows for the distributed processing of large data sets across clusters of computers using simple programming models. It is designed to scale up from single servers to thousands of machines, each offering local computation and storage. Rather than rely on hardware to deliver high-availability, the library itself is designed to detect and handle failures at the application layer, so delivering a highly-available service on top of a cluster of computers, each of which may be prone to failures.
The project includes these modules:
● Hadoop Common: The common utilities that support the other Hadoop modules.● Hadoop Distributed File System (HDFS™): A distributed file system that provides high-throughput access to application data.● Hadoop YARN: A framework for job scheduling and cluster resource management.● Hadoop MapReduce: A YARN-based system for parallel processing of large data sets.
http://hadoop.apache.org/

Understanding Hadoop● Other Hadoop-related projects at Apache include:● Ambari™: A web-based tool for provisioning, managing, and monitoring Apache Hadoop clusters which includes support for
Hadoop HDFS, Hadoop MapReduce, Hive, HCatalog, HBase, ZooKeeper, Oozie, Pig and Sqoop. Ambari also provides a dashboard for viewing cluster health such as heatmaps and ability to view MapReduce, Pig and Hive applications visually alongwith features to diagnose their performance characteristics in a user-friendly manner.
● Avro™: A data serialization system.● Cassandra™: A scalable multi-master database with no single points of failure.● Chukwa™: A data collection system for managing large distributed systems.● HBase™: A scalable, distributed database that supports structured data storage for large tables.● Hive™: A data warehouse infrastructure that provides data summarization and ad hoc querying.● Mahout™: A Scalable machine learning and data mining library.● Pig™: A high-level data-flow language and execution framework for parallel computation.● Spark™: A fast and general compute engine for Hadoop data. Spark provides a simple and expressive programming model
that supports a wide range of applications, including ETL, machine learning, stream processing, and graph computation.● Tez™: A generalized data-flow programming framework, built on Hadoop YARN, which provides a powerful and flexible engine
to execute an arbitrary DAG of tasks to process data for both batch and interactive use-cases. Tez is being adopted by Hive™, Pig™ and other frameworks in the Hadoop ecosystem, and also by other commercial software (e.g. ETL tools), to replace Hadoop™ MapReduce as the underlying execution engine.
● ZooKeeper™: A high-performance coordination service for distributed applications.
●

Why Learn HadoopHadoop, however, is specifically designed to have a very flat scalability curve. After a Hadoop program is written and functioning on ten nodes, very little--if any--work is required for that same program to run on a much larger amount of hardware.
MapReduce: Isolated ProcessesHadoop limits the amount of communication which can be performed by the processes, as each individual record is processed by a task in isolation from one another. While this sounds like a major limitation at first, it makes the whole framework much more reliable
In a Hadoop cluster, data is distributed to all the nodes of the cluster as it is being loaded in. The Hadoop Distributed File System (HDFS) will split large data files into chunks which are managed by different nodes in the cluster. In addition to this each chunk is replicated across several machines, so that a single machine failure does not result in any data being unavailable.
https://developer.yahoo.com/hadoop/tutorial/module1.html

HDFSHDFS, the Hadoop Distributed File System, is a distributed file system designed to hold very large amounts of data (terabytes or even petabytes), and provide high-throughput access to this information. Files are stored in a redundant fashion across multiple machines to ensure their durability to failure and high availability to very parallel applications.
HDFS is a block-structured file system: individual files are broken into blocks of a fixed size. These blocks are stored across a cluster of one or more machines with data storage capacity. Individual machines in the cluster are referred to as DataNodes. A file can be made of several blocks, and they are not necessarily stored on the same machine; the target machines which hold each block are chosen randomly on a block-by-block basis. Thus access to a file may require the cooperation of multiple machines, but supports file sizes far larger than a single-machine DFS; individual files can require more space than a single hard drive could hold.
https://developer.yahoo.com/hadoop/tutorial/module2.html

HDFS

Five Daemons of HadoopNameNode- the Master node which is responsible for storing the meta-data for all the files and directories. It has information such as the blocks that make a file, and where are those blocks located in the cluster.
Secondary NameNode- It periodically merges changes in the NameNode with the edit log so that it doesn’t grow too large in size. It also keeps a copy of the image which can be used in case of failure of NameNode.
DataNode - Stores actual HDFS data blocks.
JobTracker -JobTracker is the daemon service for submitting and tracking MapReduce jobs in Hadoop. There is only One Job Tracker process run on any hadoop cluster.
TaskTracker -A TaskTracker is a slave node daemon in the cluster that accepts tasks (Map, Reduce and Shuffle operations) from a JobTracker. There is only One Task Tracker process run on any hadoop slave node.
Following 3 Daemons run on Master nodes NameNode - Secondary NameNode - JobTracker -
Following 2 Daemons run on each Slave nodes DataNode . TaskTracker
http://www.fromdev.com/2010/12/interview-questions-hadoop-mapreduce.html
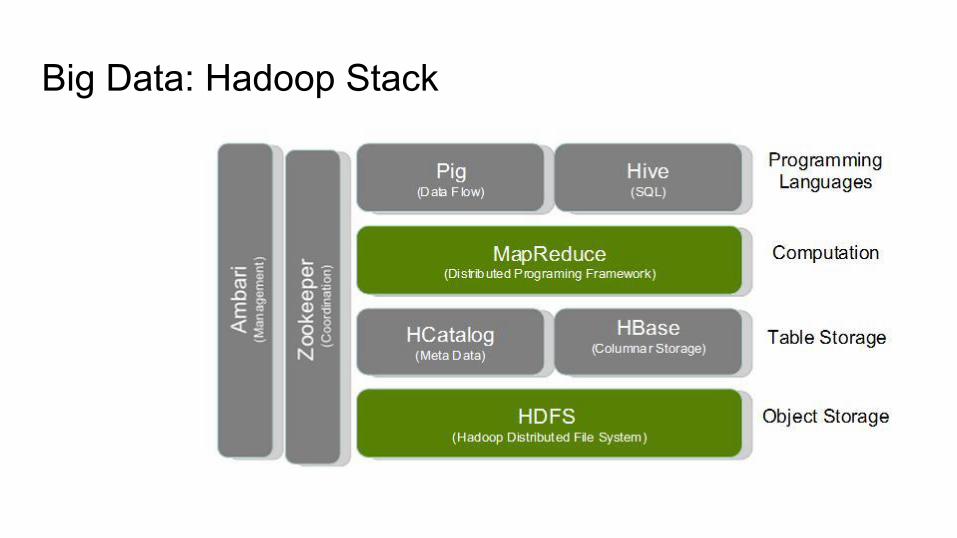
Big Data: Hadoop Stack

NoSQLA NoSQL (Not-only-SQL) database is one that has been designed to store, distribute and access data using methods that differ from relational databases (RDBMS’s). NoSQL technology was originally created and used by Internet leaders such as Facebook, Google, Amazon, and others who required database management systems that could write and read data anywhere in the world, while scaling and delivering performance across massive data sets and millions of users.
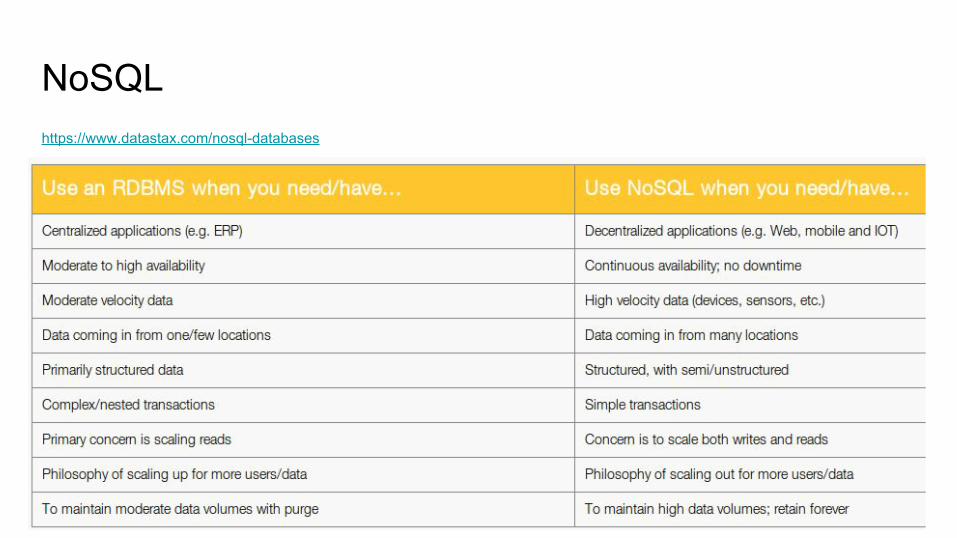
NoSQLhttps://www.datastax.com/nosql-databases

Basic Statistics
Some of the basic statistics that every data scientist should know are given here. This assumes rudimentary basic knowledge of statistics ( like measures of central tendency or variation) and basic familiarity with some of the terminology used by statisticians.
● Random Sampling- In truly random sampling,the sample should be representative of the entire data. RAndom sampling remains of relevance in the era of Big Data and Cloud Computing
● Distributions- A data scientist should know the distributions ( normal, Poisson, Chi Square, F) and also how to determine the distribution of data.
● Hypothesis Testing - Hypothesis testing is meant for testing assumptions statistically regarding values of central tendency (mean, median) or variation. A good example of an easy to use software for statistical testing is the “test” tab in the Rattle GUI in R.
● Outliers- Checking for outliers is a good way for a data scientist to see anomalies as well as identify data quality. The box plot (exploratory data analysis) and the outlierTest function from car package ( Bonferroni Outlier Test) is how statistical rigor can be maintained to outlier detection.

Basic Techniques
Some of the basic techniques that a data scientist must know are listed as follows-
● Text Mining - In text mining , text data is analyzed for frequencies, associations and corelation for predictive purposes. The tm package from R greatly helps with text mining.
● Sentiment Analysis- In sentiment analysis the text data is classified based on a sentiment lexicography ( eg which says happy is less positive than delighted but more positive than sad) to create sentiment scores of the text data mined.
● Social Network Analysis- In social network analysis, the direction of relationships, the quantum of messages and the study of nodes,edges and graphs is done to give insights..
● Time Series Forecasting- Data is said to be auto regressive with regards to time if a future value is dependent on a current value for a variable. Technqiues such as ARIMA and exponential smoothing and R packages like forecast greatly assist in time series forecasting.
● Web Analytics● Social Media Analytics● Data Mining or Machine Learning

Data Science Tools- R- Python- Tableau- Spark with ML- Hadoop (Pig and Hive)- SAS- SQL

Data Science with R
A popular language in Data Science

What Is Rhttps://www.r-project.org/about.htmlR is an integrated suite of software facilities for data manipulation, calculation and graphical display. It includes
● an effective data handling and storage facility,● a suite of operators for calculations on arrays, in particular matrices,● a large, coherent, integrated collection of intermediate tools for data
analysis,● graphical facilities for data analysis and display either on-screen or on
hardcopy, and● a well-developed, simple and effective programming language which
includes conditionals, loops, user-defined recursive functions and input and output facilities.

Install Rhttps://cran.r-project.org/bin/windows/base/

Install RStudiohttps://www.rstudio.com/products/rstudio/download/

Statistical Software Landscape
SASPython (Pandas)IBM SPSSRJuliaClojureOctave
MatlabJMPE views

Using R with other softwarehttps://rforanalytics.wordpress.com/useful-links-for-r/using-r-from-other-software/
Tableau http://www.tableausoftware.com/new-features/r-integration
Qlik http://qliksolutions.ru/qlikview/add-ons/r-connector-eng/
Oracle R http://www.oracle.com/technetwork/database/database-technologies/r/r-enterprise/overview/index.html
Rapid Miner https://rapid-i.com/content/view/202/206/lang,en/#r
JMP http://blogs.sas.com/jmp/index.php?/archives/298-JMP-Into-R!.html

Using R with other softwarehttps://rforanalytics.wordpress.com/useful-links-for-r/using-r-from-other-software/
SAS/IML http://www.sas.com/technologies/analytics/statistics/iml/index.html
Teradata http://developer.teradata.com/applications/articles/in-database-analytics-with-teradata-r
Pentaho http://bigdatatechworld.blogspot.in/2013/10/integration-of-rweka-with-pentaho-data.html
IBM SPSS
https://www14.software.ibm.com/webapp/iwm/web/signup.do?source=ibm-analytics&S_PKG=ov18855&S_TACT=M161003W&dy
nform=127&lang=en_US
TIBCO TERR
http://spotfire.tibco.com/discover-spotfire/what-does-spotfire-do/predictive-analytics/tibco-enterprise-runtime-for-r-terr

Some Advantages of Ropen sourcefreelarge number of algorithms and packages esp for statisticsflexiblevery good for data visualizationsuperb communityrapidly growingcan be used with other software

Some Disadvantages of Rin memory (RAM) usage steep learning curve some IT departments frown on open source verbose documentation tech supportevolving ecosystem for corporates

Solutions for Disadvantages of Rin memory (RAM) usage specialized packages, in database computingsteep learning curve TRAINING !!!some IT departments frown on open source TRAINING and education!verbose documentation CRAN View , R Documentationtech support expanding pool of resourcesevolving ecosystem for corporates getting better with MS et al

••
•
•

•
•••••

http://www.sas.com/en_in/software/university-edition/download-software.html
••
––
–•


Python

What is PythonPython is a widely used general-purpose, high-level programming languagn
Its design philosophy emphasizes code readability, and its syntax allows programmers to express concepts in fewer lines of code than would be possible in languages such as C++ or Java.
Python is used widely
https://www.python.org/about/success/

Object Oriented Programming (OOPS)a computer program consists of, such as variables, expressions, functions or modules.
name = ajay
print (name)
import printer
Hi I am %name
Object-oriented programming (OOP) is a programming paradigm based on the concept of "objects", which are data structures that contain data, in the form off ields, often known as attributes; and code, in the form of procedures, often known as methods.
Dynamic programming language is a term used in computer science to describe a class of high-level programming languageswhich, at runtime, execute many common programming behaviors that static programming languages perform during compilation.
"compiler" is primarily used for programs that translate source code from a high-level programming language to a lower level language (e.g., assembly language or machine code).

Javahttp://introcs.cs.princeton.edu/java/11cheatsheet/

Linuxhttp://www.linuxstall.com/linux-command-line-tips-that-every-linux-user-should-know/

SQLhttp://www.codeproject.com/Articles/33052/Visual-Representation-of-SQL-Joins
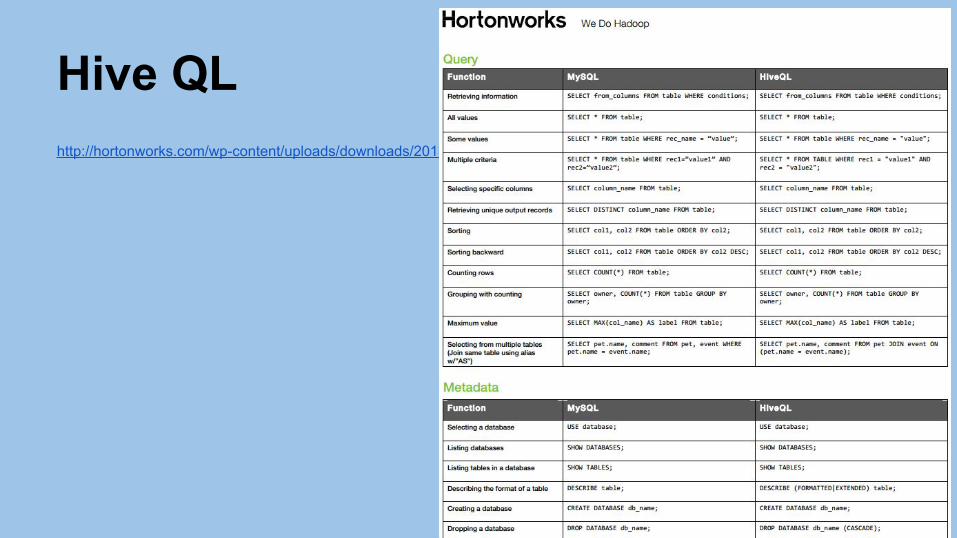
Hive QLhttp://hortonworks.com/wp-content/uploads/downloads/2013/08/Hortonworks.CheatSheet.SQLtoHive.pdf

Python http://www.astro.up.pt/~sousasag/Python_For_Astronomers/Python_qr.pdf

Python https://s3.amazonaws.com/quandl-static-content/Documents/Quandl+-+Pandas,+SciPy,+NumPy+Cheat+Sheet.pdf
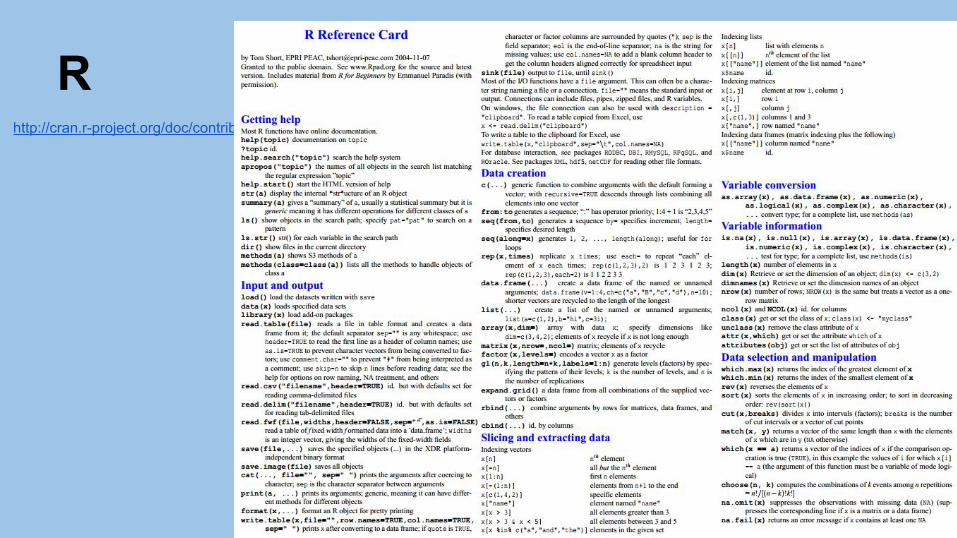
R http://cran.r-project.org/doc/contrib/Short-refcard.pdf

Pig

HDFShttps://github.com/michiard/CLOUDS-LAB/blob/master/C-S.md

Githttp://overapi.com/static/cs/git-cheat-sheet.pdf

All together nowPIG http://www.slideshare.net/Mathias-Herberts/hadoop-pig-syntax-card
HDFS https://github.com/michiard/CLOUDS-LAB/blob/master/C-S.md
R http://cran.r-project.org/doc/contrib/Short-refcard.pdf
Python https://s3.amazonaws.com/quandl-static-content/Documents/Quandl+-+Pandas,+SciPy,+NumPy+Cheat+Sheet.pdf
Python http://www.astro.up.pt/~sousasag/Python_For_Astronomers/Python_qr.pdf
Java http://introcs.cs.princeton.edu/java/11cheatsheet/
Linux http://www.linuxstall.com/linux-command-line-tips-that-every-linux-user-should-know/
SQL http://www.codeproject.com/Articles/33052/Visual-Representation-of-SQL-Joins
Git http://overapi.com/static/cs/git-cheat-sheet.pdf

RR provides a wide variety of statistical (linear and nonlinear modelling, classical statistical tests, time-series analysis, classification, clustering, …) and graphical techniques, and is highly extensible.
R is an integrated suite of software facilities for data manipulation, calculation and graphical display. It includes an effective data handling and storage facility, a suite of operators for calculations on arrays, in particular matrices, a large, coherent, integrated collection of intermediate tools for data analysis, graphical facilities for data analysis and display either on-screen or on hardcopy, and a well-developed, simple and effective programming language
https://www.r-project.org/about.html

Pythonhttp://python-history.blogspot.in/ and https://www.python.org/
SAShttp://www.sas.com/en_in/home.html

Big Data: Hadoop Stack with Sparkhttp://spark.apache.org/ Apache Spark™ is a fast and general engine for large-scale data processing.

Big Data: Hadoop Stack with Mahouthttps://mahout.apache.org/
The Apache Mahout™ project's goal is to build an environment for quickly creating scalable performant machine learning applications.Apache Mahout Samsara Environment includes
● Distributed Algebraic optimizer● R-Like DSL Scala API● Linear algebra operations● Ops are extensions to Scala● IScala REPL based interactive shell● Integrates with compatible libraries like MLLib● Runs on distributed Spark, H2O, and Flink
Apache Mahout Samsara Algorithms included
● Stochastic Singular Value Decomposition (ssvd, dssvd)● Stochastic Principal Component Analysis (spca, dspca)● Distributed Cholesky QR (thinQR)● Distributed regularized Alternating Least Squares (dals)● Collaborative Filtering: Item and Row Similarity

Big Data: Hadoop Stack with Mahouthttps://mahout.apache.org/
Apache Mahout software provides three major features:● A simple and extensible programming environment and framework for building scalable algorithms● A wide variety of premade algorithms for Scala + Apache Spark, H2O, Apache Flink● Samsara, a vector math experimentation environment with R-like syntax which works at scale

Data Science Techniques
- Machine Learning - Regression- Logistic Regression- K Means Clustering- Association Analysis- Decision Trees- Text Mining- Social Network Analysis- Time Series Forecasting- LTV and RFM Analysis- Pareto Analysis

What is an algorithm
● a process or set of rules to be followed in calculations or other problem-solving operations, especially by a computer.
● a self-contained step-by-step set of operations to be performed
● a procedure or formula for solving a problem, based on conducting a sequence of specified action
● a procedure for solving a mathematical problem (as of finding the greatest common divisor) in a finite number of steps that frequently involves repetition of an operation; broadly : a step-by-step procedure for solving a problem or accomplishing some end especially by a computer.

Machine Learning
Machine learning concerns the construction and study of systems that can learn from data. For example, a machine learning system could be trained on email messages to learn to distinguish between spam and non-spam messages
Supervised learning is the machine learning task of inferring a function from labeled training data.[1] The training data consist of a set of training examples. In supervised learning, each example is a pair consisting of an input object (typically a vector) and a desired output value (also called the supervisory signal).
In the terminology of machine learning, classification is considered an instance of supervised learning, i.e. learning where a training set of correctly identified observations is available.
In machine learning, the problem of unsupervised learning is that of trying to find hidden structure in unlabeled data. Since the examples given to the learner are unlabeled, there is no error or reward signal to evaluate a potential solution. This distinguishes unsupervised learning from supervised learning
The corresponding unsupervised procedure is known as clustering or cluster analysis, and involves grouping data into categories based on some measure of inherent similarity (e.g. the distance between instances, considered as vectors in a multi-dimensional vector space).

CRAN VIEW Machine Learning
http://cran.r-project.org/web/views/MachineLearning.html

Machine Learning in Python
http://scikit-learn.org/stable/

Classification
In machine learning and statistics, classification is the problem of identifying to which of a set of categories (sub-populations) a new observation belongs, on the basis of a training set of data containing observations (or instances) whose category membership is known. The individual observations are analyzed into a set of quantifiable properties, known as various explanatory variables,features, etc. These properties may variously be categorical (e.g. "A", "B", "AB" or "O", for blood type), ordinal (e.g. "large", "medium" or "small"), integer-valued (e.g. the number of occurrences of a part word in an email) or real-valued (e.g. a measurement of blood pressure).
Some algorithms work only in terms of discrete data and require that real-valued or integer-valued data be discretized into groups (e.g. less than 5, between 5 and 10, or greater than 10).

Regression
regression analysis is a statistical process for estimating the relationships among variables. It includes many techniques for modeling and analyzing several variables, when the focus is on the relationship between a dependent variable and one or more independent variables.
More specifically, regression analysis helps one understand how the typical value of the dependent variable (or 'criterion variable') changes when any one of the independent variables is varied, while the other independent variables are held fixed.
Most commonly, regression analysis estimates the conditional expectation of the dependent variable given the independent variables – that is, the average value of the dependent variable when the independent variables are fixed. Less commonly, the focus is on a quantile, or other location parameter of the conditional distribution of the dependent variable given the independent variables.

kNN

Support Vector Machines
http://axon.cs.byu.edu/Dan/678/miscellaneous/SVM.example.pdf
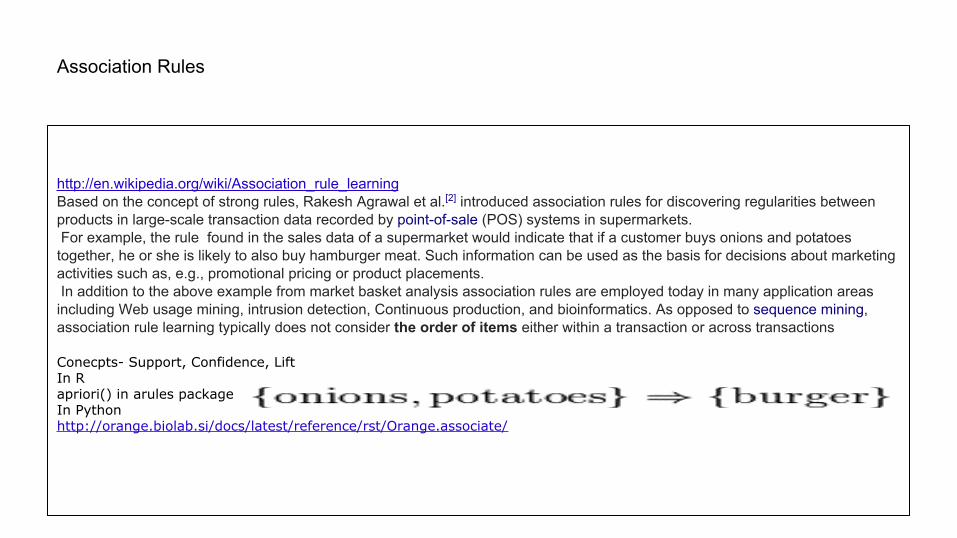
Association Rules
http://en.wikipedia.org/wiki/Association_rule_learningBased on the concept of strong rules, Rakesh Agrawal et al.[2] introduced association rules for discovering regularities between products in large-scale transaction data recorded by point-of-sale (POS) systems in supermarkets. For example, the rule found in the sales data of a supermarket would indicate that if a customer buys onions and potatoes together, he or she is likely to also buy hamburger meat. Such information can be used as the basis for decisions about marketing activities such as, e.g., promotional pricing or product placements. In addition to the above example from market basket analysis association rules are employed today in many application areas including Web usage mining, intrusion detection, Continuous production, and bioinformatics. As opposed to sequence mining, association rule learning typically does not consider the order of items either within a transaction or across transactions
Conecpts- Support, Confidence, LiftIn Rapriori() in arules packageIn Pythonhttp://orange.biolab.si/docs/latest/reference/rst/Orange.associate/

Gradient Descent
Gradient descent is a first-order iterative optimization algorithm. To find a local minimum of a function using gradient descent, one takes steps proportional to the negative of the gradient (or of the approximate gradient) of the function at the current point.
http://econometricsense.blogspot.in/2011/11/gradient-descent-in-r.html
Start at some x value, use derivative at that value to tellus which way to move, and repeat. Gradient descent.
http://www.cs.colostate.edu/%7Eanderson/cs545/Lectures/week6day2/week6day2.pdf

Gradient Descent
https://spin.atomicobject.com/2014/06/24/gradient-descent-linear-regression/ A standard approach to solving this type of problem is to define an error function (also called a cost function) that measures how “good” a given line is.
initial_b = 0 # initial y-intercept guessinitial_m = 0 # initial slope guessnum_iterations = 1000

Decision Trees
http://select.cs.cmu.edu/class/10701-F09/recitations/recitation4_decision_tree.pdf

Decision Trees
Http://www.ise.bgu.ac.il/faculty/liorr/hbchap9.pdf

Random Forest
Random Forests grows many classification trees. To classify a new object from an input vector, put the input vector down each of the trees in the forest. Each tree gives a classification, and we say the tree "votes" for that class. The forest chooses the classification having the most votes (over all the trees in the forest).Each tree is grown as follows:
1.If the number of cases in the training set is N, sample N cases at random - but with replacement, from the original data. This sample will be the training set for growing the tree.
2. If there are M input variables, a number m<<M is specified such that at each node, m variables are selected at random out of the M and the best split on these m is used to split the node. The value of m is held constant during the forest growing.
3. Each tree is grown to the largest extent possible. There is no pruning.In the original paper on random forests, it was shown that the forest error rate depends on two things:
● The correlation between any two trees in the forest. Increasing the correlation increases the forest error rate.● The strength of each individual tree in the forest. A tree with a low error rate is a strong classifier. Increasing the strength of
the individual trees decreases the forest error rate.
https://www.stat.berkeley.edu/~breiman/RandomForests/cc_home.htm#intro

Bagging
Bagging, aka bootstrap aggregation, is a relatively simple way to increase the power of a predictive statistical model by taking multiple random samples(with replacement) from your training data set, and using each of these samples to construct a separate model and separate predictions for your test set. These predictions are then averaged to create a, hopefully more accurate, final prediction value.
http://www.vikparuchuri.com/blog/build-your-own-bagging-function-in-r/

Boosting
Boosting is one of several classic methods for creating ensemble models, along with bagging, random forests, and so forth. Boosting means that each tree is dependent on prior trees, and learns by fitting the residual of the trees that preceded it. Thus, boosting in a decision tree ensemble tends to improve accuracy with some small risk of less coverage.XGBoost is a library designed and optimized for boosting trees algorithms. XGBoost is used in more than half of the winning solutions in machine learning challenges hosted at Kaggle.
http://xgboost.readthedocs.io/en/latest/model.html# And http://dmlc.ml/rstats/2016/03/10/xgboost.html

Data Science Process
By Farcaster at English Wikipedia, CC BY-SA 3.0, https://commons.wikimedia.org/w/index.php?curid=40129394

LTV AnalyticsLife Time Value (LTV) will help us answer 3
fundamental questions:
1. Did you pay enough to acquire
customers from each marketing
channel?
2. Did you acquire the best kind of
customers?
3. How much could you spend on
keeping them sweet with email and
social media?

LTV Analytics :Case Studyhttps://blog.kissmetrics.com/how-to-calculate-lifetime-value/

LTV Analyticshttps://blog.kissmetrics.com/how-to-calculate-lifetime-value/

LTV Analyticshttps://blog.kissmetrics.com/how-to-calculate-lifetime-value/

LTV Analyticshttps://blog.kissmetrics.com/how-to-calculate-lifetime-value/

LTV Analyticshttp://www.kaushik.net/avinash/analytics-tip-calculate-ltv-customer-lifetime-value/

LTV Analytics
Download the zip file from http://www.kaushik.net/avinash/avinash_ltv.zip

Pareto principle
The Pareto principle (also known as the 80–20 rule, the law of the vital few, and the principle of factor sparsity) states that, for many events, roughly 80% of the effects come from 20% of the causes
● 80% of a company's profits come from 20% of its customers● 80% of a company's complaints come from 20% of its customers● 80% of a company's profits come from 20% of the time its staff spend● 80% of a company's sales come from 20% of its products● 80% of a company's sales are made by 20% of its sales staff
Several criminology studies have found 80% of crimes are committed by 20% of criminals.
RFM AnalysisRFM is a method used for analyzing customer value.
● Recency - How recently did the customer purchase?
● Frequency - How often do they purchase?
● Monetary Value - How much do they spend?
A method
● Recency = 10 - the number of months that have passed since the customer last purchased
● Frequency = number of purchases in the last 12 months (maximum of 10)
● Monetary = value of the highest order from a given customer (benchmarked against $10k)
Alternatively, one can create categories for each attribute. For instance, the Recency attribute might be broken into three
categories: customers with purchases within the last 90 days; between 91 and 365 days; and longer than 365 days. Such
categories may be arrived at by applying business rules, or using a data mining technique, to find meaningful breaks.
A commonly used shortcut is to use deciles. One is advised to look at distribution of data before choosing breaks.
