thermal effects of geomechanics characteristics of soft ... · thermal effects of geomechanics...
TRANSCRIPT
Thermal effects of geomechanics characteristics of soft rocks from M.Enim Formation
Zulfahmi1,b, Ildrem Syafri2, Abdurrokhim2 and Ridho K. Wattimena3
1R & D Center for Mineral and Coal Technology, Jl. Jend. Sudirman No. 623 Bandung 2Faculty of Geology Engineering-Padjadjaran University, Jl. Raya Bandung-Sumedang
Km. 21 Jatinangor. 3Faculty of Mining and Petroleum Engineering-ITB, Jl. Ganesha No.10 Bandung 40132
ABSTRACT
The changes of characteristics of rocks such as claystone, siltstone, and sandstone exposed to high temperatures until 1100oC has been investigated experimentally in the laboratory. The samples originate from the proposed of UCG pilot plant in Muara Enim formation in the Palembang basin. The mineral composition of the rocks is very influential on the characteristics of rocks when treated under thermal load variations.The density of rocks decreases with increasing thermal load, but is not more than 10%. The porosity increased along with the temperatures increase. After thermal treatment, the mechanical properties of the rocks showed significant differences between the rocks that the dominant contain kaolinite mineral with the non-dominant contain kaolinite mineral. For the first group showed increases values in the compressive strength, modulus of elasticity and the axial strain after thermal treatment and the second group showed declines. But the values of the Poisson ratio of claystone and siltstone both for the first group and the second group showed a decreasing trend except sandstone rocks which showed a rising trend. In the opinion of the authors of the grain size could affect the value of Poisson's ratio. According to the dynamic test results showed an increase in velocity of compression and shear wave propagation for the first group of rocks but decline for the second group. That is quite interesting here is the significant reduction in the temperature of 500oC to 600oC for rocks from the first and the second type of rocks. This shows the difference in rate between the release of hydroxyl groups from the rocks that dominant kaolinite mineral with the non-dominant kaolinite mineral. Keywords: thermal load; physical properties; mechanical properties; dynamical properties
Corresponding author: Ph. (+62-22-6030483, Fax. (022) 6003373, E-mail: [email protected] b Ph.D. Student, E-mail: [email protected]
1. Introduction
Most of Indonesia coal deposit is low rank coal, so at more than 200 meters depth, the coal is uneconomical to be mined using conventional methods due to its high stripping ratio. One of the alternative methods to exploit such deposits is an implementation of underground coal gasification (UCG) technology. The government of Indonesia is considering UCG technology to be implemented in the country since UCG intensify coal resource use through extraction of deep seated coal and it will produce syngas that can be synthesized to synthetic natural gas to fill the gap between natural gas supply and demand in the near future and UCG has lower CO2 footprint. However, there are two potential risks associated with the characteristics of rocks surrounding the coal seam (cap rock). The first is the risk of groundwater contamination due to organic contaminants produced during the UCG process that penetrate to surrounding rock into the aquifer and the second is subsidence (Torres et al., 2014) due to the cavity formed during the UCG process which allows the rocks above the cavity to collapse. The subsidence will also affect the infrastructure on the surface and may change hydrogeological conditions above the cavity (Sury et al., 2004; Walter, 2007).
The largest of the cavity produced during the UCG process is similar to an underground mine cavity produced by longwall method, however the physical properties of rock in roof and floor of both cavities should be different from UCG uses heat to extract coal. When the temperature increases, the strength of rocks around the gasifier such as claystone, siltstone, and sandstone will change significantly (Hettema et al., 1992; Hajpál and Török, 1998; Ma et al., 2005; Tian et al., 2009; Zhang et al., 2010; Tian et al., 2015).
Subsidence risk depends some factors, including cavity volume, overburden pressure and rock strength. In this paper the strength of rock derived from the proposed location for the UCG pilot plant will be discussed. The purposes of this study are to analyze mineralogical structure and chemical composition of sedimentary rocks of the proposed location and to investigate the effect of thermal load changes to the characteristics of the rocks (physical, mechanical and dynamical). 2. Materials preparation and methods
Rock samples from above and below the target coal seam were used for this study. The samples were collected through core-drilling at the proposed of UCG plant in Muara Enim formation in the Palembang basin. Claystone, siltstone, and sandstone are the main rocks adhered to the coal seam (Figure 1). The samples were prepared using dry methods of two-week air drying as recommended by The International Society for Rock Mechanics (ISRM). Rock samples in the study are assumed as homogeneous and isotropic.
For geomechanical test, core samples with a diameter of 5.5 – 6.3 cm and a length of 2 – 2.5 times diameter were used. The samples were tested in UCS and triaxial tests at a constant displacement rate about 0,002 mm/s. The axial and radial displacement were measured with three LVDTs, one LVDT measuring the axial and the other two measuring the radial displacement. Prior to the UCS and triaxial tests, primary and

secondary waves (P-wave and S-wave) velocity were calculated by measuring the travel time of ultrasonic wave through a rock sample using the Sonic Viewer-SX.
As described by Hill and Thorsness (1982), the process of gasification and coal combustion that occurs in the underground will raise the temperature of about 700 - 900oC and when the gasification process is not disturbed by the seepage of ground water, the temperature will remain at about 1000oC. Furthermore, Burton et al., (2007) estimated that the temperature in the gasification chamber can reach 1500oC. This condition means that the surrounding rock and coal gasification cavity will be exposed to high temperatures during the gasification process takes place. To mimic these conditions in the laboratory, the process of thermal treatment of the test sample is done by heating the sample using a furnace. The thermal loading process is done by gradually warming up to the maximum temperature that can be achieved by a furnace and cooling process is then performed. The thermal treatment was performed using Nabertherm electric furnace. After air-drying, the samples were selected and then heated at a rate of 1oC/minutes at ambient pressure to minimize thermal shock and reduce occurrence of fissure and fracture. The samples were maintained at predetermined thermal load for two hours and after that cooled down in the chamber until room temperature at the same rate. The predetermined thermal load for the research were 30oC, 100oC, 200oC, 300oC, 400oC, 500oC, 600oC, 700oC, 800oC, 900oC, 1000oC and 1100oC. After thermal treatment, only intact samples are selected for geomechanics test.
Powdered rock samples were subjected to XRF (X-Ray Fluorescence) and XRD (X-Ray Diffraction) analyses to obtain chemical, mineral composition and to examine the bonding between the mineral and grain/particle size. Sample characterization was conducted using standard of mineralogical and geomechanics tests defined and described in the Indonesia National Standard (SNI) and in American Society for Testing and Material (ASTM).

3. Experimental results 3.1 Data analysis
The types of rocks as the object of the research are claystone, siltstone, and sandstone that dominates around the coal seam at the study location in Muara Enim formation in the Palembang basin as seen in Figure 1.
Fig. 1 Stratigraphy of rocks at the study location
If compared the three types of rocks from the study location with sedimentary rocks from some countries that reviewed, the density and the UCS value are lower as seen Figure 2. This is because generally the age of the rock formations in Indonesia is relatively young compared to some countries as indicated by the condition of the rocks that has not well compacted and their geological formations are varied (Rai et al., 2010). The following results are the current state of the study concerning the examination of the impact of variation, thermal load of changes of geochemical and geomechanical properties of rocks as a preliminary study to know bearing capacity or strength of the rocks around the proposed UCG pilot plant.

Fig. 2 Variations of rock density and UCS from the study location and the reviewed rocks
Test results for 61 samples of claystone, sandstone, and siltstone in the rocks around the coal seam indicate that the mineral content of the third of rocks dominated by the mineral of quartz, kaolinite, illite, siderite, pyrite, montmorillonite, orthoclase, and anorthite. On the claystone and siltstone, more than 50% found the kaolinite, illite, and siderite except in sandstone only found about 25%, but illite and siderite over 60% of the samples tested. The result of the chemical composition of the elements of claystone, siltstone, and sandstone at the study location are tested by XRF method showed the dominant element are Si, Fe, Al, Cl, K, Ca, Ti, S, Zr, Mn, and Sr as well as some metallic minerals containing relatively very small.
3.2 Changes of physical properties
To investigate the effect of temperature on the physical properties of rocks such as density and porosity, the samples have been tested before and after thermal loads. In this study, the authors distinguish between samples originating from the study location based on the dominant composition of minerals. The first group (group-I) of the sample contains quartz, kaolinite and several minerals with a small percentage and the second group (group-II) contains quartz, siderite, montmorillonite, illite, pyrite, anorthite, and orthoclase.
The change physical properties due to thermal loads could be seen from the test that compares the value of dry density and porosity of rock before (room temperature/30oC) and after being given a thermal load up to 1100oC. For the density changes, generally have a decline in value that is not too significant, ranging between 1-10%. Figure 3
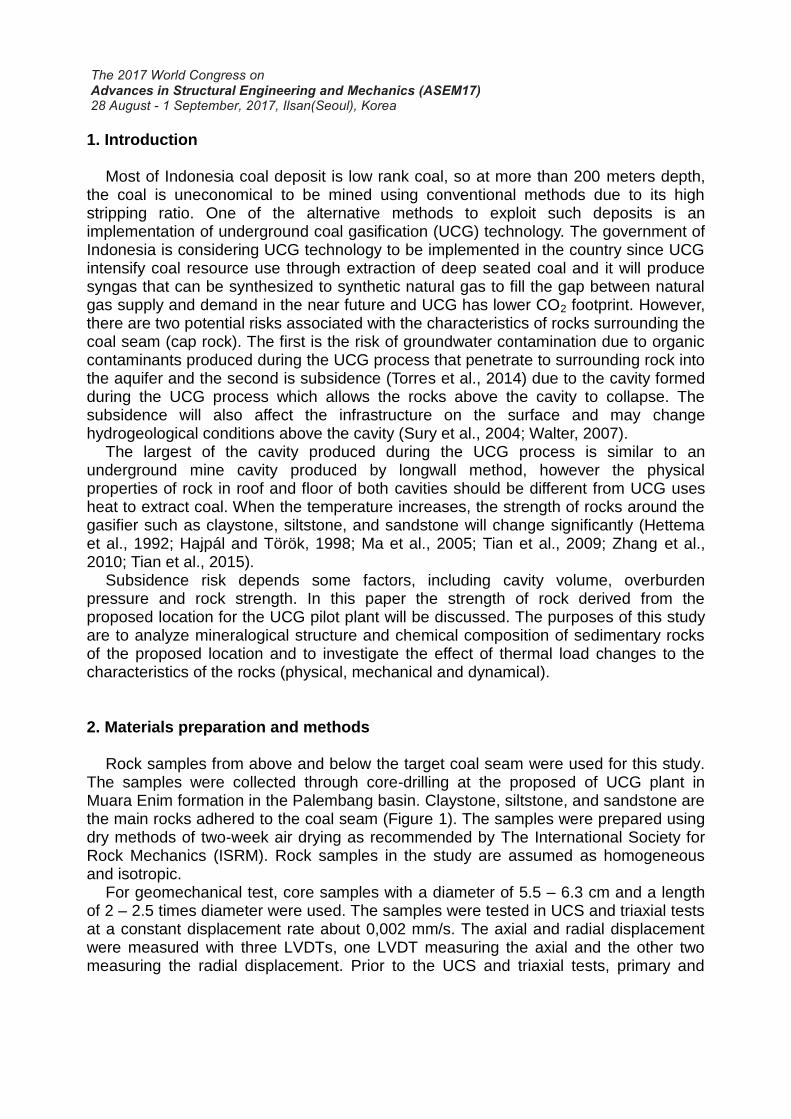
shows the change in density after subjected to the thermal load.
Fig. 3 Dry density versus thermal load
According to Tian (2013), the density decrease can be caused by loss of mass and
volume expansion. Lost mass is usually caused by the evaporation of free moisture contained within the pores of the rock. Evaporation of pore water occurs at a temperature of no more than 200oC (Tian, 2013), so the decline in the rock mass above 200oC at the thermal loads can be caused by the chemical composition alterations of rocks that undergoing a process of disintegration into free oxides, carbon dioxide or water vapor. Some previous researchers (such as Somerton, 1992; Ferrerro & Marini, 2001; Yilmaz, 2011; Wu et al, 2011; Aramide, 2012; Singer & Tye, 1979; Tian, 2013; Su et al, 2015) observe bulk density several rock types such as limestone, coal, claystone, bricks, they conclude that the dimensions have changed, the mass of the rock declined were accompanied by enlargement of the samples volume due to structural damage to the samples after being given a thermal load.
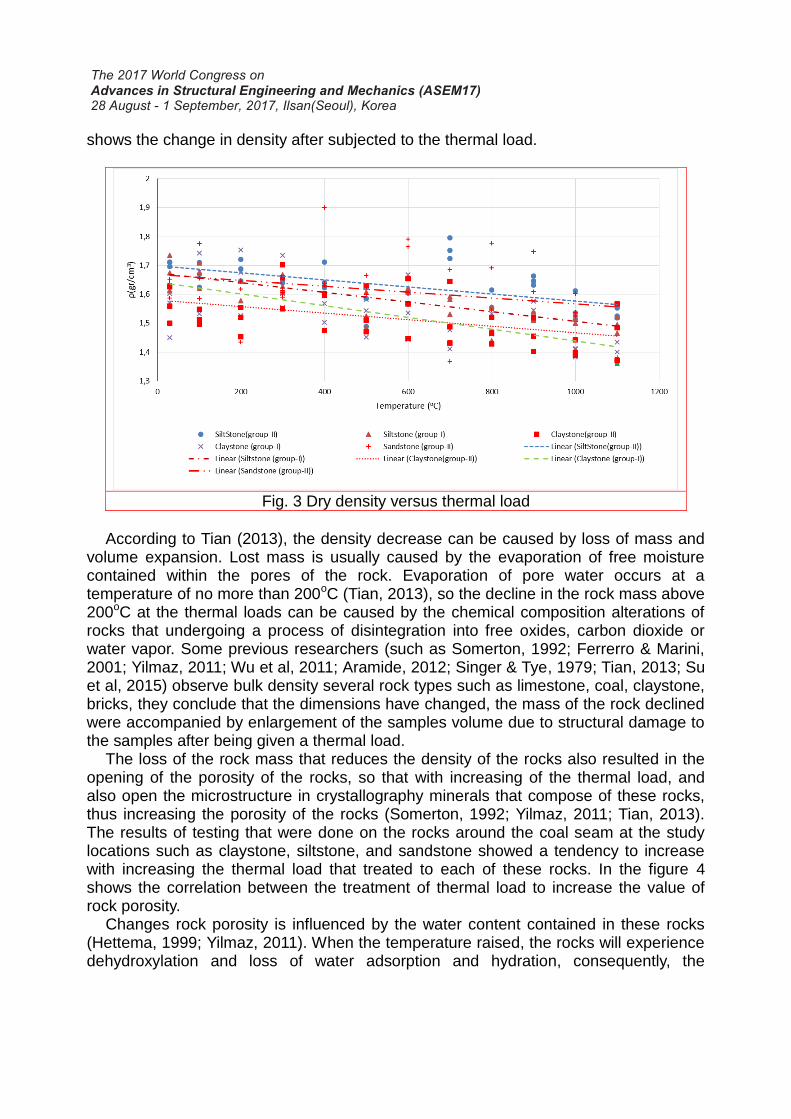
The loss of the rock mass that reduces the density of the rocks also resulted in the opening of the porosity of the rocks, so that with increasing of the thermal load, and also open the microstructure in crystallography minerals that compose of these rocks, thus increasing the porosity of the rocks (Somerton, 1992; Yilmaz, 2011; Tian, 2013). The results of testing that were done on the rocks around the coal seam at the study locations such as claystone, siltstone, and sandstone showed a tendency to increase with increasing the thermal load that treated to each of these rocks. In the figure 4 shows the correlation between the treatment of thermal load to increase the value of rock porosity.
Changes rock porosity is influenced by the water content contained in these rocks (Hettema, 1999; Yilmaz, 2011). When the temperature raised, the rocks will experience dehydroxylation and loss of water adsorption and hydration, consequently, the
interlayer space is damaged and occurs a change of porosity. These changes alter the porosity rocks as macro and micro as well as alter the plasticity of rocks (Yilmaz, 2011). The increase in temperature to some rocks (group-II) that have a structure mineralogy non-kaolinite will change the microstructure significant due to swelling so that the rock volume increases, while the rocks (group-I) that have a structure mineralogy kaolinite at a given temperature will be amorphous so that the microstructure instead become solid (Heller-Kallai, 2006). The process of heating until the temperature of 1100oC done by using a furnace at a rate of temperature rise was maintained low at approximately 2 - 3 °C / min. Heating with higher rate generally can cause thermal cracking that can destroy samples of rock, making it difficult for further testing.
Fig. 4 Total porosity versus thermal load
3.3 Changes of mechanical properties
Observations of alterations the mechanical properties of the rocks due to the thermal load were the uniaxial compressive strength, elastic modulus, Poisson's ratio and axial strain at a peak stress. Some previous researchers such as Tian (2013), Sygala et al (2013), Su et al (2015) have generally concluded that the rock strength decreases with increasing thermal load received by rocks. But some other researchers in their research result show a different trend. There are quite significant differences in each level of thermal loading and even tends to increase with increasing of thermal load that received of rocks such as expressed by Yilmaz (2011), Aramide (2012), Ranjith et al. (2012). Mao et al (2014) suggests that an increase in rock strength in the thermal load at the range of 200oC - 600oC higher than the strength at room temperature.
In this study, at first, the authors conducted a correlation between uniaxial compressive strength with thermal loading variation from room temperature to 1100oC regardless contents of mineralogical of each sample were tested. The results showed no significant trend even tend to be inconsistent as expressed by Tian (2013). Attracted by research conducted by Yilmaz (2011) who studied the effect of temperature on the characteristics of claystone which are kaolinite and bentonite, the authors tried to
30
35
40
45
50
0 200 400 600 800 1000 1200
%
Temperature (oC)
Claystone(group-I) Claystone (group-II)Siltstone(group-I) Siltstone(group-II)Sandstone(group-II) 선형 (Claystone(group-I)) 선형 (Claystone (group-II)) 선형 (Siltstone(group-I)) 선형 (Siltstone(group-II)) 선형 (Sandstone(group-II))
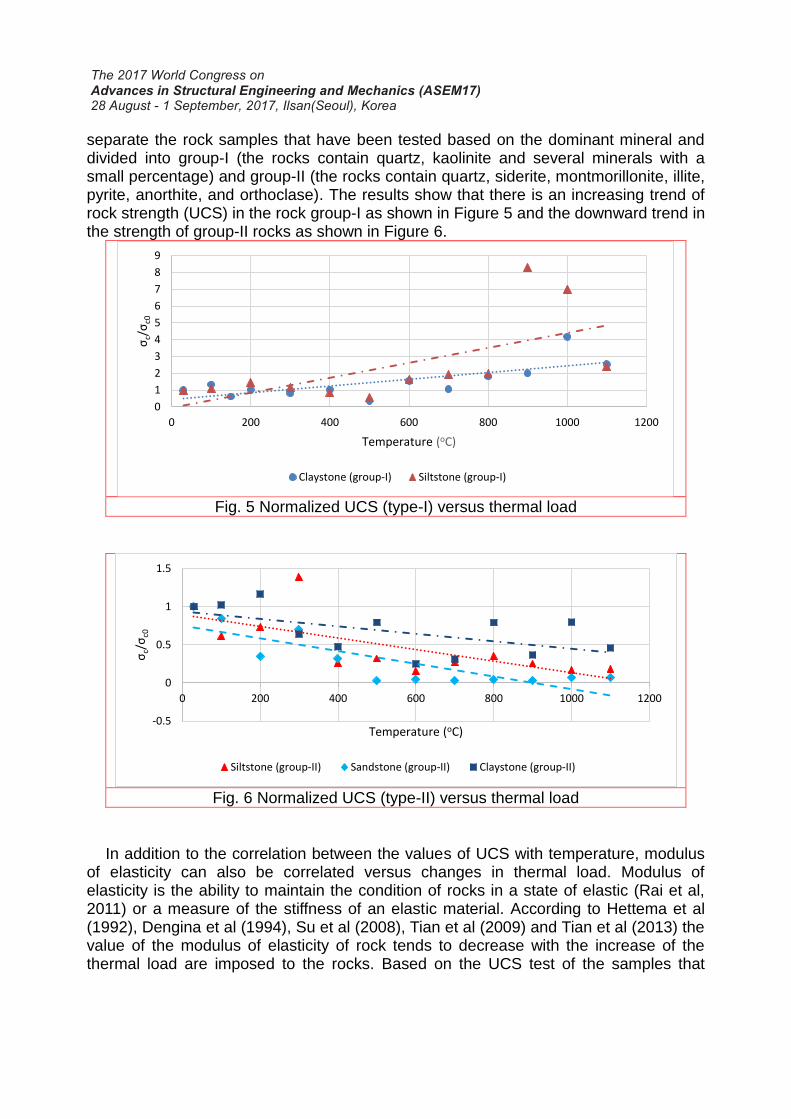
separate the rock samples that have been tested based on the dominant mineral and divided into group-I (the rocks contain quartz, kaolinite and several minerals with a small percentage) and group-II (the rocks contain quartz, siderite, montmorillonite, illite, pyrite, anorthite, and orthoclase). The results show that there is an increasing trend of rock strength (UCS) in the rock group-I as shown in Figure 5 and the downward trend in the strength of group-II rocks as shown in Figure 6.
Fig. 5 Normalized UCS (type-I) versus thermal load
Fig. 6 Normalized UCS (type-II) versus thermal load
In addition to the correlation between the values of UCS with temperature, modulus of elasticity can also be correlated versus changes in thermal load. Modulus of elasticity is the ability to maintain the condition of rocks in a state of elastic (Rai et al, 2011) or a measure of the stiffness of an elastic material. According to Hettema et al (1992), Dengina et al (1994), Su et al (2008), Tian et al (2009) and Tian et al (2013) the value of the modulus of elasticity of rock tends to decrease with the increase of the thermal load are imposed to the rocks. Based on the UCS test of the samples that
0
1
2
3
4
5
6
7
8
9
0 200 400 600 800 1000 1200
σc/σ
c0
Temperature (oC)
Claystone (group-I) Siltstone (group-I)
-0.5
0
0.5
1
1.5
0 200 400 600 800 1000 1200
σc/σ
c0
Temperature (oC)
Siltstone (group-II) Sandstone (group-II) Claystone (group-II)

derived from the study location, it turns out the value of the modulus of elasticity is affected by the condition of mineralogy and the level of the thermal load be received the rocks. Figure 7 illustrates the difference in the modulus of elasticity in each of the rock group.
Fig. 7 Young’s modulus versus thermal load
A value of Poisson Ratio (υ) is the ratio of lateral strain to axial strain (Rai et al, 2011).
This ratio characterizes the deformation of rock due to the load (in this case the uniaxial load). The change in the thermal load of rocks from the study location was influential to deformation, but the value of Poisson's ratio for each rock type shows inconsistently. The value of the Poisson ratio for claystone and siltstone of the kaolinite group and non-kaolinite showed a decreasing trend except sandstone rocks which showed a rising trend. In an opinion of the authors, the grain size seems to affect the value of the Poisson ratio. Figure 8 shows the change in the value of the Poisson ratio normalized to temperature change for each group of rocks.
Tian (2013) has conducted a test correlation against data coming from several countries. From these studies, the sandstone, limestone, and coal indicate a trend towards an increase in axial strain due to the increasing of the thermal load. This study has been carried out the correlation between the temperature of the axial strain in the triaxial test with three variations of confining pressure (50 kPa, 100 kPa, and 200 kPa). In Figure 9 shows the variation of axial strain normalized (εp-axial / εp0-axial) as a form of the deformation changes. At the Figure 9, the axial strain from the group-II of the rocks showed a decreasing trend, while for the group-I of rocks, in fact, showed an increasing trend. Although it varies, but it can be seen that at temperatures around 400oC all rock types generally indicate a decrease in the deformation, it is because of the rock begun to change the phase in which some elements began to harden. As for the rocks of the group-I, because these minerals are not plastic, so that the level of depreciation and the power of drying are the lowest and highly refractory (Hamzah, 2005), then the deformation continues to increase until at a temperature of 700° C and then began to decrease. While the rocks of group-II tends to decrease though slightly.
-10000
0
10000
20000
30000
0 200 400 600 800 1000 1200
E (K
g/cm
2 )
Temperatur (oC) Claystone (group-I) Claystone (group-II)Siltstone (group-I) Siltstone (group-II)Sandstone (group-II) 선형 (Claystone (group-I)) 선형 (Claystone (group-II)) 선형 (Siltstone (group-I)) 선형 (Siltstone (group-II)) 선형 (Sandstone (group-II))
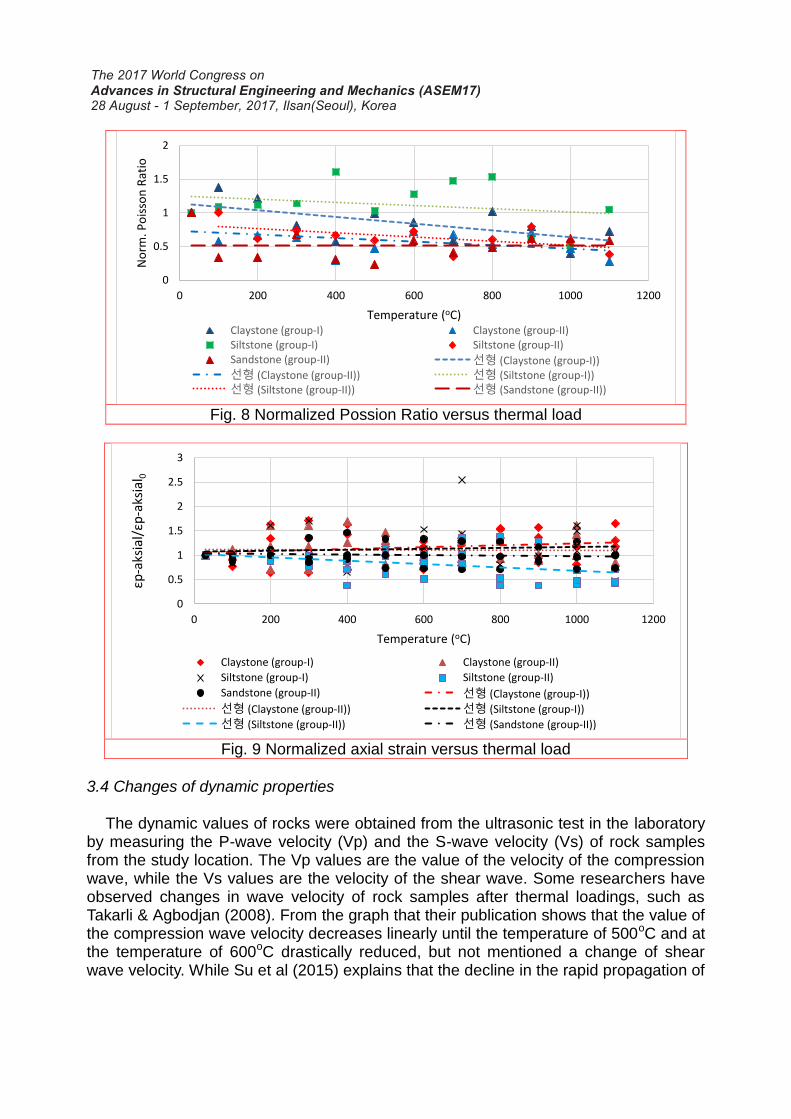
Fig. 8 Normalized Possion Ratio versus thermal load
Fig. 9 Normalized axial strain versus thermal load
3.4 Changes of dynamic properties
The dynamic values of rocks were obtained from the ultrasonic test in the laboratory
by measuring the P-wave velocity (Vp) and the S-wave velocity (Vs) of rock samples from the study location. The Vp values are the value of the velocity of the compression wave, while the Vs values are the velocity of the shear wave. Some researchers have observed changes in wave velocity of rock samples after thermal loadings, such as Takarli & Agbodjan (2008). From the graph that their publication shows that the value of the compression wave velocity decreases linearly until the temperature of 500oC and at the temperature of 600oC drastically reduced, but not mentioned a change of shear wave velocity. While Su et al (2015) explains that the decline in the rapid propagation of
0
0.5
1
1.5
2
0 200 400 600 800 1000 1200
No
rm. P
ois
son
Rat
io
Temperature (oC) Claystone (group-I) Claystone (group-II)Siltstone (group-I) Siltstone (group-II)Sandstone (group-II) 선형 (Claystone (group-I)) 선형 (Claystone (group-II)) 선형 (Siltstone (group-I)) 선형 (Siltstone (group-II)) 선형 (Sandstone (group-II))
0
0.5
1
1.5
2
2.5
3
0 200 400 600 800 1000 1200
εp-a
ksia
l/εp
-aks
ial 0
Temperature (oC)
Claystone (group-I) Claystone (group-II)
Siltstone (group-I) Siltstone (group-II)
Sandstone (group-II) 선형 (Claystone (group-I))
선형 (Claystone (group-II)) 선형 (Siltstone (group-I))
선형 (Siltstone (group-II)) 선형 (Sandstone (group-II))
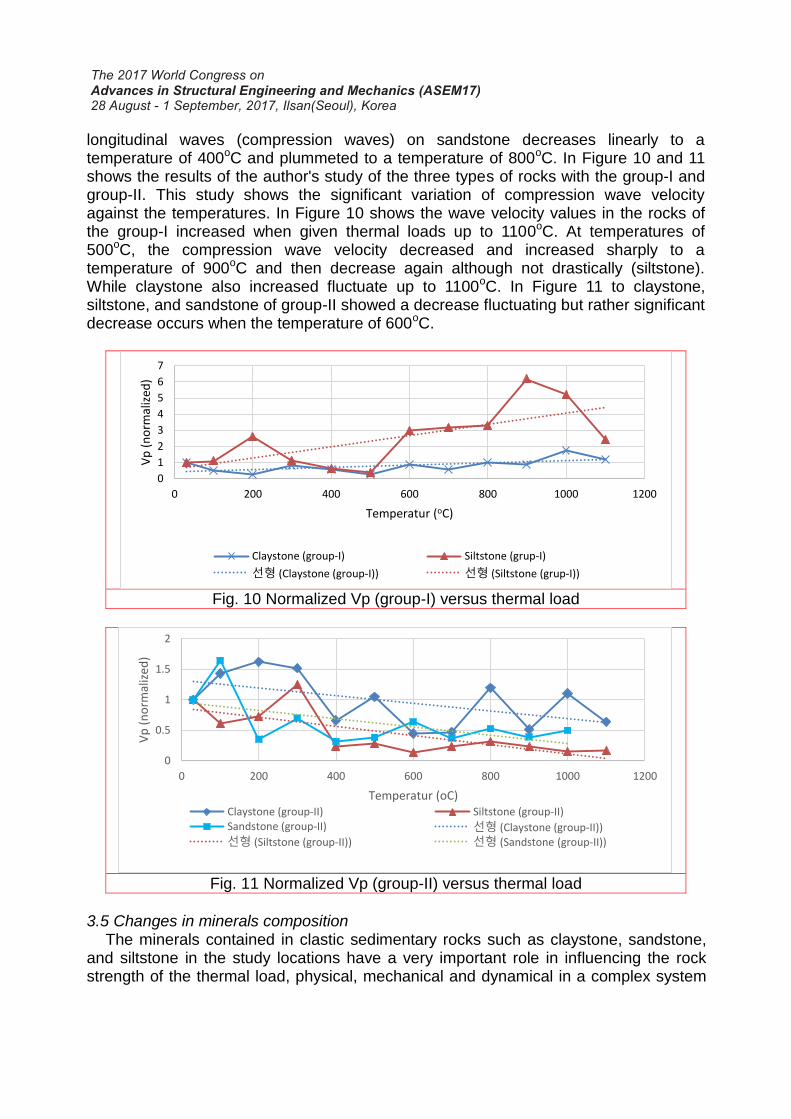
longitudinal waves (compression waves) on sandstone decreases linearly to a temperature of 400oC and plummeted to a temperature of 800oC. In Figure 10 and 11 shows the results of the author's study of the three types of rocks with the group-I and group-II. This study shows the significant variation of compression wave velocity against the temperatures. In Figure 10 shows the wave velocity values in the rocks of the group-I increased when given thermal loads up to 1100oC. At temperatures of 500oC, the compression wave velocity decreased and increased sharply to a temperature of 900oC and then decrease again although not drastically (siltstone). While claystone also increased fluctuate up to 1100oC. In Figure 11 to claystone, siltstone, and sandstone of group-II showed a decrease fluctuating but rather significant decrease occurs when the temperature of 600oC.
Fig. 10 Normalized Vp (group-I) versus thermal load
Fig. 11 Normalized Vp (group-II) versus thermal load
3.5 Changes in minerals composition
The minerals contained in clastic sedimentary rocks such as claystone, sandstone, and siltstone in the study locations have a very important role in influencing the rock strength of the thermal load, physical, mechanical and dynamical in a complex system
0
1
2
3
4
5
6
7
0 200 400 600 800 1000 1200
Vp
(n
orm
aliz
ed)
Temperatur (oC)
Claystone (group-I) Siltstone (grup-I)
선형 (Claystone (group-I)) 선형 (Siltstone (grup-I))
0
0.5
1
1.5
2
0 200 400 600 800 1000 1200
Vp
(n
orm
aliz
ed)
Temperatur (oC) Claystone (group-II) Siltstone (group-II)Sandstone (group-II) 선형 (Claystone (group-II)) 선형 (Siltstone (group-II)) 선형 (Sandstone (group-II))
of the rock mass. The UCG process will involve the loads on the rocks around the coal burning. The mineral content of the rocks can be making the rocks more strongly when given the thermal load and also can be weakened. The compounds of oxides such as SiO2 and Al2O3 are material to the framework in the manufacture of ceramics and other components such as Fe2O3, TiO2 is a compound that can give color to the rock (Rifki et al, 2007).
According to Worrall (1968) and Worrall (1986), some compounds of alkali oxides such as feldspar, mica or other minerals function as a flux that is a compound that can lower the melting point of the ceramic firing process. In addition, Worrall (1968) also explained that the mineral kaolinite when releasing water at temperatures above 100oC would gradually decompose at 450oC temperature by removing the hydroxyl group (OH) as water and turns into meta-kaolin reaction process as follows:
𝐴𝑙2𝑆𝑖𝑂5(𝑂𝐻)4450𝑜𝐶→ 2𝐴𝑙2𝑂3. 3𝑆𝑖𝑂2 + 𝑆𝑖𝑂2 (1)
But when there is no a significant temperature rise, then it can also occur backlash
that alters the structure back into kaolinite. At higher temperatures again, meta-kaolin, reacts to form crystalline compounds which in the end result will be formed free silica (cristobalite) and mullite, 3Al2O3 2SiO2 (Rifki et al, 2007). The process of changing meta- kaolin into silicon spinel and silicon spinel mullite turned into pseudo (pseudo-mullite) then changed again into mullite and cristobalite can be explained by the following equation.
2[𝐴𝑙2𝑂3. 2𝑆𝑖𝑂2] 925𝑜𝐶→ 2𝐴𝑙2𝑂33𝑆𝑖𝑂2 + 𝑆𝑖𝑂2 (2)
Meta kaolin Silicon spinel
2𝐴𝑙2𝑂3. 3𝑆𝑖𝑂21100𝑜𝐶→ 2[𝐴𝑙2𝑂3. 𝑆𝑖𝑂2] + 𝑆𝑖𝑂2 (3)
Silicon spinel Pseudomullite
3[𝐴𝑙2𝑂3. 𝑆𝑖𝑂2]1400𝑜𝐶→ 3𝐴𝑙2𝑂3. 2𝑆𝑖𝑂2 + 𝑆𝑖𝑂2 (4)
Pseudomullite Mullite Cristobalite
Along with increasing temperature, the mullite crystals grow and form the hard cristobalite. In contrast to kaolinite, the non-kaolinite minerals such as montmorillonite will remove the hydroxyl group (OH) to be the water at a temperature of 650oC and rocks were originally experienced swelling and then shrinking, resulting in the rock porosity was also changed so that the strength of the rocks to be reduced. According to Rifki et al. (2007), change or decomposition of mineral into an amorphous mass of alumina and silica occurs at higher temperatures than the kaolinite mineral and spinel phase will appear as well as the end of a product that is mullite and cristobalite (Worral, 1968) will occur after heating at a temperature of 1400oC.
Rocks such as claystone, siltstone and sandstone generally contains quartz, illite, mica, pyrite, orthoclase, siderite, anorthite, siderite which affect the rock strength when given the variation of thermal load, because the compounds of these minerals contained ions such as Na, K, Ca and Mg that acts as a fluxing ions.
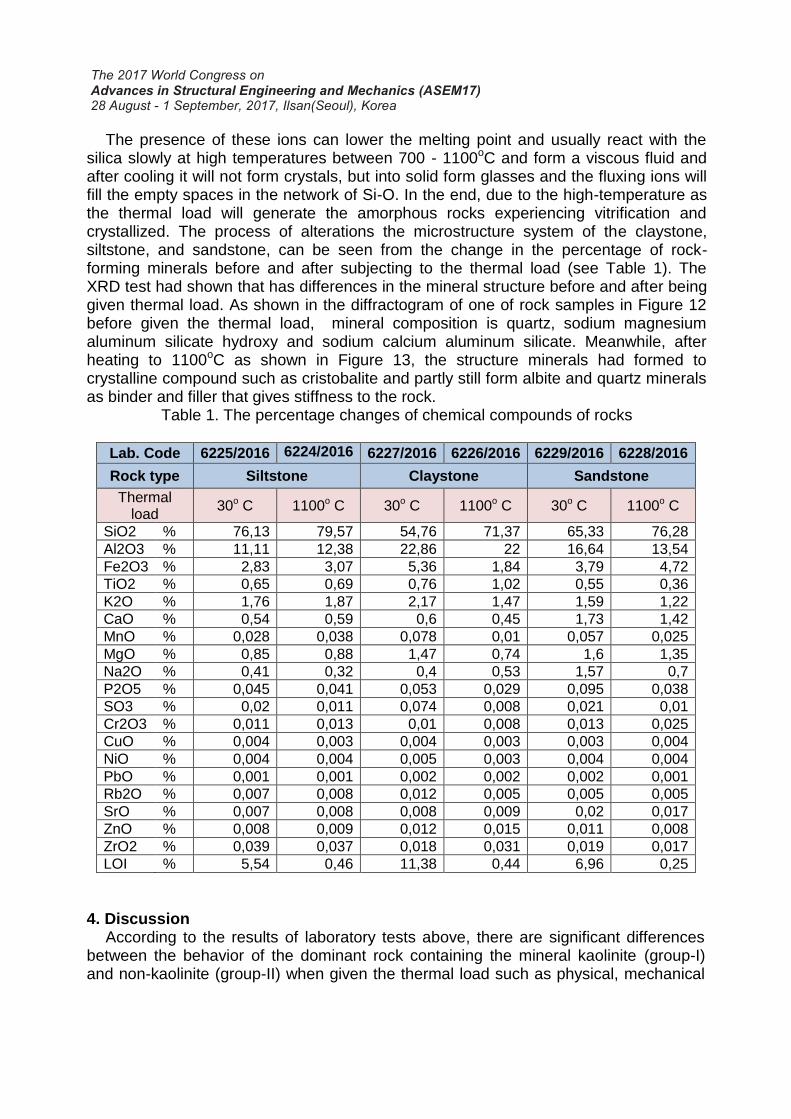
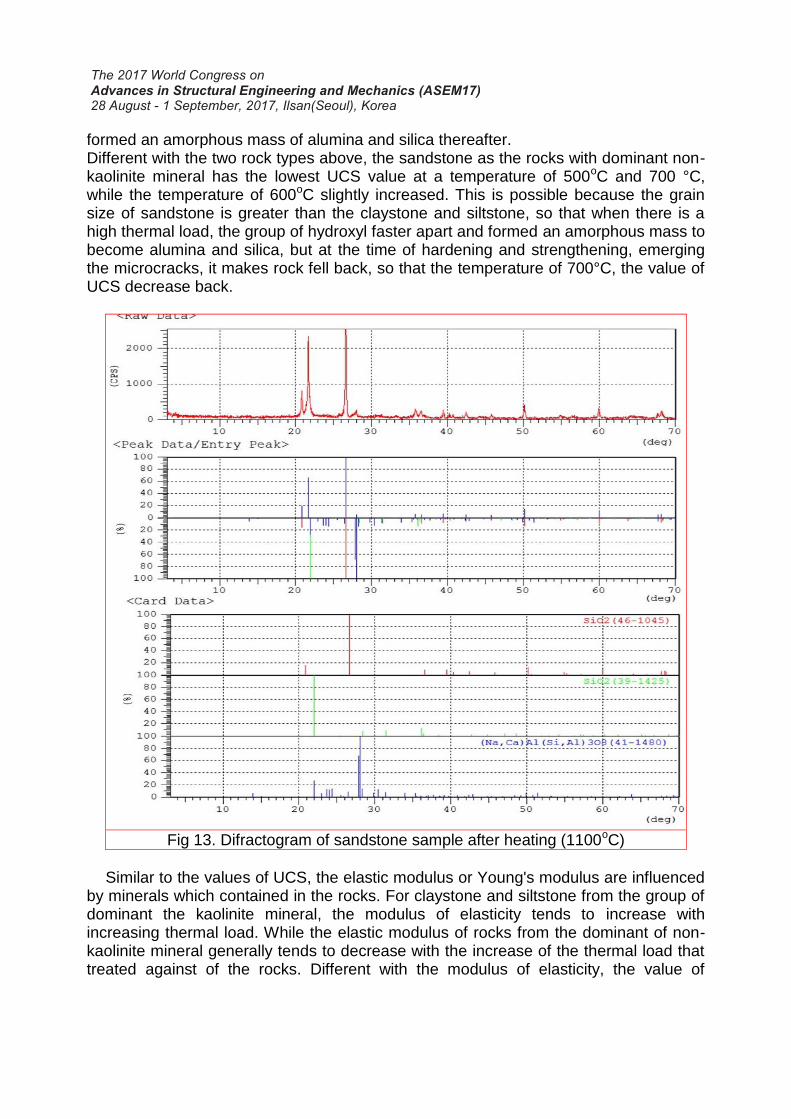
The presence of these ions can lower the melting point and usually react with the silica slowly at high temperatures between 700 - 1100oC and form a viscous fluid and after cooling it will not form crystals, but into solid form glasses and the fluxing ions will fill the empty spaces in the network of Si-O. In the end, due to the high-temperature as the thermal load will generate the amorphous rocks experiencing vitrification and crystallized. The process of alterations the microstructure system of the claystone, siltstone, and sandstone, can be seen from the change in the percentage of rock-forming minerals before and after subjecting to the thermal load (see Table 1). The XRD test had shown that has differences in the mineral structure before and after being given thermal load. As shown in the diffractogram of one of rock samples in Figure 12 before given the thermal load, mineral composition is quartz, sodium magnesium aluminum silicate hydroxy and sodium calcium aluminum silicate. Meanwhile, after heating to 1100oC as shown in Figure 13, the structure minerals had formed to crystalline compound such as cristobalite and partly still form albite and quartz minerals as binder and filler that gives stiffness to the rock.
Table 1. The percentage changes of chemical compounds of rocks
Lab. Code 6225/2016 6224/2016 6227/2016 6226/2016 6229/2016 6228/2016
Rock type Siltstone Claystone Sandstone
Thermal load
30o C 1100o C 30o C 1100o C 30o C 1100o C
SiO2 % 76,13 79,57 54,76 71,37 65,33 76,28
Al2O3 % 11,11 12,38 22,86 22 16,64 13,54
Fe2O3 % 2,83 3,07 5,36 1,84 3,79 4,72
TiO2 % 0,65 0,69 0,76 1,02 0,55 0,36
K2O % 1,76 1,87 2,17 1,47 1,59 1,22
CaO % 0,54 0,59 0,6 0,45 1,73 1,42
MnO % 0,028 0,038 0,078 0,01 0,057 0,025
MgO % 0,85 0,88 1,47 0,74 1,6 1,35
Na2O % 0,41 0,32 0,4 0,53 1,57 0,7
P2O5 % 0,045 0,041 0,053 0,029 0,095 0,038
SO3 % 0,02 0,011 0,074 0,008 0,021 0,01
Cr2O3 % 0,011 0,013 0,01 0,008 0,013 0,025
CuO % 0,004 0,003 0,004 0,003 0,003 0,004
NiO % 0,004 0,004 0,005 0,003 0,004 0,004
PbO % 0,001 0,001 0,002 0,002 0,002 0,001
Rb2O % 0,007 0,008 0,012 0,005 0,005 0,005
SrO % 0,007 0,008 0,008 0,009 0,02 0,017
ZnO % 0,008 0,009 0,012 0,015 0,011 0,008
ZrO2 % 0,039 0,037 0,018 0,031 0,019 0,017
LOI % 5,54 0,46 11,38 0,44 6,96 0,25
4. Discussion
According to the results of laboratory tests above, there are significant differences between the behavior of the dominant rock containing the mineral kaolinite (group-I) and non-kaolinite (group-II) when given the thermal load such as physical, mechanical

and dynamical behavior. The density of rocks at the study location generally decreased with increasing thermal load. The changes are not too drastic, ranging between 2-10%. Same as the density, the porosity of rocks also showed an increase. The UCS test result for the group-I, the claystone are generally shown an increase, but it is interesting here is that when the temperature of 500oC showed the lowest value. Same like the claystone, the siltstone from the group-I indicates the lowest value too at the temperature of 500oC. Appropriate with the research Warrol (1968) and Rifki et al (2007), the rocks that the dominant of kaolinite mineral will release the hydroxyl groups at a temperature of 450oC and at this point no temperature increase hence occurs the reversible reaction which was originally a change into meta-kaoline to be hydrated back into kaolinite.
Fig 12. Difractogram of sandstone sample before heating (30oC)
The rocks from the group non-kaolinite (group-II) have the lowest UCS value at the
temperature of 600oC. This occurs because the non-mineral kaolinite releasing the hydroxyl groups at temperatures between 600 - 650oC, depending on the percentage of non-mineral kaolinite compared with kaolinite. This decrease not only in claystone but also occurs in siltstone. The process of releasing the hydroxyl group in the claystone and siltstone is the beginning process of the resulting dehydration that may be can be
formed an amorphous mass of alumina and silica thereafter. Different with the two rock types above, the sandstone as the rocks with dominant non-kaolinite mineral has the lowest UCS value at a temperature of 500oC and 700 °C, while the temperature of 600oC slightly increased. This is possible because the grain size of sandstone is greater than the claystone and siltstone, so that when there is a high thermal load, the group of hydroxyl faster apart and formed an amorphous mass to become alumina and silica, but at the time of hardening and strengthening, emerging the microcracks, it makes rock fell back, so that the temperature of 700°C, the value of UCS decrease back.
Fig 13. Difractogram of sandstone sample after heating (1100oC)
Similar to the values of UCS, the elastic modulus or Young's modulus are influenced
by minerals which contained in the rocks. For claystone and siltstone from the group of dominant the kaolinite mineral, the modulus of elasticity tends to increase with increasing thermal load. While the elastic modulus of rocks from the dominant of non-kaolinite mineral generally tends to decrease with the increase of the thermal load that treated against of the rocks. Different with the modulus of elasticity, the value of

Poisson's ratio for all types of rocks and mineralogical different groups generally showed little inclination decline, except the sandstone from the group of dominant non-kaolinite mineral which tends to increase albeit slightly. This condition occurs according to the author's opinion is influenced by the grain size so has little effect on the axial deformation. 5. Conclusions
Study the influence of temperature on the changes in characteristics and behavior of rocks with being given various thermal loads has been carried out. The various temperature are 30oC, 100oC, 200oC, 300oC, 400oC, 500oC, 600oC, 700oC, 800oC, 900oC, 1000oC and 1100oC. The density of rocks decreases with increasing thermal load. Despite this decrease in density is not more than 10% (range 1-10%). Same with the density, when given the thermal load along with the rising temperatures, the porosity of rocks are increased. The differences of porosity of rocks are affected by the water content contained in these rocks. When the thermal load is increased, the rocks undergoes dehydroxylation and loss of water adsorption and hydration, consequently, the space of interlayer is damaged and there is a change of porosity. These changes alter the macro and microporosity of rocks as well as change the plasticity of these rocks.
Based on the test results of mechanical properties the rocks showed significant differences between the rocks that dominant kaolinite mineral (group-I) with the rocks that dominant non-kaolinite mineral (group-II). For the group-I, when given the variation of the thermal load from room temperature up to 1100oC showed increases value in the compressive strength, modulus of elasticity and the axial strain. As for the group-II showed declines. But the values of the Poisson ratio of claystone and siltstone both for the group-I and group-II showed a decreasing trend except sandstone rocks which showed a rising trend. In the opinion of the authors of the grain size could affect the value of Poisson's ratio.
The dynamic test has been carried out by testing the velocity wave propagation of rock samples derived from the study location. The test results showed an increase in velocity of compression and shear wave propagation for the rocks that dominant kaolinite minerals (group-I), but decline in the rocks that dominant non-kaolinite mineral (group-II). That is quite interesting here the significant reduction in the temperature of 500oC to 600oC for rocks from the group-I and II. This shows the difference in speed between the release of hydroxyl groups from the rocks that dominant kaolinite mineral (group-I) and non-kaolinite mineral (group-II).
Several tests have been conducted to know the characteristics of mineralogy such as XRF and XRD to see behavioral changes in the microstructure of the rock at each level and the addition of thermal loads. The role of the minerals contained in rocks from the study location is very influential on the characteristics and the behavior of rocks when treated the change of the thermal load.

Acknowledgments
The first, author greatly appreciates Dr. Miftahul Huda and Mr. Nendaryono for their support of my research and the laboratory staff at the rock mechanics and chemistry and physics laboratory for their support on sample testing. The research described in this paper was financially supported by R & D Center for Mineral and Coal Technology, Agency of R & D for Energy and Mineral Resources-Ministry of Energy and Mineral Resources of The Republic of Indonesia.
References Agustawijaya, D.S. (2007), “The uniaxial compressive strength of soft rock”, Civil
Engineering Dimension, Vol. 9, No. 1, 9–14. Al-Jassar, S.H. and Hawkins, A. B. (1979), “Geotechnical properties of the
Carboniferous Limestone of the Bristol Area. The influence of petrography and chemistry. Proceedings of the 4th Conference of the ISRM, Montreux, 3-14
Aramide F.O. (2012), “Effect of firing temperature on mechanical properties of fired Masonry bricks produced from Ipetumodu Clay”, Leonardo Journal of Science, p. 70-82.
ASTM American Standard of Testing and Material D 4406 - 84. Burton, E., Friedmann, J., and Upadhye, R. (2007), “Best Practices in underground
coal gasification (Report), Lawrence Livermore National Laboratory, W-7405-Eng-48. Dengina N.I., Kazak V.N. and Pristash V.V. (1993), “Changes in rocks at high
temperatures”, A. A. Skochinskii Inst. of Hydrodynamics, Lyubertsy. No. 5, pp. 96–103.
Forster, I. R. (1983), “The Influence of core sample geometry on the axial point load test”, International Journal Rock Mechanics & Mineral Science & Geomechanics Abstract, 20, 291 – 2915.
Hamzah, M.S. (2005), “Karakterisasi kaolin Kabupaten Barru sebagai bahan dasar keramik”, Majalah Ilmiah Mekanika Teknik, Tahun VI No. 19.
Heller-Kallai L. (2006), “Handbook of clay science”, edited by F. Bergaya, B.K.G. Theng and G. Lagaly, Development in Clay Science, Elsevier Ltd.
Hettema M.H., De Pater C.J., Wolf K-H.A.A. (1992) “High temperature properties of roof rock of coal rock characterization”, ISRM Symposium: EUROCK 1992, pp. 93–98).
Hill, R.W. and Thorsness, C.B. (1982), “Summary report on large block experiments in underground coal gasification, Tono Basin, Washington”, Vol. 1. Experimental description and data analysis.
Lam, T., Martin, D. and McCreath, D. (2007), “Characterising the geomechanics properties of the sedimentary rocks for the DGR excavations”, OttawaGeo2007.
Liu, E.L. (2010), “Deformation and breakage properties of crushable blocky material”, Rock Mechanic Rock Engineering, DOI 10.1007/s00603-010-0117-3
Mao X., Zhang L., Li T. and Liu H. (2007), “Properties of failure mode and thermal damage for limestone at high temperature”, Mining Science & Technology no 19, 2009, s. 0290–0294).
Rai, M.A., Kramadibrata, S. and Wattimena, R.K. (2011), “TA 3111-Mekanika batuan”, Catatan kuliah, Laboratorium geomekanika dan peralatan tambang, Institut
Teknologi Bandung. Ranjith P.G., Daniel, R.V., Chen, B.J. and Samintha, M. A.P. (2012) “Transformation
plasticity and the effect of temperature on the mechanical behaviour of Hawkesbury sandstone at atmospheric pressure”, Engineering Geology 151 pp 120 – 127, Elsevier B.V.
Reyer, D., and Philipp, S.L. (2014), “Empirical relations of rock properties of outcrop and core samples from the Northwest German Basin for geothermal drilling”, Geothermal energy. Science, 2, 21–37, 2014.
Rifki S., Nuryanto, Suhanda, and Wahyudi, K. (2007), “Sifat fisik lempung Tanjung Morawa dalam transformasi fasa mineral berdasarkan investigasi difraksi sinar X”, Jurnal Riset Geologi & Pertambangan Jilid 17, No. 1, 11-19.
Sheng, Q., Yue, Z.Q., Lee, C.F., Tham, L.G. and Zhou, H. (2002), “Estimating the excavation disturbed zone in the permanent shiplock slopes of the Three Gorges Project China, International Journal of Rock Mechanics and Mining Sciences, 39(2): 165 184.
Singer, J.M. and Tye, R.P. (1979), “Thermal, mechanical and physical properties of selected bituminious coals and cokes”, Department of Interior, Bureau of Mines.
Somerton, W.H. (1992), “Thermal properties and temperature-related behavior of rock/fluid systems, Amsterdam”, Elsevier.
Sury M, White M, Kirton J, Carr P and Woodbridge R. (2004), “Review of Environmental Issues of Underground Coal Gasification“, Report No. COAL R272 DTI/Pub URN 04/1880, 2004. University of Liège Belgium: 126.
Su H.J, Jing H W., Mao X B, Zhao H H., Yin Q. and Wang C. (2015), “Size effect of sandstone after high temperature under uniaxial compression”, J. Cent. South Univ. (2015) 22: 1901-1908.
Sygala A., Bukowska M. and Janozek, T. (2013), “High temperature versus geomechanical parameters of selected rocks – The present state of research”, Journal of Sustainable Mining, Vol. 12, No. 4 pp. 45 – 51.
Takarli, M and Agbodjan, W.P. (2008), “ Temperature effect on physical properties and mechanical behaviour of granite: Experimental investigation of material damage”, Journal of ASTM International, Vol. 5, No.3.
Tian H., Kempka T., Schlüter R., Feinendegen M. and Ziegler M. (2009), “ Infl. of high temperature on rock mass surr. in situ coal conv. Sites”, 10th Int. Sym. on Env. Geotech. and Sust. Dev.
Tian, H., (2013), “Development of a Thermo-Mechanical Model for Rocks Exposed to High Temperatures during Underground Coal Gasification”, Ph.D. Thesis, RWTH Aachen University, Aachen, Germany.
Tian, H., Kempka, T., Yu, S. and Ziegler, M. (2015), “Mechanical properties of sandstones exposed to high temperature”, Rock Mech. Rock Eng. 2015, doi:10.1007/s00603-015-0724-z.
Torres, V.N., Atkins. A.S. and Singh, R.N. (2014), “Assessment of an environmental sustainability index for the underground coal gasification process by using numerical analysis”, Coal Operator’s Conference, Research Online, University of Wollongong.
Walter K. (2007), “Fire in the hole: Underground coal gasification may provide a secure energy supply and reduce greenhouse gas emissions. Lawrence Livermore National Laboratory”, Science, and Tech. Rev., p. 12-18.

Wilson, L. C. (1976), “Tests of bored and driven piles in cretaceous mudstone at Port Elizabeth, South Africa”, Geotechnique, 26.
Worrall, W.E. (1968), “Clays: Their Nature, Origin and General Properties”, Elsevier Science Ltd
Worrall, W.E. (1986), “ Clays and Ceramic Raw Materials”, Elsevier Applied Science Publisher.
Wu, G., Teng, N.G. and Yang, W. (2011), “Physical and mechanical characteristics of limestone after high temperature”, Chinese Journal of Geotechnical Engineering, Vol. 33 (2), S. 259-264.
Yilmaz, G. (2011), “The effect of temperature on the characteristics of kaolinite and bentonite”, Scientific Research and Essays, Vol. 6(9), pp. 1928-1939.
Zhang L., Mao X. and Lu A. (2009), “Experimental study on the mechanical properties of rocks at high temperature”, Science in China Series E: Tech. Sciences, vol. 52, no 3, pp. 641–646.