coupled geomechanics–flow modelling at and below … · coupled geomechanics–flow modelling...
TRANSCRIPT
Coupled geomechanics–flow modelling at and below a critical
stress state used to investigate common statistical properties
of field production data
X. ZHANG1,4, N. C. KOUTSABELOULIS1, K. J. HEFFER2, I. G. MAIN3 & L. LI3
1Vector International Processing Systems Limited, 10 The Courtyard, Eastern Road, Bracknell,
Berkshire RG12 2XB, UK2Heriot-Watt Institute of Petroleum Engineering, Riccarton, Edinburgh, EH14 4AS, UK
3School of Geosciences, University of Edinburgh, Edinburgh EH9 3JW, UK4Present address: Schlumberger Reservoir Geomechanics Centre of Excellence, 10 The
Courtyard, Eastern Road, Bracknell, Berkshire RG12 2XB, UK (e-mail: [email protected])
Abstract: An areal model of a fractured/faulted reservoir with 49 wells is developed thatincorporates fully-coupled geo-mechanics and fluid flow. It is a generic example of a pattern water-flood although it is inspired by a parallel study of the Gullfaks reservoir in the North Sea, in whichstress-related, fault-related and long-range correlations in rate fluctuations are observed. Based onthis model, three scenarios are examined in terms of different initial stress states prior to pro-duction, each of which involves 36 months of production and injection in the presence of fracturesets and faults. The results support the concept that the long-range, stress-related and fault-relatedcharacteristics of correlations in rate fluctuations, observed not only in the Gullfaks data, but also inseveral other fields worldwide, are symptomatic of a system near a geomechanical critical point.These characteristics are not observed in models that are sub-critical. Short-range rate correlationsare likely to exist where there are highly permeable zones between producers and injectors.Long-range rate correlations occur only within critically-stressed regions where there is activeshearing or fault reactivation. The modelling results are consistent with field evidence suggestingthat incipient shearing is an important mechanism coupled with reservoir flow behaviour.
A range of phenomena associated with reservoirsfrom original hydrocarbon migration, to production-related surface subsidence and induced seismicityare related to deformation, faulting/fracturing,and their interaction with fluid flow (Maillot et al.1999; Bruno 2002; Barkved et al. 2003). To under-stand the geomechanical influences that affectthe temporal and spatial correlations of well-ratefluctuations, fully coupled geomechanical–flowmodelling approaches are used to investigate thecharacteristics of correlations in well-rate fluctu-ations based on the finite element method.
The models simulate fluid flow and the geome-chanical reactions of reservoirs during production,such as reactivation of faults and pre-existingdiscrete fracture networks, creation of new fracturesand rock matrix deformation. Any of these dynamicevents can result in changes with time in the conduc-tivities of faults, fractures and rock matrix, andhence in the total permeability field of the reservoir,which will be reflected in changes in the productionand injection rates at individual wells. The modelsare therefore able to incorporate the geomechanicalinfluences on flow rates at wells, and so allow
examination of these influences on spatial andtemporal correlations in flow rates at pairs of wellsas the rates fluctuate due to an imposed noise.Fracture sets are modelled as planes of altered stiff-nesses and potential failure without specific locationin individual finite elements; they could be taken torepresent a range of sizes, from micro-fractures tofractures at the scale of the element. Mechanicalproperties are assumed for the fracture sets, faultsand intact rock. Initial stresses applied across themodel determine whether or not the simulated reser-voir is at a critically-stressed state prior to pro-duction and injection.
The overall deformation of the fractured/faultedreservoir is controlled by potential Coulomb failureof the individual fractures and faults and also of thesurrounding intact rock. With this complexity andthe time varying nature of the conditions, in somecases approaching a critical point, it is very difficultor impossible to employ analytical techniques.Here, a coupled geomechanical–flow numericalmodelling approach based on the finite elementmodel is used to investigate the hydro-mechanicalresponses of a faulted and fractured reservoir.
From: JOLLEY, S. J., BARR, D., WALSH, J. J. & KNIPE, R. J. (eds) Structurally Complex Reservoirs.Geological Society, London, Special Publications, 292, 453–468.DOI: 10.1144/SP292.24 0305-8719/07/$15.00 # The Geological Society of London 2007.
Stress state within and surrounding
fractured/faulted reservoirs
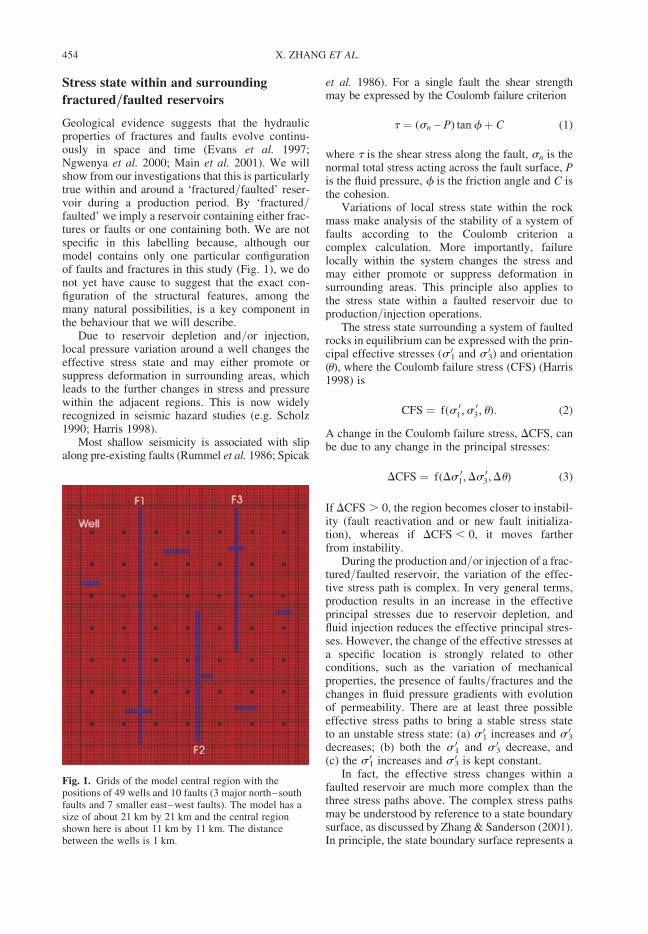
Geological evidence suggests that the hydraulicproperties of fractures and faults evolve continu-ously in space and time (Evans et al. 1997;Ngwenya et al. 2000; Main et al. 2001). We willshow from our investigations that this is particularlytrue within and around a ‘fractured/faulted’ reser-voir during a production period. By ‘fractured/faulted’ we imply a reservoir containing either frac-tures or faults or one containing both. We are notspecific in this labelling because, although ourmodel contains only one particular configurationof faults and fractures in this study (Fig. 1), we donot yet have cause to suggest that the exact con-figuration of the structural features, among themany natural possibilities, is a key component inthe behaviour that we will describe.
Due to reservoir depletion and/or injection,local pressure variation around a well changes theeffective stress state and may either promote orsuppress deformation in surrounding areas, whichleads to the further changes in stress and pressurewithin the adjacent regions. This is now widelyrecognized in seismic hazard studies (e.g. Scholz1990; Harris 1998).
Most shallow seismicity is associated with slipalong pre-existing faults (Rummel et al. 1986; Spicak
et al. 1986). For a single fault the shear strengthmay be expressed by the Coulomb failure criterion
t ¼ (sn – P) tanfþ C (1)
where t is the shear stress along the fault, sn is thenormal total stress acting across the fault surface, Pis the fluid pressure, f is the friction angle and C isthe cohesion.
Variations of local stress state within the rockmass make analysis of the stability of a system offaults according to the Coulomb criterion acomplex calculation. More importantly, failurelocally within the system changes the stress andmay either promote or suppress deformation insurrounding areas. This principle also applies tothe stress state within a faulted reservoir due toproduction/injection operations.
The stress state surrounding a system of faultedrocks in equilibrium can be expressed with the prin-cipal effective stresses (s 01 and s 03) and orientation(u), where the Coulomb failure stress (CFS) (Harris1998) is
CFS ¼ f(s 01,s 03, u): (2)
A change in the Coulomb failure stress, DCFS, canbe due to any change in the principal stresses:
DCFS ¼ f(Ds 01,Ds 03,Du) (3)
If DCFS . 0, the region becomes closer to instabil-ity (fault reactivation and or new fault initializa-tion), whereas if DCFS , 0, it moves fartherfrom instability.
During the production and/or injection of a frac-tured/faulted reservoir, the variation of the effec-tive stress path is complex. In very general terms,production results in an increase in the effectiveprincipal stresses due to reservoir depletion, andfluid injection reduces the effective principal stres-ses. However, the change of the effective stresses ata specific location is strongly related to otherconditions, such as the variation of mechanicalproperties, the presence of faults/fractures and thechanges in fluid pressure gradients with evolutionof permeability. There are at least three possibleeffective stress paths to bring a stable stress stateto an unstable stress state: (a) s 01 increases and s 03decreases; (b) both the s 01 and s 03 decrease, and(c) the s 01 increases and s 03 is kept constant.
In fact, the effective stress changes within afaulted reservoir are much more complex than thethree stress paths above. The complex stress pathsmay be understood by reference to a state boundarysurface, as discussed by Zhang & Sanderson (2001).In principle, the state boundary surface represents a
Fig. 1. Grids of the model central region with thepositions of 49 wells and 10 faults (3 major north–southfaults and 7 smaller east–west faults). The model has asize of about 21 km by 21 km and the central regionshown here is about 11 km by 11 km. The distancebetween the wells is 1 km.
X. ZHANG ET AL.454
surface, below which a fault/fracture system isstable and the fault/fracture system is unstable ifthe stress state reaches it. Any stress state whichwould touch this surface on application of a smallpositive stress change is at a critical stress state.
The stress state in a fractured/faulted reservoirduring production/injection is variable from placeto place and is changing progressively. The stresspaths are further complicated by the interactionamong stress, strain, pressure and permeability,which results in both changes of magnitude anddirection. Studies have revealed a strong correlationbetween the directionality of reservoir fluid flowand the local earth stress in reservoirs (Heffer &Lean 1993; Heffer & Koutsabeloulis 1993).
Changes in pore pressure in a reservoir affect notonly the effective stress state, but also in many casesthe total stress state (Addis 1997; Hillis 2001). Thestress path is defined as change in total horizontalstress, Sh, induced by change in the pore pressure,Pp. Usually, a stress path parameter, Ap, is definedas Ap ¼ DSh/DPp for an extended region or wholereservoir: its value generally depends upon thedeformational responses of the surrounding rockmass including nearby faults. For simplicity inthis study, in which average pressure changes arerelatively small, it is assumed that the parameter,A, is unity, and the uncertainty in effective stresshas been addressed in different cases by usingdifferent stress ratios.
Fully coupled modelling of fluid flow
and stress/strain behaviour
There are several assumptions about the variablesinvolved in coupling between flow and stress/strain (Koutsabeloulis & Hope 1998; Maillot et al.1999; Settari & Walters 1999). In this study, thecoupling between flow and stress/strain involvedthe modification of the permeability of fracturesand/or faults. In this way, the development of anextensional normal strain of fractures and/orfaults increases the permeability of the fractures/faults, and the modification of permeability has animpact on the pressure distribution, which leads tothe change of the effective stresses: those effectivestresses must be compatible with the fracture strainsin a consistent scheme.
In coupled geomechanical–flow numericalmodelling, the pressure predictions due to fluidflow changes are used by a stress simulator toprovide predictions of deformation and to updatepore/aperture volumes, which are in turn used bya flow simulator.
The effective stress calculations are performedat pre-selected times known as ‘stress steps’. Thesimulations are termed iterative if at a given stress
step pore/aperture volumes are repeatedly updatedin response to pressure predictions from the flowsimulator. The simulations are termed explicit ifonly one pore/aperture volume update is permittedat a given stress step.
In this current study, a fully coupled simulationis performed, in which the deformation, pressureand stress are simultaneously calculated at eachstress step. The fully coupled approach offersinternal consistency for solution of the hydro-mechanical equations, i.e. the fluid-flow equationsand force-balance equation of continuum mech-anics, and bypasses the need for explicit and itera-tive coupling strategies.
Reservoir rock behaviour is often time-dependent, with reservoir pressure and the hydrau-lic boundary conditions playing a part. To accountfor these effects, it is necessary to combine theequations governing the flow of fluid through thereservoir rock with the equilibrium and constitutiveequations of the reservoir rock in the finite elementmodel. To achieve that, this model makes use of theprinciple of effective stress.
The principle of effective stress is written as:
fDsg ¼ fDs 0g þ fmg 1� KT
Ks
� �Dp, (4)
where s is the total stress, s 0 is the effective stress,p is pressure, {m} is equal to unity for the diagonalcomponents of stress and zero for the off-diagonalcomponents, KT is the bulk modulus of the reservoirmaterial (solid phase plus voids), KS is the bulkmodulus of the solid phase, and D indicates anincrement.
The Darcy velocity of fluid flow through thereservoir rock is defined by Darcy’s law.
fvg ¼ �½K�fDPg (5)
where [K ] is the permeability tensor.The equation of continuity and compressibility
for the fluid is given as:
rTfvg � Q ¼ fmgT1� KT
KS
� �@1
@t
þ 1� n
KS
þ n
KW
� KT
ðKSÞ2
" #@p
@t,
(6)
where Q represents any fluid flow of the productionand injection, 1 is strain, v is flow velocity, n is theporosity and KW is the bulk modulus of the fluid.
The hydraulic behaviour of fractured/faultedrocks is considerably different from that of rockswith just matrix porosity, particularly if the fractures
COUPLED GEOMECHANICS–FLOW MODELLING 455
are connected. In this case, the fracture networksprovide fast flow channels and the pores mainlyprovide fluid storage. Understanding fluid flowthrough fractures/faults is essential to the analysisof the hydro-mechanical properties and behaviourof fractured/faulted reservoirs. This is because theeffective (bulk) permeability of fractured/faultedreservoir rock may be dominated by the permeabilityof fracture/fault networks, which is usually highlyanisotropic. Generally, the effective permeabilitycan be variable during reservoir depletion and injec-tion, a function of fluid pressure and stress state thatis non-linear and spatially variable.
A considerable amount of experimental andtheoretical research suggests that there is anapproximate cubic law for flow through fractures(Witherspoon et al. 1980; Raven & Gale 1985),which can be expressed as:
Q ¼ f(d3, dp=dx), (7)
where Q is the flow per unit length normal to thedirection of the flow, d is the hydraulic aperture offractures, and dp/dx is the pressure gradient in thedirection of the flow.
The permeability of a fracture system can also behighly dependent upon the stress state due tochanges in the connectivity of fractures close to apercolation threshold (Zhang & Sanderson 1998).Significant permeability changes in fractures/faultscan occur due to inelastic deformation despite injec-tion pressures being much lower than the confiningstress (the minimum total principal stress). In thiscase, the increase in permeability in the reservoirrocks can be due to dilation normal to the surfaceof the faults/fractures (even in a compressivestress regime), which is caused by shearing alongthe faults/fractures, rather than hydro-fracturing.Such shearing need not actually produce localizeddynamic slip to significantly affect the permeability.
Another important feature of fracture/fault flowis that flow tends to an irreducible, aperture-dependent limit at the highest normal stress andsmallest aperture. This means that a fracture isstill to some extent permeable even under a veryhigh normal compressive stress.
In this study, an assumed relationship betweenpermeability change and fracture normal strainchange based on the above considerations is used.It is assumed that the fractures/faults possess abase-level permeability prior to production andinjection, which corresponds to the residual per-meability of the fractures/faults. This implies thatthe apertures of fractures/faults have closed to theirreducible limit under the reservoir depth, but aminimum hydraulic aperture still exists. Suchdeformation-related hydraulic behaviour underhigh normal stress was also observed by Goodman(1976), Bandis et al. (1983) and Cook (1992).
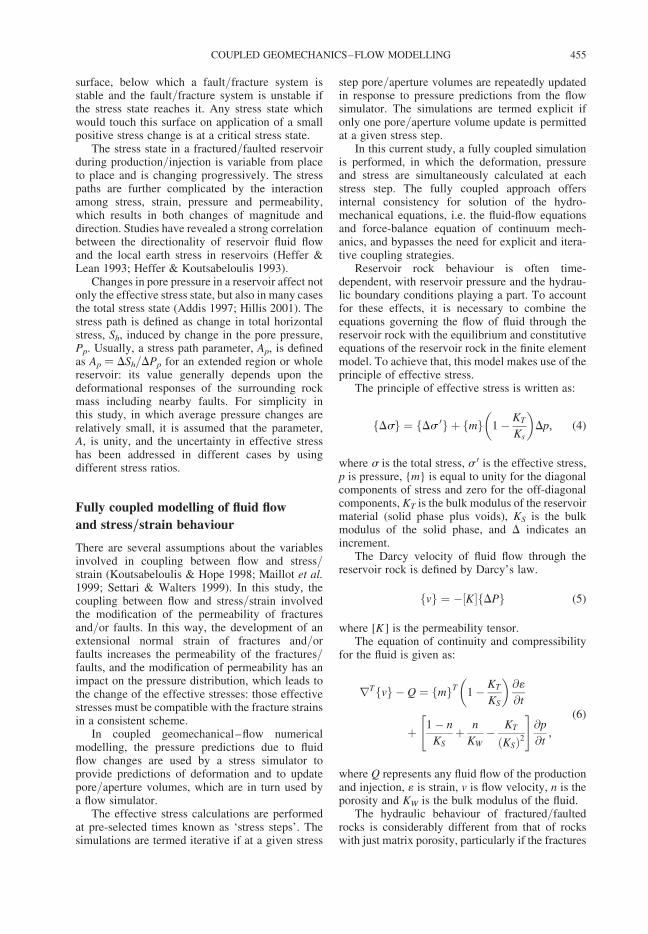
In the areal model of this study, eight sets of frac-tures with an interval of 22.58 were simulated withinthe reservoir rock. A nominal permeability enhance-ment function was used to simulate the permeabilityincrease of fractures due to fracture dilation.
DKF=KF ¼ AF(1n=1nmax), where 1n , 1nmax (8)
DKF=KF ¼ A, where 1n � 1nmax (9)
where KF is the original permeability along frac-tures, DKF is the enhancement of permeabilityalong the fracture, 1n is the strain change normalto the fracture, 1nmax is a given value for theupper limit of the strain change, A is a constantfor the maximum enhancement of permeability,and f( ) is an assumed function (see Fig. 2). It isassumed that the original permeability, KF, is theresidual value, which implies that the apertures offractures within the reservoir rock have themaximum closure at the reservoir depth prior toproduction and injection operation. In addition, amaximum permeability is assumed where theincrease of fracture normal strain is larger than 2%.
Model geometry, mechanical properties
and boundary conditions
To understand the temporal and spatial correlationsbetween producers and injectors, in terms of theirpressure, stress, deformation, permeability andflow-rates, a 2D plane strain areal model has beendeveloped to investigate the well rate correlations
Fig. 2. Relationship between normal strain change (%)and permeability change (factor) for the fracture sets andfaults. It was assumed that the initial permeability wasthe residual value, which implied that the apertures offractures within the reservoir rock had the maximumclosure at the assumed reservoir depth prior toproduction and injection operation. In addition, amaximum permeability was assumed where the fracturenormal strain was larger than 2%.
X. ZHANG ET AL.456
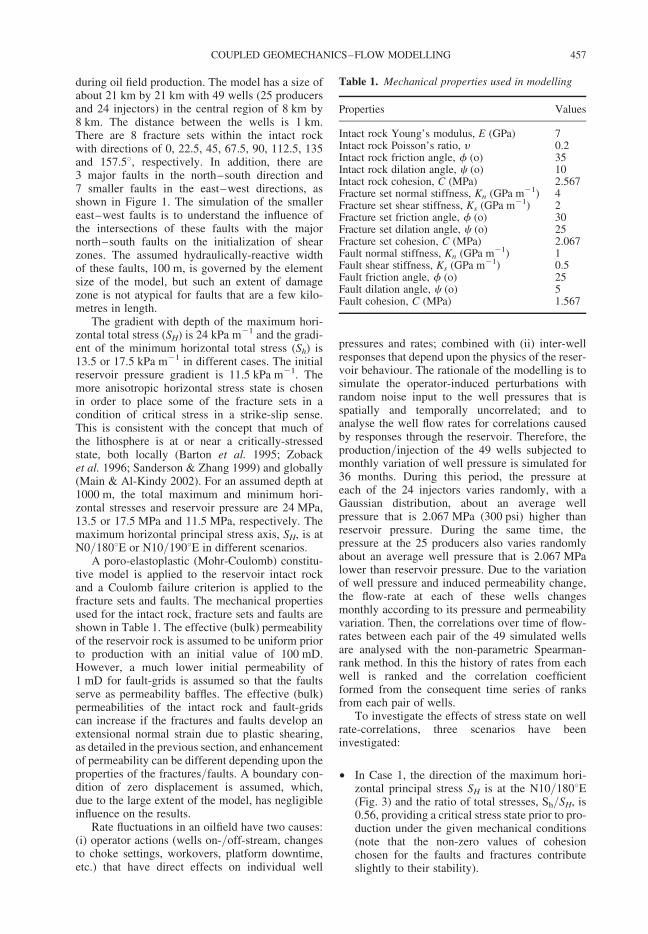
during oil field production. The model has a size ofabout 21 km by 21 km with 49 wells (25 producersand 24 injectors) in the central region of 8 km by8 km. The distance between the wells is 1 km.There are 8 fracture sets within the intact rockwith directions of 0, 22.5, 45, 67.5, 90, 112.5, 135and 157.58, respectively. In addition, there are3 major faults in the north–south direction and7 smaller faults in the east–west directions, asshown in Figure 1. The simulation of the smallereast–west faults is to understand the influence ofthe intersections of these faults with the majornorth–south faults on the initialization of shearzones. The assumed hydraulically-reactive widthof these faults, 100 m, is governed by the elementsize of the model, but such an extent of damagezone is not atypical for faults that are a few kilo-metres in length.
The gradient with depth of the maximum hori-zontal total stress (SH) is 24 kPa m21 and the gradi-ent of the minimum horizontal total stress (Sh) is13.5 or 17.5 kPa m21 in different cases. The initialreservoir pressure gradient is 11.5 kPa m21. Themore anisotropic horizontal stress state is chosenin order to place some of the fracture sets in acondition of critical stress in a strike-slip sense.This is consistent with the concept that much ofthe lithosphere is at or near a critically-stressedstate, both locally (Barton et al. 1995; Zobacket al. 1996; Sanderson & Zhang 1999) and globally(Main & Al-Kindy 2002). For an assumed depth at1000 m, the total maximum and minimum hori-zontal stresses and reservoir pressure are 24 MPa,13.5 or 17.5 MPa and 11.5 MPa, respectively. Themaximum horizontal principal stress axis, SH, is atN0/1808E or N10/1908E in different scenarios.
A poro-elastoplastic (Mohr-Coulomb) constitu-tive model is applied to the reservoir intact rockand a Coulomb failure criterion is applied to thefracture sets and faults. The mechanical propertiesused for the intact rock, fracture sets and faults areshown in Table 1. The effective (bulk) permeabilityof the reservoir rock is assumed to be uniform priorto production with an initial value of 100 mD.However, a much lower initial permeability of1 mD for fault-grids is assumed so that the faultsserve as permeability baffles. The effective (bulk)permeabilities of the intact rock and fault-gridscan increase if the fractures and faults develop anextensional normal strain due to plastic shearing,as detailed in the previous section, and enhancementof permeability can be different depending upon theproperties of the fractures/faults. A boundary con-dition of zero displacement is assumed, which,due to the large extent of the model, has negligibleinfluence on the results.
Rate fluctuations in an oilfield have two causes:(i) operator actions (wells on-/off-stream, changesto choke settings, workovers, platform downtime,etc.) that have direct effects on individual well
pressures and rates; combined with (ii) inter-wellresponses that depend upon the physics of the reser-voir behaviour. The rationale of the modelling is tosimulate the operator-induced perturbations withrandom noise input to the well pressures that isspatially and temporally uncorrelated; and toanalyse the well flow rates for correlations causedby responses through the reservoir. Therefore, theproduction/injection of the 49 wells subjected tomonthly variation of well pressure is simulated for36 months. During this period, the pressure ateach of the 24 injectors varies randomly, with aGaussian distribution, about an average wellpressure that is 2.067 MPa (300 psi) higher thanreservoir pressure. During the same time, thepressure at the 25 producers also varies randomlyabout an average well pressure that is 2.067 MPalower than reservoir pressure. Due to the variationof well pressure and induced permeability change,the flow-rate at each of these wells changesmonthly according to its pressure and permeabilityvariation. Then, the correlations over time of flow-rates between each pair of the 49 simulated wellsare analysed with the non-parametric Spearman-rank method. In this the history of rates from eachwell is ranked and the correlation coefficientformed from the consequent time series of ranksfrom each pair of wells.
To investigate the effects of stress state on wellrate-correlations, three scenarios have beeninvestigated:
† In Case 1, the direction of the maximum hori-zontal principal stress SH is at the N10/1808E(Fig. 3) and the ratio of total stresses, Sh/SH, is0.56, providing a critical stress state prior to pro-duction under the given mechanical conditions(note that the non-zero values of cohesionchosen for the faults and fractures contributeslightly to their stability).
Table 1. Mechanical properties used in modelling
Properties Values
Intact rock Young’s modulus, E (GPa) 7Intact rock Poisson’s ratio, y 0.2Intact rock friction angle, f (o) 35Intact rock dilation angle, c (o) 10Intact rock cohesion, C (MPa) 2.567Fracture set normal stiffness, Kn (GPa m21) 4Fracture set shear stiffness, Ks (GPa m21) 2Fracture set friction angle, f (o) 30Fracture set dilation angle, c (o) 25Fracture set cohesion, C (MPa) 2.067Fault normal stiffness, Kn (GPa m21) 1Fault shear stiffness, Ks (GPa m21) 0.5Fault friction angle, f (o) 25Fault dilation angle, c (o) 5Fault cohesion, C (MPa) 1.567
COUPLED GEOMECHANICS–FLOW MODELLING 457

† In Case 2, the maximum horizontal principalstress SH is in the north–south direction andthe ratio of total stresses, Sh/SH, is 0.56, also pro-viding a critical stress state prior to productionunder the given mechanical conditions, butwith active faulting and permeability enhance-ment different in detail from those in Case 1.
† In Case 3, the maximum horizontal principalstress SH is also in the north–south direction.The total minimum horizontal stress is higherand the total stress ratio of Sh/SH is 0.73, atwhich the stress state prior to production is sub-critical under the given mechanical conditions.
Well-rate correlations under different
stress conditions
Each of these three production/injection scenariosis run for a modelled period of 36 months. In allcases, the same mechanical properties, boundaryconditions, production and injection pressurehistories, and well configurations are applied. The
differences in the three cases are the direction ofthe maximum horizontal principal stress and theinitial stress state, governed by the chosen Sh/SH
ratio. In Cases 1 and 2, the initial stress is close tothe critical state, at which a small change of theeffective stress due to fluid pressure changes inthe reservoir is likely to trigger global hydro-mechanical reaction of the reservoir, irrespectiveof whether the change is at a local scale or aglobal scale (Zhang et al. 2007). In Case 3, theinitial stress state prior to production is in a subcri-tical state. The initial stress state in the three cases isillustrated in Figure 4.
Shear failure in the model is governed, not onlyby the assumed initial stress state, but also by thecohesions and orientations of the individual faultsand fractures and the complexity of the stress statethat evolves during production and injection.
Case 1: SH at N10/1908E with Sh/SH
ratio of 0.56
The pressure changes at the producers and injectorscause changes in effective stresses that, because ofnear-criticality, result in the development of plasticshear strains around wells. Figure 5 shows thedeveloped plastic shear strains around two produ-cers P19 and P20 and two injectors I18 and I19(see Fig. 3) after the production of 1 month and 4months. Although a relatively small change inpressure occurs, significant plastic shear strainsdevelops around the two injectors due to the criticalstress state prior to production. It is apparent that thedeveloped plastic shear strains are larger aroundinjector I19 than around injector I18. This is dueto a major fault near injector I19 and the proximityto the intersection of the major fault and a smallerfault, exemplifying fault-related reservoir rockfailure. Note that the direction of the developedplastic shear bands is in the NE direction, which
Fig. 3. Well configuration and direction of the appliedmaximum horizontal principal stress in Case 1. Theevolution of pressure, stress, plastic shear strain,permeability and flow-rate around the local region ofI18, P19, I19 and P20 were examined for the first4 months of production and injection.
Fig. 4. Illustration of the initial stress states prior toproduction in three cases.
X. ZHANG ET AL.458

makes an angle of about 30 degrees with the SH
direction, exemplifying reservoir rock failurerelated to stress direction.
The changes in plastic shear strains withproduction/injection between 1 and 4 months thatare detectable by close examination of the detailsof Figure 5 may seem slight, but, due to the highsensitivity of fracture permeability to strain, causesignificant permeability changes (see Fig. 6) andtherefore significant flow rate changes at thewells. Particular permeability enhancement isobserved along the plastic shear bands developedaround injector I19, which therefore support highand time-dependent flow velocities, as shown inFigure 7. Generally, significant changes in wellrates are governed by fault-related, stress-relatedand time-dependent geomechanical phenomena.
Figure 8 shows the Spearman rank correlationcoefficients of rates at 49 wells during 36 monthsof production/injection. For most of the wells, therate correlation coefficients are less than 0.5.However, significant positive correlation coeffi-cients exist between some well pairs. For each of49 wells, there are 48 correlation coefficientsbetween 48 pairs of wells. From the approximatet-statistics calculated from the correlation coeffi-cients with 34 degrees of freedom, the correlation
Fig. 5. Development of plastic shear strains rangingbetween 0.909E-3 and 0.1E-1 around wells I18, P19, I19and P20 after Month 1 (a) and Month 4 (b) duringproduction/injection operations in Case 1 (see Fig. 3 forthe locations of the wells).
Fig. 6. Enhanced permeability around wells I18, P19,I19 and P20 after Month 1 (a) ranging between 0.106E-5and 0.925E-5 (m2) and Month 4 (b) between 0.24E-5and 0.216E-4 (m2) during production/injectionoperations in Case 1. The changes in permeability arerelated to the development of the plastic shear strains inFigure 5.
Fig. 7. Velocity of flow around wells I18, P19, I19 andP20 after Month 1 (a) ranging between 0.723E-6 and0.651E-5 (m s21) and Month 4 (b) ranging between0.128E-5 and 0.116E-4 (m s21) during production/injection operations in Case 1. The flow velocity iscontrolled by the modified permeability andpressure gradient.
COUPLED GEOMECHANICS–FLOW MODELLING 459
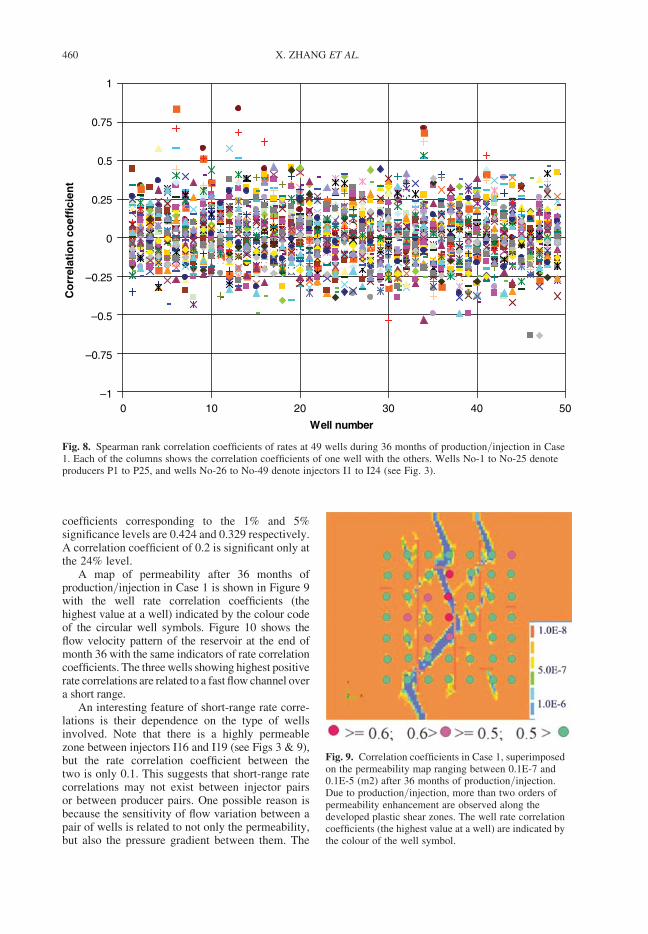
coefficients corresponding to the 1% and 5%significance levels are 0.424 and 0.329 respectively.A correlation coefficient of 0.2 is significant only atthe 24% level.
A map of permeability after 36 months ofproduction/injection in Case 1 is shown in Figure 9with the well rate correlation coefficients (thehighest value at a well) indicated by the colour codeof the circular well symbols. Figure 10 shows theflow velocity pattern of the reservoir at the end ofmonth 36 with the same indicators of rate correlationcoefficients. The three wells showing highest positiverate correlations are related to a fast flow channel overa short range.
An interesting feature of short-range rate corre-lations is their dependence on the type of wellsinvolved. Note that there is a highly permeablezone between injectors I16 and I19 (see Figs 3 & 9),but the rate correlation coefficient between thetwo is only 0.1. This suggests that short-range ratecorrelations may not exist between injector pairsor between producer pairs. One possible reason isbecause the sensitivity of flow variation between apair of wells is related to not only the permeability,but also the pressure gradient between them. The
–1
–0.75
–0.5
–0.25
0
0.25
0.5
0.75
1
0 10 20 30 40 50
Well number
Co
rrel
atio
n c
oef
fici
ent
Fig. 8. Spearman rank correlation coefficients of rates at 49 wells during 36 months of production/injection in Case1. Each of the columns shows the correlation coefficients of one well with the others. Wells No-1 to No-25 denoteproducers P1 to P25, and wells No-26 to No-49 denote injectors I1 to I24 (see Fig. 3).
Fig. 9. Correlation coefficients in Case 1, superimposedon the permeability map ranging between 0.1E-7 and0.1E-5 (m2) after 36 months of production/injection.Due to production/injection, more than two orders ofpermeability enhancement are observed along thedeveloped plastic shear zones. The well rate correlationcoefficients (the highest value at a well) are indicated bythe colour of the well symbol.
X. ZHANG ET AL.460
permeability between two injectors and betweentwo producers might be high, but the pressure gra-dient between two producers and between twoinjectors is relatively low. Alternatively, for shortinter-well distances between well pairs, the hydrau-lic interference is negative (increasing rate at onewell tends to reduce rate at the offset well), whilstthe geomechanical interference is positive (straindilatation at one well tends to produce dilatationat the offset well). It is possible that those opposingtrends tend to cancel each other. For either reason,correlated flow variation is not significant betweentwo close injectors or between two close producers:short-range rate correlations (hydraulic links) onlyexist between an injector–producer pair.
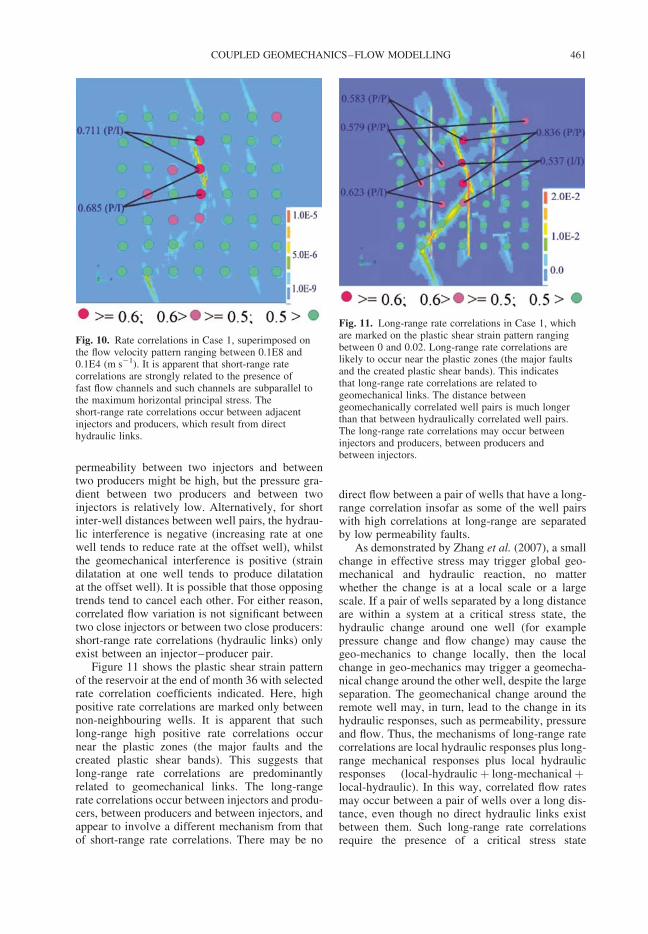
Figure 11 shows the plastic shear strain patternof the reservoir at the end of month 36 with selectedrate correlation coefficients indicated. Here, highpositive rate correlations are marked only betweennon-neighbouring wells. It is apparent that suchlong-range high positive rate correlations occurnear the plastic zones (the major faults and thecreated plastic shear bands). This suggests thatlong-range rate correlations are predominantlyrelated to geomechanical links. The long-rangerate correlations occur between injectors and produ-cers, between producers and between injectors, andappear to involve a different mechanism from thatof short-range rate correlations. There may be no
direct flow between a pair of wells that have a long-range correlation insofar as some of the well pairswith high correlations at long-range are separatedby low permeability faults.
As demonstrated by Zhang et al. (2007), a smallchange in effective stress may trigger global geo-mechanical and hydraulic reaction, no matterwhether the change is at a local scale or a largescale. If a pair of wells separated by a long distanceare within a system at a critical stress state, thehydraulic change around one well (for examplepressure change and flow change) may cause thegeo-mechanics to change locally, then the localchange in geo-mechanics may trigger a geomecha-nical change around the other well, despite the largeseparation. The geomechanical change around theremote well may, in turn, lead to the change in itshydraulic responses, such as permeability, pressureand flow. Thus, the mechanisms of long-range ratecorrelations are local hydraulic responses plus long-range mechanical responses plus local hydraulicresponses (local-hydraulicþ long-mechanicalþlocal-hydraulic). In this way, correlated flow ratesmay occur between a pair of wells over a long dis-tance, even though no direct hydraulic links existbetween them. Such long-range rate correlationsrequire the presence of a critical stress state
Fig. 11. Long-range rate correlations in Case 1, whichare marked on the plastic shear strain pattern rangingbetween 0 and 0.02. Long-range rate correlations arelikely to occur near the plastic zones (the major faultsand the created plastic shear bands). This indicatesthat long-range rate correlations are related togeomechanical links. The distance betweengeomechanically correlated well pairs is much longerthan that between hydraulically correlated well pairs.The long-range rate correlations may occur betweeninjectors and producers, between producers andbetween injectors.
Fig. 10. Rate correlations in Case 1, superimposed onthe flow velocity pattern ranging between 0.1E8 and0.1E4 (m s21). It is apparent that short-range ratecorrelations are strongly related to the presence offast flow channels and such channels are subparallel tothe maximum horizontal principal stress. Theshort-range rate correlations occur between adjacentinjectors and producers, which result from directhydraulic links.
COUPLED GEOMECHANICS–FLOW MODELLING 461
encompassing both wells, when the rocks arestrongly susceptible to small perturbations (metast-ability) and may respond at a long distance fromperturbing loads.
Case 2: SH in the north–south direction
with Sh/SH ratio of 0.56
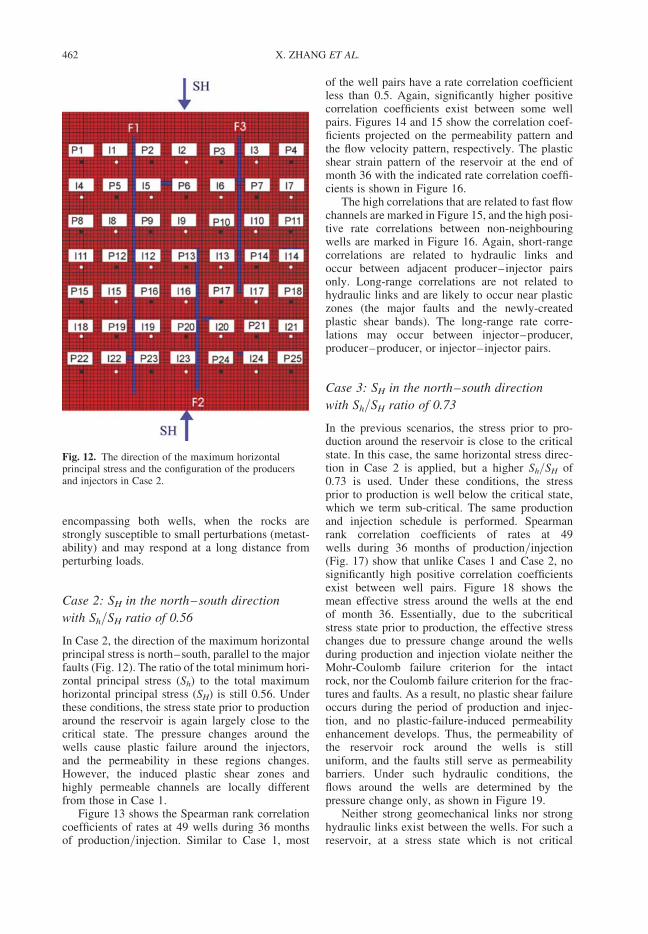
In Case 2, the direction of the maximum horizontalprincipal stress is north–south, parallel to the majorfaults (Fig. 12). The ratio of the total minimum hori-zontal principal stress (Sh) to the total maximumhorizontal principal stress (SH) is still 0.56. Underthese conditions, the stress state prior to productionaround the reservoir is again largely close to thecritical state. The pressure changes around thewells cause plastic failure around the injectors,and the permeability in these regions changes.However, the induced plastic shear zones andhighly permeable channels are locally differentfrom those in Case 1.
Figure 13 shows the Spearman rank correlationcoefficients of rates at 49 wells during 36 monthsof production/injection. Similar to Case 1, most
of the well pairs have a rate correlation coefficientless than 0.5. Again, significantly higher positivecorrelation coefficients exist between some wellpairs. Figures 14 and 15 show the correlation coef-ficients projected on the permeability pattern andthe flow velocity pattern, respectively. The plasticshear strain pattern of the reservoir at the end ofmonth 36 with the indicated rate correlation coeffi-cients is shown in Figure 16.
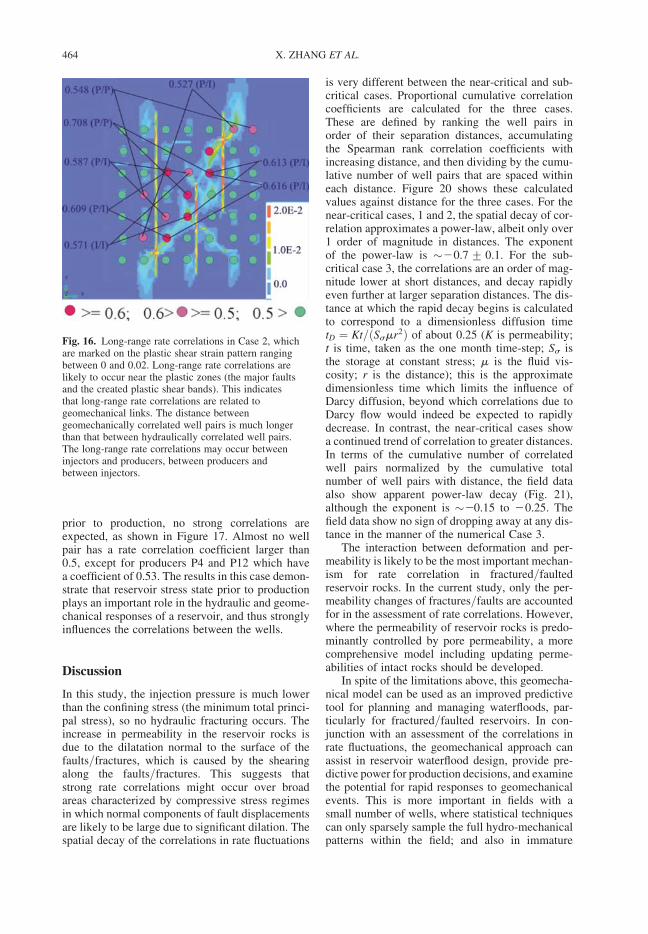
The high correlations that are related to fast flowchannels are marked in Figure 15, and the high posi-tive rate correlations between non-neighbouringwells are marked in Figure 16. Again, short-rangecorrelations are related to hydraulic links andoccur between adjacent producer–injector pairsonly. Long-range correlations are not related tohydraulic links and are likely to occur near plasticzones (the major faults and the newly-createdplastic shear bands). The long-range rate corre-lations may occur between injector–producer,producer–producer, or injector–injector pairs.
Case 3: SH in the north–south direction
with Sh/SH ratio of 0.73
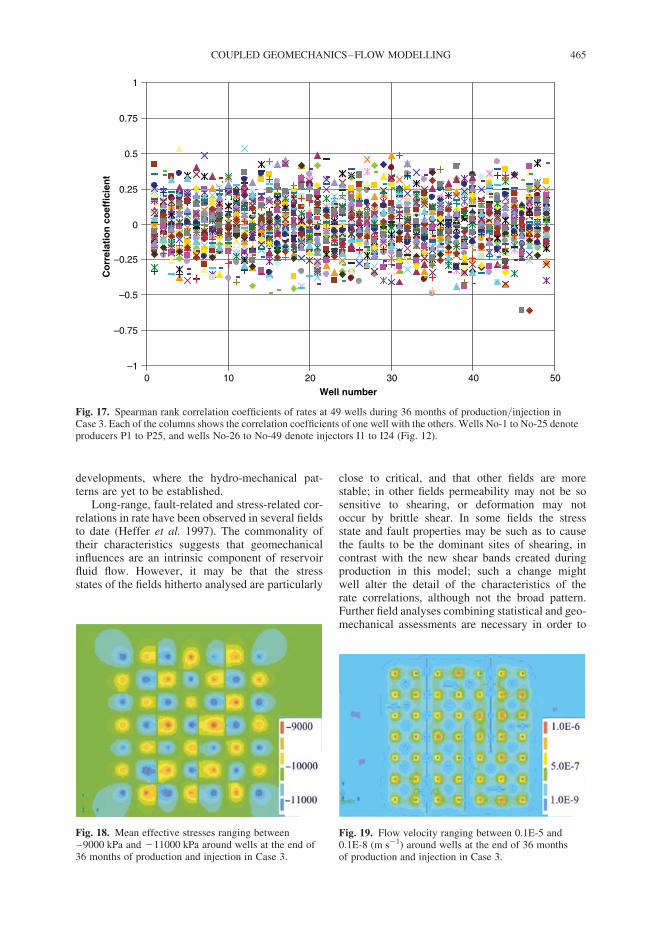
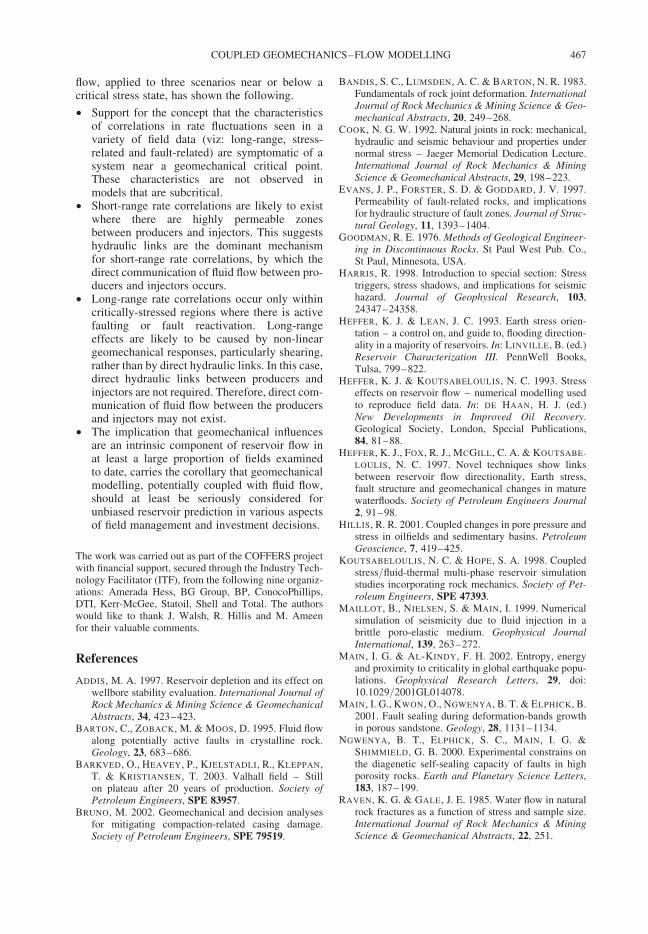
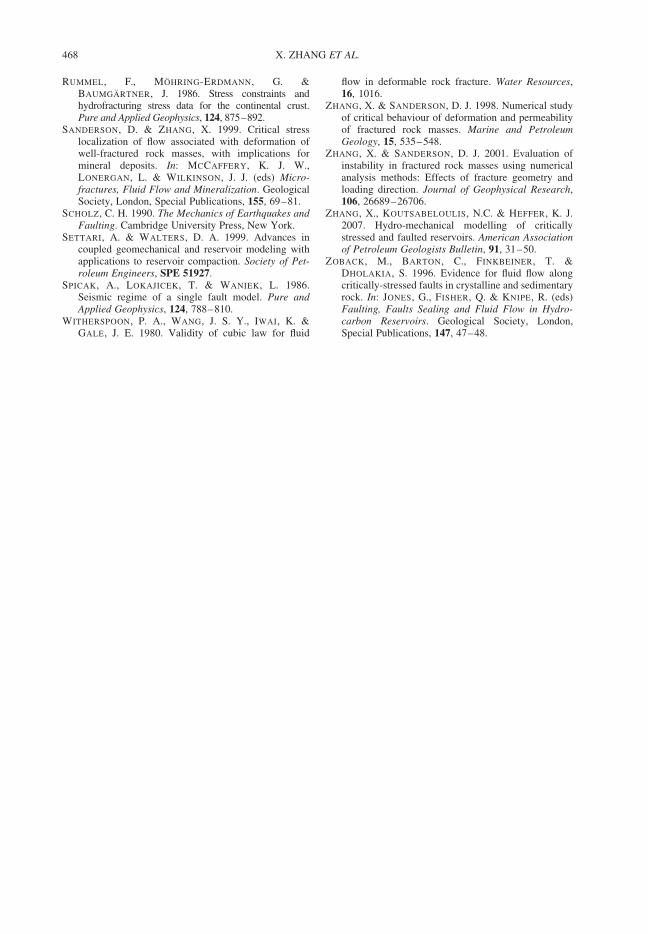
In the previous scenarios, the stress prior to pro-duction around the reservoir is close to the criticalstate. In this case, the same horizontal stress direc-tion in Case 2 is applied, but a higher Sh/SH of0.73 is used. Under these conditions, the stressprior to production is well below the critical state,which we term sub-critical. The same productionand injection schedule is performed. Spearmanrank correlation coefficients of rates at 49wells during 36 months of production/injection(Fig. 17) show that unlike Cases 1 and Case 2, nosignificantly high positive correlation coefficientsexist between well pairs. Figure 18 shows themean effective stress around the wells at the endof month 36. Essentially, due to the subcriticalstress state prior to production, the effective stresschanges due to pressure change around the wellsduring production and injection violate neither theMohr-Coulomb failure criterion for the intactrock, nor the Coulomb failure criterion for the frac-tures and faults. As a result, no plastic shear failureoccurs during the period of production and injec-tion, and no plastic-failure-induced permeabilityenhancement develops. Thus, the permeability ofthe reservoir rock around the wells is stilluniform, and the faults still serve as permeabilitybarriers. Under such hydraulic conditions, theflows around the wells are determined by thepressure change only, as shown in Figure 19.
Neither strong geomechanical links nor stronghydraulic links exist between the wells. For such areservoir, at a stress state which is not critical
Fig. 12. The direction of the maximum horizontalprincipal stress and the configuration of the producersand injectors in Case 2.
X. ZHANG ET AL.462

0 10 20 30 40 50
Well number
–1
–0.75
–0.5
–0.25
0
0.25
0.5
0.75
1C
orr
elat
ion
co
effi
cien
t
Fig. 13. Spearman rank correlation coefficients of rates at 49 wells during 36 months of production/injection inCase 2. Each of the columns shows the correlation coefficients of one well with the others. Wells No-1 to No-25 denoteproducers P1 to P25, and wells No-26 to No-49 denote injectors I1 to I24 (Fig. 12).
Fig. 14. Correlation coefficients in Case 2, which aremarked on the modified permeability ranging between0.1E-7 and 0.1E-5 (m2) after 36 months of production/injection. Due to production/injection, more two ordersof permeability enhancement are observed along thedeveloped plastic shear zones. The well rate correlationcoefficients (the highest value at a well) are indicated bythe colour of the well symbol.
Fig. 15. Short-range rate correlations in Case 2, whichare marked on the flow velocity pattern ranging between0.1E-8 and 0.1E-4 (m s21). It is apparent thatshort-range rate correlations are strongly related to thepresence of fast flow channels and such channels areparallel to the maximum horizontal principal stress. Theshort-range rate correlations occur between adjacentinjectors and producers only.
COUPLED GEOMECHANICS–FLOW MODELLING 463
prior to production, no strong correlations areexpected, as shown in Figure 17. Almost no wellpair has a rate correlation coefficient larger than0.5, except for producers P4 and P12 which havea coefficient of 0.53. The results in this case demon-strate that reservoir stress state prior to productionplays an important role in the hydraulic and geome-chanical responses of a reservoir, and thus stronglyinfluences the correlations between the wells.
Discussion
In this study, the injection pressure is much lowerthan the confining stress (the minimum total princi-pal stress), so no hydraulic fracturing occurs. Theincrease in permeability in the reservoir rocks isdue to the dilatation normal to the surface of thefaults/fractures, which is caused by the shearingalong the faults/fractures. This suggests thatstrong rate correlations might occur over broadareas characterized by compressive stress regimesin which normal components of fault displacementsare likely to be large due to significant dilation. Thespatial decay of the correlations in rate fluctuations
is very different between the near-critical and sub-critical cases. Proportional cumulative correlationcoefficients are calculated for the three cases.These are defined by ranking the well pairs inorder of their separation distances, accumulatingthe Spearman rank correlation coefficients withincreasing distance, and then dividing by the cumu-lative number of well pairs that are spaced withineach distance. Figure 20 shows these calculatedvalues against distance for the three cases. For thenear-critical cases, 1 and 2, the spatial decay of cor-relation approximates a power-law, albeit only over1 order of magnitude in distances. The exponentof the power-law is �20.7 + 0.1. For the sub-critical case 3, the correlations are an order of mag-nitude lower at short distances, and decay rapidlyeven further at larger separation distances. The dis-tance at which the rapid decay begins is calculatedto correspond to a dimensionless diffusion timetD ¼ Kt=ðSsmr2Þ of about 0.25 (K is permeability;t is time, taken as the one month time-step; Ss isthe storage at constant stress; m is the fluid vis-cosity; r is the distance); this is the approximatedimensionless time which limits the influence ofDarcy diffusion, beyond which correlations due toDarcy flow would indeed be expected to rapidlydecrease. In contrast, the near-critical cases showa continued trend of correlation to greater distances.In terms of the cumulative number of correlatedwell pairs normalized by the cumulative totalnumber of well pairs with distance, the field dataalso show apparent power-law decay (Fig. 21),although the exponent is �20.15 to 20.25. Thefield data show no sign of dropping away at any dis-tance in the manner of the numerical Case 3.
The interaction between deformation and per-meability is likely to be the most important mechan-ism for rate correlation in fractured/faultedreservoir rocks. In the current study, only the per-meability changes of fractures/faults are accountedfor in the assessment of rate correlations. However,where the permeability of reservoir rocks is predo-minantly controlled by pore permeability, a morecomprehensive model including updating perme-abilities of intact rocks should be developed.
In spite of the limitations above, this geomecha-nical model can be used as an improved predictivetool for planning and managing waterfloods, par-ticularly for fractured/faulted reservoirs. In con-junction with an assessment of the correlations inrate fluctuations, the geomechanical approach canassist in reservoir waterflood design, provide pre-dictive power for production decisions, and examinethe potential for rapid responses to geomechanicalevents. This is more important in fields with asmall number of wells, where statistical techniquescan only sparsely sample the full hydro-mechanicalpatterns within the field; and also in immature
Fig. 16. Long-range rate correlations in Case 2, whichare marked on the plastic shear strain pattern rangingbetween 0 and 0.02. Long-range rate correlations arelikely to occur near the plastic zones (the major faultsand the created plastic shear bands). This indicatesthat long-range rate correlations are related togeomechanical links. The distance betweengeomechanically correlated well pairs is much longerthan that between hydraulically correlated well pairs.The long-range rate correlations may occur betweeninjectors and producers, between producers andbetween injectors.
X. ZHANG ET AL.464
developments, where the hydro-mechanical pat-terns are yet to be established.
Long-range, fault-related and stress-related cor-relations in rate have been observed in several fieldsto date (Heffer et al. 1997). The commonality oftheir characteristics suggests that geomechanicalinfluences are an intrinsic component of reservoirfluid flow. However, it may be that the stressstates of the fields hitherto analysed are particularly
close to critical, and that other fields are morestable; in other fields permeability may not be sosensitive to shearing, or deformation may notoccur by brittle shear. In some fields the stressstate and fault properties may be such as to causethe faults to be the dominant sites of shearing, incontrast with the new shear bands created duringproduction in this model; such a change mightwell alter the detail of the characteristics of therate correlations, although not the broad pattern.Further field analyses combining statistical and geo-mechanical assessments are necessary in order to
Fig. 18. Mean effective stresses ranging between–9000 kPa and 211000 kPa around wells at the end of36 months of production and injection in Case 3.
Fig. 19. Flow velocity ranging between 0.1E-5 and0.1E-8 (m s21) around wells at the end of 36 monthsof production and injection in Case 3.
–1
–0.75
–0.5
–0.25
0
0.25
0.5
0.75
1
0 10 20 30 40 50
Well number
Co
rrel
atio
n c
oef
fici
ent
Fig. 17. Spearman rank correlation coefficients of rates at 49 wells during 36 months of production/injection inCase 3. Each of the columns shows the correlation coefficients of one well with the others. Wells No-1 to No-25 denoteproducers P1 to P25, and wells No-26 to No-49 denote injectors I1 to I24 (Fig. 12).
COUPLED GEOMECHANICS–FLOW MODELLING 465

define the limits of the hydro-mechanical behaviourdescribed in this paper.
The implication that geomechanics is generallyintrinsic to reservoir flow behaviour at manyscales carries with it the corollary that coupledgeomechanical–flow modelling should at least be
considered seriously for valid prediction of reser-voir flows. Coupled modelling can be applied indifferent contexts:
† As an investigation tool for conceptual studies.At this level, detailed information of a reservoirmay not be required and the emphasis is put onthe recovery mechanisms and the effects ofindividual parameters, such as stress condition,geomechanical properties, well configurations,lithology, porosity-permeability characteristics,degree of fracturing, sedimentology, trap type,reservoir geometry, etc. This type of modellingwould enhance the understanding of recoverymechanisms.
† As an aid in reservoir waterflood design toexamine the directionality of reservoir flows.Due to the complexity of the stress field insome real reservoirs, the directionality of flowbetween a pair of wells is controlled not onlyby the far-field maximum horizontal stresses,but also by the presence of faults/fracturesnear the wells. It may also be significantlyaltered by contrasts in the areal pattern of off-takes and injections leading to strong pressure,and therefore stress, gradients; thermoelasticstress changes can also be significant. Coupledmodelling can be used to predict the flow direc-tions around wells within a local region, which isparticularly important in regions where there arefaults between wells. Under a given in-situ stresscondition and production and injection schedule,the flow directions between each pair of wellscan be predicted.
† As a predictive tool for reservoir-specificproduction-injection simulations. At this level,detailed information for a reservoir is necessary,including the field geological setting, geomecha-nical properties, hydraulic parameters, the in-situstress condition, faults and the production/injection schedules. The results from this typeof modelling may explain the different pro-duction efficiency of some producers andpredict changes during the lifetime of a reservoir.In addition, these results can provide informationto identify hydraulic compartments where nocorrelations exist. In this way, this geomechani-cal approach has the potential to predict theshort- to medium-term oil production by examin-ing the short- and long-range of rate correlationstogether with the geomechanical responses
Conclusions
A fully coupled stress–flow model which allows thedynamic responses of geomechanical–flow beha-viour at individual wells to be investigated, includ-ing pressure, stress, strain, permeability and fluid
0.00001
0.0001
0.001
0.01
0.1
1
1 10Lag distance (km)
Av. c
orr
ela
tio
n c
oeff
icie
nt
Fig. 20. Spatial decay of average correlations of ratefluctuations in the 3 numerical cases. The averagecorrelation coefficient is measured as the cumulativeSpearman rank correlation coefficient for well pairs to agiven separation (lag) distance divided by thecumulative number of all well pairs to that separationdistance. The red and blue lines show the decay for the 2near-critical cases 1 and 2 respectively: these areconsistent with power-law decay (dashed line), with anexponent of 20.7 + 0.1. The green line shows the decayfor the subcritical case 3: the values of correlation aremuch lower, and decay at a faster rate beyond theseparation distance corresponding to a dimensionlesstime, tD c. 0.25 (indicated by the short vertical lineabove the abscissa axis), as expected with Darcy flow.
0.1
1
0.1 1 10
Lag distance (km)
Pro
pn
co
rrel
ated
wel
ls
Fig. 21. Spatial decay of correlations of rate fluctuationsin the Gullfaks field. The proportion of correlated wellsis measured as the cumulative number of correlated wellpairs with separation (lag) distance divided by thecumulative number of all well pairs to that separationdistance. The individual curves are for total fieldproduction times of 85 (blue), 103 (red), 115 (yellow)and 133 (green) months. The decays are consistent withpower-law behaviour, with exponents in the range20.14 to 20.24.
X. ZHANG ET AL.466
flow, applied to three scenarios near or below acritical stress state, has shown the following.
† Support for the concept that the characteristicsof correlations in rate fluctuations seen in avariety of field data (viz: long-range, stress-related and fault-related) are symptomatic of asystem near a geomechanical critical point.These characteristics are not observed inmodels that are subcritical.
† Short-range rate correlations are likely to existwhere there are highly permeable zonesbetween producers and injectors. This suggestshydraulic links are the dominant mechanismfor short-range rate correlations, by which thedirect communication of fluid flow between pro-ducers and injectors occurs.
† Long-range rate correlations occur only withincritically-stressed regions where there is activefaulting or fault reactivation. Long-rangeeffects are likely to be caused by non-lineargeomechanical responses, particularly shearing,rather than by direct hydraulic links. In this case,direct hydraulic links between producers andinjectors are not required. Therefore, direct com-munication of fluid flow between the producersand injectors may not exist.
† The implication that geomechanical influencesare an intrinsic component of reservoir flow inat least a large proportion of fields examinedto date, carries the corollary that geomechanicalmodelling, potentially coupled with fluid flow,should at least be seriously considered forunbiased reservoir prediction in various aspectsof field management and investment decisions.
The work was carried out as part of the COFFERS projectwith financial support, secured through the Industry Tech-nology Facilitator (ITF), from the following nine organiz-ations: Amerada Hess, BG Group, BP, ConocoPhillips,DTI, Kerr-McGee, Statoil, Shell and Total. The authorswould like to thank J. Walsh, R. Hillis and M. Ameenfor their valuable comments.
References
ADDIS, M. A. 1997. Reservoir depletion and its effect onwellbore stability evaluation. International Journal ofRock Mechanics & Mining Science & GeomechanicalAbstracts, 34, 423–423.
BARTON, C., ZOBACK, M. & MOOS, D. 1995. Fluid flowalong potentially active faults in crystalline rock.Geology, 23, 683–686.
BARKVED, O., HEAVEY, P., KJELSTADLI, R., KLEPPAN,T. & KRISTIANSEN, T. 2003. Valhall field – Stillon plateau after 20 years of production. Society ofPetroleum Engineers, SPE 83957.
BRUNO, M. 2002. Geomechanical and decision analysesfor mitigating compaction-related casing damage.Society of Petroleum Engineers, SPE 79519.
BANDIS, S. C., LUMSDEN, A. C. & BARTON, N. R. 1983.Fundamentals of rock joint deformation. InternationalJournal of Rock Mechanics & Mining Science & Geo-mechanical Abstracts, 20, 249–268.
COOK, N. G. W. 1992. Natural joints in rock: mechanical,hydraulic and seismic behaviour and properties undernormal stress – Jaeger Memorial Dedication Lecture.International Journal of Rock Mechanics & MiningScience & Geomechanical Abstracts, 29, 198–223.
EVANS, J. P., FORSTER, S. D. & GODDARD, J. V. 1997.Permeability of fault-related rocks, and implicationsfor hydraulic structure of fault zones. Journal of Struc-tural Geology, 11, 1393–1404.
GOODMAN, R. E. 1976. Methods of Geological Engineer-ing in Discontinuous Rocks. St Paul West Pub. Co.,St Paul, Minnesota, USA.
HARRIS, R. 1998. Introduction to special section: Stresstriggers, stress shadows, and implications for seismichazard. Journal of Geophysical Research, 103,24347–24358.
HEFFER, K. J. & LEAN, J. C. 1993. Earth stress orien-tation – a control on, and guide to, flooding direction-ality in a majority of reservoirs. In: LINVILLE, B. (ed.)Reservoir Characterization III. PennWell Books,Tulsa, 799–822.
HEFFER, K. J. & KOUTSABELOULIS, N. C. 1993. Stresseffects on reservoir flow – numerical modelling usedto reproduce field data. In: DE HAAN, H. J. (ed.)New Developments in Improved Oil Recovery.Geological Society, London, Special Publications,84, 81–88.
HEFFER, K. J., FOX, R. J., MCGILL, C. A. & KOUTSABE-
LOULIS, N. C. 1997. Novel techniques show linksbetween reservoir flow directionality, Earth stress,fault structure and geomechanical changes in maturewaterfloods. Society of Petroleum Engineers Journal2, 91–98.
HILLIS, R. R. 2001. Coupled changes in pore pressure andstress in oilfields and sedimentary basins. PetroleumGeoscience, 7, 419–425.
KOUTSABELOULIS, N. C. & HOPE, S. A. 1998. Coupledstress/fluid-thermal multi-phase reservoir simulationstudies incorporating rock mechanics. Society of Pet-roleum Engineers, SPE 47393.
MAILLOT, B., NIELSEN, S. & MAIN, I. 1999. Numericalsimulation of seismicity due to fluid injection in abrittle poro-elastic medium. Geophysical JournalInternational, 139, 263–272.
MAIN, I. G. & AL-KINDY, F. H. 2002. Entropy, energyand proximity to criticality in global earthquake popu-lations. Geophysical Research Letters, 29, doi:10.1029/2001GL014078.
MAIN, I. G., KWON, O., NGWENYA, B. T. & ELPHICK, B.2001. Fault sealing during deformation-bands growthin porous sandstone. Geology, 28, 1131–1134.
NGWENYA, B. T., ELPHICK, S. C., MAIN, I. G. &SHIMMIELD, G. B. 2000. Experimental constrains onthe diagenetic self-sealing capacity of faults in highporosity rocks. Earth and Planetary Science Letters,183, 187–199.
RAVEN, K. G. & GALE, J. E. 1985. Water flow in naturalrock fractures as a function of stress and sample size.International Journal of Rock Mechanics & MiningScience & Geomechanical Abstracts, 22, 251.
COUPLED GEOMECHANICS–FLOW MODELLING 467
RUMMEL, F., MOHRING-ERDMANN, G. &BAUMGARTNER, J. 1986. Stress constraints andhydrofracturing stress data for the continental crust.Pure and Applied Geophysics, 124, 875–892.
SANDERSON, D. & ZHANG, X. 1999. Critical stresslocalization of flow associated with deformation ofwell-fractured rock masses, with implications formineral deposits. In: MCCAFFERY, K. J. W.,LONERGAN, L. & WILKINSON, J. J. (eds) Micro-fractures, Fluid Flow and Mineralization. GeologicalSociety, London, Special Publications, 155, 69–81.
SCHOLZ, C. H. 1990. The Mechanics of Earthquakes andFaulting. Cambridge University Press, New York.
SETTARI, A. & WALTERS, D. A. 1999. Advances incoupled geomechanical and reservoir modeling withapplications to reservoir compaction. Society of Pet-roleum Engineers, SPE 51927.
SPICAK, A., LOKAJICEK, T. & WANIEK, L. 1986.Seismic regime of a single fault model. Pure andApplied Geophysics, 124, 788–810.
WITHERSPOON, P. A., WANG, J. S. Y., IWAI, K. &GALE, J. E. 1980. Validity of cubic law for fluid
flow in deformable rock fracture. Water Resources,16, 1016.
ZHANG, X. & SANDERSON, D. J. 1998. Numerical studyof critical behaviour of deformation and permeabilityof fractured rock masses. Marine and PetroleumGeology, 15, 535–548.
ZHANG, X. & SANDERSON, D. J. 2001. Evaluation ofinstability in fractured rock masses using numericalanalysis methods: Effects of fracture geometry andloading direction. Journal of Geophysical Research,106, 26689–26706.
ZHANG, X., KOUTSABELOULIS, N.C. & HEFFER, K. J.2007. Hydro-mechanical modelling of criticallystressed and faulted reservoirs. American Associationof Petroleum Geologists Bulletin, 91, 31–50.
ZOBACK, M., BARTON, C., FINKBEINER, T. &DHOLAKIA, S. 1996. Evidence for fluid flow alongcritically-stressed faults in crystalline and sedimentaryrock. In: JONES, G., FISHER, Q. & KNIPE, R. (eds)Faulting, Faults Sealing and Fluid Flow in Hydro-carbon Reservoirs. Geological Society, London,Special Publications, 147, 47–48.
X. ZHANG ET AL.468