theimpactofruralpensionsinchinaonlabormigrationcrm.sem.tsinghua.edu.cn/uploadfiles/file/201511/20151101231403151.… ·...
TRANSCRIPT
The Impact of Rural Pensions in China on Labor Migration
Karen Eggleston∗, Ang Sun†, Zhaoguo Zhan‡
November 1, 2015
Abstract
We study the impact of China’s new rural pension program on promoting migration
of labor. We investigate the impact by applying a regression discontinuity analysis to
this new pension program. The results reveal a perceptible difference in labor migration
among adult children whose parents are just above and below the age of pension eligibility:
The adult children with a parent just attaining the pension-eligible age are more likely
to be labor migrants compared with those with a parent just below the pension-eligible
age. We also find that with a pension-eligible parent, the adult children are more likely to
have off-farm jobs. These abrupt changes in household behavior at the cutoff suggest that
these households are credit constrained. In addition, we find that the pension’s effect on
migration is greater among adult children with a parent in poor health; pension-eligible
elderly report that they are more likely to use inpatient services when needed and less likely
to rely on adult children for care when they are ill. These results suggest that (expectations
regarding) providing care for elderly parents has constrained labor migration from China’s
rural areas to some extent, and that the new rural pension program has helped to relax
this constraint.
JEL classification: H23; H31; H55; I38; J22; O15
Keywords: Pension; Migration; Off-farm employment; Household formation; Intergenera-
tional transfers; China
∗616 Serra St, Encina Hall C323, Stanford University, CA 94305-6055. Email: [email protected].†Corresponding author. Central University of Finance and Economics, Beijing, China, 100081. Email:
[email protected]. Phone: (86)10-62789422.‡School of Economics and Management, Tsinghua University, Beijing, China, 100084. Email:
“While your parents are alive, do not journey afar.”— Confucius
1 Introduction
The social costs of inadequate mobility of rural labor in the developing world, despite the large
wage gap between urban and rural areas, have attracted increasing awareness and scrutiny
among researchers and policymakers. This issue is especially salient in China, where city
dwellers often earn more than three times as much as farmers do (National Bureau of Statistics
of China). At the same time, as China’s population rapidly ages, the factory labor shortage
(Yong Gong Huang) highlighted in recent reports may intensify unless China finds ways to
relax the constraints on full utilization of China’s vast albeit shrinking working-age population
(Meng 2012). To facilitate economic development, it is critical to understand the barriers that
prevent people living in rural areas from migrating to find better jobs. In this paper, we use
regression discontinuity analysis of the novel pension program in rural China to estimate the
effect of the “windfall” income on rural migration. Since households can anticipate pension
receipt, our findings of abrupt changes in labor migration and off-farm employment of adult
children with parent(s) become pension-eligible, suggest that credit constraints are likely to be
one factor preventing individuals from migrating in rural China.
This paper also contributes to our general knowledge about public pension programs in
developing countries. China’s rural pension system is only a few years old and not well studied
yet. In comparison, the old age pension system in South Africa, which rapidly expanded in
the early 1990s, has been extensively scrutinized. The pensions in South Africa were very
generous - twice the median income per capita in rural areas, and therefore were plausibly
expected to play a significant role in household behaviors.1 By contrast, the new rural pension
program in China provides an opportunity to examine the margins of household behavior when
1Researchers find evidence consistent with the hypothesis that pension income also benefits prime-agedadults (promoting migration for some and support within the household for others) as well as the pensioner’sgrandchildren (Ardington, Case and Hosegood 2009).
1
the pension payment is not as generous. The pension is about 10% of the average income in
Laiwu county, Shandong province, where our survey is fielded. Will such pension income have
a perceptible impact on the wellbeing of the elderly or impact household decision-making in
observable ways? If so, which household behaviors are most responsive? The answers to these
questions hold important policy implications as well as general lessons for household theory.2
The pension program in Laiwu, launched in 2007, provides 55 RMB yuan per month to
every resident age 60 or older, with funds supplied by the central, provincial, and county
governments. The age-based eligibility criterion of the pension program allows for a regression
discontinuity design. To evaluate the effect of the pension program, we draw on a detailed
survey targeting rural elderly near the pension-eligible age of 60.3 For each individual between
55 and 70 years old, in addition to basic demographics and socio-economic information, we
asked the respondent detailed questions about the attitudes and plans for support in old age
(anticipated sources of long-term care, living arrangements, and so on). We also asked detailed
questions about each of their children, including migration history, occupational choices, and
living arrangements, regardless of whether the adult child was counted as a household member
or was living under the same roof with the respondent at the time of the survey (July 2012).
Comparing the households with an elderly parent just attaining the pension eligible age
to households with an elderly parent just below the eligible age, our results reveal several
significant patterns. First, even though the pension represents only 10% of average income
and households could anticipate receipt, regression discontinuity analysis reveals a perceptible
difference in household behavior around the age of pension eligibility, suggesting that these
households are likely to be credit constrained. In particular, our results show that after the
2For example, there had been concern that the pension income may not substantially improve outcomesfor pensioners because children would reduce their financial support in lock step with the increase in socialsupport. Our results suggest that adult children do not significantly reduce financial transfers to their elderlyparents when the parents became pension-eligible. Instead, our findings suggest that the new rural pensionincome benefits multiple generations in the household, in the sense that pensioners report better security andmore labor migration among their adult children, a margin of occupational choice that had been previouslyconstrained.
3Data for the study comes from the July 2012 Survey of senior citizens in Laiwu, Shandong, China. Thesurvey was conducted by Xi’an Jiaotong University, China and the Shorenstein Asia-Pacific Research Center,FSI, at Stanford University.
2

older parent receives a pension, the adult children are more likely to be a labor migrant and
take an off-farm job.4 Second, we find that the pension’s effect on migration is greater among
adult children with a parent in poor health. These results are consistent with the previous
findings that migration decisions of adult children are influenced by the well-being of elderly
parents.5 Third, we find that pensioners expect that they will be more likely to use hired
services and slightly less likely to rely on care from an adult child when ill. There is no change
in self-assessed health or health insurance coverage after the pension-eligible age threshold.
These results are consistent with the interpretation that the increase in income relaxes the
household credit constraint, making medical services more affordable and enabling pensioners to
substitute purchased services for instrumental support directly provided by the adult children.
This substitution presumably provides the adult children with greater flexibility to participate
in the nation-wide labor market.
In addition to exploiting the pension program to scrutinize the household credit constraint,
this paper has two key advantages over the prior research evaluating the impact of old-age
pensions. The first advantage lies in our data for studying the effect of a financial windfall on
migration. Prior evidence suggests living arrangements are endogenous and directly affected by
a financial windfall. Therefore, the characteristics of household members in households receiving
a pension may be systematically different from those of non-pension households (Klasen and
Woolard 2000).6 Selective attrition will complicate identifying impacts if a household survey
only includes the intact family, or cannot track individuals who move away from the pensioner’s
residence or those who migrate out of the demographic surveillance area. For example, when
estimating the effect of pensions on adult labor supply in South Africa, researchers found
opposite patterns when the sample only included residents (Bertrand et al. 2003) compared to
4For clarity, we use “elderly” or “older parent” to refer to the older adults in our sample, age 55 to 70, todistinguish them from their adult children (typically in prime work ages of 20-40 and mostly parents themselves).
5Giles and Mu (2007) find a significantly lower probability that a son will work as a migrant when a parentis seriously ill.
6For example, the presence of a pension attracts household members who are significantly less educated, morelikely to be unemployed and to report being sick or injured (Ardington, Case and Hosegood 2009). Moreover,there is evidence of a direct causal effect of pension income on household composition through channels such aslabor specialization within the extended household (Edmonds, Mammen and Millier 2005).
3
when the sample was extended to include non-resident household members (Posel, Fairburn and
Lund 2004) within the demographic surveillance area.7 In this paper, we ask the respondent
detailed questions about each of their children, regardless of whether the child is counted as
a household member or is living under the same roof. Thus we generate data on the work,
migration, and living arrangements of all adult children of pensioners and non-pensioners,
without the complication of sample attrition caused by endogenous household formation.
The second advantage of our study is the regression discontinuity design. Life-cycle patterns
and cohort heterogeneity profoundly shape the migration decisions of household members.
Researchers examining the linkage between pension eligibility and migration have difficulty
separating the effect of pension income from that of age or cohort heterogeneity. In this paper,
we apply regression discontinuity analysis to address this problem. Residents in Laiwu are
eligible for rural pensions beginning at age 60 for both men and women, similar to most other
rural areas of China. A basic pension is available to all residents financed by the collective fund,
and individuals can purchase additional coverage by choosing from a limited menu of options
for contributory pensions. A regression discontinuity design has several advantages over other
methods of identification (Edmonds, Mammen and Miller 2005) and has been applied to many
different settings (e.g. Card, Dobkin and Maestas 2009; Miller, Pinto and Vera-Hernandez
2013).
We recognize that Laiwu is not nationally representative, but we believe this study has
methodological advantages and results that make it of broader interest. In particular, the
novelty of the survey enables us to shed light on intra-household, inter-generational allocation
when facing credit constraints. In addition to our survey data, we also use the nationally
representative China Health and Retirement Longitudinal Study (CHARLS) baseline data to
test the first stage of our fuzzy regression discontinuity design: the impact of age eligibility on
pension receipt. However, since CHARLS only has the information on adult children who co
7Ardington, Case and Hosegood (2009) use panel data with individual fixed effects to partially addressthe issue of different characteristics of individuals living with pensioners and those living without a pensioner,but they admit that they cannot follow changes for individuals who exited the demographic surveillance areabetween the waves of the survey because of migration.
4
reside with the elderly parents, replicating our results in a nationally representative sample is
not feasible.8
The rest of the paper is organized as follows. Section 2 introduces the related literature
and setting of our study. Section 3 describes the data and our identification strategy. Section
4 presents the main results and discusses interpretations. Section 5 examines other outcomes
to compare with prior research (e.g. on the case of South Africa). Section 6 offers concluding
remarks. An appendix develops a conceptual framework about migration and contains other
supplementary results.
2 Credit Constraints and Pensions in Rural China
Low incomes and limited wealth, combined with incomplete credit markets, make it difficult for
households to finance investments even when the returns exceed the costs, and constrain ability
to smooth consumption. Certainly it is clear that the rural elderly represent one of the lowest
income groups in China, with more than one in four falling below the poverty line. According
to the CHARLS baseline study in 2011-12, financial support from children and other household
members plays a key role in reducing consumption poverty: the poverty rate based only on the
income of the rural elderly and their spouses (including pensions) is 65.1%, but falls to 28.9%
when including intra-household transfers and transfers from non-resident adult children, as well
as public transfers and savings (CHARLS Team 2013).
That lack of access to credit further contributes to constraining rural household’s choice sets
is also evident, despite rapid improvement alongside economic growth. Much prior research has
found that Chinese rural households suffer from a lack of access to credit (International Fund
for Agricultural Development 2001; Luo 2004; Dong and Featherstone 2006; Yu 2008).
8Moreover, China’s large regional diversity allows for testing theories of household behavior under differentcircumstances regarding local social norms, labor market conditions, and generosity of the social safety net.Thus localized information can provide insight, highlighting dimensions of heterogeneity that may be less evidentwhen the initial analyses aggregate to the national level. Indeed, the strong statistical significance of locality(such as indicator variables for county or province) has been noted by previous researchers on China’s economicdemography (e.g. Smith et al. 2013).
5
Rural credit markets in China can be separated into formal and informal markets. Formal
credit is mostly used for the financing of agricultural production (Feder et al. 1990). The
formal financial institutions currently serving rural China include the Agricultural Bank of
China, Agricultural Development Bank of China, Rural Credit Cooperatives, and Rural Postal
Savings. Formal financial institutions have strict requirements for rural loans and limited
lending (Dong, Lu and Featherstone 2010).
Informal rural credit can take various forms. Interpersonal lending, which includes loans
extended among friends, relatives, neighbors, or colleagues, is among the most basic strategies
that farmers use to deal with liquidity requirements. The informal rural credit markets are
highly segmented, with participants limited to only those with personal relationships. Moreover,
informal loans are small and short-term. Other forms include lending from moneylenders,
pawnshops, and private money houses, some of which are illegal (Tsai 2004). These forms
require collateral. In our sample, 40.23% of the elderly individuals report 0 savings, suggesting
the limited availability of both formal and informal loans. Although China’s overall savings
rate is extraordinarily high, the older generation largely missed the opportunity to invest and
save except through investing in their children, especially sons who are expected to support
them in their old age.
China is not unique in this regard. Throughout the developing world, having children is
a way to allocate household resources inter-temporally. As Banerjee and Duflo note in Poor
Economics, “for many parents, children are their economic futures: an insurance policy, a
savings product, and some lottery tickets, all rolled into a convenient pint-size package” (p.118).
Both theory and empirical evidence suggest that households often allocate tasks among the
extended family members according to comparative advantage as shaped by social norms, with
some adult children providing financial support to elderly parents while other children mainly
invest their time to assist with the parents’ daily activities and provide care when parents are
sick or in need of long-term care. In this case, the credit constraint of the overall household can
be relaxed by remittances from migrant children. However, small families cannot necessarily use
6
such a strategy. In our sample, 23.4% of the respondents only have one child. Moreover, social
norms still dictate that sons carry more responsibility to provide financial and instrumental
help to parents than daughters do, and over 50% of the respondents we surveyed only have one
son. China’s relatively low fertility, largely attributable to China’s family planning policies that
began during the 1970s and are only recently being relaxed, implies that for a great portion of
households in rural China, including in our sample, it is not feasible to use the remittance of
one child to enable other children to migrate.
Recognizing that China’s demographic change was squeezing families and imperiling the
traditional modes of elderly support - as well as the need for a social protection system to un-
dergird a “harmonious society” and help address burgeoning urban-rural disparities - China’s
leadership introduced the New Rural Pension System (NRPS). Beginning with 320 pilot coun-
ties, NRPS covered 838 counties by the end of 2010, and virtually all of rural China by the
end of 2012.9 The program represents a financial “windfall” for the current elderly - those
who were already, or approaching, 60 years old when the program started. The pension con-
sists of three main parts: an individual premium (ge ren), a local government subsidy (ji ti),
and a central government subsidy (zheng fu). For those who voluntarily enroll, the individual
premium comprises five categories: 100, 200, 300, 400, and 500 RMB per person per year,
with correspondingly increasing benefits that are also supposed to be adjusted according to
the increase in China’s per capita income. The local government subsidy is required to be no
less than 30 RMB per person per year. The central government subsidy, also called the basic
pension, starts at 55 RMB per month per person. Current elderly receive the basic pension
without ever having paid contributions.
Shandong Province implemented the national standard pension policies in virtually all re-
spects. Laiwu County, located in central Shandong province, has income per capita close to the
9In 2009, the State Council of China released “the State Council Guidance Regarding the Development ofNew Rural Pension Pilot” (China [2009] No. 32). Based on a number of pilot studies in selected rural areas,government officials indicated that they expected the scheme to cover (i.e. be available for voluntary enrollment)10% of rural regions by the end of 2009, 50% by 2012, and 100% by 2020. These expectations have been morethan exceeded, at least in terms of coverage by the basic benefit program (not voluntary enrollment).
7
average for China as a whole. 60% of Laiwu’s total population, and 70% of the residents above
age 60, reside in Laiwu’s rural areas. Laiwu began the pilot of NRPS in 2007. The pension
provided 55 RMB yuan per month to every resident age 60 or older, with funds supplied by the
central, provincial, and county governments. In 2012, this pension was raised to 60 RMB yuan
per month. Each district and village can offer additional pension options to their residents
(such as contributory pensions on top of the guaranteed state-financed minimum), according to
local conditions. In our sample, 68.4% of the elderly received only the basic pension - 60 RMB.
For pension recipients, the pension payments constitute 60.2% of their total income, defined as
the sum of labor income and pension income.
Like most rural areas of China, Laiwu has limited options for institutional care; most elderly
reside in their own homes, with or without co-residence of (one or more of) their adult children.
Over the past several years, a few villages have set up community care centers from village
collective funds, providing no-rent dormitory-like housing and cafeteria meals to all elderly
village residents. These changes overlap in time with the roll out of the pension scheme. In this
article, we focus on the effect of the pension financial “windfall” rather than the community
care centers’ impact on living arrangements, for two primary reasons. First, institutionalized
care, even in the modest form of these community care centers, is not well accepted according
to traditional social norms, especially in rural China. In our sample, over 50% of the elderly
believe living with children is the most ideal arrangement. Second, most individuals in our
sample, especially those around the eligibility threshold of 60 years old, still work in the fields
and do not need institutional settings for long-term care.
3 Data and Fuzzy Regression Discontinuity Design
3.1 Data
This study compares the migration status of adult children who have a pension-eligible parent
to the migration status of adult children whose parent(s) are nearly eligible. Data for the study
8
comes from the July 2012 Survey of senior citizens in Laiwu, Shandong, China. Our survey is
among the most recent and detailed available for studying the impact of the new rural pension
system on household decisions. The survey was conducted by Xi’an Jiaotong University, China
and the Shorenstein Asia-Pacific Research Center at Stanford University.
We first categorize all villages into three strati according to GDP per capita in 2010. In
the first stage, within each stratus, 4 villages and 1 community care center are randomly
selected and the village heads are interviewed to assess basic village characteristics and the
implementation of the pension program.10 Village heads also provide a residents’ roster with
basic demographic information of each individual. In the second stage, from each village or
community care center a random sample of residents who fall in the age range from 55 to 70 are
interviewed with detailed questions about household composition, living arrangements, work-
related migration of adult children, and the health and health care utilization of the elderly. In
particular, the correspondents report the demographic information and work-related migration
for each of their children above age 16. Our stratified random sample of 12 villages and 3
community care centers in rural Laiwu includes data on 676 older adults with 1,441 children
and 1,553 grandchildren.
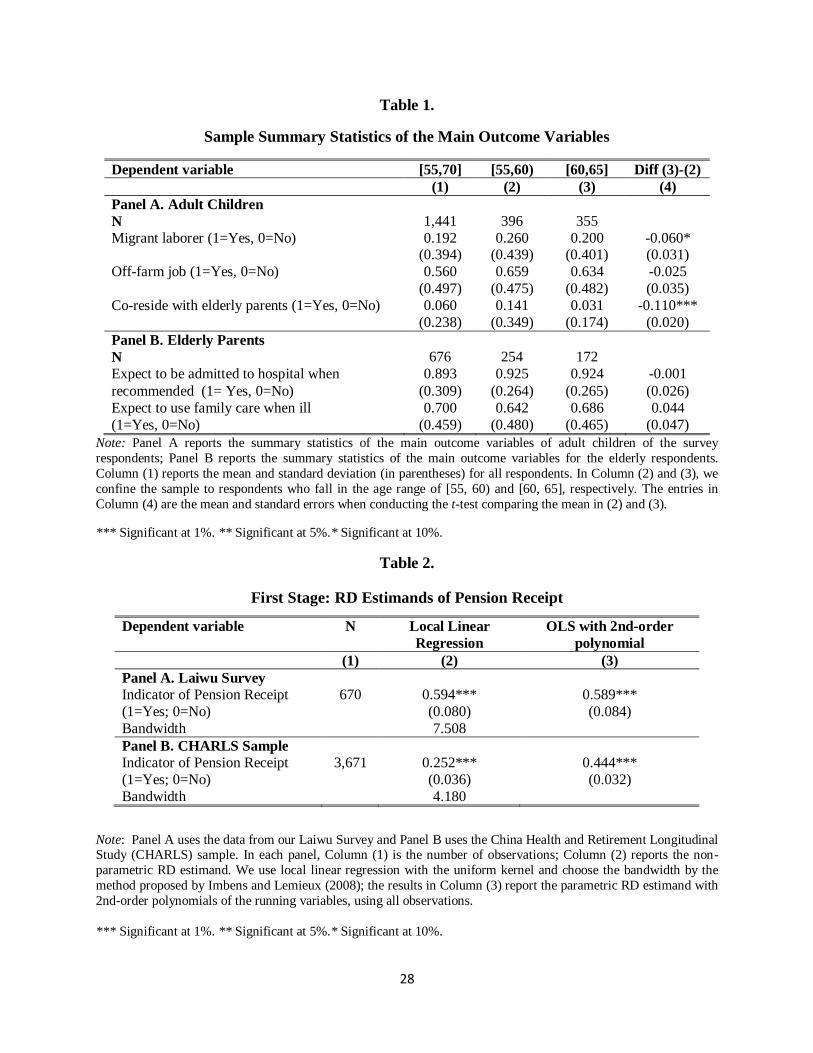
Table 1 presents summary statistics for the outcome measures used in this study. Panels
A and B report the outcomes for adult children and elderly parents, respectively. The first
column reports the mean and standard deviations for the full sample, i.e., households with
respondents age 55 to 70. Columns (2) and (3) report means and standard deviations when
confining the sample to households with a member between ages 55 and 65 – 5 years around
the age cutoff. Column (4) reports the result of a t-test comparing the difference between the
mean of those below and above the pension eligibility threshold. Note that these descriptive
statistics could be different from the true causal effect of pension receipt, because the means
and t-tests capture not only the pension effect, but also any trends regarding aging and cohort
10We over-sampled elderly living in these dormitory-style community care centers (“yanglao yuan”, rarelyproviding comprehensive nursing services). According to the 2005 National Aged Population Survey only 1.2%of China’s rural elderly lived in a nursing home (Chen, Eggleston and Li 2012).
9
heterogeneity. The potential difference underscores the importance of using a rigorous study
design such as regression discontinuity to distinguish the effect of pension income from the life
cycle pattern of extended household formation and other outcomes.
3.2 Fuzzy Regression Discontinuity
Our empirical approach is driven by the age discontinuity in the benefit structure of the social
pension program. Among the elderly in Laiwu, Shandong, social pension eligibility depends
almost exclusively on age - one becomes eligible for the pension at age 60. Thus pension income
does not depend on cumulative work history or the circumstances of the extended family.
To identify the effect of the pension program, we adopt the non-parametric Fuzzy Regression
Discontinuity (FRD) design. This design allows the jump in the probability of assignment to
the treatment at the threshold to be less than 1 (as indicated by Figure 1). In our survey, we
collect information on the implementation of the pension program at the village level. We found
pension receipt is largely determined by age eligibility and the deviations are mostly driven by
the variation in implementation at the village level. Wealthier villages grant pensions earlier,
whereas in the poorest village in our sample, only 35% of the eligible elderly received pension
income.
The validity of the regression discontinuity design crucially depends on the continuity of
the running variable, i.e., age measured in days in our FRD design. In this paper, we adopt
McCrary (2008)’s density test to formally examine whether the density of age is continuous at
the cutoff point 60. The outcome of this test is presented in Appendix Figure A1, and the null
of continuity is not rejected. Graphically, Figure A1 shows that there is no immediate jump
after age 60, so manipulation of age in order to be eligible for a pension is unlikely to exist in
our study.
In this design, the ratio of the jump in the regression of the outcome (denoted by yi in (1))
on age to the jump in the regression of the treatment indicator (denoted by pensioni in (1))
on age is interpreted as an average causal effect of the treatment (Imbens and Lemieux 2008).
10
Formally, the estimand is
τFRD =lima↓60 E(yi|agei = a)− lima↑60 E(yi|agei = a)
lima↓60 E(pensioni|agei = a)− lima↑60 E(pensioni|agei = a)(1)
The identification assumption is that the individuals near pension eligibility (that is, in their
late 50s) and those who just became eligible (in their early 60s) are comparable except for
pension eligibility. Specifically, two conditions must hold. First, the outcome for an individual
depends on resources and characteristics of the household and all of its potential members, and
these (unobserved) characteristics must have “continuous” effects on the outcome variables.
Second, the characteristics of the household and all its potential members should have con-
tinuous distributions around the age threshold. We provide suggestive evidence to show that
the unobservable respondents’ characteristics are likely balanced within a small neighborhood
around the age threshold to the extent that the observable pre-determined covariates do not
show any significant jump at the threshold. Such graphical evidence is shown in Appendix
Figure A2.
We use local linear regression to calculate lima↓60 E(yi|agei = a), lima↑60 E(yi|agei = a),
lima↓60 E(pensioni|agei = a) and lima↑60 E(pensioni|agei = a), respectively. For the implemen-
tation of local linear regression, we choose the bandwidth by the method proposed by Imbens
and Lemieux (2008)11 and use the rectangular kernel.
For each main outcome variable yi, we conduct RD estimation with local linear regression
described above. Both the reduced form estimand lima↓60 E(yi|agei = a)− lima↑60 E(yi|agei =
a), and the FRD estimand are reported, together with the bandwidth values.
To interpret our result, we need to impose the assumption of monotonicity, i.e., older indi-
viduals are more likely to receive a pension than younger ones. Specifically, the effect of interest
is how pension income impacts subsequent household outcomes for “compliers”, defined as in-
dividuals who do not receive a pension if not eligible (below age 60), and do receive a pension
11The optimal bandwidth is chosen by the criteria of minimizing squared bias and variance.
11
if eligible (age 60 or older). Then,
τFRD =lima↓60 E(yi|agei = a)− lima↑60 E(yi|agei = a)
lima↓60 E(pensioni|agei = a)− lima↑60 E(pensioni|agei = a)
= E(yi(1)− yi(0)|individual i is a complier and agei = a) (2)
where yi(1) denotes the outcome when the respondent i is “treated” by the pension pro-
gram (pension receipt = 1) and yi(0) denotes the outcome when the respondent is “not
treated” by the pension program (pension receipt = 0). In addition, we interpret E(yi(1) −
yi(0)|individual i is a complier and agei = a) as the lower bound of the pension program’s
average effect at the threshold age a for the compliers, because more households will respond
to the income windfall given a longer period of time.
To check the sensitivity of the reduced-form non-parametric estimation, we also employ an
alternative parametric method using all observations, by modeling the outcome yi as
yi = α + τ · 1(agei ≥ 60) + β · f(agei − 60) + δ · 1(agei ≥ 60)f(agei − 60) + ǫi (3)
where f(agei − 60) is a polynomial function of the normalized age, agei − 60. To test the
robustness of the non-parametric FRD estimands, we employ the 2SLS estimator τ in (4),
using Zi = 1(agei ≥ 60) as the IV for pensioni.
yi = α + τ · pensioni + β · f(agei − 60) + δ · 1(agei ≥ 60)f(agei − 60) + ǫi (4)
Both the reduced-form estimand τ in equation (3) and the IV estimand τ from (4) are re-
ported.12
During the survey, we asked the respondents about the main outcomes prior to the survey,
when the pension program was not yet launched. As a placebo test, we redo the reduced form
12We report the outcome of OLS and IV based on second order polynomials for consistency, since quantitativecriteria suggest various choices of the order, and produce qualitatively similar results for most of outcomevariables we study.
12
estimations using this pre-program information and show no effect prior to the pension policy.
4 Results and Interpretations
4.1 The First Stage: Pension Receipt
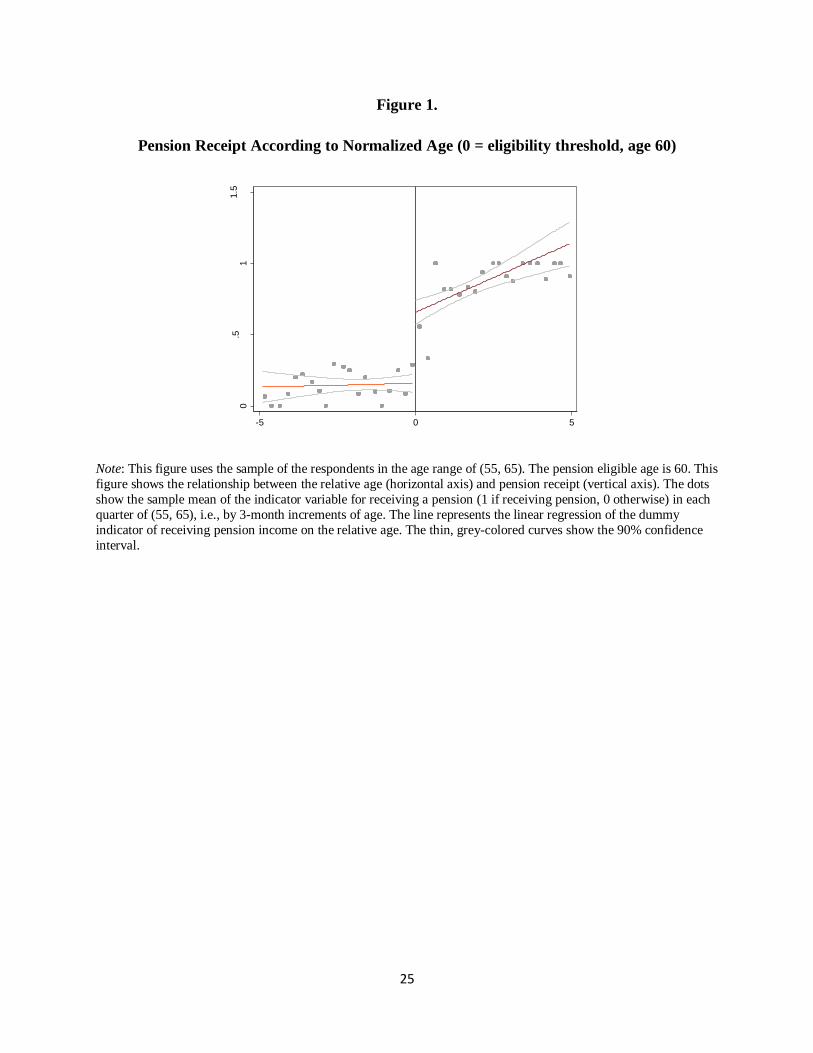
Figure 1 plots the probability that a respondent reports receiving a social pension, according to
the respondent’s normalized age (=0 if age is 60). The 20 dots on each side of the cutoff are the
3-month average of the dummy indicator of receiving a pension. In addition, the figure shows
the regression line and the 90% confidence interval, where y is the dummy indictor of receiving
pension (1 if receiving pension, 0 otherwise). We see a sharp jump of the fitted value of pension
receipt at the age cutoff of 60. Figure 1 shows a strong first stage of our FRD estimation.
Table 2 reports the result of RD estimation. In Panel A, when using our Laiwu county
data, the two estimation methods yield very similar results: at the eligibility cutoff point,
approximately 59.4% of the elderly receive pension payments. This jump is highly significant.
To confirm that our Laiwu data is not misleadingly different from the national situation in
rural China, we show in Panel B that using the nationally representative CHARLS data yields
smaller but equally significant OLS and RD estimands.
To have a better understanding of the first stage, we also examine the discontinuity of living
in community care centers at the eligible age cutoff because together with the pension program,
some villages in Laiwu County also provide subsidized community care centers. Figure A3 does
not reveal a significant jump of the propensity of living in institutions at the pension-eligible
age. Neither non-parametric nor parametric RD regression shows a significant change at the
age cutoff. Therefore, in this paper we focus on the income effect of the pension program.
4.2 Migration and Occupation of Adult Children
In our survey, we asked the respondent about whether each adult child was a migrant worker.
If not, we asked the timing of her last work-related migration if she migrated before. We also
13
solicited information about each adult child’s current job, her last job and the timing of the
last change of jobs. Therefore, we can examine migration status and off-farm employment in
2012 (after the pension program was fully in effect) as the main results, and compare to results
in 2006 (one year before pensions were introduced) as a placebo test.13
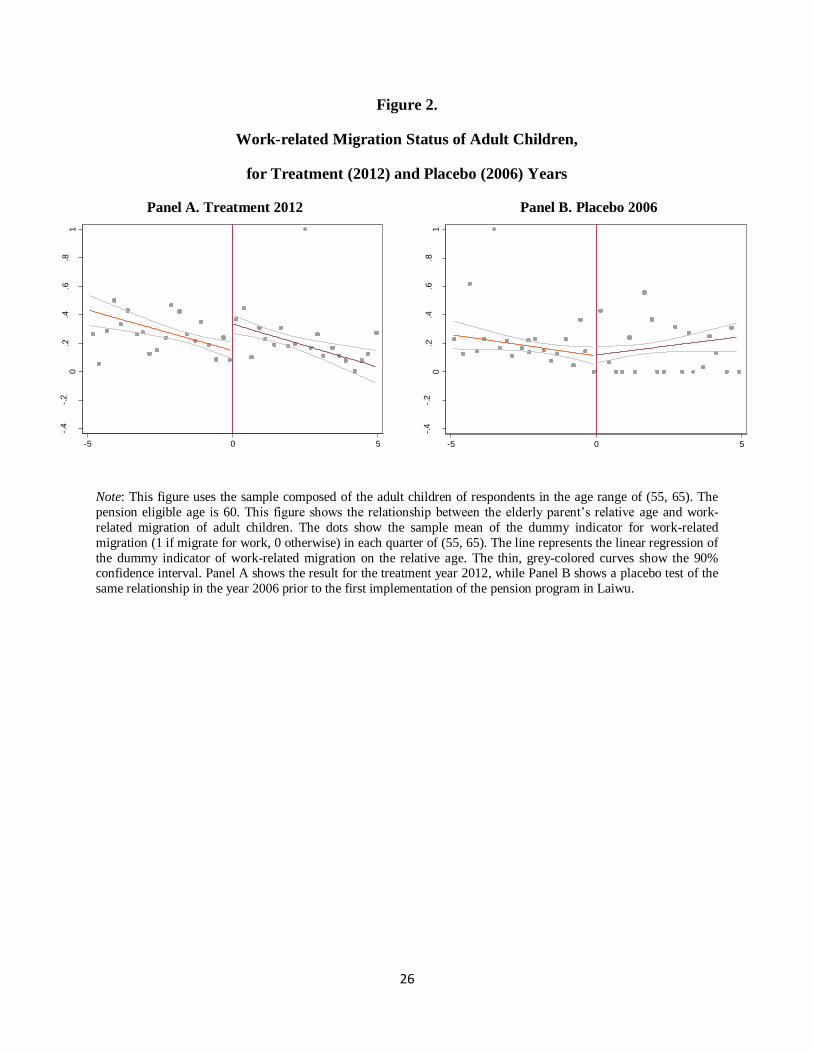
Figure 2 plots fitted values from a linear regression of the dummy indicator for work-related
migration on relative age, as well as the 90% confidence band. Figure 2 Panel A for treatment
in 2012 shows the jump of the dummy indicator for adult children migrating for work at the age
when the elderly parent becomes pension-eligible. By contrast, we do not see the same pattern
in Panel B using the migration information one year before implementation of the pension
program.
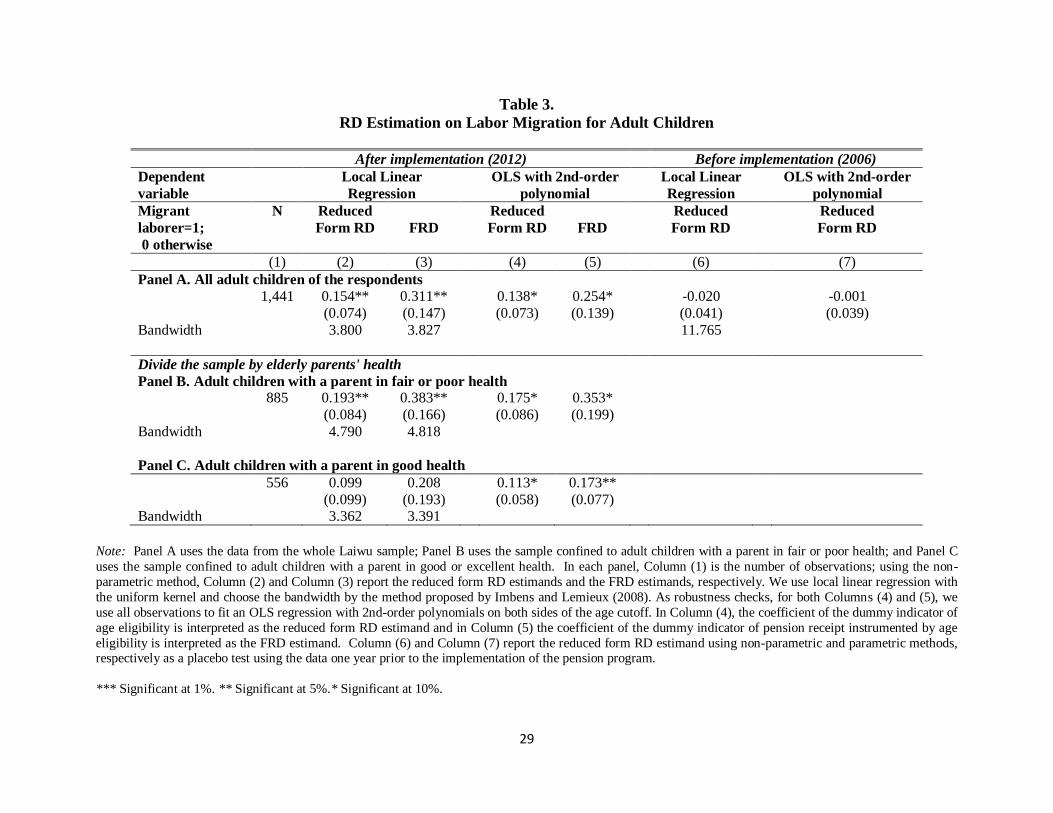
Table 3 Panel A reports the RD estimands using the sample composed of all adult children of
the respondents. Columns (2) and (3) show the non-parametric RD and FRD estimands using
local linear regressions in the post-program period are statistically significant at the 5% level.
Columns (4) and (5) show that the RD and FRD estimands from fitting OLS regressions with
second-order control functions yield similar results. The coefficients of pension eligibility are
significant at the 10% level. The magnitudes of the non-parametric FRD and 2SLS estimands
are 31.1 and 25.4 percentage points, respectively. The large magnitude could be in part because
of our small sample size, which leads to large confidence intervals, but also because the pension,
although modest, constitutes a substantial increase in the income of the elderly. In our sample,
most elderly rely upon support from their adult children. For pension recipients, the pension
payments constitute 60.2% of their total income, defined as the sum of labor income and pension
income.
In Table 3 Columns (6) and (7), we report the non-parametric and parametric reduced-form
RD estimands using migration status in the placebo year, and do not find any discrete change
at the age cutoff, which lends credibility to the linkage between the discrete change and pension
receipt in our benchmark analysis.
13Most of the adult children only changed jobs once during the period between 2006 and 2012.
14
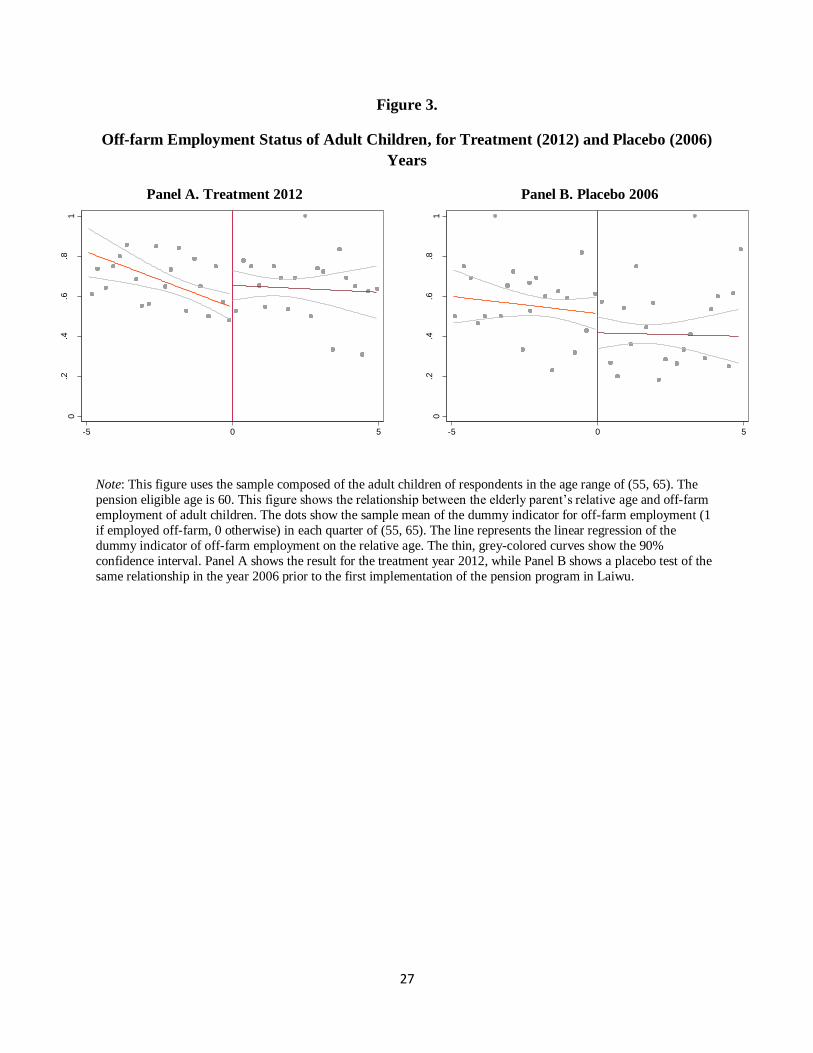
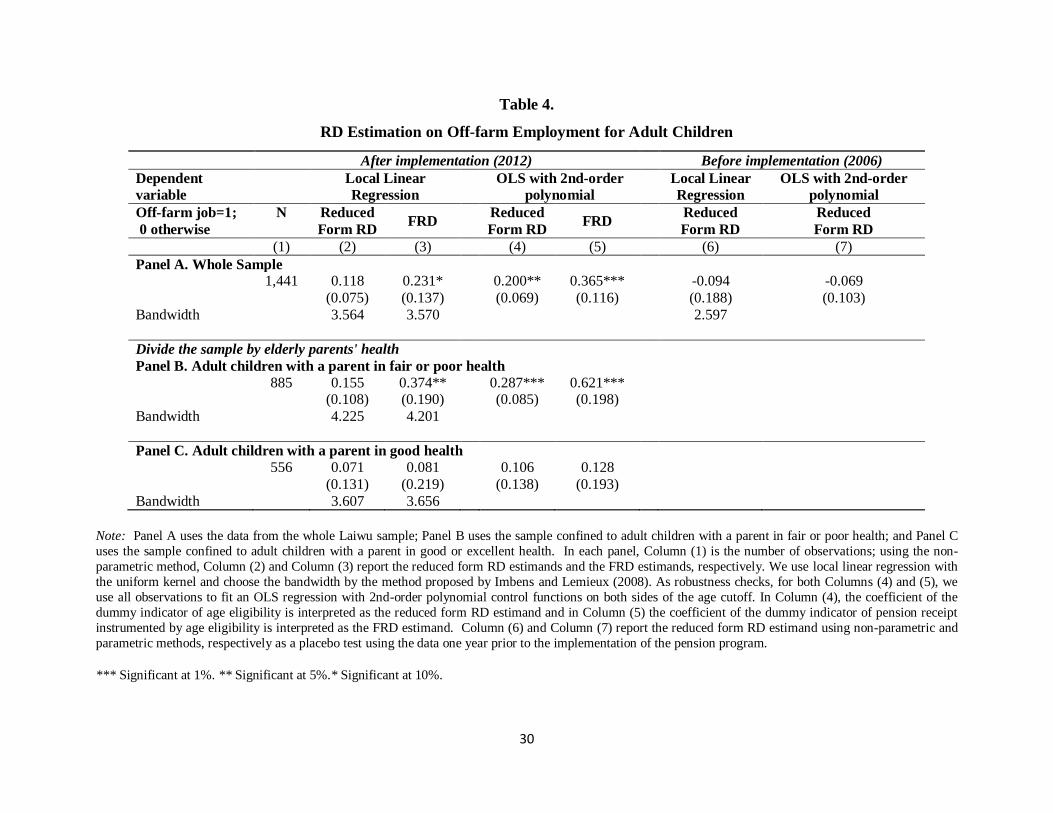
We run similar analyses for the dummy indicator of off-farm employment of adult children.
Figure 3 Panel A shows a slight insignificant increase in the likelihood of off-farm employment,
when bandwidth is 5 years of age. Table 4 Panel A Column (3) shows that the FRD estimand on
the likelihood of off-farm employment increases significantly at the margin of pension eligibility
when bandwidth is confined to around 3.57 years of age. Figure 3 Panel B and Table 4 Panel A
Column (6) and (7) show that the increase in off-farm employment disappears when examining
the placebo before-pension period. It is worthy to note that without the pension program, the
signs of the RD estimands are negative, which is consistent with lower off-farm employment
among older cohorts.
We study heterogeneity in the pension effect to shed light on the mechanism(s) through
which pension income affected household decisions. As discussed in Section 2, similar to other
countries in the developing world, elderly residents in rural China suffer a high risk of poverty
and lack social safety net. In this circumstance, instrumental help from adult children is
essential. In particular, family care provided by adult children is most common when an
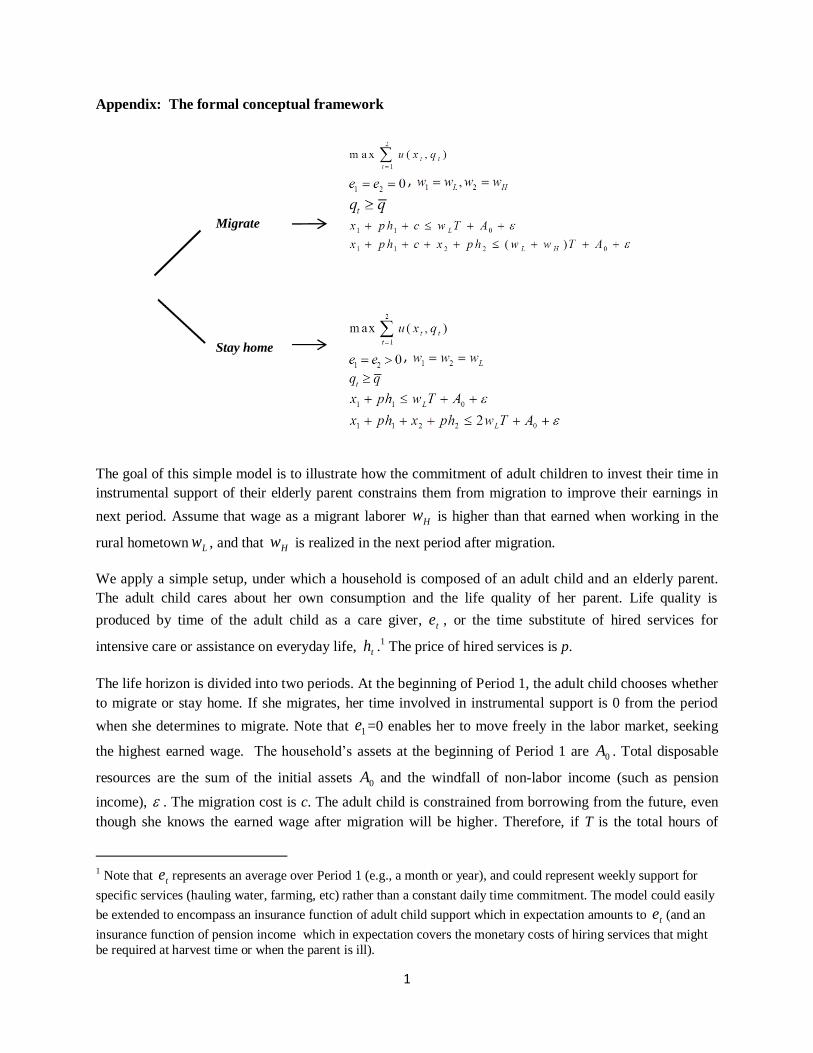
elderly family member falls ill. In the Appendix, we sketch a simple model to illustrate how
the commitment of adult children to invest their time in instrumental support of their elderly
parent constrains them from migration to improve their earnings in the next period. This
framework implies that adult children with parent(s) in poor health are more constrained from
migrating than those with parent(s) in better health (Of course, a parent’s health status is
far from random; for example, richer households are both more likely to have healthy parents
and be free from credit constraints.14). This framework is also consistent with Giles and Mu
(2007)’s empirical findings of a significantly lower probability that a Chinese son will work as
a migrant when a parent is seriously ill.
In this setting, pension income makes medical services more affordable, therefore, enables
pensioners to substitute purchased services for instrumental support directly provided by the
adult children. This substitution presumably provides the adult children with greater flexibility
14If the elderly respondents’ health reflects the extent to which a household is credit constrained, it is stillinteresting to document the heterogeneity of the pension effect.
15

in participation in the nation-wide labor market. Such flexibility matters more for the most
constrained households, i.e., the households with a parent with poor health.
We categorize the sample by respondents’ self-reported health status. We find that the RD
estimands for migration and off-farm employment are consistently of larger magnitude for those
adult children whose parent(s) report fair or poor health (in Panel B of Table 3 and Table 4),
compared to the estimands using the whole sample (in Panel A of Table 3 and Table 4) or the
estimands using the sample composed of households with a parent in good health (in Panel
C of Table 3 and Table 4).15 Conducting RD estimation using an even smaller sample could
limit precision of the estimation, which may partly explain the larger magnitude and confidence
intervals of the RD estimands, but comparison between the results in Panel B and C (both
with smaller subsamples) clearly illustrates that the households with a parent in fair or poor
health are mostly affected by the pension program.
4.3 Respondents’ Expectations on the Form of Care They Will Re-
ceive When Ill
If adult children are constrained from leaving their parents because purchasing substitute in-
strumental support is unaffordable and if such a constraint is relaxed by pension income, then
we should be able to observe the substitution of hired services for instrumental support from
adult children, especially in household plans for intensive care of ill parents.
To test this prediction, we examine respondents’ expectations regarding the kind of care that
they expect to receive if they become ill. We ask the respondents “If you get ill, will your adult
children provide you care?” We draw upon the question “If you get ill and are recommended by
a doctor to be hospitalized, will you stay in hospital?” to shed light on whether more income
boosts the respondents’ expectations of access to non-familial care when ill.16
15For the subsample composed of households with a parent in good health, the magnitude of the jump forboth results are of much smaller magnitude, indicating the statistical insignificance is unlikely to be caused bysmaller sample size.
16Although inpatient medical care (e.g. for a surgical procedure) is different from in-home care by childrenwhen sick (e.g. cooking, preparing an herbal remedy, feeding, bathing), at least in rural China there are reasons
16
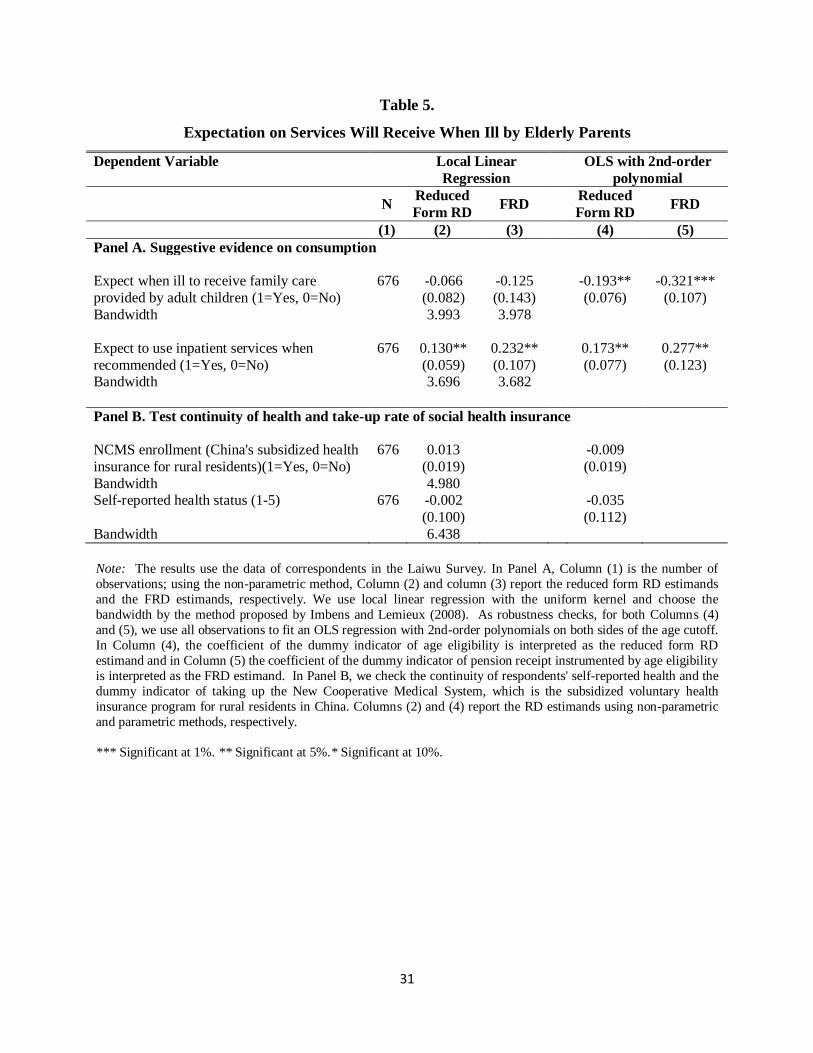
Consistent with this hypothesis, we find that elderly parents have lower expectations of
receiving care provided by children, as shown in Table 5 Panel A, although the non-parametric
estimand for expectation of receiving care from adult children is not significant when bandwidth
is 4 years of age. The OLS estimation with second-order polynomials yields significant negative
RD estimand upon the pension eligible age. The insignificant non-parametric estimand could
be consistent with the roughness of our survey indicator and China’s tradition of filial piety.
Children are regarded as responsible to provide care to parents when sick, and depending on
the severity of illness, adult children are almost inevitably involved in some form of family care.
Thus, the indicator may not be able to capture the change in expected intensity of involvement
of adult children in future family care.
In addition, Table 5 Panel A demonstrates that after they become pension-eligible, respon-
dents report being more likely to use inpatient services when recommended by a doctor. The
results are consistently significant at the 5% level. We address the skepticism that such increase
could be caused by more affordable medical services or worsening of health. Rural residents
of all ages are covered by the subsidized New Cooperative Medical Scheme (NCMS) health
insurance. There is no evidence in our data of different coverage between residents below and
above age 60. Table 5 Panel B shows no discrete change in NCMS enrollment at age 60 in
either the non-parametric or OLS regression. In addition, we examine the health status of
individuals and find no discontinuity of the self-reported health status at age 60, suggesting
that the abrupt change in expectation of using inpatient services is unlikely to be attributable
to sudden worsening of health. The magnitudes of the RD coefficients in Panel B are very
small, indicating that the chance of a discrete change in these variables is very low.
to suspect a degree of substitutability. Even in high-income Japan, there is a large controversy about “socialhospitalization” for elderly with long-term care needs, as manifest by hospital lengths of stay far exceeding mostother OECD countries.
17
5 Other Outcomes
In addition to labor migration, the effect of pensions on other outcomes such as intergenerational
transfers and living arrangements are of economic interest and have been studied in prior
research on South Africa’s pension program (Ardington, Case and Hosegood 2009; Duflo 2003;
Edmonds, Mammen and Miller 2005). To compare the pension program in rural China with
that in South Africa, we provide supplementary results on how these outcomes respond to
pension receipt in our Laiwu data.
5.1 Living Arrangements
The migration of adult children could directly lead to a change in living arrangements, with the
adult children moving away from their natal home either temporarily or permanently. However,
labor-related migration of adult children does not necessarily result in a significantly smaller
family size or lower likelihood of the pensioners living together with their adult children, because
the low proportion of initial co-residence may have been too small to detect much impact on
that margin and because of competing forces changing other margins of living arrangements
upon pension receipt. For example, Edmonds, Mammen and Miller (2005) find that prime
working age women depart, but the presence of children under 5 and young women of child-
bearing age increases. They interpret the finding as suggestive evidence about a setting where
prime age women have a comparative advantage in work away from extended family relative
to younger women. This subsection studies the setting of rural China to explore the effect of
the pension program on extended family living arrangements.
In rural China, extended families have traditionally been composed of parents, their un-
married children, and one or more married sons with wives and children, while daughters leave
their natal family behind and become part of their husbands’ families at the time of marriage
(Lang 1946). For extended families with multiple adult sons, one or more married sons usually
move away from the parents’ house to live independently. Economic factors are major forces
18
determining when adult children leave their parents’ house (Cohen 1992). Therefore, to inves-
tigate potential effect of pension receipt on family living rearrangements, we confine the sample
to adult sons and focus on the outcome of co-residence with elderly parents.
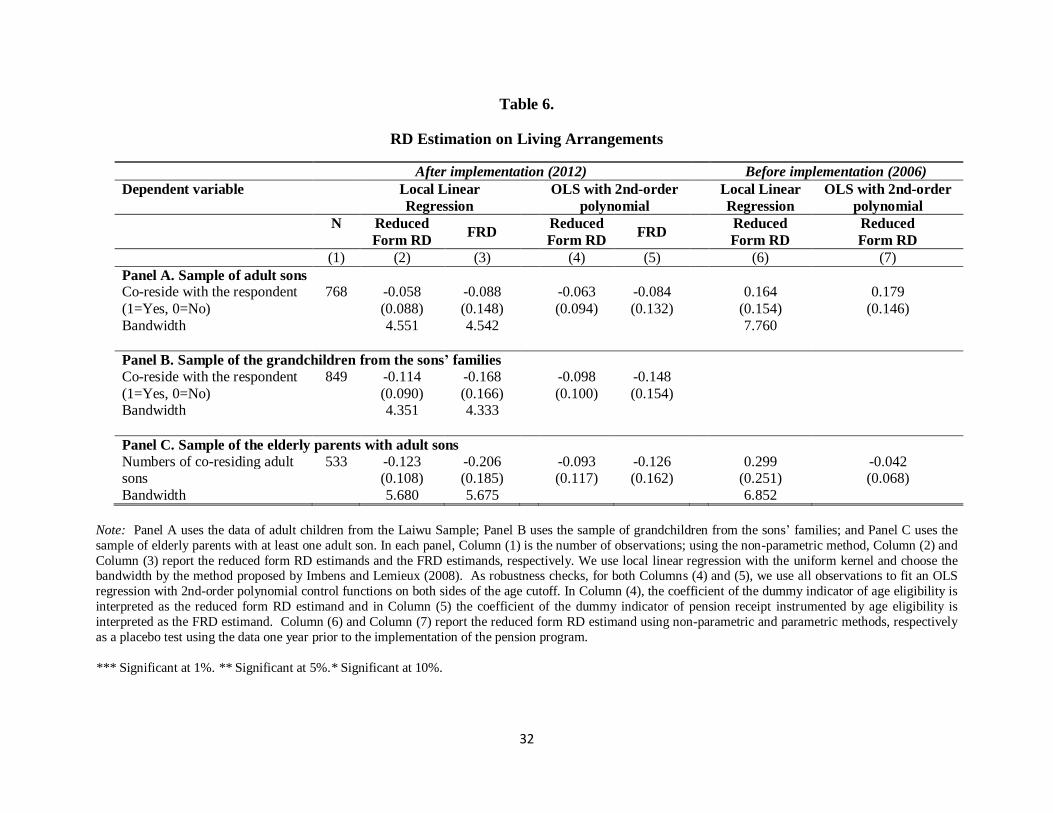
Table 6 reports the results regarding living arrangements. Panel A uses the sample of adult
sons. In the post-program period, for adult sons, although there is no significant effect on
co-residence, the coefficients in Column (2)-(5) are consistently negative. The insignificant es-
timands could partially be because the portion of co-residence in our sample is low on average
and therefore not very responsive to migration. In Table 6 Columns (6) and (7), we document
the living arrangements of adult children in the placebo year 2006.17 Without the implementa-
tion of pension program, the RD coefficient on co-residence is not significant. Moreover, the RD
coefficients are positive, indicating the average likelihood of co-residence is greater among the
older cohorts. This is consistent with the declining time trend of co-residence across generations
in rural China (Peng 2011).
We examine the outcome of co-residence with respondents using the sample of grandchildren
from adult sons’ families. The results are shown in Table 6 Panel B. The coefficients of pension
eligibility in Columns (2)-(5) are consistently negative but not significant. The results show
no evidence of family division or respondents bringing in grandchildren upon pension receipt.
In Table 6 Panel C, we report the results estimating the RD coefficient of family size for
respondents with adult sons (i.e., excluding the childless and those who have only daughters).
The results are similar to those in Panel A: the coefficients of pension eligibility in Panel C
Columns (2)-(5) are consistently negative but not significant, and Columns (6) and (7) show
that the results do not have stable negative signs using the data of 2006. The results in Panels B
and C show no evidence that pension receipt was associated with significant effects on extended
family living arrangements.
17In our survey, we asked the respondents “in what year did the current living arrangement start?” and “withwhom did you live before this change?” For the latter question, the respondents choose from among “livingalone”, “living with spouse”, “living with (other) children”, “living with (other) relatives”, and “living in anursing home”. The respondents are also asked to provide the demographic information of current householdmembers, from which we construct the variables describing current living arrangements.
19
5.2 Intergenerational Transfers
This paper emphasizes the mechanism that pension income enables elderly pensioners to be
less reliant on instrumental support from their adult children, by for example substituting
use of hired or inpatient services. Prior research focuses on other channels behind the effect
of pension income on prime-age household members’ migration, such as using the pension
income to cover migration costs of adult children, or enabling the elderly parents to take care
of grandchildren left behind by their migrating parents. The channel of “staking” the migrant
has been discussed by Ardington, Case and Hosegood (2009) in the case of South Africa.18 Our
simple model discusses the relationship between the two channels. The model is presented in
Appendix.
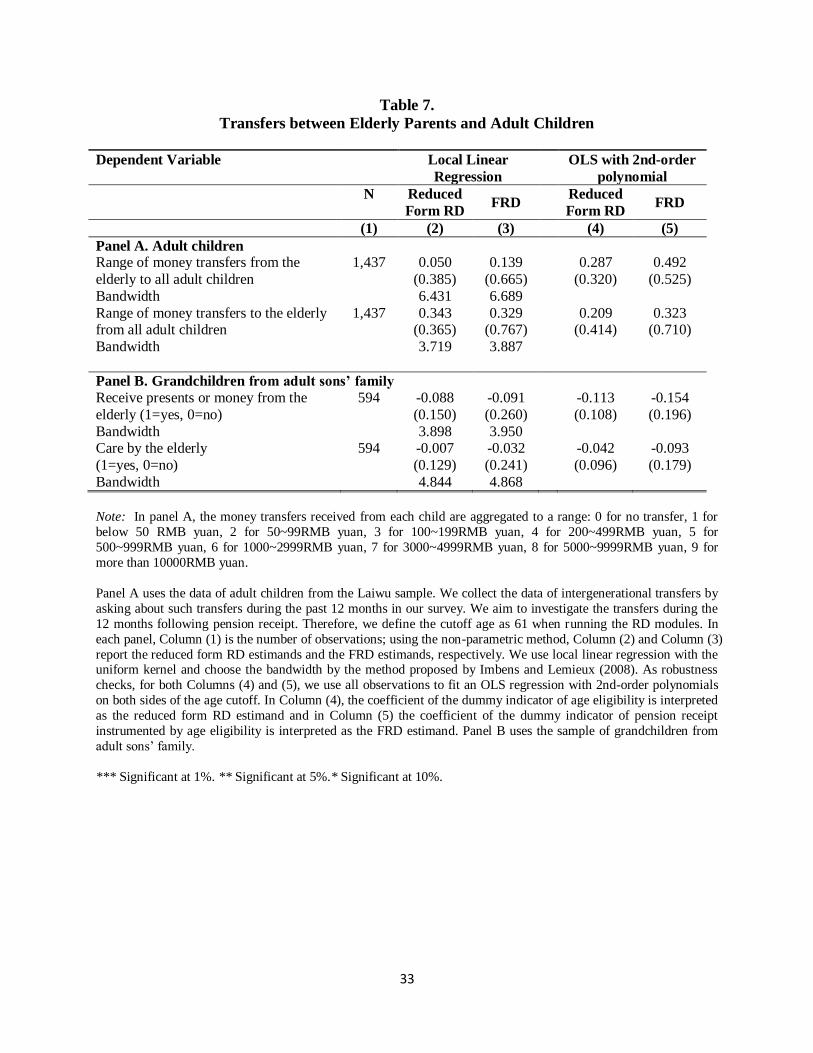
To compare this study with prior research by Ardington, Case and Hosegood (2009) in the
case of South Africa, we examine whether the pension payment impacts intra-household, inter-
generational transfers. Our survey asks parents to recall the value of all monetary transfers
and service exchange between them and their adult children and grandchildren in the previous
12 months. To examine the transfers during the 12-month period after and before pension
eligibility, we redefine the cutoff age as 61. The results are reported in Table 7.
Regarding pecuniary transfers, we find no effects on transfers to the elderly from all adult
children or on transfers in the opposition direction. It is not surprising that respondents do not
transfer more to adult children, given that the pension income only amounts to around 10% of
the average income in the locality. This is also consistent with the interpretation of decreasing
instrumental help from children and the elderly parents spending more money on purchased
services. The lack of effect of a pension on transfers from children to elderly parents has multiple
aspects. On the one hand, the adult children may earn more income after migrating, enabling
them to send remittances to their parents. On the other hand, migration costs could exhaust
the premium wage they earn, at least for the first months or year. The competing forces render
18Note that these mechanisms are consistent with independent living being a normal good (i.e., that an incomewindfall would allow greater privacy to each generation, while still providing companionship and support; seeCosta 1997, 1999 and Salcedo, Schoellman and Tertilt 2012).
20

net transfers to parents undetermined.
To study inter-generational exchange of services (i.e., non-pecuniary transfers), we estimate
the pension effect on a dummy indicator for the respondents providing day-care services to
their grandchildren. The RD coefficient is not significant. On the one hand, upon parental
migration, if a child is left behind, then she is likely to be looked after by grandparents. On
the other hand, the child might migrate to live in a new location with their parents, which
decreases the likelihood of receiving care from grandparents.
In sum, in contrast with the case of South Africa, we do not find significant transfers
between pensioners and other household members. This difference is not surprising, given that
the pension income in rural China is not as sizable as that in South Africa, which leaves the
direction of transfers unclear.
6 Conclusions
Estimating the effect of a novel rural pension program on household outcomes in rural China,
we find significant impact of the windfall income on migration of adult children. The likeli-
hoods of labor-related migration and off-farm employment increased by over twenty percentage
points. The magnitude of the estimated pension effects seems particularly striking. The large
magnitude could be because our sample is small and therefore, confidence intervals are large.
However, the magnitude may not be too surprising in this setting: although the current pension
is modest (only about 10% of average income in Laiwu), it represents a large increase in the
income of the elderly (who often rely upon support from their adult children).
The empirical results are consistent with our hypothesis that the monetary support upon
pension eligibility enables other family members to reduce the time commitment to instrumental
support of aging parents, or at least to defer those commitments to when the elderly parent
might need them more (in their 70s or 80s).19 These findings suggest that a market for in-
19In a somewhat similar way, Antman (2012) finds that adult children substitute for their siblings’ timecontributions with their own financial contributions to support elderly parents.
21
home medical and long-term care services is likely to develop in rural areas alongside the
consolidation and strengthening of the pension program, so that such services will become
increasingly available for purchase. An interesting further question for research is how this
service market develops and who participates as suppliers. Labor migration to fulfill the long-
term care needs of the urban elderly may ironically constrain the availability of labor for
long-term care in rural areas.
Encouragingly, we do not find evidence that adult children significantly reduce transfers to
their elderly parents when the parents became pension-eligible, as some analysts and policymak-
ers had feared might happen. Instead, the public expenditures contribute to multi-generation
improvements, with better security for the elderly and more freedom of occupational choice
and urban migration for the adult children.
Acknowledgement
We thank the editor and three anonymous referees for helpful comments and suggestions. We
gratefully acknowledge the financial support of the Shorenstein Asia-Pacific Research Center,
Freeman Spogli Institute for International Studies, Stanford University; the efforts of the Xi’an
Jiaotong University research team paid to field the survey; the Laiwu respondents for their
willingness to answer our survey questions; and the constructive comments of participants in
the conference on “Economic Aspects of Population Aging in China and India” held at Stanford
in March 2013, especially co-organizer David Bloom and our discussant Alfonso Sousa-Poza.
22
References
Antman, F. M. 2012. Elderly care and intrafamily resource allocation when children migrate.
Journal of Human Resources, 47(2):331–363.
Ardington, C., Case, A., and Hosegood, V. 2009. Labor supply responses to large social
transfers: Longitudinal evidence from South Africa. American Economic Journal: Applied
Economics, 1(1):22–48.
Bertrand, M., Mullainathan, S., and Miller, D. 2003. Public policy and extended families:
evidence from pensions in South Africa. World Bank Economic Review, 17(1):27–50.
Card, D., Dobkin, C., and Maestas, N. 2009. Does medicare save lives? Quarterly Journal of
Economics, 124(2):597–636.
CHARLS Team 2013. Challenges of Population Aging in China: Evidence from the National
Baseline Survey of the China Health and Retirement Longitudinal Study. Available May 2013
at http://charls.ccer.edu.cn/en/articles/103 (accessed 24 September 2013).
Chen, Q., Eggleston, K., and Li, L. 2012. Demographic change, intergenerational transfers,
and the challenges for social protection systems in the Peoples Republic of China. Aging,
Economic Growth, and Old-age Security in Asia.
Cohen, M. L. 1992. Family management and family division in contemporary rural China.
China Quarterly, 130:357–377.
Costa, D. L. 1997. Displacing the family: Union army pensions and elderly living arrangements.
Journal of Political Economy, 105(6):1269–1292.
Costa, D. L. 1999. A house of her own: old age assistance and the living arrangements of older
nonmarried women. Journal of Public Economics, 72(1):39–59.
Dong, F. and Featherstone, A. M. 2006. Technical and scale efficiencies for chinese rural credit
cooperatives: a bootstrapping approach in data envelopment analysis. Journal of Chinese
Economic and Business Studies, 4(1):57–75.
Dong, F., Lu, J., and Featherstone, A. M. 2010. Effects of credit constraints on productivity
and rural household income in China. Center for Agricultural and Rural Development, Iowa
State University.
Duflo, E. 2003. Grandmothers and Granddaughters: Old-Age Pensions and Intrahousehold
Allocation in South Africa. World Bank Economic Review, 17(1):1–25.
Edmonds, E. V., Mammen, K., and Miller, D. L. 2005. Rearranging the family? income support
and elderly living arrangements in a low-income country. Journal of Human Resources,
40(1):186–207.
23
Feder, G., Lau, L. J., Lin, J. Y., and Luo, X. 1990. The relationship between credit and
productivity in chinese agriculture: A microeconomic model of disequilibrium. American
Journal of Agricultural Economics, 72(5):1151–1157.
Giles, J. and Mu, R. 2007. Elderly parent health and the migration decisions of adult children:
Evidence from rural China. Demography, 44(2):265–288.
Imbens, G. W. and Lemieux, T. 2008. Regression discontinuity designs: A guide to practice.
Journal of Econometrics, 142(2):615–635.
International Fund for Agricultural Development 2001. Thematic Study on Rural Financial in
China. Report No. 1147-CN Rev.1. Technical report.
Klasen, S. and Woolard, I. 2000. Unemployment and employment in South Africa, 1995-1997.
Pretoria: Department of Finance. Mimeographed.
Lang, O. 1946. Chinese family and society.
Luo, M. 2004. Rural financial services: the supply and demand situation, issues and strategies.
Rural finance and credit infrastructure in China, page 354.
McCrary, J. 2008. Manipulation of the running variable in the regression discontinuity design:
A density test. Journal of Econometrics, 142(2):698–714.
Meng, X. 2012. Labor market outcomes and reforms in China. Journal of Economic Perspec-
tives, pages 75–101.
Miller, G., Pinto, D., and Vera-Hernandez, M. 2013. Risk protection, service use, and health
outcomes under colombia’s health insurance program for the poor. American Economic
Journal: Applied Economics, 5(4):61–91.
Peng, X. 2011. Chinas demographic history and future challenges. Science, 333(6042):581–587.
Posel, D., Fairburn, J. A., and Lund, F. 2006. Labour migration and households: A recon-
sideration of the effects of the social pension on labour supply in South Africa. Economic
modelling, 23(5):836–853.
Salcedo, A., Schoellman, T., and Tertilt, M. 2012. Families as roommates: Changes in US
household size from 1850 to 2000. Quantitative Economics, 3(1):133–175.
Smith, James P., M. T. Y. Z. 2013. Community Effects on Elderly Health: Evidence from
CHARLS National Baseline. Journal of the Economics of Aging, 1.
Tsai, K. S. 2004. Imperfect substitutes: the local political economy of informal finance and
microfinance in rural China and India. World Development, 32(9):1487–1507.
Yu, C. 2008. Entrepreneurship and credit constraints: evidence from rural households in China.
24
25
Figure 1.
Pension Receipt According to Normalized Age (0 = eligibility threshold, age 60)
Note: This figure uses the sample of the respondents in the age range of (55, 65). The pension eligible age is 60. This
figure shows the relationship between the relative age (horizontal axis) and pension receipt (vertical axis). The dots
show the sample mean of the indicator variable for receiving a pension (1 if receiving pension, 0 otherwise) in each
quarter of (55, 65), i.e., by 3-month increments of age. The line represents the linear regression of the dummy
indicator of receiving pension income on the relative age. The thin, grey-colored curves show the 90% confidence
interval.
0.5
11.5
-5 0 5
26
Figure 2.
Work-related Migration Status of Adult Children,
for Treatment (2012) and Placebo (2006) Years
Panel A. Treatment 2012 Panel B. Placebo 2006
Note: This figure uses the sample composed of the adult children of respondents in the age range of (55, 65). The
pension eligible age is 60. This figure shows the relationship between the elderly parent’s relative age and work-
related migration of adult children. The dots show the sample mean of the dummy indicator for work-related
migration (1 if migrate for work, 0 otherwise) in each quarter of (55, 65). The line represents the linear regression of
the dummy indicator of work-related migration on the relative age. The thin, grey-colored curves show the 90% confidence interval. Panel A shows the result for the treatment year 2012, while Panel B shows a placebo test of the
same relationship in the year 2006 prior to the first implementation of the pension program in Laiwu.
-.4
-.2
0.2
.4.6
.81
-5 0 5
-.4
-.2
0.2
.4.6
.81
-5 0 5
27
Figure 3.
Off-farm Employment Status of Adult Children, for Treatment (2012) and Placebo (2006)
Years
Panel A. Treatment 2012 Panel B. Placebo 2006
Note: This figure uses the sample composed of the adult children of respondents in the age range of (55, 65). The
pension eligible age is 60. This figure shows the relationship between the elderly parent’s relative age and off-farm
employment of adult children. The dots show the sample mean of the dummy indicator for off-farm employment (1
if employed off-farm, 0 otherwise) in each quarter of (55, 65). The line represents the linear regression of the
dummy indicator of off-farm employment on the relative age. The thin, grey-colored curves show the 90%
confidence interval. Panel A shows the result for the treatment year 2012, while Panel B shows a placebo test of the
same relationship in the year 2006 prior to the first implementation of the pension program in Laiwu.
0.2
.4.6
.81
-5 0 50
.2.4
.6.8
1-5 0 5
28
Table 1.
Sample Summary Statistics of the Main Outcome Variables
Dependent variable [55,70] [55,60) [60,65] Diff (3)-(2)
(1) (2) (3) (4)
Panel A. Adult Children
N 1,441 396 355
Migrant laborer (1=Yes, 0=No) 0.192 0.260 0.200 -0.060* (0.394) (0.439) (0.401) (0.031)
Off-farm job (1=Yes, 0=No) 0.560 0.659 0.634 -0.025
(0.497) (0.475) (0.482) (0.035)
Co-reside with elderly parents (1=Yes, 0=No) 0.060 0.141 0.031 -0.110***
(0.238) (0.349) (0.174) (0.020)
Panel B. Elderly Parents
N 676 254 172
Expect to be admitted to hospital when 0.893 0.925 0.924 -0.001
recommended (1= Yes, 0=No) (0.309) (0.264) (0.265) (0.026)
Expect to use family care when ill 0.700 0.642 0.686 0.044
(1=Yes, 0=No) (0.459) (0.480) (0.465) (0.047)
Note: Panel A reports the summary statistics of the main outcome variables of adult children of the survey
respondents; Panel B reports the summary statistics of the main outcome variables for the elderly respondents.
Column (1) reports the mean and standard deviation (in parentheses) for all respondents. In Column (2) and (3), we
confine the sample to respondents who fall in the age range of [55, 60) and [60, 65], respectively. The entries in
Column (4) are the mean and standard errors when conducting the t-test comparing the mean in (2) and (3).
*** Significant at 1%. ** Significant at 5%.* Significant at 10%.
Table 2.
First Stage: RD Estimands of Pension Receipt
Dependent variable N Local Linear
Regression
OLS with 2nd-order
polynomial
(1) (2) (3)
Panel A. Laiwu Survey
Indicator of Pension Receipt 670 0.594*** 0.589***
(1=Yes; 0=No) (0.080) (0.084)
Bandwidth 7.508
Panel B. CHARLS Sample Indicator of Pension Receipt 3,671 0.252*** 0.444***
(1=Yes; 0=No) (0.036) (0.032)
Bandwidth 4.180
Note: Panel A uses the data from our Laiwu Survey and Panel B uses the China Health and Retirement Longitudinal Study (CHARLS) sample. In each panel, Column (1) is the number of observations; Column (2) reports the non-
parametric RD estimand. We use local linear regression with the uniform kernel and choose the bandwidth by the
method proposed by Imbens and Lemieux (2008); the results in Column (3) report the parametric RD estimand with
2nd-order polynomials of the running variables, using all observations.
*** Significant at 1%. ** Significant at 5%.* Significant at 10%.
29
Table 3.
RD Estimation on Labor Migration for Adult Children
Note: Panel A uses the data from the whole Laiwu sample; Panel B uses the sample confined to adult children with a parent in fair or poor health; and Panel C
uses the sample confined to adult children with a parent in good or excellent health. In each panel, Column (1) is the number of observations; using the non-
parametric method, Column (2) and Column (3) report the reduced form RD estimands and the FRD estimands, respectively. We use local linear regression with
the uniform kernel and choose the bandwidth by the method proposed by Imbens and Lemieux (2008). As robustness checks, for both Columns (4) and (5), we
use all observations to fit an OLS regression with 2nd-order polynomials on both sides of the age cutoff. In Column (4), the coefficient of the dummy indicator of
age eligibility is interpreted as the reduced form RD estimand and in Column (5) the coefficient of the dummy indicator of pension receipt instrumented by age
eligibility is interpreted as the FRD estimand. Column (6) and Column (7) report the reduced form RD estimand using non-parametric and parametric methods, respectively as a placebo test using the data one year prior to the implementation of the pension program.
*** Significant at 1%. ** Significant at 5%.* Significant at 10%.
After implementation (2012) Before implementation (2006)
Dependent
variable
Local Linear
Regression
OLS with 2nd-order
polynomial
Local Linear
Regression
OLS with 2nd-order
polynomial
Migrant
laborer=1;
0 otherwise
N Reduced
Form RD FRD
Reduced
Form RD FRD
Reduced
Form RD
Reduced
Form RD
(1) (2) (3) (4) (5) (6) (7)
Panel A. All adult children of the respondents
1,441 0.154** 0.311** 0.138* 0.254* -0.020 -0.001
(0.074) (0.147) (0.073) (0.139) (0.041) (0.039)
Bandwidth 3.800 3.827 11.765
Divide the sample by elderly parents' health
Panel B. Adult children with a parent in fair or poor health 885 0.193** 0.383** 0.175* 0.353*
(0.084) (0.166) (0.086) (0.199)
Bandwidth 4.790 4.818
Panel C. Adult children with a parent in good health
556 0.099 0.208 0.113* 0.173**
(0.099) (0.193) (0.058) (0.077) Bandwidth 3.362 3.391
30
Table 4.
RD Estimation on Off-farm Employment for Adult Children
Note: Panel A uses the data from the whole Laiwu sample; Panel B uses the sample confined to adult children with a parent in fair or poor health; and Panel C
uses the sample confined to adult children with a parent in good or excellent health. In each panel, Column (1) is the number of observations; using the non-
parametric method, Column (2) and Column (3) report the reduced form RD estimands and the FRD estimands, respectively. We use local linear regression with
the uniform kernel and choose the bandwidth by the method proposed by Imbens and Lemieux (2008). As robustness checks, for both Columns (4) and (5), we
use all observations to fit an OLS regression with 2nd-order polynomial control functions on both sides of the age cutoff. In Column (4), the coefficient of the
dummy indicator of age eligibility is interpreted as the reduced form RD estimand and in Column (5) the coefficient of the dummy indicator of pension receipt
instrumented by age eligibility is interpreted as the FRD estimand. Column (6) and Column (7) report the reduced form RD estimand using non-parametric and
parametric methods, respectively as a placebo test using the data one year prior to the implementation of the pension program.
*** Significant at 1%. ** Significant at 5%.* Significant at 10%.
After implementation (2012) Before implementation (2006)
Dependent
variable
Local Linear
Regression
OLS with 2nd-order
polynomial
Local Linear
Regression
OLS with 2nd-order
polynomial
Off-farm job=1;
0 otherwise
N Reduced
Form RD FRD
Reduced
Form RD FRD
Reduced
Form RD
Reduced
Form RD
(1) (2) (3) (4) (5) (6) (7)
Panel A. Whole Sample 1,441 0.118
(0.075)
0.231*
(0.137)
0.200**
(0.069)
0.365***
(0.116)
-0.094
(0.188)
-0.069
(0.103)
Bandwidth 3.564 3.570 2.597
Divide the sample by elderly parents' health
Panel B. Adult children with a parent in fair or poor health 885 0.155 0.374** 0.287*** 0.621*** (0.108) (0.190) (0.085) (0.198)
Bandwidth 4.225 4.201
Panel C. Adult children with a parent in good health 556 0.071 0.081 0.106 0.128
(0.131) (0.219) (0.138) (0.193)
Bandwidth 3.607 3.656
31
Table 5.
Expectation on Services Will Receive When Ill by Elderly Parents
Note: The results use the data of correspondents in the Laiwu Survey. In Panel A, Column (1) is the number of
observations; using the non-parametric method, Column (2) and column (3) report the reduced form RD estimands
and the FRD estimands, respectively. We use local linear regression with the uniform kernel and choose the
bandwidth by the method proposed by Imbens and Lemieux (2008). As robustness checks, for both Columns (4)
and (5), we use all observations to fit an OLS regression with 2nd-order polynomials on both sides of the age cutoff.
In Column (4), the coefficient of the dummy indicator of age eligibility is interpreted as the reduced form RD
estimand and in Column (5) the coefficient of the dummy indicator of pension receipt instrumented by age eligibility
is interpreted as the FRD estimand. In Panel B, we check the continuity of respondents' self-reported health and the
dummy indicator of taking up the New Cooperative Medical System, which is the subsidized voluntary health
insurance program for rural residents in China. Columns (2) and (4) report the RD estimands using non-parametric
and parametric methods, respectively.
*** Significant at 1%. ** Significant at 5%.* Significant at 10%.
Dependent Variable Local Linear
Regression
OLS with 2nd-order
polynomial
N
Reduced
Form RD FRD
Reduced
Form RD FRD
(1) (2) (3) (4) (5)
Panel A. Suggestive evidence on consumption
Expect when ill to receive family care
provided by adult children (1=Yes, 0=No)
676 -0.066
(0.082)
-0.125
(0.143)
-0.193**
(0.076)
-0.321***
(0.107)
Bandwidth 3.993 3.978
Expect to use inpatient services when
recommended (1=Yes, 0=No)
676 0.130**
(0.059)
0.232**
(0.107)
0.173**
(0.077)
0.277**
(0.123) Bandwidth 3.696 3.682
Panel B. Test continuity of health and take-up rate of social health insurance
NCMS enrollment (China's subsidized health
insurance for rural residents)(1=Yes, 0=No)
676 0.013
(0.019)
-0.009
(0.019)
Bandwidth 4.980 Self-reported health status (1-5) 676 -0.002
(0.100)
-0.035
(0.112)
Bandwidth 6.438
32
Table 6.
RD Estimation on Living Arrangements
After implementation (2012) Before implementation (2006)
Dependent variable Local Linear
Regression
OLS with 2nd-order
polynomial
Local Linear
Regression
OLS with 2nd-order
polynomial
N Reduced
Form RD FRD
Reduced
Form RD FRD
Reduced
Form RD
Reduced
Form RD
(1) (2) (3) (4) (5) (6) (7)
Panel A. Sample of adult sons Co-reside with the respondent 768 -0.058 -0.088 -0.063 -0.084 0.164 0.179
(1=Yes, 0=No) (0.088) (0.148) (0.094) (0.132) (0.154) (0.146)
Bandwidth 4.551 4.542 7.760
Panel B. Sample of the grandchildren from the sons’ families Co-reside with the respondent 849 -0.114 -0.168 -0.098 -0.148
(1=Yes, 0=No) (0.090) (0.166) (0.100) (0.154) Bandwidth 4.351 4.333
Panel C. Sample of the elderly parents with adult sons Numbers of co-residing adult 533 -0.123 -0.206 -0.093 -0.126 0.299 -0.042 sons (0.108) (0.185) (0.117) (0.162) (0.251) (0.068)
Bandwidth 5.680 5.675 6.852
Note: Panel A uses the data of adult children from the Laiwu Sample; Panel B uses the sample of grandchildren from the sons’ families; and Panel C uses the
sample of elderly parents with at least one adult son. In each panel, Column (1) is the number of observations; using the non-parametric method, Column (2) and
Column (3) report the reduced form RD estimands and the FRD estimands, respectively. We use local linear regression with the uniform kernel and choose the bandwidth by the method proposed by Imbens and Lemieux (2008). As robustness checks, for both Columns (4) and (5), we use all observations to fit an OLS
regression with 2nd-order polynomial control functions on both sides of the age cutoff. In Column (4), the coefficient of the dummy indicator of age eligibility is
interpreted as the reduced form RD estimand and in Column (5) the coefficient of the dummy indicator of pension receipt instrumented by age eligibility is
interpreted as the FRD estimand. Column (6) and Column (7) report the reduced form RD estimand using non-parametric and parametric methods, respectively
as a placebo test using the data one year prior to the implementation of the pension program.
*** Significant at 1%. ** Significant at 5%.* Significant at 10%.
33
Table 7.
Transfers between Elderly Parents and Adult Children
Dependent Variable Local Linear
Regression
OLS with 2nd-order
polynomial
N Reduced
Form RD FRD
Reduced
Form RD FRD
(1) (2) (3) (4) (5)
Panel A. Adult children Range of money transfers from the
elderly to all adult children
1,437 0.050
(0.385)
0.139
(0.665)
0.287
(0.320)
0.492
(0.525)
Bandwidth 6.431 6.689
Range of money transfers to the elderly from all adult children
1,437 0.343 (0.365)
0.329 (0.767)
0.209 (0.414)
0.323 (0.710)
Bandwidth 3.719 3.887
Panel B. Grandchildren from adult sons’ family Receive presents or money from the
elderly (1=yes, 0=no)
594 -0.088
(0.150)
-0.091
(0.260)
-0.113
(0.108)
-0.154
(0.196)
Bandwidth 3.898 3.950 Care by the elderly
(1=yes, 0=no)
594 -0.007
(0.129)
-0.032
(0.241)
-0.042
(0.096)
-0.093
(0.179)
Bandwidth 4.844 4.868
Note: In panel A, the money transfers received from each child are aggregated to a range: 0 for no transfer, 1 for
below 50 RMB yuan, 2 for 50~99RMB yuan, 3 for 100~199RMB yuan, 4 for 200~499RMB yuan, 5 for
500~999RMB yuan, 6 for 1000~2999RMB yuan, 7 for 3000~4999RMB yuan, 8 for 5000~9999RMB yuan, 9 for
more than 10000RMB yuan.
Panel A uses the data of adult children from the Laiwu sample. We collect the data of intergenerational transfers by
asking about such transfers during the past 12 months in our survey. We aim to investigate the transfers during the
12 months following pension receipt. Therefore, we define the cutoff age as 61 when running the RD modules. In
each panel, Column (1) is the number of observations; using the non-parametric method, Column (2) and Column (3)
report the reduced form RD estimands and the FRD estimands, respectively. We use local linear regression with the uniform kernel and choose the bandwidth by the method proposed by Imbens and Lemieux (2008). As robustness
checks, for both Columns (4) and (5), we use all observations to fit an OLS regression with 2nd-order polynomials
on both sides of the age cutoff. In Column (4), the coefficient of the dummy indicator of age eligibility is interpreted
as the reduced form RD estimand and in Column (5) the coefficient of the dummy indicator of pension receipt
instrumented by age eligibility is interpreted as the FRD estimand. Panel B uses the sample of grandchildren from
adult sons’ family.
*** Significant at 1%. ** Significant at 5%.* Significant at 10%.
1
Appendix: The formal conceptual framework
The goal of this simple model is to illustrate how the commitment of adult children to invest their time in
instrumental support of their elderly parent constrains them from migration to improve their earnings in
next period. Assume that wage as a migrant laborer Hw is higher than that earned when working in the
rural hometown Lw , and that Hw is realized in the next period after migration.
We apply a simple setup, under which a household is composed of an adult child and an elderly parent.
The adult child cares about her own consumption and the life quality of her parent. Life quality is
produced by time of the adult child as a care giver, te , or the time substitute of hired services for
intensive care or assistance on everyday life, th .1 The price of hired services is p.
The life horizon is divided into two periods. At the beginning of Period 1, the adult child chooses whether
to migrate or stay home. If she migrates, her time involved in instrumental support is 0 from the period
when she determines to migrate. Note that 1e =0 enables her to move freely in the labor market, seeking
the highest earned wage. The household’s assets at the beginning of Period 1 are 0A . Total disposable
resources are the sum of the initial assets 0A and the windfall of non-labor income (such as pension
income), . The migration cost is c. The adult child is constrained from borrowing from the future, even
though she knows the earned wage after migration will be higher. Therefore, if T is the total hours of
1 Note that te represents an average over Period 1 (e.g., a month or year), and could represent weekly support for
specific services (hauling water, farming, etc) rather than a constant daily time commitment. The model could easily
be extended to encompass an insurance function of adult child support which in expectation amounts to te (and an
insurance function of pension income which in expectation covers the monetary costs of hiring services that might
be required at harvest time or when the parent is ill).
Migrate
Stay home
,
,
2
wage labor, her expenditure in Period 1 cannot exceed 0ATwL , and her total expenditure in both
periods cannot exceed 0)( ATww HL .
There is a minimum life quality for the adult parent, suggesting that the adult child cannot compress q too
much in Period 1 in order to migrate.
Denote the utility when migrating as MV , and the utility when staying home as HV . The adult child will
want to migrate if .HM VV However, she will be constrained from migrating if she cannot borrow from
the future to substitute hired services for her own labor as a care giver, and she cannot compress her
parent’s living standard below q in Period 1.
In this illustrative model, to get a simple closed form, we assume the utility function has the form2
ttt qxu , and the production function of tq is )( 2/1
0 ttt heqq , where 0q captures heterogeneity
in the elderly parent’s health endowment.2
First, we find the maxim of intertemporal utility if the adult child decides to migrate at the beginning of
Period 1. If she is credit constrained, we know that her disposable resources in Period 1 are less than her
migration-improved income in Period 2:
TwTwcA LH0
The constraint to maintain minimum life quality for the elderly parent does not bind in Period 1 if
TwqqpcA L
2
00 )/(2 .
When the minimum life quality constraint binds in Period 1, hired services to meet that requirement are
affordable when
TwqqpcA L
2
00 .
Therefore, the maxim of utility if migrating is 0 0, , , ,M H LV A w w q q , which equals
2 22 2 2
0 0 0 0 0
22 2 2 2 2
0 0 0 0 0 0
4 4 2 ( / )
( / ) 4 ( / ) 2 ( / )
L H L H L
L H L L
q p w T A c q p w T if c p q q w T A c w w T
q w T A c p q q q p w T c p q q w T A c p q q wi Tf
Similarly, the maxim of utility if staying home is
32 2 2
0 0 0 0
0 02 2
0 0 0 0
216 4 2 3 2 2, , ,
2 4 3 2 2
L L L L L
H L
L L L L L
q w w T A w p A w q q T w pV A w q q
w T A w p w q q q if A w q q T p
f
w
i
It is straightforward to show that when the wage gap is big enough, HM VV for all households that can
afford to move. Put differently, denote the asset level Twqqpc L
2
0 as *A ; when the wage gap
2 We abstract from any correlation between the parent and the child’s health and human capital endowments, and their initial assets. Lower initial assets among those in poorer health would tighten the migration constraint on the
poorer households (albeit not necessarily increasing the utility loss from constrained non-migration if the adult
children also have lower human capital endowments and would therefore earn a lower migrant wage than their
healthier, better-educated counterparts). Empirically, we do find that migrants in our sample are better educated than
adult children who do not migrate for work.
3
is large, all households that can afford to migrate ( *0 AA ) would do so and those with very low initial
assets ( *0 AA ) are “trapped” in their hometown taking care of their parents.
The pension income 0 of the elderly parent increases 0A and therefore helps the household on the
margin switch from staying home to migration. At the same time, 1e changes from positive to zero, and
1h increases because the minimum quality constraint binds both before and after the shock on asset level,
and life quality for the elderly parent is now exclusively produced by purchased care.
Given the initial distribution of household assets, those with higher 0q are less likely to be constrained
from migrating. This is evident because a smaller initial level of assets is required to meet the minimum
life quality constraint for a healthier parent: .0* 0 qA
This simple model also demonstrates the relationship between this research and that by Ardington, Case
and Hosegood (2009), who focuses on the migration cost of the adult child, c. It is easy to see that when
0 , the constraint *0 AA is relaxed (both to finance migrations costs and to support the elderly
parents life quality). In our paper, we analyze the data about inter-generational monetary transfers and do
not find evidence that in rural China the elderly parents make transfers to support adult children on their
migration. Instead, our evidence points to the mechanism highlighted in this model: that the pension
income enables the adult children to be exempted from providing instrumental support to their parents
and to search for a better job away from their home town.
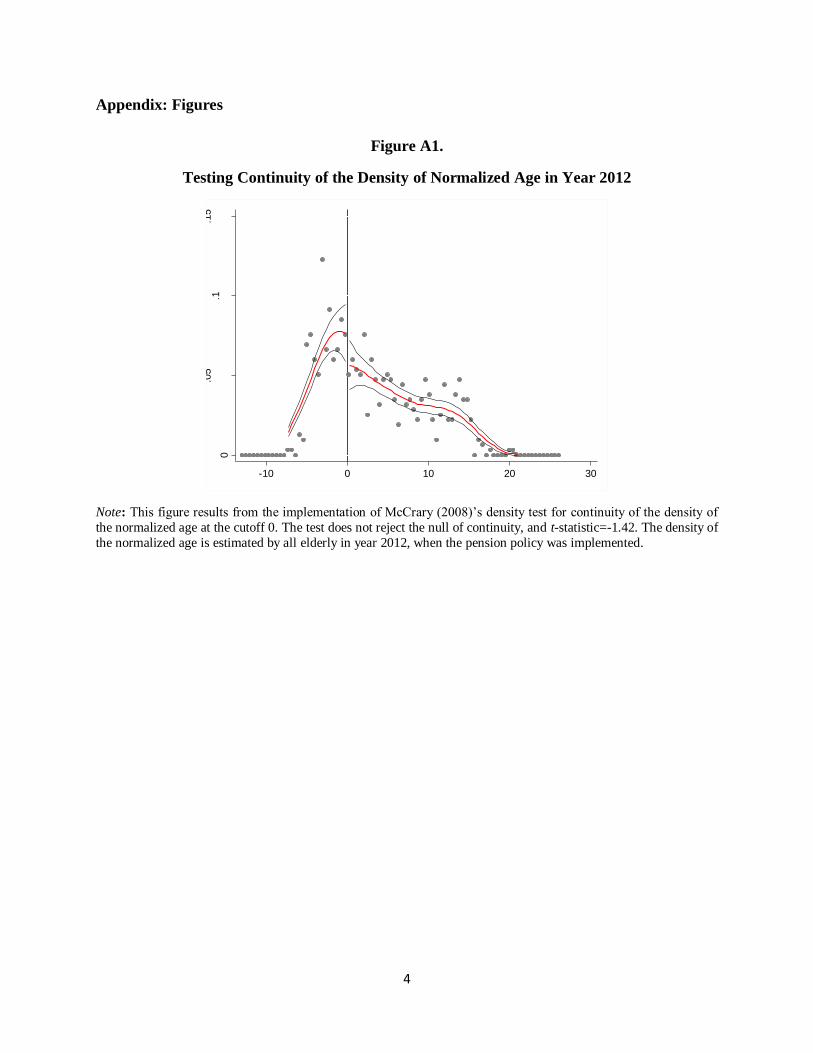
4
Appendix: Figures
Figure A1.
Testing Continuity of the Density of Normalized Age in Year 2012
Note: This figure results from the implementation of McCrary (2008)’s density test for continuity of the density of
the normalized age at the cutoff 0. The test does not reject the null of continuity, and t-statistic=-1.42. The density of
the normalized age is estimated by all elderly in year 2012, when the pension policy was implemented.
0
.05
.1.1
5
-10 0 10 20 30
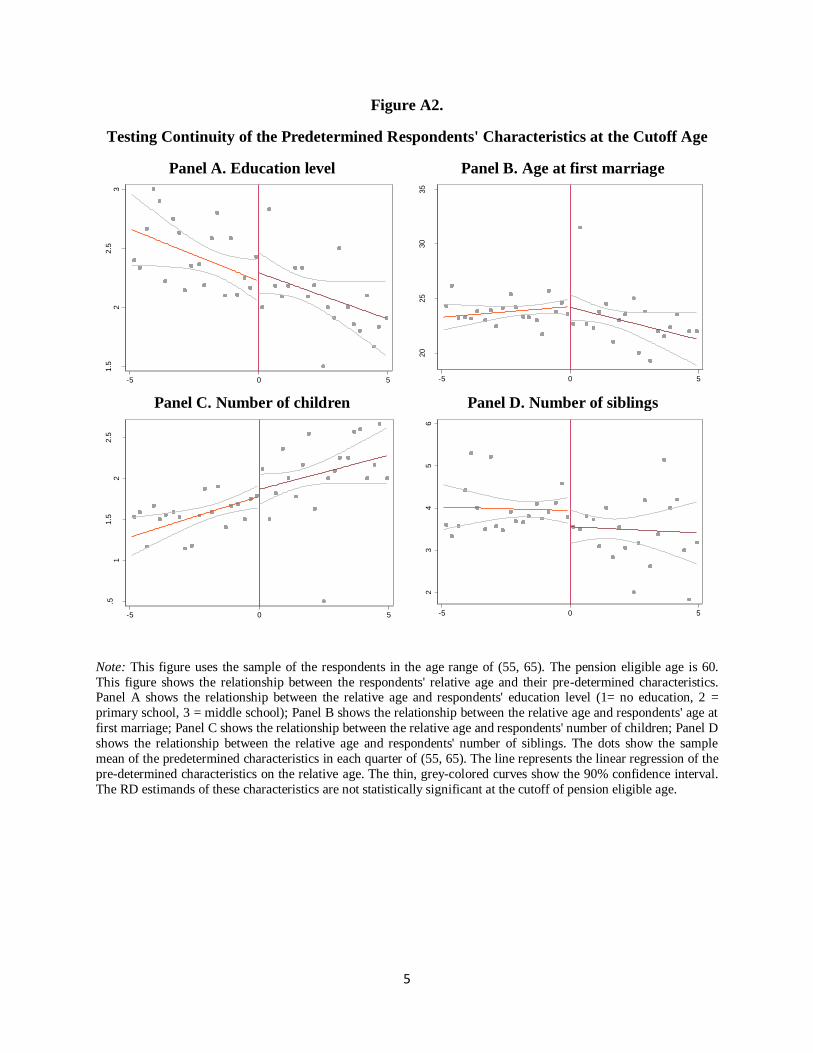
5
Figure A2.
Testing Continuity of the Predetermined Respondents' Characteristics at the Cutoff Age
Panel A. Education level Panel B. Age at first marriage
Panel C. Number of children Panel D. Number of siblings
Note: This figure uses the sample of the respondents in the age range of (55, 65). The pension eligible age is 60.
This figure shows the relationship between the respondents' relative age and their pre-determined characteristics. Panel A shows the relationship between the relative age and respondents' education level (1= no education, 2 =
primary school, 3 = middle school); Panel B shows the relationship between the relative age and respondents' age at
first marriage; Panel C shows the relationship between the relative age and respondents' number of children; Panel D
shows the relationship between the relative age and respondents' number of siblings. The dots show the sample
mean of the predetermined characteristics in each quarter of (55, 65). The line represents the linear regression of the
pre-determined characteristics on the relative age. The thin, grey-colored curves show the 90% confidence interval.
The RD estimands of these characteristics are not statistically significant at the cutoff of pension eligible age.
1.5
22.5
3
-5 0 5
20
25
30
35
-5 0 5
.51
1.5
22.5
-5 0 5
23
45
6
-5 0 5
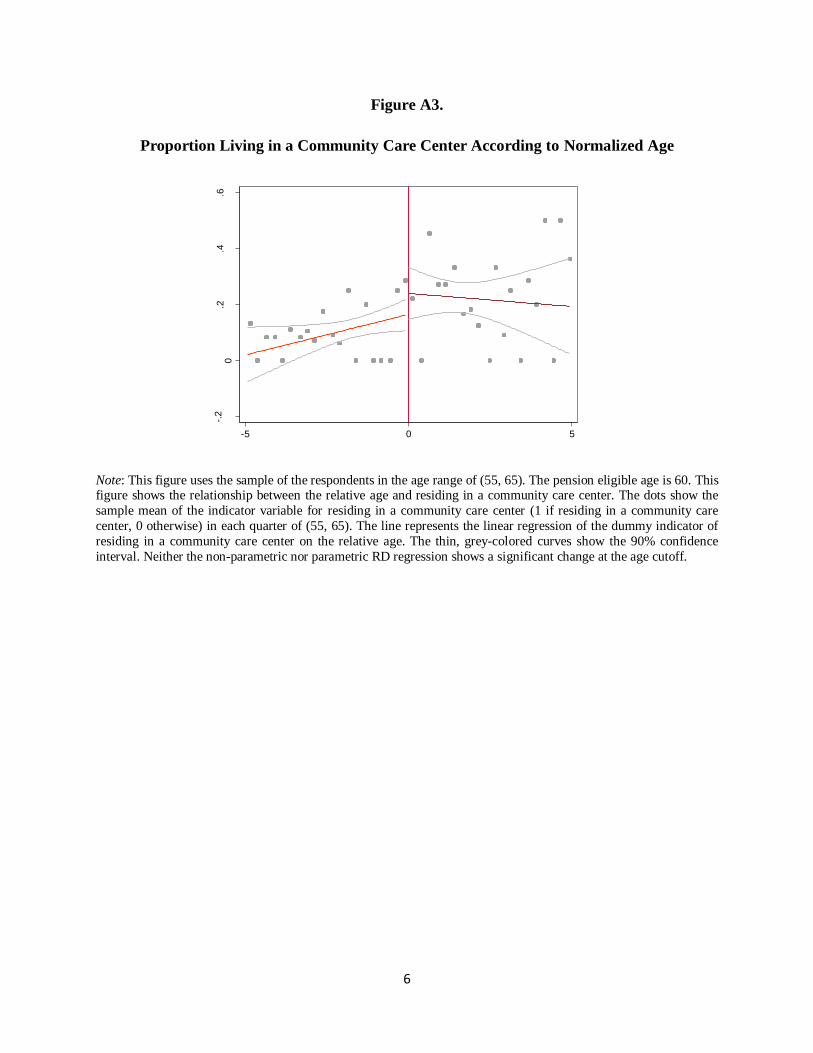
6
Figure A3.
Proportion Living in a Community Care Center According to Normalized Age
Note: This figure uses the sample of the respondents in the age range of (55, 65). The pension eligible age is 60. This figure shows the relationship between the relative age and residing in a community care center. The dots show the
sample mean of the indicator variable for residing in a community care center (1 if residing in a community care
center, 0 otherwise) in each quarter of (55, 65). The line represents the linear regression of the dummy indicator of
residing in a community care center on the relative age. The thin, grey-colored curves show the 90% confidence
interval. Neither the non-parametric nor parametric RD regression shows a significant change at the age cutoff.
-.2
0.2
.4.6
-5 0 5