the university of texas at el paso building a national reputation by successfully serving its region...
Post on 19-Dec-2015
217 views
TRANSCRIPT

The University of Texas at El Paso
Building a National Reputation
By Successfully Serving its Region

• Pre-College Preparation
• Financial Aid & Scholarships
• Academic & Career Advising
• Degree Program Options
• Flexible Class Scheduling
• Robust Research Infrastructure
• Competitive Faculty & Students
• Expanded Graduate Programs
• Enhanced Graduate Fellowships
• Enriched Undergraduate Programs
Closing the Gaps Tier One
Access and Excellence at

UTEP Enrollment Trends Closing the Gap in Student Participation
19981999
20002001
20022003
20042005
20062007
20082009
0
5,000
10,000
15,000
20,000
25,000
14,677 14,69515,224
16,22017,232
18,542 18,918 19,26819,842 20,154 20,458
21,011

19791981
19831985
19871989
19911993
19951997
19992001
20032005
20072009
0.0%
10.0%
20.0%
30.0%
40.0%
50.0%
60.0%
% Hispanic % White
% Black
Largest U.S. Ethnic Groups ShownSource: UTEP Center for Institutional Evaluation, Research and Planning
UTEP Enrollment: Student Race/Ethnicity Trends
75.6%
10.4%
3.0%

UTEP Student Origins
Source: UTEP Center for Institutional Evaluation, Research and Planning
El Paso County83%
Other Texas5%
Other U.S.4%
Mexico6%
Other International2%
Fall 2009

Top 10% Enrollment at UTEP
Source: Texas Higher Education Coordinating Board Query of all top 10% in Fall 2008from El Paso County who enrolled in any Texas Public University or 4-year college
UTEP60.3%
Texas A&M5.6%
UT Austin22.0%
Texas Tech5.3%
All Others6.9%
Texas Public University EnrollmentTop 10% High School Graduates from
El Paso County, Fall 2008
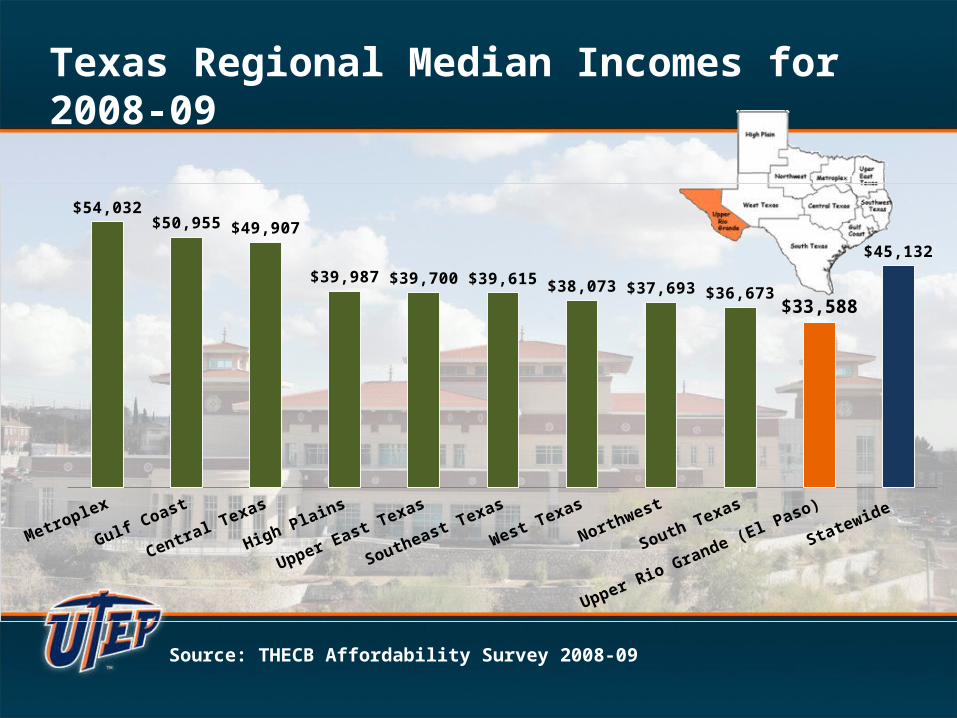
Source: THECB Affordability Survey 2008-09
Texas Regional Median Incomes for 2008-09
Metroplex
Gulf Coast
Central Texas
High Plains
Upper East Texas
Southeast Texas
West Texas
Northwest
South Texas
Upper Rio Grande (El Paso)
Statewide
$54,032$50,955 $49,907
$39,987 $39,700 $39,615 $38,073 $37,693 $36,673$33,588
$45,132

• Number of UTEP students who applied for financial aid:
16,147
• Average family income of financial aid applicants:
$33,907
• Number of financial aid applicants with family incomeof $20,000 or less: 6,828
• Percent of financial aid applicants with family income of $20,000 or less: 42%
Percent of students with family income of less than $20,000 at large public research (doctoral) universities: 10%. Percent of students with family income of less than $20,000 at small and mid-size private colleges and universities: 12% (Council of Independent Colleges: http://www.cic.edu/makingthecase/data/access/income/index.asp)
Percent of students with family income of less than $20,000 at community colleges: 29% (Lumina Foundation Focus, Fall 2005, P. 5).
Financial Aid2008-09

UTEP Tuition: Comparisons With Other Texas Public Universities
Cost per Semester Credit Hour (SCH) Estimated Cost of 15-SCH
Avg. Total Tuition and Fees Enrollment
UTEP From To Increase
(Avg. Cost of Tuition & Fees) %
Fall 2007 $ 177.95 $ 189.60 $ 11.65 $ 2,844 6.50%Fall 2008 $ 189.60 $ 199.60 $ 10.00 $ 2,994 5.27%Fall 2009 $ 199.60 $ 212.27 $ 12.67 $ 3,184 6.30%
Tuition and Fee Comparisons (Undergraduate Resident, 15 - SCH Average Cost)
Fall 2007 Fall 2008 Fall 2009UT Dallas $ 4,355 $ 4,647 $ 4,915 UT Austin $ 4,065 $ 4,254 $ 4,468 UT Arlington $ 3,822 $ 4,071 $ 4,272 University of Houston $ 3,767 $ 3,981 $ 4,163 UT San Antonio $ 3,621 $ 3,829 $ 4,021 Texas Tech $ 3,563 $ 3,570 $ 3,910 University of North Texas $ 3,337 $ 3,584 $ 3,859 UT El Paso $ 2,844 $ 2,994 $ 3,184

Total Degrees Awarded: 2000-2009Closing the Gap in Student Success
20002001
20022003
20042005
20062007
20082009
1600
2100
2600
3100
3600
3,820

UTEP Awarded 3,820 Degrees in 2008-09
Busines
s Adm
inis
tratio
n
Educatio
n
Enginee
ring
Health
Pro
fess
ion/N
ursin
g
Liber
al A
rts
Leader
ship
Stu
dies/
Public A
dmin
.
Scien
ce
Multi
disci
plinar
y Stu
dies
0
100
200
300
400
500
600
700
800
900
542472
261
410
788
240 268
98 293
129
78
92
86
63
640
765
390
488
880
86
303 268
Total Graduate

Doctoral Degree AttainmentU.S. Baccalaureate-origin Institutions Having the Largest Number U.S. Citizen Hispanic Doctorate Recipients - 2002-2006
No. of Hispanic
Baccalaureate Institution Rank Doctorate recipients
University of Puerto Rico - Rio Piedras Campus 1 372
University of Puerto Rico - Mayaguez Campus 2 232
University of California – Berkeley 3 155
University of California - Los Angeles 4 125
UT Austin 5 124
UT El Paso 6 89 Florida International University 6 89
University of Florida 8 82
University of New Mexico, All Campuses 9 69
University of Miami 10 68
NSF Survey of Earned Doctorates(integrated Science and Engineering Resources Data System)

UTEP Doctoral Enrollment Growth
Source: UTEP Center for Institutional Evaluation, Research and Planning
199019911992199319941995199619971998199920002001200220032004200520062007200820090
50
100
150
200
250
300
350
400
450
500Teaching, Learning and Culture (36)
Computer Engineering (16)
Computational Science (16)
Chemistry (22)
Computer Sciences (24)
Interdisciplinary Health Sciences (32)
Eng. Rhetoric and Composition (22)
International Business (25)
Civil Engineering (11)
History (34)
Biological Sciences (49)
Education Leadership & Admin. (53)
Environmental Science & Engineering (41)
Psychology (35)
Materials Science and Engineering (20)
Electrical and Computer Engineering (12)
Geological Sciences (12)
Total Yearly Doctoral Enrollment
Stu
de
nts
En
rolle
d

1991 1992 1993 1994 1995 1996 1997 1998 1999 2000 2001 2002 2003 2004 2005 2006 2007 2008 20090
10
20
30
40
50
60
70
7.89.6 10.4
12.9 12.9 13.8 13.717.3
14.8
2829.6
31.132.9
36.4 36.9
45.7 46.4
50.6
59.9
In $
Mil
lio
ns
Growth in Total Research ExpendituresFiscal Years 1991-2009
Source: Office of Research and Sponsored Projects* Reported to NSF, Science Resources Statistics (SRS), Jan. 2010
*
*
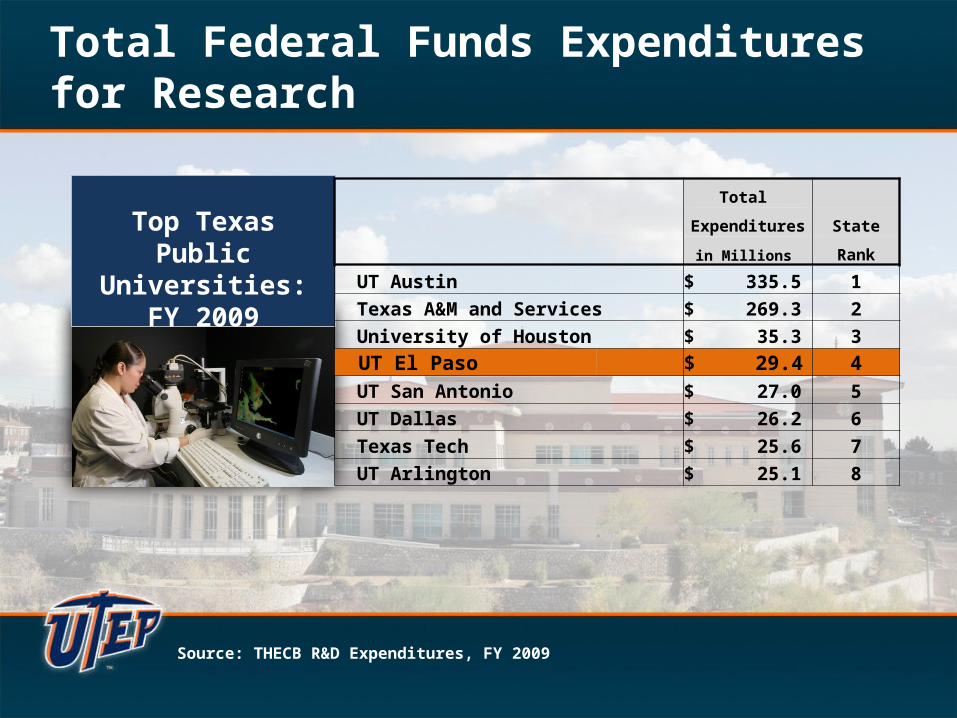
Total Federal Funds Expenditures for Research
Top Texas Public Universities:
FY 2009
Total
Expenditures State
in Millions Rank
UT Austin $ 335.5 1
Texas A&M and Services $ 269.3 2
University of Houston $ 35.3 3
UT El Paso $ 29.4 4 UT San Antonio $ 27.0 5
UT Dallas $ 26.2 6
Texas Tech $ 25.6 7
UT Arlington $ 25.1 8
Source: THECB R&D Expenditures, FY 2009

• Washington Advisory Group (2004)– “Tier One”– $100M in annual sponsored research
• HB 51– 7 Emerging Tier One universities– National Research University Fund (NRUF)
• $45 M per year in restricted research• 200 PhDs per year• … and other criteria
Tier One - Texas Style

UTEP’s National Research University Goals
• Annual expenditure of at least $100 million in
externally funded research, according to commonly accepted national standards; and
• Annual graduation of approximately 200 doctoral degrees.

Projected Research Growth
$0
$20
$40
$60
$80
$100
$120
$140
$160
in $
mill
ions
Fiscal Year
Expected Research Expenditures ($m)
Research Expenditures

Research Priorities and Cross-Cutting Research Themes
R e s e a r c h P r i o r i t i e s
Energy &
Environment
Health and Biomedical
Sciences &
Engineering
National Defense and
Border Security
Education for the
21st Century Demographic
Global Enterprise
& Border Studies
Cross-Cutting Research ThemesCyberinfrastructure and Collaborative EnvironmentsU.S.-Mexico and Latin America: Social and Behavioral
IssuesEmerging Technologies: Information Technology,
Biotechnology, & Nanotechnology

Projected Growth by 2020
• increase student enrollment from 21,000 to 29,500;
• increase the number of tenured and tenure-track faculty from 508 to 720;
• increase the provision of research, instructional, and associated support space by 2.4 M GSF; and
• increase the number of doctoral programs to 40.

Fall 2005
Fall 2006
Fall 2007
Fall 2008
Fall 2009
Fall 2010
Fall 2011
Fall 2012
Fall 2013
Fall 2014
Fall 2015
Fall 2016
Fall 2017
Fall 2018
Fall 2019
Fall 2020
15,000
17,000
19,000
21,000
23,000
25,000
27,000
29,000
31,000
33,000
19,26819,842 20,154
20,458
21,011
22,33223,002
23,69224,403
25,13525,889
26,72627,590
28,482
29,403
30,353
Total EnrollmentFall 2005 to Fall 2020

200 200 200 200 200 200 201 201 201 201 201 201 201 201 201 20120
70
120
170
220
2834
4235
5969
77
96
111
126
141
157
175
194
214
237
Doctoral Degrees Fiscal Years: 2004-2020

Projected New Doctoral Programs
College/SchoolDoctorates Pending
Review at THECB2010-2011
Doctoral Proposals Planned for 2011-2017
Doctoral Proposals under Consideration for
2017-20
Business Administration
Finance Accounting
Management Information Systems
Education Higher Education Educational Research &
Evaluation Special Education
Engineering Biomedical Engineering Manufacturing
Engineering
Energy Science & Engineering
Engineering EducationHealth Sciences Physical Therapy Human Nutrition
Liberal Arts Transnational Society,
Culture & Politics Communication Multicultural Literature
Linguistics
Nursing Nursing Practice
Science Ecology & Evolutionary
Biology
Bioinformatics Cell & Molecular
Biochemistry Statistics Fundamental & Applied
Physics Science & Math Education
Pure & Applied Mathematics
Forensic Science
University College Public Administration
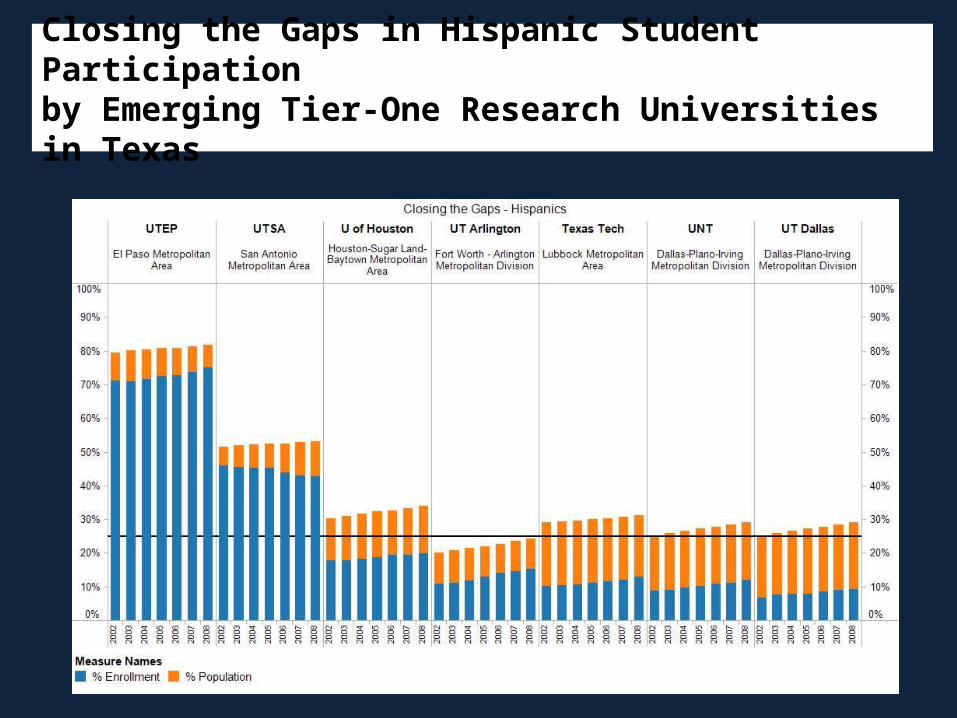
Closing the Gaps in Hispanic Student Participation by Emerging Tier-One Research Universities in Texas

Vision
The University of Texas at El Paso will proudly become
THE FIRST NATIONAL RESEARCH (TIER ONE) UNIVERSITY
with a 21st Century Student Demographic