the preliminary report on fishery resources …
TRANSCRIPT
SOUTHEAST ASIAN FISHERIES DEVELOPMENT CENTER
TD/RES/127
THE PRELIMINARY REPORT ON
FISHERY RESOURCES EXPLORATION ON
THE CONTINENTAL SLOPES IN THE
LINGAYEN GULF, THE PHILIPPINES
2008
M/V DA-BFAR, The Philippines
11-25 May 2008
-25 May 2008
Preparation and distribution of this document
The Preliminary Report on the Fishery Resources Exploration on the Continental Slopes in the Lingayen Gulf, the Philippines was prepared under the corporation between the Training Department of the Southeast Asian Fisheries Development Center (SEAFDEC) and the Bureau of Fisheries and Aquatic Resources (BFAR), the Philippines. The Document is distributed to the participants and resource persons of the Workshop, SEAFDEC Member Countries, SEAFDEC Departments and concerned institutions/organizations.
BIBLIOGRAPHIC CITATION SEAFDEC. 2008. Preliminary Report on the Fishery Resources Exploration on the Continental Slopes in the Lingayen Gulf, the Philippines, Southeast Asian Fisheries Development Center, Training Department, Thailand, TD/RES/127; 25 pp.
THIS PUBLICATION MAY NOT BE REPRODUCED, IN WHOLE OR IN PART, BY ANY METHOD OR PROCESS, WITHOUT WRITTEN PERMISSION FROM THE COPYRIGHT HOLDER. APPLICATIONS FOR SUCH PERMISSION WITH A STATEMENT OF THE PURPOSE AND EXTENT OF THE REPRODUCTION DESIRED SHOULD BE ADDRESSED TO:
SEAFDEC Training Department P.O. Box 97 Phrasamutchedi Samut Prakan 10290 Thailand
All rights reserved © SEAFDEC 2008
i
CONTENTS
1. Preface………………………….…………………………………………………..…….. ii
2. Forward …………………………………………………………………………………... iii
3. An outline of the Deep Sea Fishery Resources Exploration on the Continental Slopes
in the Lingayen Gulf ……………………………………………………………………… 2
4. Preliminary Assessment of Deep Sea Fisheries Resources along the Continental
Slopes of Lingayen Gulf, Philippines …………………..…………………..………….. 7
5. Fishing Trial on Deepwater Trawl during the Workshop on the Deep Sea Fishery
Resources Exploration on the Continental Slopes in the Lingayen Gulf …………… 17
6. Appendix: Photos of the Survey ……………………………..……………………...….. 24

ii
M E S S A G E
Like many fishing nations, the Philippines struggles with sustaining fisheries in traditional fishing grounds especially in the coastal and nearshore waters where many of our fishermen depend for their livelihood and income. While it is well recognized that the level of fishing needs to be moderated in these areas, alternative livelihoods and substitute fishing areas are important in achieving the objective of sustainable use of fisheries resources. It is for this reason that our initiative to assess the potential of our deep sea resources is important in optimizing the use of available resources in deep sea areas. It is ironic that in the Philippines, while 88% of our marine waters are considered deep water zones, yet we do not know much about their potentials. Neighboring countries like Taiwan, Japan and other more advanced fishing countries with relatively limited deep water areas have developed fisheries that are based on deep sea fish species. It is in this light that I recognize the value of this collaborative survey between BFAR and SEAFDEC on “Deep Sea Fisheries Assessment Along the Continental Slopes of Lingayen Gulf.” The survey resulted with interesting findings particularly the presence of deep sea shrimp species that are potentially valuable to fisheries. However, as we put forward our interest and efforts in developing the deep sea resources, we should also be cognizant with the high vulnerability of the resources to overexploitation. This endeavor yet again highlighted the importance of collaboration between BFAR, SEAFDEC and its member countries in addressing fisheries matters that are of common interest in the region. BFAR Director And SEAFDEC Council Director for the Philippines
iii
FORWARD
In the point of view of fishery policy maker or government searching of new fishing
ground as a consequence of the depletion of the inshore/coastal fisheries resources in the
Southeast Asian Countries. Those depletion was also reduces the supply of sea food
materials to many fish processing industries in the region and reduces the food supply for the
global level. Therefore, the deep-sea sea fishery resources survey in the EEZ of the
Southeast Asian Region in order to investigate the status and potential were existed.
Though there is a great continental shelf of almost 50% occupies the area of South
China Sea, the continental slope and the deep basin down to nearly 1,000 to 5,000 m are the
largest habitat around the Philippines, Taiwan, Indonesia, and part of the Andaman Sea
areas of Thai and Myanmar Waters. Within the 100 m depth, the fishery resources have
been intensively exploited by trawling and the shallow-water fishes in the region have been
well documented, but the deep-sea fauna are yet fully investigated. The known deep sea
pelagic resources are those of tunas, billfishes, and sharks, which are already being
exploited but the unexploited resources available in the Exclusive Economic Zone (EEZs) of
the countries in the Southeast Asian Region especially the demersal resources beyond 100
meter on the continental shelf and slope are only little or no information available. Besides,
there were no surveys have been specifically directed at the deep-sea demersal and
mesopelagic resources in the region.
We are also faced with the challenge of sustainable managing the deep sea
resources. As we are all aware of, poor management of the deep sea resources can lead to
over fishing. As responsible citizens of the region, we do not want to lose the deep fisheries
resources as what has happened to our coastal areas. Therefore, we need to understand the
deep sea ecosystem and its resources as well as the impact to such resources from fisheries.
DR. SIRI EKMAHARAJ SECRETARY GENERAL
SOUTHEAST ASEAN FISHERIES DEVELOPMENT CENTER
Outline of the Survey:
2
An outline of the Deep Sea Fishery Resources Exploration on the Continental Slopes in the Lingayen Gulf, the Philippines during 11-25 May 2008 1. INTRODUCTION
Consideration of the geographic features in the Southeast Asia Waters, more than 50% of the sea areas are identified as deep sea whereas utilization of those resources have not been initiated yet. This is due to lack of information on the species composition and how potential of the resources. In addition, it is clear that research vessel of deep sea survey seems to be one of the main factors that many countries in the region are facing. Not many research vessels in the region can conduct the deep sea resources survey due to the lack facilities, scientific instruments, type of fishing gear for fish sampling, and expertise. To encourage the SEAFDEC member countries to initiate on the deep sea resources exploration in their EEZ waters, therefore, investigation on the potential fisheries resources in the deep sea areas were commence. 2. RESEARCH TEAM AND PARTICIPANTS
The ASEAN-SEAFDEC program on the Deep Sea Fisheries Resources Exploration in the Southeast Asian Waters for 2008 which was endorsed in the 30th SEAFDEC Program Committee Meeting in Iloilo, the Philippines, one of the aims is to encourage member countries conducting the deep sea fishery resources survey in their EEZ by reason of investigation for the status and how potential of deep sea fisheries resources existing in the region. SEAFDEC/TD in collaboration with the Bureau of Fisheries and Aquatic Resources (BFAR) plan to conduct the deep sea fisheries resources on the continental shelf slopes where depth ranged between 200 and 1,000 m at Lingayen Gulf which located on the northwestern Luzon of the Philippines with the aim to investigate the existing fisheries resources and searching for potential fisheries resources in her EEZ. The survey, using three main sampling gears, there are bottom trawl, deep-sea beam trawl and deep-sea trap, respectively. The survey was conducted using the training and research vessel M/V DA-BFAR during the period from 11 to 25 May 2008. Regarding this, to obtain the most benefit of using DA-BFAR to other member countries SEAFDEC/TD in cooperation with BFAR was conducted the Shipboard Training Workshop on Deep Sea Fisheries Resources Research and Survey aboard M/V DA-BFAR during the mentioned period. Lists of scientists, participants, and organizations are as follows; Bureau of Fisheries and Aquatic Resources (BFAR) Mr. Rafael Ramiscal (Scientist and participant) Mr. Pierre Esther Velasco (Scientist and participant) Mr. Remar Asuncion (Scientist and participant) Ms. Rhoda Servidad (Scientist and participant) Ms. Jenny Viron (Scientist and participant) Ms. Riczyneth Ampoyos (Scientist) Ms. Che-che Salcepuedes (Scientist) Mr. Roger Fortaliza (Scientist) Mr. Marlo Demo-os (Scientist)
Department of Fisheries, Brunei Darussalam Mr. Abdul Hamid Haji Zainin Brunei (Participant) Research Institute for Marine Fisheries, Indonesia Mr. Muhammad Taufik (Participant) Tokyo University of Marine Science and Technology, Japan Dr. Tsuchiya Kotaro (Resource person) Department of Fisheries, Malaysia Mr. Mohammad Faisal bin Md. Saleh (Participant) Department of Fisheries, Thailand Mr. Montri Sumontha (Resource person) Mr. Narupon Darumas (Participant)
Outline of the Survey
3
Research Institute for Marine Fisheries, Vietnam Mr. Pham Quoc Huy (Participant) Southeast Asian Fisheries Development Center/Marine Fisheries Resources Development and management Department/Malaysia Mr. Mohamed Azmi bin Abdulah (Participant)
Southeast Asian Fisheries Development Center/Training Department/Thailand Dr. Worawit Wanchana (Scientist) Mr. Sayan Promjinda (Scientist) Mr. Nakaret Yasook (Scientist) Mr. Tossaporn Sukhapindha (Scientist) Dr. Natinee Sukramongkol (Scientist)
3. SAMPLING METHODS
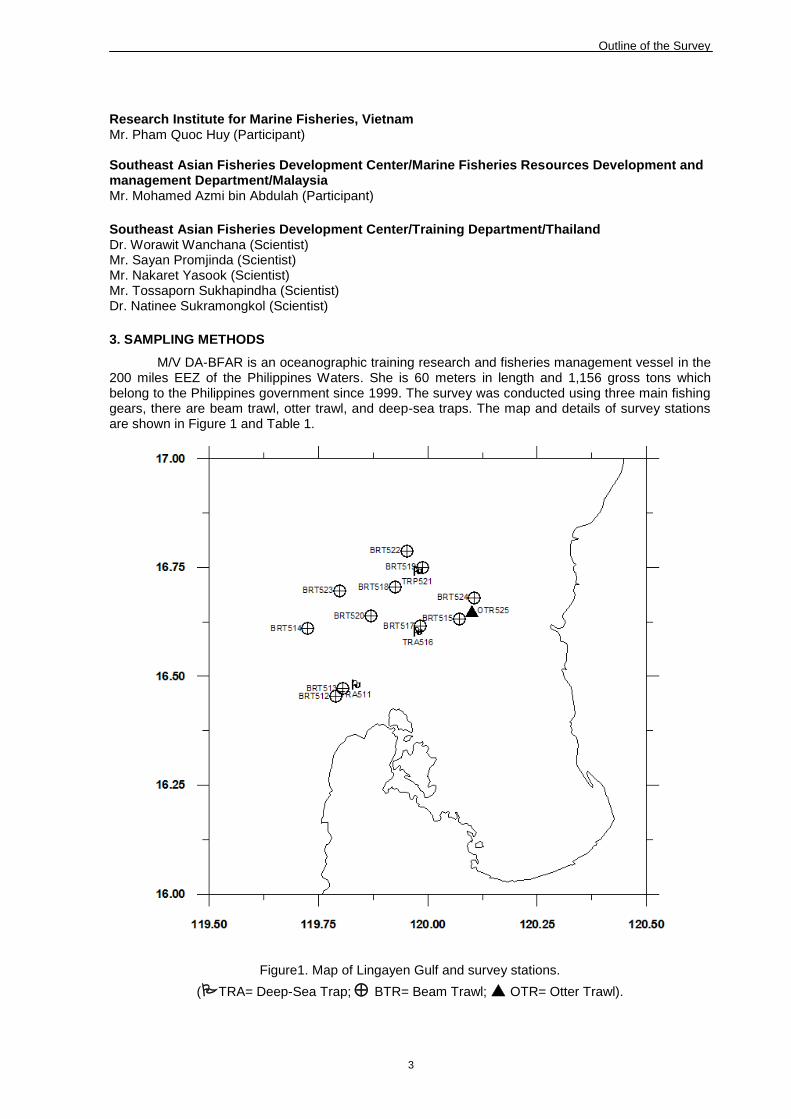
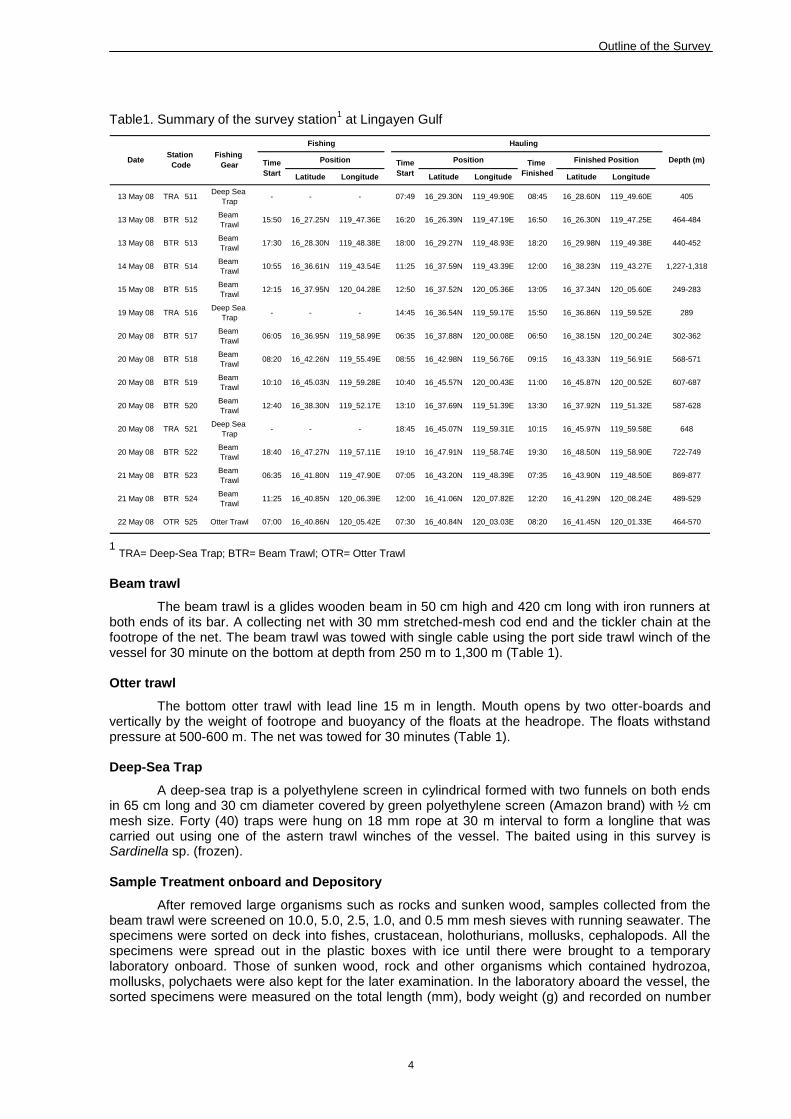
M/V DA-BFAR is an oceanographic training research and fisheries management vessel in the 200 miles EEZ of the Philippines Waters. She is 60 meters in length and 1,156 gross tons which belong to the Philippines government since 1999. The survey was conducted using three main fishing gears, there are beam trawl, otter trawl, and deep-sea traps. The map and details of survey stations are shown in Figure 1 and Table 1.
Figure1. Map of Lingayen Gulf and survey stations.
(TRA= Deep-Sea Trap; BTR= Beam Trawl; OTR= Otter Trawl).
Outline of the Survey
4
Table1. Summary of the survey station1 at Lingayen Gulf
Latitude Longitude Latitude Longitude Latitude Longitude
13 May 08 TRA 511Deep Sea
Trap- - - 07:49 16_29.30N 119_49.90E 08:45 16_28.60N 119_49.60E 405
13 May 08 BTR 512Beam
Trawl15:50 16_27.25N 119_47.36E 16:20 16_26.39N 119_47.19E 16:50 16_26.30N 119_47.25E 464-484
13 May 08 BTR 513Beam
Trawl17:30 16_28.30N 119_48.38E 18:00 16_29.27N 119_48.93E 18:20 16_29.98N 119_49.38E 440-452
14 May 08 BTR 514Beam
Trawl10:55 16_36.61N 119_43.54E 11:25 16_37.59N 119_43.39E 12:00 16_38.23N 119_43.27E 1,227-1,318
15 May 08 BTR 515Beam
Trawl12:15 16_37.95N 120_04.28E 12:50 16_37.52N 120_05.36E 13:05 16_37.34N 120_05.60E 249-283
19 May 08 TRA 516Deep Sea
Trap- - - 14:45 16_36.54N 119_59.17E 15:50 16_36.86N 119_59.52E 289
20 May 08 BTR 517Beam
Trawl06:05 16_36.95N 119_58.99E 06:35 16_37.88N 120_00.08E 06:50 16_38.15N 120_00.24E 302-362
20 May 08 BTR 518Beam
Trawl08:20 16_42.26N 119_55.49E 08:55 16_42.98N 119_56.76E 09:15 16_43.33N 119_56.91E 568-571
20 May 08 BTR 519Beam
Trawl10:10 16_45.03N 119_59.28E 10:40 16_45.57N 120_00.43E 11:00 16_45.87N 120_00.52E 607-687
20 May 08 BTR 520Beam
Trawl12:40 16_38.30N 119_52.17E 13:10 16_37.69N 119_51.39E 13:30 16_37.92N 119_51.32E 587-628
20 May 08 TRA 521Deep Sea
Trap- - - 18:45 16_45.07N 119_59.31E 10:15 16_45.97N 119_59.58E 648
20 May 08 BTR 522Beam
Trawl18:40 16_47.27N 119_57.11E 19:10 16_47.91N 119_58.74E 19:30 16_48.50N 119_58.90E 722-749
21 May 08 BTR 523Beam
Trawl06:35 16_41.80N 119_47.90E 07:05 16_43.20N 119_48.39E 07:35 16_43.90N 119_48.50E 869-877
21 May 08 BTR 524Beam
Trawl11:25 16_40.85N 120_06.39E 12:00 16_41.06N 120_07.82E 12:20 16_41.29N 120_08.24E 489-529
22 May 08 OTR 525 Otter Trawl 07:00 16_40.86N 120_05.42E 07:30 16_40.84N 120_03.03E 08:20 16_41.45N 120_01.33E 464-570
Fishing
Gear
Fishing Hauling
Depth (m) Time
Start
Time
Finished
Time
Start
DateStation
CodeFinished PositionPositionPosition
1 TRA= Deep-Sea Trap; BTR= Beam Trawl; OTR= Otter Trawl
Beam trawl
The beam trawl is a glides wooden beam in 50 cm high and 420 cm long with iron runners at both ends of its bar. A collecting net with 30 mm stretched-mesh cod end and the tickler chain at the footrope of the net. The beam trawl was towed with single cable using the port side trawl winch of the vessel for 30 minute on the bottom at depth from 250 m to 1,300 m (Table 1). Otter trawl
The bottom otter trawl with lead line 15 m in length. Mouth opens by two otter-boards and vertically by the weight of footrope and buoyancy of the floats at the headrope. The floats withstand pressure at 500-600 m. The net was towed for 30 minutes (Table 1). Deep-Sea Trap
A deep-sea trap is a polyethylene screen in cylindrical formed with two funnels on both ends in 65 cm long and 30 cm diameter covered by green polyethylene screen (Amazon brand) with ½ cm mesh size. Forty (40) traps were hung on 18 mm rope at 30 m interval to form a longline that was carried out using one of the astern trawl winches of the vessel. The baited using in this survey is Sardinella sp. (frozen). Sample Treatment onboard and Depository
After removed large organisms such as rocks and sunken wood, samples collected from the beam trawl were screened on 10.0, 5.0, 2.5, 1.0, and 0.5 mm mesh sieves with running seawater. The specimens were sorted on deck into fishes, crustacean, holothurians, mollusks, cephalopods. All the specimens were spread out in the plastic boxes with ice until there were brought to a temporary laboratory onboard. Those of sunken wood, rock and other organisms which contained hydrozoa, mollusks, polychaets were also kept for the later examination. In the laboratory aboard the vessel, the sorted specimens were measured on the total length (mm), body weight (g) and recorded on number
Outline of the Survey
5
of fish specimens. Carapace length (mm), number, group weight (g), and average individual weight (g) were recorded for shrimp specimens. Other benthic invertebrates included mollusks and cephalopods were count the number and recorded mantle length (mm), group weight (g) and individual weight (g) where necessary. The specimens were identified to the lowest taxonomic level as possible and photograph. Shrimp specimens were immersed in 80% ethanol labeled, sealed and stored in a plastic drum container. Fish specimens were placed in punctured plastic bags and submerge in 10% formalin solution in plastic drum containers. All specimens from this survey and used for taxonomic study were deposited at Bureau of Fisheries and Aquatic Resources (BFAR-NMFDC). 4. ACKNOWLEDGEMENTS
The authors wish to acknowledge the cooperation between the DA-BFAR and SEAFDEC/TD. We would also like to express our sincere thanks to the captain and crews of the M/V DA-BFAR for their help during the surveys. We also acknowledge the support of the Fisheries Agency of Japan (Japanese Trust Fund) for funding this project.
Outline of the Survey

Results from the Survey:
7
Preliminary Assessment of Deep Sea Fisheries Resources along the Continental Slopes of Lingayen Gulf, Philippines Alma C. Dickson
1, Jonathan O. Dickson
2, Rafael V. Ramiscal
1, Robin Escriba
1, Joeren Ylleana
1, Che-che
Salcepuedes1, Rhoda Servidad
1, Jenny Viron
1, Roger Fortaliza
1, and Riczineth Amposyos
1
1National Marine Fisheries Development Center, Bureau of Fisheries and Aquatic Resources, Quezon City, Philippines
2Capture Fisheries Technology Division, Bureau of Fisheries and Aquatic Resources, Quezon City, Philippines
1. ABSTRACT
Deep sea fisheries survey was conducted along the continental slopes of Lingayen Gulf on May 11-26, 2008 using beam trawl and traps to determine composition and abundance of species that are important to fisheries. Among the crustaceans, pandalid shrimps were found dominant and perhaps the most significant to fisheries mainly Heterocarpus dorsalis, H. woodmasoni, H. hayashii and H. laevigatus that were caught at sampling depths between 200 m and 800 m but were most abundant at 400-600 m.
Using swept area method, the catch-per-unit-area (CPUA) and biomass based on beam trawl tows were computed according to depth range for various species groups including crustaceans (shrimps and pandalid shrimps) and fish (family Macrouridae and Colocongridae). The CPUA for fish and crustaceans particularly pandalid shrimps was highest at 400-600 m. The total biomass for fish and crustaceans was estimated to be about 819 tons which include about 46 tons of pandalid shrimps in an area of about 2,567 km
2 with depths between 200 m and 1,500 m that is located at the entrance
of Lingayen Gulf. Embarking on a fishery based on above deep-sea species should be done carefully following thorough feasibility and assessment studies.
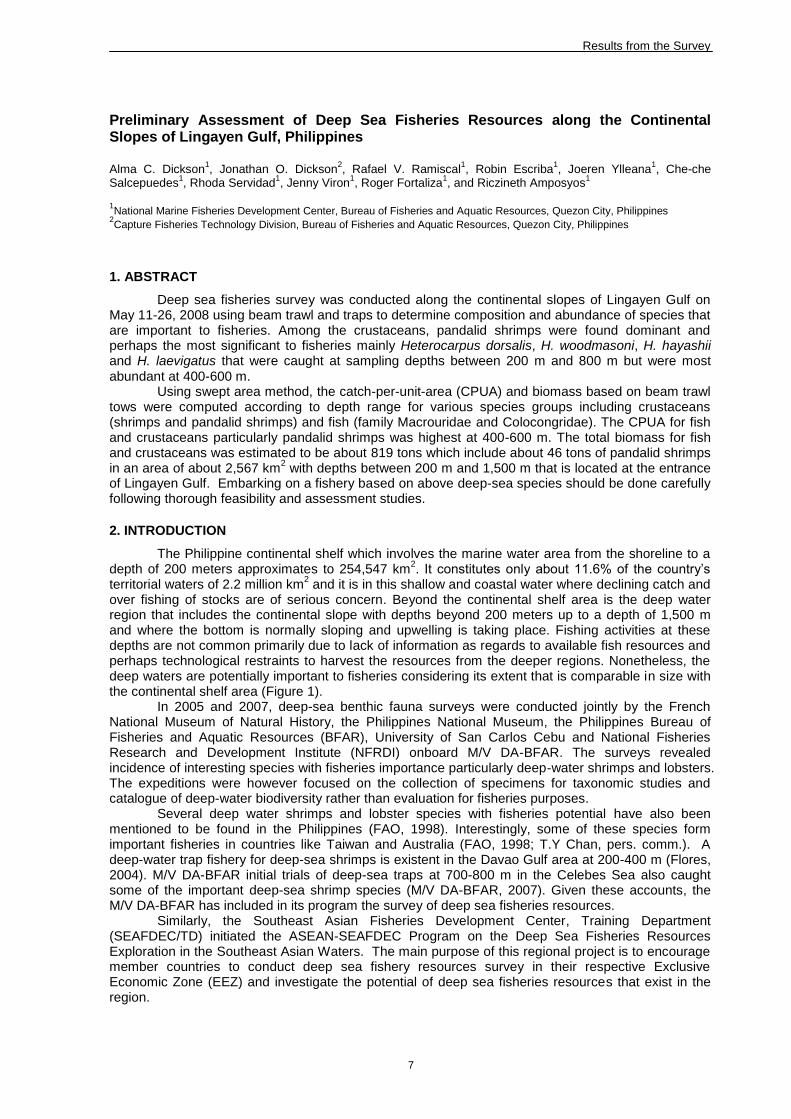
2. INTRODUCTION
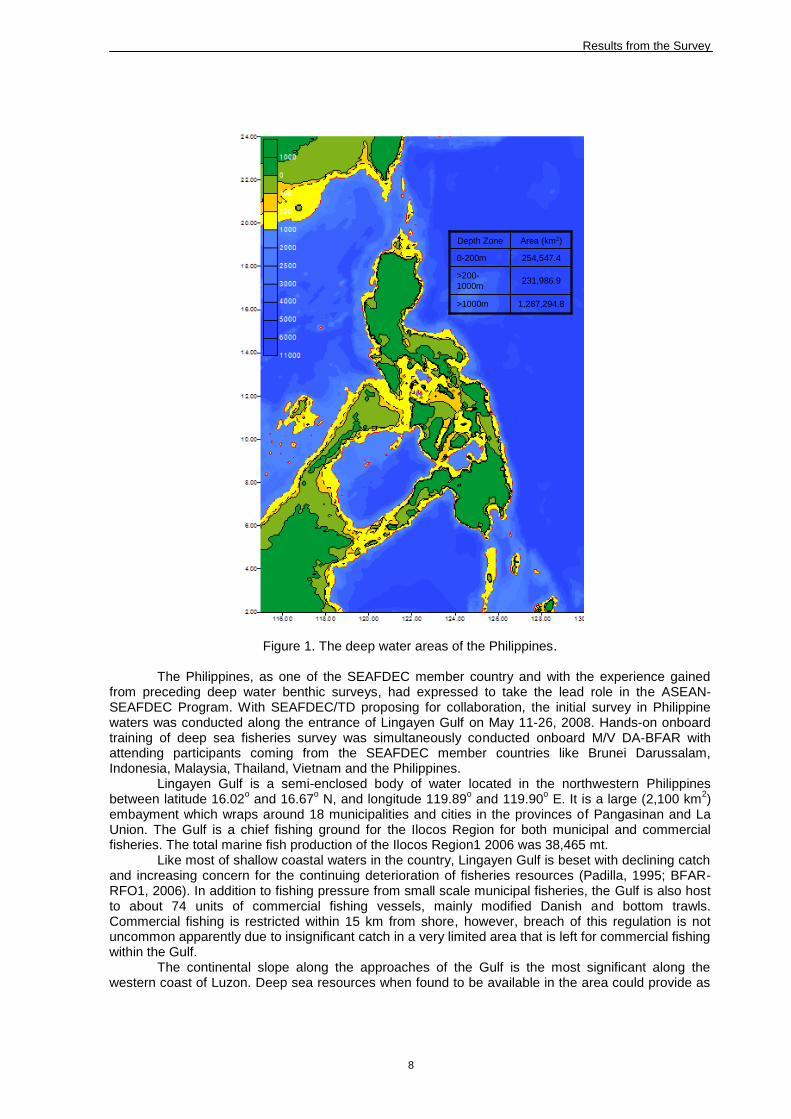
The Philippine continental shelf which involves the marine water area from the shoreline to a depth of 200 meters approximates to 254,547 km
2. It constitutes only about 11.6% of the country’s
territorial waters of 2.2 million km2 and it is in this shallow and coastal water where declining catch and
over fishing of stocks are of serious concern. Beyond the continental shelf area is the deep water region that includes the continental slope with depths beyond 200 meters up to a depth of 1,500 m and where the bottom is normally sloping and upwelling is taking place. Fishing activities at these depths are not common primarily due to lack of information as regards to available fish resources and perhaps technological restraints to harvest the resources from the deeper regions. Nonetheless, the deep waters are potentially important to fisheries considering its extent that is comparable in size with the continental shelf area (Figure 1). In 2005 and 2007, deep-sea benthic fauna surveys were conducted jointly by the French National Museum of Natural History, the Philippines National Museum, the Philippines Bureau of Fisheries and Aquatic Resources (BFAR), University of San Carlos Cebu and National Fisheries Research and Development Institute (NFRDI) onboard M/V DA-BFAR. The surveys revealed incidence of interesting species with fisheries importance particularly deep-water shrimps and lobsters. The expeditions were however focused on the collection of specimens for taxonomic studies and catalogue of deep-water biodiversity rather than evaluation for fisheries purposes.
Several deep water shrimps and lobster species with fisheries potential have also been mentioned to be found in the Philippines (FAO, 1998). Interestingly, some of these species form important fisheries in countries like Taiwan and Australia (FAO, 1998; T.Y Chan, pers. comm.). A deep-water trap fishery for deep-sea shrimps is existent in the Davao Gulf area at 200-400 m (Flores, 2004). M/V DA-BFAR initial trials of deep-sea traps at 700-800 m in the Celebes Sea also caught some of the important deep-sea shrimp species (M/V DA-BFAR, 2007). Given these accounts, the M/V DA-BFAR has included in its program the survey of deep sea fisheries resources.
Similarly, the Southeast Asian Fisheries Development Center, Training Department (SEAFDEC/TD) initiated the ASEAN-SEAFDEC Program on the Deep Sea Fisheries Resources Exploration in the Southeast Asian Waters. The main purpose of this regional project is to encourage member countries to conduct deep sea fishery resources survey in their respective Exclusive Economic Zone (EEZ) and investigate the potential of deep sea fisheries resources that exist in the region.
Results from the Survey
8
1,287,294.8>1000m
231,986.9>200-
1000m
254,547.40-200m
Area (km2)Depth Zone
1,287,294.8>1000m
231,986.9>200-
1000m
254,547.40-200m
Area (km2)Depth Zone
Figure 1. The deep water areas of the Philippines.
The Philippines, as one of the SEAFDEC member country and with the experience gained from preceding deep water benthic surveys, had expressed to take the lead role in the ASEAN-SEAFDEC Program. With SEAFDEC/TD proposing for collaboration, the initial survey in Philippine waters was conducted along the entrance of Lingayen Gulf on May 11-26, 2008. Hands-on onboard training of deep sea fisheries survey was simultaneously conducted onboard M/V DA-BFAR with attending participants coming from the SEAFDEC member countries like Brunei Darussalam, Indonesia, Malaysia, Thailand, Vietnam and the Philippines. Lingayen Gulf is a semi-enclosed body of water located in the northwestern Philippines between latitude 16.02
o and 16.67
o N, and longitude 119.89
o and 119.90
o E. It is a large (2,100 km
2)
embayment which wraps around 18 municipalities and cities in the provinces of Pangasinan and La Union. The Gulf is a chief fishing ground for the Ilocos Region for both municipal and commercial fisheries. The total marine fish production of the Ilocos Region1 2006 was 38,465 mt.
Like most of shallow coastal waters in the country, Lingayen Gulf is beset with declining catch and increasing concern for the continuing deterioration of fisheries resources (Padilla, 1995; BFAR-RFO1, 2006). In addition to fishing pressure from small scale municipal fisheries, the Gulf is also host to about 74 units of commercial fishing vessels, mainly modified Danish and bottom trawls. Commercial fishing is restricted within 15 km from shore, however, breach of this regulation is not uncommon apparently due to insignificant catch in a very limited area that is left for commercial fishing within the Gulf. The continental slope along the approaches of the Gulf is the most significant along the western coast of Luzon. Deep sea resources when found to be available in the area could provide as
Results from the Survey
9
alternative resource to reduce current fishing effort within the Gulf. For this reason, the deep sea resources survey was conducted to determine species caught and indices of abundance like catch-per-unit-area (CPUA) and biomass using beam trawl and catch-per-unit-effort (kg/trap/hr) for deep-sea traps. The survey also intended make use of bottom trawl, however major gear damage on its 1st operation discontinued its deployment. 3. MATERIALS AND METHODS
Beam Trawl
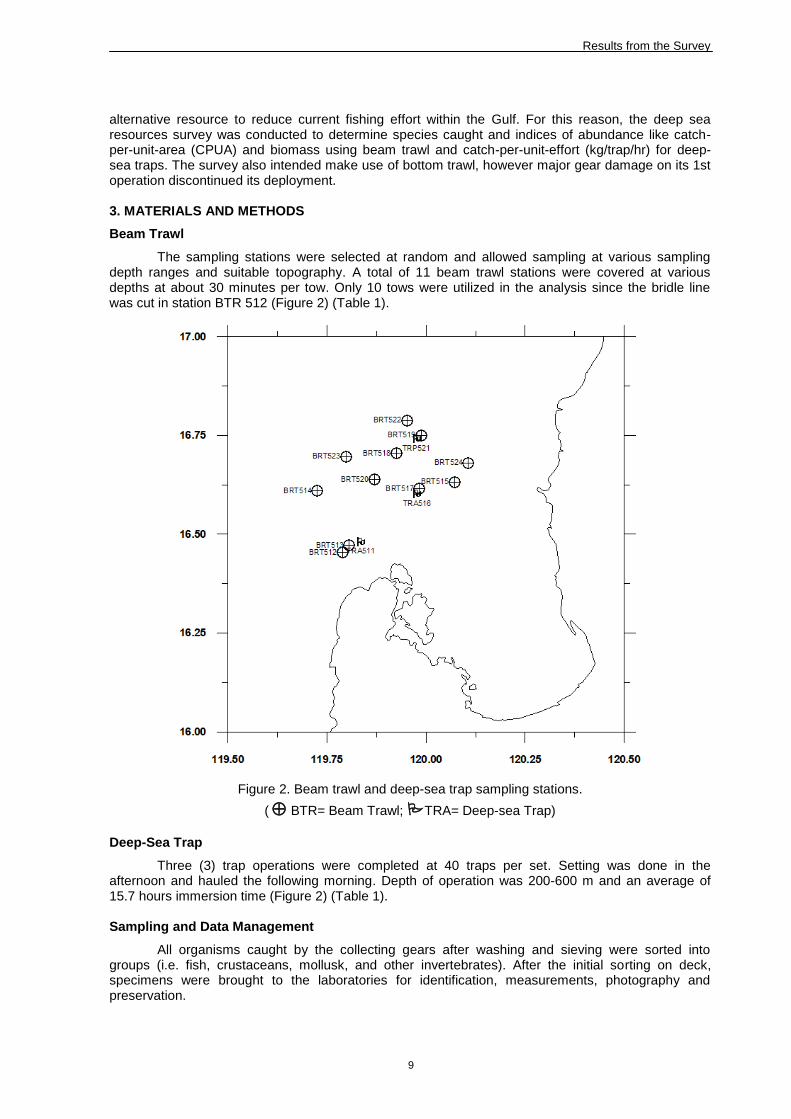
The sampling stations were selected at random and allowed sampling at various sampling depth ranges and suitable topography. A total of 11 beam trawl stations were covered at various depths at about 30 minutes per tow. Only 10 tows were utilized in the analysis since the bridle line was cut in station BTR 512 (Figure 2) (Table 1).
Figure 2. Beam trawl and deep-sea trap sampling stations.
( BTR= Beam Trawl; TRA= Deep-sea Trap)
Deep-Sea Trap
Three (3) trap operations were completed at 40 traps per set. Setting was done in the afternoon and hauled the following morning. Depth of operation was 200-600 m and an average of 15.7 hours immersion time (Figure 2) (Table 1). Sampling and Data Management
All organisms caught by the collecting gears after washing and sieving were sorted into groups (i.e. fish, crustaceans, mollusk, and other invertebrates). After the initial sorting on deck, specimens were brought to the laboratories for identification, measurements, photography and preservation.
Results from the Survey
10
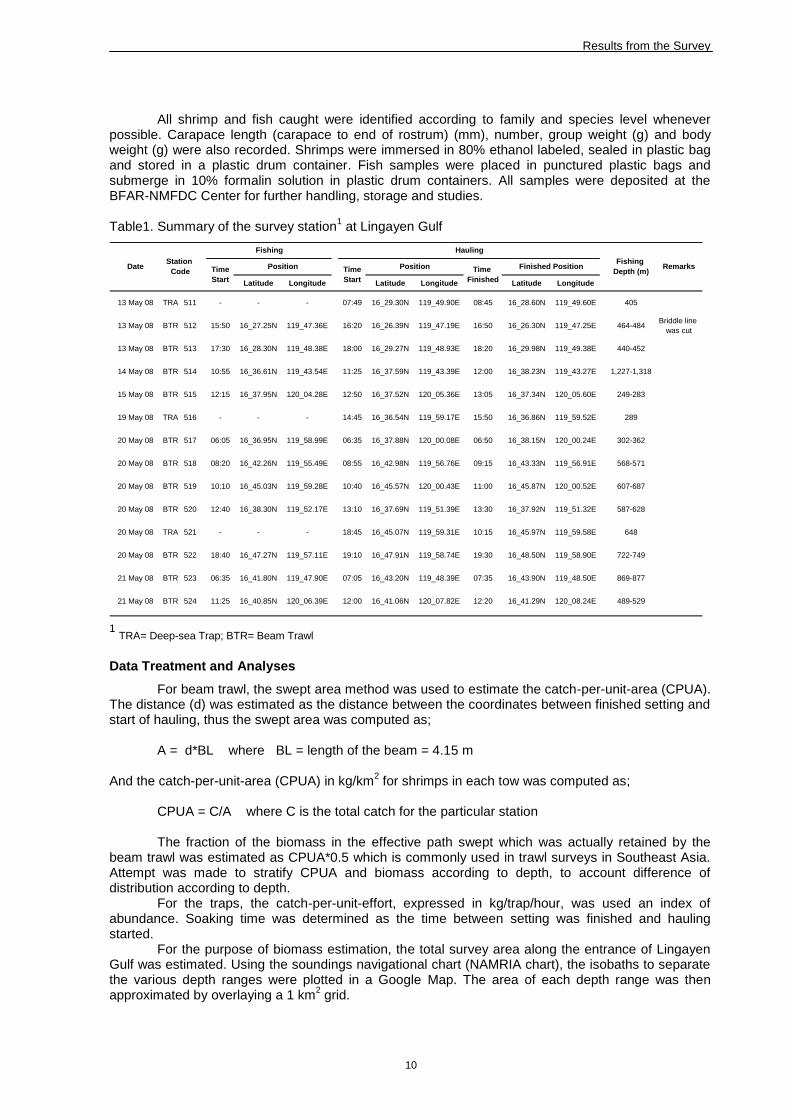
All shrimp and fish caught were identified according to family and species level whenever possible. Carapace length (carapace to end of rostrum) (mm), number, group weight (g) and body weight (g) were also recorded. Shrimps were immersed in 80% ethanol labeled, sealed in plastic bag and stored in a plastic drum container. Fish samples were placed in punctured plastic bags and submerge in 10% formalin solution in plastic drum containers. All samples were deposited at the BFAR-NMFDC Center for further handling, storage and studies. Table1. Summary of the survey station
1 at Lingayen Gulf
Latitude Longitude Latitude Longitude Latitude Longitude
13 May 08 TRA 511 - - - 07:49 16_29.30N 119_49.90E 08:45 16_28.60N 119_49.60E 405
13 May 08 BTR 512 15:50 16_27.25N 119_47.36E 16:20 16_26.39N 119_47.19E 16:50 16_26.30N 119_47.25E 464-484Briddle line
was cut
13 May 08 BTR 513 17:30 16_28.30N 119_48.38E 18:00 16_29.27N 119_48.93E 18:20 16_29.98N 119_49.38E 440-452
14 May 08 BTR 514 10:55 16_36.61N 119_43.54E 11:25 16_37.59N 119_43.39E 12:00 16_38.23N 119_43.27E 1,227-1,318
15 May 08 BTR 515 12:15 16_37.95N 120_04.28E 12:50 16_37.52N 120_05.36E 13:05 16_37.34N 120_05.60E 249-283
19 May 08 TRA 516 - - - 14:45 16_36.54N 119_59.17E 15:50 16_36.86N 119_59.52E 289
20 May 08 BTR 517 06:05 16_36.95N 119_58.99E 06:35 16_37.88N 120_00.08E 06:50 16_38.15N 120_00.24E 302-362
20 May 08 BTR 518 08:20 16_42.26N 119_55.49E 08:55 16_42.98N 119_56.76E 09:15 16_43.33N 119_56.91E 568-571
20 May 08 BTR 519 10:10 16_45.03N 119_59.28E 10:40 16_45.57N 120_00.43E 11:00 16_45.87N 120_00.52E 607-687
20 May 08 BTR 520 12:40 16_38.30N 119_52.17E 13:10 16_37.69N 119_51.39E 13:30 16_37.92N 119_51.32E 587-628
20 May 08 TRA 521 - - - 18:45 16_45.07N 119_59.31E 10:15 16_45.97N 119_59.58E 648
20 May 08 BTR 522 18:40 16_47.27N 119_57.11E 19:10 16_47.91N 119_58.74E 19:30 16_48.50N 119_58.90E 722-749
21 May 08 BTR 523 06:35 16_41.80N 119_47.90E 07:05 16_43.20N 119_48.39E 07:35 16_43.90N 119_48.50E 869-877
21 May 08 BTR 524 11:25 16_40.85N 120_06.39E 12:00 16_41.06N 120_07.82E 12:20 16_41.29N 120_08.24E 489-529
Fishing Hauling
Fishing
Depth (m)RemarksDate
Station
CodeFinished PositionPositionPosition Time
Start
Time
Start
Time
Finished
1 TRA= Deep-sea Trap; BTR= Beam Trawl
Data Treatment and Analyses
For beam trawl, the swept area method was used to estimate the catch-per-unit-area (CPUA). The distance (d) was estimated as the distance between the coordinates between finished setting and start of hauling, thus the swept area was computed as;
A = d*BL where BL = length of the beam = 4.15 m And the catch-per-unit-area (CPUA) in kg/km
2 for shrimps in each tow was computed as;
CPUA = C/A where C is the total catch for the particular station
The fraction of the biomass in the effective path swept which was actually retained by the
beam trawl was estimated as CPUA*0.5 which is commonly used in trawl surveys in Southeast Asia. Attempt was made to stratify CPUA and biomass according to depth, to account difference of distribution according to depth.
For the traps, the catch-per-unit-effort, expressed in kg/trap/hour, was used an index of abundance. Soaking time was determined as the time between setting was finished and hauling started.
For the purpose of biomass estimation, the total survey area along the entrance of Lingayen Gulf was estimated. Using the soundings navigational chart (NAMRIA chart), the isobaths to separate the various depth ranges were plotted in a Google Map. The area of each depth range was then approximated by overlaying a 1 km
2 grid.
Results from the Survey
11
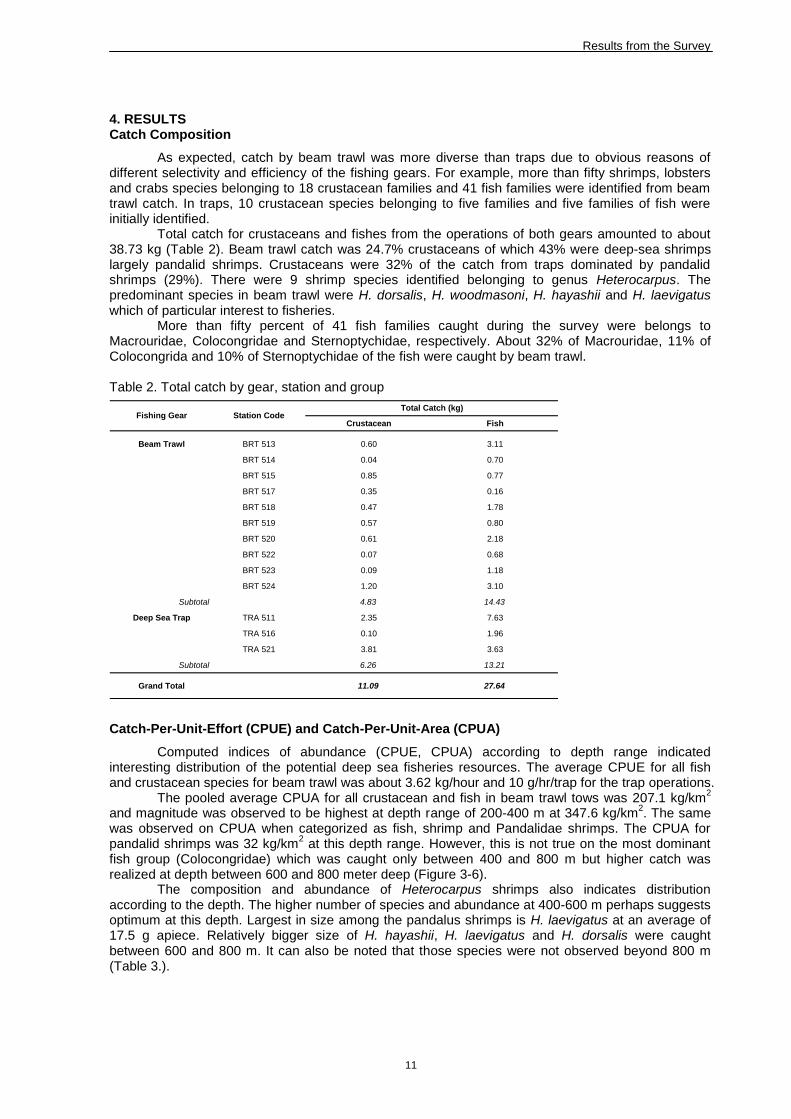
4. RESULTS Catch Composition
As expected, catch by beam trawl was more diverse than traps due to obvious reasons of different selectivity and efficiency of the fishing gears. For example, more than fifty shrimps, lobsters and crabs species belonging to 18 crustacean families and 41 fish families were identified from beam trawl catch. In traps, 10 crustacean species belonging to five families and five families of fish were initially identified.
Total catch for crustaceans and fishes from the operations of both gears amounted to about 38.73 kg (Table 2). Beam trawl catch was 24.7% crustaceans of which 43% were deep-sea shrimps largely pandalid shrimps. Crustaceans were 32% of the catch from traps dominated by pandalid shrimps (29%). There were 9 shrimp species identified belonging to genus Heterocarpus. The predominant species in beam trawl were H. dorsalis, H. woodmasoni, H. hayashii and H. laevigatus which of particular interest to fisheries.
More than fifty percent of 41 fish families caught during the survey were belongs to Macrouridae, Colocongridae and Sternoptychidae, respectively. About 32% of Macrouridae, 11% of Colocongrida and 10% of Sternoptychidae of the fish were caught by beam trawl. Table 2. Total catch by gear, station and group
Crustacean Fish
Beam Trawl BRT 513 0.60 3.11
BRT 514 0.04 0.70
BRT 515 0.85 0.77
BRT 517 0.35 0.16
BRT 518 0.47 1.78
BRT 519 0.57 0.80
BRT 520 0.61 2.18
BRT 522 0.07 0.68
BRT 523 0.09 1.18
BRT 524 1.20 3.10
Subtotal 4.83 14.43
Deep Sea Trap TRA 511 2.35 7.63
TRA 516 0.10 1.96
TRA 521 3.81 3.63
Subtotal 6.26 13.21
Grand Total 11.09 27.64
Total Catch (kg)Fishing Gear Station Code
Catch-Per-Unit-Effort (CPUE) and Catch-Per-Unit-Area (CPUA)
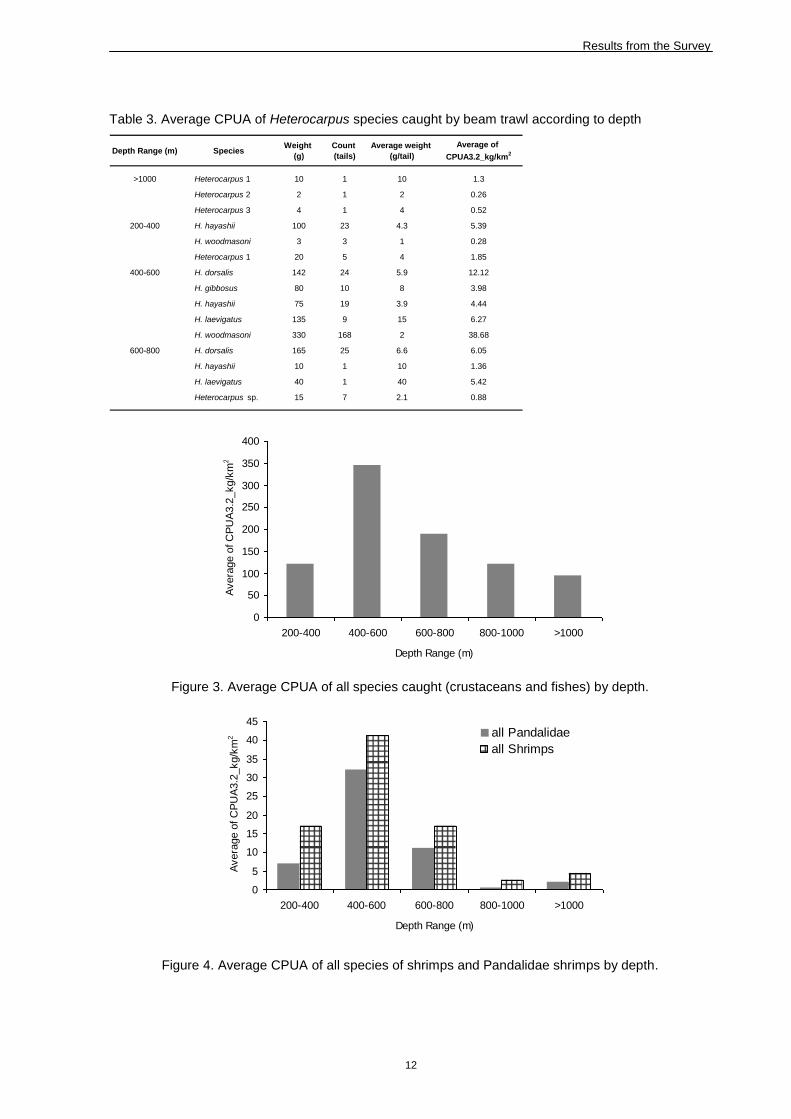
Computed indices of abundance (CPUE, CPUA) according to depth range indicated interesting distribution of the potential deep sea fisheries resources. The average CPUE for all fish and crustacean species for beam trawl was about 3.62 kg/hour and 10 g/hr/trap for the trap operations. The pooled average CPUA for all crustacean and fish in beam trawl tows was 207.1 kg/km
2
and magnitude was observed to be highest at depth range of 200-400 m at 347.6 kg/km2. The same
was observed on CPUA when categorized as fish, shrimp and Pandalidae shrimps. The CPUA for pandalid shrimps was 32 kg/km
2 at this depth range. However, this is not true on the most dominant
fish group (Colocongridae) which was caught only between 400 and 800 m but higher catch was realized at depth between 600 and 800 meter deep (Figure 3-6).
The composition and abundance of Heterocarpus shrimps also indicates distribution according to the depth. The higher number of species and abundance at 400-600 m perhaps suggests optimum at this depth. Largest in size among the pandalus shrimps is H. laevigatus at an average of 17.5 g apiece. Relatively bigger size of H. hayashii, H. laevigatus and H. dorsalis were caught between 600 and 800 m. It can also be noted that those species were not observed beyond 800 m (Table 3.).
Results from the Survey
12
Table 3. Average CPUA of Heterocarpus species caught by beam trawl according to depth
Depth Range (m) SpeciesWeight
(g)
Count
(tails)
Average weight
(g/tail)
Average of
CPUA3.2_kg/km2
>1000 Heterocarpus 1 10 1 10 1.3
Heterocarpus 2 2 1 2 0.26
Heterocarpus 3 4 1 4 0.52
200-400 H. hayashii 100 23 4.3 5.39
H. woodmasoni 3 3 1 0.28
Heterocarpus 1 20 5 4 1.85
400-600 H. dorsalis 142 24 5.9 12.12
H. gibbosus 80 10 8 3.98
H. hayashii 75 19 3.9 4.44
H. laevigatus 135 9 15 6.27
H. woodmasoni 330 168 2 38.68
600-800 H. dorsalis 165 25 6.6 6.05
H. hayashii 10 1 10 1.36
H. laevigatus 40 1 40 5.42
Heterocarpus sp. 15 7 2.1 0.88
0
50
100
150
200
250
300
350
400
200-400 400-600 600-800 800-1000 >1000
Depth Range (m)
Avera
ge o
f C
PU
A3.2
_kg/k
m2
Figure 3. Average CPUA of all species caught (crustaceans and fishes) by depth.
0
5
10
15
20
25
30
35
40
45
200-400 400-600 600-800 800-1000 >1000
Depth Range (m)
Avera
ge o
f C
PU
A3.2
_kg/k
m2 all Pandalidae
all Shrimps
Figure 4. Average CPUA of all species of shrimps and Pandalidae shrimps by depth.
Results from the Survey
13
0
50
100
150
200
250
300
200-400 400-600 600-800 800-1000 >1000
Depth Range (m)
Avera
ge o
f C
PU
A3.2
_kg/k
m2
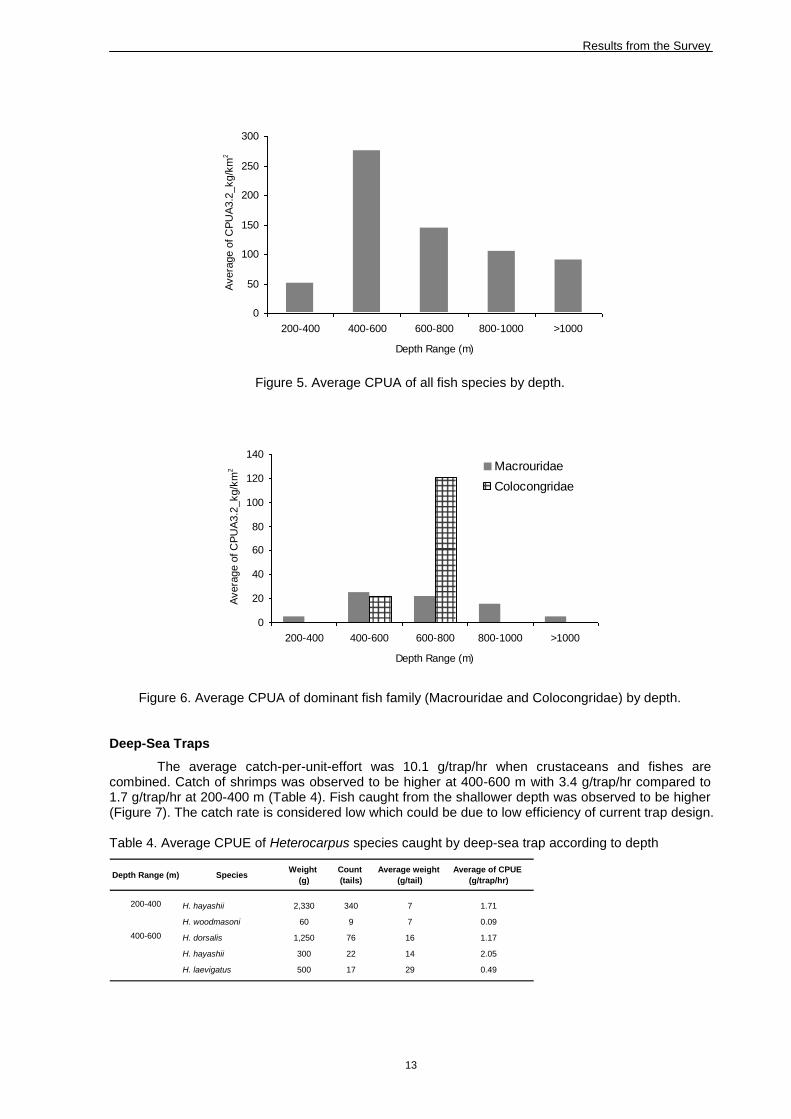
Figure 5. Average CPUA of all fish species by depth.
0
20
40
60
80
100
120
140
200-400 400-600 600-800 800-1000 >1000
Depth Range (m)
Avera
ge o
f C
PU
A3.2
_kg/k
m2 Macrouridae
Colocongridae
Figure 6. Average CPUA of dominant fish family (Macrouridae and Colocongridae) by depth.
Deep-Sea Traps
The average catch-per-unit-effort was 10.1 g/trap/hr when crustaceans and fishes are combined. Catch of shrimps was observed to be higher at 400-600 m with 3.4 g/trap/hr compared to 1.7 g/trap/hr at 200-400 m (Table 4). Fish caught from the shallower depth was observed to be higher (Figure 7). The catch rate is considered low which could be due to low efficiency of current trap design. Table 4. Average CPUE of Heterocarpus species caught by deep-sea trap according to depth
Depth Range (m) SpeciesWeight
(g)
Count
(tails)
Average weight
(g/tail)
Average of CPUE
(g/trap/hr)
200-400 H. hayashii 2,330 340 7 1.71
H. woodmasoni 60 9 7 0.09
400-600 H. dorsalis 1,250 76 16 1.17
H. hayashii 300 22 14 2.05
H. laevigatus 500 17 29 0.49
Results from the Survey
14
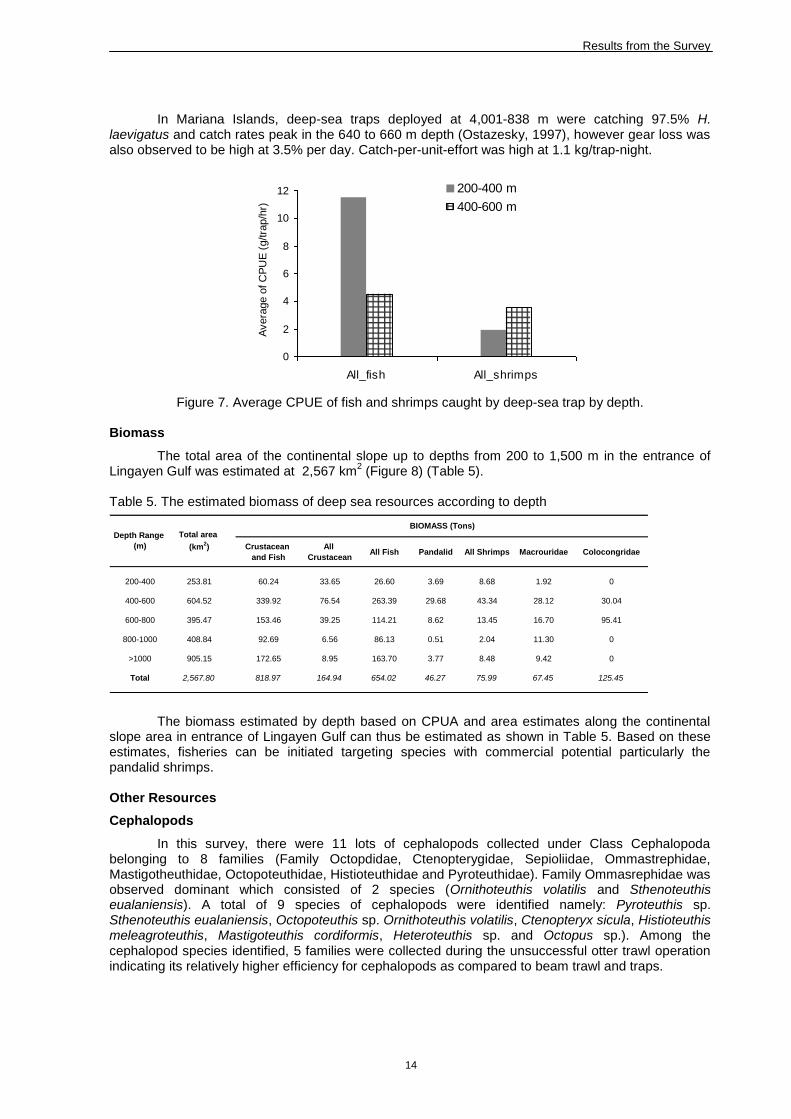
In Mariana Islands, deep-sea traps deployed at 4,001-838 m were catching 97.5% H. laevigatus and catch rates peak in the 640 to 660 m depth (Ostazesky, 1997), however gear loss was also observed to be high at 3.5% per day. Catch-per-unit-effort was high at 1.1 kg/trap-night.
0
2
4
6
8
10
12
All_fish All_shrimps
Avera
ge o
f C
PU
E (
g/tra
p/h
r)
200-400 m
400-600 m
Figure 7. Average CPUE of fish and shrimps caught by deep-sea trap by depth.
Biomass
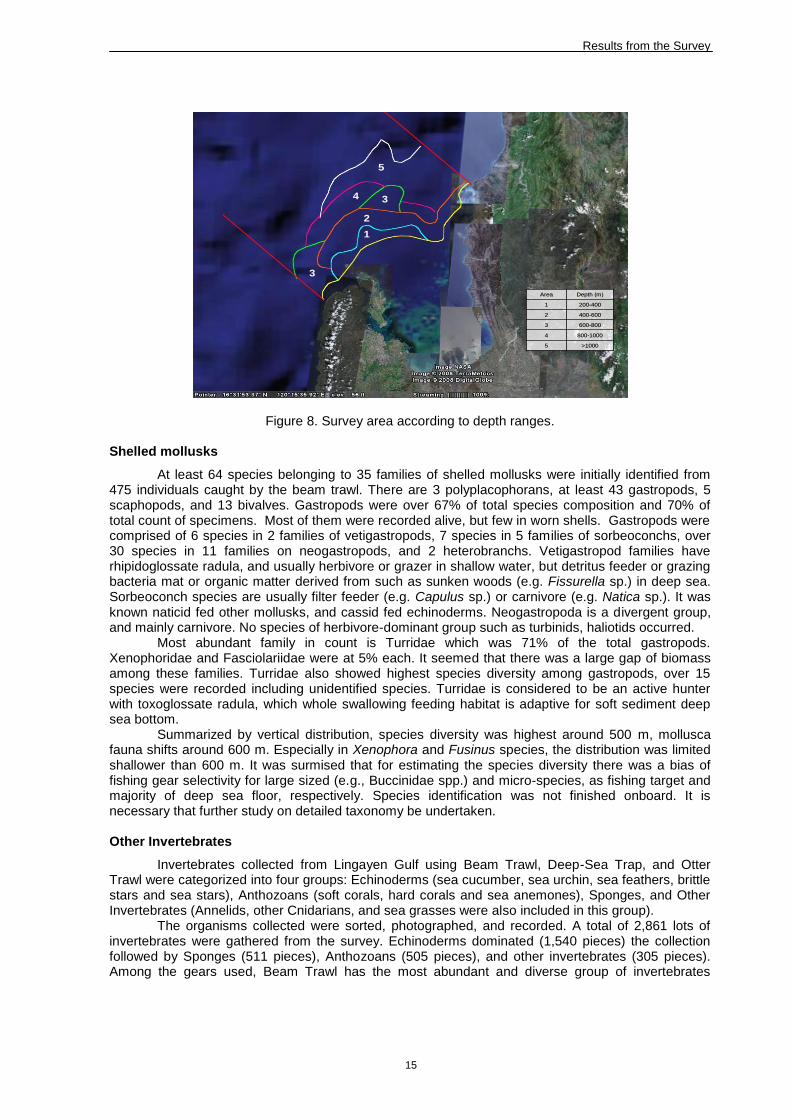
The total area of the continental slope up to depths from 200 to 1,500 m in the entrance of Lingayen Gulf was estimated at 2,567 km
2 (Figure 8) (Table 5).
Table 5. The estimated biomass of deep sea resources according to depth
Crustacean
and Fish
All
CrustaceanAll Fish Pandalid All Shrimps Macrouridae Colocongridae
200-400 253.81 60.24 33.65 26.60 3.69 8.68 1.92 0
400-600 604.52 339.92 76.54 263.39 29.68 43.34 28.12 30.04
600-800 395.47 153.46 39.25 114.21 8.62 13.45 16.70 95.41
800-1000 408.84 92.69 6.56 86.13 0.51 2.04 11.30 0
>1000 905.15 172.65 8.95 163.70 3.77 8.48 9.42 0
Total 2,567.80 818.97 164.94 654.02 46.27 75.99 67.45 125.45
BIOMASS (Tons)Depth Range
(m)
Total area
(km2)
The biomass estimated by depth based on CPUA and area estimates along the continental slope area in entrance of Lingayen Gulf can thus be estimated as shown in Table 5. Based on these estimates, fisheries can be initiated targeting species with commercial potential particularly the pandalid shrimps. Other Resources
Cephalopods
In this survey, there were 11 lots of cephalopods collected under Class Cephalopoda belonging to 8 families (Family Octopdidae, Ctenopterygidae, Sepioliidae, Ommastrephidae, Mastigotheuthidae, Octopoteuthidae, Histioteuthidae and Pyroteuthidae). Family Ommasrephidae was observed dominant which consisted of 2 species (Ornithoteuthis volatilis and Sthenoteuthis eualaniensis). A total of 9 species of cephalopods were identified namely: Pyroteuthis sp. Sthenoteuthis eualaniensis, Octopoteuthis sp. Ornithoteuthis volatilis, Ctenopteryx sicula, Histioteuthis meleagroteuthis, Mastigoteuthis cordiformis, Heteroteuthis sp. and Octopus sp.). Among the cephalopod species identified, 5 families were collected during the unsuccessful otter trawl operation indicating its relatively higher efficiency for cephalopods as compared to beam trawl and traps.
Results from the Survey
15
1
2
3
3
4
5
>10005
800-10004
600-8003
400-6002
200-4001
Depth (m)Area
>10005
800-10004
600-8003
400-6002
200-4001
Depth (m)Area
Figure 8. Survey area according to depth ranges.
Shelled mollusks
At least 64 species belonging to 35 families of shelled mollusks were initially identified from 475 individuals caught by the beam trawl. There are 3 polyplacophorans, at least 43 gastropods, 5 scaphopods, and 13 bivalves. Gastropods were over 67% of total species composition and 70% of total count of specimens. Most of them were recorded alive, but few in worn shells. Gastropods were comprised of 6 species in 2 families of vetigastropods, 7 species in 5 families of sorbeoconchs, over 30 species in 11 families on neogastropods, and 2 heterobranchs. Vetigastropod families have rhipidoglossate radula, and usually herbivore or grazer in shallow water, but detritus feeder or grazing bacteria mat or organic matter derived from such as sunken woods (e.g. Fissurella sp.) in deep sea. Sorbeoconch species are usually filter feeder (e.g. Capulus sp.) or carnivore (e.g. Natica sp.). It was known naticid fed other mollusks, and cassid fed echinoderms. Neogastropoda is a divergent group, and mainly carnivore. No species of herbivore-dominant group such as turbinids, haliotids occurred. Most abundant family in count is Turridae which was 71% of the total gastropods. Xenophoridae and Fasciolariidae were at 5% each. It seemed that there was a large gap of biomass among these families. Turridae also showed highest species diversity among gastropods, over 15 species were recorded including unidentified species. Turridae is considered to be an active hunter with toxoglossate radula, which whole swallowing feeding habitat is adaptive for soft sediment deep sea bottom.
Summarized by vertical distribution, species diversity was highest around 500 m, mollusca fauna shifts around 600 m. Especially in Xenophora and Fusinus species, the distribution was limited shallower than 600 m. It was surmised that for estimating the species diversity there was a bias of fishing gear selectivity for large sized (e.g., Buccinidae spp.) and micro-species, as fishing target and majority of deep sea floor, respectively. Species identification was not finished onboard. It is necessary that further study on detailed taxonomy be undertaken. Other Invertebrates
Invertebrates collected from Lingayen Gulf using Beam Trawl, Deep-Sea Trap, and Otter Trawl were categorized into four groups: Echinoderms (sea cucumber, sea urchin, sea feathers, brittle stars and sea stars), Anthozoans (soft corals, hard corals and sea anemones), Sponges, and Other Invertebrates (Annelids, other Cnidarians, and sea grasses were also included in this group). The organisms collected were sorted, photographed, and recorded. A total of 2,861 lots of invertebrates were gathered from the survey. Echinoderms dominated (1,540 pieces) the collection followed by Sponges (511 pieces), Anthozoans (505 pieces), and other invertebrates (305 pieces). Among the gears used, Beam Trawl has the most abundant and diverse group of invertebrates
Results from the Survey
16
collected. Anthozoans and Sponges were not present in the deep-sea trap collection since most in these groups are not mobile. The abundance of organisms were also evaluated into two levels of depth strata which are <500 m and >500 m. The result showed that invertebrates (Echinoderms, Sponges, and other invertebrates) collected were abundant at <500 m. Anthozoans group however were found high at >500 m. 5. SUMMARY
The deep sea exploratory survey of the continental slopes of Lingayen Gulf covered a total of 15 sampling operations consisting of 11 beam trawls, 3 deep-sea traps and 1 otter trawl operation. The activities were badly hampered by typhoon Cosme, reducing the accomplished stations (target: 11 beam, 4 traps and 6 otter trawl). Four oceanographic stations were also not pursued due to lost platform and rough weather that restricted safe deployment of oceanographic equipment. Beam trawl catch samples indicated high diversity, however fish and shrimp catch are possibly biased considering the low vertical opening and slow towing speed of the gear. Increasing the size of the shoes to increase vertical opening and increasing the towing speed should be considered in future surveys. The survey confirmed the prevalence of pandalid shrimp species in deep sea areas particularly 400-600 m and that their distribution beyond 800 m deep maybe limited. The pandalid shrimps can be considered as the most promising for developing a deep sea based fisheries. However, the vulnerability of deep-sea species to overexploitation should be taken into account so that an in-depth feasibility study and stock assessment are necessary prior to opening the fishery to fishermen. As a start, a pilot operation of traps could be implemented to further evaluate the extent of the resource and develop its utilization and markets. Current trap design should also be modified to include introduction of cover to improve efficiency. The current bottom trawl net of MV DA-BFAR has limited application for deep sea surveys. Besides restrictions due to present buoy capacity for deployment beyond 600m, its large size makes it susceptible to snags and damage when operated on narrow flat bottom strips that are expected in continental slope areas. Since the bottom trawl is still considered the best sampling gear for demersal fisheries assessment, a smaller shrimp trawl net towed by one cable wire is recommended in future surveys. 6. REFERENCES
BFAR. 2007. Fisheries profile 2006. BFAR-Region 1. 2008. The National Stock Assessment Program of Region 1. Unpubl. Report. Flores, J.O. Fisheries in deep water areas of the Philippines. In DA-BFAR. 2004. In turbulent seas:
The status of Philippine marine fisheries. Coastal Resource Management Program of the Department of Environment and Natural Resources, Cebu City, Philippines, pp. 72-78.
Karpenter, K.E. and V.H. Niem (eds). 1998. FAO Species identification guide for fishery purposes. The living Marine resources of the Western Central Pacific. FAO, Rome. Vol. 2-5.
M/V DA-BFAR. 2007. DY05 Cruise report of M/V DA-BFAR, Unpubl. Report. Ostaseky, J. 1997. The deepwater shrimp fishery of the Northern Mariana Islands. Southwest
Fisheries Science Center Administrative Report H-97-10. University of Minnesota, Dept. of Fish. And Wildlife, 200 Hudson Hall, St. Paul, Minnesota, USA.
Padilla J.E. and A.C. Morales. 1997. Evaluation of fisheries management alternatives for Lingayen Gulf: an option paper. Draft rep. prepared for the DENR by the International Resources Group in association with the Resources, Environment and Economics Center for Studies, Inc. and Edge vale Associates under USAID-Philippines. 58p.
Pooley, Samuel. 2007. Programmatic Environmental Assessment of the Research Programs on Spiny and Slipper Lobster, Bottomfish, and Deepwater Shrimp at the Pacific Islands Fisheries Science Center Honolulu, Hawaii. May, 2007.
Sarda, Francisco. Analysis of the Mediterranean (including North Africa) deep-sea shrimps fishery: catches, effort and economics.
Sparre, P and Venema, S.C. 1998. Introduction to tropical fish stock assessment. Part 1. Manual. FAO Fish. Tech. Pap. No. 306, Rev. 2. Rome, FAO. 1998. 407p.
Tagami, Darryl. 1988. An Assessment of Exploitable Biomass and Projection of Maximum Sustainable Yield for Hetrocarpus laevigatus in the Hawaiian Islands.
Results from the Survey
17
Fishing Trial on Deepwater Trawl during the Workshop on the Deep Sea Fishery Resources Exploration on the Continental Slopes in the Lingayen Gulf, the Philippines during 11-25 May 2008 Natinee Sukramongkol
1, Sayan Promjinda
1, Nakaret Yasook
1, Tossaporn Sukhapindha
1, Montri Sumontha
2,
Worawit Wanchana1
1Southeast Asian Fisheries Development Center, Prasamut Chedi, Samut Prakan, 10290 Thailand
2Ranong Marine Fisheries Station, Paknam, Muang, Ranong 85000 Thailand
1. INTRODUCTION
Regarding the ASEAN-SEAFDEC Program on the Deep Sea Fisheries Resources Exploration in the Southeast Asian Waters for 2008 was endorsed in the 30th SEAFDEC Program Committee Meeting at Iloilo, Philippines last November 25 to December 1,2007 (SEAFDEC, 2008). The purpose of which is to encourage member countries in conducting deep sea fishery resources survey in their respective EEZ and investigate its status to determine the potential deep sea fisheries resources existing in the Region. SEAFDEC/TD in corporation with the Bureau of Fisheries and Aquatic Resources (BFAR) agreed to conduct Shipboard Training on Deep Sea Fisheries Resources Research and Survey on board National Vessel, M/V DA-BFAR to be attended by the representatives from the SEAFDEC member countries. This paper presents the information on the results of the bottom trawl survey and the topographic survey aboard M/V DA-BFAR from 11 to 25 May 2008. 2. MATERIALS AND METHODS
The deep-sea fauna around Lingayen Bay was collected by otter trawl conducted by M/V DA-BFAR. From a total of 14 fishing operations (11 beam trawl operations and 3 deep-sea traps) one operation of otter trawl was made. The net was towed for 30 minutes on the bottom at depth between 358 and 882 meter. After net hauling, all of the samples were sorted and identified to the lowest taxonomic level as possible. In the laboratory aboard M/V DA-BFAR, the size and weigh, of fish was measured and recorded. Specimens were photography and fixed in 10% formalin. The specimens obtained in this survey and used for taxonomic study was deposited at DA-BFAR. The literature sources for deep-sea fishes (occur at waters deeper than 200 m) identification was followed Carpenter and Niem (1998, 1999, and 2001), Matsui and Rosenblatt (1984), and the report of Japan-Indonesia Deep Sea Fishery Resources Joint Exploration Project (2006). The sea floor mapping was conducted using the color video sounder (Furuno FCV-292) equipped aboard M/V DA-BFAR. The depth and position were recorded every one minute before the trawl operation to obtain the seafloor bathymetry and a transect lines during the trawl operation. 3. RESULTS
Seafloor mapping
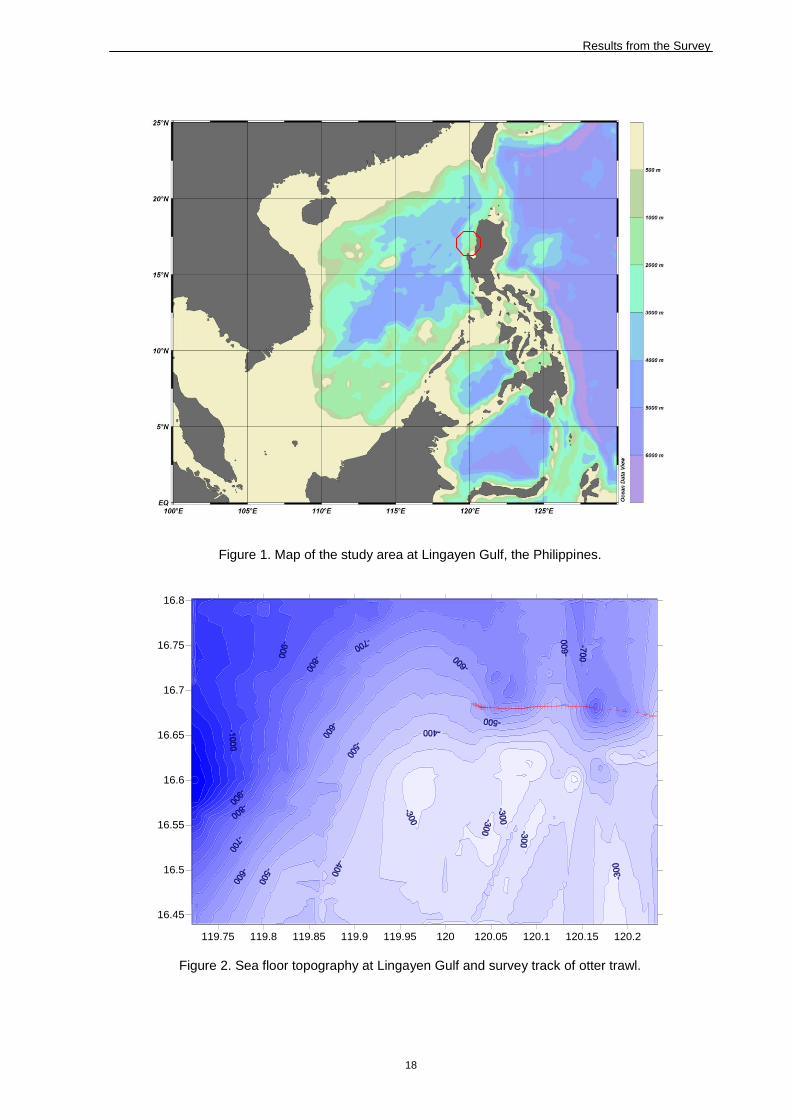
Lingayen Gulf is located on the northwestern Luzon of the Philippines (Figure 1). The bay is shallow as the continental shelf extends from 30 to 35 nautical miles from the shore to the outer part of the bay. At the survey area, just out side of the bay, is rather gentle with depths of 300-400 m and surrounded by the isobath of 500 m before falling to the deepest isobath of 1,000 m of the topographic survey. The survey track of otter trawl in the present study was shown in Figure 2. The otter trawl start conducted at latitude 16
o 40.8’ N, longitude 120
o 09.8’ E and finished at latitude 16
o 41.5’ N, longitude
120o 01.3’E. According to the irregular substrate as shown in Figure 3, the trawl net was damaged
beyond repair. Besides, work was limited to several stations in the present survey. Although nine operations of the otter trawl survey was planned to conduct, most of the operations were cancelled due to the approach of typhoon COSME (HALONG).
Results from the Survey
18
Figure 1. Map of the study area at Lingayen Gulf, the Philippines.
119.75 119.8 119.85 119.9 119.95 120 120.05 120.1 120.15 120.2
16.45
16.5
16.55
16.6
16.65
16.7
16.75
16.8
Figure 2. Sea floor topography at Lingayen Gulf and survey track of otter trawl.
Results from the Survey
19
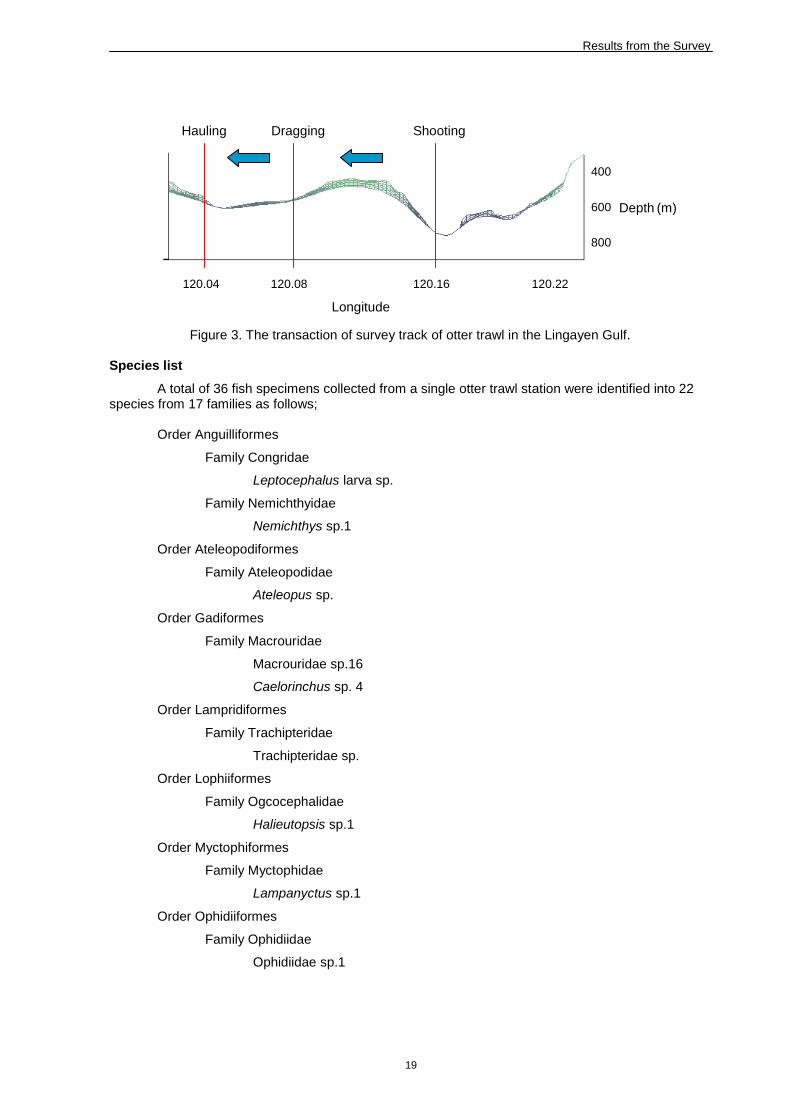
Figure 3. The transaction of survey track of otter trawl in the Lingayen Gulf. Species list
A total of 36 fish specimens collected from a single otter trawl station were identified into 22 species from 17 families as follows;
Order Anguilliformes
Family Congridae
Leptocephalus larva sp.
Family Nemichthyidae
Nemichthys sp.1
Order Ateleopodiformes
Family Ateleopodidae
Ateleopus sp.
Order Gadiformes
Family Macrouridae
Macrouridae sp.16
Caelorinchus sp. 4
Order Lampridiformes
Family Trachipteridae
Trachipteridae sp.
Order Lophiiformes
Family Ogcocephalidae
Halieutopsis sp.1
Order Myctophiformes
Family Myctophidae
Lampanyctus sp.1
Order Ophidiiformes
Family Ophidiidae
Ophidiidae sp.1
400
800
600
120.04 120.22 120.16 120.08
Depth (m)
Longitude
(East)
Shooting Hauling Dragging
Results from the Survey
20
Order Perciformes
Family Epigonidae
Epigonus atherinoides
Family A
Unidentified
Family Nomeidae
Cubiceps sp.
Family Trichiuridae
Benthodesmus tenuis
Order Squaliformes
Family Squalidae
Deania quadrispinosa
Squalidae sp.
Order Stomiiformes
Family Chauliodontidae
Chauliodus sp.
Family Gonostomatidae
Gonostoma sp.
Family Idiacanthidae
Idiacanthidae sp.
Family Malacostidae
Malacostidae sp.1
Malacostidae sp.2
Malacostidae sp.3
Six species from 5 families of cephalopods was identified from 12 specimens as follows;
Class Cephalopoda
Order Teuthida
Family Ctenopterygidae
Ctenopteryx sicula
Family Histioteuthidae
Histioteuthis meleagroteuthis
Family Octopoteuthidae
Octopoteuthis sp.
Family Ommastrephidae
Ornithoteuthis volatilis
Sthenoteuthis eualaniensis
Family Pyroteuthidae
Pyroteuthis sp.
Results from the Survey
21
There were other benthic invertebrate consisting of 7 individuals of crustacean, 8 individuals of echinoderm, 2 individuals of porifera, and 26 individuals of tunicate. The list of specimens collected as follows;
Subphylum Crustacia
Class Malacostraca
Order: Decapoda
Suborder: Dendrobranchia
Family Solenoceridae
Solanocera sp.
Suborder Pleocyemata
Family Goneplacidae
Family Pandalidae
Heterocarpus hayashii
Pandalidae sp.1
Family Palinuridae
Panulirus sp.
Family Polychelidae
Polychelidae sp.
Phylum Echinoderamata
Subphylum Asterozoa
Class: Ophiuroidea
Brittle stars (Ophiuroid)
Subphylum Echinozoa
Class: Echonoidea
Sea urchins (Echinoid)
Class: Holothuroidea
Sea cucumbers (Holothuria)
Phylum Porifera
Sponges
Phylum Chordata
Tunicate
As mentioned in this report, the only otter trawl operation was not successful due to the
damaged net, it should be note that the numbers of all collections as well as the specimen photos of all species obtained from otter trawl operation will not represented of the total catches of this survey station. 4. ACKNOWLEDGEMENTS
The authors wish to thanks to the captain and crews of the M/V DA-BFAR for their help during the surveys. We also acknowledge the support of the Fisheries Agency of Japan (Japanese Trust Fund) for funding this project.
Results from the Survey
22
5. REFERENCES
Carpenter, K.E. and V.H. Niem (eds), 1998. FAO species identification guide for fishery purposes. The living marine resources of the Western Central Pacific. Volume 1. Seaweed, corals, bivalves and gastropods. Rome, FAO, pp. 1-686
Carpenter, K.E. and V.H. Niem (eds), 1998. FAO species identification guide for fishery purposes. The living marine resources of the Western Central Pacific. Volume 2. Cephalopods, crustaceans, holothurians and sharks. Rome, FAO, pp. 687-1396.
Carpenter, K.E. and V.H. Niem (eds), 1998. FAO species identification guide for fishery purposes. The living marine resources of the Western Central Pacific. Volume 3. Batoid fishes, chimaeras and bony fishes part 1 (Elopidae to Linophrynidae). Rome, FAO, pp. 1397-2068.
Carpenter, K.E. and V.H. Niem (eds), 1998. FAO species identification guide for fishery purposes. The living marine resources of the Western Central Pacific. Volume 4. Bony fishes part 2 (Mugilidae to Carangidae). Rome, FAO, pp. 2069-2790.
Carpenter, K.E. and V.H. Niem (eds), 1998. FAO species identification guide for fishery purposes. The living marine resources of the Western Central Pacific. Volume 5. Bony fishes part 3 (Menidae to Pomacentridae). Rome, FAO, pp. 2791-3380.
Carpenter, K.E. and V.H. Niem (eds), 1998. FAO species identification guide for fishery purposes. The living marine resources of the Western Central Pacific. Volume 6. Bony fishes part 4 (Labridae to Latimeriidae), estuarine crocodiles, sea turtles, sea snakes and marine mammals. Rome, FAO, pp. 3381-4218.
OFCF. 2006. Report of the Japanese-Indonesia on Deep Sea Fishery Resources Joint Exploration Project (Final Report). Overseas Fishery Cooperation Foundation. 154 pp.
OFCF. 2006. Report of the Japanese-Indonesia on Deep Sea Fishery Resources Joint Exploration Project (Photo Album). Overseas Fishery Cooperation Foundation. 71 pp.
Matsui, T. and Rosenblatt, R.H. 1984. Review of the deep-sea fish family Platytroctidae (Pisces: Salmoniformes). Bulletin of the Scripps Institution of Oceanography, University of California, San Diego. Vol. 26. 159 pp.
Results from the Survey
Appendix: Photos of the Survey
24
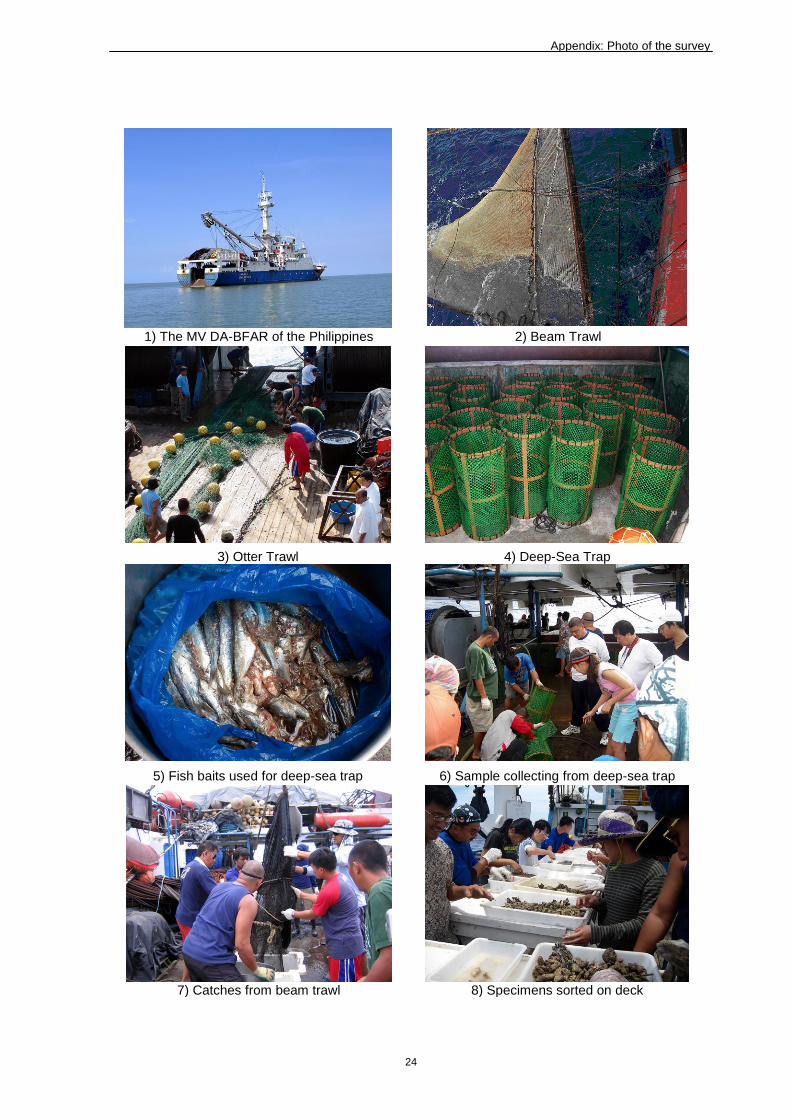
1) The MV DA-BFAR of the Philippines 2) Beam Trawl
3) Otter Trawl 4) Deep-Sea Trap
5) Fish baits used for deep-sea trap 6) Sample collecting from deep-sea trap
7) Catches from beam trawl 8) Specimens sorted on deck
Appendix: Photo of the survey
25
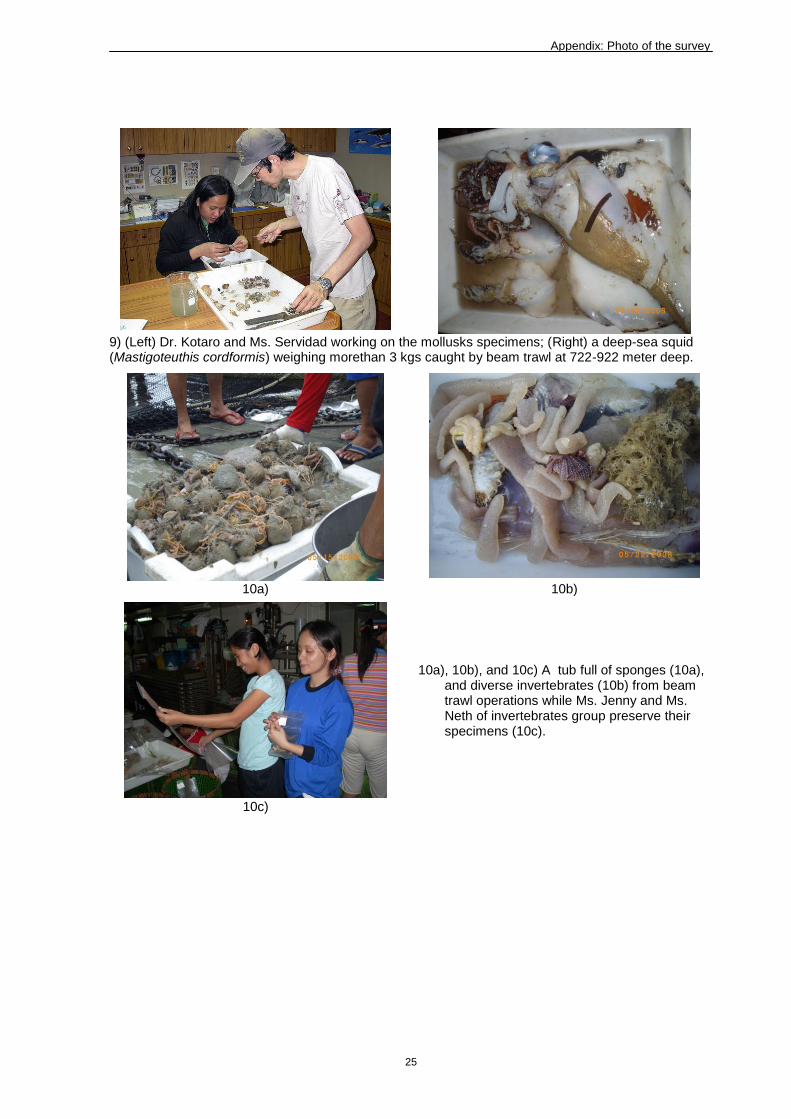
9) (Left) Dr. Kotaro and Ms. Servidad working on the mollusks specimens; (Right) a deep-sea squid (Mastigoteuthis cordformis) weighing morethan 3 kgs caught by beam trawl at 722-922 meter deep.
10a) 10b)
10a), 10b), and 10c) A tub full of sponges (10a), and diverse invertebrates (10b) from beam trawl operations while Ms. Jenny and Ms. Neth of invertebrates group preserve their specimens (10c).
10c)
Appendix: Photo of the survey