review of the state - food and agriculture organization of the state of world marine fishery...
TRANSCRIPT


Review of the state of world marine fishery resources
Marine Resources Service Fishery Resources DivisionFAO Fisheries Department
FOOD AND AGRICULTURE ORGANIZATION OF THE UNITED NATIONSRome, 2005
FAOFISHERIES
TECHNICALPAPER
457

The designations employed and the presentation of material in this information product do not imply the expression of any opinion whatsoever on the part of the Food and Agriculture Organization of the United Nations concerning the legal or development status of any country, territory, city or area or of its authorities, or concerning the delimitation of its frontiers or boundaries.
ISBN 92-5-105267-0
All rights reserved. Reproduction and dissemination of material in this information product for educational or other non-commercial purposes are authorized without any prior written permission from the copyright holders provided the source is fullyacknowledged. Reproduction of material in this information product for resale or other commercial purposes is prohibited without written permission of the copyright holders. Applications for such permission should be addressed to: Chief Publishing Management ServiceInformation Division FAO Viale delle Terme di Caracalla, 00100 Rome, Italy or by e-mail to: [email protected]
© FAO 2005

iii
PREPARATION OF THIS DOCUMENT
This document has been prepared by the Marine Resources Service, Fishery Resources Division, FAO Fisheries Department. It is part of the regular programme activities and a partial fulfilment of the Organization's role with regards to the monitoring and reporting on global marine resources and relevant environmental and ecological changes (FAO Programme Element 232A4). The main objective of this review is to provide the FAO Committee on Fisheries (COFI) and more generally, policy-makers, civil society and those who derive their livelihood from fisheries and/or have a direct interest in the conservation and management of world fishery resources with a comprehensive, objective and global review of the state of the living marine resources of the oceans. This document updates the information provided in FAO Fisheries Circular No. 920, Review of the state of world marine fishery resources: marine fisheries, issued in 1997, and also updates and expands the information provided in relevant fishery resources sections of the more recent FAO publications on The state of world fisheries and aquaculture (SOFIA). It is intended that this Review of the state of world marine fishery resources will be completely revised every six years, with briefer updates provided biennially.
Relevant sections of this review have been compiled by FAO and selected invited experts, as indicated at the beginning of each chapter. J. Csirke was responsible for the general coordination and final technical editing of this document, with the valuable assistance of J.-J. Maguire and M. Lamboeuf. R. Coppola, F. Carocci and M. Spinelli assisted with the preparation of tables and illustrations, R. Sola assisted with the typing and proofreading of main sections and E. D'Antoni illustrated the front cover and made the climate change graphs. The authors and editors gratitude is expressed to the large number of readers, collaborators and external experts that offered comments, information and suggestions based on earlier versions of this review. In this respect, thanks are expressed to: A. Aguilar Ibarra (INP, México), Alaska Fisheries Science Center, D.L. Alverson (University of Washington, Seattle, Washington, USA), P. Arenas Fuentes (INP, Mexico), D. Arosemena (Panamá), G. Bianchi (Nansen Programme, Norway), D.S. Butterworth (Marine Resource Assessment and Management Group, University of Cape Town, South Africa), A. Cockcroft (Marine and Coastal Management, South Africa), J. Coetzee (Marine and Coastal Management, South Africa), G. D'Almeida (National Marine Information and Research Centre, Namibia), V. de Barros Neto (Instituto de Investigaçao Marinha, Angola), M.E. de Leon Gonzales (Centro de Investigaciones Pesqueras, Cuba), K. Dunlop (University of Washington, Seattle, Washington, USA), L. Fereira, (Fisheries Division, Trinidad and Tobago), M. Griffiths (Marine and Coastal Management, South Africa), R. Guevara (IMARPE, Callao, Peru), S. Holloway (Marine Resource Assessment and Management Group, Cape Town, South Africa), ICES (International Council for the Exploration of the Sea), T. Iilende (National Marine Information and Research Centre, Namibia), P. McConney (Caribbean Conservation Association), R. Leslie (Marine and Coastal Management, South Africa), P. Nichols (Ministry of Fisheries and Marine Resources, Namibia), H. Nion (INAPE/DINARA, Montevideo, Uruguay), North Pacific Fisheries Science Center, E. Plaganyi (Marine Resource Assessment and Management Group, University of Cape Town, South Africa), R.A. Rademeyer (Marine Resource Assessment and Management Group, University of Cape Town, South Africa), L. Reynal (IFREMER, Martinique), S.A. Saccardo (IBAMA, Sao Paulo, Brazil), J.C. Seijo (Centro Marista de Estudios Superiores, Mérida, Mexico), L. Spadafora (Panamá), S. Sugiyama (FAO RAPI Bangkok), L. Villegas (Valparaiso, Chile), C. Waluda (Natural Environment Research Council, Cambridge, UK), J. Xavier (Natural Environment Research Council, Cambridge, UK) and many others who with our regrets are not being listed. Nevertheless and while fully recognizing the assistance received from different sources, the full responsibility for what is presented in this review lies entirely on the Organization and the authors of each chapter.
It is noted that in order to avoid repetition and to simplify the numerous references to catch information, the use of the unit "tonnes" has been abbreviated to "t" immediately following the figure without space.

iv
ABSTRACT
This document updates the regular reviews of the state of the worlds marine fisheries and fishery resources, based mainly on official catch statistics throughout 2002 and relevant stock assessment and other complementary information available until 2004. The introductory chapters refer to the global situation and major trends of world marine capture fish production and the state of the world marine fishery resources. More detailed information is provided for each FAO statistical area, together with a discussion of the major trends and changes that have occurred with the main fishery resources exploited in each area and comments on the stock assessment work undertaken in support of fisheries management in each region. Special sections address the global issue of tunas and tuna-like species and other high profile topics such as those dealing with world squid resources, deep-sea fisheries and long-term climate change and fisheries. Summary tables are provided for each statistical area showing historical and recent catches for the major marine resources and judgements on their most current state of exploitation.
FAO Marine Resources Service, Fishery Resources Division. Review of the state of world marine fishery resources. FAO Fisheries Technical Paper. No. 457. Rome, FAO. 2005. 235p.
Distribution: All FAO Members and Associate Members FAO Fisheries Department FAO Fisheries Officers in FAO Regional Offices Non-Governmental Institutions FI Marine Fisheries mailing list

CONTENTS Preparation of this document iii Abstract iv A. Global overview 1 A1. Global production and state of marine fishery resources 1 A2. Global trends in the state of marine fisheries ressources 1974-2004 10 B. Regional reviews 15 B1. Northwest Atlantic, FAO statistical area 21 (+Table D1, p. 214) 15 B2. Northeast Atlantic, FAO statistical area 27 (+Table D2, p. 215) 23 B3. Western Central Atlantic, FAO statistical area 31 (+Table D3, p. 216) 31 B4. Eastern Central Atlantic, FAO statistical area 34 (+Table D4, p. 218) 43 B5. Mediterranean and Black Sea, FAO statistical area 37 (+Table D5, p. 220) 49 B6. Southwest Atlantic, FAO statistical area 41 (+Table D6, p. 222) 65 B7. Southeast Atlantic, FAO statistical area 47 (+Table D7, p. 223) 76 B8. Western Indian Ocean, FAO statistical area 51 (+Table D8, p. 224) 87 B9. Eastern Indian Ocean, FAO statistical area 57 (+Table D9, p. 225) 94 B10. Northwest Pacific, FAO statistical area 61 (+Table D10, p. 227) 99 B11. Northeast Pacific, FAO statistical area 67 (+Table D11, p. 228) 104 B12. Western Central Pacific, FAO statistical area 71 (+Table D12, p. 229) 109 B13. Eastern Central Pacific, FAO statistical area 77 (+Table D13, p. 231) 113 B14. Southwest Pacific, FAO statistical area 81 (+Table D14, p. 232) 121 B15. Southeast Pacific, FAO statistical area 87 (+Table D15, p. 233) 130 B16. Pacific Islands Region, FAO statistical areas 71 & 77 144 B17. Southern Ocean, FAO statistical areas 48, 58 & 88 (+Table D16, p. 234) 158 C. Special topics 163 C1. Tuna and tuna-like species (+Table D17, p. 235) 163 C2. World squid resources 175 C3. Deepwater fisheries 188 C4. Fisheries and long-term climate variability 201D. Marine resources tables 212 Tables D1 to D17 214

* FAO, Marine Resources Service, Fishery Resources Division
1
A. GLOBAL OVERVIEW
A.1 GLOBAL PRODUCTION AND STATE OF MARINE FISHERY RESOURCES
by Jorge Csirke *
INTRODUCTION One of the main tasks of the Organization is to provide a comprehensive, objective and global review of the state of capture fisheries and aquaculture, and to this end the Fishery Resources Division of FAO has been monitoring the state of the main fishery resources of the world since its creation in the early 1960s. A major attempt to assess the global state of the world's marine fishery resources and to estimate their long-term production potential was made by FAO in the late 1960s and early 1970s (Gulland 1970, 1971). In those years, while the total world marine capture fish production was approaching 60 million tonnes per year after having increased at a rate of 6 percent per year since 1950 (Figure A1.1), Gulland estimated that the maximum potential for traditionally exploited marine species (Cephalopods were not included) was about 100 million tonnes per year. He also explained that, given the difficulties in ensuring the best management of each individual stock in a given area, that estimate would have to be revised downwards to a more practical maximum
potential ceiling of some 80 million tonnes. Time and further studies have so far supported this estimate.
The above efforts to assess and report on the state of global marine fishery resources were initially followed up through a series of brief summary updates (FAO, 1974, 1978, 1979, 1981, 1983, 1985, 1987, 1989, 1990, 1992) prepared as background information documents for the regular sessions of the FAO Committee on Fisheries (COFI). This regular reporting on the state of the world marine capture fishery resources continued through the production of regular stand alone publications (FAO, 1994, 1995, 1997a) and later as contribution sections to SOFIA, the major FAO Fisheries publication on the State of World Fisheries and Aquaculture (FAO, 1997b, 1999, 2000, 2002, 2004). SOFIA also has a primary objective of providing updated information to COFI and more generally, to policy-makers, civil society and all those who derive their livelihood from fisheries, while covering a much broader range of issues dealing with world fisheries.
This document is the first major revision of the state of marine fishery resources since the FAO
0
20
40
60
80
100
120
140
1950 1955 1960 1965 1970 1975 1980 1985 1990 1995 2000
Inland capture
Inland aquaculture
M arine aquaculture
M arine capture
Figure A1.1 - World production (million tonnes) from capture fisheries and aquaculture
Source FAOExcluding aquatic plants

2
(1997a) resources review, and compiles and expands the information provided in the most recent biennial updates produced for SOFIA. While the general focus and outlay of previous major reviews have been maintained to the extent possible, several changes have been introduced in this volume in response to comments and suggestions received from readers and collaborators, and also to make better use of hard copy and electronic web-based publishing possibilities.
This review provides the latest update of the state of marine fishery resources of the world by FAO and is divided into Chapters that summarize and compile the information available for each FAO major marine fishing area for statistical purposes (Figure A1.2). This chapter provides a brief summary introduction to the whole volume by highlighting the major aspects described in more detail in other chapters and by giving a broad overview of the most recent changes and current state of the major world marine fishery resources. This global overview is expanded in Chapter A2 with a brief analysis of the global trends in the state of world marine fishery resources since 1974. Chapters B1 through B17 complemented by tables in section D of this report provide details about trends in catches of each major species group and, where feasible, on the state of exploitation of main fish stocks or groups of stocks and some complementary information about the management of fisheries in each major fishing area. The special section C deals with the state of tunas and tuna-like species worldwide (Chapter C1) and world squid resources (Chapter C2), with another brief review of deep-sea resources (Chapter C3) and a chapter analysing long-term effects of climate on
fisheries production (Chapter C4) completing this section. The final set of tables in section D summarizes and complements the reviews by regions or major fishing areas of the world and main stocks or species groups organized according to the International Standard Statistical Classification of Aquatic Animals and Plants (ISSCAAP) grouping.
PROFILE OF CATCHES Total world fish production increased steadily from 19.3 million tonnes in 1950 to more than 100 million tonnes in 1989 and 134 million tonnes in 2002 (Figure A1.1). Marine capture fisheries are the largest contributors to world fish production. In 1950 marine captures were 16.7 million tonnes, representing 86 percent of the total world fish production, and by 1980 marine captures increased to 62 million tonnes, also representing 86 percent of the total. However, over the last two decades there has been a faster expansion of marine and inland water aquaculture, and the relative contribution of marine capture fisheries to the total world fish production has diminished. Nevertheless, total catches had continued to increase, but at a slower rate than aquaculture. At present, out of the total world fish production of 134.3 million tonnes in 2002, almost 63 percent (84.4 million tonnes) were produced through the exploitation of wild fish resources of the oceans. Marine and inland water aquaculture represent around 30 percent and inland water capture fisheries represent the remaining 7 percent.
After reaching about 80 million tonnes in the late-1980s, global marine catches fluctuated between 77 and 86 million tonnes, with a record
Figure A1.2 - FAO marine major fishing areas for statistical purposes

3
high of 86.7 million tonnes in 2000 and a slight decline to 84.4 million tonnes in 2002 (Figure A1.3). Most of the fluctuations in recent years were the result of changes in a few highly productive areas, particularly in the northwest Pacific (Area 61) and the southeast Pacific (Area 87), while total catches in the majority of the other fishing areas followed more or less the same general trend. Although in some areas catches have started to level off since the 1970s, such as in the northeast Atlantic (Area 27), western Central Atlantic (Area 31), eastern Central Atlantic (Area 34), Mediterranean and Black Sea (Area 37), northwest Pacific (Area 61) and eastern Central Pacific (Area 77). In other areas, such as the northwest Atlantic (Area 21) and the southeast Atlantic (Area 47), catches reached a maximum in the 1970s or early 1980s and are declining. The general trend described above provides support to the earlier estimates by Gulland (1970, 1971), and it suggests that the maximum long-term potential of the world marine capture fisheries has been reached, with some stocks and areas being overfished and some stocks not producing their full expected long-term potential. To a great extent this is confirmed by the analyses by major fishing areas and species groups discussed in other sections of this volume.
Catch composition The larger portion of the global marine catches are pelagic species, with small pelagics (ISSCAAP Group 35: herrings, sardines,
anchovies, etc.) representing around 26 percent (22.5 million tonnes) of the total catch in 2002 (Figure A1.4), down from 29 percent in the 1950s and 27 percent in 1970s. The larger pelagics (ISSCAAP Groups 36 and 37: tunas, bonitos, billfishes and miscellaneous pelagics) accounted for 21 percent (17.7 million tonnes) of the total catches in 2002, an increase in their share from 13 percent in the 1950s. Demersal fishes (ISSCAAP Groups 31, 32 and 34: flounders, halibuts, soles, cods, hakes, haddocks and miscellaneous demersals) contributed 15 percent of the total catches in 2002 (with 12.3 million tonnes), compared with almost 26 percent of the world catches in the 1950s and 1970s. Miscellaneous coastal fishes (ISSCAAP Group 33) remained stable at 6 percent and then 7 percent (with 6.1 million tonnes) in 2002, while crustaceans (ISSCAAP Groups 42, 43, 44,
0
10
20
30
40
50
60
70
80
90
100
1950 1955 1960 1965 1970 1975 1980 1985 1990 1995 2000
Pacific, Southeast
Pacific, Northwest
Pacific, Western CentralAtlantic, Southeast
Pacific, Southwest
Pacific, Northeast
Pacific, Eastern Central
M editerranean and Black Sea
Indian Ocean, WesternIndian Ocean, Eastern
Atlantic, Western Central
Atlantic, Southwest
Atlantic, Northwest
Atlantic, NortheastAtlantic, Eastern Central
Polar regions
Figure A1.3 - World marine catch (million tonnes) by major marine fisheries areas
Source FAO
M isc. coastal6.17%
Demersals12.315%
Small pelagics 22.526%
Crustaceans5.87%
Sharks & rays0.81%
Large pelagics17.721%
M olluscs6.88%
Others0.51%
Ana & diadromous
1.11%
Unident if ied10.713%
Figure A1.4 - World marine catch in 2002 (million tonnes),by main species groups
4
45, 46 and 47: crabs, lobsters, shrimps, prawns, krill, etc.) increased from 4 percent in the 1950s and 1970s to 7 percent (5.8 million tonnes) in 2002. Molluscs (ISSCAAP Groups 52, 53, 54, 55, 56, 57 and 58: abalones, conchs, oysters, mussels, scallops, clams, squids, octopus, etc.) increased slightly from 6 percent in the 1950s and 1970s to 8 percent (6.8 million tonnes) in 2002. There was a slight increase in the proportion of unidentified fish (ISSCAAP Group 39), in 2002 with 13 percent of the total catches (10.7 million tonnes), up from 11 percent in the 1950s and 1980s.
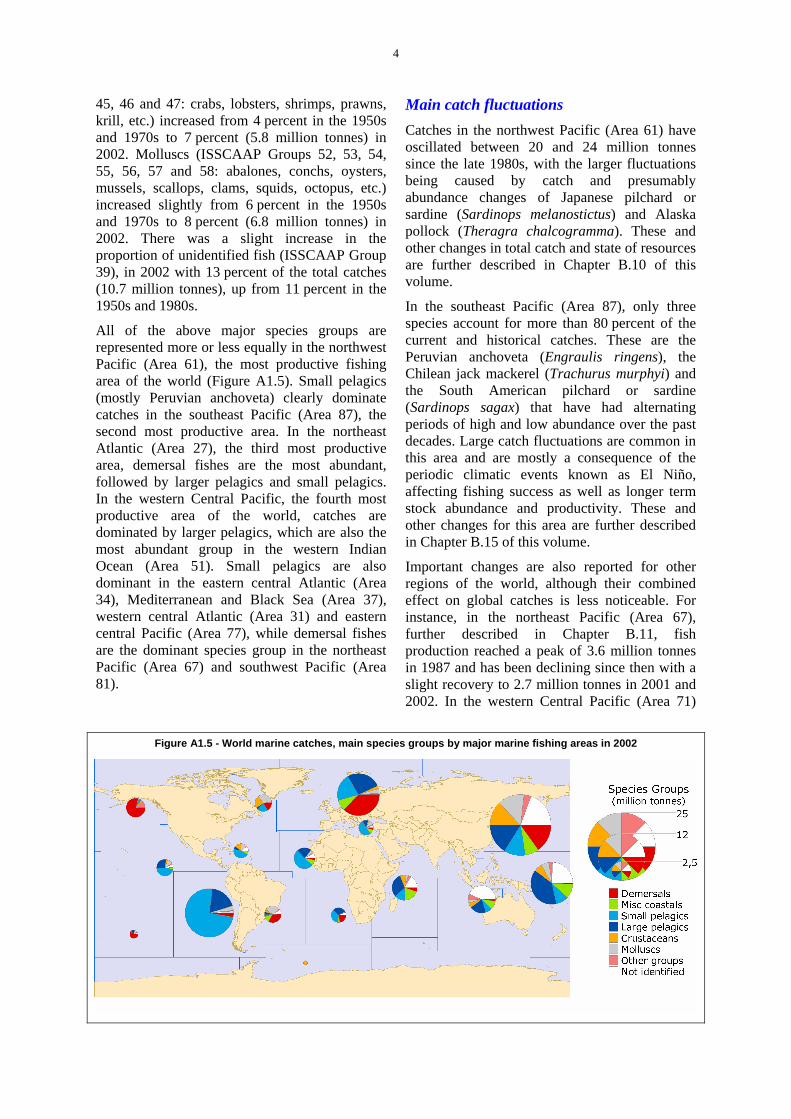
All of the above major species groups are represented more or less equally in the northwest Pacific (Area 61), the most productive fishing area of the world (Figure A1.5). Small pelagics (mostly Peruvian anchoveta) clearly dominate catches in the southeast Pacific (Area 87), the second most productive area. In the northeast Atlantic (Area 27), the third most productive area, demersal fishes are the most abundant, followed by larger pelagics and small pelagics. In the western Central Pacific, the fourth most productive area of the world, catches are dominated by larger pelagics, which are also the most abundant group in the western Indian Ocean (Area 51). Small pelagics are also dominant in the eastern central Atlantic (Area 34), Mediterranean and Black Sea (Area 37), western central Atlantic (Area 31) and eastern central Pacific (Area 77), while demersal fishes are the dominant species group in the northeast Pacific (Area 67) and southwest Pacific (Area 81).
Main catch fluctuations Catches in the northwest Pacific (Area 61) have oscillated between 20 and 24 million tonnes since the late 1980s, with the larger fluctuations being caused by catch and presumably abundance changes of Japanese pilchard or sardine (Sardinops melanostictus) and Alaska pollock (Theragra chalcogramma). These and other changes in total catch and state of resources are further described in Chapter B.10 of this volume.
In the southeast Pacific (Area 87), only three species account for more than 80 percent of the current and historical catches. These are the Peruvian anchoveta (Engraulis ringens), the Chilean jack mackerel (Trachurus murphyi) and the South American pilchard or sardine (Sardinops sagax) that have had alternating periods of high and low abundance over the past decades. Large catch fluctuations are common in this area and are mostly a consequence of the periodic climatic events known as El Niño, affecting fishing success as well as longer term stock abundance and productivity. These and other changes for this area are further described in Chapter B.15 of this volume.
Important changes are also reported for other regions of the world, although their combined effect on global catches is less noticeable. For instance, in the northeast Pacific (Area 67), further described in Chapter B.11, fish production reached a peak of 3.6 million tonnes in 1987 and has been declining since then with a slight recovery to 2.7 million tonnes in 2001 and 2002. In the western Central Pacific (Area 71)
Figure A1.5 - World marine catches, main species groups by major marine fishing areas in 2002

5
total catches have been increasing steadily since 1950, reaching almost 11 million tonnes in 2002 (Chapter B.12). In the eastern Central Pacific (Area 77) described in Chapter B.13, catches have fluctuated between 1.2 and 1.8 million tonnes since 1981, but have shown a recent increasing trend caused by the recovery of the California pilchard or sardine (Sardinops caeruleus) that yielded 722 000t in 2002, the highest on record and slightly higher than the high catch of 720 000t in 1936, which occurred during the previous high “regime” period of this species, that lasted from the late-1920s throughout the early 1940s.
In the northwest Atlantic (Area 21) fish catch production declined to a low of 2 million tonnes in 1994, following the collapse of groundfish stocks off eastern Canada. Since then catches have increased slowly to 2.3 million tonnes in 2002. These and other changes for this area are described in Chapter B.1. Major changes with some declines in total catches are reported for other areas, such as the eastern Central Atlantic (Area 34) and southwest Atlantic (Area 41) described in Chapters B.4 and B.6. Particularly worth noting are the decline of the Argentine hake (Merluccius hubbsi) since the late 1990s and the changes in abundance and resulting catches of Argentine shortfin squid (Illex argentinus) in the southwest Atlantic.
The monitoring of the state of fisheries in the western Indian Ocean (Area 51) and eastern Indian Ocean (Area 57), described in Chapters B.8 and B.9, is made particularly difficult due to the lack of information and the generally poor fishery statistics collection systems in those areas. This deficiency is reflected in the relatively high portion of catches reported as “marine fishes not identified” (ISSCAAP Group 39), meaning that no identification at species, genus or even family level have been possible when compiling official national statistics. This is also a relevant problem in other areas of the world, particularly in the northwest and western Central Pacific, and the western Central, southwest and eastern Central Atlantic (Figure A1.5).
Tunas and tuna-like species are the most important fishery resources exploited in the high seas. Their production is considerably higher in the Pacific Ocean followed by the Atlantic and Indian Oceans. As discussed in Chapter C.1, catches of the seven main commercial tuna
species increased from less than 0.5 million tonnes in the early 1950s to a maximum of 4 million tonnes in 2002, with a tendency to stabilize since 1998. Skipjack tuna (Katsuwonus pelamis) accounts for about 50 percent of this total, with 2 million tonnes in 2002, becoming this year the third highest total catch for a single species, after the Peruvian anchoveta (E. ringens) with 9.7 million tonnes and the Alaska pollock (Theragra chalcogramma) with 2.6 million tonnes.
A recurring pattern in some areas is the medium to long-term change in catch composition following the decline of some fish stocks that traditionally have been dominant in the area. For instance, in the northwest Atlantic (Chapter B.1) catches of molluscs and crustaceans have increased noticeably following the declines of demersal fishes. In the northeast Atlantic (Chapter B.2) the reduction in catches from the continuous decline of Atlantic cod (Gadus morhua) since the late 1960s has been balanced out by the increase in catches of formerly low-value species, such as blue whiting (Micromesistius poutassou) and sandeels (Ammodytes spp.). The severe decline of the Argentine hake (Merluccius hubbsi) in the southwest Atlantic (Chapter B.6) has been accompanied by an increase in the catch of shortfin squid (Illex argentinus). In the northwest Pacific (Chapter B.10) the decline in catches of the Japanese pilchard or sardine (Sardinops melanostictus) and the Alaska pollock (Theragra chalcogramma) has been somewhat compensated by the increasing catches of the Japanese anchovy (Engraulis japonicus), the largehead hairtail (Trichiurus lepturus) and squids (mostly Todarodes pacificus). The causes for these medium to long-term changes in the species composition of marine commercial catches can be multifold, including the adaptation of industry and markets to previously unattractive low valued species, the effect of fishing on the abundance of target species and on the structure of other marine communities, as well as environmental changes or regime shifts effecting the long-term abundance of the various wild fish stocks. Often these effects are confounded and in many cases they are difficult to discern, particularly in areas where research and monitoring of fishery resources and environmental processes are not well developed.

6
STATE OF EXPLOITATION The global state of exploitation of the world marine fishery resources has followed more or less the same general trend observed in previous years, as is further discussed in Chapter A.2. Throughout this report there are references to about 584 stock or species groups being monitored and on which at least general catch trends are reported in the global and regional reviews in other Chapters in this volume. Stock assessment information allowing some estimate of the state of exploitation is available on 441 (76 percent) stock or species groups. These species produced about 80 percent of the total marine catches in 2002. The remaining 143 stock or species groups, for which there is no assessment information or the available information is not sufficiently reliable to allow an estimate of their global state of exploitation, make up the remaining 20 percent of the total marine catches. This includes the 12.7 percent of world marine catches corresponding to those catches for which no proper identification, not even at the family level, is provided in official national statistics, as well as those species that even if properly identified in the official statistics, are not monitored or investigated so as to provide a reliable assessment of their state of exploitation. These usually correspond to less abundant and lower value species on which research efforts tend to be limited, although there are some major stocks and fisheries on which information is limited, including stocks of mullets, mussels, shrimps and prawns in several areas, bonga shad (Ethmalosa fimbriata) and European anchovy (Engraulis encrasicolus) in the eastern Central Atlantic, Pacific cod (Gadus macrocephalus) in the northeast Pacific, and various newly exploited deep-sea resources.
Although some efforts have been made in this review to standardize the number of marine stocks or species groups monitored and described for each major fishing area, the uneven availability of information and distribution of catch volumes has limited the number of stock groups being considered per area. Also in some fishing areas of the world there is a relatively large number of stock or species groups whose state of exploitation is undetermined or not known (Figure A1.6). The western Indian Ocean (Area 51) and western Central Atlantic (Area 31) are fishing areas with the highest incidence of stock or species groups for which the state of exploitation is reported as not known or
uncertain in the regional reviews presented in other chapters of this volume.
Of the 441 stock or species groups where assessment information is available and which have their general state of exploitation described or summarized in the regional reviews and tables in Sections B, C and D in this volume, about 3 percent are underexploited and 20 percent are moderately exploited. Stocks in these categories are the ones providing some potential for further fisheries expansion. An estimated 52 percent of the world stocks are fully exploited, and are therefore producing catches that are already at or very close to their maximum sustainable production limit, with no room for further expansion, and even some risk of decline if not properly managed. From the remaining, approximately 17 percent are over-exploited, 7 percent depleted and 1 percent recovering, and thus offer no room for further expansion (which, if any, would be conditioned to the extent of their long-term rebuilding or recovery) and even risk being part of further fishery declines if fisheries management and adequate stock recovery strategies are not put into place.
As shown in the global review of trends in Chapter A.2 (Figure A2.3), from 1974 to present there has been a downward trend in the proportion of the underexploited and moderately exploited stocks, which are those with some potential for expansion. At the same time there has been an increasing trend, with some levelling off in recent years, in the proportion of the overexploited, depleted and recovering stocks, which altogether have increased from about 10 percent in the mid-1970s to around 25 percent in the early 1990s, remaining more or less stable since then with an estimated 24 percent in 2002. This suggests that the deterioration of the situation described in previous reviews may have been halted.
The stocks of seven of the top ten species that account for 30 percent of the world total marine capture fisheries production are either fully exploited or overexploited and therefore no sustainable increases in catches can be expected from these species. These include two stocks of Peruvian anchoveta (Engraulis ringens) in the southeast Pacific that are overexploited after recovering from a recent decline, Alaska pollock (Theragra chalcogramma) that is fully exploited in the North Pacific, Japanese anchovy (Engraulis japonicus) that is fully exploited in

7
the northwest Pacific, blue whiting (Micromesistius poutassou) that is overexploited in the northeast Atlantic, capelin (Mallotus villosus) that is fully exploited in the North Atlantic and Atlantic herring (Clupea harengus) with several stocks in the North Atlantic, most of them fully exploited. Another two of the top ten species can probably support some limited increase in catches in parts of their distribution range where they are reported as still moderately exploited. This is the case of the chub mackerel (Scomber japonicus) in the southeast Pacific and eastern Central Pacific and Skipjack tuna (Katsuwonus pelamis) in the Pacific and Indian Oceans as well as in parts of the western Atlantic. In other parts of their worldwide distribution range these two species are also reported as fully exploited, and therefore offer no
possibilities of a sustained increase in catches. The status of the tenth top species, the largehead hairtail (Trichiurus lepturus) is reported as unknown in most of its areas of distribution, particularly in the northwest Pacific and western Indian Ocean. In other areas such as the eastern Indian Ocean and western Central Atlantic it is far less abundant. In the former, it is reported as moderately to fully exploited.
As noted above, about 52 percent of the stocks whose state of exploitation is known are fully exploited. The major fishing areas with the highest proportions (69-77 percent) of fully exploited stocks are the western Central Atlantic, eastern Central Atlantic, northwest Atlantic, western Indian Ocean and northwest Pacific (Figure A1.7). While the areas with the highest proportions (46-60 percent) of overexploited,
Figure A1.6 - State of exploitation of selected stock or species groups, by major marine fishing areas, 2004
Figure A1.7 - State of exploitation of selected stock or species groups for which assesment information is available, by major marine fishing areas, 2004

8
depleted and recovering stocks are the southeast Atlantic, southeast Pacific, northeast Atlantic and (for tuna and tuna-like species) Oceanic areas of the Atlantic and Indian Oceans. Few areas of the world report a relatively high number (48-70 percent) of species or stock groups as still being underexploited or moderately exploited, as is the case of the eastern Central Pacific, western Central Pacific and southwest Pacific. Some areas have 20-30 percent of stocks still considered moderately or underexploited such as the Mediterranean and Black Sea, southwest Atlantic and eastern Indian Ocean.
The combination of heavy fishing pressure and severe adverse environmental conditions associated with changes in the El Niño Southern Oscillation led in recent years to the sharp decline in the three most abundant species in the southeast Pacific, the Peruvian anchoveta, the South American pilchard (or sardine) and the Chilean jack mackerel. The stocks of Peruvian anchoveta have shown signs of recovery and at present are most likely fully or overexploited with catches in the order of 7 to 11 million tonnes per year after a sharp decline to only 1.7 million tonnes in 1998. The South American pilchard has declined sharply as part of a decadal regime period and in 2002 yielded only 28 000t after yielding up to 6.5 million tonnes in 1985 during its latest high abundance regime period. The Chilean jack mackerel is assessed as fully to overexploited and yielded 1.7 million tonnes in 2002 after declining continuously from a peak production of 5 million tonnes in 1994. The Chilean jack mackerel and particularly the South American pilchard are at present in a period of natural low abundance and it is expected that they may enter a period of high abundance when favourable environmental conditions return, provided they are not excessively exploited during the current phase. It is also unlikely that environmental conditions would be favourable for all three species above simultaneously.
In the northwest Pacific large changes in the abundance of Japanese pilchard or sardine, Japanese anchovy and Alaska pollock have also occurred in response to heavy fishing and to natural decadal oscillations. After a high abundance period in the 1980s, the Japanese pilchard declined in the mid-1990s and was followed by a strong recovery of the Japanese anchovy population which has supported catches close to 2 million tonnes per year since 1988. This alternation of sardine (or pilchard) and
anchovy stocks follows a pattern also observed in other regions of the world that seem to be mainly governed by climatic regimes affecting stock distribution and overall fish abundance. The stocks of Alaska pollock in the northwest Pacific are considered to be fully to overexploited, while those in the northeast Pacific are considered fully exploited. Catches of Alaska pollock peaked in the late-1980s and have been declining since in both areas, although there is a recent recovery in the northeast Pacific. In the northeast Atlantic catches of blue whiting have increased steeply and the species is considered overexploited. Most of the stocks of Atlantic cod in the area are also overexploited or depleted, while capelin and herring are exploited to their full potential
The summary review in Chapter A2 of this volume, shows that the proportion of overexploited, depleted and recovering stocks is not increasing as was the case until the mid-1990s and that there is a slight increase in the number of fully exploited stocks. As pointed above, the levelling off in the rate of increase of overexploited (and depleted and recovering) stocks is a positive signal suggesting that the worrying trends observed in the past might start being reversed. The signal is still weak, however, and there is still room for substantial improvements, both at regional and national levels, in the assessment and management of a large number of important fishery resources of the world. At global level there are still almost 25 percent of fish stocks that are overexploited, depleted or recovering, and for which more effective fisheries management is required. Fisheries on the fully exploited stocks also need to be monitored and managed carefully and continuously to avoid becoming overexploited or depleted.
There is a long way to go before society can be satisfied with the trends and state of exploitation of world fisheries resources. Almost 76 percent (52 percent that are fully exploited and 24 percent that are or have been overexploited) of fish stocks for which assessment information is available, need to be monitored and managed on a continuous basis and/or need to be rebuilt to ensure sustainability objectives. In addition, there is still 20 percent of the world catches that are taken from stocks or species groups for which there is not sufficient information to assess their state of exploitation. Furthermore, within the above, there is a high proportion of the total marine catches for which there is no reliable

9
information on what species are being caught. Therefore greater efforts are to be made at all levels and stages of fisheries research and management, and these should range from improving the identification of species being caught and landed, to improving the information base for the proper assessment of fish stocks and management of their fisheries. These are some of the most important steps to effectively promote the application of the Code of Conduct for Responsible Fisheries and assist member countries in complying with the recommendations of the 2002 Johannesburg World Summit on Sustainable Development regarding the need to rebuild overexploited and depleted stocks with specific targets for the year 2015. It is hoped that this review will contribute towards these aims.
REFERENCES Gulland, J.A. 1970. The fish resources of the ocean. FAO Fisheries Technical Paper, No. 97: 425p.
Gulland, J.A. 1971. The fish resources of the ocean. Fishing News Books, England. 255p.
FAO. 1974. Review of the status of exploitation of the world fish resources. FAO Fisheries Circular, No. 328: 30p.
FAO. 1978. Review of the state of world fishery resources. FAO Fisheries Circular, No. 710: 47p.
FAO. 1979. Review of the state of world fishery resources. FAO Fisheries Circular, No. 710 (Rev.1): 46p.
FAO. 1981. Review of the state of world fishery resources (marine areas and inland waters). FAO Fisheries Circular, No. 710 (Rev.2): 60p.
FAO. 1983. Review of the state of world fishery resources. FAO Fisheries Circular, No. 710 (Rev.3): 47p.
FAO. 1985. Review of the state of world fishery resources. FAO Fisheries Circular, No. 710 (Rev.4): 64p.
FAO. 1987. Review of the state of world fishery resources. FAO Fisheries Circular, No. 710 (Rev.5): 64p.
FAO. 1989. Review of the state of world fishery resources. FAO Fisheries Circular, No. 710 (Rev.6): 58p.
FAO. 1990. Review of the state of world fishery resources. FAO Fisheries Circular, No. 710 (Rev.7): 89p.
FAO. 1992. Review of the state of world fishery resources. FAO Fisheries Circular, No. 710 (Rev.8) Pt1: 114p. Pt2: 28p.
FAO. 1994. Review of the state of world marine fishery resources. FAO Fisheries Technical Paper, No. 335: 136p.
FAO. 1995. Review of the state of world marine fishery resources: marine fisheries. FAO Fisheries Circular, No. 884: 105p.
FAO. 1997a. Review of the state of world marine fishery resources: marine fisheries. FAO Fisheries Circular, No. 920: 173p.
FAO. 1997b. The State of World Fisheries and Aquaculture 1996 - SOFIA, Rome, Italy, 125p.
FAO. 1999. The State of World Fisheries and Aquaculture 1998 - SOFIA, Rome, Italy, 112p.
FAO. 2000. The State of World Fisheries and Aquaculture 2000 - SOFIA, Rome, Italy, 142p.
FAO. 2002. The State of World Fisheries and Aquaculture 2002 - SOFIA, Rome, Italy, 150p.
FAO. 2004. The State of World Fisheries and Aquaculture 2004 - SOFIA, Rome, Italy, 154p.
* FAO, Marine Resources Service, Fishery Resources Division and Fishery Information, Data and Statistics Unit
10
A2. GLOBAL TRENDS IN THE STATE OF MARINE FISHERIES RESOURCES 1974-2004
by Serge M. Garcia, Ignacio de Leiva Moreno and Richard Grainger *
INTRODUCTION Following the publication of its first global review of marine fish stocks in the early 1970s, the FAO's Fisheries Department has been monitoring regularly the state of these resources, publishing the results in "The State of World Fishery Resources, Marine Fisheries". This chapter largely draws on preceding papers FAO, (2000) and Garcia and de Leiva Moreno (2001, and 2003), updated with the latest estimates presented in other chapters of this volume. The present issue of the marine resources review is presented by FAO statistical area and by type of resources. It is based on the analysis of two sets of data: (1) the result of stock assessment from scientists and regional fishery bodies and arrangements or working groups, compiled by the Marine Resources Service up to 2004 and (2) the fishery statistics submitted by the FAO members to the Fisheries Information, Data and Statistic Unit, up to 2002. A summary of the assessment is also made available in the biennial FAO Fisheries Department flagship publication "The State of World Fisheries and Aquaculture" (SOFIA). This article is an update of the SOFIA 2000 summary.
GLOBAL SITUATION The assessment data available to FAO in 2004 in the 17 FAO statistical region areas plus the "Tuna" category, is discussed in each chapter and has been summarized in the final tables in this volume. These tables concern 584 "stock" items and information concerning their state is available for 441 (76 percent) of them. The proportion of stocks for which no information is available has remained stable throughout the last 15 years even though the absolute number of "stock" items considered has increased
3%
20%
52%
17%
7%
1%
0% 10% 20% 30% 40% 50% 60%
Under-explo ited (U)
M oderatelyexplo ited (M )
Fully expoited (F)
Over-explo ited (O)
Depleted (D)
Recovering (R)
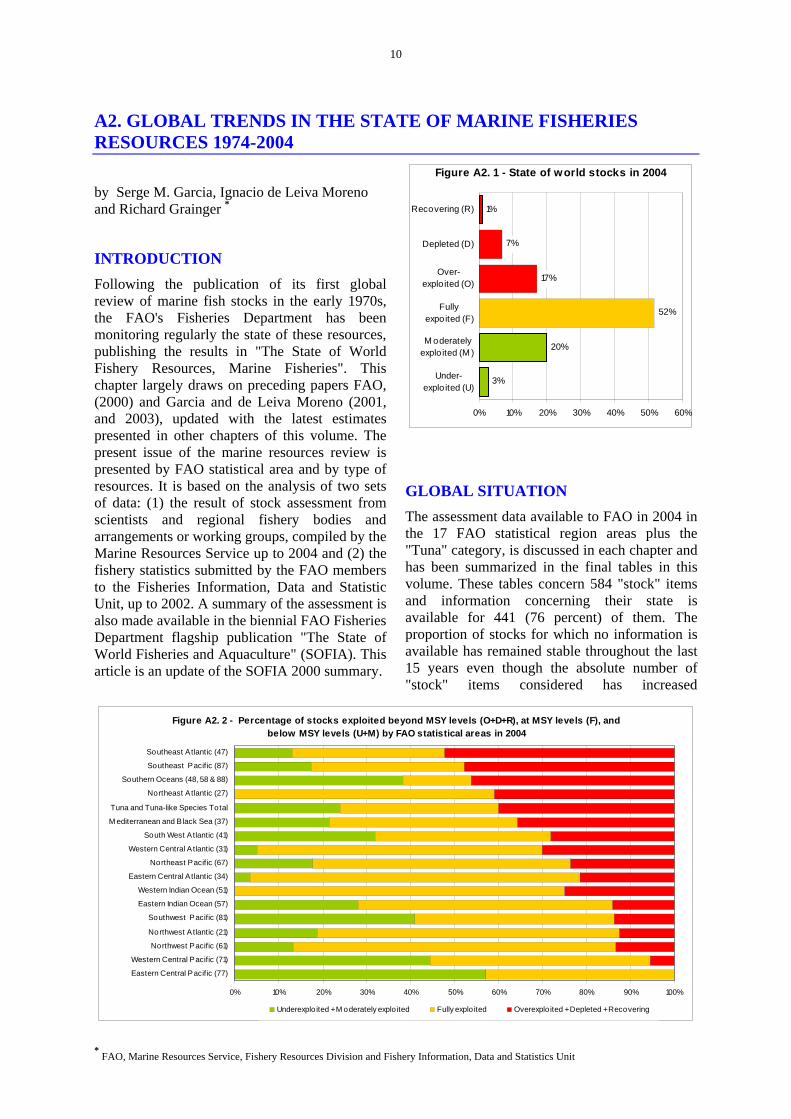
Figure A2. 1 - State of world stocks in 2004
Figure A2. 2 - Percentage of stocks exploited beyond MSY levels (O+D+R), at MSY levels (F), and below MSY levels (U+M) by FAO statistical areas in 2004
0% 10% 20% 30% 40% 50% 60% 70% 80% 90% 100%
Eastern Central Pacific (77)
Western Central Pacific (71)
Northwest Pacific (61)
Northwest A tlantic (21)
Southwest Pacific (81)
Eastern Indian Ocean (57)
Western Indian Ocean (51)
Eastern Central Atlantic (34)
Northeast Pacific (67)
Western Central A tlantic (31)
South West A tlantic (41)
M editerranean and Black Sea (37)
Tuna and Tuna-like Species Total
Northeast Atlantic (27)
Southern Oceans (48, 58 & 88)
Southeast Pacific (87)
Southeast Atlantic (47)
Underexplo ited + M oderately explo ited Fully explo ited Overexplo ited + Depleted + Recovering

11
significantly. Among the 441 "stock" items for which information was available (Figure A2.1), 3 percent (-1), appeared underexploited, 20 percent (0) moderately exploited, 52 percent (+5) fully exploited, 17 percent (-1) overexploited, 7 percent (-2) depleted and 1 percent recovering (0). Percentages in brackets indicate the absolute variations compared to previous figures for 1999. Even though the number of fully exploited and overexploited stocks have respectively increased and decreased, these year-to-year variations must be interpreted with caution.
STATE BY REGION The global picture given in Figure A2.1 can be examined by region for more detail (Figure A2.2). The percentage of stocks exploited at or beyond levels corresponding to MSY (F+O+D+R), ranges from 43 percent (for the Eastern Central Pacific) to 100 percent in the Western Central Atlantic, the Western Indian Ocean and the Northeast Atlantic. In 12 out of 17 regions, at least 70 percent of the stocks are already fully fished or overfished (F+O+D+R) pointing to the need for increased control of fishing capacity.
It should be noted that the Western Central Atlantic and Western Indian Ocean are the two FAO statistical areas with the highest percentage of stocks for which no information on state is available. The results for the Southern Ocean are heavily influenced by the under-exploitation of its krill stocks.
On the other hand, referring to the UNCLOS requirement to fish at or below MSY (U+M+F), it can be noted that the percentage of stocks exploited at or below that level of exploitation ranges from 48 percent in the Southeast Atlantic to 100 percent in the Eastern Central Pacific. Overall, out of the seventeen regions, eleven have at least 70 percent of their stocks exploited at or above that level.
GLOBAL TRENDS IN THE STATE OF STOCKS The present situation of the resources may be better appreciated when examined against the longer-term trends. These can be assessed in two ways: (1) looking back at the analytical data on the state of exploitation of the stocks since 1974;
and (2) analysing historical trends in the catch data available at FAO.
State of exploitation of world stocks The data (similar to those used in Figure A2.1) available since 1974 indicate that, in proportion, stocks exploited at the level of the MSY (Figure A2.3, top line), have decreased steadily from 1974 to 1995, with a clear reversal of this trend after 1995. The trend of the stocks offering potential for expansion (Figure A2.3, middle line) is clearly downwards, decreasing from 40 percent in 1970, to 24 percent in 2004. The proportion of overexploited stocks (Figure A2.3, bottom line) have increased, from about 10 percent in the mid-1970s to close to 25 percent in the early 2000s, but as it can be seen from the figure, the proportion of overexploited stocks remains more or less stable since the late 1980s.
0%
10%
20%
30%
40%
50%
60%
70%
80%
90%
100%
51-55
56-60
61-65
66-70
71-75
76-80
81-85
86-90
91-95
96-00
Recovering
Senescent
M ature
Developing
Undeveloped
Figure A2.4 - Stage of development of the 200 major marine fishery resources: 1950-2000
Figure A2.3 - Global trends in world stocks state of exploitation: 1974-2004
0%
10%
20%
30%
40%
50%
60%
1970 1975 1980 1985 1990 1995 2000 2005
Underexplo ited + M oderately explo ited
Fully explo itedOverexplo ited + Depleted + Recovering

12
Historical analysis of catch trends The historical evolution of the state of world fisheries resources was assessed in FAO through an analysis of historical catch data from 1950 to 1994, for the world (Grainger and Garcia, 1996) and for the Eastern Central Atlantic (Garibaldi and Grainger, 2003). The analysis has been
updated (Figure A2.4) using fishery statistics up to 2001. It is based on a simple generalized fishery development model incorporating five phases: (1) Undeveloped: low initial catches; (2) Developing: rapidly rising catches; (3) Maturing: catches reaching and remaining around their historical maximum; (4) Senescent: catches consistently falling below the historical maximum; (5) Recovering (a category not considered in the earlier studies): catches showing a new phase of increase after a period of senescence. The catch data used in the present study include finfish, crustaceans and molluscs.
The top 200 species items (or "resources") used for the present analysis, accounting for 66 percent of marine capture fishery production during 1950-2001, were selected on the basis of average annual landings from each marine statistical major fishing area over the whole period. The data referring to landings of aggregated species have been excluded from the analysis except where the grouping is confined to a single genus (e.g. Loligo spp. - Common squids).
The 200 time series were rescaled (Mean = 0; Standard deviation = 1) giving equal weight to all resources, independently of their magnitude and variance, to facilitate comparison, smoothed (3-year moving average) and grouped by shape using the K-Means Cluster Analysis (as implemented in STATISTICA Version 6, with default settings and limiting the number of clusters to 12). Based on an analysis of the slope, the profiles have been sliced into phases corresponding to the 5 stages of development indicated above. The total number (and percentage) of resources in each phase were calculated each year, across the whole data set.
The overall pattern is shown in Figure A2.4. The proportion of "undeveloped" resources fell to zero by the mid 1970s. That of "developing" resources increased until the late 1980s and decreased since the early 1990s. The "mature" resources have kept increasing since the beginning of the series. The "senescent" resources (probably affected by overfishing) increased from the beginning and may have stabilized during the last decade. Recovering resources seem to have been increasing in recent years as a result of improved management as well as favorable climatic conditions. Overall, there has been little change since the early 1990s except in the recovering category. The fact that 0%
10%
20%
30%
40%
50%
60%
70%
80%
90%
100%
1950s 1960s 1970s 1980s 1990s
Recovering
Senescent
M ature
Developing
Undeveloped
Figure A2.7 - Stage of development of the 50 most important epipelagic and deepwater resources
0%
10%
20%
30%
40%
50%
60%
70%
80%
90%
100%
1950s 1960s 1970s 1980s 1990s
Recovering
Senescent
M ature
Developing
Undeveloped
Figure A2.5 - Stage of development of the 50 most important top predators fish resources
(trophic level >4)
0%
10%
20%
30%
40%
50%
60%
70%
80%
90%
100%
1950s 1960s 1970s 1980s 1990s
Recovering
Senescent
M ature
Developing
Undeveloped
Figure A2.6 - Stage of development of the 50 most important other fish predators resources
(3.5 < trophic level < 4)

13
over two thirds of the resources appear either "mature", "senescent" or "recovering" underscores the global and priority need to control fishing effort and capacity.
Comparing the results for the period 1996-2000 in the two different analyses, state of stocks versus catch trends (Table A2.1), it appears that the analysis of catch trends indicates slightly more overexploited stocks (29 percent against 25 percent), more recovering stocks (7 percent against 1 percent), more developing stocks (32 percent against 21 percent) and less mature fisheries (32 percent against 48 percent). Altogether, considering that the catch trend analysis covers only 66 percent of the world catch, it is reassuring in terms of the analyses (if not the results) to see that both approaches agree that the vast majority of stocks (68 percent and 74 percent respectively) are exploited at or beyond maximum sustainable potential.
The same time series analysis has been repeated, selecting the 50 most productive resources in the following selected sets: (1) Top predators with a trophic level equal to or above 4, mainly tunas and tuna like species, limiting to 6 the number of clusters (Trophic level values were obtained from FISHBASE http://www.fishbase.org/home.htm); (2) Other predators with a trophic level between 3.5 and 4, mainly groundfish high value species, also limiting to 6 the number of clusters; and (3) Epipelagic and deepwater species as defined by Garibaldi and Limongelli (2003), limiting to 5 the number of clusters.
Results are presented in Figures A2.5-7. With respectively 68 percent, 80 percent and 58 percent of the resources in the mature, senescent and recovering phases. The top predators (Figure A2.5) while under very heavy pressure appear somewhat less pressurized than
the lower-level predators (Figure A2.6). This may be a feature of fishing technology development where, for example, large scale purse seining for tuna developed later than trawling for groundfish species.
As might be expected, fishing for epipelagic and deepwater species appear to be in earlier stages of development than the other groups, as during the last two decades, these oceanic and deepwater species represent the "last frontier" in the exploitation of marine fishery resources.
REGIONAL TRENDS The trend of stocks exploited beyond MSY (O+D+R) levels can be decomposed according to major regions of the Atlantic and Pacific oceans. Distinction has been made between Northern (mainly exploited by developed countries) areas of the oceans and their Central and Southern areas (mainly exploited by tropical and developing countries).
Table A2.1 Comparison of the present state of fisheries resources from the respective analyses of
state of stocks (average 1997-2004) and catch trends (average 1996-2001) in percentages
State of stocks Catch trends
Underexploited (U) 5 0 Underexploited Moderately exploited (M) 21 32 Developing
Fully exploited (F) 48 32 Mature Overexploited (O) 17
Depleted (D) 8 29 Senescent
Recovering (R) 1 7 Recovering
0%
10%
20%
30%
40%
50%
60%
1970 1975 1980 1985 1990 1995 2000 2005
Tropical AtlanticTropical PacificSouthern Ocean
Figure A2.9 - Percentage of stocks exploited beyond MSY in the Central and Southern (Tropical)
Atlantic and Pacific Oceans, and in the Southern Ocean, 1974-2004
0%
10%
20%
30%
40%
50%
1970 1975 1980 1985 1990 1995 2000 2005
North Atlantic
North Pacific
Figure A2.8 - Percentage of stocks exploited beyond MSY in the Northern Atlantic and Pacific
Oceans, 1974-2004

14
In the North Atlantic and Pacific, an increasing proportion of stocks were exploited beyond MSY level until the late 1980s or early 1990s (Figure A2.8). The situation seemed to improve and stabilize after the 1990s. The apparent decrease in 2003 in the North Pacific needs to be confirmed in the coming years. In the tropical parts of the Atlantic and Pacific oceans (central and Southern regions), the proportion of stocks exploited beyond MSY has been increasing since the late 1970s (Figure A2.9). The increase might be reaching an asymptote in the Atlantic but this does not seem to be the case yet in the Pacific. The proportion of stocks affected appears higher in the Atlantic. For the Southernmost part of these oceans (in the Antarctic) the situation appears indeed more serious.
REFERENCES Fishstat Plus. 2000. Universal software for fishery statistical series. Version 2.30. (Also available at http://www.fao.org/fi/statist/FISOFT/ FISHPLUS.asp). Capture production 1950-2001.
Garibaldi, L. & Grainger, R.J.R. 2005. "Chronicles of catches from marine fisheries in the Eastern Central Atlantic for 1950-2000. In: Ba, M., P. Chavance, D. Gascuel, D. Pauly & M. Vakily (eds.), Proceedings of the Symposium "Marine fisheries, ecosystems, and societies in
West Africa: half a century of change", Dakar, Sénégal, 24-28 June 2002. ACP-EU Fisheries Research Report of the European Union, in press.
Garibaldi, L. & Limongelli, L. 2003. Trends in oceanic captures and clustering of large marine ecosystems: two studies based on the FAO capture database. FAO Fisheries Technical Paper, No. 435: 71p.
Grainger, R.J.R. & Garcia, S.M. 1996. Chronicles of marine fishery landings (1950-1994): Trend analysis and fisheries potential, FAO Fisheries Technical Paper, No. 359: 51p.
FAO. 2000. Trends in world fisheries and their resources: 1974-1999, In: The State of World Fisheries and Aquaculture 2000. FAO, 2000, pp. 98-104.
Garcia, S.M. & de Leiva Moreno, J.I. 2001. Marine Fisheries Resources: Global State In: Steele, J., Thorpe, S. & Turekian, K. (eds). Encyclopedia of Ocean Sciences. Academic Press 2001, pp. 1548-1589.
Garcia, S.M. & de Leiva Moreno, J.I. 2003. Global Overview of Marine Fisheries In: Sinclair, M., & Valdimarsson, G. (eds) Responsible Fisheries in the Marine Ecosystem. FAO & CABI Publishing 2003, pp. 1-24.