status of the south african marine fishery resources...
TRANSCRIPT
STATUS OF THE SOUTH AFRICANMARINE FISHERY RESOURCES
2014

1
STATUS OF THE SOUTH AFRICAN MARINE FISHERY RESOURCES
2014 Department of Agriculture, Forestry and Fisheries
(Cape Town, South Africa)
ForewordFood security and nutrition, job creation and contribution to GDP are three central pillars of the Department of Agriculture Forestry and Fisheries (DAFF) policy for the foreseeable future. The fisheries sector in South Africa is worth around six to seven billion rand per annum and directly employs, in the commercial sector, some 27 000 people. Many thousands more people depend on fisheries resources for food and as a source of income to meet basic needs. The importance of maintaining or even increasing the yields from these fisheries by sustainable harvesting and the recovery of depleted stocks is therefore of paramount importance.
Sound scientific research remains one of the cornerstones for sustainable utilization of fisheries resources and, together with the Resource Management, Monitoring Control and Surveillance functions it strives to ensure that our fisheries contribute to the Department’s stated goals.
The Status of South African Marine Resources Reports produced by DAFF are now recognized as an important contribution to our under-standing of South Africa’s exploited marine resources. The information is presented in a way that is of use to both scientists, fisheries managers; fishing industry stakeholders and the public. The maintenance of the high standard of research on our exploited marine resources is essential especially given the many challenges that face the sector including the imminent implementation of the Small Scale Fisheries Policy.
This third edition of the Status of South African Marine Resources Report attempts to collate the most up-to-date information about these valuable resources based on our own and other research efforts. We are proud to have maintained the production of such a valuable and qual-ity publication, alongside the African Journal of Marine Science, our in-house journal. The latter is a world class science journal which attempts (and generally succeeds) in capturing the best work of especially African scientists.
I would like to thank the scientists and technicians of the Department, the people at the coal-face of research planning, surveys, data capture, analysis and reporting. The contribution of external scientists via the various Scientific Working Groups is also acknowledged.
EDITH V VRIESDIRECTOR GENERAL
CONTENTS
Acronyms and abbreviations .............................................................................................................
Overview .......................................................................................................................................... 1
About the report ............................................................................................................................ 4
Abalone ............................................................................................................................................. 5
Agulhas sole ................................................................................................................................... 11
Cape hakes ..................................................................................................................................... 15
Cape horse mackerel .................................................................................................................... 21
Linefish ............................................................................................................................................. 25
Netfish ............................................................................................................................................. 29
Oysters ............................................................................................................................................ 32
Patagonian toothfish ..................................................................................................................... 35
Prawns .............................................................................................................................................. 39
Seaweeds ......................................................................................................................................... 42
Sharks ............................................................................................................................................... 45
Small invertebrates and new fisheries....................................................................................... 49
Small pelagic fish (sardine, anchovy and round herring) ....................................................... 52
South Coast rock lobster ............................................................................................................ 60
Squid ................................................................................................................................................. 63
Tunas and swordfish ...................................................................................................................... 66
West Coast rock lobster ............................................................................................................. 71
ISBN: 978-0-621-43109-4
Compiler: Kim Prochazka
Contributors (in alphabetical order): Rob Anderson, Lutz Auerswald, Doug Butterworth,
Andrew Cockcroft, Janet Coetzee, Charlene da Silva, Deon Durholtz, Tracey Fairweather, Yonela
Geja, Jean Githaiga-Mwicigi, Derek Kemp, Sven Kerwath, Stephen Lamberth, Rob Leslie, Angus
Mackenzie, Genevieve Maharaj, Sekiwe Mbande, Kim Prochazka, Mark Rothman, Larvika Singh,
Nandipha Twatwa, Carl van der Lingen, Wendy West.
Graphics, Design and Lay-out: Cathy BoucherPhoto credits: Department of Agriculture, Forestry and Fisheries, Claudio Velasques Rojas,Dennis KingProduction Manager: Carol Moses
Acronyms and abbreviations
ASPM Age-structured production model
CAL Catch-at-length
CCAMLR Convention for the Conservation of Antarctic Marine Living Resources
CCSBT Commission for the Conservation of Southern Bluefin Tuna
CL Carapace length
CoG Centre of gravity
CPUE Catch per unit effort
DAFF Department of Agriculture, Forestry & Fisheries
EC Exceptional circumstances
EEZ Exclusive economic zone
EFZ Exclusive fishing zone
FIAS Fishery-independent abalone survey
FIMS Fishery-independent monitoring survey
FMSY Fishing mortality that would produce MSY level
GERMON Genetic structure and migration of albacore tuna project
GIS Geographic information system
GLM General linear model
GLMM General linear mixed model
ICCAT International Convention for the Conservation of Atlantic Tunas
ICSEAF International Commission for the South East Atlantic Fisheries
IFREMER DIO French Research Institute for Exploration of the Sea, Indian Ocean Delegation
IOTC Indian Ocean Tuna Commission
IUCN International Union for Conservation of Nature
IUU Illegal, unreported and unregulated fishing
KZN KwaZulu-Natal
LMP Linefish management protocol
MLRA Marine Living Resources Act
MLS Minimum legal size
MPA Marine protected area
MSY Maximum sustainable yield
NMLS National marine linefish system
NPOA National plan of action
NRCS National Regulator for Compulsory Standards
OMP Operational management procedure
ORI Oceanographic Research Institute
PEI-EEZ Prince Edward Island exclusive economic zone
PMCL Precautionary management catch limit
PSAT Pop-up satellite archival tag
PUCL Precautionary upper catch limit
RFMO Regional fisheries management organization
SB Shell breadth
SPOT Smart position-only tag
SSB Spawning stock biomass
SSBMSY Spawning stock biomass at MSY level
SWIO Southwest Indian Ocean
SWIOFP Southwest Indian Ocean Fisheries Project
TAB Total allowable by-catch
TAC Total allowable catch
TAE Total allowable effort
TRAFFIC The Wildlife Trade Monitoring Network
TURF Territorial user rights in fisheries
USA United States of America
WWF World Wildlife Fund
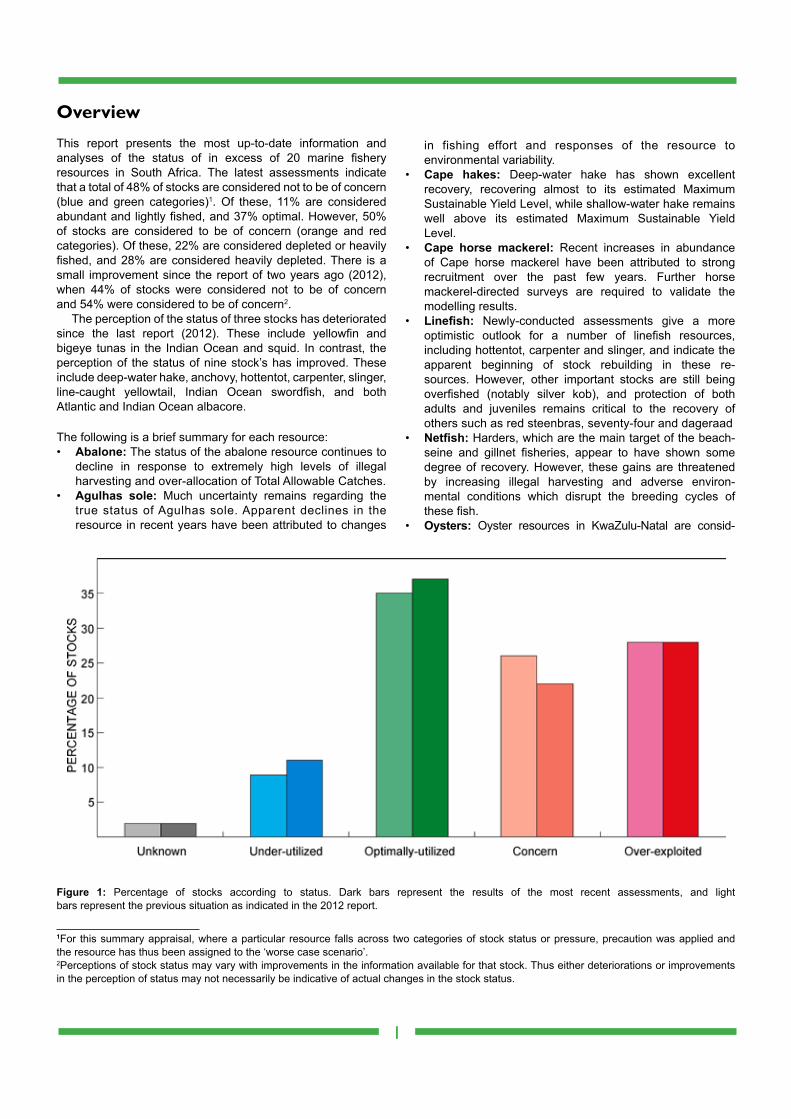
OverviewThis report presents the most up-to-date information and analyses of the status of in excess of 20 marine fishery resources in South Africa. The latest assessments indicate that a total of 48% of stocks are considered not to be of concern (blue and green categories)1. Of these, 11% are considered abundant and lightly fished, and 37% optimal. However, 50% of stocks are considered to be of concern (orange and red categories). Of these, 22% are considered depleted or heavily fished, and 28% are considered heavily depleted. There is a small improvement since the report of two years ago (2012), when 44% of stocks were considered not to be of concern and 54% were considered to be of concern2.
The perception of the status of three stocks has deteriorated since the last report (2012). These include yellowfin and bigeye tunas in the Indian Ocean and squid. In contrast, the perception of the status of nine stock’s has improved. These include deep-water hake, anchovy, hottentot, carpenter, slinger, line-caught yellowtail, Indian Ocean swordfish, and both Atlantic and Indian Ocean albacore.
The following is a brief summary for each resource:• Abalone: The status of the abalone resource continues to
decline in response to extremely high levels of illegal harvesting and over-allocation of Total Allowable Catches.
• Agulhas sole: Much uncertainty remains regarding the true status of Agulhas sole. Apparent declines in the resource in recent years have been attributed to changes
in fishing effort and responses of the resource to environmental variability.
• Cape hakes: Deep-water hake has shown excellent recovery, recovering almost to its estimated Maximum Sustainable Yield Level, while shallow-water hake remains well above its estimated Maximum Sustainable Yield Level.
• Cape horse mackerel: Recent increases in abundance of Cape horse mackerel have been attributed to strong recruitment over the past few years. Further horse mackerel-directed surveys are required to validate the modelling results.
• Linefish: Newly-conducted assessments give a more optimistic outlook for a number of linefish resources, including hottentot, carpenter and slinger, and indicate the apparent beginning of stock rebuilding in these re- sources. However, other important stocks are still being overfished (notably silver kob), and protection of both adults and juveniles remains critical to the recovery of others such as red steenbras, seventy-four and dageraad
• Netfish: Harders, which are the main target of the beach-seine and gillnet fisheries, appear to have shown some degree of recovery. However, these gains are threatened by increasing illegal harvesting and adverse environ- mental conditions which disrupt the breeding cycles of these fish.
• Oysters: Oyster resources in KwaZulu-Natal are consid-
1
Figure 1: Percentage of stocks according to status. Dark bars represent the results of the most recent assessments, and light bars represent the previous situation as indicated in the 2012 report.
1For this summary appraisal, where a particular resource falls across two categories of stock status or pressure, precaution was applied and the resource has thus been assigned to the ‘worse case scenario’.2Perceptions of stock status may vary with improvements in the information available for that stock. Thus either deteriorations or improvements in the perception of status may not necessarily be indicative of actual changes in the stock status.

octopus, whelks and crabs, redbait and redeye in Kwa- Zulu-Natal.
• Small pelagic fishes: Small pelagic fishes are character- ized by high levels of variability. Sardine stocks are currently at a low level after several years of poor recruitment. Although anchovy stocks are currently high, the Total Allowable Catches are not being filled because of the associated by-catch of juvenile sardine. The east- ward shift of anchovy persists, but sardine appears to be more abundant in the West again.
• South Coast rock lobster: The South Coast rock lobster resource is considered to be in an optimal to depleted state, with fishing pressure on this resource optimal to light in an attempt to rebuild the stock. Catches have remained stable over the past few years.
• Squid: Updated analyses suggest that the squid re- source is less productive than previously thought. De clines in the stock have been detected, necessitating a reduction in fishing effort.
• Tunas and swordfish: There are concerns regarding the stock status of most large pelagic resources, and a pau- city of reliable data available to the Regional Fisheries Management Organisations that assess these stocks means that great uncertainties regarding stock status remain.
• West Coast rock lobster: The West Coast rock lobster resource remains severely depleted, with the stocks being only 2.6% of their pre-fished levels. Reductions in catches and illegal harvesting are imperative if recovery of this resource is to be effected.
2
ered to be in an optimal state and optimally utilized. A paucity of suitable data for oysters in the Southern Cape means that their status remains largely uncertain, but their level of exploitation, and particularly illegal harvesting from subtital ‘mother beds’, is a cause for concern.
• Patagonian toothfish: Updated assessments including additional data suggest that the resource may be healthier than indicated by previous assessments, but uncertainty still remains regarding the accuracy of the assessments.
• Prawns: Prawn resources are considered to be in an optimal (deep-water) to depleted (shallow-water) state, with optimal to light fishing pressure. Continued low catches of shallow-water prawns are attributed to poor recruitment due to the drought and closure of the mouth of the St Lucia Estuary.
• Seaweeds: The status of kelp resources is considered optimal, and there is possibly room for further harvest- ing. Other seaweed resources are considered under-utilized.
• Sharks: Concerns around stock status and harvesting rates remain for most shark resources. A paucity of reliable data for both directed catch and bycatch results in high levels of uncertainty around stock status for most shark resources.
• Small invertebrates and new fisheries: Despite on- going and increased harvesting of white mussels in recent years, an ongoing shortage of data means that the status of and fishing pressure on this, and other small invertebrate resources, remains unknown. A number of new fisheries are currently under investigation, including
3
Hea
vy
Fish
ing
pres
sure
Opt
imal
Ligh
tU
nkno
wn
Unknown Abundant Optimal Depleted Heavilydepleted
Stock status
St Joseph Oysters (S.Cape)
Smooth-houndshark
Blue sharkAlbacore tuna
(Ind.)Bigeye tuna
(Ind.)
ElfSoupfin sharkYellowfin tuna
(Atl.)
White steenbrasMako shark
Southern bluefintuna
(Ind. and Atl.)
Patagoniantoothfish
Deep-water hakeSardine
Horse mackerelYellowtail
(line and net)Snoek
CarpenterSlinger
Prawns (deep-water)Albacore tuna (Ind.)Bigeye tuna (Atl.)Swordfish (Ind.)
Prawns(shallow-water)
West Coastrock lobster
Shallow-water hake
AnchovyRedeye
Seaweeds(non-kelp)Hottentot
South Coastrock lobster
Oceanic white-tip
sharkGreat
hammerheadshark
Red steenbrasSeventy-fourWhite mussel
Agulhas sole
Yellowfin tuna (Ind.)
Abalone
Harders
Oysters (KZN)Swordfish (Atl.)
Silver kob
Kelp
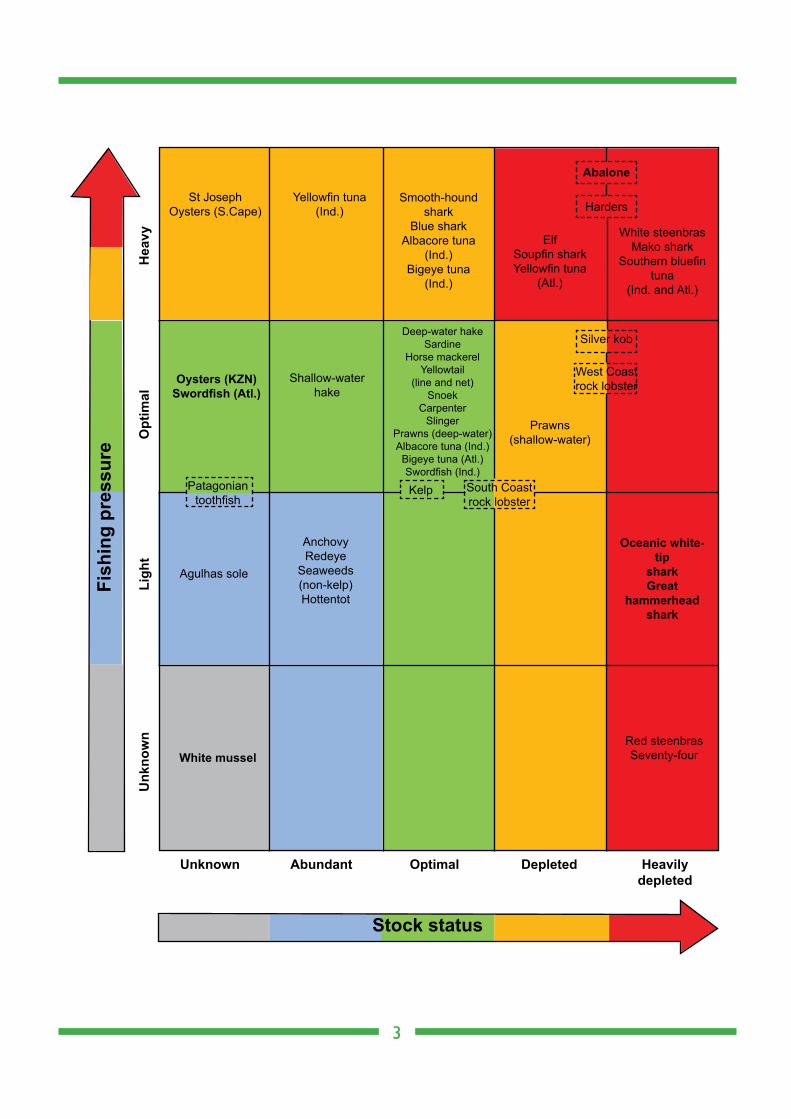
The purpose of this report is to make available information related to the current status of South Africa’s major exploited marine fishery resources, and largely reflects the work of the Fisheries Research and Development Chief Directorate up to and including 2013.
A quick-view assessment appears at the beginning of each section, is colour-coded for ease of reference, and provides an indication of stock status and fishing pressure. The first line indicates the present status of the resource, which is the result of different pressures, such as fishing and environmental fluctuations, and past management practices. The second measure indicates the present level of fishing pressure exerted on that resource. The aim of sustainable management is to have resources that are in an optimal state and that are fished at optimal levels. However, historical over-fishing may have reduced some stocks to depleted or heavily depleted levels, and rebuilding these stocks could be attempted by reducing fishing pressure. Such re- building can take several years or even decades as the rate of recovery is dependent both on the biology of the species concerned and on natural recruitment fluctuations. Additionally, short-lived species (e.g. anchovy and squid) typically show high levels of recruitment variability that can result in substantial inter-annual fluctuations in population size; these could lead to the status of that resource changing from being depleted in one year to being optimal in the next. Five categories are defined for stock status, ranging from ‘Abundant’ though to ‘Heavily depleted’, and including an ‘Unknown’ category for which there are insufficient or con- flicting data to enable an accurate estimate to be made. Four categories of fishing pressure are defined, from ‘Light’ though‘ Optimal’ to ‘Heavy’, and again including an ‘Unknown’ category for data-poor resources. The definitions used to assign a re- source to a status or category and fishing to a pressure category are given in the following tables:
4
About the report
where F is the present fishing pressure and FMSY is that fishing pressure level at which MSY is obtained.
For some, but not all, multiple-species fisheries, both the status and pressure measures are given per species. In some cases, the stock status and/or fishing pressure may vary around South Africa’s coastline, which is indicated using multiple categories. Furthermore, available information may not unambiguously indicate the appropriate category for a resource, and this is also indicated by using multiple categories
Category Abundant Optimal Depleted Heavily depleted Unknown
Definition B > BMSY B ≈ BMSY B < BMSY B << BMSY B = ?
Stock status
where B is the present biomass level (or population size) and BMSY is that biomass level at which maximum sustainable yield (MSY) is obtained.
Category Light Optimal Heavy Unknown Definition F < FMSY F ≈ FMSY F > FMSY F = ?
Fishing pressure
Introduction
Abalone Haliotis midae, locally called ‘perlemoen’, is a large marine snail that is a highly prized seafood delicacy in the Far East. Abalone are slow-growing, reaching sexual maturity at around seven years of age, and take approximate- ly 8 to 9 years to reach the minimum legal size of 11.4 cm shell breadth (SB). They reach a maximum size of 18 cm SB, and are believed to live to an age of greater than 30 years. They occur in shallow waters less than 20 m depth, but the highest densities occur in waters less than 5 m depth.
Abalone are widely distributed around the South African coastline, from St Helena Bay on the West Coast to just north of Port St Johns on the East Coast. Historically, the resource
was most abundant in the region between Cape Columbine and Quoin Point, where it supported a commercial fishery for about 65 years. Along the East Coast, the resource was considered to be discontinuous and sparsely distributed and as a result no commercial fishery for abalone was implemented there. However, experimental and subsistence permits were allocated along the East Coast in the past, and new experimen-tal allocations were approved in 2010. The recreational sector also targeted abalone for many years, but due to the decline in the resource, this component of the fishery was sus- pended in 2003/2004.
Once a lucrative commercial fishery, earning up to approximately R100 million annually at the turn of the Cen-tury, rampant illegal harvesting and continued declines in
5
Abalone
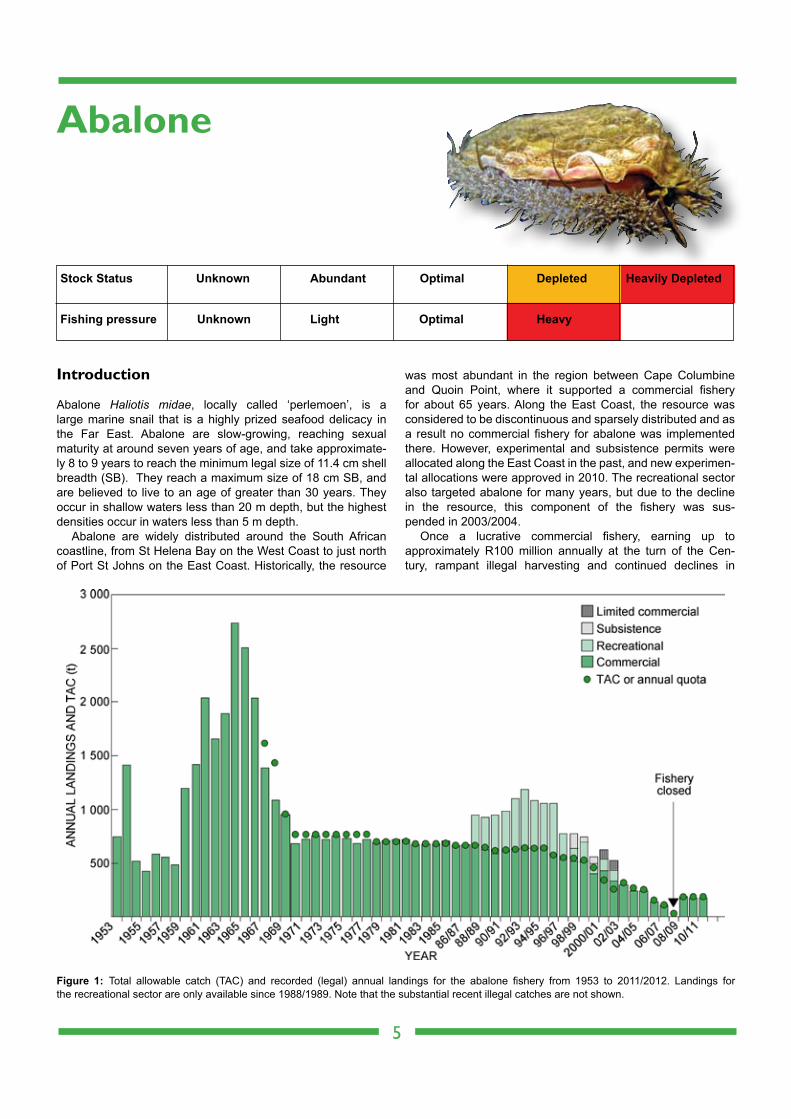
Figure 1: Total allowable catch (TAC) and recorded (legal) annual landings for the abalone fishery from 1953 to 2011/2012. Landings for the recreational sector are only available since 1988/1989. Note that the substantial recent illegal catches are not shown.
Stock Status Unknown Abundant Optimal Depleted
Fishing pressure Unknown Light Optimal Heavy
Heavily Depleted
the abundance of the resource resulted in a total closure of the fishery in February 2008. The resource has also been heavily impacted by an ecosystem shift that was brought about by the migration of West Coast rock lobster into two of the main, most productive abalone fishing areas. The commercial fishery subsequently reopened in July 2010.
History and management
The commercial (diver) fishery for abalone started in the late 1940s. During the early phase, the fishery was dominated by five large abalone processing plants. Initially, catches were unregulated, and reached a peak of close to 3 000 t in 1965 (Figure 1). By 1970, catches had declined rapidly, although the fishery remained stable, with a total annual catch of around 600–700 t, until the mid-1990s, after which there were continuous declines in commercial catches.
The early 1990s saw the booming of the recreational fishery, and a significant increase in illegal fishing activities. Continued high levels of illegal fishing and declines in the re-source led to closure of the recreational fishery in 2003/2004.
Transformation of the fishery in post-apartheid years sought to increase participation in the fishery, particularly by people who had been previously marginalised. Subsistence rights were introduced in 1998/1999, and were replaced by two-year medium-term rights. In 2003/2004, 10-year long- term rights were allocated, broadening participation in the fishery to some 300 Right Holders. At this time, the previous management zones were replaced with Territorial Use Rights in Fisheries (TURFs), aimed at developing a sense of own-ership of the resource by the new Right Holders and, in so doing, introduce co-management of the resource and improve compliance with regards to illegal fishing activities.
Illegal fishing, however, remained high despite the intro-duction of TURFs and increased compliance effort, including strengthening of the compliance fleet, introduction of stricter penalties for offenders, and controls on international trade.
Although illegal fishing of abalone occurs in all areas, its concentration has shifted from one area to another over the years in response to resource abundance and law enforce- ment presence. Illegal fishing is not selective with regard to the size of abalone taken, and almost two-thirds of confis-
6
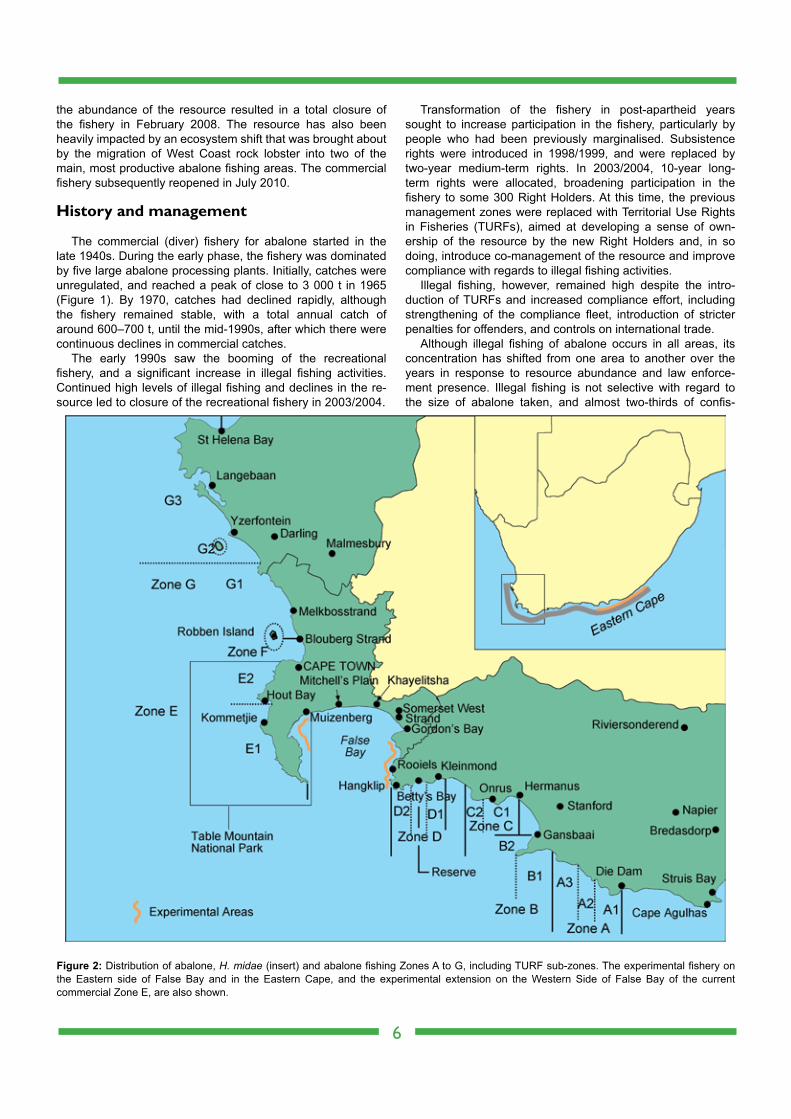
Figure 2: Distribution of abalone, H. midae (insert) and abalone fishing Zones A to G, including TURF sub-zones. The experimental fishery on the Eastern side of False Bay and in the Eastern Cape, and the experimental extension on the Western Side of False Bay of the current commercial Zone E, are also shown.
cated abalone are below the minimum legal size of 11.4 cm SB. Therefore, most of the illegally caught abalone are taken before having had the opportunity to reproduce.
The continued high levels of illegal fishing and declines in the resource led to the introduction of diving prohibitions in selected areas and the closure of the commercial fishery in February 2008. The fishery was subsequently reopened in July 2010, with TAC allocations of 150 t in the 2009/2010 and 2010/2011 seasons that were conditional on a 15% per an-num reduction in poaching. This was based on a management objective for the sustainable utilisation and recovery of the abalone resource which was to prevent the abalone spawning biomass in each zone from dropping below 20% of its esti- mated pre-fished biomass (a ‘limit reference point’), and to see it recover to 40% of that level (a ‘target reference point’) within 15 years of the re-opening of the commercial fishery in 2009/2010, i.e. by the 2024/2025 season.
The required reduction in illegal harvesting has not been achieved – in fact indices suggest a continued and substan-tial increase in poaching. At this time, some four years after the re-opening of the fishery, estimates indicate that poaching has increased by some 150%, whilst a net 50% reduction in poaching was required under the rebuilding plan.
Research and monitoring
Data from both the fishery and directed research surveys are used to assess the abalone resource. The commercial fishery is monitored by recording landings at slipways, catch returns by Right Holders and monitoring of the size of abalone caught. Commercial catch data are available from 1953, and catch per unit effort (CPUE) data from 1980.
Data on the recreational fishery were collected by means of telephone surveys and validated by recording the details of catch and effort at dive sites from 1992 to 2002. These data provided estimates of total catch, CPUE and trends in the size of abalone harvested.
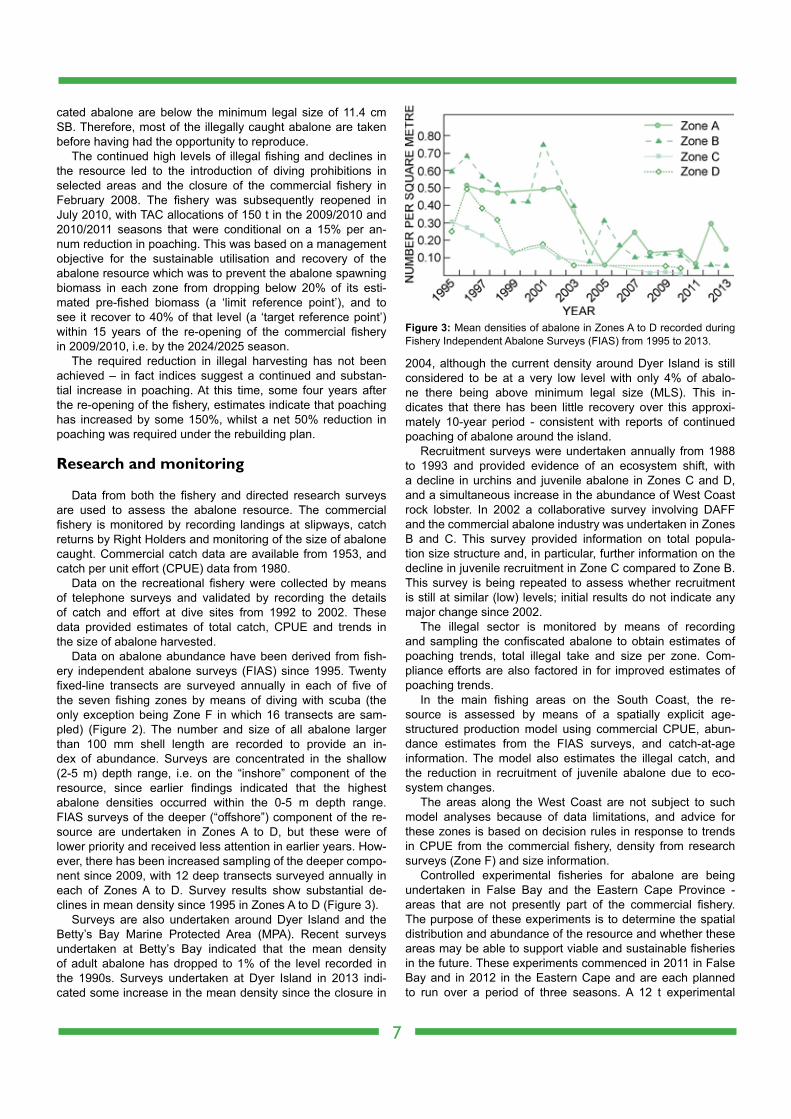
Data on abalone abundance have been derived from fish-ery independent abalone surveys (FIAS) since 1995. Twenty fixed-line transects are surveyed annually in each of five of the seven fishing zones by means of diving with scuba (the only exception being Zone F in which 16 transects are sam-pled) (Figure 2). The number and size of all abalone larger than 100 mm shell length are recorded to provide an in-dex of abundance. Surveys are concentrated in the shallow (2-5 m) depth range, i.e. on the “inshore” component of the resource, since earlier findings indicated that the highest abalone densities occurred within the 0-5 m depth range. FIAS surveys of the deeper (“offshore”) component of the re- source are undertaken in Zones A to D, but these were of lower priority and received less attention in earlier years. How-ever, there has been increased sampling of the deeper compo-nent since 2009, with 12 deep transects surveyed annually in each of Zones A to D. Survey results show substantial de- clines in mean density since 1995 in Zones A to D (Figure 3).
Surveys are also undertaken around Dyer Island and the Betty’s Bay Marine Protected Area (MPA). Recent surveys undertaken at Betty’s Bay indicated that the mean density of adult abalone has dropped to 1% of the level recorded in the 1990s. Surveys undertaken at Dyer Island in 2013 indi-cated some increase in the mean density since the closure in
2004, although the current density around Dyer Island is still considered to be at a very low level with only 4% of abalo-ne there being above minimum legal size (MLS). This in- dicates that there has been little recovery over this approxi-mately 10-year period - consistent with reports of continued poaching of abalone around the island.
Recruitment surveys were undertaken annually from 1988 to 1993 and provided evidence of an ecosystem shift, with a decline in urchins and juvenile abalone in Zones C and D, and a simultaneous increase in the abundance of West Coast rock lobster. In 2002 a collaborative survey involving DAFF and the commercial abalone industry was undertaken in Zones B and C. This survey provided information on total popula-tion size structure and, in particular, further information on the decline in juvenile recruitment in Zone C compared to Zone B. This survey is being repeated to assess whether recruitment is still at similar (low) levels; initial results do not indicate any major change since 2002.
The illegal sector is monitored by means of recording and sampling the confiscated abalone to obtain estimates of poaching trends, total illegal take and size per zone. Com-pliance efforts are also factored in for improved estimates of poaching trends.
In the main fishing areas on the South Coast, the re- source is assessed by means of a spatially explicit age- structured production model using commercial CPUE, abun-dance estimates from the FIAS surveys, and catch-at-age information. The model also estimates the illegal catch, and the reduction in recruitment of juvenile abalone due to eco- system changes.
The areas along the West Coast are not subject to such model analyses because of data limitations, and advice for these zones is based on decision rules in response to trends in CPUE from the commercial fishery, density from research surveys (Zone F) and size information.
Controlled experimental fisheries for abalone are being undertaken in False Bay and the Eastern Cape Province - areas that are not presently part of the commercial fishery. The purpose of these experiments is to determine the spatial distribution and abundance of the resource and whether these areas may be able to support viable and sustainable fisheries in the future. These experiments commenced in 2011 in False Bay and in 2012 in the Eastern Cape and are each planned to run over a period of three seasons. A 12 t experimental
7
Figure 3: Mean densities of abalone in Zones A to D recorded during Fishery Independent Abalone Surveys (FIAS) from 1995 to 2013.
catch has been allocated per season on the eastern side of False Bay, in three sub-areas from Cape Hangklip to the Steenbras River. A 31.5 t experimental catch was allocat-ed per season in the Eastern Cape, and split across seven areas ranging from the Groot River to Dwesa. Sub-area catch allocations are in place to ensure that the experiments do not overly deplete the resource in any one particular area, and to ensure the geographical coverage necessary to provide the information required to properly assess the fishery potential of the resource in these areas.
Priority research areas for the future include extending the full population surveys geographically, studies on abalone aggregation dynamics and the extent to which the potential of abalone to reproduce may be affected by the density of abalone in an area. Further improvements in illegal catch estimates and a review of the decision rules used for the assessment of the resource in the fishing zones along the West Coast (Zones E–G) are also priorities.
Current status
Poaching trendsRecommendations for the 2009/10 and 2010/11 seasons
were based on a recovery strategy for abalone that recom-mended a target to recover the resource to 40% of its esti- mated pre-exploitation spawning biomass over 15 years. Analyses indicated this would have been possible if there were to be a 15% per annum reduction in the estimated levels of
poaching throughout the 15-year recovery period.The requirement to reduce poaching by 15% per annum
was a pivotal component of the recovery plan and unless poaching off-take was reduced by at least that amount annu-ally from 2009, the fishery would be unsustainable and would, in time, collapse. Data from various sources were used to assess poaching trends.
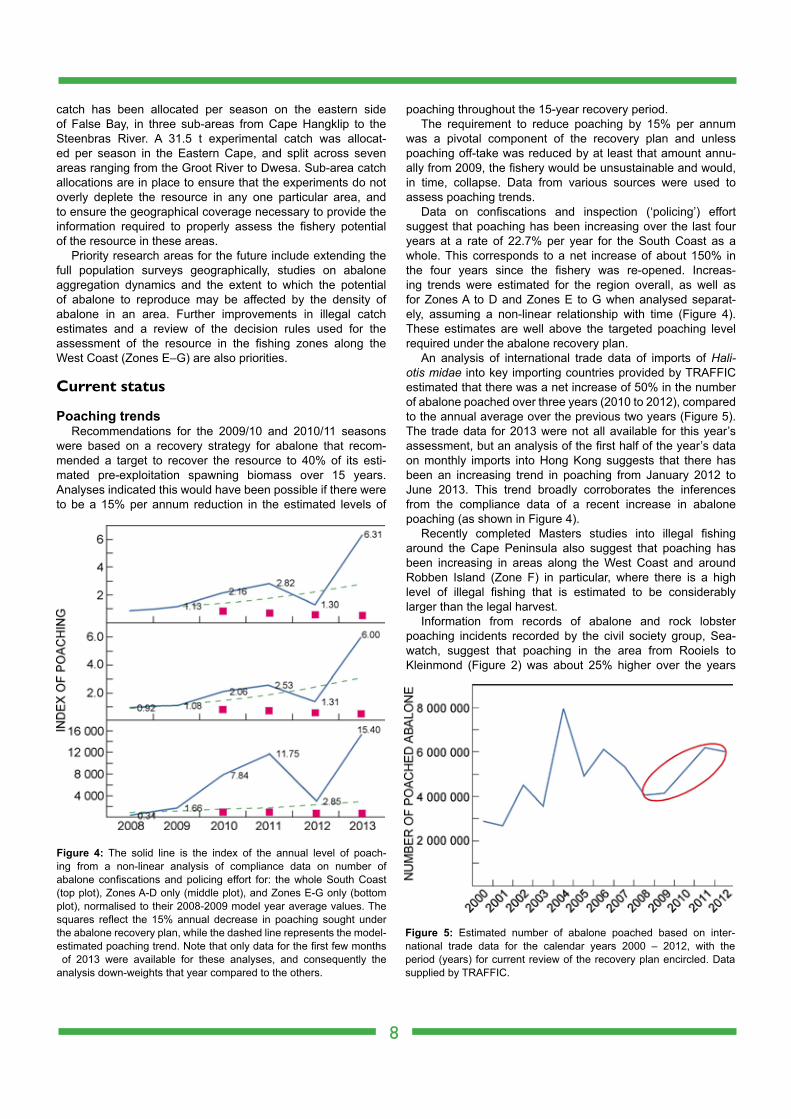
Data on confiscations and inspection (‘policing’) effort suggest that poaching has been increasing over the last four years at a rate of 22.7% per year for the South Coast as a whole. This corresponds to a net increase of about 150% in the four years since the fishery was re-opened. Increas-ing trends were estimated for the region overall, as well as for Zones A to D and Zones E to G when analysed separat- ely, assuming a non-linear relationship with time (Figure 4). These estimates are well above the targeted poaching level required under the abalone recovery plan.
An analysis of international trade data of imports of Hali-otis midae into key importing countries provided by TRAFFIC estimated that there was a net increase of 50% in the number of abalone poached over three years (2010 to 2012), compared to the annual average over the previous two years (Figure 5). The trade data for 2013 were not all available for this year’s assessment, but an analysis of the first half of the year’s data on monthly imports into Hong Kong suggests that there has been an increasing trend in poaching from January 2012 to June 2013. This trend broadly corroborates the inferences from the compliance data of a recent increase in abalone poaching (as shown in Figure 4).
Recently completed Masters studies into illegal fishing around the Cape Peninsula also suggest that poaching has been increasing in areas along the West Coast and around Robben Island (Zone F) in particular, where there is a high level of illegal fishing that is estimated to be considerably larger than the legal harvest.
Information from records of abalone and rock lobster poaching incidents recorded by the civil society group, Sea-watch, suggest that poaching in the area from Rooiels to Kleinmond (Figure 2) was about 25% higher over the years
8
Figure 5: Estimated number of abalone poached based on inter- national trade data for the calendar years 2000 – 2012, with the period (years) for current review of the recovery plan encircled. Data supplied by TRAFFIC.
Figure 4: The solid line is the index of the annual level of poach- ing from a non-linear analysis of compliance data on number of abalone confiscations and policing effort for: the whole South Coast (top plot), Zones A-D only (middle plot), and Zones E-G only (bottom plot), normalised to their 2008-2009 model year average values. The squares reflect the 15% annual decrease in poaching sought under the abalone recovery plan, while the dashed line represents the model-estimated poaching trend. Note that only data for the first few months of 2013 were available for these analyses, and consequently the analysis down-weights that year compared to the others.
2010 and 2011 when compared to the average over the previ-ous 2 years.
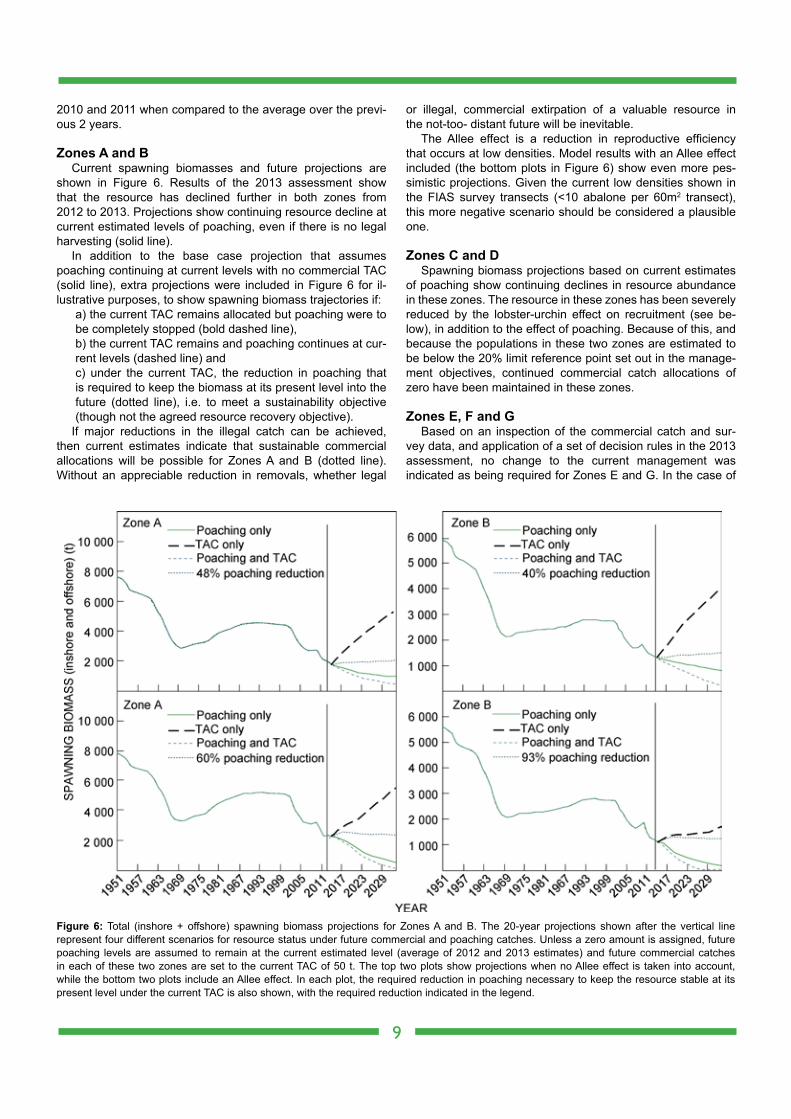
Zones A and BCurrent spawning biomasses and future projections are
shown in Figure 6. Results of the 2013 assessment show that the resource has declined further in both zones from 2012 to 2013. Projections show continuing resource decline at current estimated levels of poaching, even if there is no legal harvesting (solid line).
In addition to the base case projection that assumes poaching continuing at current levels with no commercial TAC (solid line), extra projections were included in Figure 6 for il-lustrative purposes, to show spawning biomass trajectories if: a) the current TAC remains allocated but poaching were to
be completely stopped (bold dashed line), b) the current TAC remains and poaching continues at cur-
rent levels (dashed line) and c) under the current TAC, the reduction in poaching that
is required to keep the biomass at its present level into the future (dotted line), i.e. to meet a sustainability objective (though not the agreed resource recovery objective).
If major reductions in the illegal catch can be achieved, then current estimates indicate that sustainable commercial allocations will be possible for Zones A and B (dotted line). Without an appreciable reduction in removals, whether legal
or illegal, commercial extirpation of a valuable resource in the not-too- distant future will be inevitable.
The Allee effect is a reduction in reproductive efficiency that occurs at low densities. Model results with an Allee effect included (the bottom plots in Figure 6) show even more pes-simistic projections. Given the current low densities shown in the FIAS survey transects (<10 abalone per 60m2 transect), this more negative scenario should be considered a plausible one.
Zones C and DSpawning biomass projections based on current estimates
of poaching show continuing declines in resource abundance in these zones. The resource in these zones has been severely reduced by the lobster-urchin effect on recruitment (see be-low), in addition to the effect of poaching. Because of this, and because the populations in these two zones are estimated to be below the 20% limit reference point set out in the manage-ment objectives, continued commercial catch allocations of zero have been maintained in these zones.
Zones E, F and GBased on an inspection of the commercial catch and sur-
vey data, and application of a set of decision rules in the 2013 assessment, no change to the current management was indicated as being required for Zones E and G. In the case of
9
Figure 6: Total (inshore + offshore) spawning biomass projections for Zones A and B. The 20-year projections shown after the vertical line represent four different scenarios for resource status under future commercial and poaching catches. Unless a zero amount is assigned, future poaching levels are assumed to remain at the current estimated level (average of 2012 and 2013 estimates) and future commercial catches in each of these two zones are set to the current TAC of 50 t. The top two plots show projections when no Allee effect is taken into account, while the bottom two plots include an Allee effect. In each plot, the required reduction in poaching necessary to keep the resource stable at its present level under the current TAC is also shown, with the required reduction indicated in the legend.
Zone F, however, all indicators suggest a decline in resource abundance, and a 20% reduction in the TAC was recommend-ed for Zone F for the next season.
It is important to note that the basis for setting the catch levels for Zones E–G is not as refined as for Zones A–D and there is consequently a greater associated uncertainty/risk of either over-or under-fishing in these zones. In addition, there are indications of increases in poaching overall, and in the Zone E to G region over the past few years, that were not fully accounted for in the decision rules. Furthermore, recruitment of juvenile abalone in this area is sporadic and therefore re-source productivity in these zones has historically been much lower than in the South Coast zones (A–D).
Ecosystem interactions
Since the early 1990s, ecological changes have severely disrupted normal abalone recruitment patterns in two of the major fishing zones, i.e. Zones C and D. These involved the large-scale incursion of West Coast rock lobsters into Zones C and D. The lobsters have now altered the ecosystem by con-suming large numbers of sea urchins as well as most other invertebrate species, including juvenile abalone. Sea urchins perform the important function of providing protection for ju-venile abalone. A recent study found that, in Zone D, there have been substantial increases in rock lobsters, seaweeds and sessile species and a substantial decline in grazers (of which abalone are a component). The current ecosystem state in Zone C is similar to Zone D.
The ecosystem state in Zones A & B is currently different to Zones C and D, with very few lobsters present, a lower biomass of seaweeds and sessile species, more encrusting corallines, and urchins and grazers still present in relatively high abundance.
The combined effect of poaching and ecological changes has resulted in severe declines in the abalone resource in Zones C & D. The Betty’s Bay Marine Protected Area (MPA), situated within Zone D, was also affected, which meant the loss of the main conservation area for abalone. As a result, Dyer Island has been closed to commercial fishing since the 2003/2004 season to function as a refuge area for aba-lone. FIAS surveys undertaken at Betty’s Bay MPA in 2012 indicated that the mean density of abalone dropped to 1% of the level recorded in the 1990s. This confirms that Bet-ty’s Bay no longer functions as a closed area (reserve) for abalone, so that Dyer Island should continue as a closed area
Further reading
Blamey LK, Branch GM, Reaugh-Flower KE. 2010. Temporal changes in kelp-forest benthic communities following an invasion by the rock lobster Jasus lalandii. African Journal of Marine Science 32: 481–490.
Plagányi ÉE, Butterworth DS. 2010. A spatial- and age-structured as-sessment model to estimate the impact of illegal fishing and ecosystem change on the South African abalone Haliotis midae resource. African Journal of Marine Science 32: 207–236.
Raemaekers S, Hauck M, Bürgener M, Mackenzie A, Maharaj G, Plagányi ÉE, Britz PJ. 2011. Review of the causes of the rise of the illegal South African abalone fishery and consequent clo-sure of the rights-based fishery. Ocean and Coastal Manage-ment 54: 433–445.
Tarr RJQ. 2000. The South African abalone (Haliotis midae) fishery: a decade of challenges and change. Canadian Special Publica-tions in Fisheries and Aquatic Science 130: 32–40.
Tarr RJQ, Williams PVG, Mackenzie AJ. 1996. Abalone, sea urchins and rock lobster: a possible ecological shift may affect traditional fisheries. South African Journal of Marine Science 17: 311–315.
10
Total Allowable Catches (TACs) and catches for the abalone fishery for the past 20 seasons (1993/1994 season to 2012/2013 season).
Season TAC (t) Total commercial Total recreational catch (t) catch (t)1993/94 615 613 5491994/95 615 616 4461995/96 615 614 4231996/97 550 537 4291997/98 523 523 2211998/99 515 482 1271999/00 500 490 1742000/01 433 368 952001/02 314 403 1102002/03 226 296 1022003/04 282 258 02004/05 237 204 02005/06 223 212 02006/07 125 110 02007/08 75 74 02008/09 0 0 02009/10 150 150 02010/11 150 152 02011/12 150 145 02012/13 150 * 0
*Note that data for the 2012/13 season were not yet complete at the time of preparation.
Useful statistics
Introduction
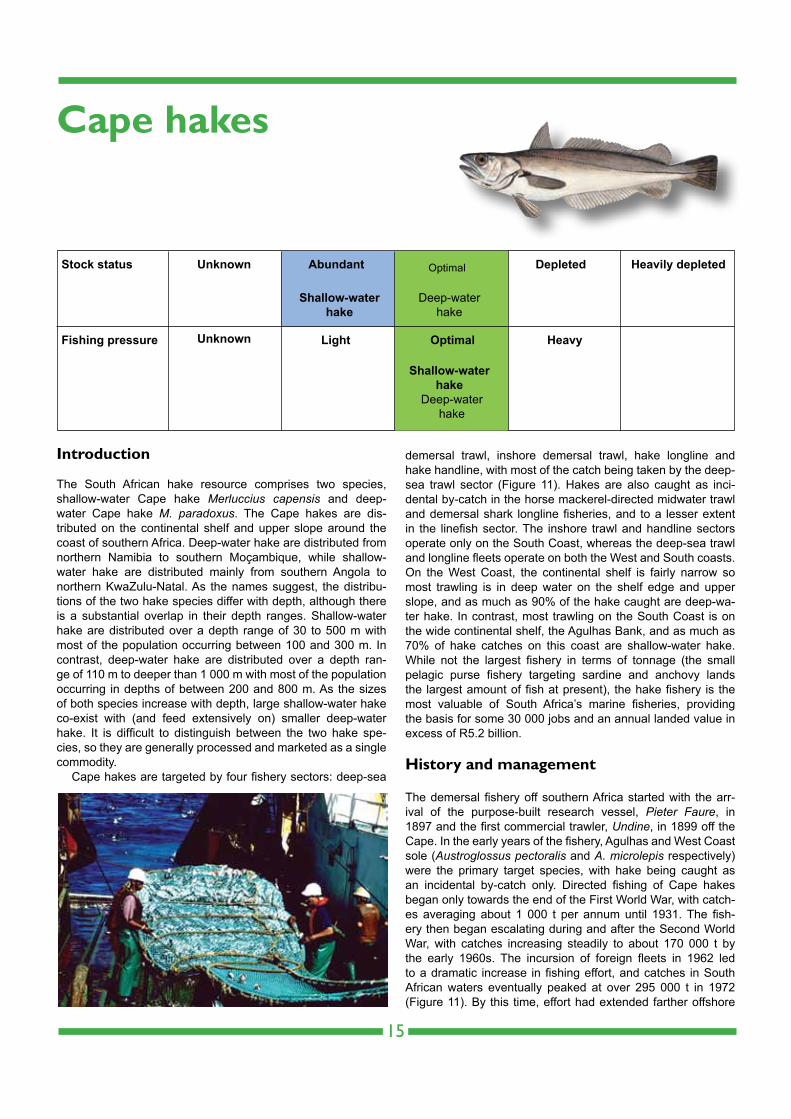
Agulhas or East Coast sole (Austroglossus pectoralis) belong to a group of fish referred to as flatfish because they lie on the seabed on their sides. During larval development, both eyes migrate to one side of the head, and well-developed fins encircle the body. They are bottom-dwelling, prefer-ring sand or silt substrates, and feed on small crustaceans, molluscs, worms and brittle stars. Although distributed pri-marily in depths of between 10 and 120 m depth, they have
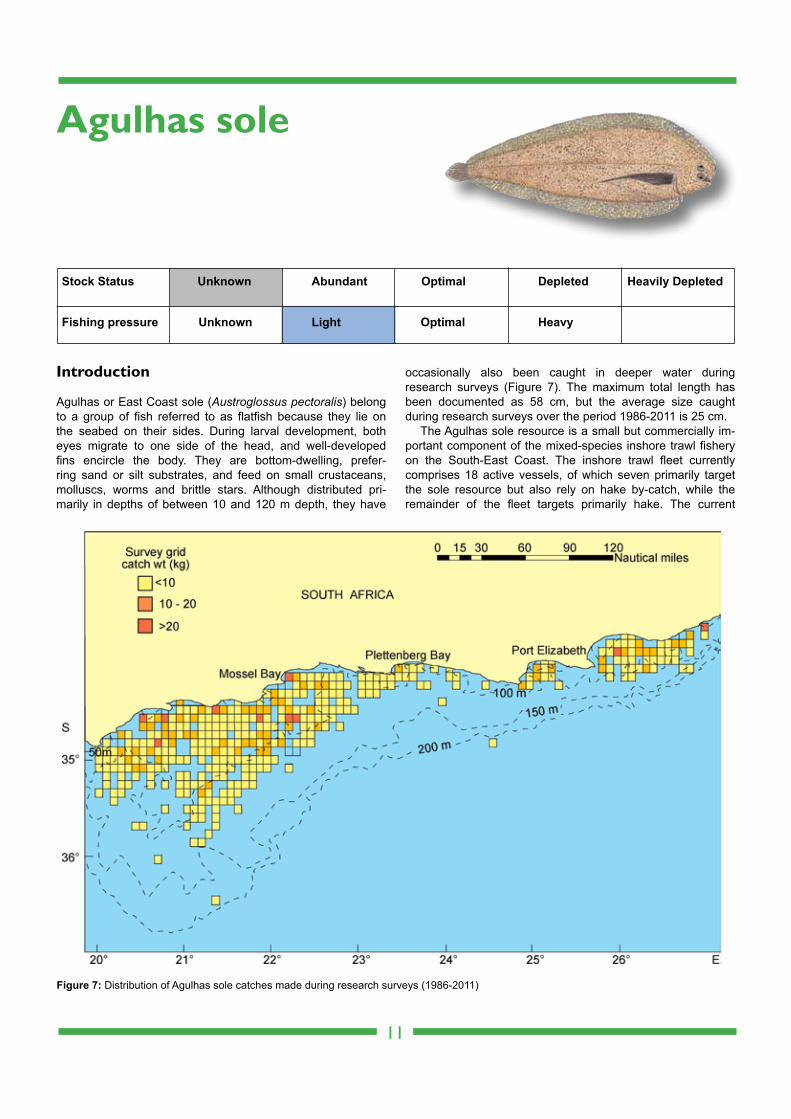
occasionally also been caught in deeper water during research surveys (Figure 7). The maximum total length has been documented as 58 cm, but the average size caught during research surveys over the period 1986-2011 is 25 cm.
The Agulhas sole resource is a small but commercially im-portant component of the mixed-species inshore trawl fishery on the South-East Coast. The inshore trawl fleet currently comprises 18 active vessels, of which seven primarily target the sole resource but also rely on hake by-catch, while the remainder of the fleet targets primarily hake. The current
11
Agulhas sole
Stock Status Unknown Abundant Optimal Depleted
Fishing pressure Unknown Light Optimal Heavy
Heavily Depleted
Figure 7: Distribution of Agulhas sole catches made during research surveys (1986-2011)
annual Total Allowable Catch (TAC) is worth approximately R36 million
History and Management
The Agulhas sole resource has been fished since the begin-ning of the last century and was one of the first fish stocks to be managed in South Africa. Exploitation of Agulhas sole was the economic base for the early fishery on the Cape South Coast and was the driving force for the development of the coastal fishing fleet.
Several factors have influenced the performance of the inshore trawl fishery over the years: the fishery has shifted from targeting Agulhas sole in the 1930s to targeting several species from the late 1970s; management interventions such as the introduction of a global quota system in 1978; individual quotas in 1982; stricter enforcement of the mesh size regu-lation; boat limitation; fleet rationalisation; closure of certain (nursery) areas to fishing to protect juvenile Agulhas sole; and, more recently, the prevention of within-season trading in quotas.
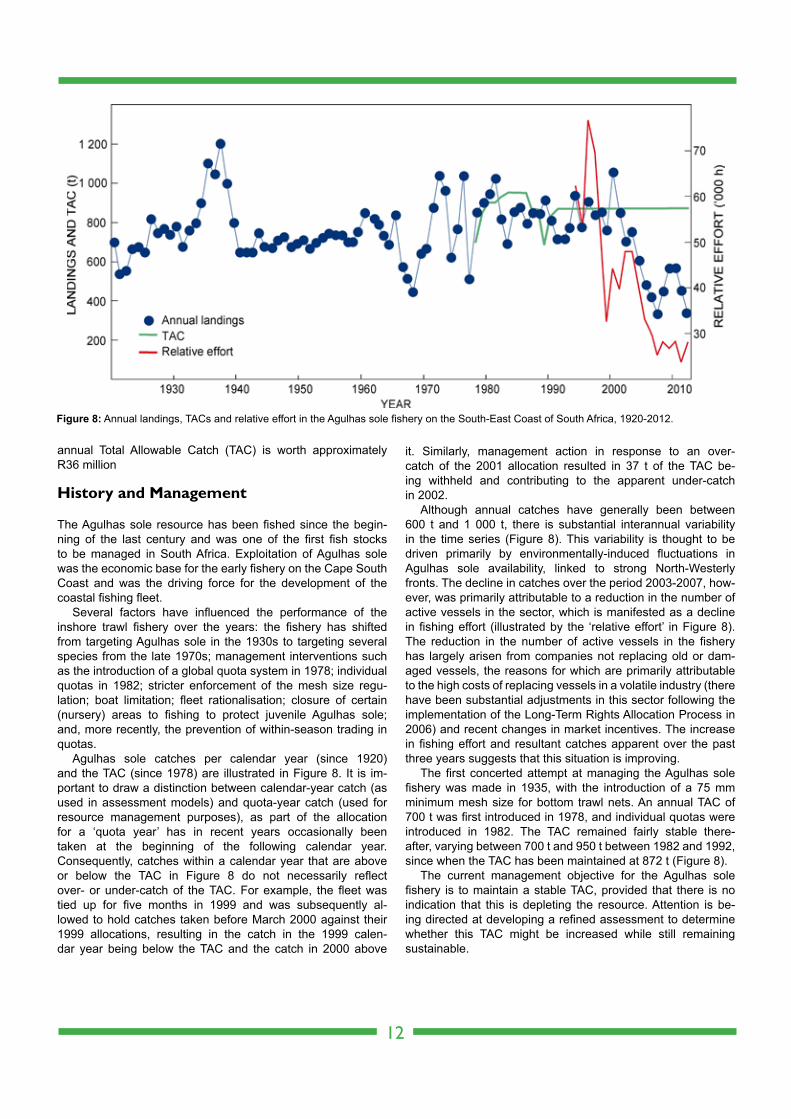
Agulhas sole catches per calendar year (since 1920) and the TAC (since 1978) are illustrated in Figure 8. It is im- portant to draw a distinction between calendar-year catch (as used in assessment models) and quota-year catch (used for resource management purposes), as part of the allocation for a ‘quota year’ has in recent years occasionally been taken at the beginning of the following calendar year. Consequently, catches within a calendar year that are above or below the TAC in Figure 8 do not necessarily reflect over- or under-catch of the TAC. For example, the fleet was tied up for five months in 1999 and was subsequently al-lowed to hold catches taken before March 2000 against their 1999 allocations, resulting in the catch in the 1999 calen-dar year being below the TAC and the catch in 2000 above
it. Similarly, management action in response to an over-catch of the 2001 allocation resulted in 37 t of the TAC be-ing withheld and contributing to the apparent under-catch in 2002.
Although annual catches have generally been between 600 t and 1 000 t, there is substantial interannual variability in the time series (Figure 8). This variability is thought to be driven primarily by environmentally-induced fluctuations in Agulhas sole availability, linked to strong North-Westerly fronts. The decline in catches over the period 2003-2007, how-ever, was primarily attributable to a reduction in the number of active vessels in the sector, which is manifested as a decline in fishing effort (illustrated by the ‘relative effort’ in Figure 8). The reduction in the number of active vessels in the fishery has largely arisen from companies not replacing old or dam-aged vessels, the reasons for which are primarily attributable to the high costs of replacing vessels in a volatile industry (there have been substantial adjustments in this sector following the implementation of the Long-Term Rights Allocation Process in 2006) and recent changes in market incentives. The increase in fishing effort and resultant catches apparent over the past three years suggests that this situation is improving.
The first concerted attempt at managing the Agulhas sole fishery was made in 1935, with the introduction of a 75 mm minimum mesh size for bottom trawl nets. An annual TAC of 700 t was first introduced in 1978, and individual quotas were introduced in 1982. The TAC remained fairly stable there- after, varying between 700 t and 950 t between 1982 and 1992, since when the TAC has been maintained at 872 t (Figure 8).
The current management objective for the Agulhas sole fishery is to maintain a stable TAC, provided that there is no indication that this is depleting the resource. Attention is be-ing directed at developing a refined assessment to determine whether this TAC might be increased while still remaining sustainable.
12
Figure 8: Annual landings, TACs and relative effort in the Agulhas sole fishery on the South-East Coast of South Africa, 1920-2012.
Research and Monitoring
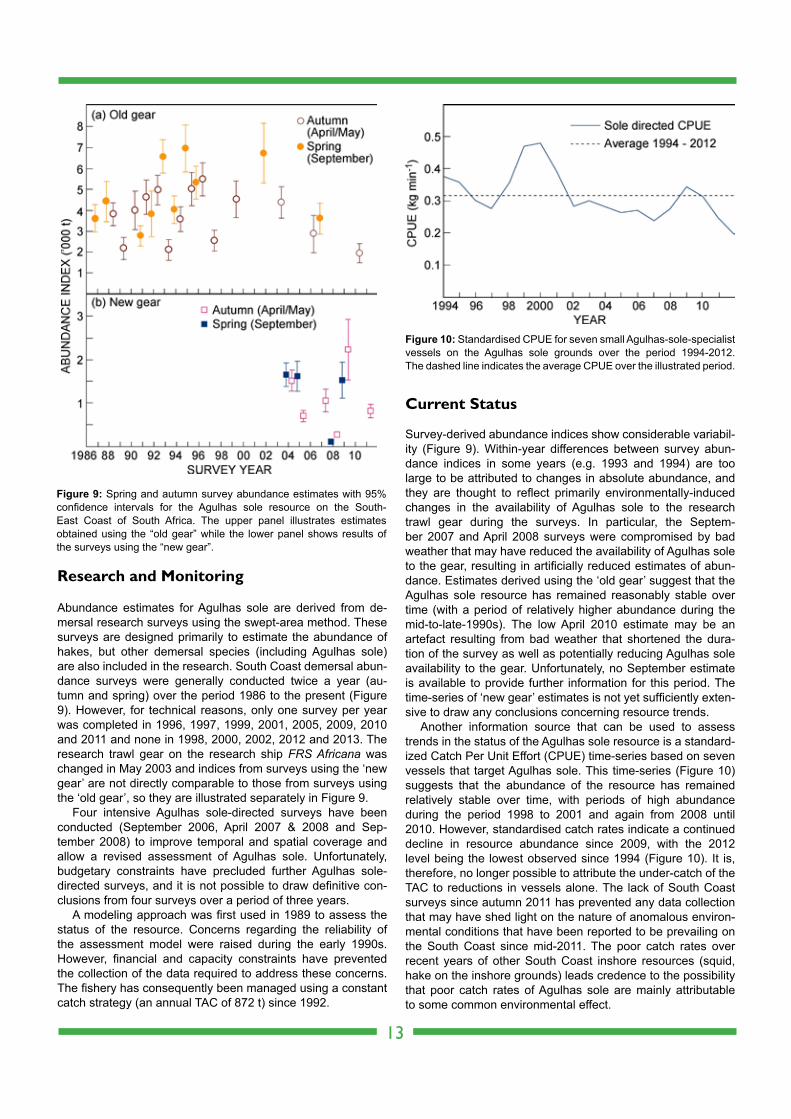
Abundance estimates for Agulhas sole are derived from de-mersal research surveys using the swept-area method. These surveys are designed primarily to estimate the abundance of hakes, but other demersal species (including Agulhas sole) are also included in the research. South Coast demersal abun-dance surveys were generally conducted twice a year (au-tumn and spring) over the period 1986 to the present (Figure 9). However, for technical reasons, only one survey per year was completed in 1996, 1997, 1999, 2001, 2005, 2009, 2010 and 2011 and none in 1998, 2000, 2002, 2012 and 2013. The research trawl gear on the research ship FRS Africana was changed in May 2003 and indices from surveys using the ‘new gear’ are not directly comparable to those from surveys using the ‘old gear’, so they are illustrated separately in Figure 9.
Four intensive Agulhas sole-directed surveys have been conducted (September 2006, April 2007 & 2008 and Sep-tember 2008) to improve temporal and spatial coverage and allow a revised assessment of Agulhas sole. Unfortunately, budgetary constraints have precluded further Agulhas sole- directed surveys, and it is not possible to draw definitive con-clusions from four surveys over a period of three years.
A modeling approach was first used in 1989 to assess the status of the resource. Concerns regarding the reliability of the assessment model were raised during the early 1990s. However, financial and capacity constraints have prevented the collection of the data required to address these concerns. The fishery has consequently been managed using a constant catch strategy (an annual TAC of 872 t) since 1992.
Current Status
Survey-derived abundance indices show considerable variabil-ity (Figure 9). Within-year differences between survey abun-dance indices in some years (e.g. 1993 and 1994) are too large to be attributed to changes in absolute abundance, and they are thought to reflect primarily environmentally-induced changes in the availability of Agulhas sole to the research trawl gear during the surveys. In particular, the Septem-ber 2007 and April 2008 surveys were compromised by bad weather that may have reduced the availability of Agulhas sole to the gear, resulting in artificially reduced estimates of abun-dance. Estimates derived using the ‘old gear’ suggest that the Agulhas sole resource has remained reasonably stable over time (with a period of relatively higher abundance during the mid-to-late-1990s). The low April 2010 estimate may be an artefact resulting from bad weather that shortened the dura-tion of the survey as well as potentially reducing Agulhas sole availability to the gear. Unfortunately, no September estimate is available to provide further information for this period. The time-series of ‘new gear’ estimates is not yet sufficiently exten-sive to draw any conclusions concerning resource trends.
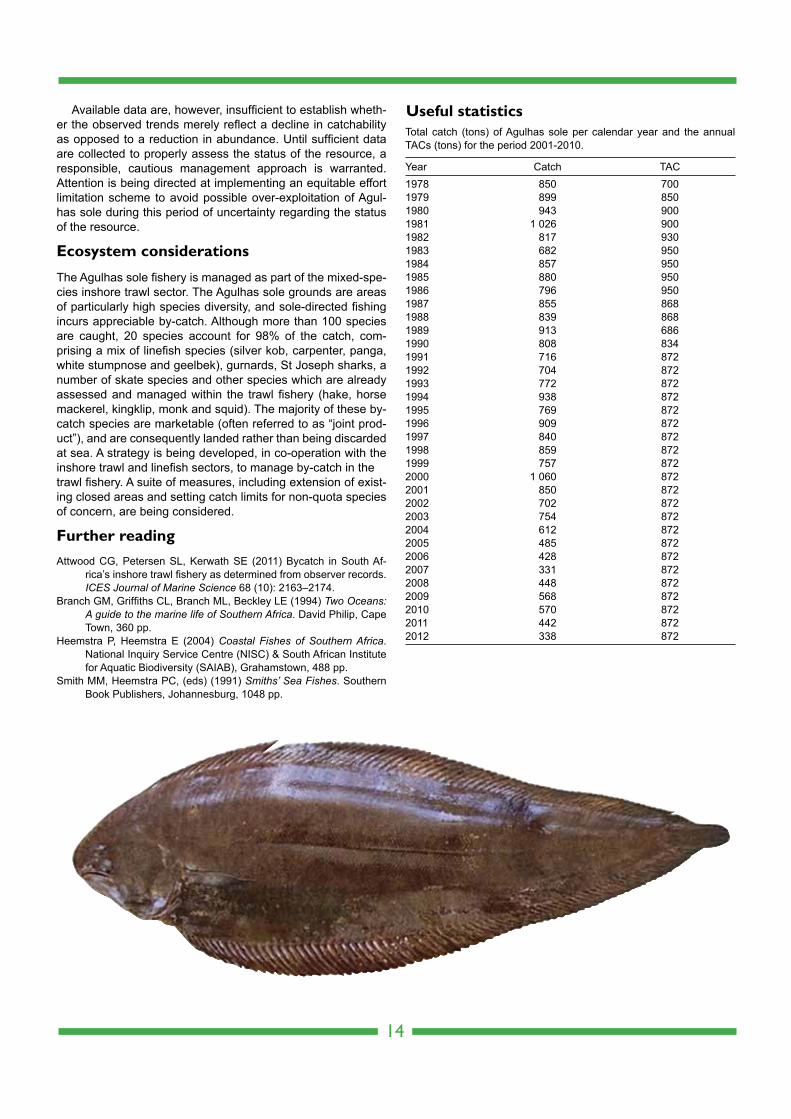
Another information source that can be used to assess trends in the status of the Agulhas sole resource is a standard-ized Catch Per Unit Effort (CPUE) time-series based on seven vessels that target Agulhas sole. This time-series (Figure 10) suggests that the abundance of the resource has remained relatively stable over time, with periods of high abundance during the period 1998 to 2001 and again from 2008 until 2010. However, standardised catch rates indicate a continued decline in resource abundance since 2009, with the 2012 level being the lowest observed since 1994 (Figure 10). It is, therefore, no longer possible to attribute the under-catch of the TAC to reductions in vessels alone. The lack of South Coast surveys since autumn 2011 has prevented any data collection that may have shed light on the nature of anomalous environ-mental conditions that have been reported to be prevailing on the South Coast since mid-2011. The poor catch rates over recent years of other South Coast inshore resources (squid, hake on the inshore grounds) leads credence to the possibility that poor catch rates of Agulhas sole are mainly attributable to some common environmental effect.
13
Figure 9: Spring and autumn survey abundance estimates with 95% confidence intervals for the Agulhas sole resource on the South- East Coast of South Africa. The upper panel illustrates estimates obtained using the “old gear” while the lower panel shows results of the surveys using the “new gear”.
Figure 10: Standardised CPUE for seven small Agulhas-sole-specialist vessels on the Agulhas sole grounds over the period 1994-2012. The dashed line indicates the average CPUE over the illustrated period.
Available data are, however, insufficient to establish wheth-er the observed trends merely reflect a decline in catchability as opposed to a reduction in abundance. Until sufficient data are collected to properly assess the status of the resource, a responsible, cautious management approach is warranted. Attention is being directed at implementing an equitable effort limitation scheme to avoid possible over-exploitation of Agul-has sole during this period of uncertainty regarding the status of the resource.
Ecosystem considerations
The Agulhas sole fishery is managed as part of the mixed-spe-cies inshore trawl sector. The Agulhas sole grounds are areas of particularly high species diversity, and sole-directed fishing incurs appreciable by-catch. Although more than 100 species are caught, 20 species account for 98% of the catch, com-prising a mix of linefish species (silver kob, carpenter, panga, white stumpnose and geelbek), gurnards, St Joseph sharks, a number of skate species and other species which are already assessed and managed within the trawl fishery (hake, horse mackerel, kingklip, monk and squid). The majority of these by-catch species are marketable (often referred to as “joint prod-uct”), and are consequently landed rather than being discarded at sea. A strategy is being developed, in co-operation with the inshore trawl and linefish sectors, to manage by-catch in thetrawl fishery. A suite of measures, including extension of exist-ing closed areas and setting catch limits for non-quota species of concern, are being considered.
Further readingAttwood CG, Petersen SL, Kerwath SE (2011) Bycatch in South Af-
rica’s inshore trawl fishery as determined from observer records. ICES Journal of Marine Science 68 (10): 2163–2174.
Branch GM, Griffiths CL, Branch ML, Beckley LE (1994) Two Oceans: A guide to the marine life of Southern Africa. David Philip, Cape Town, 360 pp.
Heemstra P, Heemstra E (2004) Coastal Fishes of Southern Africa. National Inquiry Service Centre (NISC) & South African Institute for Aquatic Biodiversity (SAIAB), Grahamstown, 488 pp.
Smith MM, Heemstra PC, (eds) (1991) Smiths’ Sea Fishes. Southern Book Publishers, Johannesburg, 1048 pp.
Useful statistics
14
Total catch (tons) of Agulhas sole per calendar year and the annual TACs (tons) for the period 2001-2010.
Year Catch TAC 1978 850 7001979 899 8501980 943 9001981 1 026 9001982 817 9301983 682 9501984 857 9501985 880 9501986 796 9501987 855 8681988 839 8681989 913 6861990 808 8341991 716 8721992 704 8721993 772 8721994 938 8721995 769 8721996 909 8721997 840 8721998 859 8721999 757 8722000 1 060 8722001 850 8722002 702 8722003 754 8722004 612 8722005 485 8722006 428 8722007 331 8722008 448 8722009 568 8722010 570 8722011 442 8722012 338 872
Introduction
The South African hake resource comprises two species, shallow-water Cape hake Merluccius capensis and deep-water Cape hake M. paradoxus. The Cape hakes are dis-tributed on the continental shelf and upper slope around the coast of southern Africa. Deep-water hake are distributed from northern Namibia to southern Moçambique, while shallow- water hake are distributed mainly from southern Angola to northern KwaZulu-Natal. As the names suggest, the distribu-tions of the two hake species differ with depth, although there is a substantial overlap in their depth ranges. Shallow-water hake are distributed over a depth range of 30 to 500 m with most of the population occurring between 100 and 300 m. In contrast, deep-water hake are distributed over a depth ran- ge of 110 m to deeper than 1 000 m with most of the population occurring in depths of between 200 and 800 m. As the sizes of both species increase with depth, large shallow-water hake co-exist with (and feed extensively on) smaller deep-water hake. It is difficult to distinguish between the two hake spe-cies, so they are generally processed and marketed as a single commodity.
Cape hakes are targeted by four fishery sectors: deep-sea
demersal trawl, inshore demersal trawl, hake longline and hake handline, with most of the catch being taken by the deep-sea trawl sector (Figure 11). Hakes are also caught as inci- dental by-catch in the horse mackerel-directed midwater trawl and demersal shark longline fisheries, and to a lesser extent in the linefish sector. The inshore trawl and handline sectors operate only on the South Coast, whereas the deep-sea trawl and longline fleets operate on both the West and South coasts. On the West Coast, the continental shelf is fairly narrow so most trawling is in deep water on the shelf edge and upper slope, and as much as 90% of the hake caught are deep-wa-ter hake. In contrast, most trawling on the South Coast is on the wide continental shelf, the Agulhas Bank, and as much as 70% of hake catches on this coast are shallow-water hake. While not the largest fishery in terms of tonnage (the small pelagic purse fishery targeting sardine and anchovy lands the largest amount of fish at present), the hake fishery is the most valuable of South Africa’s marine fisheries, providing the basis for some 30 000 jobs and an annual landed value in excess of R5.2 billion.
History and management
The demersal fishery off southern Africa started with the arr- ival of the purpose-built research vessel, Pieter Faure, in 1897 and the first commercial trawler, Undine, in 1899 off the Cape. In the early years of the fishery, Agulhas and West Coast sole (Austroglossus pectoralis and A. microlepis respectively) were the primary target species, with hake being caught as an incidental by-catch only. Directed fishing of Cape hakes began only towards the end of the First World War, with catch-es averaging about 1 000 t per annum until 1931. The fish-ery then began escalating during and after the Second World War, with catches increasing steadily to about 170 000 t by the early 1960s. The incursion of foreign fleets in 1962 led to a dramatic increase in fishing effort, and catches in South African waters eventually peaked at over 295 000 t in 1972 (Figure 11). By this time, effort had extended farther offshore
15
Cape hakes
Stock status Unknown Abundant Optimal Depleted Heavily depleted
Fishing pressure Unknown Light Optimal Heavy
Shallow-water hake
Shallow-waterhake
Deep-water hake
Deep-waterhake
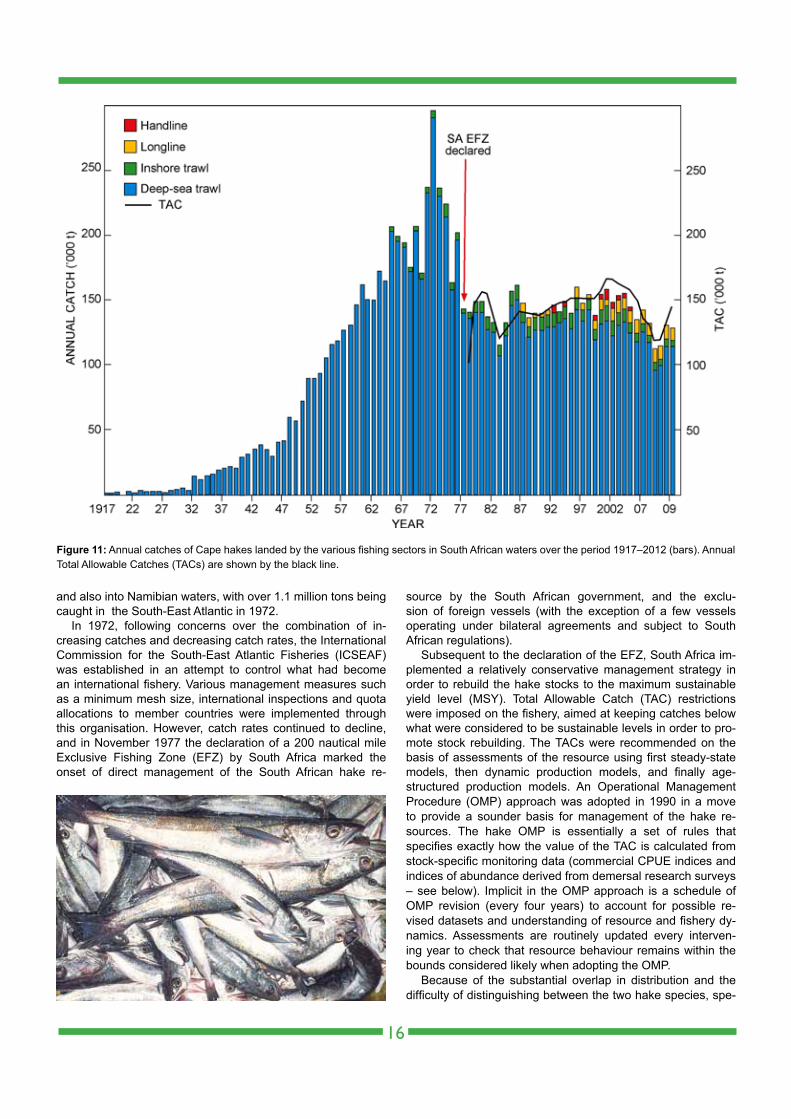
and also into Namibian waters, with over 1.1 million tons being caught in the South-East Atlantic in 1972.
In 1972, following concerns over the combination of in-creasing catches and decreasing catch rates, the International Commission for the South-East Atlantic Fisheries (ICSEAF) was established in an attempt to control what had become an international fishery. Various management measures such as a minimum mesh size, international inspections and quota allocations to member countries were implemented through this organisation. However, catch rates continued to decline, and in November 1977 the declaration of a 200 nautical mile Exclusive Fishing Zone (EFZ) by South Africa marked the onset of direct management of the South African hake re-
source by the South African government, and the exclu-sion of foreign vessels (with the exception of a few vessels operating under bilateral agreements and subject to South African regulations).
Subsequent to the declaration of the EFZ, South Africa im-plemented a relatively conservative management strategy in order to rebuild the hake stocks to the maximum sustainable yield level (MSY). Total Allowable Catch (TAC) restrictions were imposed on the fishery, aimed at keeping catches below what were considered to be sustainable levels in order to pro-mote stock rebuilding. The TACs were recommended on the basis of assessments of the resource using first steady-state models, then dynamic production models, and finally age-structured production models. An Operational Management Procedure (OMP) approach was adopted in 1990 in a move to provide a sounder basis for management of the hake re-sources. The hake OMP is essentially a set of rules that specifies exactly how the value of the TAC is calculated from stock-specific monitoring data (commercial CPUE indices and indices of abundance derived from demersal research surveys – see below). Implicit in the OMP approach is a schedule of OMP revision (every four years) to account for possible re- vised datasets and understanding of resource and fishery dy-namics. Assessments are routinely updated every interven-ing year to check that resource behaviour remains within the bounds considered likely when adopting the OMP.
Because of the substantial overlap in distribution and the difficulty of distinguishing between the two hake species, spe-
16
Figure 11: Annual catches of Cape hakes landed by the various fishing sectors in South African waters over the period 1917–2012 (bars). Annual Total Allowable Catches (TACs) are shown by the black line.
cies-specific catch-and-effort data are not available from the commercial fishery, and the two species were first assessed and managed as a single resource. However, the develop- ment of the longline fishery during the 1990s led to shifts in the relative exploitation rates of the two species, rendering species-combined assessments of the resource inappropriate. Efforts were therefore directed at developing species-disag-gregated assessment models. The first such model was de-veloped during 2005 and was used in the development of the revised OMP implemented in 2006 to calculate the TACs for the 2007 to 2010 fishing seasons.
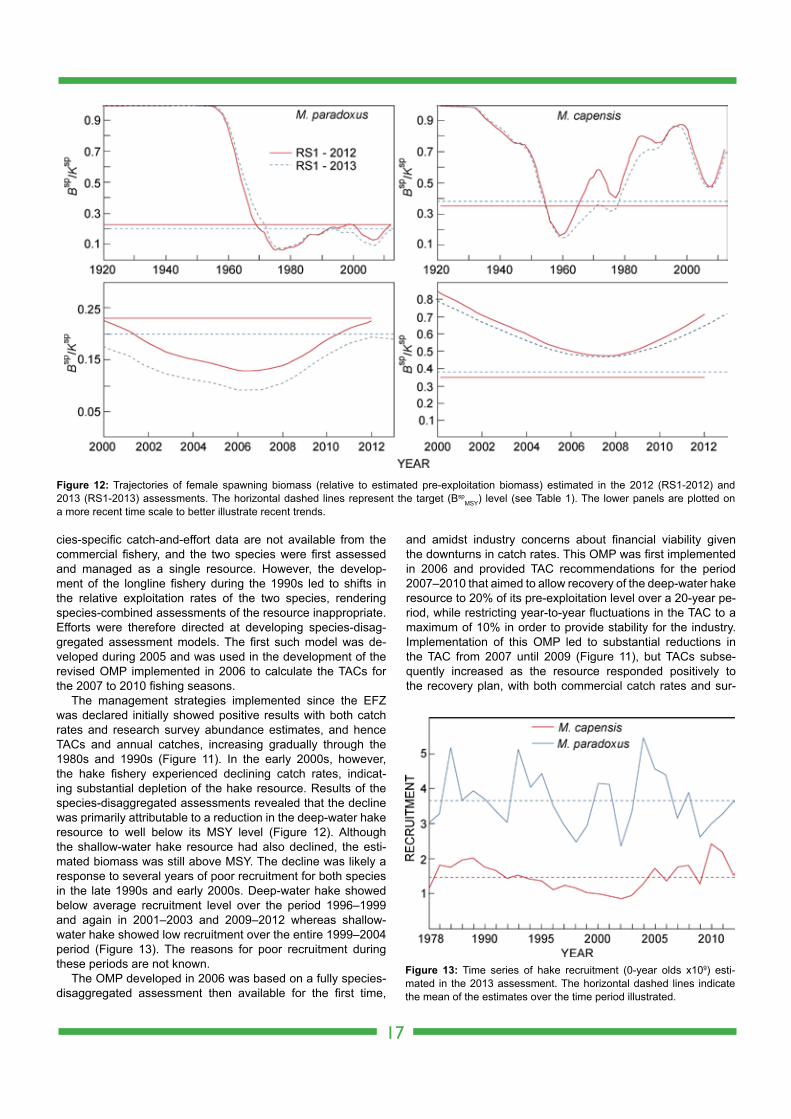
The management strategies implemented since the EFZ was declared initially showed positive results with both catch rates and research survey abundance estimates, and hence TACs and annual catches, increasing gradually through the 1980s and 1990s (Figure 11). In the early 2000s, however, the hake fishery experienced declining catch rates, indicat-ing substantial depletion of the hake resource. Results of the species-disaggregated assessments revealed that the decline was primarily attributable to a reduction in the deep-water hake resource to well below its MSY level (Figure 12). Although the shallow-water hake resource had also declined, the esti-mated biomass was still above MSY. The decline was likely a response to several years of poor recruitment for both species in the late 1990s and early 2000s. Deep-water hake showed below average recruitment level over the period 1996–1999 and again in 2001–2003 and 2009–2012 whereas shallow- water hake showed low recruitment over the entire 1999–2004 period (Figure 13). The reasons for poor recruitment during these periods are not known.
The OMP developed in 2006 was based on a fully species-disaggregated assessment then available for the first time,
and amidst industry concerns about financial viability given the downturns in catch rates. This OMP was first implemented in 2006 and provided TAC recommendations for the period 2007–2010 that aimed to allow recovery of the deep-water hake resource to 20% of its pre-exploitation level over a 20-year pe-riod, while restricting year-to-year fluctuations in the TAC to a maximum of 10% in order to provide stability for the industry. Implementation of this OMP led to substantial reductions in the TAC from 2007 until 2009 (Figure 11), but TACs subse-quently increased as the resource responded positively to the recovery plan, with both commercial catch rates and sur-
17
Figure 13: Time series of hake recruitment (0-year olds x109) esti- mated in the 2013 assessment. The horizontal dashed lines indicate the mean of the estimates over the time period illustrated.
Figure 12: Trajectories of female spawning biomass (relative to estimated pre-exploitation biomass) estimated in the 2012 (RS1-2012) and 2013 (RS1-2013) assessments. The horizontal dashed lines represent the target (Bsp
MSY) level (see Table 1). The lower panels are plotted on a more recent time scale to better illustrate recent trends.
vey indices of abundance turning around to show increasing trends (Figures 14 & 15). In accordance with the agreed OMP revision schedule, a revised OMP was developed in 2010 (OMP-2010) to provide TAC recommendations for the years 2011-2014. The implementation of OMP-2010 appeared to facilitate a continued recovering trend in the M. paradoxus resource (Figure 12), and annual TACs responded to this, increasing over this period (Figure 11). The hake OMP will again be revised during 2014 to provide the TAC recommen- dations for the years 2015–2018.
Uncertainty remains as to the extent to which the deep-water hake resource is shared between South Africa and Namibia, and the influence of catches by the two fisheries on the resource as a whole. At present, the two fisheries are man-aged independently, although the recently established Ben-guela Current Commission aims to work towards joint manage-ment of this resource, if it is established that there is sufficient sharing of the resource between the two countries to warrant this. Research and monitoring
Data are collected from both fishery-independent surveys and from the commercial fishery. Fishery-independent abun-dance indices are determined from annual research surveys
conducted on the West Coast in summer and winter and South Coast in spring and autumn. For each survey, a mini-mum of 100 trawl stations are selected using a pseudo-ran-dom stratified survey design. The survey area (coast to the 500 m depth contour) is subdivided by depth and latitude (West Coast) or longitude (South Coast) into a number of stra-ta, and the number of stations selected within each stratum is proportional to the area of the stratum. Areas of rough ground that cannot be sampled using demersal trawls are excluded from the station selection process, and it is assumed that fish densities in these areas are the same as those in adjacent areas that can be sampled. Trawling is conducted during the day only to account for the daily vertical migration of hake; hake move off the sea floor and into the water column at night to feed.
Operational problems with the departmental research ves-sel (FRS Africana) have prevented this vessel conducting any surveys subsequent to January 2012. In the absence of FRS Africana survey abundance estimates for January 2013, the data collected by the Dr. Fridtjof Nansen during the January 2013 Benguela Current Commission transboundary survey were used to generate abundance estimates for use in the 2013 assessment update and implementation of the OMP to calculate a TAC for 2014. This was possible due to the two vessels (Nansen and Africana) having conducted a number
18
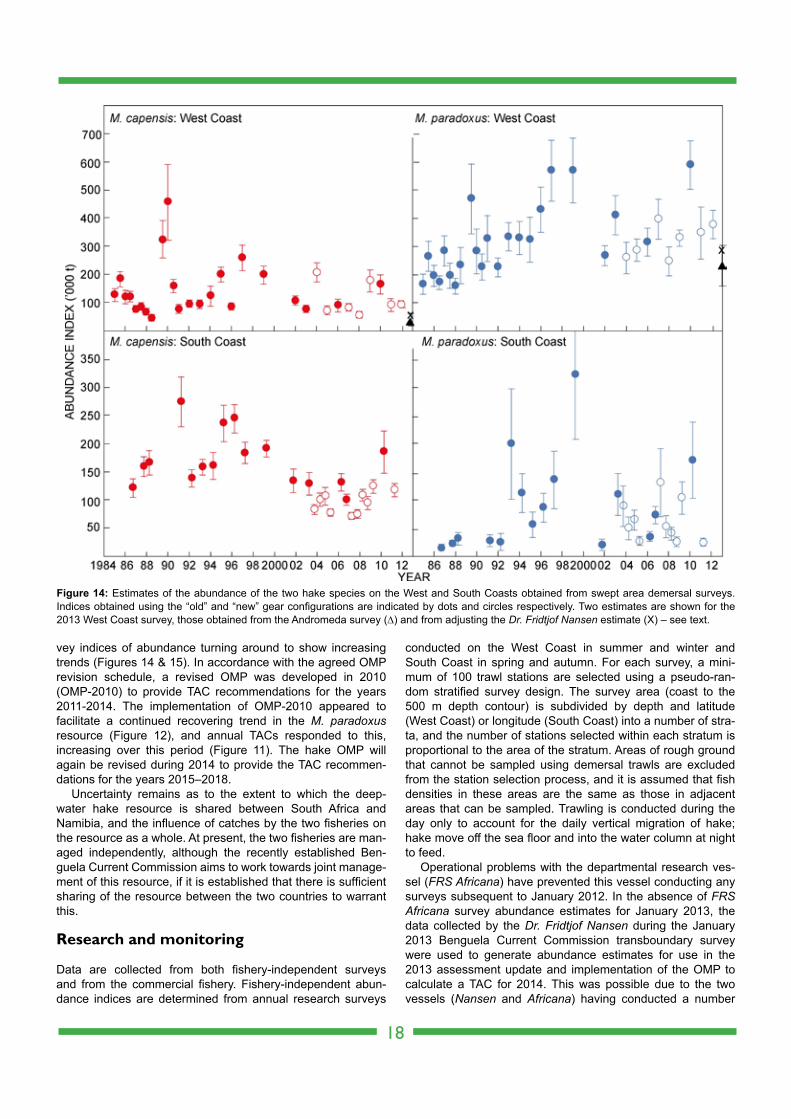
Figure 14: Estimates of the abundance of the two hake species on the West and South Coasts obtained from swept area demersal surveys. Indices obtained using the “old” and “new” gear configurations are indicated by dots and circles respectively. Two estimates are shown for the 2013 West Coast survey, those obtained from the Andromeda survey (∆) and from adjusting the Dr. Fridtjof Nansen estimate (X) – see text.

of comparable surveys (similar survey areas and periods) on the West Coast, the data from which could be used to set up a Nansen versus Africana calibration, and the “Nansen” abundance estimate thereby converted to an equivalent “Afri-cana” abundance estimate (Figure 14). In the absence of the Africana, the Department took the initiative to conduct a West Coast research survey on board a commercial vessel, the MV Andromeda, in February 2013. While data collected dur-ing this survey cannot at this time be used in assessments and the hake OMP due to possible catchability differences be- tween the two vessels, analyses are being conducted to ad-dress this issue and to ensure that the data can be incorpo-rated into the existing time-series (the abundance estimates derived from the Andromeda survey are, nevertheless, illus-trated in Figure 14 for comparative purposes).
Abundance indices from surveys (Figure 14) are calculated using the swept-area method, which relies on fishing methods and gear remaining unchanged between surveys. In 2003, it was considered necessary to change the trawl gear configu-ration on the FRS Africana because net-monitoring sensors showed that the gear used was unbalanced and was being over-spread. The change in trawl gear configuration resulted in non-comparability in the time-series. In selecting a new gear configuration, particular emphasis was placed on mini- mising the possible effect of herding on the abundance indi-
ces. This change is currently taken into account in the assess- ment model by the application of conversion factors estimated from experiments. Another recent (2011) change to the survey design is to extend the survey area into deeper water (1 000 m) to encompass the full extent of the deep-water hake resource. However, abundance estimates for input to TAC evaluations are still calculated for the historic survey area for consistency. It will be possible to incorporate abundance indices from the extended survey area into the assessment models only once a sufficiently long time-series is available. Biological sampling of research catches is routinely conducted to collect data on size structure, feeding, age and growth, and maturity and fecundity. Genetics research is also being conducted to in- vestigate the stock structure of the Cape hakes to determine whether there are genetically discrete stocks off southern Africa, and to assess the extent to which the hake populations may be shared between South Africa and Namibia.
Catch and landing data for the two hake species combined are submitted by the industry, and these data are disaggre-gated to the species level using an algorithm based on the re-lationship of species ratios to fishing depth and fish size as recorded during the research surveys. Species-specific CPUE time-series are standardised using general linear modeling techniques to account for differences in factors such as depth, area, and vessel power. This time-series is then used in the assessment to provide additional estimates of resource abun-dance and trends (Figure 15).
Current status
A routine update assessment of the hake resource incorpo-rating updated commercial (catches and CPUE) and survey (abundance estimates) data for the period up to and includ-ing 2012 was conducted in 2013. The results of this updated assessment (Table 1, Figure 12) indicate that the deep-water hake resource has not yet quite recovered to the MSY level, and is currently estimated to be at 96% of this target level (slightly below the 98% estimated in the 2012 assessment). Al-though at a slightly lower level than that estimated in 2012, the shallow-water hake resource remains well above its MSY level (Table 1, Figure 12). Implementation of the OMP resulted in the TAC for the 2014 fishing season being set at 155 280 t (i.e. a decrease of 0.5 % from the 2013 level of 156 075 t).
19
Table 1: Estimates of the management quantities of the hake resources arising from the 2013 assessment update (RS1-2013), compared to the 2012 assessment (RS1-2012). Note that estimates of biomass levels (pre-exploitation, current and Maximum Sustainable Yield Level) are for spawning females only, while the Maximum Sustainable Yield estimates apply to the whole population. Note also that “current” female spawn-ing biomass (Bsp) estimates are for 2012 in the case of RS1-2012, and 2013 in the case of RS1-2013.
M. paradoxus M. capensis
RS1-2012 RS1-2013 RS1-2012 RS1-2013
Ksp Pre-exploitation female biomass (tons) 586 000 834 000 251 000 288 000Bsp Current female spawning biomass 131 000 158 000 179 000 207 000 Bsp/Ksp Depletion (current female spawning biomass 0.22 0.19 0.71 0.72 relative to pre-exploitation level) Bsp
MSY Biomass providing Maximum Sustainable Yield 134 000 164 000 89 000 109 000Bsp
MSY/Ksp BMSY relative to pre-exploitation level (target) 0.23 0.20 0.3.5 0.38Bsp/Bsp
MSY Current status (current spawning biomass relative 0.98 0.96 2.01 1.90 to target)MSY Maximum sustainable yield 113 000 116 000 70 000 62 000
Figure 15: General Linear Model standardised catch-per-unit-effort abundance indices for the Cape hakes derived from the deep-sea trawl fleet.
Further reading
Payne AIL, Punt AE.1995. Biology and fisheries of South African Cape hakes (M. capensis and M. paradoxus). In: Alheit J, Pitcher TJ (eds), Hake. biology, fisheries and markets. London: Chapman & Hall, London. pp 15–47.
Rademeyer RA, Butterworth DS, Plagányi ÉE. 2008. Assessment of the South African hake resource taking its two-species nature into account. African Journal of Marine Science 30: 263–290.
Rademeyer RA, Butterworth DS, Plagányi ÉE. 2008. A history of recent bases for management and the development of a species- combined Operational Management Procedure for the South African hake. African Journal of Marine Science 30: 291–310.
20
Useful statistics
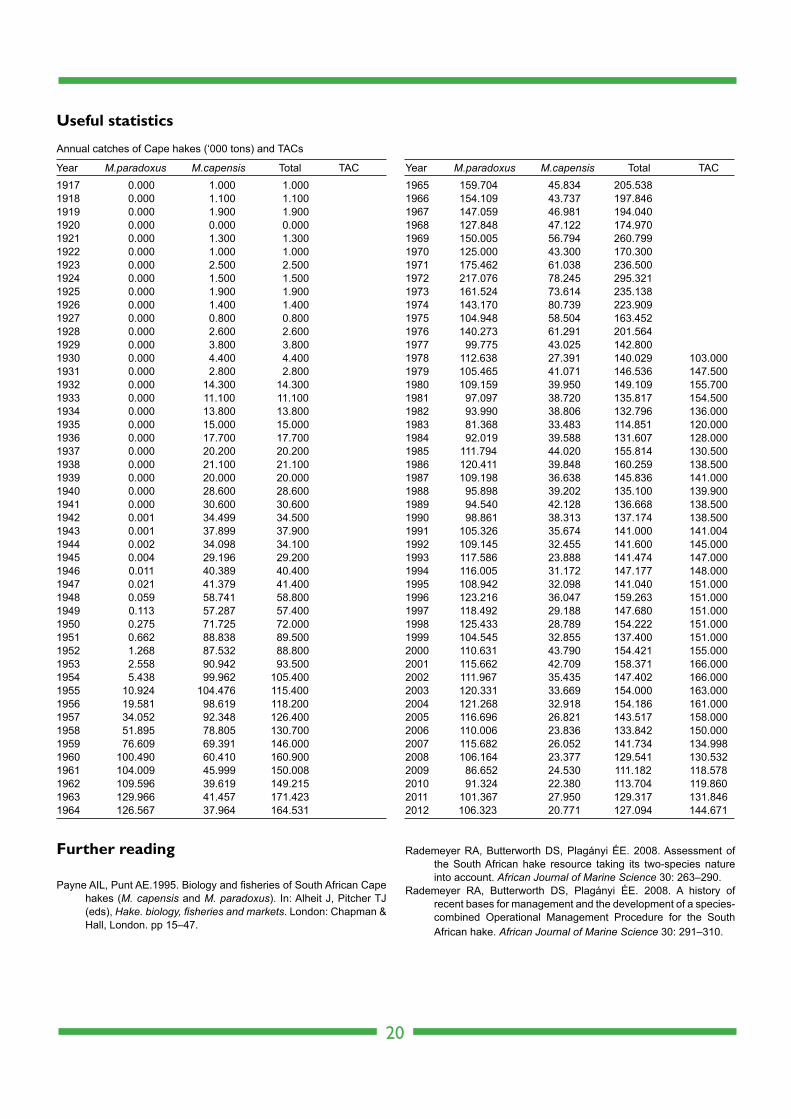
Annual catches of Cape hakes (‘000 tons) and TACs
Year M.paradoxus M.capensis Total TAC1917 0.000 1.000 1.0001918 0.000 1.100 1.1001919 0.000 1.900 1.9001920 0.000 0.000 0.0001921 0.000 1.300 1.3001922 0.000 1.000 1.0001923 0.000 2.500 2.5001924 0.000 1.500 1.5001925 0.000 1.900 1.9001926 0.000 1.400 1.4001927 0.000 0.800 0.8001928 0.000 2.600 2.6001929 0.000 3.800 3.8001930 0.000 4.400 4.4001931 0.000 2.800 2.8001932 0.000 14.300 14.3001933 0.000 11.100 11.1001934 0.000 13.800 13.8001935 0.000 15.000 15.0001936 0.000 17.700 17.7001937 0.000 20.200 20.2001938 0.000 21.100 21.1001939 0.000 20.000 20.0001940 0.000 28.600 28.6001941 0.000 30.600 30.6001942 0.001 34.499 34.5001943 0.001 37.899 37.9001944 0.002 34.098 34.1001945 0.004 29.196 29.2001946 0.011 40.389 40.4001947 0.021 41.379 41.4001948 0.059 58.741 58.8001949 0.113 57.287 57.4001950 0.275 71.725 72.0001951 0.662 88.838 89.5001952 1.268 87.532 88.8001953 2.558 90.942 93.5001954 5.438 99.962 105.4001955 10.924 104.476 115.4001956 19.581 98.619 118.2001957 34.052 92.348 126.4001958 51.895 78.805 130.7001959 76.609 69.391 146.0001960 100.490 60.410 160.9001961 104.009 45.999 150.0081962 109.596 39.619 149.2151963 129.966 41.457 171.4231964 126.567 37.964 164.531
Year M.paradoxus M.capensis Total TAC1965 159.704 45.834 205.5381966 154.109 43.737 197.8461967 147.059 46.981 194.0401968 127.848 47.122 174.9701969 150.005 56.794 260.7991970 125.000 43.300 170.3001971 175.462 61.038 236.5001972 217.076 78.245 295.3211973 161.524 73.614 235.1381974 143.170 80.739 223.9091975 104.948 58.504 163.4521976 140.273 61.291 201.5641977 99.775 43.025 142.8001978 112.638 27.391 140.029 103.0001979 105.465 41.071 146.536 147.5001980 109.159 39.950 149.109 155.7001981 97.097 38.720 135.817 154.5001982 93.990 38.806 132.796 136.0001983 81.368 33.483 114.851 120.0001984 92.019 39.588 131.607 128.0001985 111.794 44.020 155.814 130.5001986 120.411 39.848 160.259 138.5001987 109.198 36.638 145.836 141.0001988 95.898 39.202 135.100 139.9001989 94.540 42.128 136.668 138.500 1990 98.861 38.313 137.174 138.5001991 105.326 35.674 141.000 141.0041992 109.145 32.455 141.600 145.0001993 117.586 23.888 141.474 147.0001994 116.005 31.172 147.177 148.0001995 108.942 32.098 141.040 151.0001996 123.216 36.047 159.263 151.0001997 118.492 29.188 147.680 151.0001998 125.433 28.789 154.222 151.0001999 104.545 32.855 137.400 151.0002000 110.631 43.790 154.421 155.0002001 115.662 42.709 158.371 166.0002002 111.967 35.435 147.402 166.0002003 120.331 33.669 154.000 163.0002004 121.268 32.918 154.186 161.0002005 116.696 26.821 143.517 158.0002006 110.006 23.836 133.842 150.0002007 115.682 26.052 141.734 134.9982008 106.164 23.377 129.541 130.5322009 86.652 24.530 111.182 118.5782010 91.324 22.380 113.704 119.8602011 101.367 27.950 129.317 131.8462012 106.323 20.7710 127.09400 144.671
Introduction
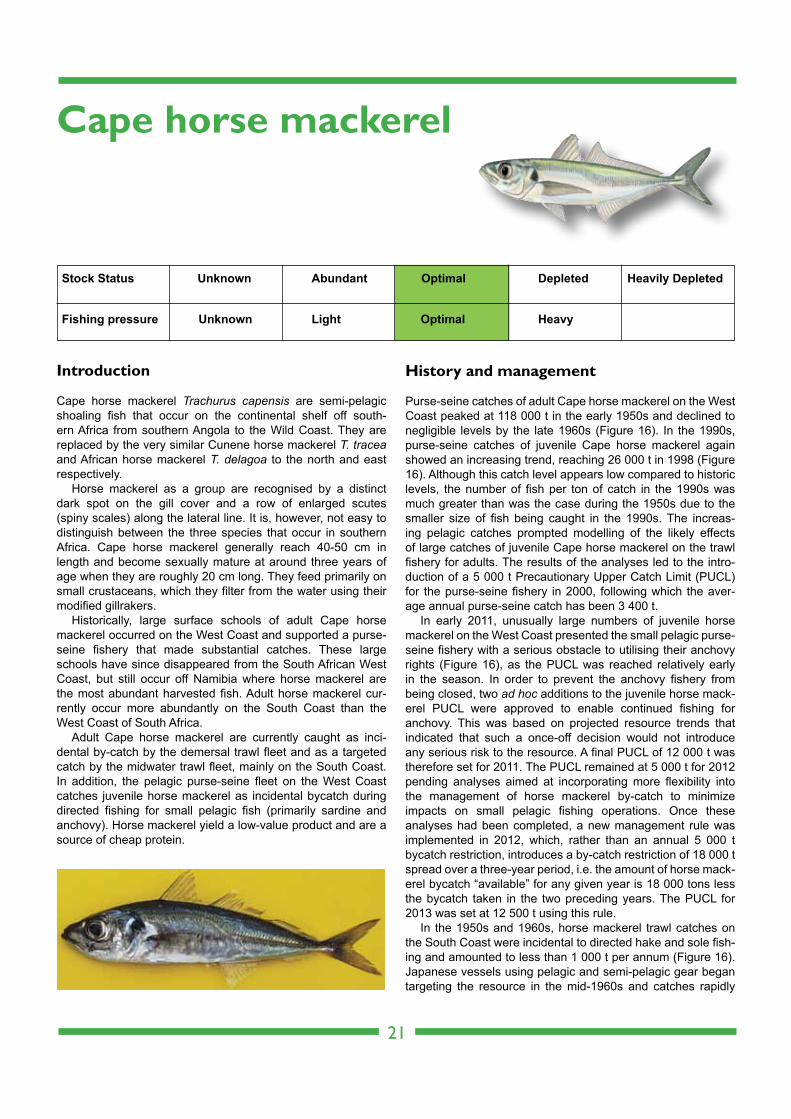
Cape horse mackerel Trachurus capensis are semi-pelagic shoaling fish that occur on the continental shelf off south-ern Africa from southern Angola to the Wild Coast. They are replaced by the very similar Cunene horse mackerel T. tracea and African horse mackerel T. delagoa to the north and east respectively.
Horse mackerel as a group are recognised by a distinct dark spot on the gill cover and a row of enlarged scutes (spiny scales) along the lateral line. It is, however, not easy to distinguish between the three species that occur in southern Africa. Cape horse mackerel generally reach 40-50 cm in length and become sexually mature at around three years of age when they are roughly 20 cm long. They feed primarily on small crustaceans, which they filter from the water using their modified gillrakers.
Historically, large surface schools of adult Cape horse mackerel occurred on the West Coast and supported a purse-seine fishery that made substantial catches. These large schools have since disappeared from the South African West Coast, but still occur off Namibia where horse mackerel are the most abundant harvested fish. Adult horse mackerel cur-rently occur more abundantly on the South Coast than the West Coast of South Africa.
Adult Cape horse mackerel are currently caught as inci-dental by-catch by the demersal trawl fleet and as a targeted catch by the midwater trawl fleet, mainly on the South Coast. In addition, the pelagic purse-seine fleet on the West Coast catches juvenile horse mackerel as incidental bycatch during directed fishing for small pelagic fish (primarily sardine and anchovy). Horse mackerel yield a low-value product and are a source of cheap protein.
History and management
Purse-seine catches of adult Cape horse mackerel on the West Coast peaked at 118 000 t in the early 1950s and declined to negligible levels by the late 1960s (Figure 16). In the 1990s, purse-seine catches of juvenile Cape horse mackerel again showed an increasing trend, reaching 26 000 t in 1998 (Figure 16). Although this catch level appears low compared to historic levels, the number of fish per ton of catch in the 1990s was much greater than was the case during the 1950s due to the smaller size of fish being caught in the 1990s. The increas- ing pelagic catches prompted modelling of the likely effects of large catches of juvenile Cape horse mackerel on the trawl fishery for adults. The results of the analyses led to the intro-duction of a 5 000 t Precautionary Upper Catch Limit (PUCL) for the purse-seine fishery in 2000, following which the aver- age annual purse-seine catch has been 3 400 t.
In early 2011, unusually large numbers of juvenile horse mackerel on the West Coast presented the small pelagic purse-seine fishery with a serious obstacle to utilising their anchovy rights (Figure 16), as the PUCL was reached relatively early in the season. In order to prevent the anchovy fishery from being closed, two ad hoc additions to the juvenile horse mack-erel PUCL were approved to enable continued fishing for anchovy. This was based on projected resource trends that indicated that such a once-off decision would not introduce any serious risk to the resource. A final PUCL of 12 000 t was therefore set for 2011. The PUCL remained at 5 000 t for 2012 pending analyses aimed at incorporating more flexibility into the management of horse mackerel by-catch to minimize impacts on small pelagic fishing operations. Once these analyses had been completed, a new management rule was implemented in 2012, which, rather than an annual 5 000 t bycatch restriction, introduces a by-catch restriction of 18 000 t spread over a three-year period, i.e. the amount of horse mack-erel bycatch “available” for any given year is 18 000 tons less the bycatch taken in the two preceding years. The PUCL for 2013 was set at 12 500 t using this rule.
In the 1950s and 1960s, horse mackerel trawl catches on the South Coast were incidental to directed hake and sole fish-ing and amounted to less than 1 000 t per annum (Figure 16). Japanese vessels using pelagic and semi-pelagic gear began targeting the resource in the mid-1960s and catches rapidly
21
Cape horse mackerel
Stock Status Unknown Abundant Optimal Depleted
Fishing pressure Unknown Light Optimal Heavy
Heavily Depleted
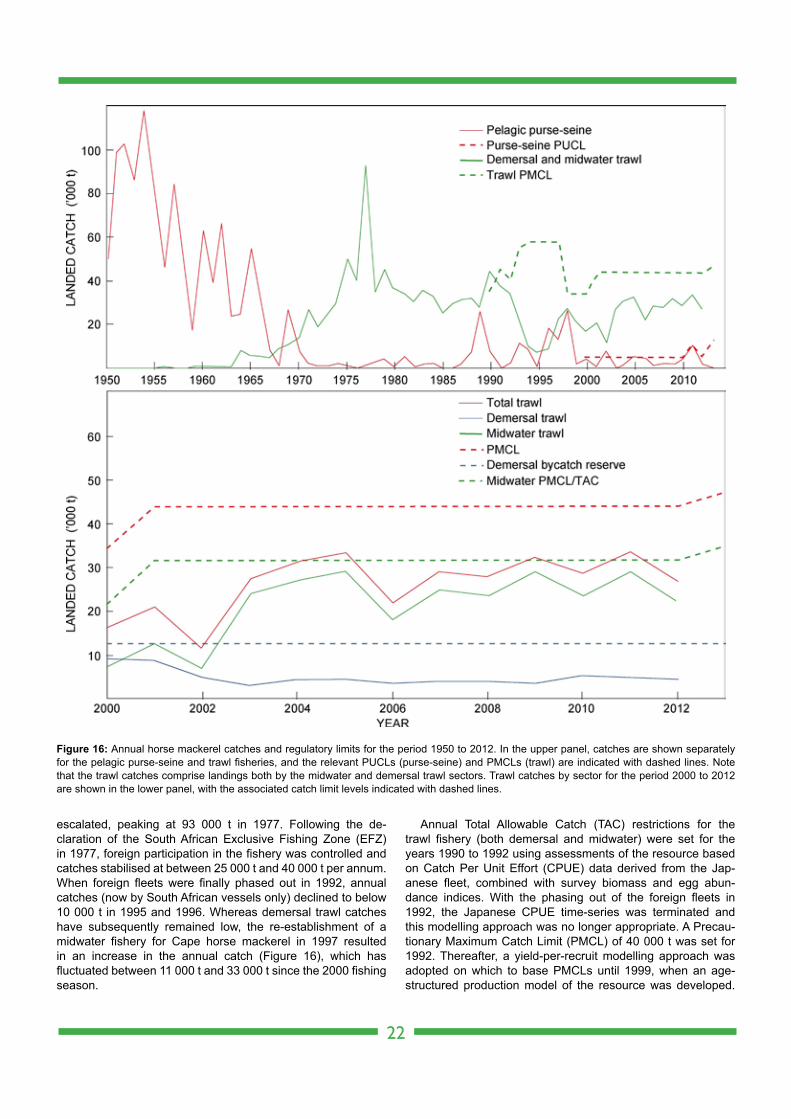
escalated, peaking at 93 000 t in 1977. Following the de- claration of the South African Exclusive Fishing Zone (EFZ) in 1977, foreign participation in the fishery was controlled and catches stabilised at between 25 000 t and 40 000 t per annum. When foreign fleets were finally phased out in 1992, annual catches (now by South African vessels only) declined to below 10 000 t in 1995 and 1996. Whereas demersal trawl catches have subsequently remained low, the re-establishment of a midwater fishery for Cape horse mackerel in 1997 resulted in an increase in the annual catch (Figure 16), which has fluctuated between 11 000 t and 33 000 t since the 2000 fishing season.
Annual Total Allowable Catch (TAC) restrictions for the trawl fishery (both demersal and midwater) were set for the years 1990 to 1992 using assessments of the resource based on Catch Per Unit Effort (CPUE) data derived from the Jap-anese fleet, combined with survey biomass and egg abun- dance indices. With the phasing out of the foreign fleets in 1992, the Japanese CPUE time-series was terminated and this modelling approach was no longer appropriate. A Precau-tionary Maximum Catch Limit (PMCL) of 40 000 t was set for 1992. Thereafter, a yield-per-recruit modelling approach was adopted on which to base PMCLs until 1999, when an age-structured production model of the resource was developed.
22
Figure 16: Annual horse mackerel catches and regulatory limits for the period 1950 to 2012. In the upper panel, catches are shown separately for the pelagic purse-seine and trawl fisheries, and the relevant PUCLs (purse-seine) and PMCLs (trawl) are indicated with dashed lines. Note that the trawl catches comprise landings both by the midwater and demersal trawl sectors. Trawl catches by sector for the period 2000 to 2012 are shown in the lower panel, with the associated catch limit levels indicated with dashed lines.
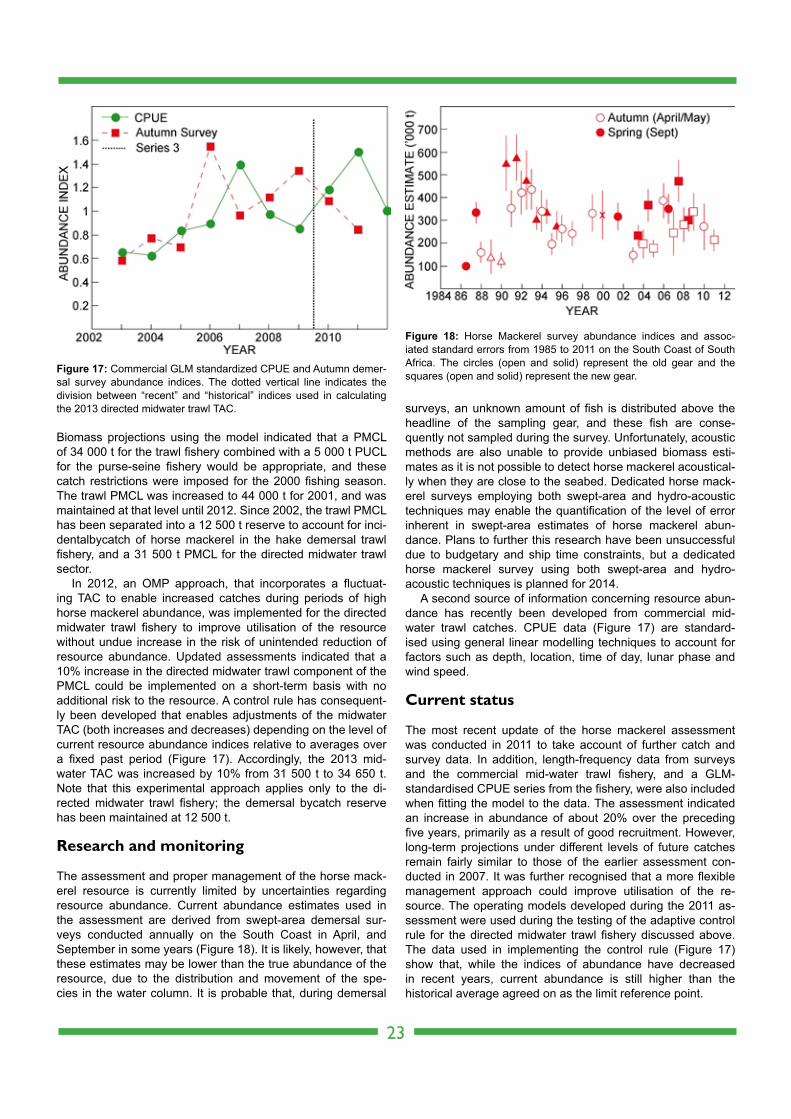
Biomass projections using the model indicated that a PMCL of 34 000 t for the trawl fishery combined with a 5 000 t PUCL for the purse-seine fishery would be appropriate, and these catch restrictions were imposed for the 2000 fishing season. The trawl PMCL was increased to 44 000 t for 2001, and was maintained at that level until 2012. Since 2002, the trawl PMCL has been separated into a 12 500 t reserve to account for inci- dentalbycatch of horse mackerel in the hake demersal trawl fishery, and a 31 500 t PMCL for the directed midwater trawl sector.
In 2012, an OMP approach, that incorporates a fluctuat-ing TAC to enable increased catches during periods of high horse mackerel abundance, was implemented for the directed midwater trawl fishery to improve utilisation of the resource without undue increase in the risk of unintended reduction of resource abundance. Updated assessments indicated that a 10% increase in the directed midwater trawl component of the PMCL could be implemented on a short-term basis with no additional risk to the resource. A control rule has consequent-ly been developed that enables adjustments of the midwater TAC (both increases and decreases) depending on the level of current resource abundance indices relative to averages over a fixed past period (Figure 17). Accordingly, the 2013 mid- water TAC was increased by 10% from 31 500 t to 34 650 t. Note that this experimental approach applies only to the di-rected midwater trawl fishery; the demersal bycatch reserve has been maintained at 12 500 t.
Research and monitoring
The assessment and proper management of the horse mack-erel resource is currently limited by uncertainties regarding resource abundance. Current abundance estimates used in the assessment are derived from swept-area demersal sur-veys conducted annually on the South Coast in April, and September in some years (Figure 18). It is likely, however, that these estimates may be lower than the true abundance of the resource, due to the distribution and movement of the spe-cies in the water column. It is probable that, during demersal
surveys, an unknown amount of fish is distributed above the headline of the sampling gear, and these fish are conse- quently not sampled during the survey. Unfortunately, acoustic methods are also unable to provide unbiased biomass esti-mates as it is not possible to detect horse mackerel acoustical-ly when they are close to the seabed. Dedicated horse mack-erel surveys employing both swept-area and hydro-acoustic techniques may enable the quantification of the level of error inherent in swept-area estimates of horse mackerel abun- dance. Plans to further this research have been unsuccessful due to budgetary and ship time constraints, but a dedicated horse mackerel survey using both swept-area and hydro-acoustic techniques is planned for 2014.
A second source of information concerning resource abun-dance has recently been developed from commercial mid- water trawl catches. CPUE data (Figure 17) are standard- ised using general linear modelling techniques to account for factors such as depth, location, time of day, lunar phase and wind speed.
Current status
The most recent update of the horse mackerel assessment was conducted in 2011 to take account of further catch and survey data. In addition, length-frequency data from surveys and the commercial mid-water trawl fishery, and a GLM-standardised CPUE series from the fishery, were also included when fitting the model to the data. The assessment indicated an increase in abundance of about 20% over the preceding five years, primarily as a result of good recruitment. However, long-term projections under different levels of future catches remain fairly similar to those of the earlier assessment con-ducted in 2007. It was further recognised that a more flexible management approach could improve utilisation of the re-source. The operating models developed during the 2011 as-sessment were used during the testing of the adaptive control rule for the directed midwater trawl fishery discussed above. The data used in implementing the control rule (Figure 17) show that, while the indices of abundance have decreased in recent years, current abundance is still higher than the historical average agreed on as the limit reference point.
23
Figure 17: Commercial GLM standardized CPUE and Autumn demer-sal survey abundance indices. The dotted vertical line indicates the division between “recent” and “historical” indices used in calculating the 2013 directed midwater trawl TAC.
Figure 18: Horse Mackerel survey abundance indices and assoc- iated standard errors from 1985 to 2011 on the South Coast of South Africa. The circles (open and solid) represent the old gear and the squares (open and solid) represent the new gear.

Further reading
Crawford RJM. 1989. Horse mackerels and saury. In: Payne AIL, Crawford RJM (eds), Oceans of life. Cape Town: Vlaeberg Pub-lishers, 122–129.
Kerstan M, Leslie RW. 1994. Horse mackerel on Agulhas bank - sum-mary of current knowledge. South African Journal of Science 90: 173–178.
Merkle D, Coetzee J. 2007. Acoustic estimation of juvenile horse mackerel 1997–2006. Unpublished Scientific Working Group Document, Marine and Coastal Management, South Africa MCM/2007/MAY/SWG-PEL/02, 8pp.
Furman LB, Butterworth DSB. 2011. Updated assessments and projec-tions under alternative future catch levels for the horse mack-erel resource. Unpublished Scientific Working Group document FISHERIES/2011/OCT/SWG-DEM/49. 31pp.
24
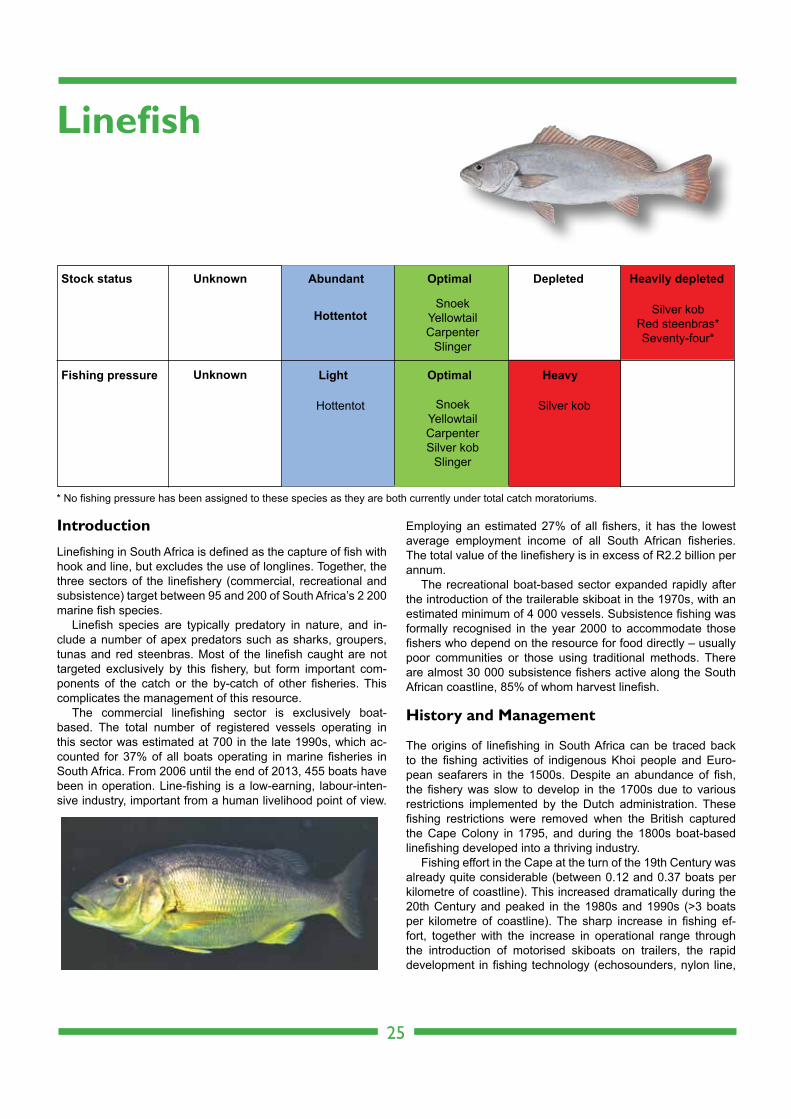
Introduction
Linefishing in South Africa is defined as the capture of fish with hook and line, but excludes the use of longlines. Together, the three sectors of the linefishery (commercial, recreational and subsistence) target between 95 and 200 of South Africa’s 2 200 marine fish species.
Linefish species are typically predatory in nature, and in-clude a number of apex predators such as sharks, groupers, tunas and red steenbras. Most of the linefish caught are not targeted exclusively by this fishery, but form important com-ponents of the catch or the by-catch of other fisheries. This complicates the management of this resource.
The commercial linefishing sector is exclusively boat- based. The total number of registered vessels operating in this sector was estimated at 700 in the late 1990s, which ac-counted for 37% of all boats operating in marine fisheries in South Africa. From 2006 until the end of 2013, 455 boats have been in operation. Line-fishing is a low-earning, labour-inten-sive industry, important from a human livelihood point of view.
Employing an estimated 27% of all fishers, it has the lowest average employment income of all South African fisheries. The total value of the linefishery is in excess of R2.2 billion per annum.
The recreational boat-based sector expanded rapidly after the introduction of the trailerable skiboat in the 1970s, with an estimated minimum of 4 000 vessels. Subsistence fishing was formally recognised in the year 2000 to accommodate those fishers who depend on the resource for food directly – usually poor communities or those using traditional methods. There are almost 30 000 subsistence fishers active along the South African coastline, 85% of whom harvest linefish.
History and Management
The origins of linefishing in South Africa can be traced back to the fishing activities of indigenous Khoi people and Euro-pean seafarers in the 1500s. Despite an abundance of fish, the fishery was slow to develop in the 1700s due to various restrictions implemented by the Dutch administration. These fishing restrictions were removed when the British captured the Cape Colony in 1795, and during the 1800s boat-based linefishing developed into a thriving industry.
Fishing effort in the Cape at the turn of the 19th Century was already quite considerable (between 0.12 and 0.37 boats per kilometre of coastline). This increased dramatically during the 20th Century and peaked in the 1980s and 1990s (>3 boats per kilometre of coastline). The sharp increase in fishing ef-fort, together with the increase in operational range through the introduction of motorised skiboats on trailers, the rapid development in fishing technology (echosounders, nylon line,
25
Linefish
Stock status Abundant Optimal Depleted Heavily depletedUnknown
Fishing pressure Light Optimal Heavy
SnoekYellowtailCarpenter
Slinger
Silver kobRed steenbras*Seventy-four*
Hottentot Silver kob
Unknown
Hottentot
SnoekYellowtailCarpenterSilver kob
Slinger
* No fishing pressure has been assigned to these species as they are both currently under total catch moratoriums.
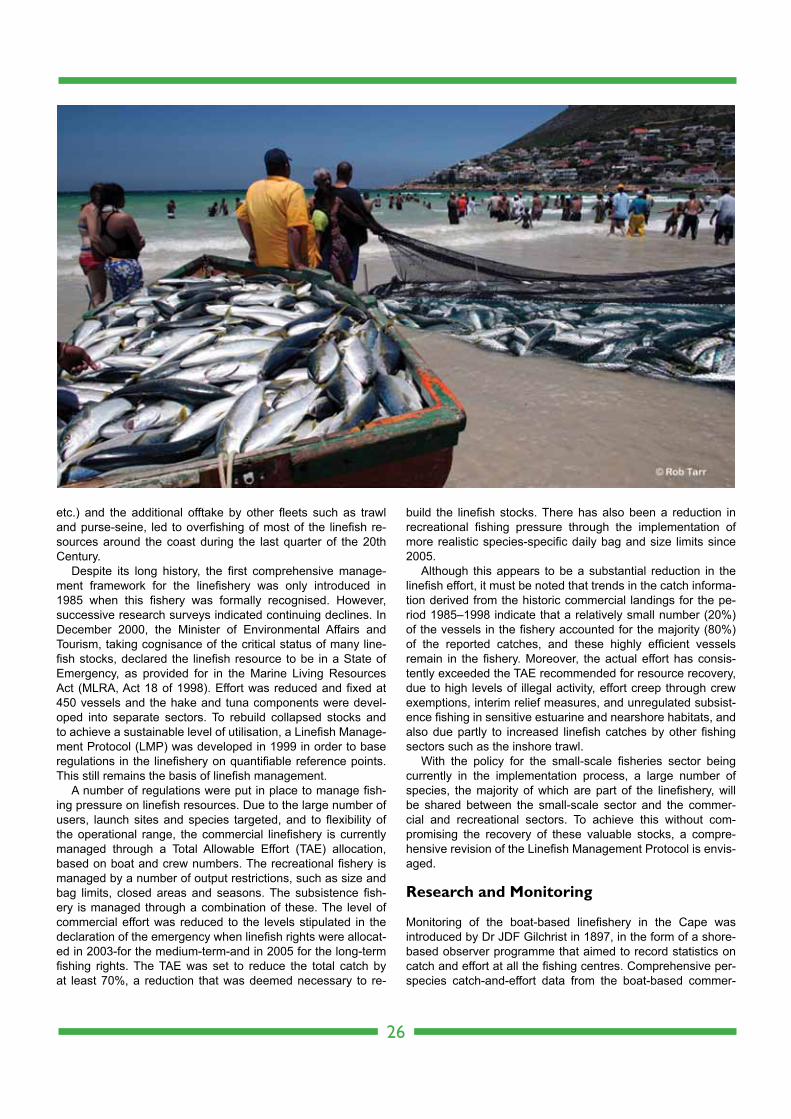
etc.) and the additional offtake by other fleets such as trawl and purse-seine, led to overfishing of most of the linefish re-sources around the coast during the last quarter of the 20th Century.
Despite its long history, the first comprehensive manage-ment framework for the linefishery was only introduced in 1985 when this fishery was formally recognised. However, successive research surveys indicated continuing declines. In December 2000, the Minister of Environmental Affairs and Tourism, taking cognisance of the critical status of many line-fish stocks, declared the linefish resource to be in a State of Emergency, as provided for in the Marine Living Resources Act (MLRA, Act 18 of 1998). Effort was reduced and fixed at 450 vessels and the hake and tuna components were devel-oped into separate sectors. To rebuild collapsed stocks and to achieve a sustainable level of utilisation, a Linefish Manage-ment Protocol (LMP) was developed in 1999 in order to base regulations in the linefishery on quantifiable reference points. This still remains the basis of linefish management.
A number of regulations were put in place to manage fish- ing pressure on linefish resources. Due to the large number of users, launch sites and species targeted, and to flexibility of the operational range, the commercial linefishery is currently managed through a Total Allowable Effort (TAE) allocation, based on boat and crew numbers. The recreational fishery is managed by a number of output restrictions, such as size and bag limits, closed areas and seasons. The subsistence fish- ery is managed through a combination of these. The level of commercial effort was reduced to the levels stipulated in the declaration of the emergency when linefish rights were allocat-ed in 2003-for the medium-term-and in 2005 for the long-term fishing rights. The TAE was set to reduce the total catch by at least 70%, a reduction that was deemed necessary to re-
build the linefish stocks. There has also been a reduction in recreational fishing pressure through the implementation of more realistic species-specific daily bag and size limits since 2005.
Although this appears to be a substantial reduction in the linefish effort, it must be noted that trends in the catch informa-tion derived from the historic commercial landings for the pe-riod 1985–1998 indicate that a relatively small number (20%) of the vessels in the fishery accounted for the majority (80%) of the reported catches, and these highly efficient vessels remain in the fishery. Moreover, the actual effort has consis- tently exceeded the TAE recommended for resource recovery, due to high levels of illegal activity, effort creep through crew exemptions, interim relief measures, and unregulated subsist-ence fishing in sensitive estuarine and nearshore habitats, and also due partly to increased linefish catches by other fishing sectors such as the inshore trawl.
With the policy for the small-scale fisheries sector being currently in the implementation process, a large number of species, the majority of which are part of the linefishery, will be shared between the small-scale sector and the commer-cial and recreational sectors. To achieve this without com- promising the recovery of these valuable stocks, a compre-hensive revision of the Linefish Management Protocol is envis-aged.
Research and Monitoring
Monitoring of the boat-based linefishery in the Cape was introduced by Dr JDF Gilchrist in 1897, in the form of a shore-based observer programme that aimed to record statistics on catch and effort at all the fishing centres. Comprehensive per-species catch-and-effort data from the boat-based commer-
26
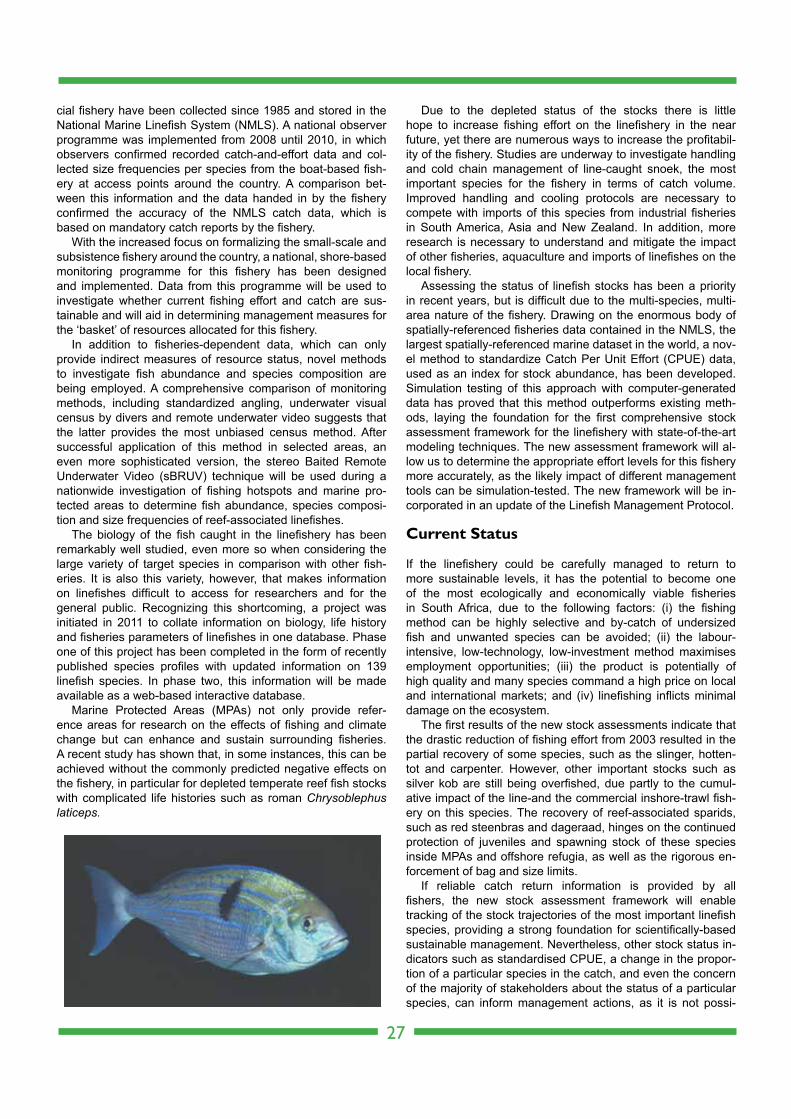
cial fishery have been collected since 1985 and stored in the National Marine Linefish System (NMLS). A national observer programme was implemented from 2008 until 2010, in which observers confirmed recorded catch-and-effort data and col-lected size frequencies per species from the boat-based fish-ery at access points around the country. A comparison bet- ween this information and the data handed in by the fishery confirmed the accuracy of the NMLS catch data, which is based on mandatory catch reports by the fishery.
With the increased focus on formalizing the small-scale and subsistence fishery around the country, a national, shore-based monitoring programme for this fishery has been designed and implemented. Data from this programme will be used to investigate whether current fishing effort and catch are sus-tainable and will aid in determining management measures for the ‘basket’ of resources allocated for this fishery.
In addition to fisheries-dependent data, which can only provide indirect measures of resource status, novel methods to investigate fish abundance and species composition are being employed. A comprehensive comparison of monitoring methods, including standardized angling, underwater visual census by divers and remote underwater video suggests that the latter provides the most unbiased census method. After successful application of this method in selected areas, an even more sophisticated version, the stereo Baited Remote Underwater Video (sBRUV) technique will be used during a nationwide investigation of fishing hotspots and marine pro-tected areas to determine fish abundance, species composi-tion and size frequencies of reef-associated linefishes.
The biology of the fish caught in the linefishery has been remarkably well studied, even more so when considering the large variety of target species in comparison with other fish-eries. It is also this variety, however, that makes information on linefishes difficult to access for researchers and for the general public. Recognizing this shortcoming, a project was initiated in 2011 to collate information on biology, life history and fisheries parameters of linefishes in one database. Phase one of this project has been completed in the form of recently published species profiles with updated information on 139 linefish species. In phase two, this information will be made available as a web-based interactive database.
Marine Protected Areas (MPAs) not only provide refer-ence areas for research on the effects of fishing and climate change but can enhance and sustain surrounding fisheries. A recent study has shown that, in some instances, this can be achieved without the commonly predicted negative effects on the fishery, in particular for depleted temperate reef fish stocks with complicated life histories such as roman Chrysoblephus laticeps.
Due to the depleted status of the stocks there is little hope to increase fishing effort on the linefishery in the near future, yet there are numerous ways to increase the profitabil-ity of the fishery. Studies are underway to investigate handling and cold chain management of line-caught snoek, the most important species for the fishery in terms of catch volume. Improved handling and cooling protocols are necessary to compete with imports of this species from industrial fisheries in South America, Asia and New Zealand. In addition, more research is necessary to understand and mitigate the impact of other fisheries, aquaculture and imports of linefishes on the local fishery.
Assessing the status of linefish stocks has been a priority in recent years, but is difficult due to the multi-species, multi-area nature of the fishery. Drawing on the enormous body of spatially-referenced fisheries data contained in the NMLS, the largest spatially-referenced marine dataset in the world, a nov-el method to standardize Catch Per Unit Effort (CPUE) data, used as an index for stock abundance, has been developed. Simulation testing of this approach with computer-generated data has proved that this method outperforms existing meth-ods, laying the foundation for the first comprehensive stock assessment framework for the linefishery with state-of-the-art modeling techniques. The new assessment framework will al-low us to determine the appropriate effort levels for this fishery more accurately, as the likely impact of different management tools can be simulation-tested. The new framework will be in-corporated in an update of the Linefish Management Protocol.
Current Status
If the linefishery could be carefully managed to return to more sustainable levels, it has the potential to become one of the most ecologically and economically viable fisheries in South Africa, due to the following factors: (i) the fishing method can be highly selective and by-catch of undersized fish and unwanted species can be avoided; (ii) the labour-intensive, low-technology, low-investment method maximises employment opportunities; (iii) the product is potentially of high quality and many species command a high price on local and international markets; and (iv) linefishing inflicts minimal damage on the ecosystem.
The first results of the new stock assessments indicate that the drastic reduction of fishing effort from 2003 resulted in the partial recovery of some species, such as the slinger, hotten-tot and carpenter. However, other important stocks such as silver kob are still being overfished, due partly to the cumul- ative impact of the line-and the commercial inshore-trawl fish-ery on this species. The recovery of reef-associated sparids, such as red steenbras and dageraad, hinges on the continued protection of juveniles and spawning stock of these species inside MPAs and offshore refugia, as well as the rigorous en-forcement of bag and size limits.
If reliable catch return information is provided by all fishers, the new stock assessment framework will enable tracking of the stock trajectories of the most important linefish species, providing a strong foundation for scientifically-based sustainable management. Nevertheless, other stock status in-dicators such as standardised CPUE, a change in the propor-tion of a particular species in the catch, and even the concern of the majority of stakeholders about the status of a particular species, can inform management actions, as it is not possi-
27
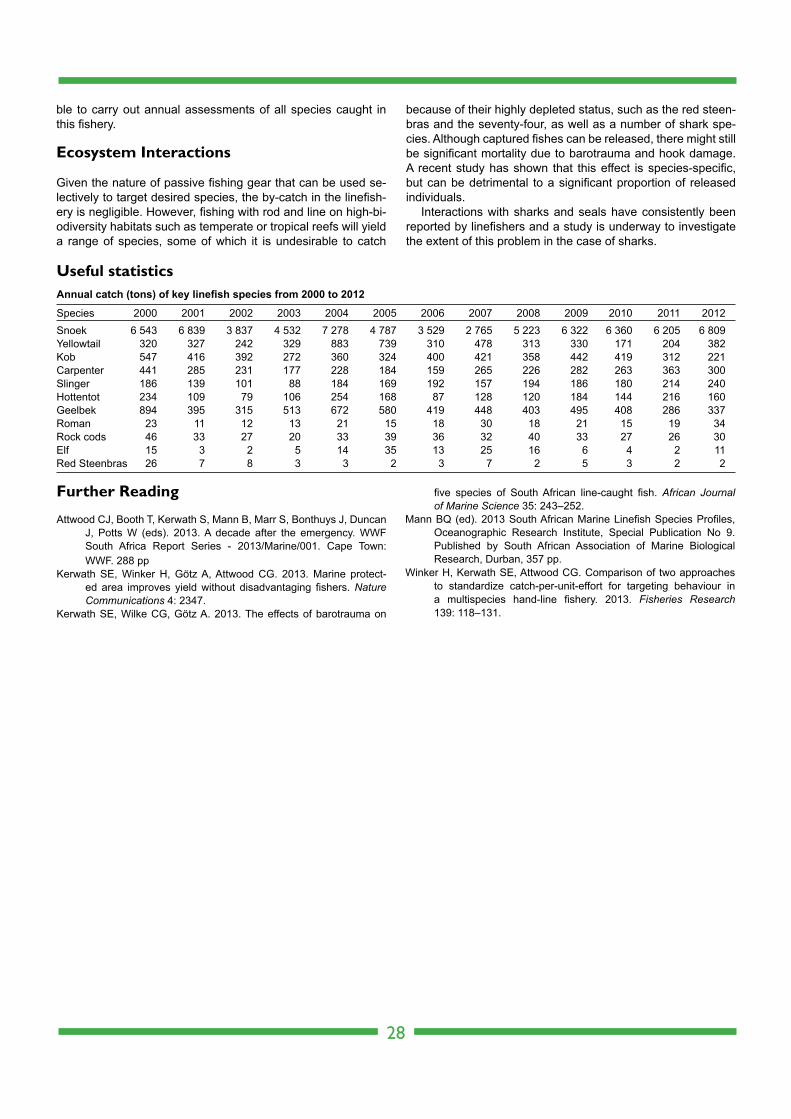
ble to carry out annual assessments of all species caught in this fishery.
Ecosystem Interactions
Given the nature of passive fishing gear that can be used se-lectively to target desired species, the by-catch in the linefish-ery is negligible. However, fishing with rod and line on high-bi-odiversity habitats such as temperate or tropical reefs will yield a range of species, some of which it is undesirable to catch
because of their highly depleted status, such as the red steen-bras and the seventy-four, as well as a number of shark spe-cies. Although captured fishes can be released, there might still be significant mortality due to barotrauma and hook damage. A recent study has shown that this effect is species-specific, but can be detrimental to a significant proportion of released individuals.
Interactions with sharks and seals have consistently been reported by linefishers and a study is underway to investigate the extent of this problem in the case of sharks.
28
Annual catch (tons) of key linefish species from 2000 to 2012
Species 2000 2001 2002 2003 2004 2005 2006 2007 2008 2009 2010 2011 2012 Snoek 6 543 6 839 3 837 4 532 7 278 4 787 3 529 2 765 5 223 6 322 6 360 6 205 6 809Yellowtail 320 327 242 329 883 739 310 478 313 330 171 204 382Kob 547 416 392 272 360 324 400 421 358 442 419 312 221Carpenter 441 285 231 177 228 184 159 265 226 282 263 363 300Slinger 186 139 101 88 184 169 192 157 194 186 180 214 240Hottentot 234 109 79 106 254 168 87 128 120 184 144 216 160Geelbek 894 395 315 513 672 580 419 448 403 495 408 286 337Roman 23 11 12 13 21 15 18 30 18 21 15 19 34Rock cods 46 33 27 20 33 39 36 32 40 33 27 26 30Elf 15 3 2 5 14 35 13 25 16 6 4 2 11Red Steenbras 26 7 8 3 3 2 3 7 2 5 3 2 2
Useful statistics
Further Reading
Attwood CJ, Booth T, Kerwath S, Mann B, Marr S, Bonthuys J, Duncan J, Potts W (eds). 2013. A decade after the emergency. WWF South Africa Report Series - 2013/Marine/001. Cape Town: WWF. 288 pp
Kerwath SE, Winker H, Götz A, Attwood CG. 2013. Marine protect-ed area improves yield without disadvantaging fishers. Nature Communications 4: 2347.
Kerwath SE, Wilke CG, Götz A. 2013. The effects of barotrauma on
five species of South African line-caught fish. African Journal of Marine Science 35: 243–252.
Mann BQ (ed). 2013 South African Marine Linefish Species Profiles, Oceanographic Research Institute, Special Publication No 9. Published by South African Association of Marine Biological Research, Durban, 357 pp.
Winker H, Kerwath SE, Attwood CG. Comparison of two approaches to standardize catch-per-unit-effort for targeting behaviour in a multispecies hand-line fishery. 2013. Fisheries Research 139: 118–131.
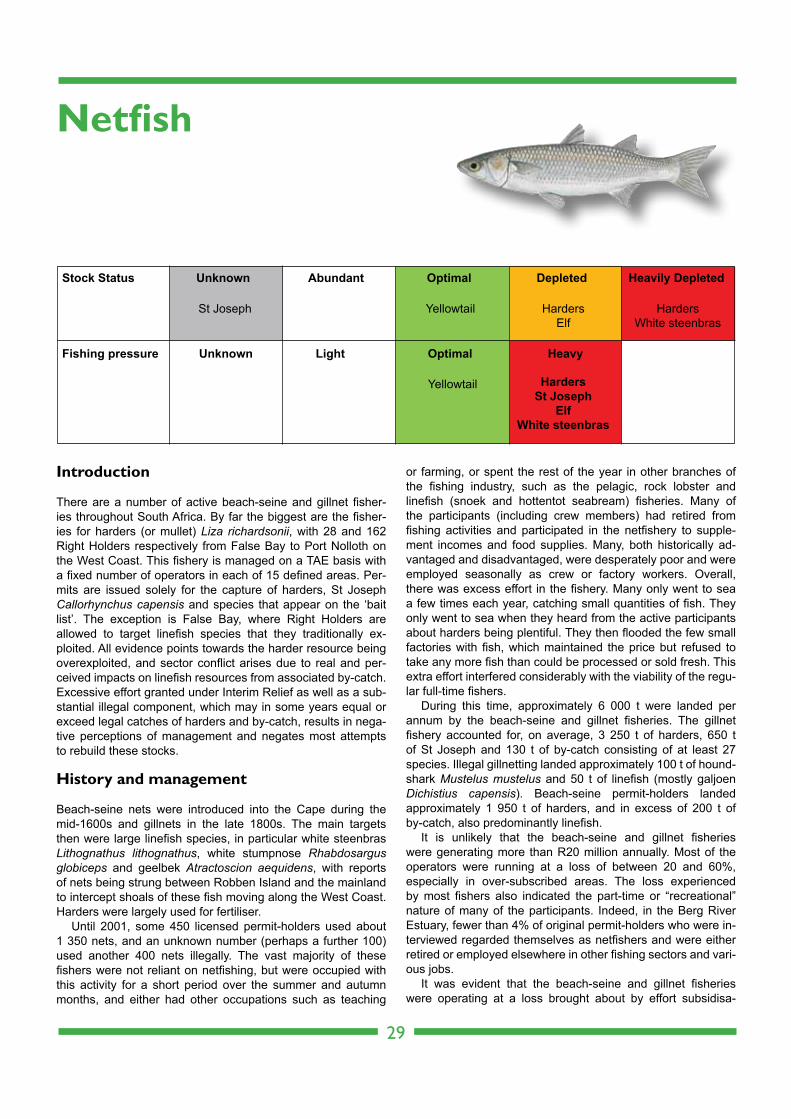
Introduction
There are a number of active beach-seine and gillnet fisher-ies throughout South Africa. By far the biggest are the fisher-ies for harders (or mullet) Liza richardsonii, with 28 and 162 Right Holders respectively from False Bay to Port Nolloth on the West Coast. This fishery is managed on a TAE basis with a fixed number of operators in each of 15 defined areas. Per-mits are issued solely for the capture of harders, St Joseph Callorhynchus capensis and species that appear on the ‘bait list’. The exception is False Bay, where Right Holders are allowed to target linefish species that they traditionally ex-ploited. All evidence points towards the harder resource being overexploited, and sector conflict arises due to real and per-ceived impacts on linefish resources from associated by-catch. Excessive effort granted under Interim Relief as well as a sub- stantial illegal component, which may in some years equal or exceed legal catches of harders and by-catch, results in nega-tive perceptions of management and negates most attempts to rebuild these stocks.
History and management
Beach-seine nets were introduced into the Cape during the mid-1600s and gillnets in the late 1800s. The main targets then were large linefish species, in particular white steenbras Lithognathus lithognathus, white stumpnose Rhabdosargus globiceps and geelbek Atractoscion aequidens, with reports of nets being strung between Robben Island and the mainland to intercept shoals of these fish moving along the West Coast. Harders were largely used for fertiliser.
Until 2001, some 450 licensed permit-holders used about 1 350 nets, and an unknown number (perhaps a further 100) used another 400 nets illegally. The vast majority of these fishers were not reliant on netfishing, but were occupied with this activity for a short period over the summer and autumn months, and either had other occupations such as teaching
or farming, or spent the rest of the year in other branches of the fishing industry, such as the pelagic, rock lobster and linefish (snoek and hottentot seabream) fisheries. Many of the participants (including crew members) had retired from fishing activities and participated in the netfishery to supple-ment incomes and food supplies. Many, both historically ad- vantaged and disadvantaged, were desperately poor and were employed seasonally as crew or factory workers. Overall, there was excess effort in the fishery. Many only went to sea a few times each year, catching small quantities of fish. They only went to sea when they heard from the active participants about harders being plentiful. They then flooded the few small factories with fish, which maintained the price but refused to take any more fish than could be processed or sold fresh. This extra effort interfered considerably with the viability of the regu-lar full-time fishers.
During this time, approximately 6 000 t were landed per annum by the beach-seine and gillnet fisheries. The gillnet fishery accounted for, on average, 3 250 t of harders, 650 t of St Joseph and 130 t of by-catch consisting of at least 27 species. Illegal gillnetting landed approximately 100 t of hound-shark Mustelus mustelus and 50 t of linefish (mostly galjoen Dichistius capensis). Beach-seine permit-holders landed approximately 1 950 t of harders, and in excess of 200 t of by-catch, also predominantly linefish.
It is unlikely that the beach-seine and gillnet fisheries were generating more than R20 million annually. Most of the operators were running at a loss of between 20 and 60%, especially in over-subscribed areas. The loss experienced by most fishers also indicated the part-time or “recreational” nature of many of the participants. Indeed, in the Berg River Estuary, fewer than 4% of original permit-holders who were in-terviewed regarded themselves as netfishers and were either retired or employed elsewhere in other fishing sectors and vari-ous jobs.
It was evident that the beach-seine and gillnet fisheries were operating at a loss brought about by effort subsidisa-
29
Netfish
Stock Status Abundant Optimal Depleted Heavily DepletedUnknown
Fishing pressure Light Optimal HeavyUnknown
Yellowtail HardersElf
Yellowtail HardersSt Joseph
ElfWhite steenbras
HardersWhite steenbras
St Joseph
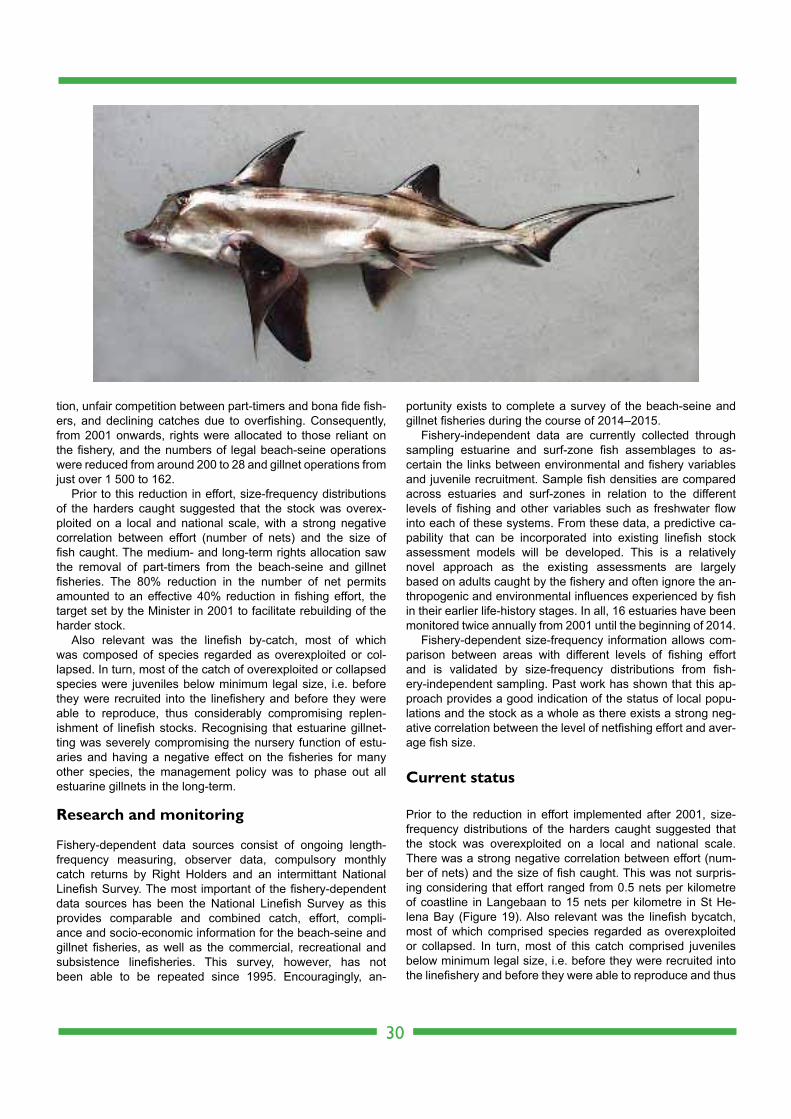
tion, unfair competition between part-timers and bona fide fish-ers, and declining catches due to overfishing. Consequently, from 2001 onwards, rights were allocated to those reliant on the fishery, and the numbers of legal beach-seine operations were reduced from around 200 to 28 and gillnet operations from just over 1 500 to 162.
Prior to this reduction in effort, size-frequency distributions of the harders caught suggested that the stock was overex-ploited on a local and national scale, with a strong negative correlation between effort (number of nets) and the size of fish caught. The medium- and long-term rights allocation saw the removal of part-timers from the beach-seine and gillnet fisheries. The 80% reduction in the number of net permits amounted to an effective 40% reduction in fishing effort, the target set by the Minister in 2001 to facilitate rebuilding of the harder stock.
Also relevant was the linefish by-catch, most of which was composed of species regarded as overexploited or col-lapsed. In turn, most of the catch of overexploited or collapsed species were juveniles below minimum legal size, i.e. before they were recruited into the linefishery and before they were able to reproduce, thus considerably compromising replen-ishment of linefish stocks. Recognising that estuarine gillnet-ting was severely compromising the nursery function of estu-aries and having a negative effect on the fisheries for many other species, the management policy was to phase out all estuarine gillnets in the long-term.
Research and monitoring
Fishery-dependent data sources consist of ongoing length-frequency measuring, observer data, compulsory monthly catch returns by Right Holders and an intermittant National Linefish Survey. The most important of the fishery-dependent data sources has been the National Linefish Survey as this provides comparable and combined catch, effort, compli-ance and socio-economic information for the beach-seine and gillnet fisheries, as well as the commercial, recreational and subsistence linefisheries. This survey, however, has not been able to be repeated since 1995. Encouragingly, an-
portunity exists to complete a survey of the beach-seine and gillnet fisheries during the course of 2014–2015.
Fishery-independent data are currently collected through sampling estuarine and surf-zone fish assemblages to as-certain the links between environmental and fishery variables and juvenile recruitment. Sample fish densities are compared across estuaries and surf-zones in relation to the different levels of fishing and other variables such as freshwater flow into each of these systems. From these data, a predictive ca-pability that can be incorporated into existing linefish stock assessment models will be developed. This is a relatively novel approach as the existing assessments are largely based on adults caught by the fishery and often ignore the an-thropogenic and environmental influences experienced by fish in their earlier life-history stages. In all, 16 estuaries have been monitored twice annually from 2001 until the beginning of 2014.
Fishery-dependent size-frequency information allows com-parison between areas with different levels of fishing effort and is validated by size-frequency distributions from fish-ery-independent sampling. Past work has shown that this ap-proach provides a good indication of the status of local popu- lations and the stock as a whole as there exists a strong neg-ative correlation between the level of netfishing effort and aver-age fish size.
Current status
Prior to the reduction in effort implemented after 2001, size- frequency distributions of the harders caught suggested that the stock was overexploited on a local and national scale. There was a strong negative correlation between effort (num-ber of nets) and the size of fish caught. This was not surpris-ing considering that effort ranged from 0.5 nets per kilometre of coastline in Langebaan to 15 nets per kilometre in St He-lena Bay (Figure 19). Also relevant was the linefish bycatch, most of which comprised species regarded as overexploited or collapsed. In turn, most of this catch comprised juveniles below minimum legal size, i.e. before they were recruited into the linefishery and before they were able to reproduce and thus
30
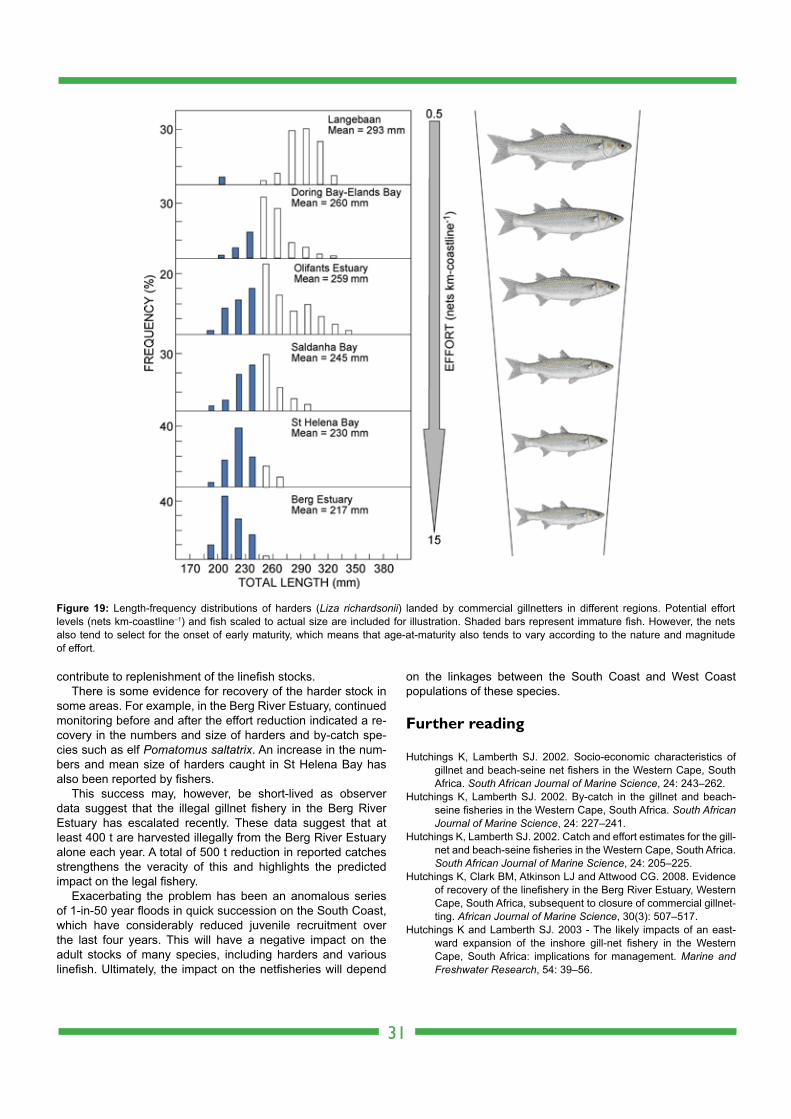
contribute to replenishment of the linefish stocks.There is some evidence for recovery of the harder stock in
some areas. For example, in the Berg River Estuary, continued monitoring before and after the effort reduction indicated a re-covery in the numbers and size of harders and by-catch spe-cies such as elf Pomatomus saltatrix. An increase in the num-bers and mean size of harders caught in St Helena Bay has also been reported by fishers.
This success may, however, be short-lived as observer data suggest that the illegal gillnet fishery in the Berg River Estuary has escalated recently. These data suggest that at least 400 t are harvested illegally from the Berg River Estuary alone each year. A total of 500 t reduction in reported catches strengthens the veracity of this and highlights the predicted impact on the legal fishery.
Exacerbating the problem has been an anomalous series of 1-in-50 year floods in quick succession on the South Coast, which have considerably reduced juvenile recruitment over the last four years. This will have a negative impact on the adult stocks of many species, including harders and various linefish. Ultimately, the impact on the netfisheries will depend
on the linkages between the South Coast and West Coast populations of these species.
Further reading
Hutchings K, Lamberth SJ. 2002. Socio-economic characteristics of gillnet and beach-seine net fishers in the Western Cape, South Africa. South African Journal of Marine Science, 24: 243–262.
Hutchings K, Lamberth SJ. 2002. By-catch in the gillnet and beach-seine fisheries in the Western Cape, South Africa. South African Journal of Marine Science, 24: 227–241.
Hutchings K, Lamberth SJ. 2002. Catch and effort estimates for the gill-net and beach-seine fisheries in the Western Cape, South Africa. South African Journal of Marine Science, 24: 205–225.
Hutchings K, Clark BM, Atkinson LJ and Attwood CG. 2008. Evidence of recovery of the linefishery in the Berg River Estuary, Western Cape, South Africa, subsequent to closure of commercial gillnet-ting. African Journal of Marine Science, 30(3): 507–517.
Hutchings K and Lamberth SJ. 2003 - The likely impacts of an east-ward expansion of the inshore gill-net fishery in the Western Cape, South Africa: implications for management. Marine and Freshwater Research, 54: 39–56.
31
Figure 19: Length-frequency distributions of harders (Liza richardsonii) landed by commercial gillnetters in different regions. Potential effort levels (nets km-coastline–1) and fish scaled to actual size are included for illustration. Shaded bars represent immature fish. However, the nets also tend to select for the onset of early maturity, which means that age-at-maturity also tends to vary according to the nature and magnitude of effort.
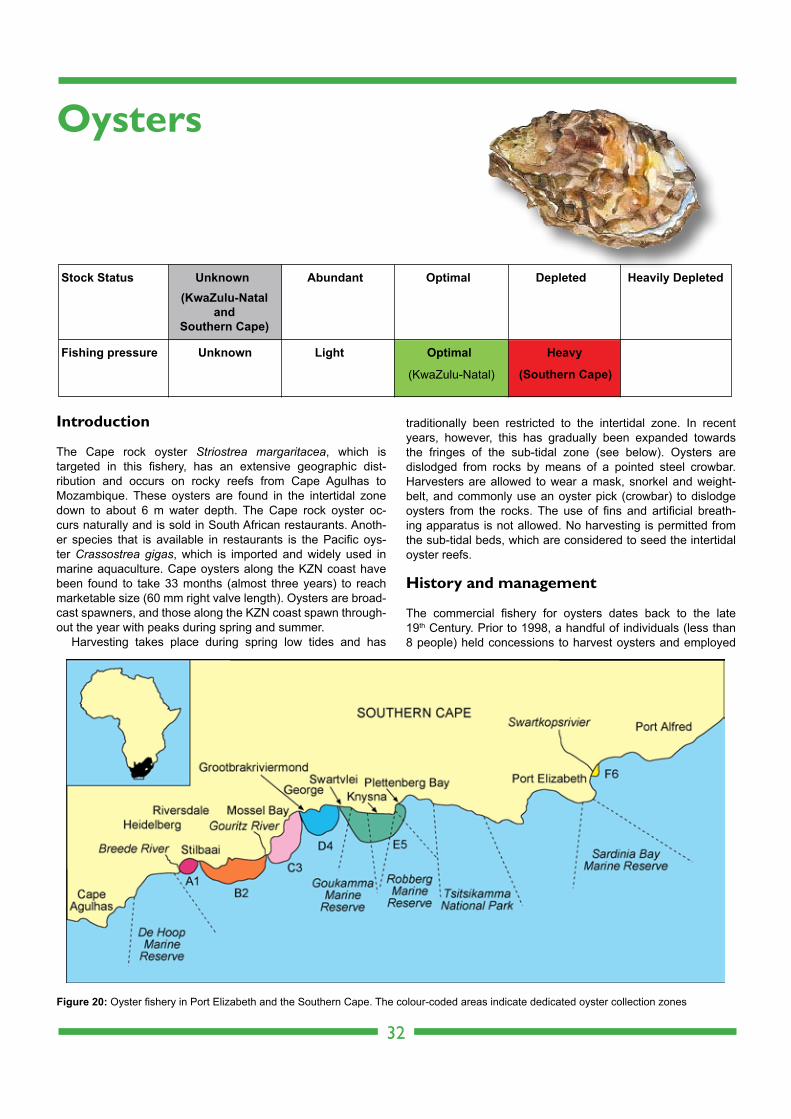
Introduction
The Cape rock oyster Striostrea margaritacea, which is targeted in this fishery, has an extensive geographic dist- ribution and occurs on rocky reefs from Cape Agulhas to Mozambique. These oysters are found in the intertidal zone down to about 6 m water depth. The Cape rock oyster oc-curs naturally and is sold in South African restaurants. Anoth-er species that is available in restaurants is the Pacific oys-ter Crassostrea gigas, which is imported and widely used in marine aquaculture. Cape oysters along the KZN coast have been found to take 33 months (almost three years) to reach marketable size (60 mm right valve length). Oysters are broad-cast spawners, and those along the KZN coast spawn through-out the year with peaks during spring and summer.
Harvesting takes place during spring low tides and has
traditionally been restricted to the intertidal zone. In recent years, however, this has gradually been expanded towards the fringes of the sub-tidal zone (see below). Oysters are dislodged from rocks by means of a pointed steel crowbar. Harvesters are allowed to wear a mask, snorkel and weight-belt, and commonly use an oyster pick (crowbar) to dislodge oysters from the rocks. The use of fins and artificial breath-ing apparatus is not allowed. No harvesting is permitted from the sub-tidal beds, which are considered to seed the intertidal oyster reefs.
History and management
The commercial fishery for oysters dates back to the late 19th Century. Prior to 1998, a handful of individuals (less than 8 people) held concessions to harvest oysters and employed
32
Oysters
Figure 20: Oyster fishery in Port Elizabeth and the Southern Cape. The colour-coded areas indicate dedicated oyster collection zones
Stock Status Abundant Optimal Depleted Heavily DepletedUnknown
Fishing pressure Light Optimal HeavyUnknown
(KwaZulu-Natal)
(KwaZulu-Natal and
Southern Cape)
(Southern Cape)
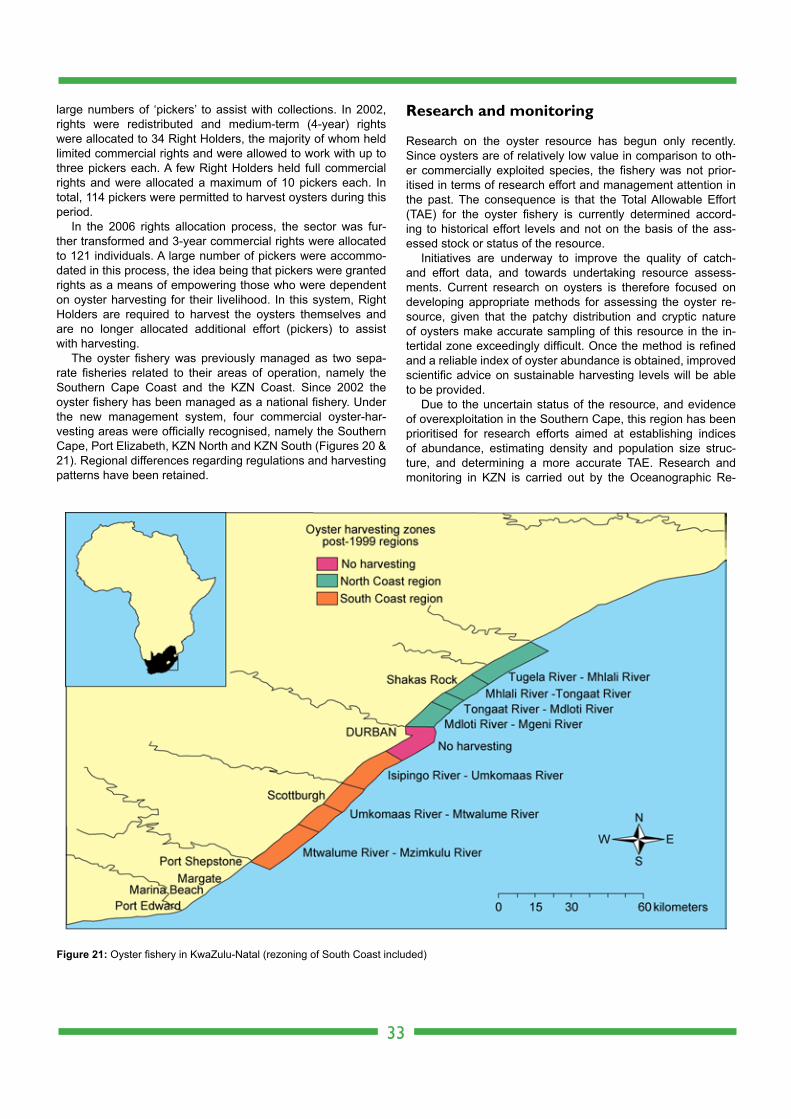
large numbers of ‘pickers’ to assist with collections. In 2002, rights were redistributed and medium-term (4-year) rights were allocated to 34 Right Holders, the majority of whom held limited commercial rights and were allowed to work with up to three pickers each. A few Right Holders held full commercial rights and were allocated a maximum of 10 pickers each. In total, 114 pickers were permitted to harvest oysters during this period.
In the 2006 rights allocation process, the sector was fur-ther transformed and 3-year commercial rights were allocated to 121 individuals. A large number of pickers were accommo-dated in this process, the idea being that pickers were granted rights as a means of empowering those who were dependent on oyster harvesting for their livelihood. In this system, Right Holders are required to harvest the oysters themselves and are no longer allocated additional effort (pickers) to assist with harvesting.
The oyster fishery was previously managed as two sepa-rate fisheries related to their areas of operation, namely the Southern Cape Coast and the KZN Coast. Since 2002 the oyster fishery has been managed as a national fishery. Under the new management system, four commercial oyster-har-vesting areas were officially recognised, namely the Southern Cape, Port Elizabeth, KZN North and KZN South (Figures 20 & 21). Regional differences regarding regulations and harvesting patterns have been retained.
Research and monitoring
Research on the oyster resource has begun only recently. Since oysters are of relatively low value in comparison to oth-er commercially exploited species, the fishery was not prior- itised in terms of research effort and management attention in the past. The consequence is that the Total Allowable Effort (TAE) for the oyster fishery is currently determined accord-ing to historical effort levels and not on the basis of the ass- essed stock or status of the resource.
Initiatives are underway to improve the quality of catch- and effort data, and towards undertaking resource assess-ments. Current research on oysters is therefore focused on developing appropriate methods for assessing the oyster re-source, given that the patchy distribution and cryptic nature of oysters make accurate sampling of this resource in the in-tertidal zone exceedingly difficult. Once the method is refined and a reliable index of oyster abundance is obtained, improved scientific advice on sustainable harvesting levels will be able to be provided.
Due to the uncertain status of the resource, and evidence of overexploitation in the Southern Cape, this region has been prioritised for research efforts aimed at establishing indices of abundance, estimating density and population size struc-ture, and determining a more accurate TAE. Research and monitoring in KZN is carried out by the Oceanographic Re-
33
Figure 21: Oyster fishery in KwaZulu-Natal (rezoning of South Coast included)

search Institute under contract to the Branch: Fisheries Man-agement with the purpose of providing information on which to base recommendations for this region of the coast.
Current status
The overall TAE of 145 pickers has remained stable in this sector since 2002, and was based on the total number of pick-ers active at that time. The status quo is being maintained until further data become available.
Total catches between 2002 and 2005 were between ap-proximately 600 000 and 730 000 oysters, the majority of which were harvested in the Southern Cape (Figure 22). Data for 2006 are not available because catch reporting was poor on account of the new rights allocation and the change of Right Holders. The low catches in KZN in 2008 (3 491 individu-als) was an exception, caused mainly by problems during the permit processing. It is noteworthy, however, that catches in KZN have nearly halved compared with the period from 2000 until 2005, but this is thought to be due to problems with permit allocation and catch reporting.
The oyster resource along the KZN coast is considered to be fully exploited. Resource assessments undertaken in 2006 during a research project outsourced to the Oceanographic Research Institute (ORI) showed that, although the oys-ter stocks declined since 1980, they were stable or showed a slight decline for approximately 20 years prior to the study. Harvesting figures have, however, declined over the last dec-ade. This may be a result of reduced effort (due to non-ac-tivation of permits), especially along KZN South Coast, poor catch reporting or a decline in resource availability. Further research is required for an updated assessment.
In the Southern Cape there is concern that the intertidal zone is being denuded of oysters as a result of being over-harvested. Surveys undertaken between 2000 and 2004 that measured oyster density and size composition suggested that the intertidal component of the oyster stock along the South- ern Cape Coast appeared to be over-exploited. Moreover,
there have been reports of divers illegally harvesting oysters from subtidal ‘mother beds’.
Catch Per Unit Effort (CPUE) data for the Southern Cape oyster fishery are considered to be unsuitable for the purposes of stock assessment, and the status of this resource thus remains uncertain.
Ecosystem interactions
The harvesting of rock oysters involves the direct picking of individual organisms from the rocks, and the use of diving masks by pickers allows more precise fishing, thereby reduc-ing the potential for dislodgement of non-target species. Oys-ter harvesting is therefore considered to have minimal signi- ficant disturbance on the surrounding biological communities, although research is required to substantiate this view.
34
Figure 22: Total number of oysters harvested from the Southern Cape and KwaZulu-Natal coasts for the period 1972–2012.
Total Allowable Effort (TAE) (number of pickers) and Total Catch (number of oysters) for the oyster fishery for the period 2000 to 2012
2002 2003 2004 2005 2006 2007 2008 2009 2010 2011 2012* TAE 105 105 105 105 105 105 105 105 105 105 105 Catch 471 360 511 946 468 485 373 322 - 387 831 316 295 346 375 358 406 508 134 311 186* TAE 40 40 40 40 40 40 40 40 40 40 40 Catch 257 238 163 357 227 067 222 864 - 105 552 - 103 684 102 168 24 924 12 544*
Southern Capeand PE
KwaZulu-Natal
- No catch data were available due to no or poor catch returns*Catch data for 2012 may be incomplete since catch returns are often submitted late
Useful statistics
Further reading
Haupt TM, Griffiths CL, Robinson TB, Tonin AFG, De Bruyn PA. 2010. History and status of oyster exploitation and culture in South Africa. Journal of Shellfish Research 29: 151–159.
Kruger A, Schleyer MH. 2004. Marine invertebrate catches recorded during the Ezemvelo KwaZulu-Natal Wildlife estuarine and marine patrols. Oceanographic Research Institute, South Africa. Report No. 2004/15.
Kruger A, Schleyer MH. 2004. Mail and telephone surveys of permit holders to obtain recreational invertebrate fisheries catch sta-tistics. Oceanographic Research Institute, South Africa. Report No. 2004/16.
Maharaj G. 2004. Oysters. Research Highlights. Department of Environmental Affairs and Tourism 12: 27–28.
Schleyer A, Kruger A. 1990. Gonadal changes and hermaphroditism in the oyster, Striostrea margaritacea. Unpublished report. South Africa: Oceanographic Research Institute.
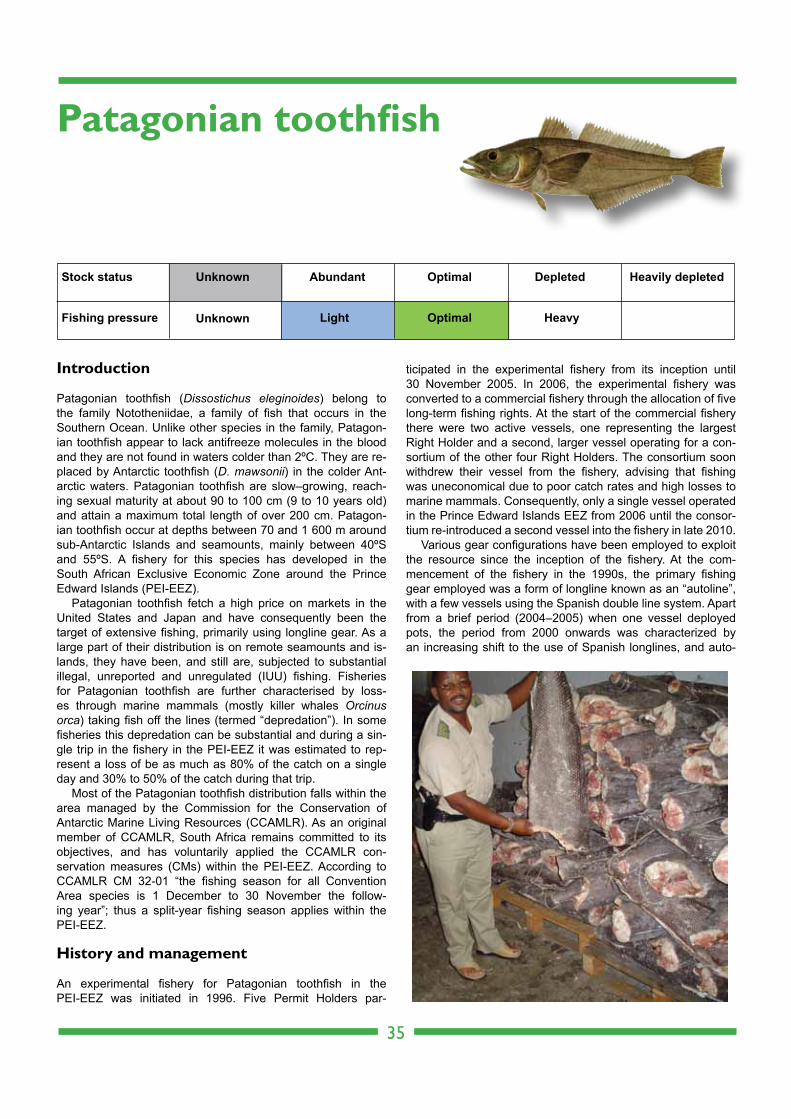
Introduction
Patagonian toothfish (Dissostichus eleginoides) belong to the family Nototheniidae, a family of fish that occurs in the Southern Ocean. Unlike other species in the family, Patagon-ian toothfish appear to lack antifreeze molecules in the blood and they are not found in waters colder than 2ºC. They are re- placed by Antarctic toothfish (D. mawsonii) in the colder Ant-arctic waters. Patagonian toothfish are slow–growing, reach-ing sexual maturity at about 90 to 100 cm (9 to 10 years old) and attain a maximum total length of over 200 cm. Patagon-ian toothfish occur at depths between 70 and 1 600 m around sub-Antarctic Islands and seamounts, mainly between 40ºS and 55ºS. A fishery for this species has developed in the South African Exclusive Economic Zone around the Prince Edward Islands (PEI-EEZ).
Patagonian toothfish fetch a high price on markets in the United States and Japan and have consequently been the target of extensive fishing, primarily using longline gear. As a large part of their distribution is on remote seamounts and is-lands, they have been, and still are, subjected to substantial illegal, unreported and unregulated (IUU) fishing. Fisheries for Patagonian toothfish are further characterised by loss-es through marine mammals (mostly killer whales Orcinus orca) taking fish off the lines (termed “depredation”). In some fisheries this depredation can be substantial and during a sin-gle trip in the fishery in the PEI-EEZ it was estimated to rep-resent a loss of be as much as 80% of the catch on a single day and 30% to 50% of the catch during that trip.
Most of the Patagonian toothfish distribution falls within the area managed by the Commission for the Conservation of Antarctic Marine Living Resources (CCAMLR). As an original member of CCAMLR, South Africa remains committed to its objectives, and has voluntarily applied the CCAMLR con-servation measures (CMs) within the PEI-EEZ. According to CCAMLR CM 32-01 “the fishing season for all Convention Area species is 1 December to 30 November the follow-ing year”; thus a split-year fishing season applies within the PEI-EEZ.
History and management
An experimental fishery for Patagonian toothfish in the PEI-EEZ was initiated in 1996. Five Permit Holders par-
ticipated in the experimental fishery from its inception until 30 November 2005. In 2006, the experimental fishery was converted to a commercial fishery through the allocation of five long-term fishing rights. At the start of the commercial fishery there were two active vessels, one representing the largest Right Holder and a second, larger vessel operating for a con-sortium of the other four Right Holders. The consortium soon withdrew their vessel from the fishery, advising that fishing was uneconomical due to poor catch rates and high losses to marine mammals. Consequently, only a single vessel operated in the Prince Edward Islands EEZ from 2006 until the consor-tium re-introduced a second vessel into the fishery in late 2010.
Various gear configurations have been employed to exploit the resource since the inception of the fishery. At the com-mencement of the fishery in the 1990s, the primary fishing gear employed was a form of longline known as an “autoline”, with a few vessels using the Spanish double line system. Apart from a brief period (2004–2005) when one vessel deployed pots, the period from 2000 onwards was characterized by an increasing shift to the use of Spanish longlines, and auto-
35
Patagonian toothfish
Stock status Abundant Optimal Depleted Heavily depletedUnknown
Fishing pressure Light Optimal HeavyUnknown

lines were eventually phased out altogether by 2008. Anoth-er shift in the gear employed began with the introduction in 2008 of a modified longline gear, the trotline, that app- reciably decreases the loss of catch to marine mammal dep-redation and has a higher retention of large fish. Use of this gear has subsequently increased to the extent that almost no Spanish longline gear was used during the 2011 fishing season (Figure 23). These gear changes have complicated the assessment of the status of the resource (see below), and hence its management. An experiment to calibrate catch rates between Spanish longlines and trotlines was initiated in the 2011/2012 season and continued through to the end of the 2012/2013 fishing season.
Prior to the start of the experimental fishery there were extremely high levels of IUU fishing, which likely had an ad-verse impact on the resource. Estimated IUU catches de-clined subsequently and were assumed to be constant at 156 t per annum over the period 2003 to 2009 (Table 2). Recent information indicates that no IUU fishing has occurred in the
Prince Edward Islands EEZ since 2010. Regulation of the fishery was initiated in the 2000/01 fish-
ing season by means of a Total Allowable Catch (TAC) restric-tion of 2 250 t. The first assessment of the status of the re- source was conducted in 2001 and used an Age Structured Production Model (ASPM) that was base d on catch-per-unit-effort (CPUE) data derived from Spanish longline sets. The results of the assessment indicated severe depletion of the stock, and the apparent depressed status of the resource led to a decrease in the TAC from 2 250 t in the 2000/01 sea-son to 600 t in the 2001/02 season. The CCAMLR Scientific Committee recommended that South Africa set a TAC of not more than 400 t for the 2002/03 season. In consultation with industry representatives, a compromise was reached be- tween the 400 t recommended by CCAMLR’s Scientific Com-mittee and the 600 t TAC that was set in the 2001/02 season. This compromise was firstly to demonstrate South Africa’s commitment to CCAMLR, and secondly to provide sufficient catch to maintain a year-round legal fishing presence in the Prince Edward Islands EEZ as a means of deterring further IUU fishing in the area. The TAC was thus set at 500 t for the 2002/03 season and maintained at that level for the 2003/04 fishing season.
The ASPM was extended to incorporate catch-at-length (CAL) data as a basis for TAC recommendations in 2003. Despite refinements to the model, the two primary resource monitoring indices (CPUE and CAL) yielded conflicting esti-mates of resource status. While the CPUE data indicated that the resource was severely depleted, the CAL data suggested that the situation was less serious. Attempts to reconcile these two indices were unsuccessful. These circumstances led to major difficulties in making scientific recommendations for ap-propriate catch limits for this resource, and a pragmatic ap-proach was adopted that led to a reduction in the TAC to 450 t for the 2004/05 season. The consortium of four Right Hold-ers withdrew their vessel in 2006 due to economic pressures, leaving only a single Right Holder, with an allocation of 27% of the TAC, active in the fishery. Consequently the annual TAC
36
Total Total Estimated Estimated Season longline Pot legal TAC IUU catch total catch 1996/1997+ 2 754.9 2 754.9 21 350 24 104.9 1997/1998 1 224.6 1 224.6 1 808 3 032.6 1998/1999 945.1 945.1 1 014 1.959.1 1999/2000 1 577.8 1 577.8 1 210 2 787.8 2000/2001 267.8 267.8 2 250 352 619.8 2001/2002 237.3 237.3 600 306 543.3 2002/2003 251.1 251.1 500 256 507.1 2003/2004 182.5 72.6 255.1 500 156 411.1 2004/2005 142.6 103.5 246.1 450 156 402.1 2005/2006 169.1 169.1 450 156 325.1 2006/2007 245.0 245.0 450 156 401.0 2007/2008 145.2 145.2 450 156 301.2 2008/2009 72.5 72.5 450 156 228.5 2009/2010 223.7 223.7 450 156 379.7 2010/2011 291.4 291.4 400 0 291.4 2011/2012 276.1 276.1 320 0 276.1 2012/2013* 165.5 165.5 320 0 165.5
Table 2: Catches (tons) per fishing season of Patagonian toothfish estimated to have been taken from the Prince Edward Islands EEZ
CO
MM
ER
CIA
LE
XP
ER
IIME
NTA
L
+ Catch data for the 1996/1997 season include catches made during October and November 1996 (i.e. effectively the 1995/1996 fishing season* Data for the 2012/2013 season are currently incomplete, and therefore do not reflect the total catch made during this fishing season
Figure 23: Number of longline sets deployed per fishing season in the Prince Edward Islands EEZ. Data are shown for the three different longline gear configurations deployed in the fishery over time.
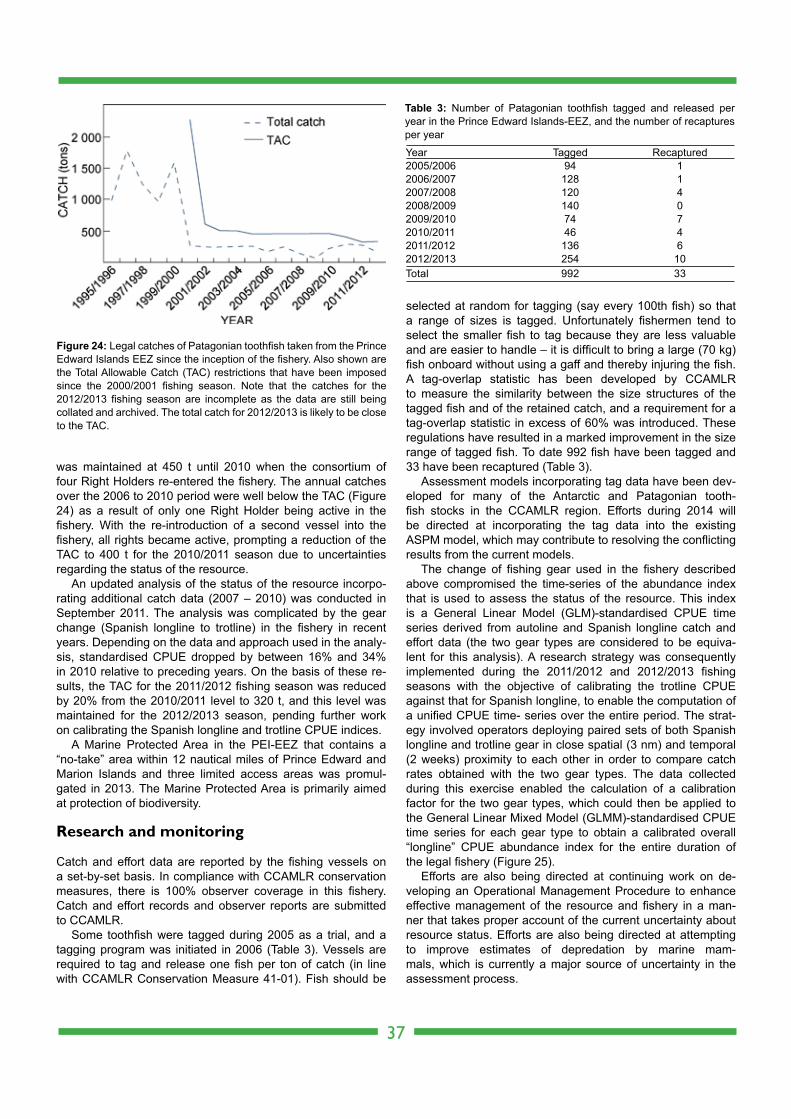
was maintained at 450 t until 2010 when the consortium of four Right Holders re-entered the fishery. The annual catches over the 2006 to 2010 period were well below the TAC (Figure 24) as a result of only one Right Holder being active in the fishery. With the re-introduction of a second vessel into the fishery, all rights became active, prompting a reduction of the TAC to 400 t for the 2010/2011 season due to uncertainties regarding the status of the resource.
An updated analysis of the status of the resource incorpo-rating additional catch data (2007 – 2010) was conducted in September 2011. The analysis was complicated by the gear change (Spanish longline to trotline) in the fishery in recent years. Depending on the data and approach used in the analy-sis, standardised CPUE dropped by between 16% and 34% in 2010 relative to preceding years. On the basis of these re-sults, the TAC for the 2011/2012 fishing season was reduced by 20% from the 2010/2011 level to 320 t, and this level was maintained for the 2012/2013 season, pending further work on calibrating the Spanish longline and trotline CPUE indices.
A Marine Protected Area in the PEI-EEZ that contains a “no-take” area within 12 nautical miles of Prince Edward and Marion Islands and three limited access areas was promul- gated in 2013. The Marine Protected Area is primarily aimed at protection of biodiversity. Research and monitoring
Catch and effort data are reported by the fishing vessels on a set-by-set basis. In compliance with CCAMLR conservation measures, there is 100% observer coverage in this fishery. Catch and effort records and observer reports are submitted to CCAMLR.
Some toothfish were tagged during 2005 as a trial, and a tagging program was initiated in 2006 (Table 3). Vessels are required to tag and release one fish per ton of catch (in line with CCAMLR Conservation Measure 41-01). Fish should be
selected at random for tagging (say every 100th fish) so that a range of sizes is tagged. Unfortunately fishermen tend to select the smaller fish to tag because they are less valuable and are easier to handle – it is difficult to bring a large (70 kg) fish onboard without using a gaff and thereby injuring the fish. A tag-overlap statistic has been developed by CCAMLR to measure the similarity between the size structures of the tagged fish and of the retained catch, and a requirement for a tag-overlap statistic in excess of 60% was introduced. These regulations have resulted in a marked improvement in the size range of tagged fish. To date 992 fish have been tagged and 33 have been recaptured (Table 3).
Assessment models incorporating tag data have been dev- eloped for many of the Antarctic and Patagonian tooth-fish stocks in the CCAMLR region. Efforts during 2014 will be directed at incorporating the tag data into the existing ASPM model, which may contribute to resolving the conflicting results from the current models.
The change of fishing gear used in the fishery described above compromised the time-series of the abundance index that is used to assess the status of the resource. This index is a General Linear Model (GLM)-standardised CPUE time series derived from autoline and Spanish longline catch and effort data (the two gear types are considered to be equiva-lent for this analysis). A research strategy was consequently implemented during the 2011/2012 and 2012/2013 fishing seasons with the objective of calibrating the trotline CPUE against that for Spanish longline, to enable the computation of a unified CPUE time- series over the entire period. The strat-egy involved operators deploying paired sets of both Spanish longline and trotline gear in close spatial (3 nm) and temporal (2 weeks) proximity to each other in order to compare catch rates obtained with the two gear types. The data collected during this exercise enabled the calculation of a calibration factor for the two gear types, which could then be applied to the General Linear Mixed Model (GLMM)-standardised CPUE time series for each gear type to obtain a calibrated overall “longline” CPUE abundance index for the entire duration of the legal fishery (Figure 25).
Efforts are also being directed at continuing work on de-veloping an Operational Management Procedure to enhance effective management of the resource and fishery in a man-ner that takes proper account of the current uncertainty about resource status. Efforts are also being directed at attempting to improve estimates of depredation by marine mam-mals, which is currently a major source of uncertainty in the assessment process.
37
Year Tagged Recaptured2005/2006 94 12006/2007 128 12007/2008 120 42008/2009 140 02009/2010 74 72010/2011 46 42011/2012 136 62012/2013 254 10Total 992 33
Table 3: Number of Patagonian toothfish tagged and released per year in the Prince Edward Islands-EEZ, and the number of recaptures per year
Figure 24: Legal catches of Patagonian toothfish taken from the Prince Edward Islands EEZ since the inception of the fishery. Also shown are the Total Allowable Catch (TAC) restrictions that have been imposed since the 2000/2001 fishing season. Note that the catches for the 2012/2013 fishing season are incomplete as the data are still being collated and archived. The total catch for 2012/2013 is likely to be close to the TAC.
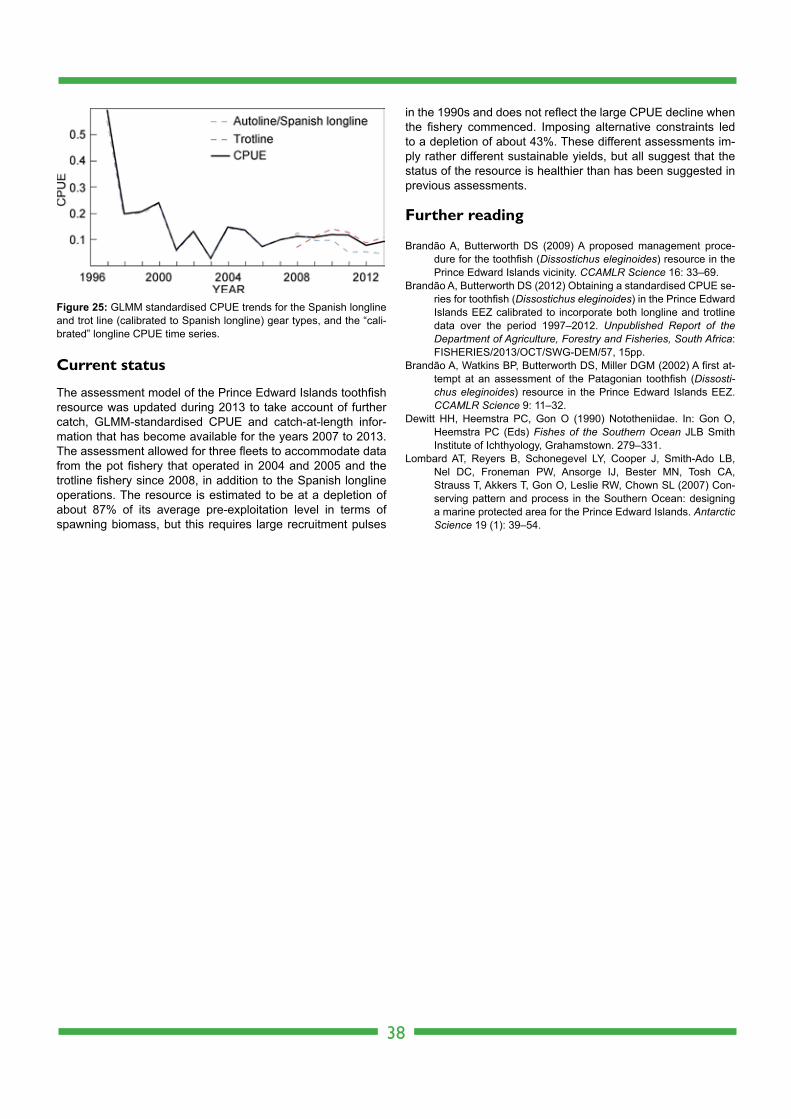
Current status
The assessment model of the Prince Edward Islands toothfish resource was updated during 2013 to take account of further catch, GLMM-standardised CPUE and catch-at-length infor-mation that has become available for the years 2007 to 2013. The assessment allowed for three fleets to accommodate data from the pot fishery that operated in 2004 and 2005 and the trotline fishery since 2008, in addition to the Spanish longline operations. The resource is estimated to be at a depletion of about 87% of its average pre-exploitation level in terms of spawning biomass, but this requires large recruitment pulses
in the 1990s and does not reflect the large CPUE decline when the fishery commenced. Imposing alternative constraints led to a depletion of about 43%. These different assessments im-ply rather different sustainable yields, but all suggest that the status of the resource is healthier than has been suggested in previous assessments.
Further reading
Brandão A, Butterworth DS (2009) A proposed management proce-dure for the toothfish (Dissostichus eleginoides) resource in the Prince Edward Islands vicinity. CCAMLR Science 16: 33–69.
Brandão A, Butterworth DS (2012) Obtaining a standardised CPUE se-ries for toothfish (Dissostichus eleginoides) in the Prince Edward Islands EEZ calibrated to incorporate both longline and trotline data over the period 1997–2012. Unpublished Report of the Department of Agriculture, Forestry and Fisheries, South Africa: FISHERIES/2013/OCT/SWG-DEM/57, 15pp.
Brandão A, Watkins BP, Butterworth DS, Miller DGM (2002) A first at-tempt at an assessment of the Patagonian toothfish (Dissosti-chus eleginoides) resource in the Prince Edward Islands EEZ. CCAMLR Science 9: 11–32.
Dewitt HH, Heemstra PC, Gon O (1990) Nototheniidae. In: Gon O, Heemstra PC (Eds) Fishes of the Southern Ocean JLB Smith Institute of Ichthyology, Grahamstown. 279–331.
Lombard AT, Reyers B, Schonegevel LY, Cooper J, Smith-Ado LB, Nel DC, Froneman PW, Ansorge IJ, Bester MN, Tosh CA, Strauss T, Akkers T, Gon O, Leslie RW, Chown SL (2007) Con-serving pattern and process in the Southern Ocean: designing a marine protected area for the Prince Edward Islands. Antarctic Science 19 (1): 39–54.
38
Figure 25: GLMM standardised CPUE trends for the Spanish longline and trot line (calibrated to Spanish longline) gear types, and the “cali-brated” longline CPUE time series.
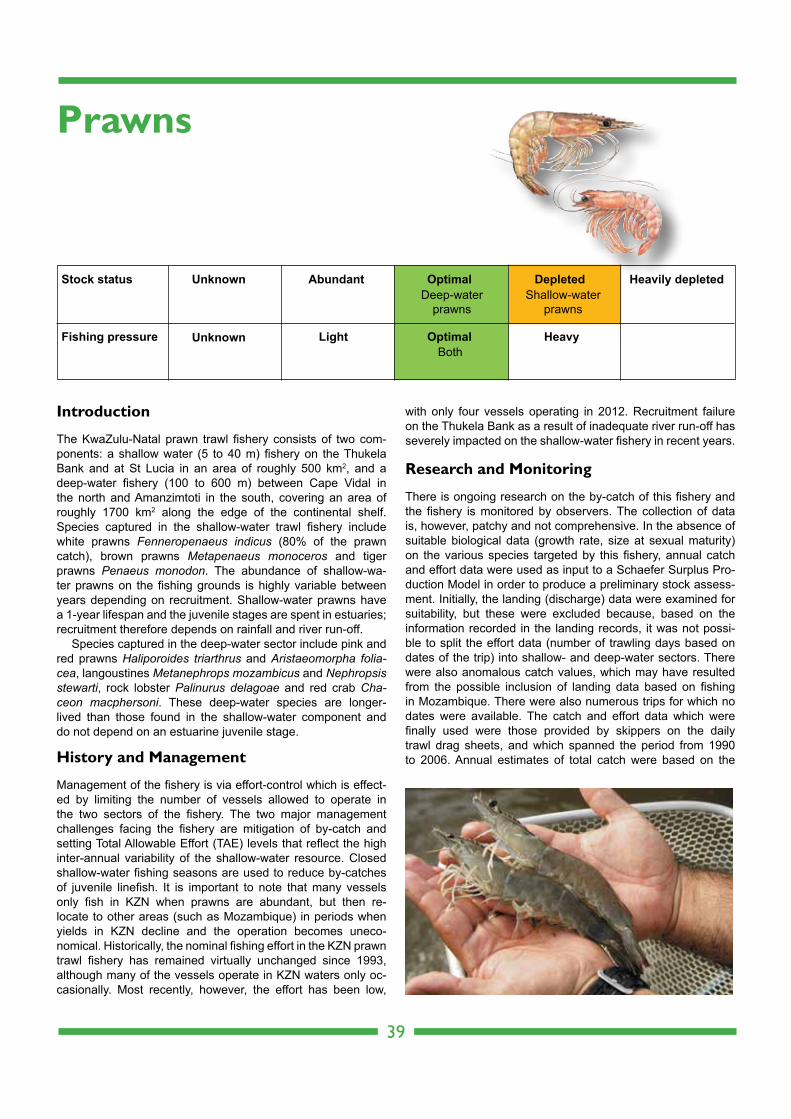
Introduction
The KwaZulu-Natal prawn trawl fishery consists of two com-ponents: a shallow water (5 to 40 m) fishery on the Thukela Bank and at St Lucia in an area of roughly 500 km2, and a deep-water fishery (100 to 600 m) between Cape Vidal in the north and Amanzimtoti in the south, covering an area of roughly 1700 km2 along the edge of the continental shelf. Species captured in the shallow-water trawl fishery include white prawns Fenneropenaeus indicus (80% of the prawn catch), brown prawns Metapenaeus monoceros and tiger prawns Penaeus monodon. The abundance of shallow-wa-ter prawns on the fishing grounds is highly variable between years depending on recruitment. Shallow-water prawns have a 1-year lifespan and the juvenile stages are spent in estuaries; recruitment therefore depends on rainfall and river run-off.
Species captured in the deep-water sector include pink and red prawns Haliporoides triarthrus and Aristaeomorpha folia-cea, langoustines Metanephrops mozambicus and Nephropsis stewarti, rock lobster Palinurus delagoae and red crab Cha-ceon macphersoni. These deep-water species are longer- lived than those found in the shallow-water component and do not depend on an estuarine juvenile stage.
History and Management
Management of the fishery is via effort-control which is effect- ed by limiting the number of vessels allowed to operate in the two sectors of the fishery. The two major management challenges facing the fishery are mitigation of by-catch and setting Total Allowable Effort (TAE) levels that reflect the high inter-annual variability of the shallow-water resource. Closed shallow-water fishing seasons are used to reduce by-catches of juvenile linefish. It is important to note that many vessels only fish in KZN when prawns are abundant, but then re- locate to other areas (such as Mozambique) in periods when yields in KZN decline and the operation becomes uneco- nomical. Historically, the nominal fishing effort in the KZN prawn trawl fishery has remained virtually unchanged since 1993, although many of the vessels operate in KZN waters only oc-casionally. Most recently, however, the effort has been low,
with only four vessels operating in 2012. Recruitment failure on the Thukela Bank as a result of inadequate river run-off has severely impacted on the shallow-water fishery in recent years.
Research and Monitoring
There is ongoing research on the by-catch of this fishery and the fishery is monitored by observers. The collection of data is, however, patchy and not comprehensive. In the absence of suitable biological data (growth rate, size at sexual maturity) on the various species targeted by this fishery, annual catch and effort data were used as input to a Schaefer Surplus Pro-duction Model in order to produce a preliminary stock assess-ment. Initially, the landing (discharge) data were examined for suitability, but these were excluded because, based on the information recorded in the landing records, it was not possi-ble to split the effort data (number of trawling days based on dates of the trip) into shallow- and deep-water sectors. There were also anomalous catch values, which may have resulted from the possible inclusion of landing data based on fishing in Mozambique. There were also numerous trips for which no dates were available. The catch and effort data which were finally used were those provided by skippers on the daily trawl drag sheets, and which spanned the period from 1990 to 2006. Annual estimates of total catch were based on the
39
Prawns
Stock status Abundant Optimal Depleted Heavily depletedUnknown
Fishing pressure Light Optimal HeavyUnknown
Deep-waterprawns
Shallow-waterprawns
Both
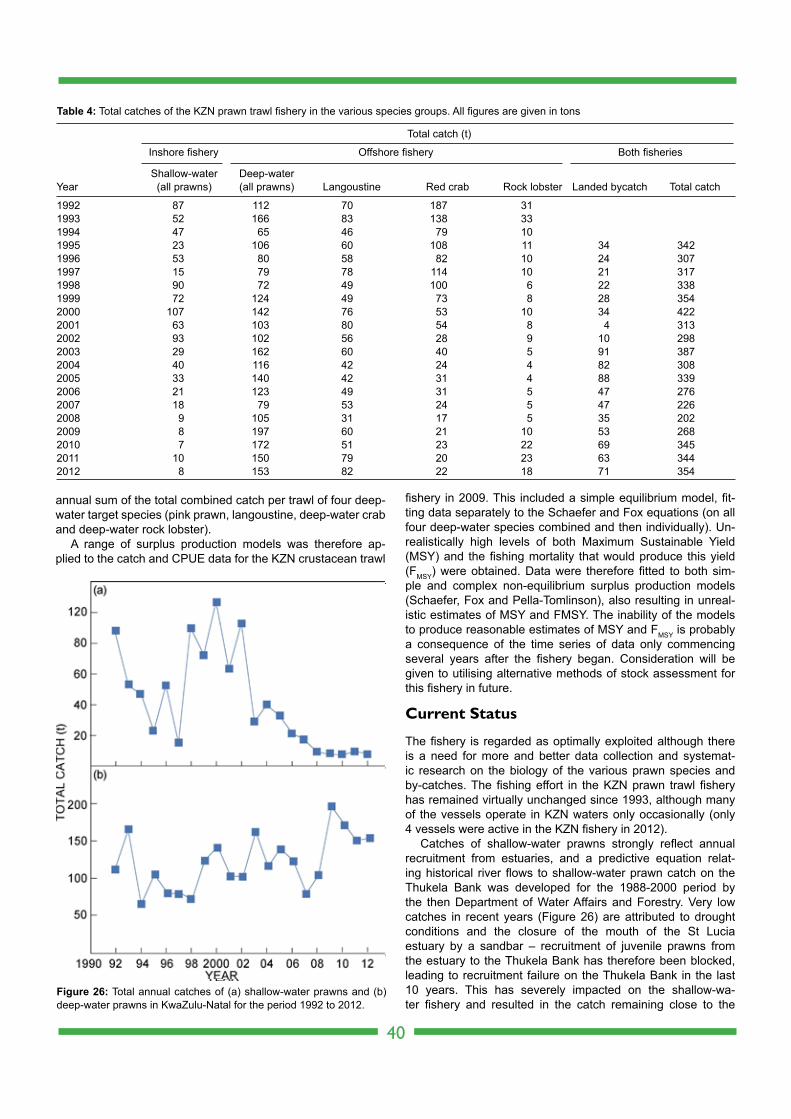
annual sum of the total combined catch per trawl of four deep-water target species (pink prawn, langoustine, deep-water crab and deep-water rock lobster).
A range of surplus production models was therefore ap-plied to the catch and CPUE data for the KZN crustacean trawl
fishery in 2009. This included a simple equilibrium model, fit-ting data separately to the Schaefer and Fox equations (on all four deep-water species combined and then individually). Un-realistically high levels of both Maximum Sustainable Yield (MSY) and the fishing mortality that would produce this yield (FMSY) were obtained. Data were therefore fitted to both sim-ple and complex non-equilibrium surplus production models (Schaefer, Fox and Pella-Tomlinson), also resulting in unreal-istic estimates of MSY and FMSY. The inability of the models to produce reasonable estimates of MSY and FMSY is probably a consequence of the time series of data only commencing several years after the fishery began. Consideration will be given to utilising alternative methods of stock assessment for this fishery in future.
Current Status
The fishery is regarded as optimally exploited although there is a need for more and better data collection and systemat-ic research on the biology of the various prawn species and by-catches. The fishing effort in the KZN prawn trawl fishery has remained virtually unchanged since 1993, although many of the vessels operate in KZN waters only occasionally (only 4 vessels were active in the KZN fishery in 2012).
Catches of shallow-water prawns strongly reflect annual recruitment from estuaries, and a predictive equation relat-ing historical river flows to shallow-water prawn catch on the Thukela Bank was developed for the 1988-2000 period by the then Department of Water Affairs and Forestry. Very low catches in recent years (Figure 26) are attributed to drought conditions and the closure of the mouth of the St Lucia estuary by a sandbar – recruitment of juvenile prawns from the estuary to the Thukela Bank has therefore been blocked, leading to recruitment failure on the Thukela Bank in the last 10 years. This has severely impacted on the shallow-wa-ter fishery and resulted in the catch remaining close to the
40
Figure 26: Total annual catches of (a) shallow-water prawns and (b) deep-water prawns in KwaZulu-Natal for the period 1992 to 2012.
Inshore fishery Offshore fishery Both fisheries
Shallow-water Deep-water Year (all prawns) (all prawns) Langoustine Red crab Rock lobster Landed bycatch Total catch
1992 87 112 70 187 31 1993 52 166 83 138 33 1994 47 65 46 79 10 1995 23 106 60 108 11 34 3421996 53 80 58 82 10 24 3071997 15 79 78 114 10 21 3171998 90 72 49 100 6 22 3381999 72 124 49 73 8 28 3542000 107 142 76 53 10 34 4222001 63 103 80 54 8 4 3132002 93 102 56 28 9 10 2982003 29 162 60 40 5 91 3872004 40 116 42 24 4 82 3082005 33 140 42 31 4 88 3392006 21 123 49 31 5 47 2762007 18 79 53 24 5 47 2262008 9 105 31 17 5 35 2022009 8 197 60 21 10 53 2682010 7 172 51 23 22 69 3452011 10 150 79 20 23 63 3442012 8 153 82 22 18 71 354
Table 4: Total catches of the KZN prawn trawl fishery in the various species groups. All figures are given in tons
Total catch (t)
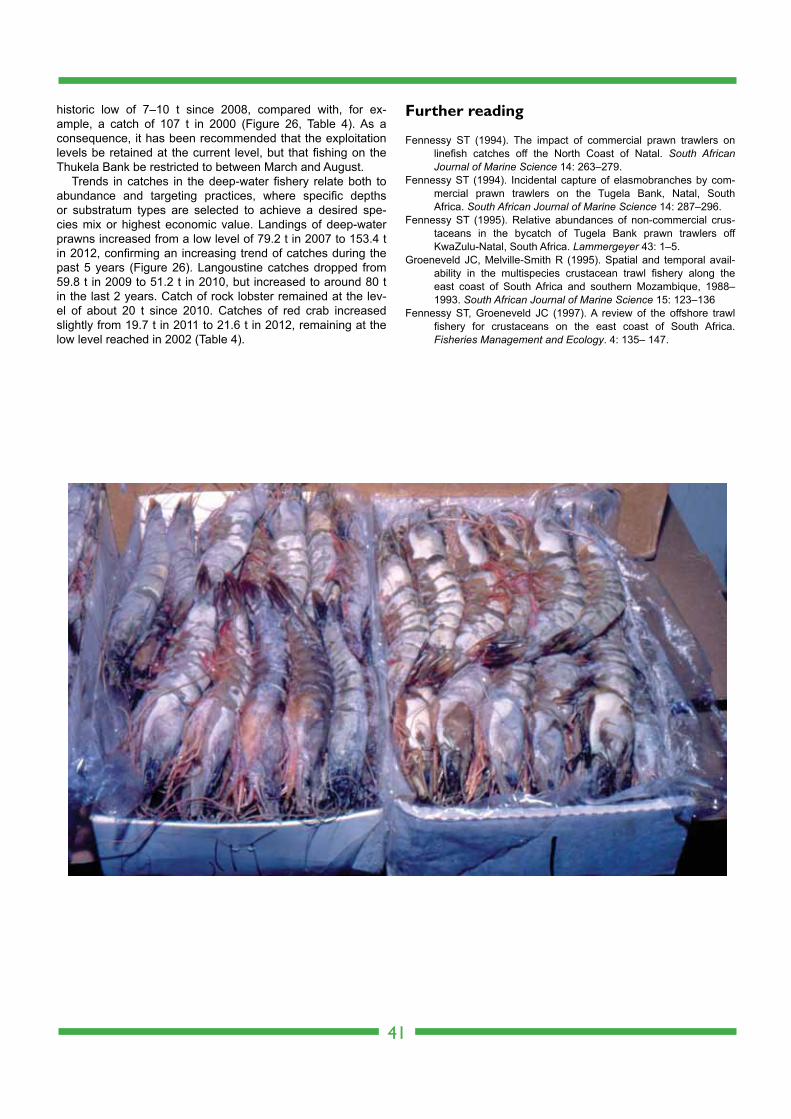
historic low of 7–10 t since 2008, compared with, for ex-ample, a catch of 107 t in 2000 (Figure 26, Table 4). As a consequence, it has been recommended that the exploitation levels be retained at the current level, but that fishing on the Thukela Bank be restricted to between March and August.
Trends in catches in the deep-water fishery relate both to abundance and targeting practices, where specific depths or substratum types are selected to achieve a desired spe-cies mix or highest economic value. Landings of deep-water prawns increased from a low level of 79.2 t in 2007 to 153.4 t in 2012, confirming an increasing trend of catches during the past 5 years (Figure 26). Langoustine catches dropped from 59.8 t in 2009 to 51.2 t in 2010, but increased to around 80 t in the last 2 years. Catch of rock lobster remained at the lev-el of about 20 t since 2010. Catches of red crab increased slightly from 19.7 t in 2011 to 21.6 t in 2012, remaining at the low level reached in 2002 (Table 4).
Further reading
Fennessy ST (1994). The impact of commercial prawn trawlers on linefish catches off the North Coast of Natal. South African Journal of Marine Science 14: 263–279.
Fennessy ST (1994). Incidental capture of elasmobranches by com-mercial prawn trawlers on the Tugela Bank, Natal, South Africa. South African Journal of Marine Science 14: 287–296.
Fennessy ST (1995). Relative abundances of non-commercial crus- taceans in the bycatch of Tugela Bank prawn trawlers off KwaZulu-Natal, South Africa. Lammergeyer 43: 1–5.
Groeneveld JC, Melville-Smith R (1995). Spatial and temporal avail-ability in the multispecies crustacean trawl fishery along the east coast of South Africa and southern Mozambique, 1988–1993. South African Journal of Marine Science 15: 123–136
Fennessy ST, Groeneveld JC (1997). A review of the offshore trawl fishery for crustaceans on the east coast of South Africa. Fisheries Management and Ecology. 4: 135– 147.
41
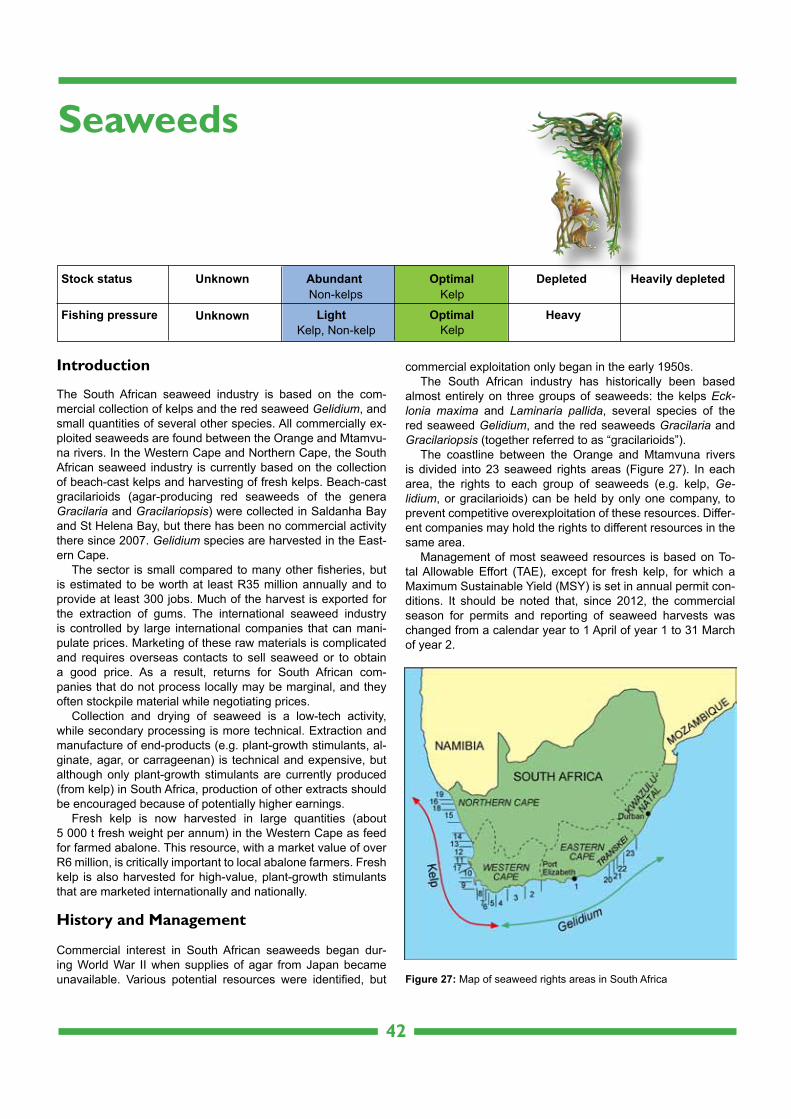
Introduction
The South African seaweed industry is based on the com-mercial collection of kelps and the red seaweed Gelidium, and small quantities of several other species. All commercially ex-ploited seaweeds are found between the Orange and Mtamvu-na rivers. In the Western Cape and Northern Cape, the South African seaweed industry is currently based on the collection of beach-cast kelps and harvesting of fresh kelps. Beach-cast gracilarioids (agar-producing red seaweeds of the genera Gracilaria and Gracilariopsis) were collected in Saldanha Bay and St Helena Bay, but there has been no commercial activity there since 2007. Gelidium species are harvested in the East-ern Cape.
The sector is small compared to many other fisheries, but is estimated to be worth at least R35 million annually and to provide at least 300 jobs. Much of the harvest is exported for the extraction of gums. The international seaweed industry is controlled by large international companies that can mani- pulate prices. Marketing of these raw materials is complicated and requires overseas contacts to sell seaweed or to obtain a good price. As a result, returns for South African com- panies that do not process locally may be marginal, and they often stockpile material while negotiating prices.
Collection and drying of seaweed is a low-tech activity, while secondary processing is more technical. Extraction and manufacture of end-products (e.g. plant-growth stimulants, al-ginate, agar, or carrageenan) is technical and expensive, but although only plant-growth stimulants are currently produced (from kelp) in South Africa, production of other extracts should be encouraged because of potentially higher earnings.
Fresh kelp is now harvested in large quantities (about 5 000 t fresh weight per annum) in the Western Cape as feed for farmed abalone. This resource, with a market value of over R6 million, is critically important to local abalone farmers. Fresh kelp is also harvested for high-value, plant-growth stimulants that are marketed internationally and nationally.
History and Management
Commercial interest in South African seaweeds began dur-ing World War II when supplies of agar from Japan became unavailable. Various potential resources were identified, but
commercial exploitation only began in the early 1950s.The South African industry has historically been based
almost entirely on three groups of seaweeds: the kelps Eck-lonia maxima and Laminaria pallida, several species of the red seaweed Gelidium, and the red seaweeds Gracilaria and Gracilariopsis (together referred to as “gracilarioids”).
The coastline between the Orange and Mtamvuna rivers is divided into 23 seaweed rights areas (Figure 27). In each area, the rights to each group of seaweeds (e.g. kelp, Ge-lidium, or gracilarioids) can be held by only one company, to prevent competitive overexploitation of these resources. Differ-ent companies may hold the rights to different resources in the same area.
Management of most seaweed resources is based on To-tal Allowable Effort (TAE), except for fresh kelp, for which a Maximum Sustainable Yield (MSY) is set in annual permit con-ditions. It should be noted that, since 2012, the commercial season for permits and reporting of seaweed harvests was changed from a calendar year to 1 April of year 1 to 31 March of year 2.
42
Seaweeds
Stock status Abundant Optimal Depleted Heavily depletedUnknown
Fishing pressure Light Optimal HeavyUnknown
Non-kelps Kelp
Kelp, Non-kelp Kelp
Figure 27: Map of seaweed rights areas in South Africa
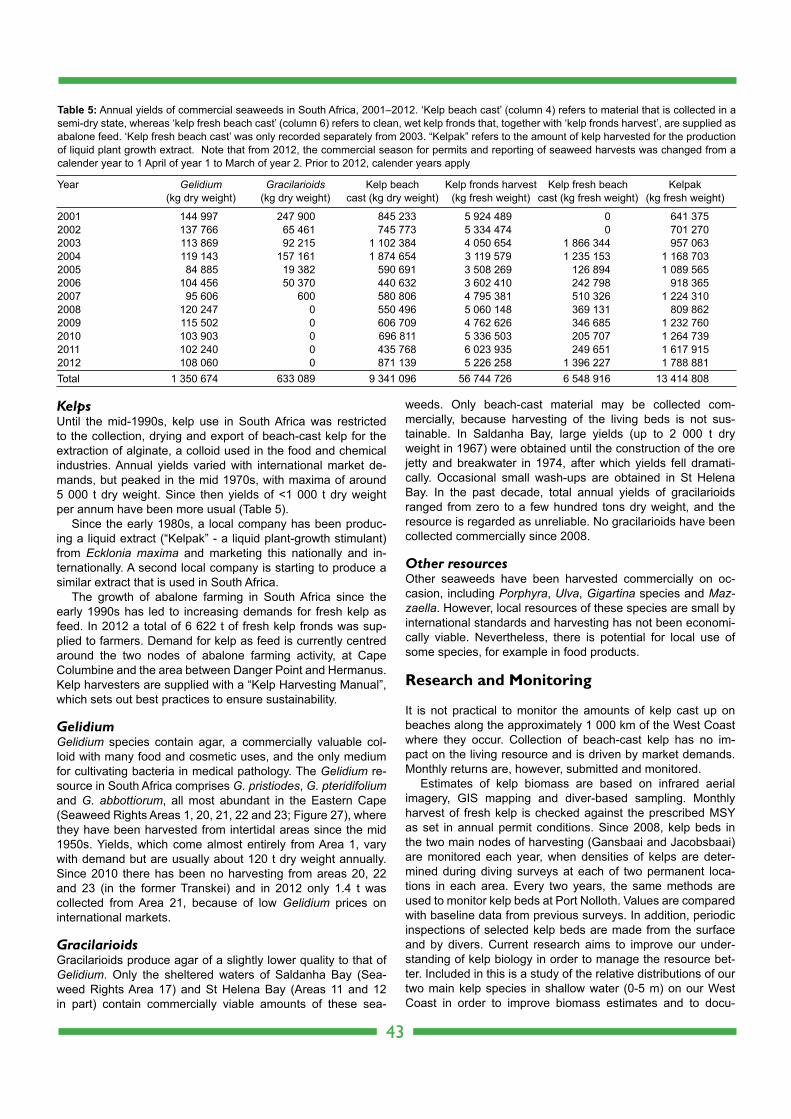
KelpsUntil the mid-1990s, kelp use in South Africa was restricted to the collection, drying and export of beach-cast kelp for the extraction of alginate, a colloid used in the food and chemical industries. Annual yields varied with international market de-mands, but peaked in the mid 1970s, with maxima of around 5 000 t dry weight. Since then yields of <1 000 t dry weight per annum have been more usual (Table 5).
Since the early 1980s, a local company has been produc-ing a liquid extract (“Kelpak” - a liquid plant-growth stimulant) from Ecklonia maxima and marketing this nationally and in-ternationally. A second local company is starting to produce a similar extract that is used in South Africa.
The growth of abalone farming in South Africa since the early 1990s has led to increasing demands for fresh kelp as feed. In 2012 a total of 6 622 t of fresh kelp fronds was sup-plied to farmers. Demand for kelp as feed is currently centred around the two nodes of abalone farming activity, at Cape Columbine and the area between Danger Point and Hermanus. Kelp harvesters are supplied with a “Kelp Harvesting Manual”, which sets out best practices to ensure sustainability.
GelidiumGelidium species contain agar, a commercially valuable col-loid with many food and cosmetic uses, and the only medium for cultivating bacteria in medical pathology. The Gelidium re-source in South Africa comprises G. pristiodes, G. pteridifolium and G. abbottiorum, all most abundant in the Eastern Cape (Seaweed Rights Areas 1, 20, 21, 22 and 23; Figure 27), where they have been harvested from intertidal areas since the mid 1950s. Yields, which come almost entirely from Area 1, vary with demand but are usually about 120 t dry weight annually. Since 2010 there has been no harvesting from areas 20, 22 and 23 (in the former Transkei) and in 2012 only 1.4 t was collected from Area 21, because of low Gelidium prices on international markets.
GracilarioidsGracilarioids produce agar of a slightly lower quality to that of Gelidium. Only the sheltered waters of Saldanha Bay (Sea-weed Rights Area 17) and St Helena Bay (Areas 11 and 12 in part) contain commercially viable amounts of these sea-
weeds. Only beach-cast material may be collected com-mercially, because harvesting of the living beds is not sus- tainable. In Saldanha Bay, large yields (up to 2 000 t dry weight in 1967) were obtained until the construction of the ore jetty and breakwater in 1974, after which yields fell dramati-cally. Occasional small wash-ups are obtained in St Helena Bay. In the past decade, total annual yields of gracilarioids ranged from zero to a few hundred tons dry weight, and the resource is regarded as unreliable. No gracilarioids have been collected commercially since 2008.
Other resourcesOther seaweeds have been harvested commercially on oc-casion, including Porphyra, Ulva, Gigartina species and Maz-zaella. However, local resources of these species are small by international standards and harvesting has not been economi-cally viable. Nevertheless, there is potential for local use of some species, for example in food products.
Research and Monitoring
It is not practical to monitor the amounts of kelp cast up on beaches along the approximately 1 000 km of the West Coast where they occur. Collection of beach-cast kelp has no im-pact on the living resource and is driven by market demands. Monthly returns are, however, submitted and monitored.
Estimates of kelp biomass are based on infrared aerial imagery, GIS mapping and diver-based sampling. Monthly harvest of fresh kelp is checked against the prescribed MSY as set in annual permit conditions. Since 2008, kelp beds in the two main nodes of harvesting (Gansbaai and Jacobsbaai) are monitored each year, when densities of kelps are deter-mined during diving surveys at each of two permanent loca-tions in each area. Every two years, the same methods are used to monitor kelp beds at Port Nolloth. Values are compared with baseline data from previous surveys. In addition, periodic inspections of selected kelp beds are made from the surface and by divers. Current research aims to improve our under-standing of kelp biology in order to manage the resource bet-ter. Included in this is a study of the relative distributions of our two main kelp species in shallow water (0-5 m) on our West Coast in order to improve biomass estimates and to docu-
43
Year Gelidium Gracilarioids Kelp beach Kelp fronds harvest Kelp fresh beach Kelpak (kg dry weight) (kg dry weight) cast (kg dry weight) (kg fresh weight) cast (kg fresh weight) (kg fresh weight)
2001 144 997 247 900 845 233 5 924 489 0 641 3752002 137 766 65 461 745 773 5 334 474 0 701 2702003 113 869 92 215 1 102 384 4 050 654 1 866 344 957 0632004 119 143 157 161 1 874 654 3 119 579 1 235 153 1 168 7032005 84 885 19 382 590 691 3 508 269 126 894 1 089 5652006 104 456 50 370 440 632 3 602 410 242 798 918 3652007 95 606 600 580 806 4 795 381 510 326 1 224 3102008 120 247 0 550 496 5 060 148 369 131 809 8622009 115 502 0 606 709 4 762 626 346 685 1 232 7602010 103 903 0 696 811 5 336 503 205 707 1 264 7392011 102 240 0 435 768 6 023 935 249 651 1 617 9152012 108 060 0 871 139 5 226 258 1 396 227 1 788 881Total 1 350 674 633 089 9 341 096 56 744 726 6 548 916 13 414 808
Table 5: Annual yields of commercial seaweeds in South Africa, 2001–2012. ‘Kelp beach cast’ (column 4) refers to material that is collected in a semi-dry state, whereas ‘kelp fresh beach cast’ (column 6) refers to clean, wet kelp fronds that, together with ‘kelp fronds harvest’, are supplied as abalone feed. ‘Kelp fresh beach cast’ was only recorded separately from 2003. “Kelpak” refers to the amount of kelp harvested for the production of liquid plant growth extract. Note that from 2012, the commercial season for permits and reporting of seaweed harvests was changed from a calender year to 1 April of year 1 to March of year 2. Prior to 2012, calender years apply
ment their relative distributions in the event of possible climate changes in the future.
Assessment of the Gracilarioid resource is performed on an ad hoc basis because only beach-cast seaweed is col- lected and there is therefore no direct effect on the living re-source.
Harvesting of Gelidium in the Eastern Cape and the biol-ogy of G. pristoides were comprehensively researched in the 1980s. Current monitoring is by annual inspections of sev-eral randomly-chosen harvested and non-harvested shores along the approximately 400 km Eastern Cape coast where harvesting is done, and annual biomass and density meas-urements at two permanent study sites: one in the centre and one near the southern edge of the most intensively harvested Area 1. Catch returns are also monitored to ensure that yields do not exceed historical levels: if they did, further inspections and monitoring would be necessary. Other seaweed resources are assessed on an ad hoc basis as the need arises.
Current Status
KelpsThere are 14 areas in which kelp rights were held in 2012. No commercial activity was reported in five of these areas: in two of them Right Holders could not access the resource. Two Right Holders did not activate their rights during 2012.
Yields of dry beach-cast kelp totalled 871 t in 2012 (Table 5). A further 1 396 t wet weight of fresh beach-cast kelp was supplied to abalone farms, together with 5 226 t wet weight harvested directly as abalone feed. These yields have re- mained fairly steady over the past three years. Substantial har-vests for abalone feed were obtained in areas 5, 6, 7 and 11. Although there are more than 5 abalone farms in the Gansbaai – Hermanus area, they are supplied by 4 rights areas (Areas 5, 6, 7 and 8), with a substantial potential MSY between them. The fact that on parts of the coast there is still substantial po-tentially harvestable biomass (‘spare’ MSY) bodes well for the expansion of abalone farms in this area.
In some areas harvests (Table 6) were well below MSY. The under-harvest is a result of lower demand for kelp in some areas and/or the use of alternative abalone feeds, and is not a
reflection of the status of the resource in those areas. In Area 9, the production of Kelpak (plant-growth stimulant) used al-most 1 789 t of fresh kelp in 2012 (87% of MSY). In all rights areas except 11, the fresh kelp resource can be regarded either as well (but incompletely) exploited, or under-exploited.
Monitoring, visual inspections and reports from Right Hold-ers show that the kelp resource is stable and healthy.
GelidiumIn 2012 substantial quantities of Gelidium were collected only from Area 1, where G. pristoides comprises more than 90% of the harvest. The other species, which make up most of the harvest in Areas 20-23, at present fetch low prices on Asian markets, and only Area 21 provided some harvest (1.4 t). Catch returns from Area 1 (108 t dry weight) were slightly higher than those for the previous year. Inspections and measurements done in February and May 2013 indicate very healthy G. pris-toides populations with density and biomass values well within normal limits.
GracilarioidsBiomass of this unreliable resource varied during 2012, but large wash-ups were observed early in winter. These periodic fluctuations appear to have natural causes and have been re-corded before. This resource must at present be regarded as commercially unreliable, despite such occasional wash-ups.
Other seaweed resourcesDespite some commercial interest in Ulva and Porphyra in Area 11, where research has shown there to be a small but viable resource, no further developments have taken place.
Seaweed resources in general, with the exception of gracilar-ioids, are in a good state. None are over-exploited, some (kelp in a few rights areas) are close to optimal exploitation, and some are under-exploited.
Ecosystem interactions
In the case of Gelidium pristoides, which makes up the bulk of the Gelidium harvest, considerable research has shown that harvesting, as currently practised, has negligible ecosystem effects.
Ecosystem effects of kelp harvesting have been dealt with in a few studies, and are the subject of ongoing research. Re-sults indicate that ecosystem effects are slight. Future studies will incorporate possible climate change interactions.
Further reading
Anderson RJ, Simons RH, Jarman NG. 1989. Commercial seaweeds in southern Africa: utilization and research. South African Journal of Marine Science 8: 277–299.
Anderson RJ, Simons RH, Jarman NG, Levitt GJ. 1991. Gelidium pristoides in South Africa. Hydrobiologia 221: 55–66.
Anderson RJ, Bolton JJ, Molloy FJ, Rotmann KW. 2003. Commercial seaweeds in southern Africa. Proceedings of the 17th Interna-tional Seaweed Symposium. Oxford University Press. pp.1–12.
Anderson RJ, Rand A, Rothman MD, Bolton JJ. 2007. Mapping and quantifying the South African kelp resource. African Journal of Marine Science 29: 369–378.
Rothman MD, Anderson RJ, Boothroyd CJT, Kemp FA, Bolton JJ. 2008. The gracilarioids in South Africa: long-term monitoring of a declining resource. Journal of Applied Phycology 21: 47–53.
44
Area number Whole kelp Kelp fronds (t fresh weight) (t fresh weight)
05 2 840 1 42006* 0* 4 59207 1 421 71008 2 048 1 02409 2 060 1 03010 188 9411 3 085 1 54312 50 2513 113 5714 620 31015 2 200 1 10016 620 31018 2 928 1 46419 765 383
Total 18 938 14 062
Table 6: Maximum sustainable yield of harvested kelp for all areas for the 2012 season (1 April 2012—30 March 2013)
*Note: In Area 6, only non-lethal harvesting of fronds is allowed
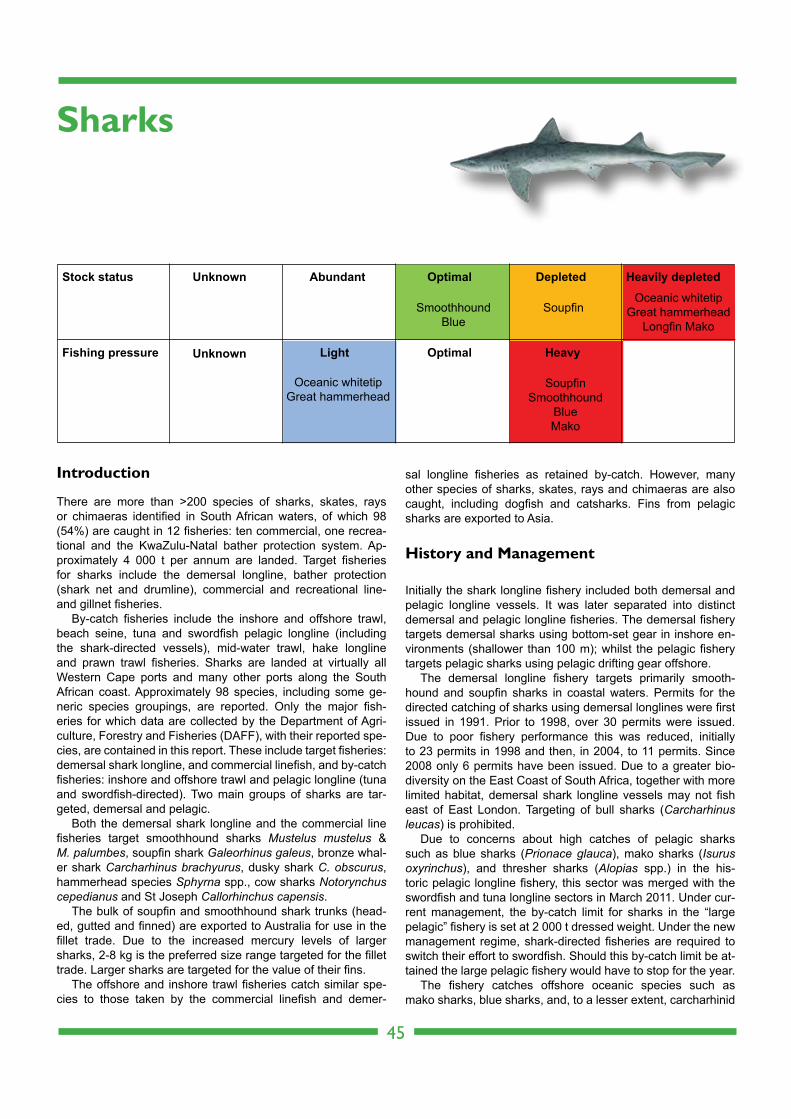
Introduction
There are more than >200 species of sharks, skates, rays or chimaeras identified in South African waters, of which 98 (54%) are caught in 12 fisheries: ten commercial, one recrea-tional and the KwaZulu-Natal bather protection system. Ap-proximately 4 000 t per annum are landed. Target fisheries for sharks include the demersal longline, bather protection (shark net and drumline), commercial and recreational line- and gillnet fisheries.
By-catch fisheries include the inshore and offshore trawl, beach seine, tuna and swordfish pelagic longline (including the shark-directed vessels), mid-water trawl, hake longline and prawn trawl fisheries. Sharks are landed at virtually all Western Cape ports and many other ports along the South African coast. Approximately 98 species, including some ge-neric species groupings, are reported. Only the major fish- eries for which data are collected by the Department of Agri-culture, Forestry and Fisheries (DAFF), with their reported spe-cies, are contained in this report. These include target fisheries: demersal shark longline, and commercial linefish, and by-catch fisheries: inshore and offshore trawl and pelagic longline (tuna and swordfish-directed). Two main groups of sharks are tar-geted, demersal and pelagic.
Both the demersal shark longline and the commercial line fisheries target smoothhound sharks Mustelus mustelus & M. palumbes, soupfin shark Galeorhinus galeus, bronze whal-er shark Carcharhinus brachyurus, dusky shark C. obscurus, hammerhead species Sphyrna spp., cow sharks Notorynchus cepedianus and St Joseph Callorhinchus capensis.
The bulk of soupfin and smoothhound shark trunks (head-ed, gutted and finned) are exported to Australia for use in the fillet trade. Due to the increased mercury levels of larger sharks, 2-8 kg is the preferred size range targeted for the fillet trade. Larger sharks are targeted for the value of their fins.
The offshore and inshore trawl fisheries catch similar spe-cies to those taken by the commercial linefish and demer-
sal longline fisheries as retained by-catch. However, many other species of sharks, skates, rays and chimaeras are also caught, including dogfish and catsharks. Fins from pelagic sharks are exported to Asia.
History and Management
Initially the shark longline fishery included both demersal and pelagic longline vessels. It was later separated into distinct demersal and pelagic longline fisheries. The demersal fishery targets demersal sharks using bottom-set gear in inshore en-vironments (shallower than 100 m); whilst the pelagic fishery targets pelagic sharks using pelagic drifting gear offshore.
The demersal longline fishery targets primarily smooth-hound and soupfin sharks in coastal waters. Permits for the directed catching of sharks using demersal longlines were first issued in 1991. Prior to 1998, over 30 permits were issued. Due to poor fishery performance this was reduced, initially to 23 permits in 1998 and then, in 2004, to 11 permits. Since 2008 only 6 permits have been issued. Due to a greater bio- diversity on the East Coast of South Africa, together with more limited habitat, demersal shark longline vessels may not fish east of East London. Targeting of bull sharks (Carcharhinus leucas) is prohibited.
Due to concerns about high catches of pelagic sharks such as blue sharks (Prionace glauca), mako sharks (Isurus oxyrinchus), and thresher sharks (Alopias spp.) in the his-toric pelagic longline fishery, this sector was merged with the swordfish and tuna longline sectors in March 2011. Under cur-rent management, the by-catch limit for sharks in the “large pelagic” fishery is set at 2 000 t dressed weight. Under the new management regime, shark-directed fisheries are required to switch their effort to swordfish. Should this by-catch limit be at-tained the large pelagic fishery would have to stop for the year.
The fishery catches offshore oceanic species such as mako sharks, blue sharks, and, to a lesser extent, carcharhinid
45
Sharks
Stock status Abundant Optimal Depleted Heavily depletedUnknown
Fishing pressure Light Optimal Heavy
SmoothhoundBlue
SoupfinOceanic whitetip
Great hammerheadLongfin Mako
SoupfinSmoothhound
BlueMako
Unknown
Oceanic whitetipGreat hammerhead
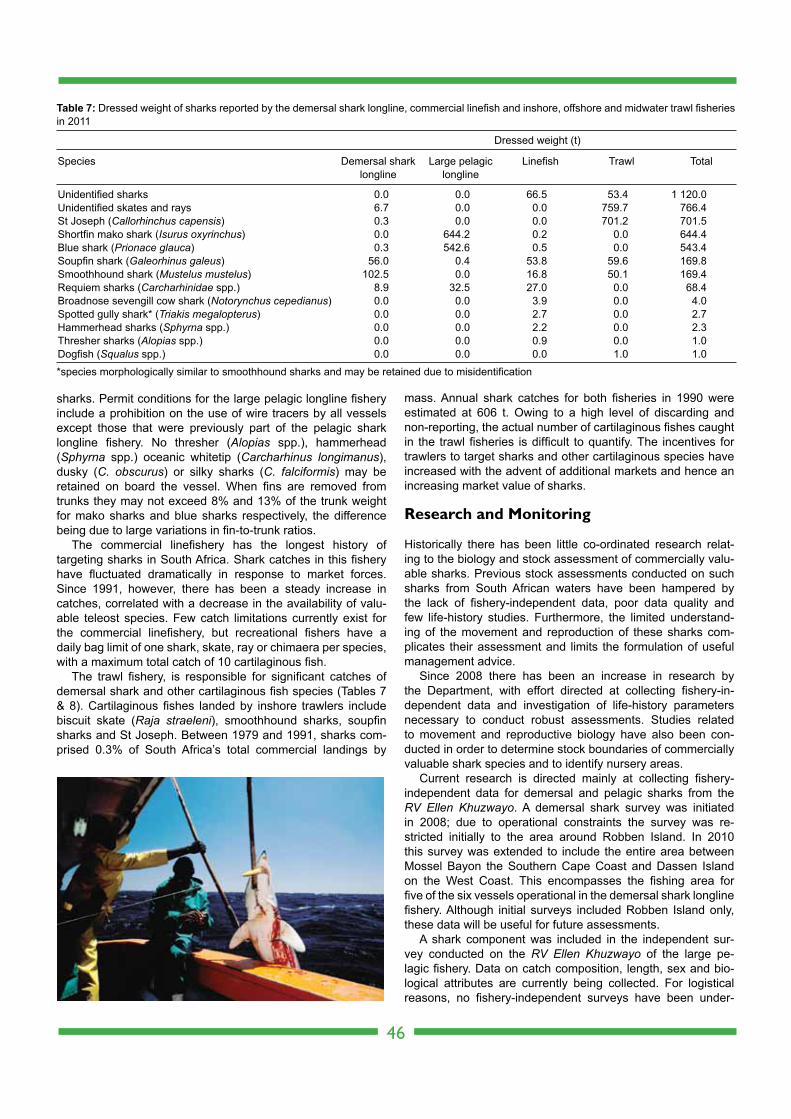
sharks. Permit conditions for the large pelagic longline fishery include a prohibition on the use of wire tracers by all vessels except those that were previously part of the pelagic shark longline fishery. No thresher (Alopias spp.), hammerhead (Sphyrna spp.) oceanic whitetip (Carcharhinus longimanus), dusky (C. obscurus) or silky sharks (C. falciformis) may be retained on board the vessel. When fins are removed from trunks they may not exceed 8% and 13% of the trunk weight for mako sharks and blue sharks respectively, the difference being due to large variations in fin-to-trunk ratios.
The commercial linefishery has the longest history of targeting sharks in South Africa. Shark catches in this fishery have fluctuated dramatically in response to market forces. Since 1991, however, there has been a steady increase in catches, correlated with a decrease in the availability of valu-able teleost species. Few catch limitations currently exist for the commercial linefishery, but recreational fishers have a daily bag limit of one shark, skate, ray or chimaera per species, with a maximum total catch of 10 cartilaginous fish.
The trawl fishery, is responsible for significant catches of demersal shark and other cartilaginous fish species (Tables 7 & 8). Cartilaginous fishes landed by inshore trawlers include biscuit skate (Raja straeleni), smoothhound sharks, soupfin sharks and St Joseph. Between 1979 and 1991, sharks com-prised 0.3% of South Africa’s total commercial landings by
mass. Annual shark catches for both fisheries in 1990 were estimated at 606 t. Owing to a high level of discarding and non-reporting, the actual number of cartilaginous fishes caught in the trawl fisheries is difficult to quantify. The incentives for trawlers to target sharks and other cartilaginous species have increased with the advent of additional markets and hence an increasing market value of sharks.
Research and Monitoring
Historically there has been little co-ordinated research relat-ing to the biology and stock assessment of commercially valu-able sharks. Previous stock assessments conducted on such sharks from South African waters have been hampered by the lack of fishery-independent data, poor data quality and few life-history studies. Furthermore, the limited understand-ing of the movement and reproduction of these sharks com-plicates their assessment and limits the formulation of useful management advice.
Since 2008 there has been an increase in research by the Department, with effort directed at collecting fishery-in-dependent data and investigation of life-history parameters necessary to conduct robust assessments. Studies related to movement and reproductive biology have also been con- ducted in order to determine stock boundaries of commercially valuable shark species and to identify nursery areas.
Current research is directed mainly at collecting fishery-independent data for demersal and pelagic sharks from the RV Ellen Khuzwayo. A demersal shark survey was initiated in 2008; due to operational constraints the survey was re- stricted initially to the area around Robben Island. In 2010 this survey was extended to include the entire area between Mossel Bayon the Southern Cape Coast and Dassen Island on the West Coast. This encompasses the fishing area for five of the six vessels operational in the demersal shark longline fishery. Although initial surveys included Robben Island only, these data will be useful for future assessments.
A shark component was included in the independent sur-vey conducted on the RV Ellen Khuzwayo of the large pe-lagic fishery. Data on catch composition, length, sex and bio- logical attributes are currently being collected. For logistical reasons, no fishery-independent surveys have been under-
46
Table 7: Dressed weight of sharks reported by the demersal shark longline, commercial linefish and inshore, offshore and midwater trawl fisheries in 2011
Species Demersal shark Large pelagic Linefish Trawl Total longline longline
Unidentified sharks 0.0 0.0 66.5 53.4 1 120.0Unidentified skates and rays 6.7 0.0 0.0 759.7 766.4St Joseph (Callorhinchus capensis) 0.3 0.0 0.0 701.2 701.5Shortfin mako shark (Isurus oxyrinchus) 0.0 644.2 0.2 0.0 644.4Blue shark (Prionace glauca) 0.3 542.6 0.5 0.0 543.4Soupfin shark (Galeorhinus galeus) 56.0 0.4 53.8 59.6 169.8Smoothhound shark (Mustelus mustelus) 102.5 0.0 16.8 50.1 169.4Requiem sharks (Carcharhinidae spp.) 8.9 32.5 27.0 0.0 68.4Broadnose sevengill cow shark (Notorynchus cepedianus) 0.0 0.0 3.9 0.0 4.0Spotted gully shark* (Triakis megalopterus) 0.0 0.0 2.7 0.0 2.7Hammerhead sharks (Sphyrna spp.) 0.0 0.0 2.2 0.0 2.3Thresher sharks (Alopias spp.) 0.0 0.0 0.9 0.0 1.0Dogfish (Squalus spp.) 0.0 0.0 0.0 1.0 1.0
Dressed weight (t)
*species morphologically similar to smoothhound sharks and may be retained due to misidentification
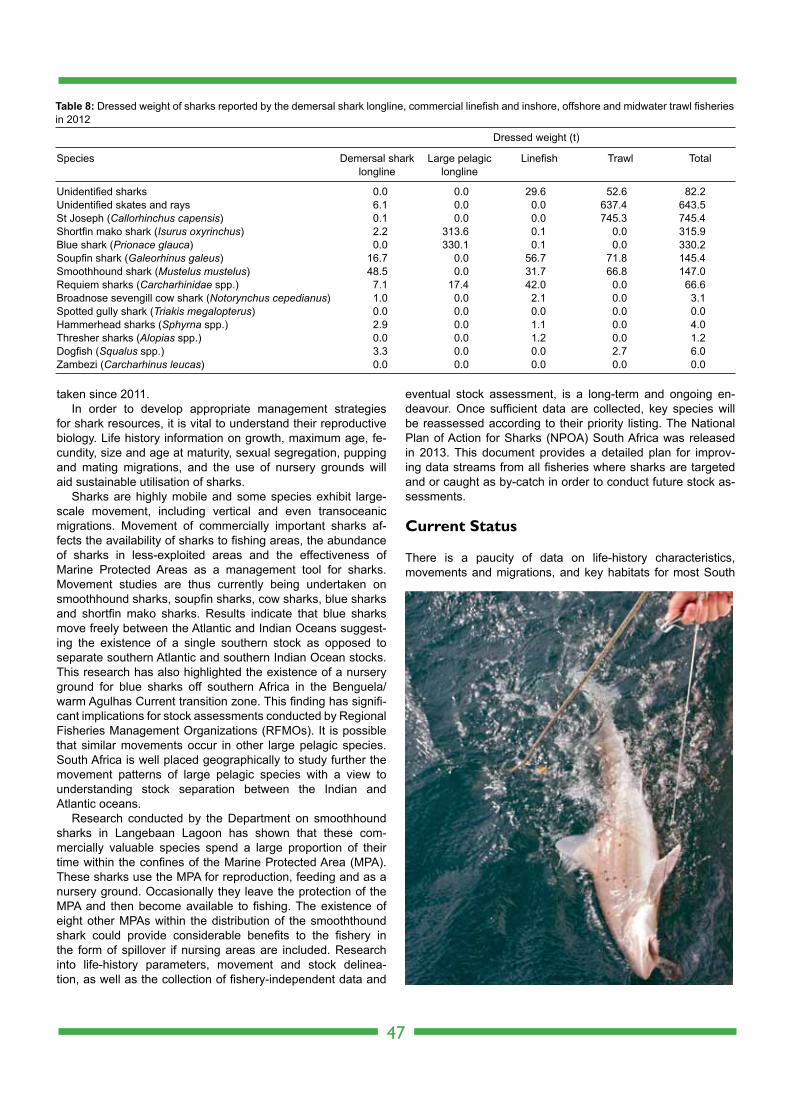
taken since 2011. In order to develop appropriate management strategies
for shark resources, it is vital to understand their reproductive biology. Life history information on growth, maximum age, fe-cundity, size and age at maturity, sexual segregation, pupping and mating migrations, and the use of nursery grounds will aid sustainable utilisation of sharks.
Sharks are highly mobile and some species exhibit large-scale movement, including vertical and even transoceanic migrations. Movement of commercially important sharks af-fects the availability of sharks to fishing areas, the abundance of sharks in less-exploited areas and the effectiveness of Marine Protected Areas as a management tool for sharks. Movement studies are thus currently being undertaken on smoothhound sharks, soupfin sharks, cow sharks, blue sharks and shortfin mako sharks. Results indicate that blue sharks move freely between the Atlantic and Indian Oceans suggest-ing the existence of a single southern stock as opposed to separate southern Atlantic and southern Indian Ocean stocks. This research has also highlighted the existence of a nursery ground for blue sharks off southern Africa in the Benguela/warm Agulhas Current transition zone. This finding has signifi-cant implications for stock assessments conducted by Regional Fisheries Management Organizations (RFMOs). It is possible that similar movements occur in other large pelagic species. South Africa is well placed geographically to study further the movement patterns of large pelagic species with a view to understanding stock separation between the Indian and Atlantic oceans.
Research conducted by the Department on smoothhound sharks in Langebaan Lagoon has shown that these com-mercially valuable species spend a large proportion of their time within the confines of the Marine Protected Area (MPA). These sharks use the MPA for reproduction, feeding and as a nursery ground. Occasionally they leave the protection of the MPA and then become available to fishing. The existence of eight other MPAs within the distribution of the smooththound shark could provide considerable benefits to the fishery in the form of spillover if nursing areas are included. Research into life-history parameters, movement and stock delinea-tion, as well as the collection of fishery-independent data and
eventual stock assessment, is a long-term and ongoing en-deavour. Once sufficient data are collected, key species will be reassessed according to their priority listing. The National Plan of Action for Sharks (NPOA) South Africa was released in 2013. This document provides a detailed plan for improv-ing data streams from all fisheries where sharks are targeted and or caught as by-catch in order to conduct future stock as-sessments.
Current Status
There is a paucity of data on life-history characteristics, movements and migrations, and key habitats for most South
47
Table 8: Dressed weight of sharks reported by the demersal shark longline, commercial linefish and inshore, offshore and midwater trawl fisheries in 2012
Species Demersal shark Large pelagic Linefish Trawl Total longline longline
Unidentified sharks 0.0 0.0 29.6 52.6 82.2Unidentified skates and rays 6.1 0.0 0.0 637.4 643.5St Joseph (Callorhinchus capensis) 0.1 0.0 0.0 745.3 745.4Shortfin mako shark (Isurus oxyrinchus) 2.2 313.6 0.1 0.0 315.9Blue shark (Prionace glauca) 0.0 330.1 0.1 0.0 330.2Soupfin shark (Galeorhinus galeus) 16.7 0.0 56.7 71.8 145.4Smoothhound shark (Mustelus mustelus) 48.5 0.0 31.7 66.8 147.0Requiem sharks (Carcharhinidae spp.) 7.1 17.4 42.0 0.0 66.6Broadnose sevengill cow shark (Notorynchus cepedianus) 1.0 0.0 2.1 0.0 3.1Spotted gully shark (Triakis megalopterus) 0.0 0.0 0.0 0.0 0.0Hammerhead sharks (Sphyrna spp.) 2.9 0.0 1.1 0.0 4.0Thresher sharks (Alopias spp.) 0.0 0.0 1.2 0.0 1.2Dogfish (Squalus spp.) 3.3 0.0 0.0 2.7 6.0Zambezi (Carcharhinus leucas) 0.0 0.0 0.0 0.0 0.0
Dressed weight (t)
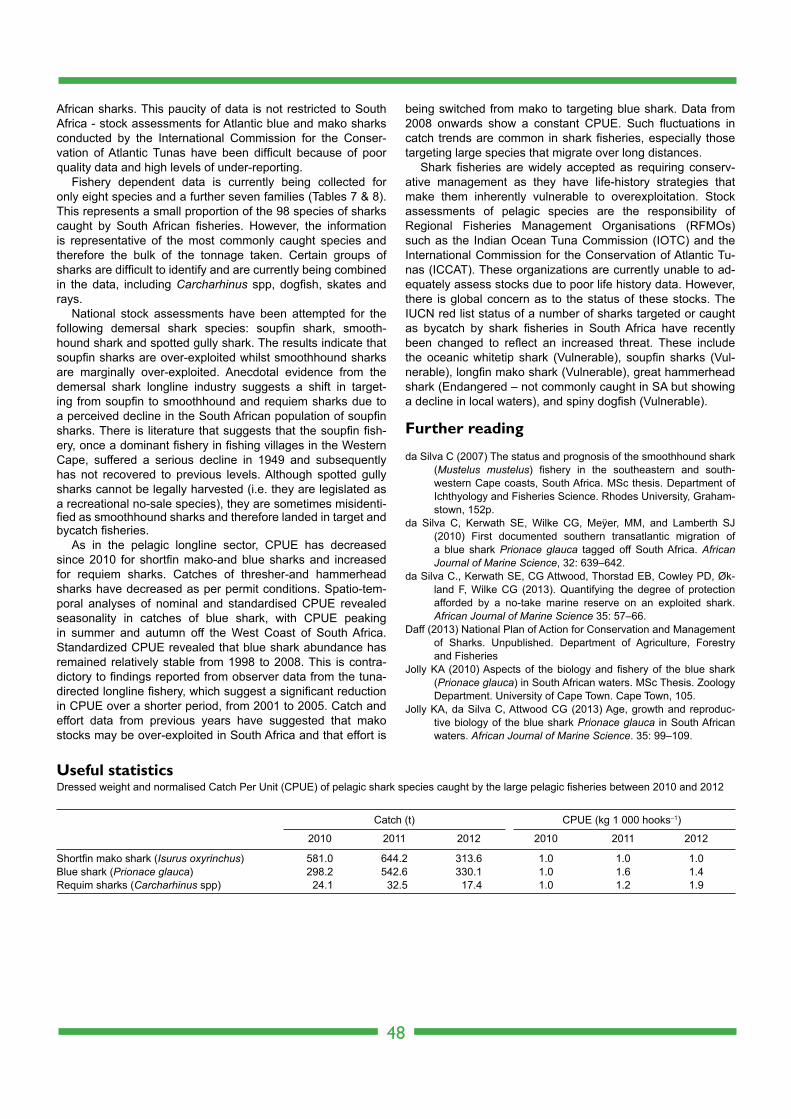
African sharks. This paucity of data is not restricted to South Africa - stock assessments for Atlantic blue and mako sharks conducted by the International Commission for the Conser-vation of Atlantic Tunas have been difficult because of poor quality data and high levels of under-reporting.
Fishery dependent data is currently being collected for only eight species and a further seven families (Tables 7 & 8). This represents a small proportion of the 98 species of sharks caught by South African fisheries. However, the information is representative of the most commonly caught species and therefore the bulk of the tonnage taken. Certain groups of sharks are difficult to identify and are currently being combined in the data, including Carcharhinus spp, dogfish, skates and rays.
National stock assessments have been attempted for the following demersal shark species: soupfin shark, smooth-hound shark and spotted gully shark. The results indicate that soupfin sharks are over-exploited whilst smoothhound sharks are marginally over-exploited. Anecdotal evidence from the demersal shark longline industry suggests a shift in target-ing from soupfin to smoothhound and requiem sharks due to a perceived decline in the South African population of soupfin sharks. There is literature that suggests that the soupfin fish-ery, once a dominant fishery in fishing villages in the Western Cape, suffered a serious decline in 1949 and subsequently has not recovered to previous levels. Although spotted gully sharks cannot be legally harvested (i.e. they are legislated as a recreational no-sale species), they are sometimes misidenti-fied as smoothhound sharks and therefore landed in target and bycatch fisheries.
As in the pelagic longline sector, CPUE has decreased since 2010 for shortfin mako-and blue sharks and increased for requiem sharks. Catches of thresher-and hammerhead sharks have decreased as per permit conditions. Spatio-tem-poral analyses of nominal and standardised CPUE revealed seasonality in catches of blue shark, with CPUE peaking in summer and autumn off the West Coast of South Africa. Standardized CPUE revealed that blue shark abundance has remained relatively stable from 1998 to 2008. This is contra-dictory to findings reported from observer data from the tuna-directed longline fishery, which suggest a significant reduction in CPUE over a shorter period, from 2001 to 2005. Catch and effort data from previous years have suggested that mako stocks may be over-exploited in South Africa and that effort is
being switched from mako to targeting blue shark. Data from 2008 onwards show a constant CPUE. Such fluctuations in catch trends are common in shark fisheries, especially those targeting large species that migrate over long distances.
Shark fisheries are widely accepted as requiring conserv-ative management as they have life-history strategies that make them inherently vulnerable to overexploitation. Stock assessments of pelagic species are the responsibility of Regional Fisheries Management Organisations (RFMOs) such as the Indian Ocean Tuna Commission (IOTC) and the International Commission for the Conservation of Atlantic Tu-nas (ICCAT). These organizations are currently unable to ad-equately assess stocks due to poor life history data. However, there is global concern as to the status of these stocks. The IUCN red list status of a number of sharks targeted or caught as bycatch by shark fisheries in South Africa have recently been changed to reflect an increased threat. These include the oceanic whitetip shark (Vulnerable), soupfin sharks (Vul-nerable), longfin mako shark (Vulnerable), great hammerhead shark (Endangered – not commonly caught in SA but showing a decline in local waters), and spiny dogfish (Vulnerable).
Further reading
da Silva C (2007) The status and prognosis of the smoothhound shark (Mustelus mustelus) fishery in the southeastern and south- western Cape coasts, South Africa. MSc thesis. Department of Ichthyology and Fisheries Science. Rhodes University, Graham-stown, 152p.
da Silva C, Kerwath SE, Wilke CG, Meÿer, MM, and Lamberth SJ (2010) First documented southern transatlantic migration of a blue shark Prionace glauca tagged off South Africa. African Journal of Marine Science, 32: 639–642.
da Silva C., Kerwath SE, CG Attwood, Thorstad EB, Cowley PD, Øk-land F, Wilke CG (2013). Quantifying the degree of protection afforded by a no-take marine reserve on an exploited shark. African Journal of Marine Science 35: 57–66.
Daff (2013) National Plan of Action for Conservation and Management of Sharks. Unpublished. Department of Agriculture, Forestry and Fisheries
Jolly KA (2010) Aspects of the biology and fishery of the blue shark (Prionace glauca) in South African waters. MSc Thesis. Zoology Department. University of Cape Town. Cape Town, 105.
Jolly KA, da Silva C, Attwood CG (2013) Age, growth and reproduc-tive biology of the blue shark Prionace glauca in South African waters. African Journal of Marine Science. 35: 99–109.
48
Useful statistics
Catch (t) CPUE (kg 1 000 hooks–1)
2010 2011 2012 2010 2011 2012
Shortfin mako shark (Isurus oxyrinchus) 581.0 644.2 313.6 1.0 1.0 1.0Blue shark (Prionace glauca) 298.2 542.6 330.1 1.0 1.6 1.4Requim sharks (Carcharhinus spp) 24.1 32.5 17.4 1.0 1.2 1.9
Dressed weight and normalised Catch Per Unit (CPUE) of pelagic shark species caught by the large pelagic fisheries between 2010 and 2012
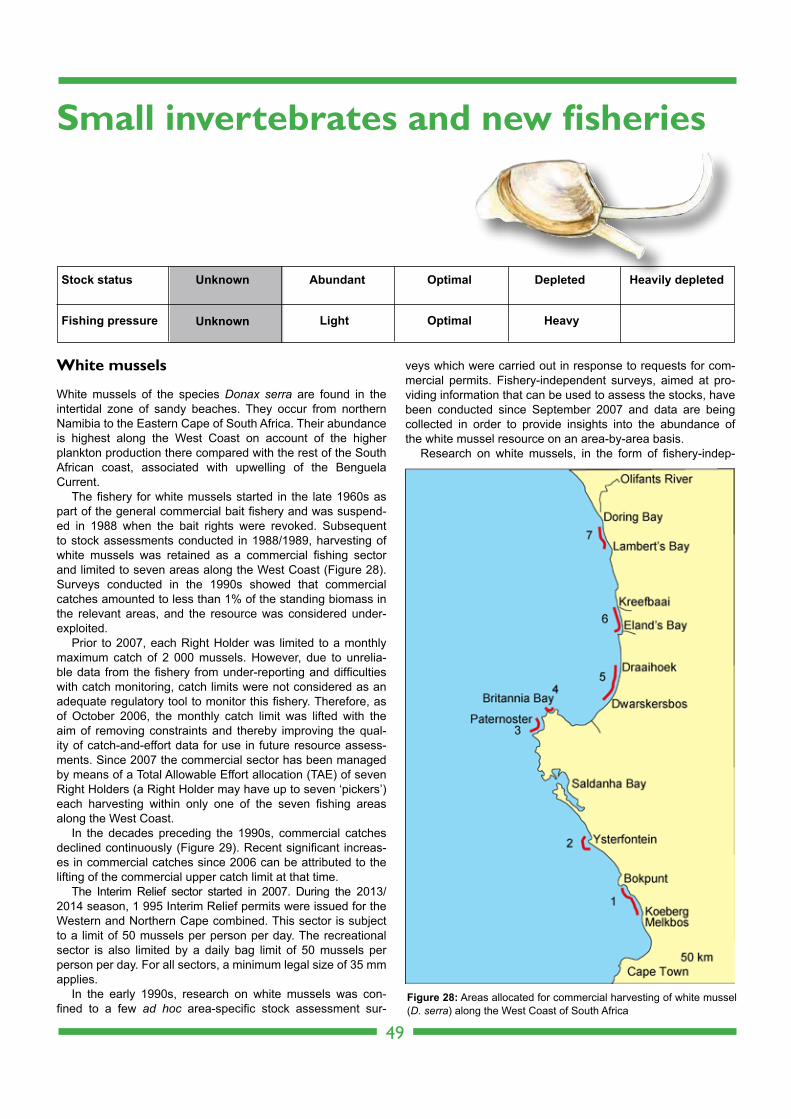
White mussels
White mussels of the species Donax serra are found in the intertidal zone of sandy beaches. They occur from northern Namibia to the Eastern Cape of South Africa. Their abundance is highest along the West Coast on account of the higher plankton production there compared with the rest of the South African coast, associated with upwelling of the Benguela Current.
The fishery for white mussels started in the late 1960s as part of the general commercial bait fishery and was suspend-ed in 1988 when the bait rights were revoked. Subsequent to stock assessments conducted in 1988/1989, harvesting of white mussels was retained as a commercial fishing sector and limited to seven areas along the West Coast (Figure 28). Surveys conducted in the 1990s showed that commercial catches amounted to less than 1% of the standing biomass in the relevant areas, and the resource was considered under-exploited.
Prior to 2007, each Right Holder was limited to a monthly maximum catch of 2 000 mussels. However, due to unrelia-ble data from the fishery from under-reporting and difficulties with catch monitoring, catch limits were not considered as an adequate regulatory tool to monitor this fishery. Therefore, as of October 2006, the monthly catch limit was lifted with the aim of removing constraints and thereby improving the qual-ity of catch-and-effort data for use in future resource assess-ments. Since 2007 the commercial sector has been managed by means of a Total Allowable Effort allocation (TAE) of seven Right Holders (a Right Holder may have up to seven ‘pickers’) each harvesting within only one of the seven fishing areas along the West Coast.
In the decades preceding the 1990s, commercial catches declined continuously (Figure 29). Recent significant increas-es in commercial catches since 2006 can be attributed to the lifting of the commercial upper catch limit at that time.
The Interim Relief sector started in 2007. During the 2013/ 2014 season, 1 995 Interim Relief permits were issued for the Western and Northern Cape combined. This sector is subject to a limit of 50 mussels per person per day. The recreational sector is also limited by a daily bag limit of 50 mussels per person per day. For all sectors, a minimum legal size of 35 mm applies.
In the early 1990s, research on white mussels was con-fined to a few ad hoc area-specific stock assessment sur-
veys which were carried out in response to requests for com-mercial permits. Fishery-independent surveys, aimed at pro-viding information that can be used to assess the stocks, have been conducted since September 2007 and data are being collected in order to provide insights into the abundance of the white mussel resource on an area-by-area basis.
Research on white mussels, in the form of fishery-indep-
49
Small invertebrates and new fisheries
Stock status Abundant Optimal Depleted Heavily depletedUnknown
Fishing pressure Light Optimal HeavyUnknown
Figure 28: Areas allocated for commercial harvesting of white mussel (D. serra) along the West Coast of South Africa
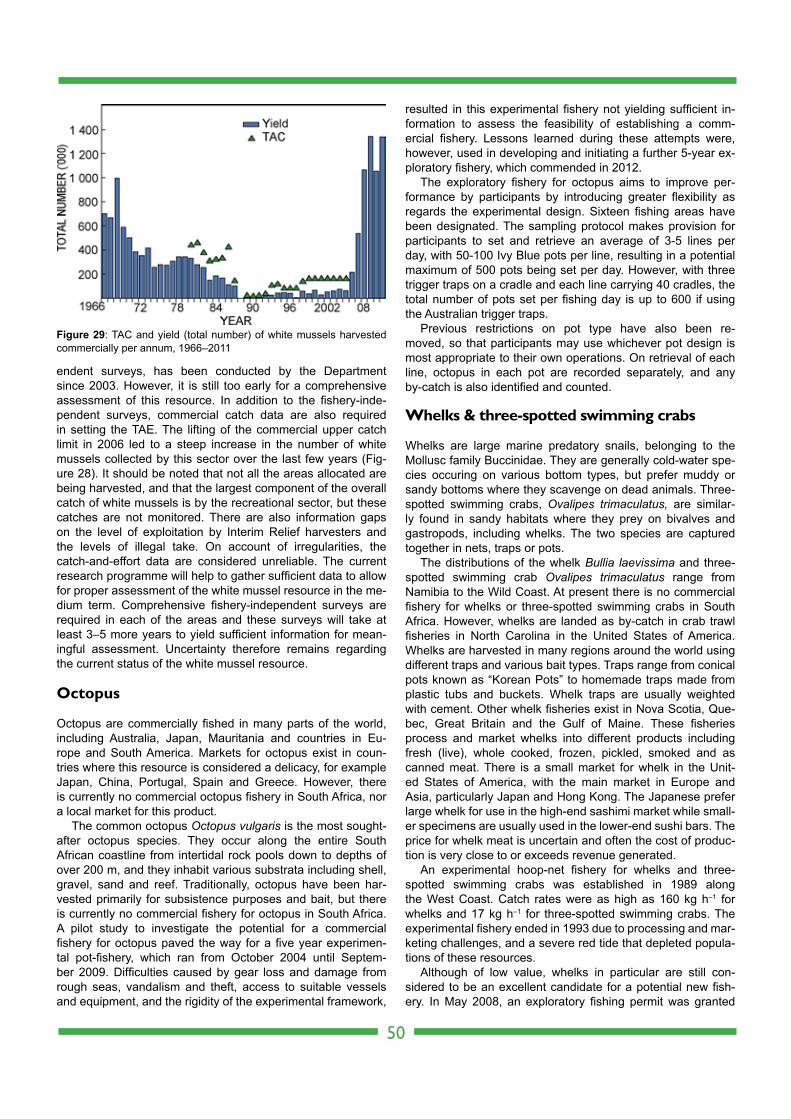
endent surveys, has been conducted by the Department since 2003. However, it is still too early for a comprehensive assessment of this resource. In addition to the fishery-inde-pendent surveys, commercial catch data are also required in setting the TAE. The lifting of the commercial upper catch limit in 2006 led to a steep increase in the number of white mussels collected by this sector over the last few years (Fig-ure 28). It should be noted that not all the areas allocated are being harvested, and that the largest component of the overall catch of white mussels is by the recreational sector, but these catches are not monitored. There are also information gaps on the level of exploitation by Interim Relief harvesters and the levels of illegal take. On account of irregularities, the catch-and-effort data are considered unreliable. The current research programme will help to gather sufficient data to allow for proper assessment of the white mussel resource in the me-dium term. Comprehensive fishery-independent surveys are required in each of the areas and these surveys will take at least 3–5 more years to yield sufficient information for mean-ingful assessment. Uncertainty therefore remains regarding the current status of the white mussel resource.
Octopus
Octopus are commercially fished in many parts of the world, including Australia, Japan, Mauritania and countries in Eu-rope and South America. Markets for octopus exist in coun-tries where this resource is considered a delicacy, for example Japan, China, Portugal, Spain and Greece. However, there is currently no commercial octopus fishery in South Africa, nor a local market for this product.
The common octopus Octopus vulgaris is the most sought-after octopus species. They occur along the entire South African coastline from intertidal rock pools down to depths of over 200 m, and they inhabit various substrata including shell, gravel, sand and reef. Traditionally, octopus have been har-vested primarily for subsistence purposes and bait, but there is currently no commercial fishery for octopus in South Africa. A pilot study to investigate the potential for a commercial fishery for octopus paved the way for a five year experimen-tal pot-fishery, which ran from October 2004 until Septem-ber 2009. Difficulties caused by gear loss and damage from rough seas, vandalism and theft, access to suitable vessels and equipment, and the rigidity of the experimental framework,
resulted in this experimental fishery not yielding sufficient in- formation to assess the feasibility of establishing a comm- ercial fishery. Lessons learned during these attempts were, however, used in developing and initiating a further 5-year ex-ploratory fishery, which commended in 2012.
The exploratory fishery for octopus aims to improve per-formance by participants by introducing greater flexibility as regards the experimental design. Sixteen fishing areas have been designated. The sampling protocol makes provision for participants to set and retrieve an average of 3-5 lines per day, with 50-100 Ivy Blue pots per line, resulting in a potential maximum of 500 pots being set per day. However, with three trigger traps on a cradle and each line carrying 40 cradles, the total number of pots set per fishing day is up to 600 if using the Australian trigger traps.
Previous restrictions on pot type have also been re- moved, so that participants may use whichever pot design is most appropriate to their own operations. On retrieval of each line, octopus in each pot are recorded separately, and any by-catch is also identified and counted.
Whelks & three-spotted swimming crabs
Whelks are large marine predatory snails, belonging to the Mollusc family Buccinidae. They are generally cold-water spe-cies occuring on various bottom types, but prefer muddy or sandy bottoms where they scavenge on dead animals. Three-spotted swimming crabs, Ovalipes trimaculatus, are similar-ly found in sandy habitats where they prey on bivalves and gastropods, including whelks. The two species are captured together in nets, traps or pots.
The distributions of the whelk Bullia laevissima and three-spotted swimming crab Ovalipes trimaculatus range from Namibia to the Wild Coast. At present there is no commercial fishery for whelks or three-spotted swimming crabs in South Africa. However, whelks are landed as by-catch in crab trawl fisheries in North Carolina in the United States of America. Whelks are harvested in many regions around the world using different traps and various bait types. Traps range from conical pots known as “Korean Pots” to homemade traps made from plastic tubs and buckets. Whelk traps are usually weighted with cement. Other whelk fisheries exist in Nova Scotia, Que-bec, Great Britain and the Gulf of Maine. These fisheries process and market whelks into different products including fresh (live), whole cooked, frozen, pickled, smoked and as canned meat. There is a small market for whelk in the Unit-ed States of America, with the main market in Europe and Asia, particularly Japan and Hong Kong. The Japanese prefer large whelk for use in the high-end sashimi market while small-er specimens are usually used in the lower-end sushi bars. The price for whelk meat is uncertain and often the cost of produc-tion is very close to or exceeds revenue generated.
An experimental hoop-net fishery for whelks and three-spotted swimming crabs was established in 1989 along the West Coast. Catch rates were as high as 160 kg h–1 for whelks and 17 kg h–1 for three-spotted swimming crabs. The experimental fishery ended in 1993 due to processing and mar-keting challenges, and a severe red tide that depleted popula-tions of these resources.
Although of low value, whelks in particular are still con-sidered to be an excellent candidate for a potential new fish-ery. In May 2008, an exploratory fishing permit was granted
50
Figure 29: TAC and yield (total number) of white mussels harvested commercially per annum, 1966–2011
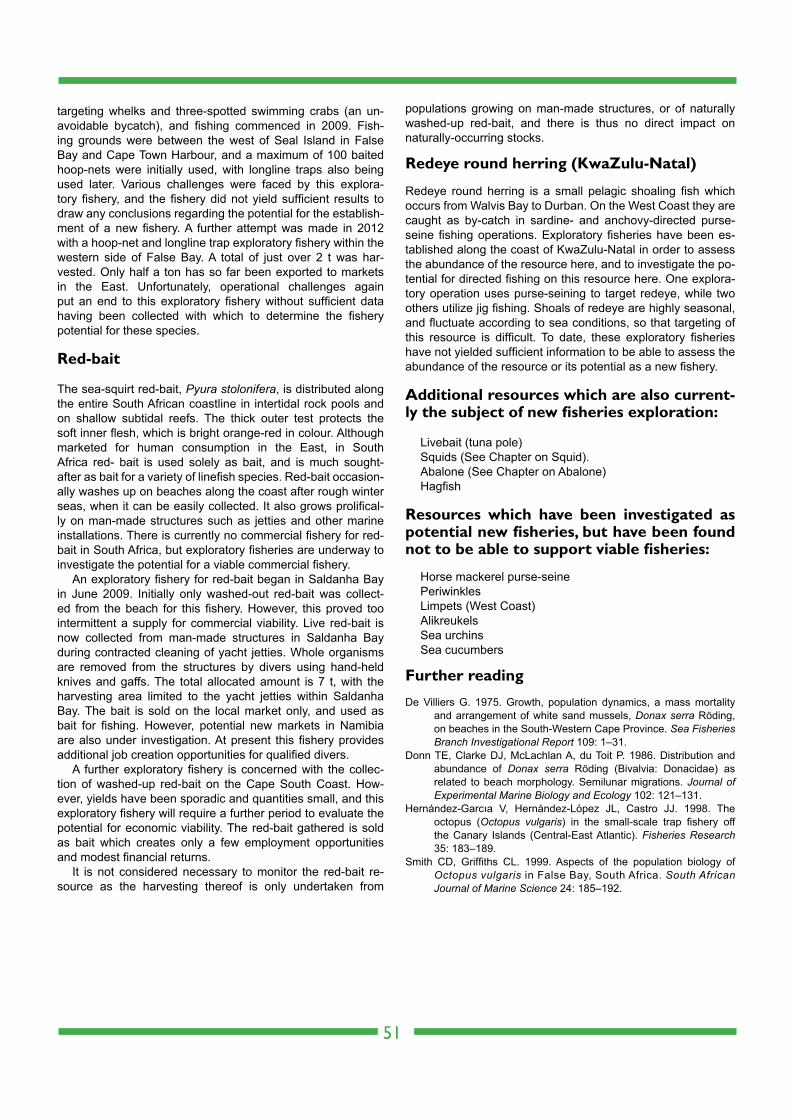
targeting whelks and three-spotted swimming crabs (an un-avoidable bycatch), and fishing commenced in 2009. Fish-ing grounds were between the west of Seal Island in False Bay and Cape Town Harbour, and a maximum of 100 baited hoop-nets were initially used, with longline traps also being used later. Various challenges were faced by this explora-tory fishery, and the fishery did not yield sufficient results to draw any conclusions regarding the potential for the establish-ment of a new fishery. A further attempt was made in 2012 with a hoop-net and longline trap exploratory fishery within the western side of False Bay. A total of just over 2 t was har-vested. Only half a ton has so far been exported to markets in the East. Unfortunately, operational challenges again put an end to this exploratory fishery without sufficient data having been collected with which to determine the fishery potential for these species.
Red-bait
The sea-squirt red-bait, Pyura stolonifera, is distributed along the entire South African coastline in intertidal rock pools and on shallow subtidal reefs. The thick outer test protects the soft inner flesh, which is bright orange-red in colour. Although marketed for human consumption in the East, in South Africa red- bait is used solely as bait, and is much sought- after as bait for a variety of linefish species. Red-bait occasion-ally washes up on beaches along the coast after rough winter seas, when it can be easily collected. It also grows prolifical-ly on man-made structures such as jetties and other marine installations. There is currently no commercial fishery for red-bait in South Africa, but exploratory fisheries are underway to investigate the potential for a viable commercial fishery.
An exploratory fishery for red-bait began in Saldanha Bay in June 2009. Initially only washed-out red-bait was collect-ed from the beach for this fishery. However, this proved too intermittent a supply for commercial viability. Live red-bait is now collected from man-made structures in Saldanha Bay during contracted cleaning of yacht jetties. Whole organisms are removed from the structures by divers using hand-held knives and gaffs. The total allocated amount is 7 t, with the harvesting area limited to the yacht jetties within Saldanha Bay. The bait is sold on the local market only, and used as bait for fishing. However, potential new markets in Namibia are also under investigation. At present this fishery provides additional job creation opportunities for qualified divers.
A further exploratory fishery is concerned with the collec-tion of washed-up red-bait on the Cape South Coast. How-ever, yields have been sporadic and quantities small, and this exploratory fishery will require a further period to evaluate the potential for economic viability. The red-bait gathered is sold as bait which creates only a few employment opportunities and modest financial returns.
It is not considered necessary to monitor the red-bait re-source as the harvesting thereof is only undertaken from
populations growing on man-made structures, or of naturally washed-up red-bait, and there is thus no direct impact on naturally-occurring stocks.
Redeye round herring (KwaZulu-Natal)
Redeye round herring is a small pelagic shoaling fish which occurs from Walvis Bay to Durban. On the West Coast they are caught as by-catch in sardine- and anchovy-directed purse-seine fishing operations. Exploratory fisheries have been es-tablished along the coast of KwaZulu-Natal in order to assess the abundance of the resource here, and to investigate the po-tential for directed fishing on this resource here. One explora-tory operation uses purse-seining to target redeye, while two others utilize jig fishing. Shoals of redeye are highly seasonal, and fluctuate according to sea conditions, so that targeting of this resource is difficult. To date, these exploratory fisheries have not yielded sufficient information to be able to assess the abundance of the resource or its potential as a new fishery.
Additional resources which are also current-ly the subject of new fisheries exploration:
Livebait (tuna pole)Squids (See Chapter on Squid).Abalone (See Chapter on Abalone)Hagfish
Resources which have been investigated as potential new fisheries, but have been found not to be able to support viable fisheries:
Horse mackerel purse-seinePeriwinklesLimpets (West Coast)AlikreukelsSea urchinsSea cucumbers
Further reading
De Villiers G. 1975. Growth, population dynamics, a mass mortality and arrangement of white sand mussels, Donax serra Röding, on beaches in the South-Western Cape Province. Sea Fisheries Branch Investigational Report 109: 1–31.
Donn TE, Clarke DJ, McLachlan A, du Toit P. 1986. Distribution and abundance of Donax serra Röding (Bivalvia: Donacidae) as related to beach morphology. Semilunar migrations. Journal of Experimental Marine Biology and Ecology 102: 121–131.
Hernández-Garcıa V, Hernández-López JL, Castro JJ. 1998. The octopus (Octopus vulgaris) in the small-scale trap fishery off the Canary Islands (Central-East Atlantic). Fisheries Research 35: 183–189.
Smith CD, Griffiths CL. 1999. Aspects of the population biology of Octopus vulgaris in False Bay, South Africa. South African Journal of Marine Science 24: 185–192.
51
Introduction
Off the coast of South Africa, small pelagic forage fish con-sisting predominantly of anchovy Engraulis encrasicolus, sar-dine Sardinops sagax and redeye round herring Etrumeus whiteheadi generally account for more than 90% of the to-tal pelagic purse-seine catch. Forage fish are usually found in the continental shelf waters between Hondeklip Bay on the West Coast and Durban on the East Coast. They gener-ally exhibit schooling behaviour, have a small body size with rapid growth rates, have short life spans and exhibit strong population responses to environmental variability, which re-sults in large natural fluctuations in abundance over space and time. Long-term changes in the relative abundance of anchovy and sardine, over decadal and centennial time scales, have been observed both locally and worldwide. These species alternations are generally associated with vari-
ability in the recruitment of both species, owing to changing environmental factors that affect, amongst others, transport of eggs and larvae and feeding conditions.
Pelagic fish resources are important to the country for sev-eral reasons. Firstly, the purse-seine fishery in which they are caught is South Africa’s largest fishery (in terms of landed mass) and second only to the hake fishery in terms of value. Secondly, pelagic fish are an important and high-quality source of protein. Anchovy and round herring are mostly reduced to fish meal and oil in industrial-scale factories and used as a protein supplement in agri- or aqua-feeds. Sardine is mainly canned for human and pet consumption, with a small amount packed whole for bait or as cutlets for human consumption. Thirdly, the pelagic fishery employs a large workforce in fishing and related industries. Finally, pelagic fish occupy a key position in the marine food web where they are the link that transfers energy produced by plankton to large-bodied predatory fish, seabirds, and marine mammals. Because many animals and humans depend on forage fish, it is impor-tant to manage the fishery that targets them in a manner that accounts for their high degree of variability and importance to the ecosystem. This is so because of the potentially severe risks of local depletion of forage fish for dependent species such as seabirds, particularly in years of low fish abundance in certain areas.
The primary approach that has been used to limit catches of forage fish is rights-based management with a specified annual Total Allowable Catch (TAC). Incorporation of ecosys-tem considerations and the development of ecosystem-based management is being under taken through the revised Op-erational Management Procedure (OMP-13) currently being developed. In revising the OMP, additional performance sta-tistics related to several ecosystem objectives under different harvest strategies will be evaluated, over and above those re-lated to resource risk and average catch. Central to the new
52
Small pelagic fish (sardine, anchovy and round herring)
Stock status Abundant Optimal Depleted Heavily depletedUnknown
Fishing pressure Light Optimal Heavy
AnchovyRedeye round
herring
Sardine
Sardine
UnknownAnchovy
Redeye round herring
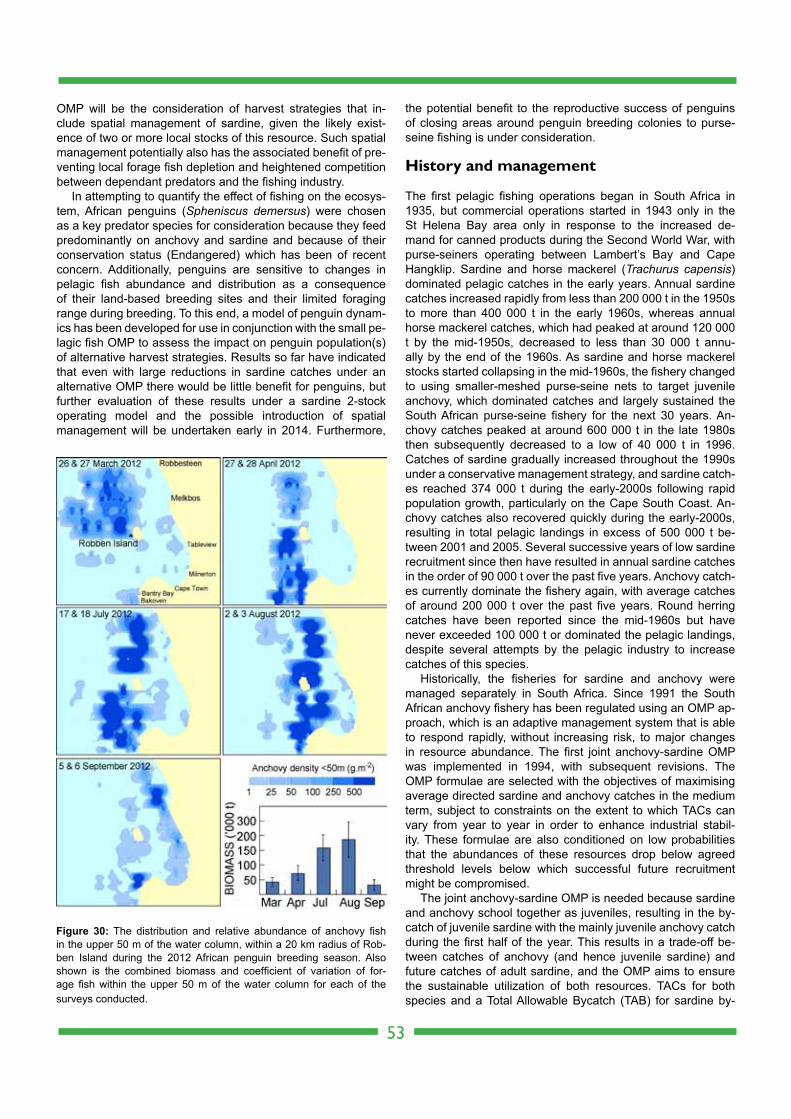
OMP will be the consideration of harvest strategies that in- clude spatial management of sardine, given the likely exist-ence of two or more local stocks of this resource. Such spatial management potentially also has the associated benefit of pre-venting local forage fish depletion and heightened competition between dependant predators and the fishing industry.
In attempting to quantify the effect of fishing on the ecosys-tem, African penguins (Spheniscus demersus) were chosen as a key predator species for consideration because they feed predominantly on anchovy and sardine and because of their conservation status (Endangered) which has been of recent concern. Additionally, penguins are sensitive to changes in pelagic fish abundance and distribution as a consequence of their land-based breeding sites and their limited foraging range during breeding. To this end, a model of penguin dynam-ics has been developed for use in conjunction with the small pe-lagic fish OMP to assess the impact on penguin population(s) of alternative harvest strategies. Results so far have indicated that even with large reductions in sardine catches under an alternative OMP there would be little benefit for penguins, but further evaluation of these results under a sardine 2-stock operating model and the possible introduction of spatial management will be undertaken early in 2014. Furthermore,
the potential benefit to the reproductive success of penguins of closing areas around penguin breeding colonies to purse-seine fishing is under consideration.
History and management
The first pelagic fishing operations began in South Africa in 1935, but commercial operations started in 1943 only in the St Helena Bay area only in response to the increased de-mand for canned products during the Second World War, with purse-seiners operating between Lambert’s Bay and Cape Hangklip. Sardine and horse mackerel (Trachurus capensis) dominated pelagic catches in the early years. Annual sardine catches increased rapidly from less than 200 000 t in the 1950s to more than 400 000 t in the early 1960s, whereas annual horse mackerel catches, which had peaked at around 120 000 t by the mid-1950s, decreased to less than 30 000 t annu-ally by the end of the 1960s. As sardine and horse mackerel stocks started collapsing in the mid-1960s, the fishery changed to using smaller-meshed purse-seine nets to target juvenile anchovy, which dominated catches and largely sustained the South African purse-seine fishery for the next 30 years. An-chovy catches peaked at around 600 000 t in the late 1980s then subsequently decreased to a low of 40 000 t in 1996. Catches of sardine gradually increased throughout the 1990s under a conservative management strategy, and sardine catch-es reached 374 000 t during the early-2000s following rapid population growth, particularly on the Cape South Coast. An-chovy catches also recovered quickly during the early-2000s, resulting in total pelagic landings in excess of 500 000 t be-tween 2001 and 2005. Several successive years of low sardine recruitment since then have resulted in annual sardine catches in the order of 90 000 t over the past five years. Anchovy catch-es currently dominate the fishery again, with average catches of around 200 000 t over the past five years. Round herring catches have been reported since the mid-1960s but have never exceeded 100 000 t or dominated the pelagic landings, despite several attempts by the pelagic industry to increase catches of this species.
Historically, the fisheries for sardine and anchovy were managed separately in South Africa. Since 1991 the South African anchovy fishery has been regulated using an OMP ap-proach, which is an adaptive management system that is able to respond rapidly, without increasing risk, to major changes in resource abundance. The first joint anchovy-sardine OMP was implemented in 1994, with subsequent revisions. The OMP formulae are selected with the objectives of maximising average directed sardine and anchovy catches in the medium term, subject to constraints on the extent to which TACs can vary from year to year in order to enhance industrial stabil-ity. These formulae are also conditioned on low probabilities that the abundances of these resources drop below agreed threshold levels below which successful future recruitment might be compromised.
The joint anchovy-sardine OMP is needed because sardine and anchovy school together as juveniles, resulting in the by-catch of juvenile sardine with the mainly juvenile anchovy catch during the first half of the year. This results in a trade-off be-tween catches of anchovy (and hence juvenile sardine) and future catches of adult sardine, and the OMP aims to ensure the sustainable utilization of both resources. TACs for both species and a Total Allowable Bycatch (TAB) for sardine by-
53
Figure 30: The distribution and relative abundance of anchovy fish in the upper 50 m of the water column, within a 20 km radius of Rob-ben Island during the 2012 African penguin breeding season. Also shown is the combined biomass and coefficient of variation of for-age fish within the upper 50 m of the water column for each of the surveys conducted.
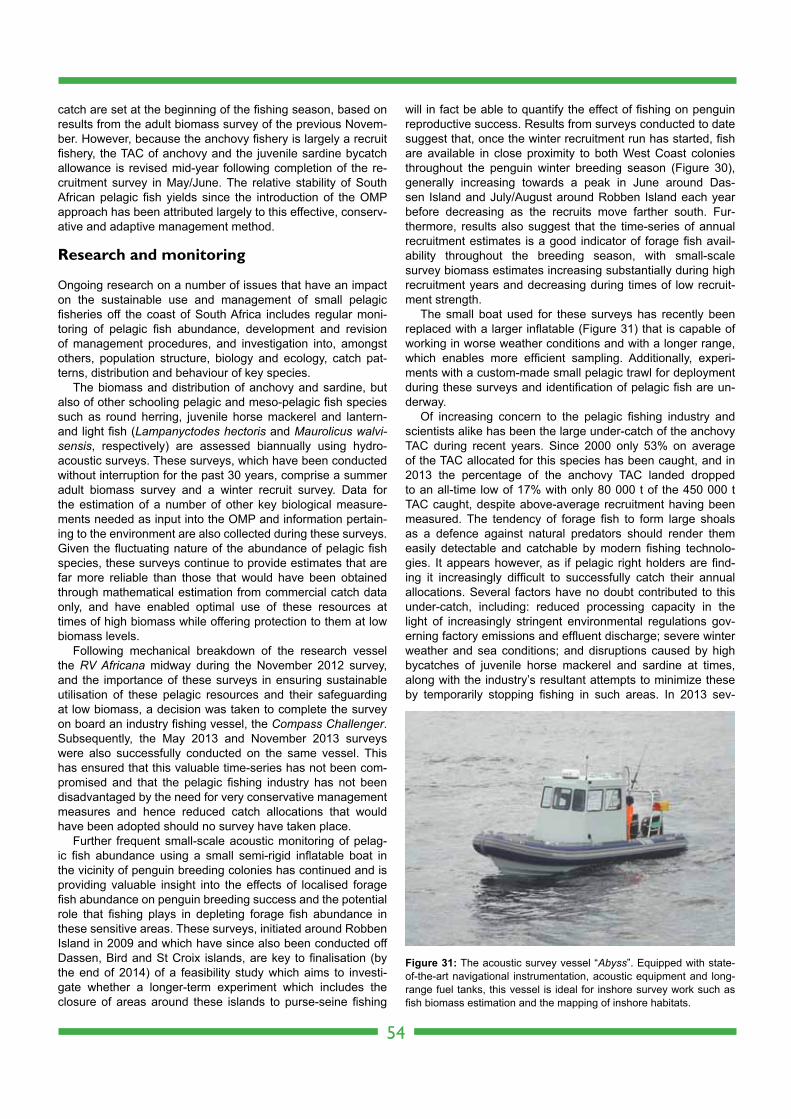
catch are set at the beginning of the fishing season, based on results from the adult biomass survey of the previous Novem-ber. However, because the anchovy fishery is largely a recruit fishery, the TAC of anchovy and the juvenile sardine bycatch allowance is revised mid-year following completion of the re-cruitment survey in May/June. The relative stability of South African pelagic fish yields since the introduction of the OMP approach has been attributed largely to this effective, conserv-ative and adaptive management method.
Research and monitoring
Ongoing research on a number of issues that have an impact on the sustainable use and management of small pelagic fisheries off the coast of South Africa includes regular moni-toring of pelagic fish abundance, development and revision of management procedures, and investigation into, amongst others, population structure, biology and ecology, catch pat-terns, distribution and behaviour of key species.
The biomass and distribution of anchovy and sardine, but also of other schooling pelagic and meso-pelagic fish species such as round herring, juvenile horse mackerel and lantern- and light fish (Lampanyctodes hectoris and Maurolicus walvi-sensis, respectively) are assessed biannually using hydro-acoustic surveys. These surveys, which have been conducted without interruption for the past 30 years, comprise a summer adult biomass survey and a winter recruit survey. Data for the estimation of a number of other key biological measure-ments needed as input into the OMP and information pertain-ing to the environment are also collected during these surveys. Given the fluctuating nature of the abundance of pelagic fish species, these surveys continue to provide estimates that are far more reliable than those that would have been obtained through mathematical estimation from commercial catch data only, and have enabled optimal use of these resources at times of high biomass while offering protection to them at low biomass levels.
Following mechanical breakdown of the research vessel the RV Africana midway during the November 2012 survey, and the importance of these surveys in ensuring sustainable utilisation of these pelagic resources and their safeguarding at low biomass, a decision was taken to complete the survey on board an industry fishing vessel, the Compass Challenger. Subsequently, the May 2013 and November 2013 surveys were also successfully conducted on the same vessel. This has ensured that this valuable time-series has not been com-promised and that the pelagic fishing industry has not been disadvantaged by the need for very conservative management measures and hence reduced catch allocations that would have been adopted should no survey have taken place.
Further frequent small-scale acoustic monitoring of pelag-ic fish abundance using a small semi-rigid inflatable boat in the vicinity of penguin breeding colonies has continued and is providing valuable insight into the effects of localised forage fish abundance on penguin breeding success and the potential role that fishing plays in depleting forage fish abundance in these sensitive areas. These surveys, initiated around Robben Island in 2009 and which have since also been conducted off Dassen, Bird and St Croix islands, are key to finalisation (by the end of 2014) of a feasibility study which aims to investi- gate whether a longer-term experiment which includes the closure of areas around these islands to purse-seine fishing
will in fact be able to quantify the effect of fishing on penguin reproductive success. Results from surveys conducted to date suggest that, once the winter recruitment run has started, fish are available in close proximity to both West Coast colonies throughout the penguin winter breeding season (Figure 30), generally increasing towards a peak in June around Das-sen Island and July/August around Robben Island each year before decreasing as the recruits move farther south. Fur-thermore, results also suggest that the time-series of annual recruitment estimates is a good indicator of forage fish avail-ability throughout the breeding season, with small-scale survey biomass estimates increasing substantially during high recruitment years and decreasing during times of low recruit-ment strength.
The small boat used for these surveys has recently been replaced with a larger inflatable (Figure 31) that is capable of working in worse weather conditions and with a longer range, which enables more efficient sampling. Additionally, experi-ments with a custom-made small pelagic trawl for deployment during these surveys and identification of pelagic fish are un-derway.
Of increasing concern to the pelagic fishing industry and scientists alike has been the large under-catch of the anchovy TAC during recent years. Since 2000 only 53% on average of the TAC allocated for this species has been caught, and in 2013 the percentage of the anchovy TAC landed dropped to an all-time low of 17% with only 80 000 t of the 450 000 t TAC caught, despite above-average recruitment having been measured. The tendency of forage fish to form large shoals as a defence against natural predators should render them easily detectable and catchable by modern fishing technolo-gies. It appears however, as if pelagic right holders are find-ing it increasingly difficult to successfully catch their annual allocations. Several factors have no doubt contributed to this under-catch, including: reduced processing capacity in the light of increasingly stringent environmental regulations gov-erning factory emissions and effluent discharge; severe winter weather and sea conditions; and disruptions caused by high bycatches of juvenile horse mackerel and sardine at times, along with the industry’s resultant attempts to minimize these by temporarily stopping fishing in such areas. In 2013 sev-
54
Figure 31: The acoustic survey vessel “Abyss”. Equipped with state-of-the-art navigational instrumentation, acoustic equipment and long-range fuel tanks, this vessel is ideal for inshore survey work such as fish biomass estimation and the mapping of inshore habitats.
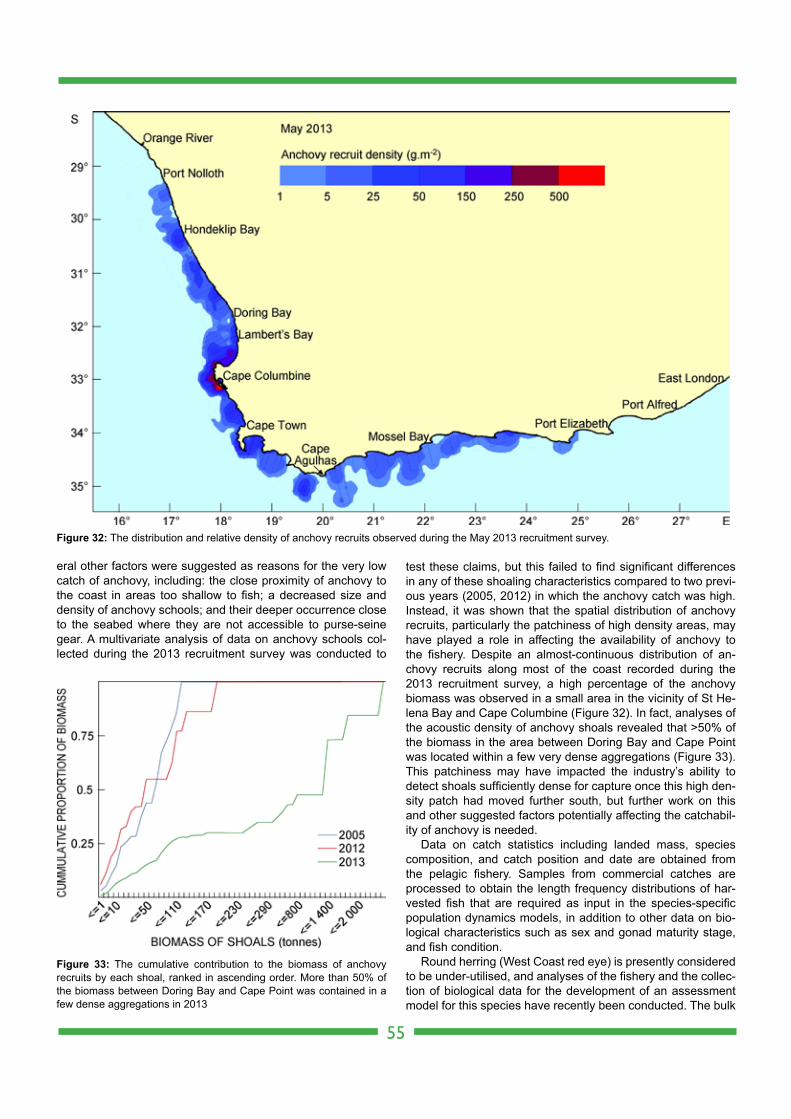
test these claims, but this failed to find significant differences in any of these shoaling characteristics compared to two previ-ous years (2005, 2012) in which the anchovy catch was high. Instead, it was shown that the spatial distribution of anchovy recruits, particularly the patchiness of high density areas, may have played a role in affecting the availability of anchovy to the fishery. Despite an almost-continuous distribution of an-chovy recruits along most of the coast recorded during the 2013 recruitment survey, a high percentage of the anchovy biomass was observed in a small area in the vicinity of St He-lena Bay and Cape Columbine (Figure 32). In fact, analyses of the acoustic density of anchovy shoals revealed that >50% of the biomass in the area between Doring Bay and Cape Point was located within a few very dense aggregations (Figure 33). This patchiness may have impacted the industry’s ability to detect shoals sufficiently dense for capture once this high den-sity patch had moved further south, but further work on this and other suggested factors potentially affecting the catchabil-ity of anchovy is needed.
Data on catch statistics including landed mass, species composition, and catch position and date are obtained from the pelagic fishery. Samples from commercial catches are processed to obtain the length frequency distributions of har-vested fish that are required as input in the species-specific population dynamics models, in addition to other data on bio-logical characteristics such as sex and gonad maturity stage, and fish condition.
Round herring (West Coast red eye) is presently considered to be under-utilised, and analyses of the fishery and the collec-tion of biological data for the development of an assessment model for this species have recently been conducted. The bulk
eral other factors were suggested as reasons for the very low catch of anchovy, including: the close proximity of anchovy to the coast in areas too shallow to fish; a decreased size and density of anchovy schools; and their deeper occurrence close to the seabed where they are not accessible to purse-seine gear. A multivariate analysis of data on anchovy schools col-lected during the 2013 recruitment survey was conducted to
55
Figure 32: The distribution and relative density of anchovy recruits observed during the May 2013 recruitment survey.
Figure 33: The cumulative contribution to the biomass of anchovy recruits by each shoal, ranked in ascending order. More than 50% of the biomass between Doring Bay and Cape Point was contained in a few dense aggregations in 2013
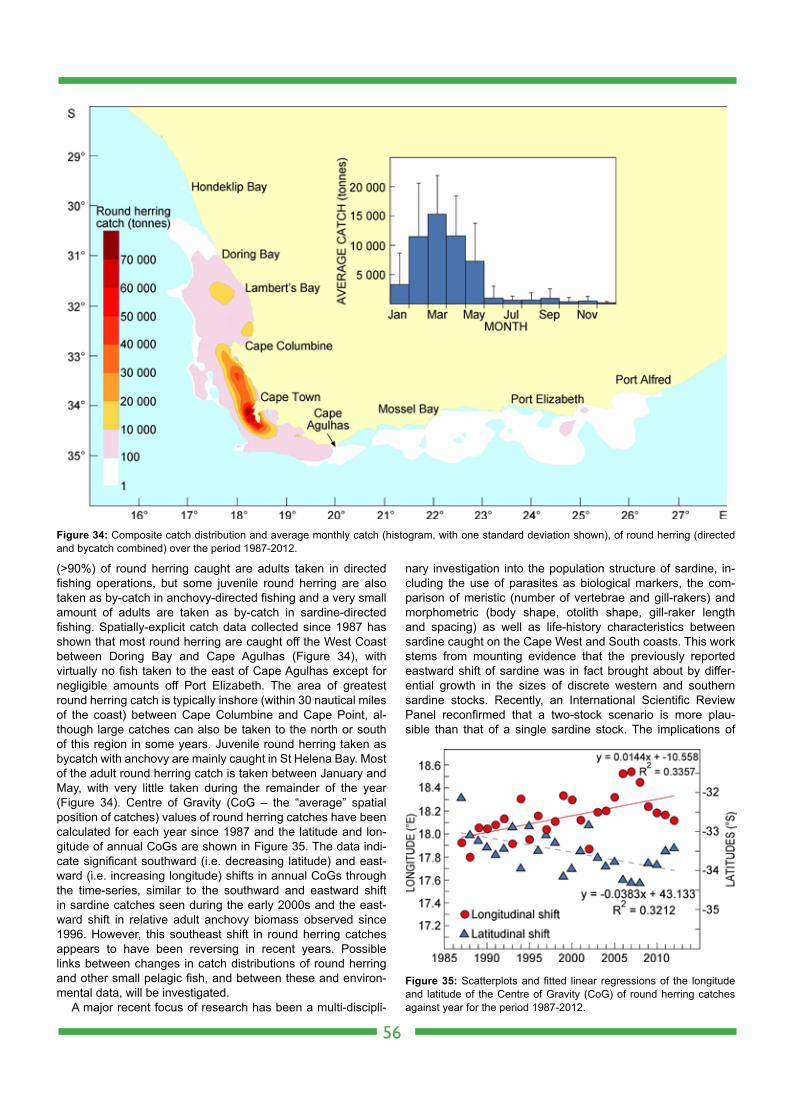
1
(>90%) of round herring caught are adults taken in directed fishing operations, but some juvenile round herring are also taken as by-catch in anchovy-directed fishing and a very small amount of adults are taken as by-catch in sardine-directed fishing. Spatially-explicit catch data collected since 1987 has shown that most round herring are caught off the West Coast between Doring Bay and Cape Agulhas (Figure 34), with virtually no fish taken to the east of Cape Agulhas except for negligible amounts off Port Elizabeth. The area of greatest round herring catch is typically inshore (within 30 nautical miles of the coast) between Cape Columbine and Cape Point, al-though large catches can also be taken to the north or south of this region in some years. Juvenile round herring taken as bycatch with anchovy are mainly caught in St Helena Bay. Most of the adult round herring catch is taken between January and May, with very little taken during the remainder of the year (Figure 34). Centre of Gravity (CoG – the “average” spatial position of catches) values of round herring catches have been calculated for each year since 1987 and the latitude and lon-gitude of annual CoGs are shown in Figure 35. The data indi-cate significant southward (i.e. decreasing latitude) and east-ward (i.e. increasing longitude) shifts in annual CoGs through the time-series, similar to the southward and eastward shift in sardine catches seen during the early 2000s and the east-ward shift in relative adult anchovy biomass observed since 1996. However, this southeast shift in round herring catches appears to have been reversing in recent years. Possible links between changes in catch distributions of round herring and other small pelagic fish, and between these and environ- mental data, will be investigated.
A major recent focus of research has been a multi-discipli-
nary investigation into the population structure of sardine, in-cluding the use of parasites as biological markers, the com-parison of meristic (number of vertebrae and gill-rakers) and morphometric (body shape, otolith shape, gill-raker length and spacing) as well as life-history characteristics between sardine caught on the Cape West and South coasts. This work stems from mounting evidence that the previously reported eastward shift of sardine was in fact brought about by differ-ential growth in the sizes of discrete western and southern sardine stocks. Recently, an International Scientific Review Panel reconfirmed that a two-stock scenario is more plau-sible than that of a single sardine stock. The implications of
56
Figure 34: Composite catch distribution and average monthly catch (histogram, with one standard deviation shown), of round herring (directed and bycatch combined) over the period 1987-2012.
Figure 35: Scatterplots and fitted linear regressions of the longitude and latitude of the Centre of Gravity (CoG) of round herring catches against year for the period 1987-2012.
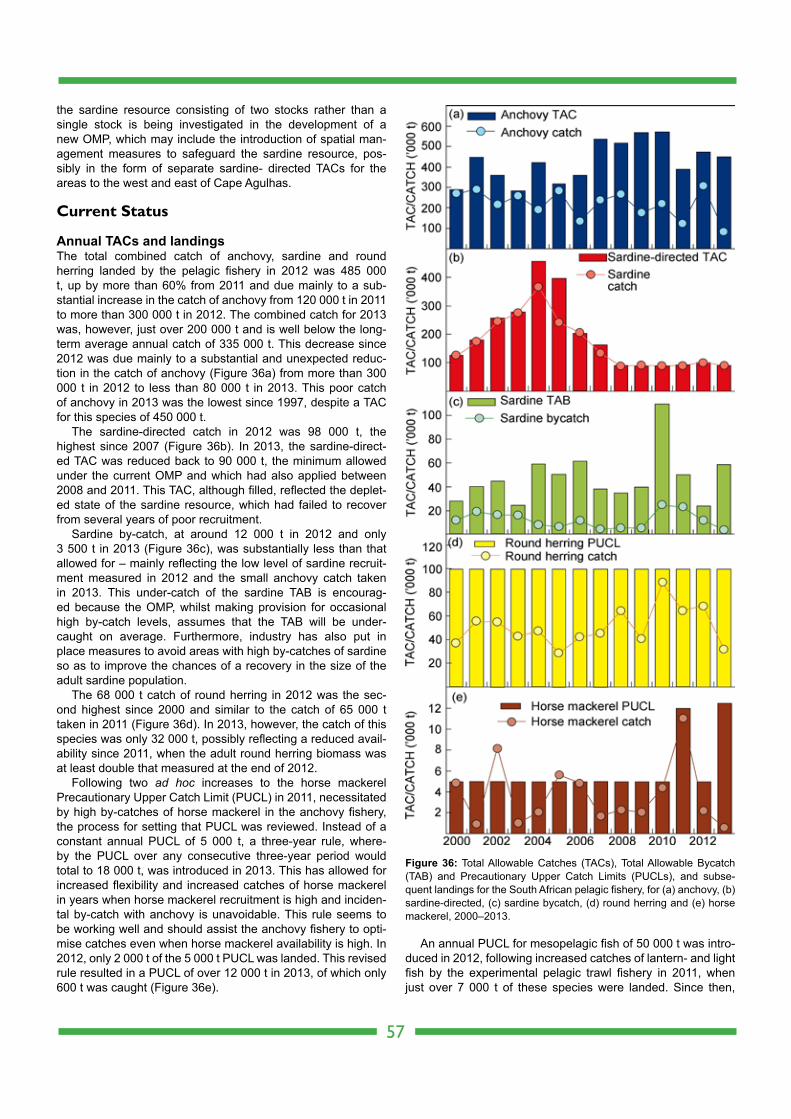
1
the sardine resource consisting of two stocks rather than a single stock is being investigated in the development of a new OMP, which may include the introduction of spatial man-agement measures to safeguard the sardine resource, pos-sibly in the form of separate sardine- directed TACs for the areas to the west and east of Cape Agulhas.
Current Status
Annual TACs and landingsThe total combined catch of anchovy, sardine and round herring landed by the pelagic fishery in 2012 was 485 000 t, up by more than 60% from 2011 and due mainly to a sub- stantial increase in the catch of anchovy from 120 000 t in 2011 to more than 300 000 t in 2012. The combined catch for 2013 was, however, just over 200 000 t and is well below the long-term average annual catch of 335 000 t. This decrease since 2012 was due mainly to a substantial and unexpected reduc-tion in the catch of anchovy (Figure 36a) from more than 300 000 t in 2012 to less than 80 000 t in 2013. This poor catch of anchovy in 2013 was the lowest since 1997, despite a TAC for this species of 450 000 t.
The sardine-directed catch in 2012 was 98 000 t, the highest since 2007 (Figure 36b). In 2013, the sardine-direct-ed TAC was reduced back to 90 000 t, the minimum allowed under the current OMP and which had also applied between 2008 and 2011. This TAC, although filled, reflected the deplet-ed state of the sardine resource, which had failed to recover from several years of poor recruitment.
Sardine by-catch, at around 12 000 t in 2012 and only 3 500 t in 2013 (Figure 36c), was substantially less than that allowed for – mainly reflecting the low level of sardine recruit-ment measured in 2012 and the small anchovy catch taken in 2013. This under-catch of the sardine TAB is encourag- ed because the OMP, whilst making provision for occasional high by-catch levels, assumes that the TAB will be under-caught on average. Furthermore, industry has also put in place measures to avoid areas with high by-catches of sardine so as to improve the chances of a recovery in the size of the adult sardine population.
The 68 000 t catch of round herring in 2012 was the sec-ond highest since 2000 and similar to the catch of 65 000 t taken in 2011 (Figure 36d). In 2013, however, the catch of this species was only 32 000 t, possibly reflecting a reduced avail- ability since 2011, when the adult round herring biomass was at least double that measured at the end of 2012.
Following two ad hoc increases to the horse mackerel Precautionary Upper Catch Limit (PUCL) in 2011, necessitated by high by-catches of horse mackerel in the anchovy fishery, the process for setting that PUCL was reviewed. Instead of a constant annual PUCL of 5 000 t, a three-year rule, where-by the PUCL over any consecutive three-year period would total to 18 000 t, was introduced in 2013. This has allowed for increased flexibility and increased catches of horse mackerel in years when horse mackerel recruitment is high and inciden-tal by-catch with anchovy is unavoidable. This rule seems to be working well and should assist the anchovy fishery to opti-mise catches even when horse mackerel availability is high. In 2012, only 2 000 t of the 5 000 t PUCL was landed. This revised rule resulted in a PUCL of over 12 000 t in 2013, of which only 600 t was caught (Figure 36e).
An annual PUCL for mesopelagic fish of 50 000 t was intro-duced in 2012, following increased catches of lantern- and light fish by the experimental pelagic trawl fishery in 2011, when just over 7 000 t of these species were landed. Since then,
57
Figure 36: Total Allowable Catches (TACs), Total Allowable Bycatch (TAB) and Precautionary Upper Catch Limits (PUCLs), and subse-quent landings for the South African pelagic fishery, for (a) anchovy, (b) sardine-directed, (c) sardine bycatch, (d) round herring and (e) horse mackerel, 2000–2013.
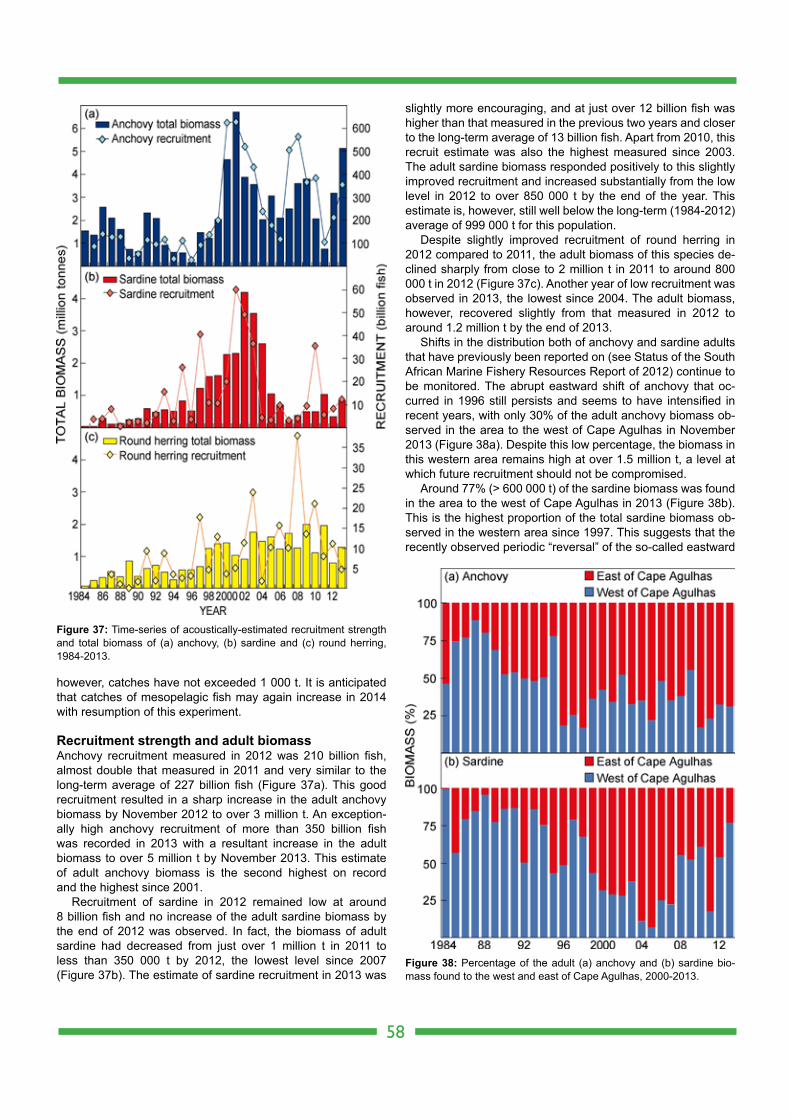
1
however, catches have not exceeded 1 000 t. It is anticipated that catches of mesopelagic fish may again increase in 2014 with resumption of this experiment.
Recruitment strength and adult biomassAnchovy recruitment measured in 2012 was 210 billion fish, almost double that measured in 2011 and very similar to the long-term average of 227 billion fish (Figure 37a). This good recruitment resulted in a sharp increase in the adult anchovy biomass by November 2012 to over 3 million t. An exception-ally high anchovy recruitment of more than 350 billion fish was recorded in 2013 with a resultant increase in the adult biomass to over 5 million t by November 2013. This estimate of adult anchovy biomass is the second highest on record and the highest since 2001.
Recruitment of sardine in 2012 remained low at around 8 billion fish and no increase of the adult sardine biomass by the end of 2012 was observed. In fact, the biomass of adult sardine had decreased from just over 1 million t in 2011 to less than 350 000 t by 2012, the lowest level since 2007 (Figure 37b). The estimate of sardine recruitment in 2013 was
slightly more encouraging, and at just over 12 billion fish was higher than that measured in the previous two years and closer to the long-term average of 13 billion fish. Apart from 2010, this recruit estimate was also the highest measured since 2003. The adult sardine biomass responded positively to this slightly improved recruitment and increased substantially from the low level in 2012 to over 850 000 t by the end of the year. This estimate is, however, still well below the long-term (1984-2012) average of 999 000 t for this population.
Despite slightly improved recruitment of round herring in 2012 compared to 2011, the adult biomass of this species de-clined sharply from close to 2 million t in 2011 to around 800 000 t in 2012 (Figure 37c). Another year of low recruitment was observed in 2013, the lowest since 2004. The adult biomass, however, recovered slightly from that measured in 2012 to around 1.2 million t by the end of 2013.
Shifts in the distribution both of anchovy and sardine adults that have previously been reported on (see Status of the South African Marine Fishery Resources Report of 2012) continue to be monitored. The abrupt eastward shift of anchovy that oc-curred in 1996 still persists and seems to have intensified in recent years, with only 30% of the adult anchovy biomass ob-served in the area to the west of Cape Agulhas in November 2013 (Figure 38a). Despite this low percentage, the biomass in this western area remains high at over 1.5 million t, a level at which future recruitment should not be compromised.
Around 77% (> 600 000 t) of the sardine biomass was found in the area to the west of Cape Agulhas in 2013 (Figure 38b). This is the highest proportion of the total sardine biomass ob-served in the western area since 1997. This suggests that the recently observed periodic “reversal” of the so-called eastward
58
Figure 38: Percentage of the adult (a) anchovy and (b) sardine bio-mass found to the west and east of Cape Agulhas, 2000-2013.
Figure 37: Time-series of acoustically-estimated recruitment strength and total biomass of (a) anchovy, (b) sardine and (c) round herring, 1984-2013.
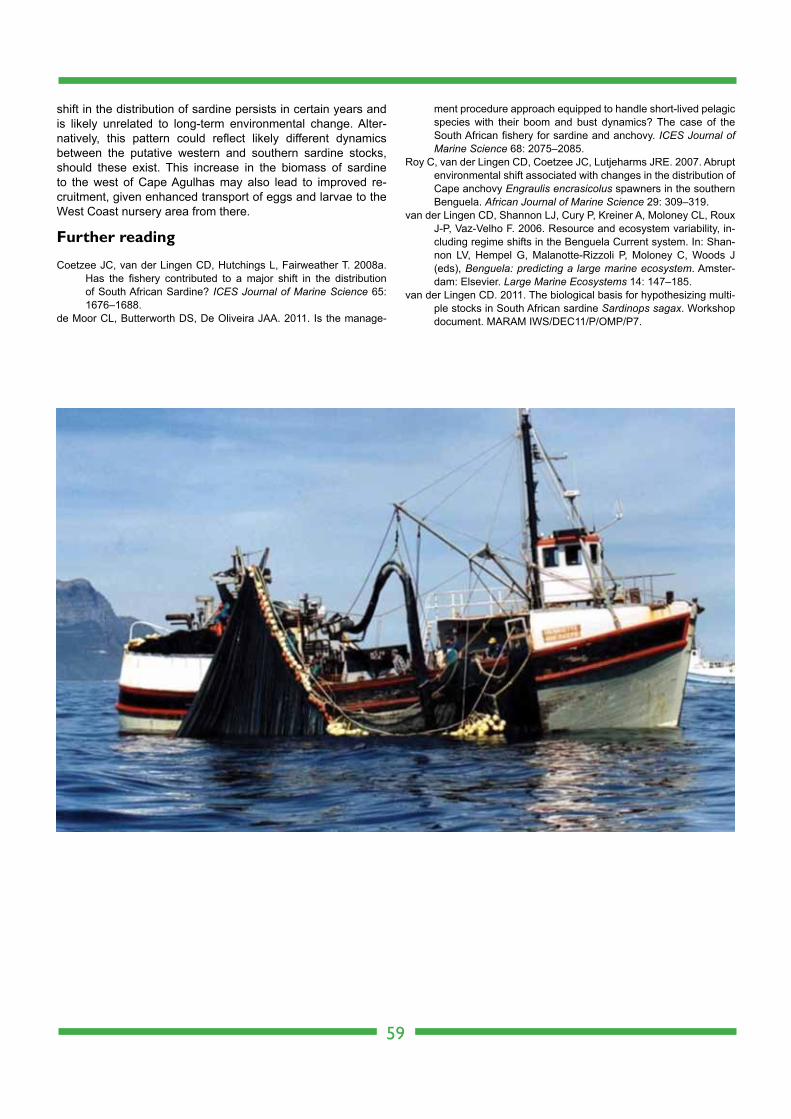
1
shift in the distribution of sardine persists in certain years and is likely unrelated to long-term environmental change. Alter-natively, this pattern could reflect likely different dynamics between the putative western and southern sardine stocks, should these exist. This increase in the biomass of sardine to the west of Cape Agulhas may also lead to improved re-cruitment, given enhanced transport of eggs and larvae to the West Coast nursery area from there.
Further reading
Coetzee JC, van der Lingen CD, Hutchings L, Fairweather T. 2008a. Has the fishery contributed to a major shift in the distribution of South African Sardine? ICES Journal of Marine Science 65: 1676–1688.
de Moor CL, Butterworth DS, De Oliveira JAA. 2011. Is the manage-
ment procedure approach equipped to handle short-lived pelagic species with their boom and bust dynamics? The case of the South African fishery for sardine and anchovy. ICES Journal of Marine Science 68: 2075–2085.
Roy C, van der Lingen CD, Coetzee JC, Lutjeharms JRE. 2007. Abrupt environmental shift associated with changes in the distribution of Cape anchovy Engraulis encrasicolus spawners in the southern Benguela. African Journal of Marine Science 29: 309–319.
van der Lingen CD, Shannon LJ, Cury P, Kreiner A, Moloney CL, Roux J-P, Vaz-Velho F. 2006. Resource and ecosystem variability, in-cluding regime shifts in the Benguela Current system. In: Shan-non LV, Hempel G, Malanotte-Rizzoli P, Moloney C, Woods J (eds), Benguela: predicting a large marine ecosystem. Amster-dam: Elsevier. Large Marine Ecosystems 14: 147–185.
van der Lingen CD. 2011. The biological basis for hypothesizing multi-ple stocks in South African sardine Sardinops sagax. Workshop document. MARAM IWS/DEC11/P/OMP/P7.
59
1
Introduction
South Coast rock lobsters (Palinurus gilchristi) are endemic to the southern coast of South Africa, where they occur on rocky substrata at depths of 50-200 m. The fishery operates between East London and Cape Point and up to 250 km off-shore along the outer edge of the Agulhas Bank, and fish-ing gear is restricted to longlines with traps. It is the second largest rock lobster fishery in South Africa, and is capital inten-sive, requiring specialized equipment and large ocean-going vessels.
Products (frozen tails, whole or live lobster) are exported to the USA, Europe and the Far East. Sales are affected by seasonal overseas market trends and competition from oth-er lobster-producing countries. High prices on international markets and the decline of the Rand to Dollar exchange rate make the sector lucrative. Prices for commodities fluctuate and the sales prices in the USA are currently the equivalent of R440-R600 per kg tail mass.
Longline trap-fishing is labour intensive and as such each boat requires approximately 30 officers and crew. The total sea-going complement of the fleet is about 300 individuals, nearly all previously disadvantaged individuals. In addition to sea-going personnel, the sector employs approximately 100 land-based factory (processing) and administrative person-nel, mostly previously disadvantaged people. The total export value in 2011/2012 was approximately R160 million.
History and Management
The South Coast rock lobster was first described in 1900 and was recorded occasionally in trawler catches for sole at a depth of about 70 m. The commercial fishery commenced in 1974, after the discovery of concentrations of rock lobsters on rocky ground at a depth of around 110 m off Port Elizabeth. Numerous local and foreign fishing vessels converged on the fishing grounds, giving rise to the expansion of the fishery. However, foreign fishing vessels had to withdraw from the fish-ery in 1976, when South Coast rock lobster was recognized as a species occurring wholly within South African waters. From 1977 onwards, the sector operated solely as a local commercial fishery.
The fishery has a management history stretching back to 1974. The fishery was regulated initially by limiting the num-ber of traps permitted per vessel. Catches and catch rates de- clined significantly between 1977 and 1979 (Figure 39). The introduction of management measures such as reduction of effort and catches during the early 1980s resulted in resource recovery (Figures 39 & 40). An annual Total Allowable Catch (TAC) was introduced in 1984, based on the performance of the fishery in the previous years. The TAC and limited entry stabilized the sector until the 1993/94 season (Figure 39), and a more rigorous procedure for stock assessment was devel-oped in 1994.
The fishing season for South Coast rock lobster is year-
60
South Coast rock lobster
Stock status Abundant Optimal Depleted Heavily depletedUnknown
Fishing pressure Light Optimal HeavyUnknown
Figure 39: Annual catches of South Coast rock lobster from 1977-2011.
Figure 40: South Coast rock lobster CPUE by area.
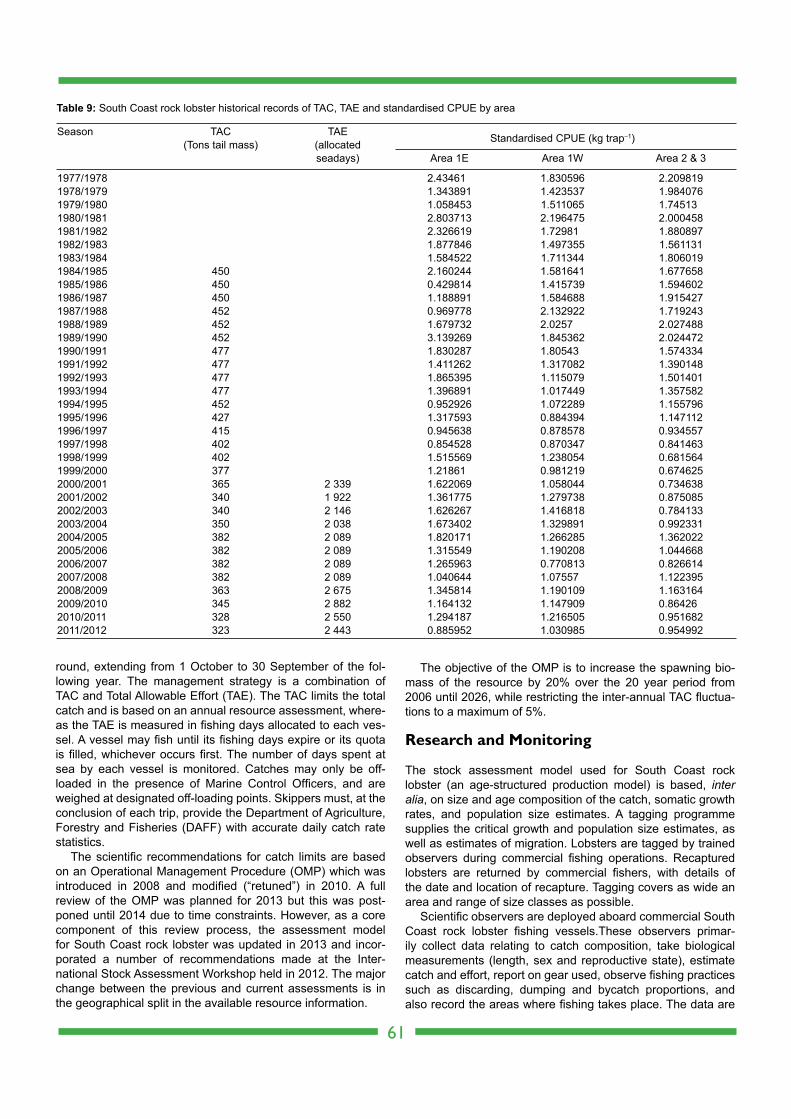
1
round, extending from 1 October to 30 September of the fol-lowing year. The management strategy is a combination of TAC and Total Allowable Effort (TAE). The TAC limits the total catch and is based on an annual resource assessment, where-as the TAE is measured in fishing days allocated to each ves-sel. A vessel may fish until its fishing days expire or its quota is filled, whichever occurs first. The number of days spent at sea by each vessel is monitored. Catches may only be off-loaded in the presence of Marine Control Officers, and are weighed at designated off-loading points. Skippers must, at the conclusion of each trip, provide the Department of Agriculture, Forestry and Fisheries (DAFF) with accurate daily catch rate statistics.
The scientific recommendations for catch limits are based on an Operational Management Procedure (OMP) which was introduced in 2008 and modified (“retuned”) in 2010. A full review of the OMP was planned for 2013 but this was post-poned until 2014 due to time constraints. However, as a core component of this review process, the assessment model for South Coast rock lobster was updated in 2013 and incor-porated a number of recommendations made at the Inter- national Stock Assessment Workshop held in 2012. The major change between the previous and current assessments is in the geographical split in the available resource information.
The objective of the OMP is to increase the spawning bio-mass of the resource by 20% over the 20 year period from 2006 until 2026, while restricting the inter-annual TAC fluctua-tions to a maximum of 5%.
Research and Monitoring
The stock assessment model used for South Coast rock lobster (an age-structured production model) is based, inter alia, on size and age composition of the catch, somatic growth rates, and population size estimates. A tagging programme supplies the critical growth and population size estimates, as well as estimates of migration. Lobsters are tagged by trained observers during commercial fishing operations. Recaptured lobsters are returned by commercial fishers, with details of the date and location of recapture. Tagging covers as wide an area and range of size classes as possible.
Scientific observers are deployed aboard commercial South Coast rock lobster fishing vessels.These observers primar-ily collect data relating to catch composition, take biological measurements (length, sex and reproductive state), estimate catch and effort, report on gear used, observe fishing practices such as discarding, dumping and bycatch proportions, and also record the areas where fishing takes place. The data are
61
Season TAC TAE (Tons tail mass) (allocated Standardised CPUE (kg trap–1)
seadays) Area 1E Area 1W Area 2 & 3
1977/1978 2.43461 1.830596 2.2098191978/1979 1.343891 1.423537 1.984076 1979/1980 1.058453 1.511065 1.74513 1980/1981 2.803713 2.196475 2.0004581981/1982 2.326619 1.72981 1.8808971982/1983 1.877846 1.497355 1.5611311983/1984 1.584522 1.711344 1.8060191984/1985 450 2.160244 1.581641 1.677658 1985/1986 450 0.429814 1.415739 1.594602 1986/1987 450 1.188891 1.584688 1.9154271987/1988 452 0.969778 2.132922 1.7192431988/1989 452 1.679732 2.0257 2.0274881989/1990 452 3.139269 1.845362 2.0244721990/1991 477 1.830287 1.80543 1.5743341991/1992 477 1.411262 1.317082 1.3901481992/1993 477 1.865395 1.115079 1.5014011993/1994 477 1.396891 1.017449 1.3575821994/1995 452 0.952926 1.072289 1.1557961995/1996 427 1.317593 0.884394 1.1471121996/1997 415 0.945638 0.878578 0.9345571997/1998 402 0.854528 0.870347 0.8414631998/1999 402 1.515569 1.238054 0.6815641999/2000 377 1.21861 0.981219 0.6746252000/2001 365 2 339 1.622069 1.058044 0.7346382001/2002 340 1 922 1.361775 1.279738 0.8750852002/2003 340 2 146 1.626267 1.416818 0.7841332003/2004 350 2 038 1.673402 1.329891 0.9923312004/2005 382 2 089 1.820171 1.266285 1.362022 2005/2006 382 2 089 1.315549 1.190208 1.0446682006/2007 382 2 089 1.265963 0.770813 0.8266142007/2008 382 2 089 1.040644 1.07557 1.1223952008/2009 363 2 675 1.345814 1.190109 1.1631642009/2010 345 2 882 1.164132 1.147909 0.864262010/2011 328 2 550 1.294187 1.216505 0.9516822011/2012 323 2 443 0.885952 1.030985 0.954992
Table 9: South Coast rock lobster historical records of TAC, TAE and standardised CPUE by area
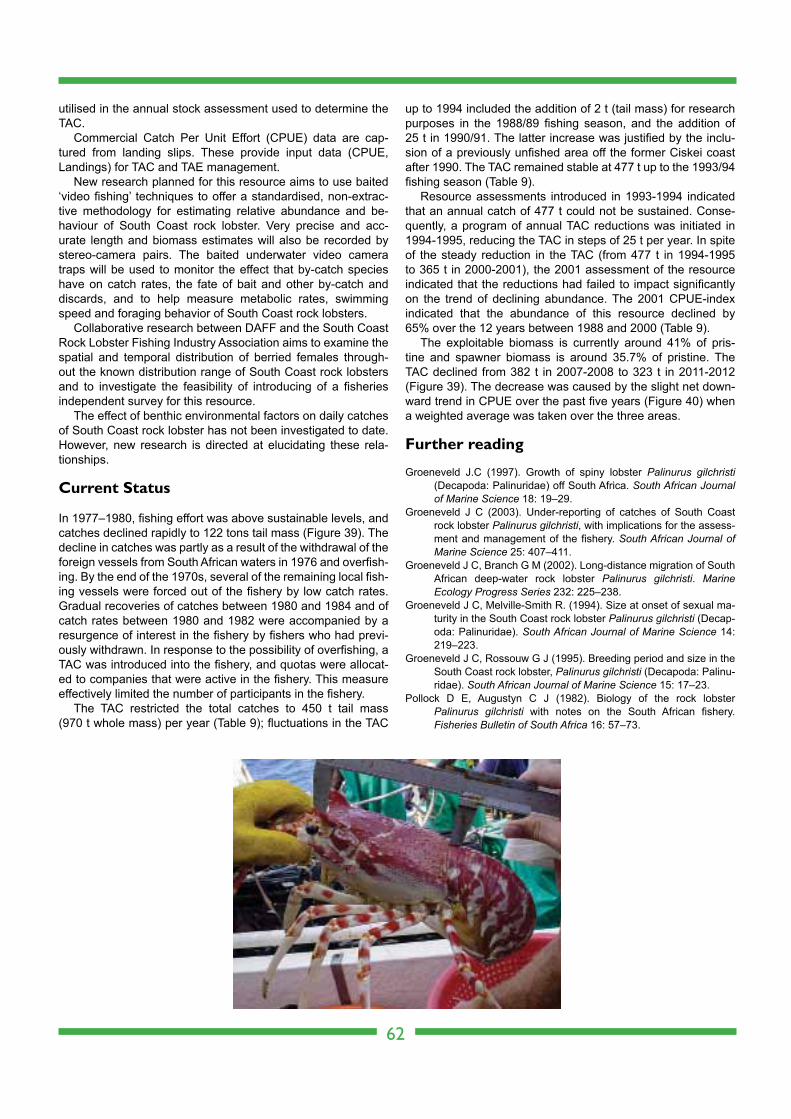
1
utilised in the annual stock assessment used to determine the TAC.
Commercial Catch Per Unit Effort (CPUE) data are cap- tured from landing slips. These provide input data (CPUE, Landings) for TAC and TAE management.
New research planned for this resource aims to use baited ‘video fishing’ techniques to offer a standardised, non-extrac-tive methodology for estimating relative abundance and be- haviour of South Coast rock lobster. Very precise and acc- urate length and biomass estimates will also be recorded by stereo-camera pairs. The baited underwater video camera traps will be used to monitor the effect that by-catch species have on catch rates, the fate of bait and other by-catch and discards, and to help measure metabolic rates, swimming speed and foraging behavior of South Coast rock lobsters.
Collaborative research between DAFF and the South Coast Rock Lobster Fishing Industry Association aims to examine the spatial and temporal distribution of berried females through- out the known distribution range of South Coast rock lobsters and to investigate the feasibility of introducing of a fisheries independent survey for this resource.
The effect of benthic environmental factors on daily catches of South Coast rock lobster has not been investigated to date. However, new research is directed at elucidating these rela-tionships.
Current Status
In 1977–1980, fishing effort was above sustainable levels, and catches declined rapidly to 122 tons tail mass (Figure 39). The decline in catches was partly as a result of the withdrawal of the foreign vessels from South African waters in 1976 and overfish-ing. By the end of the 1970s, several of the remaining local fish-ing vessels were forced out of the fishery by low catch rates. Gradual recoveries of catches between 1980 and 1984 and of catch rates between 1980 and 1982 were accompanied by a resurgence of interest in the fishery by fishers who had previ-ously withdrawn. In response to the possibility of overfishing, a TAC was introduced into the fishery, and quotas were allocat-ed to companies that were active in the fishery. This measure effectively limited the number of participants in the fishery.
The TAC restricted the total catches to 450 t tail mass (970 t whole mass) per year (Table 9); fluctuations in the TAC
up to 1994 included the addition of 2 t (tail mass) for research purposes in the 1988/89 fishing season, and the addition of 25 t in 1990/91. The latter increase was justified by the inclu-sion of a previously unfished area off the former Ciskei coast after 1990. The TAC remained stable at 477 t up to the 1993/94 fishing season (Table 9).
Resource assessments introduced in 1993-1994 indicated that an annual catch of 477 t could not be sustained. Conse-quently, a program of annual TAC reductions was initiated in 1994-1995, reducing the TAC in steps of 25 t per year. In spite of the steady reduction in the TAC (from 477 t in 1994-1995 to 365 t in 2000-2001), the 2001 assessment of the resource indicated that the reductions had failed to impact significantly on the trend of declining abundance. The 2001 CPUE-index indicated that the abundance of this resource declined by 65% over the 12 years between 1988 and 2000 (Table 9).
The exploitable biomass is currently around 41% of pris-tine and spawner biomass is around 35.7% of pristine. The TAC declined from 382 t in 2007-2008 to 323 t in 2011-2012 (Figure 39). The decrease was caused by the slight net down-ward trend in CPUE over the past five years (Figure 40) when a weighted average was taken over the three areas.
Further reading
Groeneveld J.C (1997). Growth of spiny lobster Palinurus gilchristi (Decapoda: Palinuridae) off South Africa. South African Journal of Marine Science 18: 19–29.
Groeneveld J C (2003). Under-reporting of catches of South Coast rock lobster Palinurus gilchristi, with implications for the assess-ment and management of the fishery. South African Journal of Marine Science 25: 407–411.
Groeneveld J C, Branch G M (2002). Long-distance migration of South African deep-water rock lobster Palinurus gilchristi. Marine Ecology Progress Series 232: 225–238.
Groeneveld J C, Melville-Smith R. (1994). Size at onset of sexual ma-turity in the South Coast rock lobster Palinurus gilchristi (Decap-oda: Palinuridae). South African Journal of Marine Science 14: 219–223.
Groeneveld J C, Rossouw G J (1995). Breeding period and size in the South Coast rock lobster, Palinurus gilchristi (Decapoda: Palinu-ridae). South African Journal of Marine Science 15: 17–23.
Pollock D E, Augustyn C J (1982). Biology of the rock lobster Palinurus gilchristi with notes on the South African fishery. Fisheries Bulletin of South Africa 16: 57–73.
62
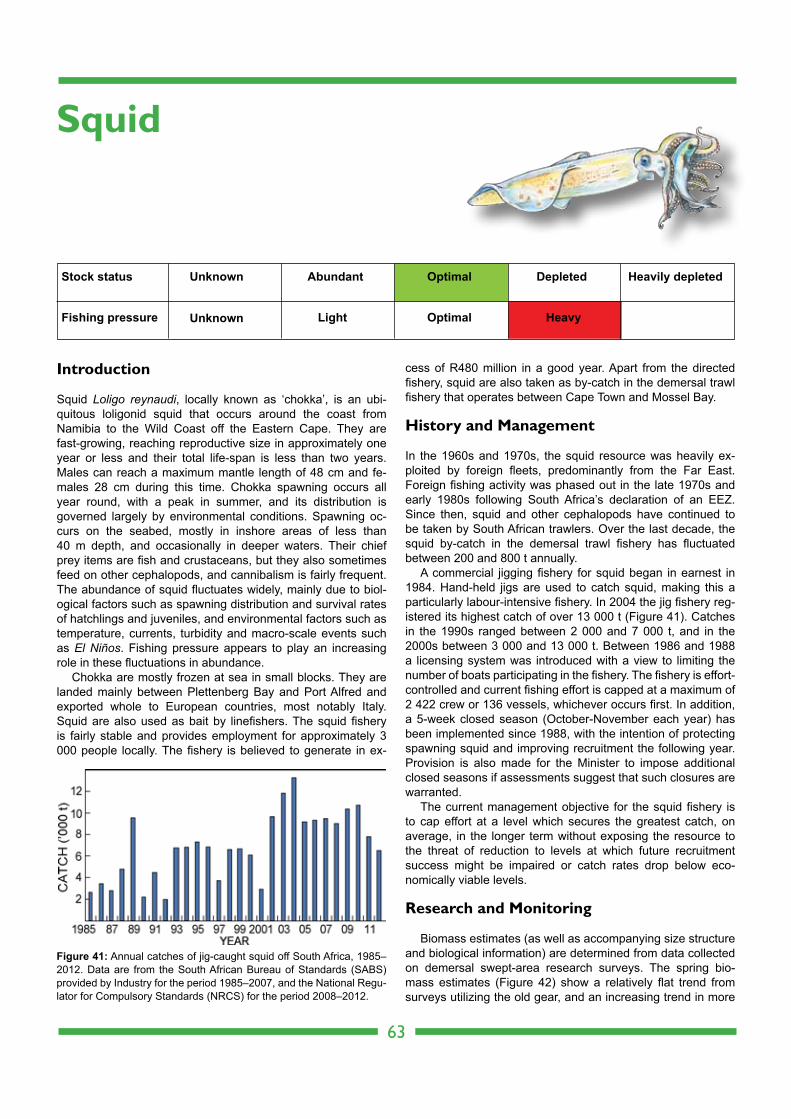
1
Introduction
Squid Loligo reynaudi, locally known as ‘chokka’, is an ubi- quitous loligonid squid that occurs around the coast from Namibia to the Wild Coast off the Eastern Cape. They are fast-growing, reaching reproductive size in approximately one year or less and their total life-span is less than two years. Males can reach a maximum mantle length of 48 cm and fe-males 28 cm during this time. Chokka spawning occurs all year round, with a peak in summer, and its distribution is governed largely by environmental conditions. Spawning oc-curs on the seabed, mostly in inshore areas of less than 40 m depth, and occasionally in deeper waters. Their chief prey items are fish and crustaceans, but they also sometimes feed on other cephalopods, and cannibalism is fairly frequent. The abundance of squid fluctuates widely, mainly due to biol- ogical factors such as spawning distribution and survival rates of hatchlings and juveniles, and environmental factors such as temperature, currents, turbidity and macro-scale events such as El Niños. Fishing pressure appears to play an increasing role in these fluctuations in abundance.
Chokka are mostly frozen at sea in small blocks. They are landed mainly between Plettenberg Bay and Port Alfred and exported whole to European countries, most notably Italy. Squid are also used as bait by linefishers. The squid fishery is fairly stable and provides employment for approximately 3 000 people locally. The fishery is believed to generate in ex-
cess of R480 million in a good year. Apart from the directed fishery, squid are also taken as by-catch in the demersal trawl fishery that operates between Cape Town and Mossel Bay.
History and Management
In the 1960s and 1970s, the squid resource was heavily ex-ploited by foreign fleets, predominantly from the Far East. Foreign fishing activity was phased out in the late 1970s and early 1980s following South Africa’s declaration of an EEZ. Since then, squid and other cephalopods have continued to be taken by South African trawlers. Over the last decade, the squid by-catch in the demersal trawl fishery has fluctuated between 200 and 800 t annually.
A commercial jigging fishery for squid began in earnest in 1984. Hand-held jigs are used to catch squid, making this a particularly labour-intensive fishery. In 2004 the jig fishery reg-istered its highest catch of over 13 000 t (Figure 41). Catches in the 1990s ranged between 2 000 and 7 000 t, and in the 2000s between 3 000 and 13 000 t. Between 1986 and 1988 a licensing system was introduced with a view to limiting the number of boats participating in the fishery. The fishery is effort-controlled and current fishing effort is capped at a maximum of 2 422 crew or 136 vessels, whichever occurs first. In addition, a 5-week closed season (October-November each year) has been implemented since 1988, with the intention of protecting spawning squid and improving recruitment the following year. Provision is also made for the Minister to impose additional closed seasons if assessments suggest that such closures are warranted.
The current management objective for the squid fishery is to cap effort at a level which secures the greatest catch, on average, in the longer term without exposing the resource to the threat of reduction to levels at which future recruitment success might be impaired or catch rates drop below eco- nomically viable levels.
Research and Monitoring
Biomass estimates (as well as accompanying size structure and biological information) are determined from data collected on demersal swept-area research surveys. The spring bio- mass estimates (Figure 42) show a relatively flat trend from surveys utilizing the old gear, and an increasing trend in more
63
Squid
Stock status Abundant Optimal Depleted Heavily depletedUnknown
Fishing pressure Light Optimal HeavyUnknown
Figure 41: Annual catches of jig-caught squid off South Africa, 1985–2012. Data are from the South African Bureau of Standards (SABS) provided by Industry for the period 1985–2007, and the National Regu-lator for Compulsory Standards (NRCS) for the period 2008–2012.
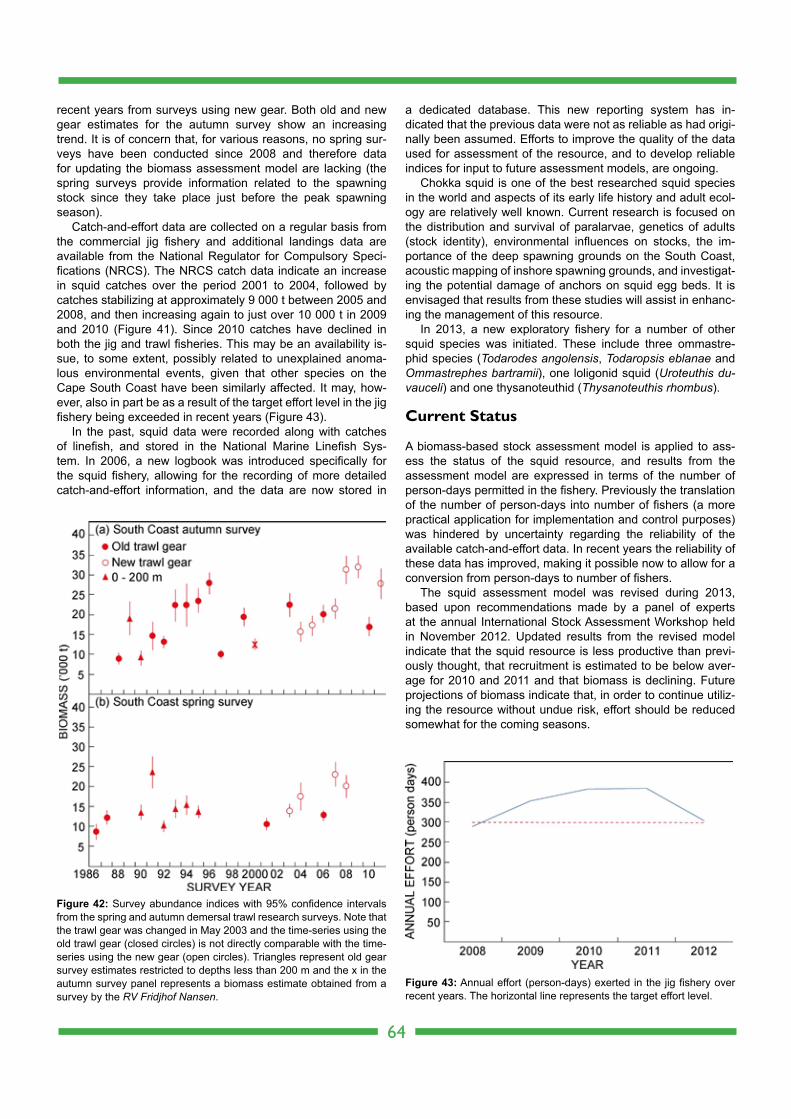
1
recent years from surveys using new gear. Both old and new gear estimates for the autumn survey show an increasing trend. It is of concern that, for various reasons, no spring sur-veys have been conducted since 2008 and therefore data for updating the biomass assessment model are lacking (the spring surveys provide information related to the spawning stock since they take place just before the peak spawning season).
Catch-and-effort data are collected on a regular basis from the commercial jig fishery and additional landings data are available from the National Regulator for Compulsory Speci-fications (NRCS). The NRCS catch data indicate an increase in squid catches over the period 2001 to 2004, followed by catches stabilizing at approximately 9 000 t between 2005 and 2008, and then increasing again to just over 10 000 t in 2009 and 2010 (Figure 41). Since 2010 catches have declined in both the jig and trawl fisheries. This may be an availability is-sue, to some extent, possibly related to unexplained anoma-lous environmental events, given that other species on the Cape South Coast have been similarly affected. It may, how-ever, also in part be as a result of the target effort level in the jig fishery being exceeded in recent years (Figure 43).
In the past, squid data were recorded along with catches of linefish, and stored in the National Marine Linefish Sys-tem. In 2006, a new logbook was introduced specifically for the squid fishery, allowing for the recording of more detailed catch-and-effort information, and the data are now stored in
a dedicated database. This new reporting system has in- dicated that the previous data were not as reliable as had origi-nally been assumed. Efforts to improve the quality of the data used for assessment of the resource, and to develop reliable indices for input to future assessment models, are ongoing.
Chokka squid is one of the best researched squid species in the world and aspects of its early life history and adult ecol-ogy are relatively well known. Current research is focused on the distribution and survival of paralarvae, genetics of adults (stock identity), environmental influences on stocks, the im-portance of the deep spawning grounds on the South Coast, acoustic mapping of inshore spawning grounds, and investigat-ing the potential damage of anchors on squid egg beds. It is envisaged that results from these studies will assist in enhanc-ing the management of this resource.
In 2013, a new exploratory fishery for a number of other squid species was initiated. These include three ommastre-phid species (Todarodes angolensis, Todaropsis eblanae and Ommastrephes bartramii), one loligonid squid (Uroteuthis du-vauceli) and one thysanoteuthid (Thysanoteuthis rhombus).
Current Status
A biomass-based stock assessment model is applied to ass- ess the status of the squid resource, and results from the assessment model are expressed in terms of the number of person-days permitted in the fishery. Previously the translation of the number of person-days into number of fishers (a more practical application for implementation and control purposes) was hindered by uncertainty regarding the reliability of the available catch-and-effort data. In recent years the reliability of these data has improved, making it possible now to allow for a conversion from person-days to number of fishers.
The squid assessment model was revised during 2013, based upon recommendations made by a panel of experts at the annual International Stock Assessment Workshop held in November 2012. Updated results from the revised model indicate that the squid resource is less productive than previ-ously thought, that recruitment is estimated to be below aver-age for 2010 and 2011 and that biomass is declining. Future projections of biomass indicate that, in order to continue utiliz-ing the resource without undue risk, effort should be reduced somewhat for the coming seasons.
64
Figure 42: Survey abundance indices with 95% confidence intervals from the spring and autumn demersal trawl research surveys. Note that the trawl gear was changed in May 2003 and the time-series using the old trawl gear (closed circles) is not directly comparable with the time- series using the new gear (open circles). Triangles represent old gear survey estimates restricted to depths less than 200 m and the x in the autumn survey panel represents a biomass estimate obtained from a survey by the RV Fridjhof Nansen.
Figure 43: Annual effort (person-days) exerted in the jig fishery over recent years. The horizontal line represents the target effort level.
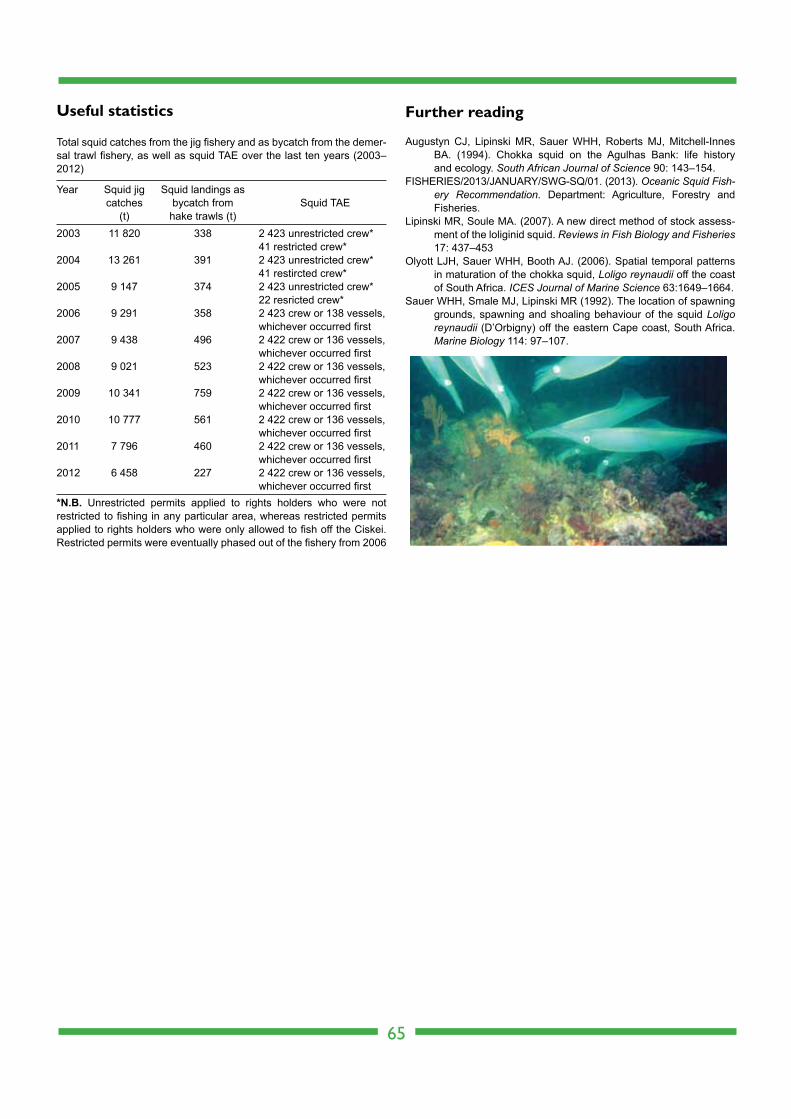
1
Useful statistics Further reading
Augustyn CJ, Lipinski MR, Sauer WHH, Roberts MJ, Mitchell-Innes BA. (1994). Chokka squid on the Agulhas Bank: life history and ecology. South African Journal of Science 90: 143–154.
FISHERIES/2013/JANUARY/SWG-SQ/01. (2013). Oceanic Squid Fish-ery Recommendation. Department: Agriculture, Forestry and Fisheries.
Lipinski MR, Soule MA. (2007). A new direct method of stock assess-ment of the loliginid squid. Reviews in Fish Biology and Fisheries 17: 437–453
Olyott LJH, Sauer WHH, Booth AJ. (2006). Spatial temporal patterns in maturation of the chokka squid, Loligo reynaudii off the coast of South Africa. ICES Journal of Marine Science 63:1649–1664.
Sauer WHH, Smale MJ, Lipinski MR (1992). The location of spawning grounds, spawning and shoaling behaviour of the squid Loligo reynaudii (D’Orbigny) off the eastern Cape coast, South Africa. Marine Biology 114: 97–107.
65
Total squid catches from the jig fishery and as bycatch from the demer-sal trawl fishery, as well as squid TAE over the last ten years (2003–2012)
Year Squid jig Squid landings as catches bycatch from Squid TAE (t) hake trawls (t)2003 11 820 338 2 423 unrestricted crew* 41 restricted crew*2004 13 261 391 2 423 unrestricted crew* 41 restircted crew*2005 9 147 374 2 423 unrestricted crew* 22 resricted crew*2006 9 291 358 2 423 crew or 138 vessels, whichever occurred first2007 9 438 496 2 422 crew or 136 vessels, whichever occurred first2008 9 021 523 2 422 crew or 136 vessels, whichever occurred first2009 10 341 759 2 422 crew or 136 vessels, whichever occurred first2010 10 777 561 2 422 crew or 136 vessels, whichever occurred first2011 7 796 460 2 422 crew or 136 vessels, whichever occurred first2012 6 458 227 2 422 crew or 136 vessels, whichever occurred first*N.B. Unrestricted permits applied to rights holders who were not restricted to fishing in any particular area, whereas restricted permits applied to rights holders who were only allowed to fish off the Ciskei. Restricted permits were eventually phased out of the fishery from 2006
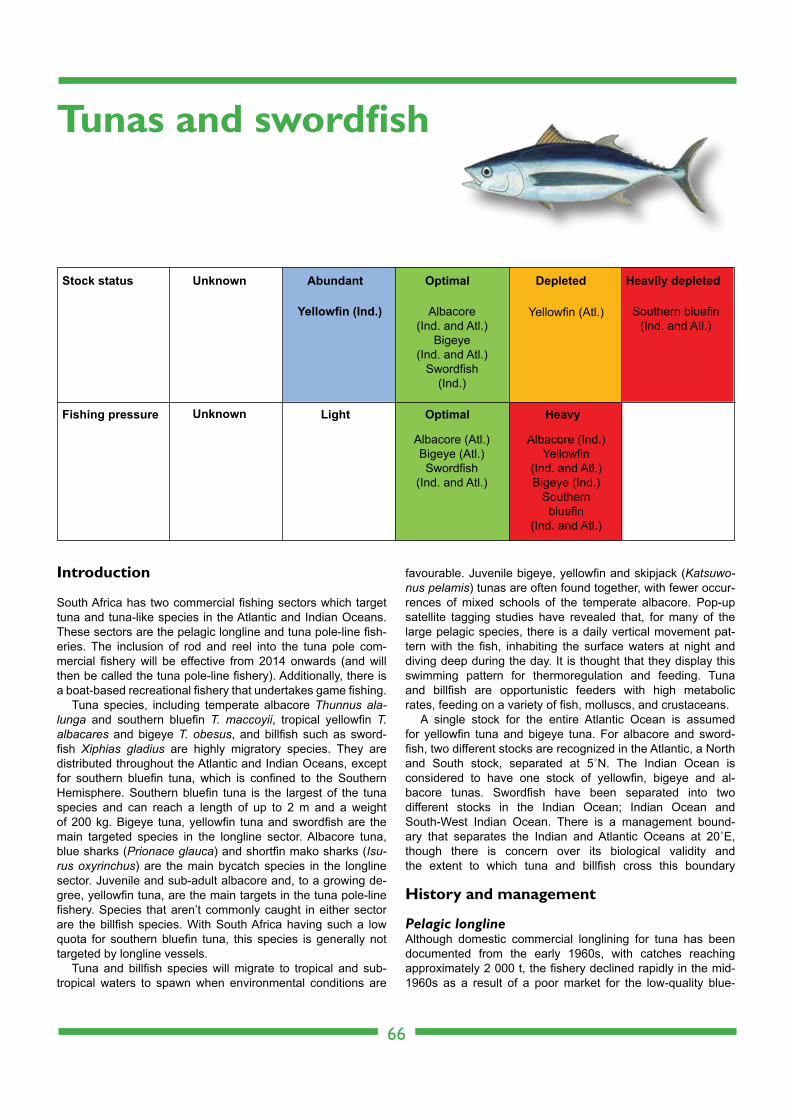
1
Introduction
South Africa has two commercial fishing sectors which target tuna and tuna-like species in the Atlantic and Indian Oceans. These sectors are the pelagic longline and tuna pole-line fish-eries. The inclusion of rod and reel into the tuna pole com- mercial fishery will be effective from 2014 onwards (and will then be called the tuna pole-line fishery). Additionally, there is a boat-based recreational fishery that undertakes game fishing.
Tuna species, including temperate albacore Thunnus ala-lunga and southern bluefin T. maccoyii, tropical yellowfin T. albacares and bigeye T. obesus, and billfish such as sword-fish Xiphias gladius are highly migratory species. They are distributed throughout the Atlantic and Indian Oceans, except for southern bluefin tuna, which is confined to the Southern Hemisphere. Southern bluefin tuna is the largest of the tuna species and can reach a length of up to 2 m and a weight of 200 kg. Bigeye tuna, yellowfin tuna and swordfish are the main targeted species in the longline sector. Albacore tuna, blue sharks (Prionace glauca) and shortfin mako sharks (Isu-rus oxyrinchus) are the main bycatch species in the longline sector. Juvenile and sub-adult albacore and, to a growing de-gree, yellowfin tuna, are the main targets in the tuna pole-line fishery. Species that aren’t commonly caught in either sector are the billfish species. With South Africa having such a low quota for southern bluefin tuna, this species is generally not targeted by longline vessels.
Tuna and billfish species will migrate to tropical and sub-tropical waters to spawn when environmental conditions are
favourable. Juvenile bigeye, yellowfin and skipjack (Katsuwo-nus pelamis) tunas are often found together, with fewer occur-rences of mixed schools of the temperate albacore. Pop-up satellite tagging studies have revealed that, for many of the large pelagic species, there is a daily vertical movement pat-tern with the fish, inhabiting the surface waters at night and diving deep during the day. It is thought that they display this swimming pattern for thermoregulation and feeding. Tuna and billfish are opportunistic feeders with high metabolic rates, feeding on a variety of fish, molluscs, and crustaceans.
A single stock for the entire Atlantic Ocean is assumed for yellowfin tuna and bigeye tuna. For albacore and sword-fish, two different stocks are recognized in the Atlantic, a North and South stock, separated at 5˚N. The Indian Ocean is considered to have one stock of yellowfin, bigeye and al-bacore tunas. Swordfish have been separated into two different stocks in the Indian Ocean; Indian Ocean and South-West Indian Ocean. There is a management bound-ary that separates the Indian and Atlantic Oceans at 20˚E, though there is concern over its biological validity and the extent to which tuna and billfish cross this boundary
History and management
Pelagic longlineAlthough domestic commercial longlining for tuna has been documented from the early 1960s, with catches reaching approximately 2 000 t, the fishery declined rapidly in the mid-1960s as a result of a poor market for the low-quality blue-
66
Tunas and swordfish
Stock status Abundant Optimal Depleted Heavily depletedUnknown
Fishing pressure Light Optimal Heavy
Albacore (Ind. and Atl.)
Bigeye(Ind. and Atl.)
Swordfish(Ind.)
Yellowfin (Atl.) Southern bluefin(Ind. and Atl.)
Albacore (Atl.)Bigeye (Atl.)Swordfish
(Ind. and Atl.)
Unknown
Yellowfin (Ind.)
Albacore (Ind.)Yellowfin
(Ind. and Atl.)Bigeye (Ind.)
Southernbluefin
(Ind. and Atl.)
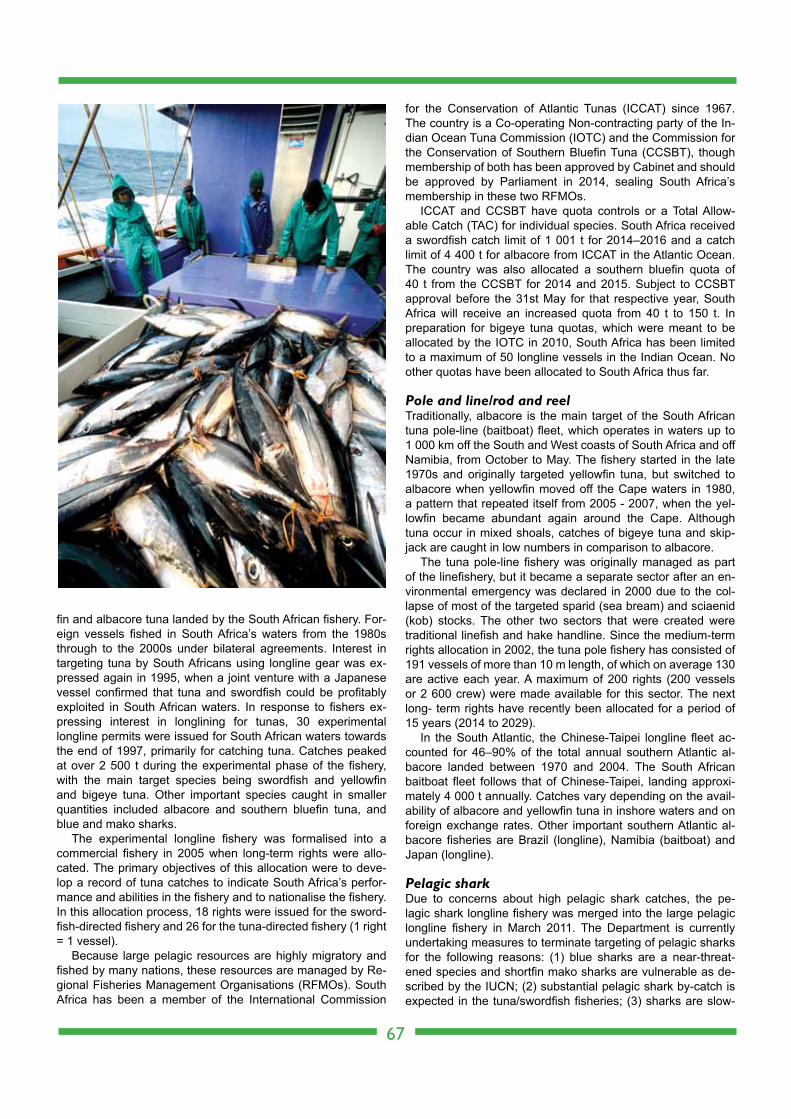
1
fin and albacore tuna landed by the South African fishery. For-eign vessels fished in South Africa’s waters from the 1980s through to the 2000s under bilateral agreements. Interest in targeting tuna by South Africans using longline gear was ex-pressed again in 1995, when a joint venture with a Japanese vessel confirmed that tuna and swordfish could be profitably exploited in South African waters. In response to fishers ex-pressing interest in longlining for tunas, 30 experimental longline permits were issued for South African waters towards the end of 1997, primarily for catching tuna. Catches peaked at over 2 500 t during the experimental phase of the fishery, with the main target species being swordfish and yellowfin and bigeye tuna. Other important species caught in smaller quantities included albacore and southern bluefin tuna, and blue and mako sharks.
The experimental longline fishery was formalised into a commercial fishery in 2005 when long-term rights were allo-cated. The primary objectives of this allocation were to deve- lop a record of tuna catches to indicate South Africa’s perfor-mance and abilities in the fishery and to nationalise the fishery. In this allocation process, 18 rights were issued for the sword-fish-directed fishery and 26 for the tuna-directed fishery (1 right = 1 vessel).
Because large pelagic resources are highly migratory and fished by many nations, these resources are managed by Re-gional Fisheries Management Organisations (RFMOs). South Africa has been a member of the International Commission
for the Conservation of Atlantic Tunas (ICCAT) since 1967. The country is a Co-operating Non-contracting party of the In-dian Ocean Tuna Commission (IOTC) and the Commission for the Conservation of Southern Bluefin Tuna (CCSBT), though membership of both has been approved by Cabinet and should be approved by Parliament in 2014, sealing South Africa’s membership in these two RFMOs.
ICCAT and CCSBT have quota controls or a Total Allow- able Catch (TAC) for individual species. South Africa received a swordfish catch limit of 1 001 t for 2014–2016 and a catch limit of 4 400 t for albacore from ICCAT in the Atlantic Ocean. The country was also allocated a southern bluefin quota of 40 t from the CCSBT for 2014 and 2015. Subject to CCSBT approval before the 31st May for that respective year, South Africa will receive an increased quota from 40 t to 150 t. In preparation for bigeye tuna quotas, which were meant to be allocated by the IOTC in 2010, South Africa has been limited to a maximum of 50 longline vessels in the Indian Ocean. No other quotas have been allocated to South Africa thus far.
Pole and line/rod and reelTraditionally, albacore is the main target of the South African tuna pole-line (baitboat) fleet, which operates in waters up to 1 000 km off the South and West coasts of South Africa and off Namibia, from October to May. The fishery started in the late 1970s and originally targeted yellowfin tuna, but switched to albacore when yellowfin moved off the Cape waters in 1980, a pattern that repeated itself from 2005 - 2007, when the yel-lowfin became abundant again around the Cape. Although tuna occur in mixed shoals, catches of bigeye tuna and skip-jack are caught in low numbers in comparison to albacore.
The tuna pole-line fishery was originally managed as part of the linefishery, but it became a separate sector after an en-vironmental emergency was declared in 2000 due to the col-lapse of most of the targeted sparid (sea bream) and sciaenid (kob) stocks. The other two sectors that were created were traditional linefish and hake handline. Since the medium-term rights allocation in 2002, the tuna pole fishery has consisted of 191 vessels of more than 10 m length, of which on average 130 are active each year. A maximum of 200 rights (200 vessels or 2 600 crew) were made available for this sector. The next long- term rights have recently been allocated for a period of 15 years (2014 to 2029).
In the South Atlantic, the Chinese-Taipei longline fleet ac-counted for 46–90% of the total annual southern Atlantic al-bacore landed between 1970 and 2004. The South African baitboat fleet follows that of Chinese-Taipei, landing approxi- mately 4 000 t annually. Catches vary depending on the avail-ability of albacore and yellowfin tuna in inshore waters and on foreign exchange rates. Other important southern Atlantic al-bacore fisheries are Brazil (longline), Namibia (baitboat) and Japan (longline).
Pelagic sharkDue to concerns about high pelagic shark catches, the pe-lagic shark longline fishery was merged into the large pelagic longline fishery in March 2011. The Department is currently undertaking measures to terminate targeting of pelagic sharks for the following reasons: (1) blue sharks are a near-threat-ened species and shortfin mako sharks are vulnerable as de-scribed by the IUCN; (2) substantial pelagic shark by-catch is expected in the tuna/swordfish fisheries; (3) sharks are slow-
67

1
growing, mature late, and have low fecundity, which makes them paticularly susceptible to overfishing; and (4) concerns over ecosystem effects of reducing numbers of appex preda-tors. Under current management, the bycatch limit has been set using a Precautionary Upper Catch Limit (PUCL) of 2 000 t dressed weight. Once this limit is reached, fishing in the large pelagic fishery would close. The domestic pelagic longline fishery originally only targeted tuna and swordfish, although shark by-catch was also recorded. Foreign pelagic tuna-di-rected fisheries are comprised of Japanese vessels that take a bycatch of offshore oceanic species such as mako sharks, blue sharks and carcharhinid sharks such as silky sharks Carcharhinus falciformis.
Research and monitoring
The scientific observer programme for domestic longline ves-sels came to an end in March 2011. Currently, 100% cover- age is achieved on foreign-flag vessels but no coverage has been achieved on domestic vessels since March 2011. The scientific observer coverage on the foreign-flag vessels obtains length frequencies, biological samples, and fisheries informa-tion on target and bycatch species. The observer coverage will be aimed at 20% of catch days for domestic longline ves-sels, once the programme is re-established. Port-side monitor-ing of tuna pole vessels will also re-commence upon the re-establishment of the scientific observer programme.
The relatively recent establishment of a large pelagic fish- ery represents an important milestone in the development of South African fisheries. However, research activities directed at the large pelagic species targeted by longline are in their infancy, though to date four dedicated research trips have been undertaken since 2008.
The main focus of past research on large pelagic re- sources in South Africa has been on the life history and stock structure of swordfish in southern African waters. This spe-cies is commercially important to the local longline fleet, and the research was sparked in response to the sharp decline in catch rates. Furthermore, the IOTC recognises the South-West Indian Ocean (SWIO) region as having a sub-population with its own scientific and management advice. As South Africa fishes in the SWIO region, it has been of interest to further the knowledge on this species in our waters. The scientific ob-server programme was used extensively from 1998 to collect swordfish length frequencies and biological material for age and growth studies, sexing, maturity staging and dietary stud-ies.
A pilot tagging programme for swordfish and bigeye and yellowfin tuna, using commercial longliners as a tagging plat-form, was conducted between 2004 and 2006, with approxi-mately 300 large pelagic fish tagged. One swordfish was re-captured from this tagging programme just a few months later in the same vicinity as it was originally tagged. However, there have been too few recaptures to draw any meaningful conclu-sions about the movements of these fish.
South Africa’s involvement in the South West Indian Ocean Fisheries Project (SWIOFP), through Component 4 (assess-ment and sustainable utilisation of large pelagic resources), has provided momentum to the research programme. The primary focus is to understand the distribution and move- ment of swordfish and bigeye and yellowfin tuna within
the SWIO region, to which end 15 pop-up satellite archival tags (PSATs) have been provided for deployment on these species, as well as hook monitors and time-depth recorders for deployment on an instrumented longline.
In 2009, two bigeye tuna were successfully tagged with PSATs. The animals were found to move north, following the direction of the Benguela Current. In 2010, three yellow-fin tuna were tagged with PSATs. The three tags popped up and transmitted data earlier than they were programmed to do, indicating that the animals had died prematurely and the tags had exceeded their depth limit of 1 200 m. The trends in the data are yet to be analysed in detail to understand the cause of these premature pop-ups. Three blue sharks were tagged with PSATs in 2010 and a further two blue sharks were tagged with SPOT (Smart Position Only) tags in 2011. The Department’s national research cruise in 2011 was a momen-tous achievement during which 11 swordfish were success- fully PSAT-tagged in the SWIO region. Swordfish have proven to be very sensitive to handling on the line and South Africa is the first country to achieve PSAT-tagging of swordfish in this region. Tags had been programmed for either 90 or 180 days. Four tags remained on the fish for more than 60 days. The tag results revealed that all swordfishes remained with-in the region but one fish crossed the 20o longitude bound-ary, twice indicating that there might be a link to the Southern Atlantic stock.
The Department continues to collaborate with WWF and
68

1
Birdlife SA to assess the impact of longline fisheries on sea-birds, turtles and sharks, and to investigate various mitiga-tion and management measures. A National Plan of Action (NPOA) for seabirds was published in 2008, which aims to re-duce seabird mortalities below 0.05 seabirds 1 000 hooks–1. Good collaboration with the fishing industry, researchers and managers, continual refining of mitigation measures, the imple-mentation of stringent management measures through permit conditions, and close monitoring, has resulted in a decrease of seabird mortalities and is currently almost at the goal identi- fied in the NPOA-Seabirds. The NPOA-Sharks, a comprehen-sive plan that covers issues around the consumptive use of sharks, has been published as of November 2013, and its im-plementation needs to be coordinated.
The ICCAT and IOTC have expressed concerns over the movement of species between the 20°E management bound-ary that separates the Indian and Atlantic oceans. The extent of the mixing between the two oceans has strong implications for the outcomes of stock assessments. South Africa is in a position to begin to address this issue, for the benefit not only of South Africa, but of neighbouring fishing fleets too. A mul-tidisciplinary approach is required, coupling tagging, genetic, stable isotope research. Further research initiated in South Africa is using swordfish genetics to ascertain stock deline- ation between the two oceans.
South Africa is currently a collaborator in the GEnetic StRucture and Migration Of Albacore TuNa (GERMON) project being headed up by the French Research Institute for Exploita-tion of the Sea, Indian Ocean’s Delegation (IFREMER DOI). The project aims to further the knowledge information on the stock structure and biology of albacore in the Indian Ocean and the area between the Indian and Atlantic oceans. The sampling is currently underway and the project will conclude in 2015. Coupled with the GERMON project, South Africa has recently tagged albacore with PSAT tags to complement the outcomes of the genetic, stable isotope analyses.
The RFMOs are responsible for conducting stock assess-ments of large pelagic species. South Africa has contributed standardised catch-per-unit-effort (CPUE) for inclusion in IC-CAT stock assessments for albacore and swordfish since 1996.
Current status
Stock assessments and country allocations for the Atlantic and Indian ocean stocks of tuna and tuna-like species are the re-
sponsibility of ICCAT and the IOTC, while stock assessments for southern bluefin tuna are conducted by the CCSBT.
Yellowfin tunaA stock assessment for yellowfin tuna conducted by ICCAT in 2011 (using catch-and-effort data through 2010) indicated that the yellowfin stock in the Atlantic Ocean was overfished and catches were about 10% higher during 2008–2010 than in 2007. ICCAT has recommended that no additional effort be exerted on the Atlantic yellowfin stock, as production model has indicated that increased catches will slow or reverse re-building of the stock. The high catches in the Indian Ocean in the period 2003–2006 (average catch of 464 000 t) may have led to a decline in the biomass of the stock. A stock assess-ment conducted in 2012 suggested that the stock is currently not overfished and is not experiencing overfishing. The IOTC Scientific Committee recommended that the catches in the In-dian Ocean do not exceed the current estimate of Maximum Sustainable Yield (MSY) of 300 000 t (catches of yellowfin in 2011 were 302 939 t) and that improvements in the status of the stock are dependent on future recruitments reaching previ-ous higher levels and the control of fishing pressures (catch and effort).
AlbacoreA full southern Atlantic albacore stock assessment was con-ducted by ICCAT in 2013, using a broad range of methods and data up to 2011. The results of the stock assessment sug-gest there is a 57% probability that the stock is both overfished and experiencing overfishing. The large confidence intervals reveal uncertainties in the status of the stock. Consequently, the TAC was maintained at 24 000 t in the South Atlantic re-gion with Contracting Parties receiving hard-limit quotas. South Africa received a catch limit of 4 400 t for 2014. The IOTC conducted an albacore stock assessment in 2011. At current effort levels the Indian Ocean stock is considered at risk and catches are most likely above MSY (29 900 t).
SwordfishA swordfish stock assessment conducted by ICCAT in 2013 re-vealed conflicting results between the models. The stock could be in an overfished state and experiencing overfishing. Until improved scientific information is available, in the form of more consistent indices, tagging studies to estimate fishing mortality or abundance, or other improved information, this uncertainty may remain. South Africa’s TAC was maintained at 1 001 t for 2014–2016. The outlook for the swordfish stock in the Indian Ocean is more optimistic with signs of reductions in catch and effort that have brought down mortalities. These conditions are suitable for stock recovery and rebuilding to the level of MSY.
Bigeye tunaThe latest stock assessment of bigeye tuna in the Atlantic Ocean was conducted in 2010, using catch data up to 2009, and it indicated that the stock is optimally exploited. The total catch in 2009 increased to 86 011 t, higher than the targeted TAC of 85 000 t recommended by the ICCAT (Standing Com-mittee on Research and Statistics) to promote stock growth. The total catch of bigeye tuna in the Indian Ocean reached 40 700 t in 1999, but the average catch for the period 2005–
69
1
2009 has been 114 600 t. The stock assessment in 2006 used four assessment models and the results showed that the stock was fully exploited. Current catches (2011) of bigeye tuna in the Indian Ocean (87 420 t) are below the range of the esti-mated MSY levels of between 100 000 t and 115 000 t, indicat-ing that the stock is not overfished and it is not experiencing overfishing.
Southern bluefin tunaA model assessment of the southern bluefin stock was not conducted in 2013 at the Extended Scientific Committee of CCSBT. The indicators continue to support previous evidence that this tuna resource is still overexploited. The stock assess-ment also indicated that the spawning stock biomass (SSB) is at a very low fraction of its original biomass (4.6% of unfished levels) as well as below the levels that could produce maxi- mum sustainable yield (15% of SSBMSY), and these results were consistent across all possible scenarios. However, the global TAC has been increased to 12 449 t for 2014 and it is estimated to be increased to 14 647 t for the years 2015–2017. These increases are less than the 30 000 t set in the Man-agement Plan and are a result of recent positive trends in the CPUE and aerial surveys indices. Catches at the current TAC are expected to achieve rebuilding of the stock.
Pelagic sharksStock assessments of pelagic sharks, conducted by ICCAT in 2008, were inconclusive due to widespread under-reporting of shark catch-and-effort data. Despite this, there is inter- national concern regarding the stock status of pelagic sharks, due to the biology of these species and the current high fish-
ing capacity worldwide. As a precautionary measure, RFMOs have called for the capping of effort on sharks and have re-quested that nursery grounds for these species be protected.
Further readingBigelow KA, Musyl MK, Poisson F, Kleiberm O. (2006). Pelagic longline
gear depth and shoaling. Fisheries Research 77: 173–183.Dulvy NK, Baum JK, Clarke S, Compagno LJV, Cortés E, Domingo A,
Fordham S, Fowler S, Francis MP, Gibson C, Martínez J, Musick JA, Saldo A, Stevens JD, Valenti S. (2008) You can swim but you can’t hide: the global status and conservation of oceanic sharks and rays. Aquatic Conservation: Marine and Freshwater ecosys-tems 18: 459–482.
Muths D, Grewe P, Jean C and Bourjea J. (2009). Genetic popula-tion structure of the swordfish (Xiphias gladius) in the southwest Indian Ocean: Sex-biased differentiation, congruency between markers and its incidence in a way of stock assessment. Fisher-ies Research, 97(3): 263–269.
Penney AJ, Punt AE. (1993). The South African Tuna Fishery: past, present and future. In: Beckley LE, van der Elst OA (eds), Fish, fishers and fisheries. Oceanographic Research Institute, Special Publication 2: 140–142
Penney AJ, Yeh S-Y, Kuo C-L, Leslie RW. (1998). Relationships be-tween albacore (Thunnus alalunga) stocks in the southern Atlan-tic and Indian Oceans. Collective Volume of Scientific Papers p (ICCAT) 50: 261–271.
Penney AJ, Griffiths MH. (1999). A first description of the developing South African longline fishery. Collective Volume of Scientific Pa-pers (ICCAT) 49: 162–173.
West W, Kerwath S, da Silva C, Wilke C and Marsac F. (2012). Hori-zontal and vertical movements of swordfish tagged with pop up-satellite transmitters in the south-west Indian Ocean, off South Africa. IOTC Working Party on Billfish, IOTC-2012-WPB10-16.
70
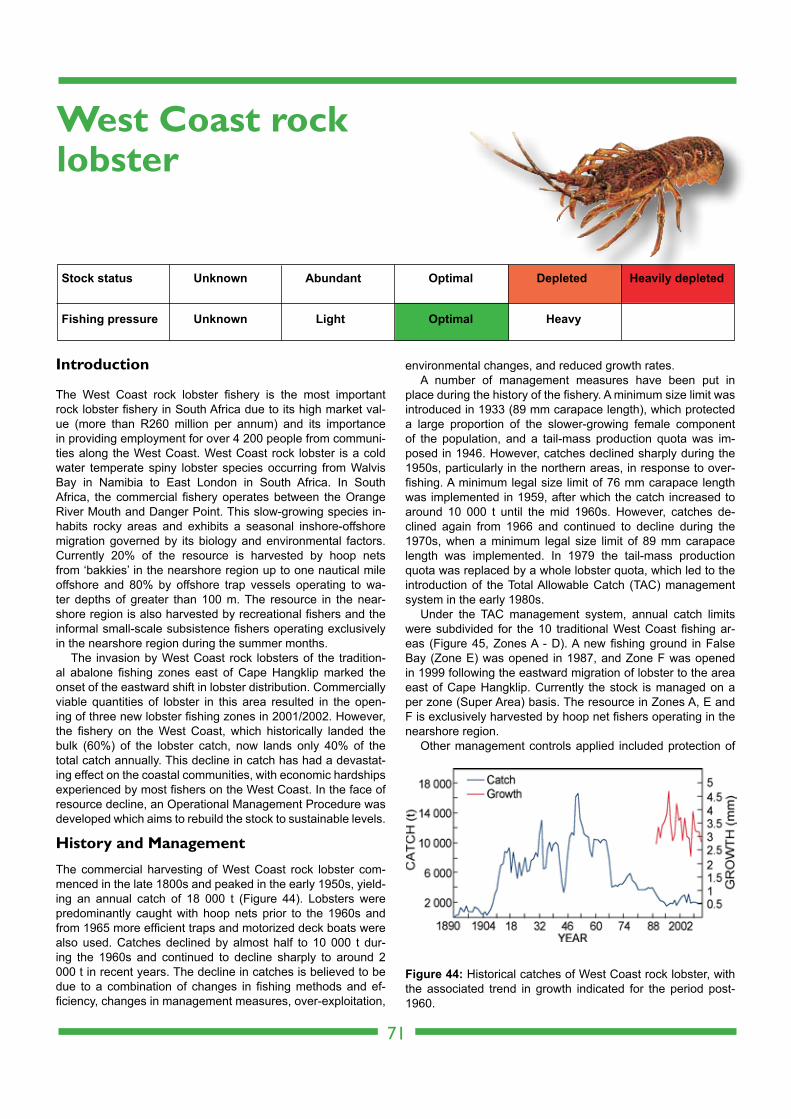
1
Introduction
The West Coast rock lobster fishery is the most important rock lobster fishery in South Africa due to its high market val-ue (more than R260 million per annum) and its importance in providing employment for over 4 200 people from communi-ties along the West Coast. West Coast rock lobster is a cold water temperate spiny lobster species occurring from Walvis Bay in Namibia to East London in South Africa. In South Africa, the commercial fishery operates between the Orange River Mouth and Danger Point. This slow-growing species in-habits rocky areas and exhibits a seasonal inshore-offshore migration governed by its biology and environmental factors. Currently 20% of the resource is harvested by hoop nets from ‘bakkies’ in the nearshore region up to one nautical mile offshore and 80% by offshore trap vessels operating to wa-ter depths of greater than 100 m. The resource in the near- shore region is also harvested by recreational fishers and the informal small-scale subsistence fishers operating exclusively in the nearshore region during the summer months.
The invasion by West Coast rock lobsters of the tradition-al abalone fishing zones east of Cape Hangklip marked the onset of the eastward shift in lobster distribution. Commercially viable quantities of lobster in this area resulted in the open-ing of three new lobster fishing zones in 2001/2002. However, the fishery on the West Coast, which historically landed the bulk (60%) of the lobster catch, now lands only 40% of the total catch annually. This decline in catch has had a devastat-ing effect on the coastal communities, with economic hardships experienced by most fishers on the West Coast. In the face of resource decline, an Operational Management Procedure was developed which aims to rebuild the stock to sustainable levels.
History and Management
The commercial harvesting of West Coast rock lobster com-menced in the late 1800s and peaked in the early 1950s, yield-ing an annual catch of 18 000 t (Figure 44). Lobsters were predominantly caught with hoop nets prior to the 1960s and from 1965 more efficient traps and motorized deck boats were also used. Catches declined by almost half to 10 000 t dur-ing the 1960s and continued to decline sharply to around 2 000 t in recent years. The decline in catches is believed to be due to a combination of changes in fishing methods and ef-ficiency, changes in management measures, over-exploitation,
environmental changes, and reduced growth rates.A number of management measures have been put in
place during the history of the fishery. A minimum size limit was introduced in 1933 (89 mm carapace length), which protected a large proportion of the slower-growing female component of the population, and a tail-mass production quota was im- posed in 1946. However, catches declined sharply during the 1950s, particularly in the northern areas, in response to over-fishing. A minimum legal size limit of 76 mm carapace length was implemented in 1959, after which the catch increased to around 10 000 t until the mid 1960s. However, catches de- clined again from 1966 and continued to decline during the 1970s, when a minimum legal size limit of 89 mm carapace length was implemented. In 1979 the tail-mass production quota was replaced by a whole lobster quota, which led to the introduction of the Total Allowable Catch (TAC) management system in the early 1980s.
Under the TAC management system, annual catch limits were subdivided for the 10 traditional West Coast fishing ar-eas (Figure 45, Zones A - D). A new fishing ground in False Bay (Zone E) was opened in 1987, and Zone F was opened in 1999 following the eastward migration of lobster to the area east of Cape Hangklip. Currently the stock is managed on a per zone (Super Area) basis. The resource in Zones A, E and F is exclusively harvested by hoop net fishers operating in the nearshore region.
Other management controls applied included protection of
71
West Coast rock lobster
Stock status Abundant Optimal Depleted Heavily depletedUnknown
Fishing pressure Light Optimal HeavyUnknown
Figure 44: Historical catches of West Coast rock lobster, with the associated trend in growth indicated for the period post-1960.

172
Figure 45: West Coast rock lobster fishing zones and areas. The five Super Areas used in the Operational management Procedure (OMP) corresponds to Zone A, Zone B, Zone C, Area 7 and Area 8 combined with Zone F.
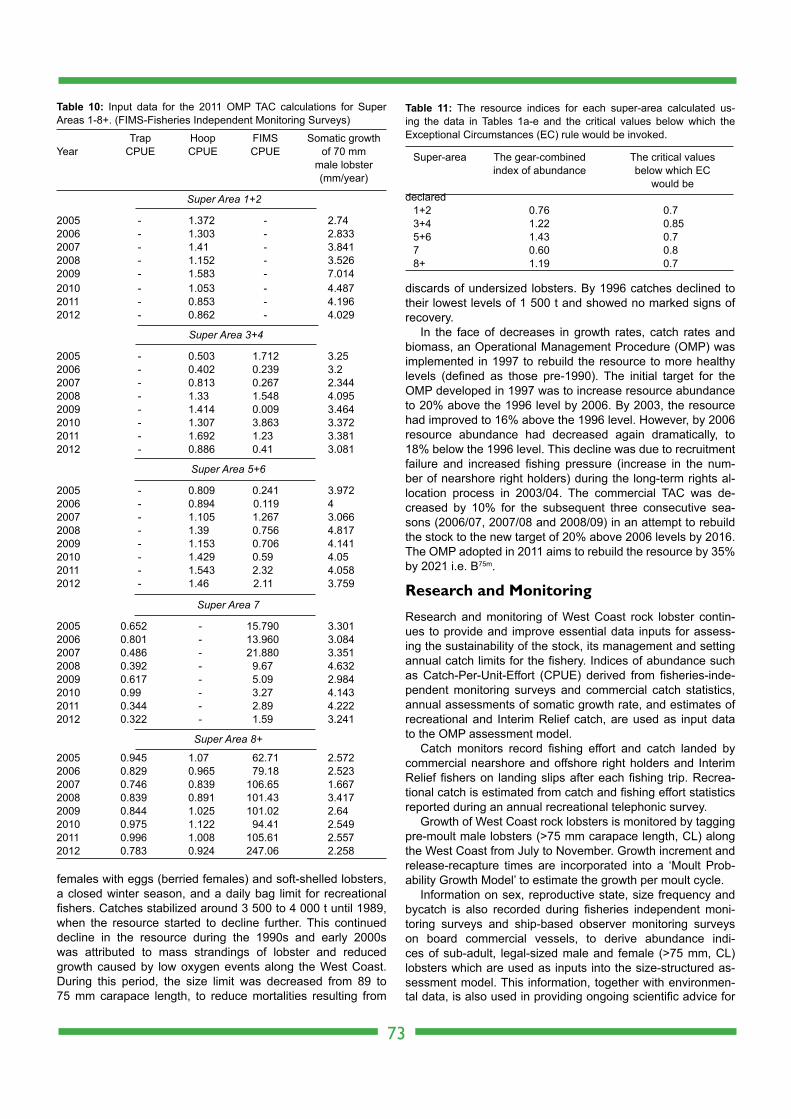
1
females with eggs (berried females) and soft-shelled lobsters, a closed winter season, and a daily bag limit for recreational fishers. Catches stabilized around 3 500 to 4 000 t until 1989, when the resource started to decline further. This continued decline in the resource during the 1990s and early 2000s was attributed to mass strandings of lobster and reduced growth caused by low oxygen events along the West Coast. During this period, the size limit was decreased from 89 to 75 mm carapace length, to reduce mortalities resulting from
discards of undersized lobsters. By 1996 catches declined to their lowest levels of 1 500 t and showed no marked signs of recovery.
In the face of decreases in growth rates, catch rates and biomass, an Operational Management Procedure (OMP) was implemented in 1997 to rebuild the resource to more healthy levels (defined as those pre-1990). The initial target for the OMP developed in 1997 was to increase resource abundance to 20% above the 1996 level by 2006. By 2003, the resource had improved to 16% above the 1996 level. However, by 2006 resource abundance had decreased again dramatically, to 18% below the 1996 level. This decline was due to recruitment failure and increased fishing pressure (increase in the num- ber of nearshore right holders) during the long-term rights al-location process in 2003/04. The commercial TAC was de-creased by 10% for the subsequent three consecutive sea- sons (2006/07, 2007/08 and 2008/09) in an attempt to rebuild the stock to the new target of 20% above 2006 levels by 2016. The OMP adopted in 2011 aims to rebuild the resource by 35% by 2021 i.e. B75m.
Research and Monitoring
Research and monitoring of West Coast rock lobster contin-ues to provide and improve essential data inputs for assess-ing the sustainability of the stock, its management and setting annual catch limits for the fishery. Indices of abundance such as Catch-Per-Unit-Effort (CPUE) derived from fisheries-inde-pendent monitoring surveys and commercial catch statistics, annual assessments of somatic growth rate, and estimates of recreational and Interim Relief catch, are used as input data to the OMP assessment model.
Catch monitors record fishing effort and catch landed by commercial nearshore and offshore right holders and Interim Relief fishers on landing slips after each fishing trip. Recrea-tional catch is estimated from catch and fishing effort statistics reported during an annual recreational telephonic survey.
Growth of West Coast rock lobsters is monitored by tagging pre-moult male lobsters (>75 mm carapace length, CL) along the West Coast from July to November. Growth increment and release-recapture times are incorporated into a ‘Moult Prob-ability Growth Model’ to estimate the growth per moult cycle.
Information on sex, reproductive state, size frequency and bycatch is also recorded during fisheries independent moni-toring surveys and ship-based observer monitoring surveys on board commercial vessels, to derive abundance indi-ces of sub-adult, legal-sized male and female (>75 mm, CL) lobsters which are used as inputs into the size-structured as-sessment model. This information, together with environmen-tal data, is also used in providing ongoing scientific advice for
73
Super Area 1+2
2005 - 1.372 - 2.742006 - 1.303 - 2.8332007 - 1.41 - 3.8412008 - 1.152 - 3.5262009 - 1.583 - 7.0142010 - 1.053 - 4.4872011 - 0.853 - 4.1962012 - 0.862 - 4.029
Super Area 3+4
2005 - 0.503 1.712 3.252006 - 0.402 0.239 3.22007 - 0.813 0.267 2.3442008 - 1.33 1.548 4.0952009 - 1.414 0.009 3.4642010 - 1.307 3.863 3.3722011 - 1.692 1.23 3.3812012 - 0.886 0.41 3.081
Super Area 5+6
2005 - 0.809 0.241 3.9722006 - 0.894 0.119 4 2007 - 1.105 1.267 3.0662008 - 1.39 0.756 4.8172009 - 1.153 0.706 4.1412010 - 1.429 0.59 4.052011 - 1.543 2.32 4.0582012 - 1.46 2.11 3.759
Super Area 7
2005 0.652 - 15.790 3.3012006 0.801 - 13.960 3.0842007 0.486 - 21.880 3.3512008 0.392 - 9.67 4.6322009 0.617 - 5.09 2.9842010 0.99 - 3.27 4.1432011 0.344 - 2.89 4.2222012 0.322 - 1.59 3.241 Super Area 8+
2005 0.945 1.07 62.71 2.5722006 0.829 0.965 79.18 2.5232007 0.746 0.839 106.65 1.6672008 0.839 0.891 101.43 3.4172009 0.844 1.025 101.02 2.642010 0.975 1.122 94.41 2.5492011 0.996 1.008 105.61 2.5572012 0.783 0.924 247.06 2.258
Table 10: Input data for the 2011 OMP TAC calculations for Super Areas 1-8+. (FIMS-Fisheries Independent Monitoring Surveys)
Trap Hoop FIMS Somatic growth Year CPUE CPUE CPUE of 70 mm male lobster (mm/year)
Super-area The gear-combined The critical values index of abundance below which EC would be declared 1+2 0.76 0.7 3+4 1.22 0.85 5+6 1.43 0.7 7 0.60 0.8 8+ 1.19 0.7
Table 11: The resource indices for each super-area calculated us-ing the data in Tables 1a-e and the critical values below which the Exceptional Circumstances (EC) rule would be invoked.
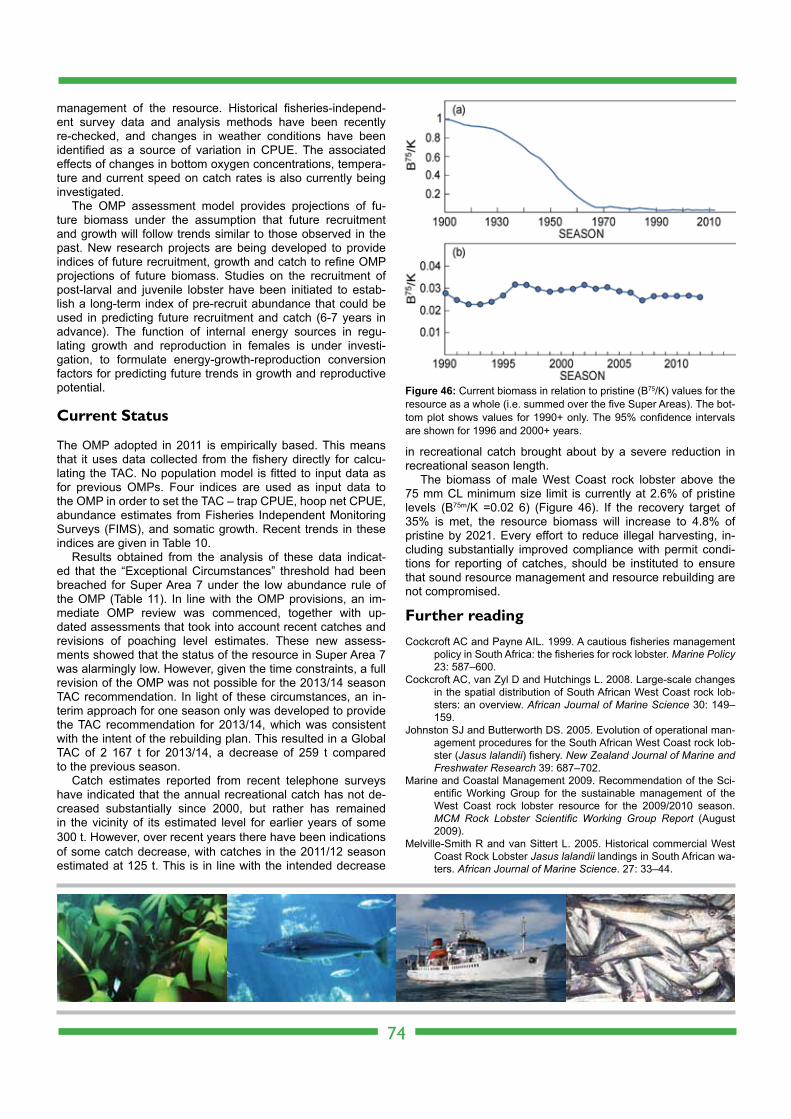
1
management of the resource. Historical fisheries-independ-ent survey data and analysis methods have been recently re-checked, and changes in weather conditions have been identified as a source of variation in CPUE. The associated effects of changes in bottom oxygen concentrations, tempera-ture and current speed on catch rates is also currently being investigated.
The OMP assessment model provides projections of fu-ture biomass under the assumption that future recruitment and growth will follow trends similar to those observed in the past. New research projects are being developed to provide indices of future recruitment, growth and catch to refine OMP projections of future biomass. Studies on the recruitment of post-larval and juvenile lobster have been initiated to estab-lish a long-term index of pre-recruit abundance that could be used in predicting future recruitment and catch (6-7 years in advance). The function of internal energy sources in regu-lating growth and reproduction in females is under investi- gation, to formulate energy-growth-reproduction conversion factors for predicting future trends in growth and reproductive potential.
Current Status
The OMP adopted in 2011 is empirically based. This means that it uses data collected from the fishery directly for calcu-lating the TAC. No population model is fitted to input data as for previous OMPs. Four indices are used as input data to the OMP in order to set the TAC – trap CPUE, hoop net CPUE, abundance estimates from Fisheries Independent Monitoring Surveys (FIMS), and somatic growth. Recent trends in these indices are given in Table 10.
Results obtained from the analysis of these data indicat-ed that the “Exceptional Circumstances” threshold had been breached for Super Area 7 under the low abundance rule of the OMP (Table 11). In line with the OMP provisions, an im-mediate OMP review was commenced, together with up- dated assessments that took into account recent catches and revisions of poaching level estimates. These new assess- ments showed that the status of the resource in Super Area 7 was alarmingly low. However, given the time constraints, a full revision of the OMP was not possible for the 2013/14 season TAC recommendation. In light of these circumstances, an in-terim approach for one season only was developed to provide the TAC recommendation for 2013/14, which was consistent with the intent of the rebuilding plan. This resulted in a Global TAC of 2 167 t for 2013/14, a decrease of 259 t compared to the previous season.
Catch estimates reported from recent telephone surveys have indicated that the annual recreational catch has not de-creased substantially since 2000, but rather has remained in the vicinity of its estimated level for earlier years of some 300 t. However, over recent years there have been indications of some catch decrease, with catches in the 2011/12 season estimated at 125 t. This is in line with the intended decrease
74
Figure 46: Current biomass in relation to pristine (B75/K) values for the resource as a whole (i.e. summed over the five Super Areas). The bot-tom plot shows values for 1990+ only. The 95% confidence intervals are shown for 1996 and 2000+ years.
in recreational catch brought about by a severe reduction in recreational season length.
The biomass of male West Coast rock lobster above the 75 mm CL minimum size limit is currently at 2.6% of pristine levels (B75m/K =0.02 6) (Figure 46). If the recovery target of 35% is met, the resource biomass will increase to 4.8% of pristine by 2021. Every effort to reduce illegal harvesting, in-cluding substantially improved compliance with permit condi-tions for reporting of catches, should be instituted to ensure that sound resource management and resource rebuilding are not compromised.
Further readingCockcroft AC and Payne AIL. 1999. A cautious fisheries management
policy in South Africa: the fisheries for rock lobster. Marine Policy 23: 587–600.
Cockcroft AC, van Zyl D and Hutchings L. 2008. Large-scale changes in the spatial distribution of South African West Coast rock lob-sters: an overview. African Journal of Marine Science 30: 149–159.
Johnston SJ and Butterworth DS. 2005. Evolution of operational man-agement procedures for the South African West Coast rock lob-ster (Jasus lalandii) fishery. New Zealand Journal of Marine and Freshwater Research 39: 687–702.
Marine and Coastal Management 2009. Recommendation of the Sci-entific Working Group for the sustainable management of the West Coast rock lobster resource for the 2009/2010 season. MCM Rock Lobster Scientific Working Group Report (August 2009).
Melville-Smith R and van Sittert L. 2005. Historical commercial West Coast Rock Lobster Jasus lalandii landings in South African wa-ters. African Journal of Marine Science. 27: 33–44.

175
Notes.................................................................................................................................................................................................................
.................................................................................................................................................................................................................
.................................................................................................................................................................................................................
.................................................................................................................................................................................................................
.................................................................................................................................................................................................................
.................................................................................................................................................................................................................
.................................................................................................................................................................................................................
.................................................................................................................................................................................................................
.................................................................................................................................................................................................................
.................................................................................................................................................................................................................
.................................................................................................................................................................................................................
.................................................................................................................................................................................................................
.................................................................................................................................................................................................................
.................................................................................................................................................................................................................
.................................................................................................................................................................................................................
.................................................................................................................................................................................................................
.................................................................................................................................................................................................................
.................................................................................................................................................................................................................
.................................................................................................................................................................................................................
.................................................................................................................................................................................................................
.................................................................................................................................................................................................................
.................................................................................................................................................................................................................

176
.................................................................................................................................................................................................................
.................................................................................................................................................................................................................
.................................................................................................................................................................................................................
.................................................................................................................................................................................................................
.................................................................................................................................................................................................................
.................................................................................................................................................................................................................
.................................................................................................................................................................................................................
.................................................................................................................................................................................................................
.................................................................................................................................................................................................................
.................................................................................................................................................................................................................
.................................................................................................................................................................................................................
.................................................................................................................................................................................................................
.................................................................................................................................................................................................................
.................................................................................................................................................................................................................
.................................................................................................................................................................................................................
.................................................................................................................................................................................................................
.................................................................................................................................................................................................................
.................................................................................................................................................................................................................
.................................................................................................................................................................................................................
.................................................................................................................................................................................................................
.................................................................................................................................................................................................................
.................................................................................................................................................................................................................

177