philippine marine fishery resources
TRANSCRIPT

7/29/2019 Philippine Marine Fishery Resources
http://slidepdf.com/reader/full/philippine-marine-fishery-resources 1/36
Ph i l i p p i n e
Ma r i n e F i sh er y
Resources
7/29/2019 Philippine Marine Fishery Resources
http://slidepdf.com/reader/full/philippine-marine-fishery-resources 2/36
TABLE OF CONTENTS
List of Tables 94
List of Figures 95List of Appendix Tables 96List of Appendix Figures 97
A. Introduction 99
B. Conceptual Framework 101
B.1 Scope and Coverage 101
B.2 Framework for the Asset Account 101
C. Operationalizing the Framework 102
C.1 Sources of Data 103
C.2 Estimation Methodology 103
C.2.1. Fish Stock 103C.2.2. Fish Catch 103
C.2.3. Fishing Effort 104C.2.4. Sustainable Yield 105C.2.5. Depletion 105
C.2.6. Environmentally Adjusted Net Value Added 106
D. Analysis, Results and Discussions 106
E. Recommendations 111
Acronyms 113Definition of Terms 114
Appendices 117
1. Tables 1182. Figure 127
Literature Cited 128
7/29/2019 Philippine Marine Fishery Resources
http://slidepdf.com/reader/full/philippine-marine-fishery-resources 3/36
LIST OF TABLES
Table Number Ti tle Page
1 Per Capita Consumption, Fish Production 107and Population in the Philippines, 1985-1993
2 Contribution of Fishery GVA to AFF-GVA and 108
GDP, 1985-1993
3 Estimated Value of Marine Fishery Resource 109
Depletion, 1985-1993
4 Estimated GVA, NVA and EVA for Marine 111Fishery, 1985-1993
7/29/2019 Philippine Marine Fishery Resources
http://slidepdf.com/reader/full/philippine-marine-fishery-resources 4/36
LIST OF FIGURES
Figure Number Ti tle Page
1 Asset Accounts Framework for Fishery Resources 101
2 Total Production and Per Capita Consumption of Fish, 107
1985-1993
3 GVA of Total Fishery and Percentage to AFF and GDP 108
4 Sustainable Yield, Actual Catch and Depletion, 1988-1993 109
5 Net Value Added (NVA) and Environmentally Adjusted 111
Net Value Added (EVA), 1985-1993
7/29/2019 Philippine Marine Fishery Resources
http://slidepdf.com/reader/full/philippine-marine-fishery-resources 5/36
LIST OF APPENDIX TABLES
Table Number Ti tle Page
Appendix Table 1. Total Marine Fish Catch, 1976-1993 118
Appendix Table 2. Actual Estimates: Horsepower and Marine Fish 119
Catch and the Computed CPUE of
Commercial Fishing Vessels by Type of Gear,1976-1993
Appendix Table 3. Corrected Estimates: Horsepower and Marine 120Fish Catch of Commercial Fishing Vessels by
Type of Gear, 1976-1993
Appendix Table 4. Commercial and Municipal Horsepower Adjusted 121to Purse Seine Equivalent, 1976-1993
Appendix Table 5. Number of Fishers and Horsepower Equivalent 122 Adjusted to Purse Seine Equivalent, 1976-1993
Appendix Table 6. Total Fishing Effort in Purse Seine Equivalent, 123
1976-1993
Appendix Table 7. Summary Output o f Regression 124
Appendix Table 8. Estimated Marine Fishery Resource 125
Depletion, 1976-1993
Appendix Table 9. Estimated Net Rent for Marine 126Fishery Resources, 1985-1993

7/29/2019 Philippine Marine Fishery Resources
http://slidepdf.com/reader/full/philippine-marine-fishery-resources 6/36
LIST OF APPENDIX FIGURE
Figure Number Ti tle Page
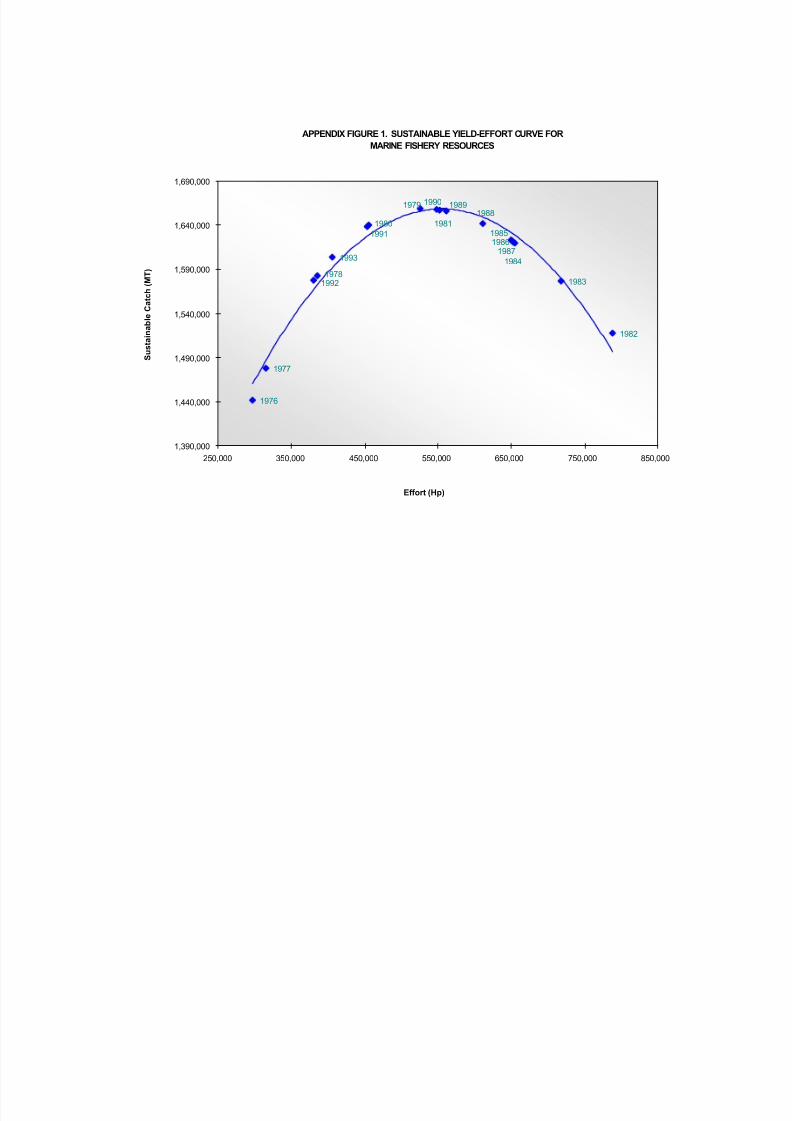
Appendix Figure 1. Sustainable Yield-Effort Curve for Philippine 127Marine Fishery Resources
7/29/2019 Philippine Marine Fishery Resources
http://slidepdf.com/reader/full/philippine-marine-fishery-resources 7/36
Environmental and Natural Resource Accounting
Philippine Marine Fishery Resources99
A. INTRODUCTION
The Philippines consists of 7,100 islands and islets with a coastline of about
18,000 kilometers. Its territorial waters cover about 2.2 million square kilometers, twelvepercent of which is coastal while eighty-eight percent is oceanic, including the ExclusiveEconomic Zone (EEZ). The Philippine coastal ecosystem is comprised of biologically
productive habitats such as mangroves, seagrasses and coral reefs that support thecountry’s marine fisheries. The country is also endowed with 569,600 hectares of freshwater ecosystem that includes lakes, major rivers, reservoirs, swamplands and
fishponds. The diverse aquatic resources favor the development of the variousinterrelated but distinct components of the coastal zone.
During the past decade, the Philippine coastal zone has been under intensepressure from overfishing
1. Fishing capacity for demersal and small pelagic fisheries
exceeded the levels allowed to ensure maximum productivity of fish stocks. The
nearshore fish stocks are believed to have been fished most heavily. Furthermore, due to
the extent of overfishing in the country, small and juvenile fish are now being caughtalong with the bigger fish, further slowing down the natural recovery of the fish stocks.
The country’s increasing population further aggravates the situation as it causes acorresponding increase in the demand for fish.
Fishing is the major source of livelihood in coastal zones. In the absence of alternative sources of income in the area, however, an increasingly conflicting situation inthe use of fishery resources results. Cases of illegal fishing among commercial and
municipal fishermen have been plaguing the industry. Our laws prohibit commercialfishing vessels (vessels which exceed the three gross ton capacity limit) from fishingwithin 15 kilometers from the shore. Yet many commercial fishing vessels compete with
municipal fishing vessels in nearshore fishing grounds. Owing to the fact that commercialfishing vessels have bigger storage space and nets with bigger fishing capacities thanthose of municipal fishing boats, the encroachment of commercial fishermen on municipal
fishing grounds effectively crowds out the municipal fishermen in the area. This alsoleaves the municipal fishing grounds unproductive and less able to replenish the fishstocks.
Other environmental damages, which are mostly due to activities of man, also
contributed to the degradation of coastal zone resources. Such activities include
destructive fishing practices, which destroy the coral reefs; inland logging, which causessiltation; and industrialization, which causes pollution. Not to be discounted are thewastes produced by the consumption activities of the overgrowing population.
It is believed that fishing has not been maximized in the offshore and EEZ waters,which constitute 88 percent of the area of marine waters. Some foreign commercial
fishing companies with modern technology and equipment have been illegally fishing inthe EEZ waters of the country to maximize catch. Philippine commercial fishermen are
deterred from venturing into these areas because of high fuel costs, inadequateinformation on availability of resources in offshore waters, lack of technical expertise onpost-harvest handling and obsolete fishing fleet.
2
The importance of fishery in the Philippine economy can not be understated. It isthe country’s second staple food next to rice. For the period 1988-1993 at constant 1985prices, the contribution of the fishery sector to the country’s gross domestic product
1 Philippine Fisheries Sector Program, 19932 Ibid.
7/29/2019 Philippine Marine Fishery Resources
http://slidepdf.com/reader/full/philippine-marine-fishery-resources 8/36
Environmental and Natural Resource Accounting
Philippine Marine Fishery Resources100
(GDP) averaged 4.5 percent (NSCB, 1994). The fishing industry also provides
employment to around 1.4 million Filipinos, equivalent to six percent of the country’s totallabor force (PFSP, 1993).
In 1990, the Philippines ranked eleventh in the world in terms of total fishproduction, yielding a total of 2.27 million metric tons. The country also ranked third intuna production and was the top producer of cultivated seaweed (carageenan) in the
world (Padilla, 1994).
Because of its importance, concern for the fishery sector has been incorporated
in the government's development plans as early as the 1978 to 1982 Medium TermDevelopment Plan (MTDP). It was during this time that the country's growingenvironmental problems began to be accorded a higher priority. Today, the current
MTDP (1992-1998) gives emphasis on the following policies on fisheries and aquaticresource management:
1. Intensify the implementation of resource management and conservation
programs by protecting and rehabilitating traditional fishing grounds, coralreefs, mangrove and other habitats of marine life, and designating
coastal resources for the exclusive use of subsistence municipalfisherfolk in consultation with the local government units (LGUs);
2. Conduct an inventory of remaining mangrove areas and prohibit their conversion;
3. Formulate a framework for coastal research and provide means for itsimplementation;
4. Establish more marine nature reserves;
5. Conduct more baseline studies on the ecological characteristics and
dynamics of corals and marine ecosystem diversity productivity; and
6. Expand deep-sea fishing to non-traditional fishing grounds in thePhilippine EEZ.
However, information necessary for the formulation of policies and plans for thefishery sector in accordance with the concept of sustainable development is still wanting,
as with other natural resources and the environment in general. Nevertheless, there areseveral macro-economic indicators relating to the performance of the fishery sector, aswell as biological and environmental information on this resource and the related
ecosystem. Attempts to develop a common framework that addresses consistently botheconomic and natural resource/environmental problems have been initiated, althoughthey are mostly fragmented and are still in their initial stages. Hence, a working
document towards this end is still lacking.
Natural resources have always been considered as free goods, such that the
conventional national accounts do not value the use of these resources. Hence, themedium and long-term plans for the economy, which use these macroeconomicaggregates, do not link with the policies concerning natural resources.
This study demonstrates the accounting and valuation of the use of these naturalresources, specifically fishery resource as input to fishing activity, and the monitoring of
the corresponding stocks. This paper is organized as follows: 1) the conceptualframework; 2) operationalizing the framework which includes sources of data and
7/29/2019 Philippine Marine Fishery Resources
http://slidepdf.com/reader/full/philippine-marine-fishery-resources 9/36
Environmental and Natural Resource Accounting
Philippine Marine Fishery Resources101
estimation methodology; 3) results and discussions; and 4) recommendations for the
improvement of fishery resource accounting.
B. CONCEPTUAL FRAMEWORK
B.1. Scope and Coverage
Fishery resource accounts cover the cultivated fish stock and stock of other
aquatic animals in fishponds and farms, as well as non-cultivated fish stocks and other aquatic animals in the ocean and in the inland and coastal waters. Specifically, cultivatedfishery resources cover aquaculture and mariculture, while the non-cultivated fishery
resources include marine and freshwater fisheries. Due to data limitations, this initialstudy is confined only to marine fisheries.
B.2. Framework for the Asset Account
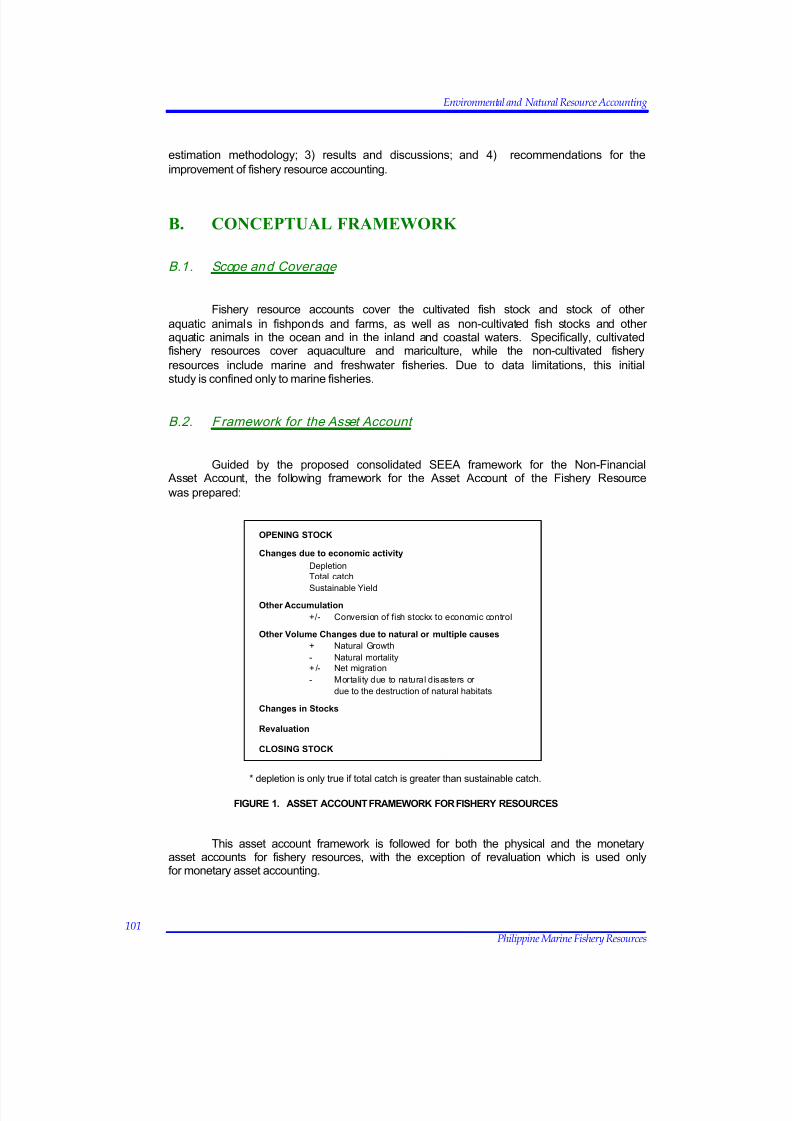
Guided by the proposed consolidated SEEA framework for the Non-Financial Asset Account, the following framework for the Asset Account of the Fishery Resource
was prepared:
* depletion is only true if total catch is greater than sustainable catch.
FIGURE 1. ASSET ACCOUNT FRAMEWORK FOR FISHERY RESOURCES
This asset account framework is followed for both the physical and the monetaryasset accounts for fishery resources, with the exception of revaluation which is used onlyfor monetary asset accounting.
OPENING STOCK
Changes due to economic activity
Depletion
Total catch
Sustainable Yield
Other Accumulation
+/- Conversion of fish stockx to economic control
Other Volume Changes due to natural or multiple causes
+ Natural Growth
- Natural mortality
+ /- Net migration
- Mortality due to natural disasters or
due to the destruction of natural habitats
Changes in Stocks
Revaluation
CLOSING STOCK
7/29/2019 Philippine Marine Fishery Resources
http://slidepdf.com/reader/full/philippine-marine-fishery-resources 10/36
Environmental and Natural Resource Accounting
Philippine Marine Fishery Resources102
For non-cultivated fishery, which constitutes marine and fresh water resources,
changes in stocks are due to depletion, other accumulation and other volume changes.Depletion is accounted for when fish caught exceeds the sustainable yield, that is, when
harvest exceeds natural growth. Since fish is a renewable resource, the stock of fish canbe increased if allowed to regenerate. But fish can only regenerate to a level allowed bythe carrying capacity of the ecosystem. Given the capacity of the fish to regenerate andits natural life span, the use of this resource when provided for by its natural growth is not
considered depletion. Other accumulation is the conversion of non-cultivated fish stocksto economic control, considered as “economic appearance” in the 1993 SNA.
Natural growth, natural mortality, net migration and mortality due to naturaldisasters or due to the destruction of natural habitats make up other volume changeswhich affect the closing stock of non-cultivated fishery resources.
C. OPERATIONALIZING THE FRAMEWORK
The study recognizes the complexity of fishery resource accounting, taking intoconsideration the highly mobile nature of fishery resources. Fish stocks can only bemeasured indirectly, using biological modeling. Through the Fox model, a clear
relationship between decreases in stock and increases in fishing effort, with all other factors remaining constant, may be esta blished. However, available data on fishing effortis wanting. Data for fishing effort, defined in terms of resource inputs to fishing activity,
which include the fishing boat, men and gear among others, were regularly collected bythe Bureau of Fisheries and Aquatic Resource (BFAR) until 1980. Collection of this dataset ended with the transfer of the Statistics Division of the BFAR to the Bureau of
Agricultural Statistics (BAS). So for the purposes of this study, fishing effort had to beestimated indirectly using other available parameters and indicators. These will bediscussed in further detail later in the estimation methodology.
As for fish stocks, the Resource Ecological Assessment Study conducted by theBFAR in 1993, which covered 12 major fishing grounds can provide estimates of biomass
for areas covered and other parameters relevant to the compilation of the asset accounts.Level of fish stocks for the entire country, however, is required in this study and the
limited data available cannot be statistically raised to arrive at an estimate for all fishing
grounds.
Depletion, as earlier mentioned, is the extraction of fishery resource beyond the
rate of natural growth, measured as a positive difference between catch and sustainableyield. Sustainable yield is likewise dependent on fishing effort data, the monitoring of which, as mentioned above, has been stopped since 1981. However, special studies and
administrative-based data are available which could provide indicators to estimate thisvariable, but only at the national level and limited to marine fishery resource.
As an initial exercise in operationalizing the concepts of natural resourceaccounting for the fishery resource, depletion will be the only indicator included in theasset account framework to be computed. The estimates on depletion are measured at
the national level for total marine fishery resources. Variables on fish catch andsustainable catch serve as critical input variables in the estimation of depletion.
7/29/2019 Philippine Marine Fishery Resources
http://slidepdf.com/reader/full/philippine-marine-fishery-resources 11/36
Environmental and Natural Resource Accounting
Philippine Marine Fishery Resources103
C.1. Sources of Data
Data used for the fishery study were sourced from agricultural censuses, currentsurveys on fisheries, administrative reports and results of special studies of researchinstitutions. Data on fish production and prices were provided by BAS from Surveys of Commercial and Municipal Fish Landing Centers. Prior to 1980, these data were
generated by BFAR based on regional monitoring reports of licensed fishing vessels.
Cost of production data for commercial fishing were obtained from various
sources such as the Annual Survey of Establishments (ASE) of the National StatisticsOffice (NSO), the Input-Output Tables of the National Statistical Coordination Board(NSCB) and results of special studies on cost of production conducted by research
institutions like the International Center for Living Aquatic Resources Management(ICLARM) and the College of Fisheries, University of the Philippines, Visayas.
Results of fishery studies conducted by the Environment and Natural Resources
Accounting Project (ENRAP) Phase II also provided the parameters for the estimation of fishing effort.
C.2. Estimation Methodology
The succeeding discussions include the methodologies for estimating depletion in
physical and in monetary terms, and also include the estimation of the different inputvariables necessary, given the limited data available.
C.2.1. Fish Stock
Fishery stocks data are not available at present. However, indirect estimation of this variable can be done as soon as the complete results of the 1993 Resource
Ecological Assessment Study (REA) of the BFAR, covering 12 major fishing grounds,become available. This study provides estimates of biomass for areas covered andtackles other parameters relevant in the construction of the asset account. Stock
assessment can only be meaningful, however, if estimated by fishing ground. With anincomplete set of data, the study cannot arrive at an estimate for all fishing grounds.
C.2.2. Fish Catch
Fish catch is one of the variables used in estimating depletion and sustainable
catch. Catch data were classified into commercial and municipal fish production.Municipal production data were further classified into marine and inland fish production.
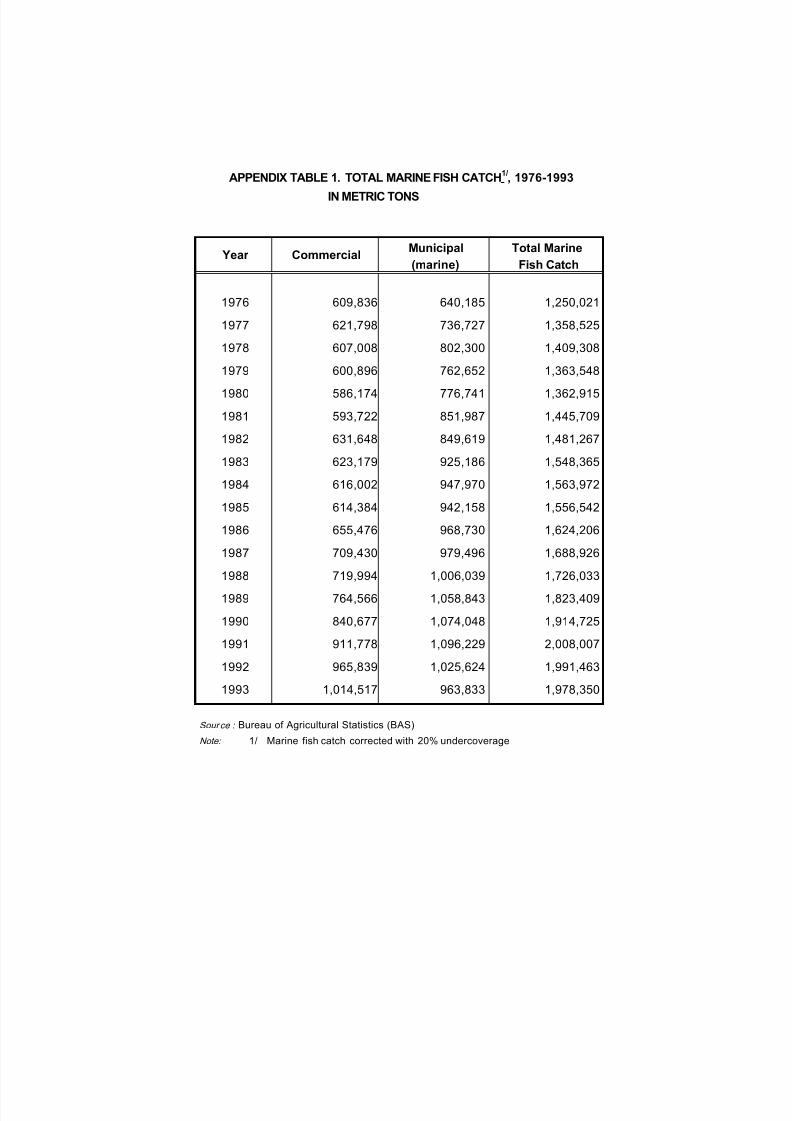
For this study however, total marine fish catch refers to commercial and municipal marinefishes.
To derive the variable on sustainable catch, a longer series on fish catch was
needed. This was obtained by extrapolating the BAS data on fish catch using trends of the BFAR data from 1980 backwards. Fish catch data is likewise used to estimate fishingeffort. To be consistent with the national accounts, a correction factor of 20.0 percent
was applied to reported fish production to account for the under coverage (see Appendix
7/29/2019 Philippine Marine Fishery Resources
http://slidepdf.com/reader/full/philippine-marine-fishery-resources 12/36
Environmental and Natural Resource Accounting
Philippine Marine Fishery Resources104
Table 1, page 118). This ratio was obtained as the percentage difference between the
survey data and the estimated actual production using the commodity flow method.
C.2.3. Fishing Effort
Data on fishing effort is necessary in computing for sustainable catch. Currentproduction surveys do not produce data on fishing effort
3. However, special studies and
administrative-based data are available which can provide indicators to estimate this
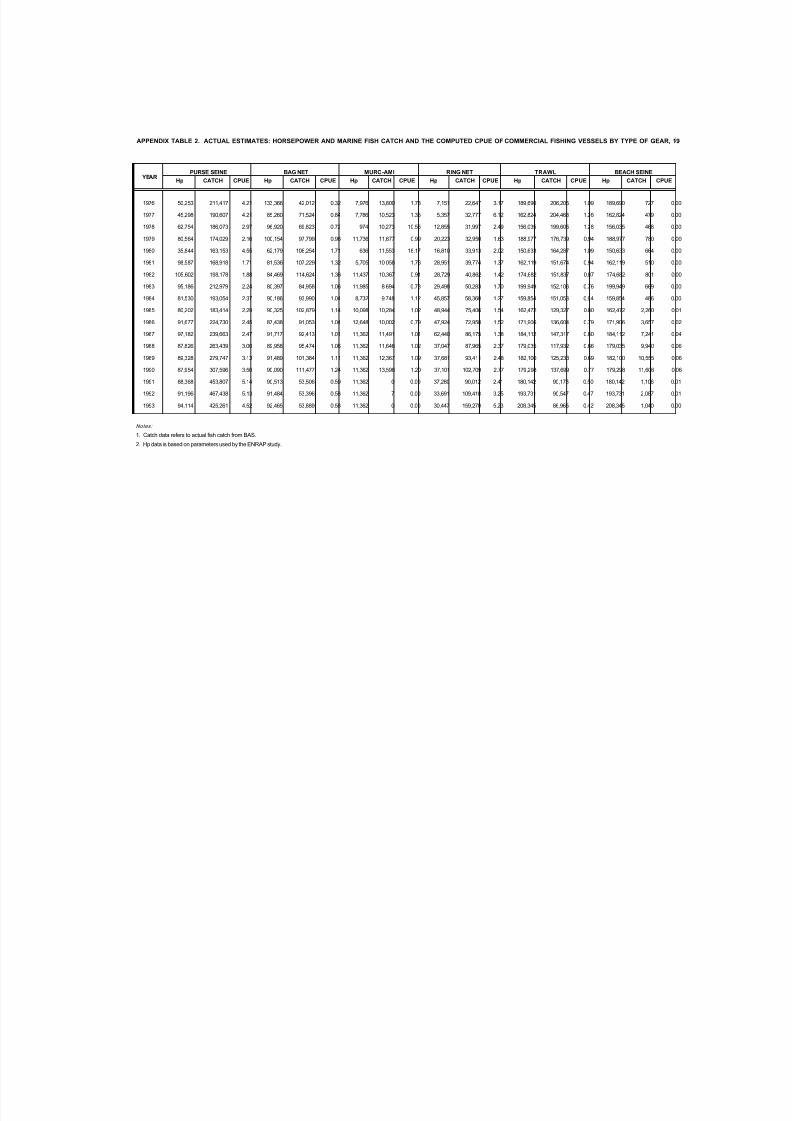
variable, at the national level, and limited to marine fishery resources. As such, fishingeffort was estimated indirectly by using available parameters on horsepower for commercial and municipal fishing vessels.
For commercial fishing effort, expressed in horsepower (hp), the horsepower equivalent was obtained based on the computed catch per unit effort (CPUE). The CPUE
for each major fishing gear was computed based on the actual fish catch data divided bythe estimated parameters on horsepower
4(hp) (see Appendix Table 2, Page 119). CPUE
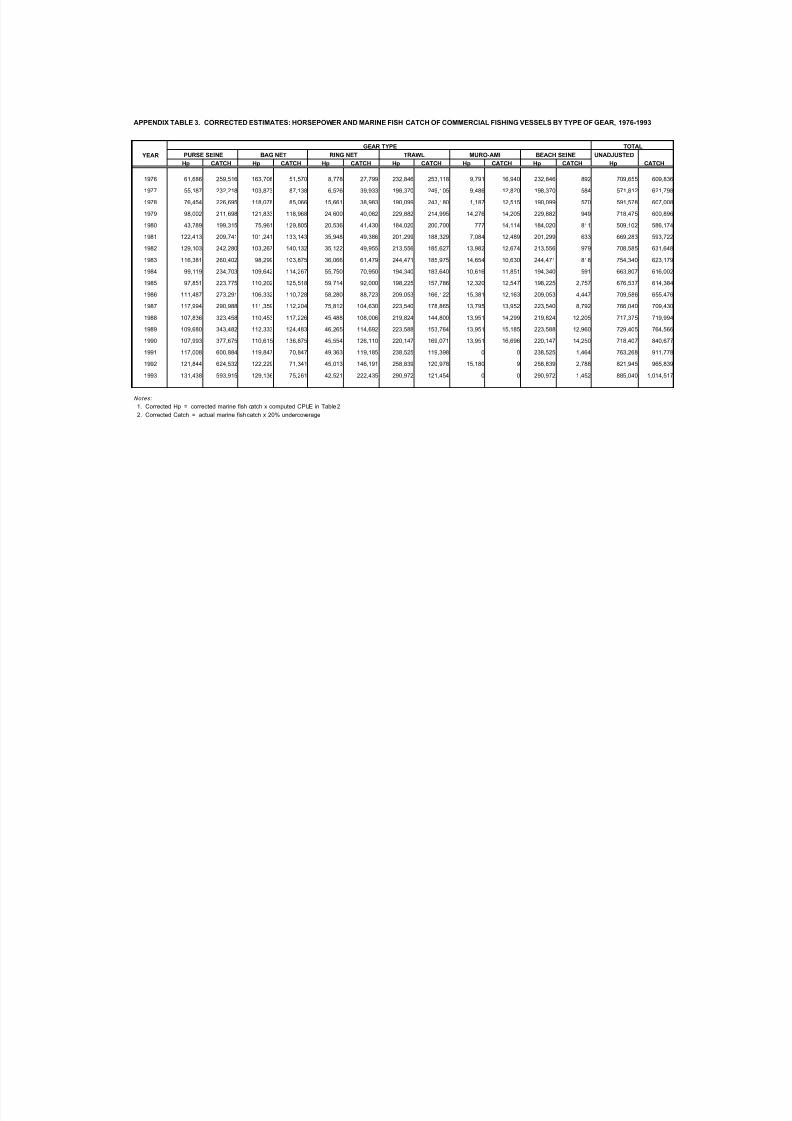
was computed by major fishing gear: purse seine, bagnet, ringnet, trawl, muro-ami andbeach seine. The computation assumes that fishing effort is understated by the samepercentage as catch. Thus, total commercial fishing effort was derived by applying thecomputed CPUE to the corrected commercial fish catch in metric tons, by major fishing
gear (see Appendix Table 3, page 120).
To standardize catching efficiency of the various fishing gears used over a certain
period of time, each of the horsepower of other fishing gears was converted to purseseine equivalent (PS)
5using the ratio of CPUE of each fishing gear to CPUE of purse
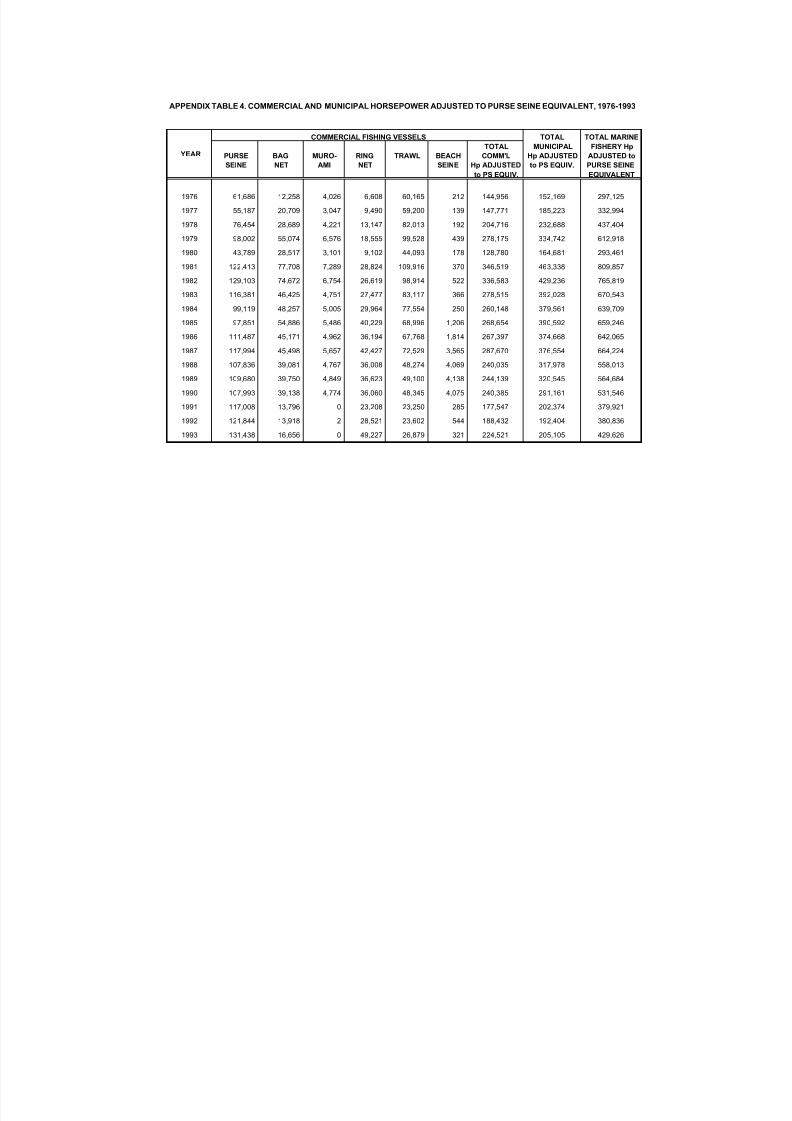
seine (see Appendix Table 4, page 121).
For municipal fishing effort, the available benchmark estimates on horsepower of
municipal fishing vessels and total municipal fishermen by type were obtained from the
results of the 1980 Census of Fisheries. Both sets of data were extrapolated using
ENRAP estimates6
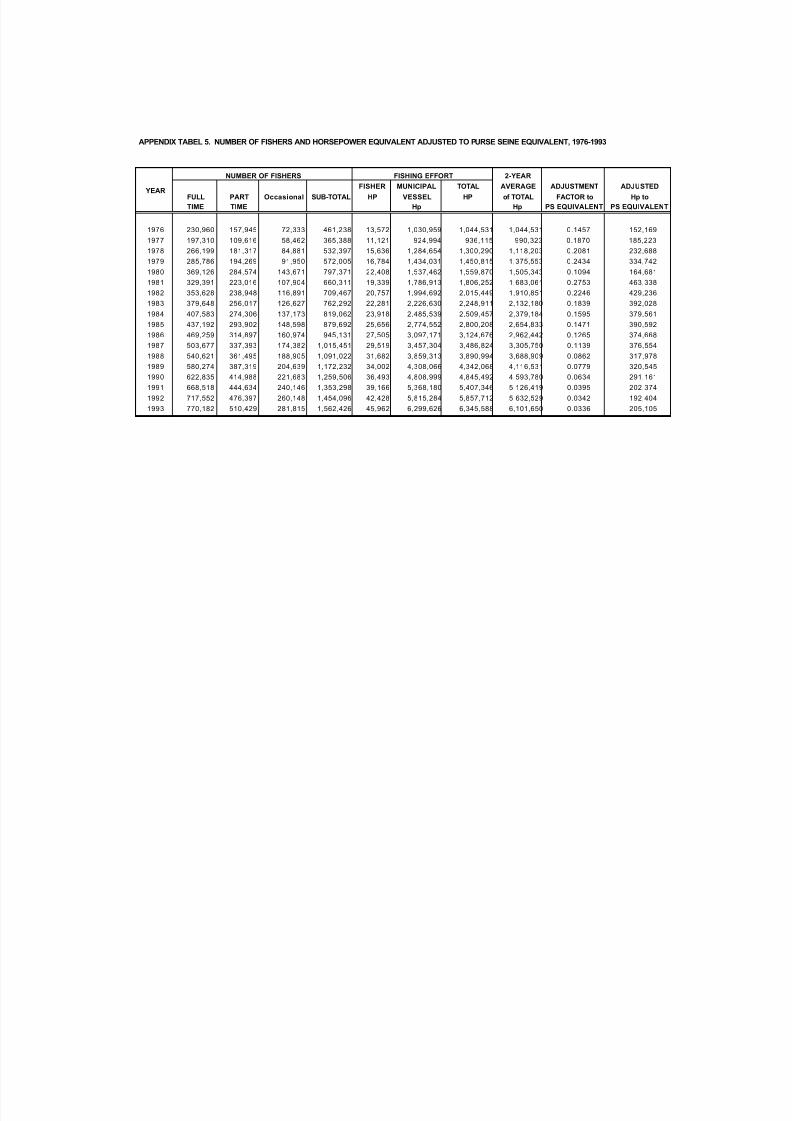
on horsepower of municipal fishing vessels and number of fishermen.To translate number of fishermen to fishing power (hp equivalent), the following
conversion factors7
were applied:
(a) hp of full-time fishermen = number of full-time fishermen x 0.18 Hp x 6/24
hours;(b) hp of part-time fisherman = hp of full-time x 40%; and(c) hp of occasional fishermen = hp of full-time x 11%.
3 Fishing effort and fish catch were generated by BFAR prior to 1980. This was not however continued bythe BAS, which took over data collection from BFAR.
4 The relationship between horsepower and vessel tonnage by fishing gear was estimated by ENRAPbased on data from BFAR.
5 Purse seine equivalent is used to standardize fishing efficiency for the different gears because purse
seine accounts for a large proportion of marine fish landed.
6 ENRAP series on horsepower of municipal fishing vessels and number of fishermen were estimated usingtime series analysis.
7 The constant factors used are based on available studies. The horsepower equivalent of a full-time fisher is placed at 0.18 hp per day (Southeast Asia average), based on a study by Karim (1985) on EnergyExpenditure of a Group of Students. Six hours is assumed to be the number of hours worked by a fisher per day (full-time fishing). Forty percent is the mean percentage of days of actual part-time fishing with respect tofull-time fishing and 11 percent is the mean percentage of actual occasional fishing with respect to full-timefishing.
7/29/2019 Philippine Marine Fishery Resources
http://slidepdf.com/reader/full/philippine-marine-fishery-resources 13/36
Environmental and Natural Resource Accounting
Philippine Marine Fishery Resources105
The above constant factors were applied throughout the series. Total
horsepower equivalent for municipal fishermen is equal to (a) + (b) + (c).
To arrive at total fishing effort in hp equivalent for municipal fishing, fishing effortfor municipal fishing vessels was added to fishing effort of fishermen, afterwhich, a two-year average was computed to obtain a smoother set of time series data. This was thentranslated to PS equivalent following the same methodology used for commercial fishing
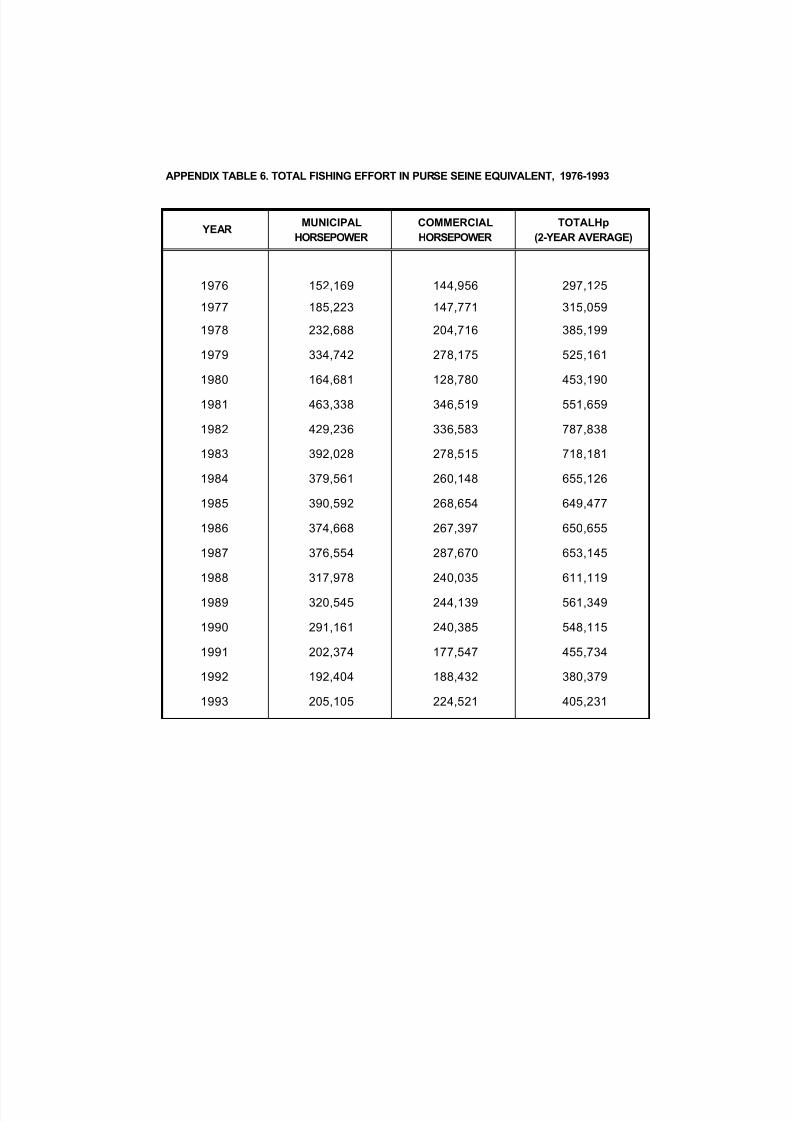
effort in PS equivalent. Results of the above estimates are presented in appendix table 5(page 122). Total fishing effort in PS equivalent for marine fishery is the sum of estimatedcommercial fishing effort and municipal fishing effort, both in PS equivalent (see Appendix
Table 6, page 123).
C.2.4. Sustainable Yield (Catch)
The level of sustainable catch was estimated using the Fox Model8. This model
shows that catch decreases as fishing effort increases, with all other factors remaining
constant. The following equation was used:
Y = E exp (a + b E)
Where: Y = catch or yield from the resource
E = fishing effort per unit timea = constant
b = regression coefficient
The regression coefficient was derived by establishing the relationship betweenthe time series data on fish catch and fishing efforts estimated
9earlier, with an R-square
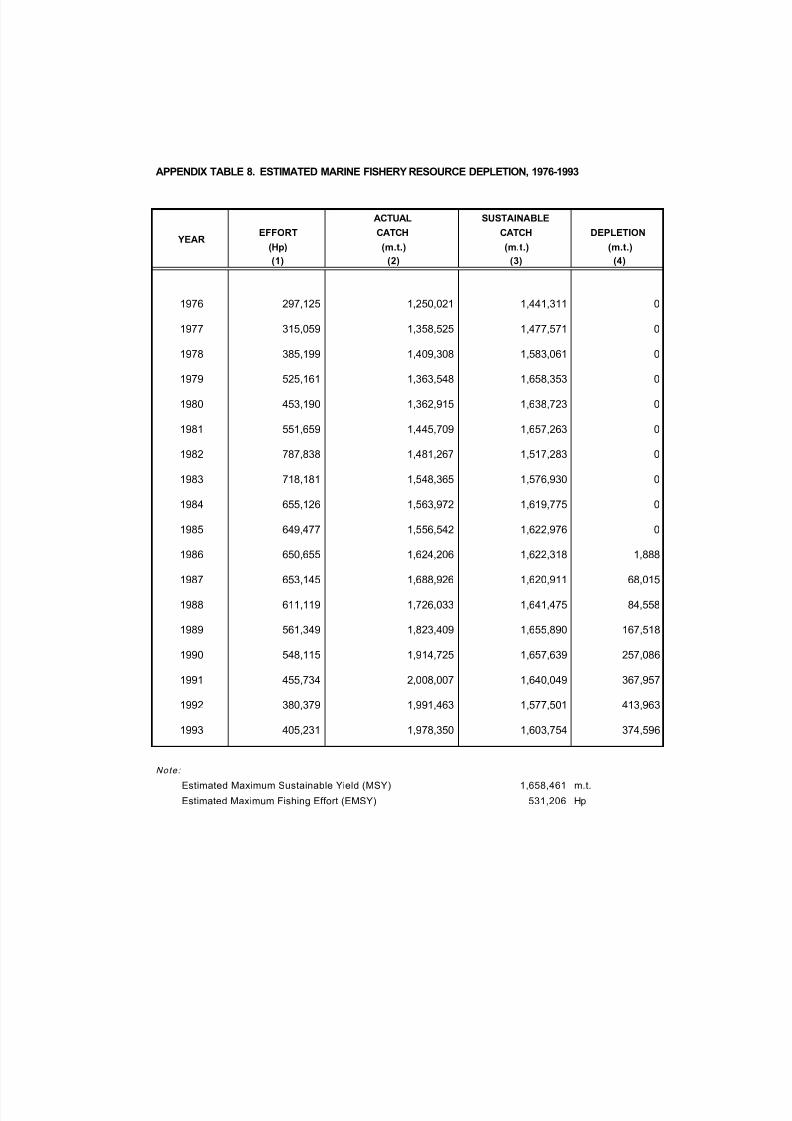
of 0.7960 (see Appendix Table 7, page 124). The sustainable catch level estimated using
the above equation is shown in Appendix Table 8 while the sustainable yield curve is
presented in Appendix Chart 1.
C.2.5. Depletion
Fish is a renewable biological resource that will eventually die if not harvested.
When the harvest of fish exceeds natural growth, depletion occurs. Depletion wascomputed as follows:
Depletion = Actual Catch less Sustainable Catch
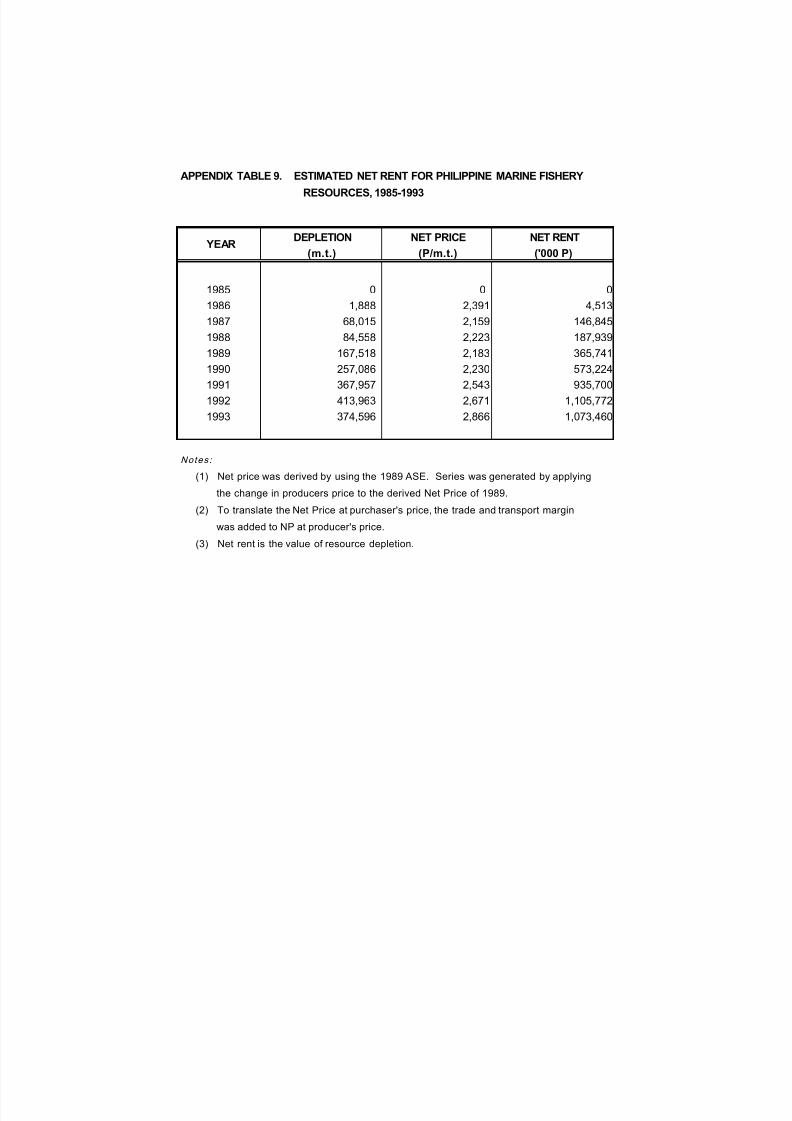
In monetary terms, the value of depletion, expressed as net rent was estimatedusing the Net Price Method, that is,
Net Rent = Net Price per Unit x Depletion
Appendix Table 8 and 9 (page 125&126) present the results of these formulas.
8 1989. FAO Fisheries Technical Paper #306/2. Introduction to Tropical Fish Assessment, Part 1&2.9 Time series of the fishing effort was smoothened using the two-year moving average.
7/29/2019 Philippine Marine Fishery Resources
http://slidepdf.com/reader/full/philippine-marine-fishery-resources 14/36
Environmental and Natural Resource Accounting
Philippine Marine Fishery Resources106
The ASE of the NSO provided the basis for arriving at net rent. To arrive at net
rent, costs of intermediate inputs (fuel, compensation of employees, indirect taxes,depreciation, and a 15.0 percent opportunity cost - based on experts’ opinion - for holding
fixed assets) were subtracted from the gross output valued at producer’s price (grossrevenue). Based on the above computations , the ratio of net rent to gross output wasderived.
Net price at market prices was estimated from net price at producer’s price.Since ASE data do not provide information on the corresponding catch, the net price atproducer’s price was obtained by applying the ratio of net rent to gross output, which is
12.2 percent, to the producer’s price10
of fish. The trend of producer’s price was appliedto derive estimates of net price.
C.2.6. Envi ronmentall y Adjusted Net Value Added (EVA)
The net value added (NVA) includes factor payments to production, namely,
compensation, indirect taxes less subsidies, and net operating surplus (excludes the costof depreciation of fixed assets). From the computed NVA, the resulting net rent wasdeducted to arrive at an estimate for environmentally adjusted NVA. However, onlydepletion of fish stocks, as a component of the asset account that effects the changes in
the closing stock, was computed in this study. All other factors have yet to be included inthe preliminary estimate of environmentally adjusted NVA.
Available data from the National Accounts cover estimates of gross value added(GVA) of the fishery sector by factor shares. The GVA estimates at current prices for fishery were derived using the formula:
GVAt = Qt x (1+UNC) x Pt x GVAR
where : Qt = quantity of productionUNC = undercoverage ratio
Pt = current producer’s priceGVAR = gross value added ratio
Separate estimations were done for commercial and municipal marine fishing togenerate total GVA for marine fishery. However, since the breakdown of GVA by factor
share is not available separately for commercial and marine municipal fishing, the samestructure as the total fishery sector was used. NVA was estimated by deducting thedepreciation cost of fixed assets from the computed GVA.
D. ANALYSIS, RESULTS AND DISCUSSIONS
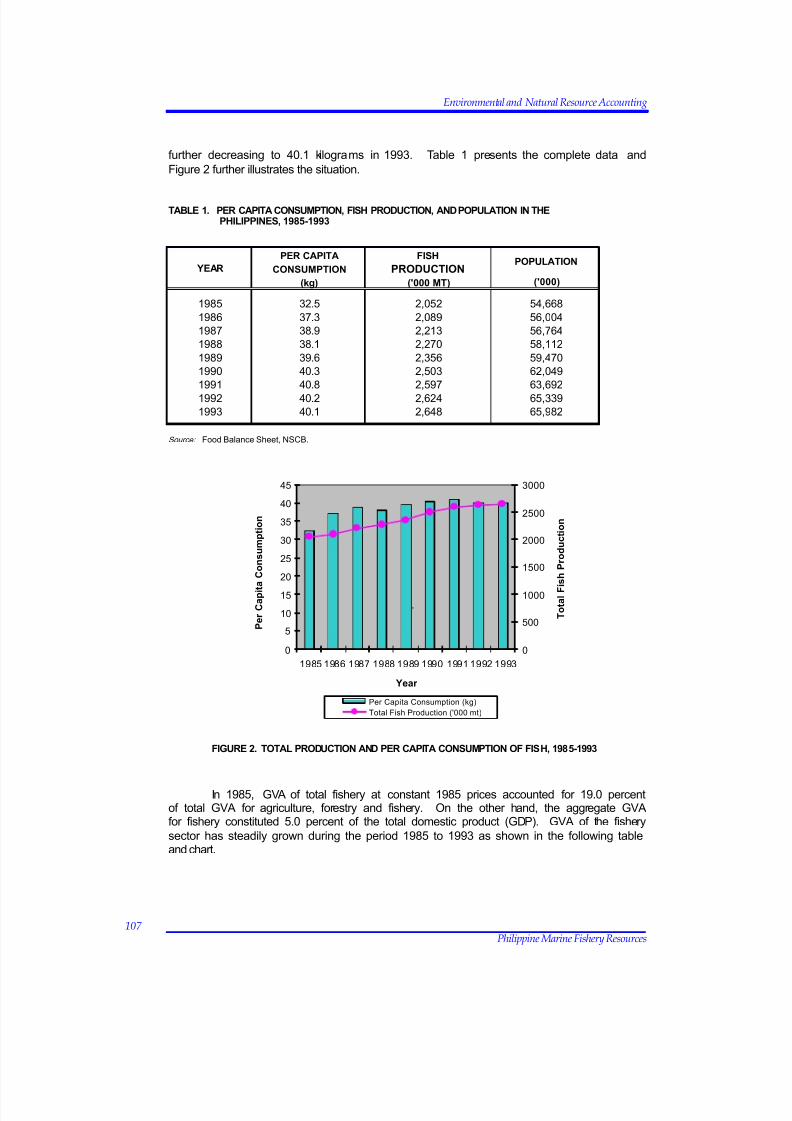
The importance of the fishery resources lies heavily on its ability to support thepopulation’s food requirements. Increasing population demands for increased fishproduction. Thus, from the period 1985 to 1993, total fish production continued to
increase. Per capita fish consumption also showed an increasing trend from 32.5kilograms in 1985 to 40.9 in 1991. In 1992, however, this declined to 40.2 kilogram s,
10 Producers Price for fish was generated from the BAS Survey of fish landing centers.
7/29/2019 Philippine Marine Fishery Resources
http://slidepdf.com/reader/full/philippine-marine-fishery-resources 15/36
Environmental and Natural Resource Accounting
Philippine Marine Fishery Resources107
further decreasing to 40.1 kilograms in 1993. Table 1 presents the complete data and
Figure 2 further illustrates the situation.
TABLE 1. PER CAPITA CONSUMPTION, FISH PRODUCTION, AND POPULATION IN THEPHILIPPINES, 1985-1993
FIGURE 2. TOTAL PRODUCTION AND PER CAPITA CONSUMPTION OF FISH, 1985-1993
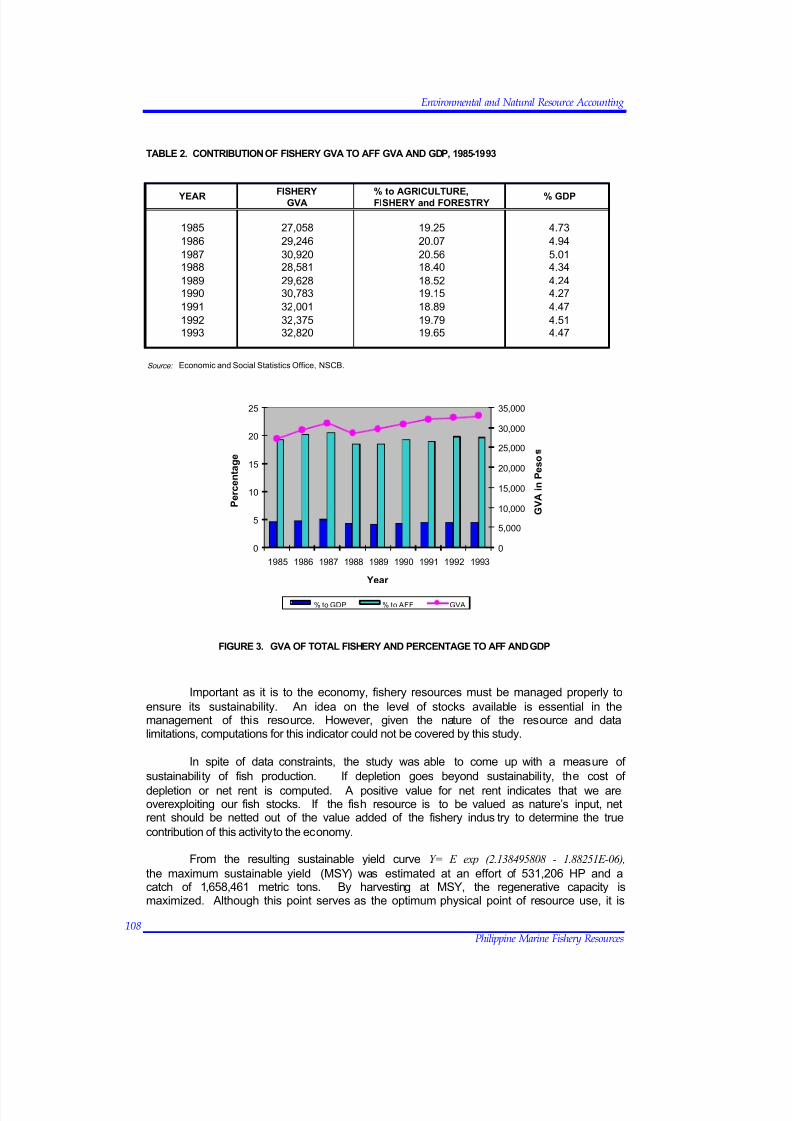
In 1985, GVA of total fishery at constant 1985 prices accounted for 19.0 percentof total GVA for agriculture, forestry and fishery. On the other hand, the aggregate GVAfor fishery constituted 5.0 percent of the total domestic product (GDP). GVA of the fishery
sector has steadily grown during the period 1985 to 1993 as shown in the following tableand chart.
0
5
10
15
20
25
30
35
40
45
1985 1986 1987 1988 1989 1990 1991 1992 1993
Year
P e r C a p i t
a C o n s u m p t i o n
0
500
1000
1500
2000
2500
3000
T o t a l F
i s h P r o d u c t i o n
Per Capita Consumption (kg)
Total Fish Production ('000 mt)
.
PER CAPITA FISH
CONSUMPTION PRODUCTION
(kg) ('000 MT) ('000)
1985 32.5 2,052 54,668
1986 37.3 2,089 56,004
1987 38.9 2,213 56,764
1988 38.1 2,270 58,112
1989 39.6 2,356 59,470
1990 40.3 2,503 62,049
1991 40.8 2,597 63,692
1992 40.2 2,624 65,339
1993 40.1 2,648 65,982
Source: Food Balance Sheet, NSCB.
YEARPOPULATION
7/29/2019 Philippine Marine Fishery Resources
http://slidepdf.com/reader/full/philippine-marine-fishery-resources 16/36
Environmental and Natural Resource Accounting
Philippine Marine Fishery Resources108
TABLE 2. CONTRIBUTION OF FISHERY GVA TO AFF GVA AND GDP, 1985-1993
FIGURE 3. GVA OF TOTAL FISHERY AND PERCENTAGE TO AFF AND GDP
Important as it is to the economy, fishery resources must be managed properly to
ensure its sustainability. An idea on the level of stocks available is essential in themanagement of this resource. However, given the nature of the resource and datalimitations, computations for this indicator could not be covered by this study.
In spite of data constraints, the study was able to come up with a measure of
sustainability of fish production. If depletion goes beyond sustainability, the cost of
depletion or net rent is computed. A positive value for net rent indicates that we areoverexploiting our fish stocks. If the fish resource is to be valued as nature’s input, netrent should be netted out of the value added of the fishery indus try to determine the true
contribution of this activity to the economy.
From the resulting sustainable yield curve Y= E exp (2.138495808 - 1.88251E-06),
the maximum sustainable yield (MSY) was estimated at an effort of 531,206 HP and acatch of 1,658,461 metric tons. By harvesting at MSY, the regenerative capacity ismaximized. Although this point serves as the optimum physical point of resource use, it is
FISHERY % to AGRICULTURE,GVA FISHERY and FORESTRY
1985 27,058 19.25 4.73
1986 29,246 20.07 4.94
1987 30,920 20.56 5.011988 28,581 18.40 4.34
1989 29,628 18.52 4.241990 30,783 19.15 4.27
1991 32,001 18.89 4.47
1992 32,375 19.79 4.511993 32,820 19.65 4.47
Source: Economic and Social Statistics Office, NSCB.
YEAR % GDP
0
5
10
15
20
25
1985 1986 1987 1988 1989 1990 1991 1992 1993
Year
P e r c e n
t a g e
0
5,000
10,000
15,000
20,000
25,000
30,000
35,000
G V A i n P e s o
% to GDP % to AFF GVA
7/29/2019 Philippine Marine Fishery Resources
http://slidepdf.com/reader/full/philippine-marine-fishery-resources 17/36
Environmental and Natural Resource Accounting
Philippine Marine Fishery Resources109
not the economically optimal management policy. The point where harvesting is
rewarding is where marginal revenue (MR) is equal to marginal cost (MC).
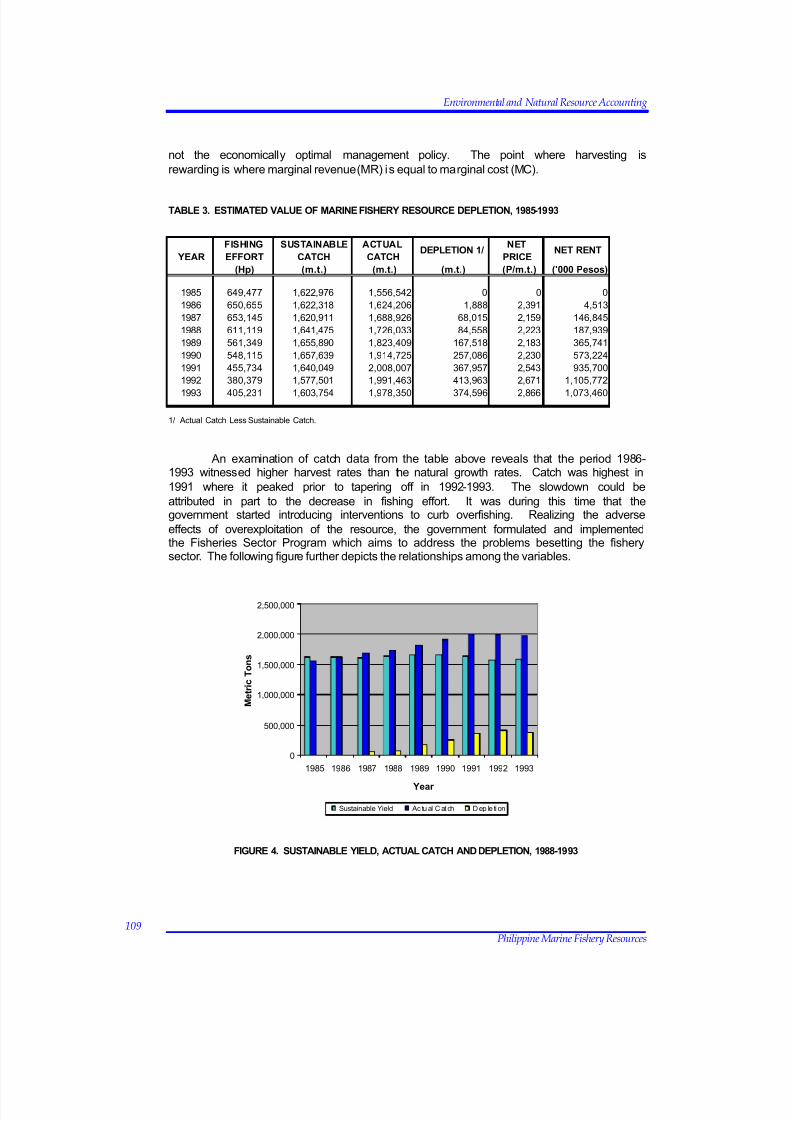
TABLE 3. ESTIMATED VALUE OF MARINE FISHERY RESOURCE DEPLETION, 1985-1993
An examination of catch data from the table above reveals that the period 1986-1993 witnessed higher harvest rates than the natural growth rates. Catch was highest in
1991 where it peaked prior to tapering off in 1992-1993. The slowdown could be
attributed in part to the decrease in fishing effort. It was during this time that thegovernment started introducing interventions to curb overfishing. Realizing the adverse
effects of overexploitation of the resource, the government formulated and implementedthe Fisheries Sector Program which aims to address the problems besetting the fisherysector. The following figure further depicts the relationships among the variables.
FIGURE 4. SUSTAINABLE YIELD, ACTUAL CATCH AND DEPLETION, 1988-1993
FISHING SUSTAINABLE ACTUAL NET
EFFORT CATCH CATCH PRICE
(Hp) (m.t.) (m.t.) (m.t.) (P/m.t.) ('000 Pesos)
1985 649,477 1,622,976 1,556,542 0 0 0
1986 650,655 1,622,318 1,624,206 1,888 2,391 4,513
1987 653,145 1,620,911 1,688,926 68,015 2,159 146,845
1988 611,119 1,641,475 1,726,033 84,558 2,223 187,939
1989 561,349 1,655,890 1,823,409 167,518 2,183 365,741
1990 548,115 1,657,639 1,914,725 257,086 2,230 573,224
1991 455,734 1,640,049 2,008,007 367,957 2,543 935,700
1992 380,379 1,577,501 1,991,463 413,963 2,671 1,105,772
1993 405,231 1,603,754 1,978,350 374,596 2,866 1,073,460
1/ Actual Catch Less Sustainable Catch.
DEPLETION 1/ NET RENT YEAR
0
500,000
1,000,000
1,500,000
2,000,000
2,500,000
1985 1986 1987 1988 1989 1990 1991 1992 1993
Year
M e t r i c T o n s
Sustainable Yield Ac tu al C at ch D ep le ti on
7/29/2019 Philippine Marine Fishery Resources
http://slidepdf.com/reader/full/philippine-marine-fishery-resources 18/36
Environmental and Natural Resource Accounting
Philippine Marine Fishery Resources110
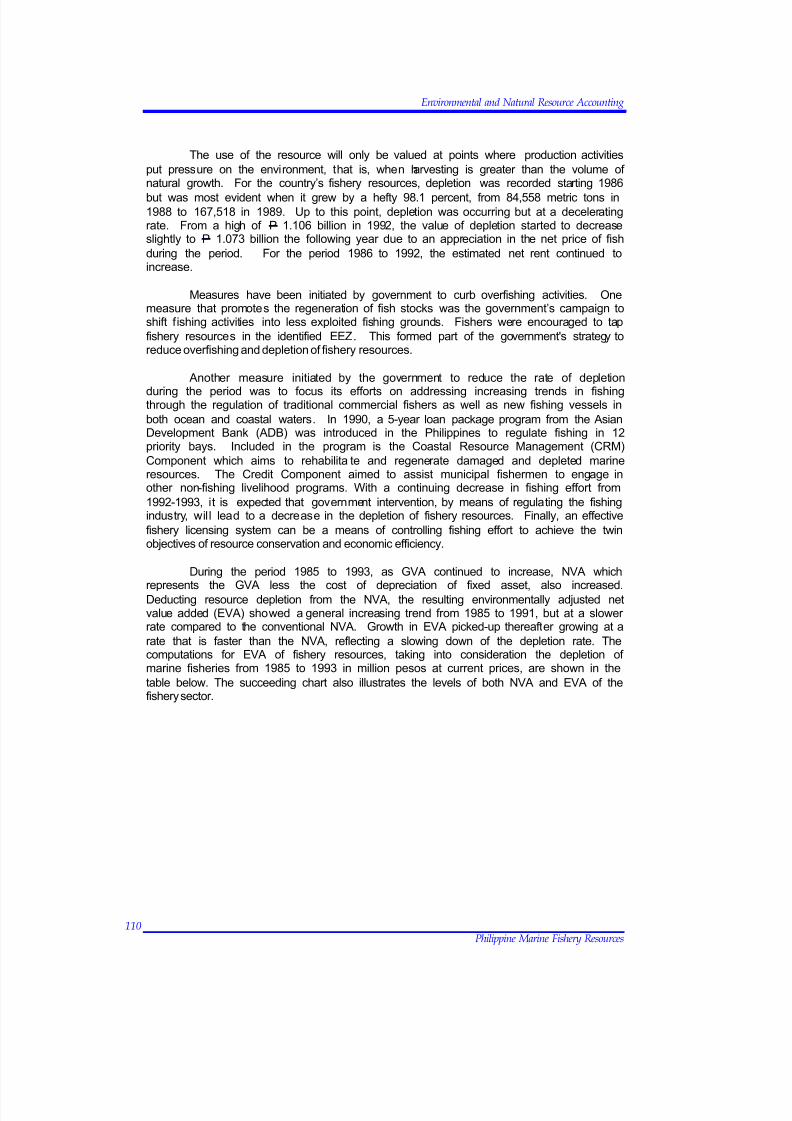
The use of the resource will only be valued at points where production activities
put pressure on the environment, that is, when harvesting is greater than the volume of natural growth. For the country’s fishery resources, depletion was recorded starting 1986
but was most evident when it grew by a hefty 98.1 percent, from 84,558 metric tons in1988 to 167,518 in 1989. Up to this point, depletion was occurring but at a deceleratingrate. From a high of P 1.106 billion in 1992, the value of depletion started to decreaseslightly to P 1.073 billion the following year due to an appreciation in the net price of fish
during the period. For the period 1986 to 1992, the estimated net rent continued toincrease.
Measures have been initiated by government to curb overfishing activities. Onemeasure that promotes the regeneration of fish stocks was the government’s campaign toshift fishing activities into less exploited fishing grounds. Fishers were encouraged to tap
fishery resources in the identified EEZ. This formed part of the government's strategy toreduce overfishing and depletion of fishery resources.
Another measure initiated by the government to reduce the rate of depletion
during the period was to focus its efforts on addressing increasing trends in fishingthrough the regulation of traditional commercial fishers as well as new fishing vessels in
both ocean and coastal waters. In 1990, a 5-year loan package program from the AsianDevelopment Bank (ADB) was introduced in the Philippines to regulate fishing in 12priority bays. Included in the program is the Coastal Resource Management (CRM)
Component which aims to rehabilita te and regenerate damaged and depleted marineresources. The Credit Component aimed to assist municipal fishermen to engage inother non-fishing livelihood programs. With a continuing decrease in fishing effort from
1992-1993, it is expected that government intervention, by means of regulating the fishingindustry, will lead to a decrease in the depletion of fishery resources. Finally, an effective
fishery licensing system can be a means of controlling fishing effort to achieve the twinobjectives of resource conservation and economic efficiency.
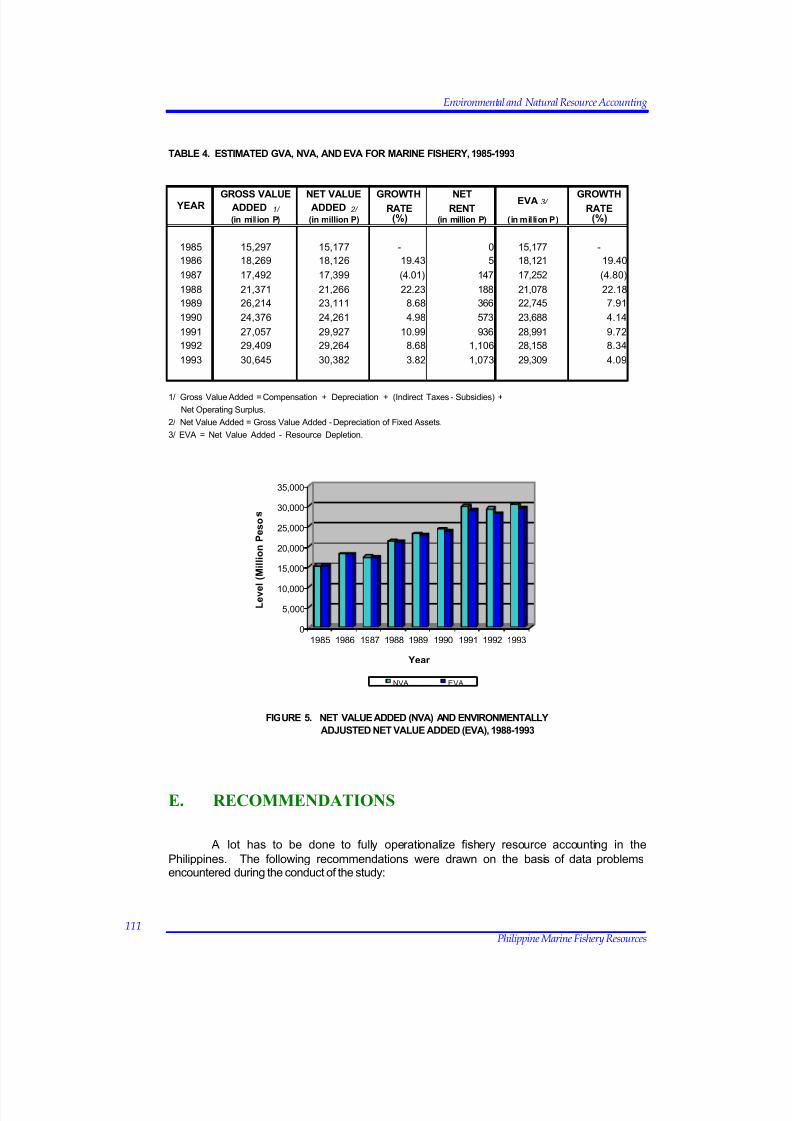
During the period 1985 to 1993, as GVA continued to increase, NVA which
represents the GVA less the cost of depreciation of fixed asset, also increased.Deducting resource depletion from the NVA, the resulting environmentally adjusted netvalue added (EVA) showed a general increasing trend from 1985 to 1991, but at a slower rate compared to the conventional NVA. Growth in EVA picked-up thereafter growing at a
rate that is faster than the NVA, reflecting a slowing down of the depletion rate. Thecomputations for EVA of fishery resources, taking into consideration the depletion of marine fisheries from 1985 to 1993 in million pesos at current prices, are shown in the
table below. The succeeding chart also illustrates the levels of both NVA and EVA of thefishery sector.
7/29/2019 Philippine Marine Fishery Resources
http://slidepdf.com/reader/full/philippine-marine-fishery-resources 19/36
Environmental and Natural Resource Accounting
Philippine Marine Fishery Resources111
TABLE 4. ESTIMATED GVA, NVA, AND EVA FOR MARINE FISHERY, 1985-1993
FIGURE 5. NET VALUE ADDED (NVA) AND ENVIRONMENTALLY
ADJUSTED NET VALUE ADDED (EVA), 1988-1993
E. RECOMMENDATIONS
A lot has to be done to fully operationalize fishery resource accounting in the
Philippines. The following recommendations were drawn on the basis of data problemsencountered during the conduct of the study:
GROSS VALUE NET VALUE GROWTH NET GROWTHADDED 1/ ADDED 2/ RATE RENT RATE(in million P) (in million P) (%) (in million P) (in million P) (%)
1985 15,297 15,177 - 0 15,177 -
1986 18,269 18,126 19.43 5 18,121 19.40
1987 17,492 17,399 (4.01) 147 17,252 (4.80)
1988 21,371 21,266 22.23 188 21,078 22.18
1989 26,214 23,111 8.68 366 22,745 7.91
1990 24,376 24,261 4.98 573 23,688 4.14
1991 27,057 29,927 10.99 936 28,991 9.72
1992 29,409 29,264 8.68 1,106 28,158 8.34
1993 30,645 30,382 3.82 1,073 29,309 4.09
1/ Gross Value Added = Compensation + Depreciation + (Indirect Taxes - Subsidies) +
Net Operating Surplus.
2/ Net Value Added = Gross Value Added - Depreciation of Fixed Assets.
3/ EVA = Net Value Added - Resource Depletion.
YEAREVA 3/
0
5,000
10,000
15,000
20,000
25,000
30,000
35,000
L e v e
l ( M i l l i o n
P e s o
1985 1986 1987 1988 1989 1990 1991 1992 1993
Year
NVA EVA
7/29/2019 Philippine Marine Fishery Resources
http://slidepdf.com/reader/full/philippine-marine-fishery-resources 20/36
Environmental and Natural Resource Accounting
Philippine Marine Fishery Resources112
1. Data set on fishing effort is considered as one of the most critical variables in the
study therefore, regular surveys on fisheries of the BAS should incorporate thisdata set. Other factors that affect fishing effort, like number of hauling, fishing
days, number of crew, etc., likewise, should be included. The current availabledata on production is estimated with 20.0 percent under-coverage ratio thus,there is a need to improve this data to further refine the estimates on sustainablecatch.
2. The available data from the 1991 Census of Fisheries failed to include relevantinformation on characteristics of fishing units, particularly on inventory of fishing
boats and its corresponding tonnage and horsepower. These variables need tobe looked into in succeeding censuses.
3. Data on cost of production for both commercial and municipal fishing areinadequate and limited only to results of special studies. A conduct of anationwide survey for commercial and municipal fishing should be pursued
separately.
4. The study also showed that although there are available data from BFAR studies
on stock assessment, the coverage is limited only to selected fishing grounds. Tobe able to derive accurate estimates on the level of fish stock at the nationallevel, an expansion of the coverage of these studies should include the remaining
fishing grounds.
5. Finally, more venues for discussions and exchange of experiences in
operationalizing the concepts in fishery resource accounting should be madeavailable, given the complexity of the bioeconomics of the resource.
7/29/2019 Philippine Marine Fishery Resources
http://slidepdf.com/reader/full/philippine-marine-fishery-resources 21/36
Environmental and Natural Resource Accounting
Philippine Marine Fishery Resources113
ACRONYMS
ASE Annual Survey of EstablishmentsBAS Bureau of Agricultural StatisticsBFAR Bureau of Fisheries and Aquatic Resources
CPUE Catch Per Unit EffortEEZ Exclusive Economic ZoneENRA Environmental and Natural Resource Accounting
ENRAP Environmental and Natural Resource Accounting ProjectEVA Environmentally Adjusted Net Value Added
FAO Food and Agriculture Organization
FSP Fishery Sector ProgramGDP Gross Domestic ProductGVA Gross Value Added
Hp Horse Power
ICLARM International Center for Living Aquatic ResourcesManagement
IEMSD Integrated Environmental Management for SustainableDevelopment
Kg Kilogram
LGU Local Government UnitMC Marginal CostMR Marginal Revenue
MSY Maximum Sustainable YieldMT Metric TonMTDP Medium Term Development Plan
NEDA National Economic and Development AuthorityNPM Net Price MethodNSCB National Statistical Coordination Board
NSO National Statistics OfficeNVA Net Value AddedPS Purse Seine
PSNA Philippine System of National AccountsREA Resource Ecological Assessment
REECS Resources, Environment and Economics Center for Studies
SEEA System of Integrated Economic and Environmental AccountingTWG Technical Working Group
7/29/2019 Philippine Marine Fishery Resources
http://slidepdf.com/reader/full/philippine-marine-fishery-resources 22/36
Environmental and Natural Resource Accounting
Philippine Marine Fishery Resources114
DEFINITION OF TERMS
Aquaculture - aquatic products that are cultured such as fish,
oysters, seaweed and other aquatic resources inseas, lakes and rivers.
Biomass - the total entities that include fishes and other aquaticproducts in the waters measured in number or inweight.
Closing Stock - fish inventory at the end of the accounting period.
Commercial Fishing - the catching of fish with the use of fishing boats witha capacity of more than three gross tons.
Depletion - refers to the decrease of the existing stock due to
fishing activities of man. This occurs when totalcatch exceeds sustainable catch.
Fish - Includes all fishes and other aquatic animals such ascrustaceans (crabs, prawns, shrimps, lobsters, etc.)
and mollusks (clams, scallops, oysters, snails andother shellfish).
Fish Catch - volume of fish landed from commercial andmunicipal fishing.
Fish Stock - level of fish available in the country’s waters at acertain period of time which can be measured innumber or in weight.
Fishery - business of catching, taking, handling, marketing andpreserving fish or other fishery/aquatic products and
the right to fish or take such products.
Fishing - refers to the catching, gathering and culturing of fish,
crustaceans, mollusks, and all other aquatic animalsand plants in the sea or in inland waters. It includesthe catching of fish and aquatic animals like turtles;
the gathering of clams, snails, shells and seaweeds;and the culturing of fish and oysters. Sport fishing or small scale fishing pursued as a hobby is excluded.
Fishing Boat - a type of watercraft, such as banca, sailboat, motor
boat, etc., either licensed or not, used for fishingpurposes. Carrier boats used for the purpose of transporting fish in the course of fishing shall also beconsidered fishing boats.
Fishing Effort - a collective variable referring to manpower, machinepower and technology employed in harvesting
fishery resource.
7/29/2019 Philippine Marine Fishery Resources
http://slidepdf.com/reader/full/philippine-marine-fishery-resources 23/36
Environmental and Natural Resource Accounting
Philippine Marine Fishery Resources115
Fishing Gear - apparatus, gadgets, implements and other
paraphernalia used in catching and gathering fishwith or without the use of boats.
Fishing Method - the procedure of catching fish; it is usually identifiedby the name of the fishing gear used.
Fishing Mortality - fish loss due to fish harvesting activity and/or other natural causes.
Fishing Unit - minimum unit necessary for operating a fishingmethod. It is usually composed of fishing boat,fishing gear and manpower. When a fishing boat is
not necessary for the operation of fishing method,the fishing unit may be composed of the fishing gear and manpower. When a fishing boat and fishing gear
are not necessary for the operation of fishing
method, the fishing unit is composed of manpower only.
Growth - biological process specifying the rate at which thesize of fish increases over time.
Marinewater Fish - fishes thriving on seawater outside of the coastalline.
Migration - inflow/outflow of fish in the country’s waters.
Municipal Fishing - characterized by the use of simple gear and fishing
boat some of which are non-motorized and with acapacity of less than three gross tons.
Natural Mortality - represents the loss from death of fish due topredation and from adverse ecological conditions.
Opening Stock - fish inventory at the beginning of the accountingperiod.
Overfishing - extraction of fishery resources beyond the rate of natural growth

7/29/2019 Philippine Marine Fishery Resources
http://slidepdf.com/reader/full/philippine-marine-fishery-resources 24/36
Environmental and Natural Resource Accounting
Philippine Marine Fishery Resources117
APPENDICES
7/29/2019 Philippine Marine Fishery Resources
http://slidepdf.com/reader/full/philippine-marine-fishery-resources 25/36
Municipal Total Marine
(marine) Fish Catch
1976 609,836 640,185 1,250,021
1977 621,798 736,727 1,358,525
1978 607,008 802,300 1,409,308
1979 600,896 762,652 1,363,548
1980 586,174 776,741 1,362,915
1981 593,722 851,987 1,445,709
1982 631,648 849,619 1,481,267
1983 623,179 925,186 1,548,365
1984 616,002 947,970 1,563,972
1985 614,384 942,158 1,556,542
1986 655,476 968,730 1,624,206
1987 709,430 979,496 1,688,926
1988 719,994 1,006,039 1,726,033
1989 764,566 1,058,843 1,823,409
1990 840,677 1,074,048 1,914,725
1991 911,778 1,096,229 2,008,007
1992 965,839 1,025,624 1,991,463
1993 1,014,517 963,833 1,978,350
Source : Bureau of Agricultural Statistics (BAS)
Note: 1/ Marine fish catch corrected with 20% undercoverage
APPENDIX TABLE 1. TOTAL MARINE FISH CATCH1/, 1976-1993
IN METRIC TONS
Year Commercial
7/29/2019 Philippine Marine Fishery Resources
http://slidepdf.com/reader/full/philippine-marine-fishery-resources 26/36
PURSE SEINE BAG NET MURO-AMI RING NET TRAWL BEACH SEINE
Hp CATCH CPUE Hp CATCH CPUE Hp CATCH CPUE Hp CATCH CPUE Hp CATCH CPUE Hp CATCH CPUE
1976 50,253 211,417 4.21 133,366 42,012 0.32 7,976 13,800 1.73 7,151 22,647 3.17 189,690 206,205 1.09 189,690 727 0.00
1977 45,298 190,607 4.21 85,260 71,524 0.84 7,786 10,523 1.35 5,357 32,777 6.12 162,824 204,468 1.26 162,824 479 0.00
1978 62,754 186,073 2.97 96,920 69,823 0.72 974 10,273 10.55 12,855 31,997 2.49 156,035 199,605 1.28 156,035 468 0.00
1979 80,564 174,029 2.16 100,154 97,799 0.98 11,736 11,677 0.99 20,223 32,950 1.63 188,977 176,739 0.94 188,977 780 0.00
1980 35,844 163,153 4.55 62,179 106,254 1.71 636 11,553 18.17 16,810 33,913 2.02 150,633 164,287 1.09 150,633 664 0.00
1981 98,587 168,918 1.71 81,536 107,229 1.32 5,705 10,058 1.76 28,951 39,774 1.37 162,119 151,674 0.94 162,119 510 0.00
1982 105,602 198,178 1.88 84,469 114,624 1.36 11,437 10,367 0.91 28,729 40,862 1.42 174,682 151,837 0.87 174,682 801 0.00
1983 95,186 212,979 2.24 80,397 84,958 1.06 11,985 8,694 0.73 29,498 50,283 1.70 199,949 152,106 0.76 199,949 669 0.00
1984 81,530 193,054 2.37 90,186 93,990 1.04 8,732 9,748 1.12 45,857 58,360 1.27 159,854 151,053 0.94 159,854 486 0.00
1985 80,202 183,414 2.29 90,325 102,879 1.14 10,098 10,284 1.02 48,944 75,406 1.54 162,472 129,327 0.80 162,472 2,260 0.01
1986 91,677 224,730 2.45 87,438 91,053 1.04 12,648 10,002 0.79 47,924 72,958 1.52 171,906 136,604 0.79 171,906 3,657 0.02
1987 97,182 239,663 2.47 91,717 92,413 1.01 11,362 11,491 1.01 62,440 86,175 1.38 184,112 147,317 0.80 184,112 7,241 0.04
1988 87,826 263,439 3.00 89,958 95,474 1.06 11,362 11,646 1.02 37,047 87,965 2.37 179,035 117,932 0.66 179,035 9,940 0.06
1989 89,328 279,747 3.13 91,489 101,384 1.11 11,362 12,367 1.09 37,681 93,411 2.48 182,100 125,233 0.69 182,100 10,555 0.06
1990 87,954 307,596 3.50 90,090 111,477 1.24 11,362 13,598 1.20 37,101 102,709 2.77 179,298 137,699 0.77 179,298 11,606 0.06
1991 88,368 453,807 5.14 90,513 53,506 0.59 11,362 0 0.00 37,280 90,012 2.41 180,142 90,173 0.50 180,142 1,106 0.01
1992 91,196 467,438 5.13 91,484 53,396 0.58 11,362 7 0.00 33,691 109,418 3.25 193,731 90,547 0.47 193,731 2,087 0.01
1993 94,114 425,261 4.52 92,465 53,889 0.58 11,362 0 0.00 30,447 159,270 5.23 208,345 86,965 0.42 208,345 1,040 0.00
Notes:
1. Catch data refers to actual fish catch from BAS.
2. Hp data is based on parameters used by the ENRAP study.
APPENDIX TABLE 2. ACTUAL ESTIMATES: HORSEPOWER AND MARINE FISH CATCH AND THE COMPUTED CPUE OF COMMERCIAL FISHING VESSELS BY TYPE OF GEAR, 19
YEAR
7/29/2019 Philippine Marine Fishery Resources
http://slidepdf.com/reader/full/philippine-marine-fishery-resources 27/36
GEAR TYPE TOTAL
YEAR PURSE SEINE BAG NET RING NET TRAWL MURO-AMI BEACH SEINE UNADJUSTED
Hp CATCH Hp CATCH Hp CATCH Hp CATCH Hp CATCH Hp CATCH Hp CATCH
1976 61,686 259,516 163,708 51,570 8,778 27,799 232,846 253,118 9,791 16,940 232,846 892 709,655 609,836
1977 55,187 232,218 103,873 87,138 6,526 39,933 198,370 249,105 9,486 12,820 198,370 584 571,812 621,798
1978 76,454 226,695 118,078 85,066 15,661 38,983 190,099 243,180 1,187 12,515 190,099 570 591,578 607,008
1979 98,002 211,698 121,833 118,968 24,600 40,082 229,882 214,995 14,276 14,205 229,882 949 718,475 600,896
1980 43,789 199,315 75,961 129,805 20,536 41,430 184,020 200,700 777 14,114 184,020 811 509,102 586,174
1981 122,413 209,741 101,241 133,143 35,948 49,386 201,299 188,329 7,084 12,489 201,299 633 669,283 593,722
1982 129,103 242,280 103,267 140,132 35,122 49,955 213,556 185,627 13,982 12,674 213,556 979 708,585 631,648
1983 116,381 260,402 98,299 103,875 36,066 61,479 244,471 185,975 14,654 10,630 244,471 818 754,340 623,179
1984 99,119 234,703 109,642 114,267 55,750 70,950 194,340 183,640 10,616 11,851 194,340 591 663,807 616,002
1985 97,851 223,775 110,202 125,518 59,714 92,000 198,225 157,786 12,320 12,547 198,225 2,757 676,537 614,384
1986 111,487 273,291 106,332 110,728 58,280 88,723 209,053 166,122 15,381 12,163 209,053 4,447 709,586 655,476
1987 117,994 290,988 111,359 112,204 75,812 104,630 223,540 178,865 13,795 13,952 223,540 8,792 766,040 709,430
1988 107,836 323,458 110,453 117,226 45,488 108,006 219,824 144,800 13,951 14,299 219,824 12,205 717,375 719,994
1989 109,680 343,482 112,333 124,483 46,265 114,692 223,588 153,764 13,951 15,185 223,588 12,960 729,405 764,566
1990 107,993 377,675 110,615 136,875 45,554 126,110 220,147 169,071 13,951 16,696 220,147 14,250 718,407 840,677
1991 117,008 600,884 119,847 70,847 49,363 119,185 238,525 119,398 0 0 238,525 1,464 763,268 911,778
1992 121,844 624,532 122,229 71,341 45,013 146,191 258,839 120,978 15,180 9 258,839 2,788 821,945 965,839
1993 131,438 593,915 129,136 75,261 42,521 222,435 290,972 121,454 0 0 290,972 1,452 885,040 1,014,517
Notes:
1. Corrected Hp = corrected marine fish catch x computed CPUE in Table 2
2. Corrected Catch = actual marine fish catch x 20% undercoverage
APPENDIX TABLE 3. CORRECTED ESTIMATES: HORSEPOWER AND MARINE FISH CATCH OF COMMERCIAL FISHING VESSELS BY TYPE OF GEAR, 1976-1993
7/29/2019 Philippine Marine Fishery Resources
http://slidepdf.com/reader/full/philippine-marine-fishery-resources 28/36
COMMERCIAL FISHING VESSELS TOTAL TOTAL MARINE
TOTAL MUNICIPAL FISHERY Hp
PURSE BAG MURO- RING TRAWL BEACH COMM'L Hp ADJUSTED ADJUSTED to
SEINE NET AMI NET SEINE Hp ADJUSTED to PS EQUIV. PURSE SEINE
to PS EQUIV. EQUIVALENT
1976 61,686 12,258 4,026 6,608 60,165 212 144,956 152,169 297,125
1977 55,187 20,709 3,047 9,490 59,200 139 147,771 185,223 332,994
1978 76,454 28,689 4,221 13,147 82,013 192 204,716 232,688 437,404
1979 98,002 55,074 6,576 18,555 99,528 439 278,175 334,742 612,918
1980 43,789 28,517 3,101 9,102 44,093 178 128,780 164,681 293,461
1981 122,413 77,708 7,289 28,824 109,916 370 346,519 463,338 809,857
1982 129,103 74,672 6,754 26,619 98,914 522 336,583 429,236 765,819
1983 116,381 46,425 4,751 27,477 83,117 366 278,515 392,028 670,543
1984 99,119 48,257 5,005 29,964 77,554 250 260,148 379,561 639,709
1985 97,851 54,886 5,486 40,229 68,996 1,206 268,654 390,592 659,246
1986 111,487 45,171 4,962 36,194 67,768 1,814 267,397 374,668 642,065
1987 117,994 45,498 5,657 42,427 72,529 3,565 287,670 376,554 664,224
1988 107,836 39,081 4,767 36,008 48,274 4,069 240,035 317,978 558,013
1989 109,680 39,750 4,849 36,623 49,100 4,138 244,139 320,545 564,684
1990 107,993 39,138 4,774 36,060 48,345 4,075 240,385 291,161 531,546
1991 117,008 13,796 0 23,208 23,250 285 177,547 202,374 379,921
1992 121,844 13,918 2 28,521 23,602 544 188,432 192,404 380,836
1993 131,438 16,656 0 49,227 26,879 321 224,521 205,105 429,626
APPENDIX TABLE 4. COMMERCIAL AND MUNICIPAL HORSEPOWER ADJUSTED TO PURSE SEINE EQUIVALENT, 1976-1993
YEAR
7/29/2019 Philippine Marine Fishery Resources
http://slidepdf.com/reader/full/philippine-marine-fishery-resources 29/36
FISHING EFFORT 2-YEAR
FISHER MUNICIPAL TOTAL AVERAGE ADJUSTMENT ADJUSTED
FULL PART Occasional SUB-TOTAL HP VESSEL HP of TOTAL FACTOR to Hp to
TIME TIME Hp Hp PS EQUIVALENT PS EQUIVALENT
1976 230,960 157,945 72,333 461,238 13,572 1,030,959 1,044,531 1,044,531 0.1457 152,169
1977 197,310 109,616 58,462 365,388 11,121 924,994 936,115 990,323 0.1870 185,223
1978 266,199 181,317 84,881 532,397 15,636 1,284,654 1,300,290 1,118,203 0.2081 232,688
1979 285,786 194,269 91,950 572,005 16,784 1,434,031 1,450,815 1,375,553 0.2434 334,742
1980 369,126 284,574 143,671 797,371 22,408 1,537,462 1,559,870 1,505,343 0.1094 164,681
1981 329,391 223,016 107,904 660,311 19,339 1,786,913 1,806,252 1,683,061 0.2753 463,338
1982 353,628 238,948 116,891 709,467 20,757 1,994,692 2,015,449 1,910,851 0.2246 429,236
1983 379,648 256,017 126,627 762,292 22,281 2,226,630 2,248,911 2,132,180 0.1839 392,028
1984 407,583 274,306 137,173 819,062 23,918 2,485,539 2,509,457 2,379,184 0.1595 379,561
1985 437,192 293,902 148,598 879,692 25,656 2,774,552 2,800,208 2,654,833 0.1471 390,592
1986 469,259 314,897 160,974 945,131 27,505 3,097,171 3,124,676 2,962,442 0.1265 374,668
1987 503,677 337,393 174,382 1,015,451 29,519 3,457,304 3,486,824 3,305,750 0.1139 376,554
1988 540,621 361,495 188,905 1,091,022 31,682 3,859,313 3,890,994 3,688,909 0.0862 317,978
1989 580,274 387,319 204,639 1,172,232 34,002 4,308,066 4,342,068 4,116,531 0.0779 320,545
1990 622,835 414,988 221,683 1,259,506 36,493 4,808,999 4,845,492 4,593,780 0.0634 291,161
1991 668,518 444,634 240,146 1,353,298 39,166 5,368,180 5,407,346 5,126,419 0.0395 202,374
1992 717,552 476,397 260,148 1,454,096 42,428 5,815,284 5,857,712 5,632,529 0.0342 192,404
1993 770,182 510,429 281,815 1,562,426 45,962 6,299,626 6,345,588 6,101,650 0.0336 205,105
APPENDIX TABEL 5. NUMBER OF FISHERS AND HORSEPOWER EQUIVALENT ADJUSTED TO PURSE SEINE EQUIVALENT, 1976-1993
YEAR
NUMBER OF FISHERS
7/29/2019 Philippine Marine Fishery Resources
http://slidepdf.com/reader/full/philippine-marine-fishery-resources 30/36
MUNICIPAL COMMERCIAL TOTALHp
HORSEPOWER HORSEPOWER (2-YEAR AVERAGE)
1976 152,169 144,956 297,125
1977 185,223 147,771 315,059
1978 232,688 204,716 385,199
1979 334,742 278,175 525,161
1980 164,681 128,780 453,190
1981 463,338 346,519 551,659
1982 429,236 336,583 787,838
1983 392,028 278,515 718,181
1984 379,561 260,148 655,126
1985 390,592 268,654 649,477
1986 374,668 267,397 650,655
1987 376,554 287,670 653,145
1988 317,978 240,035 611,119
1989 320,545 244,139 561,349
1990 291,161 240,385 548,115
1991 202,374 177,547 455,734
1992 192,404 188,432 380,379
1993 205,105 224,521 405,231
APPENDIX TABLE 6. TOTAL FISHING EFFORT IN PURSE SEINE EQUIVALENT, 1976-1993
YEAR

7/29/2019 Philippine Marine Fishery Resources
http://slidepdf.com/reader/full/philippine-marine-fishery-resources 31/36
APPENDIX TABLE 7. SUMMARY OUTPUT OF REGRESSION
Regression Statistics
Multiple R 0.892168288
R Square 0.795964254
Adjusted R Square 0.78 321202
Standard Error 0.139034696
Observations 18
ANOVA
df SS MS F Sign i f icance F
Regression 1 1.20657318 1.20657318 62.4176318 6.5208E-07
Residual 16 0.309290345 0.019330647
Total 17 1.515863525
Coeffic ients Standard Erro r t Stat P-value Lower 95% Upper 95% Lower 95.000% Upper 95.000%
Intercept 2.138495808 0.131286743 16.28874139 2.2064E-11 1.860180408 2.416811208 1.860180408 2.416811208
X Variable 1 -1.88251E-06 2.38278E-07 -7.900483009 6.5208E-07 -2.38764E-06 -1.37738E-06 -2.38764E-06 -1.37738E-06
7/29/2019 Philippine Marine Fishery Resources
http://slidepdf.com/reader/full/philippine-marine-fishery-resources 32/36
ACTUAL SUSTAINABLE
EFFORT CATCH CATCH DEPLETION
(Hp) (m.t.) (m.t.) (m.t.)
(1) (2) (3) (4)
1976 297,125 1,250,021 1,441,311 0
1977 315,059 1,358,525 1,477,571 0
1978 385,199 1,409,308 1,583,061 0
1979 525,161 1,363,548 1,658,353 0
1980 453,190 1,362,915 1,638,723 0
1981 551,659 1,445,709 1,657,263 0
1982 787,838 1,481,267 1,517,283 0
1983 718,181 1,548,365 1,576,930 0
1984 655,126 1,563,972 1,619,775 0
1985 649,477 1,556,542 1,622,976 0
1986 650,655 1,624,206 1,622,318 1,888
1987 653,145 1,688,926 1,620,911 68,015
1988 611,119 1,726,033 1,641,475 84,558
1989 561,349 1,823,409 1,655,890 167,518
1990 548,115 1,914,725 1,657,639 257,086
1991 455,734 2,008,007 1,640,049 367,957
1992 380,379 1,991,463 1,577,501 413,963
1993 405,231 1,978,350 1,603,754 374,596
Note:
Estimated Maximum Sustainable Yield (MSY) 1,658,461 m.t.Estimated Maximum Fishing Effort (EMSY) 531,206 Hp
APPENDIX TABLE 8. ESTIMATED MARINE FISHERY RESOURCE DEPLETION, 1976-1993
YEAR
7/29/2019 Philippine Marine Fishery Resources
http://slidepdf.com/reader/full/philippine-marine-fishery-resources 33/36
DEPLETION NET PRICE NET RENT
(m.t.) (P/m.t.) ('000 P)
1985 0 0 0
1986 1,888 2,391 4,513
1987 68,015 2,159 146,845
1988 84,558 2,223 187,939
1989 167,518 2,183 365,741
1990 257,086 2,230 573,224
1991 367,957 2,543 935,700
1992 413,963 2,671 1,105,772
1993 374,596 2,866 1,073,460
Notes :
(1) Net price was derived by using the 1989 ASE. Series was generated by applying
the change in producers price to the derived Net Price of 1989.
(2) To translate the Net Price at purchaser's price, the trade and transport margin
was added to NP at producer's price.
(3) Net rent is the value of resource depletion.
APPENDIX TABLE 9. ESTIMATED NET RENT FOR PHILIPPINE MARINE FISHERY
RESOURCES, 1985-1993
YEAR
7/29/2019 Philippine Marine Fishery Resources
http://slidepdf.com/reader/full/philippine-marine-fishery-resources 34/36
APPENDIX FIGURE 1. SUSTAINABLE YIELD-EFFORT CURVE FOR
MARINE FISHERY RESOURCES
1984
1976
1977
19921978
1993
1991
1980
1979 1990
1981
19891988
1983
1982
198719861985
1,390,000
1,440,000
1,490,000
1,540,000
1,590,000
1,640,000
1,690,000
250,000 350,000 450,000 550,000 650,000 750,000 850,000
Effort (Hp)
S u s t a i n a b l e C a t c h ( M T )
7/29/2019 Philippine Marine Fishery Resources
http://slidepdf.com/reader/full/philippine-marine-fishery-resources 35/36
Environmental and Natural Resource Accounting
Philippine Marine Fishery Resources129
LITERATURE CITED
National Economic and Development Authority. 1980. Glossary of Terms. NEDA, Pasig.
National Statistics Office. Census of Fisheries.NSO. Quezon City.
Bureau of Agricultural Statistics. 1988-1993. Commercial Fishery Production Statistics.
BAS. Quezon City.
_____ . 1989-1993. Fishery Statistics of the Philippines. BAS. Quezon City.
_____ . 1990. Compendium on Agriculture, Fishery and Forestry. BAS. Quezon City.
_____ . 1992-1993. Marine Municipal Fishery Statistics on the 12 FSP Priority Bays.
BAS. Quezon City.
_____ . Commonly Used Fishing Gears in the Philippines. Fishery Sector Program-NationalFisheries Information System. Bureau of Agricultural Statistics. Quezon City.
Bureau of Fisheries and Aquatic Resources. 1951-1988. Fisheries Statistics of the Philippines.
BFAR. Quezon City.
REA-FSP. 1993. The Fisheries of Ormoc Bay.Resource Ecological Assessment of Ormoc
Bay. Fishery Sector Program. U.P. Visayas, Bureau of Fisheries and AquaticResources.
Dalzell, P. and Ganaden, R.A. 1987. A Review of the Fisheries for Small Pelagic Fishes in
Philippine Waters. Vol. 1. ICLARM Technical Paper Series #1. Bureau of Fisheriesand Aquatic Resources. Quezon City.
Padilla, J.E. and de Guzman, F. 1994. Fishery Resources Accounting in the Philippines.
Environmental and Natural Resources Accounting Project II. Quezon City.
Padilla, J.E. and Cruz, A.C. 1995. An Application of Production Theory to Fishing Effort
Standardization in the Small Pelagics Fishery in Central Philippines. ICLARM ContributionNo. 994. International Center for Living Aquatic Resources Management. Makati.
7/29/2019 Philippine Marine Fishery Resources
http://slidepdf.com/reader/full/philippine-marine-fishery-resources 36/36
Environmental and Natural Resource Accounting
Silvestre, G. and Pauly, D. Estimate of Yield and Economic Rent from Philippine Demersal Stock 1946-1984. ICLARM Contribution No. 332.Makati.
Trinidad, A.C. 1993. Bio-economics of the Philippine Small Pelagic Fishery. ICLARM TechnicalReports # 38. International Center for Living Aquatic Resources Management.
International Center for Living Aquatic Resources Management. Makati.