the new economy ppi
TRANSCRIPT

8/4/2019 The New Economy PPI
http://slidepdf.com/reader/full/the-new-economy-ppi 1/54
The Progressive Policy Institute’sTechnology, Innovation, and New Economy Project
The Pro ject’s mission is to educate federal, state, and local policy makers about what drives the New Economy, and to
foster policies that promote technological advances, economic innovation, investment, and entrepreneurship. Mark Warner
is the Project chairman. Mr. Warner is managing director of Columbia Capital, a merchant and investment banking firm in
Alexandria, VA. He ran for the U.S. Senate in Virginia in 1996 on a platform of promoting and adapting to the New Economy.
As a part of the Project, PPI has formed a New Economy Task Force composed of elected leaders and New Economy
entrepreneurs. The Task Force is being co-chaired by Senate Minority Leader Tom Daschle and Gateway CEO Ted Waitt.
The goals of the Task Force are to begin a meaningful two-way dialogue about the challenges of public and private gover-
nance in the New Economy; to jointly develop principles and policy priorities for rethinking government policy in the
Inf ormation Age; and to work to build a new consensus for political change consistent with these aims.
Among the key principles guiding the Project’s work are the following:
• Higher productivity and faster economic growth are prerequisites for expanding opportunity and raising living stan-
dards.
• The key factors of economic growth are science and technology, world-class education and skills, organizational
innovation, robust competition, and open global trade.
• Markets are the best drivers of growth and innovation, but public action can and should create conditions in which
innovation can flourish. This requires updating public fiscal, investment, and regulatory policies at every level.
• Archaic regulatory barriers to competition and innovation should be replaced with “open architecture” principles
that do not favor one technology or industry over another.
• Government should be reinvented to be as fast, responsive, and flexible as the economy and society with which itinteracts. The new model of governing is decentralized, non-bureaucratic, catalytic, and empowering.
• We should take active steps to extend the benefits of technology and innovation to all citizens, reversing current
trends toward economic inequality.
The goals of the Technology, Innovation, and New Economy Project are a natural extension of the mission of the
Progressive Policy Institute, which is to define and promote a new progressive politics for America in the 21st century.
The Institute’s core philosophy rises from the belief that America is ill-served by an obsolete left-right debate that is out
of step with the powerful forces re-shaping our society and economy. The Institute advocates a philosophy that adapts
the progressive tradition in American politics to the realities of the Information Age and points to a “Third Way” beyond
the liberal impulse to defend the bureaucratic status quo and the conservative bid to dismantle government.
The Institute is a project of the Progressive Foundation. Will Marshall is President of the Institute. Al From is
Chairman of the Progressive Foundation. For further information, to view this report online, or to order other PPI publica-
tions, please call, write, or visit the PPI Web site:
600 Pennsylvan ia Avenue, SE · Suite 400 · Washington, DC 20003
email: [email protected] · www. dlcppi.org
phone: (202) 546-0007 · fax: (202) 544-5014
8/4/2019 The New Economy PPI
http://slidepdf.com/reader/full/the-new-economy-ppi 2/54
THE NEW ECONOMY INDEX:
Understanding America’s Economic Transformation
Robert D. Atkinson and Randolph H. Court
Progressive Policy InstituteTechnology, Innovation, and New Economy Project
November 1998

8/4/2019 The New Economy PPI
http://slidepdf.com/reader/full/the-new-economy-ppi 3/54
We wish to thank our colleagues at the Progressive Policy Institute for their insights and editorial guidance, particularly
Will Marshall, Chuck Alston, Ed Kilgore, Steven Nider, and Edie Wilson. Special thanks are also due to Jenny Bates,
Jonathan Kaplan, Amy McAndrews, and Amy Sokotch for their invaluable research assistance; and to Eliza Culbertson,
who granted us an extra dispensation of hard disk space for data storage on the over-taxed PPI computer system.
We would also like to express our appreciation to all those who served as outside readers and consultants on this project,
especially Ken Voytek, chief economist with the National Alliance of Business, who helped develop several employment-
related indicators; Chris Benner (Working Partnerships), Christopher Caine (IBM), Randy Collins (Columbia Capital
Corporation), Stephen Crolius (Boston Consulting Group), Alan Daley (Bell Atlantic), Don Hicks (University of Texas),
Ken Jarboe (Jarboe & Associates), Peter Mathias (Mathias & Company), Jeremiah Murphy (Siemens Corporation), Andrew
Reamer (Reamer & Associates), Steven Rose (Educational Testing Service), and Osceola Thomas (AT&T).
ACKNOWLEDGMENTS

8/4/2019 The New Economy PPI
http://slidepdf.com/reader/full/the-new-economy-ppi 4/54
N E W EC O N O M Y I N D E
TABLE OF CONTENT
Introduction 2
SECTION IWhat’s New About The New Economy? 8
INDUSTRIAL AND OCCUPATIONAL CHANGE
New Industries and Jobs............................................9
Skills and Wages......................................................10
GLOBALIZATION
Trade........................................................................11Foreign Direct Investment .......................................12
DYNAMISM AND COMPETITION
Gazelles ...................................................................13
Competition..............................................................14
“Coopetition”...........................................................15
The Churn Economy................................................15
Product and Service Diversity..................................16
Speed.......................................................................17
THE INFORMATION TECHNOLOGY REVOLUTION
Microelectronics Proliferation..................................18
Cost of Computing....................................................18
Cost of Data Transmission........................................19
SECTION IINew Economy Outcomes:
Impacts on Americans 20
Growth and Productivity ........... ............ ............ .......21
Earnings Inequality..................................................23
Unemployment.........................................................24
Displacement...........................................................24
Education and Income.............................................25
Benefits....................................................................26
Contingent Work......................................................27
Job Tenure................................................................27
SECTION IIIFoundations for Future Growth 28
PROGRESS TOWARDS DIGITAL TRANSFORMATION
E-Commerce ............................................................29
Internet Hosts..........................................................30
Households Online...................................................31
Businesses Online....................................................32Government IT Expenditures...................................32
Schools Online.........................................................33
Bandwidth................................................................34
INVESTMENT IN INNOVATION
Venture Capital........................................................35
Federal R&D ...........................................................36
Private R&D............................................................37
Patents.....................................................................37
Capital Investment...................................................38
Costs of Economic Regulation ........... ............ ..........39
FOSTERING NEW ECONOMY SKILLS
Math and Reading Scores ........................................40
Scientists and Engineers in the Workforce...............41
Science and Engineering Degrees............................42
Worker Education....................................................43
Corporate Training...................................................43
Nine Myths About the New Economy 44
Data Sources 46
Endnotes 48
About the Authors 50

8/4/2019 The New Economy PPI
http://slidepdf.com/reader/full/the-new-economy-ppi 5/54
2 N E W E C O N O M Y I N D E X
INTRODUCTION
“It is not the strongest of the species that survive,
nor the most intelligent,
but the ones most responsive to change.”
— Charles Darwin

8/4/2019 The New Economy PPI
http://slidepdf.com/reader/full/the-new-economy-ppi 6/54
N E W E C O N O M Y I N D E X
INTRODUCTIO
The U.S. economy is undergoing a fundamental transfor-
mation at the dawn of the new millennium. Some of the
most obvious outward signs of change are in fact among
the root causes of it: revolutionary technological advances,
including powerful personal computers, high-speed telecom-
munications, and the Internet. The market environment facili-
tated by these and other developments in the last decade and a
half has been variously labeled the “information economy,”
“network economy,” “digital economy,” “knowledge economy,”
and the “risk society.” Together, the whole package is often sim-
ply ref erred to as the “New Economy.”
The story of how businesses are changing in today’s economyhas been told and retold with such frequency in recent years that
it has become something of a cliche: the new rules of the game
require speed, flexibility, and innovation. New, rapidly growing
companies are selling to global markets almost from their incep-
tion, and established companies are being forced to reinvent their
operations to stay competitive in the new terrain. This is the part
of the New Economy that was born in Steve Jobs’ and Steve
Wozniak ’s garage, at Bell Labs, Xerox PARC, and in the trunk of
Michael Dell’s car. It is Silicon Valley: Netscape, Yahoo!, and the
next Big Thing. And of course it is Microsoft, with a market capi-
talization now second only to General Electric’s.
But this New Economy is about more than high technology
and the frenetic action at the cutting edge. Most firms, not just
the ones actually producing technology, are organizing work
around it. The New Economy is a metal casting firm in
Pittsburgh that uses computer-aided manufacturing technology
to cut costs, save energy, and reduce waste. It is a farmer in
Nebraska who sows genetically altered seeds and drives a trac-
tor with a global satellite positioning system. It is an insurance
company in Iowa that uses software to flatten managerial hierar-
chies and give its workers broader responsibilities and autono-
my. It is a textile firm in Georgia that uses the Internet to take
orders from customers around the world.
It is also as much about new organizational models as it is
about new technologies. The New Economy is the Miller brew-
ery in Trenton, New Jersey, which produces 50 percent more
beer per worker than the company’s next-most-productive facil-
ity, in part because a lean, 13-member crew has been trained to
work in teams to handle the overnight shift with no oversight.1
Yet while the social and political implications of this New
Economy are clearly vast, our system for tracking economicprogress—the set of indicators we use as a gauge—has not kept
up with the pace of evolution. Our statistical system was essen-
tially established to measure a stable economy with most of the
output in agricultural and manufactured goods. Until the Great
Depression, economic indicators were often measures of natural
resources and commodity production: the number of bales of
cotton produced, hogs raised, steel ingots melted. (Even today,
the United States spends three times more on agricultural sta-
tistics than on national income statistics, according to MIT
economist Lester Thurow.) After the New Deal and the creation
of federal statistical agencies, our economic indicators began to
focus on monetary measures related to managing the businesscycle. For example, significant eff ort is made to track the gross
domestic product (GDP), inflation and changes in the money
supply, business inventories, and consumer purchases thought
to affect the business cycle, such as housing and autos. (The first
15 pages of the Congressional Joint Economic Committee’s
monthly “Economic Indicators” are devoted to these sorts of
indicators of the business cycle. It is not until the sixteenth page
that the report gets to arguably the most important indicator of
economic well-being: productivity.)
8/4/2019 The New Economy PPI
http://slidepdf.com/reader/full/the-new-economy-ppi 7/54
4 N E W E C O N O M Y I N D E X
INTRODUCTION
The purpose of this report is to draw on a new set of indica-
tors, gathered from existing public and private data, to examine
some of the key characteristics of the New Economy.2 We havedivided these indicators into three groups. The first group
tracks some of the elemental structural changes that collective-
ly mark the transition to the New Economy: industrial and occu-
pational change, globalization, the changing nature of competi-
tion and economic dynamism, and the progress of the informa-
tion technology (IT) revolution. The second group examines the
implications of this transition for working Americans: what is
happening to incomes and economic growth, jobs, and employ-
ment dynamics. The third group assesses the nation’s perf or-
mance in terms of three main foundations for growth in the New
Economy: the pace of transition to a digital economy, investment
by business and government in technology and innovation, andprogress on the development of education and skills.
Structural Transformation
Beyond the technological advances, what is actually new
about the so-called New Economy? In one respect, nothing. We
still work at jobs for a living, and we still buy, sell, and trade
products and services, just like we always have. As Federal
Reserve Chairman Alan Greenspan has noted, the heart of the
economy is, as it always has been, grounded in human nature,
not in any new technological reality. In Greenspan’s analysis,
“The way we evaluate assets, and the way changes in thoseassets affect our economy, do not appear to be coming out of a set
of rules that is different from the one that governed the actions of
our forebears.... As in the past, our advanced economy is primar-
ily driven by how human psychology molds the value system that
drives a competitive market economy. And that process is inextri-
cably linked to human nature, which appears essentially
immutable and, thus, anchors the future to the past.” 3
Nonetheless, Greenspan and other economists agree that some
of the key rules of the game are changing, from the way we orga-
nize production, to our patterns of trade, to the way organizations
deliver value to consumers.
The global economic crisis that began in Asia in 1997 has
caused growing concern that one of the fundamental hallmarks
of the New Economy, the increasingly complex state of global
interconnectedness, may in fact be a harbinger of financial
chaos. Many of the Asian economies that were touted as eco-
nomic miracles for the better part of this decade are now in pro-
found economic and social disarray. Slower growth and falling
demand have plunged Russia into default, and now threaten
Latin America. No one can precisely predict how these events
will continue to unfold, but we believe that the worst-case sce-nario—a serious world-wide recession—would, at most, only
slow the pace of the forces described in this report.
The trends at the heart of the New Economy are long-term
st ruct ur al trends. It is true that globalization is one of these new
structural realities, and thus business cycles will increasingly
tend to be world-wide in scale. But the current problems in Asia
and elsewhere should not be seen as inherent features of the
New Economy. The troubles are not simply a byproduct of the
ability of capital to move instantaneously from market to market
at the whims of international investors. Rather, one of the basic
reasons for the Asian economic crisis is that Asian economieshave not yet fully adapted their institutional structures (particu-
larly their finance, investment, and banking systems), their
business practices, or their policies to match the imperatives of
the New Economy. In Japan, for example, slow growth in the ser-
vice sector has hindered overall economic growth. Failure to
dismantle barriers to imports and foreign direct investment,
along with low levels of entrepreneurship, have limited compe-
tition.4 In turn, there have been insufficient pressures for corpo-
rate and financial restructuring. Moreover, low levels of invest-
ment in information technology5 have meant a slower transition
to a more digital economy, and a slower overall pace of change.6
The fallout of the economic crisis, while extremely destruc-
tive and painful in the short term, could eventually yield con-
structive developments. The turbulence puts pressure on gov-
ernments to establish New Economy policy frameworks, on
industries to embrace new business practices, and on societies
to adopt new attitudes. One example of a constructive outcome
would be the creation of modern, transparent banking and finan-
cial reporting systems which rely on the most realistic vehicle
for both national governments and firms to deliver regular finan-
cial reports and other information to a worldwide audience in
real time—the Internet. Such a system already exists in the
United States; public companies must file their required docu-
ments and reports in electronic form with the Securities and
Exchange Commission so the information can be archived and
made immediately available to the public via Edgar, the
agency’s online database.7
The United States is ahead of the curve in a number of
areas. Here, one of the most noticeable structural changes in

8/4/2019 The New Economy PPI
http://slidepdf.com/reader/full/the-new-economy-ppi 8/54
N E W E C O N O M Y I N D E X
INTRODUCTIO
the New Economy is the degree to which dynamism, constant
innovation, and adaptation have become the norm. One of the
keys to the recent strong U.S. economic performance has beenthe country’s ability to embrace these changes. Nearly three
quarters of all net new jobs are being created by 350,000 new
fast-growing “gazelle” firms (companies with sales growth of at
least 20 percent per year for four straight years). Almost a third
of all jobs are now in flux (either being born or dying, added or
subtracted) every year. This churning of the economy is being
spurred by new technology, but also by increasing competition,
a trend that is in turn partly a product of increasing globaliza-
tion. Between 1970 and 1997, U.S. imports and exports grew
three and a half times faster than GDP in 1992 dollars.
Another striking structural characteristic of the NewEconomy is occupational change. Between 1969 and 1995,
virtually all the jobs lost in the production or distribution of
goods have been replaced by jobs in offices. Tod ay, almost 93
million American workers (which amounts to 80 percent of all
jobs) do not spend their days making things—instead, they
move things, process or generate information, or provide ser-
vices to people.
The Challenge Ahead
Is all of this turbulence, change, and complexity tempo-
rary, simply the byproduct of the transition from the IndustrialAge to an information era? Or are these intrinsic and permanent
aspects of the New Economy? The Progressive Policy Institute
believes that the latter is true and that the challenge now is to
learn how to manage and govern in an era of sustained and con-
stant innovation and adaptation.
Some see the emergence of the New Economy as disruptive
and threatening. Others celebrate it uncritically, ignoring the
social strains created by its constant change and uneven distrib-
ution of costs and benefits, and rejecting any role for government.
PPI subscribes to a third view, embracing the inherent new pos-
sibilities born of unleashed entrepreneurial energy for techno-
logical and economic progress, while supporting policies that fos-
ter growth and innovation, and equip all Americans with the tools
they need to succeed. The New Economy is not an end in itself,
but the means to advance larger progressive goals: new econom-
ic opportunities and higher living standards, more individual
choice and freedom, greater dignity and autonomy for working
Americans, stronger communities, and wider citizen participa-
tion in public life.
Today, though the foundations for the New Economy are in
place, widespread benefits haven’t yet been realized. Despite job
growth, low unemployment, and other notable signs of economicprogress—and despite gushing press accounts of fabulous new
wealth and opportunities—a central paradox of the emerging New
Economy is that the 1980s and 1990s have seen productivity and
per capita GDP growth rates languish in the 1.25 percent range,
while income inequality has grown. Our challenge is to create a
progressive economic policy framework that will encourage a new
era of higher growth, while promoting and enabling a broad-based
prosperity that produces the widest possible winners’ circle.
Old economic policy, shaped by the Great Depression, large-
ly focused on creating jobs, controlling inflation, and managing
the business cycle. The New Economy brings new concerns.Technology, as well as a highly competent Federal Reserve poli-
cy, may have lessened the importance and severity of the domes-
tic business cycle. We have shown that we can create jobs—over
nine million of them in the first five years of the Clinton
Administration. And there is general agreement that in the new
global economy, with increased competition and technology, the
risk of inflation is reduced. The real challenge of economic poli-
cy now is to support and foster continued adaptation, including
policies that lead to a fully digital economy characterized by con-
tinuous, high levels of innovation and a highly educated and
skilled workforce.
The nascent transformation to a digital economy, where an
increasing share of economic value is a product of electronic
means, has the potential to usher in a new period of sustained
higher productivity and wage growth in America. Most of the
indicators of the transformation to a digital economy forecast
steady progress. Computing and telecommunications costs have
been falling dramatically, and the U.S. Internet economy is pro-
jected to be worth $350 billion by 2001 (when nearly 40 percent
of U.S. households are projected to be online). But realizing the
digital economy’s potential will depend in part on regulatory, tax,
and procurement policies—at all levels of government—aimed
first at not hindering, and where possible at fostering this trans-
f ormation. Government also clearly has a role to play in spurring
the transformation by encouraging the electronic delivery of pub-
lic services, though it has taken little more than baby steps in the
right direction at this point.

8/4/2019 The New Economy PPI
http://slidepdf.com/reader/full/the-new-economy-ppi 9/54
6 N E W E C O N O M Y I N D E X
INTRODUCTION
New Economy economists like Paul Romer, Richard
Nelson, and Rob Shapiro have focused on knowledge, technol-
ogy, and learning as keys to economic growth and have begunto focus on how policy can actually affect innovation. A con-
sensus has emerged that investments to develop and commer-
cialize research and technology play a major role in increased
standards of living for Americans. However, indicators of inno-
vation and investment suggest cause for concern. In the last
five years, federal support for both basic and applied research
have fallen precipitously. Industry investment in basic research
has also declined. Similarly, over the last decade the stock of
machinery and equipment that American workers use to be pro-
ductive has fallen as a share of GDP.
Education is another economic foundation area showing alack of sufficient progress. Corporate expenditures on employ-
ee training have fallen in the 1990s as a share of GDP.
Meanwhile, K-12 performance has simply failed to keep up
with the pressing need for a skilled workforce, in spite of con-
tinued increases in education spending. We need a set of poli-
cies to ensure that American companies have the skilled work-
ers they need to be productive, and that American workers have
the skills they need to navigate, adapt, and prosper in the New
Economy.
The New Economy puts a premium on what Nobel Laureate
economist Douglas North calls “adaptive efficiency”—the abil-ity of institutions to innovate, continuously learn, and produc-
tively change. In the old economy, fixed assets, financing, and
labor were principal sources of competitive advantage for firms.
But now, as markets fragment, technology accelerates, and
competition comes from unexpected places, learning, creativi-
ty, and adaptation are becoming the principal sources of com-
petitive advantage in many industries. Enabling constant inno-
vation has become the goal of any organization committed to
prospering, and should also become the goal of public policy in
the New Economy.
PPI believes that a progressive innovation-oriented policyframework for the New Economy should rest on four pillars:
1. Investment in new economic foundations, specifically
education, training, and scientific and technological
research.
2. Creation of an open and flexible regulatory and trade
regime that supports growth and innovation, including
policies that support the IT revolution.
3. Development of policies to enable American workers to
have the tools they need to navigate, adapt, and prosperin a continually changing economic environment.
4. Reinvention—and digitization—of government to make
it fast, responsive, and flexible.
In summary, if we are to ask workers to take the risks inher-
ent in embracing the New Economy, we must equip them with the
tools to allow them to prosper and cope with change and uncer-
tainty. If we fail to invest in a knowledge infrastructure—world-
class education, training, science, and technology—our enter-
prises will not have the skilled workers and cutting-edge tools
they need to grow and create well-paying jobs. And if IndustrialAge government does not transform itself into Information Age
government, it will become an inefficient, anachronistic insti-
tution, impeding rather than advancing progress.

8/4/2019 The New Economy PPI
http://slidepdf.com/reader/full/the-new-economy-ppi 10/54
N E W E C O N O M Y I N D E X
INTRODUCTIO
Keys to the Old and New Economies8
ISSUE OLD ECONOMY NEW ECONOMY
Economy-Wide Characteristics:
Mark ets Stable Dynamic
Scope of Competition National Global
Organizational Form Hierarchical, Bureaucratic Network ed
Industry:
Organization of Production Mass Production Flexible Production
Key Drivers of Growth Capital / Labor Innovation / Knowledge
Key Technology Driver Mechanization Digitization
Source of Competitive Advantage Lowering Cost Through Innovation, Quality,
Economies of Scale Time-To-Market, and Cost
Importance of Research / Innovation Low-Moderate High
Relations With Other Firms Go It Alone Alliances and Collaboration
Workforce:
Policy Goal Full Employment Higher Real Wages and Incomes
Sk ills Job-Specific Skills Broad Skills and Cross-Training
Requisite Education A Skill or Degree Lifelong Learning
Labor-Management Relations Adversarial Collaborative
Nature of Employment Stable Marked by Risk and Opportunity
Government:
Business-Government Relations Impose Requirements Encourage Growth Opportunities
Regulation Command and Control Market Tools, Flexibility

8/4/2019 The New Economy PPI
http://slidepdf.com/reader/full/the-new-economy-ppi 11/54
8 N E W E C O N O M Y I N D E X
SECTION I
What’s New About The New Economy?
The term New Economy refers to a set of qualitative and quantitative
changes that, in the last 15 years, have transformed the structure, func-
tioning, and rules of the economy. The New Economy is a knowledge and
idea-based economy where the keys to job creation and higher standardsof living are innovative ideas and technology embedded in services and
manufactured products. It is an economy where risk, uncertainty, and
constant change are the rule, rather than the exception. Part I of this
report highlights 13 indicators that collectively illustrate the emergence
of the structural roots of this New Economy.
8/4/2019 The New Economy PPI
http://slidepdf.com/reader/full/the-new-economy-ppi 12/54
N E W E C O N O M Y I N D E X
WHAT’S NEW ABOUT THE NEW ECONOMY
INDUSTRIAL AND OCCUPATIONAL CHANGE
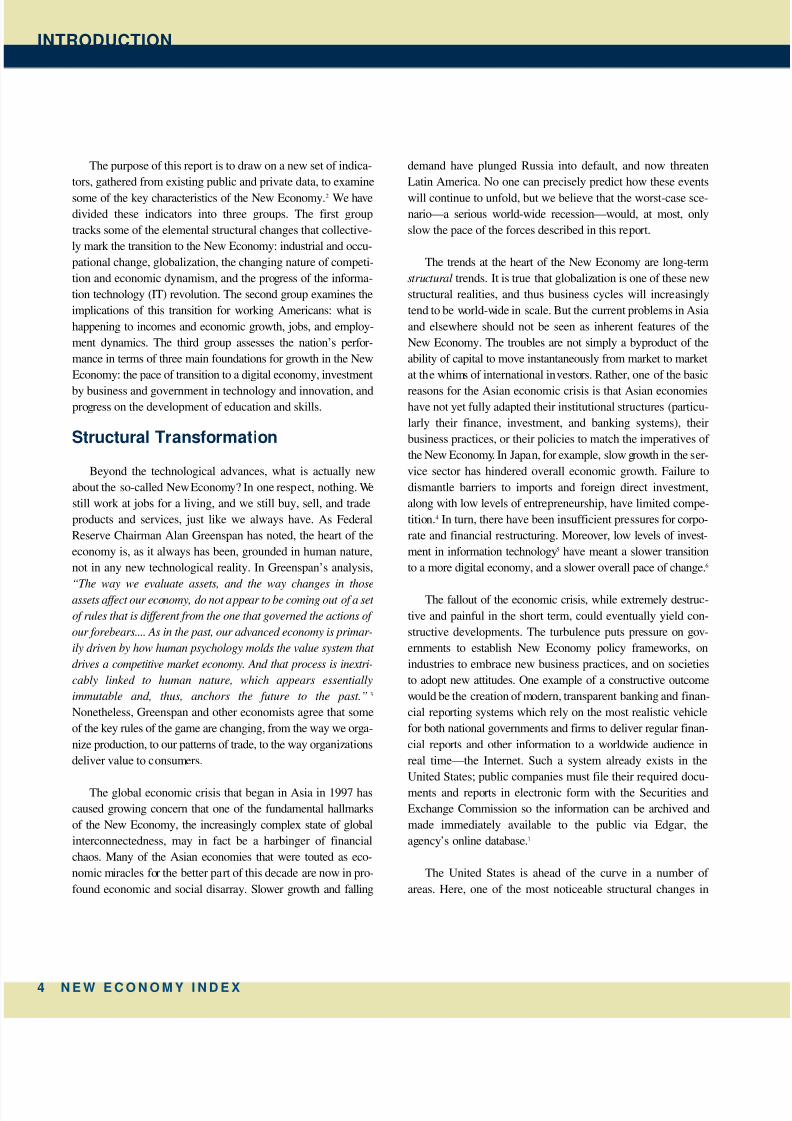
More People Work in Offices and Provide Services
Why Is This Important? While the old economy was fundamentally
organized around standardized mass production, the New Economy is
organized around flexible production of goods and services. To the extent
our trade, tax, and employment policies do not reflect this new reality,
economic growth will suffer.
The Trend: The New Economy is a high-tech, services, and office
economy. This is not to say that mass production manufacturing is unim-
portant, or that the United States produces fewer manufactured goods or
food (in fact we produce more than ever). But higher rates of productivity
growth in manufacturing and agriculture have meant that almost 93 mil-
lion workers (80 percent the workforce) do not spend their days making
things—instead, they work in jobs that require them to move things,
process or generate information, or provide services to people.
Within both manufacturing and services, technology companies have
become more important. High-technology industries’ share of value-added
in manufacturing has grown from 18 percent in 1970 to 24 percent in
1994.9 High-tech companies’ output has increased as a share of GDP from
5.5 percent in 1990 to 6.2 percent in 1996. But while the jobs and income
produced by the high-tech sector are important, it is the high-tech prod-
ucts and services that are helping to transform the rest of the economy.
Since 1969, virtually all the jobs lost in goods production and distribution
sectors have been replaced by office jobs. The tools most Americans use
are now more likely to be faxes, copiers, telephones, or PCs than riveters,
lathes, or forklifts. In the New Economy, where competitive advantage
increasingly stems from customization, design quality, and customer
service, more of the value-added is produced in offices. 10
“Since 1969, virtually all jobslost in goods production and
distribution sectors have beenreplaced by office jobs.”
8/4/2019 The New Economy PPI
http://slidepdf.com/reader/full/the-new-economy-ppi 13/54
1 0 N E W E C O N O M Y I N D E X
WHAT’S NEW ABOUT THE NEW ECONOMY?
INDUSTRIAL AND OCCUPATIONAL CHANGE
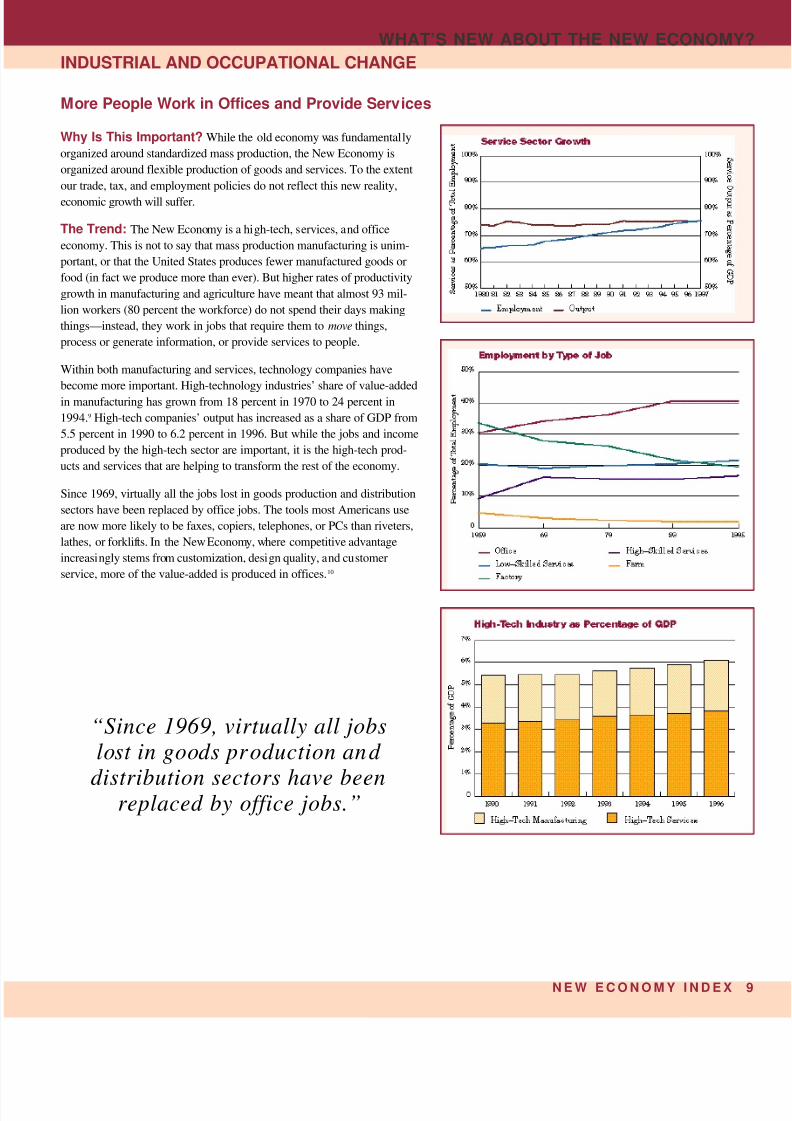
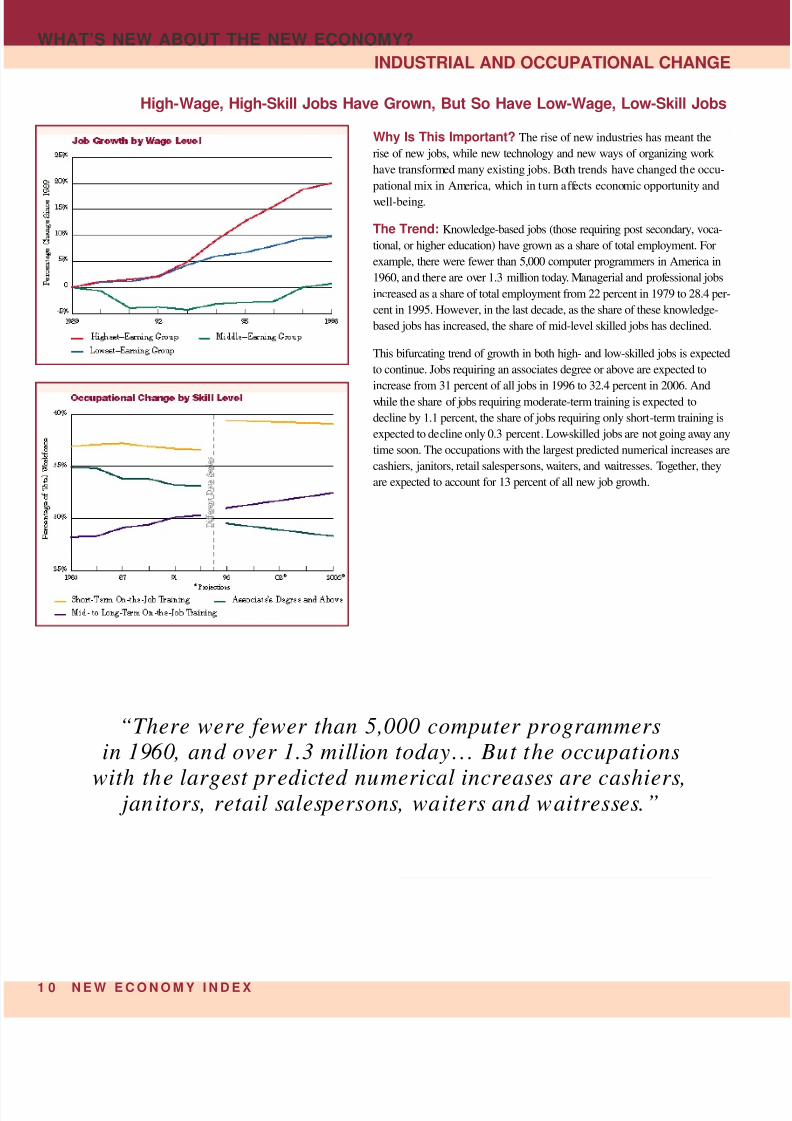
High-Wage, High-Skill Jobs Have Grown, But So Have Low-Wage, Low-Skill Jobs
Why Is This Important? The rise of new industries has meant the
rise of new jobs, while new technology and new ways of organizing work
have transformed many existing jobs. Both trends have changed the occu-
pational mix in America, which in turn affects economic opportunity and
well-being.
The Trend: Knowledge-based jobs (those requiring post secondary, voca-
tional, or higher education) have grown as a share of total employment. For
example, there were fewer than 5,000 computer programmers in America in
1960, and there are over 1.3 million today. Managerial and professional jobs
increased as a share of total employment from 22 percent in 1979 to 28.4 per-
cent in 1995. However, in the last decade, as the share of these knowledge-
based jobs has increased, the share of mid-level skilled jobs has declined.
This bifurcating trend of growth in both high- and low-skilled jobs is expected
to continue. Jobs requiring an associates degree or above are expected to
increase from 31 percent of all jobs in 1996 to 32.4 percent in 2006. And
while the share of jobs requiring moderate-term training is expected to
decline by 1.1 percent, the share of jobs requiring only short-term training is
expected to decline only 0.3 percent. Low-skilled jobs are not going away any
time soon. The occupations with the largest predicted numerical increases are
cashiers, janitors, retail salespersons, waiters, and waitresses. Together, they
are expected to account for 13 percent of all new job growth.
“There were fewer than 5,000 computer programmersin 1960, and over 1.3 million today... But the occupations
with the largest predicted numerical increases are cashiers, janitors, retail salespersons, waiters and waitresses.”

8/4/2019 The New Economy PPI
http://slidepdf.com/reader/full/the-new-economy-ppi 14/54
N E W EC O N O M Y I N D E X 1
WHAT’S NEW ABOUT THE NEW ECONOMY
GLOBALIZATION
Trade Is an Increasing Share of the New Economy
Why Is This Important? The dramatic expansion of trade means
more robust competition, which makes constant innovation more critical
to success. For that reason, globalization has accelerated industrial and
occupational restructuring, leading to the decline of some industries and
jobs, and the growth of others. One indicator of the extent of the trend
toward globalization is the growing value of exports and imports as a share
of the economy.
The Trend: Trade has become an integral part of the United States’ and
world economies. U.S. exports and imports have increased from 11 per-
cent of GDP in 1970 to 25 percent in 1997. Moreover, the United States is
increasingly specializing in more complex, higher value-added goods and
services, as reflected in the fact that the average weight of a dollar’s worth
of American exports is less than half of what it was in 1970.
World exports increased from $1.3 trillion in 1970 to $4.3 trillion in
1995, in constant dollars. And globalization may be about to move up to
a new level. Jane Fraser and Jeremy Oppenheim, of the consulting firm
McKinsey & Company, have estimated that the value of the world econo-
my that is “globally contestable,” which is to say open to global competi-
tors in product, service, or asset ownership markets, will rise from about
$4 trillion in 1995 (approximately a seventh of the world’s output) to more
than $21 trillion by 2000 (about half of world output). According to Fraser
and Oppenheim, “We are on the brink of a major long-term transformation
of the world economy from a series of local industries locked in closed
national economies to a system of integrated global markets contested by
global players.”11 This growth will be driven by global capital markets,
reduced economic and trade barriers, and perhaps most importantly, tech-
nological change, which makes it easier to locate enterprises and sell
products and services almost anywhere. For example, online brokerages
like E-Trade or Charles Schwab are just as accessible from Singapore or
New Zealand as they are from the United States.
12
“The average weight of a dollar’s worth of Americanexports is less than half of what it was in 1970.”
8/4/2019 The New Economy PPI
http://slidepdf.com/reader/full/the-new-economy-ppi 15/54
1 2 N E W E C O N O M Y I N D E X
WHAT’S NEW ABOUT THE NEW ECONOMY?
GLOBALIZATION
The Knowledge Economy: Knowledge Producers and Knowledge Users
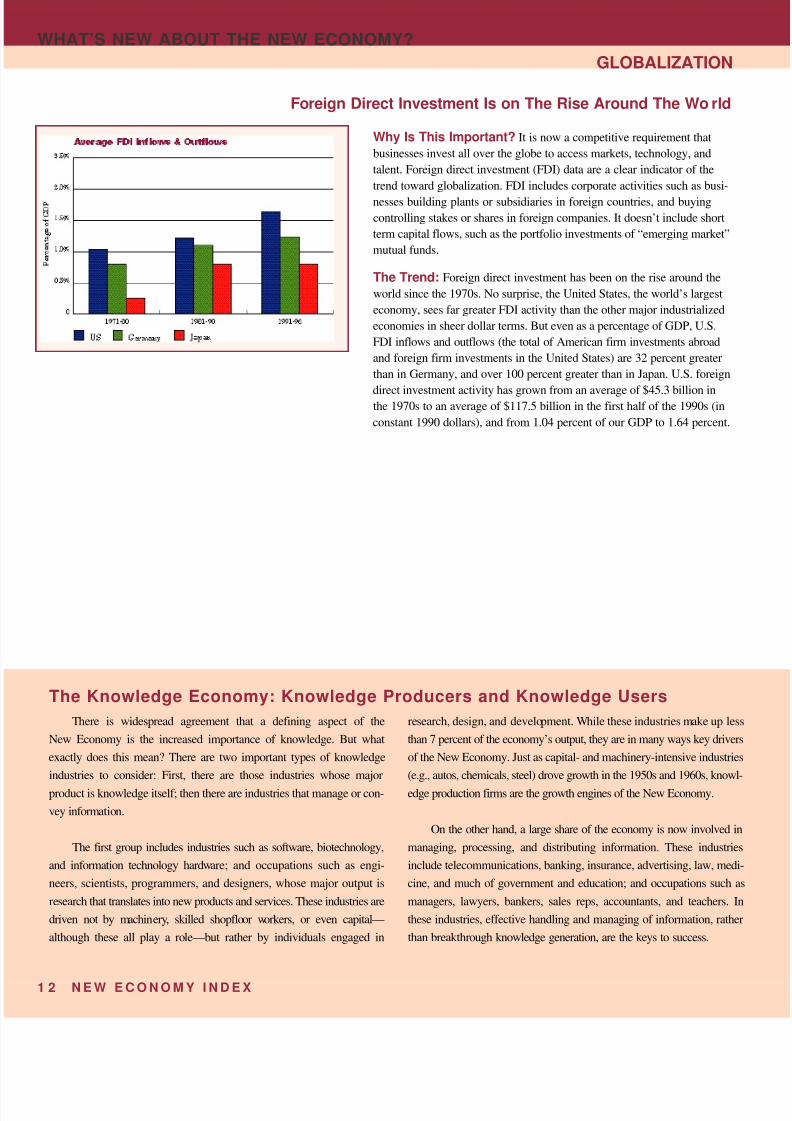
Foreign Direct Investment Is on The Rise Around The World
There is widespread agreement that a defining aspect of the
New Economy is the increased importance of knowledge. But what
exactly does this mean? There are two important types of knowledge
industries to consider: First, there are those industries whose major
product is knowledge itself; then there are industries that manage or con-
vey information.
The first group includes industries such as software, biotechnology,
and information technology hardware; and occupations such as engi-
neers, scientists, programmers, and designers, whose major output is
research that translates into new products and services. These industries are
driven not by machinery, skilled shopfloor workers, or even capital—
although these all play a role—but rather by individuals engaged in
research, design, and development. While these industries make up less
than 7 percent of the economy’s output, they are in many ways key drivers
of the New Economy. Just as capital- and machinery-intensive industries
(e.g., autos, chemicals, steel) drove growth in the 1950s and 1960s, knowl-
edge production firms are the growth engines of the New Economy.
On the other hand, a large share of the economy is now involved in
managing, processing, and distributing information. These industries
include telecommunications, banking, insurance, advertising, law, medi-
cine, and much of government and education; and occupations such as
managers, lawyers, bankers, sales reps, accountants, and teachers. In
these industries, effective handling and managing of information, rather
than break through knowledge generation, are the keys to success.
Why Is This Important? It is now a competitive requirement that
businesses invest all over the globe to access markets, technology, and
talent. Foreign direct investment (FDI) data are a clear indicator of the
trend toward globalization. FDI includes corporate activities such as busi-
nesses building plants or subsidiaries in foreign countries, and buying
controlling stakes or shares in foreign companies. It doesn’t include short
term capital flows, such as the portfolio investments of “emerging market”
mutual funds.
The Trend: Foreign direct investment has been on the rise around the
world since the 1970s. No surprise, the United States, the world’s largest
economy, sees far greater FDI activity than the other major industrialized
economies in sheer dollar terms. But even as a percentage of GDP, U.S.
FDI inflows and outflows (the total of American firm investments abroad
and foreign firm investments in the United States) are 32 percent greater
than in Germany, and over 100 percent greater than in Japan. U.S. foreign
direct investment activity has grown from an average of $45.3 billion inthe 1970s to an average of $117.5 billion in the first half of the 1990s (in
constant 1990 dollars), and from 1.04 percent of our GDP to 1.64 percent.

8/4/2019 The New Economy PPI
http://slidepdf.com/reader/full/the-new-economy-ppi 16/54
N E W E C O N O M Y I N D E X 1
WHAT’S NEW ABOUT THE NEW ECONOMY
DYNAMISM AND COMPETITION
The increased importance of knowledge means that the net stock of
intangible capital (e.g., education and research and development) has
grown faster than tangible capital (e.g., buildings, transportation, roads,
and machinery). Federally-financed intangible capital has increased
f rom 60 percent of the value of federally-financed physical capital in
1970 to 93 percent today.13 This trend is equally true in business. In the
1960s and 1970s about 25 percent of the diff erence in average stock
price earnings could be attributed to change in reported earnings. By the
early 1990s, this had dropped to less than 10 percent.14 Part of this
change is attributable to the fact that the worth of companies is increas-
ingly related to intangible assets (R&D, brands, employee talent and
knowledge) that traditional accounting fails to measure.
In the New Economy, intangible capital has become at least as
important as tangible capital, and a greater share of the value of tangi-
ble capital is based on intangible inputs. As we have become richer, we
have increasingly consumed services and goods with higher value-
added content. This trend is demonstrated by the fact that the economic
output of the U.S. economy, as measured in tons, is roughly the same as
it was a century ago, yet its real economic value is 20 times greater15. In
other words, we have added intangible attributes to goods and services
the most important being knowledge. One example is anti-lock brakes
which are the product of a generation of research and development, and
are loaded with electronics. They don’t weigh any more than conventiona
brakes, but they certainly provide a great deal more value to drivers.
The Economy Is Spawning New, Fast-Growing Entrepreneurial Companies
Why Is This Important? The ability and willingness of entrepreneurs
to take risks and start new, fast-growing companies, coupled with institu-
tions and laws that support entrepreneurship, has sparked growth and job
creation. In a quickly changing economy with a premium on innovation,
the degree to which the economy is composed of new rapidly growing
firms is indicative of innovative capacity. But it is not small firms per se
that are the key; it is the relatively small number of fast-growing
“gazelles” (companies with sales growth of at least 20 percent per year
for four straight years) that account for the lion’s share of net new jobs
from small companies.
The Trend: The economy is increasingly made up of these gazelles.
Since 1993, the number of gazelles has grown 40 percent, to over
355,000. These companies are responsible for creating 70 percent of the
net new jobs added to the economy between 1993 and 1996. The small
share of gazelles with over 100 employees accounted for 46 percent of total
job growth. Additionally, over the course of the last three decades, f inan-cial markets seem to have evolved to embrace entrepreneurial dynamism
more than in the past. The trend is reflected in the fact that the number of
initial public offerings (first rounds of companies’ stock sold when they
make their debut in the public markets) has been rising steadily, by a
total of some 50 percent between the 1960s and the 1990s. Although, the
IPO market has cooled considerably in the recent market volatility.
8/4/2019 The New Economy PPI
http://slidepdf.com/reader/full/the-new-economy-ppi 17/54
1 4 N E W E C O N O M Y I N D E X
WHAT’S NEW ABOUT THE NEW ECONOMY?
DYNAMISM AND COMPETITION
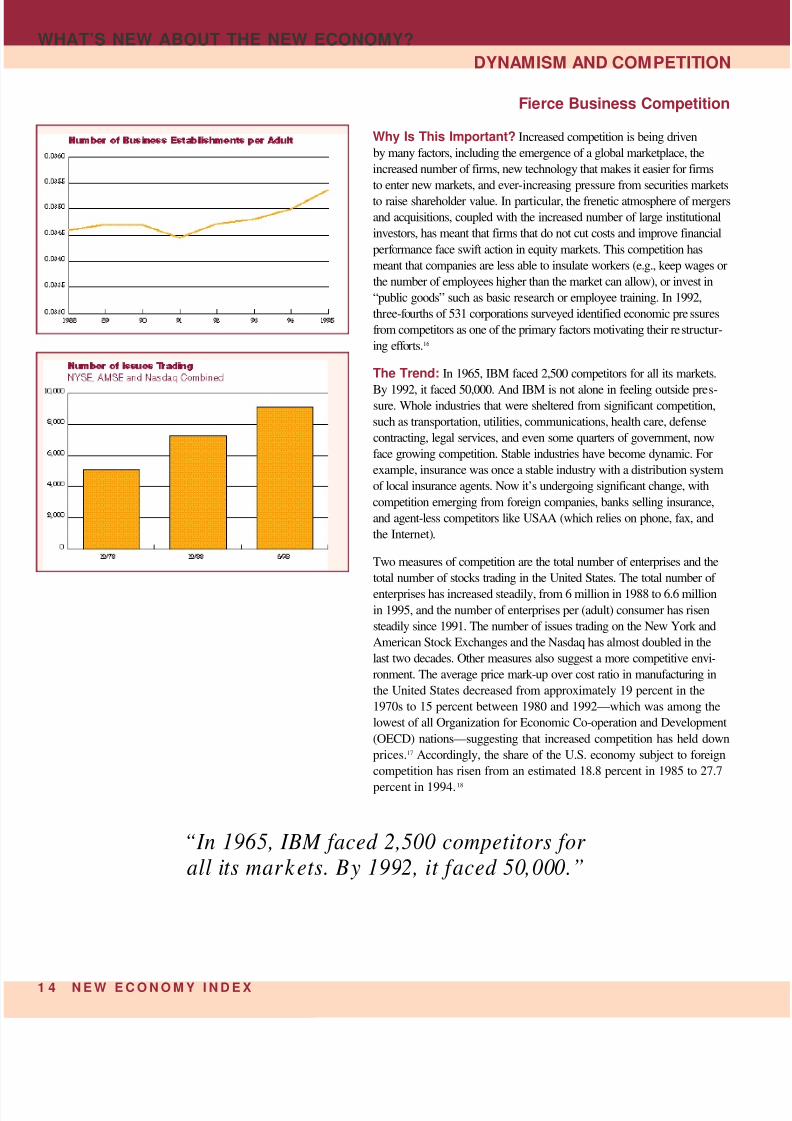
Fierce Business Competition
Why Is This Important? Increased competition is being driven
by many factors, including the emergence of a global marketplace, the
increased number of firms, new technology that makes it easier for firms
to enter new markets, and ever-increasing pressure from securities markets
to raise shareholder value. In particular, the frenetic atmosphere of mergers
and acquisitions, coupled with the increased number of large institutional
investors, has meant that firms that do not cut costs and improve financial
perf ormance face swift action in equity markets. This competition has
meant that companies are less able to insulate workers (e.g., keep wages or
the number of employees higher than the market can allow), or invest in
“public goods” such as basic research or employee training. In 1992,
three-f ourths of 531 corporations surveyed identified economic pressures
f rom competitors as one of the primary factors motivating their restructur-
ing eff orts.16
The Trend: In 1965, IBM faced 2,500 competitors for all its markets.
By 1992, it faced 50,000. And IBM is not alone in feeling outside pres-sure. Whole industries that were sheltered from significant competition,
such as transportation, utilities, communications, health care, defense
contracting, legal services, and even some quarters of government, now
face growing competition. Stable industries have become dynamic. For
example, insurance was once a stable industry with a distribution system
of local insurance agents. Now it’s undergoing significant change, with
competition emerging from foreign companies, banks selling insurance,
and agent-less competitors like USAA (which relies on phone, fax, and
the Internet).
Two measures of competition are the total number of enterprises and the
total number of stocks trading in the United States. The total number of
enterprises has increased steadily, from 6 million in 1988 to 6.6 million
in 1995, and the number of enterprises per (adult) consumer has risen
steadily since 1991. The number of issues trading on the New York and
American Stock Exchanges and the Nasdaq has almost doubled in the
last two decades. Other measures also suggest a more competitive envi-
ronment. The average price mark-up over cost ratio in manufacturing in
the United States decreased from approximately 19 percent in the
1970s to 15 percent between 1980 and 1992—which was among the
lowest of all Organization for Economic Co-operation and Development
(OECD) nations—suggesting that increased competition has held down
prices.17 Accordingly, the share of the U.S. economy subject to foreign
competition has risen from an estimated 18.8 percent in 1985 to 27.7
percent in 1994.18
“In 1965, IBM faced 2,500 competitors for all its markets. By 1992, it faced 50,000.”
8/4/2019 The New Economy PPI
http://slidepdf.com/reader/full/the-new-economy-ppi 18/54
N E W EC O N O M Y I N D E X 1
WHAT’S NEW ABOUT THE NEW ECONOMY
DYNAMISM AND COMPETITION
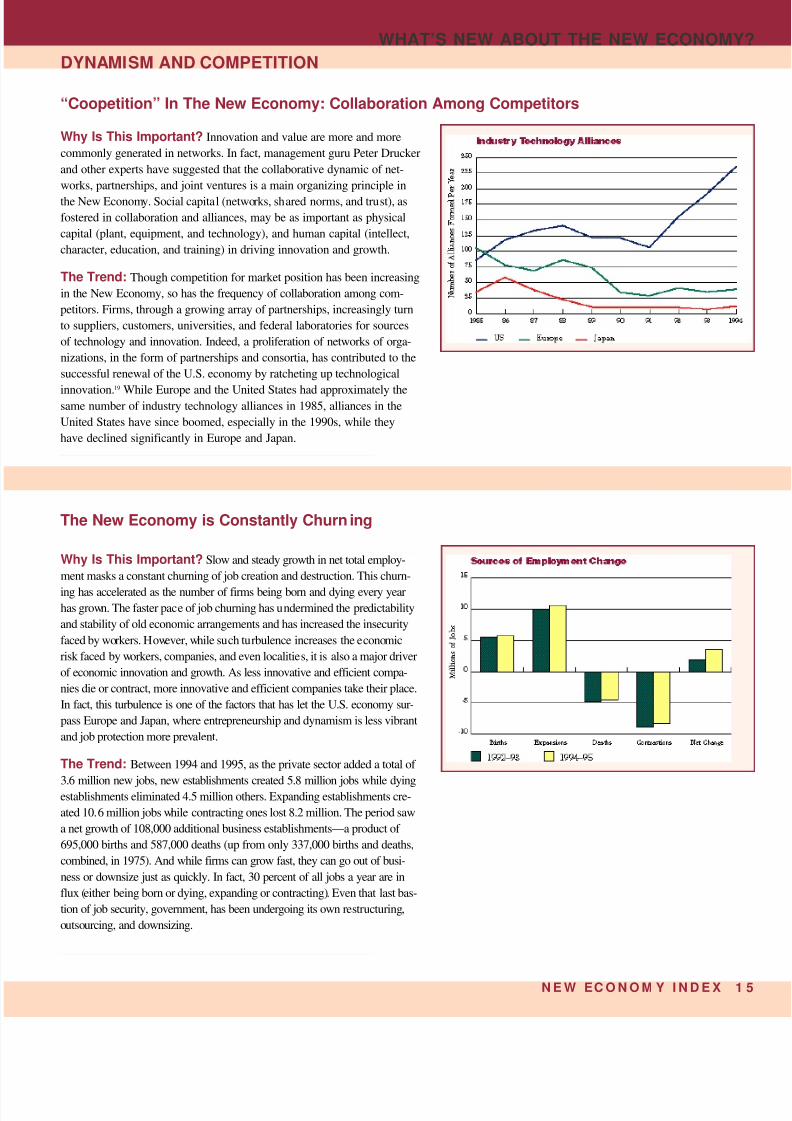
Why Is This Important? Innovation and value are more and more
commonly generated in networks. In fact, management guru Peter Drucker
and other experts have suggested that the collaborative dynamic of net-
works, partnerships, and joint ventures is a main organizing principle in
the New Economy. Social capital (networks, shared norms, and trust), as
fostered in collaboration and alliances, may be as important as physical
capital (plant, equipment, and technology), and human capital (intellect,
character, education, and training) in driving innovation and growth.
The Trend: Though competition for market position has been increasing
in the New Economy, so has the frequency of collaboration among com-
petitors. Firms, through a growing array of partnerships, increasingly turn
to suppliers, customers, universities, and federal laboratories for sources
of technology and innovation. Indeed, a proliferation of networks of orga-
nizations, in the form of partnerships and consortia, has contributed to the
successful renewal of the U.S. economy by ratcheting up technological
innovation.19
While Europe and the United States had approximately thesame number of industry technology alliances in 1985, alliances in the
United States have since boomed, especially in the 1990s, while they
have declined significantly in Europe and Japan.
The New Economy is Constantly Churning
Why Is This Important? Slow and steady growth in net total employ-
ment masks a constant churning of job creation and destruction. This churn-
ing has accelerated as the number of firms being born and dying every yearhas grown. The faster pace of job churning has undermined the predictability
and stability of old economic arrangements and has increased the insecurity
faced by workers. However, while such turbulence increases the economic
risk faced by workers, companies, and even localities, it is also a major driver
of economic innovation and growth. As less innovative and efficient compa-
nies die or contract, more innovative and efficient companies take their place.
In fact, this turbulence is one of the factors that has let the U.S. economy sur-
pass Europe and Japan, where entrepreneurship and dynamism is less vibrant
and job protection more prevalent.
The Trend: Between 1994 and 1995, as the private sector added a total of
3.6 million new jobs, new establishments created 5.8 million jobs while dyingestablishments eliminated 4.5 million others. Expanding establishments cre-
ated 10.6 million jobs while contracting ones lost 8.2 million. The period saw
a net growth of 108,000 additional business establishments—a product of
695,000 births and 587,000 deaths (up from only 337,000 births and deaths,
combined, in 1975). And while firms can grow fast, they can go out of busi-
ness or downsize just as quickly. In fact, 30 percent of all jobs a year are in
flux (either being born or dying, expanding or contracting). Even that last bas-
tion of job security, government, has been undergoing its own restructuring,
outsourcing, and downsizing.
“Coopetition” In The New Economy: Collaboration Among Competitors

8/4/2019 The New Economy PPI
http://slidepdf.com/reader/full/the-new-economy-ppi 19/54
1 6 N E W E C O N O M Y I N D E X
WHAT’S NEW ABOUT THE NEW ECONOMY?
DYNAMISM AND COMPETITION
Consumer Choices Are Exploding
Why Is This Important? The New Economy is no longer a mass pro-
duction economy where, as Henry Ford is reported to have said, “You can
have a Model T in any color as long as it’s black.” The rise of production
processes based on information technology has allowed companies to develop
“flexible” factories and offices in which costs rise little when variety expands.
More flexible and agile companies are better able to efficiently target new and
diverse markets. Moreover, fiercer business competition has meant that com-
panies are constantly developing new products and services in order to gain
new markets. Consumers benefit because their needs are more specifically
addressed.
The Trend: One indicator of expanding consumer choice is the number of
trademarks filed by companies. Between 1984 and 1989, the number of
trademarks filed grew steadily. However, since 1989, filings have taken off ,
increasing from about 80,000 per year to 180,000 per year in 1995. Other
indicators also suggest growing consumer choice. The average number of
products in grocery stores has increased from under 13,000 in 1980 to 30,000in 1998. Similarly, the average number of magazines published has increased
f rom 2,500 in 1987 to 4,400 in 1997. Overall, an estimated 50,000 new prod-
ucts are announced every year in America, up from only a few thousand
annually in 1970.20 In a broad range of product and service categorizes,
Americans are off ered an expanding array of choices. In fact, the brand that
has the largest market share in many consumer markets today is “other.”21
“An estimated 50,000 new products are announced every year in America, up from only a few thousand annually in 1970.”
8/4/2019 The New Economy PPI
http://slidepdf.com/reader/full/the-new-economy-ppi 20/54
N E W E C O N O M Y I N D E X 1
WHAT’S NEW ABOUT THE NEW ECONOMY
DYNAMISM AND COMPETITION
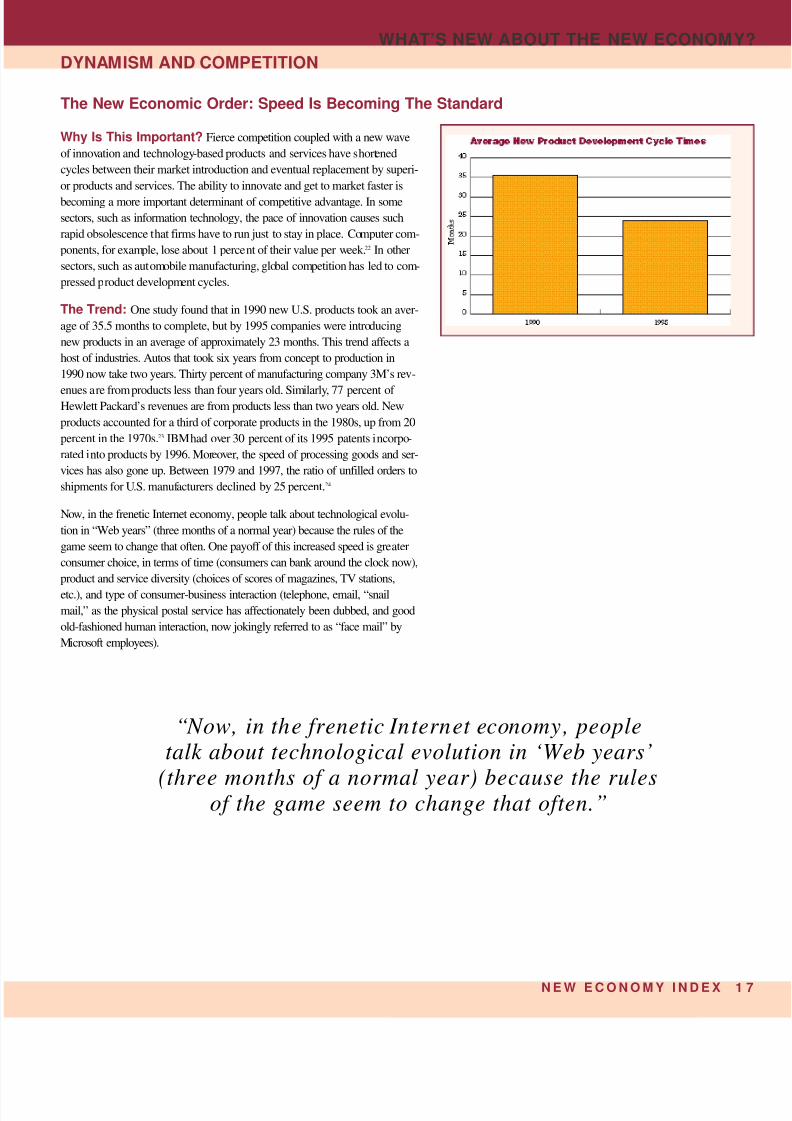
The New Economic Order: Speed Is Becoming The Standard
Why Is This Important? Fierce competition coupled with a new wave
of innovation and technology-based products and services have shortened
cycles between their market introduction and eventual replacement by superi-
or products and services. The ability to innovate and get to market faster is
becoming a more important determinant of competitive advantage. In some
sectors, such as information technology, the pace of innovation causes such
rapid obsolescence that firms have to run just to stay in place. Computer com-
ponents, for example, lose about 1 percent of their value per week.22 In other
sectors, such as automobile manufacturing, global competition has led to com-
pressed product development cycles.
The Trend: One study found that in 1990 new U.S. products took an aver-
age of 35.5 months to complete, but by 1995 companies were introducing
new products in an average of approximately 23 months. This trend affects a
host of industries. Autos that took six years from concept to production in
1990 now take two years. Thirty percent of manufacturing company 3M’s rev-
enues are from products less than four years old. Similarly, 77 percent of Hewlett Packard’s revenues are from products less than two years old. New
products accounted for a third of corporate products in the 1980s, up from 20
percent in the 1970s.23 IBM had over 30 percent of its 1995 patents incorpo-
rated into products by 1996. Moreover, the speed of processing goods and ser-
vices has also gone up. Between 1979 and 1997, the ratio of unfilled orders to
shipments for U.S. manufacturers declined by 25 percent.24
Now, in the frenetic Internet economy, people talk about technological evolu-
tion in “Web years” (three months of a normal year) because the rules of the
game seem to change that often. One payoff of this increased speed is greater
consumer choice, in terms of time (consumers can bank around the clock now),
product and service diversity (choices of scores of magazines, TV stations,
etc.), and type of consumer-business interaction (telephone, email, “snail
mail,” as the physical postal service has affectionately been dubbed, and good
old-fashioned human interaction, now jokingly ref erred to as “face mail” by
Microsoft employees).
“Now, in the frenetic Internet economy, peopletalk about technological evolution in ‘Web years’
(three months of a normal year) because the rulesof the game seem to change that often.”

8/4/2019 The New Economy PPI
http://slidepdf.com/reader/full/the-new-economy-ppi 21/54
1 8 N E W E C O N O M Y I N D E X
WHAT’S NEW ABOUT THE NEW ECONOMY?
THE INFORMATION TECHNOLOGY REVOLUTION
Microchips Are Everywhere
Computing Costs Are Plummeting
Why Is This Important? Information technology—everything fromfaxes and phones to computers and the Internet—is transforming busi-
nesses and industries. Information technology is increasing efficiencies,
cutting costs, driving customization of products and services, and increas-
ing the speed of commerce. The trend is also enabling the emergence of
whole new industries and products, as witnessed by the hundreds of thou-
sands of new jobs created by the Internet.
The Trend: Moore’s Law (named after Gordon Moore, a founder of
Intel), which says that the processing power of microchips doubles every
18 months, has a corollary: the cost of computing is dropping by nearly
25 percent per year. In 1978, Intel Corporation introduced its 8086 chip,
which defined the base architecture for the later x86 series (including the
386, 486, and Pentium chips). It contained 29,000 transistors. Four years
later came the 286, with 134,000 transistors. Three years after that, the
386 had 275,000 transistors. And on the trend goes: the Pentium Pro,
introduced in 1995, had 5.5 million transistors in its core central process-
ing unit. Meanwhile, the cost of all that computing power has been drop-
ping precipitously. In 1978, the price of Intel’s 8086 was 1.2 cents per
transistor, and $480 per million instructions per second (MIPS). By 1985,
the 386 cost 0.11 cents per transistor and $50 per MIPS. Ten years later,
the Pentium Pro’s introductory price amounted to 0.02 cents per transis-
tor, and $4 per MIPS. And the prices are expected to continue to fall.
Why Is This Important? There may be no better testament to the fact
that we have passed from a mechanized, industrial era into a new, digital
era than the proliferation of semiconductor technology—the combination
of integrated circuits (chips) and other discrete components found on cir-
cuit boards in everything from desktop computers to phones, cars, kitchen
appliances, medical devices, and even roads.
The Trend: The world’s appetite for semiconductors has been growing
dramatically, and the trend (despite recent market weakness) is expected
to continue. In 1984, worldwide shipments of semiconductors totaled 88
billion units, and by 1997 world shipments were close to 260 billion
units—nearly a 200 percent increase. By 2003, the number is expected to
pass the 400 billion unit mark.
From 1982 to 1996, the world semiconductor market has grown from a
$20 billion market into well over a $100 billion market in constant 1992
dollars. In the same period in the United States, semiconductor sales as a
percentage of GDP rose from less than 0.2 percent to as high as 0.65 per-
cent, all while dropping in price.

8/4/2019 The New Economy PPI
http://slidepdf.com/reader/full/the-new-economy-ppi 22/54
N E W EC O N O M Y I N D E X 1
WHAT’S NEW ABOUT THE NEW ECONOMY
THE INFORMATION TECHNOLOGY REVOLUTION
Data Transmission Costs Are Plummeting
Why Is This Important? One of the chief enablers of the New
Economy is instantaneous global communications: the ability to easily
send and receive data—everything from documents to video and multime-
dia—inexpensively. One measure of progress in that direction is the cost
of data transmission.
The Trend: The cost to transmit one bit of data over a kilometer of
f iberoptic cable declined by three orders of magnitude between the mid-
1970s and the beginning of the 1990s, allowing more data to be transmitted
over longer distances at lower prices.
Technologies for transmitting data are also getting more and more powerf ul.
For example, technology recently developed by Lucent transmits 3.2 terabits
—which is approximately equal to 90,000 volumes of an encyclopedia—
per second.
“Moore’s Law, which says that the processing power of microchips doubles every 18 months, has a corollary: the cost
of computing is dropping by nearly 25 percent per year.”
8/4/2019 The New Economy PPI
http://slidepdf.com/reader/full/the-new-economy-ppi 23/54
2 0 N E W E C O N O M Y I N D E X
SECTION II
New Economy Outcomes:Impacts on Americans
As Section I illustrates, America is in the midst of an economic
transformation. This section examines its impact on the well-being of
Americans. We pay specific attention to productivity and income growth,the number and types of jobs being produced, un- and under-employment
rates, and work stability and risk. The means to these end results may
change in new economic times, but the importance of the end results
themselves does not.
Conventional indicators give the appearance of strong economic
performance. Jobs are up. Inflation and unemployment are down. And
despite recent volatility, the stock market has boomed in the 1990s.
However, more fundamental measures of economic well-being, particularlyper capita GDP, productivity, and wage inequality, suggest that the New
Economy has not yet realized its full potential. Ensuring that it does is
the key mid- and long-term policy challenge in the New Economy.
8/4/2019 The New Economy PPI
http://slidepdf.com/reader/full/the-new-economy-ppi 24/54
N E W E C ON O M Y I N D E X 2
NEW ECONOMY OUTCOME
IMPACTS ON AMERICANS
Productivity Growth is Lagging
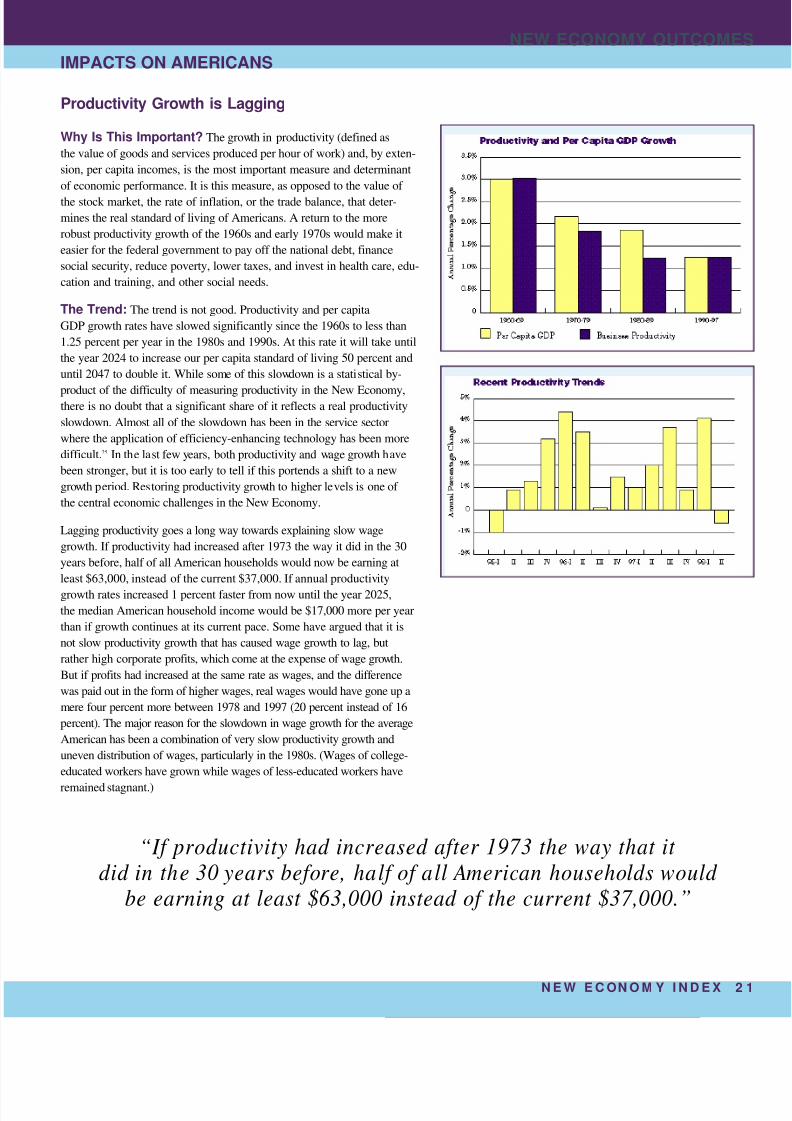
Why Is This Important? The growth in productivity (defined as
the value of goods and services produced per hour of work) and, by exten-
sion, per capita incomes, is the most important measure and determinant
of economic performance. It is this measure, as opposed to the value of
the stock market, the rate of inflation, or the trade balance, that deter-
mines the real standard of living of Americans. A return to the more
robust productivity growth of the 1960s and early 1970s would make it
easier for the federal government to pay off the national debt, finance
social security, reduce poverty, lower taxes, and invest in health care, edu-
cation and training, and other social needs.
The Trend: The trend is not good. Productivity and per capita
GDP growth rates have slowed significantly since the 1960s to less than
1.25 percent per year in the 1980s and 1990s. At this rate it will take until
the year 2024 to increase our per capita standard of living 50 percent and
until 2047 to double it. While some of this slowdown is a statistical by-
product of the difficulty of measuring productivity in the New Economy,there is no doubt that a significant share of it reflects a real productivity
slowdown. Almost all of the slowdown has been in the service sector
where the application of efficiency-enhancing technology has been more
difficult.25 In the last few years, both productivity and wage growth have
been stronger, but it is too early to tell if this portends a shift to a new
growth period. Restoring productivity growth to higher levels is one of
the central economic challenges in the New Economy.
Lagging productivity goes a long way towards explaining slow wage
growth. If productivity had increased after 1973 the way it did in the 30
years before, half of all American households would now be earning at
least $63,000, instead of the current $37,000. If annual productivity
growth rates increased 1 percent faster from now until the year 2025,
the median American household income would be $17,000 more per year
than if growth continues at its current pace. Some have argued that it is
not slow productivity growth that has caused wage growth to lag, but
rather high corporate profits, which come at the expense of wage growth.
But if profits had increased at the same rate as wages, and the diff erence
was paid out in the form of higher wages, real wages would have gone up a
mere four percent more between 1978 and 1997 (20 percent instead of 16
percent). The major reason for the slowdown in wage growth for the average
American has been a combination of very slow productivity growth and
uneven distribution of wages, particularly in the 1980s. (Wages of college-
educated workers have grown while wages of less-educated workers have
remained stagnant.)
“If productivity had increased after 1973 the way that it did in the 30 years before, half of all American households would
be earning at least $63,000 instead of the current $37,000.”
8/4/2019 The New Economy PPI
http://slidepdf.com/reader/full/the-new-economy-ppi 25/54
2 2 N E W E C O N O M Y I N D E X
NEW ECONOMY OUTCOMES
IMPACTS ON AMERICANS
Nobel Prize-winning economist Robert Solow has said that we see
computers everywhere except in the productivity statistics. That pro-
ductivity measures do not seem to show any impact from new com-
puter and information technologies has been labeled the “productivi-
ty paradox.” Productivity growth has slowed every decade since the
1960s while investments in information technology have grown dra-
matically. Some take this as proof that information technology doesn’t
affect productivity.
Yet the real reason for the productivity paradox may lie in the
fact that the U.S. economy is neither fully in the old mechanized
economy nor yet in the new digital economy. The animating force in
the old economy was the desire to mechanize goods production and
handling—to automate the assembly line and the farm. And this
effort has paid off handsomely, with 3 percent to 4 percent productiv-
ity growth per year in manufacturing and agriculture for the last 100
years. But now, with over 80 percent of jobs in the service sector,
where productivity is growing at less than 1 percent per year, mecha-
nization has run its course as the predominant driver of productivity.
Until recently, it has proven difficult to introduce the kinds of pro-
ductivity-enhancing technologies in many service industries that are
used in manufacturing. But the next big motor force of productivity
improvement, digitization, is only in its early stages and hasn’t yet
reached the critical mass necessary to significantly affect macro-eco-
nomic productivity statistics.
Make no mistake, application of information technology does
improve productivity. Since the 1970s, productivity has grown about
1.1 percent per year for sectors that have invested heavily in com-
puters and approximately 0.35 percent for sectors that have invested
less heavily.26 Research by MIT economists shows that in the 1990s
computers contribute significantly to firm-level output and productiv-
ity.27 But the effects have been concentrated in a limited number of
firms and industries.
As we make the transition to a more digital economy, the effects
are likely to be felt economy-wide. It wasn’t until the early 1990s
that microprocessors were fast and cheap enough to really work well
in a wide range of applications. Pentium computer chips weren’t
introduced until 1993. The Internet didn’t begin to become a mass
medium until 1994. Emerging new technologies such as smart cards,
voice-based computing, video telephony, “expert system” software,
and the “Next Generation Internet” are just now beginning to arrive.
When these and others are widely used, and when a majority of the
economy and society are linked through digital networks, it will be
possible to speak of a nearly complete digitization of the economy.
When this happens, a large share of economic functions will be con-
ducted through digital information technology, while paper (e.g.,
cash, forms, files) and routine face-to-face (e.g, clerks, order takers)
transactions will become less important, leading to significantly
increased efficiencies. For example, while the cost of a teller trans-
action at a bank is $1.07, the cost of a similar online banking trans-
action is one cent.
As a result, the animating force for productivity and wage growth
in the New Economy will be the pervasive use of digital electronic
technologies to increase efficiency and productivity, particularly in
the heretofore low-technology service sector. The digitization of the
economy in the 21st century promises to bring the kinds of economic
benefits to Americans that mechanization brought in the 20th. And
this will be spurred by the “network effect”—the more Americans
use these technologies (e.g., Internet, smart cards, broadband
telecommunications), the more applications will be developed, and
the more value they will provide for users. Once this occurs, the pro-
ductivity paradox could very likely give way to a productivity and
wage boom. Government can play an important role in facilitating the
transition to a digital economy by adopting laws and regulations that
explicitly support and advance electronic commerce.
Explaining The Productivity Paradox
8/4/2019 The New Economy PPI
http://slidepdf.com/reader/full/the-new-economy-ppi 26/54
N E W E C ON O M Y I N D E X 2
NEW ECONOMY OUTCOME
IMPACTS ON AMERICANS
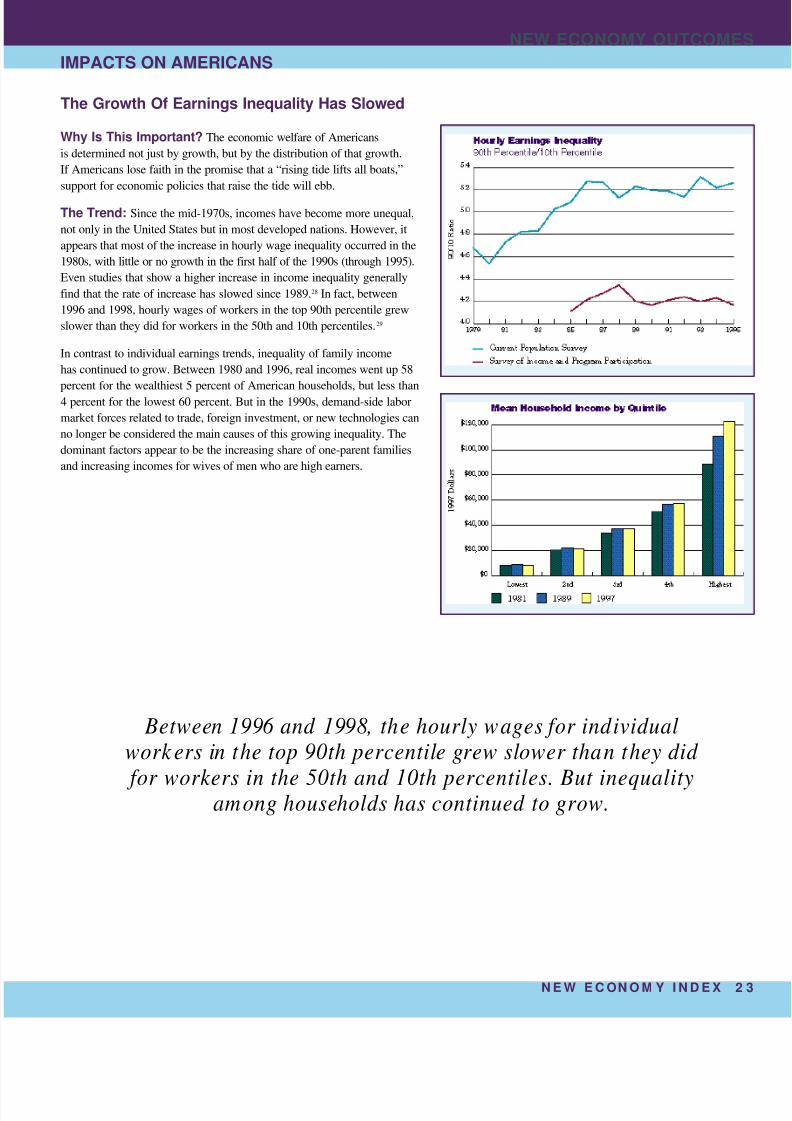
The Growth Of Earnings Inequality Has Slowed
Why Is This Important? The economic welfare of Americans
is determined not just by growth, but by the distribution of that growth.
If Americans lose faith in the promise that a “rising tide lifts all boats,”
support for economic policies that raise the tide will ebb.
The Trend: Since the mid-1970s, incomes have become more unequal,
not only in the United States but in most developed nations. However, it
appears that most of the increase in hourly wage inequality occurred in the
1980s, with little or no growth in the first half of the 1990s (through 1995).
Even studies that show a higher increase in income inequality generally
find that the rate of increase has slowed since 1989.28 In fact, between
1996 and 1998, hourly wages of workers in the top 90th percentile grew
slower than they did for workers in the 50th and 10th percentiles. 29
In contrast to individual earnings trends, inequality of family income
has continued to grow. Between 1980 and 1996, real incomes went up 58
percent for the wealthiest 5 percent of American households, but less than
4 percent for the lowest 60 percent. But in the 1990s, demand-side labor
market forces related to trade, foreign investment, or new technologies can
no longer be considered the main causes of this growing inequality. The
dominant factors appear to be the increasing share of one-parent families
and increasing incomes for wives of men who are high earners.
Between 1996 and 1998, the hourly wages for individualwork ers in the top 90th percentile grew slower than they did
for workers in the 50th and 10th percentiles. But inequalityamong households has continued to grow.

8/4/2019 The New Economy PPI
http://slidepdf.com/reader/full/the-new-economy-ppi 27/54
2 4 N E W E C O N O M Y I N D E X
NEW ECONOMY OUTCOMES
IMPACTS ON AMERICANS
Fewer Workers Are Unemployed and Under-employed
Modest Increases In Worker Displacement
Why Is This Important? Ensuring that all Americans who want to work
are able to is the goal of any economy, new or old. One indicator of progress
in that direction is the share of Americans who are either unemployed or
involuntarily working part-time instead of full-time (under-employed).
The Trend: Together, unemployment and under-employment declined as
a percentage of total employment from 11.4 percent in 1987 to 9.7 percent
in 1989, but increased in the recession of the early 1990s. In 1997, at a
similar period of the business cycle, the figure was down to 8.4 percent.
In the New Economy, even in periods of low unemployment, the United
States should be able to enjoy lower levels of inflation than were the norm
in the 1970s and 1980s for two reasons. First, technology contributes to a
reduced risk of inflation by allowing companies to avoid production bot-
tlenecks. Second, globalization and other forces leading to increased com-
petition in product and labor markets tend to hold prices down by reduc-
ing the ability of workers to excessively bid up wages—and the ability of
companies to raise prices—faster than productivity increases.
Why Is This Important? One way that a more dynamic, open,
and efficient economy can affect workers is by making the labor market
more volatile, both in terms of the number of workers losing their jobs and
the average length of unemployment. Somewhat higher levels of employ-
ment volatility have increased the anxiety of many American workers andmay make them less willing to embrace the New Economy.
The Trend: Despite popular accounts that large layoffs have come with
new rapidity, the data show that layoffs are largely cyclical in nature and
have only modestly increased in the 1990s. Worker displacement (workers
with three or more years of job tenure who are laid off either permanently
or temporarily) has declined each year since the height of the 1990 and
1991 recession, but remains slightly higher than in equivalent periods in
the 1980s. Moreover, the composition of layoffs has changed. Today, a
greater share of layoffs are permanent rather than temporary, and layoffs
increasingly affect white collar rather than blue collar workers.
Even though unemployment is down and layoffs are up only slightly, work-
ers are remaining unemployed longer. The average duration of unemploy-
ment has increased from approximately 12 weeks during the 1960s to over
17 weeks in the 1990s. Long-term unemployment has increased even
more, rising 130 percent from 1975 to 1994. This trend appears to apply
to all demographic groups and all OECD nations—in fact, the rate of
increase in the United States is among the lowest, well below the increase
in Germany (320 percent), Canada (250 percent), and France (245 per-
cent). This increase in the time it takes some workers to get back to work
is closely tied to the increase in technological change, as some workers’
skills do not adapt to changing occupational demands.30
8/4/2019 The New Economy PPI
http://slidepdf.com/reader/full/the-new-economy-ppi 28/54
N E W E C O N O M Y I N D E X 2
NEW ECONOMY OUTCOME
IMPACTS ON AMERICANS
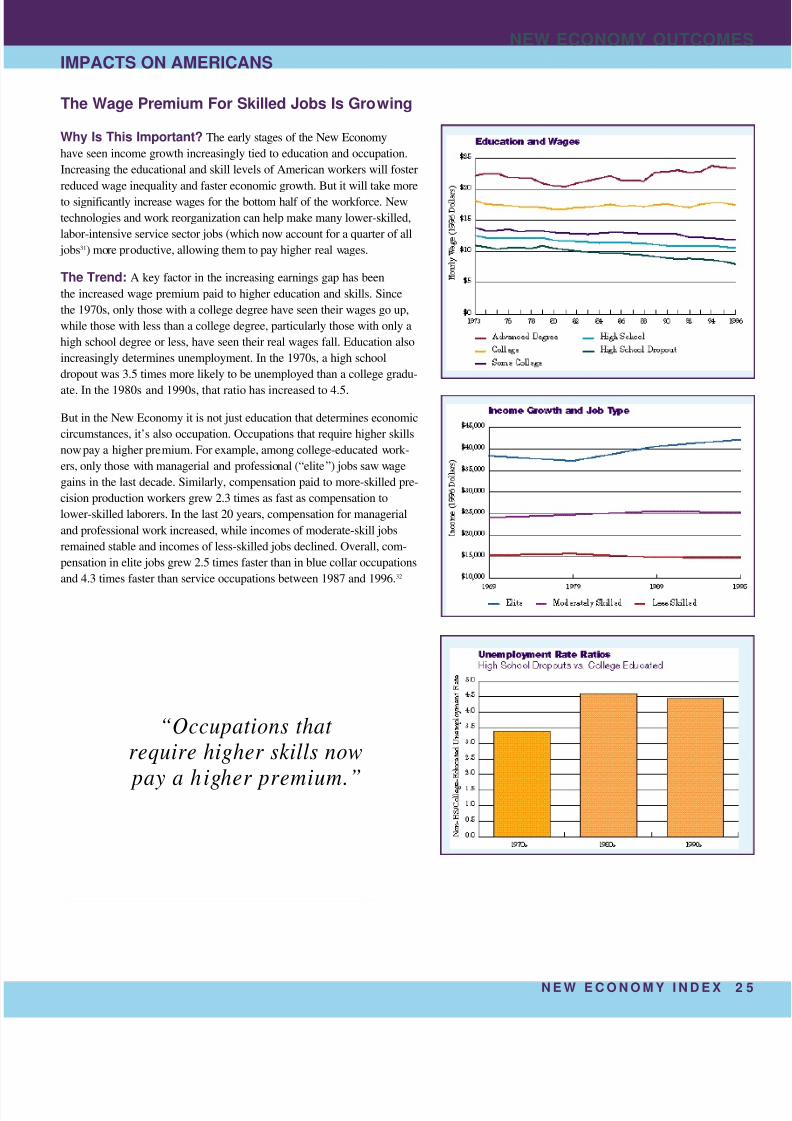
The Wage Premium For Skilled Jobs Is Growing
Why Is This Important? The early stages of the New Economy
have seen income growth increasingly tied to education and occupation.
Increasing the educational and skill levels of American workers will foster
reduced wage inequality and faster economic growth. But it will take more
to significantly increase wages for the bottom half of the workforce. New
technologies and work reorganization can help make many lower-skilled,
labor-intensive service sector jobs (which now account for a quarter of all
jobs31) more productive, allowing them to pay higher real wages.
The Trend: A key factor in the increasing earnings gap has been
the increased wage premium paid to higher education and skills. Since
the 1970s, only those with a college degree have seen their wages go up,
while those with less than a college degree, particularly those with only a
high school degree or less, have seen their real wages fall. Education also
increasingly determines unemployment. In the 1970s, a high school
dropout was 3.5 times more likely to be unemployed than a college gradu-
ate. In the 1980s and 1990s, that ratio has increased to 4.5.
But in the New Economy it is not just education that determines economic
circumstances, it’s also occupation. Occupations that require higher skills
now pay a higher premium. For example, among college-educated work-
ers, only those with managerial and professional (“elite”) jobs saw wage
gains in the last decade. Similarly, compensation paid to more-skilled pre-
cision production workers grew 2.3 times as fast as compensation to
lower-skilled laborers. In the last 20 years, compensation for managerial
and professional work increased, while incomes of moderate-skill jobs
remained stable and incomes of less-skilled jobs declined. Overall, com-
pensation in elite jobs grew 2.5 times faster than in blue collar occupations
and 4.3 times faster than service occupations between 1987 and 1996. 32
“Occupations that require higher skills now
pay a higher premium.”

8/4/2019 The New Economy PPI
http://slidepdf.com/reader/full/the-new-economy-ppi 29/54
2 6 N E W E C O N O M Y I N D E X
NEW ECONOMY OUTCOMES
IMPACTS ON AMERICANS
Employee Benefits Have Fallen
Why Is This Important? In addition to wage levels, a key indicator
of the well-being of workers is the set of benefits they receive, in part icular
retirement and health care. We are shifting from a period when employers
provided many elements of family security to one where workers must now
take greater personal responsibility for sources of economic security.
The Trend: In general, a smaller percentage of American workers are
receiving benefits today than 15 years ago. The share of workers receiving
defined-benefit pension plans has fallen from approximately 30 percent
of the workforce in 1981 to 20 percent today, while the share of workers
receiving pension plans of any type has fallen slightly since the mid-1980s.
With the continuing rise of 401-K and other defined-contribution plans,
employees are paying a greater share of total pension costs. Likewise, the
share of workers without health coverage has increased slightly from about
15 percent of the workforce in 1985 to 18 percent in 1995. And, as the
cost of health care has increased, the share of health plans requiring
matching contributions from employees has increased significantly.
33

8/4/2019 The New Economy PPI
http://slidepdf.com/reader/full/the-new-economy-ppi 30/54
N E W E C O N O M Y I N D E X 2
NEW ECONOMY OUTCOME
IMPACTS ON AMERICANS
Modest Increases In Contingent Work
Workers Experience Less Job Stability
Why Is This Important? One claim made by many about the New
Economy is that while U.S. corporations are restructuring successfully,
they are doing it by converting full-time, permanent jobs into part-time,
temporary, and contract work. Data on the share of workers who are “con-
tingent” suggest that this claim is overstated.
The Trend: Using the broadest definition of contingent work—namely,
part-time, contract, and temporary workers—it is clear that the share of the
work f orce that could qualify as contingent has grown slowly, from about 25
percent in 1980 to about 28 in 1996. In some regions of the country, such
as Silicon Valley, contingent workers appear to have grown as a share of
the workforce. Similarly, some occupations are more affected than others.
However, overall contingent work is not the nature of work in the 1990s. In
1995, fewer than one in 10 workers—9.9 percent of the total workforce
(12.1 million people)—had alternative work arrangements (8.3 were inde-
pendent contractors, 2 million were working “on call,” between 1.2 million
and 2.1 million were working for temporary help agencies, and 652,000were working for contract firms).34 Workers who expected their jobs to end
within a year made up an even smaller share—2.8 percent of the work-
f orce. And overall, with the exception of temp jobs, which increased from 1
million in 1986 to 2.1 million in 1997, these numbers have increased
slowly, if at all. For example, between 1975 and 1994, self-employment
(the largest contingent group—85 percent of the “independent contractor”
category) remained level at 8.7 percent (10.6 million), an all-time low.35
Why Is This Important? Even though most Americans still have
full-time, permanent employment, the nature of this employment has
changed. One aspect is declining employment tenure. As new companies
spring up and established companies respond to change and competition,
fewer and fewer workers can look forward to long careers with a single
employer. Employees must now continually reinvent themselves through-
out their working lives, even if they remain with the same employer.
The Trend: At first glance, median job tenure appears to have been holding
steady. This is largely because as women have been in the labor force longer
their tenure has been on the rise, and as the Baby Boom generation ages itmoves into more senior positions where tenure is longer. But men’s median
tenure fell between 1983 and 1996 in nearly every age group. For example,
tenure for men aged 45 to 54 fell from 12.8 to 10.1 years. Job tenure in the
United States is half as long as it is in other OECD nations. These changes
help explain why many Americans are anxious about the New Economy, par-
ticularly since many people affected may not be choosing these arrangements
voluntarily. One reason some workers may be changing jobs more often, how-
ever, is that the costs of switching jobs have dropped during the 1980s, to the
point where workers who changed jobs every other year had almost the same
earnings after 10 years as those who had kept their jobs for 10 years.36

8/4/2019 The New Economy PPI
http://slidepdf.com/reader/full/the-new-economy-ppi 31/54
2 8 N E W E C O N O M Y I N D E X
SECTION III
Foundations for Future Growth
While the goals are still the same in the New Economy (e.g., increasing
incomes, full employment), the means to achieve them have changed. PPI
believes that three main foundations will underpin strong and widely-
shared economic growth in the New Economy: development of a ubiqui-tous digital economy, increased research and innovation, and improved
skills and knowledge of the workforce. The indicators in this section
assess our progress in these areas. Each is marked with a trend line indi-
cating positive ( ), negative ( ), or no progress ( ).
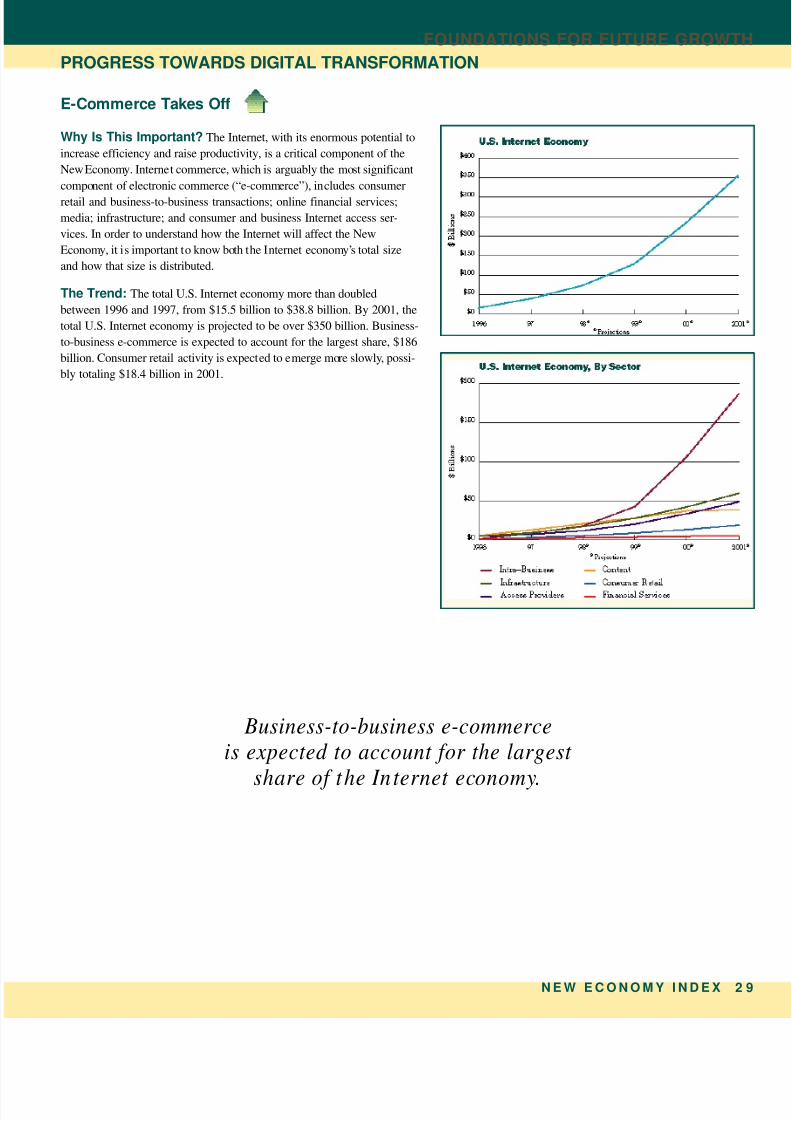
8/4/2019 The New Economy PPI
http://slidepdf.com/reader/full/the-new-economy-ppi 32/54
N E W E C O N O M Y I N D E X 2
E-Commerce Takes Off
Why Is This Important? The Internet, with its enormous potential to
increase efficiency and raise productivity, is a critical component of the
New Economy. Internet commerce, which is arguably the most significant
component of electronic commerce (“e-commerce”), includes consumer
retail and business-to-business transactions; online financial services;
media; infrastructure; and consumer and business Internet access ser-
vices. In order to understand how the Internet will affect the New
Economy, it is important to know both the Internet economy’s total size
and how that size is distributed.
The Trend: The total U.S. Internet economy more than doubled
between 1996 and 1997, from $15.5 billion to $38.8 billion. By 2001, the
total U.S. Internet economy is projected to be over $350 billion. Business-
to-business e-commerce is expected to account for the largest share, $186
billion. Consumer retail activity is expected to emerge more slowly, possi-
bly totaling $18.4 billion in 2001.
FOUNDATIONS FOR FUTURE GROWT
PROGRESS TOWARDS DIGITAL TRANSFORMATION
Business-to-business e-commerceis expected to account for the largest
share of the Internet economy.
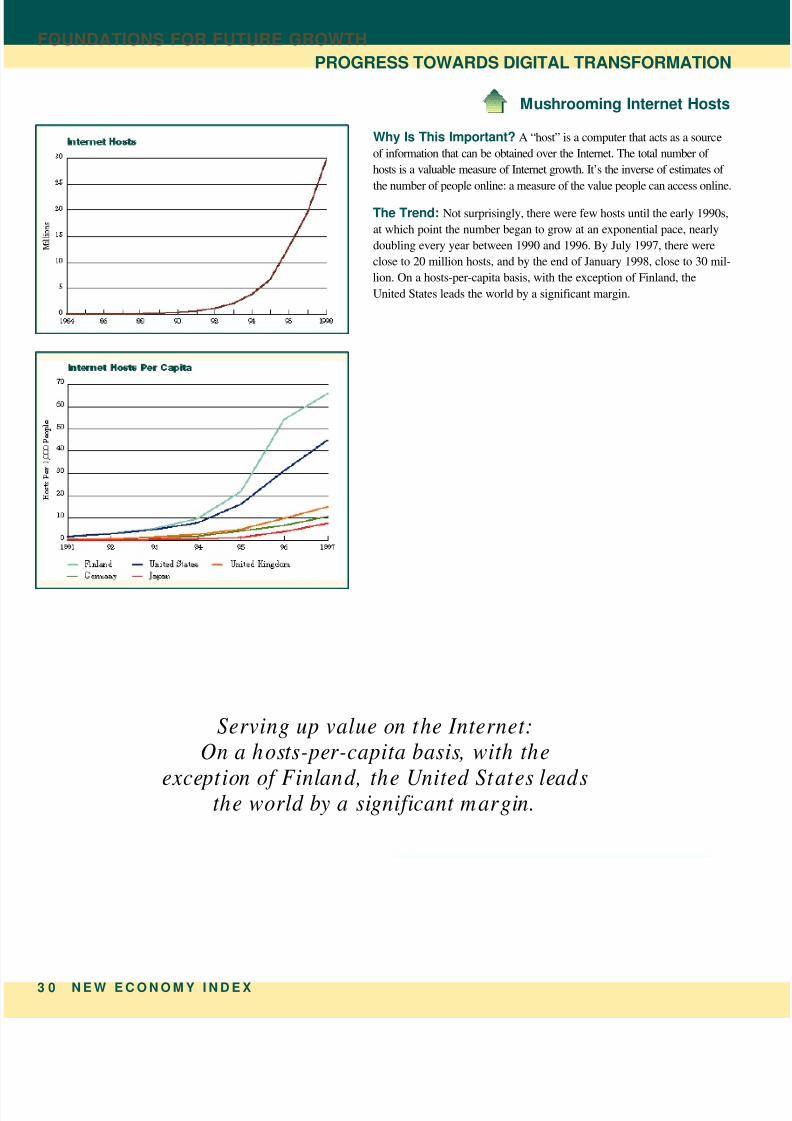
8/4/2019 The New Economy PPI
http://slidepdf.com/reader/full/the-new-economy-ppi 33/54
3 0 N E W E C O N O M Y I N D E X
Mushrooming Internet Hosts
Why Is This Important? A “host” is a computer that acts as a source
of information that can be obtained over the Internet. The total number of
hosts is a valuable measure of Internet growth. It’s the inverse of estimates of
the number of people online: a measure of the value people can access online.
The Trend: Not surprisingly, there were few hosts until the early 1990s,
at which point the number began to grow at an exponential pace, nearly
doubling every year between 1990 and 1996. By July 1997, there were
close to 20 million hosts, and by the end of January 1998, close to 30 mil-
lion. On a hosts-per-capita basis, with the exception of Finland, the
United States leads the world by a significant margin.
FOUNDATIONS FOR FUTURE GROWTH
PROGRESS TOWARDS DIGITAL TRANSFORMATION
Serving up value on the Internet:On a hosts-per-capita basis, with the
exception of Finland, the United States leadsthe world by a significant margin.

8/4/2019 The New Economy PPI
http://slidepdf.com/reader/full/the-new-economy-ppi 34/54
N E W E C O N O M Y I N D E X 3
More Households on the Net
Why Is This Important? The number of people online is both
a sign of the potential magnitude of electronic commerce, and an indica-
tion of our progress toward ubiquitous access to a range of online services,
from health care to financial services to online governmental services.
The Trend: In 1996, 13 percent of American households were online.
By 1997, 18 percent were online. The figure is projected to rise to 38
percent by 2001. The percentage of adults online has been slightly greater
than the percentage of households online because many adults have
access through their universities or work. From 1995 to 1997, the number
of adult Internet users grew from 14.3 million to 41.5 million—from 7.5
percent of the adult population to nearly 22 percent. By the end of 2000,
72 million American adults are expected to be online—more than 35 per-
cent of the adult population.
The speed of adoption of the Internet has been unprecedented. It will
have taken the Internet less than seven years to be adopted by 30 percent
of Americans, compared to 13 years for PCs, 17 for televisions, and 38 for
telephones. And just like other major technologies, wealthier and more-
educated consumers are the early adopters. However, as the technology
becomes cheaper, a broader range of Americans are getting online. The
average income of Internet users is dropping, as is the average education
level. Both trends suggest that the online population is beginning to look
more like the American population in general.37
FOUNDATIONS FOR FUTURE GROWT
PROGRESS TOWARDS DIGITAL TRANSFORMATION
“It will have takenthe Internet less than seven years
to be adopted by 30 percent of Americans, compared to 13 years for PCs, 17 for televisions,
and 38 for telephones.”
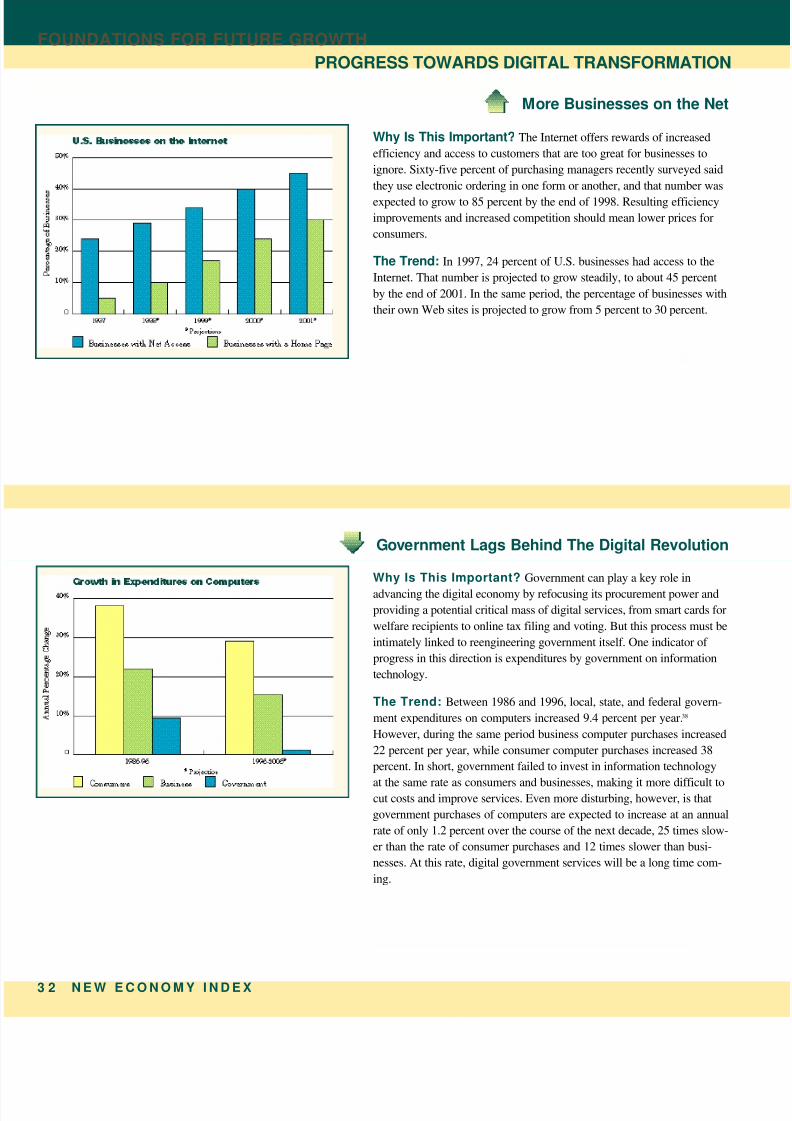
8/4/2019 The New Economy PPI
http://slidepdf.com/reader/full/the-new-economy-ppi 35/54
3 2 N E W E C O N O M Y I N D E X
More Businesses on the Net
Government Lags Behind The Digital Revolution
Why Is This Important? The Internet offers rewards of increased
efficiency and access to customers that are too great for businesses to
ignore. Sixty-five percent of purchasing managers recently surveyed said
they use electronic ordering in one form or another, and that number was
expected to grow to 85 percent by the end of 1998. Resulting efficiency
improvements and increased competition should mean lower prices for
consumers.
The Trend: In 1997, 24 percent of U.S. businesses had access to the
Internet. That number is projected to grow steadily, to about 45 percent
by the end of 2001. In the same period, the percentage of businesses with
their own Web sites is projected to grow from 5 percent to 30 percent.
Why Is This Important? Government can play a key role in
advancing the digital economy by refocusing its procurement power and
providing a potential critical mass of digital services, from smart cards for
welfare recipients to online tax filing and voting. But this process must be
intimately linked to reengineering government itself. One indicator of
progress in this direction is expenditures by government on information
technology.
The Trend: Between 1986 and 1996, local, state, and federal govern-
ment expenditures on computers increased 9.4 percent per year.38
However, during the same period business computer purchases increased
22 percent per year, while consumer computer purchases increased 38
percent. In short, government failed to invest in information technology
at the same rate as consumers and businesses, making it more difficult tocut costs and improve services. Even more disturbing, however, is that
government purchases of computers are expected to increase at an annual
rate of only 1.2 percent over the course of the next decade, 25 times slow-
er than the rate of consumer purchases and 12 times slower than busi-
nesses. At this rate, digital government services will be a long time com-
ing.
FOUNDATIONS FOR FUTURE GROWTH
PROGRESS TOWARDS DIGITAL TRANSFORMATION

8/4/2019 The New Economy PPI
http://slidepdf.com/reader/full/the-new-economy-ppi 36/54
N E W E C O N O M Y I N D E X 3
More Schools on the Net
Why Is This Important? It is not yet clear how, and to what degree,
computers and the Internet should be integrated into K-12 curricula. PPI
believes that the federal government must play a role in the process of
evaluating the effectiveness of the various types of computer-based educa-
tion.39 But in the meantime, there is both real and symbolic value in
wiring the nation’s schools. Certainly the effort will accelerate our
progress toward a digital information infrastructure.
The Trend: The ratio of students per computer has been dropping
steadily, from 123 to 1 in 1983, to 9 to 1 in 1996. However, many of these
computers are old and slow and cannot access the Internet or use new
software applications. In recent years, the percentage of schools with at
least one Internet connection has increased rapidly, from 35 percent in
1994, to 78 percent in 1997. Poorer schools lag about a year or so behind
other schools in adoption rates. The percentage of classrooms with
Internet access has gone from 3 percent to 27 percent in the same period.
FOUNDATIONS FOR FUTURE GROWT
PROGRESS TOWARDS DIGITAL TRANSFORMATION
“The percentage of schools with at least one Internet connection has increased rapidly, from about
35 percent in 1994, to 78 percent in 1997.”

8/4/2019 The New Economy PPI
http://slidepdf.com/reader/full/the-new-economy-ppi 37/54
3 4 N E W E C O N O M Y I N D E X
The Bandwidth Buildout
Why Is This Important? The ability to transfer large amounts of
data is largely determined by bandwidth, the carrying capacity of the
connections, or the “size of the pipes,” between the sender and receiver
of the data. Greater bandwidth allows faster transmission of larger
amounts of data, which in turn will facilitate not only the development of
vastly more valuable and compelling online services, but also the conver-
gence of all forms of electronic data transmission, from email and basic
text documents, which require relatively little bandwidth, to full-motion,
real-time video applications, which will require a great deal of carrying
capacity. To determine our progress toward an information infrastructure
where such services are feasible, it is important to look at the availability
of high-bandwidth (“broadband”) services.
The Trend: Broadband services have only recently begun to be
deployed and they are still relatively expensive. Moreover, most people
are still not on the Internet, and there are too few indispensable Internet
applications requiring high bandwidth to make broadband services anecessity. These factors help explain why in 1997, while cable companies
could claim nearly 10 million U.S. homes “passed” with services allowing
high bandwidth Internet access over cable television wires, only some-
where in the neighborhood of 100,000 homes—approximately eight per-
cent—actually subscribed. Similarly, by the end of 1998, some nine mil-
lion homes are projected to have access to new asymmetric digital sub-
scriber line (ADSL) services, which allow high-speed Internet connections
over copper telephone lines, with 68,000 homes projected to subscribe.
But by 2005, according to a conservative estimate, over five million
homes are projected to subscribe to ADSL services and 14 million homes
are expected to subscribe to cable services. Thus, within seven years,
close to 20 million households in the United States—approximately 20percent of all households—will likely have high-speed data capacity. And
it’s likely the numbers will be even higher. In the near future, most
American consumers should have a choice of either cable or ADSL ser-
vice available to them. Analysts at UBS Global Research project that the
Regional Bell Operating Companies will have 22.2 million lines capable
of supporting ADSL service by the end of 1998. Prudential Securities has
estimated that total consumer subscriptions to high-speed services will
reach 25 million in just the next four years.
FOUNDATIONS FOR FUTURE GROWTH
PROGRESS TOWARDS A DIGITAL TRANSFORMATION
Technology recently developed by Lucent transmits3.2 terabits—which is approximately equal to 90,000
volumes of an encyclopedia—per second.
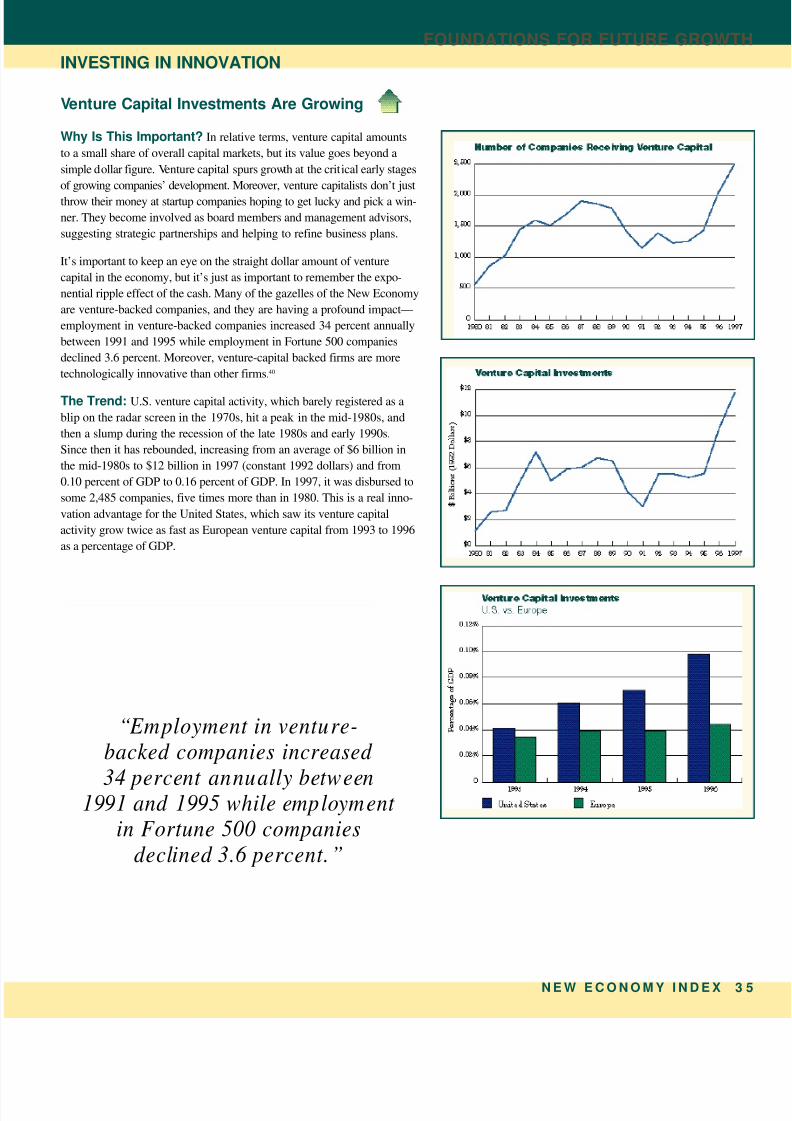
8/4/2019 The New Economy PPI
http://slidepdf.com/reader/full/the-new-economy-ppi 38/54
N E W E C O N O M Y I N D E X 3
Venture Capital Investments Are Growing
Why Is This Important? In relative terms, venture capital amounts
to a small share of overall capital markets, but its value goes beyond a
simple dollar figure. Venture capital spurs growth at the critical early stages
of growing companies’ development. Moreover, venture capitalists don’t just
throw their money at startup companies hoping to get lucky and pick a win-
ner. They become involved as board members and management advisors,
suggesting strategic partnerships and helping to refine business plans.
It’s important to keep an eye on the straight dollar amount of venture
capital in the economy, but it’s just as important to remember the expo-
nential ripple effect of the cash. Many of the gazelles of the New Economy
are venture-backed companies, and they are having a profound impact—
employment in venture-backed companies increased 34 percent annually
between 1991 and 1995 while employment in Fortune 500 companies
declined 3.6 percent. Moreover, venture-capital backed firms are more
technologically innovative than other firms.40
The Trend: U.S. venture capital activity, which barely registered as a
blip on the radar screen in the 1970s, hit a peak in the mid-1980s, and
then a slump during the recession of the late 1980s and early 1990s.
Since then it has rebounded, increasing from an average of $6 billion in
the mid-1980s to $12 billion in 1997 (constant 1992 dollars) and from
0.10 percent of GDP to 0.16 percent of GDP. In 1997, it was disbursed to
some 2,485 companies, five times more than in 1980. This is a real inno-
vation advantage for the United States, which saw its venture capital
activity grow twice as fast as European venture capital from 1993 to 1996
as a percentage of GDP.
FOUNDATIONS FOR FUTURE GROWT
INVESTING IN INNOVATION
“Employment in venture-backed companies increased
34 percent annually between1991 and 1995 while employment in Fortune 500 companies
declined 3.6 percent.”
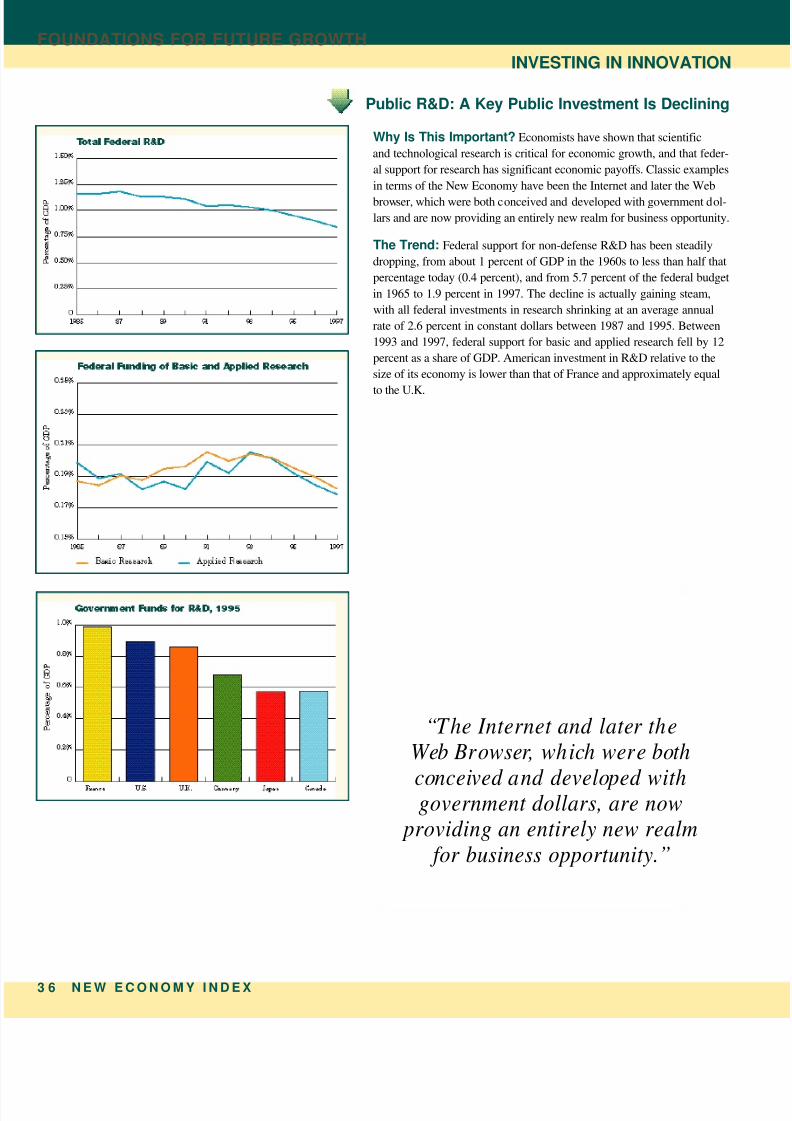
8/4/2019 The New Economy PPI
http://slidepdf.com/reader/full/the-new-economy-ppi 39/54
3 6 N E W E C O N O M Y I N D E X
Public R&D: A Key Public Investment Is Declining
Why Is This Important? Economists have shown that scientific
and technological research is critical for economic growth, and that feder-
al support for research has significant economic payoffs. Classic examples
in terms of the New Economy have been the Internet and later the Web
browser, which were both conceived and developed with government dol-
lars and are now providing an entirely new realm for business opportunity.
The Trend: Federal support for non-defense R&D has been steadily
dropping, from about 1 percent of GDP in the 1960s to less than half that
percentage today (0.4 percent), and from 5.7 percent of the federal budget
in 1965 to 1.9 percent in 1997. The decline is actually gaining steam,
with all federal investments in research shrinking at an average annual
rate of 2.6 percent in constant dollars between 1987 and 1995. Between
1993 and 1997, federal support for basic and applied research fell by 12
percent as a share of GDP. American investment in R&D relative to the
size of its economy is lower than that of France and approximately equal
to the U.K.
FOUNDATIONS FOR FUTURE GROWTH
INVESTING IN INNOVATION
“The Internet and later theWeb Browser, which were both
conceived and developed withgovernment dollars, are now providing an entirely new realm
for business opportunity.”

8/4/2019 The New Economy PPI
http://slidepdf.com/reader/full/the-new-economy-ppi 40/54
N E W EC O N O M Y I N D E X 3
Private R&D Is Growing, But Basic Research Lags
Patents Are Increasing
Why Is This Important? R&D, which yields new product innovations
and adds to the knowledge base of industry and the marketplace as a
whole, is a key driver of economic growth—and business provides more
than two-thirds of all R&D funding.
The Trend: After steadily rising in the 1980s, and falling in the early
1990s, business-funded R&D as a share of GDP has continued its upward
climb, reaching its highest levels ever in 1997. However, as a share of
GDP, company-funded basic research has declined slightly in this decade
as competitive pressures and faster product cycles have led companies to
shift their research more toward product development and process
improvements. It is too early to tell whether this shift away from more
risky exploratory research will limit innovation, but it does present
cause for concern.
Why Is This Important? Research and technological innovation
account for more than two-thirds of per capita economic growth.41 One
indicator of the rate of innovation is the number of patents issued.
The Trend: After reaching a peak in the mid-1970s, the number of
patents issued per year in the United States declined until 1983. Since
then, however, patents have increased consistently, almost doubling by
1997 when more than 110,000 patents were issued. Of patents issued in
the United States, the share issued to foreign residents has risen from
approximately 35 percent in 1975 to 45 percent in 1997. This is a consid-
erably greater share than in Japan, where only 13 percent of all patents
are issued to foreigners, but considerably less than in the U.K. (89.2 per-
cent) or Germany (65.2 percent).
FOUNDATIONS FOR FUTURE GROWT
INVESTING IN INNOVATION

8/4/2019 The New Economy PPI
http://slidepdf.com/reader/full/the-new-economy-ppi 41/54
3 8 N E W E C O N O M Y I N D E X
Investment Is Up, But Capital Stocks Are Down
Why Is This Important? Although knowledge generation is a key
to driving economic growth, the size and quality of the nation’s capital
stock (e.g., machines, equipment), particularly information technology, is
the critical determinant of productivity and real wage advance. 42 Moreover,
it is through the acquisition of new generations of equipment that techno-
logical innovations are spread throughout the economy.
The Trend: Business investment in new equipment as a share of
GDP has grown significantly in the 1990s, increasing more than 40 per-
cent from the late 1980s. However, there is a difference between invest-
ment (the amount of money spent per year) and capital stocks (the total
value of capital equipment in any one year). Capital stocks have actually
declined in the 1990s, from about 5.3 percent of GDP in the 1980s to
approximately 4.2 percent in the 1990s. It’s not entirely clear why the
value of capital stock is going down while investments are up, but one
reason is certainly that an increasing share of investment is now in infor-
mation technology, which devalues quickly. For example, approximately60 percent of corporate information technology budgets go toward replace-
ment of outdated equipment and product upgrades.43
FOUNDATIONS FOR FUTURE GROWTH
INVESTING IN INNOVATION
“Business investment in new equipment hasgrown significantly, yet capital stocks have declined from
about 5.3 percent of GDP in the 1980s to approximately4.2 percent of GDP in the 1990s.”

8/4/2019 The New Economy PPI
http://slidepdf.com/reader/full/the-new-economy-ppi 42/54
N E W EC O N O M Y I N D E X 3
The Costs Imposed By Economic Regulation Are Falling
Why Is This Important? In fast-moving, innovation-based markets,
some forms of economic regulation place an undue drag on economic
growth. Moreover, the rapid pace of change makes it less likely that gov-
ernment can adapt economic regulations fast enough. For example, the
delay of the FCC in licensing cellular telephones in 1982 is estimated to
have cost the U.S. economy $83 billion.44 New Economy factors have not
reduced the need for environmental or social regulation (e.g., worker safe-
ty or pollution control), but they have allowed regulation to be more flexi-
ble and supportive of innovation.
The Trend: Between 1983 and 1997, the inefficiency costs of economic
regulation borne by both industry and consumers have fallen almost 70
percent as a share of GDP. The deregulation of transportation, (including
trucking and airlines), natural gas and oil, financial services, and
telecommunications has meant that, on net, competition and innovation
have saved American consumers billions of dollars. However, the costs of
regulation still remain high (between $71 billion and $223 billion,depending on the estimate used), suggesting that further economic dereg-
ulation (of electric and gas utilities, for example) could produce further
benefits.
FOUNDATIONS FOR FUTURE GROWT
INVESTING IN INNOVATION
“Between 1983 and 1997, the inneff iciency costs of economicregulation borne by both industry and consumers have fallen
almost 70 percent as a share of GDP.”
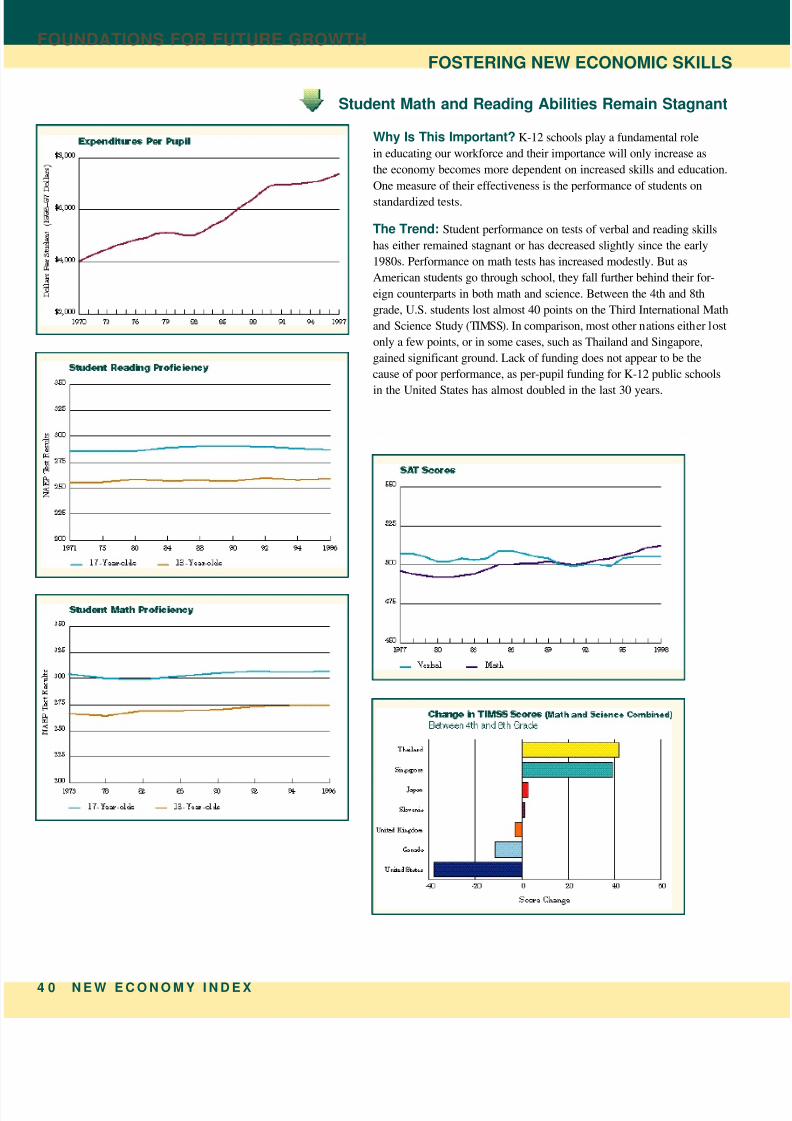
8/4/2019 The New Economy PPI
http://slidepdf.com/reader/full/the-new-economy-ppi 43/54
4 0 N E W E C O N O M Y I N D E X
Student Math and Reading Abilities Remain Stagnant
Why Is This Important? K-12 schools play a fundamental role
in educating our workforce and their importance will only increase as
the economy becomes more dependent on increased skills and education.
One measure of their effectiveness is the performance of students on
standardized tests.
The Trend: Student performance on tests of verbal and reading skills
has either remained stagnant or has decreased slightly since the early
1980s. Performance on math tests has increased modestly. But as
American students go through school, they fall further behind their for-
eign counterparts in both math and science. Between the 4th and 8th
grade, U.S. students lost almost 40 points on the Third International Math
and Science Study (TIMSS). In comparison, most other nations either lost
only a few points, or in some cases, such as Thailand and Singapore,
gained significant ground. Lack of funding does not appear to be the
cause of poor performance, as per-pupil funding for K-12 public schools
in the United States has almost doubled in the last 30 years.
FOUNDATIONS FOR FUTURE GROWTH
FOSTERING NEW ECONOMIC SKILLS
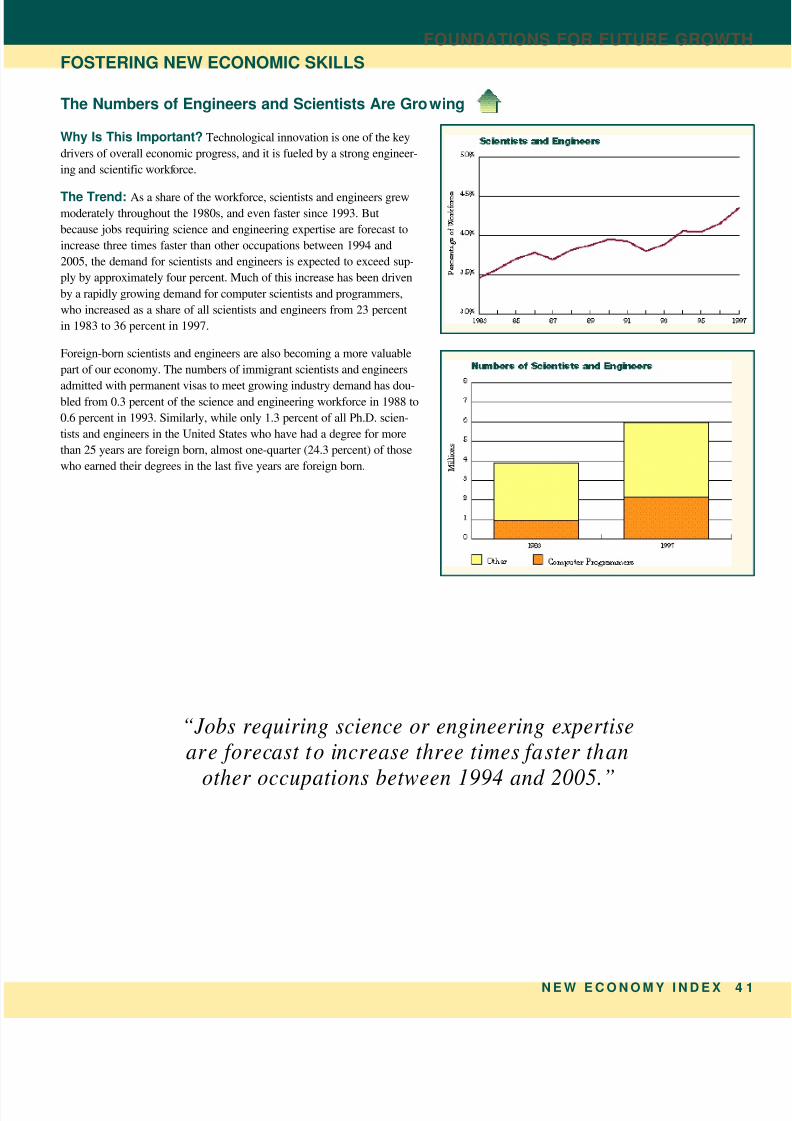
8/4/2019 The New Economy PPI
http://slidepdf.com/reader/full/the-new-economy-ppi 44/54
N E W E C O N O M Y I N D E X 4
The Numbers of Engineers and Scientists Are Growing
Why Is This Important? Technological innovation is one of the key
drivers of overall economic progress, and it is fueled by a strong engineer-
ing and scientific workforce.
The Trend: As a share of the workforce, scientists and engineers grewmoderately throughout the 1980s, and even faster since 1993. But
because jobs requiring science and engineering expertise are forecast to
increase three times faster than other occupations between 1994 and
2005, the demand for scientists and engineers is expected to exceed sup-
ply by approximately four percent. Much of this increase has been driven
by a rapidly growing demand for computer scientists and programmers,
who increased as a share of all scientists and engineers from 23 percent
in 1983 to 36 percent in 1997.
Foreign-born scientists and engineers are also becoming a more valuable
part of our economy. The numbers of immigrant scientists and engineers
admitted with permanent visas to meet growing industry demand has dou-
bled from 0.3 percent of the science and engineering workforce in 1988 to
0.6 percent in 1993. Similarly, while only 1.3 percent of all Ph.D. scien-
tists and engineers in the United States who have had a degree for more
than 25 years are foreign born, almost one-quarter (24.3 percent) of those
who earned their degrees in the last five years are foreign born.
FOUNDATIONS FOR FUTURE GROWT
FOSTERING NEW ECONOMIC SKILLS
“Jobs requiring science or engineering expertiseare forecast to increase three times faster than
other occupations between 1994 and 2005.”

8/4/2019 The New Economy PPI
http://slidepdf.com/reader/full/the-new-economy-ppi 45/54
4 2 N E W EC O N O M Y I N D E X
Science And Engineering Degrees On Rise In Early 1990’s
Why Is This Important? In the New Economy, the key engines
of growth—technology and research-based companies and industries—
are fueled by a large and high-caliber scientific and engineering work-
force. Ensuring a growing and high-quality scientific workforce will be
critical to continued economic growth in the next century.
The Trend: After falling in the late 1980s, the number of people getting
science and engineering degrees has grown as a share of the population.
One contributing factor is that foreign students, who remain a modest
fraction of all science and engineering degree holders, are earning a sig-
nificant and growing share of graduate degrees in some scientific and
technical fields. For example, foreign students earned 35 percent of the
master’s degrees in computer science and 33 percent of those in engineer-
ing in 1993, up from 11 percent and 22 percent, respectively, in these
fields in 1977.
“Foreign students earned 35 percent of the masters’ degrees in computer science and 33
percent of those in engineering in 1993, up from 11 percent and 22 percent, respectively, in 1977.”
FOUNDATIONS FOR FUTURE GROWTH
FOSTERING NEW ECONOMIC SKILLS
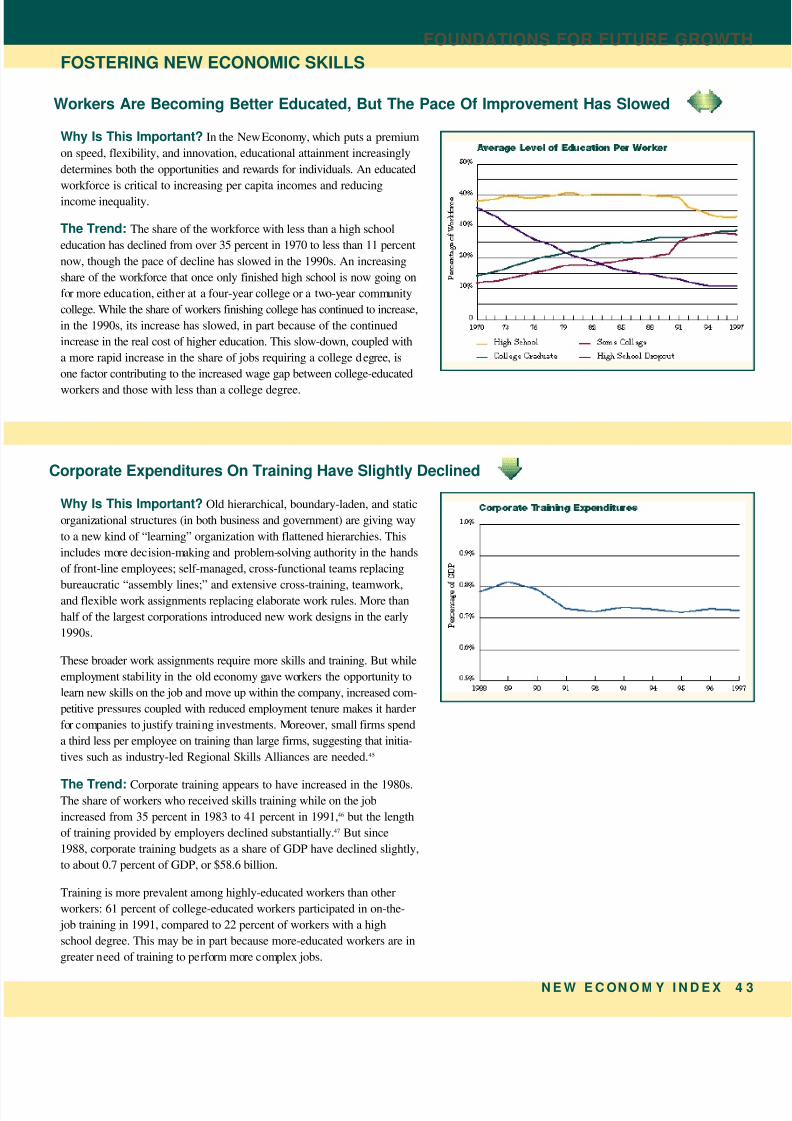
8/4/2019 The New Economy PPI
http://slidepdf.com/reader/full/the-new-economy-ppi 46/54
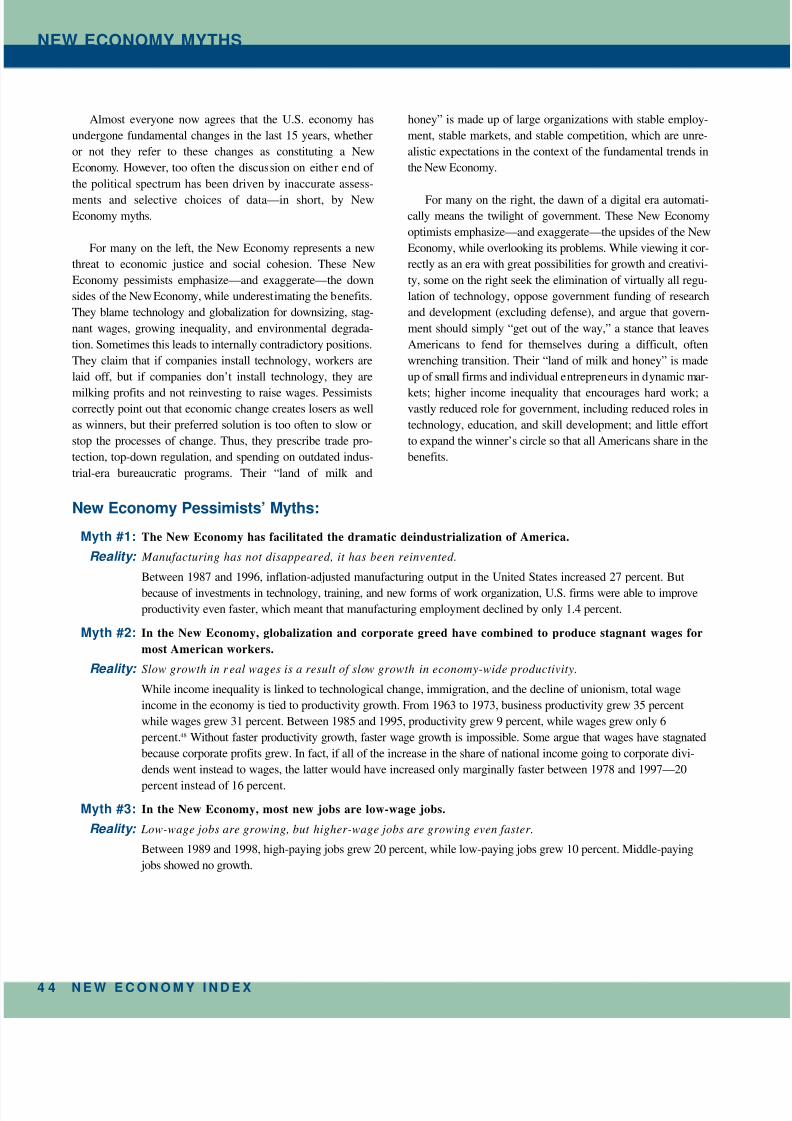
8/4/2019 The New Economy PPI
http://slidepdf.com/reader/full/the-new-economy-ppi 47/54
4 4 N E W E C O N O M Y I N D E X
NEW ECONOMY MYTHS
Almost everyone now agrees that the U.S. economy has
und ergone fundamental changes in the last 15 years, whether
or not they refer to these changes as constituting a New
Ec onom y. However, too often the discussion on either end of
the political spectrum has been driven by inaccurate assess-
ments and selective choices of data—in short, by NewEconomy myths.
For many on the left, the New Economy represents a new
threat to economic justice and social cohesion. These New
Economy pessimists emphasize—and exaggerate—the down
sides of the New Economy, while underestimating the benefits.
They blame technology and globalization for downsizing, stag-
nant wages, growing inequality, and environmental degrada-
tion. Sometimes this leads to internally contradictory positions.
They claim that if companies install technology, workers are
laid off, but if companies don’t install technology, they are
milking profits and not reinvesting to raise wages. Pessimistscorrectly point out that economic change creates losers as well
as winners, but their preferred solution is too often to slow or
stop the processes of change. Thus, they prescribe trade pro-
tection, top-down regulation, and spending on outdated indus-
trial-era bureaucratic programs. Their “land of milk and
honey” is made up of large organizations with stable employ-
ment, stable markets, and stable competition, which are unre-
alistic expectations in the context of the fundamental trends in
the New Economy.
For many on the right, the dawn of a digital era automati-cally means the twilight of government. These New Economy
optimists emphasize—and exaggerate—the upsides of the New
Economy, while overlooking its problems. While viewing it cor-
rectly as an era with great possibilities for growth and creativi-
ty, some on the right seek the elimination of virtually all regu-
lation of technology, oppose government funding of research
and development (excluding defense), and argue that govern-
ment should simply “get out of the way,” a stance that leaves
Americans to fend for themselves during a difficult, often
wrenching transition. Their “land of milk and honey” is made
up of small firms and individual entrepreneurs in dynamic mar-
kets; higher income inequality that encourages hard work; avastly reduced role for government, including reduced roles in
technology, education, and skill development; and little effort
to expand the winner’s circle so that all Americans share in the
benefits.
New Economy Pessimists’ Myths:
Myth #1: The New Economy has facilitated the dramatic deindustrialization of America.
R e a l i t y : Manufacturing has not disappeared, it has been reinvented.
Between 1987 and 1996, inflation-adjusted manufacturing output in the United States increased 27 percent. But
because of investments in technology, training, and new forms of work organization, U.S. firms were able to improve
productivity even faster, which meant that manufacturing employment declined by only 1.4 percent.
Myth #2: In the New Economy, globalization and corporate greed have combined to produce stagnant wages for
most American workers.
R e a l i t y : Slow growth in r eal wages is a result of slow growth in economy-wide productivity.
While income inequality is linked to technological change, immigration, and the decline of unionism, total wage
income in the economy is tied to productivity growth. From 1963 to 1973, business productivity grew 35 percent
while wages grew 31 percent. Between 1985 and 1995, productivity grew 9 percent, while wages grew only 6
percent.48 Without faster productivity growth, faster wage growth is impossible. Some argue that wages have stagnated
because corporate profits grew. In fact, if all of the increase in the share of national income going to corporate divi-
dends went instead to wages, the latter would have increased only marginally faster between 1978 and 1997—20
percent instead of 16 percent.
Myth #3: In the New Economy, most new jobs are low-wage jobs.
R e a l i t y : Low-wage jobs are growing, but higher-wage jobs are growing even faster.
Between 1989 and 1998, high-paying jobs grew 20 percent, while low-paying jobs grew 10 percent. Middle-paying
jobs showed no growth.

8/4/2019 The New Economy PPI
http://slidepdf.com/reader/full/the-new-economy-ppi 48/54
N E W E C O N O M Y I N D E X 4
NEW ECONOMY MYTH
Myth #4: Technological change kills more jobs than it creates.
R e a l i t y : Technology changes the composition of jobs and raises productivity and incomes, but it does not raise the
natural ra te of unemployment. On th e contrary, the dynam ic New Economy has reduced unemployment
rates to a 25 year low.
New technologies (e.g., tractors, disease resistant crops, etc.) spurred the decline in agricultural jobs. However, as foodbecame cheaper (American consumers spend less of their income on food than any other nation) consumers spent their
increased real income on other things (e.g., cars, appliances, entertainment), creating employment in other sectors.
The 30-year low for unemployment after the wave of corporate downsizing and technology introduction makes it clear
that technology doesn’t reduce the total number of jobs in the economy. As new information technologies begin to
raise productivity growth rates, this same positive dynamic will continue, leading to higher incomes, not fewer jobs.
Myth #5: Corporate reengineering has meant the downsizing of large numbers of middle class, managerial jobs.
R e a l i t y : In the last nine years, three million new mana gerial jobs have been ad ded (14.8 million in 1989 to 18 mil-
lion in 1998). 49
Despite the fact that New Economy organizations flatten hierarchies, the New Economy spurs greater demand for
more managers who focus on quality, innovation, design, marketing, and finance.
New Economy Optimist’s Myths:
Myth #1: The U.S. economy is in the midst of unprecedented economic boom that began in the early 1980s.
R e a l i t y : Growth in per cap ita GDP, produ ctivity, an d wages since the 1980s have lagged behind growth rates in the
1960s and early 1970s.
While job growth was stronger in the 1980s and 1990s than in the 1960s and 1970s, productivity and per-capita
GDP grew about half as fast.
Myth #2: Income inequality is not a serious problem.
R e a l i t y : Between 1980 and 1996, real incomes went up 58 percent for the wealthiest 5 percent of American house-
holds, but less than 4 percent for the lowest 60 percent.
Household income inequality has increased and has made it more difficult for many Americans to achieve theAmerican dream. The strength of America’s economy has historically been that most Americans have felt that they
can prosper if they get an education, work hard, and play by the rules. If this compact is broken, our social fabric will
start to disintegrate.
Myth #3: The dispersing tendencies of the New Economy mean the death of large corporations and the twilight
of government.
R e a l i t y : Large corporations and government are reinventing themselves and still play k ey roles in the economy, to
say the least.
Because information technology lets firms reach larger markets and take advantage of economies of scale, the average
size of firms in the New Economy is growing, not shrinking. Moreover, just as the Internet did not mean the end of
large companies like IBM, it also does not bode the end of government. Rather, it creates a requirement that govern-
ments re-engineer themselves to be faster, more flexible, and smarter.Myth #4: In the New Economy, a significantly growing share of the workforce are self-employed entrepreneurs.
R e a l i t y : Entrepreneurs represent about the same share of the workforce as ever.
Between 1975 and 1994, self-employment as a share of total employment remained level at approximately 8.7 per-
cent (10.6 million workers)—an all-time low.
8/4/2019 The New Economy PPI
http://slidepdf.com/reader/full/the-new-economy-ppi 49/54
4 6 N E W E C O N O M Y I N D E X
INDICATOR DATA SOURCES
Page 9 Indicator: More People Work in Offices and Provide Services.
Sources: Sectoral employment and output: President’s Council of Economic Advisors, Economic Report of the President, February
1998 (Washington, DC: 1998). High-tech output: American Electronics Association, Cybernation: The Importance of the High-
Technology Industry to the American Economy (Washington, DC: 1997). Employment by type of work: Anthony Carnevale and Stephen
J. Rose, Education For What? The New Office Economy (Princeton, NJ: Educational Testing Service, 1998).Page 10 Indicator: High-Wage, High-Skill Jobs Have Grown, But So Have Low-Wage, Low-Skill Jobs.
Sources: An analysis of Bureau of Labor Statistics (BLS) occupational projections and training data was conducted by Ken Voytek, the
chief economist of the National Alliance of Business. Job classification data: Carnevale and Rose. Job growth by wage category:
Randy E. Ilg, “The Nature of Employment Growth, 1989-95,” Bureau of Labor Statistics, Monthly Labor Review , vol. 119, no. 6
(http://www.bls.gov/opub/mlr/1996/06/contents.htm, June 1996).
Page 11 Indicator: Trade Is an Increasing Share of the New Economy.
Source: Economic Report of the President, February 1998 . The sum of each year’s imports and exports in constant 1992 dollars have
been graphed as a percentage of that year’s GDP.
Page 12 Indicator: Foreign Direct Investment Is on The Rise Around The World.
Source: Organization for Economic Co-Operation and Development, Reviews of Foreign Direct Investment-United States (Paris: OECD, 1995).
Page 13 Indicator: The Economy Is Spawning New, Fast-growing, Entrepreneurial Companies.
Source: David Birch, Anne Haggerty, and William Parsons, Corporate Demographics: Who’s Creating Jobs (Cambridge, MA: Cognetics, 1997).
Page 14 Indicator: Businesses Face More Competition.
Source: U.S. Census Bureau, County Business Patterns , selected years.Page 15 Indicator: “Coopetition:” Increasingly, Competitors Are Collaborating.
Source: National Science Foundation, Science and Engineering Indicators, 1996 (Washington, DC: U.S. Government Printing Office,
1996), p. 158.
Page 15 Indicator: The New Economy Is Constantly Churning.
Source: United States Census Bureau (http://www.census.gov/pub/epcd/ssel_tabs/view/tab9_99.html).
Page 16 Indicator: Consumer Choices Are Exploding.
Sources: The U.S. Patent and Trademark Office. Magazine data: Harrington Associates, LLC. Grocery data: Food Marketing Institute.
Page 17 Indicator: Speed Is Becoming the Standard.
Sources: Abbie Griffin, “PDMA Research on New Product Development Practices: Updating Trends and Benchmarking Best
Practices,” Journal of Product Innovation Management , vol. 14, no. 6 (November 1997), pp. 429-458. Albert Page, “Assessing New
Product Development Practices and Performance: Establishing Crucial Norms,” Journal of Product Innovation Management , vol. 10 no.
4 (September 1993), pp. 273-290 (as cited in Griffin).
Page 18 Indicator: Microchips Are Everywhere.
Source: VLSI Research (San Jose, California).
Page 18 Indicator: Computing Costs Are Plummeting.
Source: Integrated Circuit Engineering Corporation, using Intel Corporation’s technical specifications and chip data.
Page 19 Indicator: Data Transmission Costs Are Plummeting.
Source: Probe Research (Cedar Knolls, New Jersey), Bellcore.
Page 21 Indicator: Productivity Growth Is Lagging.
Source: Economic Report of the President, February 1998 .
Page 23 Indicator: The Growth of Earnings Inequality Has Slowed.
Sources: Household Income from Census Bureau, Current Population Survey (http://www.census.gov/hhes/income/histinc/h03.html).
Hourly earnings inequality from Robert I. Lerman, “Reassessing Trends in U.S. Earnings Inequality,” Monthly Labor Review , December
1997, pp. 17-25. The figure shows the trend in the ratio of the income of the highest 10 percent of wage earners to the lowest 10 per-
cent. The CPS line uses data from the Census Bureau’s Current Population Survey. The SIPP line uses data from the Census Bureau’s
Survey of Income and Program Participation.
Page 24 Indicator: Fewer Workers Are Unemployed or Under-employed.
Source: U.S. Department of Labor, Bureau of Labor Statistics. Underemployed persons are defined as people working part time (one to
34 hours) due to economic reasons, as opposed to voluntarily choosing to work part-time. The graph shows the number of under-
employed plus the number of unemployed as a percentage of total employment.
Page 24 Indicator: Worker Displacement Is Only Modestly Increasing.
Sources: Bureau of Labor Statistics. Also, William Baumol and Edward Wolff, “Speed of Technical Progress and Length of the Average
Interjob Period,” Working Paper no. 237, May 1998, The Jerome Levy Economics Institute of Bard College.
Page 25 Indicator: The Wage Premium for Skilled Jobs Is Growing.
Sources: U.S. Department of Labor, Report on the American Workforce, 1997 (Washington, DC:1998). Anthony P. Carnevale and
Stephen J. Rose, Education for What: The New Office Economy . The graph shows the average unemployment rate for workers with
less than four years of high school divided by the average unemployment rate for workers with four years or more of college in the
1970s, 1980s and 1990s.

8/4/2019 The New Economy PPI
http://slidepdf.com/reader/full/the-new-economy-ppi 50/54
N E W EC O N O M Y I N D E X 4
INDICATOR DATA SOURCE
Page 26 Indicator: Employee Benefits Have Fallen.
Sources: Pension data are from the U.S. Department of Labor Pension and Welfare Benefits Administration. Health care data are
Employee Benefit Research Institute estimates from 1988 through 1996 U.S. Census Bureau current population surveys.
Page 27 Indicator: Contingent Work Is Also Increasing Only Modestly.
Source: Richard Belous, “The Rise of the Contingent Work Force: Growth of Temporary, Part-Time and Subcontracted Employment,”National Policy Institute, Looking Ahead , vol. 19, no. 1 (June 1997).
Page 27 Indicator: Workers Experience Less Job Stability.
Source: Bureau of Labor Statistics (http://stats.bls.gov/news.release/tenure.nws.htm).
Page 29 Indicator: E-Commerce to Take Off.
Source: Forrester Research (Cambridge, Massachusetts). Projections based on U.S. Census data (on the number of U.S. businesses)
and surveys of Internet service providers.
Page 30 Indicator: Mushrooming Internet Hosts.
Source: Mark Lot tor, Network Wizards (Menlo Park, California).
Page 31 Indicator: More Households On The Net.
Sources: Adults online: Cyber Dialogue, Inc. (New York). Households online: IDC/Link (New York). Demographics: Peter Clemente, The
State of the Net (New York: McGraw Hill, 1998).
Page 32 Indicator: More Businesses On The Net.
Source: Forrester Research (Cambridge, Massachusetts) surveyed 81 Internet service providers of various sizes and focus areas and
extrapolated to forecast the percentage of businesses that will be on the Internet in coming years.
Page 32 Indicator: Government Lags Behind the Digital Revolution.
Source: U.S. Department of Labor, Bureau of Labor Statistics, Employment Outlook, 1996-2006: A Summary of BLS Projections
(Washington, DC: 1998).
Page 33 Indicator: More Schools On The Net.
Sources: Quality Education Data and the U.S. Department of Education.
Page 34 Indicator: The Bandwidth Buildout.
Source: Broadband market projections by Paul Kagen & Associates (Carmel, California).
Page 35 Indicator: Venture Capital Investments Are Growing.
Sources: U.S. statistics: The National Venture Capital Association 1997 Annual Report (Arlington, VA: NVCA, 1998), prepared by
Venture Economics (a division of Securities Data Company). United States-European comparative data: The Organization for Economic
Cooperation and Development Science, Technology and Industry Outlook, 1998 (Paris: OECD, 1998). The two sources’ estimates vary.
Page 36 Indicator: Public R&D Is Declining.
Sources: U.S. data from the National Science Foundation, Science and Engineering Indicators, 1996 . International data from OECD,
Science, Technology, and Industry Outlook, 1998 . All international figures in purchasing power parity funds.
Page 37 Indicator: Private R&D Is Growing, But Basic Research Lags.
Source: National Science Foundation, National Patterns of R&D Resources 1997: Data Update
(http://www.nsf.gov/sbe/srs/natpat97/start.htm).
Page 37 Indicator: Patents Are Increasing.
Source: U.S. Patent and Trademark Office. Data are for utility patents.
Page 38 Indicator: Investment Is Up, But Capital Stocks Are Down.
Sources: U.S. Department of Commerce Bureau of Economic Analysis, Survey of Current Business, and Economic Report of the
President, February 1998.
Page 39 Indicator: The Costs Imposed by Economic Regulation Are Falling.
Source: U.S. Small Business Administration, Office of the Chief Counsel for Advocacy, The Changing Burden of Regulation, Paperwork,
and Tax Compliance on Small Business: A Report to Congress, (Washington, DC: SBA, October 1995), Table 3, p. 28.
Page 40 Indicator: Student Math And Reading Abilities Remain Stagnant.
Source: Student achievement data: National Center for Education Statistics, Digest of Education Statistics 1997 (Washington, DC: U.S.Government Printing Office, 1997). IEA Third International Mathematics and Science Study (TIMSS), 1995-96.
Page 41 Indicator: Engineers and Scientists Are Growing as a Share of The Total Workforce.
Sources: Bureau of Labor Statistics. The graph shows the combined total of math, computer, and natural scientists, engineers, techni-
cians, and computer programmers as a share of the total workforce. Data on doctoral scientists: P. Brown and P.H. Henderson,
“Doctoral Scientists and Engineers in the United States: 1995 Profile” (Washington, DC: National Academy Press, 1998).
Page 42 Indicator: Science and Engineering Degrees Are on the Rise in the Early 1990s.
Source: National Science Foundation, Science & Engineering Indicators, 1996.
Page 43 Indicator: Workers Are Becoming Better Educated, but the Pace of Improvement Has Slowed.
Source: Anthony P. Canevale and Stephen J. Rose, Education for What: The New Office Economy.
Page 43 Indicator: Corporate Expenditures on Training Have Slightly Declined.
Source: Training Magazine , October 1997.

8/4/2019 The New Economy PPI
http://slidepdf.com/reader/full/the-new-economy-ppi 51/54
4 8 N E W E C O N O M Y I N D E X
END NOTES
1. Bob Davis and David Wessel, Prosperity: The Coming 20-Year Boom and What It Means to You (New York: Random House,1998).
2.This report uses existing data to illustrate some of the changes that mark the fundamental transformation of the economy. However,
the New Economy has made it an imperative that we revamp and modernize our economic statistics system, including how we mea-
sure ecomonic output and quality improvement. PPI will be releasing a paper addressing this issue and listing specific improvements
that need to be made.
3. Remarks by Chairman Alan Greenspan at the Haas School of Business, University of California, Berkeley, September 4, 1998.
(http:/ /www.bog.frb.fed.us/boarddocs.speeches.19980904.htm)
4.One indicator of the lower level of competition is that the Japanese had the highest domestic mark-up ratios in manufacturing of all
OECD nations, 75 percent higher than in the United States for the period from 1980 to 1992. OECD, Science, Technology and
Industry: Scoreboard of Indicators, 1997 (Paris: OECD,1997).
5. In 1995, the Japanese investment in information technology as a share of GDP is 55 percent of the U.S. level and as a share of total
investment is even lower. OECD, Science, Technology, and Industry Outlook (Paris: OECD, 1998).
6.Japan’s Deputy Minister of Posts and Telecommunications, Yoshio Utsumi, recently wrote: “Japan has not yet fully met the challenge
of moving to an economy that is led by domestic consumption rather than a heavy reliance on exports; that bases business on strict
cost-benefit analysis rather than personal ties; and, above all, that is dependent not on manufacturing but on knowledge and the
skills of the information age.” Yoshio Utsumi, “IT and Telecommunications in Japan’s Economic Recovery,” Journal of Information
Policy , vol. 1, no. 2 (Vienna, VA: Silverberg Independent Media, September 1998), 11.
7. http://www.sec.gov/edgarhp.htm.
8. A similar set of Old and New Economy characteristics has also been developed by John Doer, of Kleiner, Perkins, Caulfield & Byers
(Menlo Park, California).
9. Organization for Economic Cooperation and Development, The Knowledge Economy (Paris: OECD, 1996), 9.
10.Non-production jobs are growing in the manufacturing sector. In 1976, 32 percent of manufacturing workers worked in managerial,
professional, sales, technical, or service jobs. Today, they account for over 40 percent of the sector.
11.Jane Frazer and Jeremy Oppenheim, “What’s New About Globalization,” The McKinsey Quarterly , no. 2 (1997): 172.
12.Service import and export data are not available in constant dollars before 1982.
13.Office of Management and Budget, Budget of the United States Government: Analytical Perspectives, FY 1999 (Washington: U.S.
Government Printing Office, 1998), 147.
14.Baruch Lev, “The Old Rules No Longer Apply,” Forbes ASAP (April 7, 1997).
15.Martin Wolf, “The Bearable Lightness,” Financial Times (August 12, 1998), (www.ft.com/hippocampus/79922).
16.Peter Cappelli, et. al, Change and Work (Washington, DC: National Policy Associat ion, 1997).
17.Organization for Economic Cooperation and Development, Science, Technology and Industry: Scoreboard of Indicators (Paris: OECD,1997), 70.
18.Ibid., 88.
19.Jane E. Fountain and Robert D. Atkinson, Innovation, Social Capital, and the New Economy: New Federal Policies to Support
Collaborative Research (Washington, DC: Progressive Policy Institute, July 1998).
20.Regis McKenna, Real Time: Preparing for the Age of the Never Satisfied Customer (Boston: Harvard Business School Press, 1997).
21.Ibid.
22.Kristi Thiese, equity analyst, investment bank Raymond James & Associates.
23.Cappelli, op. cit.
24.President’s Council of Economic Advisors, Economic Report of the President (February 1998).
25.Not all industries in the service sector have had slow productivity growth. For example, two of the industries that have seen the
fastest productivity growth in the last 10 years, railroads and telecommunications, are in the service sector. Yet most of the other
industries in the service sector have seen productivity growth rates well under 1 percent per year.
26.The Conference Board, Perspectives on a Global Economy (Washington, DC, 1998), 13.
27.Erik Brynjolfsson and Lorin Hitt, “Beyond the Productivity Paradox: Computers Are The Catalyst For Bigger Changes,”
Communications of the ACM , vol. 41, no. 8 (August 1998): 49-55.
28.Jared Berstein and Lawrence Mishel, “Has Wage Inequality Stopped Growing?” Monthly Labor Review , (December 1997): 3-16.
29.Lawrence Mishel, Jared Bernsein, and John Schmitt, “Finally, Real Wage Gains,” Economic Policy Institute, Issue Brief no. 127 (July
17, 1998).
30.William J. Baumol and Edward N. Wolfe, “Speed of Technical Progress and Length of the Average Interjob Period,” Working Papers ,
no. 237 (Annandale on-Hudson, New York: Jerome Levy Economics Institute of Bard College, 1998).
31.Stephen Herzenberg, John A. Alic and Howard Wial, New Rules for a New Economy: Employment and Opportunity in Post-Industrial
America (Ithaca, NY: Cornell University Press, 1998).

8/4/2019 The New Economy PPI
http://slidepdf.com/reader/full/the-new-economy-ppi 52/54
N E W E C O N O M Y I N D E X 4
END NOTE
32.Martha Walker and Bruce Bergman, “Analyzing Year-to-Year Changes in Employers’ Costs for Employee Compensation”
Compensation and Working Conditions (Spring 1998): 26.
33.Defined benefit pension plans are financed entirely by employers, and employers’ annual contributions are determined by the funding
status of the plans. When plans experience high returns on investments, as they are likely to do during bull markets, employers
decrease contributions. The inverse is also true; when plans experience low returns or losses on investments, employers increasetheir contributions.
34.Anne E. Polivka, “Contingent and Alternative Work Arrangements, Defined,” Monthly Labor Review (October 1996): 3-9. Estimates of
employment through temporary help agencies come from the Current Population Survey, which pegged the number at 1.2 million
people in 1995, and from the BLS survey of business estabishments (Bureau of Labor Statistics, Employment, Hours, and Earnings,
United States, 1988-1996 , Washington, DC: August 1996), which put the number at 2.1 million.
35.John E. Bregger, “Measuring Self-Employment in the United States,” Monthly Labor Review (January/February 1996).
36.Cappelli, op. cit.
37.David Moschella and Robert D. Atkinson, The Internet and Society: Universal Access, Not Universal Service (Washington, DC:
Progressive Policy Institute, 1998).
38.Bureau of Labor Statistics, Employment Outlook: 1996-2006: A Summary of BLS Projections (Washington, DC: U.S. Department of
Labor, 1998).
39.David Moschella and Robert D. Atkinson, The Internet and Society: Universal Access, Not Universal Service (Washington, DC:
Progressive Policy Institute, 1998).40.Samuel Kortum and Josh Lerner, “Does Venture Capital Spur Innovation?” Presented at the Columbia Sloan Conference on
Financing Innovation (December 12, 1997), (http:/ /papers.ssrn.com/sol3/paper.taf?ABSTRACT_ID=10583).
41.Kenan Patrick Jarboe and Robert D. Atkinson, The Case for Technology in the Knowledge Economy: R&D, Economic Growth, and
the Role of Government (Washington, DC: Progressive Policy Institute, 1998).
42.Even in traditional industries, plants that use technologies like computer-aided manufacturing to be competitive pay their workers
almost two-thirds more than plants in the same industry that continue to do things the old fashioned way. Timothy Dunne,
Technology Usage in U.S. Manufacturing Industries: NewEvidence From the Survey of Manufacturers (Washington, DC: Center for
Economic Studies, Bureau of the Census, U.S. Department of Commerce, November 1991), 91-97.
43.Stephen Roach, The Boom For Whom: Revisiting America’s Technology Paradox (New York: Morgan Stanley Dean Witter, 1998).
44.Jeffrey H. Rohlfs, Charles L. Jackson, and Tracey E. Kelly, “Estimate of the Loss to the United States Caused by the FCC’s Delay in
Licensing Cellular Telecommunications,” National Economic Research Associates, Inc. (November 8, 1991).
45.Robert D. Atkinson, Building New Skills for the New Economy: Regional Skills Alliances (Washington, DC: Progressive Policy Institute,
1998). Legislation has been introduced in the House (H.R. 3270) and Senate (S. 2021) to establish federally-funded Regional Skills
Alliance initiative.
46.U.S. Department of Labor, Bureau of Labor Statistics, 1995 Survey of Employer-Provided Training—Employer Results
(http://stats.bls.gov/news.release/sept1.nws.htm).
47.Cappelli, op. cit.
48. Economic Report of the President , 1998.
49.U.S. Department of Labor, Bureau of Labor Statistics, Employment and Earnings (selected years).

8/4/2019 The New Economy PPI
http://slidepdf.com/reader/full/the-new-economy-ppi 53/54
5 0 N E W E C O N O M Y I N D E X
ABOUT THE AUTHORS
Robert D. Atkinson, Ph.D., is the director of the Progressive Policy Institute’s project on
Technology, Innovation, and the New Economy. Previously, he served as executive director of the
Rhode Island Economic Policy Council, and as a project director and senior analyst at the former
Congressional Office of Technology Assessment (OTA). While at OTA, he directed The Technological
Reshaping of Metropolitan America, a report examining the impact of the information technology revo-
lution on America’s urban areas. Dr. Atkinson holds a Ph.D. in city and regional planning from the
University of North Carolina at Chapel Hill.
Randolph H. Court is the technology policy analyst at the Progressive Policy Institute. He is
a former business reporter for Wired News in San Francisco, where he covered the computer and
telecommunications industries, and Silicon Valley. He has also worked as a researcher and freelancewriter for the Red Herr ing, a San Francisco magazine covering the business of technology, and as a
general assignment reporter for the San Diego Daily Tr anscr i pt , a business and legal paper. He holds
a master’s degree in journalism from the University of California at Berkeley.

8/4/2019 The New Economy PPI
http://slidepdf.com/reader/full/the-new-economy-ppi 54/54
NOTE