new economy, new kpis - nsuchaud
TRANSCRIPT
New economy new KPIsThe customer era
Foreword
y creating some disruption in value chains and favouring the emergence of new models the digital revolution has induced deep changes in the way value is created and shared It is more and more decorrelated from short term financial performance That should push organizations and investors to review their monitoring and valuation of innovative projects as well as pay attention to the value of some intangible assets such as customer capital talent capital ecosystem software or societal and environmental impact
Customer centricity was at the heart of the digital revolution which explains why among these assets customer capital is the easiest to value by investors However if wersquove focused our analysis in this presentation on this asset this should not overshadow the other key levers that organizations need now for their transformation to be more and more systemic
Digital native economic models have been built by design according to an extra-financial approach with monitoring and communication already focused on customer KPIs and sometimes on talent or ecosystem metrics By contrast if players other than digital natives have initiated a deep transformation of their model they have not yet adapted their reporting styles even though this would enable them to better allocate resources and value the customer acquisition strategy
Combined with this document we are launching a new index dedicated to testing your own maturity regarding customer capital (how yoursquove integrated this approach how customer-centric your reporting is how you use it) Once this assessment has been completed this presentation will help drive you along the path towards a new reporting approach Additionally it will help you harness your organizations potential which weve identified at both the internal and external levels while focusing on stakeholder engagement and value creation levers
BJean-Christophe Liaubet
Partner at Fabernovel
What is this documentThis is a document dedicated to presenting Fabernovelrsquos view on the new value creation levers in the digital era and in particular on the customer pillar why it is a critical asset how to monitor it assess it and optimize valuation This comes jointly with an index to assess onersquos company maturity on client capital
Who should read itCEOs and C-level employees both from financial and digitalinnovation teams in order to spread this new approach in the company and push their teams to monitor and assess innovation projects differently Ideally this approach should be widely shared inside the company
Customer-centric KPIs
- Q1 2019 -
What can you expect to learn from itThis document should give you a good understanding of the customer lifecycle as well as the KPI toolkit to monitor each of its step It also presents an overview of how mature digital players and incumbents are on this type of reporting Finally it intends to give you the keys to switch to this approach including a dedicated tool to assess your own maturity
Who wrote itFabernovelrsquos teams of experts in the valuation of innovation some of whom were equity analysts for 10-15 years before joining Fabernovel combining expertise in both finance and digital innovation
The digital revolution is a value revolution
Investors increasingly base their judgement on
optionality which is reflected on valuation multiples A companyrsquos biggest challenge then
becomes to crystallize this optionality
Rising share of optionality in valuation
The new economy is leading to massive value shifts driven by three simultaneous trends
The Emergence of new models changing
competitive environments evolving
sector boundaries Perspectives are
blurred
The concept of ldquovaluerdquo needs to be
redefined is it based on the generation of
flows or on the development of assets
on usage value or on financial value
Value chain disruption
New value definition
Valuation is not always correlated to financial performance anymoreThree trillion-dollar babies each in its own way
Microsoftrsquos good earnings
and long-term vision
Applersquos very high
profitability
Amazonrsquosstrategic vision
and exploratory DNA
Applersquos market cap exceeded $1Tn last August after its announcement of very strong financial results and high stock buybacks
Microsoftrsquos market cap appreciation came after strong Q1 earning results primarily driven by its cloud activity But it also came from investorsrsquo trust in Microsoftrsquos vision due to the belief that Microsoft has a key role to play in the B2B cloud market
Amazonrsquos market cap crossed the $1Tn threshold in September 2018 driven by growing valuation multiples Investors were notably buying Bezosrsquos strategic vision despite the companyrsquos low profits
26x15x
$63Bn $39Bn
80x
$13Bn
$1Tn $1Tn$1TnReached on 02082018 Reached on 25042019Reached on 04092018
Market Cap
Net Income
PE
New patternsof value creation
Immobilism is costlya lack of transformationcan be fatal
Think long-term and accept a J-curve
Customer talent ecosystem3 critical assets amp value levers
Vision ampEntrepreneurial culture
are key
New value models new rules
The need for a new valuation approachInnovation amp new models raise the question of how to measure value
Source Factset as of August8 2019
The digital revolution has brought uncertainty regarding the definition and measure of value creation for investors as well as financial teams
Current financial standards do not appear relevant enough anymore to value innovation and new models as some unprofitable companies outperform on public markets
User growth and employee engagement metrics can prevail over financial performance
For innovative projects long term growth prospects appear to be more attractive than short term profitability showing the necessity to take a whole new approach no longer based on financial restructuring and build-up but rather on customer retention talent attractiveness CSR impact and ecosystem diversity
832019 has seen the
highest percentage of unprofitable IPOs
$50Bb
$5Bn
Market Cap
Net loss
Financial standards do not reflect companiesrsquo value anymore
Providing a 360deg approach of value creationSome key intangible assets have become critical in companiesrsquo valuation
Valuation approach in the new economy needs to integrate all drivers for value creation and provide a 360deg vision of businesses
Different pillars of value creation need to be takeninto account in order to assess a companyrsquos valueand growth sustainability
CustomersTalentsEcosystemSocial amp environmental impactSoftware
amp other components specific to each company and industry (governance brand culture products andor services etc)
These pillars complementary to financial performance enable us to answer the question of how to value innovation
ValueCreation
pillars
Customers
Talents
Ecosystem
Social amp environment
impactSoftware
Regulatory push Stakeholder push
Several forces pushing in that directionRegulations as well as stakeholder concerns call for a more comprehensive approach
The EU directive implemented in France (2017-1180 ordonance) replaces companiesrsquoCSR reports with a compulsory ldquoExtra-financial performance declarationrdquo
It takes into account 4 categories of information social impact environment human rights and fighting corruption
The objective is to make extra-financial indicators an integral component of a companyrsquos reporting and to illustrate their ldquocrucial role in a companyrsquos performance and activityrdquo(Medef website)
Applies to Public companies with gt 500 employees and Revenue gt euro40m or Balance sheet total gt euro20m to Private companies with gt 500 employees and Revenue or Balance sheet total gt euro100m
Investors are highlighting the rising importance of non-financial criteria to assess a companyrsquos value
Customersrsquo concern for a companyrsquos commitment and purpose have encouraged corporates to focus on components other than financials
By reinforcing its social amp environmental objectives MAIF has seen an improvement in its attractiveness and in its customer loyalty resulting in a euro100m cut per year in acquisition costs
The customer era1
The
cust
omer
era
Each era has created its own KPIsWith digital revolution comes the customer era
200sPerformance grading of royal family members (China)
1800sDaily performance of employees (Scotland manufactures)
1200sFirst follow-up of margins (Venice merchants)
1930sROI amp apparition of the first dashboards (France)
1990sThe Balanced Scorecard evaluates financial amp non-financial performance (US)
1910sTaylorism introduces the calculation of time per movement (US workers)
2015sDigital revolution brings out new customer-centric players questioning traditional KPIs
2018-2019Amazon the ldquocustomer companyrdquo is valued $1 trn
Customer approach expands to take into account all stakeholders
1970sEBITDA is introduced to highlight cash flow capacities (US)
2000sIntroduction of ARPU (Telecoms)
Productivity era
Stakeholder era
Finance era Customer era
The
cust
omer
era
No more markets only customersLooking at the new economy with different ldquoglassesrdquo
Traditional EconomyIndustrial economy centered on products
New EconomyUsage economy centered on customersVs
From marketsMarketing mix (4P)
Competition on one offerMarket share
From a chainAdded valueValue chain
Assets ownerNumber of suppliers
From core business5-year plan
Growth amp marginBusiness portfolio
hellipto customersrsquo needsUser experience (4C)Competition on one particular needUsage share Share of wallet
to an ecosystem of partnersCircular valueClosed loop of valueNetwork orchestratorLength of network amp diversity of connections
to mission statement30-year vision 6-month action plan Customer Lifetime ValueExperience platform
The
cust
omer
era
Shifting from product management to customer experience Revenue based on customer spendings vs products
Revenue =
Unit price x
number of products
Revenue =
Revenue per customer
x number of customers
Total profit
Traditional management
ProductA
a
Margin A
+ +Margin B Margin C
=
CustomerSegment A Profit Seg A
+Profit Seg B
Profit Seg C
+
New management models
=
ProductB
ProductC
CustomerSegment B
CustomerSegment C
Customer centricity the cornerstone of the new modelrsquos successTh
e cu
stom
er e
ra
Leverage the direct access to customers via customized offers leading to high engagement
The Customer Is the Business Strategy
Collecting and analyzing exhaustive customer metrics is a driver of innovation enabling companies to experiment and create new solutions services or products and opening the path to customization
An innovation catalyst
New players are building a direct disintermediated relationship with their customers who are all the more willing to complete transactions when the relationship is qualitative Their model is based on economies of scale which leads to competitive prices
The bigger the added value for customers the better the network effect for the brand By building a wide user base with a high satisfaction rate new players gain more attractivity and become harder and harder to challenge
A strong pathway to revenue
Building high entry barriers
ldquoLeading with next-generation key performance indicatorsrdquostudy MIT Sloan Management Review x Google
Customer centricityat the heart of winning strategies
The
cust
omer
era
Selling subscriptions at a losshellip or notThe classical marketing amp commercial approach has usually been to minimize acquisition costs But with Primersquos generous advantages (free and soon 1-day delivery streaming etc) Amazon is looking to maximize its margins by investing in a growing base of customers spending more money more often and spending more time attached to the brand (rather than optimizing costs)
AmazonInvesting in its customer base to grow profits amp improve performance
Sources worldwide figures from Amazon Fortune Fabernovel analysis Beamer
[As of June 2019]
+ Prime subscription ($120 yearly)- Prime costs (Video amp music content delivery cost)
An investment that pays off
Amazon Prime
vs $600 non-Prime
$1400Annual spend per member
Retention rate after 1st year
After 2 years
93
= Greater net short-term costs for Prime
= Greater long-term profit for PrimeThe
cust
omer
era
Customers Sellers
+ offer+ service
+ business opportunities+ purchases
+ customer data+ revenue
+ products+ competition (lower prices)
Prime Video Music amp Reading
Free shipping etc
+ customers+ purchase frequency
+ sellers
98
I constantly remind our employees to be afraid to wake up every morning terrified Not of our competition but of our customers
Jeff Bezos
AmazonldquoAn obsessive compulsive focusrdquo on customers the first driver of success
Amazon follows 500 KPIs internally in real time of which 80 are customer centric Indeed delivering optimal satisfaction comes from a good knowledge of users
Thanks to these measures Amazon has been ranked number 1 in the American Customer Satisfaction Index for 8 years
1Contact rate(for each product)
The higher this rate is the lower the customer
satisfaction is
2Conversion rate(by product category)
Enables performance estimation of
recommendation algorithms
The
cust
omer
era
3Loading time
(of homepage)
ldquoA 01 second delay in page rendering can
translate into a 1 drop in customer activityrdquo
Jeff Bezos
4Delivery date
(of products)
of purchases that are delivered after the due
date
ldquoWersquore not satisfieduntil its 0rdquo
Jeff Bezos
NetflixLeveraging customer knowledge to increase engagement and generate revenue
75of the contentviewed on Netflix is based on personal recommendations
Netflix captures data corresponding to various problematicsWhen is the user watching the program WhereOn which device When does the user pause or switch off programsWhat do users research
To better understand users by cross-referencing data and identifying habits amp preferences
And drive strategic choices regarding content creation and licence buyout to provide better customized content
Relying on customer centric metrics
House of Cards a data-driven production
Netflix relied on user data showing their interests amp preferences to produce a
euro100m TV serie and create different trailers each targeting different customer segments
A long-lasting growing revenue (in $m)
The
cust
omer
era
Netflix leverages customer data to draw a specific profile for each user and design via complex algorithms a unique customized catalogue of movies for each which has been the base of the strong customer experience on which Netflix built its success
In a context of increasing competition among streaming services and of Netflix subscribers growth slowdown in Q2 customer centricity is all the more key to accentuate user engagement
Accepting short-term losses to win the long-term raceValue is not systematically linked to financial profit Spotify has convinced investors to accept to lose financial value in the short term in order to gain customer-related sustainability drivers (customer awareness market share loyalty share of customer usage etc)In Q1 19 Spotify was the first music streaming company to reach the 100m paying subscribers milestone
SpotifyCustomer asset as a driver of long-term sustainability boosting company valuation
Spotify EBITDA (eurom) Number of Premium subscribers (millions) Spotify Sales (eurom)
Enterprise value euro278 Md
High losses
Sources company reports Statista Factset estimates
But an exponential customer value And growing revenues
A strategy leading to a high market valuation (as of Q2 19)The
cust
omer
era
EV paying user euro258 subscription EV sales 4x
SlackBetting on customer experience to attract users and convert them into paying users
Slack relies on a freemium offer to grow its paying user baseSlackrsquos strategic bet has been to rely on a free offer to attract the most customers A free well-packaged and high-quality version of the solution is accessible to all and paying companies are only being charged for their members that are actually active on the platform This strategy encourages teams to onboard as many active users as possible with limited barriers to entry
Sources ldquoSlack the future workplacerdquo by Fabernovel Slack
Paying users total users ratio
30 (Aug 14)
39 (Feb 18)
Slack then relies on its frictionless user experience (customization to reflect onersquos company culture various services and apps) to encourages users to switch from free use of Slack to paying accounts and generate revenue
It has already proven its success with a paying userstotal users ratio growing impressively fast
The
cust
omer
era
Slack - Daily active users
A recurring revenue model or market potential can be identified as drivers for valuation
New
eco
nom
y n
ew K
PIs
Some customer-centric companies benefit from a high premium
The market long term growth potential as illustrated by Lyft amp Uber (new mobility) and Slack (New work organizations)
The revenue model Subscription models such as Slack and Netflix are highly valued as it ensures a longer relationship with the customer while advertising models such as Twitter or Snap have a lower EVUser
Source Factset data as of 13092019
Comparison of customer-centric companiesrsquo EVuser Two key drivers
FacebookA stable empire
The biggest user base (as of June 2019)
A very high ARPUOne of the highest thanks to Facebookrsquos various offers and its advertising revenue
Facebook has the highest EVUser among social media sector (excluding Tencent that reaches other sectors)
208$24 bn
$29
Comparison of 3 social media leaders
SnapA young community
offering some opportunities
A decent number of usersbut users who are not using the service much often
New growth opportunitiessuch as the implementation of video games and new filters boosting the user base and the potential of increasing ARPU
But an ARPU below sector averageFewer interactions of the user base with Snap lead to fewer revenues from advertising
48$500m$63
EVUserNo of users
ARPU
New
eco
nom
y n
ew K
PIs
Among the same sector valuations can be quite different
Twitter Increasing the ARPUof a stable user base
A smaller user baseof Monthly Active Users
But a higher amp increasing ARPUThe company shows a high EVUser due to its increasing ARPU
Twitter increased its Sales by 50 between 2017 and the end of 2019 with almost the same user base
92$336m
$8
Growth potential and visibility are critical for investors
The future potential of a company is its ability to find new levers of growth (revenue diversification new offers) which allows the company to improve the previous 2 pillars (with new offers comes new ARPU and a higher magnetism)
Potential of new territories
The capacity to give some insights on long term potential is key to engage them
The ability to have an elevated annual ARPU is highly correlated to the EVUser because it drives a companyrsquos revenue
The magnetism of a company is its ability to acquire and maintain its customer base thanks to their offer and targeted marketing
Monetization Magnetism
New
eco
nom
y n
ew K
PIs
We see the following components as central for the potential of long term value creation for business models It is key for valuation to engage investors on it That is where the use of customer KPIs plays a major role
The notion of customer goes beyondthe commercial transaction
The
cust
omer
era
The
cust
omer
era
In the digital economy everyone is a customer
New business models have redefined the customer concept and make no difference between paying customers amp non-paying ones
Indeed customer-centric companies strive to deliver the best possible experience to everyone to catch their attention and turn it into commitment and eventually into revenuehellip whether or not a transaction is made
The scope of the customer notion brings together all steps of the relationship with the company from being a visitor to being a non-paying user and finally a paying one
The customer scope
The customer scope goes from visitors to paying users
VisitorsAnyone who pays special attention to you
Non Paying UsersAnyone who uses your productservice but does not complete a purchase
Paying Users Users who complete
a purchase
Value Creation
Attract Engage Leverage
Awareness Reach of the company
Retentionloyal amp frequent users
MonetizationGenerating revenue from
users (paying or non-paying)
Activation Visitor commitment (giving informationhellip)
Acquisitionof visitors
Attention drawn
ConversionVisitors become users
(paying or non-paying)
The
cust
omer
era
The customer lifecycle from attention to revenue
Fueled by customer experience
The customer lifecycle from attention to revenue
(advertising affiliation) can measure their non-paying customers (users) and their paying customers (advertisers)
Models based on data monetization
B2C freemium models B2B2C models
can measure their paying customers (companies) and their non-paying customers (final users employees)
The
cust
omer
era
Depending on their business model companies can measure paying users non-paying ones or both
can measure their non-paying customers (users) and their paying customers (subscribers) analyzing engagement amp monetization of each
The
cust
omer
era
Experience is at the heart of the relationship with customersCustomer satisfaction must be the ultimate goal of customer experience
Customer experience has been a key differentiating factor for successful new business modelsIt relies on a few standards that have become a prerequisite
Critical in the digital era trust has emerged as one of the most crucial standards for customer experienceA strong relationship of trust relies on user protection regarding privacy andor safety companyrsquos ethics in terms of transparency
of information and power given to customers and more generally on the quality of the value proposition solving a real need
Indeed customers and more generally stakeholders penalize companies when trust is no longer respected Facebook faced a strong backlash after repeated data breaches and Apple amp Samsung were fined by Italian antitrust authorities for their planned
obsolescence practices considered dishonest for users
Efficiency
Gucci partnered with Farfetch to launch F90 a 90mn delivery service of
any Gucci article
Personalization
Spotify generates a unique track curation for each user thanks to its AI algorithms
Simplicity
Amazon offers additional services to provide a seamless experience in fashion Prime Wardrobe (members try before they buy) and Echo look
(clothing style analysis and recommendations)
Trust
Qwant differentiated from Google by insisting on user protection with its slogan ldquoThe search engine which respects your private liferdquo
The
cust
omer
era
Experience is the backbone of customer value
Delivering wow customer service to achieve a low churn
Zappos invests in its lsquoCustomer Loyalty teamrsquo to deliver a wow service via an overstaffing that enables ldquobreathing spacerdquo for employees in-depth training and a wide flexibility regarding scripts and calls timing By focusing on its customer service Zappos creates a strong emotional connection with customers which has proven successful in terms of acquisition and retention
Experience lays the foundation to attract customers and engage them in order to create value
Inversely a better knowledge of each step of the customer path can highlight potential areas of improvement of the customer experience
A better
CustomerExperience
Attractiveness
CustomerEngagement
Monetization
Improves Optimizes
ZAPPOS (Acquired by Amazon in 2009)
How to assess amp improve customer value2
If you donrsquot measure it you canrsquot improve it
Lord Kelvin
Ass
essi
ng
amp im
pro
vin
g c
ust
omer
val
ue
Evaluating each step of the customer lifecycleMeasuring your customer centricity through each step of the customer path
The framework to evaluate a companyrsquos customer capital integrates4 complementary key blocks of KPIs that retrace every aspect of the customer scope
Attract Engage Leverage
Customer Experience
Capacity to acquire amp
activate visitors
Capacity to convert them into
customers amp engage them
Capacity to monetize your
customers
Improves resultsRely on a seamless
and satisfying experience
The framework will reflect the maturity of onersquos company on its customer centricity
Attractiveness
is the first key phase in the relationship to customers
raising awareness and acquiring new visitors There is no monetization at this stage thus no direct impact on the PampL but it will condition the rest of the value chain
Ass
essi
ng
amp im
pro
vin
g c
ust
omer
val
ue
Assessing attractiveness
How well does the company manage to reach a wide audience
How many new visitors does the company attractHow well are they activated (from someone paying attention to someone who takes action)
Attracting new visitors and activating them
Awareness
Company marketing reachNb of followers on social media
Nb of views of content published
Nb of reactions (likes claps)
Nb of attendees to events
Nb of subscriptions to newsletters clubs
BrandProductservice magnetismNb of brandproductservice mentions researches
Brand knowledge(based on surveys amp perception studies)
Rate of adoption of the productsolution
Viral coefficient
Acquisition of visitorsNb of visitors (anyone who pays attention)Nb of visits on the websitephysical venueFirst contacts for business services(Direct Traffic + indirect traffic per channel)
Nb of single visitors (website physical venue for meetings) Gross adds net adds overall growth
Nb of customer requests about the productservice
ActivationNb of accountssessions created
Nb of proposals or demos required
Nb of app downloads
Social MediaFinancial services amp mobile payment
Nb of visitorsApp store rankingbased on number of downloads
Attract mdash Reporting use cases
Magnetism amp activation
KPI
Reporting
Tracking traffic Reach
bull As of March Snapchat reaches 90 of all 13-24 year-olds and 75 of all 13-34 year-olds in the USbull Our audience watching content on Discover every day has grown over 35 year-over-year
Square Investor Presentation May 2019 Asos 2018 financial report Snap 2019 Q1 amp Q2 earnings
Online fashion retailer
Ass
essi
ng
amp im
pro
vin
g c
ust
omer
val
ue
KPI
Reporting
AudienceAudience reach
KPI
Reporting
Engagement
will be critical regarding the potential of revenue and value creation driven by each customer
Once visitors engage with the productservice they become users Either paying or non-paying users (ex freemium models) participate to create value and impact the PampL directly or indirectly
Ass
essi
ng
amp im
pro
vin
g c
ust
omer
val
ue
Assessing EngagementConverting visitors into users and retaining them
Are visitors successfully converted into usersConversion
From visitors to users (Paying or non-paying)Total nb of active users (Gross adds Net addsTotal growth)Conversion rate (from visitors to users (paying or non-paying)Nb of contracts purchase membership abandonment rebound rate
From non-paying usersto paying usersConversion rate
Do these users become loyal and committed to the company
How many final users and how engaged are they
Retention
Paying amp non-paying usersDailymonthly active usersRetention rate Churn rateAverage lifespan of customers of returning customersUsage Nb of interactions average time spentvisits Nb of pages seen per session
Recurring users (paying)Average time between service contract renewals or purchasesNb of recurring buyers recurring purchase or service contracts (Nb of repeat purchasesnb of total purchases)
CommitmentNb of referrals amp sponsorshipsNb of new users drawnby existing users
Final user data
Nb of final usersTotal net adds gross addsgrowthDailymonthly active usersUser churn rate retention rate nb of returning users
UsageNb of interactions average time spentvisitsNb of pages seen per sessionFrequency of usageAverage lifespan of users
Engage mdash Reporting use casesA
sses
sing
amp im
prov
ing
cust
omer
val
ueA
sses
sin
g amp
imp
rovi
ng
cu
stom
er v
alu
e Telecom operatorFashion e-commerce company
Active usersPaying users
Conversion rate of first-time buyer into repeat buyer
From members to repeat buyers
KPI
Reporting
Users Retention of customers
Showroomprive 2018 results presentation SurveyMonkey yearly report 2018 VodafoneZiggo Presentation March 2019
Online surveys solution
KPI
Reporting
Churn rateNet adds
KPI
Reporting
Ass
essi
ng
amp im
pro
vin
g c
ust
omer
val
ue
Assessing LeverageMonetizing customers and maximizing value
Leveraging
means monetizingBy evaluating customersrsquo (including both visitors and users) impact on PampL value creation can be quantified monitored and optimized
What revenue is drawn directly from paying amp non-paying usersCustomer revenue
Direct revenue (paying users)Total amp average revenue per customer revenue from high value customer revenue from repeat customersARR per customerARPCOUpsell amp cross-sell rateRGUAverage basket value size GMV Nb of orders per customer
Indirect revenue (Non paying user)Total revenue per userARPUFCF per userARR per user
What are the costs for each user
What is the overall value generated by each user
Customer costs
Paying usersCAC (blended paid)Fulfillment cost ratioMarketing costs (channels costs Pay-per-click costs)
Non paying users costs (if applicable)User acquisition cost Marketing costs
Customer value creationEVcustomerCLV (per customer or per cohort)Contribution margin per customerContent created by customers
Cash impactFCF per customerPoor debt status Payment delays
Leverage mdash Reporting use casesA
sses
sing
amp im
prov
ing
cust
omer
val
ueA
sses
sin
g amp
imp
rovi
ng
cu
stom
er v
alu
e E-commerce companySocial media
Customer Acquisition CostAverage Revenue Per User (ARPU) worldwide amp per region
From members to repeat buyers
KPI
Reporting
Users Retention of customers
Facebook - Q2 2019 Results HelloFresh - Capital Markets Day 2018 Zalando Q2 2019 earnings
Meal kit delivery service
KPI
Reporting
Average ordersbasket sizeGMV per active customer
KPI
Reporting
Ass
essi
ng
amp im
pro
vin
g c
ust
omer
val
ue
Assessing ExperienceProviding a qualitative experience to maximize satisfaction
Customer experience
is a key enabler in the customer relation and will drive a companyrsquos ability to optimize its centricity and generate the best value from it Today most companies limit their attention to NPS or customer service indicators they need to push their analysis beyond
How well does the company know and adapt to its customersPersonalization
Knowledge of customersCustomer habits amp preference metricsCustomer profile
CurationAmount of dedicated contentAmount of customized products or servicesLevel of anticipation of choices and needsSingularity amp differentiation of the experience
How qualitative and seamless is the experience provided to customers
How positively do customers evaluate their global experience
Quality of experienceSimplicityFrictionless experience Ergonomy of the digital orphysical venue (app amp website loading time) and of the customer pathAdditional services Free trials return policies
EfficiencyCustomer relation First contact resolution and of resolved issues delay of answers and problem resolution timeDelivery amp delay timeInitial training time of employees
TrustUser protectionsafety of the productsolution data privacyEthics responsibility of the company respectful business practices
Satisfaction
Overall satisfactionProduct or service rankingNb of cancelled ordersCustomer Satisfaction ratescore (CSAT) NPSSocial sentiment ( of positive reaction positive vocabulary)
Experience satisfactionCustomer Effort Score Customer experience index (Forrester) System usability scaleLevel of emotion generated by the experience (Net Emotion Score)
Experience mdash Reporting use casesA
sses
sing
amp im
prov
ing
cust
omer
val
ueA
sses
sin
g amp
imp
rovi
ng
cu
stom
er v
alu
e Meal kit delivery serviceE-commerce conglomerate
Customer Acquisition CostAverage Revenue Per User (ARPU) worldwide amp per region
From membersto repeat buyers
KPI
Reporting
Users Retention of customers
Alibaba - Investor Day 2018 Europcar Mobility Group 2019 Capital Markets Day Blue Apron - Investor Presentation (Q3 18)
Rental amp mobility company
KPI
Reporting
Average ordersbasket sizeGMV per active customer
KPI
Reporting
Where do companies stand todayMain trends amp reporting practices
3
Wh
ere
do
com
pan
ies
stan
d t
oday
A lack of homogeneity in the customer-centric approach
General overview of CAC 40 companies compared to a panel of large digital natives(GAFAM social media e-commerce)
Deep dive on a sample of 35 various B2C companies both digital natives and traditional among a diversity of sectors Insurance Banking Social media Streaming Mobility Leisure Video games E-commerce Retail Food Tech Telecoms Energy
Mostly based on external reporting(2018-2019 results publications press releases)
With insights on internal reporting practices (Corporate blogs research articles white papers interviews)
Benchmark methodology Collection amp classification of customer-centric KPIs
In our study led about several French and international companies two main trends emerged
In general companies tend to report metrics related to all steps of the customer lifecycle (attractivity engagement leverage experience)
With a slight focus on customer engagement
A variety of KPIs
Customer-centric reporting practices still vary highly between digital players and more historical ones
Digital native companies were created with a stakeholder centric approach and a monitoringcommunication focused on customer KPIs from the beginning However even if other companies have initiated a deep transformation of their organization hardly any of them have really switched to a new reporting approach yet
A gap in reporting practices
Incumbents have not switched to a new reporting approach yet
Average number of customer KPIs reported
By digital nativecompanies
52By CAC 40companies
17Wh
ere
do
com
pan
ies
stan
d t
oday
Digital native companies leading on customer-centric reporting
Different models different practices
Customer-centric external reporting appears to be a standard for ldquodigital nativerdquo companies (Tech giants in e-commerce social media streaminghellip) However it remains less common among incumbents except for a few pioneering sectors like Telecoms
Communicateon at least one customer KPI
Number of customersSatisfaction metrics (mostly NPS)
Main KPIs
CAC 40 external reporting ldquoDigital nativesrdquo external reporting
0Have external
reporting mainly focused on
customer metrics
60
Such a gap can be explained by an uneven access to the customer different models and cultures and the difficulties encountered to change an historically different approach as well as the legacy business
Communicateon at least one customer KPI
Number of customers amp growthNumber of active customers ARPU
Main KPIs
50Have external
reporting mainly focused on
customer metrics
90
Overview of CAC 40 companies amp a panel of 10 large ldquodigital nativesrdquo
Areas of focus 25 of companies communicate on all 4 categories of KPIs
Wh
ere
do
com
pan
ies
stan
d t
oday
Companies focus on different aspects of the customer scope
94 of companies included in the benchmark report at least one metric related to Engage
Companies report KPIs related to all categories with a slight focus on engagement
A variety of KPIs reportedRepartition of KPIs collected
Number of customersReported by
53of benchmarkrsquos companies
Active customers 25
Total amp averagerevenue per user
Reported by 33
of benchmarkrsquos companies
Most reported KPIs
72 of companies included in the benchmark report at least one metric related to Experience
61 of companies included in the benchmark report at least one metric related to Leverage
42 of companies included in the benchmark report at least one metric related to Attract
Deep dive on a panel of thirty-five B2C companies with various industries and nationalities
Leverage28
Engage35
Attract14
Experience23
Number of ordersper customer
25
Customer profile 25
And for youThe path to customer KPI reporting
4
Selectingthe right KPIs
1
The path to customer-centric reportingTh
e p
ath
to
cust
omer
KP
I rep
orti
ng
A three-step plan to integrate customer KPIs into your reporting
Harnessing your KPIsInternally
amp externally
3Implementing
your KPIs
2
The
pat
h t
o cu
stom
er K
PI r
epor
tin
gSelecting the right KPIs
For each company its own KPIs adapted to its specific needs
A few examples of OMTM (one metric that matters)
OMTM Time between the 1st amp 2nd connexion
Strategic customer KPIs driving your financial performance
Focus on adequate KPIS providing actionable insights on your long-term financial performance
ldquoThe one metricthat mattersrdquo
Focus on the one metric that is most critical for your performance and that can be followed over time
Selecting therelevant metric
Temporality(can be contextualized)
RateRatio(comparable)
Intelligible(easily understandable)
Decision-oriented(actionable)
OMTM Nb of friends added in the 10 days after inscription
The
pat
h t
o cu
stom
er K
PI r
epor
tin
gImplementing your KPIs
A progressive process for a long-term approach
Complementary approachCustomer-centric reporting does not replace traditional financial indicators it brings complementary information in order to improve value creation
Starting internallyTo set sustainable customer-centric reporting start by following amp monitoring these KPIs internally before communicating externally on it
Engaging your teamsCEO CFO COO Operational teams Unit managers etc need to be familiarized with this new approach
Setting up tools amp guidelines to reach goalsSet specific objectives to be reached for every step of the way tools (automated data tracking etc) and a timeline of follow-up
Defining your level of action depending on your maturity on customer approachCollecting customer data analyzing to extract information andor leveraging data to engage actions
To optimize resource allocation
To segmentcustomers and identify new customer needs to
launch new offers
To monitorcompanyrsquos performance
The
pat
h t
o cu
stom
er K
PI r
epor
tin
gHarnessing your KPIs internally
Setting the internal purpose of your follow-up
Leveraging your KPIs internally
Who
Teams Executives Management Operationals
To monetize customer data to third
parties
The
pat
h t
o cu
stom
er K
PI r
epor
tin
gNike using Customer Lifetime Value to optimize resource allocation
Selecting and implementing CLV to better forecast customer value
Visitors paying or non paying users
ARPU (Direct amp Indirect revenue)Costscustomer (production servicehellip)
Number of customers
Profitper customer (PPC)
Customer lifespan (n)
CAC (Marketing advertising promotions hellip)
Acquisitioncost
1 ( 1 - retention rate)
Σk=1
nPPCk
(1 + WACC) k- CAC CLV =
Early 2018Nike acquires Zodiac
(consumer data analytics)to helps calculate CLV
In 2017Nike launches ldquoConsumer Direct Offenserdquo plan to improve direct
customer relation
The resultsBetter understanding of the
value of an individual customer enabled them to boost revenue
and retention with the right marketing recommendations
and offers
Customer Lifetime Valuation $Bn
The
pat
h t
o cu
stom
er K
PI r
epor
tin
gHarnessing your KPIs externally
Setting the external purpose of your follow-up
To measure your impact
To valueyour customer asset
and strategy
To educate on your model
Building on your KPIS externally
Who
Stakeholders Investors Partners Customers Media Regulators
Twitter valorizing customer capital to financial markets
+ 10Stock price
User acquisition KPI positively influences market reaction after disappointing forecasts
In the publication of its 2019 Q2 earnings Twitter published a
guidance adjusted downwards with revenue growth expected
to slow down and a disappointing forecast
And yet the companyrsquos market cap has been up following the
publication of its quarterly results driven by a better user acquisition growth which has pushed investors to focus on
mid-term potential
+ 5 millionDaily active users
The
pat
h t
o cu
stom
er K
PI r
epor
tin
g
Source MarketWatch July 26
The KPI toolbox for startersA few elements to begin with
New customer concerns and interests in social amp environmental issues impact the customer-business relationshipCustomers loyalty is now related to the companyrsquos external commitment
Stakeholders centricity soon to be integrated as a driver of customer value
The next move
Direct traffic Conversion rate Nb of active users Churn rate Recurring users ARPU CAC CLV NPS Customer habitsspecific to each company
Customer experience has been crucial for the success of new business models
It is key to gather experience KPIs on every step of the customer journey and to set specific objectives for each step
Offering the best experience tailored on customerrsquos specific needs must be an all-time preoccupation
The must haves
The underrated
game changer
The
pat
h t
o cu
stom
er K
PI r
epor
tin
g
Going further Download Fabernovel data mapping toolkit
The
pat
h t
o cu
stom
er K
PI r
epor
tin
g
Evaluate the level of maturity of your customer approach
And you how customer-centric are you
Click here for an overview of the index
To access the full version of the index you can contact us at axellericour-dumasfabernovelcom
Jean-Christophe LiaubetPartner
Jean-Christophe joined Fabernovel in 2017 as a Partner and founder of the valuation practice of the Group
With over 20 years of experience as an Equity Analyst and then Managing Director at Exane BNP Paribas he helps corporates make and value the best investment decisions
Gabrielle PeyrelongueValue analyst
Graduate from ESSEC Gabrielle joined Fabernovel in 2018 as a Value Analyst
She has worked within Fabernovel practices in Paris and San Francisco focusing on several projects including innovation strategy and new models of valuation based on extra financial criteria
Axelle Ricour-DumasValue Director
Axelle joined Fabernovel in 2018 as a Director after 20 years as Equity analyst at Cheuvreux Director of Investor Relations at IPSOS and Founder of her company MYFINADVICE
At Fabernovel she works on several projects of strategic advisory and has a strong expertise on the assessment and scoring of strategic projects
Jeacutereacutemy TaiumlebQuantitative analyst
Jeacutereacutemy joined Fabernovel as a quantitative analyst after graduating from CentraleSupelec and ESCP Europe
He specializes in quantitative finance and data analysis especially for tech companies and works on several projects including financial research financial modelling and ecosystem modelling
AuthorsC
red
its
An
nex
esKPIs glossary
ARPCOAverage Revenue Per Convergent Offer
ARPU (Average Revenue Per User)total of revenuestotal users ARRAnnual Recurring Revenue
Avg lifespan of customer (in months)1monthly churn
Cohort analysisanalysis based on consumersusers fragmentation
Customer acquisition cost total acquisition campaign costsnumber of new customers (CLVCAC ratio)
Customer concentrationbiggest customer revenuetotal revenue Customer Effort Scoremeasures satisfaction regarding the effort through customer journey
Contribution marginselling price per unit minus the variable cost per unit
LTV or CLV Customer lifetime valueARPU x 1CLV attrition rate Can also be based on FCF margins
DMT (Dureacutee Moyenne de Traitement)average processing time
First Call Resolutionfirst call resolution rate reflects customer service performance
Fulfillment Cost RatioFulfillment cost (Cost of sales amp distributionlogistic content creation services payments)revenue
GMV (Gross Merchandise Value)average nb of orders per customer x average basket size(after returns)
Marketing Cost Ratiomarketing costsrevenue
Net addsnew subscribers or customers - nb of unsubscribing
Net Promoter Score brand ambassadors - brand detractors
An
nex
esKPIs glossary
Network effectthe more a product is used the more its value increases(ex Facebook) each company has its own KPIs to assess it
Problem Resolution time(Sum of All Interactions for Total Resolved Issues - Total nb of Resolved Issues)
RGUsRevenue Generating Units (a customer can represent various RGUs for example when subscribing to a mobile phone contract + TV contract + internet rarr the customer represents 3 RGUs) Traffic sourcesdirect organichellip
Conversion ratepace at which the solutionproductservice has been adopted
Rebound ratecustomers leaving site without a chance to convert them
repeat purchaseNb of repeat purchasenb of total purchases
Requests rate with lowhigh level of added valuesimplerecurring customer service requests rate vs complex ones Retention rate(Nb of Customers at End of Period - nb of New Customers Acquired During Period)nb of Customers at Start of Period
Viralityspeed of productservice spread can be measured by k-value (average nb of invitations sent by each userconversion rate of invitations into new users)
An
nex
esCompanies analyzed in the benchmark
HelloFresh
Netflix
Orange
PSA
Showroomprive
Snap
Spotify
Square
Takewaycom
Twitch
Ubisoft
Vodafone
Zalando
Zynga
Activision Blizzard
Airbnb
AirFrance
Alibaba
Allianz
Amazon
Asos
Axa
Baidu
Blablacar
Blue Apron
BNP
Carrefour
Creacutedit Agricole
Easyjet
EDF
Engie
Europcar Mobility Group
Thank youCONTACT
Jean-Christophe LIAUBETPartner
+33 6 08 86 24 88jean-christopheliaubetFabernovelcom
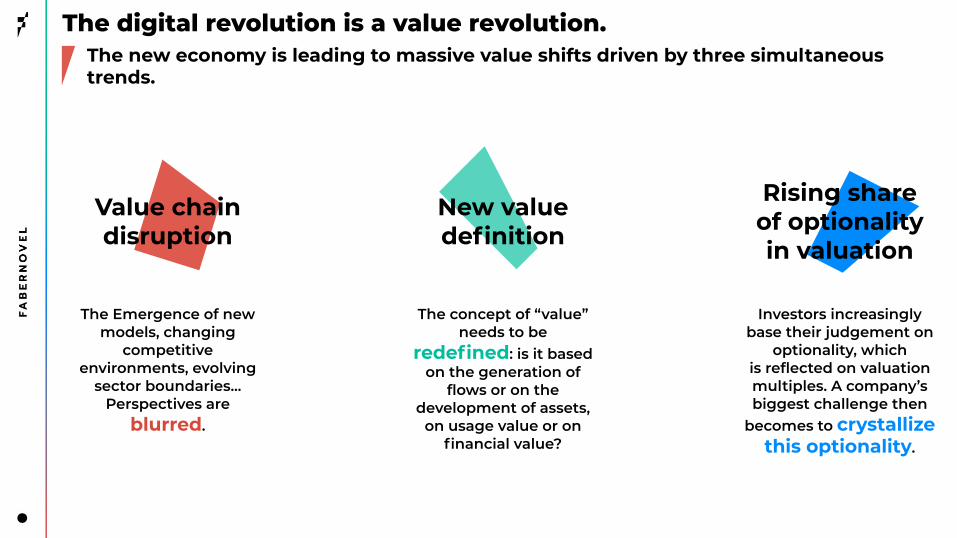
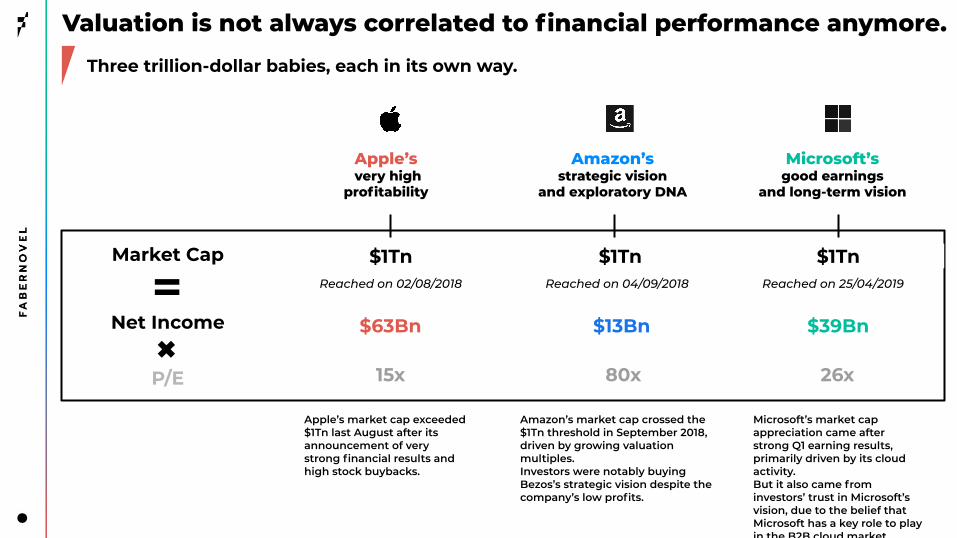
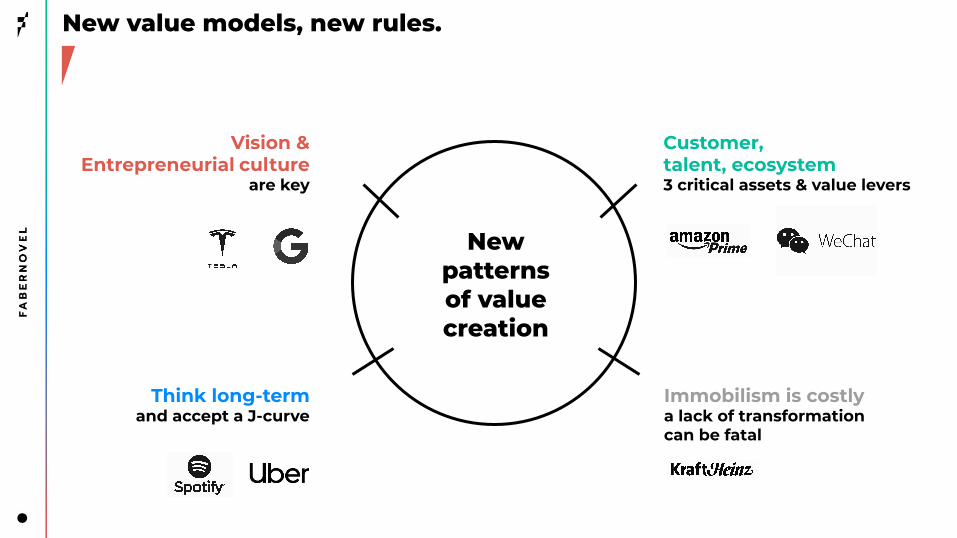
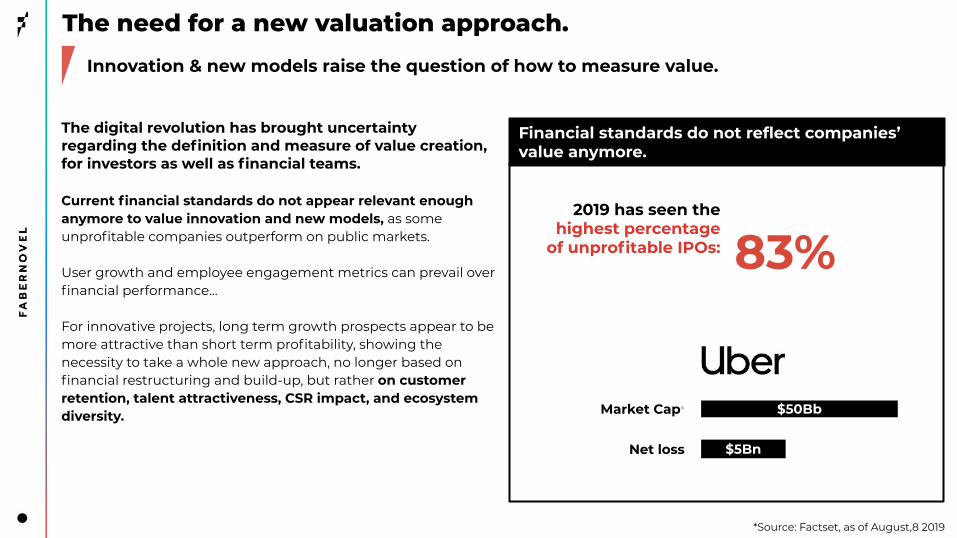
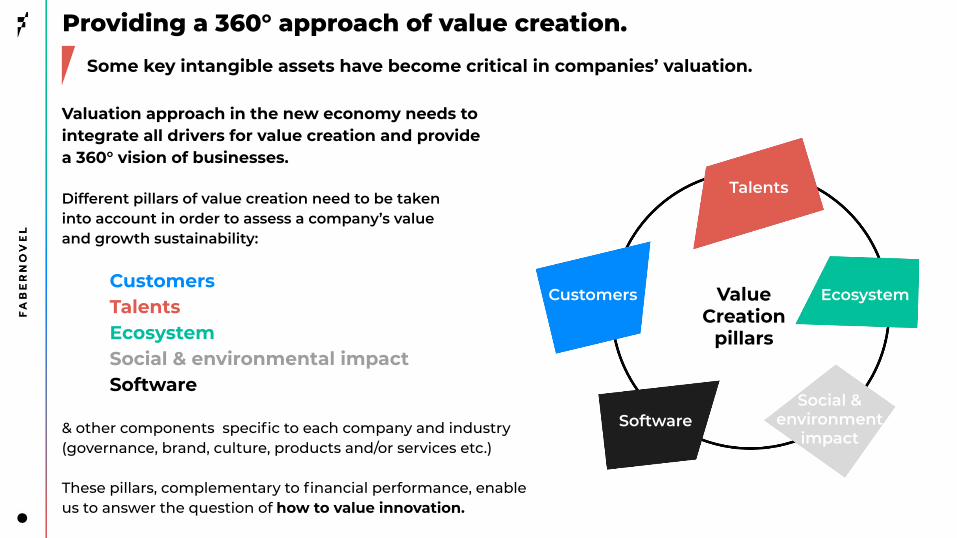
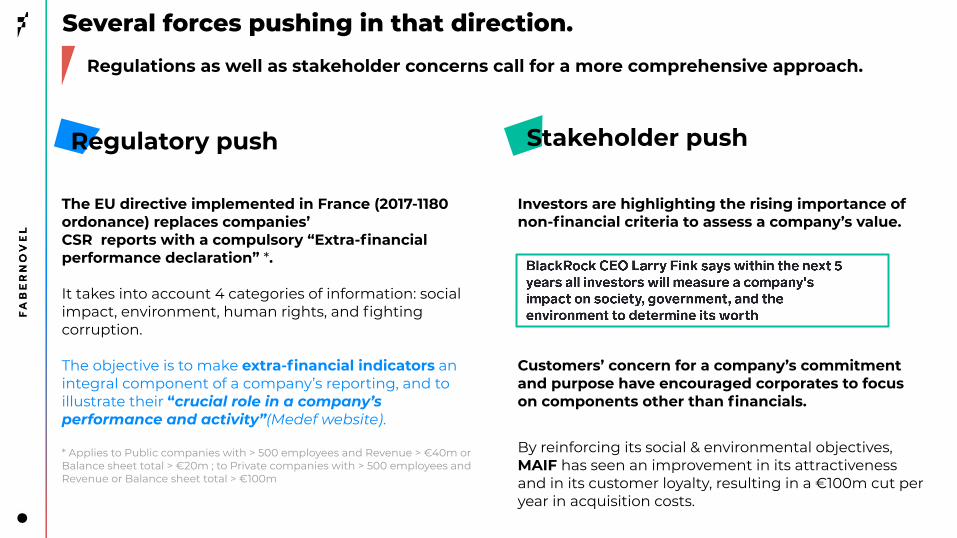
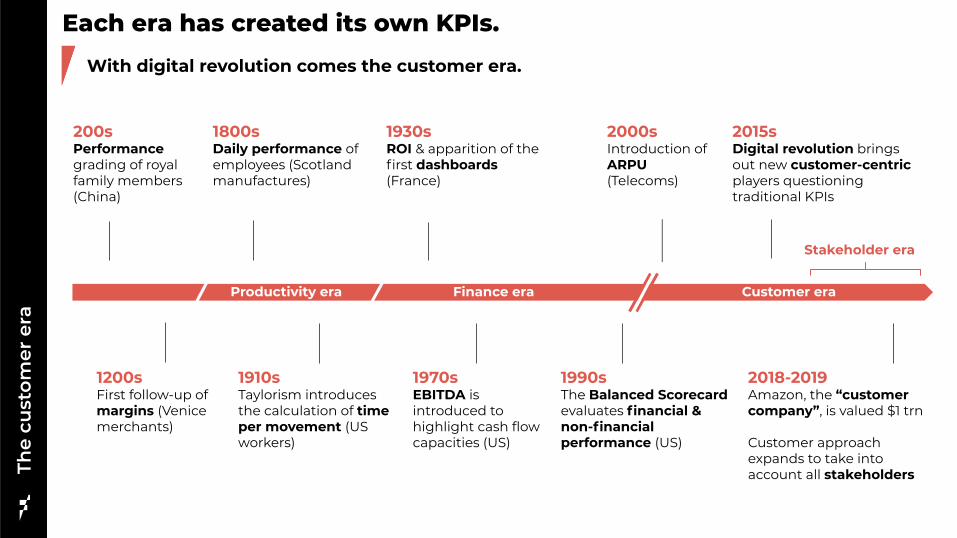
The
cust
omer
era
Each era has created its own KPIsWith digital revolution comes the customer era
200sPerformance grading of royal family members (China)
1800sDaily performance of employees (Scotland manufactures)
1200sFirst follow-up of margins (Venice merchants)
1930sROI amp apparition of the first dashboards (France)
1990sThe Balanced Scorecard evaluates financial amp non-financial performance (US)
1910sTaylorism introduces the calculation of time per movement (US workers)
2015sDigital revolution brings out new customer-centric players questioning traditional KPIs
2018-2019Amazon the ldquocustomer companyrdquo is valued $1 trn
Customer approach expands to take into account all stakeholders
1970sEBITDA is introduced to highlight cash flow capacities (US)
2000sIntroduction of ARPU (Telecoms)
Productivity era
Stakeholder era
Finance era Customer era
The
cust
omer
era
No more markets only customersLooking at the new economy with different ldquoglassesrdquo
Traditional EconomyIndustrial economy centered on products
New EconomyUsage economy centered on customersVs
From marketsMarketing mix (4P)
Competition on one offerMarket share
From a chainAdded valueValue chain
Assets ownerNumber of suppliers
From core business5-year plan
Growth amp marginBusiness portfolio
hellipto customersrsquo needsUser experience (4C)Competition on one particular needUsage share Share of wallet
to an ecosystem of partnersCircular valueClosed loop of valueNetwork orchestratorLength of network amp diversity of connections
to mission statement30-year vision 6-month action plan Customer Lifetime ValueExperience platform
The
cust
omer
era
Shifting from product management to customer experience Revenue based on customer spendings vs products
Revenue =
Unit price x
number of products
Revenue =
Revenue per customer
x number of customers
Total profit
Traditional management
ProductA
a
Margin A
+ +Margin B Margin C
=
CustomerSegment A Profit Seg A
+Profit Seg B
Profit Seg C
+
New management models
=
ProductB
ProductC
CustomerSegment B
CustomerSegment C
Customer centricity the cornerstone of the new modelrsquos successTh
e cu
stom
er e
ra
Leverage the direct access to customers via customized offers leading to high engagement
The Customer Is the Business Strategy
Collecting and analyzing exhaustive customer metrics is a driver of innovation enabling companies to experiment and create new solutions services or products and opening the path to customization
An innovation catalyst
New players are building a direct disintermediated relationship with their customers who are all the more willing to complete transactions when the relationship is qualitative Their model is based on economies of scale which leads to competitive prices
The bigger the added value for customers the better the network effect for the brand By building a wide user base with a high satisfaction rate new players gain more attractivity and become harder and harder to challenge
A strong pathway to revenue
Building high entry barriers
ldquoLeading with next-generation key performance indicatorsrdquostudy MIT Sloan Management Review x Google
Customer centricityat the heart of winning strategies
The
cust
omer
era
Selling subscriptions at a losshellip or notThe classical marketing amp commercial approach has usually been to minimize acquisition costs But with Primersquos generous advantages (free and soon 1-day delivery streaming etc) Amazon is looking to maximize its margins by investing in a growing base of customers spending more money more often and spending more time attached to the brand (rather than optimizing costs)
AmazonInvesting in its customer base to grow profits amp improve performance
Sources worldwide figures from Amazon Fortune Fabernovel analysis Beamer
[As of June 2019]
+ Prime subscription ($120 yearly)- Prime costs (Video amp music content delivery cost)
An investment that pays off
Amazon Prime
vs $600 non-Prime
$1400Annual spend per member
Retention rate after 1st year
After 2 years
93
= Greater net short-term costs for Prime
= Greater long-term profit for PrimeThe
cust
omer
era
Customers Sellers
+ offer+ service
+ business opportunities+ purchases
+ customer data+ revenue
+ products+ competition (lower prices)
Prime Video Music amp Reading
Free shipping etc
+ customers+ purchase frequency
+ sellers
98
I constantly remind our employees to be afraid to wake up every morning terrified Not of our competition but of our customers
Jeff Bezos
AmazonldquoAn obsessive compulsive focusrdquo on customers the first driver of success
Amazon follows 500 KPIs internally in real time of which 80 are customer centric Indeed delivering optimal satisfaction comes from a good knowledge of users
Thanks to these measures Amazon has been ranked number 1 in the American Customer Satisfaction Index for 8 years
1Contact rate(for each product)
The higher this rate is the lower the customer
satisfaction is
2Conversion rate(by product category)
Enables performance estimation of
recommendation algorithms
The
cust
omer
era
3Loading time
(of homepage)
ldquoA 01 second delay in page rendering can
translate into a 1 drop in customer activityrdquo
Jeff Bezos
4Delivery date
(of products)
of purchases that are delivered after the due
date
ldquoWersquore not satisfieduntil its 0rdquo
Jeff Bezos
NetflixLeveraging customer knowledge to increase engagement and generate revenue
75of the contentviewed on Netflix is based on personal recommendations
Netflix captures data corresponding to various problematicsWhen is the user watching the program WhereOn which device When does the user pause or switch off programsWhat do users research
To better understand users by cross-referencing data and identifying habits amp preferences
And drive strategic choices regarding content creation and licence buyout to provide better customized content
Relying on customer centric metrics
House of Cards a data-driven production
Netflix relied on user data showing their interests amp preferences to produce a
euro100m TV serie and create different trailers each targeting different customer segments
A long-lasting growing revenue (in $m)
The
cust
omer
era
Netflix leverages customer data to draw a specific profile for each user and design via complex algorithms a unique customized catalogue of movies for each which has been the base of the strong customer experience on which Netflix built its success
In a context of increasing competition among streaming services and of Netflix subscribers growth slowdown in Q2 customer centricity is all the more key to accentuate user engagement
Accepting short-term losses to win the long-term raceValue is not systematically linked to financial profit Spotify has convinced investors to accept to lose financial value in the short term in order to gain customer-related sustainability drivers (customer awareness market share loyalty share of customer usage etc)In Q1 19 Spotify was the first music streaming company to reach the 100m paying subscribers milestone
SpotifyCustomer asset as a driver of long-term sustainability boosting company valuation
Spotify EBITDA (eurom) Number of Premium subscribers (millions) Spotify Sales (eurom)
Enterprise value euro278 Md
High losses
Sources company reports Statista Factset estimates
But an exponential customer value And growing revenues
A strategy leading to a high market valuation (as of Q2 19)The
cust
omer
era
EV paying user euro258 subscription EV sales 4x
SlackBetting on customer experience to attract users and convert them into paying users
Slack relies on a freemium offer to grow its paying user baseSlackrsquos strategic bet has been to rely on a free offer to attract the most customers A free well-packaged and high-quality version of the solution is accessible to all and paying companies are only being charged for their members that are actually active on the platform This strategy encourages teams to onboard as many active users as possible with limited barriers to entry
Sources ldquoSlack the future workplacerdquo by Fabernovel Slack
Paying users total users ratio
30 (Aug 14)
39 (Feb 18)
Slack then relies on its frictionless user experience (customization to reflect onersquos company culture various services and apps) to encourages users to switch from free use of Slack to paying accounts and generate revenue
It has already proven its success with a paying userstotal users ratio growing impressively fast
The
cust
omer
era
Slack - Daily active users
A recurring revenue model or market potential can be identified as drivers for valuation
New
eco
nom
y n
ew K
PIs
Some customer-centric companies benefit from a high premium
The market long term growth potential as illustrated by Lyft amp Uber (new mobility) and Slack (New work organizations)
The revenue model Subscription models such as Slack and Netflix are highly valued as it ensures a longer relationship with the customer while advertising models such as Twitter or Snap have a lower EVUser
Source Factset data as of 13092019
Comparison of customer-centric companiesrsquo EVuser Two key drivers
FacebookA stable empire
The biggest user base (as of June 2019)
A very high ARPUOne of the highest thanks to Facebookrsquos various offers and its advertising revenue
Facebook has the highest EVUser among social media sector (excluding Tencent that reaches other sectors)
208$24 bn
$29
Comparison of 3 social media leaders
SnapA young community
offering some opportunities
A decent number of usersbut users who are not using the service much often
New growth opportunitiessuch as the implementation of video games and new filters boosting the user base and the potential of increasing ARPU
But an ARPU below sector averageFewer interactions of the user base with Snap lead to fewer revenues from advertising
48$500m$63
EVUserNo of users
ARPU
New
eco
nom
y n
ew K
PIs
Among the same sector valuations can be quite different
Twitter Increasing the ARPUof a stable user base
A smaller user baseof Monthly Active Users
But a higher amp increasing ARPUThe company shows a high EVUser due to its increasing ARPU
Twitter increased its Sales by 50 between 2017 and the end of 2019 with almost the same user base
92$336m
$8
Growth potential and visibility are critical for investors
The future potential of a company is its ability to find new levers of growth (revenue diversification new offers) which allows the company to improve the previous 2 pillars (with new offers comes new ARPU and a higher magnetism)
Potential of new territories
The capacity to give some insights on long term potential is key to engage them
The ability to have an elevated annual ARPU is highly correlated to the EVUser because it drives a companyrsquos revenue
The magnetism of a company is its ability to acquire and maintain its customer base thanks to their offer and targeted marketing
Monetization Magnetism
New
eco
nom
y n
ew K
PIs
We see the following components as central for the potential of long term value creation for business models It is key for valuation to engage investors on it That is where the use of customer KPIs plays a major role
The notion of customer goes beyondthe commercial transaction
The
cust
omer
era
The
cust
omer
era
In the digital economy everyone is a customer
New business models have redefined the customer concept and make no difference between paying customers amp non-paying ones
Indeed customer-centric companies strive to deliver the best possible experience to everyone to catch their attention and turn it into commitment and eventually into revenuehellip whether or not a transaction is made
The scope of the customer notion brings together all steps of the relationship with the company from being a visitor to being a non-paying user and finally a paying one
The customer scope
The customer scope goes from visitors to paying users
VisitorsAnyone who pays special attention to you
Non Paying UsersAnyone who uses your productservice but does not complete a purchase
Paying Users Users who complete
a purchase
Value Creation
Attract Engage Leverage
Awareness Reach of the company
Retentionloyal amp frequent users
MonetizationGenerating revenue from
users (paying or non-paying)
Activation Visitor commitment (giving informationhellip)
Acquisitionof visitors
Attention drawn
ConversionVisitors become users
(paying or non-paying)
The
cust
omer
era
The customer lifecycle from attention to revenue
Fueled by customer experience
The customer lifecycle from attention to revenue
(advertising affiliation) can measure their non-paying customers (users) and their paying customers (advertisers)
Models based on data monetization
B2C freemium models B2B2C models
can measure their paying customers (companies) and their non-paying customers (final users employees)
The
cust
omer
era
Depending on their business model companies can measure paying users non-paying ones or both
can measure their non-paying customers (users) and their paying customers (subscribers) analyzing engagement amp monetization of each
The
cust
omer
era
Experience is at the heart of the relationship with customersCustomer satisfaction must be the ultimate goal of customer experience
Customer experience has been a key differentiating factor for successful new business modelsIt relies on a few standards that have become a prerequisite
Critical in the digital era trust has emerged as one of the most crucial standards for customer experienceA strong relationship of trust relies on user protection regarding privacy andor safety companyrsquos ethics in terms of transparency
of information and power given to customers and more generally on the quality of the value proposition solving a real need
Indeed customers and more generally stakeholders penalize companies when trust is no longer respected Facebook faced a strong backlash after repeated data breaches and Apple amp Samsung were fined by Italian antitrust authorities for their planned
obsolescence practices considered dishonest for users
Efficiency
Gucci partnered with Farfetch to launch F90 a 90mn delivery service of
any Gucci article
Personalization
Spotify generates a unique track curation for each user thanks to its AI algorithms
Simplicity
Amazon offers additional services to provide a seamless experience in fashion Prime Wardrobe (members try before they buy) and Echo look
(clothing style analysis and recommendations)
Trust
Qwant differentiated from Google by insisting on user protection with its slogan ldquoThe search engine which respects your private liferdquo
The
cust
omer
era
Experience is the backbone of customer value
Delivering wow customer service to achieve a low churn
Zappos invests in its lsquoCustomer Loyalty teamrsquo to deliver a wow service via an overstaffing that enables ldquobreathing spacerdquo for employees in-depth training and a wide flexibility regarding scripts and calls timing By focusing on its customer service Zappos creates a strong emotional connection with customers which has proven successful in terms of acquisition and retention
Experience lays the foundation to attract customers and engage them in order to create value
Inversely a better knowledge of each step of the customer path can highlight potential areas of improvement of the customer experience
A better
CustomerExperience
Attractiveness
CustomerEngagement
Monetization
Improves Optimizes
ZAPPOS (Acquired by Amazon in 2009)
How to assess amp improve customer value2
If you donrsquot measure it you canrsquot improve it
Lord Kelvin
Ass
essi
ng
amp im
pro
vin
g c
ust
omer
val
ue
Evaluating each step of the customer lifecycleMeasuring your customer centricity through each step of the customer path
The framework to evaluate a companyrsquos customer capital integrates4 complementary key blocks of KPIs that retrace every aspect of the customer scope
Attract Engage Leverage
Customer Experience
Capacity to acquire amp
activate visitors
Capacity to convert them into
customers amp engage them
Capacity to monetize your
customers
Improves resultsRely on a seamless
and satisfying experience
The framework will reflect the maturity of onersquos company on its customer centricity
Attractiveness
is the first key phase in the relationship to customers
raising awareness and acquiring new visitors There is no monetization at this stage thus no direct impact on the PampL but it will condition the rest of the value chain
Ass
essi
ng
amp im
pro
vin
g c
ust
omer
val
ue
Assessing attractiveness
How well does the company manage to reach a wide audience
How many new visitors does the company attractHow well are they activated (from someone paying attention to someone who takes action)
Attracting new visitors and activating them
Awareness
Company marketing reachNb of followers on social media
Nb of views of content published
Nb of reactions (likes claps)
Nb of attendees to events
Nb of subscriptions to newsletters clubs
BrandProductservice magnetismNb of brandproductservice mentions researches
Brand knowledge(based on surveys amp perception studies)
Rate of adoption of the productsolution
Viral coefficient
Acquisition of visitorsNb of visitors (anyone who pays attention)Nb of visits on the websitephysical venueFirst contacts for business services(Direct Traffic + indirect traffic per channel)
Nb of single visitors (website physical venue for meetings) Gross adds net adds overall growth
Nb of customer requests about the productservice
ActivationNb of accountssessions created
Nb of proposals or demos required
Nb of app downloads
Social MediaFinancial services amp mobile payment
Nb of visitorsApp store rankingbased on number of downloads
Attract mdash Reporting use cases
Magnetism amp activation
KPI
Reporting
Tracking traffic Reach
bull As of March Snapchat reaches 90 of all 13-24 year-olds and 75 of all 13-34 year-olds in the USbull Our audience watching content on Discover every day has grown over 35 year-over-year
Square Investor Presentation May 2019 Asos 2018 financial report Snap 2019 Q1 amp Q2 earnings
Online fashion retailer
Ass
essi
ng
amp im
pro
vin
g c
ust
omer
val
ue
KPI
Reporting
AudienceAudience reach
KPI
Reporting
Engagement
will be critical regarding the potential of revenue and value creation driven by each customer
Once visitors engage with the productservice they become users Either paying or non-paying users (ex freemium models) participate to create value and impact the PampL directly or indirectly
Ass
essi
ng
amp im
pro
vin
g c
ust
omer
val
ue
Assessing EngagementConverting visitors into users and retaining them
Are visitors successfully converted into usersConversion
From visitors to users (Paying or non-paying)Total nb of active users (Gross adds Net addsTotal growth)Conversion rate (from visitors to users (paying or non-paying)Nb of contracts purchase membership abandonment rebound rate
From non-paying usersto paying usersConversion rate
Do these users become loyal and committed to the company
How many final users and how engaged are they
Retention
Paying amp non-paying usersDailymonthly active usersRetention rate Churn rateAverage lifespan of customers of returning customersUsage Nb of interactions average time spentvisits Nb of pages seen per session
Recurring users (paying)Average time between service contract renewals or purchasesNb of recurring buyers recurring purchase or service contracts (Nb of repeat purchasesnb of total purchases)
CommitmentNb of referrals amp sponsorshipsNb of new users drawnby existing users
Final user data
Nb of final usersTotal net adds gross addsgrowthDailymonthly active usersUser churn rate retention rate nb of returning users
UsageNb of interactions average time spentvisitsNb of pages seen per sessionFrequency of usageAverage lifespan of users
Engage mdash Reporting use casesA
sses
sing
amp im
prov
ing
cust
omer
val
ueA
sses
sin
g amp
imp
rovi
ng
cu
stom
er v
alu
e Telecom operatorFashion e-commerce company
Active usersPaying users
Conversion rate of first-time buyer into repeat buyer
From members to repeat buyers
KPI
Reporting
Users Retention of customers
Showroomprive 2018 results presentation SurveyMonkey yearly report 2018 VodafoneZiggo Presentation March 2019
Online surveys solution
KPI
Reporting
Churn rateNet adds
KPI
Reporting
Ass
essi
ng
amp im
pro
vin
g c
ust
omer
val
ue
Assessing LeverageMonetizing customers and maximizing value
Leveraging
means monetizingBy evaluating customersrsquo (including both visitors and users) impact on PampL value creation can be quantified monitored and optimized
What revenue is drawn directly from paying amp non-paying usersCustomer revenue
Direct revenue (paying users)Total amp average revenue per customer revenue from high value customer revenue from repeat customersARR per customerARPCOUpsell amp cross-sell rateRGUAverage basket value size GMV Nb of orders per customer
Indirect revenue (Non paying user)Total revenue per userARPUFCF per userARR per user
What are the costs for each user
What is the overall value generated by each user
Customer costs
Paying usersCAC (blended paid)Fulfillment cost ratioMarketing costs (channels costs Pay-per-click costs)
Non paying users costs (if applicable)User acquisition cost Marketing costs
Customer value creationEVcustomerCLV (per customer or per cohort)Contribution margin per customerContent created by customers
Cash impactFCF per customerPoor debt status Payment delays
Leverage mdash Reporting use casesA
sses
sing
amp im
prov
ing
cust
omer
val
ueA
sses
sin
g amp
imp
rovi
ng
cu
stom
er v
alu
e E-commerce companySocial media
Customer Acquisition CostAverage Revenue Per User (ARPU) worldwide amp per region
From members to repeat buyers
KPI
Reporting
Users Retention of customers
Facebook - Q2 2019 Results HelloFresh - Capital Markets Day 2018 Zalando Q2 2019 earnings
Meal kit delivery service
KPI
Reporting
Average ordersbasket sizeGMV per active customer
KPI
Reporting
Ass
essi
ng
amp im
pro
vin
g c
ust
omer
val
ue
Assessing ExperienceProviding a qualitative experience to maximize satisfaction
Customer experience
is a key enabler in the customer relation and will drive a companyrsquos ability to optimize its centricity and generate the best value from it Today most companies limit their attention to NPS or customer service indicators they need to push their analysis beyond
How well does the company know and adapt to its customersPersonalization
Knowledge of customersCustomer habits amp preference metricsCustomer profile
CurationAmount of dedicated contentAmount of customized products or servicesLevel of anticipation of choices and needsSingularity amp differentiation of the experience
How qualitative and seamless is the experience provided to customers
How positively do customers evaluate their global experience
Quality of experienceSimplicityFrictionless experience Ergonomy of the digital orphysical venue (app amp website loading time) and of the customer pathAdditional services Free trials return policies
EfficiencyCustomer relation First contact resolution and of resolved issues delay of answers and problem resolution timeDelivery amp delay timeInitial training time of employees
TrustUser protectionsafety of the productsolution data privacyEthics responsibility of the company respectful business practices
Satisfaction
Overall satisfactionProduct or service rankingNb of cancelled ordersCustomer Satisfaction ratescore (CSAT) NPSSocial sentiment ( of positive reaction positive vocabulary)
Experience satisfactionCustomer Effort Score Customer experience index (Forrester) System usability scaleLevel of emotion generated by the experience (Net Emotion Score)
Experience mdash Reporting use casesA
sses
sing
amp im
prov
ing
cust
omer
val
ueA
sses
sin
g amp
imp
rovi
ng
cu
stom
er v
alu
e Meal kit delivery serviceE-commerce conglomerate
Customer Acquisition CostAverage Revenue Per User (ARPU) worldwide amp per region
From membersto repeat buyers
KPI
Reporting
Users Retention of customers
Alibaba - Investor Day 2018 Europcar Mobility Group 2019 Capital Markets Day Blue Apron - Investor Presentation (Q3 18)
Rental amp mobility company
KPI
Reporting
Average ordersbasket sizeGMV per active customer
KPI
Reporting
Where do companies stand todayMain trends amp reporting practices
3
Wh
ere
do
com
pan
ies
stan
d t
oday
A lack of homogeneity in the customer-centric approach
General overview of CAC 40 companies compared to a panel of large digital natives(GAFAM social media e-commerce)
Deep dive on a sample of 35 various B2C companies both digital natives and traditional among a diversity of sectors Insurance Banking Social media Streaming Mobility Leisure Video games E-commerce Retail Food Tech Telecoms Energy
Mostly based on external reporting(2018-2019 results publications press releases)
With insights on internal reporting practices (Corporate blogs research articles white papers interviews)
Benchmark methodology Collection amp classification of customer-centric KPIs
In our study led about several French and international companies two main trends emerged
In general companies tend to report metrics related to all steps of the customer lifecycle (attractivity engagement leverage experience)
With a slight focus on customer engagement
A variety of KPIs
Customer-centric reporting practices still vary highly between digital players and more historical ones
Digital native companies were created with a stakeholder centric approach and a monitoringcommunication focused on customer KPIs from the beginning However even if other companies have initiated a deep transformation of their organization hardly any of them have really switched to a new reporting approach yet
A gap in reporting practices
Incumbents have not switched to a new reporting approach yet
Average number of customer KPIs reported
By digital nativecompanies
52By CAC 40companies
17Wh
ere
do
com
pan
ies
stan
d t
oday
Digital native companies leading on customer-centric reporting
Different models different practices
Customer-centric external reporting appears to be a standard for ldquodigital nativerdquo companies (Tech giants in e-commerce social media streaminghellip) However it remains less common among incumbents except for a few pioneering sectors like Telecoms
Communicateon at least one customer KPI
Number of customersSatisfaction metrics (mostly NPS)
Main KPIs
CAC 40 external reporting ldquoDigital nativesrdquo external reporting
0Have external
reporting mainly focused on
customer metrics
60
Such a gap can be explained by an uneven access to the customer different models and cultures and the difficulties encountered to change an historically different approach as well as the legacy business
Communicateon at least one customer KPI
Number of customers amp growthNumber of active customers ARPU
Main KPIs
50Have external
reporting mainly focused on
customer metrics
90
Overview of CAC 40 companies amp a panel of 10 large ldquodigital nativesrdquo
Areas of focus 25 of companies communicate on all 4 categories of KPIs
Wh
ere
do
com
pan
ies
stan
d t
oday
Companies focus on different aspects of the customer scope
94 of companies included in the benchmark report at least one metric related to Engage
Companies report KPIs related to all categories with a slight focus on engagement
A variety of KPIs reportedRepartition of KPIs collected
Number of customersReported by
53of benchmarkrsquos companies
Active customers 25
Total amp averagerevenue per user
Reported by 33
of benchmarkrsquos companies
Most reported KPIs
72 of companies included in the benchmark report at least one metric related to Experience
61 of companies included in the benchmark report at least one metric related to Leverage
42 of companies included in the benchmark report at least one metric related to Attract
Deep dive on a panel of thirty-five B2C companies with various industries and nationalities
Leverage28
Engage35
Attract14
Experience23
Number of ordersper customer
25
Customer profile 25
And for youThe path to customer KPI reporting
4
Selectingthe right KPIs
1
The path to customer-centric reportingTh
e p
ath
to
cust
omer
KP
I rep
orti
ng
A three-step plan to integrate customer KPIs into your reporting
Harnessing your KPIsInternally
amp externally
3Implementing
your KPIs
2
The
pat
h t
o cu
stom
er K
PI r
epor
tin
gSelecting the right KPIs
For each company its own KPIs adapted to its specific needs
A few examples of OMTM (one metric that matters)
OMTM Time between the 1st amp 2nd connexion
Strategic customer KPIs driving your financial performance
Focus on adequate KPIS providing actionable insights on your long-term financial performance
ldquoThe one metricthat mattersrdquo
Focus on the one metric that is most critical for your performance and that can be followed over time
Selecting therelevant metric
Temporality(can be contextualized)
RateRatio(comparable)
Intelligible(easily understandable)
Decision-oriented(actionable)
OMTM Nb of friends added in the 10 days after inscription
The
pat
h t
o cu
stom
er K
PI r
epor
tin
gImplementing your KPIs
A progressive process for a long-term approach
Complementary approachCustomer-centric reporting does not replace traditional financial indicators it brings complementary information in order to improve value creation
Starting internallyTo set sustainable customer-centric reporting start by following amp monitoring these KPIs internally before communicating externally on it
Engaging your teamsCEO CFO COO Operational teams Unit managers etc need to be familiarized with this new approach
Setting up tools amp guidelines to reach goalsSet specific objectives to be reached for every step of the way tools (automated data tracking etc) and a timeline of follow-up
Defining your level of action depending on your maturity on customer approachCollecting customer data analyzing to extract information andor leveraging data to engage actions
To optimize resource allocation
To segmentcustomers and identify new customer needs to
launch new offers
To monitorcompanyrsquos performance
The
pat
h t
o cu
stom
er K
PI r
epor
tin
gHarnessing your KPIs internally
Setting the internal purpose of your follow-up
Leveraging your KPIs internally
Who
Teams Executives Management Operationals
To monetize customer data to third
parties
The
pat
h t
o cu
stom
er K
PI r
epor
tin
gNike using Customer Lifetime Value to optimize resource allocation
Selecting and implementing CLV to better forecast customer value
Visitors paying or non paying users
ARPU (Direct amp Indirect revenue)Costscustomer (production servicehellip)
Number of customers
Profitper customer (PPC)
Customer lifespan (n)
CAC (Marketing advertising promotions hellip)
Acquisitioncost
1 ( 1 - retention rate)
Σk=1
nPPCk
(1 + WACC) k- CAC CLV =
Early 2018Nike acquires Zodiac
(consumer data analytics)to helps calculate CLV
In 2017Nike launches ldquoConsumer Direct Offenserdquo plan to improve direct
customer relation
The resultsBetter understanding of the
value of an individual customer enabled them to boost revenue
and retention with the right marketing recommendations
and offers
Customer Lifetime Valuation $Bn
The
pat
h t
o cu
stom
er K
PI r
epor
tin
gHarnessing your KPIs externally
Setting the external purpose of your follow-up
To measure your impact
To valueyour customer asset
and strategy
To educate on your model
Building on your KPIS externally
Who
Stakeholders Investors Partners Customers Media Regulators
Twitter valorizing customer capital to financial markets
+ 10Stock price
User acquisition KPI positively influences market reaction after disappointing forecasts
In the publication of its 2019 Q2 earnings Twitter published a
guidance adjusted downwards with revenue growth expected
to slow down and a disappointing forecast
And yet the companyrsquos market cap has been up following the
publication of its quarterly results driven by a better user acquisition growth which has pushed investors to focus on
mid-term potential
+ 5 millionDaily active users
The
pat
h t
o cu
stom
er K
PI r
epor
tin
g
Source MarketWatch July 26
The KPI toolbox for startersA few elements to begin with
New customer concerns and interests in social amp environmental issues impact the customer-business relationshipCustomers loyalty is now related to the companyrsquos external commitment
Stakeholders centricity soon to be integrated as a driver of customer value
The next move
Direct traffic Conversion rate Nb of active users Churn rate Recurring users ARPU CAC CLV NPS Customer habitsspecific to each company
Customer experience has been crucial for the success of new business models
It is key to gather experience KPIs on every step of the customer journey and to set specific objectives for each step
Offering the best experience tailored on customerrsquos specific needs must be an all-time preoccupation
The must haves
The underrated
game changer
The
pat
h t
o cu
stom
er K
PI r
epor
tin
g
Going further Download Fabernovel data mapping toolkit
The
pat
h t
o cu
stom
er K
PI r
epor
tin
g
Evaluate the level of maturity of your customer approach
And you how customer-centric are you
Click here for an overview of the index
To access the full version of the index you can contact us at axellericour-dumasfabernovelcom
Jean-Christophe LiaubetPartner
Jean-Christophe joined Fabernovel in 2017 as a Partner and founder of the valuation practice of the Group
With over 20 years of experience as an Equity Analyst and then Managing Director at Exane BNP Paribas he helps corporates make and value the best investment decisions
Gabrielle PeyrelongueValue analyst
Graduate from ESSEC Gabrielle joined Fabernovel in 2018 as a Value Analyst
She has worked within Fabernovel practices in Paris and San Francisco focusing on several projects including innovation strategy and new models of valuation based on extra financial criteria
Axelle Ricour-DumasValue Director
Axelle joined Fabernovel in 2018 as a Director after 20 years as Equity analyst at Cheuvreux Director of Investor Relations at IPSOS and Founder of her company MYFINADVICE
At Fabernovel she works on several projects of strategic advisory and has a strong expertise on the assessment and scoring of strategic projects
Jeacutereacutemy TaiumlebQuantitative analyst
Jeacutereacutemy joined Fabernovel as a quantitative analyst after graduating from CentraleSupelec and ESCP Europe
He specializes in quantitative finance and data analysis especially for tech companies and works on several projects including financial research financial modelling and ecosystem modelling
AuthorsC
red
its
An
nex
esKPIs glossary
ARPCOAverage Revenue Per Convergent Offer
ARPU (Average Revenue Per User)total of revenuestotal users ARRAnnual Recurring Revenue
Avg lifespan of customer (in months)1monthly churn
Cohort analysisanalysis based on consumersusers fragmentation
Customer acquisition cost total acquisition campaign costsnumber of new customers (CLVCAC ratio)
Customer concentrationbiggest customer revenuetotal revenue Customer Effort Scoremeasures satisfaction regarding the effort through customer journey
Contribution marginselling price per unit minus the variable cost per unit
LTV or CLV Customer lifetime valueARPU x 1CLV attrition rate Can also be based on FCF margins
DMT (Dureacutee Moyenne de Traitement)average processing time
First Call Resolutionfirst call resolution rate reflects customer service performance
Fulfillment Cost RatioFulfillment cost (Cost of sales amp distributionlogistic content creation services payments)revenue
GMV (Gross Merchandise Value)average nb of orders per customer x average basket size(after returns)
Marketing Cost Ratiomarketing costsrevenue
Net addsnew subscribers or customers - nb of unsubscribing
Net Promoter Score brand ambassadors - brand detractors
An
nex
esKPIs glossary
Network effectthe more a product is used the more its value increases(ex Facebook) each company has its own KPIs to assess it
Problem Resolution time(Sum of All Interactions for Total Resolved Issues - Total nb of Resolved Issues)
RGUsRevenue Generating Units (a customer can represent various RGUs for example when subscribing to a mobile phone contract + TV contract + internet rarr the customer represents 3 RGUs) Traffic sourcesdirect organichellip
Conversion ratepace at which the solutionproductservice has been adopted
Rebound ratecustomers leaving site without a chance to convert them
repeat purchaseNb of repeat purchasenb of total purchases
Requests rate with lowhigh level of added valuesimplerecurring customer service requests rate vs complex ones Retention rate(Nb of Customers at End of Period - nb of New Customers Acquired During Period)nb of Customers at Start of Period
Viralityspeed of productservice spread can be measured by k-value (average nb of invitations sent by each userconversion rate of invitations into new users)
An
nex
esCompanies analyzed in the benchmark
HelloFresh
Netflix
Orange
PSA
Showroomprive
Snap
Spotify
Square
Takewaycom
Twitch
Ubisoft
Vodafone
Zalando
Zynga
Activision Blizzard
Airbnb
AirFrance
Alibaba
Allianz
Amazon
Asos
Axa
Baidu
Blablacar
Blue Apron
BNP
Carrefour
Creacutedit Agricole
Easyjet
EDF
Engie
Europcar Mobility Group
Thank youCONTACT
Jean-Christophe LIAUBETPartner
+33 6 08 86 24 88jean-christopheliaubetFabernovelcom
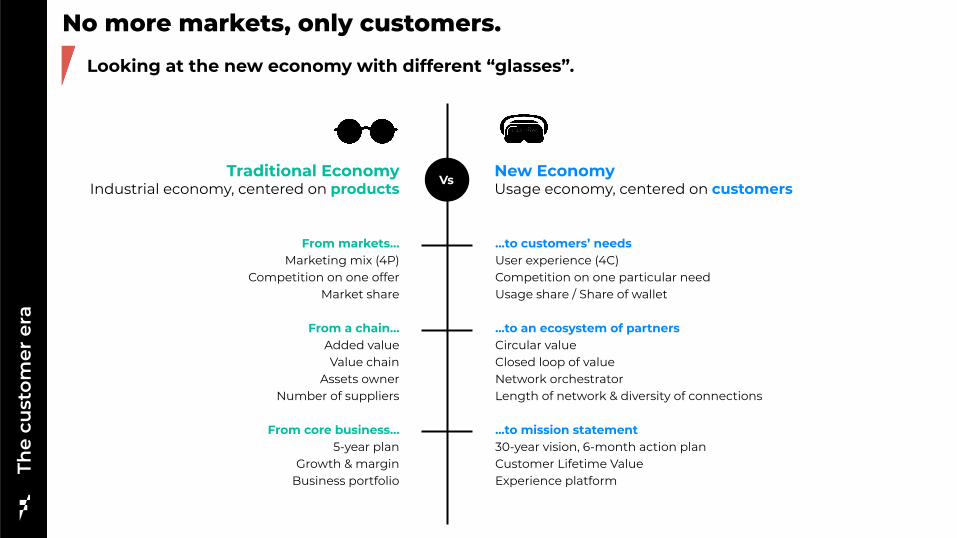
The
cust
omer
era
No more markets only customersLooking at the new economy with different ldquoglassesrdquo
Traditional EconomyIndustrial economy centered on products
New EconomyUsage economy centered on customersVs
From marketsMarketing mix (4P)
Competition on one offerMarket share
From a chainAdded valueValue chain
Assets ownerNumber of suppliers
From core business5-year plan
Growth amp marginBusiness portfolio
hellipto customersrsquo needsUser experience (4C)Competition on one particular needUsage share Share of wallet
to an ecosystem of partnersCircular valueClosed loop of valueNetwork orchestratorLength of network amp diversity of connections
to mission statement30-year vision 6-month action plan Customer Lifetime ValueExperience platform
The
cust
omer
era
Shifting from product management to customer experience Revenue based on customer spendings vs products
Revenue =
Unit price x
number of products
Revenue =
Revenue per customer
x number of customers
Total profit
Traditional management
ProductA
a
Margin A
+ +Margin B Margin C
=
CustomerSegment A Profit Seg A
+Profit Seg B
Profit Seg C
+
New management models
=
ProductB
ProductC
CustomerSegment B
CustomerSegment C
Customer centricity the cornerstone of the new modelrsquos successTh
e cu
stom
er e
ra
Leverage the direct access to customers via customized offers leading to high engagement
The Customer Is the Business Strategy
Collecting and analyzing exhaustive customer metrics is a driver of innovation enabling companies to experiment and create new solutions services or products and opening the path to customization
An innovation catalyst
New players are building a direct disintermediated relationship with their customers who are all the more willing to complete transactions when the relationship is qualitative Their model is based on economies of scale which leads to competitive prices
The bigger the added value for customers the better the network effect for the brand By building a wide user base with a high satisfaction rate new players gain more attractivity and become harder and harder to challenge
A strong pathway to revenue
Building high entry barriers
ldquoLeading with next-generation key performance indicatorsrdquostudy MIT Sloan Management Review x Google
Customer centricityat the heart of winning strategies
The
cust
omer
era
Selling subscriptions at a losshellip or notThe classical marketing amp commercial approach has usually been to minimize acquisition costs But with Primersquos generous advantages (free and soon 1-day delivery streaming etc) Amazon is looking to maximize its margins by investing in a growing base of customers spending more money more often and spending more time attached to the brand (rather than optimizing costs)
AmazonInvesting in its customer base to grow profits amp improve performance
Sources worldwide figures from Amazon Fortune Fabernovel analysis Beamer
[As of June 2019]
+ Prime subscription ($120 yearly)- Prime costs (Video amp music content delivery cost)
An investment that pays off
Amazon Prime
vs $600 non-Prime
$1400Annual spend per member
Retention rate after 1st year
After 2 years
93
= Greater net short-term costs for Prime
= Greater long-term profit for PrimeThe
cust
omer
era
Customers Sellers
+ offer+ service
+ business opportunities+ purchases
+ customer data+ revenue
+ products+ competition (lower prices)
Prime Video Music amp Reading
Free shipping etc
+ customers+ purchase frequency
+ sellers
98
I constantly remind our employees to be afraid to wake up every morning terrified Not of our competition but of our customers
Jeff Bezos
AmazonldquoAn obsessive compulsive focusrdquo on customers the first driver of success
Amazon follows 500 KPIs internally in real time of which 80 are customer centric Indeed delivering optimal satisfaction comes from a good knowledge of users
Thanks to these measures Amazon has been ranked number 1 in the American Customer Satisfaction Index for 8 years
1Contact rate(for each product)
The higher this rate is the lower the customer
satisfaction is
2Conversion rate(by product category)
Enables performance estimation of
recommendation algorithms
The
cust
omer
era
3Loading time
(of homepage)
ldquoA 01 second delay in page rendering can
translate into a 1 drop in customer activityrdquo
Jeff Bezos
4Delivery date
(of products)
of purchases that are delivered after the due
date
ldquoWersquore not satisfieduntil its 0rdquo
Jeff Bezos
NetflixLeveraging customer knowledge to increase engagement and generate revenue
75of the contentviewed on Netflix is based on personal recommendations
Netflix captures data corresponding to various problematicsWhen is the user watching the program WhereOn which device When does the user pause or switch off programsWhat do users research
To better understand users by cross-referencing data and identifying habits amp preferences
And drive strategic choices regarding content creation and licence buyout to provide better customized content
Relying on customer centric metrics
House of Cards a data-driven production
Netflix relied on user data showing their interests amp preferences to produce a
euro100m TV serie and create different trailers each targeting different customer segments
A long-lasting growing revenue (in $m)
The
cust
omer
era
Netflix leverages customer data to draw a specific profile for each user and design via complex algorithms a unique customized catalogue of movies for each which has been the base of the strong customer experience on which Netflix built its success
In a context of increasing competition among streaming services and of Netflix subscribers growth slowdown in Q2 customer centricity is all the more key to accentuate user engagement
Accepting short-term losses to win the long-term raceValue is not systematically linked to financial profit Spotify has convinced investors to accept to lose financial value in the short term in order to gain customer-related sustainability drivers (customer awareness market share loyalty share of customer usage etc)In Q1 19 Spotify was the first music streaming company to reach the 100m paying subscribers milestone
SpotifyCustomer asset as a driver of long-term sustainability boosting company valuation
Spotify EBITDA (eurom) Number of Premium subscribers (millions) Spotify Sales (eurom)
Enterprise value euro278 Md
High losses
Sources company reports Statista Factset estimates
But an exponential customer value And growing revenues
A strategy leading to a high market valuation (as of Q2 19)The
cust
omer
era
EV paying user euro258 subscription EV sales 4x
SlackBetting on customer experience to attract users and convert them into paying users
Slack relies on a freemium offer to grow its paying user baseSlackrsquos strategic bet has been to rely on a free offer to attract the most customers A free well-packaged and high-quality version of the solution is accessible to all and paying companies are only being charged for their members that are actually active on the platform This strategy encourages teams to onboard as many active users as possible with limited barriers to entry
Sources ldquoSlack the future workplacerdquo by Fabernovel Slack
Paying users total users ratio
30 (Aug 14)
39 (Feb 18)
Slack then relies on its frictionless user experience (customization to reflect onersquos company culture various services and apps) to encourages users to switch from free use of Slack to paying accounts and generate revenue
It has already proven its success with a paying userstotal users ratio growing impressively fast
The
cust
omer
era
Slack - Daily active users
A recurring revenue model or market potential can be identified as drivers for valuation
New
eco
nom
y n
ew K
PIs
Some customer-centric companies benefit from a high premium
The market long term growth potential as illustrated by Lyft amp Uber (new mobility) and Slack (New work organizations)
The revenue model Subscription models such as Slack and Netflix are highly valued as it ensures a longer relationship with the customer while advertising models such as Twitter or Snap have a lower EVUser
Source Factset data as of 13092019
Comparison of customer-centric companiesrsquo EVuser Two key drivers
FacebookA stable empire
The biggest user base (as of June 2019)
A very high ARPUOne of the highest thanks to Facebookrsquos various offers and its advertising revenue
Facebook has the highest EVUser among social media sector (excluding Tencent that reaches other sectors)
208$24 bn
$29
Comparison of 3 social media leaders
SnapA young community
offering some opportunities
A decent number of usersbut users who are not using the service much often
New growth opportunitiessuch as the implementation of video games and new filters boosting the user base and the potential of increasing ARPU
But an ARPU below sector averageFewer interactions of the user base with Snap lead to fewer revenues from advertising
48$500m$63
EVUserNo of users
ARPU
New
eco
nom
y n
ew K
PIs
Among the same sector valuations can be quite different
Twitter Increasing the ARPUof a stable user base
A smaller user baseof Monthly Active Users
But a higher amp increasing ARPUThe company shows a high EVUser due to its increasing ARPU
Twitter increased its Sales by 50 between 2017 and the end of 2019 with almost the same user base
92$336m
$8
Growth potential and visibility are critical for investors
The future potential of a company is its ability to find new levers of growth (revenue diversification new offers) which allows the company to improve the previous 2 pillars (with new offers comes new ARPU and a higher magnetism)
Potential of new territories
The capacity to give some insights on long term potential is key to engage them
The ability to have an elevated annual ARPU is highly correlated to the EVUser because it drives a companyrsquos revenue
The magnetism of a company is its ability to acquire and maintain its customer base thanks to their offer and targeted marketing
Monetization Magnetism
New
eco
nom
y n
ew K
PIs
We see the following components as central for the potential of long term value creation for business models It is key for valuation to engage investors on it That is where the use of customer KPIs plays a major role
The notion of customer goes beyondthe commercial transaction
The
cust
omer
era
The
cust
omer
era
In the digital economy everyone is a customer
New business models have redefined the customer concept and make no difference between paying customers amp non-paying ones
Indeed customer-centric companies strive to deliver the best possible experience to everyone to catch their attention and turn it into commitment and eventually into revenuehellip whether or not a transaction is made
The scope of the customer notion brings together all steps of the relationship with the company from being a visitor to being a non-paying user and finally a paying one
The customer scope
The customer scope goes from visitors to paying users
VisitorsAnyone who pays special attention to you
Non Paying UsersAnyone who uses your productservice but does not complete a purchase
Paying Users Users who complete
a purchase
Value Creation
Attract Engage Leverage
Awareness Reach of the company
Retentionloyal amp frequent users
MonetizationGenerating revenue from
users (paying or non-paying)
Activation Visitor commitment (giving informationhellip)
Acquisitionof visitors
Attention drawn
ConversionVisitors become users
(paying or non-paying)
The
cust
omer
era
The customer lifecycle from attention to revenue
Fueled by customer experience
The customer lifecycle from attention to revenue
(advertising affiliation) can measure their non-paying customers (users) and their paying customers (advertisers)
Models based on data monetization
B2C freemium models B2B2C models
can measure their paying customers (companies) and their non-paying customers (final users employees)
The
cust
omer
era
Depending on their business model companies can measure paying users non-paying ones or both
can measure their non-paying customers (users) and their paying customers (subscribers) analyzing engagement amp monetization of each
The
cust
omer
era
Experience is at the heart of the relationship with customersCustomer satisfaction must be the ultimate goal of customer experience
Customer experience has been a key differentiating factor for successful new business modelsIt relies on a few standards that have become a prerequisite
Critical in the digital era trust has emerged as one of the most crucial standards for customer experienceA strong relationship of trust relies on user protection regarding privacy andor safety companyrsquos ethics in terms of transparency
of information and power given to customers and more generally on the quality of the value proposition solving a real need
Indeed customers and more generally stakeholders penalize companies when trust is no longer respected Facebook faced a strong backlash after repeated data breaches and Apple amp Samsung were fined by Italian antitrust authorities for their planned
obsolescence practices considered dishonest for users
Efficiency
Gucci partnered with Farfetch to launch F90 a 90mn delivery service of
any Gucci article
Personalization
Spotify generates a unique track curation for each user thanks to its AI algorithms
Simplicity
Amazon offers additional services to provide a seamless experience in fashion Prime Wardrobe (members try before they buy) and Echo look
(clothing style analysis and recommendations)
Trust
Qwant differentiated from Google by insisting on user protection with its slogan ldquoThe search engine which respects your private liferdquo
The
cust
omer
era
Experience is the backbone of customer value
Delivering wow customer service to achieve a low churn
Zappos invests in its lsquoCustomer Loyalty teamrsquo to deliver a wow service via an overstaffing that enables ldquobreathing spacerdquo for employees in-depth training and a wide flexibility regarding scripts and calls timing By focusing on its customer service Zappos creates a strong emotional connection with customers which has proven successful in terms of acquisition and retention
Experience lays the foundation to attract customers and engage them in order to create value
Inversely a better knowledge of each step of the customer path can highlight potential areas of improvement of the customer experience
A better
CustomerExperience
Attractiveness
CustomerEngagement
Monetization
Improves Optimizes
ZAPPOS (Acquired by Amazon in 2009)
How to assess amp improve customer value2
If you donrsquot measure it you canrsquot improve it
Lord Kelvin
Ass
essi
ng
amp im
pro
vin
g c
ust
omer
val
ue
Evaluating each step of the customer lifecycleMeasuring your customer centricity through each step of the customer path
The framework to evaluate a companyrsquos customer capital integrates4 complementary key blocks of KPIs that retrace every aspect of the customer scope
Attract Engage Leverage
Customer Experience
Capacity to acquire amp
activate visitors
Capacity to convert them into
customers amp engage them
Capacity to monetize your
customers
Improves resultsRely on a seamless
and satisfying experience
The framework will reflect the maturity of onersquos company on its customer centricity
Attractiveness
is the first key phase in the relationship to customers
raising awareness and acquiring new visitors There is no monetization at this stage thus no direct impact on the PampL but it will condition the rest of the value chain
Ass
essi
ng
amp im
pro
vin
g c
ust
omer
val
ue
Assessing attractiveness
How well does the company manage to reach a wide audience
How many new visitors does the company attractHow well are they activated (from someone paying attention to someone who takes action)
Attracting new visitors and activating them
Awareness
Company marketing reachNb of followers on social media
Nb of views of content published
Nb of reactions (likes claps)
Nb of attendees to events
Nb of subscriptions to newsletters clubs
BrandProductservice magnetismNb of brandproductservice mentions researches
Brand knowledge(based on surveys amp perception studies)
Rate of adoption of the productsolution
Viral coefficient
Acquisition of visitorsNb of visitors (anyone who pays attention)Nb of visits on the websitephysical venueFirst contacts for business services(Direct Traffic + indirect traffic per channel)
Nb of single visitors (website physical venue for meetings) Gross adds net adds overall growth
Nb of customer requests about the productservice
ActivationNb of accountssessions created
Nb of proposals or demos required
Nb of app downloads
Social MediaFinancial services amp mobile payment
Nb of visitorsApp store rankingbased on number of downloads
Attract mdash Reporting use cases
Magnetism amp activation
KPI
Reporting
Tracking traffic Reach
bull As of March Snapchat reaches 90 of all 13-24 year-olds and 75 of all 13-34 year-olds in the USbull Our audience watching content on Discover every day has grown over 35 year-over-year
Square Investor Presentation May 2019 Asos 2018 financial report Snap 2019 Q1 amp Q2 earnings
Online fashion retailer
Ass
essi
ng
amp im
pro
vin
g c
ust
omer
val
ue
KPI
Reporting
AudienceAudience reach
KPI
Reporting
Engagement
will be critical regarding the potential of revenue and value creation driven by each customer
Once visitors engage with the productservice they become users Either paying or non-paying users (ex freemium models) participate to create value and impact the PampL directly or indirectly
Ass
essi
ng
amp im
pro
vin
g c
ust
omer
val
ue
Assessing EngagementConverting visitors into users and retaining them
Are visitors successfully converted into usersConversion
From visitors to users (Paying or non-paying)Total nb of active users (Gross adds Net addsTotal growth)Conversion rate (from visitors to users (paying or non-paying)Nb of contracts purchase membership abandonment rebound rate
From non-paying usersto paying usersConversion rate
Do these users become loyal and committed to the company
How many final users and how engaged are they
Retention
Paying amp non-paying usersDailymonthly active usersRetention rate Churn rateAverage lifespan of customers of returning customersUsage Nb of interactions average time spentvisits Nb of pages seen per session
Recurring users (paying)Average time between service contract renewals or purchasesNb of recurring buyers recurring purchase or service contracts (Nb of repeat purchasesnb of total purchases)
CommitmentNb of referrals amp sponsorshipsNb of new users drawnby existing users
Final user data
Nb of final usersTotal net adds gross addsgrowthDailymonthly active usersUser churn rate retention rate nb of returning users
UsageNb of interactions average time spentvisitsNb of pages seen per sessionFrequency of usageAverage lifespan of users
Engage mdash Reporting use casesA
sses
sing
amp im
prov
ing
cust
omer
val
ueA
sses
sin
g amp
imp
rovi
ng
cu
stom
er v
alu
e Telecom operatorFashion e-commerce company
Active usersPaying users
Conversion rate of first-time buyer into repeat buyer
From members to repeat buyers
KPI
Reporting
Users Retention of customers
Showroomprive 2018 results presentation SurveyMonkey yearly report 2018 VodafoneZiggo Presentation March 2019
Online surveys solution
KPI
Reporting
Churn rateNet adds
KPI
Reporting
Ass
essi
ng
amp im
pro
vin
g c
ust
omer
val
ue
Assessing LeverageMonetizing customers and maximizing value
Leveraging
means monetizingBy evaluating customersrsquo (including both visitors and users) impact on PampL value creation can be quantified monitored and optimized
What revenue is drawn directly from paying amp non-paying usersCustomer revenue
Direct revenue (paying users)Total amp average revenue per customer revenue from high value customer revenue from repeat customersARR per customerARPCOUpsell amp cross-sell rateRGUAverage basket value size GMV Nb of orders per customer
Indirect revenue (Non paying user)Total revenue per userARPUFCF per userARR per user
What are the costs for each user
What is the overall value generated by each user
Customer costs
Paying usersCAC (blended paid)Fulfillment cost ratioMarketing costs (channels costs Pay-per-click costs)
Non paying users costs (if applicable)User acquisition cost Marketing costs
Customer value creationEVcustomerCLV (per customer or per cohort)Contribution margin per customerContent created by customers
Cash impactFCF per customerPoor debt status Payment delays
Leverage mdash Reporting use casesA
sses
sing
amp im
prov
ing
cust
omer
val
ueA
sses
sin
g amp
imp
rovi
ng
cu
stom
er v
alu
e E-commerce companySocial media
Customer Acquisition CostAverage Revenue Per User (ARPU) worldwide amp per region
From members to repeat buyers
KPI
Reporting
Users Retention of customers
Facebook - Q2 2019 Results HelloFresh - Capital Markets Day 2018 Zalando Q2 2019 earnings
Meal kit delivery service
KPI
Reporting
Average ordersbasket sizeGMV per active customer
KPI
Reporting
Ass
essi
ng
amp im
pro
vin
g c
ust
omer
val
ue
Assessing ExperienceProviding a qualitative experience to maximize satisfaction
Customer experience
is a key enabler in the customer relation and will drive a companyrsquos ability to optimize its centricity and generate the best value from it Today most companies limit their attention to NPS or customer service indicators they need to push their analysis beyond
How well does the company know and adapt to its customersPersonalization
Knowledge of customersCustomer habits amp preference metricsCustomer profile
CurationAmount of dedicated contentAmount of customized products or servicesLevel of anticipation of choices and needsSingularity amp differentiation of the experience
How qualitative and seamless is the experience provided to customers
How positively do customers evaluate their global experience
Quality of experienceSimplicityFrictionless experience Ergonomy of the digital orphysical venue (app amp website loading time) and of the customer pathAdditional services Free trials return policies
EfficiencyCustomer relation First contact resolution and of resolved issues delay of answers and problem resolution timeDelivery amp delay timeInitial training time of employees
TrustUser protectionsafety of the productsolution data privacyEthics responsibility of the company respectful business practices
Satisfaction
Overall satisfactionProduct or service rankingNb of cancelled ordersCustomer Satisfaction ratescore (CSAT) NPSSocial sentiment ( of positive reaction positive vocabulary)
Experience satisfactionCustomer Effort Score Customer experience index (Forrester) System usability scaleLevel of emotion generated by the experience (Net Emotion Score)
Experience mdash Reporting use casesA
sses
sing
amp im
prov
ing
cust
omer
val
ueA
sses
sin
g amp
imp
rovi
ng
cu
stom
er v
alu
e Meal kit delivery serviceE-commerce conglomerate
Customer Acquisition CostAverage Revenue Per User (ARPU) worldwide amp per region
From membersto repeat buyers
KPI
Reporting
Users Retention of customers
Alibaba - Investor Day 2018 Europcar Mobility Group 2019 Capital Markets Day Blue Apron - Investor Presentation (Q3 18)
Rental amp mobility company
KPI
Reporting
Average ordersbasket sizeGMV per active customer
KPI
Reporting
Where do companies stand todayMain trends amp reporting practices
3
Wh
ere
do
com
pan
ies
stan
d t
oday
A lack of homogeneity in the customer-centric approach
General overview of CAC 40 companies compared to a panel of large digital natives(GAFAM social media e-commerce)
Deep dive on a sample of 35 various B2C companies both digital natives and traditional among a diversity of sectors Insurance Banking Social media Streaming Mobility Leisure Video games E-commerce Retail Food Tech Telecoms Energy
Mostly based on external reporting(2018-2019 results publications press releases)
With insights on internal reporting practices (Corporate blogs research articles white papers interviews)
Benchmark methodology Collection amp classification of customer-centric KPIs
In our study led about several French and international companies two main trends emerged
In general companies tend to report metrics related to all steps of the customer lifecycle (attractivity engagement leverage experience)
With a slight focus on customer engagement
A variety of KPIs
Customer-centric reporting practices still vary highly between digital players and more historical ones
Digital native companies were created with a stakeholder centric approach and a monitoringcommunication focused on customer KPIs from the beginning However even if other companies have initiated a deep transformation of their organization hardly any of them have really switched to a new reporting approach yet
A gap in reporting practices
Incumbents have not switched to a new reporting approach yet
Average number of customer KPIs reported
By digital nativecompanies
52By CAC 40companies
17Wh
ere
do
com
pan
ies
stan
d t
oday
Digital native companies leading on customer-centric reporting
Different models different practices
Customer-centric external reporting appears to be a standard for ldquodigital nativerdquo companies (Tech giants in e-commerce social media streaminghellip) However it remains less common among incumbents except for a few pioneering sectors like Telecoms
Communicateon at least one customer KPI
Number of customersSatisfaction metrics (mostly NPS)
Main KPIs
CAC 40 external reporting ldquoDigital nativesrdquo external reporting
0Have external
reporting mainly focused on
customer metrics
60
Such a gap can be explained by an uneven access to the customer different models and cultures and the difficulties encountered to change an historically different approach as well as the legacy business
Communicateon at least one customer KPI
Number of customers amp growthNumber of active customers ARPU
Main KPIs
50Have external
reporting mainly focused on
customer metrics
90
Overview of CAC 40 companies amp a panel of 10 large ldquodigital nativesrdquo
Areas of focus 25 of companies communicate on all 4 categories of KPIs
Wh
ere
do
com
pan
ies
stan
d t
oday
Companies focus on different aspects of the customer scope
94 of companies included in the benchmark report at least one metric related to Engage
Companies report KPIs related to all categories with a slight focus on engagement
A variety of KPIs reportedRepartition of KPIs collected
Number of customersReported by
53of benchmarkrsquos companies
Active customers 25
Total amp averagerevenue per user
Reported by 33
of benchmarkrsquos companies
Most reported KPIs
72 of companies included in the benchmark report at least one metric related to Experience
61 of companies included in the benchmark report at least one metric related to Leverage
42 of companies included in the benchmark report at least one metric related to Attract
Deep dive on a panel of thirty-five B2C companies with various industries and nationalities
Leverage28
Engage35
Attract14
Experience23
Number of ordersper customer
25
Customer profile 25
And for youThe path to customer KPI reporting
4
Selectingthe right KPIs
1
The path to customer-centric reportingTh
e p
ath
to
cust
omer
KP
I rep
orti
ng
A three-step plan to integrate customer KPIs into your reporting
Harnessing your KPIsInternally
amp externally
3Implementing
your KPIs
2
The
pat
h t
o cu
stom
er K
PI r
epor
tin
gSelecting the right KPIs
For each company its own KPIs adapted to its specific needs
A few examples of OMTM (one metric that matters)
OMTM Time between the 1st amp 2nd connexion
Strategic customer KPIs driving your financial performance
Focus on adequate KPIS providing actionable insights on your long-term financial performance
ldquoThe one metricthat mattersrdquo
Focus on the one metric that is most critical for your performance and that can be followed over time
Selecting therelevant metric
Temporality(can be contextualized)
RateRatio(comparable)
Intelligible(easily understandable)
Decision-oriented(actionable)
OMTM Nb of friends added in the 10 days after inscription
The
pat
h t
o cu
stom
er K
PI r
epor
tin
gImplementing your KPIs
A progressive process for a long-term approach
Complementary approachCustomer-centric reporting does not replace traditional financial indicators it brings complementary information in order to improve value creation
Starting internallyTo set sustainable customer-centric reporting start by following amp monitoring these KPIs internally before communicating externally on it
Engaging your teamsCEO CFO COO Operational teams Unit managers etc need to be familiarized with this new approach
Setting up tools amp guidelines to reach goalsSet specific objectives to be reached for every step of the way tools (automated data tracking etc) and a timeline of follow-up
Defining your level of action depending on your maturity on customer approachCollecting customer data analyzing to extract information andor leveraging data to engage actions
To optimize resource allocation
To segmentcustomers and identify new customer needs to
launch new offers
To monitorcompanyrsquos performance
The
pat
h t
o cu
stom
er K
PI r
epor
tin
gHarnessing your KPIs internally
Setting the internal purpose of your follow-up
Leveraging your KPIs internally
Who
Teams Executives Management Operationals
To monetize customer data to third
parties
The
pat
h t
o cu
stom
er K
PI r
epor
tin
gNike using Customer Lifetime Value to optimize resource allocation
Selecting and implementing CLV to better forecast customer value
Visitors paying or non paying users
ARPU (Direct amp Indirect revenue)Costscustomer (production servicehellip)
Number of customers
Profitper customer (PPC)
Customer lifespan (n)
CAC (Marketing advertising promotions hellip)
Acquisitioncost
1 ( 1 - retention rate)
Σk=1
nPPCk
(1 + WACC) k- CAC CLV =
Early 2018Nike acquires Zodiac
(consumer data analytics)to helps calculate CLV
In 2017Nike launches ldquoConsumer Direct Offenserdquo plan to improve direct
customer relation
The resultsBetter understanding of the
value of an individual customer enabled them to boost revenue
and retention with the right marketing recommendations
and offers
Customer Lifetime Valuation $Bn
The
pat
h t
o cu
stom
er K
PI r
epor
tin
gHarnessing your KPIs externally
Setting the external purpose of your follow-up
To measure your impact
To valueyour customer asset
and strategy
To educate on your model
Building on your KPIS externally
Who
Stakeholders Investors Partners Customers Media Regulators
Twitter valorizing customer capital to financial markets
+ 10Stock price
User acquisition KPI positively influences market reaction after disappointing forecasts
In the publication of its 2019 Q2 earnings Twitter published a
guidance adjusted downwards with revenue growth expected
to slow down and a disappointing forecast
And yet the companyrsquos market cap has been up following the
publication of its quarterly results driven by a better user acquisition growth which has pushed investors to focus on
mid-term potential
+ 5 millionDaily active users
The
pat
h t
o cu
stom
er K
PI r
epor
tin
g
Source MarketWatch July 26
The KPI toolbox for startersA few elements to begin with
New customer concerns and interests in social amp environmental issues impact the customer-business relationshipCustomers loyalty is now related to the companyrsquos external commitment
Stakeholders centricity soon to be integrated as a driver of customer value
The next move
Direct traffic Conversion rate Nb of active users Churn rate Recurring users ARPU CAC CLV NPS Customer habitsspecific to each company
Customer experience has been crucial for the success of new business models
It is key to gather experience KPIs on every step of the customer journey and to set specific objectives for each step
Offering the best experience tailored on customerrsquos specific needs must be an all-time preoccupation
The must haves
The underrated
game changer
The
pat
h t
o cu
stom
er K
PI r
epor
tin
g
Going further Download Fabernovel data mapping toolkit
The
pat
h t
o cu
stom
er K
PI r
epor
tin
g
Evaluate the level of maturity of your customer approach
And you how customer-centric are you
Click here for an overview of the index
To access the full version of the index you can contact us at axellericour-dumasfabernovelcom
Jean-Christophe LiaubetPartner
Jean-Christophe joined Fabernovel in 2017 as a Partner and founder of the valuation practice of the Group
With over 20 years of experience as an Equity Analyst and then Managing Director at Exane BNP Paribas he helps corporates make and value the best investment decisions
Gabrielle PeyrelongueValue analyst
Graduate from ESSEC Gabrielle joined Fabernovel in 2018 as a Value Analyst
She has worked within Fabernovel practices in Paris and San Francisco focusing on several projects including innovation strategy and new models of valuation based on extra financial criteria
Axelle Ricour-DumasValue Director
Axelle joined Fabernovel in 2018 as a Director after 20 years as Equity analyst at Cheuvreux Director of Investor Relations at IPSOS and Founder of her company MYFINADVICE
At Fabernovel she works on several projects of strategic advisory and has a strong expertise on the assessment and scoring of strategic projects
Jeacutereacutemy TaiumlebQuantitative analyst
Jeacutereacutemy joined Fabernovel as a quantitative analyst after graduating from CentraleSupelec and ESCP Europe
He specializes in quantitative finance and data analysis especially for tech companies and works on several projects including financial research financial modelling and ecosystem modelling
AuthorsC
red
its
An
nex
esKPIs glossary
ARPCOAverage Revenue Per Convergent Offer
ARPU (Average Revenue Per User)total of revenuestotal users ARRAnnual Recurring Revenue
Avg lifespan of customer (in months)1monthly churn
Cohort analysisanalysis based on consumersusers fragmentation
Customer acquisition cost total acquisition campaign costsnumber of new customers (CLVCAC ratio)
Customer concentrationbiggest customer revenuetotal revenue Customer Effort Scoremeasures satisfaction regarding the effort through customer journey
Contribution marginselling price per unit minus the variable cost per unit
LTV or CLV Customer lifetime valueARPU x 1CLV attrition rate Can also be based on FCF margins
DMT (Dureacutee Moyenne de Traitement)average processing time
First Call Resolutionfirst call resolution rate reflects customer service performance
Fulfillment Cost RatioFulfillment cost (Cost of sales amp distributionlogistic content creation services payments)revenue
GMV (Gross Merchandise Value)average nb of orders per customer x average basket size(after returns)
Marketing Cost Ratiomarketing costsrevenue
Net addsnew subscribers or customers - nb of unsubscribing
Net Promoter Score brand ambassadors - brand detractors
An
nex
esKPIs glossary
Network effectthe more a product is used the more its value increases(ex Facebook) each company has its own KPIs to assess it
Problem Resolution time(Sum of All Interactions for Total Resolved Issues - Total nb of Resolved Issues)
RGUsRevenue Generating Units (a customer can represent various RGUs for example when subscribing to a mobile phone contract + TV contract + internet rarr the customer represents 3 RGUs) Traffic sourcesdirect organichellip
Conversion ratepace at which the solutionproductservice has been adopted
Rebound ratecustomers leaving site without a chance to convert them
repeat purchaseNb of repeat purchasenb of total purchases
Requests rate with lowhigh level of added valuesimplerecurring customer service requests rate vs complex ones Retention rate(Nb of Customers at End of Period - nb of New Customers Acquired During Period)nb of Customers at Start of Period
Viralityspeed of productservice spread can be measured by k-value (average nb of invitations sent by each userconversion rate of invitations into new users)
An
nex
esCompanies analyzed in the benchmark
HelloFresh
Netflix
Orange
PSA
Showroomprive
Snap
Spotify
Square
Takewaycom
Twitch
Ubisoft
Vodafone
Zalando
Zynga
Activision Blizzard
Airbnb
AirFrance
Alibaba
Allianz
Amazon
Asos
Axa
Baidu
Blablacar
Blue Apron
BNP
Carrefour
Creacutedit Agricole
Easyjet
EDF
Engie
Europcar Mobility Group
Thank youCONTACT
Jean-Christophe LIAUBETPartner
+33 6 08 86 24 88jean-christopheliaubetFabernovelcom
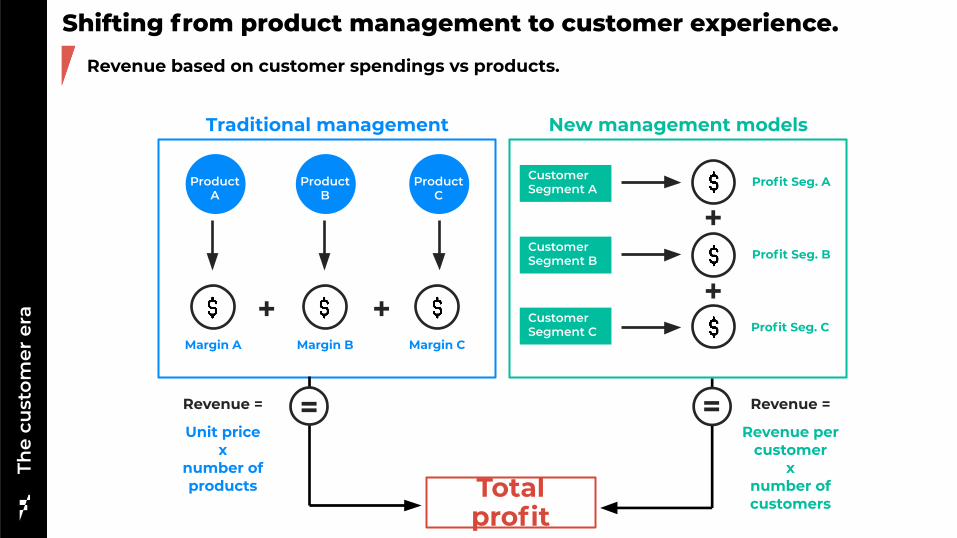
The
cust
omer
era
Shifting from product management to customer experience Revenue based on customer spendings vs products
Revenue =
Unit price x
number of products
Revenue =
Revenue per customer
x number of customers
Total profit
Traditional management
ProductA
a
Margin A
+ +Margin B Margin C
=
CustomerSegment A Profit Seg A
+Profit Seg B
Profit Seg C
+
New management models
=
ProductB
ProductC
CustomerSegment B
CustomerSegment C
Customer centricity the cornerstone of the new modelrsquos successTh
e cu
stom
er e
ra
Leverage the direct access to customers via customized offers leading to high engagement
The Customer Is the Business Strategy
Collecting and analyzing exhaustive customer metrics is a driver of innovation enabling companies to experiment and create new solutions services or products and opening the path to customization
An innovation catalyst
New players are building a direct disintermediated relationship with their customers who are all the more willing to complete transactions when the relationship is qualitative Their model is based on economies of scale which leads to competitive prices
The bigger the added value for customers the better the network effect for the brand By building a wide user base with a high satisfaction rate new players gain more attractivity and become harder and harder to challenge
A strong pathway to revenue
Building high entry barriers
ldquoLeading with next-generation key performance indicatorsrdquostudy MIT Sloan Management Review x Google
Customer centricityat the heart of winning strategies
The
cust
omer
era
Selling subscriptions at a losshellip or notThe classical marketing amp commercial approach has usually been to minimize acquisition costs But with Primersquos generous advantages (free and soon 1-day delivery streaming etc) Amazon is looking to maximize its margins by investing in a growing base of customers spending more money more often and spending more time attached to the brand (rather than optimizing costs)
AmazonInvesting in its customer base to grow profits amp improve performance
Sources worldwide figures from Amazon Fortune Fabernovel analysis Beamer
[As of June 2019]
+ Prime subscription ($120 yearly)- Prime costs (Video amp music content delivery cost)
An investment that pays off
Amazon Prime
vs $600 non-Prime
$1400Annual spend per member
Retention rate after 1st year
After 2 years
93
= Greater net short-term costs for Prime
= Greater long-term profit for PrimeThe
cust
omer
era
Customers Sellers
+ offer+ service
+ business opportunities+ purchases
+ customer data+ revenue
+ products+ competition (lower prices)
Prime Video Music amp Reading
Free shipping etc
+ customers+ purchase frequency
+ sellers
98
I constantly remind our employees to be afraid to wake up every morning terrified Not of our competition but of our customers
Jeff Bezos
AmazonldquoAn obsessive compulsive focusrdquo on customers the first driver of success
Amazon follows 500 KPIs internally in real time of which 80 are customer centric Indeed delivering optimal satisfaction comes from a good knowledge of users
Thanks to these measures Amazon has been ranked number 1 in the American Customer Satisfaction Index for 8 years
1Contact rate(for each product)
The higher this rate is the lower the customer
satisfaction is
2Conversion rate(by product category)
Enables performance estimation of
recommendation algorithms
The
cust
omer
era
3Loading time
(of homepage)
ldquoA 01 second delay in page rendering can
translate into a 1 drop in customer activityrdquo
Jeff Bezos
4Delivery date
(of products)
of purchases that are delivered after the due
date
ldquoWersquore not satisfieduntil its 0rdquo
Jeff Bezos
NetflixLeveraging customer knowledge to increase engagement and generate revenue
75of the contentviewed on Netflix is based on personal recommendations
Netflix captures data corresponding to various problematicsWhen is the user watching the program WhereOn which device When does the user pause or switch off programsWhat do users research
To better understand users by cross-referencing data and identifying habits amp preferences
And drive strategic choices regarding content creation and licence buyout to provide better customized content
Relying on customer centric metrics
House of Cards a data-driven production
Netflix relied on user data showing their interests amp preferences to produce a
euro100m TV serie and create different trailers each targeting different customer segments
A long-lasting growing revenue (in $m)
The
cust
omer
era
Netflix leverages customer data to draw a specific profile for each user and design via complex algorithms a unique customized catalogue of movies for each which has been the base of the strong customer experience on which Netflix built its success
In a context of increasing competition among streaming services and of Netflix subscribers growth slowdown in Q2 customer centricity is all the more key to accentuate user engagement
Accepting short-term losses to win the long-term raceValue is not systematically linked to financial profit Spotify has convinced investors to accept to lose financial value in the short term in order to gain customer-related sustainability drivers (customer awareness market share loyalty share of customer usage etc)In Q1 19 Spotify was the first music streaming company to reach the 100m paying subscribers milestone
SpotifyCustomer asset as a driver of long-term sustainability boosting company valuation
Spotify EBITDA (eurom) Number of Premium subscribers (millions) Spotify Sales (eurom)
Enterprise value euro278 Md
High losses
Sources company reports Statista Factset estimates
But an exponential customer value And growing revenues
A strategy leading to a high market valuation (as of Q2 19)The
cust
omer
era
EV paying user euro258 subscription EV sales 4x
SlackBetting on customer experience to attract users and convert them into paying users
Slack relies on a freemium offer to grow its paying user baseSlackrsquos strategic bet has been to rely on a free offer to attract the most customers A free well-packaged and high-quality version of the solution is accessible to all and paying companies are only being charged for their members that are actually active on the platform This strategy encourages teams to onboard as many active users as possible with limited barriers to entry
Sources ldquoSlack the future workplacerdquo by Fabernovel Slack
Paying users total users ratio
30 (Aug 14)
39 (Feb 18)
Slack then relies on its frictionless user experience (customization to reflect onersquos company culture various services and apps) to encourages users to switch from free use of Slack to paying accounts and generate revenue
It has already proven its success with a paying userstotal users ratio growing impressively fast
The
cust
omer
era
Slack - Daily active users
A recurring revenue model or market potential can be identified as drivers for valuation
New
eco
nom
y n
ew K
PIs
Some customer-centric companies benefit from a high premium
The market long term growth potential as illustrated by Lyft amp Uber (new mobility) and Slack (New work organizations)
The revenue model Subscription models such as Slack and Netflix are highly valued as it ensures a longer relationship with the customer while advertising models such as Twitter or Snap have a lower EVUser
Source Factset data as of 13092019
Comparison of customer-centric companiesrsquo EVuser Two key drivers
FacebookA stable empire
The biggest user base (as of June 2019)
A very high ARPUOne of the highest thanks to Facebookrsquos various offers and its advertising revenue
Facebook has the highest EVUser among social media sector (excluding Tencent that reaches other sectors)
208$24 bn
$29
Comparison of 3 social media leaders
SnapA young community
offering some opportunities
A decent number of usersbut users who are not using the service much often
New growth opportunitiessuch as the implementation of video games and new filters boosting the user base and the potential of increasing ARPU
But an ARPU below sector averageFewer interactions of the user base with Snap lead to fewer revenues from advertising
48$500m$63
EVUserNo of users
ARPU
New
eco
nom
y n
ew K
PIs
Among the same sector valuations can be quite different
Twitter Increasing the ARPUof a stable user base
A smaller user baseof Monthly Active Users
But a higher amp increasing ARPUThe company shows a high EVUser due to its increasing ARPU
Twitter increased its Sales by 50 between 2017 and the end of 2019 with almost the same user base
92$336m
$8
Growth potential and visibility are critical for investors
The future potential of a company is its ability to find new levers of growth (revenue diversification new offers) which allows the company to improve the previous 2 pillars (with new offers comes new ARPU and a higher magnetism)
Potential of new territories
The capacity to give some insights on long term potential is key to engage them
The ability to have an elevated annual ARPU is highly correlated to the EVUser because it drives a companyrsquos revenue
The magnetism of a company is its ability to acquire and maintain its customer base thanks to their offer and targeted marketing
Monetization Magnetism
New
eco
nom
y n
ew K
PIs
We see the following components as central for the potential of long term value creation for business models It is key for valuation to engage investors on it That is where the use of customer KPIs plays a major role
The notion of customer goes beyondthe commercial transaction
The
cust
omer
era
The
cust
omer
era
In the digital economy everyone is a customer
New business models have redefined the customer concept and make no difference between paying customers amp non-paying ones
Indeed customer-centric companies strive to deliver the best possible experience to everyone to catch their attention and turn it into commitment and eventually into revenuehellip whether or not a transaction is made
The scope of the customer notion brings together all steps of the relationship with the company from being a visitor to being a non-paying user and finally a paying one
The customer scope
The customer scope goes from visitors to paying users
VisitorsAnyone who pays special attention to you
Non Paying UsersAnyone who uses your productservice but does not complete a purchase
Paying Users Users who complete
a purchase
Value Creation
Attract Engage Leverage
Awareness Reach of the company
Retentionloyal amp frequent users
MonetizationGenerating revenue from
users (paying or non-paying)
Activation Visitor commitment (giving informationhellip)
Acquisitionof visitors
Attention drawn
ConversionVisitors become users
(paying or non-paying)
The
cust
omer
era
The customer lifecycle from attention to revenue
Fueled by customer experience
The customer lifecycle from attention to revenue
(advertising affiliation) can measure their non-paying customers (users) and their paying customers (advertisers)
Models based on data monetization
B2C freemium models B2B2C models
can measure their paying customers (companies) and their non-paying customers (final users employees)
The
cust
omer
era
Depending on their business model companies can measure paying users non-paying ones or both
can measure their non-paying customers (users) and their paying customers (subscribers) analyzing engagement amp monetization of each
The
cust
omer
era
Experience is at the heart of the relationship with customersCustomer satisfaction must be the ultimate goal of customer experience
Customer experience has been a key differentiating factor for successful new business modelsIt relies on a few standards that have become a prerequisite
Critical in the digital era trust has emerged as one of the most crucial standards for customer experienceA strong relationship of trust relies on user protection regarding privacy andor safety companyrsquos ethics in terms of transparency
of information and power given to customers and more generally on the quality of the value proposition solving a real need
Indeed customers and more generally stakeholders penalize companies when trust is no longer respected Facebook faced a strong backlash after repeated data breaches and Apple amp Samsung were fined by Italian antitrust authorities for their planned
obsolescence practices considered dishonest for users
Efficiency
Gucci partnered with Farfetch to launch F90 a 90mn delivery service of
any Gucci article
Personalization
Spotify generates a unique track curation for each user thanks to its AI algorithms
Simplicity
Amazon offers additional services to provide a seamless experience in fashion Prime Wardrobe (members try before they buy) and Echo look
(clothing style analysis and recommendations)
Trust
Qwant differentiated from Google by insisting on user protection with its slogan ldquoThe search engine which respects your private liferdquo
The
cust
omer
era
Experience is the backbone of customer value
Delivering wow customer service to achieve a low churn
Zappos invests in its lsquoCustomer Loyalty teamrsquo to deliver a wow service via an overstaffing that enables ldquobreathing spacerdquo for employees in-depth training and a wide flexibility regarding scripts and calls timing By focusing on its customer service Zappos creates a strong emotional connection with customers which has proven successful in terms of acquisition and retention
Experience lays the foundation to attract customers and engage them in order to create value
Inversely a better knowledge of each step of the customer path can highlight potential areas of improvement of the customer experience
A better
CustomerExperience
Attractiveness
CustomerEngagement
Monetization
Improves Optimizes
ZAPPOS (Acquired by Amazon in 2009)
How to assess amp improve customer value2
If you donrsquot measure it you canrsquot improve it
Lord Kelvin
Ass
essi
ng
amp im
pro
vin
g c
ust
omer
val
ue
Evaluating each step of the customer lifecycleMeasuring your customer centricity through each step of the customer path
The framework to evaluate a companyrsquos customer capital integrates4 complementary key blocks of KPIs that retrace every aspect of the customer scope
Attract Engage Leverage
Customer Experience
Capacity to acquire amp
activate visitors
Capacity to convert them into
customers amp engage them
Capacity to monetize your
customers
Improves resultsRely on a seamless
and satisfying experience
The framework will reflect the maturity of onersquos company on its customer centricity
Attractiveness
is the first key phase in the relationship to customers
raising awareness and acquiring new visitors There is no monetization at this stage thus no direct impact on the PampL but it will condition the rest of the value chain
Ass
essi
ng
amp im
pro
vin
g c
ust
omer
val
ue
Assessing attractiveness
How well does the company manage to reach a wide audience
How many new visitors does the company attractHow well are they activated (from someone paying attention to someone who takes action)
Attracting new visitors and activating them
Awareness
Company marketing reachNb of followers on social media
Nb of views of content published
Nb of reactions (likes claps)
Nb of attendees to events
Nb of subscriptions to newsletters clubs
BrandProductservice magnetismNb of brandproductservice mentions researches
Brand knowledge(based on surveys amp perception studies)
Rate of adoption of the productsolution
Viral coefficient
Acquisition of visitorsNb of visitors (anyone who pays attention)Nb of visits on the websitephysical venueFirst contacts for business services(Direct Traffic + indirect traffic per channel)
Nb of single visitors (website physical venue for meetings) Gross adds net adds overall growth
Nb of customer requests about the productservice
ActivationNb of accountssessions created
Nb of proposals or demos required
Nb of app downloads
Social MediaFinancial services amp mobile payment
Nb of visitorsApp store rankingbased on number of downloads
Attract mdash Reporting use cases
Magnetism amp activation
KPI
Reporting
Tracking traffic Reach
bull As of March Snapchat reaches 90 of all 13-24 year-olds and 75 of all 13-34 year-olds in the USbull Our audience watching content on Discover every day has grown over 35 year-over-year
Square Investor Presentation May 2019 Asos 2018 financial report Snap 2019 Q1 amp Q2 earnings
Online fashion retailer
Ass
essi
ng
amp im
pro
vin
g c
ust
omer
val
ue
KPI
Reporting
AudienceAudience reach
KPI
Reporting
Engagement
will be critical regarding the potential of revenue and value creation driven by each customer
Once visitors engage with the productservice they become users Either paying or non-paying users (ex freemium models) participate to create value and impact the PampL directly or indirectly
Ass
essi
ng
amp im
pro
vin
g c
ust
omer
val
ue
Assessing EngagementConverting visitors into users and retaining them
Are visitors successfully converted into usersConversion
From visitors to users (Paying or non-paying)Total nb of active users (Gross adds Net addsTotal growth)Conversion rate (from visitors to users (paying or non-paying)Nb of contracts purchase membership abandonment rebound rate
From non-paying usersto paying usersConversion rate
Do these users become loyal and committed to the company
How many final users and how engaged are they
Retention
Paying amp non-paying usersDailymonthly active usersRetention rate Churn rateAverage lifespan of customers of returning customersUsage Nb of interactions average time spentvisits Nb of pages seen per session
Recurring users (paying)Average time between service contract renewals or purchasesNb of recurring buyers recurring purchase or service contracts (Nb of repeat purchasesnb of total purchases)
CommitmentNb of referrals amp sponsorshipsNb of new users drawnby existing users
Final user data
Nb of final usersTotal net adds gross addsgrowthDailymonthly active usersUser churn rate retention rate nb of returning users
UsageNb of interactions average time spentvisitsNb of pages seen per sessionFrequency of usageAverage lifespan of users
Engage mdash Reporting use casesA
sses
sing
amp im
prov
ing
cust
omer
val
ueA
sses
sin
g amp
imp
rovi
ng
cu
stom
er v
alu
e Telecom operatorFashion e-commerce company
Active usersPaying users
Conversion rate of first-time buyer into repeat buyer
From members to repeat buyers
KPI
Reporting
Users Retention of customers
Showroomprive 2018 results presentation SurveyMonkey yearly report 2018 VodafoneZiggo Presentation March 2019
Online surveys solution
KPI
Reporting
Churn rateNet adds
KPI
Reporting
Ass
essi
ng
amp im
pro
vin
g c
ust
omer
val
ue
Assessing LeverageMonetizing customers and maximizing value
Leveraging
means monetizingBy evaluating customersrsquo (including both visitors and users) impact on PampL value creation can be quantified monitored and optimized
What revenue is drawn directly from paying amp non-paying usersCustomer revenue
Direct revenue (paying users)Total amp average revenue per customer revenue from high value customer revenue from repeat customersARR per customerARPCOUpsell amp cross-sell rateRGUAverage basket value size GMV Nb of orders per customer
Indirect revenue (Non paying user)Total revenue per userARPUFCF per userARR per user
What are the costs for each user
What is the overall value generated by each user
Customer costs
Paying usersCAC (blended paid)Fulfillment cost ratioMarketing costs (channels costs Pay-per-click costs)
Non paying users costs (if applicable)User acquisition cost Marketing costs
Customer value creationEVcustomerCLV (per customer or per cohort)Contribution margin per customerContent created by customers
Cash impactFCF per customerPoor debt status Payment delays
Leverage mdash Reporting use casesA
sses
sing
amp im
prov
ing
cust
omer
val
ueA
sses
sin
g amp
imp
rovi
ng
cu
stom
er v
alu
e E-commerce companySocial media
Customer Acquisition CostAverage Revenue Per User (ARPU) worldwide amp per region
From members to repeat buyers
KPI
Reporting
Users Retention of customers
Facebook - Q2 2019 Results HelloFresh - Capital Markets Day 2018 Zalando Q2 2019 earnings
Meal kit delivery service
KPI
Reporting
Average ordersbasket sizeGMV per active customer
KPI
Reporting
Ass
essi
ng
amp im
pro
vin
g c
ust
omer
val
ue
Assessing ExperienceProviding a qualitative experience to maximize satisfaction
Customer experience
is a key enabler in the customer relation and will drive a companyrsquos ability to optimize its centricity and generate the best value from it Today most companies limit their attention to NPS or customer service indicators they need to push their analysis beyond
How well does the company know and adapt to its customersPersonalization
Knowledge of customersCustomer habits amp preference metricsCustomer profile
CurationAmount of dedicated contentAmount of customized products or servicesLevel of anticipation of choices and needsSingularity amp differentiation of the experience
How qualitative and seamless is the experience provided to customers
How positively do customers evaluate their global experience
Quality of experienceSimplicityFrictionless experience Ergonomy of the digital orphysical venue (app amp website loading time) and of the customer pathAdditional services Free trials return policies
EfficiencyCustomer relation First contact resolution and of resolved issues delay of answers and problem resolution timeDelivery amp delay timeInitial training time of employees
TrustUser protectionsafety of the productsolution data privacyEthics responsibility of the company respectful business practices
Satisfaction
Overall satisfactionProduct or service rankingNb of cancelled ordersCustomer Satisfaction ratescore (CSAT) NPSSocial sentiment ( of positive reaction positive vocabulary)
Experience satisfactionCustomer Effort Score Customer experience index (Forrester) System usability scaleLevel of emotion generated by the experience (Net Emotion Score)
Experience mdash Reporting use casesA
sses
sing
amp im
prov
ing
cust
omer
val
ueA
sses
sin
g amp
imp
rovi
ng
cu
stom
er v
alu
e Meal kit delivery serviceE-commerce conglomerate
Customer Acquisition CostAverage Revenue Per User (ARPU) worldwide amp per region
From membersto repeat buyers
KPI
Reporting
Users Retention of customers
Alibaba - Investor Day 2018 Europcar Mobility Group 2019 Capital Markets Day Blue Apron - Investor Presentation (Q3 18)
Rental amp mobility company
KPI
Reporting
Average ordersbasket sizeGMV per active customer
KPI
Reporting
Where do companies stand todayMain trends amp reporting practices
3
Wh
ere
do
com
pan
ies
stan
d t
oday
A lack of homogeneity in the customer-centric approach
General overview of CAC 40 companies compared to a panel of large digital natives(GAFAM social media e-commerce)
Deep dive on a sample of 35 various B2C companies both digital natives and traditional among a diversity of sectors Insurance Banking Social media Streaming Mobility Leisure Video games E-commerce Retail Food Tech Telecoms Energy
Mostly based on external reporting(2018-2019 results publications press releases)
With insights on internal reporting practices (Corporate blogs research articles white papers interviews)
Benchmark methodology Collection amp classification of customer-centric KPIs
In our study led about several French and international companies two main trends emerged
In general companies tend to report metrics related to all steps of the customer lifecycle (attractivity engagement leverage experience)
With a slight focus on customer engagement
A variety of KPIs
Customer-centric reporting practices still vary highly between digital players and more historical ones
Digital native companies were created with a stakeholder centric approach and a monitoringcommunication focused on customer KPIs from the beginning However even if other companies have initiated a deep transformation of their organization hardly any of them have really switched to a new reporting approach yet
A gap in reporting practices
Incumbents have not switched to a new reporting approach yet
Average number of customer KPIs reported
By digital nativecompanies
52By CAC 40companies
17Wh
ere
do
com
pan
ies
stan
d t
oday
Digital native companies leading on customer-centric reporting
Different models different practices
Customer-centric external reporting appears to be a standard for ldquodigital nativerdquo companies (Tech giants in e-commerce social media streaminghellip) However it remains less common among incumbents except for a few pioneering sectors like Telecoms
Communicateon at least one customer KPI
Number of customersSatisfaction metrics (mostly NPS)
Main KPIs
CAC 40 external reporting ldquoDigital nativesrdquo external reporting
0Have external
reporting mainly focused on
customer metrics
60
Such a gap can be explained by an uneven access to the customer different models and cultures and the difficulties encountered to change an historically different approach as well as the legacy business
Communicateon at least one customer KPI
Number of customers amp growthNumber of active customers ARPU
Main KPIs
50Have external
reporting mainly focused on
customer metrics
90
Overview of CAC 40 companies amp a panel of 10 large ldquodigital nativesrdquo
Areas of focus 25 of companies communicate on all 4 categories of KPIs
Wh
ere
do
com
pan
ies
stan
d t
oday
Companies focus on different aspects of the customer scope
94 of companies included in the benchmark report at least one metric related to Engage
Companies report KPIs related to all categories with a slight focus on engagement
A variety of KPIs reportedRepartition of KPIs collected
Number of customersReported by
53of benchmarkrsquos companies
Active customers 25
Total amp averagerevenue per user
Reported by 33
of benchmarkrsquos companies
Most reported KPIs
72 of companies included in the benchmark report at least one metric related to Experience
61 of companies included in the benchmark report at least one metric related to Leverage
42 of companies included in the benchmark report at least one metric related to Attract
Deep dive on a panel of thirty-five B2C companies with various industries and nationalities
Leverage28
Engage35
Attract14
Experience23
Number of ordersper customer
25
Customer profile 25
And for youThe path to customer KPI reporting
4
Selectingthe right KPIs
1
The path to customer-centric reportingTh
e p
ath
to
cust
omer
KP
I rep
orti
ng
A three-step plan to integrate customer KPIs into your reporting
Harnessing your KPIsInternally
amp externally
3Implementing
your KPIs
2
The
pat
h t
o cu
stom
er K
PI r
epor
tin
gSelecting the right KPIs
For each company its own KPIs adapted to its specific needs
A few examples of OMTM (one metric that matters)
OMTM Time between the 1st amp 2nd connexion
Strategic customer KPIs driving your financial performance
Focus on adequate KPIS providing actionable insights on your long-term financial performance
ldquoThe one metricthat mattersrdquo
Focus on the one metric that is most critical for your performance and that can be followed over time
Selecting therelevant metric
Temporality(can be contextualized)
RateRatio(comparable)
Intelligible(easily understandable)
Decision-oriented(actionable)
OMTM Nb of friends added in the 10 days after inscription
The
pat
h t
o cu
stom
er K
PI r
epor
tin
gImplementing your KPIs
A progressive process for a long-term approach
Complementary approachCustomer-centric reporting does not replace traditional financial indicators it brings complementary information in order to improve value creation
Starting internallyTo set sustainable customer-centric reporting start by following amp monitoring these KPIs internally before communicating externally on it
Engaging your teamsCEO CFO COO Operational teams Unit managers etc need to be familiarized with this new approach
Setting up tools amp guidelines to reach goalsSet specific objectives to be reached for every step of the way tools (automated data tracking etc) and a timeline of follow-up
Defining your level of action depending on your maturity on customer approachCollecting customer data analyzing to extract information andor leveraging data to engage actions
To optimize resource allocation
To segmentcustomers and identify new customer needs to
launch new offers
To monitorcompanyrsquos performance
The
pat
h t
o cu
stom
er K
PI r
epor
tin
gHarnessing your KPIs internally
Setting the internal purpose of your follow-up
Leveraging your KPIs internally
Who
Teams Executives Management Operationals
To monetize customer data to third
parties
The
pat
h t
o cu
stom
er K
PI r
epor
tin
gNike using Customer Lifetime Value to optimize resource allocation
Selecting and implementing CLV to better forecast customer value
Visitors paying or non paying users
ARPU (Direct amp Indirect revenue)Costscustomer (production servicehellip)
Number of customers
Profitper customer (PPC)
Customer lifespan (n)
CAC (Marketing advertising promotions hellip)
Acquisitioncost
1 ( 1 - retention rate)
Σk=1
nPPCk
(1 + WACC) k- CAC CLV =
Early 2018Nike acquires Zodiac
(consumer data analytics)to helps calculate CLV
In 2017Nike launches ldquoConsumer Direct Offenserdquo plan to improve direct
customer relation
The resultsBetter understanding of the
value of an individual customer enabled them to boost revenue
and retention with the right marketing recommendations
and offers
Customer Lifetime Valuation $Bn
The
pat
h t
o cu
stom
er K
PI r
epor
tin
gHarnessing your KPIs externally
Setting the external purpose of your follow-up
To measure your impact
To valueyour customer asset
and strategy
To educate on your model
Building on your KPIS externally
Who
Stakeholders Investors Partners Customers Media Regulators
Twitter valorizing customer capital to financial markets
+ 10Stock price
User acquisition KPI positively influences market reaction after disappointing forecasts
In the publication of its 2019 Q2 earnings Twitter published a
guidance adjusted downwards with revenue growth expected
to slow down and a disappointing forecast
And yet the companyrsquos market cap has been up following the
publication of its quarterly results driven by a better user acquisition growth which has pushed investors to focus on
mid-term potential
+ 5 millionDaily active users
The
pat
h t
o cu
stom
er K
PI r
epor
tin
g
Source MarketWatch July 26
The KPI toolbox for startersA few elements to begin with
New customer concerns and interests in social amp environmental issues impact the customer-business relationshipCustomers loyalty is now related to the companyrsquos external commitment
Stakeholders centricity soon to be integrated as a driver of customer value
The next move
Direct traffic Conversion rate Nb of active users Churn rate Recurring users ARPU CAC CLV NPS Customer habitsspecific to each company
Customer experience has been crucial for the success of new business models
It is key to gather experience KPIs on every step of the customer journey and to set specific objectives for each step
Offering the best experience tailored on customerrsquos specific needs must be an all-time preoccupation
The must haves
The underrated
game changer
The
pat
h t
o cu
stom
er K
PI r
epor
tin
g
Going further Download Fabernovel data mapping toolkit
The
pat
h t
o cu
stom
er K
PI r
epor
tin
g
Evaluate the level of maturity of your customer approach
And you how customer-centric are you
Click here for an overview of the index
To access the full version of the index you can contact us at axellericour-dumasfabernovelcom
Jean-Christophe LiaubetPartner
Jean-Christophe joined Fabernovel in 2017 as a Partner and founder of the valuation practice of the Group
With over 20 years of experience as an Equity Analyst and then Managing Director at Exane BNP Paribas he helps corporates make and value the best investment decisions
Gabrielle PeyrelongueValue analyst
Graduate from ESSEC Gabrielle joined Fabernovel in 2018 as a Value Analyst
She has worked within Fabernovel practices in Paris and San Francisco focusing on several projects including innovation strategy and new models of valuation based on extra financial criteria
Axelle Ricour-DumasValue Director
Axelle joined Fabernovel in 2018 as a Director after 20 years as Equity analyst at Cheuvreux Director of Investor Relations at IPSOS and Founder of her company MYFINADVICE
At Fabernovel she works on several projects of strategic advisory and has a strong expertise on the assessment and scoring of strategic projects
Jeacutereacutemy TaiumlebQuantitative analyst
Jeacutereacutemy joined Fabernovel as a quantitative analyst after graduating from CentraleSupelec and ESCP Europe
He specializes in quantitative finance and data analysis especially for tech companies and works on several projects including financial research financial modelling and ecosystem modelling
AuthorsC
red
its
An
nex
esKPIs glossary
ARPCOAverage Revenue Per Convergent Offer
ARPU (Average Revenue Per User)total of revenuestotal users ARRAnnual Recurring Revenue
Avg lifespan of customer (in months)1monthly churn
Cohort analysisanalysis based on consumersusers fragmentation
Customer acquisition cost total acquisition campaign costsnumber of new customers (CLVCAC ratio)
Customer concentrationbiggest customer revenuetotal revenue Customer Effort Scoremeasures satisfaction regarding the effort through customer journey
Contribution marginselling price per unit minus the variable cost per unit
LTV or CLV Customer lifetime valueARPU x 1CLV attrition rate Can also be based on FCF margins
DMT (Dureacutee Moyenne de Traitement)average processing time
First Call Resolutionfirst call resolution rate reflects customer service performance
Fulfillment Cost RatioFulfillment cost (Cost of sales amp distributionlogistic content creation services payments)revenue
GMV (Gross Merchandise Value)average nb of orders per customer x average basket size(after returns)
Marketing Cost Ratiomarketing costsrevenue
Net addsnew subscribers or customers - nb of unsubscribing
Net Promoter Score brand ambassadors - brand detractors
An
nex
esKPIs glossary
Network effectthe more a product is used the more its value increases(ex Facebook) each company has its own KPIs to assess it
Problem Resolution time(Sum of All Interactions for Total Resolved Issues - Total nb of Resolved Issues)
RGUsRevenue Generating Units (a customer can represent various RGUs for example when subscribing to a mobile phone contract + TV contract + internet rarr the customer represents 3 RGUs) Traffic sourcesdirect organichellip
Conversion ratepace at which the solutionproductservice has been adopted
Rebound ratecustomers leaving site without a chance to convert them
repeat purchaseNb of repeat purchasenb of total purchases
Requests rate with lowhigh level of added valuesimplerecurring customer service requests rate vs complex ones Retention rate(Nb of Customers at End of Period - nb of New Customers Acquired During Period)nb of Customers at Start of Period
Viralityspeed of productservice spread can be measured by k-value (average nb of invitations sent by each userconversion rate of invitations into new users)
An
nex
esCompanies analyzed in the benchmark
HelloFresh
Netflix
Orange
PSA
Showroomprive
Snap
Spotify
Square
Takewaycom
Twitch
Ubisoft
Vodafone
Zalando
Zynga
Activision Blizzard
Airbnb
AirFrance
Alibaba
Allianz
Amazon
Asos
Axa
Baidu
Blablacar
Blue Apron
BNP
Carrefour
Creacutedit Agricole
Easyjet
EDF
Engie
Europcar Mobility Group
Thank youCONTACT
Jean-Christophe LIAUBETPartner
+33 6 08 86 24 88jean-christopheliaubetFabernovelcom
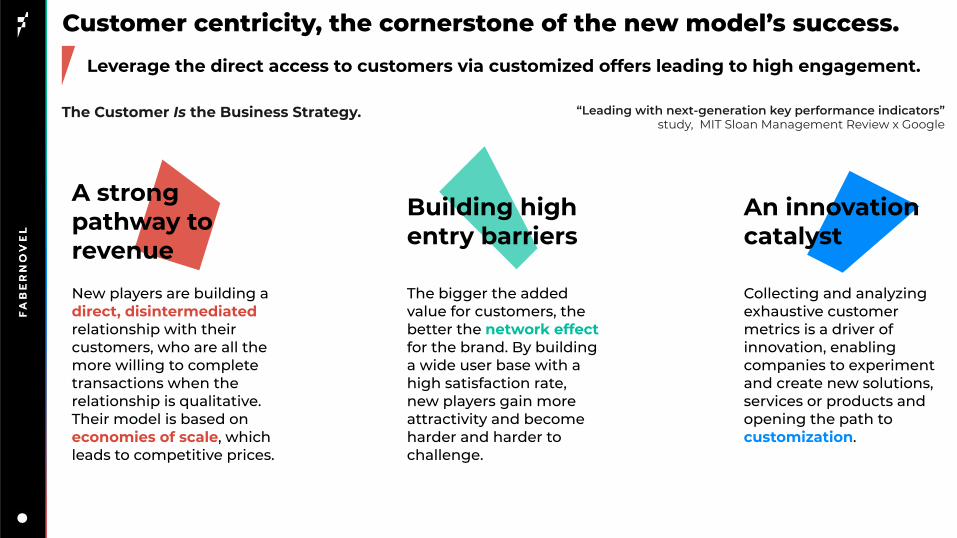
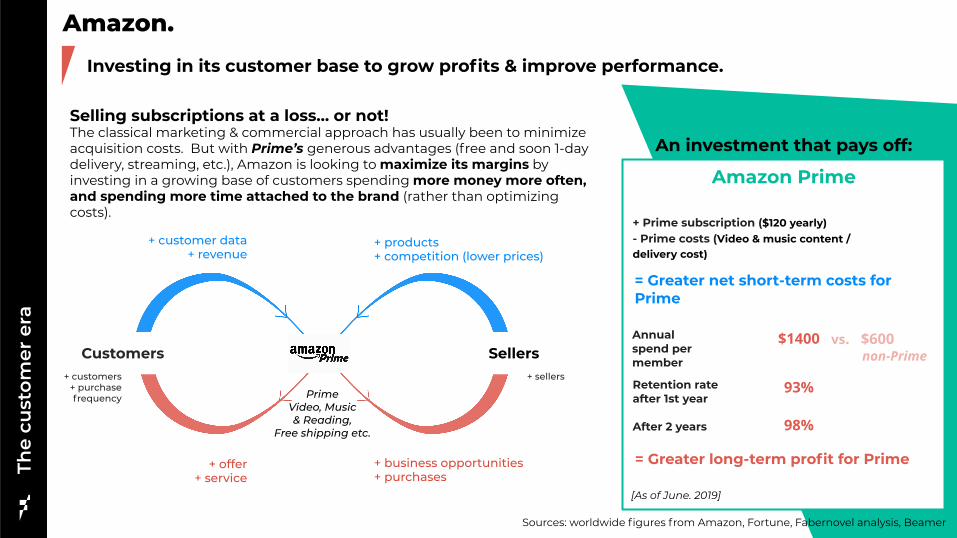
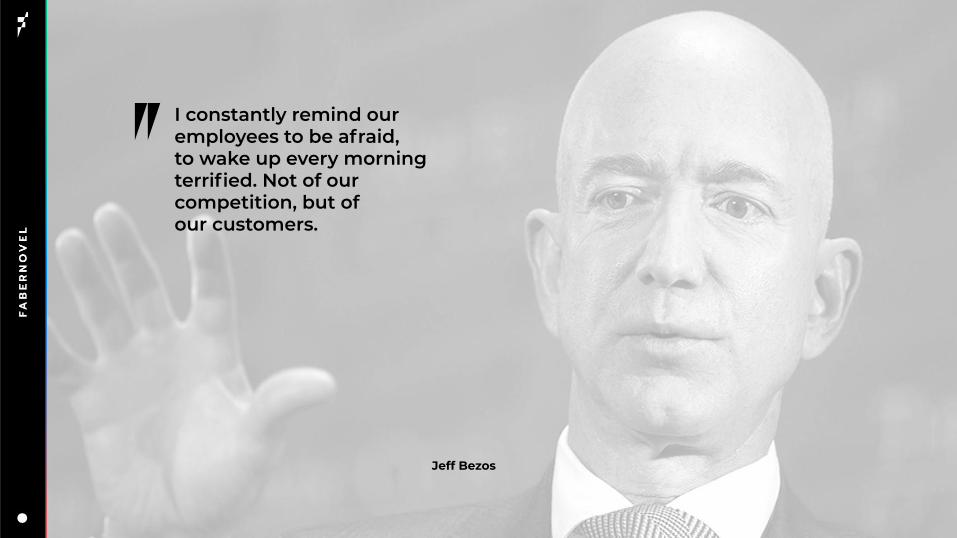
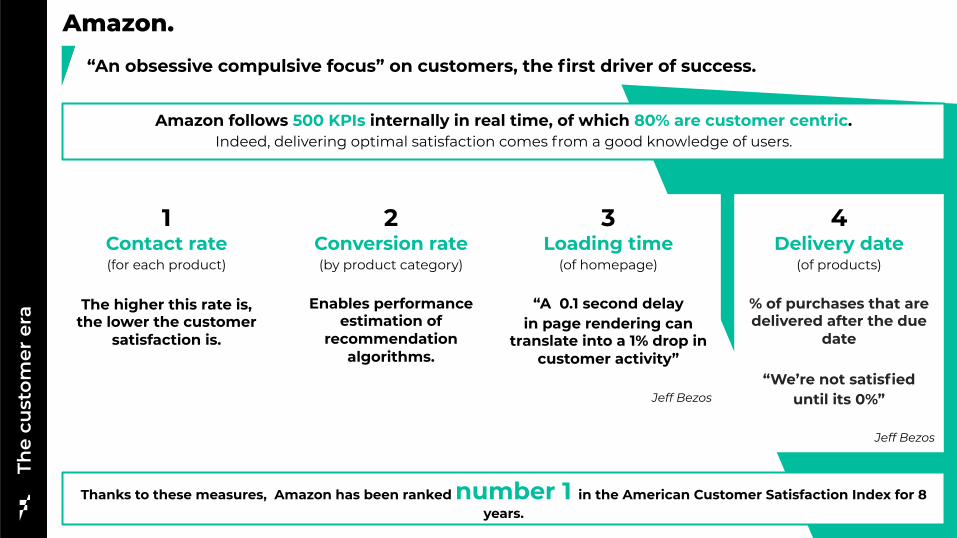
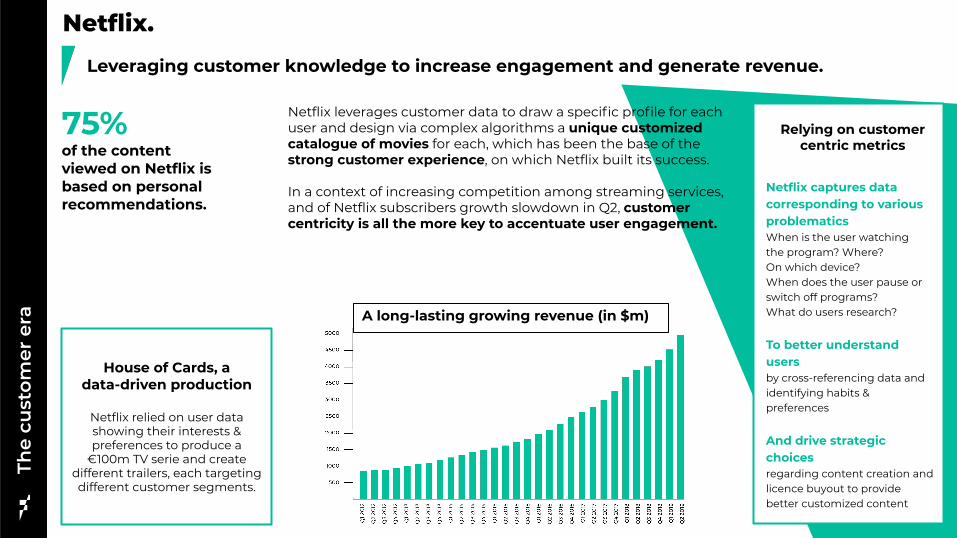
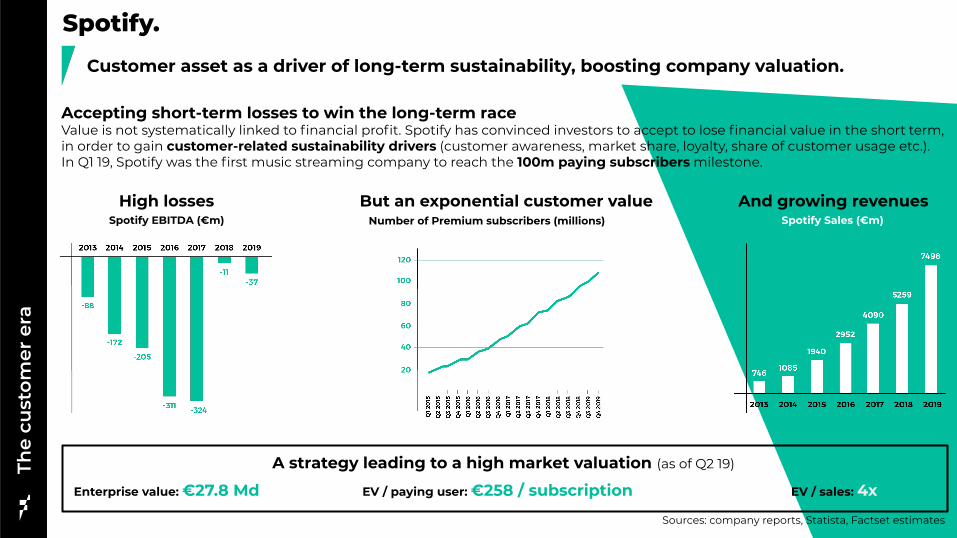
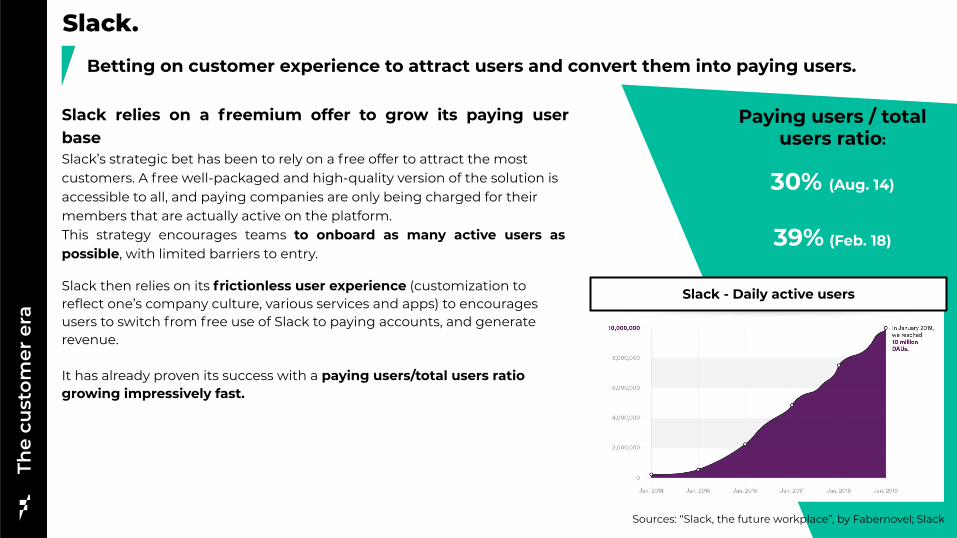
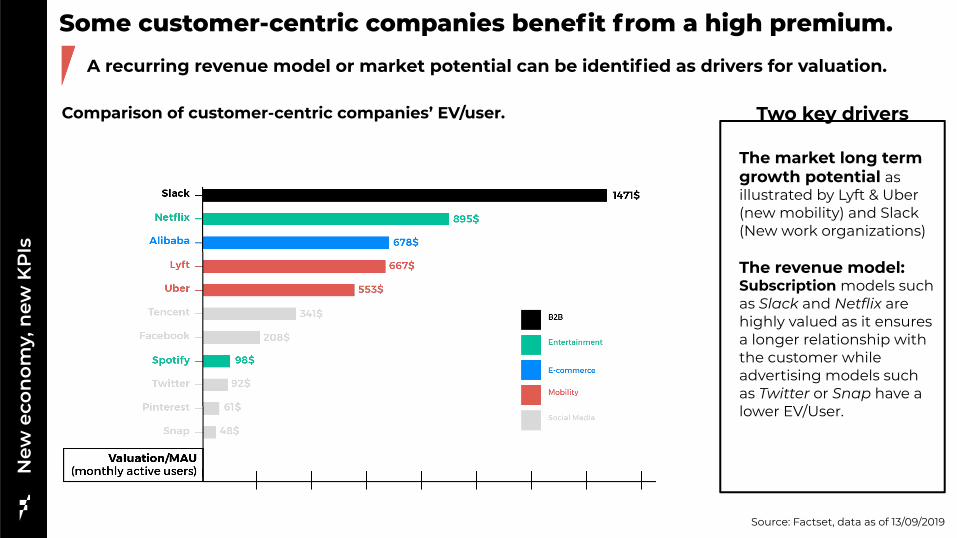
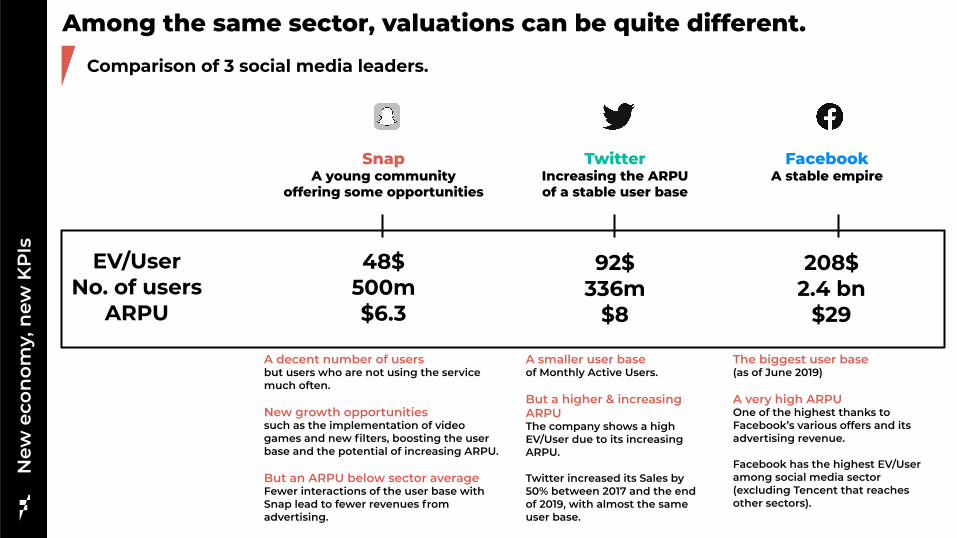
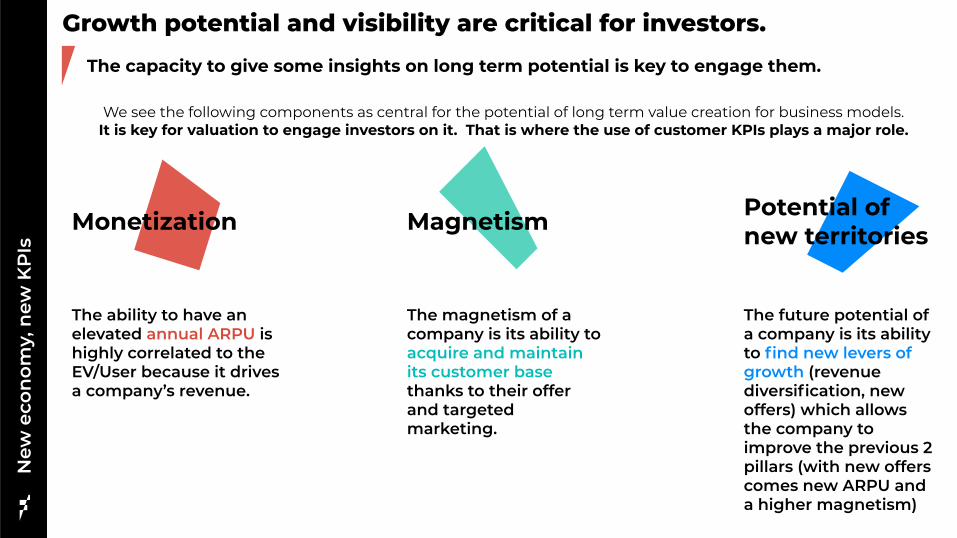
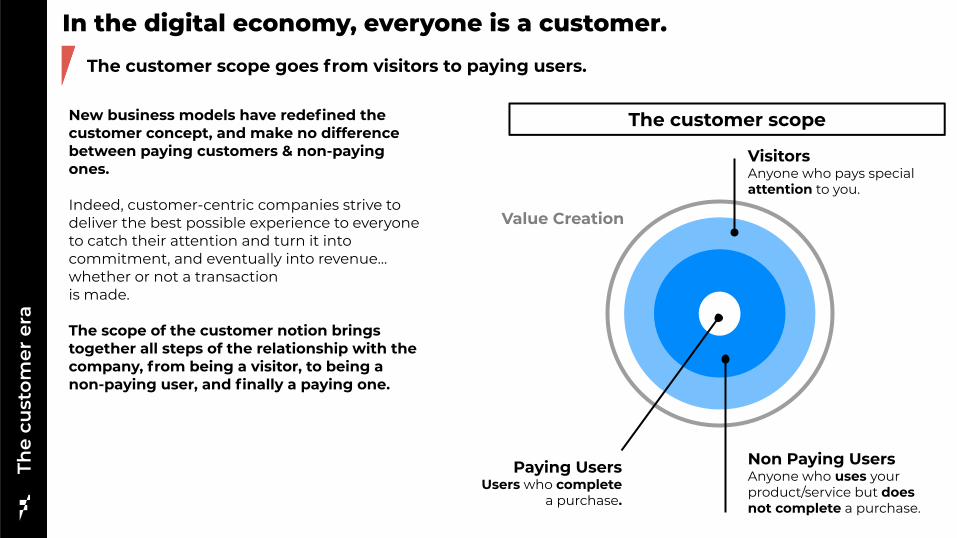
The
cust
omer
era
In the digital economy everyone is a customer
New business models have redefined the customer concept and make no difference between paying customers amp non-paying ones
Indeed customer-centric companies strive to deliver the best possible experience to everyone to catch their attention and turn it into commitment and eventually into revenuehellip whether or not a transaction is made
The scope of the customer notion brings together all steps of the relationship with the company from being a visitor to being a non-paying user and finally a paying one
The customer scope
The customer scope goes from visitors to paying users
VisitorsAnyone who pays special attention to you
Non Paying UsersAnyone who uses your productservice but does not complete a purchase
Paying Users Users who complete
a purchase
Value Creation
Attract Engage Leverage
Awareness Reach of the company
Retentionloyal amp frequent users
MonetizationGenerating revenue from
users (paying or non-paying)
Activation Visitor commitment (giving informationhellip)
Acquisitionof visitors
Attention drawn
ConversionVisitors become users
(paying or non-paying)
The
cust
omer
era
The customer lifecycle from attention to revenue
Fueled by customer experience
The customer lifecycle from attention to revenue
(advertising affiliation) can measure their non-paying customers (users) and their paying customers (advertisers)
Models based on data monetization
B2C freemium models B2B2C models
can measure their paying customers (companies) and their non-paying customers (final users employees)
The
cust
omer
era
Depending on their business model companies can measure paying users non-paying ones or both
can measure their non-paying customers (users) and their paying customers (subscribers) analyzing engagement amp monetization of each
The
cust
omer
era
Experience is at the heart of the relationship with customersCustomer satisfaction must be the ultimate goal of customer experience
Customer experience has been a key differentiating factor for successful new business modelsIt relies on a few standards that have become a prerequisite
Critical in the digital era trust has emerged as one of the most crucial standards for customer experienceA strong relationship of trust relies on user protection regarding privacy andor safety companyrsquos ethics in terms of transparency
of information and power given to customers and more generally on the quality of the value proposition solving a real need
Indeed customers and more generally stakeholders penalize companies when trust is no longer respected Facebook faced a strong backlash after repeated data breaches and Apple amp Samsung were fined by Italian antitrust authorities for their planned
obsolescence practices considered dishonest for users
Efficiency
Gucci partnered with Farfetch to launch F90 a 90mn delivery service of
any Gucci article
Personalization
Spotify generates a unique track curation for each user thanks to its AI algorithms
Simplicity
Amazon offers additional services to provide a seamless experience in fashion Prime Wardrobe (members try before they buy) and Echo look
(clothing style analysis and recommendations)
Trust
Qwant differentiated from Google by insisting on user protection with its slogan ldquoThe search engine which respects your private liferdquo
The
cust
omer
era
Experience is the backbone of customer value
Delivering wow customer service to achieve a low churn
Zappos invests in its lsquoCustomer Loyalty teamrsquo to deliver a wow service via an overstaffing that enables ldquobreathing spacerdquo for employees in-depth training and a wide flexibility regarding scripts and calls timing By focusing on its customer service Zappos creates a strong emotional connection with customers which has proven successful in terms of acquisition and retention
Experience lays the foundation to attract customers and engage them in order to create value
Inversely a better knowledge of each step of the customer path can highlight potential areas of improvement of the customer experience
A better
CustomerExperience
Attractiveness
CustomerEngagement
Monetization
Improves Optimizes
ZAPPOS (Acquired by Amazon in 2009)
How to assess amp improve customer value2
If you donrsquot measure it you canrsquot improve it
Lord Kelvin
Ass
essi
ng
amp im
pro
vin
g c
ust
omer
val
ue
Evaluating each step of the customer lifecycleMeasuring your customer centricity through each step of the customer path
The framework to evaluate a companyrsquos customer capital integrates4 complementary key blocks of KPIs that retrace every aspect of the customer scope
Attract Engage Leverage
Customer Experience
Capacity to acquire amp
activate visitors
Capacity to convert them into
customers amp engage them
Capacity to monetize your
customers
Improves resultsRely on a seamless
and satisfying experience
The framework will reflect the maturity of onersquos company on its customer centricity
Attractiveness
is the first key phase in the relationship to customers
raising awareness and acquiring new visitors There is no monetization at this stage thus no direct impact on the PampL but it will condition the rest of the value chain
Ass
essi
ng
amp im
pro
vin
g c
ust
omer
val
ue
Assessing attractiveness
How well does the company manage to reach a wide audience
How many new visitors does the company attractHow well are they activated (from someone paying attention to someone who takes action)
Attracting new visitors and activating them
Awareness
Company marketing reachNb of followers on social media
Nb of views of content published
Nb of reactions (likes claps)
Nb of attendees to events
Nb of subscriptions to newsletters clubs
BrandProductservice magnetismNb of brandproductservice mentions researches
Brand knowledge(based on surveys amp perception studies)
Rate of adoption of the productsolution
Viral coefficient
Acquisition of visitorsNb of visitors (anyone who pays attention)Nb of visits on the websitephysical venueFirst contacts for business services(Direct Traffic + indirect traffic per channel)
Nb of single visitors (website physical venue for meetings) Gross adds net adds overall growth
Nb of customer requests about the productservice
ActivationNb of accountssessions created
Nb of proposals or demos required
Nb of app downloads
Social MediaFinancial services amp mobile payment
Nb of visitorsApp store rankingbased on number of downloads
Attract mdash Reporting use cases
Magnetism amp activation
KPI
Reporting
Tracking traffic Reach
bull As of March Snapchat reaches 90 of all 13-24 year-olds and 75 of all 13-34 year-olds in the USbull Our audience watching content on Discover every day has grown over 35 year-over-year
Square Investor Presentation May 2019 Asos 2018 financial report Snap 2019 Q1 amp Q2 earnings
Online fashion retailer
Ass
essi
ng
amp im
pro
vin
g c
ust
omer
val
ue
KPI
Reporting
AudienceAudience reach
KPI
Reporting
Engagement
will be critical regarding the potential of revenue and value creation driven by each customer
Once visitors engage with the productservice they become users Either paying or non-paying users (ex freemium models) participate to create value and impact the PampL directly or indirectly
Ass
essi
ng
amp im
pro
vin
g c
ust
omer
val
ue
Assessing EngagementConverting visitors into users and retaining them
Are visitors successfully converted into usersConversion
From visitors to users (Paying or non-paying)Total nb of active users (Gross adds Net addsTotal growth)Conversion rate (from visitors to users (paying or non-paying)Nb of contracts purchase membership abandonment rebound rate
From non-paying usersto paying usersConversion rate
Do these users become loyal and committed to the company
How many final users and how engaged are they
Retention
Paying amp non-paying usersDailymonthly active usersRetention rate Churn rateAverage lifespan of customers of returning customersUsage Nb of interactions average time spentvisits Nb of pages seen per session
Recurring users (paying)Average time between service contract renewals or purchasesNb of recurring buyers recurring purchase or service contracts (Nb of repeat purchasesnb of total purchases)
CommitmentNb of referrals amp sponsorshipsNb of new users drawnby existing users
Final user data
Nb of final usersTotal net adds gross addsgrowthDailymonthly active usersUser churn rate retention rate nb of returning users
UsageNb of interactions average time spentvisitsNb of pages seen per sessionFrequency of usageAverage lifespan of users
Engage mdash Reporting use casesA
sses
sing
amp im
prov
ing
cust
omer
val
ueA
sses
sin
g amp
imp
rovi
ng
cu
stom
er v
alu
e Telecom operatorFashion e-commerce company
Active usersPaying users
Conversion rate of first-time buyer into repeat buyer
From members to repeat buyers
KPI
Reporting
Users Retention of customers
Showroomprive 2018 results presentation SurveyMonkey yearly report 2018 VodafoneZiggo Presentation March 2019
Online surveys solution
KPI
Reporting
Churn rateNet adds
KPI
Reporting
Ass
essi
ng
amp im
pro
vin
g c
ust
omer
val
ue
Assessing LeverageMonetizing customers and maximizing value
Leveraging
means monetizingBy evaluating customersrsquo (including both visitors and users) impact on PampL value creation can be quantified monitored and optimized
What revenue is drawn directly from paying amp non-paying usersCustomer revenue
Direct revenue (paying users)Total amp average revenue per customer revenue from high value customer revenue from repeat customersARR per customerARPCOUpsell amp cross-sell rateRGUAverage basket value size GMV Nb of orders per customer
Indirect revenue (Non paying user)Total revenue per userARPUFCF per userARR per user
What are the costs for each user
What is the overall value generated by each user
Customer costs
Paying usersCAC (blended paid)Fulfillment cost ratioMarketing costs (channels costs Pay-per-click costs)
Non paying users costs (if applicable)User acquisition cost Marketing costs
Customer value creationEVcustomerCLV (per customer or per cohort)Contribution margin per customerContent created by customers
Cash impactFCF per customerPoor debt status Payment delays
Leverage mdash Reporting use casesA
sses
sing
amp im
prov
ing
cust
omer
val
ueA
sses
sin
g amp
imp
rovi
ng
cu
stom
er v
alu
e E-commerce companySocial media
Customer Acquisition CostAverage Revenue Per User (ARPU) worldwide amp per region
From members to repeat buyers
KPI
Reporting
Users Retention of customers
Facebook - Q2 2019 Results HelloFresh - Capital Markets Day 2018 Zalando Q2 2019 earnings
Meal kit delivery service
KPI
Reporting
Average ordersbasket sizeGMV per active customer
KPI
Reporting
Ass
essi
ng
amp im
pro
vin
g c
ust
omer
val
ue
Assessing ExperienceProviding a qualitative experience to maximize satisfaction
Customer experience
is a key enabler in the customer relation and will drive a companyrsquos ability to optimize its centricity and generate the best value from it Today most companies limit their attention to NPS or customer service indicators they need to push their analysis beyond
How well does the company know and adapt to its customersPersonalization
Knowledge of customersCustomer habits amp preference metricsCustomer profile
CurationAmount of dedicated contentAmount of customized products or servicesLevel of anticipation of choices and needsSingularity amp differentiation of the experience
How qualitative and seamless is the experience provided to customers
How positively do customers evaluate their global experience
Quality of experienceSimplicityFrictionless experience Ergonomy of the digital orphysical venue (app amp website loading time) and of the customer pathAdditional services Free trials return policies
EfficiencyCustomer relation First contact resolution and of resolved issues delay of answers and problem resolution timeDelivery amp delay timeInitial training time of employees
TrustUser protectionsafety of the productsolution data privacyEthics responsibility of the company respectful business practices
Satisfaction
Overall satisfactionProduct or service rankingNb of cancelled ordersCustomer Satisfaction ratescore (CSAT) NPSSocial sentiment ( of positive reaction positive vocabulary)
Experience satisfactionCustomer Effort Score Customer experience index (Forrester) System usability scaleLevel of emotion generated by the experience (Net Emotion Score)
Experience mdash Reporting use casesA
sses
sing
amp im
prov
ing
cust
omer
val
ueA
sses
sin
g amp
imp
rovi
ng
cu
stom
er v
alu
e Meal kit delivery serviceE-commerce conglomerate
Customer Acquisition CostAverage Revenue Per User (ARPU) worldwide amp per region
From membersto repeat buyers
KPI
Reporting
Users Retention of customers
Alibaba - Investor Day 2018 Europcar Mobility Group 2019 Capital Markets Day Blue Apron - Investor Presentation (Q3 18)
Rental amp mobility company
KPI
Reporting
Average ordersbasket sizeGMV per active customer
KPI
Reporting
Where do companies stand todayMain trends amp reporting practices
3
Wh
ere
do
com
pan
ies
stan
d t
oday
A lack of homogeneity in the customer-centric approach
General overview of CAC 40 companies compared to a panel of large digital natives(GAFAM social media e-commerce)
Deep dive on a sample of 35 various B2C companies both digital natives and traditional among a diversity of sectors Insurance Banking Social media Streaming Mobility Leisure Video games E-commerce Retail Food Tech Telecoms Energy
Mostly based on external reporting(2018-2019 results publications press releases)
With insights on internal reporting practices (Corporate blogs research articles white papers interviews)
Benchmark methodology Collection amp classification of customer-centric KPIs
In our study led about several French and international companies two main trends emerged
In general companies tend to report metrics related to all steps of the customer lifecycle (attractivity engagement leverage experience)
With a slight focus on customer engagement
A variety of KPIs
Customer-centric reporting practices still vary highly between digital players and more historical ones
Digital native companies were created with a stakeholder centric approach and a monitoringcommunication focused on customer KPIs from the beginning However even if other companies have initiated a deep transformation of their organization hardly any of them have really switched to a new reporting approach yet
A gap in reporting practices
Incumbents have not switched to a new reporting approach yet
Average number of customer KPIs reported
By digital nativecompanies
52By CAC 40companies
17Wh
ere
do
com
pan
ies
stan
d t
oday
Digital native companies leading on customer-centric reporting
Different models different practices
Customer-centric external reporting appears to be a standard for ldquodigital nativerdquo companies (Tech giants in e-commerce social media streaminghellip) However it remains less common among incumbents except for a few pioneering sectors like Telecoms
Communicateon at least one customer KPI
Number of customersSatisfaction metrics (mostly NPS)
Main KPIs
CAC 40 external reporting ldquoDigital nativesrdquo external reporting
0Have external
reporting mainly focused on
customer metrics
60
Such a gap can be explained by an uneven access to the customer different models and cultures and the difficulties encountered to change an historically different approach as well as the legacy business
Communicateon at least one customer KPI
Number of customers amp growthNumber of active customers ARPU
Main KPIs
50Have external
reporting mainly focused on
customer metrics
90
Overview of CAC 40 companies amp a panel of 10 large ldquodigital nativesrdquo
Areas of focus 25 of companies communicate on all 4 categories of KPIs
Wh
ere
do
com
pan
ies
stan
d t
oday
Companies focus on different aspects of the customer scope
94 of companies included in the benchmark report at least one metric related to Engage
Companies report KPIs related to all categories with a slight focus on engagement
A variety of KPIs reportedRepartition of KPIs collected
Number of customersReported by
53of benchmarkrsquos companies
Active customers 25
Total amp averagerevenue per user
Reported by 33
of benchmarkrsquos companies
Most reported KPIs
72 of companies included in the benchmark report at least one metric related to Experience
61 of companies included in the benchmark report at least one metric related to Leverage
42 of companies included in the benchmark report at least one metric related to Attract
Deep dive on a panel of thirty-five B2C companies with various industries and nationalities
Leverage28
Engage35
Attract14
Experience23
Number of ordersper customer
25
Customer profile 25
And for youThe path to customer KPI reporting
4
Selectingthe right KPIs
1
The path to customer-centric reportingTh
e p
ath
to
cust
omer
KP
I rep
orti
ng
A three-step plan to integrate customer KPIs into your reporting
Harnessing your KPIsInternally
amp externally
3Implementing
your KPIs
2
The
pat
h t
o cu
stom
er K
PI r
epor
tin
gSelecting the right KPIs
For each company its own KPIs adapted to its specific needs
A few examples of OMTM (one metric that matters)
OMTM Time between the 1st amp 2nd connexion
Strategic customer KPIs driving your financial performance
Focus on adequate KPIS providing actionable insights on your long-term financial performance
ldquoThe one metricthat mattersrdquo
Focus on the one metric that is most critical for your performance and that can be followed over time
Selecting therelevant metric
Temporality(can be contextualized)
RateRatio(comparable)
Intelligible(easily understandable)
Decision-oriented(actionable)
OMTM Nb of friends added in the 10 days after inscription
The
pat
h t
o cu
stom
er K
PI r
epor
tin
gImplementing your KPIs
A progressive process for a long-term approach
Complementary approachCustomer-centric reporting does not replace traditional financial indicators it brings complementary information in order to improve value creation
Starting internallyTo set sustainable customer-centric reporting start by following amp monitoring these KPIs internally before communicating externally on it
Engaging your teamsCEO CFO COO Operational teams Unit managers etc need to be familiarized with this new approach
Setting up tools amp guidelines to reach goalsSet specific objectives to be reached for every step of the way tools (automated data tracking etc) and a timeline of follow-up
Defining your level of action depending on your maturity on customer approachCollecting customer data analyzing to extract information andor leveraging data to engage actions
To optimize resource allocation
To segmentcustomers and identify new customer needs to
launch new offers
To monitorcompanyrsquos performance
The
pat
h t
o cu
stom
er K
PI r
epor
tin
gHarnessing your KPIs internally
Setting the internal purpose of your follow-up
Leveraging your KPIs internally
Who
Teams Executives Management Operationals
To monetize customer data to third
parties
The
pat
h t
o cu
stom
er K
PI r
epor
tin
gNike using Customer Lifetime Value to optimize resource allocation
Selecting and implementing CLV to better forecast customer value
Visitors paying or non paying users
ARPU (Direct amp Indirect revenue)Costscustomer (production servicehellip)
Number of customers
Profitper customer (PPC)
Customer lifespan (n)
CAC (Marketing advertising promotions hellip)
Acquisitioncost
1 ( 1 - retention rate)
Σk=1
nPPCk
(1 + WACC) k- CAC CLV =
Early 2018Nike acquires Zodiac
(consumer data analytics)to helps calculate CLV
In 2017Nike launches ldquoConsumer Direct Offenserdquo plan to improve direct
customer relation
The resultsBetter understanding of the
value of an individual customer enabled them to boost revenue
and retention with the right marketing recommendations
and offers
Customer Lifetime Valuation $Bn
The
pat
h t
o cu
stom
er K
PI r
epor
tin
gHarnessing your KPIs externally
Setting the external purpose of your follow-up
To measure your impact
To valueyour customer asset
and strategy
To educate on your model
Building on your KPIS externally
Who
Stakeholders Investors Partners Customers Media Regulators
Twitter valorizing customer capital to financial markets
+ 10Stock price
User acquisition KPI positively influences market reaction after disappointing forecasts
In the publication of its 2019 Q2 earnings Twitter published a
guidance adjusted downwards with revenue growth expected
to slow down and a disappointing forecast
And yet the companyrsquos market cap has been up following the
publication of its quarterly results driven by a better user acquisition growth which has pushed investors to focus on
mid-term potential
+ 5 millionDaily active users
The
pat
h t
o cu
stom
er K
PI r
epor
tin
g
Source MarketWatch July 26
The KPI toolbox for startersA few elements to begin with
New customer concerns and interests in social amp environmental issues impact the customer-business relationshipCustomers loyalty is now related to the companyrsquos external commitment
Stakeholders centricity soon to be integrated as a driver of customer value
The next move
Direct traffic Conversion rate Nb of active users Churn rate Recurring users ARPU CAC CLV NPS Customer habitsspecific to each company
Customer experience has been crucial for the success of new business models
It is key to gather experience KPIs on every step of the customer journey and to set specific objectives for each step
Offering the best experience tailored on customerrsquos specific needs must be an all-time preoccupation
The must haves
The underrated
game changer
The
pat
h t
o cu
stom
er K
PI r
epor
tin
g
Going further Download Fabernovel data mapping toolkit
The
pat
h t
o cu
stom
er K
PI r
epor
tin
g
Evaluate the level of maturity of your customer approach
And you how customer-centric are you
Click here for an overview of the index
To access the full version of the index you can contact us at axellericour-dumasfabernovelcom
Jean-Christophe LiaubetPartner
Jean-Christophe joined Fabernovel in 2017 as a Partner and founder of the valuation practice of the Group
With over 20 years of experience as an Equity Analyst and then Managing Director at Exane BNP Paribas he helps corporates make and value the best investment decisions
Gabrielle PeyrelongueValue analyst
Graduate from ESSEC Gabrielle joined Fabernovel in 2018 as a Value Analyst
She has worked within Fabernovel practices in Paris and San Francisco focusing on several projects including innovation strategy and new models of valuation based on extra financial criteria
Axelle Ricour-DumasValue Director
Axelle joined Fabernovel in 2018 as a Director after 20 years as Equity analyst at Cheuvreux Director of Investor Relations at IPSOS and Founder of her company MYFINADVICE
At Fabernovel she works on several projects of strategic advisory and has a strong expertise on the assessment and scoring of strategic projects
Jeacutereacutemy TaiumlebQuantitative analyst
Jeacutereacutemy joined Fabernovel as a quantitative analyst after graduating from CentraleSupelec and ESCP Europe
He specializes in quantitative finance and data analysis especially for tech companies and works on several projects including financial research financial modelling and ecosystem modelling
AuthorsC
red
its
An
nex
esKPIs glossary
ARPCOAverage Revenue Per Convergent Offer
ARPU (Average Revenue Per User)total of revenuestotal users ARRAnnual Recurring Revenue
Avg lifespan of customer (in months)1monthly churn
Cohort analysisanalysis based on consumersusers fragmentation
Customer acquisition cost total acquisition campaign costsnumber of new customers (CLVCAC ratio)
Customer concentrationbiggest customer revenuetotal revenue Customer Effort Scoremeasures satisfaction regarding the effort through customer journey
Contribution marginselling price per unit minus the variable cost per unit
LTV or CLV Customer lifetime valueARPU x 1CLV attrition rate Can also be based on FCF margins
DMT (Dureacutee Moyenne de Traitement)average processing time
First Call Resolutionfirst call resolution rate reflects customer service performance
Fulfillment Cost RatioFulfillment cost (Cost of sales amp distributionlogistic content creation services payments)revenue
GMV (Gross Merchandise Value)average nb of orders per customer x average basket size(after returns)
Marketing Cost Ratiomarketing costsrevenue
Net addsnew subscribers or customers - nb of unsubscribing
Net Promoter Score brand ambassadors - brand detractors
An
nex
esKPIs glossary
Network effectthe more a product is used the more its value increases(ex Facebook) each company has its own KPIs to assess it
Problem Resolution time(Sum of All Interactions for Total Resolved Issues - Total nb of Resolved Issues)
RGUsRevenue Generating Units (a customer can represent various RGUs for example when subscribing to a mobile phone contract + TV contract + internet rarr the customer represents 3 RGUs) Traffic sourcesdirect organichellip
Conversion ratepace at which the solutionproductservice has been adopted
Rebound ratecustomers leaving site without a chance to convert them
repeat purchaseNb of repeat purchasenb of total purchases
Requests rate with lowhigh level of added valuesimplerecurring customer service requests rate vs complex ones Retention rate(Nb of Customers at End of Period - nb of New Customers Acquired During Period)nb of Customers at Start of Period
Viralityspeed of productservice spread can be measured by k-value (average nb of invitations sent by each userconversion rate of invitations into new users)
An
nex
esCompanies analyzed in the benchmark
HelloFresh
Netflix
Orange
PSA
Showroomprive
Snap
Spotify
Square
Takewaycom
Twitch
Ubisoft
Vodafone
Zalando
Zynga
Activision Blizzard
Airbnb
AirFrance
Alibaba
Allianz
Amazon
Asos
Axa
Baidu
Blablacar
Blue Apron
BNP
Carrefour
Creacutedit Agricole
Easyjet
EDF
Engie
Europcar Mobility Group
Thank youCONTACT
Jean-Christophe LIAUBETPartner
+33 6 08 86 24 88jean-christopheliaubetFabernovelcom
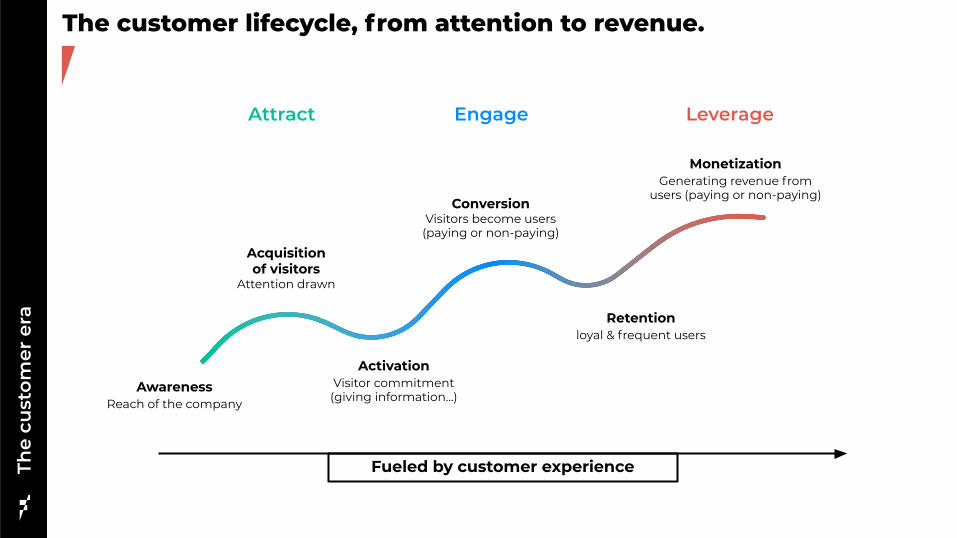
Attract Engage Leverage
Awareness Reach of the company
Retentionloyal amp frequent users
MonetizationGenerating revenue from
users (paying or non-paying)
Activation Visitor commitment (giving informationhellip)
Acquisitionof visitors
Attention drawn
ConversionVisitors become users
(paying or non-paying)
The
cust
omer
era
The customer lifecycle from attention to revenue
Fueled by customer experience
The customer lifecycle from attention to revenue
(advertising affiliation) can measure their non-paying customers (users) and their paying customers (advertisers)
Models based on data monetization
B2C freemium models B2B2C models
can measure their paying customers (companies) and their non-paying customers (final users employees)
The
cust
omer
era
Depending on their business model companies can measure paying users non-paying ones or both
can measure their non-paying customers (users) and their paying customers (subscribers) analyzing engagement amp monetization of each
The
cust
omer
era
Experience is at the heart of the relationship with customersCustomer satisfaction must be the ultimate goal of customer experience
Customer experience has been a key differentiating factor for successful new business modelsIt relies on a few standards that have become a prerequisite
Critical in the digital era trust has emerged as one of the most crucial standards for customer experienceA strong relationship of trust relies on user protection regarding privacy andor safety companyrsquos ethics in terms of transparency
of information and power given to customers and more generally on the quality of the value proposition solving a real need
Indeed customers and more generally stakeholders penalize companies when trust is no longer respected Facebook faced a strong backlash after repeated data breaches and Apple amp Samsung were fined by Italian antitrust authorities for their planned
obsolescence practices considered dishonest for users
Efficiency
Gucci partnered with Farfetch to launch F90 a 90mn delivery service of
any Gucci article
Personalization
Spotify generates a unique track curation for each user thanks to its AI algorithms
Simplicity
Amazon offers additional services to provide a seamless experience in fashion Prime Wardrobe (members try before they buy) and Echo look
(clothing style analysis and recommendations)
Trust
Qwant differentiated from Google by insisting on user protection with its slogan ldquoThe search engine which respects your private liferdquo
The
cust
omer
era
Experience is the backbone of customer value
Delivering wow customer service to achieve a low churn
Zappos invests in its lsquoCustomer Loyalty teamrsquo to deliver a wow service via an overstaffing that enables ldquobreathing spacerdquo for employees in-depth training and a wide flexibility regarding scripts and calls timing By focusing on its customer service Zappos creates a strong emotional connection with customers which has proven successful in terms of acquisition and retention
Experience lays the foundation to attract customers and engage them in order to create value
Inversely a better knowledge of each step of the customer path can highlight potential areas of improvement of the customer experience
A better
CustomerExperience
Attractiveness
CustomerEngagement
Monetization
Improves Optimizes
ZAPPOS (Acquired by Amazon in 2009)
How to assess amp improve customer value2
If you donrsquot measure it you canrsquot improve it
Lord Kelvin
Ass
essi
ng
amp im
pro
vin
g c
ust
omer
val
ue
Evaluating each step of the customer lifecycleMeasuring your customer centricity through each step of the customer path
The framework to evaluate a companyrsquos customer capital integrates4 complementary key blocks of KPIs that retrace every aspect of the customer scope
Attract Engage Leverage
Customer Experience
Capacity to acquire amp
activate visitors
Capacity to convert them into
customers amp engage them
Capacity to monetize your
customers
Improves resultsRely on a seamless
and satisfying experience
The framework will reflect the maturity of onersquos company on its customer centricity
Attractiveness
is the first key phase in the relationship to customers
raising awareness and acquiring new visitors There is no monetization at this stage thus no direct impact on the PampL but it will condition the rest of the value chain
Ass
essi
ng
amp im
pro
vin
g c
ust
omer
val
ue
Assessing attractiveness
How well does the company manage to reach a wide audience
How many new visitors does the company attractHow well are they activated (from someone paying attention to someone who takes action)
Attracting new visitors and activating them
Awareness
Company marketing reachNb of followers on social media
Nb of views of content published
Nb of reactions (likes claps)
Nb of attendees to events
Nb of subscriptions to newsletters clubs
BrandProductservice magnetismNb of brandproductservice mentions researches
Brand knowledge(based on surveys amp perception studies)
Rate of adoption of the productsolution
Viral coefficient
Acquisition of visitorsNb of visitors (anyone who pays attention)Nb of visits on the websitephysical venueFirst contacts for business services(Direct Traffic + indirect traffic per channel)
Nb of single visitors (website physical venue for meetings) Gross adds net adds overall growth
Nb of customer requests about the productservice
ActivationNb of accountssessions created
Nb of proposals or demos required
Nb of app downloads
Social MediaFinancial services amp mobile payment
Nb of visitorsApp store rankingbased on number of downloads
Attract mdash Reporting use cases
Magnetism amp activation
KPI
Reporting
Tracking traffic Reach
bull As of March Snapchat reaches 90 of all 13-24 year-olds and 75 of all 13-34 year-olds in the USbull Our audience watching content on Discover every day has grown over 35 year-over-year
Square Investor Presentation May 2019 Asos 2018 financial report Snap 2019 Q1 amp Q2 earnings
Online fashion retailer
Ass
essi
ng
amp im
pro
vin
g c
ust
omer
val
ue
KPI
Reporting
AudienceAudience reach
KPI
Reporting
Engagement
will be critical regarding the potential of revenue and value creation driven by each customer
Once visitors engage with the productservice they become users Either paying or non-paying users (ex freemium models) participate to create value and impact the PampL directly or indirectly
Ass
essi
ng
amp im
pro
vin
g c
ust
omer
val
ue
Assessing EngagementConverting visitors into users and retaining them
Are visitors successfully converted into usersConversion
From visitors to users (Paying or non-paying)Total nb of active users (Gross adds Net addsTotal growth)Conversion rate (from visitors to users (paying or non-paying)Nb of contracts purchase membership abandonment rebound rate
From non-paying usersto paying usersConversion rate
Do these users become loyal and committed to the company
How many final users and how engaged are they
Retention
Paying amp non-paying usersDailymonthly active usersRetention rate Churn rateAverage lifespan of customers of returning customersUsage Nb of interactions average time spentvisits Nb of pages seen per session
Recurring users (paying)Average time between service contract renewals or purchasesNb of recurring buyers recurring purchase or service contracts (Nb of repeat purchasesnb of total purchases)
CommitmentNb of referrals amp sponsorshipsNb of new users drawnby existing users
Final user data
Nb of final usersTotal net adds gross addsgrowthDailymonthly active usersUser churn rate retention rate nb of returning users
UsageNb of interactions average time spentvisitsNb of pages seen per sessionFrequency of usageAverage lifespan of users
Engage mdash Reporting use casesA
sses
sing
amp im
prov
ing
cust
omer
val
ueA
sses
sin
g amp
imp
rovi
ng
cu
stom
er v
alu
e Telecom operatorFashion e-commerce company
Active usersPaying users
Conversion rate of first-time buyer into repeat buyer
From members to repeat buyers
KPI
Reporting
Users Retention of customers
Showroomprive 2018 results presentation SurveyMonkey yearly report 2018 VodafoneZiggo Presentation March 2019
Online surveys solution
KPI
Reporting
Churn rateNet adds
KPI
Reporting
Ass
essi
ng
amp im
pro
vin
g c
ust
omer
val
ue
Assessing LeverageMonetizing customers and maximizing value
Leveraging
means monetizingBy evaluating customersrsquo (including both visitors and users) impact on PampL value creation can be quantified monitored and optimized
What revenue is drawn directly from paying amp non-paying usersCustomer revenue
Direct revenue (paying users)Total amp average revenue per customer revenue from high value customer revenue from repeat customersARR per customerARPCOUpsell amp cross-sell rateRGUAverage basket value size GMV Nb of orders per customer
Indirect revenue (Non paying user)Total revenue per userARPUFCF per userARR per user
What are the costs for each user
What is the overall value generated by each user
Customer costs
Paying usersCAC (blended paid)Fulfillment cost ratioMarketing costs (channels costs Pay-per-click costs)
Non paying users costs (if applicable)User acquisition cost Marketing costs
Customer value creationEVcustomerCLV (per customer or per cohort)Contribution margin per customerContent created by customers
Cash impactFCF per customerPoor debt status Payment delays
Leverage mdash Reporting use casesA
sses
sing
amp im
prov
ing
cust
omer
val
ueA
sses
sin
g amp
imp
rovi
ng
cu
stom
er v
alu
e E-commerce companySocial media
Customer Acquisition CostAverage Revenue Per User (ARPU) worldwide amp per region
From members to repeat buyers
KPI
Reporting
Users Retention of customers
Facebook - Q2 2019 Results HelloFresh - Capital Markets Day 2018 Zalando Q2 2019 earnings
Meal kit delivery service
KPI
Reporting
Average ordersbasket sizeGMV per active customer
KPI
Reporting
Ass
essi
ng
amp im
pro
vin
g c
ust
omer
val
ue
Assessing ExperienceProviding a qualitative experience to maximize satisfaction
Customer experience
is a key enabler in the customer relation and will drive a companyrsquos ability to optimize its centricity and generate the best value from it Today most companies limit their attention to NPS or customer service indicators they need to push their analysis beyond
How well does the company know and adapt to its customersPersonalization
Knowledge of customersCustomer habits amp preference metricsCustomer profile
CurationAmount of dedicated contentAmount of customized products or servicesLevel of anticipation of choices and needsSingularity amp differentiation of the experience
How qualitative and seamless is the experience provided to customers
How positively do customers evaluate their global experience
Quality of experienceSimplicityFrictionless experience Ergonomy of the digital orphysical venue (app amp website loading time) and of the customer pathAdditional services Free trials return policies
EfficiencyCustomer relation First contact resolution and of resolved issues delay of answers and problem resolution timeDelivery amp delay timeInitial training time of employees
TrustUser protectionsafety of the productsolution data privacyEthics responsibility of the company respectful business practices
Satisfaction
Overall satisfactionProduct or service rankingNb of cancelled ordersCustomer Satisfaction ratescore (CSAT) NPSSocial sentiment ( of positive reaction positive vocabulary)
Experience satisfactionCustomer Effort Score Customer experience index (Forrester) System usability scaleLevel of emotion generated by the experience (Net Emotion Score)
Experience mdash Reporting use casesA
sses
sing
amp im
prov
ing
cust
omer
val
ueA
sses
sin
g amp
imp
rovi
ng
cu
stom
er v
alu
e Meal kit delivery serviceE-commerce conglomerate
Customer Acquisition CostAverage Revenue Per User (ARPU) worldwide amp per region
From membersto repeat buyers
KPI
Reporting
Users Retention of customers
Alibaba - Investor Day 2018 Europcar Mobility Group 2019 Capital Markets Day Blue Apron - Investor Presentation (Q3 18)
Rental amp mobility company
KPI
Reporting
Average ordersbasket sizeGMV per active customer
KPI
Reporting
Where do companies stand todayMain trends amp reporting practices
3
Wh
ere
do
com
pan
ies
stan
d t
oday
A lack of homogeneity in the customer-centric approach
General overview of CAC 40 companies compared to a panel of large digital natives(GAFAM social media e-commerce)
Deep dive on a sample of 35 various B2C companies both digital natives and traditional among a diversity of sectors Insurance Banking Social media Streaming Mobility Leisure Video games E-commerce Retail Food Tech Telecoms Energy
Mostly based on external reporting(2018-2019 results publications press releases)
With insights on internal reporting practices (Corporate blogs research articles white papers interviews)
Benchmark methodology Collection amp classification of customer-centric KPIs
In our study led about several French and international companies two main trends emerged
In general companies tend to report metrics related to all steps of the customer lifecycle (attractivity engagement leverage experience)
With a slight focus on customer engagement
A variety of KPIs
Customer-centric reporting practices still vary highly between digital players and more historical ones
Digital native companies were created with a stakeholder centric approach and a monitoringcommunication focused on customer KPIs from the beginning However even if other companies have initiated a deep transformation of their organization hardly any of them have really switched to a new reporting approach yet
A gap in reporting practices
Incumbents have not switched to a new reporting approach yet
Average number of customer KPIs reported
By digital nativecompanies
52By CAC 40companies
17Wh
ere
do
com
pan
ies
stan
d t
oday
Digital native companies leading on customer-centric reporting
Different models different practices
Customer-centric external reporting appears to be a standard for ldquodigital nativerdquo companies (Tech giants in e-commerce social media streaminghellip) However it remains less common among incumbents except for a few pioneering sectors like Telecoms
Communicateon at least one customer KPI
Number of customersSatisfaction metrics (mostly NPS)
Main KPIs
CAC 40 external reporting ldquoDigital nativesrdquo external reporting
0Have external
reporting mainly focused on
customer metrics
60
Such a gap can be explained by an uneven access to the customer different models and cultures and the difficulties encountered to change an historically different approach as well as the legacy business
Communicateon at least one customer KPI
Number of customers amp growthNumber of active customers ARPU
Main KPIs
50Have external
reporting mainly focused on
customer metrics
90
Overview of CAC 40 companies amp a panel of 10 large ldquodigital nativesrdquo
Areas of focus 25 of companies communicate on all 4 categories of KPIs
Wh
ere
do
com
pan
ies
stan
d t
oday
Companies focus on different aspects of the customer scope
94 of companies included in the benchmark report at least one metric related to Engage
Companies report KPIs related to all categories with a slight focus on engagement
A variety of KPIs reportedRepartition of KPIs collected
Number of customersReported by
53of benchmarkrsquos companies
Active customers 25
Total amp averagerevenue per user
Reported by 33
of benchmarkrsquos companies
Most reported KPIs
72 of companies included in the benchmark report at least one metric related to Experience
61 of companies included in the benchmark report at least one metric related to Leverage
42 of companies included in the benchmark report at least one metric related to Attract
Deep dive on a panel of thirty-five B2C companies with various industries and nationalities
Leverage28
Engage35
Attract14
Experience23
Number of ordersper customer
25
Customer profile 25
And for youThe path to customer KPI reporting
4
Selectingthe right KPIs
1
The path to customer-centric reportingTh
e p
ath
to
cust
omer
KP
I rep
orti
ng
A three-step plan to integrate customer KPIs into your reporting
Harnessing your KPIsInternally
amp externally
3Implementing
your KPIs
2
The
pat
h t
o cu
stom
er K
PI r
epor
tin
gSelecting the right KPIs
For each company its own KPIs adapted to its specific needs
A few examples of OMTM (one metric that matters)
OMTM Time between the 1st amp 2nd connexion
Strategic customer KPIs driving your financial performance
Focus on adequate KPIS providing actionable insights on your long-term financial performance
ldquoThe one metricthat mattersrdquo
Focus on the one metric that is most critical for your performance and that can be followed over time
Selecting therelevant metric
Temporality(can be contextualized)
RateRatio(comparable)
Intelligible(easily understandable)
Decision-oriented(actionable)
OMTM Nb of friends added in the 10 days after inscription
The
pat
h t
o cu
stom
er K
PI r
epor
tin
gImplementing your KPIs
A progressive process for a long-term approach
Complementary approachCustomer-centric reporting does not replace traditional financial indicators it brings complementary information in order to improve value creation
Starting internallyTo set sustainable customer-centric reporting start by following amp monitoring these KPIs internally before communicating externally on it
Engaging your teamsCEO CFO COO Operational teams Unit managers etc need to be familiarized with this new approach
Setting up tools amp guidelines to reach goalsSet specific objectives to be reached for every step of the way tools (automated data tracking etc) and a timeline of follow-up
Defining your level of action depending on your maturity on customer approachCollecting customer data analyzing to extract information andor leveraging data to engage actions
To optimize resource allocation
To segmentcustomers and identify new customer needs to
launch new offers
To monitorcompanyrsquos performance
The
pat
h t
o cu
stom
er K
PI r
epor
tin
gHarnessing your KPIs internally
Setting the internal purpose of your follow-up
Leveraging your KPIs internally
Who
Teams Executives Management Operationals
To monetize customer data to third
parties
The
pat
h t
o cu
stom
er K
PI r
epor
tin
gNike using Customer Lifetime Value to optimize resource allocation
Selecting and implementing CLV to better forecast customer value
Visitors paying or non paying users
ARPU (Direct amp Indirect revenue)Costscustomer (production servicehellip)
Number of customers
Profitper customer (PPC)
Customer lifespan (n)
CAC (Marketing advertising promotions hellip)
Acquisitioncost
1 ( 1 - retention rate)
Σk=1
nPPCk
(1 + WACC) k- CAC CLV =
Early 2018Nike acquires Zodiac
(consumer data analytics)to helps calculate CLV
In 2017Nike launches ldquoConsumer Direct Offenserdquo plan to improve direct
customer relation
The resultsBetter understanding of the
value of an individual customer enabled them to boost revenue
and retention with the right marketing recommendations
and offers
Customer Lifetime Valuation $Bn
The
pat
h t
o cu
stom
er K
PI r
epor
tin
gHarnessing your KPIs externally
Setting the external purpose of your follow-up
To measure your impact
To valueyour customer asset
and strategy
To educate on your model
Building on your KPIS externally
Who
Stakeholders Investors Partners Customers Media Regulators
Twitter valorizing customer capital to financial markets
+ 10Stock price
User acquisition KPI positively influences market reaction after disappointing forecasts
In the publication of its 2019 Q2 earnings Twitter published a
guidance adjusted downwards with revenue growth expected
to slow down and a disappointing forecast
And yet the companyrsquos market cap has been up following the
publication of its quarterly results driven by a better user acquisition growth which has pushed investors to focus on
mid-term potential
+ 5 millionDaily active users
The
pat
h t
o cu
stom
er K
PI r
epor
tin
g
Source MarketWatch July 26
The KPI toolbox for startersA few elements to begin with
New customer concerns and interests in social amp environmental issues impact the customer-business relationshipCustomers loyalty is now related to the companyrsquos external commitment
Stakeholders centricity soon to be integrated as a driver of customer value
The next move
Direct traffic Conversion rate Nb of active users Churn rate Recurring users ARPU CAC CLV NPS Customer habitsspecific to each company
Customer experience has been crucial for the success of new business models
It is key to gather experience KPIs on every step of the customer journey and to set specific objectives for each step
Offering the best experience tailored on customerrsquos specific needs must be an all-time preoccupation
The must haves
The underrated
game changer
The
pat
h t
o cu
stom
er K
PI r
epor
tin
g
Going further Download Fabernovel data mapping toolkit
The
pat
h t
o cu
stom
er K
PI r
epor
tin
g
Evaluate the level of maturity of your customer approach
And you how customer-centric are you
Click here for an overview of the index
To access the full version of the index you can contact us at axellericour-dumasfabernovelcom
Jean-Christophe LiaubetPartner
Jean-Christophe joined Fabernovel in 2017 as a Partner and founder of the valuation practice of the Group
With over 20 years of experience as an Equity Analyst and then Managing Director at Exane BNP Paribas he helps corporates make and value the best investment decisions
Gabrielle PeyrelongueValue analyst
Graduate from ESSEC Gabrielle joined Fabernovel in 2018 as a Value Analyst
She has worked within Fabernovel practices in Paris and San Francisco focusing on several projects including innovation strategy and new models of valuation based on extra financial criteria
Axelle Ricour-DumasValue Director
Axelle joined Fabernovel in 2018 as a Director after 20 years as Equity analyst at Cheuvreux Director of Investor Relations at IPSOS and Founder of her company MYFINADVICE
At Fabernovel she works on several projects of strategic advisory and has a strong expertise on the assessment and scoring of strategic projects
Jeacutereacutemy TaiumlebQuantitative analyst
Jeacutereacutemy joined Fabernovel as a quantitative analyst after graduating from CentraleSupelec and ESCP Europe
He specializes in quantitative finance and data analysis especially for tech companies and works on several projects including financial research financial modelling and ecosystem modelling
AuthorsC
red
its
An
nex
esKPIs glossary
ARPCOAverage Revenue Per Convergent Offer
ARPU (Average Revenue Per User)total of revenuestotal users ARRAnnual Recurring Revenue
Avg lifespan of customer (in months)1monthly churn
Cohort analysisanalysis based on consumersusers fragmentation
Customer acquisition cost total acquisition campaign costsnumber of new customers (CLVCAC ratio)
Customer concentrationbiggest customer revenuetotal revenue Customer Effort Scoremeasures satisfaction regarding the effort through customer journey
Contribution marginselling price per unit minus the variable cost per unit
LTV or CLV Customer lifetime valueARPU x 1CLV attrition rate Can also be based on FCF margins
DMT (Dureacutee Moyenne de Traitement)average processing time
First Call Resolutionfirst call resolution rate reflects customer service performance
Fulfillment Cost RatioFulfillment cost (Cost of sales amp distributionlogistic content creation services payments)revenue
GMV (Gross Merchandise Value)average nb of orders per customer x average basket size(after returns)
Marketing Cost Ratiomarketing costsrevenue
Net addsnew subscribers or customers - nb of unsubscribing
Net Promoter Score brand ambassadors - brand detractors
An
nex
esKPIs glossary
Network effectthe more a product is used the more its value increases(ex Facebook) each company has its own KPIs to assess it
Problem Resolution time(Sum of All Interactions for Total Resolved Issues - Total nb of Resolved Issues)
RGUsRevenue Generating Units (a customer can represent various RGUs for example when subscribing to a mobile phone contract + TV contract + internet rarr the customer represents 3 RGUs) Traffic sourcesdirect organichellip
Conversion ratepace at which the solutionproductservice has been adopted
Rebound ratecustomers leaving site without a chance to convert them
repeat purchaseNb of repeat purchasenb of total purchases
Requests rate with lowhigh level of added valuesimplerecurring customer service requests rate vs complex ones Retention rate(Nb of Customers at End of Period - nb of New Customers Acquired During Period)nb of Customers at Start of Period
Viralityspeed of productservice spread can be measured by k-value (average nb of invitations sent by each userconversion rate of invitations into new users)
An
nex
esCompanies analyzed in the benchmark
HelloFresh
Netflix
Orange
PSA
Showroomprive
Snap
Spotify
Square
Takewaycom
Twitch
Ubisoft
Vodafone
Zalando
Zynga
Activision Blizzard
Airbnb
AirFrance
Alibaba
Allianz
Amazon
Asos
Axa
Baidu
Blablacar
Blue Apron
BNP
Carrefour
Creacutedit Agricole
Easyjet
EDF
Engie
Europcar Mobility Group
Thank youCONTACT
Jean-Christophe LIAUBETPartner
+33 6 08 86 24 88jean-christopheliaubetFabernovelcom
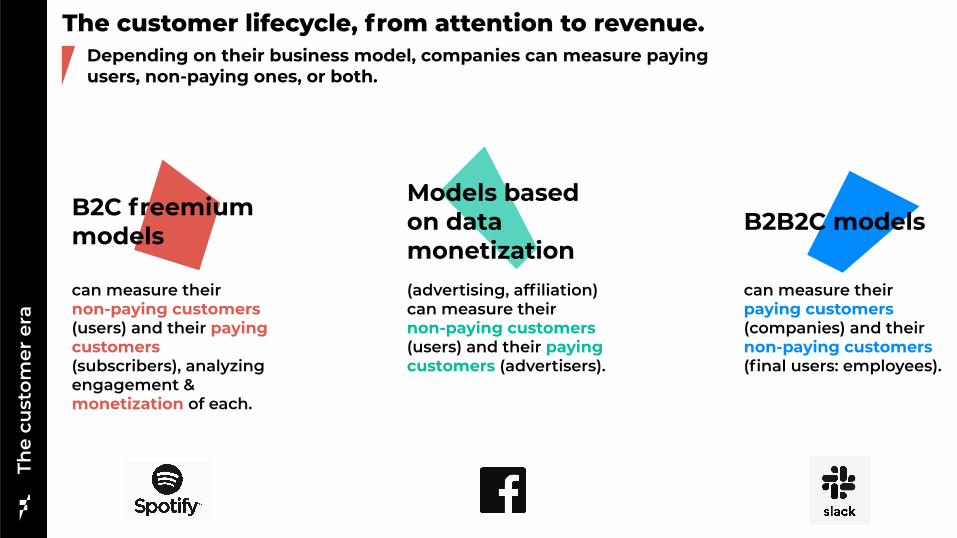
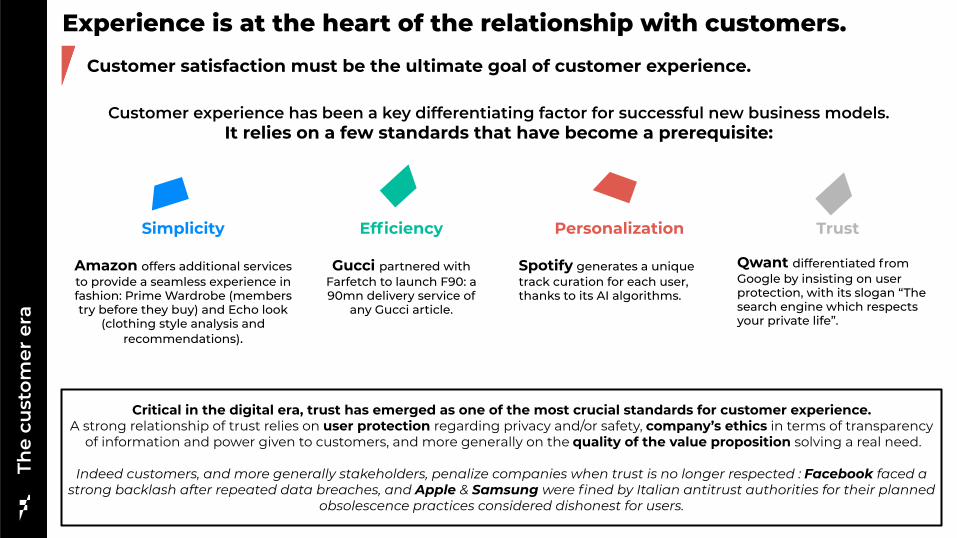
The
cust
omer
era
Experience is at the heart of the relationship with customersCustomer satisfaction must be the ultimate goal of customer experience
Customer experience has been a key differentiating factor for successful new business modelsIt relies on a few standards that have become a prerequisite
Critical in the digital era trust has emerged as one of the most crucial standards for customer experienceA strong relationship of trust relies on user protection regarding privacy andor safety companyrsquos ethics in terms of transparency
of information and power given to customers and more generally on the quality of the value proposition solving a real need
Indeed customers and more generally stakeholders penalize companies when trust is no longer respected Facebook faced a strong backlash after repeated data breaches and Apple amp Samsung were fined by Italian antitrust authorities for their planned
obsolescence practices considered dishonest for users
Efficiency
Gucci partnered with Farfetch to launch F90 a 90mn delivery service of
any Gucci article
Personalization
Spotify generates a unique track curation for each user thanks to its AI algorithms
Simplicity
Amazon offers additional services to provide a seamless experience in fashion Prime Wardrobe (members try before they buy) and Echo look
(clothing style analysis and recommendations)
Trust
Qwant differentiated from Google by insisting on user protection with its slogan ldquoThe search engine which respects your private liferdquo
The
cust
omer
era
Experience is the backbone of customer value
Delivering wow customer service to achieve a low churn
Zappos invests in its lsquoCustomer Loyalty teamrsquo to deliver a wow service via an overstaffing that enables ldquobreathing spacerdquo for employees in-depth training and a wide flexibility regarding scripts and calls timing By focusing on its customer service Zappos creates a strong emotional connection with customers which has proven successful in terms of acquisition and retention
Experience lays the foundation to attract customers and engage them in order to create value
Inversely a better knowledge of each step of the customer path can highlight potential areas of improvement of the customer experience
A better
CustomerExperience
Attractiveness
CustomerEngagement
Monetization
Improves Optimizes
ZAPPOS (Acquired by Amazon in 2009)
How to assess amp improve customer value2
If you donrsquot measure it you canrsquot improve it
Lord Kelvin
Ass
essi
ng
amp im
pro
vin
g c
ust
omer
val
ue
Evaluating each step of the customer lifecycleMeasuring your customer centricity through each step of the customer path
The framework to evaluate a companyrsquos customer capital integrates4 complementary key blocks of KPIs that retrace every aspect of the customer scope
Attract Engage Leverage
Customer Experience
Capacity to acquire amp
activate visitors
Capacity to convert them into
customers amp engage them
Capacity to monetize your
customers
Improves resultsRely on a seamless
and satisfying experience
The framework will reflect the maturity of onersquos company on its customer centricity
Attractiveness
is the first key phase in the relationship to customers
raising awareness and acquiring new visitors There is no monetization at this stage thus no direct impact on the PampL but it will condition the rest of the value chain
Ass
essi
ng
amp im
pro
vin
g c
ust
omer
val
ue
Assessing attractiveness
How well does the company manage to reach a wide audience
How many new visitors does the company attractHow well are they activated (from someone paying attention to someone who takes action)
Attracting new visitors and activating them
Awareness
Company marketing reachNb of followers on social media
Nb of views of content published
Nb of reactions (likes claps)
Nb of attendees to events
Nb of subscriptions to newsletters clubs
BrandProductservice magnetismNb of brandproductservice mentions researches
Brand knowledge(based on surveys amp perception studies)
Rate of adoption of the productsolution
Viral coefficient
Acquisition of visitorsNb of visitors (anyone who pays attention)Nb of visits on the websitephysical venueFirst contacts for business services(Direct Traffic + indirect traffic per channel)
Nb of single visitors (website physical venue for meetings) Gross adds net adds overall growth
Nb of customer requests about the productservice
ActivationNb of accountssessions created
Nb of proposals or demos required
Nb of app downloads
Social MediaFinancial services amp mobile payment
Nb of visitorsApp store rankingbased on number of downloads
Attract mdash Reporting use cases
Magnetism amp activation
KPI
Reporting
Tracking traffic Reach
bull As of March Snapchat reaches 90 of all 13-24 year-olds and 75 of all 13-34 year-olds in the USbull Our audience watching content on Discover every day has grown over 35 year-over-year
Square Investor Presentation May 2019 Asos 2018 financial report Snap 2019 Q1 amp Q2 earnings
Online fashion retailer
Ass
essi
ng
amp im
pro
vin
g c
ust
omer
val
ue
KPI
Reporting
AudienceAudience reach
KPI
Reporting
Engagement
will be critical regarding the potential of revenue and value creation driven by each customer
Once visitors engage with the productservice they become users Either paying or non-paying users (ex freemium models) participate to create value and impact the PampL directly or indirectly
Ass
essi
ng
amp im
pro
vin
g c
ust
omer
val
ue
Assessing EngagementConverting visitors into users and retaining them
Are visitors successfully converted into usersConversion
From visitors to users (Paying or non-paying)Total nb of active users (Gross adds Net addsTotal growth)Conversion rate (from visitors to users (paying or non-paying)Nb of contracts purchase membership abandonment rebound rate
From non-paying usersto paying usersConversion rate
Do these users become loyal and committed to the company
How many final users and how engaged are they
Retention
Paying amp non-paying usersDailymonthly active usersRetention rate Churn rateAverage lifespan of customers of returning customersUsage Nb of interactions average time spentvisits Nb of pages seen per session
Recurring users (paying)Average time between service contract renewals or purchasesNb of recurring buyers recurring purchase or service contracts (Nb of repeat purchasesnb of total purchases)
CommitmentNb of referrals amp sponsorshipsNb of new users drawnby existing users
Final user data
Nb of final usersTotal net adds gross addsgrowthDailymonthly active usersUser churn rate retention rate nb of returning users
UsageNb of interactions average time spentvisitsNb of pages seen per sessionFrequency of usageAverage lifespan of users
Engage mdash Reporting use casesA
sses
sing
amp im
prov
ing
cust
omer
val
ueA
sses
sin
g amp
imp
rovi
ng
cu
stom
er v
alu
e Telecom operatorFashion e-commerce company
Active usersPaying users
Conversion rate of first-time buyer into repeat buyer
From members to repeat buyers
KPI
Reporting
Users Retention of customers
Showroomprive 2018 results presentation SurveyMonkey yearly report 2018 VodafoneZiggo Presentation March 2019
Online surveys solution
KPI
Reporting
Churn rateNet adds
KPI
Reporting
Ass
essi
ng
amp im
pro
vin
g c
ust
omer
val
ue
Assessing LeverageMonetizing customers and maximizing value
Leveraging
means monetizingBy evaluating customersrsquo (including both visitors and users) impact on PampL value creation can be quantified monitored and optimized
What revenue is drawn directly from paying amp non-paying usersCustomer revenue
Direct revenue (paying users)Total amp average revenue per customer revenue from high value customer revenue from repeat customersARR per customerARPCOUpsell amp cross-sell rateRGUAverage basket value size GMV Nb of orders per customer
Indirect revenue (Non paying user)Total revenue per userARPUFCF per userARR per user
What are the costs for each user
What is the overall value generated by each user
Customer costs
Paying usersCAC (blended paid)Fulfillment cost ratioMarketing costs (channels costs Pay-per-click costs)
Non paying users costs (if applicable)User acquisition cost Marketing costs
Customer value creationEVcustomerCLV (per customer or per cohort)Contribution margin per customerContent created by customers
Cash impactFCF per customerPoor debt status Payment delays
Leverage mdash Reporting use casesA
sses
sing
amp im
prov
ing
cust
omer
val
ueA
sses
sin
g amp
imp
rovi
ng
cu
stom
er v
alu
e E-commerce companySocial media
Customer Acquisition CostAverage Revenue Per User (ARPU) worldwide amp per region
From members to repeat buyers
KPI
Reporting
Users Retention of customers
Facebook - Q2 2019 Results HelloFresh - Capital Markets Day 2018 Zalando Q2 2019 earnings
Meal kit delivery service
KPI
Reporting
Average ordersbasket sizeGMV per active customer
KPI
Reporting
Ass
essi
ng
amp im
pro
vin
g c
ust
omer
val
ue
Assessing ExperienceProviding a qualitative experience to maximize satisfaction
Customer experience
is a key enabler in the customer relation and will drive a companyrsquos ability to optimize its centricity and generate the best value from it Today most companies limit their attention to NPS or customer service indicators they need to push their analysis beyond
How well does the company know and adapt to its customersPersonalization
Knowledge of customersCustomer habits amp preference metricsCustomer profile
CurationAmount of dedicated contentAmount of customized products or servicesLevel of anticipation of choices and needsSingularity amp differentiation of the experience
How qualitative and seamless is the experience provided to customers
How positively do customers evaluate their global experience
Quality of experienceSimplicityFrictionless experience Ergonomy of the digital orphysical venue (app amp website loading time) and of the customer pathAdditional services Free trials return policies
EfficiencyCustomer relation First contact resolution and of resolved issues delay of answers and problem resolution timeDelivery amp delay timeInitial training time of employees
TrustUser protectionsafety of the productsolution data privacyEthics responsibility of the company respectful business practices
Satisfaction
Overall satisfactionProduct or service rankingNb of cancelled ordersCustomer Satisfaction ratescore (CSAT) NPSSocial sentiment ( of positive reaction positive vocabulary)
Experience satisfactionCustomer Effort Score Customer experience index (Forrester) System usability scaleLevel of emotion generated by the experience (Net Emotion Score)
Experience mdash Reporting use casesA
sses
sing
amp im
prov
ing
cust
omer
val
ueA
sses
sin
g amp
imp
rovi
ng
cu
stom
er v
alu
e Meal kit delivery serviceE-commerce conglomerate
Customer Acquisition CostAverage Revenue Per User (ARPU) worldwide amp per region
From membersto repeat buyers
KPI
Reporting
Users Retention of customers
Alibaba - Investor Day 2018 Europcar Mobility Group 2019 Capital Markets Day Blue Apron - Investor Presentation (Q3 18)
Rental amp mobility company
KPI
Reporting
Average ordersbasket sizeGMV per active customer
KPI
Reporting
Where do companies stand todayMain trends amp reporting practices
3
Wh
ere
do
com
pan
ies
stan
d t
oday
A lack of homogeneity in the customer-centric approach
General overview of CAC 40 companies compared to a panel of large digital natives(GAFAM social media e-commerce)
Deep dive on a sample of 35 various B2C companies both digital natives and traditional among a diversity of sectors Insurance Banking Social media Streaming Mobility Leisure Video games E-commerce Retail Food Tech Telecoms Energy
Mostly based on external reporting(2018-2019 results publications press releases)
With insights on internal reporting practices (Corporate blogs research articles white papers interviews)
Benchmark methodology Collection amp classification of customer-centric KPIs
In our study led about several French and international companies two main trends emerged
In general companies tend to report metrics related to all steps of the customer lifecycle (attractivity engagement leverage experience)
With a slight focus on customer engagement
A variety of KPIs
Customer-centric reporting practices still vary highly between digital players and more historical ones
Digital native companies were created with a stakeholder centric approach and a monitoringcommunication focused on customer KPIs from the beginning However even if other companies have initiated a deep transformation of their organization hardly any of them have really switched to a new reporting approach yet
A gap in reporting practices
Incumbents have not switched to a new reporting approach yet
Average number of customer KPIs reported
By digital nativecompanies
52By CAC 40companies
17Wh
ere
do
com
pan
ies
stan
d t
oday
Digital native companies leading on customer-centric reporting
Different models different practices
Customer-centric external reporting appears to be a standard for ldquodigital nativerdquo companies (Tech giants in e-commerce social media streaminghellip) However it remains less common among incumbents except for a few pioneering sectors like Telecoms
Communicateon at least one customer KPI
Number of customersSatisfaction metrics (mostly NPS)
Main KPIs
CAC 40 external reporting ldquoDigital nativesrdquo external reporting
0Have external
reporting mainly focused on
customer metrics
60
Such a gap can be explained by an uneven access to the customer different models and cultures and the difficulties encountered to change an historically different approach as well as the legacy business
Communicateon at least one customer KPI
Number of customers amp growthNumber of active customers ARPU
Main KPIs
50Have external
reporting mainly focused on
customer metrics
90
Overview of CAC 40 companies amp a panel of 10 large ldquodigital nativesrdquo
Areas of focus 25 of companies communicate on all 4 categories of KPIs
Wh
ere
do
com
pan
ies
stan
d t
oday
Companies focus on different aspects of the customer scope
94 of companies included in the benchmark report at least one metric related to Engage
Companies report KPIs related to all categories with a slight focus on engagement
A variety of KPIs reportedRepartition of KPIs collected
Number of customersReported by
53of benchmarkrsquos companies
Active customers 25
Total amp averagerevenue per user
Reported by 33
of benchmarkrsquos companies
Most reported KPIs
72 of companies included in the benchmark report at least one metric related to Experience
61 of companies included in the benchmark report at least one metric related to Leverage
42 of companies included in the benchmark report at least one metric related to Attract
Deep dive on a panel of thirty-five B2C companies with various industries and nationalities
Leverage28
Engage35
Attract14
Experience23
Number of ordersper customer
25
Customer profile 25
And for youThe path to customer KPI reporting
4
Selectingthe right KPIs
1
The path to customer-centric reportingTh
e p
ath
to
cust
omer
KP
I rep
orti
ng
A three-step plan to integrate customer KPIs into your reporting
Harnessing your KPIsInternally
amp externally
3Implementing
your KPIs
2
The
pat
h t
o cu
stom
er K
PI r
epor
tin
gSelecting the right KPIs
For each company its own KPIs adapted to its specific needs
A few examples of OMTM (one metric that matters)
OMTM Time between the 1st amp 2nd connexion
Strategic customer KPIs driving your financial performance
Focus on adequate KPIS providing actionable insights on your long-term financial performance
ldquoThe one metricthat mattersrdquo
Focus on the one metric that is most critical for your performance and that can be followed over time
Selecting therelevant metric
Temporality(can be contextualized)
RateRatio(comparable)
Intelligible(easily understandable)
Decision-oriented(actionable)
OMTM Nb of friends added in the 10 days after inscription
The
pat
h t
o cu
stom
er K
PI r
epor
tin
gImplementing your KPIs
A progressive process for a long-term approach
Complementary approachCustomer-centric reporting does not replace traditional financial indicators it brings complementary information in order to improve value creation
Starting internallyTo set sustainable customer-centric reporting start by following amp monitoring these KPIs internally before communicating externally on it
Engaging your teamsCEO CFO COO Operational teams Unit managers etc need to be familiarized with this new approach
Setting up tools amp guidelines to reach goalsSet specific objectives to be reached for every step of the way tools (automated data tracking etc) and a timeline of follow-up
Defining your level of action depending on your maturity on customer approachCollecting customer data analyzing to extract information andor leveraging data to engage actions
To optimize resource allocation
To segmentcustomers and identify new customer needs to
launch new offers
To monitorcompanyrsquos performance
The
pat
h t
o cu
stom
er K
PI r
epor
tin
gHarnessing your KPIs internally
Setting the internal purpose of your follow-up
Leveraging your KPIs internally
Who
Teams Executives Management Operationals
To monetize customer data to third
parties
The
pat
h t
o cu
stom
er K
PI r
epor
tin
gNike using Customer Lifetime Value to optimize resource allocation
Selecting and implementing CLV to better forecast customer value
Visitors paying or non paying users
ARPU (Direct amp Indirect revenue)Costscustomer (production servicehellip)
Number of customers
Profitper customer (PPC)
Customer lifespan (n)
CAC (Marketing advertising promotions hellip)
Acquisitioncost
1 ( 1 - retention rate)
Σk=1
nPPCk
(1 + WACC) k- CAC CLV =
Early 2018Nike acquires Zodiac
(consumer data analytics)to helps calculate CLV
In 2017Nike launches ldquoConsumer Direct Offenserdquo plan to improve direct
customer relation
The resultsBetter understanding of the
value of an individual customer enabled them to boost revenue
and retention with the right marketing recommendations
and offers
Customer Lifetime Valuation $Bn
The
pat
h t
o cu
stom
er K
PI r
epor
tin
gHarnessing your KPIs externally
Setting the external purpose of your follow-up
To measure your impact
To valueyour customer asset
and strategy
To educate on your model
Building on your KPIS externally
Who
Stakeholders Investors Partners Customers Media Regulators
Twitter valorizing customer capital to financial markets
+ 10Stock price
User acquisition KPI positively influences market reaction after disappointing forecasts
In the publication of its 2019 Q2 earnings Twitter published a
guidance adjusted downwards with revenue growth expected
to slow down and a disappointing forecast
And yet the companyrsquos market cap has been up following the
publication of its quarterly results driven by a better user acquisition growth which has pushed investors to focus on
mid-term potential
+ 5 millionDaily active users
The
pat
h t
o cu
stom
er K
PI r
epor
tin
g
Source MarketWatch July 26
The KPI toolbox for startersA few elements to begin with
New customer concerns and interests in social amp environmental issues impact the customer-business relationshipCustomers loyalty is now related to the companyrsquos external commitment
Stakeholders centricity soon to be integrated as a driver of customer value
The next move
Direct traffic Conversion rate Nb of active users Churn rate Recurring users ARPU CAC CLV NPS Customer habitsspecific to each company
Customer experience has been crucial for the success of new business models
It is key to gather experience KPIs on every step of the customer journey and to set specific objectives for each step
Offering the best experience tailored on customerrsquos specific needs must be an all-time preoccupation
The must haves
The underrated
game changer
The
pat
h t
o cu
stom
er K
PI r
epor
tin
g
Going further Download Fabernovel data mapping toolkit
The
pat
h t
o cu
stom
er K
PI r
epor
tin
g
Evaluate the level of maturity of your customer approach
And you how customer-centric are you
Click here for an overview of the index
To access the full version of the index you can contact us at axellericour-dumasfabernovelcom
Jean-Christophe LiaubetPartner
Jean-Christophe joined Fabernovel in 2017 as a Partner and founder of the valuation practice of the Group
With over 20 years of experience as an Equity Analyst and then Managing Director at Exane BNP Paribas he helps corporates make and value the best investment decisions
Gabrielle PeyrelongueValue analyst
Graduate from ESSEC Gabrielle joined Fabernovel in 2018 as a Value Analyst
She has worked within Fabernovel practices in Paris and San Francisco focusing on several projects including innovation strategy and new models of valuation based on extra financial criteria
Axelle Ricour-DumasValue Director
Axelle joined Fabernovel in 2018 as a Director after 20 years as Equity analyst at Cheuvreux Director of Investor Relations at IPSOS and Founder of her company MYFINADVICE
At Fabernovel she works on several projects of strategic advisory and has a strong expertise on the assessment and scoring of strategic projects
Jeacutereacutemy TaiumlebQuantitative analyst
Jeacutereacutemy joined Fabernovel as a quantitative analyst after graduating from CentraleSupelec and ESCP Europe
He specializes in quantitative finance and data analysis especially for tech companies and works on several projects including financial research financial modelling and ecosystem modelling
AuthorsC
red
its
An
nex
esKPIs glossary
ARPCOAverage Revenue Per Convergent Offer
ARPU (Average Revenue Per User)total of revenuestotal users ARRAnnual Recurring Revenue
Avg lifespan of customer (in months)1monthly churn
Cohort analysisanalysis based on consumersusers fragmentation
Customer acquisition cost total acquisition campaign costsnumber of new customers (CLVCAC ratio)
Customer concentrationbiggest customer revenuetotal revenue Customer Effort Scoremeasures satisfaction regarding the effort through customer journey
Contribution marginselling price per unit minus the variable cost per unit
LTV or CLV Customer lifetime valueARPU x 1CLV attrition rate Can also be based on FCF margins
DMT (Dureacutee Moyenne de Traitement)average processing time
First Call Resolutionfirst call resolution rate reflects customer service performance
Fulfillment Cost RatioFulfillment cost (Cost of sales amp distributionlogistic content creation services payments)revenue
GMV (Gross Merchandise Value)average nb of orders per customer x average basket size(after returns)
Marketing Cost Ratiomarketing costsrevenue
Net addsnew subscribers or customers - nb of unsubscribing
Net Promoter Score brand ambassadors - brand detractors
An
nex
esKPIs glossary
Network effectthe more a product is used the more its value increases(ex Facebook) each company has its own KPIs to assess it
Problem Resolution time(Sum of All Interactions for Total Resolved Issues - Total nb of Resolved Issues)
RGUsRevenue Generating Units (a customer can represent various RGUs for example when subscribing to a mobile phone contract + TV contract + internet rarr the customer represents 3 RGUs) Traffic sourcesdirect organichellip
Conversion ratepace at which the solutionproductservice has been adopted
Rebound ratecustomers leaving site without a chance to convert them
repeat purchaseNb of repeat purchasenb of total purchases
Requests rate with lowhigh level of added valuesimplerecurring customer service requests rate vs complex ones Retention rate(Nb of Customers at End of Period - nb of New Customers Acquired During Period)nb of Customers at Start of Period
Viralityspeed of productservice spread can be measured by k-value (average nb of invitations sent by each userconversion rate of invitations into new users)
An
nex
esCompanies analyzed in the benchmark
HelloFresh
Netflix
Orange
PSA
Showroomprive
Snap
Spotify
Square
Takewaycom
Twitch
Ubisoft
Vodafone
Zalando
Zynga
Activision Blizzard
Airbnb
AirFrance
Alibaba
Allianz
Amazon
Asos
Axa
Baidu
Blablacar
Blue Apron
BNP
Carrefour
Creacutedit Agricole
Easyjet
EDF
Engie
Europcar Mobility Group
Thank youCONTACT
Jean-Christophe LIAUBETPartner
+33 6 08 86 24 88jean-christopheliaubetFabernovelcom
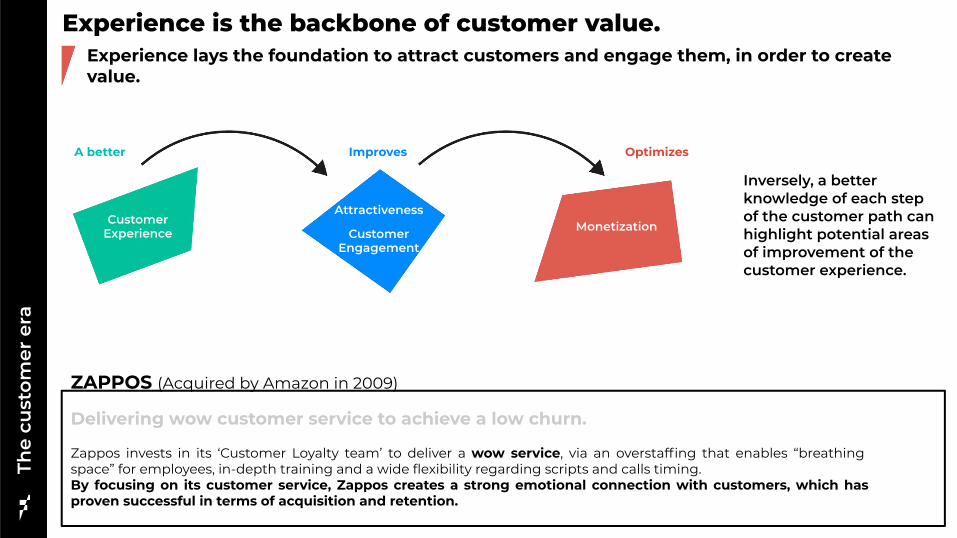
The
cust
omer
era
Experience is the backbone of customer value
Delivering wow customer service to achieve a low churn
Zappos invests in its lsquoCustomer Loyalty teamrsquo to deliver a wow service via an overstaffing that enables ldquobreathing spacerdquo for employees in-depth training and a wide flexibility regarding scripts and calls timing By focusing on its customer service Zappos creates a strong emotional connection with customers which has proven successful in terms of acquisition and retention
Experience lays the foundation to attract customers and engage them in order to create value
Inversely a better knowledge of each step of the customer path can highlight potential areas of improvement of the customer experience
A better
CustomerExperience
Attractiveness
CustomerEngagement
Monetization
Improves Optimizes
ZAPPOS (Acquired by Amazon in 2009)
How to assess amp improve customer value2
If you donrsquot measure it you canrsquot improve it
Lord Kelvin
Ass
essi
ng
amp im
pro
vin
g c
ust
omer
val
ue
Evaluating each step of the customer lifecycleMeasuring your customer centricity through each step of the customer path
The framework to evaluate a companyrsquos customer capital integrates4 complementary key blocks of KPIs that retrace every aspect of the customer scope
Attract Engage Leverage
Customer Experience
Capacity to acquire amp
activate visitors
Capacity to convert them into
customers amp engage them
Capacity to monetize your
customers
Improves resultsRely on a seamless
and satisfying experience
The framework will reflect the maturity of onersquos company on its customer centricity
Attractiveness
is the first key phase in the relationship to customers
raising awareness and acquiring new visitors There is no monetization at this stage thus no direct impact on the PampL but it will condition the rest of the value chain
Ass
essi
ng
amp im
pro
vin
g c
ust
omer
val
ue
Assessing attractiveness
How well does the company manage to reach a wide audience
How many new visitors does the company attractHow well are they activated (from someone paying attention to someone who takes action)
Attracting new visitors and activating them
Awareness
Company marketing reachNb of followers on social media
Nb of views of content published
Nb of reactions (likes claps)
Nb of attendees to events
Nb of subscriptions to newsletters clubs
BrandProductservice magnetismNb of brandproductservice mentions researches
Brand knowledge(based on surveys amp perception studies)
Rate of adoption of the productsolution
Viral coefficient
Acquisition of visitorsNb of visitors (anyone who pays attention)Nb of visits on the websitephysical venueFirst contacts for business services(Direct Traffic + indirect traffic per channel)
Nb of single visitors (website physical venue for meetings) Gross adds net adds overall growth
Nb of customer requests about the productservice
ActivationNb of accountssessions created
Nb of proposals or demos required
Nb of app downloads
Social MediaFinancial services amp mobile payment
Nb of visitorsApp store rankingbased on number of downloads
Attract mdash Reporting use cases
Magnetism amp activation
KPI
Reporting
Tracking traffic Reach
bull As of March Snapchat reaches 90 of all 13-24 year-olds and 75 of all 13-34 year-olds in the USbull Our audience watching content on Discover every day has grown over 35 year-over-year
Square Investor Presentation May 2019 Asos 2018 financial report Snap 2019 Q1 amp Q2 earnings
Online fashion retailer
Ass
essi
ng
amp im
pro
vin
g c
ust
omer
val
ue
KPI
Reporting
AudienceAudience reach
KPI
Reporting
Engagement
will be critical regarding the potential of revenue and value creation driven by each customer
Once visitors engage with the productservice they become users Either paying or non-paying users (ex freemium models) participate to create value and impact the PampL directly or indirectly
Ass
essi
ng
amp im
pro
vin
g c
ust
omer
val
ue
Assessing EngagementConverting visitors into users and retaining them
Are visitors successfully converted into usersConversion
From visitors to users (Paying or non-paying)Total nb of active users (Gross adds Net addsTotal growth)Conversion rate (from visitors to users (paying or non-paying)Nb of contracts purchase membership abandonment rebound rate
From non-paying usersto paying usersConversion rate
Do these users become loyal and committed to the company
How many final users and how engaged are they
Retention
Paying amp non-paying usersDailymonthly active usersRetention rate Churn rateAverage lifespan of customers of returning customersUsage Nb of interactions average time spentvisits Nb of pages seen per session
Recurring users (paying)Average time between service contract renewals or purchasesNb of recurring buyers recurring purchase or service contracts (Nb of repeat purchasesnb of total purchases)
CommitmentNb of referrals amp sponsorshipsNb of new users drawnby existing users
Final user data
Nb of final usersTotal net adds gross addsgrowthDailymonthly active usersUser churn rate retention rate nb of returning users
UsageNb of interactions average time spentvisitsNb of pages seen per sessionFrequency of usageAverage lifespan of users
Engage mdash Reporting use casesA
sses
sing
amp im
prov
ing
cust
omer
val
ueA
sses
sin
g amp
imp
rovi
ng
cu
stom
er v
alu
e Telecom operatorFashion e-commerce company
Active usersPaying users
Conversion rate of first-time buyer into repeat buyer
From members to repeat buyers
KPI
Reporting
Users Retention of customers
Showroomprive 2018 results presentation SurveyMonkey yearly report 2018 VodafoneZiggo Presentation March 2019
Online surveys solution
KPI
Reporting
Churn rateNet adds
KPI
Reporting
Ass
essi
ng
amp im
pro
vin
g c
ust
omer
val
ue
Assessing LeverageMonetizing customers and maximizing value
Leveraging
means monetizingBy evaluating customersrsquo (including both visitors and users) impact on PampL value creation can be quantified monitored and optimized
What revenue is drawn directly from paying amp non-paying usersCustomer revenue
Direct revenue (paying users)Total amp average revenue per customer revenue from high value customer revenue from repeat customersARR per customerARPCOUpsell amp cross-sell rateRGUAverage basket value size GMV Nb of orders per customer
Indirect revenue (Non paying user)Total revenue per userARPUFCF per userARR per user
What are the costs for each user
What is the overall value generated by each user
Customer costs
Paying usersCAC (blended paid)Fulfillment cost ratioMarketing costs (channels costs Pay-per-click costs)
Non paying users costs (if applicable)User acquisition cost Marketing costs
Customer value creationEVcustomerCLV (per customer or per cohort)Contribution margin per customerContent created by customers
Cash impactFCF per customerPoor debt status Payment delays
Leverage mdash Reporting use casesA
sses
sing
amp im
prov
ing
cust
omer
val
ueA
sses
sin
g amp
imp
rovi
ng
cu
stom
er v
alu
e E-commerce companySocial media
Customer Acquisition CostAverage Revenue Per User (ARPU) worldwide amp per region
From members to repeat buyers
KPI
Reporting
Users Retention of customers
Facebook - Q2 2019 Results HelloFresh - Capital Markets Day 2018 Zalando Q2 2019 earnings
Meal kit delivery service
KPI
Reporting
Average ordersbasket sizeGMV per active customer
KPI
Reporting
Ass
essi
ng
amp im
pro
vin
g c
ust
omer
val
ue
Assessing ExperienceProviding a qualitative experience to maximize satisfaction
Customer experience
is a key enabler in the customer relation and will drive a companyrsquos ability to optimize its centricity and generate the best value from it Today most companies limit their attention to NPS or customer service indicators they need to push their analysis beyond
How well does the company know and adapt to its customersPersonalization
Knowledge of customersCustomer habits amp preference metricsCustomer profile
CurationAmount of dedicated contentAmount of customized products or servicesLevel of anticipation of choices and needsSingularity amp differentiation of the experience
How qualitative and seamless is the experience provided to customers
How positively do customers evaluate their global experience
Quality of experienceSimplicityFrictionless experience Ergonomy of the digital orphysical venue (app amp website loading time) and of the customer pathAdditional services Free trials return policies
EfficiencyCustomer relation First contact resolution and of resolved issues delay of answers and problem resolution timeDelivery amp delay timeInitial training time of employees
TrustUser protectionsafety of the productsolution data privacyEthics responsibility of the company respectful business practices
Satisfaction
Overall satisfactionProduct or service rankingNb of cancelled ordersCustomer Satisfaction ratescore (CSAT) NPSSocial sentiment ( of positive reaction positive vocabulary)
Experience satisfactionCustomer Effort Score Customer experience index (Forrester) System usability scaleLevel of emotion generated by the experience (Net Emotion Score)
Experience mdash Reporting use casesA
sses
sing
amp im
prov
ing
cust
omer
val
ueA
sses
sin
g amp
imp
rovi
ng
cu
stom
er v
alu
e Meal kit delivery serviceE-commerce conglomerate
Customer Acquisition CostAverage Revenue Per User (ARPU) worldwide amp per region
From membersto repeat buyers
KPI
Reporting
Users Retention of customers
Alibaba - Investor Day 2018 Europcar Mobility Group 2019 Capital Markets Day Blue Apron - Investor Presentation (Q3 18)
Rental amp mobility company
KPI
Reporting
Average ordersbasket sizeGMV per active customer
KPI
Reporting
Where do companies stand todayMain trends amp reporting practices
3
Wh
ere
do
com
pan
ies
stan
d t
oday
A lack of homogeneity in the customer-centric approach
General overview of CAC 40 companies compared to a panel of large digital natives(GAFAM social media e-commerce)
Deep dive on a sample of 35 various B2C companies both digital natives and traditional among a diversity of sectors Insurance Banking Social media Streaming Mobility Leisure Video games E-commerce Retail Food Tech Telecoms Energy
Mostly based on external reporting(2018-2019 results publications press releases)
With insights on internal reporting practices (Corporate blogs research articles white papers interviews)
Benchmark methodology Collection amp classification of customer-centric KPIs
In our study led about several French and international companies two main trends emerged
In general companies tend to report metrics related to all steps of the customer lifecycle (attractivity engagement leverage experience)
With a slight focus on customer engagement
A variety of KPIs
Customer-centric reporting practices still vary highly between digital players and more historical ones
Digital native companies were created with a stakeholder centric approach and a monitoringcommunication focused on customer KPIs from the beginning However even if other companies have initiated a deep transformation of their organization hardly any of them have really switched to a new reporting approach yet
A gap in reporting practices
Incumbents have not switched to a new reporting approach yet
Average number of customer KPIs reported
By digital nativecompanies
52By CAC 40companies
17Wh
ere
do
com
pan
ies
stan
d t
oday
Digital native companies leading on customer-centric reporting
Different models different practices
Customer-centric external reporting appears to be a standard for ldquodigital nativerdquo companies (Tech giants in e-commerce social media streaminghellip) However it remains less common among incumbents except for a few pioneering sectors like Telecoms
Communicateon at least one customer KPI
Number of customersSatisfaction metrics (mostly NPS)
Main KPIs
CAC 40 external reporting ldquoDigital nativesrdquo external reporting
0Have external
reporting mainly focused on
customer metrics
60
Such a gap can be explained by an uneven access to the customer different models and cultures and the difficulties encountered to change an historically different approach as well as the legacy business
Communicateon at least one customer KPI
Number of customers amp growthNumber of active customers ARPU
Main KPIs
50Have external
reporting mainly focused on
customer metrics
90
Overview of CAC 40 companies amp a panel of 10 large ldquodigital nativesrdquo
Areas of focus 25 of companies communicate on all 4 categories of KPIs
Wh
ere
do
com
pan
ies
stan
d t
oday
Companies focus on different aspects of the customer scope
94 of companies included in the benchmark report at least one metric related to Engage
Companies report KPIs related to all categories with a slight focus on engagement
A variety of KPIs reportedRepartition of KPIs collected
Number of customersReported by
53of benchmarkrsquos companies
Active customers 25
Total amp averagerevenue per user
Reported by 33
of benchmarkrsquos companies
Most reported KPIs
72 of companies included in the benchmark report at least one metric related to Experience
61 of companies included in the benchmark report at least one metric related to Leverage
42 of companies included in the benchmark report at least one metric related to Attract
Deep dive on a panel of thirty-five B2C companies with various industries and nationalities
Leverage28
Engage35
Attract14
Experience23
Number of ordersper customer
25
Customer profile 25
And for youThe path to customer KPI reporting
4
Selectingthe right KPIs
1
The path to customer-centric reportingTh
e p
ath
to
cust
omer
KP
I rep
orti
ng
A three-step plan to integrate customer KPIs into your reporting
Harnessing your KPIsInternally
amp externally
3Implementing
your KPIs
2
The
pat
h t
o cu
stom
er K
PI r
epor
tin
gSelecting the right KPIs
For each company its own KPIs adapted to its specific needs
A few examples of OMTM (one metric that matters)
OMTM Time between the 1st amp 2nd connexion
Strategic customer KPIs driving your financial performance
Focus on adequate KPIS providing actionable insights on your long-term financial performance
ldquoThe one metricthat mattersrdquo
Focus on the one metric that is most critical for your performance and that can be followed over time
Selecting therelevant metric
Temporality(can be contextualized)
RateRatio(comparable)
Intelligible(easily understandable)
Decision-oriented(actionable)
OMTM Nb of friends added in the 10 days after inscription
The
pat
h t
o cu
stom
er K
PI r
epor
tin
gImplementing your KPIs
A progressive process for a long-term approach
Complementary approachCustomer-centric reporting does not replace traditional financial indicators it brings complementary information in order to improve value creation
Starting internallyTo set sustainable customer-centric reporting start by following amp monitoring these KPIs internally before communicating externally on it
Engaging your teamsCEO CFO COO Operational teams Unit managers etc need to be familiarized with this new approach
Setting up tools amp guidelines to reach goalsSet specific objectives to be reached for every step of the way tools (automated data tracking etc) and a timeline of follow-up
Defining your level of action depending on your maturity on customer approachCollecting customer data analyzing to extract information andor leveraging data to engage actions
To optimize resource allocation
To segmentcustomers and identify new customer needs to
launch new offers
To monitorcompanyrsquos performance
The
pat
h t
o cu
stom
er K
PI r
epor
tin
gHarnessing your KPIs internally
Setting the internal purpose of your follow-up
Leveraging your KPIs internally
Who
Teams Executives Management Operationals
To monetize customer data to third
parties
The
pat
h t
o cu
stom
er K
PI r
epor
tin
gNike using Customer Lifetime Value to optimize resource allocation
Selecting and implementing CLV to better forecast customer value
Visitors paying or non paying users
ARPU (Direct amp Indirect revenue)Costscustomer (production servicehellip)
Number of customers
Profitper customer (PPC)
Customer lifespan (n)
CAC (Marketing advertising promotions hellip)
Acquisitioncost
1 ( 1 - retention rate)
Σk=1
nPPCk
(1 + WACC) k- CAC CLV =
Early 2018Nike acquires Zodiac
(consumer data analytics)to helps calculate CLV
In 2017Nike launches ldquoConsumer Direct Offenserdquo plan to improve direct
customer relation
The resultsBetter understanding of the
value of an individual customer enabled them to boost revenue
and retention with the right marketing recommendations
and offers
Customer Lifetime Valuation $Bn
The
pat
h t
o cu
stom
er K
PI r
epor
tin
gHarnessing your KPIs externally
Setting the external purpose of your follow-up
To measure your impact
To valueyour customer asset
and strategy
To educate on your model
Building on your KPIS externally
Who
Stakeholders Investors Partners Customers Media Regulators
Twitter valorizing customer capital to financial markets
+ 10Stock price
User acquisition KPI positively influences market reaction after disappointing forecasts
In the publication of its 2019 Q2 earnings Twitter published a
guidance adjusted downwards with revenue growth expected
to slow down and a disappointing forecast
And yet the companyrsquos market cap has been up following the
publication of its quarterly results driven by a better user acquisition growth which has pushed investors to focus on
mid-term potential
+ 5 millionDaily active users
The
pat
h t
o cu
stom
er K
PI r
epor
tin
g
Source MarketWatch July 26
The KPI toolbox for startersA few elements to begin with
New customer concerns and interests in social amp environmental issues impact the customer-business relationshipCustomers loyalty is now related to the companyrsquos external commitment
Stakeholders centricity soon to be integrated as a driver of customer value
The next move
Direct traffic Conversion rate Nb of active users Churn rate Recurring users ARPU CAC CLV NPS Customer habitsspecific to each company
Customer experience has been crucial for the success of new business models
It is key to gather experience KPIs on every step of the customer journey and to set specific objectives for each step
Offering the best experience tailored on customerrsquos specific needs must be an all-time preoccupation
The must haves
The underrated
game changer
The
pat
h t
o cu
stom
er K
PI r
epor
tin
g
Going further Download Fabernovel data mapping toolkit
The
pat
h t
o cu
stom
er K
PI r
epor
tin
g
Evaluate the level of maturity of your customer approach
And you how customer-centric are you
Click here for an overview of the index
To access the full version of the index you can contact us at axellericour-dumasfabernovelcom
Jean-Christophe LiaubetPartner
Jean-Christophe joined Fabernovel in 2017 as a Partner and founder of the valuation practice of the Group
With over 20 years of experience as an Equity Analyst and then Managing Director at Exane BNP Paribas he helps corporates make and value the best investment decisions
Gabrielle PeyrelongueValue analyst
Graduate from ESSEC Gabrielle joined Fabernovel in 2018 as a Value Analyst
She has worked within Fabernovel practices in Paris and San Francisco focusing on several projects including innovation strategy and new models of valuation based on extra financial criteria
Axelle Ricour-DumasValue Director
Axelle joined Fabernovel in 2018 as a Director after 20 years as Equity analyst at Cheuvreux Director of Investor Relations at IPSOS and Founder of her company MYFINADVICE
At Fabernovel she works on several projects of strategic advisory and has a strong expertise on the assessment and scoring of strategic projects
Jeacutereacutemy TaiumlebQuantitative analyst
Jeacutereacutemy joined Fabernovel as a quantitative analyst after graduating from CentraleSupelec and ESCP Europe
He specializes in quantitative finance and data analysis especially for tech companies and works on several projects including financial research financial modelling and ecosystem modelling
AuthorsC
red
its
An
nex
esKPIs glossary
ARPCOAverage Revenue Per Convergent Offer
ARPU (Average Revenue Per User)total of revenuestotal users ARRAnnual Recurring Revenue
Avg lifespan of customer (in months)1monthly churn
Cohort analysisanalysis based on consumersusers fragmentation
Customer acquisition cost total acquisition campaign costsnumber of new customers (CLVCAC ratio)
Customer concentrationbiggest customer revenuetotal revenue Customer Effort Scoremeasures satisfaction regarding the effort through customer journey
Contribution marginselling price per unit minus the variable cost per unit
LTV or CLV Customer lifetime valueARPU x 1CLV attrition rate Can also be based on FCF margins
DMT (Dureacutee Moyenne de Traitement)average processing time
First Call Resolutionfirst call resolution rate reflects customer service performance
Fulfillment Cost RatioFulfillment cost (Cost of sales amp distributionlogistic content creation services payments)revenue
GMV (Gross Merchandise Value)average nb of orders per customer x average basket size(after returns)
Marketing Cost Ratiomarketing costsrevenue
Net addsnew subscribers or customers - nb of unsubscribing
Net Promoter Score brand ambassadors - brand detractors
An
nex
esKPIs glossary
Network effectthe more a product is used the more its value increases(ex Facebook) each company has its own KPIs to assess it
Problem Resolution time(Sum of All Interactions for Total Resolved Issues - Total nb of Resolved Issues)
RGUsRevenue Generating Units (a customer can represent various RGUs for example when subscribing to a mobile phone contract + TV contract + internet rarr the customer represents 3 RGUs) Traffic sourcesdirect organichellip
Conversion ratepace at which the solutionproductservice has been adopted
Rebound ratecustomers leaving site without a chance to convert them
repeat purchaseNb of repeat purchasenb of total purchases
Requests rate with lowhigh level of added valuesimplerecurring customer service requests rate vs complex ones Retention rate(Nb of Customers at End of Period - nb of New Customers Acquired During Period)nb of Customers at Start of Period
Viralityspeed of productservice spread can be measured by k-value (average nb of invitations sent by each userconversion rate of invitations into new users)
An
nex
esCompanies analyzed in the benchmark
HelloFresh
Netflix
Orange
PSA
Showroomprive
Snap
Spotify
Square
Takewaycom
Twitch
Ubisoft
Vodafone
Zalando
Zynga
Activision Blizzard
Airbnb
AirFrance
Alibaba
Allianz
Amazon
Asos
Axa
Baidu
Blablacar
Blue Apron
BNP
Carrefour
Creacutedit Agricole
Easyjet
EDF
Engie
Europcar Mobility Group
Thank youCONTACT
Jean-Christophe LIAUBETPartner
+33 6 08 86 24 88jean-christopheliaubetFabernovelcom
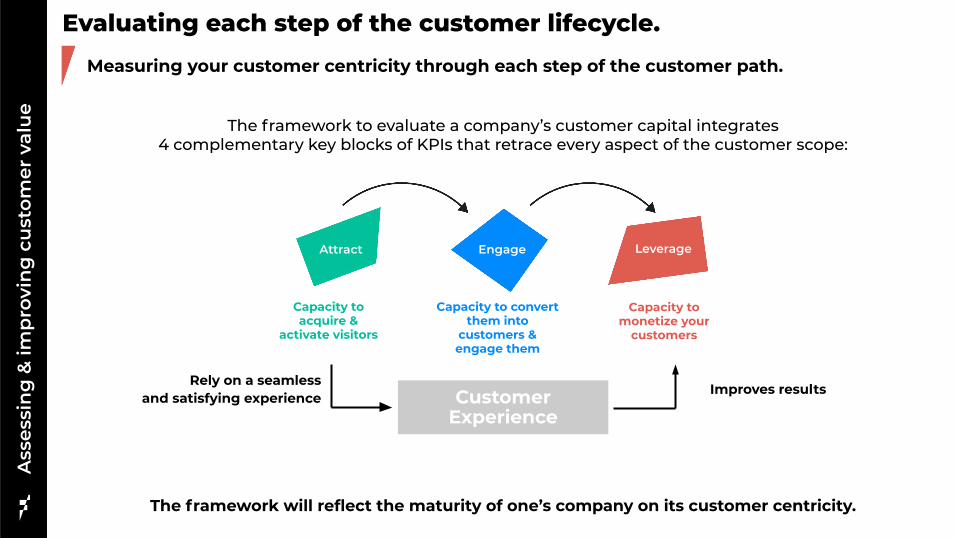
Ass
essi
ng
amp im
pro
vin
g c
ust
omer
val
ue
Evaluating each step of the customer lifecycleMeasuring your customer centricity through each step of the customer path
The framework to evaluate a companyrsquos customer capital integrates4 complementary key blocks of KPIs that retrace every aspect of the customer scope
Attract Engage Leverage
Customer Experience
Capacity to acquire amp
activate visitors
Capacity to convert them into
customers amp engage them
Capacity to monetize your
customers
Improves resultsRely on a seamless
and satisfying experience
The framework will reflect the maturity of onersquos company on its customer centricity
Attractiveness
is the first key phase in the relationship to customers
raising awareness and acquiring new visitors There is no monetization at this stage thus no direct impact on the PampL but it will condition the rest of the value chain
Ass
essi
ng
amp im
pro
vin
g c
ust
omer
val
ue
Assessing attractiveness
How well does the company manage to reach a wide audience
How many new visitors does the company attractHow well are they activated (from someone paying attention to someone who takes action)
Attracting new visitors and activating them
Awareness
Company marketing reachNb of followers on social media
Nb of views of content published
Nb of reactions (likes claps)
Nb of attendees to events
Nb of subscriptions to newsletters clubs
BrandProductservice magnetismNb of brandproductservice mentions researches
Brand knowledge(based on surveys amp perception studies)
Rate of adoption of the productsolution
Viral coefficient
Acquisition of visitorsNb of visitors (anyone who pays attention)Nb of visits on the websitephysical venueFirst contacts for business services(Direct Traffic + indirect traffic per channel)
Nb of single visitors (website physical venue for meetings) Gross adds net adds overall growth
Nb of customer requests about the productservice
ActivationNb of accountssessions created
Nb of proposals or demos required
Nb of app downloads
Social MediaFinancial services amp mobile payment
Nb of visitorsApp store rankingbased on number of downloads
Attract mdash Reporting use cases
Magnetism amp activation
KPI
Reporting
Tracking traffic Reach
bull As of March Snapchat reaches 90 of all 13-24 year-olds and 75 of all 13-34 year-olds in the USbull Our audience watching content on Discover every day has grown over 35 year-over-year
Square Investor Presentation May 2019 Asos 2018 financial report Snap 2019 Q1 amp Q2 earnings
Online fashion retailer
Ass
essi
ng
amp im
pro
vin
g c
ust
omer
val
ue
KPI
Reporting
AudienceAudience reach
KPI
Reporting
Engagement
will be critical regarding the potential of revenue and value creation driven by each customer
Once visitors engage with the productservice they become users Either paying or non-paying users (ex freemium models) participate to create value and impact the PampL directly or indirectly
Ass
essi
ng
amp im
pro
vin
g c
ust
omer
val
ue
Assessing EngagementConverting visitors into users and retaining them
Are visitors successfully converted into usersConversion
From visitors to users (Paying or non-paying)Total nb of active users (Gross adds Net addsTotal growth)Conversion rate (from visitors to users (paying or non-paying)Nb of contracts purchase membership abandonment rebound rate
From non-paying usersto paying usersConversion rate
Do these users become loyal and committed to the company
How many final users and how engaged are they
Retention
Paying amp non-paying usersDailymonthly active usersRetention rate Churn rateAverage lifespan of customers of returning customersUsage Nb of interactions average time spentvisits Nb of pages seen per session
Recurring users (paying)Average time between service contract renewals or purchasesNb of recurring buyers recurring purchase or service contracts (Nb of repeat purchasesnb of total purchases)
CommitmentNb of referrals amp sponsorshipsNb of new users drawnby existing users
Final user data
Nb of final usersTotal net adds gross addsgrowthDailymonthly active usersUser churn rate retention rate nb of returning users
UsageNb of interactions average time spentvisitsNb of pages seen per sessionFrequency of usageAverage lifespan of users
Engage mdash Reporting use casesA
sses
sing
amp im
prov
ing
cust
omer
val
ueA
sses
sin
g amp
imp
rovi
ng
cu
stom
er v
alu
e Telecom operatorFashion e-commerce company
Active usersPaying users
Conversion rate of first-time buyer into repeat buyer
From members to repeat buyers
KPI
Reporting
Users Retention of customers
Showroomprive 2018 results presentation SurveyMonkey yearly report 2018 VodafoneZiggo Presentation March 2019
Online surveys solution
KPI
Reporting
Churn rateNet adds
KPI
Reporting
Ass
essi
ng
amp im
pro
vin
g c
ust
omer
val
ue
Assessing LeverageMonetizing customers and maximizing value
Leveraging
means monetizingBy evaluating customersrsquo (including both visitors and users) impact on PampL value creation can be quantified monitored and optimized
What revenue is drawn directly from paying amp non-paying usersCustomer revenue
Direct revenue (paying users)Total amp average revenue per customer revenue from high value customer revenue from repeat customersARR per customerARPCOUpsell amp cross-sell rateRGUAverage basket value size GMV Nb of orders per customer
Indirect revenue (Non paying user)Total revenue per userARPUFCF per userARR per user
What are the costs for each user
What is the overall value generated by each user
Customer costs
Paying usersCAC (blended paid)Fulfillment cost ratioMarketing costs (channels costs Pay-per-click costs)
Non paying users costs (if applicable)User acquisition cost Marketing costs
Customer value creationEVcustomerCLV (per customer or per cohort)Contribution margin per customerContent created by customers
Cash impactFCF per customerPoor debt status Payment delays
Leverage mdash Reporting use casesA
sses
sing
amp im
prov
ing
cust
omer
val
ueA
sses
sin
g amp
imp
rovi
ng
cu
stom
er v
alu
e E-commerce companySocial media
Customer Acquisition CostAverage Revenue Per User (ARPU) worldwide amp per region
From members to repeat buyers
KPI
Reporting
Users Retention of customers
Facebook - Q2 2019 Results HelloFresh - Capital Markets Day 2018 Zalando Q2 2019 earnings
Meal kit delivery service
KPI
Reporting
Average ordersbasket sizeGMV per active customer
KPI
Reporting
Ass
essi
ng
amp im
pro
vin
g c
ust
omer
val
ue
Assessing ExperienceProviding a qualitative experience to maximize satisfaction
Customer experience
is a key enabler in the customer relation and will drive a companyrsquos ability to optimize its centricity and generate the best value from it Today most companies limit their attention to NPS or customer service indicators they need to push their analysis beyond
How well does the company know and adapt to its customersPersonalization
Knowledge of customersCustomer habits amp preference metricsCustomer profile
CurationAmount of dedicated contentAmount of customized products or servicesLevel of anticipation of choices and needsSingularity amp differentiation of the experience
How qualitative and seamless is the experience provided to customers
How positively do customers evaluate their global experience
Quality of experienceSimplicityFrictionless experience Ergonomy of the digital orphysical venue (app amp website loading time) and of the customer pathAdditional services Free trials return policies
EfficiencyCustomer relation First contact resolution and of resolved issues delay of answers and problem resolution timeDelivery amp delay timeInitial training time of employees
TrustUser protectionsafety of the productsolution data privacyEthics responsibility of the company respectful business practices
Satisfaction
Overall satisfactionProduct or service rankingNb of cancelled ordersCustomer Satisfaction ratescore (CSAT) NPSSocial sentiment ( of positive reaction positive vocabulary)
Experience satisfactionCustomer Effort Score Customer experience index (Forrester) System usability scaleLevel of emotion generated by the experience (Net Emotion Score)
Experience mdash Reporting use casesA
sses
sing
amp im
prov
ing
cust
omer
val
ueA
sses
sin
g amp
imp
rovi
ng
cu
stom
er v
alu
e Meal kit delivery serviceE-commerce conglomerate
Customer Acquisition CostAverage Revenue Per User (ARPU) worldwide amp per region
From membersto repeat buyers
KPI
Reporting
Users Retention of customers
Alibaba - Investor Day 2018 Europcar Mobility Group 2019 Capital Markets Day Blue Apron - Investor Presentation (Q3 18)
Rental amp mobility company
KPI
Reporting
Average ordersbasket sizeGMV per active customer
KPI
Reporting
Where do companies stand todayMain trends amp reporting practices
3
Wh
ere
do
com
pan
ies
stan
d t
oday
A lack of homogeneity in the customer-centric approach
General overview of CAC 40 companies compared to a panel of large digital natives(GAFAM social media e-commerce)
Deep dive on a sample of 35 various B2C companies both digital natives and traditional among a diversity of sectors Insurance Banking Social media Streaming Mobility Leisure Video games E-commerce Retail Food Tech Telecoms Energy
Mostly based on external reporting(2018-2019 results publications press releases)
With insights on internal reporting practices (Corporate blogs research articles white papers interviews)
Benchmark methodology Collection amp classification of customer-centric KPIs
In our study led about several French and international companies two main trends emerged
In general companies tend to report metrics related to all steps of the customer lifecycle (attractivity engagement leverage experience)
With a slight focus on customer engagement
A variety of KPIs
Customer-centric reporting practices still vary highly between digital players and more historical ones
Digital native companies were created with a stakeholder centric approach and a monitoringcommunication focused on customer KPIs from the beginning However even if other companies have initiated a deep transformation of their organization hardly any of them have really switched to a new reporting approach yet
A gap in reporting practices
Incumbents have not switched to a new reporting approach yet
Average number of customer KPIs reported
By digital nativecompanies
52By CAC 40companies
17Wh
ere
do
com
pan
ies
stan
d t
oday
Digital native companies leading on customer-centric reporting
Different models different practices
Customer-centric external reporting appears to be a standard for ldquodigital nativerdquo companies (Tech giants in e-commerce social media streaminghellip) However it remains less common among incumbents except for a few pioneering sectors like Telecoms
Communicateon at least one customer KPI
Number of customersSatisfaction metrics (mostly NPS)
Main KPIs
CAC 40 external reporting ldquoDigital nativesrdquo external reporting
0Have external
reporting mainly focused on
customer metrics
60
Such a gap can be explained by an uneven access to the customer different models and cultures and the difficulties encountered to change an historically different approach as well as the legacy business
Communicateon at least one customer KPI
Number of customers amp growthNumber of active customers ARPU
Main KPIs
50Have external
reporting mainly focused on
customer metrics
90
Overview of CAC 40 companies amp a panel of 10 large ldquodigital nativesrdquo
Areas of focus 25 of companies communicate on all 4 categories of KPIs
Wh
ere
do
com
pan
ies
stan
d t
oday
Companies focus on different aspects of the customer scope
94 of companies included in the benchmark report at least one metric related to Engage
Companies report KPIs related to all categories with a slight focus on engagement
A variety of KPIs reportedRepartition of KPIs collected
Number of customersReported by
53of benchmarkrsquos companies
Active customers 25
Total amp averagerevenue per user
Reported by 33
of benchmarkrsquos companies
Most reported KPIs
72 of companies included in the benchmark report at least one metric related to Experience
61 of companies included in the benchmark report at least one metric related to Leverage
42 of companies included in the benchmark report at least one metric related to Attract
Deep dive on a panel of thirty-five B2C companies with various industries and nationalities
Leverage28
Engage35
Attract14
Experience23
Number of ordersper customer
25
Customer profile 25
And for youThe path to customer KPI reporting
4
Selectingthe right KPIs
1
The path to customer-centric reportingTh
e p
ath
to
cust
omer
KP
I rep
orti
ng
A three-step plan to integrate customer KPIs into your reporting
Harnessing your KPIsInternally
amp externally
3Implementing
your KPIs
2
The
pat
h t
o cu
stom
er K
PI r
epor
tin
gSelecting the right KPIs
For each company its own KPIs adapted to its specific needs
A few examples of OMTM (one metric that matters)
OMTM Time between the 1st amp 2nd connexion
Strategic customer KPIs driving your financial performance
Focus on adequate KPIS providing actionable insights on your long-term financial performance
ldquoThe one metricthat mattersrdquo
Focus on the one metric that is most critical for your performance and that can be followed over time
Selecting therelevant metric
Temporality(can be contextualized)
RateRatio(comparable)
Intelligible(easily understandable)
Decision-oriented(actionable)
OMTM Nb of friends added in the 10 days after inscription
The
pat
h t
o cu
stom
er K
PI r
epor
tin
gImplementing your KPIs
A progressive process for a long-term approach
Complementary approachCustomer-centric reporting does not replace traditional financial indicators it brings complementary information in order to improve value creation
Starting internallyTo set sustainable customer-centric reporting start by following amp monitoring these KPIs internally before communicating externally on it
Engaging your teamsCEO CFO COO Operational teams Unit managers etc need to be familiarized with this new approach
Setting up tools amp guidelines to reach goalsSet specific objectives to be reached for every step of the way tools (automated data tracking etc) and a timeline of follow-up
Defining your level of action depending on your maturity on customer approachCollecting customer data analyzing to extract information andor leveraging data to engage actions
To optimize resource allocation
To segmentcustomers and identify new customer needs to
launch new offers
To monitorcompanyrsquos performance
The
pat
h t
o cu
stom
er K
PI r
epor
tin
gHarnessing your KPIs internally
Setting the internal purpose of your follow-up
Leveraging your KPIs internally
Who
Teams Executives Management Operationals
To monetize customer data to third
parties
The
pat
h t
o cu
stom
er K
PI r
epor
tin
gNike using Customer Lifetime Value to optimize resource allocation
Selecting and implementing CLV to better forecast customer value
Visitors paying or non paying users
ARPU (Direct amp Indirect revenue)Costscustomer (production servicehellip)
Number of customers
Profitper customer (PPC)
Customer lifespan (n)
CAC (Marketing advertising promotions hellip)
Acquisitioncost
1 ( 1 - retention rate)
Σk=1
nPPCk
(1 + WACC) k- CAC CLV =
Early 2018Nike acquires Zodiac
(consumer data analytics)to helps calculate CLV
In 2017Nike launches ldquoConsumer Direct Offenserdquo plan to improve direct
customer relation
The resultsBetter understanding of the
value of an individual customer enabled them to boost revenue
and retention with the right marketing recommendations
and offers
Customer Lifetime Valuation $Bn
The
pat
h t
o cu
stom
er K
PI r
epor
tin
gHarnessing your KPIs externally
Setting the external purpose of your follow-up
To measure your impact
To valueyour customer asset
and strategy
To educate on your model
Building on your KPIS externally
Who
Stakeholders Investors Partners Customers Media Regulators
Twitter valorizing customer capital to financial markets
+ 10Stock price
User acquisition KPI positively influences market reaction after disappointing forecasts
In the publication of its 2019 Q2 earnings Twitter published a
guidance adjusted downwards with revenue growth expected
to slow down and a disappointing forecast
And yet the companyrsquos market cap has been up following the
publication of its quarterly results driven by a better user acquisition growth which has pushed investors to focus on
mid-term potential
+ 5 millionDaily active users
The
pat
h t
o cu
stom
er K
PI r
epor
tin
g
Source MarketWatch July 26
The KPI toolbox for startersA few elements to begin with
New customer concerns and interests in social amp environmental issues impact the customer-business relationshipCustomers loyalty is now related to the companyrsquos external commitment
Stakeholders centricity soon to be integrated as a driver of customer value
The next move
Direct traffic Conversion rate Nb of active users Churn rate Recurring users ARPU CAC CLV NPS Customer habitsspecific to each company
Customer experience has been crucial for the success of new business models
It is key to gather experience KPIs on every step of the customer journey and to set specific objectives for each step
Offering the best experience tailored on customerrsquos specific needs must be an all-time preoccupation
The must haves
The underrated
game changer
The
pat
h t
o cu
stom
er K
PI r
epor
tin
g
Going further Download Fabernovel data mapping toolkit
The
pat
h t
o cu
stom
er K
PI r
epor
tin
g
Evaluate the level of maturity of your customer approach
And you how customer-centric are you
Click here for an overview of the index
To access the full version of the index you can contact us at axellericour-dumasfabernovelcom
Jean-Christophe LiaubetPartner
Jean-Christophe joined Fabernovel in 2017 as a Partner and founder of the valuation practice of the Group
With over 20 years of experience as an Equity Analyst and then Managing Director at Exane BNP Paribas he helps corporates make and value the best investment decisions
Gabrielle PeyrelongueValue analyst
Graduate from ESSEC Gabrielle joined Fabernovel in 2018 as a Value Analyst
She has worked within Fabernovel practices in Paris and San Francisco focusing on several projects including innovation strategy and new models of valuation based on extra financial criteria
Axelle Ricour-DumasValue Director
Axelle joined Fabernovel in 2018 as a Director after 20 years as Equity analyst at Cheuvreux Director of Investor Relations at IPSOS and Founder of her company MYFINADVICE
At Fabernovel she works on several projects of strategic advisory and has a strong expertise on the assessment and scoring of strategic projects
Jeacutereacutemy TaiumlebQuantitative analyst
Jeacutereacutemy joined Fabernovel as a quantitative analyst after graduating from CentraleSupelec and ESCP Europe
He specializes in quantitative finance and data analysis especially for tech companies and works on several projects including financial research financial modelling and ecosystem modelling
AuthorsC
red
its
An
nex
esKPIs glossary
ARPCOAverage Revenue Per Convergent Offer
ARPU (Average Revenue Per User)total of revenuestotal users ARRAnnual Recurring Revenue
Avg lifespan of customer (in months)1monthly churn
Cohort analysisanalysis based on consumersusers fragmentation
Customer acquisition cost total acquisition campaign costsnumber of new customers (CLVCAC ratio)
Customer concentrationbiggest customer revenuetotal revenue Customer Effort Scoremeasures satisfaction regarding the effort through customer journey
Contribution marginselling price per unit minus the variable cost per unit
LTV or CLV Customer lifetime valueARPU x 1CLV attrition rate Can also be based on FCF margins
DMT (Dureacutee Moyenne de Traitement)average processing time
First Call Resolutionfirst call resolution rate reflects customer service performance
Fulfillment Cost RatioFulfillment cost (Cost of sales amp distributionlogistic content creation services payments)revenue
GMV (Gross Merchandise Value)average nb of orders per customer x average basket size(after returns)
Marketing Cost Ratiomarketing costsrevenue
Net addsnew subscribers or customers - nb of unsubscribing
Net Promoter Score brand ambassadors - brand detractors
An
nex
esKPIs glossary
Network effectthe more a product is used the more its value increases(ex Facebook) each company has its own KPIs to assess it
Problem Resolution time(Sum of All Interactions for Total Resolved Issues - Total nb of Resolved Issues)
RGUsRevenue Generating Units (a customer can represent various RGUs for example when subscribing to a mobile phone contract + TV contract + internet rarr the customer represents 3 RGUs) Traffic sourcesdirect organichellip
Conversion ratepace at which the solutionproductservice has been adopted
Rebound ratecustomers leaving site without a chance to convert them
repeat purchaseNb of repeat purchasenb of total purchases
Requests rate with lowhigh level of added valuesimplerecurring customer service requests rate vs complex ones Retention rate(Nb of Customers at End of Period - nb of New Customers Acquired During Period)nb of Customers at Start of Period
Viralityspeed of productservice spread can be measured by k-value (average nb of invitations sent by each userconversion rate of invitations into new users)
An
nex
esCompanies analyzed in the benchmark
HelloFresh
Netflix
Orange
PSA
Showroomprive
Snap
Spotify
Square
Takewaycom
Twitch
Ubisoft
Vodafone
Zalando
Zynga
Activision Blizzard
Airbnb
AirFrance
Alibaba
Allianz
Amazon
Asos
Axa
Baidu
Blablacar
Blue Apron
BNP
Carrefour
Creacutedit Agricole
Easyjet
EDF
Engie
Europcar Mobility Group
Thank youCONTACT
Jean-Christophe LIAUBETPartner
+33 6 08 86 24 88jean-christopheliaubetFabernovelcom
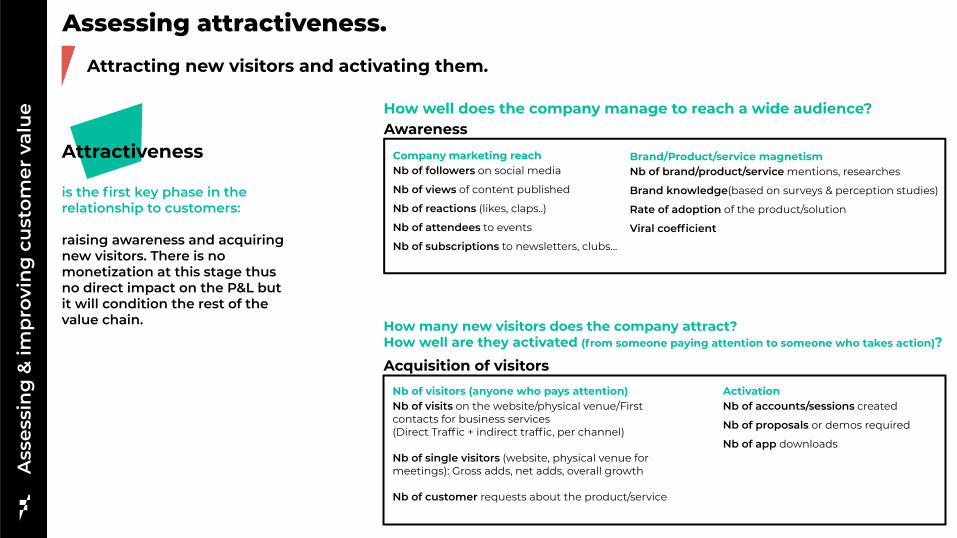
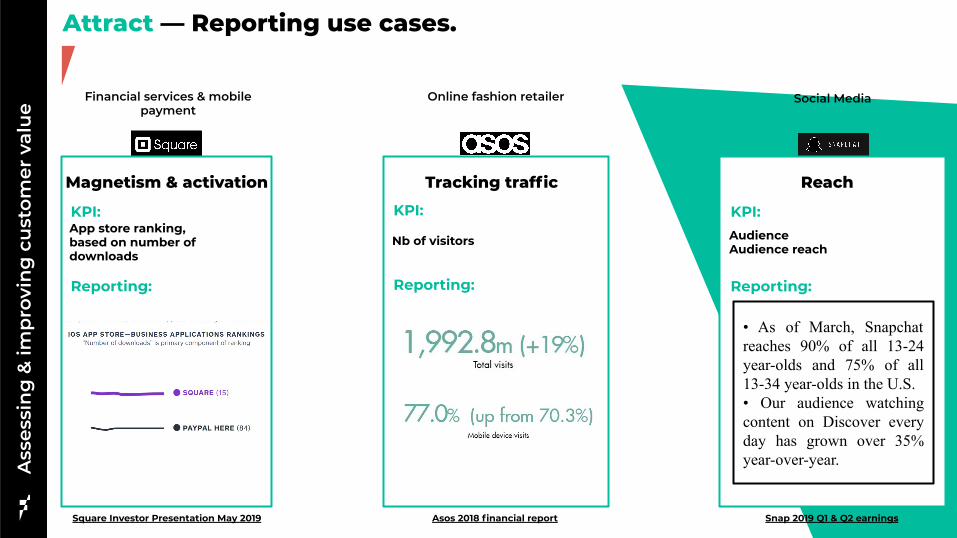
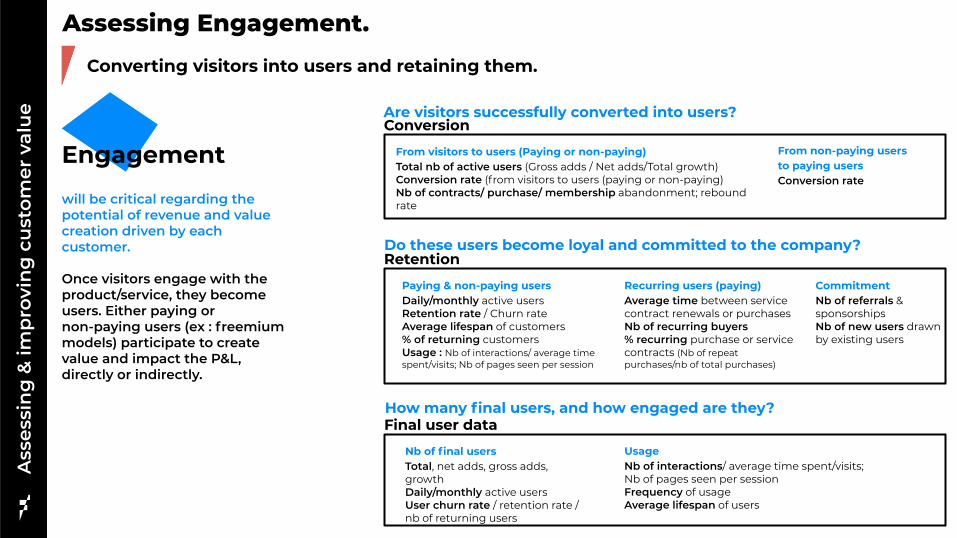
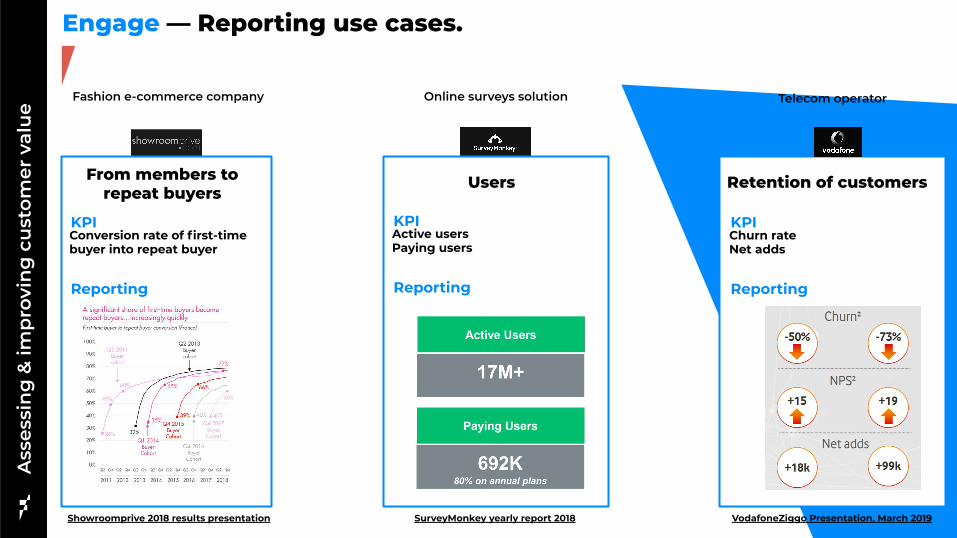
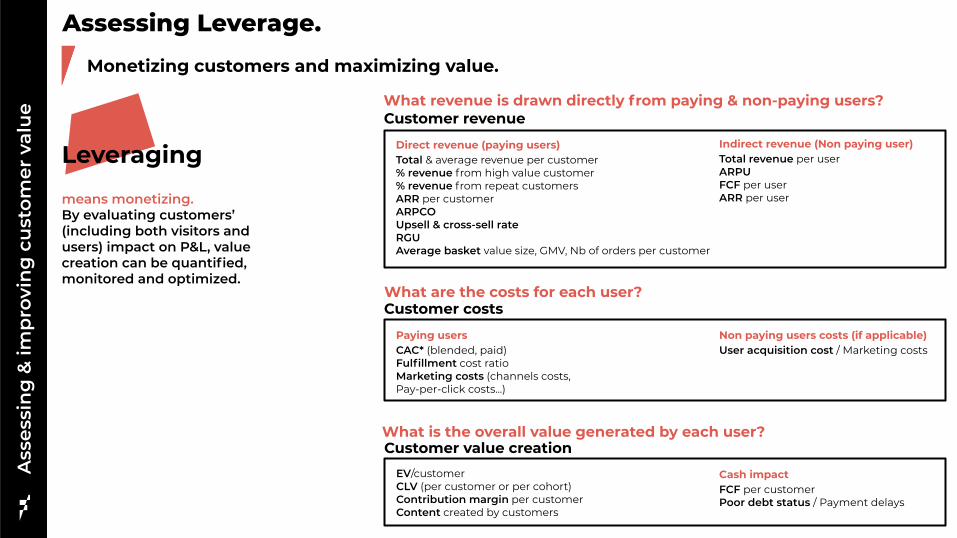
Ass
essi
ng
amp im
pro
vin
g c
ust
omer
val
ue
Assessing LeverageMonetizing customers and maximizing value
Leveraging
means monetizingBy evaluating customersrsquo (including both visitors and users) impact on PampL value creation can be quantified monitored and optimized
What revenue is drawn directly from paying amp non-paying usersCustomer revenue
Direct revenue (paying users)Total amp average revenue per customer revenue from high value customer revenue from repeat customersARR per customerARPCOUpsell amp cross-sell rateRGUAverage basket value size GMV Nb of orders per customer
Indirect revenue (Non paying user)Total revenue per userARPUFCF per userARR per user
What are the costs for each user
What is the overall value generated by each user
Customer costs
Paying usersCAC (blended paid)Fulfillment cost ratioMarketing costs (channels costs Pay-per-click costs)
Non paying users costs (if applicable)User acquisition cost Marketing costs
Customer value creationEVcustomerCLV (per customer or per cohort)Contribution margin per customerContent created by customers
Cash impactFCF per customerPoor debt status Payment delays
Leverage mdash Reporting use casesA
sses
sing
amp im
prov
ing
cust
omer
val
ueA
sses
sin
g amp
imp
rovi
ng
cu
stom
er v
alu
e E-commerce companySocial media
Customer Acquisition CostAverage Revenue Per User (ARPU) worldwide amp per region
From members to repeat buyers
KPI
Reporting
Users Retention of customers
Facebook - Q2 2019 Results HelloFresh - Capital Markets Day 2018 Zalando Q2 2019 earnings
Meal kit delivery service
KPI
Reporting
Average ordersbasket sizeGMV per active customer
KPI
Reporting
Ass
essi
ng
amp im
pro
vin
g c
ust
omer
val
ue
Assessing ExperienceProviding a qualitative experience to maximize satisfaction
Customer experience
is a key enabler in the customer relation and will drive a companyrsquos ability to optimize its centricity and generate the best value from it Today most companies limit their attention to NPS or customer service indicators they need to push their analysis beyond
How well does the company know and adapt to its customersPersonalization
Knowledge of customersCustomer habits amp preference metricsCustomer profile
CurationAmount of dedicated contentAmount of customized products or servicesLevel of anticipation of choices and needsSingularity amp differentiation of the experience
How qualitative and seamless is the experience provided to customers
How positively do customers evaluate their global experience
Quality of experienceSimplicityFrictionless experience Ergonomy of the digital orphysical venue (app amp website loading time) and of the customer pathAdditional services Free trials return policies
EfficiencyCustomer relation First contact resolution and of resolved issues delay of answers and problem resolution timeDelivery amp delay timeInitial training time of employees
TrustUser protectionsafety of the productsolution data privacyEthics responsibility of the company respectful business practices
Satisfaction
Overall satisfactionProduct or service rankingNb of cancelled ordersCustomer Satisfaction ratescore (CSAT) NPSSocial sentiment ( of positive reaction positive vocabulary)
Experience satisfactionCustomer Effort Score Customer experience index (Forrester) System usability scaleLevel of emotion generated by the experience (Net Emotion Score)
Experience mdash Reporting use casesA
sses
sing
amp im
prov
ing
cust
omer
val
ueA
sses
sin
g amp
imp
rovi
ng
cu
stom
er v
alu
e Meal kit delivery serviceE-commerce conglomerate
Customer Acquisition CostAverage Revenue Per User (ARPU) worldwide amp per region
From membersto repeat buyers
KPI
Reporting
Users Retention of customers
Alibaba - Investor Day 2018 Europcar Mobility Group 2019 Capital Markets Day Blue Apron - Investor Presentation (Q3 18)
Rental amp mobility company
KPI
Reporting
Average ordersbasket sizeGMV per active customer
KPI
Reporting
Where do companies stand todayMain trends amp reporting practices
3
Wh
ere
do
com
pan
ies
stan
d t
oday
A lack of homogeneity in the customer-centric approach
General overview of CAC 40 companies compared to a panel of large digital natives(GAFAM social media e-commerce)
Deep dive on a sample of 35 various B2C companies both digital natives and traditional among a diversity of sectors Insurance Banking Social media Streaming Mobility Leisure Video games E-commerce Retail Food Tech Telecoms Energy
Mostly based on external reporting(2018-2019 results publications press releases)
With insights on internal reporting practices (Corporate blogs research articles white papers interviews)
Benchmark methodology Collection amp classification of customer-centric KPIs
In our study led about several French and international companies two main trends emerged
In general companies tend to report metrics related to all steps of the customer lifecycle (attractivity engagement leverage experience)
With a slight focus on customer engagement
A variety of KPIs
Customer-centric reporting practices still vary highly between digital players and more historical ones
Digital native companies were created with a stakeholder centric approach and a monitoringcommunication focused on customer KPIs from the beginning However even if other companies have initiated a deep transformation of their organization hardly any of them have really switched to a new reporting approach yet
A gap in reporting practices
Incumbents have not switched to a new reporting approach yet
Average number of customer KPIs reported
By digital nativecompanies
52By CAC 40companies
17Wh
ere
do
com
pan
ies
stan
d t
oday
Digital native companies leading on customer-centric reporting
Different models different practices
Customer-centric external reporting appears to be a standard for ldquodigital nativerdquo companies (Tech giants in e-commerce social media streaminghellip) However it remains less common among incumbents except for a few pioneering sectors like Telecoms
Communicateon at least one customer KPI
Number of customersSatisfaction metrics (mostly NPS)
Main KPIs
CAC 40 external reporting ldquoDigital nativesrdquo external reporting
0Have external
reporting mainly focused on
customer metrics
60
Such a gap can be explained by an uneven access to the customer different models and cultures and the difficulties encountered to change an historically different approach as well as the legacy business
Communicateon at least one customer KPI
Number of customers amp growthNumber of active customers ARPU
Main KPIs
50Have external
reporting mainly focused on
customer metrics
90
Overview of CAC 40 companies amp a panel of 10 large ldquodigital nativesrdquo
Areas of focus 25 of companies communicate on all 4 categories of KPIs
Wh
ere
do
com
pan
ies
stan
d t
oday
Companies focus on different aspects of the customer scope
94 of companies included in the benchmark report at least one metric related to Engage
Companies report KPIs related to all categories with a slight focus on engagement
A variety of KPIs reportedRepartition of KPIs collected
Number of customersReported by
53of benchmarkrsquos companies
Active customers 25
Total amp averagerevenue per user
Reported by 33
of benchmarkrsquos companies
Most reported KPIs
72 of companies included in the benchmark report at least one metric related to Experience
61 of companies included in the benchmark report at least one metric related to Leverage
42 of companies included in the benchmark report at least one metric related to Attract
Deep dive on a panel of thirty-five B2C companies with various industries and nationalities
Leverage28
Engage35
Attract14
Experience23
Number of ordersper customer
25
Customer profile 25
And for youThe path to customer KPI reporting
4
Selectingthe right KPIs
1
The path to customer-centric reportingTh
e p
ath
to
cust
omer
KP
I rep
orti
ng
A three-step plan to integrate customer KPIs into your reporting
Harnessing your KPIsInternally
amp externally
3Implementing
your KPIs
2
The
pat
h t
o cu
stom
er K
PI r
epor
tin
gSelecting the right KPIs
For each company its own KPIs adapted to its specific needs
A few examples of OMTM (one metric that matters)
OMTM Time between the 1st amp 2nd connexion
Strategic customer KPIs driving your financial performance
Focus on adequate KPIS providing actionable insights on your long-term financial performance
ldquoThe one metricthat mattersrdquo
Focus on the one metric that is most critical for your performance and that can be followed over time
Selecting therelevant metric
Temporality(can be contextualized)
RateRatio(comparable)
Intelligible(easily understandable)
Decision-oriented(actionable)
OMTM Nb of friends added in the 10 days after inscription
The
pat
h t
o cu
stom
er K
PI r
epor
tin
gImplementing your KPIs
A progressive process for a long-term approach
Complementary approachCustomer-centric reporting does not replace traditional financial indicators it brings complementary information in order to improve value creation
Starting internallyTo set sustainable customer-centric reporting start by following amp monitoring these KPIs internally before communicating externally on it
Engaging your teamsCEO CFO COO Operational teams Unit managers etc need to be familiarized with this new approach
Setting up tools amp guidelines to reach goalsSet specific objectives to be reached for every step of the way tools (automated data tracking etc) and a timeline of follow-up
Defining your level of action depending on your maturity on customer approachCollecting customer data analyzing to extract information andor leveraging data to engage actions
To optimize resource allocation
To segmentcustomers and identify new customer needs to
launch new offers
To monitorcompanyrsquos performance
The
pat
h t
o cu
stom
er K
PI r
epor
tin
gHarnessing your KPIs internally
Setting the internal purpose of your follow-up
Leveraging your KPIs internally
Who
Teams Executives Management Operationals
To monetize customer data to third
parties
The
pat
h t
o cu
stom
er K
PI r
epor
tin
gNike using Customer Lifetime Value to optimize resource allocation
Selecting and implementing CLV to better forecast customer value
Visitors paying or non paying users
ARPU (Direct amp Indirect revenue)Costscustomer (production servicehellip)
Number of customers
Profitper customer (PPC)
Customer lifespan (n)
CAC (Marketing advertising promotions hellip)
Acquisitioncost
1 ( 1 - retention rate)
Σk=1
nPPCk
(1 + WACC) k- CAC CLV =
Early 2018Nike acquires Zodiac
(consumer data analytics)to helps calculate CLV
In 2017Nike launches ldquoConsumer Direct Offenserdquo plan to improve direct
customer relation
The resultsBetter understanding of the
value of an individual customer enabled them to boost revenue
and retention with the right marketing recommendations
and offers
Customer Lifetime Valuation $Bn
The
pat
h t
o cu
stom
er K
PI r
epor
tin
gHarnessing your KPIs externally
Setting the external purpose of your follow-up
To measure your impact
To valueyour customer asset
and strategy
To educate on your model
Building on your KPIS externally
Who
Stakeholders Investors Partners Customers Media Regulators
Twitter valorizing customer capital to financial markets
+ 10Stock price
User acquisition KPI positively influences market reaction after disappointing forecasts
In the publication of its 2019 Q2 earnings Twitter published a
guidance adjusted downwards with revenue growth expected
to slow down and a disappointing forecast
And yet the companyrsquos market cap has been up following the
publication of its quarterly results driven by a better user acquisition growth which has pushed investors to focus on
mid-term potential
+ 5 millionDaily active users
The
pat
h t
o cu
stom
er K
PI r
epor
tin
g
Source MarketWatch July 26
The KPI toolbox for startersA few elements to begin with
New customer concerns and interests in social amp environmental issues impact the customer-business relationshipCustomers loyalty is now related to the companyrsquos external commitment
Stakeholders centricity soon to be integrated as a driver of customer value
The next move
Direct traffic Conversion rate Nb of active users Churn rate Recurring users ARPU CAC CLV NPS Customer habitsspecific to each company
Customer experience has been crucial for the success of new business models
It is key to gather experience KPIs on every step of the customer journey and to set specific objectives for each step
Offering the best experience tailored on customerrsquos specific needs must be an all-time preoccupation
The must haves
The underrated
game changer
The
pat
h t
o cu
stom
er K
PI r
epor
tin
g
Going further Download Fabernovel data mapping toolkit
The
pat
h t
o cu
stom
er K
PI r
epor
tin
g
Evaluate the level of maturity of your customer approach
And you how customer-centric are you
Click here for an overview of the index
To access the full version of the index you can contact us at axellericour-dumasfabernovelcom
Jean-Christophe LiaubetPartner
Jean-Christophe joined Fabernovel in 2017 as a Partner and founder of the valuation practice of the Group
With over 20 years of experience as an Equity Analyst and then Managing Director at Exane BNP Paribas he helps corporates make and value the best investment decisions
Gabrielle PeyrelongueValue analyst
Graduate from ESSEC Gabrielle joined Fabernovel in 2018 as a Value Analyst
She has worked within Fabernovel practices in Paris and San Francisco focusing on several projects including innovation strategy and new models of valuation based on extra financial criteria
Axelle Ricour-DumasValue Director
Axelle joined Fabernovel in 2018 as a Director after 20 years as Equity analyst at Cheuvreux Director of Investor Relations at IPSOS and Founder of her company MYFINADVICE
At Fabernovel she works on several projects of strategic advisory and has a strong expertise on the assessment and scoring of strategic projects
Jeacutereacutemy TaiumlebQuantitative analyst
Jeacutereacutemy joined Fabernovel as a quantitative analyst after graduating from CentraleSupelec and ESCP Europe
He specializes in quantitative finance and data analysis especially for tech companies and works on several projects including financial research financial modelling and ecosystem modelling
AuthorsC
red
its
An
nex
esKPIs glossary
ARPCOAverage Revenue Per Convergent Offer
ARPU (Average Revenue Per User)total of revenuestotal users ARRAnnual Recurring Revenue
Avg lifespan of customer (in months)1monthly churn
Cohort analysisanalysis based on consumersusers fragmentation
Customer acquisition cost total acquisition campaign costsnumber of new customers (CLVCAC ratio)
Customer concentrationbiggest customer revenuetotal revenue Customer Effort Scoremeasures satisfaction regarding the effort through customer journey
Contribution marginselling price per unit minus the variable cost per unit
LTV or CLV Customer lifetime valueARPU x 1CLV attrition rate Can also be based on FCF margins
DMT (Dureacutee Moyenne de Traitement)average processing time
First Call Resolutionfirst call resolution rate reflects customer service performance
Fulfillment Cost RatioFulfillment cost (Cost of sales amp distributionlogistic content creation services payments)revenue
GMV (Gross Merchandise Value)average nb of orders per customer x average basket size(after returns)
Marketing Cost Ratiomarketing costsrevenue
Net addsnew subscribers or customers - nb of unsubscribing
Net Promoter Score brand ambassadors - brand detractors
An
nex
esKPIs glossary
Network effectthe more a product is used the more its value increases(ex Facebook) each company has its own KPIs to assess it
Problem Resolution time(Sum of All Interactions for Total Resolved Issues - Total nb of Resolved Issues)
RGUsRevenue Generating Units (a customer can represent various RGUs for example when subscribing to a mobile phone contract + TV contract + internet rarr the customer represents 3 RGUs) Traffic sourcesdirect organichellip
Conversion ratepace at which the solutionproductservice has been adopted
Rebound ratecustomers leaving site without a chance to convert them
repeat purchaseNb of repeat purchasenb of total purchases
Requests rate with lowhigh level of added valuesimplerecurring customer service requests rate vs complex ones Retention rate(Nb of Customers at End of Period - nb of New Customers Acquired During Period)nb of Customers at Start of Period
Viralityspeed of productservice spread can be measured by k-value (average nb of invitations sent by each userconversion rate of invitations into new users)
An
nex
esCompanies analyzed in the benchmark
HelloFresh
Netflix
Orange
PSA
Showroomprive
Snap
Spotify
Square
Takewaycom
Twitch
Ubisoft
Vodafone
Zalando
Zynga
Activision Blizzard
Airbnb
AirFrance
Alibaba
Allianz
Amazon
Asos
Axa
Baidu
Blablacar
Blue Apron
BNP
Carrefour
Creacutedit Agricole
Easyjet
EDF
Engie
Europcar Mobility Group
Thank youCONTACT
Jean-Christophe LIAUBETPartner
+33 6 08 86 24 88jean-christopheliaubetFabernovelcom
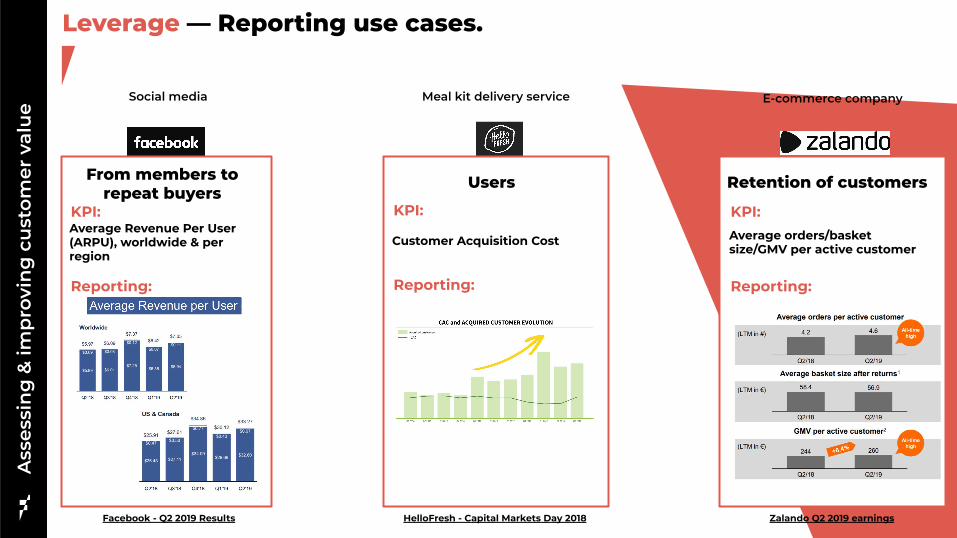
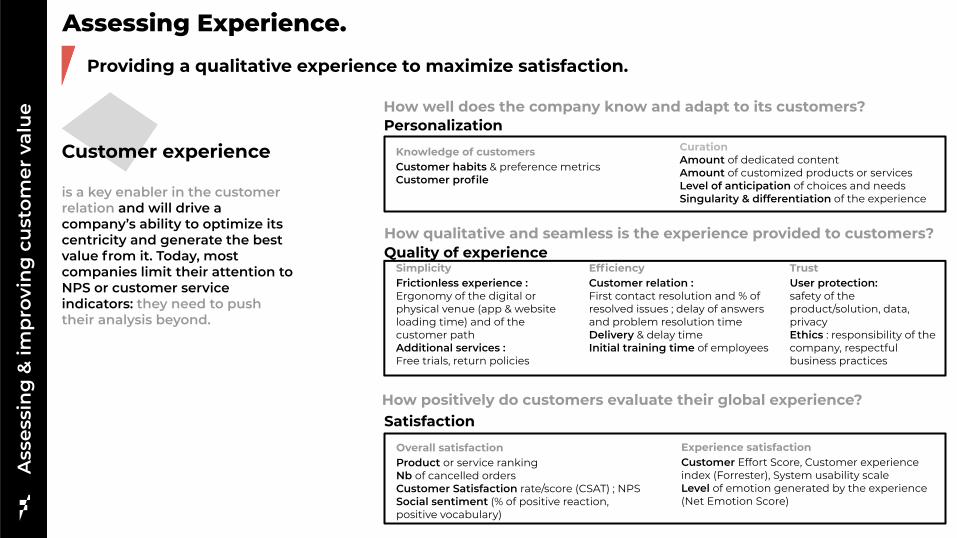
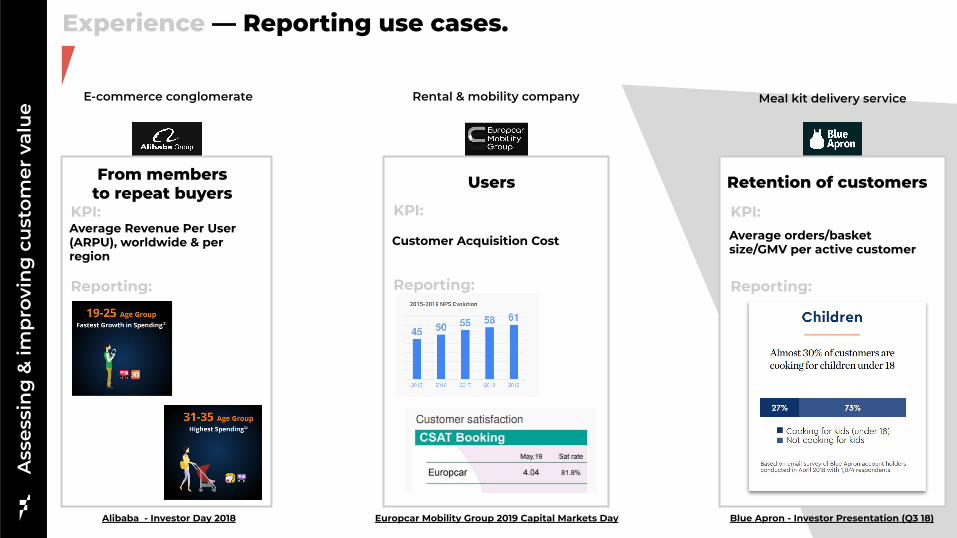
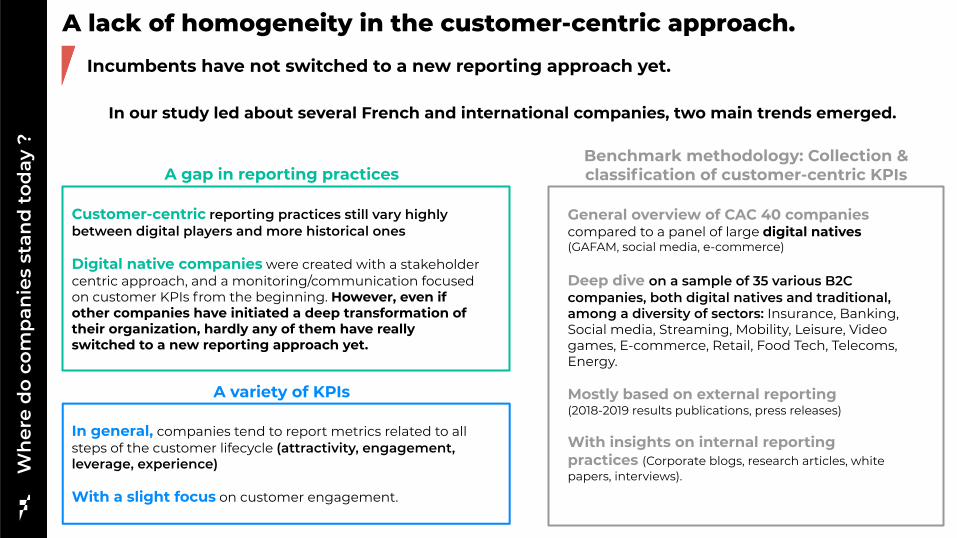
Wh
ere
do
com
pan
ies
stan
d t
oday
A lack of homogeneity in the customer-centric approach
General overview of CAC 40 companies compared to a panel of large digital natives(GAFAM social media e-commerce)
Deep dive on a sample of 35 various B2C companies both digital natives and traditional among a diversity of sectors Insurance Banking Social media Streaming Mobility Leisure Video games E-commerce Retail Food Tech Telecoms Energy
Mostly based on external reporting(2018-2019 results publications press releases)
With insights on internal reporting practices (Corporate blogs research articles white papers interviews)
Benchmark methodology Collection amp classification of customer-centric KPIs
In our study led about several French and international companies two main trends emerged
In general companies tend to report metrics related to all steps of the customer lifecycle (attractivity engagement leverage experience)
With a slight focus on customer engagement
A variety of KPIs
Customer-centric reporting practices still vary highly between digital players and more historical ones
Digital native companies were created with a stakeholder centric approach and a monitoringcommunication focused on customer KPIs from the beginning However even if other companies have initiated a deep transformation of their organization hardly any of them have really switched to a new reporting approach yet
A gap in reporting practices
Incumbents have not switched to a new reporting approach yet
Average number of customer KPIs reported
By digital nativecompanies
52By CAC 40companies
17Wh
ere
do
com
pan
ies
stan
d t
oday
Digital native companies leading on customer-centric reporting
Different models different practices
Customer-centric external reporting appears to be a standard for ldquodigital nativerdquo companies (Tech giants in e-commerce social media streaminghellip) However it remains less common among incumbents except for a few pioneering sectors like Telecoms
Communicateon at least one customer KPI
Number of customersSatisfaction metrics (mostly NPS)
Main KPIs
CAC 40 external reporting ldquoDigital nativesrdquo external reporting
0Have external
reporting mainly focused on
customer metrics
60
Such a gap can be explained by an uneven access to the customer different models and cultures and the difficulties encountered to change an historically different approach as well as the legacy business
Communicateon at least one customer KPI
Number of customers amp growthNumber of active customers ARPU
Main KPIs
50Have external
reporting mainly focused on
customer metrics
90
Overview of CAC 40 companies amp a panel of 10 large ldquodigital nativesrdquo
Areas of focus 25 of companies communicate on all 4 categories of KPIs
Wh
ere
do
com
pan
ies
stan
d t
oday
Companies focus on different aspects of the customer scope
94 of companies included in the benchmark report at least one metric related to Engage
Companies report KPIs related to all categories with a slight focus on engagement
A variety of KPIs reportedRepartition of KPIs collected
Number of customersReported by
53of benchmarkrsquos companies
Active customers 25
Total amp averagerevenue per user
Reported by 33
of benchmarkrsquos companies
Most reported KPIs
72 of companies included in the benchmark report at least one metric related to Experience
61 of companies included in the benchmark report at least one metric related to Leverage
42 of companies included in the benchmark report at least one metric related to Attract
Deep dive on a panel of thirty-five B2C companies with various industries and nationalities
Leverage28
Engage35
Attract14
Experience23
Number of ordersper customer
25
Customer profile 25
And for youThe path to customer KPI reporting
4
Selectingthe right KPIs
1
The path to customer-centric reportingTh
e p
ath
to
cust
omer
KP
I rep
orti
ng
A three-step plan to integrate customer KPIs into your reporting
Harnessing your KPIsInternally
amp externally
3Implementing
your KPIs
2
The
pat
h t
o cu
stom
er K
PI r
epor
tin
gSelecting the right KPIs
For each company its own KPIs adapted to its specific needs
A few examples of OMTM (one metric that matters)
OMTM Time between the 1st amp 2nd connexion
Strategic customer KPIs driving your financial performance
Focus on adequate KPIS providing actionable insights on your long-term financial performance
ldquoThe one metricthat mattersrdquo
Focus on the one metric that is most critical for your performance and that can be followed over time
Selecting therelevant metric
Temporality(can be contextualized)
RateRatio(comparable)
Intelligible(easily understandable)
Decision-oriented(actionable)
OMTM Nb of friends added in the 10 days after inscription
The
pat
h t
o cu
stom
er K
PI r
epor
tin
gImplementing your KPIs
A progressive process for a long-term approach
Complementary approachCustomer-centric reporting does not replace traditional financial indicators it brings complementary information in order to improve value creation
Starting internallyTo set sustainable customer-centric reporting start by following amp monitoring these KPIs internally before communicating externally on it
Engaging your teamsCEO CFO COO Operational teams Unit managers etc need to be familiarized with this new approach
Setting up tools amp guidelines to reach goalsSet specific objectives to be reached for every step of the way tools (automated data tracking etc) and a timeline of follow-up
Defining your level of action depending on your maturity on customer approachCollecting customer data analyzing to extract information andor leveraging data to engage actions
To optimize resource allocation
To segmentcustomers and identify new customer needs to
launch new offers
To monitorcompanyrsquos performance
The
pat
h t
o cu
stom
er K
PI r
epor
tin
gHarnessing your KPIs internally
Setting the internal purpose of your follow-up
Leveraging your KPIs internally
Who
Teams Executives Management Operationals
To monetize customer data to third
parties
The
pat
h t
o cu
stom
er K
PI r
epor
tin
gNike using Customer Lifetime Value to optimize resource allocation
Selecting and implementing CLV to better forecast customer value
Visitors paying or non paying users
ARPU (Direct amp Indirect revenue)Costscustomer (production servicehellip)
Number of customers
Profitper customer (PPC)
Customer lifespan (n)
CAC (Marketing advertising promotions hellip)
Acquisitioncost
1 ( 1 - retention rate)
Σk=1
nPPCk
(1 + WACC) k- CAC CLV =
Early 2018Nike acquires Zodiac
(consumer data analytics)to helps calculate CLV
In 2017Nike launches ldquoConsumer Direct Offenserdquo plan to improve direct
customer relation
The resultsBetter understanding of the
value of an individual customer enabled them to boost revenue
and retention with the right marketing recommendations
and offers
Customer Lifetime Valuation $Bn
The
pat
h t
o cu
stom
er K
PI r
epor
tin
gHarnessing your KPIs externally
Setting the external purpose of your follow-up
To measure your impact
To valueyour customer asset
and strategy
To educate on your model
Building on your KPIS externally
Who
Stakeholders Investors Partners Customers Media Regulators
Twitter valorizing customer capital to financial markets
+ 10Stock price
User acquisition KPI positively influences market reaction after disappointing forecasts
In the publication of its 2019 Q2 earnings Twitter published a
guidance adjusted downwards with revenue growth expected
to slow down and a disappointing forecast
And yet the companyrsquos market cap has been up following the
publication of its quarterly results driven by a better user acquisition growth which has pushed investors to focus on
mid-term potential
+ 5 millionDaily active users
The
pat
h t
o cu
stom
er K
PI r
epor
tin
g
Source MarketWatch July 26
The KPI toolbox for startersA few elements to begin with
New customer concerns and interests in social amp environmental issues impact the customer-business relationshipCustomers loyalty is now related to the companyrsquos external commitment
Stakeholders centricity soon to be integrated as a driver of customer value
The next move
Direct traffic Conversion rate Nb of active users Churn rate Recurring users ARPU CAC CLV NPS Customer habitsspecific to each company
Customer experience has been crucial for the success of new business models
It is key to gather experience KPIs on every step of the customer journey and to set specific objectives for each step
Offering the best experience tailored on customerrsquos specific needs must be an all-time preoccupation
The must haves
The underrated
game changer
The
pat
h t
o cu
stom
er K
PI r
epor
tin
g
Going further Download Fabernovel data mapping toolkit
The
pat
h t
o cu
stom
er K
PI r
epor
tin
g
Evaluate the level of maturity of your customer approach
And you how customer-centric are you
Click here for an overview of the index
To access the full version of the index you can contact us at axellericour-dumasfabernovelcom
Jean-Christophe LiaubetPartner
Jean-Christophe joined Fabernovel in 2017 as a Partner and founder of the valuation practice of the Group
With over 20 years of experience as an Equity Analyst and then Managing Director at Exane BNP Paribas he helps corporates make and value the best investment decisions
Gabrielle PeyrelongueValue analyst
Graduate from ESSEC Gabrielle joined Fabernovel in 2018 as a Value Analyst
She has worked within Fabernovel practices in Paris and San Francisco focusing on several projects including innovation strategy and new models of valuation based on extra financial criteria
Axelle Ricour-DumasValue Director
Axelle joined Fabernovel in 2018 as a Director after 20 years as Equity analyst at Cheuvreux Director of Investor Relations at IPSOS and Founder of her company MYFINADVICE
At Fabernovel she works on several projects of strategic advisory and has a strong expertise on the assessment and scoring of strategic projects
Jeacutereacutemy TaiumlebQuantitative analyst
Jeacutereacutemy joined Fabernovel as a quantitative analyst after graduating from CentraleSupelec and ESCP Europe
He specializes in quantitative finance and data analysis especially for tech companies and works on several projects including financial research financial modelling and ecosystem modelling
AuthorsC
red
its
An
nex
esKPIs glossary
ARPCOAverage Revenue Per Convergent Offer
ARPU (Average Revenue Per User)total of revenuestotal users ARRAnnual Recurring Revenue
Avg lifespan of customer (in months)1monthly churn
Cohort analysisanalysis based on consumersusers fragmentation
Customer acquisition cost total acquisition campaign costsnumber of new customers (CLVCAC ratio)
Customer concentrationbiggest customer revenuetotal revenue Customer Effort Scoremeasures satisfaction regarding the effort through customer journey
Contribution marginselling price per unit minus the variable cost per unit
LTV or CLV Customer lifetime valueARPU x 1CLV attrition rate Can also be based on FCF margins
DMT (Dureacutee Moyenne de Traitement)average processing time
First Call Resolutionfirst call resolution rate reflects customer service performance
Fulfillment Cost RatioFulfillment cost (Cost of sales amp distributionlogistic content creation services payments)revenue
GMV (Gross Merchandise Value)average nb of orders per customer x average basket size(after returns)
Marketing Cost Ratiomarketing costsrevenue
Net addsnew subscribers or customers - nb of unsubscribing
Net Promoter Score brand ambassadors - brand detractors
An
nex
esKPIs glossary
Network effectthe more a product is used the more its value increases(ex Facebook) each company has its own KPIs to assess it
Problem Resolution time(Sum of All Interactions for Total Resolved Issues - Total nb of Resolved Issues)
RGUsRevenue Generating Units (a customer can represent various RGUs for example when subscribing to a mobile phone contract + TV contract + internet rarr the customer represents 3 RGUs) Traffic sourcesdirect organichellip
Conversion ratepace at which the solutionproductservice has been adopted
Rebound ratecustomers leaving site without a chance to convert them
repeat purchaseNb of repeat purchasenb of total purchases
Requests rate with lowhigh level of added valuesimplerecurring customer service requests rate vs complex ones Retention rate(Nb of Customers at End of Period - nb of New Customers Acquired During Period)nb of Customers at Start of Period
Viralityspeed of productservice spread can be measured by k-value (average nb of invitations sent by each userconversion rate of invitations into new users)
An
nex
esCompanies analyzed in the benchmark
HelloFresh
Netflix
Orange
PSA
Showroomprive
Snap
Spotify
Square
Takewaycom
Twitch
Ubisoft
Vodafone
Zalando
Zynga
Activision Blizzard
Airbnb
AirFrance
Alibaba
Allianz
Amazon
Asos
Axa
Baidu
Blablacar
Blue Apron
BNP
Carrefour
Creacutedit Agricole
Easyjet
EDF
Engie
Europcar Mobility Group
Thank youCONTACT
Jean-Christophe LIAUBETPartner
+33 6 08 86 24 88jean-christopheliaubetFabernovelcom
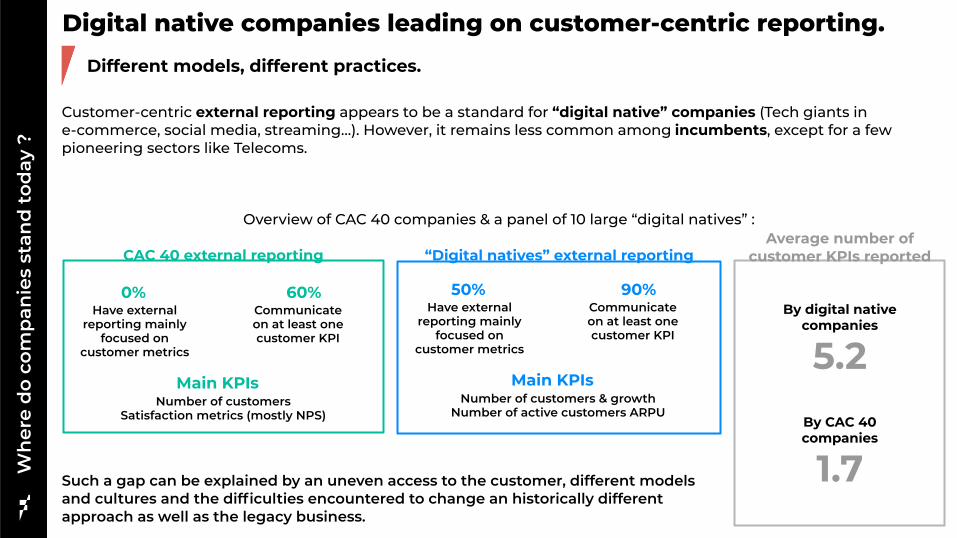
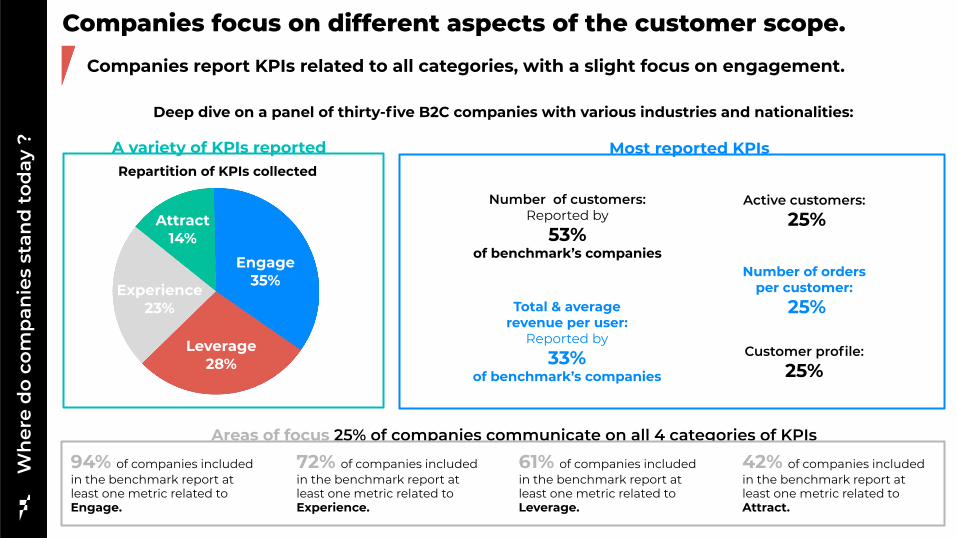
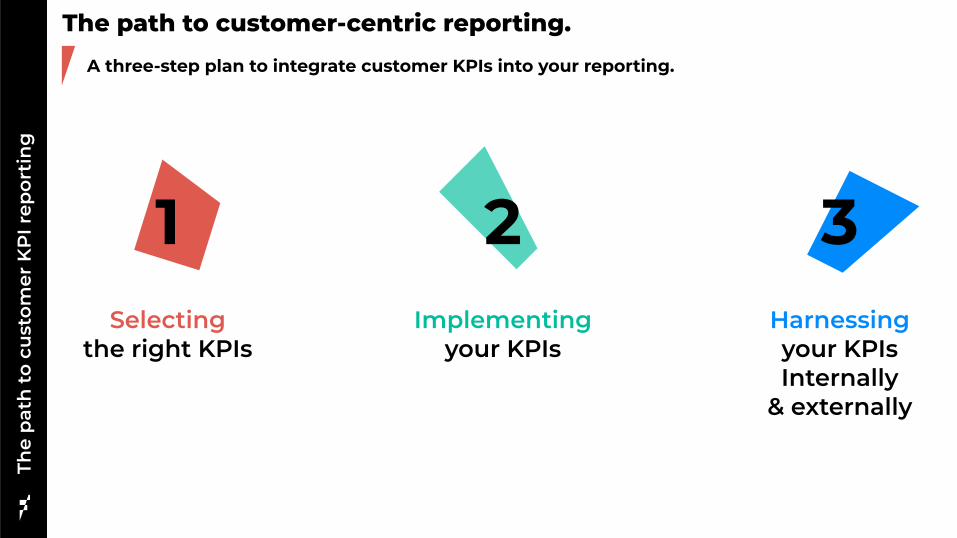
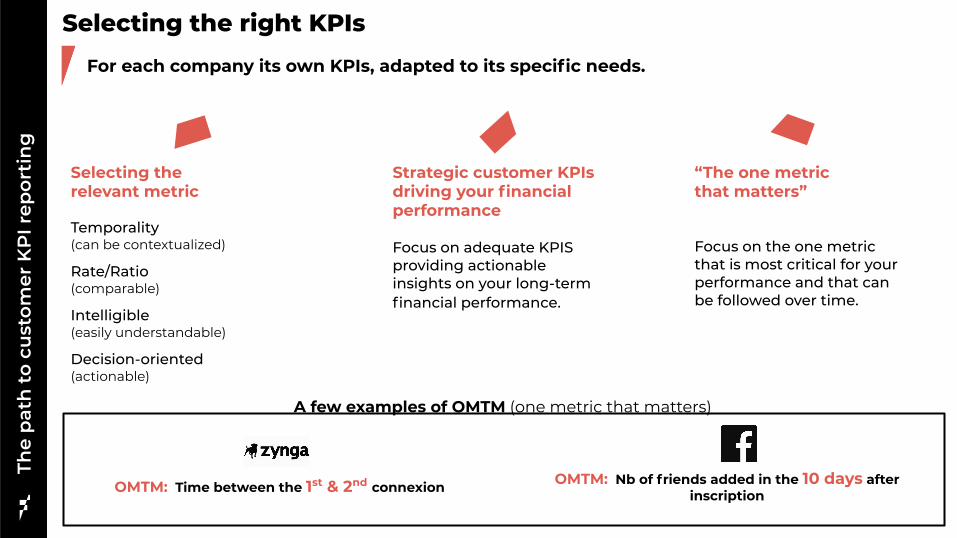
The
pat
h t
o cu
stom
er K
PI r
epor
tin
gSelecting the right KPIs
For each company its own KPIs adapted to its specific needs
A few examples of OMTM (one metric that matters)
OMTM Time between the 1st amp 2nd connexion
Strategic customer KPIs driving your financial performance
Focus on adequate KPIS providing actionable insights on your long-term financial performance
ldquoThe one metricthat mattersrdquo
Focus on the one metric that is most critical for your performance and that can be followed over time
Selecting therelevant metric
Temporality(can be contextualized)
RateRatio(comparable)
Intelligible(easily understandable)
Decision-oriented(actionable)
OMTM Nb of friends added in the 10 days after inscription
The
pat
h t
o cu
stom
er K
PI r
epor
tin
gImplementing your KPIs
A progressive process for a long-term approach
Complementary approachCustomer-centric reporting does not replace traditional financial indicators it brings complementary information in order to improve value creation
Starting internallyTo set sustainable customer-centric reporting start by following amp monitoring these KPIs internally before communicating externally on it
Engaging your teamsCEO CFO COO Operational teams Unit managers etc need to be familiarized with this new approach
Setting up tools amp guidelines to reach goalsSet specific objectives to be reached for every step of the way tools (automated data tracking etc) and a timeline of follow-up
Defining your level of action depending on your maturity on customer approachCollecting customer data analyzing to extract information andor leveraging data to engage actions
To optimize resource allocation
To segmentcustomers and identify new customer needs to
launch new offers
To monitorcompanyrsquos performance
The
pat
h t
o cu
stom
er K
PI r
epor
tin
gHarnessing your KPIs internally
Setting the internal purpose of your follow-up
Leveraging your KPIs internally
Who
Teams Executives Management Operationals
To monetize customer data to third
parties
The
pat
h t
o cu
stom
er K
PI r
epor
tin
gNike using Customer Lifetime Value to optimize resource allocation
Selecting and implementing CLV to better forecast customer value
Visitors paying or non paying users
ARPU (Direct amp Indirect revenue)Costscustomer (production servicehellip)
Number of customers
Profitper customer (PPC)
Customer lifespan (n)
CAC (Marketing advertising promotions hellip)
Acquisitioncost
1 ( 1 - retention rate)
Σk=1
nPPCk
(1 + WACC) k- CAC CLV =
Early 2018Nike acquires Zodiac
(consumer data analytics)to helps calculate CLV
In 2017Nike launches ldquoConsumer Direct Offenserdquo plan to improve direct
customer relation
The resultsBetter understanding of the
value of an individual customer enabled them to boost revenue
and retention with the right marketing recommendations
and offers
Customer Lifetime Valuation $Bn
The
pat
h t
o cu
stom
er K
PI r
epor
tin
gHarnessing your KPIs externally
Setting the external purpose of your follow-up
To measure your impact
To valueyour customer asset
and strategy
To educate on your model
Building on your KPIS externally
Who
Stakeholders Investors Partners Customers Media Regulators
Twitter valorizing customer capital to financial markets
+ 10Stock price
User acquisition KPI positively influences market reaction after disappointing forecasts
In the publication of its 2019 Q2 earnings Twitter published a
guidance adjusted downwards with revenue growth expected
to slow down and a disappointing forecast
And yet the companyrsquos market cap has been up following the
publication of its quarterly results driven by a better user acquisition growth which has pushed investors to focus on
mid-term potential
+ 5 millionDaily active users
The
pat
h t
o cu
stom
er K
PI r
epor
tin
g
Source MarketWatch July 26
The KPI toolbox for startersA few elements to begin with
New customer concerns and interests in social amp environmental issues impact the customer-business relationshipCustomers loyalty is now related to the companyrsquos external commitment
Stakeholders centricity soon to be integrated as a driver of customer value
The next move
Direct traffic Conversion rate Nb of active users Churn rate Recurring users ARPU CAC CLV NPS Customer habitsspecific to each company
Customer experience has been crucial for the success of new business models
It is key to gather experience KPIs on every step of the customer journey and to set specific objectives for each step
Offering the best experience tailored on customerrsquos specific needs must be an all-time preoccupation
The must haves
The underrated
game changer
The
pat
h t
o cu
stom
er K
PI r
epor
tin
g
Going further Download Fabernovel data mapping toolkit
The
pat
h t
o cu
stom
er K
PI r
epor
tin
g
Evaluate the level of maturity of your customer approach
And you how customer-centric are you
Click here for an overview of the index
To access the full version of the index you can contact us at axellericour-dumasfabernovelcom
Jean-Christophe LiaubetPartner
Jean-Christophe joined Fabernovel in 2017 as a Partner and founder of the valuation practice of the Group
With over 20 years of experience as an Equity Analyst and then Managing Director at Exane BNP Paribas he helps corporates make and value the best investment decisions
Gabrielle PeyrelongueValue analyst
Graduate from ESSEC Gabrielle joined Fabernovel in 2018 as a Value Analyst
She has worked within Fabernovel practices in Paris and San Francisco focusing on several projects including innovation strategy and new models of valuation based on extra financial criteria
Axelle Ricour-DumasValue Director
Axelle joined Fabernovel in 2018 as a Director after 20 years as Equity analyst at Cheuvreux Director of Investor Relations at IPSOS and Founder of her company MYFINADVICE
At Fabernovel she works on several projects of strategic advisory and has a strong expertise on the assessment and scoring of strategic projects
Jeacutereacutemy TaiumlebQuantitative analyst
Jeacutereacutemy joined Fabernovel as a quantitative analyst after graduating from CentraleSupelec and ESCP Europe
He specializes in quantitative finance and data analysis especially for tech companies and works on several projects including financial research financial modelling and ecosystem modelling
AuthorsC
red
its
An
nex
esKPIs glossary
ARPCOAverage Revenue Per Convergent Offer
ARPU (Average Revenue Per User)total of revenuestotal users ARRAnnual Recurring Revenue
Avg lifespan of customer (in months)1monthly churn
Cohort analysisanalysis based on consumersusers fragmentation
Customer acquisition cost total acquisition campaign costsnumber of new customers (CLVCAC ratio)
Customer concentrationbiggest customer revenuetotal revenue Customer Effort Scoremeasures satisfaction regarding the effort through customer journey
Contribution marginselling price per unit minus the variable cost per unit
LTV or CLV Customer lifetime valueARPU x 1CLV attrition rate Can also be based on FCF margins
DMT (Dureacutee Moyenne de Traitement)average processing time
First Call Resolutionfirst call resolution rate reflects customer service performance
Fulfillment Cost RatioFulfillment cost (Cost of sales amp distributionlogistic content creation services payments)revenue
GMV (Gross Merchandise Value)average nb of orders per customer x average basket size(after returns)
Marketing Cost Ratiomarketing costsrevenue
Net addsnew subscribers or customers - nb of unsubscribing
Net Promoter Score brand ambassadors - brand detractors
An
nex
esKPIs glossary
Network effectthe more a product is used the more its value increases(ex Facebook) each company has its own KPIs to assess it
Problem Resolution time(Sum of All Interactions for Total Resolved Issues - Total nb of Resolved Issues)
RGUsRevenue Generating Units (a customer can represent various RGUs for example when subscribing to a mobile phone contract + TV contract + internet rarr the customer represents 3 RGUs) Traffic sourcesdirect organichellip
Conversion ratepace at which the solutionproductservice has been adopted
Rebound ratecustomers leaving site without a chance to convert them
repeat purchaseNb of repeat purchasenb of total purchases
Requests rate with lowhigh level of added valuesimplerecurring customer service requests rate vs complex ones Retention rate(Nb of Customers at End of Period - nb of New Customers Acquired During Period)nb of Customers at Start of Period
Viralityspeed of productservice spread can be measured by k-value (average nb of invitations sent by each userconversion rate of invitations into new users)
An
nex
esCompanies analyzed in the benchmark
HelloFresh
Netflix
Orange
PSA
Showroomprive
Snap
Spotify
Square
Takewaycom
Twitch
Ubisoft
Vodafone
Zalando
Zynga
Activision Blizzard
Airbnb
AirFrance
Alibaba
Allianz
Amazon
Asos
Axa
Baidu
Blablacar
Blue Apron
BNP
Carrefour
Creacutedit Agricole
Easyjet
EDF
Engie
Europcar Mobility Group
Thank youCONTACT
Jean-Christophe LIAUBETPartner
+33 6 08 86 24 88jean-christopheliaubetFabernovelcom
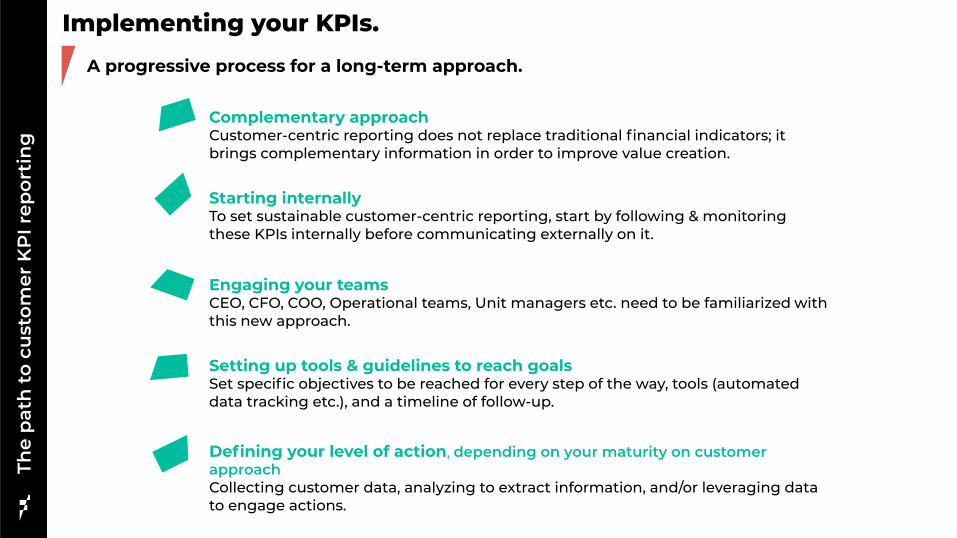
The
pat
h t
o cu
stom
er K
PI r
epor
tin
gImplementing your KPIs
A progressive process for a long-term approach
Complementary approachCustomer-centric reporting does not replace traditional financial indicators it brings complementary information in order to improve value creation
Starting internallyTo set sustainable customer-centric reporting start by following amp monitoring these KPIs internally before communicating externally on it
Engaging your teamsCEO CFO COO Operational teams Unit managers etc need to be familiarized with this new approach
Setting up tools amp guidelines to reach goalsSet specific objectives to be reached for every step of the way tools (automated data tracking etc) and a timeline of follow-up
Defining your level of action depending on your maturity on customer approachCollecting customer data analyzing to extract information andor leveraging data to engage actions
To optimize resource allocation
To segmentcustomers and identify new customer needs to
launch new offers
To monitorcompanyrsquos performance
The
pat
h t
o cu
stom
er K
PI r
epor
tin
gHarnessing your KPIs internally
Setting the internal purpose of your follow-up
Leveraging your KPIs internally
Who
Teams Executives Management Operationals
To monetize customer data to third
parties
The
pat
h t
o cu
stom
er K
PI r
epor
tin
gNike using Customer Lifetime Value to optimize resource allocation
Selecting and implementing CLV to better forecast customer value
Visitors paying or non paying users
ARPU (Direct amp Indirect revenue)Costscustomer (production servicehellip)
Number of customers
Profitper customer (PPC)
Customer lifespan (n)
CAC (Marketing advertising promotions hellip)
Acquisitioncost
1 ( 1 - retention rate)
Σk=1
nPPCk
(1 + WACC) k- CAC CLV =
Early 2018Nike acquires Zodiac
(consumer data analytics)to helps calculate CLV
In 2017Nike launches ldquoConsumer Direct Offenserdquo plan to improve direct
customer relation
The resultsBetter understanding of the
value of an individual customer enabled them to boost revenue
and retention with the right marketing recommendations
and offers
Customer Lifetime Valuation $Bn
The
pat
h t
o cu
stom
er K
PI r
epor
tin
gHarnessing your KPIs externally
Setting the external purpose of your follow-up
To measure your impact
To valueyour customer asset
and strategy
To educate on your model
Building on your KPIS externally
Who
Stakeholders Investors Partners Customers Media Regulators
Twitter valorizing customer capital to financial markets
+ 10Stock price
User acquisition KPI positively influences market reaction after disappointing forecasts
In the publication of its 2019 Q2 earnings Twitter published a
guidance adjusted downwards with revenue growth expected
to slow down and a disappointing forecast
And yet the companyrsquos market cap has been up following the
publication of its quarterly results driven by a better user acquisition growth which has pushed investors to focus on
mid-term potential
+ 5 millionDaily active users
The
pat
h t
o cu
stom
er K
PI r
epor
tin
g
Source MarketWatch July 26
The KPI toolbox for startersA few elements to begin with
New customer concerns and interests in social amp environmental issues impact the customer-business relationshipCustomers loyalty is now related to the companyrsquos external commitment
Stakeholders centricity soon to be integrated as a driver of customer value
The next move
Direct traffic Conversion rate Nb of active users Churn rate Recurring users ARPU CAC CLV NPS Customer habitsspecific to each company
Customer experience has been crucial for the success of new business models
It is key to gather experience KPIs on every step of the customer journey and to set specific objectives for each step
Offering the best experience tailored on customerrsquos specific needs must be an all-time preoccupation
The must haves
The underrated
game changer
The
pat
h t
o cu
stom
er K
PI r
epor
tin
g
Going further Download Fabernovel data mapping toolkit
The
pat
h t
o cu
stom
er K
PI r
epor
tin
g
Evaluate the level of maturity of your customer approach
And you how customer-centric are you
Click here for an overview of the index
To access the full version of the index you can contact us at axellericour-dumasfabernovelcom
Jean-Christophe LiaubetPartner
Jean-Christophe joined Fabernovel in 2017 as a Partner and founder of the valuation practice of the Group
With over 20 years of experience as an Equity Analyst and then Managing Director at Exane BNP Paribas he helps corporates make and value the best investment decisions
Gabrielle PeyrelongueValue analyst
Graduate from ESSEC Gabrielle joined Fabernovel in 2018 as a Value Analyst
She has worked within Fabernovel practices in Paris and San Francisco focusing on several projects including innovation strategy and new models of valuation based on extra financial criteria
Axelle Ricour-DumasValue Director
Axelle joined Fabernovel in 2018 as a Director after 20 years as Equity analyst at Cheuvreux Director of Investor Relations at IPSOS and Founder of her company MYFINADVICE
At Fabernovel she works on several projects of strategic advisory and has a strong expertise on the assessment and scoring of strategic projects
Jeacutereacutemy TaiumlebQuantitative analyst
Jeacutereacutemy joined Fabernovel as a quantitative analyst after graduating from CentraleSupelec and ESCP Europe
He specializes in quantitative finance and data analysis especially for tech companies and works on several projects including financial research financial modelling and ecosystem modelling
AuthorsC
red
its
An
nex
esKPIs glossary
ARPCOAverage Revenue Per Convergent Offer
ARPU (Average Revenue Per User)total of revenuestotal users ARRAnnual Recurring Revenue
Avg lifespan of customer (in months)1monthly churn
Cohort analysisanalysis based on consumersusers fragmentation
Customer acquisition cost total acquisition campaign costsnumber of new customers (CLVCAC ratio)
Customer concentrationbiggest customer revenuetotal revenue Customer Effort Scoremeasures satisfaction regarding the effort through customer journey
Contribution marginselling price per unit minus the variable cost per unit
LTV or CLV Customer lifetime valueARPU x 1CLV attrition rate Can also be based on FCF margins
DMT (Dureacutee Moyenne de Traitement)average processing time
First Call Resolutionfirst call resolution rate reflects customer service performance
Fulfillment Cost RatioFulfillment cost (Cost of sales amp distributionlogistic content creation services payments)revenue
GMV (Gross Merchandise Value)average nb of orders per customer x average basket size(after returns)
Marketing Cost Ratiomarketing costsrevenue
Net addsnew subscribers or customers - nb of unsubscribing
Net Promoter Score brand ambassadors - brand detractors
An
nex
esKPIs glossary
Network effectthe more a product is used the more its value increases(ex Facebook) each company has its own KPIs to assess it
Problem Resolution time(Sum of All Interactions for Total Resolved Issues - Total nb of Resolved Issues)
RGUsRevenue Generating Units (a customer can represent various RGUs for example when subscribing to a mobile phone contract + TV contract + internet rarr the customer represents 3 RGUs) Traffic sourcesdirect organichellip
Conversion ratepace at which the solutionproductservice has been adopted
Rebound ratecustomers leaving site without a chance to convert them
repeat purchaseNb of repeat purchasenb of total purchases
Requests rate with lowhigh level of added valuesimplerecurring customer service requests rate vs complex ones Retention rate(Nb of Customers at End of Period - nb of New Customers Acquired During Period)nb of Customers at Start of Period
Viralityspeed of productservice spread can be measured by k-value (average nb of invitations sent by each userconversion rate of invitations into new users)
An
nex
esCompanies analyzed in the benchmark
HelloFresh
Netflix
Orange
PSA
Showroomprive
Snap
Spotify
Square
Takewaycom
Twitch
Ubisoft
Vodafone
Zalando
Zynga
Activision Blizzard
Airbnb
AirFrance
Alibaba
Allianz
Amazon
Asos
Axa
Baidu
Blablacar
Blue Apron
BNP
Carrefour
Creacutedit Agricole
Easyjet
EDF
Engie
Europcar Mobility Group
Thank youCONTACT
Jean-Christophe LIAUBETPartner
+33 6 08 86 24 88jean-christopheliaubetFabernovelcom
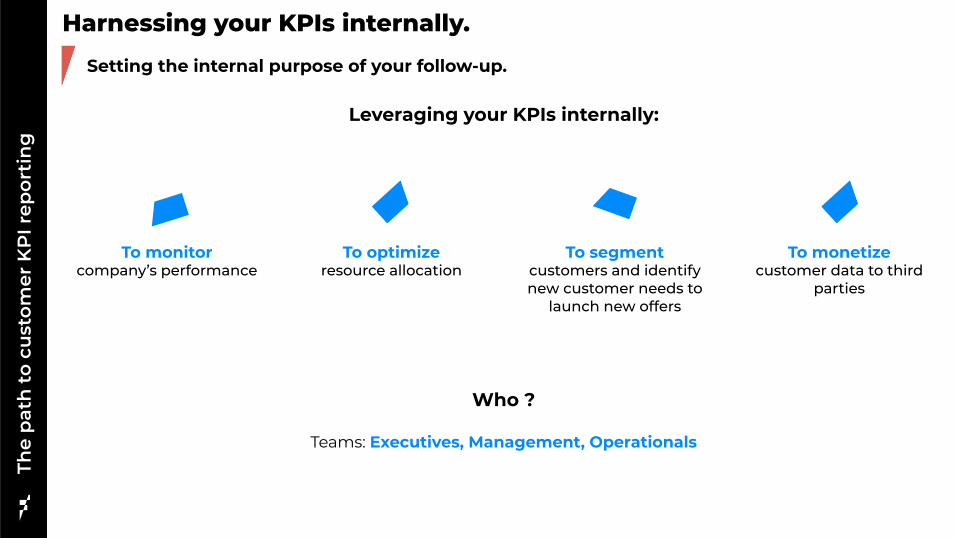
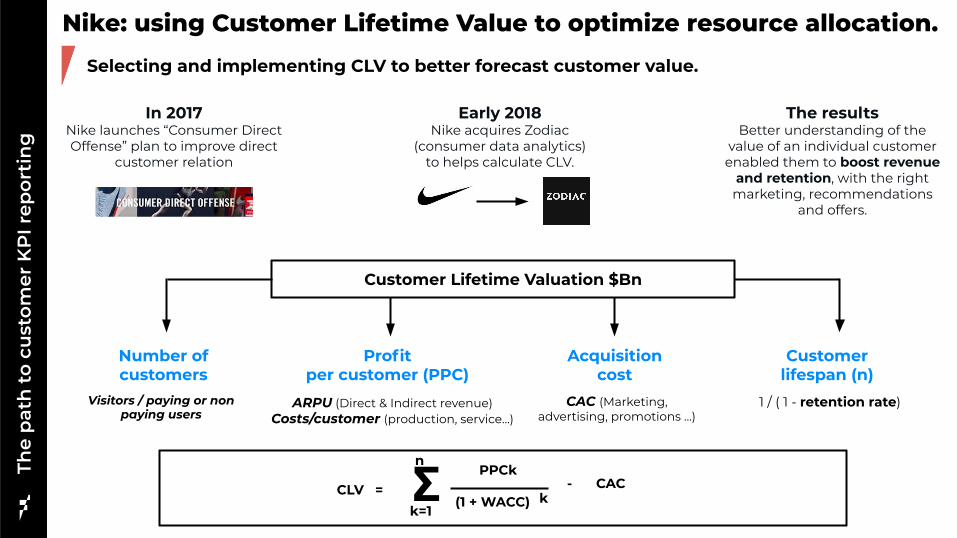
The
pat
h t
o cu
stom
er K
PI r
epor
tin
gNike using Customer Lifetime Value to optimize resource allocation
Selecting and implementing CLV to better forecast customer value
Visitors paying or non paying users
ARPU (Direct amp Indirect revenue)Costscustomer (production servicehellip)
Number of customers
Profitper customer (PPC)
Customer lifespan (n)
CAC (Marketing advertising promotions hellip)
Acquisitioncost
1 ( 1 - retention rate)
Σk=1
nPPCk
(1 + WACC) k- CAC CLV =
Early 2018Nike acquires Zodiac
(consumer data analytics)to helps calculate CLV
In 2017Nike launches ldquoConsumer Direct Offenserdquo plan to improve direct
customer relation
The resultsBetter understanding of the
value of an individual customer enabled them to boost revenue
and retention with the right marketing recommendations
and offers
Customer Lifetime Valuation $Bn
The
pat
h t
o cu
stom
er K
PI r
epor
tin
gHarnessing your KPIs externally
Setting the external purpose of your follow-up
To measure your impact
To valueyour customer asset
and strategy
To educate on your model
Building on your KPIS externally
Who
Stakeholders Investors Partners Customers Media Regulators
Twitter valorizing customer capital to financial markets
+ 10Stock price
User acquisition KPI positively influences market reaction after disappointing forecasts
In the publication of its 2019 Q2 earnings Twitter published a
guidance adjusted downwards with revenue growth expected
to slow down and a disappointing forecast
And yet the companyrsquos market cap has been up following the
publication of its quarterly results driven by a better user acquisition growth which has pushed investors to focus on
mid-term potential
+ 5 millionDaily active users
The
pat
h t
o cu
stom
er K
PI r
epor
tin
g
Source MarketWatch July 26
The KPI toolbox for startersA few elements to begin with
New customer concerns and interests in social amp environmental issues impact the customer-business relationshipCustomers loyalty is now related to the companyrsquos external commitment
Stakeholders centricity soon to be integrated as a driver of customer value
The next move
Direct traffic Conversion rate Nb of active users Churn rate Recurring users ARPU CAC CLV NPS Customer habitsspecific to each company
Customer experience has been crucial for the success of new business models
It is key to gather experience KPIs on every step of the customer journey and to set specific objectives for each step
Offering the best experience tailored on customerrsquos specific needs must be an all-time preoccupation
The must haves
The underrated
game changer
The
pat
h t
o cu
stom
er K
PI r
epor
tin
g
Going further Download Fabernovel data mapping toolkit
The
pat
h t
o cu
stom
er K
PI r
epor
tin
g
Evaluate the level of maturity of your customer approach
And you how customer-centric are you
Click here for an overview of the index
To access the full version of the index you can contact us at axellericour-dumasfabernovelcom
Jean-Christophe LiaubetPartner
Jean-Christophe joined Fabernovel in 2017 as a Partner and founder of the valuation practice of the Group
With over 20 years of experience as an Equity Analyst and then Managing Director at Exane BNP Paribas he helps corporates make and value the best investment decisions
Gabrielle PeyrelongueValue analyst
Graduate from ESSEC Gabrielle joined Fabernovel in 2018 as a Value Analyst
She has worked within Fabernovel practices in Paris and San Francisco focusing on several projects including innovation strategy and new models of valuation based on extra financial criteria
Axelle Ricour-DumasValue Director
Axelle joined Fabernovel in 2018 as a Director after 20 years as Equity analyst at Cheuvreux Director of Investor Relations at IPSOS and Founder of her company MYFINADVICE
At Fabernovel she works on several projects of strategic advisory and has a strong expertise on the assessment and scoring of strategic projects
Jeacutereacutemy TaiumlebQuantitative analyst
Jeacutereacutemy joined Fabernovel as a quantitative analyst after graduating from CentraleSupelec and ESCP Europe
He specializes in quantitative finance and data analysis especially for tech companies and works on several projects including financial research financial modelling and ecosystem modelling
AuthorsC
red
its
An
nex
esKPIs glossary
ARPCOAverage Revenue Per Convergent Offer
ARPU (Average Revenue Per User)total of revenuestotal users ARRAnnual Recurring Revenue
Avg lifespan of customer (in months)1monthly churn
Cohort analysisanalysis based on consumersusers fragmentation
Customer acquisition cost total acquisition campaign costsnumber of new customers (CLVCAC ratio)
Customer concentrationbiggest customer revenuetotal revenue Customer Effort Scoremeasures satisfaction regarding the effort through customer journey
Contribution marginselling price per unit minus the variable cost per unit
LTV or CLV Customer lifetime valueARPU x 1CLV attrition rate Can also be based on FCF margins
DMT (Dureacutee Moyenne de Traitement)average processing time
First Call Resolutionfirst call resolution rate reflects customer service performance
Fulfillment Cost RatioFulfillment cost (Cost of sales amp distributionlogistic content creation services payments)revenue
GMV (Gross Merchandise Value)average nb of orders per customer x average basket size(after returns)
Marketing Cost Ratiomarketing costsrevenue
Net addsnew subscribers or customers - nb of unsubscribing
Net Promoter Score brand ambassadors - brand detractors
An
nex
esKPIs glossary
Network effectthe more a product is used the more its value increases(ex Facebook) each company has its own KPIs to assess it
Problem Resolution time(Sum of All Interactions for Total Resolved Issues - Total nb of Resolved Issues)
RGUsRevenue Generating Units (a customer can represent various RGUs for example when subscribing to a mobile phone contract + TV contract + internet rarr the customer represents 3 RGUs) Traffic sourcesdirect organichellip
Conversion ratepace at which the solutionproductservice has been adopted
Rebound ratecustomers leaving site without a chance to convert them
repeat purchaseNb of repeat purchasenb of total purchases
Requests rate with lowhigh level of added valuesimplerecurring customer service requests rate vs complex ones Retention rate(Nb of Customers at End of Period - nb of New Customers Acquired During Period)nb of Customers at Start of Period
Viralityspeed of productservice spread can be measured by k-value (average nb of invitations sent by each userconversion rate of invitations into new users)
An
nex
esCompanies analyzed in the benchmark
HelloFresh
Netflix
Orange
PSA
Showroomprive
Snap
Spotify
Square
Takewaycom
Twitch
Ubisoft
Vodafone
Zalando
Zynga
Activision Blizzard
Airbnb
AirFrance
Alibaba
Allianz
Amazon
Asos
Axa
Baidu
Blablacar
Blue Apron
BNP
Carrefour
Creacutedit Agricole
Easyjet
EDF
Engie
Europcar Mobility Group
Thank youCONTACT
Jean-Christophe LIAUBETPartner
+33 6 08 86 24 88jean-christopheliaubetFabernovelcom
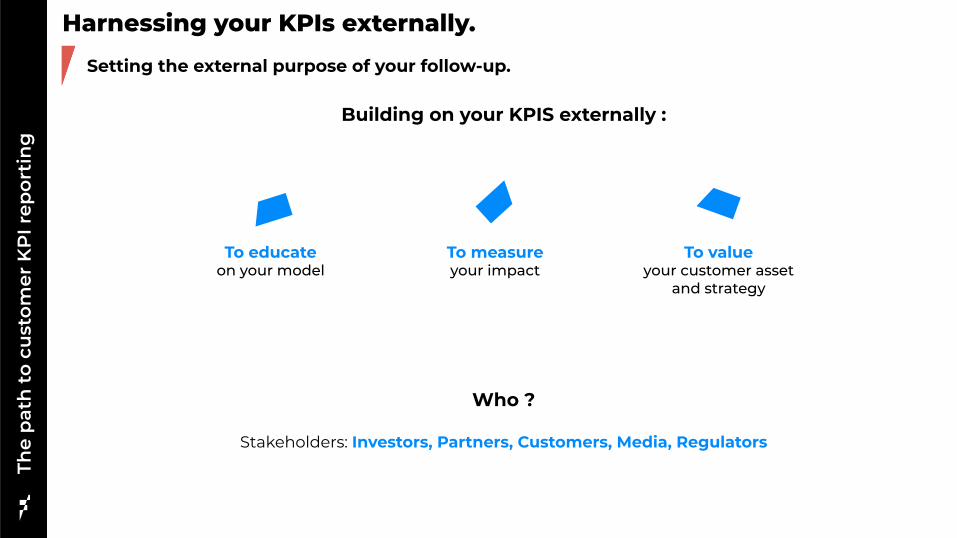
The
pat
h t
o cu
stom
er K
PI r
epor
tin
gHarnessing your KPIs externally
Setting the external purpose of your follow-up
To measure your impact
To valueyour customer asset
and strategy
To educate on your model
Building on your KPIS externally
Who
Stakeholders Investors Partners Customers Media Regulators
Twitter valorizing customer capital to financial markets
+ 10Stock price
User acquisition KPI positively influences market reaction after disappointing forecasts
In the publication of its 2019 Q2 earnings Twitter published a
guidance adjusted downwards with revenue growth expected
to slow down and a disappointing forecast
And yet the companyrsquos market cap has been up following the
publication of its quarterly results driven by a better user acquisition growth which has pushed investors to focus on
mid-term potential
+ 5 millionDaily active users
The
pat
h t
o cu
stom
er K
PI r
epor
tin
g
Source MarketWatch July 26
The KPI toolbox for startersA few elements to begin with
New customer concerns and interests in social amp environmental issues impact the customer-business relationshipCustomers loyalty is now related to the companyrsquos external commitment
Stakeholders centricity soon to be integrated as a driver of customer value
The next move
Direct traffic Conversion rate Nb of active users Churn rate Recurring users ARPU CAC CLV NPS Customer habitsspecific to each company
Customer experience has been crucial for the success of new business models
It is key to gather experience KPIs on every step of the customer journey and to set specific objectives for each step
Offering the best experience tailored on customerrsquos specific needs must be an all-time preoccupation
The must haves
The underrated
game changer
The
pat
h t
o cu
stom
er K
PI r
epor
tin
g
Going further Download Fabernovel data mapping toolkit
The
pat
h t
o cu
stom
er K
PI r
epor
tin
g
Evaluate the level of maturity of your customer approach
And you how customer-centric are you
Click here for an overview of the index
To access the full version of the index you can contact us at axellericour-dumasfabernovelcom
Jean-Christophe LiaubetPartner
Jean-Christophe joined Fabernovel in 2017 as a Partner and founder of the valuation practice of the Group
With over 20 years of experience as an Equity Analyst and then Managing Director at Exane BNP Paribas he helps corporates make and value the best investment decisions
Gabrielle PeyrelongueValue analyst
Graduate from ESSEC Gabrielle joined Fabernovel in 2018 as a Value Analyst
She has worked within Fabernovel practices in Paris and San Francisco focusing on several projects including innovation strategy and new models of valuation based on extra financial criteria
Axelle Ricour-DumasValue Director
Axelle joined Fabernovel in 2018 as a Director after 20 years as Equity analyst at Cheuvreux Director of Investor Relations at IPSOS and Founder of her company MYFINADVICE
At Fabernovel she works on several projects of strategic advisory and has a strong expertise on the assessment and scoring of strategic projects
Jeacutereacutemy TaiumlebQuantitative analyst
Jeacutereacutemy joined Fabernovel as a quantitative analyst after graduating from CentraleSupelec and ESCP Europe
He specializes in quantitative finance and data analysis especially for tech companies and works on several projects including financial research financial modelling and ecosystem modelling
AuthorsC
red
its
An
nex
esKPIs glossary
ARPCOAverage Revenue Per Convergent Offer
ARPU (Average Revenue Per User)total of revenuestotal users ARRAnnual Recurring Revenue
Avg lifespan of customer (in months)1monthly churn
Cohort analysisanalysis based on consumersusers fragmentation
Customer acquisition cost total acquisition campaign costsnumber of new customers (CLVCAC ratio)
Customer concentrationbiggest customer revenuetotal revenue Customer Effort Scoremeasures satisfaction regarding the effort through customer journey
Contribution marginselling price per unit minus the variable cost per unit
LTV or CLV Customer lifetime valueARPU x 1CLV attrition rate Can also be based on FCF margins
DMT (Dureacutee Moyenne de Traitement)average processing time
First Call Resolutionfirst call resolution rate reflects customer service performance
Fulfillment Cost RatioFulfillment cost (Cost of sales amp distributionlogistic content creation services payments)revenue
GMV (Gross Merchandise Value)average nb of orders per customer x average basket size(after returns)
Marketing Cost Ratiomarketing costsrevenue
Net addsnew subscribers or customers - nb of unsubscribing
Net Promoter Score brand ambassadors - brand detractors
An
nex
esKPIs glossary
Network effectthe more a product is used the more its value increases(ex Facebook) each company has its own KPIs to assess it
Problem Resolution time(Sum of All Interactions for Total Resolved Issues - Total nb of Resolved Issues)
RGUsRevenue Generating Units (a customer can represent various RGUs for example when subscribing to a mobile phone contract + TV contract + internet rarr the customer represents 3 RGUs) Traffic sourcesdirect organichellip
Conversion ratepace at which the solutionproductservice has been adopted
Rebound ratecustomers leaving site without a chance to convert them
repeat purchaseNb of repeat purchasenb of total purchases
Requests rate with lowhigh level of added valuesimplerecurring customer service requests rate vs complex ones Retention rate(Nb of Customers at End of Period - nb of New Customers Acquired During Period)nb of Customers at Start of Period
Viralityspeed of productservice spread can be measured by k-value (average nb of invitations sent by each userconversion rate of invitations into new users)
An
nex
esCompanies analyzed in the benchmark
HelloFresh
Netflix
Orange
PSA
Showroomprive
Snap
Spotify
Square
Takewaycom
Twitch
Ubisoft
Vodafone
Zalando
Zynga
Activision Blizzard
Airbnb
AirFrance
Alibaba
Allianz
Amazon
Asos
Axa
Baidu
Blablacar
Blue Apron
BNP
Carrefour
Creacutedit Agricole
Easyjet
EDF
Engie
Europcar Mobility Group
Thank youCONTACT
Jean-Christophe LIAUBETPartner
+33 6 08 86 24 88jean-christopheliaubetFabernovelcom
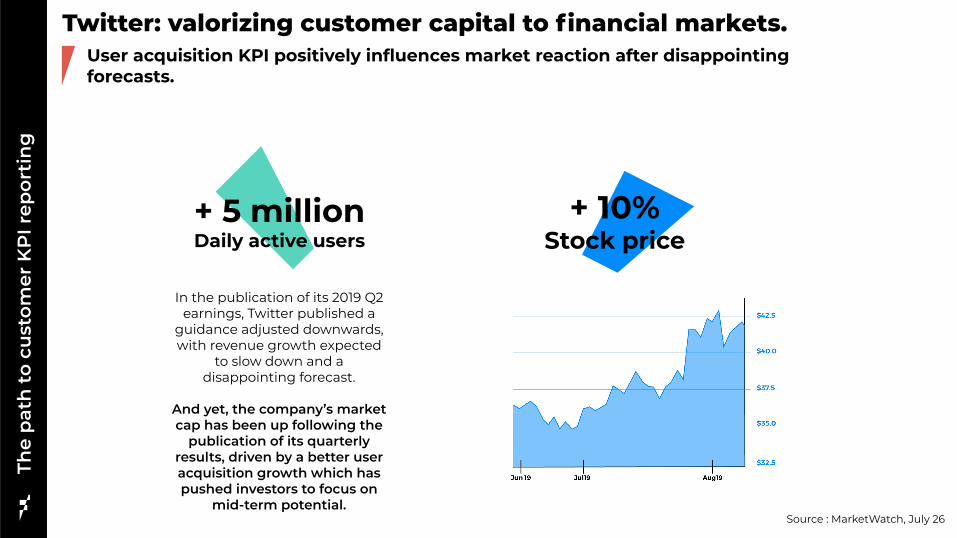
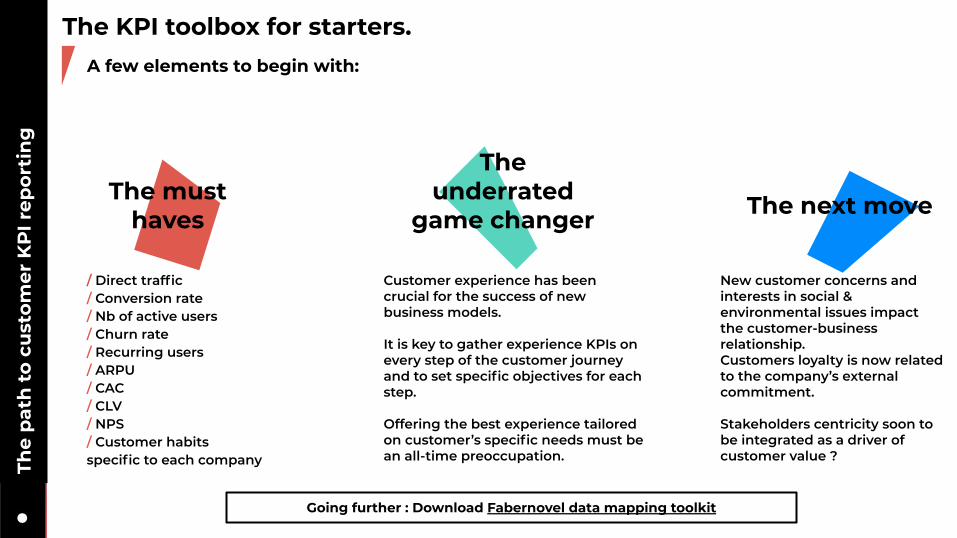
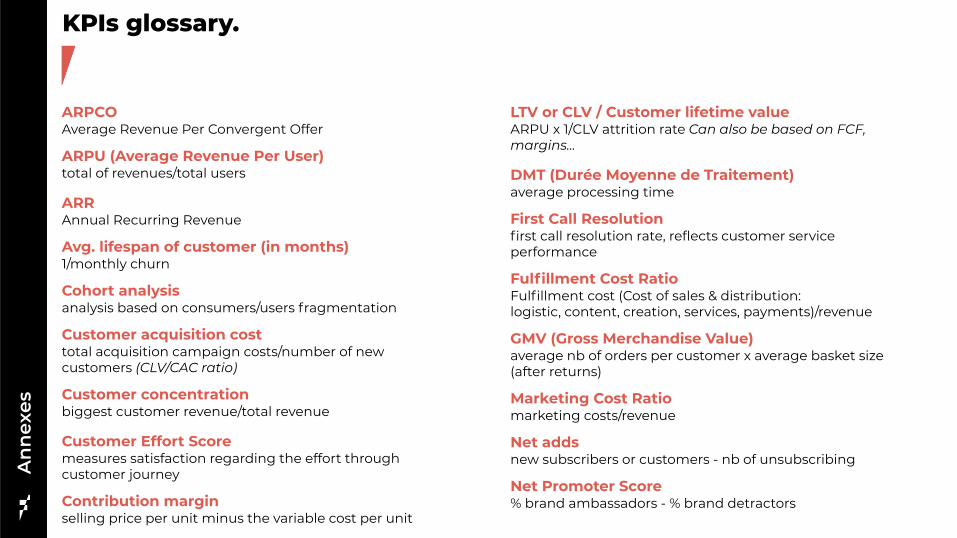
An
nex
esKPIs glossary
Network effectthe more a product is used the more its value increases(ex Facebook) each company has its own KPIs to assess it
Problem Resolution time(Sum of All Interactions for Total Resolved Issues - Total nb of Resolved Issues)
RGUsRevenue Generating Units (a customer can represent various RGUs for example when subscribing to a mobile phone contract + TV contract + internet rarr the customer represents 3 RGUs) Traffic sourcesdirect organichellip
Conversion ratepace at which the solutionproductservice has been adopted
Rebound ratecustomers leaving site without a chance to convert them
repeat purchaseNb of repeat purchasenb of total purchases
Requests rate with lowhigh level of added valuesimplerecurring customer service requests rate vs complex ones Retention rate(Nb of Customers at End of Period - nb of New Customers Acquired During Period)nb of Customers at Start of Period
Viralityspeed of productservice spread can be measured by k-value (average nb of invitations sent by each userconversion rate of invitations into new users)
An
nex
esCompanies analyzed in the benchmark
HelloFresh
Netflix
Orange
PSA
Showroomprive
Snap
Spotify
Square
Takewaycom
Twitch
Ubisoft
Vodafone
Zalando
Zynga
Activision Blizzard
Airbnb
AirFrance
Alibaba
Allianz
Amazon
Asos
Axa
Baidu
Blablacar
Blue Apron
BNP
Carrefour
Creacutedit Agricole
Easyjet
EDF
Engie
Europcar Mobility Group
Thank youCONTACT
Jean-Christophe LIAUBETPartner
+33 6 08 86 24 88jean-christopheliaubetFabernovelcom
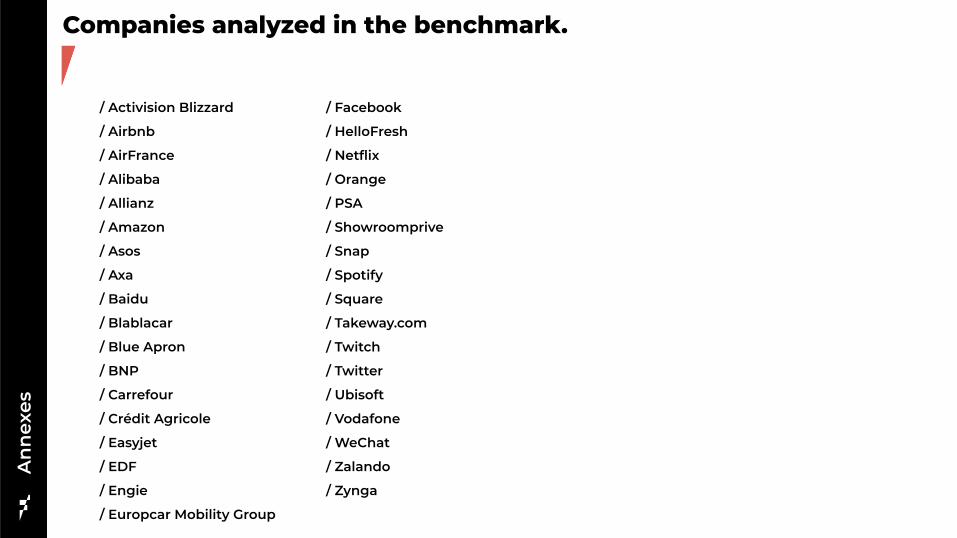
An
nex
esCompanies analyzed in the benchmark
HelloFresh
Netflix
Orange
PSA
Showroomprive
Snap
Spotify
Square
Takewaycom
Twitch
Ubisoft
Vodafone
Zalando
Zynga
Activision Blizzard
Airbnb
AirFrance
Alibaba
Allianz
Amazon
Asos
Axa
Baidu
Blablacar
Blue Apron
BNP
Carrefour
Creacutedit Agricole
Easyjet
EDF
Engie
Europcar Mobility Group
Thank youCONTACT
Jean-Christophe LIAUBETPartner
+33 6 08 86 24 88jean-christopheliaubetFabernovelcom

Thank youCONTACT
Jean-Christophe LIAUBETPartner
+33 6 08 86 24 88jean-christopheliaubetFabernovelcom