pcc mission kpis - pima.edu · pcc mission kpis core theme: student ... • new diversity officer...
TRANSCRIPT
PCC Mission KPIsCore Theme: Student Services
December 2017
Institutional Research, Planning and Effectiveness

PCC’s 7 Core Themes

Mission Key Performance Indicators (KPI) –Student Services
Objectives:
Provide quality and appropriate student support services at the campuses
Provide student‐centered admissions and financial aid processes that support student success

Core Theme: Student Services: KPIs Community College Survey of Student Engagement (CCSSE) benchmark on “Support for
Learners” • Financial aid had outreach events and FAFSA sessions ∙ PimaConnection Initiative• New Diversity officer has had a number of Diversity Cafe chats ∙ Rethinking new student orientation• New Ethnic and Transborder studies program was launched and has a number of events• Introduced Program Advisors for students to have an assigned advisor in their program of study
Access KPI: “Student progress from initial contact through application, placement tests (if applicable), new student orientation, registration, enrollment at defined intervals throughout the semester, completion of the first semester and persistence into the following spring”
• New admissions application
• Admissions counselors now have caseloads to follow through on getting students to apply and through the enrollment funnel
• We had an engagement with Blackboard over the summer to reengage students and get them to reenroll in Fall 2017
Three‐year average financial aid default rate • Since this is a 3 year indicator, it takes sometime for initiative to take effect, although we did work with the Department of Education to get
some students removed from our cohort who were involved in fraudulent behavior, had passed away, or were erroneously in the cohort. We currently have a default management plan that is being worked and included work with SALT to provide default counseling to students and will bring on board Financial Aid TV to provide more info to students about loan default.

Why should we care about Student Engagement?Stud
ent E
ngagem
ent
Persisten
ce
Higher level of achievement
Source: h
ttp://www.ccsse.org/cen
ter/abou
t_cccse/focus.cfm
Involvem
ent in learning
Stud
ent S
atisfactio
n
Academ
ic Success

KPI: “Support for Learners” Community College Survey of Student
Engagement (CCSSE)
A benchmark dashboard report is available on PCC mission‐fulfillment website
https://www.pima.edu/about‐pima/mission/mission‐fulfillment.html

“Support for Learners” Community College Survey of Student Engagement (CCSSE)
• Administer in Spring 2017 in classrooms• Survey used by community colleges throughout nation• Provides metrics to measure student engagement• Benchmark ‐ allows comparison of the entire pool of students who completed survey and a comparison of extra‐large community college
• Benchmark PCC’s progress over time (2011, 2014, 2017)• Results will be posted: https://www.pima.edu/about‐pima/reports/benchmarking‐studies/index.html

How much does the College provide the financial support you need to afford your education?
Source: 201
4 CC
SSE
Results

Community College FACULTY Survey Student Engagement (CCFSSE)
• Companion to CCSSE • Asks faculty about perceptions regarding students’ educational experiences, their teaching practices, and the ways they spend their professional time
• Online Survey Spring 2017• Will post reports with benchmark data in 2018: https://www.pima.edu/about‐pima/reports/benchmarking‐studies/index.html

Survey of Entering Student Engagement (SENSE)
• Asks about experiences of entering students; including registration, advising, placement testing, tutoring, financial aid, instruction, study habits, academic intention, etc.
• Administered in 90 classes in Fall 2017• 1500 + responses• Will post reports with benchmark data in March 2018: https://www.pima.edu/about‐pima/reports/benchmarking‐studies/index.html

KPI: Student progress• The Access KPI: “Student progress from initial contact through application, placement tests (if applicable), new student orientation, registration, enrollment at defined intervals throughout the semester, completion of the first semester and persistence into the following spring” will also provide insights related to student services
• Interactive enrollment funnel from filling out the application, placement test, orientation, to registration. Includes applicant demographics too.
• Pima Reports –> Interactive Reports – Beta Testing ‐> Admission Reports ‐> Admissions Summary – Last Four Fallhttps://pimareports.pima.edu/BOE/BI


KPI: Three‐year average financial aid default rate
• Background
Applicants/Enrolled ApplicantsOverall Financial Aid ApplicantsApplicants who are Offered Financial AidPELL GrantsLoans
Subsidized vs. Unsubsidized
• Default RatesLoans that are incorporated into the Calculation of the Default Rate

42,56540,738
45,87544,694
38,924
30,028
27,94129,006
27,144 27,765
35,217
32,185 31,84630,541
24,267
20,63319,635 20,199
17,79416,102
0
5,000
10,000
15,000
20,000
25,000
30,000
35,000
40,000
45,000
50,000
2008 2009 2010 2011 2012 2013 2014 2015 2016 2017
Applicant Count per Year and Students who Subsequently Enrolled

0.0%
5.0%
10.0%
15.0%
20.0%
25.0%
30.0%
35.0%
40.0%
45.0%
2008 2009 2010 2011 2012 2013 2014 2015 2016 2017
17.3%
21.0%
30.6%31.7%
37.7%
31.3%29.7% 30.4%
34.4%
42.0%
Students Lost through the Application Process thru Enrollment

10.5%14.6%
19.6%23.5%
26.3%29.3% 28.5% 27.5% 26.4%
23.8%
89.5%85.4%
80.4%76.5%
73.7%70.7% 71.5% 72.5% 73.6%
76.2%
0.0%
10.0%
20.0%
30.0%
40.0%
50.0%
60.0%
70.0%
80.0%
90.0%
100.0%
2008 2009 2010 2011 2012 2013 2014 2015 2016 2017
Applicants to PCC and Applied for Financial Aid
YES NO
YES
NO
0.0%
10.0%
20.0%
30.0%
40.0%
50.0%
60.0%
70.0%
80.0%
90.0%
20082009
20102011
20122013
20142015
20162017
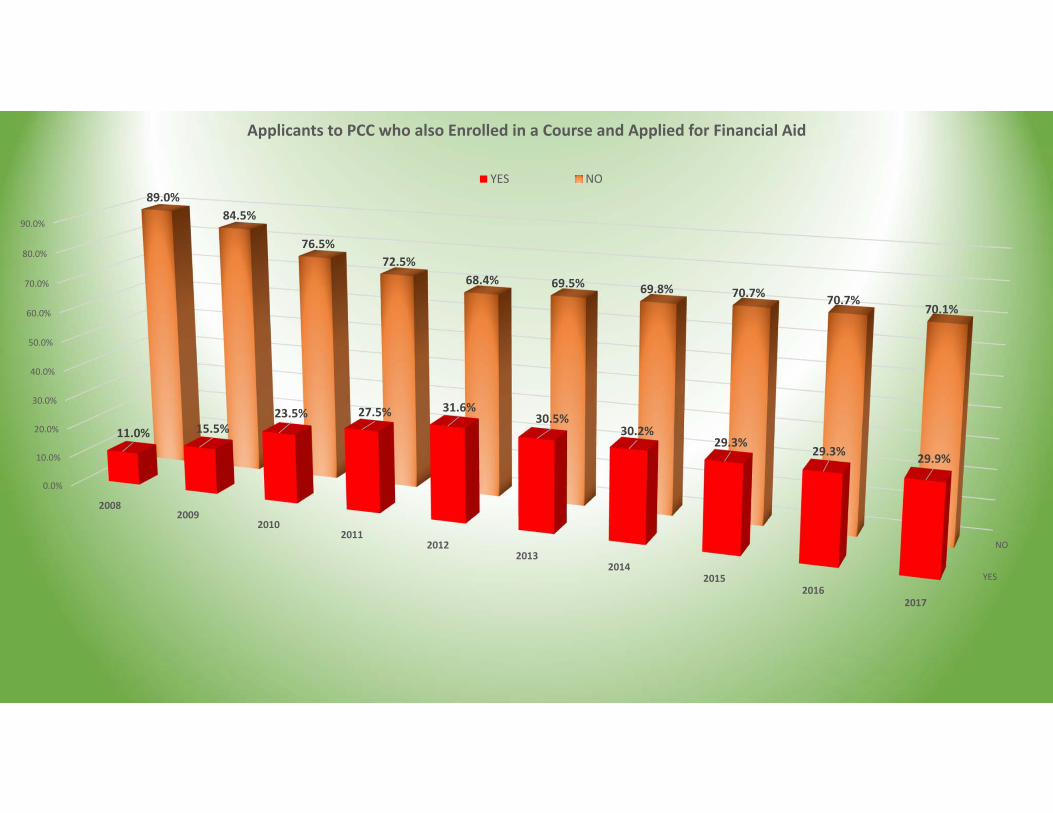
11.0% 15.5%23.5% 27.5% 31.6%
30.5%30.2%
29.3%29.3% 29.9%
89.0%84.5%
76.5%72.5%
68.4% 69.5% 69.8% 70.7% 70.7%70.1%
Applicants to PCC who also Enrolled in a Course and Applied for Financial Aid
YES NO

0.0%
10.0%
20.0%
30.0%
40.0%
50.0%
60.0%
70.0%
80.0%
2008 2009 2010 2011 2012 2013 2014 2015 2016 2017
61.9%
72.4%76.2%
70.1%
76.4%
70.3%
65.5%
70.8% 71.1%68.4%
38.1%
27.6%23.8%
29.9%
23.6%
29.7%
34.5%
29.2% 28.9%31.6%
Students who were Admitted to PCC, Enrolled in at least one course, Applied for Financial Aid and were Offered Financial Aid
YES NO

0.0%
10.0%
20.0%
30.0%
40.0%
50.0%
60.0%
70.0%
2008 2009 2010 2011 2012 2013 2014 2015 2016 2017
49.7%
58.7%
64.1% 63.6%
69.3%
63.7%
59.0%
64.1% 64.4%
60.4%
50.3%
41.3%
35.9% 36.4%
30.7%
36.3%
41.0%
35.9% 35.6%
39.6%
PCC Applicants who Enrolled in a Course within 2 Years and who was Offered a PELL Grant
YES NO

10 States With The Highest Pell Grant Dollar Disbursements
By Katy Hopkins, Communications Staff
In a newly released letter to Congress, the Department of Education (ED) provides a trove of Pell Grant recipient data.Nationwide, $31,972,224,445 was disbursed in Pell Grant funding in the 2012‐13 award year. In the letter, ED breaks down dollar disbursements by state, as well as the number of recipients in each. According to ED, the following 10 states were home to the highest dollar total Pell Grant disbursements that award year:
1. California: $3,941,927,385 to 1,098,008 recipients2. Texas: $2,275,245,881 to 651,712 recipients3. Florida: $2,157,019,496 to 632,279 recipients4. New York: $1,974,667,215 to 523,613 recipients5. Arizona: $1,666,853,069 to 477,135 recipients6. Illinois: $1,218,072,520 to 361,962 recipients7. Michigan: $1,017,422,093 to 308,074 recipients8. Ohio: $1,005,859,283 to 301,589 recipients9. Georgia: $996,890,157 to 309,006 recipients10. Pennsylvania: $981,064,153 to 287,120 recipients
ED provided the letter in response to a request from the House and Senate Appropriations Committees, as part of the fiscal year (FY) 2014 Consolidated Appropriations Act, for enrollment and graduation information on Pell Grant recipients. See ED’s letter for the full data, including institutional award information, and read NASFAA’s recap on the aggregate graduation information released.
Publication Date: 2/18/2015Source: National Association of Student Financial Aid Administratorshttp://www.nasfaa.org/news‐item/925/10_States_With_The_Highest_Pell_Grant_Dollar_Disbursements

Financial Aid 3‐Year Default RatesFY 2014, 2013, 2012, and 2011
ENROLLMENT: To provide context for the Cohort Default Rate (CDR) data we include enrollment data (students enrolled at any time during the year) and a corresponding percentage (borrowers entering repayment divided by that enrollment figure). While there is no direct relationship between the timing of when a borrower entered repayment (October 1 through September 30) and any particular enrollment year, for the purpose of these data, we have chosen to use the academic year ending on the June 30 prior to the beginning of the cohort year (e.g., FY 2013 CDR Year will use 2011-2012 enrollment).https://nslds.ed.gov/nslds/nslds_SA/defaultmanagement/cohortdetail_3yr.cfm?sno=13&ope_id=007266
Current Date : 10/27/17
FY 2014 FY 2013 FY 2012 FY 2011
Default Rate 19.3 % 20.9 % 21.3 % 20.6 %
Number in Default 780 934 1,023 790
Number in Repay 4,037 4,452 4,799 3,819
Enrollment figures 47,374 53,250 56,916 61,012
Percentage Calculation 8.5 % 8.3 % 8.4 % 6.2 %OPE ID: 7266Type: Associate's DegreeControl: PublicPrograms: Both (FFEL/FDL)
2014 source: https://www2.ed.gov/offices/OSFAP/defaultmanagement/cdr.html

ARIZONA COMMUNITY COLLEGE’S DEFAULT RATES
Name 2014 Default Rate 2013 Default Rate 2012 Default Rate 2011 Default Rate
COCHISE COLLEGE 6.1 5.2 9.6 9.0
ARIZONA WESTERN COLLEGE 17.1 24.5 27.0 21.4
CHANDLER‐GILBERT COMMUNITY COLLEGE 17.3 16.2 16.7 21.1
MOHAVE COMMUNITY COLLEGE 17.4 18.0 22.7 28.6
COCONINO COUNTY COMMUNITY COLLEGE 18.0 17.1 22.4 21.9
SCOTTSDALE COMMUNITY COLLEGE 19.1 18.4 16.3 16.1
PIMA COMMUNITY COLLEGE 19.3 20.9 21.3 20.6
PARADISE VALLEY COMMUNITY COLLEGE 19.6 16.6 18.1 20.2
GLENDALE COMMUNITY COLLEGE 20.4 21.1 22 18.1
RIO SALADO COMMUNITY COLLEGE 21.9 22.4 29.9 24.9
ESTRELLA MOUNTAIN 22.5 18.8 18.6 17.4
CENTRAL ARIZONA COLLEGE 22.5 23.2 24.4 22.6
MESA COMMUNITY COLLEGE 22.8 24.3 22.9 19.2
GATEWAY COMMUNITY COLLEGE 24.7 20.5 18.2 17.3
YAVAPAI COLLEGE 25.5 22.2 23.2 19.3
PHOENIX COLLEGE 31.0 27.6 24.8 20.6
SOUTH MOUNTAIN COMMUNITY COLLEGE 33.3 30.2 28.5 28.5Source: https://www2.ed.gov/offices/OSFAP/defaultmanagement/cdr.htmlNote: Eastern Arizona has no data.