the im-9 cell line: a model for evaluating tcdd-induced
TRANSCRIPT
Wright State University Wright State University
CORE Scholar CORE Scholar
Browse all Theses and Dissertations Theses and Dissertations
2010
The IM-9 Cell Line: A Model for Evaluating TCDD-Induced The IM-9 Cell Line: A Model for Evaluating TCDD-Induced
Modulation of The Polymorphic Human Hs1,2 Enhancer within the Modulation of The Polymorphic Human Hs1,2 Enhancer within the
3' Immunoglobulin Heavy Chain Regulatory Region 3' Immunoglobulin Heavy Chain Regulatory Region
Ruth C. Chambers-Turner Wright State University
Follow this and additional works at: https://corescholar.libraries.wright.edu/etd_all
Part of the Immunology and Infectious Disease Commons, and the Microbiology Commons
Repository Citation Repository Citation Chambers-Turner, Ruth C., "The IM-9 Cell Line: A Model for Evaluating TCDD-Induced Modulation of The Polymorphic Human Hs1,2 Enhancer within the 3' Immunoglobulin Heavy Chain Regulatory Region" (2010). Browse all Theses and Dissertations. 326. https://corescholar.libraries.wright.edu/etd_all/326
This Thesis is brought to you for free and open access by the Theses and Dissertations at CORE Scholar. It has been accepted for inclusion in Browse all Theses and Dissertations by an authorized administrator of CORE Scholar. For more information, please contact [email protected].
THE IM-9 CELL LINE: A MODEL FOR EVALUATING TCDD-INDUCED
MODULATION OF THE POLYMORPHIC HUMAN HS1,2 ENHANCER WITHIN
THE 3’ IMMUNOGLOBULIN HEAVY CHAIN REGULATORY REGION.
A thesis submitted in partial fulfillment
of the requirements for the degree of
Master of Science
By
RUTH CHAMBERS-TURNER
B.S., Central State University, 2003
2010
Wright State University

WRIGHT STATE UNIVERSITY
SCHOOL OF GRADUATE STUDIES
Date 3/18/2010
I HEREBY RECOMMEND THAT THE THESIS PREPARED UNDER MY
SUPERVISION BY Ruth Chambers-Turner ENTITLED The IM-9 cell
line: a model for evaluating TCDD-induced modulation of the
polymorphic human hs1,2 enhancer within the 3’
immunoglobulin heavy chain regulatory region. BE ACCEPTED
IN PARTIAL FULFILLMENT OF THE REQUIREMENTS FOR THE DEGREE
OF Master of Science
Courtney Sulentic, Ph.D.
Thesis Director
Barbara Hull, Ph.D.
Program Director
Committee on Final Examination
Courtney Sulentic, Ph.D.
Nancy Bigley, Ph.D.
Michael Leffak, Ph.D.
John A. Bantle, Ph.D.
Vice President for Research and
Graduate Studies and Interim Dean
of Graduate Studies

iii
ABSTRACT
Chambers-Turner, Ruth M.S., Microbiology and Immunology Graduate Program, Wright
State University, 2010. The IM-9 cell line: a model for evaluating TCDD-induced
modulation of the polymorphic human hs1,2 enhancer within the 3’ immunoglobulin
regulatory region.
2,3,7,8-tetrachlorodibenzo-p-dioxin (TCDD), a disrupter, of B-cell differentiation,
induces binding of the aryl hydrocarbon receptor (AhR) nuclear complex to dioxin
responsive elements (DRE) within the mouse immunoglobulin heavy chain regulatory
region (3’IgHRR), and produces a marked inhibition of 3’IgHRR activation, IgH
expression, and antibody secretion in a well-characterized mouse B-cell line (CH12.LX).
The mouse 3’IgHRR consists of at least four enhancers (hs3a; hs1,2; hs3b; hs4), and is
highly homologous with the three enhancers (hs3; hs1,2; hs4) of the human 3’IgHRR. A
polymorphism of the human hs1,2 enhancer (resulting in varying numbers of tandem
repeats containing a DRE and κB site) has been correlated with several autoimmune
diseases. Although the human and mouse hs1,2 enhancers are share a ~90% identity,
luciferase reporter studies in mouse CH12.LX B-cells showed that TCDD inhibited LPS
stimulation of the mouse hs1,2 enhancer but co-treatment with TCDD and LPS
synergistically activated human hs1,2 enhancer activity. To evaluate transcriptional
differences between the human and mouse hs1,2 enhancers, our objectives were to
iv
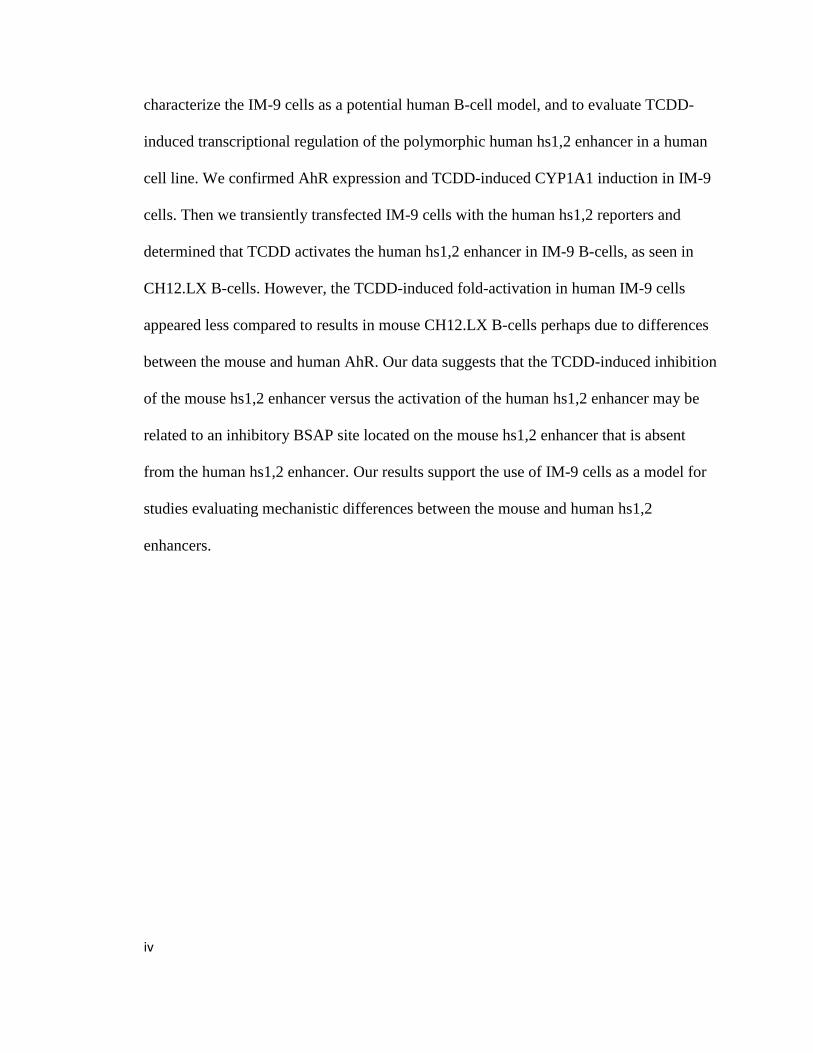
characterize the IM-9 cells as a potential human B-cell model, and to evaluate TCDD-
induced transcriptional regulation of the polymorphic human hs1,2 enhancer in a human
cell line. We confirmed AhR expression and TCDD-induced CYP1A1 induction in IM-9
cells. Then we transiently transfected IM-9 cells with the human hs1,2 reporters and
determined that TCDD activates the human hs1,2 enhancer in IM-9 B-cells, as seen in
CH12.LX B-cells. However, the TCDD-induced fold-activation in human IM-9 cells
appeared less compared to results in mouse CH12.LX B-cells perhaps due to differences
between the mouse and human AhR. Our data suggests that the TCDD-induced inhibition
of the mouse hs1,2 enhancer versus the activation of the human hs1,2 enhancer may be
related to an inhibitory BSAP site located on the mouse hs1,2 enhancer that is absent
from the human hs1,2 enhancer. Our results support the use of IM-9 cells as a model for
studies evaluating mechanistic differences between the mouse and human hs1,2
enhancers.

v
TABLE OF CONTENTS
I. INTRODUCTION
Overview of B-cell and immunoglobulin development……………………..1
Organization of the immunoglobulin heavy chain gene……………………..5
2,3,7,8-Tetrachlorodibenzo--dioxin (TCDD)………………………………8
TCDD, the aryl hydrocarbon receptor and dioxin response elements……….11
Transcriptional modulation of the 3’IgHRR by TCDD……………………..15
Basal transcriptional regulation of the individual enhancers of the mouse and
human 3’IgHRR……………………………………………………………..16
Transcriptional regulation of the human hs1,2 enhancer…………………….22
The human IM-9 cellular model……………………………………………..27
Relevance…………………………………………………………………….28
II. MATERIALS AND METHODS
Chemicals and reagents………………………………………………….......30
Cell line models……………………………………………………………...30
Western blot………………………………………………………………….31
RNA isolation………………………………………………………………..32
Reverse Transcriptase and Real-time Polymerase Chain Reaction (RT-
PCR)................................................................................................................33
vi
Enzyme Linked Immunosorbent Assay (ELISA)…………………………....34
Reporter plasmids…………………………………………………………....36
Transient transfections…………………………………………………….....39
Luciferase Assay……………………………………………………………..40
Statistical analysis of data…………………………………………………...39
III. RESULTS
Characterization of IM-9 cells……………………………………………….42
IM-9 cells express the AhR……………………………………………...43
IM-9 cells have a functional AhR signaling pathway…………………...46
IM-9 cells express basal IgG…………………………………………….48
IgG expression in IM-9 cells is not significantly activated by CpG or
R848………………………......................................................................51
Transfection of the polymorphic human hs1,2 enhancer into IM-9 cells
Culturing conditions for transfection studies in IM-9 cells……………...56
TCDD activates the human polymorphic hs1,2 enhancer……………….60
The human hs1,2 enhancer is not activated by CpG…………………….64
BSAP decreases TCDD-induced activity of the human hs1,2 enhancer…….66
IV. DISCUSSION
The IM-9 cells are an acceptable but not ideal cellular model for mechanistic
studies on the effects of TCDD on the 3’IgHRR……………………………69
The human polymorphic hs1,2 enhancer is activated by TCDD in human IM-9
cells…………………………………………………………………………..73

vii
BSAP negatively regulates the 1A+BSAP reporter in IM-9 cells treated with
TCDD………………………………………………………………………..75
V. CONCLUSION……………………………………………………………..79
VI. LITERATURE CITED……………………………………………………...81

viii
LIST OF FIGURES
1. B-cell maturation, differentiation, and Ig expression…………………………....4
2. Schematic of the mouse and human IgH genes………………………………….7
3. Polyaromatic TCDD induces chloracne poisoning………………………………10
4. The aryl hydrocarbon pathway…………………………………………………..14
5. Schematic of the mouse IgH locus and the mouse hs1,2 enhancer……………...25
6. Schematic of the human IgH locus and the C1 and C2 hs1,2 enhancer
regions………………………….………………………………………………...26
7. Human hs1,2 enhancer luciferase reporter constructs…………………………...38
8. CpG treatment does not appreciably increase AhR expression in human IM-
cells……………………………………………………………………………....45
9. TCDD induces CYP1A1 induction……………………………………………...47
10. Basal Ig secretion from IM-9 cells normalized to cell number………………….50
11. A low concentration of CpG modestly activates IgG secretion in IM-9 cells…..53
12. IM-9 cells are not activated by R848……………………………………………54
13. The 1B reporter is activated by 30 and 100 nM TCDD when IM-9 cells are
cultured to stationary or log concentrations……………………………………..58
14. The fold-activation of the 1B and 1C reporters is slightly higher in IM-9 cells
initially cultured to a stationary phase versus a log phase………………….…...59
ix
15. The human hs1,2 reporters are activated by TCDD in human IM-9 cells……….62
16. LPS and TCDD co-treatment synergistically activates the 1B reporter in
CH12.LX cells but CpG treatment does not enhance TCDD-induced activation of
the 1B reporter in IM-9 cells…………………………………………………...65
17. TCDD-induced activation of the human hs1,2 enhancer is inhibited by the
addition of a BSAP binding motif……………………………………………….68
x
LIST OF TABLES
1. Regulation of the mouse hs4 and hs1,2 enhancers………………………………21
2. Comparisons of TCDD-induced fold-activation relative to vehicle control of VH
promoter alone and the hs1,2 reporters in CH12.LX or IM-9 cells……………...63

xi
ACKNOWLEDGEMENT
I would like to thank my husband, William Turner, my mother, Rita Clark-
Chambers, my father, Kenneth Chambers, and the many other friends and family who
have supported me with open ears, and unlimited encouragement. Your reassurance has
helped to give me the focus and confidence needed to reach and complete this goal. I
would also like to thank my advisor, Courtney Sulentic, and my committee members, as
your continuous support has pushed me to work harder and achieve higher than the
expectations of others. Additionally, I would like to thank my lab mates. Your unending
patience and willingness to answer my many questions has supported my growth in the
field of science and as an individual.

1
INTRODUCTION
Overview of B-cell and immunoglobulin development
2-3-7-8-tetrachlorodibenzo--dioxin (TCDD) is a potent environmental
contaminate that has demonstrated toxic effects in laboratory animals and humans. One
of the most sensitive targets of TCDD is B cells in which TCDD inhibits expression of
the immunoglobulin heavy chain gene (IgH) and secretion of immunoglobulin (Ig) in
activated mouse B cells (Sulentic et al., 1998; Sulentic et al; 2000; Dooley and
Holsapple, 1988; Karras and Holsapple, 1994). Immunoglobulin, also known as antibody
(Ab), is composed of two identical heavy and light chains, each containing a constant and
variable region. The composition of the heavy and light chains is generated in a complex
sequence of events resulting in genetic rearrangement of the immunoglobulin heavy
chain (IgH) and light chain (IgL) genes from their germline configurations. Specifically,
a single variable (V), diversity (D) (only for IgH), and joining (J) region will be
recombined to form the VDJ variable region of IgH and the VJ variable region of IgL.
V(D)J recombination of the light and heavy chains will confer antigen specificity of the
antibody. The IgH gene contains several constant (C) regions that encode each of the five
major classes of antibody (IgM, IgD, IgG, IgA, IgE). A DNA recombination event called
class switch recombination (CSR) will determine which isotype is expressed.
Rearrangement of the VDJ regions and early IgM expression in the cytoplasm occurs
during the first stages of B cell maturation from precursor stem cells to Pro then Pre-B

2
cells (Fig. 1). During the next phase, the immature B cell stage, early IgM is expressed on
the surface of the cell (Fig. 1). In the following mature B cell phase, both IgM and IgD
are expressed on the cell membrane (Fig. 1). Notably, if a B cell fails a step in the
maturation process or recognizes a self antigen, it goes through negative selection, and
will die by apoptosis. Mature B cells can bind antigen through their membrane bound Ig
which is called the B-cell receptor (BCR). The B cell will not differentiate further until it
has been activated by antigen (Ag). Activation initiates stimulatory pathways that result
in regulation of class switch recombination (CSR), proliferation, and Ig expression and
secretion. Activation can be initiated in a T-independent or T-dependent manner. In T-
independent activation a T-independent antigen binds to the BCR or a toll-like receptor
on the B cell membrane. An example of a T-independent antigen is lipopolysaccharide
(LPS), a cell wall component of gram negative bacteria that can, in higher doses, induce
polyclonal activation and antibody secretion by binding to TLR4 or a LPS-specific BCR.
Activation with a T-dependent antigen requires that first the T-dependent antigen binds to
the BCR. The antigen is then engulfed and digested into peptides that are subsequently
displayed on the B cell surface by major histocompatibility complex II (MHC II)
molecules. Then the MHC II/antigen is cross-linked by a CD4+ T-cell receptor along
with an additional stimulatory interaction between the CD40 receptor on the B cell and
CD40 ligand (CD40L) on the T-cell. Activation of a B cell induces a signal transduction
pathway that causes B cell proliferation and differentiation to high antibody producing
plasma cells or memory B cells (Fig. 1). After a B cell has been activated, additional
BCR diversity for antigen can still be generated by somatic hypermutation, in which
single nucleotides of the already rearranged VJ or VDJ regions are randomly exchanged

3
with different nucleotides. Additionally, after B cell activation, CSR can change the
isotype of the expressed immunoglobulin. During CSR double stranded DNA is
enzymatically broken in two of the repetitive sequence regions, termed switch regions
(S), that are associated with each constant region. Then, the segment in between the two
broken S regions, one located upstream of the first constant region and one located
upstream of the constant region that will be expressed following CSR, is deleted out of
the gene and the VDJ is joined to the switched constant region. Throughout the CSR
process the IgH chain maintains its VDJ sequence, and therefore, variable region antigen
specificity remains unchanged. However, a new constant region will be expressed which
will reflect a change in isotype. As Ig is the key effector molecule of the B-cell-mediated
immune response, TCDD-induced modulation of Ig expression and secretion is highly
significant. Normal Ig expression and secretion is in part, dependent on the complex
organization of the IgH gene.

4
Precursor Cell
Pro-B Cell
Pre-B Cell
Immature B Cell
Mature B Cell
IgMIgD
IgMpre-B cell receptor
Antigen Independent Phase
Antigen Dependent Phase
IgMIgE
Plasma Cell
Plasma Cell
IgMIgGIgA
IgGIgAIgE
Memory B Cell
IgG
Plasma Cell
Memory B CellIgA
Plasma Cell
Memory B Cell
Memory B Cell
IgMIgMIgM
LymphoblastStage
Figure 1. B-cell maturation, differentiation, and Ig expression. B cells mature
independent of antigen from precursor stem cells to IgM and IgD-expressing mature B
cells. Activation with antigen results in differentiation into B lymphoblast cells, which
proliferate polyclonally into high antibody-secreting plasma cells, and membrane bound
Ig-expressing memory B cells.

5
Organization of the immunoglobulin heavy chain gene
Regulation of the complexly organized IgH is carefully orchestrated by several
regulatory regions located on both the 5’ and 3’ ends of the IgH gene. The most 5’
element of the IgH is the variable heavy chain promoter (VH) which is followed by VDJ
regions which directly contribute to specificity of the immunoglobulin heavy chain
during B cell development (Reviewed by Alt et al. 1992) (Fig. 2). The immunoglobulin
heavy chain intronic enhancer (Eµ) is located 5’ to the constant region and regulates
VDJ joining during early B cell development (Serwe and Sablitzky, 1993) (Fig. 2).
Initially, the E enhancer was believed to be the lone enhancer of the IgH. However,
Serwe and Sablitzky (1993) conducted a study in which embryonic stem cells with a
deleted E enhancer were used to produce chimeric mice that generated B cells that, in
spite of the deleted E enhancer, still demonstrated V-DJ rearrangements of the IgH loci,
although fewer rearrangements were observed than that of control B cells. This study was
supported by additional studies in which IgH expression was maintained independent of
the E enhancer (Wabl et al, 1984; Klein et al., 1984). Bottaro et al. (1998) supported
evidence of a second enhancer region in studies in which hybridomas generated from
cells containing a E deletion had significant but incomplete inhibition of CSR in the IgH
locus, suggesting partial regulation by a separate regulatory region. Support for a second
enhancer region was also established in studies in which CSR was disrupted by the
deletion of an enhancer region located about 16 kb 3’ of the C gene in mouse B cells
(Pattersson et al., 1990; Lieberson et al., 1991; Darizvach et al., 1991). We now know
that enhancer as the hypersensitivity site 1,2 (hs1,2) enhancer. In another study, B cells

6
from hs1,2 -/-
chimeric mice displayed altered IgG isotype expression and a decrease in
corresponding mRNA transcripts after LPS activation as compared to the wildtype mice,
suggesting an altered CSR response (Cogné et al., 1994). Recent reports suggest that
regulation of the IgH gene is partially mediated via physical interactions between the Eμ
enhancer and the 3’IgHRR in plasma cells (Ju et al. 2007) and in primary splenic cells
VDJ-3’IgHRR as well as E-3’IgHRR interactions were reported (Ju et al. 2007).
Regulation of the 3’IgHRR is highly complex because it is composed of multiple distinct
enhancers (Fig. 2), each containing binding sites for several transcription factors. The
mouse 3’IgHRR contains four hypersensitivity sites associated with enhancer activity
(hs3a; hs1,2; hs3b; and hs4) (Madisen and Groudine, 1994; Chauveau and Cogné, 1998;
Saleque et al., 1997) (Fig. 2). Alternatively, the human IgH contains two 3’IgHRR
downstream of two Cα regions, Cα1 and Cα2. The two 3’IgHRR are nearly identical and
contain three enhancers, hs3a, hs1,2 and hs4 with no equivalent of the mouse hs3b
enhancer (Mills et al., 1997) (Fig. 2). The human C1 3’IgHRR demonstrates elevated
transcription and expression versus the human C2 3’IgHRR (Mills et al., 1997). The
difference could be due to a duplication event resulting in the inversion of the C2 hs1,2
enhancer with respect to its Cα1 homologue (Mills et al. 1997). Additionally the
difference in transcription and expression could be due to the fact that the E synergizes
with the more upstream C1 3’IgHRR, increasing the overall enhancer strength (Mills et
al., 1997). The discovery of the 3’IgHRR led to the question of the mechanism of
chemically-induced deficiencies in B cell function, one specific chemical mediator being
the potent contaminant TCDD.

7
µ d e
VDJ
g3 g1 g2b g2a
VH E
3’IgHRR
Mouse IgH locus
Human IgH locus
EVDJ
µ d g3 g1 e 1 g2 2g4 e
VH
1 3’IgHRR 2 3’IgHRR
Figure 2. Schematic of the mouse and human IgH genes. Variable heavy chain
promoter, VH,, black oval; rearranged VDJ segments, red rectangles; E enhancer, blue
circle; S regions, pink rectangles; constant regions, orange ovals, 3’IgHRR green boxes.

8
2,3,7,8-Tetrachlorodibenzo--dioxin (TCDD)
2,3,7,8-Tetrachlordibenzo--dioxin (TCDD) is an environmentally persistent
polycyclic aromatic hydrocarbon (PAH) (Fig. 3) that is produced as a byproduct in the
combustion of chlorinated organic compounds (Reviewed by Fiedler, 1996 and Fiedler
et al., 2006). One common source of TCDD contamination is its release during the
manufacture of commercial products (Reviewed by Fiedler, 1996; Fiedler et al., 2006).
Additionally, TCDD is released as a pollutant from natural sources including forest fires
and volcanoes (Reviewed by Fiedler, 1996; Fiedler et al., 2006). TCDD is a potential
threat to human health due to bioaccumulation in humans and wildlife through multiple
sources of exposure (i.e. air, drinking water, soil, dust and smoke) (Reviewed by Fiedler,
1996; Fiedler et al., 2006). Research on the health effects of TCDD was spurred in the
1970’s due its use in the infamous Agent Orange. Agent Orange was an herbicide that
was sprayed to defoliate the dense terrain of trees, shrubbery, and crops of Vietnam in
order to deny enemy cover and food during the Vietnam War (Kashida, et al., 2010).
Agent Orange has been associated with prostate cancer, eczema, radiculopathy, diabetes
mellitus, peripheral neuropathy, hypertension, and birth defects in exposed individuals
(Giri et al., 2004; Kim et al., 2003a, 2003b; Ngo et al., 2006). Agent Orange consists of a
mixture of 2,4-dichlorophenoxyacetic acid (2,4-D) and 2,4,5-trichlorophenoxyacetic acid
(2,4,5-T) with TCDD as a contaminant of the 2-4-5-T (Reviewed by Young et al., 2004).
Aside from Agent Orange, TCDD has gained much media exposure ever since the 1970’s
due to environmental disasters in which high amounts of TCDD were accidentally
released (Fiedler et al., 2006). More recently TCDD made headlines in 2004 when it was
used to poison Viktor Yushchenko, President of the Ukraine, which resulted in chloracne,

9
a disfiguring skin condition. The pathogenesis of chloracne includes a multitude of acne-
like eruptions of comedones, cysts and pustules, and by squamous metaplasia of
epithelial cells within the duct of the sebaceous gland which may in part be due to
constitutive activation of the TCDD/Aryl hydrocarbon receptor (AhR) pathway
(described below) in epithelial cells (Geusau et al., 2001; Tang et al., 2008) (Fig. 3). In
addition, TCDD-associated hepatotoxic, carcinogenic, and immunotoxic effects have
been reported in humans (Geusau et al., 2001). Furthermore, in laboratory animals,
TCDD has produced hepatotoxic, immunotoxic, teratogenic, carcinogenic, and
neurotoxic effects (Mandal 2005), in addition to a wasting syndrome and thymic atrophy
(Poland and Knutson 1982). We have explored the immunotoxic effects of TCDD and
found that when the mouse B cell line, CH12.LX, is activated by the polyclonal activator
LPS, TCDD-co-treatment markedly inhibits IgM secretion (Sulentic et al., 1998, 2000).
Moreover a decrease in IgM expression was also demonstrated in primary B cells that
had been activated with LPS (Dooley and Holsapple, 1988) or anti-IgM (Karras and
Holsapple, 1994) and treated with TCDD. Since Ig expression and secretion is regulated
by the 3’IgHRR, we believe there could be a correlation between TCDD-induced
immunotoxic effects and chemical modulation of the 3’IgHRR. The overall toxic
response from TCDD, the most potent of the PAH family of chemicals, has been
suggested to be due, in part, to its affinity for the aryl hydrocarbon receptor (AhR) and
activation of the AhR pathway (Pohjanvirta et al., 1999).

10
A.
B.
Figure 3. Polyaromatic TCDD induces chloracne poisoning. A, polyaromatic
hydrocarbon chemical structure of 2,3,7,8-tetrachlorodibenzo--dioxin
(http://commons.wikimedia.org/wiki/File:Dioxine_pcdd.png). B, Viktor Yushchenko
before (L) and after (R) 2004 TCDD poisoning that resulted in disfiguring chloracne
lesions (http://blog.kievukraine.info/2007_07_01_archive.html).

11
TCDD, the aryl hydrocarbon receptor, and dioxin response elements
The principle mechanism of TCDD toxicity is thought to be mediated through the
AhR pathway. AhR studies were initially derived from research on the inducibility of the
metabolic enzyme aryl hydrocarbon hydroxylase (AHH), which is also known as
CYP1A1, of the cytochrome P450 superfamily of enzymes. Early AHH inducibility
studies utilized mice that were able (responsive), or unable (non-responsive) to induce
AHH and therefore metabolize PAH, benzo[a] pyrene (BP) or 3-methylcholanthrene (3-
MC) (Reviewed by Whitlock, 1990). However, when TCDD was established as a much
more potent inducer of AHH than BP and 3-MC, ligand binding studies using [3H]-
TCDD in the responsive mouse strain were conducted to determine the receptor
responsible for the induction. In these ligand binding studies an intracellular hepatic
protein that could saturably bind TCDD with high affinity was discovered, and named the
aryl hydrocarbon receptor (AhR) (Reviewed by Whitlock, 1990). The AhR has now been
extensively characterized as a basic helix loop helix protein (bHLH) in the period/aryl
hydrocarbon nuclear translocator protein/single minded (Per/ARNT/SIM) family. The
Per/ARNT/SIM family of proteins is reportedly involved in regulation of genes
controlling circadian rhythm, neurogenesis, stress response to hypoxia, and metabolism
(Hogenesh et al., 1997; Hoffman et al., 1991; Crews et al., 1999; Liu et al., 2003). AhR
has specifically been identified as a mediator of several cellular processes including
regulation of cell cycle, inflammation, and metabolism of xenobiotics including, TCDD
(Whitlock et al., 1999; Vogel et al., 2007; Singh et al., 2007; Ito et al., 2004; Bock and
Khole et al., 2006). In addition to PAH environmental pollutants, the AhR is responsive

12
to halogenated hydrocarbons, and planar polychlorinated biphenyls, and recently, several
naturally occurring dietary and endogenous ligands have been identified (Reviewed by
Denison and Nagy, 2003). The AhR pathway has been extensively characterized using
TCDD, the prototypic AhR ligand (Reviewed by Ma, 2001). Similar to the steroid
signaling pathway, the AhR pathway begins when lipophilic TCDD crosses the cellular
membrane. It binds to AhR, which is in a complex with two heat shock proteins (hsp90)
and X-associated protein 2 (XAP2), and the co-chaperone protein p23 (Ma and
Whitlock.1997; Carver et al., 1997; Perdew et al., 1991; Petrulis et al., 2003; Shetty et al.,
2003). The AhR complex of proteins and TCDD cross the nuclear membrane where AhR
and TCDD dissociate from the protein complex and forms a heterodimer with the aryl
hydrocarbon nuclear translocator (ARNT) which is also a bHLH protein (Hord and
Perdew, 1994; Hoffman et al., 1991; Probst et al., 1993; Hankinson et al., 1995). The
AhR/ARNT heterodimer is believed to induce transcriptional modulation by binding to
dioxin response element (DRE) binding sites. Interestingly, AhR has been reported to
bind DRE sites in the presence and absence of exogenous ligand (Ma et al., 1997). DRE
binding sites consist of the core pentanucleotide sequence, GCGTG, and are well
conserved throughout several mammalian genomes (Sun et al., 2004; Tijet et al., 2006).
Several DRE sites have been identified in the enhancer region of the metabolic gene
CYP1A1, the most studied target of TCDD (Whitlock et al., 1990; Masten and Shiverick,
1995). Indeed, induction of CYP1A1 is the well established gold star indicator of a
functional AhR pathway. In a study examining the role of the AhR in the effects of
TCDD on IgM, the induction of CYP1A1 was compared to inhibition of IgM expression
in activated CH12.LX cells. The findings indicated a structure activity relationship in the

13
induction of CYP1A1 and the inhibition of IgM expression and secretion in that higher
affinity AhR ligands produced a greater effect on these endpoints (Sulentic et al., 2000).
Furthermore, statistical analysis of concentration-response curves comparing IC50 values
for expression and IgM secretion to EC50 values of CYP1A1 induction were not
significantly different further suggesting a common mechanism of action, i.e. the AhR
pathway (Sulentic et al., 2000). Moreover, we identified DRE-like motifs in the hs1,2 and
hs4 enhancers of the mouse 3’IgHRR (Sulentic et al., 2000) and EMSA-Western studies
have confirmed binding of AhR nuclear protein from TCDD-treated CH12.LX cells to
oligomers designed from the mouse hs1,2 and hs4 enhancer DRE sites (Sulentic et al.,
2000). Likewise, ChIP analysis confirmed AhR-DRE binding complexes in the hs4
domain of the mouse 3’IgHRR (Sulentic et al., 2004a). Thus, we believe that TCDD may
induce AhR/ARNT binding to DRE sites of the 3’IgHRR which, in turn, modulates
transcriptional regulation of Ig expression and secretion.
14
TCDD
TCDD, AhR, HSP90,
HSP90, p23
Translocates
Disociates
ARNT
Binds ARNT
BindsDRE
CYP1A1mRNA Binds
DRE
IgHmRNA???p
ARNT
Binds ARNT
BindsDRE
CYP1A1mRNA Binds
DRE
IgHmRNA??
?
Antibody
TCDD, AhR, HSP90,
HSP90, p23,XAP2
Disociates
TCDD/AhRTranslocates
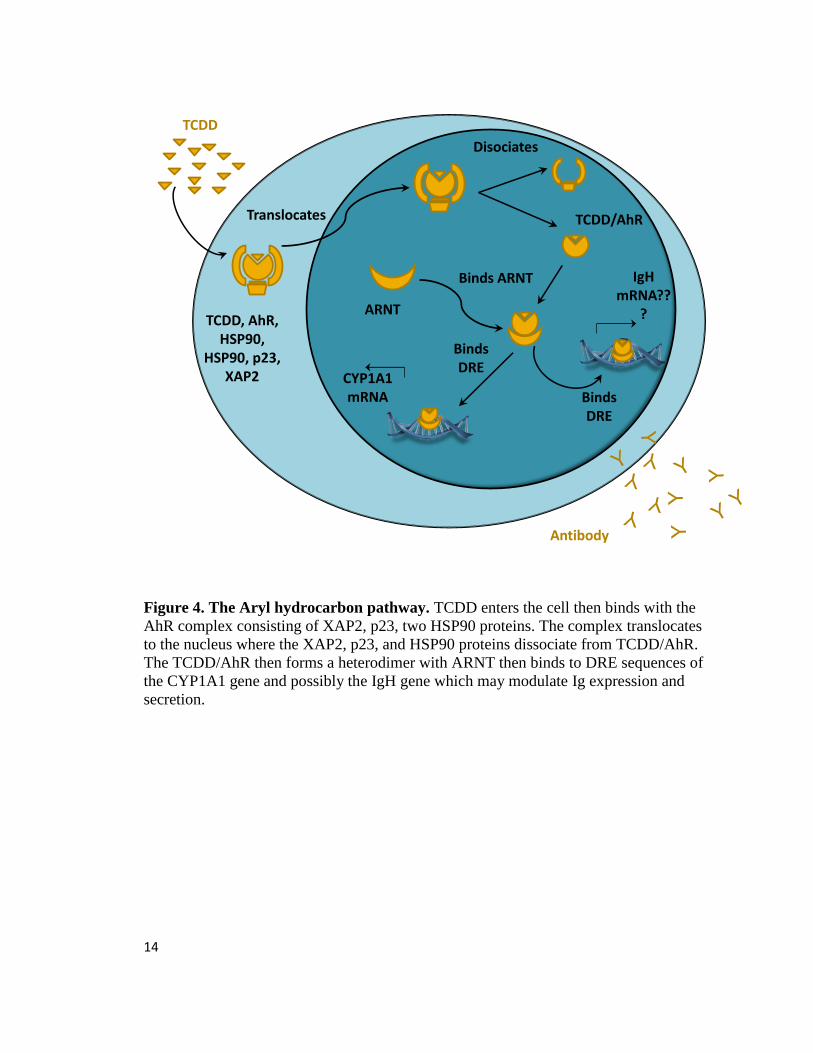
Figure 4. The Aryl hydrocarbon pathway. TCDD enters the cell then binds with the
AhR complex consisting of XAP2, p23, two HSP90 proteins. The complex translocates
to the nucleus where the XAP2, p23, and HSP90 proteins dissociate from TCDD/AhR.
The TCDD/AhR then forms a heterodimer with ARNT then binds to DRE sequences of
the CYP1A1 gene and possibly the IgH gene which may modulate Ig expression and
secretion.

15
Transcriptional modulation of the 3’IgHRR by TCDD
In order to examine the effects of TCDD on transcriptional regulation of the
3’IgHRR, we previously utilized luciferase reporter constructs containing the mouse
variable heavy chain promoter and the mouse 3’IgHRR, hs4 or hs1,2 enhancers (Sulentic
et al., 2004a, 2004b; Fernando et al., manuscript in preparation). In these experiments we
found that while TCDD and LPS co-treatment synergistically activate the hs4 enhancer,
the activities of the mouse hs1,2 enhancer and the entire mouse 3’IgHRR were inhibited
by TCDD in LPS-activated mouse CH12.LX cells (Sulentic 2004a, 2004b). In a separate
study, a cell line was generated in which CRE-loxP technology was utilized to delete the
hs3b and hs4 enhancers from a mini locus containing a 3’IgHRR-regulated g2b transgene,
therefore, leaving the g2b transgene under the regulation of the hs3a and hs1,2 enhancers
(Fernando et al., manuscript in preparation). This study demonstrated that while LPS
activated g2b expression in the control cell line containing the complete 3’IgHRR-
regulated mini locus as well as the hs3a/hs1,2-regulated mini locus, the two mini loci
were equally inhibited by TCDD which suggests that the TCDD-induced inhibition of the
mouse 3’IgHRR in LPS-activated mouse B cells is mediated through the hs1,2 enhancer,
(and possibly the hs3a enhancer) (Fernando et al., manuscript in preparation).
Interestingly, whereas LPS-induced activation of the mouse hs1,2 enhancer is inhibited
by TCDD, the human hs1,2 enhancer demonstrates synergistic activation in LPS-
activated and TCDD co-treated mouse CH12.LX cells (Fernando et al., manuscript in
preparation). These studies clearly demonstrate the apparent difference between the
effects of TCDD on the mouse versus human hs1,2 enhancers. Moreover, our previous
studies suggest that each enhancer of the 3’IgHRR is individually regulated and support

16
the theory that multifaceted transcriptional regulatory events are contributing to the
effects of TCDD on Ig expression and secretion in B cells.
Basal transcriptional regulation of the individual enhancers of the mouse and
human 3’IgHRR
Over the last 20 years the basal transcriptional regulatory events of the 3’IgHRR
have been outlined in human and mouse B cells. Indeed, several breakthrough studies
have used the DNA fragmentation method in which restriction enzymes are utilized to
map the individual enhancers of the mouse and human 3’IgHRR (Madisen and Groudine,
1994; Chauveau et al., 1998; Mills et al., 1997; Kanda et al, 2000). In these studies
transient and/or stable transfections were conducted using the enhancers of the 3’IgHRR
cloned into reporter constructs of a promoter and the human growth hormone gene
(Madisen and Groudine 1994), chloramphenicol acetyl transferase gene (Chauveau et al.,
1998), or a luciferase gene (Mills et al., 1997, Kanda et al., 2000). In each study an
enhanserless reporter containing only the promoter was used as a negative control
(Madisen and Groudine, 1994; Chauveau et al., 1998; Mills et al., 1997; Kanda et al.,
2000). The early studies established that the human and mouse hs1,2 enhancers were
most transcriptionally active in late B cell lines such as mature B cells and
plasmacytomas (Madisen and Groudine, 1994; Chauveau et al., 1998; Mills et al., 1997;
Kanda et al., 2000). Moreover, the hs4 is the only enhancer that exhibited enhancer
activity in pre and pro-B cells as well as in the later phases of B cell development
(Madisen and Groudine, 1994; Chauveau et al., 1998; Giannini et al., 1993; Michaelson
et al., 1996). Two studies utilizing human and mouse hs3 enhancers (hs3a and hs3b in

17
mouse studies) found that, alone, the hs3 enhancer had little or no activity (Chauveau et
al., 1998; Mills et al., 1997). However, the hs3a and hs3b enhancers flanking the mouse
hs1,2 enhancer were determined to be palindromes (Salaque et al., 1997) and a construct
of the three mouse enhancers in tandem (hs3ahs1,2hs3b) generated the greatest
activity in plasma cells compared to the individual enhancers (Chauveau et al., 1998).
Furthermore, other studies agreed that, with respect to the individual enhancers, there was
substantial activity when all of the enhancers were linked together in tandem in pre-B
cells and mature B cells (Madisen and Groudine, 1994; Chauveau et al., 1998; Kanda et
al., 2000). Moreover, a remarkable synergistic amplification was discovered when the E
enhancer was added to constructs with all of the enhancers in tandem (Chauveau et al.,
1998).
Several conserved transcription factor binding sites contribute to the basal activity
of each individual enhancer region of the mouse and human 3’IgHRR. The mouse hs3a
and hs3b enhancers are 97% identical and the mouse hs3a enhancer shares a 74%
homology to the nearly identical human hs3 enhancers of the human C1 and C2
3’IgHRR over a 200bp core segment (Mills et al., 1997; Chauveau and Cogné, 1996).
The hs3 enhancers are the least studied of the 3’IgHRR due to their weak enhancer
activity (Mills et al., 1997; Chauveau et al., 1998; Madisen and Groudine 1994),
however, sequence analysis has indicated that the mouse hs3a and hs3b enhancers have
AP-1 and Oct binding site (Mills et al., 1997, Madisen and Groudine 1994) and the
human hs3 enhancers have conserved AP-1 and a SP1 motifs (Guglielmi et al., 2004;
Mills et al., 1997). Interestingly, AP-1 binding proteins are activated by TCDD in mouse

18
hepa1c1c7 cells (Hoffer et al., 1996; Puga et al., 2000) and SP-1 binding has been shown
to associate with NFκB proteins (Hirano et al., 1998). Similar to the hs3 mouse and
human enhancers, the mouse and human hs4 enhancers share a 76% homology (Mills et
al., 1997). The mouse and human hs4 enhancers have been reported as strong enhancers
in early B-cell lineages, but also in some plasmacytoma cell lines (Kanda et al., 2000;
Madisen and Groudine, 1994; Chauveau et al., 1998). Partially contributing to this
enhancer activity is an exactly conserved Oct motif. Notably, the mouse hs4 enhancer has
a weaker second Oct binding site (Guglielmi et al., 2004, Michaelson et al., 1996). Both
of the Oct sites from the mouse hs4 have been confirmed by binding studies in pre-B and
B cell lines (Michaelson et al., 1996). Additional contributors to mouse and human hs4
activity include DRE and κB motifs (Sulentic et al., 2004a, 2004b; Mills et al., 1994;
Guglielmi et al., 2004). The κB sites in the mouse and human hs4 enhancers have been
established as necessities for hs4 enhancer activity (Kanda et al., 2000), and one of the
κB sites on the mouse hs4 enhancer overlaps with a DRE site (Sulentic et al., 2000).
EMSA-Western binding studies have demonstrated binding of AhR/ARNT and NFκB to
this overlapping DRE and κB site (Sulentic et al., 2000). Additionally, ChIP assay has
identified TCDD-inducible AhR binding, presumably to the DRE, in the hs4 enhancer in
CH12.LX cells activated with LPS (Sulentic et al. 2004a). Further, site-directed mutation
of the DRE and/or κB sites on an hs4 luciferase reporter construct demonstrated that the
DRE and B cooperatively regulate the hs4 enhancer (Sulentic et al., 2004a, 2004b).
Interestingly, Cos-7 cells demonstrated AhR-dependant modulation of NFκB binding
activity in TCDD-treated cells and in the absence of AhR ligand (Tian et al., 1999). An
additional characteristic of the mouse hs4 enhancer is the presence of a high affinity B

19
cell activator protein (BSAP) site (Mills et al., 1994), which was confirmed by EMSA
binding studies with cold competitor (Michaelson et al. 1996). BSAP, also known as
Pax5, negatively regulates early B-cell differentiation in part by repressing lineage-
inappropriate genes (Reviewed by Nutt et al., 2001, 2008). As B cells mature BSAP
negative regulation maintains B cell identity (Reviewed by Nutt et al., 2008). However,
expression of B lymphocyte-induced maturation protein 1 (BLIMP-1) in mature B cells
inhibits BSAP repression in an autoregulatory negative feedback loop which results in
terminal differentiation of B cells into plasma cells that do not express BSAP (Lin et al.,
2002; Mora-López et al., 2007; Delogu et al., 2006). Both the mouse and human hs4 and
hs1,2 enhancers are complexly regulated via transcription factor binding to BSAP, κB,
Oct, and possibly DRE sites in the various maturation stages of B cell development. In a
pre-B cell line the κB and Oct sites are activators while the BSAP site is a repressor of
the hs4 enhancer (Michaelson et al., 1996) (table 1). Further, the BSAP, κB, and Oct sites
are concerted positive regulators of the mouse hs4 enhancer in a mature B cell line, and
in plasma cells is a positive regulator of the hs4 and Oct has no effect on activity
(Michaelson et al., 1996) (table 1). Conversely, in the mouse hs1,2 enhancer, BSAP, κB,
and Oct sites exert a concerted repression in mature B cells (Michaelson et al., 1996,
Singh and Birshtein 1996) (table 1). However, when the BSAP sites of the mouse hs1,2
enhancers are mutated κB and Oct are no longer repressive in mature B cells (Michaelson
et al., 1996; Singh and Birshtein, 1996) and in the absence of BSAP proteins, as is seen in
plasma cells, NFκB and Oct proteins activate the hs1,2 enhancer (Michaelson et al.,
1996; Singh and Birshtein, 1996) (table 1). BSAP basal repression of the hs1,2 enhancer
in the early B-cell lineages is consistent with findings that BSAP is an inhibitor of early

20
B-cell differentiation (Nutt et al., 1999). Additionally, the reduced BSAP expression in
mature B cells to no expression in plasma cells (Reviewed by Nutt et al., 2001) could
relate to the change from repression to activation by NFκB and Oct proteins. Notably,
when mouse splenocytes and the mature B-cell line, CH12.LX, were co-treated with LPS
and TCDD, they demonstrated prolonged expression of BSAP that was correlated with a
decrease in IgH transcripts (Yoo et al., 2004; Schneider et al., 2008) which suggested that
the maintained negative regulation from BSAP could have inhibited the change in role of
Oct and NFκB proteins from repressive to activating factors. Furthermore, as stated
above the κB and DRE sites of the hs4 enhancer have been found to cooperatively
influence transcriptional regulation in TCDD-treated and LPS-activated B cells (Sulentic
et 2004a, 2004b). Moreover, there is a possible κB site adjacent to a DRE sites of the
hs1,2 enhancer which may also collectively influence transcriptional regulation of the
hs1,2 enhancer. Thus, the DRE, κB, and Oct, in addition to the BSAP sites of the mouse
hs1,2 enhancer could be contributing to the inhibitory effect of TCDD and LPS co-
treatment in mature B cells. Interestingly, the human hs1,2 enhancer, which shares a 90%
homology over a 135 bp core sequence with the mouse enhancer, lacks a BSAP binding
site (Mills et al., 1997), and is activated by LPS and TCDD co-treatment rather than
inhibited as seen with the mouse hs1,2 enhancer.

21
Mouse hs4 enhancer BSAP Oct
Pre-B cell
Mature B cell
Plasma Cell
Mouse hs1,2 enhancer BSAP Oct
Mature B cell
Plasma Cell
Table 1. Regulation of the mouse hs4 and hs1,2 enhancers. Activation (), inhibition
() or no change (-) in basal activity of the hs4 and hs1,2 enhancers of the 3’IgHRR by
transcription factor binding to BSAP, κB, or Oct sites, as determined by site directed
mutation or deletion results of studies in pre-B, mature B, or plasma cell lines. The hs1,2
enhancer has low basal activity in pre-B cells which is the likely reason that it was not
evaluated. BSAP has been reported to not be expressed in plasma cell lines, which is
denoted by “*.”
22
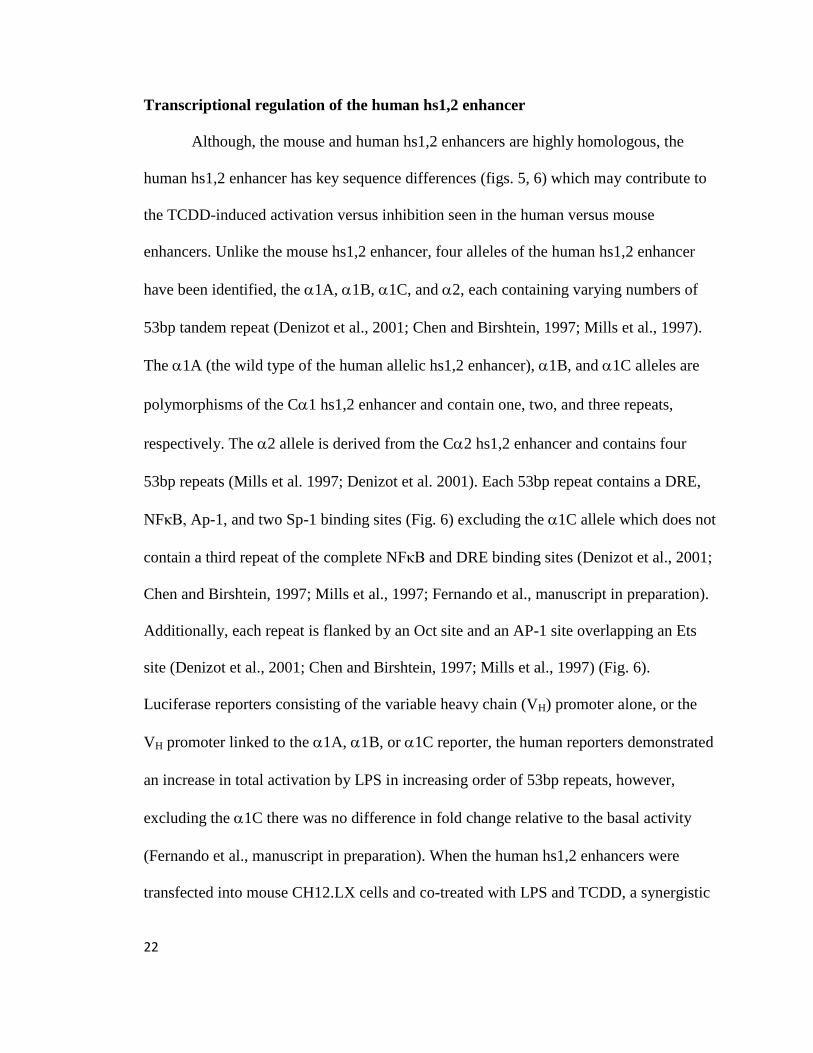
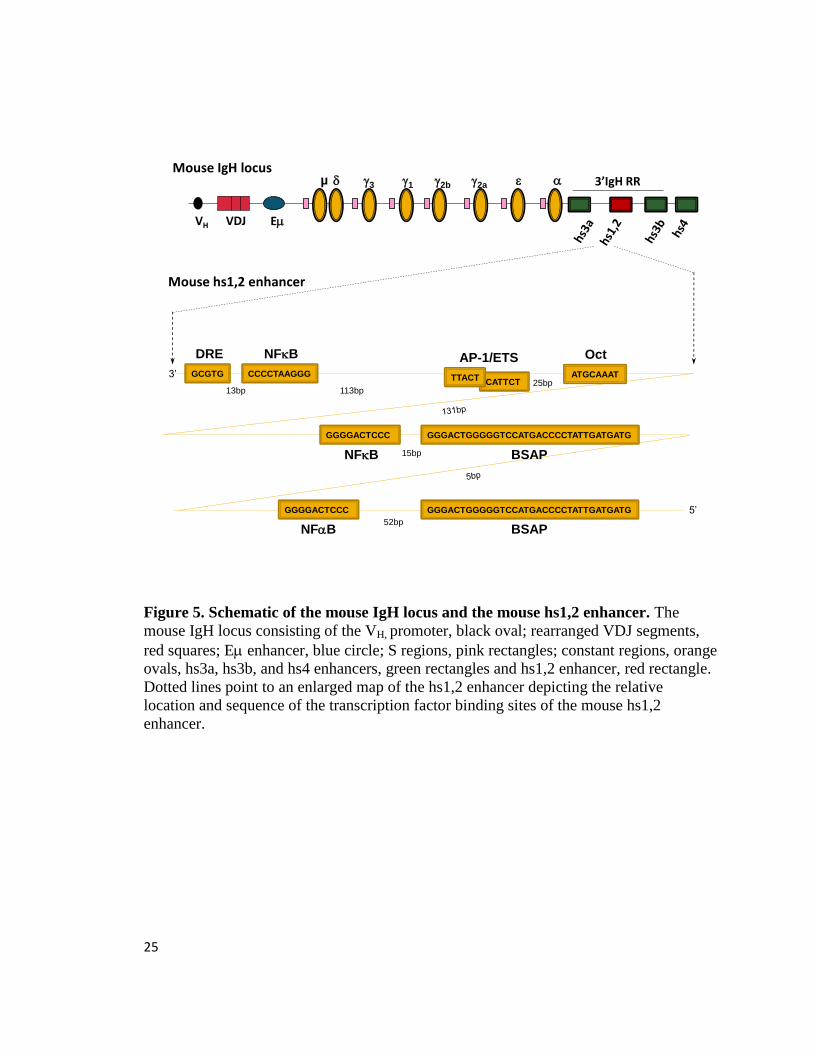
Transcriptional regulation of the human hs1,2 enhancer
Although, the mouse and human hs1,2 enhancers are highly homologous, the
human hs1,2 enhancer has key sequence differences (figs. 5, 6) which may contribute to
the TCDD-induced activation versus inhibition seen in the human versus mouse
enhancers. Unlike the mouse hs1,2 enhancer, four alleles of the human hs1,2 enhancer
have been identified, the 1A, 1B, 1C, and 2, each containing varying numbers of
53bp tandem repeat (Denizot et al., 2001; Chen and Birshtein, 1997; Mills et al., 1997).
The 1A (the wild type of the human allelic hs1,2 enhancer), 1B, and 1C alleles are
polymorphisms of the C1 hs1,2 enhancer and contain one, two, and three repeats,
respectively. The 2 allele is derived from the C2 hs1,2 enhancer and contains four
53bp repeats (Mills et al. 1997; Denizot et al. 2001). Each 53bp repeat contains a DRE,
NFκB, Ap-1, and two Sp-1 binding sites (Fig. 6) excluding the 1C allele which does not
contain a third repeat of the complete NFκB and DRE binding sites (Denizot et al., 2001;
Chen and Birshtein, 1997; Mills et al., 1997; Fernando et al., manuscript in preparation).
Additionally, each repeat is flanked by an Oct site and an AP-1 site overlapping an Ets
site (Denizot et al., 2001; Chen and Birshtein, 1997; Mills et al., 1997) (Fig. 6).
Luciferase reporters consisting of the variable heavy chain (VH) promoter alone, or the
VH promoter linked to the 1A, 1B, or 1C reporter, the human reporters demonstrated
an increase in total activation by LPS in increasing order of 53bp repeats, however,
excluding the 1C there was no difference in fold change relative to the basal activity
(Fernando et al., manuscript in preparation). When the human hs1,2 enhancers were
transfected into mouse CH12.LX cells and co-treated with LPS and TCDD, a synergistic
23
activation was observed, which also demonstrated an increase in activation according to
number of repeats (Fernando et al., manuscript in preparation). Thus this activation
appears to be related to the 53bp repeats and their associated transcription factor binding
sites. Notably, the LPS and TCDD-induced fold-change of the 1C reporter is not
increased to the extent of the 1A, possibly due to the lack of the DRE and NFκB
binding sites in the third 53bp repeat, and the 1B had the greatest fold activation
(Fernando et al., manuscript in preparation). Furthermore, the 1B reporter has been
associated with several human autoimmune diseases including: IgA nephropathy (IgAN)
(Aupetit et al., 2000), Celiac disease, systemic sclerosis, schizophrenia dermatitis
herpetiformis, plaque psoriasis (Frezza et al., 2004, 2007, 2009), psoriatic arthritis
(Cianci et al., 2008), and rheumatoid arthritis (Tolusso et al., 2009). These studies
suggest a correlation with the 1B allele of the hs1,2 enhancer and immune
deregulation of the IgA1 isotype (Aupetit et al., 2000), which could be related to altered
regulation of the transcription factors in the 53bp repeat. Another recent study was
conducted in which the DRE, NFκB, AP-1, and/or Oct binding sites were deleted from
the 1A allele of the human hs1,2 enhancer in multiple combinations of deletions (DRE;
B; DRE and B; Oct; DRE, B, AP-1; DRE,B, AP-1and Oct) (Fernando et al.,
manuscript in preparation). This study demonstrated that in TCDD and LPS co-treated
mouse CH12.LX cells, the NFκB binding site was a positive regulator of the TCDD-
induced activation and the DRE was a slightly negative regulator (Fernando et al.,
manuscript in preparation). Additionally, the activation effect of TCDD was not
completely abrogated until the deletion of the entire 53bp region (DRE, NFκB, AP-1) and

24
the Oct site in the flanking region (Fernando et al., manuscript in process). These results
suggest that these sites of the 53bp and flanking regions may collectively contribute to
the overall positive regulation of TCDD-induced activation of the human hs1,2 enhancer.
However, these studies of the human hs1,2 enhancer were conducted in the mouse
CH12.LX cell line. Since AhR endogenous expression and affinity to TCDD is species
specific (Reviewed by Connor and Aylward, 2006), the true effect of TCDD on the
human hs1,2 enhancer in a human B cell line is unknown.
25
µ d e
VDJ
g3 g1 g2b g2a
VH E
Mouse IgH locus3’IgH RR
Mouse hs1,2 enhancer
3’
5’
GCGTG CCCCTAAGGGCATTCT
ATGCAAAT
DRE NFB
TTACT
AP-1/ETS
13bp 113bp25bp
Oct
GGGGACTCCC
NFB
GGGACTGGGGGTCCATGACCCCTATTGATGATG
GGGACTGGGGGTCCATGACCCCTATTGATGATGGGGGACTCCC
NFB
BSAP
BSAP
15bp
52bp
Figure 5. Schematic of the mouse IgH locus and the mouse hs1,2 enhancer. The
mouse IgH locus consisting of the VH, promoter, black oval; rearranged VDJ segments,
red squares; E enhancer, blue circle; S regions, pink rectangles; constant regions, orange
ovals, hs3a, hs3b, and hs4 enhancers, green rectangles and hs1,2 enhancer, red rectangle.
Dotted lines point to an enlarged map of the hs1,2 enhancer depicting the relative
location and sequence of the transcription factor binding sites of the mouse hs1,2
enhancer.

26
Human IgH locus
EVDJ
µ d g3 g1 e 1 g2 2g4 e
VH
1 3’IgH RR 2 3’IgH RR
Human hs1,2 enhancer
OctAP-1/ETS
3’
52 bp sequence
CCCGCCC GCGTG TGCTCA
SP-1 DRE AP-1 NFB Sp1
12 bp7 bp9 bp
TGACTCATTCT ATGCAAAT24 bp
GGGGACACCCCGCCC 5’
Figure 6. Schematic of the human IgH locus and the C1 and C2 hs1,2 enhancer
regions. The human IgH consisting of the VH,, black oval; rearranged VDJ segments, red
squares; E enhancer, blue circle; S regions, pink squares; constant regions, orange ovals,
hs3a, and hs4 enhancers, green rectangles and hs1,2 enhancer, red rectangle. Dotted lines
point to an expanded depiction of the nearly identical C1 and C2 hs1,2 enhancers and
the relative location and sequence of the transcription factor binding sites of the human
hs1,2 enhancer. The bracket indicates the transcription factor binding sites included in the
53 bp repeated polymorphism of the human hs1,2 enhancer.
27
The human IM-9 cellular model
To date several studies have led us to enquire the effects of TCDD on the human
hs1,2 enhancer in a human cell line. TCDD-induced effects mediated by the AhR have
been extensively characterized in several cellular models including primary B cells
(Crawford et al., 1997; Marcus et al., 1998). Also, numerous mouse and human cell
studies have examined the 3’IgHRR. Further, the mouse CH12.LX B cell line has been
utilized to study the inhibitory effect of TCDD on antibody secretion and Ig expression in
LPS-activated cells (Sulentic et al., 1998, 2000). In addition, the TCDD-induced
modulation of the mouse hs4 and hs1,2 enhancers and the 3’IgHRR in total has been
examined in LPS-activated mouse CH12.LX cells (Sulentic et al., 2000, 2004a, 2004b).
Moreover, we have recently completed several studies on the effects of TCDD on
transcriptional regulation of the human hs1,2 enhancer in LPS-activated mouse CH12.LX
cells (Fernando et al., manuscript in preparation). However, although ligand-activated
AhR has been characterized in human primary B cells (Allan and Sherr 2005), a gap
remains in our understanding of the effects of TCDD on transcriptional regulation of the
human hs1,2 enhancer, possibly through the AhR pathway, in a human B cell line. The
human hs1,2 enhancer is of particular interest due to the association of the 1B allele
with several human autoimmune diseases. In order to translate our mouse findings into
relevant human application it is necessary to study the effects of TCDD on the human
hs1,2 enhancer within a human B cell model. The IM-9 cell line is a potential model for
such studies. The IM-9 cell line is reported by American Type Culture Collection to be a
CD19+ human IgG secreting lymphoblastoid cell line. IgG secretion of the IM-9 cell line
has been characterized by Fahey, Buell, and Sox (1971). Furthermore, Masten and

28
Shiverick (1996) demonstrated binding of nuclear protein from IM-9 cells to DRE
oligomers which were supershifted with anti-AhR antibodies, suggesting functional AhR
protein. Notably, the same group found that the BSAP sites of the CD19 gene and the 5’
S region of the g2a constant region on the IgH chain each have BSAP binding motifs
which contain an embedded consensus region of the core DRE sequence (Masten and
Shiverick, 1995). Utilizing EMSA analysis they demonstrated that binding of IM-9
nuclear protein to a labeled oligomer consisting of a CYP1A1 DRE is partially inhibited
by an unlabeled oligomer corresponding to the BSAP binding site of the CD19 gene,
suggesting that AhR binds to the DRE embedded in the BSAP binding sites (Masten and
Shiverick, 1995). Thus, the objective of this study was to 1) characterize the expression
and function of the AhR in IM-9 cell line for use in mechanistic studies evaluating
TCDD-induced effects on the human hs1,2 enhancer, 2) examine the effect of TCDD on
the transcriptional regulation of the human hs1,2 enhancer in the human IM-9 cell line,
and 3) determine if BSAP is mediating the divergence in transcriptional regulation
between the mouse and human hs1,2 enhancers with TCDD treatment.
Relevance
Alteration in the regulation of the 3’IgHRR could pose a significant threat to human
health since the AhR is activated by several environmentally persistent ligands, including
TCDD, as well as a wide array of chemicals from environmental, dietary, and
pharmaceutical origin. In fact, we have recently examined the inhibitory effects of several
non-dioxin AhR ligands including, the dietary metabolite indolo(3,2,b)carbazole; the
antimalarial drug primaquine; the pesticide carbaryl; and the proton pump inhibitor

29
omeprazole (Prilosec) on the expression of a stably transfected g2b transgene under the
regulation of the mouse 3’IgHRR in LPS-activated mouse CH12.LX cells (Hensler et al.,
2009). Since modulation of the transcriptional activity of the hs1,2 enhancer has been
associated with numerous autoimmune diseases, the elucidation of TCDD-induced
effects, possibly mediated by the AhR, on the 3’IgHRR is highly relevant to human
health. This study will be the first to examine the influence of TCDD on the human hs1,2
enhancer in a human cell line model and should contribute to understanding the etiology
of diseases related to the hs1,2 enhancer. Moreover, this study may elucidate the source
of the divergence in transcriptional regulation seen between the human and mouse hs1,2
enhancers which is highly significant because if major differences in regulation between
human and mouse exist, these differences need to be taken into consideration when
interpreting future toxicological and mechanistic studies specific to Ig expression using
mouse models.

30
MATERIALS AND METHODS
Chemicals and reagents
TCDD in 100% DMSO was purchased from AccuStandard Inc. (New Haven,
CT). Dimethyl sulfoxide (DMSO) and lipopolysaccharide (LPS, Escherichia coli) were
purchased from Sigma Aldrich (St Louis, MO). CpG was purchased from the
Macromolecular Structure, Sequencing and Synthesis Facility at Michigan State
University (East Lansing, MI) and R848 was purchased from Alexis Biochemicals (San
Diego, CA).
Cell line models
The IM-9 cell line was purchased from American Tissue and American Type
Culture Collection (Rockville, MD). The IM-9 cell line is an Epstein-Bar Virus-
transformed B lymphoblastoid cell line which was isolated from a human Caucasian
female patient with multiple myeloma. The IM-9 cell line was characterized by Fahey,
Sox, and Buell (1971). IM-9 cells were grown in RPMI 1640 media (Mediatech, Inc.,
Manassas, VA) supplemented with 10% bovine calf serum (Hyclone Laboratories,
Logan, UT), 10 mM HEPES, 20 mM sodium bicarbonate (Sigma Aldrich), 1 mM sodium
pyruvate, 2 mM L-glutamine, 100 units/mL penicillin, 100 g/mL streptomycin (Fisher

31
Scientific, Hanover Park, IL), and 50 M 2-mercaptoethanol (Pierce, Rockford, IL). The
CH12.LX cell line was generously donated by Geoffrey Haughton (University of North
Carolina, Chapel Hill, NC). The source of the CH12.LX cell line was the murine CH12
B-cell lymphoma, which was characterized by Bishop and Haughton (1996). CH12.LX
cells were grown under the same media conditions as the IM-9 cells except with 13.5 mM
HEPES and 0.1 mM nonessential amino acids and no supplemental L-glutamine or
sodium bicarbonate was added. All cells were maintained at 37 C in a 5% CO2
atmosphere.
Western blot
Preceding western blot analysis 50 mL of IM-9 cells in triplicate were left
untreated or treated with vehicle (0.019% DMSO) or TCDD (30 nM) and incubated for
24 hr at 37 C in a 5% CO2 atmosphere. Following incubation, the cells were centrifuged
at 250 x g for 5 min at 4 C. The remaining pellet of cells was incubated for at least 1 h at
-80 C with mild lysis buffer (NP-40, 1M NaCl, 0.1M NaPO4, 0.5M EDTA) containing
freshly added Complete Mini protease inhibitor cocktail (Roche Applied Sciences,
Indianapolis, IN) to lyse the cells. After samples were thawed on ice and cleared of debris
by centrifugation, total protein per sample was determined using Bradford analysis (Bio-
Rad Laboratories, Hercules, CA). One hundred g of total protein per sample was then
analyzed for the presence of the AhR by Western blot analysis. Briefly, cell lysates were
resolved by electrophoreses with a denaturing 10% polyacrylamide SDS-PAGE (National

32
Diagnostics, Manville, NJ) in SDS electrophoresis running buffer (5 mM TRIS, 192 mM
Glycine, 3.4 mM SDS) at 125V for 1.5 h. The proteins were transferred in
Tris/borate/EDTA buffer (TBE) (890 mM Tris base, 890 mM boric acid, 0.5M EDTA) to
a polyvinylidene difluoride (PVDF) membrane (Millipore, Bedford, MA). Membranes
were then blocked overnight at 4C with 5% nonfat dairy milk (Kroger, Cincinnati, OH)
and 0.05% Tween (Sigma) in TRIS buffered sailine. After blocking, the membrane was
washed four times with 1x TBS for 5 min on a rocker plate (GyroTwister, Woodbridge,
NJ). The membrane was incubated in a solution of 1:1000 primary antibody against the
AhR (Abcam, Cambridge, MA), 3% bovine serum albumin (BSA) (Calbiochem, La Jolla,
CA), and 0.05% Tween in TBS for 1 hr. The membrane was again washed four times for
5 min each with 1x TBS on a rocker plate. A 1:5000 solution of goat anti-mouse
secondary (Abcam) antibody conjugated with horseradish peroxidase, 3% BSA, and
0.05% Tween in TBS was applied to the blot for 1 hr. The blot was rinsed 4 times for
5min each with 1x TBS on a rocker plate. Supersignal western pico chemiluminescence
substrate (ECL) (Thermo Scientific, Rockford, IL) was used to visualize the protein on a
Fuji Las 3000 imager (FujiFilm Corporation, Tokyo, Japan).
RNA isolation
CYP1A1 RNA transcripts were amplified by RT-PCR. Briefly, 1mL of IM-9
cells, in triplicate, were left untreated or treated with vehicle (0.019% DMSO) or TCDD
(30nM) then incubated for 24h at 37C in a 5% CO2 atmosphere. Following the
incubation period, samples were centrifuged at 2000 rpm and pellets were re-suspended

33
in 100L of Tri-Reagent (Sigma Life Science, St Louis, MO) then stored at -80C.
Samples were thawed at room temperature then centrifuged at 12,000 x g for 10min. The
aqueous layer was removed and mixed with 10 L BCP (Sigma-Aldrich) then loaded into
Phase Lock Gel tubes (5PRIME, Gaithersburg, MD) and vortexed. Tubes were incubated
for 10min at room temperature then centrifuged at 12,000 x g and 4C for 5min to clear
the Tri reagent phenol from the samples. The clear aqueous layer was removed and
combined with 100L isopropanol (Pharmco-Aaper and Commercial Alcohols,
Brookfield CT) and incubated for 10min at room temperature. Samples were centrifuged
for 8min at 12,000 x g at 4C then pellets were washed with 75% ethanol (ACROS
Organics, Geel, Belgium). Pellets were dried for 15min then re-suspended in 25L of
distilled water and dissolved by rocking motion for 30 min then stored at -80C.
Reverse Transcriptase and Real-time Polymerase Chain Reaction (RT-PCR)
RNA isolated above was reverse transcribed into cDNA using RT-PCR. RNA
samples were measured for total RNA using the NanoDrop (NanoDrop Technologies,
Wilmington, DE). Each sample was normalized to a concentration of 1g/19.25L. A
master mix solution was made using the Taqman RT-PCR kit (Applied Biosystems,
Branchburg, NJ). Briefly, 19.25L of RNA sample combined with 5L Taqman RT
buffer, 11L 25mM MgCl2, 10L dNTPs, 2.5 random hexamers, 1L RNAse inhibitor,
and 1.25L Reverse Transcriptase were reverse transcribed using a Thermo cycler

34
(Eppendorf, Hauppauge, NY) for 25C for 10min, 48C for 30min, 95C for 5min, then
a 4C hold. The resultant cDNA samples were then stored at -80C.
Amplification of Cyp1a1 transcripts from the cDNA above was measured by
Real Time Polymerase Chain Reaction. Briefly, Cyp1a1 and B-actin primers were
generated using Primer3 Software ((http://fokker.wi.mit.edu/primer3/input.htm). Ten
pmol of forward and reverse Cyp1a1 primers (FP: CCTCTTTGGAGCTGGGTTTG;
RP:GCTGTGGGGGATGGTGAA) and 2.5L of 1:10 diluted DNA, were added to 2x
SYBR Green PCR Master Mix (Applied Biosystems, Warrington, UK). Then, SYBR
Green incorporation was measured for 40 cycles by the 7500 real-time PCR system
(Applied Biosystems, Warrington, UK). Amplified transcripts of -actin, a housekeeping
gene (FP:TCACCCACACTGGGCCCATCTACGA;
RP;CAGCGGAACCGCTCATTGCCATGG) were measured in a separate tube as a
positive control. Fold induction was measured relative to the vehicle samples.
Enzyme Linked Immunosorbent Assay (ELISA)
IM-9 cells were grown to stationary phase (1.2 - 1.4 x 10⁶ C/mL) then cut back to
log phase, 6.0 x 10⁴ – 5.0 x 10
5 C/mL, based on total treatment time. One milliliter
samples of IM-9 cells, in triplicate, were left untreated or treated with vehicle (0.019%
DMSO), R848 (0, 10, 100, or 1000 nM), CpG (0.1, 0.5, 1, 3, 5, or 6 M) or TCDD
(30nM) then incubated at 37C in a 5% CO2 atmosphere for 4 – 96 hr. Twenty microliters
of each sample was then diluted 1:1 with Trypan Blue (Beckman Coulter, Brea,

35
California) and counted by hemocytometer (AO Scientific Instruments, Buffalo, NY).
The remaining samples were centrifuged at 250 x g and pellets were re-suspended in 50
L mild lysis buffer containing complete mini (protease inhibitor). Supernatants were
analyzed by sandwich ELISA for IgG, as previously described (Sulentic et al., 1998).
Briefly, 100L of supernatant or IgG standard (human, Bethyl Laboratories,
Montgomery, TX) was loaded to a 96-well plate coated with 1:2500 goat-anti-human
capture antibody (Southern Biotech, Birmingham, AL), diluted in 0.1% sodium
bicarbonate then incubated for 1.5 hr. Following the incubation period, the plate was
washed 3x with 0.05% Tween in phosphate buffered saline (PBS) and 4x H2O by a plate
washer. Horseradish peroxidase anti-human capture antibody (Bethyl Laboratories)
diluted 1:10000 in a solution of 3% BSA, 0.05% Tween, and PBS was loaded to the plate
and incubated for 1.5 hr. Excess antibody was washed 3x with 0.05% Tween in PBS and
4x with H2O by a plate washer. Colorimetric detection of IgG captured on the plate was
performed by adding 100 L of ABTS substrate (2,29-azinobis(3-ethylbenz thiazoline-
sulfonic acid)) (Roche Diagnostics, Indiana, IN) and measuring the absorbance using the
kinetic mode (1 min intervals for 60 min) using a Spectramax plus 384 automated
microplate reader with a 405 nm filter (Molecular Devices, Sunnyvale, CA). The
concentration of IgG in each sample was calculated from a standard curve of known
concentrations of human IgG using the SOFTmax PRO analysis software (Molecular
Devices).

36
Reporter plasmids
Human luciferase reporters were kindly provided by Dr. Michel Cogné,
(Laboratoire d’Immunologic, Limoges, France). The reporters consisted of an
enhancerless variable heavy chain promoter (VH) 5’ to the luciferase gene or the VH
promoter and the luciferase gene upstream of the human polymorphic hs1,2 enhancer
consisting of either one (α1A), two (α1B), or three (α1C) 53bp repeats, as described
previously (Denizot et al. 2001) (Fig. 7). All plasmids were constructed using a pGL3
basic luciferase reporter construct, (Promega, Madison, WI). A BSAP binding site added
to the 1A human hs1,2 enhancer reporter (1A+BSAP) was previously prepared by our
laboratory using site-directed mutagenesis according to QuikChange XL Site-Directed
Mutagenesis Kit (Stratagene, La Jolla, CA). Oligonucleotide primers were designed to
add a BSAP binding motif (TS- GTGGTCCCAGTGTCAGCCCTGGGGTGTTGAGCC-
ACCCATCCTTGCCCTAACCCAAGTGGGCCT; BS-AAGCCCACTTGGGTTAGGG-
CAAGGATGGGTGGCTCAACACCCCAGGGCTGACACTGGGACCAC) using the
QuikChange Primer Design Program (http://www.stratagene.com/ sdmdesigner). Briefly,
10 ng of the 1A human hs1,2 reporter was combined with 5 μL 10x reaction buffer, 125
ng of each oligonucleotide primer, 1 μL of dNTP mix, 3 μL of QuikSolution, and 1 μL of
PfuTurbo DNA polymerase to a final volume of 50 L in thin-walled PCR tubes.
Samples were heated to 95 C for 1 min then cycled 18 times, at 95 C for 50 s, 60 C for
50 s, and 68 C for 6 min per cycle (1 min/kb). A 7 min final extension step occurred at
68 C after 18 cycles. Next, the parental DNA template was digested with Dpn I. The
remaining DNA plasmid was transformed into XL10-Gold Ultracompetent cells, then

37
isolated and the desired addition validated by sequencing (Retrogen, Inc., San Diego,
CA).

38
VH (~ 5.00 kb)
VH
VH promoter luciferase reporter (control)
Luciferase
(~ 5.05 kb)
* 53 bp polymorphism
1AVH hs1,2
Human polymorphic hs1,2 enhancer luciferase reporters
Luciferase
1C (~ 5.15 kb)VH hs1,2
Luciferase***
VH
1B (~ 5.10 kb)hs1,2
Luciferase **
*
Figure 7. Human hs1,2 enhancer luciferase reporter constructs. Each reporter
plasmid was made using a pGL3 basic luciferase construct and contained a variable
heavy chain (VH) promoter. The number of 53bp repeats in each allele of the
polymorphic human hs1,2 enhancer is denoted by asterisk “*.”

39
Transient transfections
IM-9 cells were grown up to their stationary phase concentration (1.2 - 1.4 x 10⁶
C/mL) then 1.0 x 10⁷
C were suspended in 200 L of culture media with 10 g of
reporter and transferred to a 2 mm gap electroporation cuvette (Molecular Bioproducts,
San Diego, CA). Cells were electroporated using an electro cell manipulator (ECM 630,
BTX, San Diego, CA) at a voltage, capacitance, and resistance of 150 V, 1700 F, and 75
Ω, respectively. Multiple transfections per plasmid were pooled and divided into
treatment groups at a concentration of 1 x 10⁶
C/mL. CH12.LX cells were grown up to
log phase (5 x 10⁵
C/mL) then 1.0 x 10⁷C were electroporated as described above at a
voltage, capacitance, and resistance of 250 V, 150 F, and 75 Ω, respectively. Multiple
transfections per plasmid were pooled and divided into treatment groups at a
concentration of 5 x 10⁵ C/mL. Immediately following transfection, unstimulated IM-9
cells were treated with vehicle (0.019% or 0.1% DMSO) or TCDD, or were co-treated
with TCDD and CpG and/or R848. Unstimulated or LPS-stimulated CH12.LX cells were
treated with (0.019% DMSO) or TCDD (30nM), or were co-treated with TCDD and LPS.
Treated IM-9 and CH12.LX cells were aliquoted in triplicate into 12-well plates for a 24h
incubation period. Cells were then lysed with 1x reporter lysis buffer (Promega) and
frozen at 80C for at least 1 hr.

40
Luciferase Assay
To measure luciferase activity, samples were thawed on ice, centrifuged at 14,000
rpm for 5 min. Then twenty microliters of sample supernatant was added to 100L
luciferase assay reagent (Promega). Luciferase activity (i.e. luminescence) was measured
using a Sirius luminometer (Berthold Detection Systems, Oak Ridge, TN) and was
represented as relative light units.
Traditionally transfection efficiency is determined by co-transfecting a control
plasmid such as -gal. However, common stimulants, such as LPS reportedly activate the
promoter and enhancers of control plasmids, making precise standardization of the
activity of the control plasmid difficult to determine. Therefore, transfection efficiency
was measured by quantitative real-time PCR. DNA was isolated from naïve samples that
had been incubated for 2h following transfection using the GenElute Mammalian
Genomic DNA miniprep kit (Sigma-Aldrich). Purified DNA was diluted 10-fold and then
analyzed by real-time PCR for the luciferase gene. Briefly, primers specific for the
luciferase gene encoded with the pGL3 luciferase vector series, were previously
generated by our laboratory using Primer3 Software. Next, 10pmol of forward and
reverse primers and 2L of diluted purified DNA, were added to 1x SYBR Green PCR
Master Mix (Applied Biosystems). Then, SYBR Green incorporation was measured for
40 cycles by the 7500 real time PCR system (Applied Biosystems). A standard curve of
known quantities of plasmid DNA was utilized to measure the concentration of plasmid
DNA. The total amount of plasmid (ng of plasmid) was calculated by multiplying the
concentration of plasmid DNA (ng of plasmid/L), the volume of DNA added (2 L),

41
and the fold dilution (10). The plasmid number per cell was calculated using the
following equation: [(nanograms of plasmid) x (molecules of plasmid / nanograms of
plasmid )/ cell number], as previously described (Sulentic et al., 2004).
Statistical Analysis of Data
The mean ± SE (n=3) was calculated for each treatment group within each
experiment. Significance between treatment groups of real-time PCR studies was
determined by a 1-way ANOVA followed by a Dunnett’s two-tailed t test. Significance
between treatment groups and time points in ELISA studies was determined by 2-way
ANOVA followed by a Bonferroni’s two-tailed t test. In luciferase assays, significance
between treatment groups of 1 plasmid was determined by 1-way ANOVA followed by a
Dunnett’s two-tailed t test. Significance between multiple plasmids was determined by 2-
way ANOVA followed by a Bonferroni’s two-tailed t test. TCDD-induced fold activation
in luciferase studies was calculated by dividing the mean luciferase activity of TCDD
and/or stimulant-treated samples by the mean luciferase activity of the appropriate
vehicle. Mean fold change for TCDD activation ± SE was determined by analyzing
eleven separate experiments. Luciferase activity relative to transfection efficiency was
calculated by dividing the mean plasmid number of the VH reporter by the mean plasmid
number of the appropriate hs1,2 reporter. The quotient was then multiplied to the
luciferase activity results for each treatment group for the appropriate hs1,2 reporter.
42
RESULTS
Characterization of IM-9 cells
Our lab has utilized the mouse CH12.LX cell line extensively to study the role of
the AhR/DRE in the inhibitory effect of TCDD on antibody secretion and Ig expression
(Sulentic et al., 1998; Sulentic et al., 2000) as well as the TCDD-induced inhibition of
3’IgHRR activation (Sulentic et al., 2004a; Sulentic et al., 2004b). In order to translate
our mouse findings into relevant human application it is necessary to utilize a human B-
cell line model in which to study the effects of TCDD on the human 3’IgHRR. We
decided to characterize the human lymphoblastoid IM-9 cell line as a model for TCDD
toxicology studies because: 1) it demonstrated TCDD-induced binding of the AhR to an
oligomer containing a DRE site from the Cyp1a1 gene (Masten and Shiverick, 1996), a
metabolic gene of which expression is a hallmark of a functional AhR pathway; 2) our
preliminary EMSA analysis demonstrated TCDD-induced binding of the AhR from IM-9
cells to an oligomer containing the DRE-like site from the human hs1,2 enhancer, also
suggesting a functional AhR pathway (data not shown); 3) we successfully transiently
expressed a luciferase reporter regulated by the human hs1,2 enhancer in IM-9 cells,
which supported the use of IM-9 cells in studies of transcriptional activation of the
human hs1,2 enhancer. Collectively, our preliminary results supported the
characterization of the IM-9 cell line for the use as a model for determining the molecular
mechanisms behind TCDD-induced modulation of the 3’IgHRR.

43
IM-9 cells express the AhR: The expression of a functional AhR is a necessity for our
studies, as the mechanism for TCDD-induced effects is thought to be mediated by the
AhR. By Western blot analysis we confirmed AhR expression in unstimulated IM-9
whole cell lysates (Fig. 8). Since unstimulated human primary B cells were reported to
have low expression of AhR (Allan and Sherr, 2005), we loaded 100 g of IM-9 protein
versus 50g of CH12.LX protein. Accordingly, our results confirmed the expression of
AhR in IM-9 cells. Interestingly, although twice as much total protein from IM-9 cells
versus CH12.LX cells was loaded to the blot, the levels of AhR expression from the two
cell lines appeared to be similar. Notably, whereas the size of mouse AhR has been
reported to be 96 kDa, human AhR has been reported to be 110 kDa, which corresponds
with our results. In previous studies cellular activation resulted in an increase in AhR and
CYP1A1 expression in mouse primary splenocytes and isolated primary B cells
(Crawford et al., 1997; Marcus et al., 1998). In addition, activated mouse primary B cells
treated with TCDD demonstrated an increase in AhR binding to a DRE oligomer versus
cells that were not activated in EMSA/Western studies (Crawford et al., 1997). These
results suggest that increased AhR expression due to activation of mouse primary B cells
may result in an increase in B cell sensitivity to TCDD and activation of the AhR
pathway. In our previous experiments, we activated AhR expression in mouse CH12.LX
cells with LPS, a toll-like receptor 4 (TLR4) ligand and B-cell stimulant (Sulentic et al.,
1998). However, it has been reported that while LPS is not an efficient activator of
human B cells, CpG, a TLR9 stimulant, effectively activates human B cells (Bauer et al.,
2001). Likewise Allan and Sherr (2005) found an upregulation of AhR expression and
ligand-independent activation in CpG-activated primary human B-cells. Thus, we

44
attempted to upregulate AhR expression by activating the IM-9 cells with CpG. We
found that only 24 h of CpG treatment may have slightly activated the AhR in IM-9 cells.
However, expression of the AhR in IM-9 cells was not appreciably upregulated as a
result of CpG treatment (Fig. 8), which suggests that CpG may not be an effective
activator of IM-9 cells, particularly based on later studies demonstrating a lack of IM-9
activation with CpG (see below). Nonetheless, upregulation AhR was not a necessity for
our studies, as the basal expression of AhR was clearly demonstrated, warranting further
characterization of the IM-9 cell line (Fig. 8)

45
Figure 8. CpG treatment does not appreciably increase AhR expression in human
IM-9 cells. Whole cell lysate (100 µg) from naïve (Na) IM-9 cells (5x10⁵ C/mL) or cells
treated with CpG (1 µM) for 24, 48, or 72 h was loaded into lanes 2-7, resolved on a 10%
SDS-PAGE gel, and probed with mouse anti-AhR antibody (0.1 µg/mL). Lysate (50 µg)
from naïve CH12.LX cells (5x10⁵
C/mL) was loaded into lane 1 as a positive control.

46
IM-9 cells have a functional AhR signaling pathway: Since TCDD-induced effects are
thought to be mediated through the AhR pathway, a functional AhR pathway in IM-9
cells is essential for our mechanistic studies. As stated above, several past mechanistic
studies have established induction of the CYP1A1 gene, a metabolic gene, as the
hallmark of a functional AhR pathway (see Ma, 2001 for review). Therefore, we chose to
utilize real-time RT-PCR to quantify RNA transcripts for the CYP1A1 gene in naïve or
TCDD-treated IM-9 cells. We found a marked induction of CYP1A1 in the TCDD-
treated cells which suggest that IM-9 cells have a functional AhR pathway (Fig. 9).

47
NA VH TCDD0
2
4
6
8
**
Fo
ld in
du
cti
on
of
CY
P1A
1 D
NA
Figure 9. TCDD induces CYP1A1 induction. Reverse transcribed cDNA from
untreated IM-9 cells or cells treated for 24h with vehicle (0.019% DMSO) or 30 nM
TCDD was amplified by real-time PCR with -actin as an internal control. Fold induction
was relative to NA.

48
IM-9 cells express basal IgG: Previous experiments in our laboratory support the theory
that TCDD inhibits antibody secretion through the AhR pathway in the mouse CH12.LX
cell line (Sulentic et al., 1998; Sulentic et al., 2000). Therefore, we hypothesize that
modulation of Ig secretion is a toxicological endpoint of TCDD induction of the AhR
pathway in a human cell line. In order to determine if IM-9 cells are a viable model for
studying the TCDD-induced effects on Ig secretion, we chose to characterize basal Ig
secretion in IM-9 cells. Importantly, a prerequisite for determining antibody secretion
was to develop the most effective culturing conditions for the IM-9 cell line by analyzing
proliferation patterns corresponding with basal Ig secretion. A complex proliferation and
basal Ig secretion pattern in the IM-9 cell line was reported by Fahey, Buell and Sox
(1971). Since cell lines are known to change their phenotype over time, likely due to
various reasons including different culturing practices, our studies focused first on
verifying optimum culturing conditions for activation of Ig expression. In correlation
with the Fahey, 1971 study, we found that in order to see significant basal IgG secretion,
IM-9 cells had to be grown up to a stationary growth phase (cell concentration 1.2 x 10⁶
C/mL) then reduced in concentration to obtain a log growth phase (cell concentration
between 2.5 x 10⁴ and 5.0 x 10
5 C/mL). Then this cycle of concentration growth and
reduction was to be repeated once. After the second reduction in concentration to obtain a
log growth phase, basal Ig was expressed and could be sampled as cells proliferated back
up to a stationary phase. Using these culturing practices we established that the current
IM-9 cell line secretes IgG, however, when normalized to cell number, naïve IM-9 cell
supernatant only demonstrated low levels of secreted IgG in the magnitude of ng per 105
cells (Fig. 10), whereas the levels of secreted IgG seen in the Fahey study (1971) was in

49
the magnitude of hundreds of ng per 105
cells. Differences in magnitude of basal IgG
secretion suggest that the IM-9 cell line may have changed in phenotype or our particular
culturing conditions, such as the type and lot of serum, may influence the basal IgG
levels. Interestingly, physiological levels of human IgG are g per liter in magnitude.
Thus, our levels of IgG secretion in the human IM-9 cell line may not be physiologically
significant.
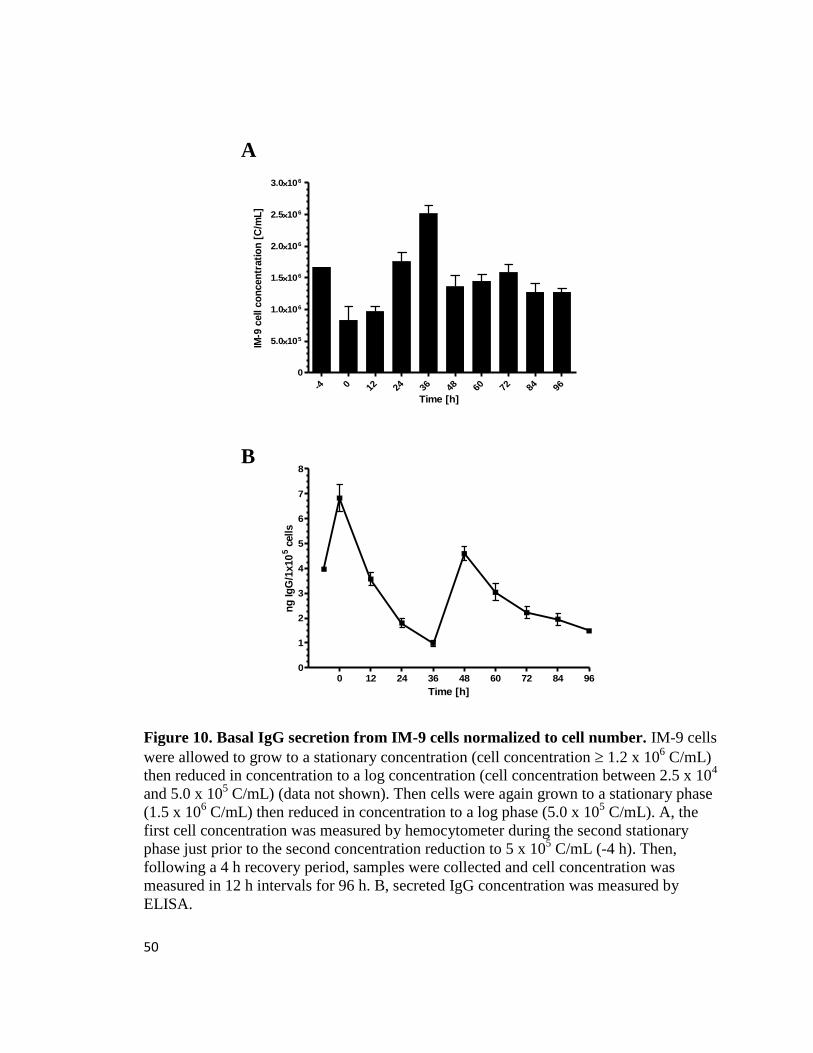
50
0 12 24 36 48 60 72 84 960
1
2
3
4
5
6
7
8
Time [h]
ng
Ig
G/1
x10
5 c
ells
-4 0 12 24 36 48 60 72 84 96
0
5.0105
1.0106
1.5106
2.0106
2.5106
3.0106
Time [h]
IM-9
cell
co
ncen
trati
on
[C
/mL
]
Figure 10. Basal IgG secretion from IM-9 cells normalized to cell number. IM-9 cells
were allowed to grow to a stationary concentration (cell concentration 1.2 x 10⁶ C/mL)
then reduced in concentration to a log concentration (cell concentration between 2.5 x 10⁴
and 5.0 x 10⁵ C/mL) (data not shown). Then cells were again grown to a stationary phase
(1.5 x 10⁶ C/mL) then reduced in concentration to a log phase (5.0 x 10
5 C/mL). A, the
first cell concentration was measured by hemocytometer during the second stationary
phase just prior to the second concentration reduction to 5 x 10⁵ C/mL (-4 h). Then,
following a 4 h recovery period, samples were collected and cell concentration was
measured in 12 h intervals for 96 h. B, secreted IgG concentration was measured by
ELISA.
AStationary - Stationary (100 nM TCDD)
NA V T0.0
0.5
1.0
1.5
2.0
2.5Legend
Legend
Legend
Fo
ld C
han
ge
Stationary - Stationary (30 nM TCDD)
NA V T0.0
0.5
1.0
1.5
2.0
2.5
*NA
Legend
Legend
Fo
ld C
han
ge
Log - Stationary (100 nM TCDD)
NA V T0.0
0.5
1.0
1.5
2.0
2.5**
Fo
ld C
han
ge
Log - Stationary (30 nM TCDD)
NA V T0.0
0.5
1.0
1.5
2.0
2.5
*
Fo
ld C
han
ge
BStationary - Stationary (100 nM TCDD)
NA V T0.0
0.5
1.0
1.5
2.0
2.5Legend
Legend
Legend
Fo
ld C
han
ge
Stationary - Stationary (30 nM TCDD)
NA V T0.0
0.5
1.0
1.5
2.0
2.5
*NA
Legend
Legend
Fo
ld C
han
ge
Log - Stationary (100 nM TCDD)
NA V T0.0
0.5
1.0
1.5
2.0
2.5**
Fo
ld C
han
ge
Log - Stationary (30 nM TCDD)
NA V T0.0
0.5
1.0
1.5
2.0
2.5
*
Fo
ld C
han
ge

51
IgG expression in IM-9 cells is not significantly activated by CpG or R848: We
previously demonstrated in mouse CH12.LX cells that IgM expression activated by LPS-
stimulation was inhibited by TCDD (Sulentic et al., 1998). Since in CH12.LX cells
TCDD-induced inhibition of Ig required cellular activation we attempted to identify a B-
cell activator for our human IM-9 cells. As previously stated, CpG has been shown to
activate human B cells (Bauer et al., 2001). In our earlier studies we found that CpG did
not appreciably stimulate upregulation of the AhR. However, there was still the
possibility that CpG would stimulate IgG expression. Thus, we tested CpG as a stimulant
of IgG expression in IM-9 cells and found a modest activation of IgG at 36 h by 0.5 M
CpG (Fig. 11), however higher concentrations (1 and 3 M) of CpG significantly
inhibited background IgG expression (fig 11). Given that the CpG activation we saw was
not significant, we considered testing R848 as a stimulant. R848 has been reported as a
TLR7 agonist that mimics CD40L activation (Bishop et al., 2001). CD40L is primarily
expressed on activated T cells and was demonstrated by Allan and Sherr (2005), to be a
promising but expensive stimulant of primary human B cells. Thus, we attempted to
stimulate IM-9 cells with R848, an affordable substitute to recombinant CD40L. We
found little or no significant activation in IgG concentration relative to vehicle control
(0.1% DMSO) in IM-9 cells treated with 10-1000 ng/mL R848 for 36-96 h. However, our
24 h samples showed variably showed no effect or inhibition in IM-9 cells treated with
100 ng/mL R848 (p<0.05). (Fig. 12). Although, IM-9 cells have been reported to be high
IgG-secreting lymphoblast (Fahey et al., 1971), we did not detect high basal IgG
secretion and have yet to find an optimal stimulant for these cells. The appropriate

52
activation stimuli may be more complex and involve a combination of stimuli including
interleukins and CD40L.

53
0 24 36 480
5.0105
1.0106
1.5106
2.0106
2.5106
3.0106
NA
0.5 M CpG
1 M CpG
3 M CpG
Sampling Time [h]
IM-9
cell c
on
cen
trati
on
[C
/mL
]
24 36 480
1
2
3
4
*
***
3 M CpG
1 M CpG
NA
0.5 M CpG
Time [h]
IgG
Co
ncen
trati
on
[n
g/1
05 c
ell
s]
Figure 11. A low concentration of CpG modestly activates IgG secretion in IM-9
cells. IM-9 cells were allowed to grow to a stationary phase concentration (cell
concentration 1.2 x 10⁶ C/mL) then reduced in concentration to a log phase
concentration (cell concentration between 2.5 x 10⁴ and 5.0 x 10
5 C/mL) (data not
shown). Cells were then again grown to a stationary phase concentration and then
reduced in concentration to 5.0 x 10⁵ C/mL. Naïve (NA) IM-9 cells and cells treated with
0.5, 1 or 3M CpG were incubated for 24-48h. A, samples were collected and cell
concentration was measured by hemocytometer at 24, 36, and 48 h. B, IgG concentration
was measured by ELISA. Two-way ANOVA followed by a Bonferroni’s two-tailed t test
(95% confidence interval) indicates significant inhibition relative to the NA control at a
concentration of 1 M CpG (*) (p<0.05), and 3 M CpG (***) (p<0.001).
AStationary - Stationary (100 nM TCDD)
NA V T0.0
0.5
1.0
1.5
2.0
2.5Legend
Legend
Legend
Fo
ld C
han
ge
Stationary - Stationary (30 nM TCDD)
NA V T0.0
0.5
1.0
1.5
2.0
2.5
*NA
Legend
Legend
Fo
ld C
han
ge
Log - Stationary (100 nM TCDD)
NA V T0.0
0.5
1.0
1.5
2.0
2.5**
Fo
ld C
han
ge
Log - Stationary (30 nM TCDD)
NA V T0.0
0.5
1.0
1.5
2.0
2.5
*
Fo
ld C
han
ge
BStationary - Stationary (100 nM TCDD)
NA V T0.0
0.5
1.0
1.5
2.0
2.5Legend
Legend
Legend
Fo
ld C
han
ge
Stationary - Stationary (30 nM TCDD)
NA V T0.0
0.5
1.0
1.5
2.0
2.5
*NA
Legend
Legend
Fo
ld C
han
ge
Log - Stationary (100 nM TCDD)
NA V T0.0
0.5
1.0
1.5
2.0
2.5**
Fo
ld C
han
ge
Log - Stationary (30 nM TCDD)
NA V T0.0
0.5
1.0
1.5
2.0
2.5
*
Fo
ld C
han
ge

54
24 36 48 72 96
0
5.0105
1.0106
1.5106
2.0106
NA
0.1% DMSO
10 ng/mL R848
100 ng/mL R848
1000 ng/mL R848
*****
*IM
-9 c
ell c
on
cen
trati
on
[C
/mL
]
24 36 48 72 96
0
2
4
6
8NA
0.1% DMSO
10 ng/mL R848
100 ng/mL R848
1000 ng/mL R848
***
Time [h]
IgG
Co
ncen
trati
on
[n
g/1
05 c
ell
s]
Figure 12. IM-9 cells are not activated by R848. IM-9 cells were allowed to grow to a
stationary phase concentration (cell concentration 1.2 x 10⁶ C/mL) then reduced in
concentration to a log phase concentration (cell concentration between 2.5 x 10⁴ and 5.0 x
105 C/mL) (data not shown). Then, untreated IM-9 cells were again grown to a stationary
phase and then reduced in concentration to 3.5 x 10⁴ C/mL. Naïve (NA) IM-9 and cells
and cells treated with 0.1% DMSO vehicle, 10, 100, or 1000 ng/mL R848 were incubated
for 24-96h. A, Samples were collected and cell concentration was measured by
hemocytometer at 24, 36, 48, 72 and 96 h. B, IgG concentration was measured by
ELISA. Two-way ANOVA followed by a Bonferroni’s two-tailed t test (95% confidence
interval) indicated significant differences compared to the vehicle control p<0.05 (*),
p<0.01 (**).
AStationary - Stationary (100 nM TCDD)
NA V T0.0
0.5
1.0
1.5
2.0
2.5Legend
Legend
Legend
Fo
ld C
han
ge
Stationary - Stationary (30 nM TCDD)
NA V T0.0
0.5
1.0
1.5
2.0
2.5
*NA
Legend
Legend
Fo
ld C
han
ge
Log - Stationary (100 nM TCDD)
NA V T0.0
0.5
1.0
1.5
2.0
2.5**
Fo
ld C
han
ge
Log - Stationary (30 nM TCDD)
NA V T0.0
0.5
1.0
1.5
2.0
2.5
*
Fo
ld C
han
ge
BStationary - Stationary (100 nM TCDD)
NA V T0.0
0.5
1.0
1.5
2.0
2.5Legend
Legend
Legend
Fo
ld C
han
ge
Stationary - Stationary (30 nM TCDD)
NA V T0.0
0.5
1.0
1.5
2.0
2.5
*NA
Legend
Legend
Fo
ld C
han
ge
Log - Stationary (100 nM TCDD)
NA V T0.0
0.5
1.0
1.5
2.0
2.5**
Fo
ld C
han
ge
Log - Stationary (30 nM TCDD)
NA V T0.0
0.5
1.0
1.5
2.0
2.5
*
Fo
ld C
han
ge

55
Transfection of the polymorphic human hs1,2 enhancer into IM-9 cells
Our lab has demonstrated that TCDD induces binding of the mouse AhR to a
DRE site within an oligomer from the hs1,2 enhancer region of the 3’IgHRR (Sulentic et
al., 2000). We have also shown that TCDD inhibits transcriptional activity of the mouse
hs1,2 enhancer (Fernando et al. manuscript in preparation), which suggests that
regulation of the mouse hs1,2 enhancer may be a sensitive transcriptional target of TCDD
through the AhR signaling pathway. Since the mouse and human hs1,2 enhancers share a
90% core sequence identity (Mills et al. 1997), we propose that the transcriptional
regulation of the human hs1,2 enhancer may also be a sensitive transcriptional target of
the human AhR pathway. Three allelic polymorphisms of the human hs1,2 enhancer have
been reported, α1A, α1B, and α1C, each containing a 1, 2, or 3-53 bp tandem repeats,
respectively (Denizot et al., 2001). We previously found that activation of luciferase
reporters consisting of the VH promoter and the or the 1C allele of the hs1,2
enhancer was TCDD concentration-dependent, and cells stimulated with LPS and co-
treated with TCDD demonstrated an enhanced activation that was dependent on number
of 53 bp repeats in addition to being TCDD and LPS concentration-dependent (Fernando
et al., manuscript in preparation). Strikingly, however, the 1B reporter, the allele that
has been associated with several human autoimmune diseases, showed the greatest fold-
activation (p<0.05) of the three hs1,2 reporters in LPS-activated and TCDD co-treated
CH12.LX cells (Fernando et al., manuscript in preparation), Still, a gap remained in our
understanding of the effects of TCDD on transcriptional regulation of the human hs1,2
enhancers in a human cell line. In preliminary experiments we found, in correspondence

56
with studies in the mouse CH12.LX cell line, the 1B wild type reporter, transfected into
human IM-9 cells demonstrated a TCDD-induced increase in activity. However, the
effect of TCDD on the 1A and 1C alleles of the hs1,2 enhancer in human cells had not
been determined. Accordingly, we conducted transfection studies on all three of the
human hs1,2 reporters to evaluate the effects of TCDD in the human IM-9 cell line
Culturing conditions for transfection studies in IM-9 cells: In the above mentioned Ig
experiments we determined that IM-9 cells required a complex culturing pattern in order
to express Ig. Therefore, to determine ideal culturing conditions, we conducted several
studies in which the IM-9 cells were initially grown to lag, log, or stationary phase,
transfected with the 1B reporter, then seeded at lag, log, or stationary phase and treated
with TCDD. In addition, previous studies have demonstrated that human AhR has a
lower level of endogenous expression and affinity for TCDD than mouse AhR (Harper et
al., 1988). Furthermore, we found lower expression of human AhR versus mouse AhR in
IM-9 and CH12.LX cells, respectively in our earlier Western Blot studies. Therefore, we
initially tested both a standard concentration (30nM, for our laboratory) and a high
concentration (100 nM) of TCDD in our culturing condition studies because low AhR
expression may be associated with lowered sensitivity to TCDD, as has been suggested in
other studies (Harper et al., 1998; Ema et al., 1994). We found a significant TCDD-
induced activation in the log-stationary (i.e., grown to log phase then transfected and
reseeded at a stationary phase concentration), and stationary-stationary (i.e., grown to
stationary phase then transfected and reseeded at a stationary phase concentration) culture
conditions with both 30nM and 100nM concentrations of TCDD (Fig. 13). Interestingly,
57
there was a marked increase in overall luciferase activity levels of the log-stationary
samples versus the stationary-stationary samples (Fig. 13). In spite of this, we saw
slightly higher TCDD-induced fold-activation in stationary-stationary samples versus
log-stationary samples treated with 30 nM TCDD (fig 14). When we compared these
results to a pilot study in which we treated the 1C reporter with 30 nM TCDD, we saw a
similar trend in fold-activation (fig 14). Consequently, we decided to use stationary-
stationary culturing conditions in our transfection studies. We decided to use 30 nM
TCDD versus 100 nM TCDD because 30 nM TCDD is closer to common TCDD
exposure levels than the 100 nM TCDD and results from additional studies did not show
a great difference in fold induction from 30 nM TCDD versus 100 nM TCDD. This
corresponds to studies in mouse CH112.LX cells in which TCDD-induced fold-activation
seemed to plateau at 30 nM TCDD (Fernando et al., manuscript in preparation).

58
Stat-Log Log-Log Stat-Stat Log-Stat0
50000
100000
150000
200000
*
*
**
NA
0.019% DMSO
30 nM TCDD
0.1% DMSO
100 nM TCDD
Starting Phase-Seeding Phase
Lu
cifera
se A
cti
vit
y
(rela
tive lig
ht
un
its)
Figure 13. The 1B reporter is activated by 30 and 100nM TCDD when IM-9 cells
are cultured to stationary or log concentrations. IM-9 cells were grown to a stationary
phase (cell concentration 1.2 x 10⁶ C/mL) or to a log concentration (~5.0 x 10
5 C/mL),
transfected with the 1B luciferase reporter, and then left untreated (NA), or treated with
DMSO vehicle or TCDD. The vehicle controls for samples treated with 30 nM or 100 nM
TCDD was 0.019% or 0.1% DMSO. Treatment groups with a log phase final seeding
concentration were seeded at 5.0 x 10⁵ C/mL. Treatment groups with a stationary phase
final seeding concentration were seeded at 1.0 x 10⁶ C/mL and incubated for 24h.
Luciferase activity was measured in relative light units. Statistical significance was
determined by Two-way ANOVA followed by a Bonferroni’s two-tailed t test (95%
confidence intervals) indicated and is depicted by “*” (p<0.05) or “**” (p<0.01).

59
1B Stationary - Stationary
NA DMSO TCDD0.0
0.5
1.0
1.5
2.0
2.5
*
Lu
cif
era
se A
cti
vit
y
(rela
tive lig
ht
un
its)
1C Stationary - Stationary
NA DMSO TCDD0.0
0.5
1.0
1.5
2.0
2.5
**
Fo
ld C
han
ge
1C Log - Stationary
NA DMSO TCDD0.0
0.5
1.0
1.5
2.0
2.5
**
Fo
ld C
han
ge
1B Log - Stationary
NA DMSO TCDD0.0
0.5
1.0
1.5
2.0
2.5
*
Lu
cif
era
se A
cti
vit
y
(rela
tive lig
ht
un
its)
Figure 14. The fold-activation of the 1B and 1C reporters is slightly higher in IM-
9 cells initially cultured to a stationary phase versus a log phase. IM-9 cells were
grown to a stationary phase (cell concentration 1.2 x 10⁶ C/mL) or to a log
concentration (~5.0 x 10⁵ C/mL), then transfected with either the 1B or 1C luciferase
reporters, and then left untreated (NA), or treated with 0.019% DMSO vehicle (DMSO)
or 30 nM TCDD (TCDD). Treatment groups were seeded at 1.0 x 10⁶ C/mL and
incubated for 24h. Luciferase activity results were normalized to fold change relative to
vehicle control. Statistical significance was determined by one-way ANOVA followed by
a Dunnett’s two-tailed t test (95% confidence interval) and is depicted by “*” (p<0.05) or
“**” (p<0.01).
CStationary - Stationary (100 nM TCDD)
NA V T0.0
0.5
1.0
1.5
2.0
2.5Legend
Legend
Legend
Fo
ld C
han
ge
Stationary - Stationary (30 nM TCDD)
NA V T0.0
0.5
1.0
1.5
2.0
2.5
*NA
Legend
Legend
Fo
ld C
han
ge
Log - Stationary (100 nM TCDD)
NA V T0.0
0.5
1.0
1.5
2.0
2.5**
Fo
ld C
han
ge
Log - Stationary (30 nM TCDD)
NA V T0.0
0.5
1.0
1.5
2.0
2.5
*
Fo
ld C
han
ge
DStationary - Stationary (100 nM TCDD)
NA V T0.0
0.5
1.0
1.5
2.0
2.5Legend
Legend
Legend
Fo
ld C
han
ge
Stationary - Stationary (30 nM TCDD)
NA V T0.0
0.5
1.0
1.5
2.0
2.5
*NA
Legend
Legend
Fo
ld C
han
ge
Log - Stationary (100 nM TCDD)
NA V T0.0
0.5
1.0
1.5
2.0
2.5**
Fo
ld C
han
ge
Log - Stationary (30 nM TCDD)
NA V T0.0
0.5
1.0
1.5
2.0
2.5
*
Fo
ld C
han
ge
BStationary - Stationary (100 nM TCDD)
NA V T0.0
0.5
1.0
1.5
2.0
2.5Legend
Legend
Legend
Fo
ld C
han
ge
Stationary - Stationary (30 nM TCDD)
NA V T0.0
0.5
1.0
1.5
2.0
2.5
*NA
Legend
Legend
Fo
ld C
han
ge
Log - Stationary (100 nM TCDD)
NA V T0.0
0.5
1.0
1.5
2.0
2.5**
Fo
ld C
han
ge
Log - Stationary (30 nM TCDD)
NA V T0.0
0.5
1.0
1.5
2.0
2.5
*
Fo
ld C
han
ge
AStationary - Stationary (100 nM TCDD)
NA V T0.0
0.5
1.0
1.5
2.0
2.5Legend
Legend
Legend
Fo
ld C
han
ge
Stationary - Stationary (30 nM TCDD)
NA V T0.0
0.5
1.0
1.5
2.0
2.5
*NA
Legend
Legend
Fo
ld C
han
ge
Log - Stationary (100 nM TCDD)
NA V T0.0
0.5
1.0
1.5
2.0
2.5**
Fo
ld C
han
ge
Log - Stationary (30 nM TCDD)
NA V T0.0
0.5
1.0
1.5
2.0
2.5
*
Fo
ld C
han
ge

60
TCDD activates the human polymorphic hs1,2 enhancer: Once culturing conditions
for IM-9 transfection studies were optimized we focused our attention on determining
TCDD-induced effects on the 1A, 1B, 1C, alleles of the hs1,2 enhancer as well as a
control reporter consisting of the VH promoter alone. We found that the basal activities of
the human hs1,2 reporters were markedly higher in IM-9 cells versus CH12.LX cells
(data not shown). In addition we found that in the human IM-9 cell line all three of the
hs1,2 reporters were activated by TCDD relative to a vehicle control (0.019% DMSO)
(Fig. 15). These results correspond to the activation of each reporter that was seen in
CH12.LX cells treated with TCDD. We also compared the averages of TCDD-induced
fold-activation of the VH promoter and hs1,2 reporters relative to vehicle from multiple
independent studies in the IM-9 (VH promoter n=4; 1A n=9; 1B n=11; 1C n= 10)
and CH12.LX (1A n=4; 1B n=3; 1C n=4) cell lines (Table 2). Converse to our basal
activity findings, we found a considerably higher increase in the TCDD-induced fold-
activation relative to vehicle of the hs1,2 reporters in CH12.LX versus IM-9 cells (Table
2). Moreover, the VH promoter was only transfected into IM-9 cells in this study,
however, the fold-activation of the VH promoter in IM-9 cells was considerably lower
than the fold activation demonstrated in our previous CH12.LX studies (Fernando et al.,
manuscript in preparation), (data not shown). It is notable, however, that the TCDD-
induced increase in fold-activation of the hs1,2 enhancers compared to the VH promoter
in IM-9 cells was not statistically significant (Table 2). However our previous studies
also suggest that the VH promoter may be regulated differently than the hs1,2 reporters
after treatment with TCDD and LPS in CH12.LX cells. Nevertheless, supposing the
effect of greater TCDD-induced fold-activation of the hs1,2 reporters in CH12.LX cells
61
versus IM-9 cells is mediated by the AhR, then these findings correspond with previous
reports of higher AhR affinity and expression in mouse cells versus human cells.
Furthermore, regardless of the extent of the fold-activation, in both IM-9 and CH12.LX
cells the fold-activation of the 1B reporter was the highest of the human hs1,2 reporters
(Table 2), which may be medically relevant to human health based on the association of
the 1B allele of the hs1,2 enhancer to several autoimmune diseases. In total our data
demonstrates that the human hs1,2 enhancers are activated by TCDD in a human B-cell
line model.

62
1A
NA DMSO TCDD0
20000
40000
60000 **
Lu
cifera
se A
cti
vit
y
(rela
tive lig
ht
un
its)
1C
NA DMSO TCDD0
20000
40000
60000 **L
ucifera
se A
cti
vit
y
(rela
tive lig
ht
un
its)
VH promoter
NA DMSO TCDD0
20000
40000
60000
Lu
cifera
se A
cti
vit
y
(rela
tive lig
ht
un
its)
1B
NA DMSO T 0
20000
40000
60000
**
Lu
cifera
se A
cti
vit
y
(rela
tive lig
ht
un
its)
Figure 15. The human hs1,2 reporters are activated by TCDD in human IM-9 cells.
The VH, 1A, 1B or 1C reporters were transfected into IM-9 cells then left untreated
(NA) or treated with 0.019% DMSO vehicle control (DMSO) or 30nM TCDD (TCDD)
and incubated for 24 h. The results depicted are not from the same study. Luciferase
activity results are reported in relative light units and are normalized to the activity of the
DMSO vehicle treatment group of each plasmid. Statistical significance was determined
by one-way ANOVA followed by a Dunnett’s two-tailed t test (95% confidence interval)
and is depicted by “**” (p<0.01).
AStationary - Stationary (100 nM TCDD)
NA V T0.0
0.5
1.0
1.5
2.0
2.5Legend
Legend
Legend
Fo
ld C
han
ge
Stationary - Stationary (30 nM TCDD)
NA V T0.0
0.5
1.0
1.5
2.0
2.5
*NA
Legend
Legend
Fo
ld C
han
ge
Log - Stationary (100 nM TCDD)
NA V T0.0
0.5
1.0
1.5
2.0
2.5**
Fo
ld C
han
ge
Log - Stationary (30 nM TCDD)
NA V T0.0
0.5
1.0
1.5
2.0
2.5
*
Fo
ld C
han
ge
BStationary - Stationary (100 nM TCDD)
NA V T0.0
0.5
1.0
1.5
2.0
2.5Legend
Legend
Legend
Fo
ld C
han
ge
Stationary - Stationary (30 nM TCDD)
NA V T0.0
0.5
1.0
1.5
2.0
2.5
*NA
Legend
Legend
Fo
ld C
han
ge
Log - Stationary (100 nM TCDD)
NA V T0.0
0.5
1.0
1.5
2.0
2.5**
Fo
ld C
han
ge
Log - Stationary (30 nM TCDD)
NA V T0.0
0.5
1.0
1.5
2.0
2.5
*
Fo
ld C
han
ge
CStationary - Stationary (100 nM TCDD)
NA V T0.0
0.5
1.0
1.5
2.0
2.5Legend
Legend
Legend
Fo
ld C
han
ge
Stationary - Stationary (30 nM TCDD)
NA V T0.0
0.5
1.0
1.5
2.0
2.5
*NA
Legend
Legend
Fo
ld C
han
ge
Log - Stationary (100 nM TCDD)
NA V T0.0
0.5
1.0
1.5
2.0
2.5**
Fo
ld C
han
ge
Log - Stationary (30 nM TCDD)
NA V T0.0
0.5
1.0
1.5
2.0
2.5
*
Fo
ld C
han
ge
DStationary - Stationary (100 nM TCDD)
NA V T0.0
0.5
1.0
1.5
2.0
2.5Legend
Legend
Legend
Fo
ld C
han
ge
Stationary - Stationary (30 nM TCDD)
NA V T0.0
0.5
1.0
1.5
2.0
2.5
*NA
Legend
Legend
Fo
ld C
han
ge
Log - Stationary (100 nM TCDD)
NA V T0.0
0.5
1.0
1.5
2.0
2.5**
Fo
ld C
han
ge
Log - Stationary (30 nM TCDD)
NA V T0.0
0.5
1.0
1.5
2.0
2.5
*
Fo
ld C
han
ge

63
CH12.LX (30 nM TCDD) IM-9 (30 nM TCDD)
Reporter Fold-activation
±SEM p-value Fold-activation
±SEM p-value
VH † † † 1.2 0.058 p>0.05
1A 1.9 0.313 p>0.05 1.4 0.066 p<0.01
1B 2.6 0.231 p<0.01 1.6 0.116 p<0.001
1C 1.8 0.288 p>0.05 1.5 0.078 p<0.001
Table 2. Comparisons of TCDD-induced fold-activation relative to vehicle control of
the VH promoter alone and the hs1,2 reporters in CH12.LX or IM-9 cells.
Comparison of the average fold-activation induced by 30 nM TCDD relative to the
0.019% DMSO vehicle control from multiple transfection studies of the 1A, 1B, and
1C human reporters in unstimulated CH12.LX cells (1A n=4; 1B n=3; 1C n=4)
versus unstimulated IM-9 cells (1A n=9; 1B n=11; 1C n= 10). Transfection studies
utilizing the VH reporter alone were not conducted in CH12.LX cells, as symbolized by
“†.”Significance was calculated by 1-way ANOVA followed by a Dunnett’s two-tailed t
test (95% confidence interval).
64
The human hs1,2 enhancer is not activated by CpG
In our past CH12.LX transfection studies we found a correlation between the number of
53bp repeats of each allele of the human hs1,2 enhancer and a LPS-induced increase in
the total activity of the VH promoter and human hs1,2 reporters (Fernando et al.,
manuscript in preparation). Furthermore, we found that the human hs1,2 enhancer was
synergistically activated by TCDD and LPS co-treatment in CH12.LX cells (Fernando et
al., manuscript in preparation). Therefore, we decided to determine if the synergistic
activation from stimulation and TCDD treatment is also displayed in human IM-9 cells.
Although, we did not see an appreciable level of cellular activation of IM-9 cells treated
with CpG in our characterization studies, our preliminary experiments demonstrated a
slight CpG-induced activation of transcriptional activity of the human 1B reporter in
IM-9 cells (data not shown). Thus, we employed CpG as a stimulant for our transfection
studies. However, our data suggests that the transcriptional activation of the 1B reporter
is not enhanced in IM-9 cells co-treated with CpG and TCDD (Fig. 16).

65
1B reporter in IM-9 cells
NA DMSO TCDD CpG C+D C+T0
5000
10000
15000
20000
** **
Lu
cifera
se A
cti
vit
y
(rela
tive lig
ht
un
its)
1B reporter in CH12.LX cells
NA DMSO TCDD LPS L+D L+T0
500
1000
1500
2000
2500
***
***
Lu
cifera
se A
cti
vit
y
(rela
tive lig
ht
un
its)
Figure 16. LPS and TCDD co-treatment synergistically activates the 1B reporter
in CH12.LX cells but CpG treatment does not enhance TCDD-induced activation of
the 1B reporter in IM-9 cells. A, Luciferase activity of the 1B reporter was measured
in untreated human IM-9 B cells (NA) or IM-9 cells treated for 24 h with 0.019% DMSO
vehicle control (DMSO), 30 nM TCDD (TCDD), 0.5 M CpG (CpG), 0.5 M CpG +
0.019% DMSO (C+D), or 0.5 M CpG + 30 nM TCDD (C+T). B, Luciferase activity of
the 1B reporter was measured in untreated mouse CH12.LX cells (NA) or CH12.LX
cells treated for 24 h with 0.019% DMSO vehicle control (DMSO), 30 nM TCDD
(TCDD), 1 g/mL LPS (L), 1 g/mL LPS + 0.019% DMSO (L+D) or 1 g/mL + 30 nM
TCDD (L+T). Statistical significance was determined by one-way ANOVA followed by
a Dunnett’s two-tailed t test (95% confidence interval) and is depicted by “**” (p<0.01)
or “***” (p<0.001).
AStationary - Stationary (100 nM TCDD)
NA V T0.0
0.5
1.0
1.5
2.0
2.5Legend
Legend
Legend
Fo
ld C
han
ge
Stationary - Stationary (30 nM TCDD)
NA V T0.0
0.5
1.0
1.5
2.0
2.5
*NA
Legend
Legend
Fo
ld C
han
ge
Log - Stationary (100 nM TCDD)
NA V T0.0
0.5
1.0
1.5
2.0
2.5**
Fo
ld C
han
ge
Log - Stationary (30 nM TCDD)
NA V T0.0
0.5
1.0
1.5
2.0
2.5
*
Fo
ld C
han
ge
BStationary - Stationary (100 nM TCDD)
NA V T0.0
0.5
1.0
1.5
2.0
2.5Legend
Legend
Legend
Fo
ld C
han
ge
Stationary - Stationary (30 nM TCDD)
NA V T0.0
0.5
1.0
1.5
2.0
2.5
*NA
Legend
Legend
Fo
ld C
han
ge
Log - Stationary (100 nM TCDD)
NA V T0.0
0.5
1.0
1.5
2.0
2.5**
Fo
ld C
han
ge
Log - Stationary (30 nM TCDD)
NA V T0.0
0.5
1.0
1.5
2.0
2.5
*
Fo
ld C
han
ge

66
BSAP decreases TCDD-induced activity of the human hs1,2 enhancer
Mouse models are widely used for toxicological studies based on their overall
genetic similarity to humans. As stated previously, the human and mouse hs1,2 enhancers
share a 90% core sequence identity (Mills et al. 1997). However, differences between the
human and mouse hs1,2 enhancer sequences may impact their transcriptional regulation.
Our previous data has shown that TCDD inhibits LPS-stimulated transcriptional
activation of a luciferase reporter consisting of the mouse hs1,2 enhancer in the mouse
CH12.LX cell line (Fernando et al. manuscript in preparation). Conversely, in CH12.LX
cells the human hs1,2 luciferase reporters are activated by TCDD in the absence of
stimulation and synergistically activated by a TCDD and LPS co-treatment (Fernando et
al. manuscript in preparation). The primary sequence difference between the human and
mouse hs1,2 enhancers is the lack in the human hs1,2 sequence of the high affinity BSAP
site found in the mouse hs1,2 enhancer sequence (Mills et al. 1997). BSAP is an inhibitor
of B-cell differentiation (Nutt et al. 1999). In immature and mature B cells BSAP
expression is high, but during the differentiation process BSAP expression is reduced to
nil in plasma cells (Reviewed by Nutt et al. 2001). BSAP in conjunction with κB and Oct
motifs exert a concerted repression of the mouse hs1,2 enhancer in mature B cells (Singh
and Birshtein 1993, 1995; Michaelson et al., 1996). This is contrary to what is seen in
plasma cells where BSAP is not expressed and protein binding to the B and Oct motifs
within the mouse hs1,2 enhancer exhibits a positive effect (Michaelson 1996). Moreover,
Yoo et al. (2003) demonstrated that in CH12.LX cells co-treated with LPS and TCDD,
expression of BSAP protein and mRNA was maintained 72h post LPS-activation. The
TCDD-induced sustained expression of BSAP could have inhibited the change in role of

67
κB and Oct which positively regulate B cells late in differentiation. This prolonged
expression of BSAP and hence, negative regulation by BSAP, was correlated with a
decrease in IgH transcripts (Yoo et al. 2003). Together these conclusions led us to the
hypothesis that in TCDD-treated cells, the lack of the high affinity BSAP site in the
human hs1,2 enhancer when compared to the mouse hs1,2 enhancer could mediate the
differences in transcriptional modulation by TCDD. Therefore, oligonucleotide primers
were designed to add a BSAP site, identical to the high affinity BSAP site in the mouse
hs1,2 enhancer, to the wild type human 1A reporter (1A+BSAP) by site directed
mutagenesis (Fernando et al,. manuscript in preparation). We then conducted transient
transfection experiments using the 1A and the 1A+BSAP reporters in IM-9 cells and
we found that both reporters were activated by TCDD. We found that, the TCDD-
induced fold-activation of the 1A+BSAP was noticeably lower than the fold-activation
of the 1A reporter (Fig. 17). Therefore, our results suggest that the 1A+BSAP reporter
may be negatively regulated by the added BSAP motif. This is supported by studies from
our lab of 1A+B reporter transfected into the mouse CH12.LX cell line, in which the
1A+BSAP reporter demonstrated a consistent decrease in total TCDD-induced
activation versus the 1A reporter in LPS induced CH12.LX cells (Ochs et al.,
manuscript in progress).

68
1A reporter
NA DMSO TCDD0.0
0.5
1.0
1.5
2.0
***F
old
Ch
an
ge
Rele
tive t
o V
eh
icle
1A + BSAP reporter
NA DMSO TCDD0.0
0.5
1.0
1.5
2.0
*
Fo
ld C
han
ge
Rele
tive t
o V
eh
icle
Figure 17. TCDD-induced activation of the human hs1,2 enhancer is inhibited by
addition of a BSAP binding motif. IM-9 cells were transfected with the 1A (A) or
1A + BSAP (B) reporters then left untreated (NA) or treated with 0.019% DMSO
vehicle control (DMSO) or 30 nM TCDD (TCDD) and incubated for 24 h. Luciferase
activity was normalized to fold change in activity relative to VH. Statistical significance
was determined by one-way ANOVA followed by a Dunnett’s two-tailed t test (95%
confidence interval) and is depicted by “*” (p<0.05) or “***” (p<0.001).
AStationary - Stationary (100 nM TCDD)
NA V T0.0
0.5
1.0
1.5
2.0
2.5Legend
Legend
Legend
Fo
ld C
han
ge
Stationary - Stationary (30 nM TCDD)
NA V T0.0
0.5
1.0
1.5
2.0
2.5
*NA
Legend
Legend
Fo
ld C
han
ge
Log - Stationary (100 nM TCDD)
NA V T0.0
0.5
1.0
1.5
2.0
2.5**
Fo
ld C
han
ge
Log - Stationary (30 nM TCDD)
NA V T0.0
0.5
1.0
1.5
2.0
2.5
*
Fo
ld C
han
ge
BStationary - Stationary (100 nM TCDD)
NA V T0.0
0.5
1.0
1.5
2.0
2.5Legend
Legend
Legend
Fo
ld C
han
ge
Stationary - Stationary (30 nM TCDD)
NA V T0.0
0.5
1.0
1.5
2.0
2.5
*NA
Legend
Legend
Fo
ld C
han
ge
Log - Stationary (100 nM TCDD)
NA V T0.0
0.5
1.0
1.5
2.0
2.5**
Fo
ld C
han
ge
Log - Stationary (30 nM TCDD)
NA V T0.0
0.5
1.0
1.5
2.0
2.5
*
Fo
ld C
han
ge

69
DISSCUSION
The IM-9 cells are an acceptable but not ideal cellular model for mechanistic studies
on the effects of TCDD on the 3’IgHRR
The 3’IgHRR has been established as a mediator of VDJ rearrangement (Serwe
and Sablitzky, 1993), CSR (Bottaro et al., 1998; Pattersson et al., 1990; Lieberson et al.,
1991; Darizvach et al., 1991; Cogné et al., 1994) and Ig expression and secretion (Wabl
et al, 1984; Klein et al., 1984) through transcriptional regulation of the IgH gene. Our
previous studies suggest that expression and secretion of Ig may be inhibited by TCDD,
possibly through the AhR pathway (Sulentic et al., 1998; 2000). We previously
hypothesized that the AhR pathway and binding of AhR/ARNT to DRE motifs may be
one mechanism behind TCDD-induced modulation of the mouse 3’IgHRR and individual
enhancers in activated CH12.LX cells. We have identified DRE-like motifs within the
hs4 of the mouse and hs1,2 of the mouse and human 3’IgHRR (Sulentic et al., 2000;
Fernando et al., manuscript in preparation). We also found that, in the LPS-activated
mouse CH12.LX cell line, TCDD modulates the transcriptional activity of luciferase
reporter plasmids consisting of the mouse hs4 enhancer and 3’IgHRR as well as the
mouse and human1,2 enhancers of the 3’IgHRR (Sulentic et al., 2004a, 2004b; Fernando
et al., manuscript in preparation). However, this study is the first to explore the use of a

70
human cell line as a model for mechanistic studies on the effects of TCDD on the human
hs1,2enhancer of the 3’IgHRR. We found that the IM-9 cell line may be a suitable, but
not an ideal model for our 3’IgHRR studies. Our data suggests that IM-9 cells possess a
functional AhR pathway, as we identified AhR expression and established TCDD
induction of the CYP1A1 gene in IM-9 cells. In a previous study, the expression of AhR
was not confirmed in the IM-9 cell line due to conflicting results in which TCDD induced
binding of AhR and ARNT protein to a DRE from the CYP1A1 gene, as identified by
supershift analysis in an EMSA study, but AhR was not detected by Western blot
(Masten and Shiverick, 1996). We believe our confirmation of AhR expression in IM-9
cells can be attributed to increased specificity and affinity of anti-AhR antibody since the
time of the previous IM-9 cell study (Masten and Shiverick, 1996). Still, identifying AhR
required us to load high concentrations of total IM-9 protein in our Western blot assay,
and the expression level of AhR coincided with the considerably lower induction of
CYP1A1 when compared to what is seen in the mouse CH12.LX cells (Sulentic et al.,
2000). The lowered induction of CYP1A1 supports the theory that human AhR has lower
expression and binding affinity for TCDD than mouse AhR (Harper et al., 1988; Ema et
al., 1994; Reviewed by Connor and Aylward, 2006) which may influence the level of
TCDD-induced CYP1A1 expression and resultant toxic effects. Interestingly, our results
contrast with the Nohara et al. study (2006) which suggested that TCDD induced higher
levels of CYP1A1 induction in primary human lymphocytes versus AhR high affinity
C57BL/6 (C57) mouse cells. However, differences in CYP1A1 induction are related to
AhR expression and several polymorphisms of human AhR with varied binding affinity
to TCDD have demonstrated cell-type specificity in human tonsils, hepatocytes, placenta

71
(Lorenzen and Okey, 1991; Lesca et al., 1994; Okey et al 1997). Thus, AhR binding
affinity to TCDD may differ between primary lymphocytes and the IM-9 B cell line.
Additionally, several laboratories have demonstrated that lowered expression of CYP1A1
could also be dependent on several factors along the AhR pathway other than AhR
affinity, including coactivators (Fuji-Kuriyama and Mimura, 2005; Hankinson, 2005;
Kim and Stallcup, 2004), chaperone proteins (Carlson and Perdew, 2002; Cox and Miller,
2003), and cross-talk between AhR and other transcription factors (Beishlag and Perdew,
2005; Marlowe and Puga, 2002).
In parallel with our previous findings that TCDD-treatment may inhibit Ig
expression and secretion in activated mouse CH12.LX cells, possibly through the AhR
pathway (Sulentic et al., 1998, 2000), we hypothesize that TCDD may also inhibit Ig
secretion in an activated human cell line. In order to analyze TCDD-induced differences
in Ig expression and secretion, an ideal human cell model should express basal and/or
inducible Ig. We evaluated basal Ig in IM-9 cells and found a level of basal Ig secretion
that was contrary to what was previously reported by the Fahey et al. study (1971), in
which IM-9 cells were characterized as high Ig secreting lymphoblast but not plasma
cells. In their study they utilized a complex culturing pattern in order to induce high
amounts of basal IgG. We followed the culturing pattern illustrated in their 1971 study
(Fahey et al., 1971), however their resulting antibody secretion was orders of magnitude
higher than our findings, (hundreds of ng per 106 cells versus ng per 10
6 cells). This
quantitative difference in IgG expression was perplexing, and could have been due to
unspecified culturing practices or IM-9 cell line differentiation. The lymphoblast phase of
development means that the B cell has encountered antigen but has not differentiated into

72
plasma cells which would be demonstrated by high amounts of endoplasmic reticulum
within the cell and high levels of Ig secretion. Even though the IM-9 cells in the Fahey
study (1971) started off in a lymphoblast stage of development, their IM-9 cell cultures
were maintained at considerably high cell concentrations (2 - 3 x 10⁶ C/mL) for extended
periods of time (10 -12 days). Perhaps, several days of such high cell culture
concentrations are necessary to initiate an antibody response in IM-9 cells. However,
these same conditions could have led to differentiation of the Fahey IM-9 cells into
plasma cells, and concordantly the high levels of Ig that we did not see. Interestingly, in
our 96 h Ig secretion studies in IM-9 cells we saw low but increasing numbers of larger
than average cells with cellular structures visible at a 1000X magnification, possibly
endoplasmic reticulum, after 60 h that would suggest the onset of cellular differentiation.
One report has suggested that change in phenotype of B cells during extended periods of
culture may be due to interactions with stimulatory fragments of Ig Fc regions that have
been secreted into cell media (Hobbs et al., 1985, 1989). Contamination is also a
possibility, as one report stated that one of the biggest problems encountered in cell
culture is infection with mycoplasmas (Drexler et al., 1999), which has also been
associated with differentiation of B cells (Sitia et al., 2005). Alternatively to a possible
phenotype change within the Fahey study (1971), our initial culture of IM-9 cells from
ATCC could have a different phenotype with respect to the reported phenotype of the
IM-9 cells. For example, the IM-9 cells we cultured may have already differentiated into
memory B cells, and studies with in vivo mouse B cells have suggested that memory B
cells may only secret high levels of IgG if activated by cell specific antigen in addition to
TLR activation (Richard et al., 2008; reviewed by Lanzavecchia and Sallusto, 2009). This
73
may be why they were not activated to secrete Ig by the TLR 9 agonist CpG or the TLR7
agonist R848 which have both reported to be activators of B cell lines (Bauer et al., 2001;
Bishop et al., 2001). In light of this premise the IM-9 cells may be activated only if they
are treated with the TLR9 agonist CpG or TLR7 agonist R848 in conjunction with, anti-
IgG, anti CD40 or CD40L, and/or stimulatory cytokines (i.e. IL-4 or IL-9). Thus, the
limited IgG expression in IM-9 cells could hinder determining TCDD-induced effects on
Ig expression which makes IM-9 the cell line a less than ideal human B-cell model.
However, the IM-9 cells still have a functional AhR pathway which supports the use of
them for mechanistic studies of TCDD in the transcriptional regulation of the 3’IgHRR.
The human polymorphic hs1,2 enhancer is activated by TCDD in human IM-9 cells
As stated above, the AhR pathway is thought to end in AhR/ARNT binding to
DRE motifs in promoter regions of several genes (Whitlock, 1990). We previously
identified DRE motifs within the hs4 and the mouse and human hs1,2 enhancers of the
3’IgHRR which may be sensitive targets of TCDD. More specifically, we found that
TCDD activates the mouse hs4, but inhibits the mouse 3’IgHRR. Additionally, although
the human and mouse hs1,2 enhancers share a 90% similarity (Mills et al., 1997), TCDD
inhibits the activity of a reporter consisting of the mouse hs1,2 enhancer, but activates the
human hs1,2 reporter in LPS activated and TCDD-treated IM-9 cells (Sulentic et al.,
2000; Fernando et al., manuscript in preparation). This study resolves the question of
whether this divergence in transcriptional activation between the mouse and human hs1,2
enhancers in mouse CH12.LX cells was cell model related, by demonstrating that
74
reporters consisting of the human polymorphic hs1,2 enhancer are also activated by
TCDD in IM-9 cells. However the TCDD-induced activation seen in human IM-9 cells
did not mirror what was seen in mouse CH12.LX cells. One key difference was that the
basal activity of each of the human hs1,2 reporters was magnitudes higher than the
activity seen in the CH12.LX cells. This difference could have been cell model related in
that human IM-9 cells may possess cellular machinery (i.e. RNA polymerase, basal
transcription factors) that is more equipped to activate the human hs1,2 reporters, as
mouse cellular machinery may more effectively activate the mouse hs1,2 reporter. This
theory is supported by a study from Chen and Birshtein (1997) in which they observed
that reporters consisting of the human C1 3’IgHRR and C2 3’IgHRR demonstrated
more basal activity than the mouse hs1,2 enhancer in a human plasma cell line. On the
other hand, the mouse hs1,2 enhancer was more basally activated in a mouse plasma cell
line than the human C1 and C2 3’IgHRR (Chen and Birshtein, 1997). Whereas the
human hs1,2 reporters demonstrated the greatest basal activity in human IM-9 cells, the
greatest fold change in TCDD-induced activation of the human hs1,2 reporters was
demonstrated in mouse CH12.LX cells. This difference could have also been cell model
related in that the AhR has been found to be species specific in several animal models
including, mouse, guinea pig, rat and others (reviewed by Connor and Aylward, 2006). In
most cases human AhR has demonstrated considerably lower binding affinities and
expression levels than other animal models (reviewed by Connor and Aylward, 2006),
which may have influenced the extent of TCDD-induced inhibition. Although we saw
differences in levels of basal activity and in TCDD-induced fold-activation of the human
hs1,2 reporters in IM-9 and CH12.LX cells, we found that the 1B reporter demonstrated

75
the greatest TCDD-induced fold-activation in both IM-9 and CH12.LX cells. This finding
is relevant because of the multiple autoimmune diseases that have been associated with
the expression of the 1B enhancer of the hs1,2 enhancer, including: IgA nephropathy
(IgAN) (Aupetit et al., 2000), Celiac disease, systemic sclerosis, schizophrenia, dermatitis
herpetiformis, plaque psoriasis (Frezza et al., 2004,2007, 2009), psoriatic arthritis (Cianci
et al., 2008), and rheumatoid arthritis (Tolusso et al., 2009). Several studies suggest a
correlation with the 1B allele of the hs1,2 enhancer and immune deregulation of the
IgA1 isotype which relates to our work in that we believe TCDD is a modulator of
immune regulation through the 3’IgHRR, and we have shown altered regulation of Ig
expression and function by TCDD (Sulentic et al., 1998, 2000). As discussed above we
did not identify an ideal stimulant for IM-9 cells so we were unable to compare the
effects of TCDD in activated CH12.LX and activated IM-9 cells. However, since the
human hs1,2 reporters still demonstrated TCDD-induced activation in IM-9 cells as well
as in unstimulated mouse CH12.LX cell, these results are significant because they
support the applicability of TCDD mechanistic studies of the 3’IgHRR in mouse cell
lines to human application.
BSAP negatively regulates the 1A+BSAP reporter in IM-9 cells treated with
TCDD
As previously stated, the mouse and human hs1,2 enhancers share a 90%
homology (Mills et al., 1997). However the mouse and human hs1,2 enhancers have a
divergence in transcriptional regulation in which the mouse hs1,2 enhancer is inhibited

76
by TCDD-induced and LPS co-treated CH12.LX cells, whereas the human hs1,2
enhancer is activated. In the study above we determined that this divergence is not due to
differences in cellular models as TCDD activated the human hs1,2 enhancer in both
mouse CH12.LX cells and human IM-9 cells. Therefore, we hypothesized that minor
sequence differences could be causing the divergence in transcriptional regulation. We
utilized the 1A+BSAP reporter, which is the 1A reporter (which has no BSAP site)
with an added BSAP sequence identical to the high affinity BSAP sequence of the mouse
hs1,2 enhancer, in order to explore whether the high affinity BSAP site of the mouse
hs1,2 enhancer is the repressive factor causing the divergence in transcriptional
regulation of the mouse versus human hs1,2 enhancers. We found that the added BSAP
site to the 1A reporter lowered TCDD-induced activation compared to the wild type
1A reporter, which suggests that BSAP exerts an inhibitory role on the 1A+BSAP
reporter. These results provide supportive evidence that BSAP may, in part, be
contributing to the TCDD-induced inhibition of the mouse hs1,2 enhancer (contains a
BSAP site) in LPS-activated CH12.LX B cells as opposed to the TCDD-induced
activation of the human hs1,2 enhancer (no BSAP site). This hypothesis is also supported
by preliminary studies in our lab in which the 1A+BSAP enhancer compared to the
1A reporter demonstrates a significant decrease in total activity in the mouse CH12.LX
cells (Ochs et al., unpublished data). BSAP inhibition could have occurred through the
recruitment of Groucho family proteins, which are co-repressive proteins reported to
localize with BSAP and repress gene transcription (reviewed by Fisher and Caudy, 1998;
Parkhurst, 1998). Additionally, BSAP could have competed for recruitment of general
transcription factors (TBP and TFIIF), which AhR has also been shown to recruit

77
(Rowlands et al., 1996). Interestingly, the total activation of the human hs1,2 enhancer
was not completely ablated by the addition of the BSAP site in either cell line. This
finding may have been due to the collective activation by NFκB, AP-1, and Oct that we
found in our previous site directed mutational studies on the human hs1,2 reporter in LPS
and TCDD co-treated CH12.LX cells (Fernando et al., manuscript in preparation).
Notably in our earlier studies we also found that the DRE exerts a slightly inhibitory
effect (Fernando et al., manuscript in preparation) on the human hs1,2 reporter.
Importantly, inhibition of the mouse hs1,2 enhancer may have been due to additional
factors besides the high affinity BSAP site we added to the 1A reporter. For instance, a
second low affinity BSAP site is located on the mouse hs1,2 enhancer (Singh and
Birshtein, 1993; Mills et al., 1997), and full repression of basal activity of the hs1,2
enhancer has been reported to be seen only when both BSAP sites are occupied (Singh
and Birshtein, 1996). In addition, an NFP site, an ETS-like family motif and positive
regulator of the mouse hs1,2 enhancer, is located adjacent to a BSAP site of the mouse
hs1,2 enhancer (Neurath et al., 1995). NFP has demonstrated reciprocal binding with
the high affinity BSAP site. More specifically, in mature B cells, binding of the BSAP
site of the mouse hs1,2 enhancer blocks the NFP site and, therefore, inhibits the basal
activity of the mouse hs1,2 enhancer (Neurath et al., 1995). On the other hand, in plasma
cells, where BSAP is not expressed, binding to NFP is not blocked which increases the
activity of the mouse hs1,2 enhancer resulting in increased mRNA transcripts (Neurath et
al., 1995). However, while this may explain a possible mechanism of the BSAP-mediated
repression of the mouse hs1,2 enhancer, it does not explain the BSAP-mediated
repression we saw of the human 1A+BSAP reporter, as the human hs1,2 enhancer does

78
not contain a NFP site. Although the mechanism behind the inhibition of the mouse
hs1,2 enhancer remains unclear, our data strongly supports the theory that BSAP is a
primary mediator behind the transcriptional divergence between the mouse and human
hs1,2 enhancers.

79
CONCLUSION
Our results support the use of the IM-9 cell line as a model for mechanistic
studies on the effects of TCDD on the human 3’IgHRR, as evidenced by AhR expression
and TCDD-mediated induction of the CYP1A1 gene. Our IM-9 cells demonstrated a
different phenotype then previously reported in that they expressed only low levels of
IgG. Moreover IM-9 cells were not activated by CpG, through TLR9, or R848, through
TLR7. However, since increased AhR expression may result in increased B cell
sensitivity to TCDD and activation of the AhR pathway, in our in future studies we may
attempt to activate IM-9 cells with multiple T-independent and dependant agonist, such
as a TLR agonist in addition to CD40L, anti-IgG, and/or stimulatory cytokines. Although
our IM-9 cells only secrete low levels of IgG, they still have the necessary cellular
machinery to facilitate TCDD-induced expression of the human polymorphic hs1,2
enhancer. Moreover we found that the human hs1,2 reporter showed significantly higher
basal activation in the human IM-9 cell line than in the mouse CH12.LX cell line. Yet,
TCDD induced a greater fold activation of the human hs1,2 reporter in the mouse
CH12.LX cell line versus the human IM-9 cell line. Notably, the 1B reporter
demonstrated the greatest TCDD-induced activation in both cell lines. This finding is
relevant to human health in that immune deregulation of the 1B allele of the human
hs1,2 enhancer has been associated with several human autoimmune diseases and TCDD-
induced modulation of the 1B allele via the AhR pathway could be one mechanism in

80
the etiology of the reported diseases. Regardless of the differences in level of basal and
TCDD-induced activity, our findings of TCDD-induced activation of the human hs1,2
reporter in both IM-9 and CH12.LX cell lines support the use of the human IM-9 cell line
for mechanistic studies of TCDD-induced effects of the human hs1,2 enhancer. One
future study that could further validate this conclusion would be to transfect the mouse
hs1,2 reporter into human IM-9 cells in order to compare the trend in TCDD-induced
effects to our previous observations in the mouse CH12.LX cell line. In addition to
demonstrating the similarities and differences in the activity of the human hs1,2 reporter
transfected into IM-9 and CH12.LX cell lines, we demonstrated that the BSAP site in the
mouse hs1,2 enhancer may be contributing to the inhibitory effect of TCDD on the
mouse versus human hs1,2 reporter. This theory is supported by the decrease in TCDD-
induced activation of the 1A allele of the human hs1,2 enhancer with the addition of a
BSAP binding site. To study this further we could explore the effects of deleting the high
affinity BSAP site from the mouse hs1,2 reporter and transfect this mutated reporter into
the mouse CH12.LX cell line. In conclusion, our results that TCDD modulates the
activity of the human hs1,2 enhancer in the human IM-9 cell line are highly relevant due
to the fact that TCDD is environmentally persistent, and the reports that the AhR pathway
is activated by several exogenous and endogenous chemicals and pharmaceuticals in
addition to TCDD (Hensler et al., 2009; Flaveny et al., 2009), thus warranting continued
study on the impact of TCDD on the human 3’IgHRR in the human IM-9 cell line.

81
LITERATURE CITED
Allan, L. L., & Sherr, D. H. (2005). Constitutive activation and environmental chemical induction of the
aryl hydrocarbon receptor/transcription factor in activated human B lymphocytes. Molecular
Pharmacology, 67(5), 1740-1750. doi:10.1124/mol.104.009100
Alt, F. W., Rathbun, G., Oltz, E., Taccioli, G., & Shinkai, Y. (1992). Function and control of
recombination-activating gene activity. Annals of the New York Academy of Sciences, 651, 277-294.
Aupetit, C., Drouet, M., Pinaud, E., Denizot, Y., Aldigier, J. C., Bridoux, F., & Cogne, M. (2000). Alleles
of the alpha1 immunoglobulin gene 3' enhancer control evolution of IgA nephropathy toward renal
failure. Kidney International, 58(3), 966-971. doi:10.1046/j.1523-1755.2000.00253.x
Bauer, S., Kirschning, C. J., Hacker, H., Redecke, V., Hausmann, S., Akira, S., Wagner, H., & Lipford, G.
B. (2001). Human TLR9 confers responsiveness to bacterial DNA via species-specific CpG motif
recognition. Proceedings of the National Academy of Sciences of the United States of America,
98(16), 9237-9242. doi:10.1073/pnas.161293498
Beischlag, T. V., & Perdew, G. H. (2005). ER alpha-AHR-ARNT protein-protein interactions mediate
estradiol-dependent transrepression of dioxin-inducible gene transcription. The Journal of Biological
Chemistry, 280(22), 21607-21611. doi:10.1074/jbc.C500090200
Birshtein, B. K., Chen, C., Saleque, S., Michaelson, J. S., Singh, M., & Little, R. D. (1997). Murine and
human 3'IgH regulatory sequences. Current Topics in Microbiology and Immunology, 224, 73-80.
Bishop, G. A., & Haughton, G. (1986). Use of the CH lymphomas as models of murine B cell
differentiation. Immunologic Research, 5(4), 263-270.
Bishop, G. A., Ramirez, L. M., Baccam, M., Busch, L. K., Pederson, L. K., & Tomai, M. A. (2001). The
immune response modifier resiquimod mimics CD40-induced B cell activation. Cellular Immunology,
208(1), 9-17. doi:10.1006/cimm.2001.1769

82
Bock, K. W., & Kohle, C. (2006). Ah receptor: Dioxin-mediated toxic responses as hints to deregulated
physiologic functions. Biochemical Pharmacology, 72(4), 393-404. doi:10.1016/j.bcp.2006.01.017
Borlak, J., & Jenke, H. S. (2008). Cross-talk between aryl hydrocarbon receptor and mitogen-activated
protein kinase signaling pathway in liver cancer through c-raf transcriptional regulation. Molecular
Cancer Research : MCR, 6(8), 1326-1336. doi:10.1158/1541-7786.MCR-08-0042
Bottaro, A., Young, F., Chen, J., Serwe, M., Sablitzky, F., & Alt, F. W. (1998). Deletion of the IgH intronic
enhancer and associated matrix-attachment regions decreases, but does not abolish, class switching at
the mu locus. International Immunology, 10(6), 799-806.
Brekke, K. M., & Garrard, W. T. (2004). Assembly and analysis of the mouse immunoglobulin kappa gene
sequence. Immunogenetics, 56(7), 490-505. doi:10.1007/s00251-004-0659-0
Carlson, D. B., & Perdew, G. H. (2002). A dynamic role for the ah receptor in cell signaling? insights from
a diverse group of ah receptor interacting proteins. Journal of Biochemical and Molecular
Toxicology, 16(6), 317-325. doi:10.1002/jbt.10051
Carver, L. A., & Bradfield, C. A. (1997). Ligand-dependent interaction of the aryl hydrocarbon receptor
with a novel immunophilin homolog in vivo. The Journal of Biological Chemistry, 272(17), 11452-
11456.
Chauveau, C., & Cogne, M. (1996). Palindromic structure of the IgH 3'locus control region. Nature
Genetics, 14(1), 15-16. doi:10.1038/ng0996-15
Chauveau, C., Pinaud, E., & Cogne, M. (1998). Synergies between regulatory elements of the
immunoglobulin heavy chain locus and its palindromic 3' locus control region. European Journal of
Immunology, 28(10), 3048-3056.
Chen, C., & Birshtein, B. K. (1997). Virtually identical enhancers containing a segment of homology to
murine 3'IgH-E(hs1,2) lie downstream of human ig C alpha 1 and C alpha 2 genes. Journal of
Immunology (Baltimore, Md.: 1950), 159(3), 1310-1318.
Cianci, R., Giambra, V., Mattioli, C., Esposito, M., Cammarota, G., Scibilia, G., Magazzu, G., Orlando, A.,
Sandri, G., Bianchi, L., Gasbarrini, G. B., Pandolfi, F., & Frezza, D. (2008). Increased frequency of ig
heavy-chain HS1,2-A enhancer *2 allele in dermatitis herpetiformis, plaque psoriasis, and psoriatic
arthritis. The Journal of Investigative Dermatology, 128(8), 1920-1924. doi:10.1038/jid.2008.40

83
Cogne, M., Lansford, R., Bottaro, A., Zhang, J., Gorman, J., Young, F., Cheng, H. L., & Alt, F. W. (1994).
A class switch control region at the 3' end of the immunoglobulin heavy chain locus. Cell, 77(5), 737-
747.
Connor, K. T., & Aylward, L. L. (2006). Human response to dioxin: Aryl hydrocarbon receptor (AhR)
molecular structure, function, and dose-response data for enzyme induction indicate an impaired
human AhR. Journal of Toxicology and Environmental Health.Part B, Critical Reviews, 9(2), 147-
171. doi:10.1080/15287390500196487
Cox, M. B., & Miller, C. A.,3rd. (2003). Pharmacological and genetic analysis of 90-kDa heat shock
isoprotein-aryl hydrocarbon receptor complexes. Molecular Pharmacology, 64(6), 1549-1556.
doi:10.1124/mol.64.6.1549
Crawford, R. B., Holsapple, M. P., & Kaminski, N. E. (1997). Leukocyte activation induces aryl
hydrocarbon receptor up-regulation, DNA binding, and increased Cyp1a1 expression in the absence
of exogenous ligand. Molecular Pharmacology, 52(6), 921-927.
Crawford, R. B., Sulentic, C. E., Yoo, B. S., & Kaminski, N. E. (2003). 2,3,7,8-tetrachlorodibenzo-p-dioxin
(TCDD) alters the regulation and posttranslational modification of p27kip1 in lipopolysaccharide-
activated B cells. Toxicological Sciences : An Official Journal of the Society of Toxicology, 75(2),
333-342. doi:10.1093/toxsci/kfg199
Crews, S. T., & Fan, C. M. (1999). Remembrance of things PAS: Regulation of development by bHLH-
PAS proteins. Current Opinion in Genetics & Development, 9(5), 580-587.
Dariavach, P., Williams, G. T., Campbell, K., Pettersson, S., & Neuberger, M. S. (1991). The mouse IgH
3'-enhancer. European Journal of Immunology, 21(6), 1499-1504.
Delogu, A., Schebesta, A., Sun, Q., Aschenbrenner, K., Perlot, T., & Busslinger, M. (2006). Gene
repression by Pax5 in B cells is essential for blood cell homeostasis and is reversed in plasma cells.
Immunity, 24(3), 269-281. doi:10.1016/j.immuni.2006.01.012
Denison, M. S., & Nagy, S. R. (2003). Activation of the aryl hydrocarbon receptor by structurally diverse
exogenous and endogenous chemicals. Annual Review of Pharmacology and Toxicology, 43, 309-
334. doi:10.1146/annurev.pharmtox.43.100901.135828

84
Denizot, Y., Pinaud, E., Aupetit, C., Le Morvan, C., Magnoux, E., Aldigier, J. C., & Cogne, M. (2001).
Polymorphism of the human alpha1 immunoglobulin gene 3' enhancer hs1,2 and its relation to gene
expression. Immunology, 103(1), 35-40.
Dooley, R. K., & Holsapple, M. P. (1988). Elucidation of cellular targets responsible for
tetrachlorodibenzo-p-dioxin (TCDD)-induced suppression of antibody responses: I. the role of the B
lymphocyte. Immunopharmacology, 16(3), 167-180.
Ema, M., Ohe, N., Suzuki, M., Mimura, J., Sogawa, K., Ikawa, S., & Fujii-Kuriyama, Y. (1994). Dioxin
binding activities of polymorphic forms of mouse and human arylhydrocarbon receptors. The Journal
of Biological Chemistry, 269(44), 27337-27343.
Ema, M., Sogawa, K., Watanabe, N., Chujoh, Y., Matsushita, N., Gotoh, O., Funae, Y., & Fujii-Kuriyama,
Y. (1992). cDNA cloning and structure of mouse putative ah receptor. Biochemical and Biophysical
Research Communications, 184(1), 246-253.
Fahey, J. L., Buell, D. N., & Sox, H. C. (1971). Proliferation and differentiation of lymphoid cells: Studies
with human lymphoid cell lines and immunoglobulin synthesis. Annals of the New York Academy of
Sciences, 190, 221-234.
Fiedler, H. (1996). Sources of PCDD/PCDF and impact on the environment. Chemosphere, 32(1), 55-64.
Fiedler, H. (2006). Origin, structure and distribution of dioxins. [Entstehung, Struktur und Verbreitung von
Dioxinen] DTW.Deutsche Tierarztliche Wochenschrift, 113(8), 304-307.
Fisher, A. L., & Caudy, M. (1998). Groucho proteins: Transcriptional corepressors for specific subsets of
DNA-binding transcription factors in vertebrates and invertebrates. Genes & Development, 12(13),
1931-1940.
Frezza, D., Giambra, V., Cianci, R., Fruscalzo, A., Giufre, M., Cammarota, G., Martinez-Labarga, C.,
Rickards, O., Scibilia, G., Sferlazzas, C., Bartolozzi, F., Starnino, S., Magazzu, G., Gasbarrini, G. B.,
& Pandolfi, F. (2004). Increased frequency of the immunoglobulin enhancer HS1,2 allele 2 in coeliac
disease. Scandinavian Journal of Gastroenterology, 39(11), 1083-1087.
doi:10.1080/00365520410007999
Frezza, D., Giambra, V., Mattioli, C., Piccoli, K., Massoud, R., Siracusano, A., Di Giannantonio, M.,
Birshtein, B. K., & Rubino, I. A. (2009). Allelic frequencies of 3' ig heavy chain locus enhancer

85
HS1,2-A associated with ig levels in patients with schizophrenia. International Journal of
Immunopathology and Pharmacology, 22(1), 115-123.
Frezza, D., Giambra, V., Tolusso, B., De Santis, M., Bosello, S., Vettori, S., Triolo, G., Valentini, G., &
Ferraccioli, G. (2007). Polymorphism of immunoglobulin enhancer element HS1,2A: Allele *2
associates with systemic sclerosis. comparison with HLA-DR and DQ allele frequency. Annals of the
Rheumatic Diseases, 66(9), 1210-1215. doi:10.1136/ard.2006.066597
Fujii-Kuriyama, Y., Ema, M., Mimura, J., & Sogawa, K. (1994). Ah receptor: A novel ligand-activated
transcription factor. Experimental and Clinical Immunogenetics, 11(2-3), 65-74.
Geusau, A., Abraham, K., Geissler, K., Sator, M. O., Stingl, G., & Tschachler, E. (2001). Severe 2,3,7,8-
tetrachlorodibenzo-p-dioxin (TCDD) intoxication: Clinical and laboratory effects. Environmental
Health Perspectives, 109(8), 865-869.
Giambra, V., Martinez-Labarga, C., Giufre, M., Modiano, D., Simpore, J., Gisladottir, B. K., Francavilla,
R., Zhelezova, G., Kilic, S. S., Crawford, M., Biondi, G., Rickards, O., & Frezza, D. (2006).
Immunoglobulin enhancer HS1,2 polymorphism: A new powerful anthropogenetic marker. Annals of
Human Genetics, 70(Pt 6), 946-950. doi:10.1111/j.1469-1809.2006.00273.x
Giannini, S. L., Singh, M., Calvo, C. F., Ding, G., & Birshtein, B. K. (1993). DNA regions flanking the
mouse ig 3' alpha enhancer are differentially methylated and DNAase I hypersensitive during B cell
differentiation. Journal of Immunology (Baltimore, Md.: 1950), 150(5), 1772-1780.
Giri, V. N., Cassidy, A. E., Beebe-Dimmer, J., Ellis, L. R., Smith, D. C., Bock, C. H., & Cooney, K. A.
(2004). Association between agent orange and prostate cancer: A pilot case-control study. Urology,
63(4), 757-60; discussion 760-1. doi:10.1016/j.urology.2003.11.044
Guglielmi, L., Truffinet, V., Magnoux, E., Cogne, M., & Denizot, Y. (2004). The polymorphism of the
locus control region lying downstream the human IgH locus is restricted to hs1,2 but not to hs3 and
hs4 enhancers. Immunology Letters, 94(1-2), 77-81. doi:10.1016/j.imlet.2004.04.003
Hankinson, O. (1995). The aryl hydrocarbon receptor complex. Annual Review of Pharmacology and
Toxicology, 35, 307-340. doi:10.1146/annurev.pa.35.040195.001515
Hankinson, O. (2005). Role of coactivators in transcriptional activation by the aryl hydrocarbon receptor.
Archives of Biochemistry and Biophysics, 433(2), 379-386. doi:10.1016/j.abb.2004.09.031

86
Harper, P. A., Golas, C. L., & Okey, A. B. (1988). Characterization of the ah receptor and aryl hydrocarbon
hydroxylase induction by 2,3,7,8-tetrachlorodibenzo-p-dioxin and benz(a)anthracene in the human
A431 squamous cell carcinoma line. Cancer Research, 48(9), 2388-2395.
Henseler, R. A., Romer, E. J., & Sulentic, C. E. (2009). Diverse chemicals including aryl hydrocarbon
receptor ligands modulate transcriptional activity of the 3'immunoglobulin heavy chain regulatory
region. Toxicology, 261(1-2), 9-18. doi:10.1016/j.tox.2009.03.015
Hirano, F., Tanaka, H., Hirano, Y., Hiramoto, M., Handa, H., Makino, I., & Scheidereit, C. (1998).
Functional interference of Sp1 and NF-kappaB through the same DNA binding site. Molecular and
Cellular Biology, 18(3), 1266-1274.
Hobbs, M. V., Houghten, R. A., Janda, J. A., Weigle, W. O., & Morgan, E. L. (1989). Induction of human
B cell differentiation by fc region activators. I. identification of an active tetrapeptide. Clinical
Immunology and Immunopathology, 50(2), 251-263.
Hobbs, M. V., Morgan, E. L., Houghten, R. A., Thoman, M. L., & Weigle, W. O. (1987). Identification of a
lymphocyte-activating pentapeptide sequence in the fc region of human IgG1. Journal of Immunology
(Baltimore, Md.: 1950), 138(8), 2581-2586.
Hoffer, A., Chang, C. Y., & Puga, A. (1996). Dioxin induces transcription of fos and jun genes by ah
receptor-dependent and -independent pathways. Toxicology and Applied Pharmacology, 141(1), 238-
247. doi:10.1006/taap.1996.0280
Hoffman, E. C., Reyes, H., Chu, F. F., Sander, F., Conley, L. H., Brooks, B. A., & Hankinson, O. (1991).
Cloning of a factor required for activity of the ah (dioxin) receptor. Science (New York, N.Y.),
252(5008), 954-958.
Hogenesch, J. B., Chan, W. K., Jackiw, V. H., Brown, R. C., Gu, Y. Z., Pray-Grant, M., Perdew, G. H., &
Bradfield, C. A. (1997). Characterization of a subset of the basic-helix-loop-helix-PAS superfamily
that interacts with components of the dioxin signaling pathway. The Journal of Biological Chemistry,
272(13), 8581-8593.
Hord, N. G., & Perdew, G. H. (1994). Physicochemical and immunocytochemical analysis of the aryl
hydrocarbon receptor nuclear translocator: Characterization of two monoclonal antibodies to the aryl
hydrocarbon receptor nuclear translocator. Molecular Pharmacology, 46(4), 618-626.

87
Ito, T., Tsukumo, S., Suzuki, N., Motohashi, H., Yamamoto, M., Fujii-Kuriyama, Y., Mimura, J., Lin, T.
M., Peterson, R. E., Tohyama, C., & Nohara, K. (2004). A constitutively active arylhydrocarbon
receptor induces growth inhibition of jurkat T cells through changes in the expression of genes related
to apoptosis and cell cycle arrest. The Journal of Biological Chemistry, 279(24), 25204-25210.
doi:10.1074/jbc.M402143200
Ju, Z., Volpi, S. A., Hassan, R., Martinez, N., Giannini, S. L., Gold, T., & Birshtein, B. K. (2007). Evidence
for physical interaction between the immunoglobulin heavy chain variable region and the 3'
regulatory region. The Journal of Biological Chemistry, 282(48), 35169-35178.
doi:10.1074/jbc.M705719200
Kanda, K., Hu, H. M., Zhang, L., Grandchamps, J., & Boxer, L. M. (2000). NF-kappa B activity is required
for the deregulation of c-myc expression by the immunoglobulin heavy chain enhancer. The Journal
of Biological Chemistry, 275(41), 32338-32346. doi:10.1074/jbc.M004148200
Karras, J. G., & Holsapple, M. P. (1994). Inhibition of calcium-dependent B cell activation by 2,3,7,8-
tetrachlorodibenzo-p-dioxin. Toxicology and Applied Pharmacology, 125(2), 264-270.
doi:10.1006/taap.1994.1072
Kim, H. A., Kim, E. M., Park, Y. C., Yu, J. Y., Hong, S. K., Jeon, S. H., Park, K. L., Hur, S. J., & Heo, Y.
(2003). Immunotoxicological effects of agent orange exposure to the vietnam war korean veterans.
Industrial Health, 41(3), 158-166.
Kim, J. H., & Stallcup, M. R. (2004). Role of the coiled-coil coactivator (CoCoA) in aryl hydrocarbon
receptor-mediated transcription. The Journal of Biological Chemistry, 279(48), 49842-49848.
doi:10.1074/jbc.M408535200
Kim, J. S., Lim, H. S., Cho, S. I., Cheong, H. K., & Lim, M. K. (2003). Impact of agent orange exposure
among korean vietnam veterans. Industrial Health, 41(3), 149-157.
Kishida, M., Imamura, K., Takenaka, N., Maeda, Y., Viet, P. H., Kondo, A., & Bandow, H. (2010).
Characteristics of the abundance of polychlorinated dibenzo-p-dioxin and dibenzofurans, and dioxin-
like polychlorinated biphenyls in sediment samples from selected asian regions in can gio, southern
vietnam and osaka, japan. Chemosphere, 78(2), 127-133. doi:10.1016/j.chemosphere.2009.10.003

88
Klein, S., Sablitzky, F., & Radbruch, A. (1984). Deletion of the IgH enhancer does not reduce
immunoglobulin heavy chain production of a hybridoma IgD class switch variant. The EMBO
Journal, 3(11), 2473-2476.
Lanzavecchia, A., & Sallusto, F. (2009). Human B cell memory. Current Opinion in Immunology, 21(3),
298-304. doi:10.1016/j.coi.2009.05.019
Lesca, P., Witkamp, R., Maurel, P., & Galtier, P. (1994). The pig as a model for studying AH receptor and
other PAH-binding proteins in man. Biochemical and Biophysical Research Communications, 200(1),
475-481. doi:10.1006/bbrc.1994.1473
Lieberson, R., Giannini, S. L., Birshtein, B. K., & Eckhardt, L. A. (1991). An enhancer at the 3' end of the
mouse immunoglobulin heavy chain locus. Nucleic Acids Research, 19(4), 933-937.
Lin, K. I., Angelin-Duclos, C., Kuo, T. C., & Calame, K. (2002). Blimp-1-dependent repression of pax-5 is
required for differentiation of B cells to immunoglobulin M-secreting plasma cells. Molecular and
Cellular Biology, 22(13), 4771-4780.
Liu, C., Goshu, E., Wells, A., & Fan, C. M. (2003). Identification of the downstream targets of SIM1 and
ARNT2, a pair of transcription factors essential for neuroendocrine cell differentiation. The Journal
of Biological Chemistry, 278(45), 44857-44867. doi:10.1074/jbc.M304489200
Lorenzen, A., & Okey, A. B. (1991). Detection and characterization of ah receptor in tissue and cells from
human tonsils. Toxicology and Applied Pharmacology, 107(2), 203-214.
Ma, C., Marlowe, J. L., & Puga, A. (2009). The aryl hydrocarbon receptor at the crossroads of multiple
signaling pathways. EXS, 99, 231-257.
Ma, Q. (2001). Induction of CYP1A1. the AhR/DRE paradigm: Transcription, receptor regulation, and
expanding biological roles. Current Drug Metabolism, 2(2), 149-164.
Ma, Q., & Whitlock, J. P.,Jr. (1997). A novel cytoplasmic protein that interacts with the ah receptor,
contains tetratricopeptide repeat motifs, and augments the transcriptional response to 2,3,7,8-
tetrachlorodibenzo-p-dioxin. The Journal of Biological Chemistry, 272(14), 8878-8884.
Madisen, L., & Groudine, M. (1994). Identification of a locus control region in the immunoglobulin heavy-
chain locus that deregulates c-myc expression in plasmacytoma and burkitt's lymphoma cells. Genes
& Development, 8(18), 2212-2226.

89
Mandal, P. K. (2005). Dioxin: A review of its environmental effects and its aryl hydrocarbon receptor
biology. Journal of Comparative Physiology.B, Biochemical, Systemic, and Environmental
Physiology, 175(4), 221-230. doi:10.1007/s00360-005-0483-3
Marcus, R. S., Holsapple, M. P., & Kaminski, N. E. (1998). Lipopolysaccharide activation of murine
splenocytes and splenic B cells increased the expression of aryl hydrocarbon receptor and aryl
hydrocarbon receptor nuclear translocator. The Journal of Pharmacology and Experimental
Therapeutics, 287(3), 1113-1118.
Marlowe, J. L., & Puga, A. (2005). Aryl hydrocarbon receptor, cell cycle regulation, toxicity, and
tumorigenesis. Journal of Cellular Biochemistry, 96(6), 1174-1184. doi:10.1002/jcb.20656
Masten, S. A., & Shiverick, K. T. (1995). The ah receptor recognizes DNA binding sites for the B cell
transcription factor, BSAP: A possible mechanism for dioxin-mediated alteration of CD19 gene
expression in human B lymphocytes. Biochemical and Biophysical Research Communications,
212(1), 27-34. doi:10.1006/bbrc.1995.1931
Masten, S. A., & Shiverick, K. T. (1996). Characterization of the aryl hydrocarbon receptor complex in
human B lymphocytes: Evidence for a distinct nuclear DNA-binding form. Archives of Biochemistry
and Biophysics, 336(2), 297-308. doi:10.1006/abbi.1996.0561
Matsushita, N., Sogawa, K., Ema, M., Yoshida, A., & Fujii-Kuriyama, Y. (1993). A factor binding to the
xenobiotic responsive element (XRE) of P-4501A1 gene consists of at least two helix-loop-helix
proteins, ah receptor and arnt. The Journal of Biological Chemistry, 268(28), 21002-21006.
Michaelson, J. S., Singh, M., Snapper, C. M., Sha, W. C., Baltimore, D., & Birshtein, B. K. (1996).
Regulation of 3' IgH enhancers by a common set of factors, including kappa B-binding proteins.
Journal of Immunology (Baltimore, Md.: 1950), 156(8), 2828-2839.
Mills, F. C., Harindranath, N., Mitchell, M., & Max, E. E. (1997). Enhancer complexes located downstream
of both human immunoglobulin calpha genes. The Journal of Experimental Medicine, 186(6), 845-
858.
Mora-Lopez, F., Reales, E., Brieva, J. A., & Campos-Caro, A. (2007). Human BSAP and BLIMP1 conform
an autoregulatory feedback loop. Blood, 110(9), 3150-3157. doi:10.1182/blood-2007-05-092262

90
Morris, D. L., Karras, J. G., & Holsapple, M. P. (1993). Direct effects of 2,3,7,8-tetrachlorodibenzo-p-
dioxin (TCDD) on responses to lipopolysaccharide (LPS) by isolated murine B-cells.
Immunopharmacology, 26(2), 105-112.
Neurath, M. F., Max, E. E., & Strober, W. (1995). Pax5 (BSAP) regulates the murine immunoglobulin 3'
alpha enhancer by suppressing binding of NF-alpha P, a protein that controls heavy chain
transcription. Proceedings of the National Academy of Sciences of the United States of America,
92(12), 5336-5340.
Ngo, A. D., Taylor, R., Roberts, C. L., & Nguyen, T. V. (2006). Association between agent orange and
birth defects: Systematic review and meta-analysis. International Journal of Epidemiology, 35(5),
1220-1230. doi:10.1093/ije/dyl038
Nohara, K., Ao, K., Miyamoto, Y., Ito, T., Suzuki, T., Toyoshiba, H., & Tohyama, C. (2006). Comparison
of the 2,3,7,8-tetrachlorodibenzo-p-dioxin (TCDD)-induced CYP1A1 gene expression profile in
lymphocytes from mice, rats, and humans: Most potent induction in humans. Toxicology, 225(2-3),
204-213. doi:10.1016/j.tox.2006.06.005
Nutt, S. L., Eberhard, D., Horcher, M., Rolink, A. G., & Busslinger, M. (2001). Pax5 determines the
identity of B cells from the beginning to the end of B-lymphopoiesis. International Reviews of
Immunology, 20(1), 65-82.
Nutt, S. L., Heavey, B., Rolink, A. G., & Busslinger, M. (1999). Commitment to the B-lymphoid lineage
depends on the transcription factor Pax5. Nature, 401(6753), 556-562. doi:10.1038/44076
Okey, A. B., Giannone, J. V., Smart, W., Wong, J. M., Manchester, D. K., Parker, N. B., Feeley, M. M.,
Grant, D. L., & Gilman, A. (1997). Binding of 2,3,7,8-tetrachlorodibenzo-p-dioxin to AH receptor in
placentas from normal versus abnormal pregnancy outcomes. Chemosphere, 34(5-7), 1535-1547.
Okey, A. B., Riddick, D. S., & Harper, P. A. (1994). The ah receptor: Mediator of the toxicity of 2,3,7,8-
tetrachlorodibenzo-p-dioxin (TCDD) and related compounds. Toxicology Letters, 70(1), 1-22.
Pankratova, E. V., Deyev, I. E., Zhenilo, S. V., & Polanovsky, O. L. (2001). Tissue-specific isoforms of the
ubiquitous transcription factor oct-1. Molecular Genetics and Genomics : MGG, 266(2), 239-245.
Parkhurst, S. M. (1998). Groucho: Making its marx as a transcriptional co-repressor. Trends in Genetics :
TIG, 14(4), 130-132.

91
Parslow, T. G., Blair, D. L., Murphy, W. J., & Granner, D. K. (1984). Structure of the 5' ends of
immunoglobulin genes: A novel conserved sequence. Proceedings of the National Academy of
Sciences of the United States of America, 81(9), 2650-2654.
Perdew, G. H. (1991). Comparison of the nuclear and cytosolic forms of the ah receptor from hepa 1c1c7
cells: Charge heterogeneity and ATP binding properties. Archives of Biochemistry and Biophysics,
291(2), 284-290.
Petrulis, J. R., Kusnadi, A., Ramadoss, P., Hollingshead, B., & Perdew, G. H. (2003). The hsp90 co-
chaperone XAP2 alters importin beta recognition of the bipartite nuclear localization signal of the ah
receptor and represses transcriptional activity. The Journal of Biological Chemistry, 278(4), 2677-
2685. doi:10.1074/jbc.M209331200
Pettersson, S., Cook, G. P., Bruggemann, M., Williams, G. T., & Neuberger, M. S. (1990). A second B
cell-specific enhancer 3' of the immunoglobulin heavy-chain locus. Nature, 344(6262), 165-168.
doi:10.1038/344165a0
Pohjanvirta, R., Viluksela, M., Tuomisto, J. T., Unkila, M., Karasinska, J., Franc, M. A., Holowenko, M.,
Giannone, J. V., Harper, P. A., Tuomisto, J., & Okey, A. B. (1999). Physicochemical differences in
the AH receptors of the most TCDD-susceptible and the most TCDD-resistant rat strains. Toxicology
and Applied Pharmacology, 155(1), 82-95. doi:10.1006/taap.1998.8565
Poland, A., & Knutson, J. C. (1982). 2,3,7,8-tetrachlorodibenzo-P-dioxin and related halogenated aromatic
hydrocarbons: Examination of the mechanism of toxicity. Annual Review of Pharmacology and
Toxicology, 22, 517-554. doi:10.1146/annurev.pa.22.040182.002505
Pridans, C., Holmes, M. L., Polli, M., Wettenhall, J. M., Dakic, A., Corcoran, L. M., Smyth, G. K., & Nutt,
S. L. (2008). Identification of Pax5 target genes in early B cell differentiation. Journal of Immunology
(Baltimore, Md.: 1950), 180(3), 1719-1728.
Probst, M. R., Reisz-Porszasz, S., Agbunag, R. V., Ong, M. S., & Hankinson, O. (1993). Role of the aryl
hydrocarbon receptor nuclear translocator protein in aryl hydrocarbon (dioxin) receptor action.
Molecular Pharmacology, 44(3), 511-518.
Puga, A., Maier, A., & Medvedovic, M. (2000). The transcriptional signature of dioxin in human hepatoma
HepG2 cells. Biochemical Pharmacology, 60(8), 1129-1142.

92
Richard, K., Pierce, S. K., & Song, W. (2008). The agonists of TLR4 and 9 are sufficient to activate
memory B cells to differentiate into plasma cells in vitro but not in vivo. Journal of Immunology
(Baltimore, Md.: 1950), 181(3), 1746-1752.
Rowlands, J. C., McEwan, I. J., & Gustafsson, J. A. (1996). Trans-activation by the human aryl
hydrocarbon receptor and aryl hydrocarbon receptor nuclear translocator proteins: Direct interactions
with basal transcription factors. Molecular Pharmacology, 50(3), 538-548.
Saleque, S., Singh, M., Little, R. D., Giannini, S. L., Michaelson, J. S., & Birshtein, B. K. (1997). Dyad
symmetry within the mouse 3' IgH regulatory region includes two virtually identical enhancers (C
alpha3'E and hs3). Journal of Immunology (Baltimore, Md.: 1950), 158(10), 4780-4787.
Schneider, D., Manzan, M. A., Crawford, R. B., Chen, W., & Kaminski, N. E. (2008). 2,3,7,8-
tetrachlorodibenzo-p-dioxin-mediated impairment of B cell differentiation involves dysregulation of
paired box 5 (Pax5) isoform, Pax5a. The Journal of Pharmacology and Experimental Therapeutics,
326(2), 463-474. doi:10.1124/jpet.108.139857
Serwe, M., & Sablitzky, F. (1993). V(D)J recombination in B cells is impaired but not blocked by targeted
deletion of the immunoglobulin heavy chain intron enhancer. The EMBO Journal, 12(6), 2321-2327.
Shetty, P. V., Bhagwat, B. Y., & Chan, W. K. (2003). P23 enhances the formation of the aryl hydrocarbon
receptor-DNA complex. Biochemical Pharmacology, 65(6), 941-948.
Singh, M., & Birshtein, B. K. (1993). NF-HB (BSAP) is a repressor of the murine immunoglobulin heavy-
chain 3' alpha enhancer at early stages of B-cell differentiation. Molecular and Cellular Biology,
13(6), 3611-3622.
Singh, M., & Birshtein, B. K. (1996). Concerted repression of an immunoglobulin heavy-chain enhancer, 3'
alpha E(hs1,2). Proceedings of the National Academy of Sciences of the United States of America,
93(9), 4392-4397.
Singh, N. P., Nagarkatti, M., & Nagarkatti, P. S. (2007). Role of dioxin response element and nuclear
factor-kappaB motifs in 2,3,7,8-tetrachlorodibenzo-p-dioxin-mediated regulation of fas and fas ligand
expression. Molecular Pharmacology, 71(1), 145-157. doi:10.1124/mol.106.028365

93
Sitia, R., Rubartelli, A., Deambrosis, S., Pozzi, D., & Hammerling, U. (1985). Differentiation in the murine
B cell lymphoma I.29: Inductive capacities of lipopolysaccharide and mycoplasma fermentans
products. European Journal of Immunology, 15(6), 570-575.
Smith, C. I., Baskin, B., Pattersson, E., Hammarstrom, L., & Islam, K. B. (1995). In vivo switching:
Identification of germline transcripts for human IgA. Advances in Experimental Medicine and
Biology, 371A, 9-13.
Sulentic, C. E., Holsapple, M. P., & Kaminski, N. E. (1998). Aryl hydrocarbon receptor-dependent
suppression by 2,3,7, 8-tetrachlorodibenzo-p-dioxin of IgM secretion in activated B cells. Molecular
Pharmacology, 53(4), 623-629.
Sulentic, C. E., Holsapple, M. P., & Kaminski, N. E. (2000). Putative link between transcriptional
regulation of IgM expression by 2,3,7,8-tetrachlorodibenzo-p-dioxin and the aryl hydrocarbon
receptor/dioxin-responsive enhancer signaling pathway. The Journal of Pharmacology and
Experimental Therapeutics, 295(2), 705-716.
Sulentic, C. E., Kang, J. S., Na, Y. J., & Kaminski, N. E. (2004a). Interactions at a dioxin responsive
element (DRE) and an overlapping kappaB site within the hs4 domain of the 3'alpha immunoglobulin
heavy chain enhancer. Toxicology, 200(2-3), 235-246. doi:10.1016/j.tox.2004.03.015
Sulentic, C. E., Zhang, W., Na, Y. J., & Kaminski, N. E. (2004b). 2,3,7,8-tetrachlorodibenzo-p-dioxin, an
exogenous modulator of the 3'alpha immunoglobulin heavy chain enhancer in the CH12.LX mouse
cell line. The Journal of Pharmacology and Experimental Therapeutics, 309(1), 71-78.
doi:10.1124/jpet.103.059493
Sun, Y. V., Boverhof, D. R., Burgoon, L. D., Fielden, M. R., & Zacharewski, T. R. (2004). Comparative
analysis of dioxin response elements in human, mouse and rat genomic sequences. Nucleic Acids
Research, 32(15), 4512-4523. doi:10.1093/nar/gkh782
Swanson, H. I. (2002). DNA binding and protein interactions of the AHR/ARNT heterodimer that facilitate
gene activation. Chemico-Biological Interactions, 141(1-2), 63-76.
Tang, N. J., Liu, J., Coenraads, P. J., Dong, L., Zhao, L. J., Ma, S. W., Chen, X., Zhang, C. M., Ma, X. M.,
Wei, W. G., Zhang, P., & Bai, Z. P. (2008). Expression of AhR, CYP1A1, GSTA1, c-fos and TGF-
94
alpha in skin lesions from dioxin-exposed humans with chloracne. Toxicology Letters, 177(3), 182-
187. doi:10.1016/j.toxlet.2008.01.011
Tian, Y., Ke, S., Denison, M. S., Rabson, A. B., & Gallo, M. A. (1999). Ah receptor and NF-kappaB
interactions, a potential mechanism for dioxin toxicity. The Journal of Biological Chemistry, 274(1),
510-515.
Tijet, N., Boutros, P. C., Moffat, I. D., Okey, A. B., Tuomisto, J., & Pohjanvirta, R. (2006). Aryl
hydrocarbon receptor regulates distinct dioxin-dependent and dioxin-independent gene batteries.
Molecular Pharmacology, 69(1), 140-153. doi:10.1124/mol.105.018705
Tolusso, B., Frezza, D., Mattioli, C., Fedele, A. L., Bosello, S., Faustini, F., Peluso, G., Giambra, V.,
Pietrapertosa, D., Morelli, A., Gremese, E., De Santis, M., & Ferraccioli, G. F. (2009). Allele *2 of
the HS1,2A enhancer of the ig regulatory region associates with rheumatoid arthritis. Annals of the
Rheumatic Diseases, 68(3), 416-419. doi:10.1136/ard.2008.095414
Uphoff, C. C., & Drexler, H. G. (1999). Detection of mycoplasma contaminations in cell cultures by PCR
analysis. Human Cell : Official Journal of Human Cell Research Society, 12(4), 229-236.
Vogel, C. F., Sciullo, E., & Matsumura, F. (2007). Involvement of RelB in aryl hydrocarbon receptor-
mediated induction of chemokines. Biochemical and Biophysical Research Communications, 363(3),
722-726. doi:10.1016/j.bbrc.2007.09.032
Wabl, M. R., & Burrows, P. D. (1984). Expression of immunoglobulin heavy chain at a high level in the
absence of a proposed immunoglobulin enhancer element in cis. Proceedings of the National
Academy of Sciences of the United States of America, 81(8), 2452-2455.
Wen, L. P., Koeiman, N., & Whitlock, J. P.,Jr. (1990). Dioxin-inducible, ah receptor-dependent
transcription in vitro. Proceedings of the National Academy of Sciences of the United States of
America, 87(21), 8545-8549.
Whitlock, J. P.,Jr. (1990). Genetic and molecular aspects of 2,3,7,8-tetrachlorodibenzo-p-dioxin action.
Annual Review of Pharmacology and Toxicology, 30, 251-277.
doi:10.1146/annurev.pa.30.040190.001343
Whitlock, J. P.,Jr. (1999). Induction of cytochrome P4501A1. Annual Review of Pharmacology and
Toxicology, 39, 103-125. doi:10.1146/annurev.pharmtox.39.1.103

95
Yoo, B. S., Boverhof, D. R., Shnaider, D., Crawford, R. B., Zacharewski, T. R., & Kaminski, N. E. (2004).
2,3,7,8-tetrachlorodibenzo-p-dioxin (TCDD) alters the regulation of Pax5 in lipopolysaccharide-
activated B cells. Toxicological Sciences : An Official Journal of the Society of Toxicology, 77(2),
272-279. doi:10.1093/toxsci/kfh013
Young, A. L., Giesy, J. P., Jones, P. D., & Newton, M. (2004). Environmental fate and bioavailability of
agent orange and its associated dioxin during the vietnam war. Environmental Science and Pollution
Research International, 11(6), 359-370.
Zelazowski, P., Carrasco, D., Rosas, F. R., Moorman, M. A., Bravo, R., & Snapper, C. M. (1997). B cells
genetically deficient in the c-rel transactivation domain have selective defects in germline CH
transcription and ig class switching. Journal of Immunology (Baltimore, Md.: 1950), 159(7), 3133-
3139.