cognova technologies 1 evaluating induced models evaluating induced models with daniel l. silver...
TRANSCRIPT
CogNovaTechnologies
1
Evaluating Induced ModelsEvaluating Induced Models
withwith
Daniel L. SilverDaniel L. Silver
Copyright (c), 2004All Rights Reserved
CogNovaTechnologies
2
AgendaAgenda Interpretation and Evaluation PhaseInterpretation and Evaluation Phase Model accuracy (fitness) and Model accuracy (fitness) and
confidenceconfidence Testing the difference between two Testing the difference between two
modelsmodels Testing the difference between two Testing the difference between two
DM methods (e.g. IDT versus ANN)DM methods (e.g. IDT versus ANN)

CogNovaTechnologies
3
The KDD ProcessThe KDD Process
Selection and Preprocessing
Data Mining
Interpretation and Evaluation
Data Consolidation
Knowledge
p(x)=0.02
DataWarehouse
Data Sources
Patterns & Models
Prepared Data
ConsolidatedData
CogNovaTechnologies
4
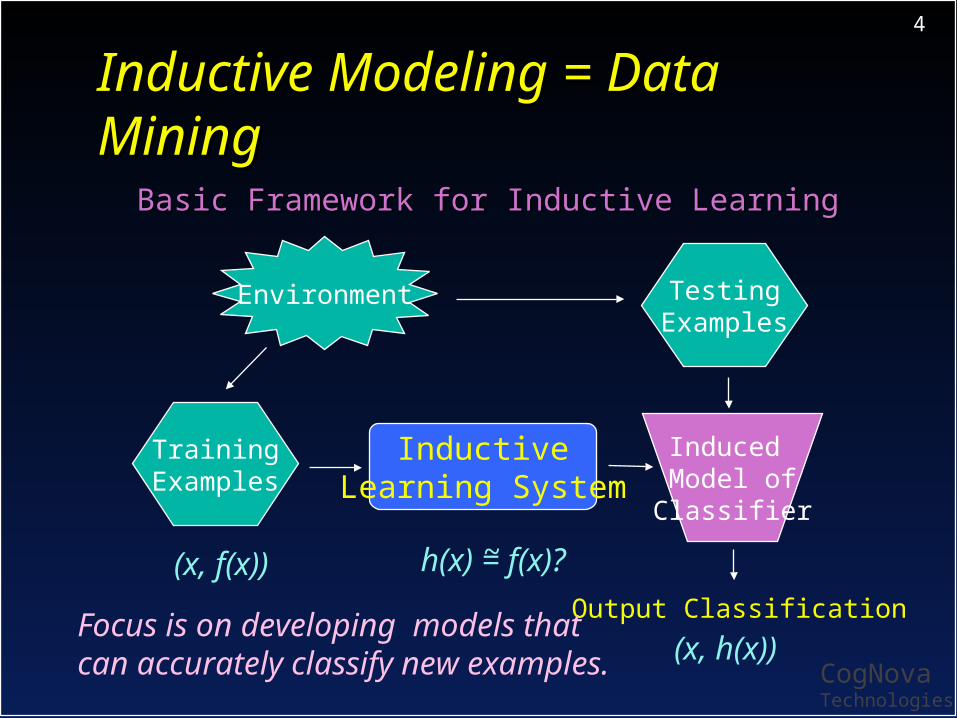
Inductive Modeling = Data Inductive Modeling = Data MiningMiningBasic Framework for Inductive LearningBasic Framework for Inductive Learning
InductiveLearning System
Environment
TrainingExamples
TestingExamples
Induced Model ofClassifier
Output Classification
(x, f(x))
(x, h(x))
h(x) = f(x)?
Focus is on developing models thatcan accurately classify new examples.
~

CogNovaTechnologies
5
Model Accuracy and Model Accuracy and ConfidenceConfidence
Preferably a separate verification set is used to judge fitness or accuracy to judge fitness or accuracy
Statistical confidence in the accuracy of Statistical confidence in the accuracy of a model can be expressed as an intervala model can be expressed as an interval
Mean ErrororErrorRate
h1

CogNovaTechnologies
6
The Normal Curve and The Normal Curve and Confidence IntervalsConfidence Intervals
Consider a class of 30 personsConsider a class of 30 persons True mean (average) mark of 75%True mean (average) mark of 75% How can we estimate this from the How can we estimate this from the
marks of only 10 sample persons?marks of only 10 sample persons? Let’s do an example using ExcelLet’s do an example using Excel
CogNovaTechnologies
7
Model Accuracy and Model Accuracy and ConfidenceConfidence
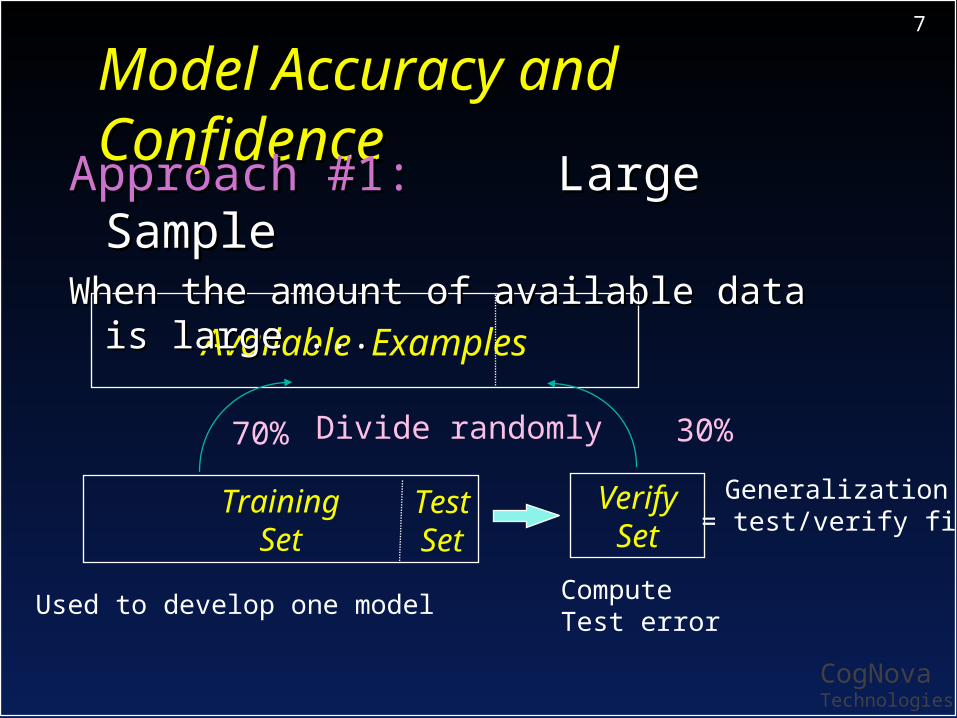
Available Examples
TrainingSet
VerifySet
Approach #1: Approach #1: Large SampleLarge SampleWhen the amount of available data is When the amount of available data is
large ...large ...
70% 30%
Used to develop one modelComputeTest error
Divide randomly
Generalization= test/verify fit
TestSet

CogNovaTechnologies
8
Model Accuracy and Model Accuracy and ConfidenceConfidence
Generalization statistic (fit, error or Generalization statistic (fit, error or accuracy) is provided by the learning accuracy) is provided by the learning systemsystem
Confidence interval must be computed:Confidence interval must be computed:• Continuous target variable - Compute mean Continuous target variable - Compute mean
error over error over nn examples and confidence interval examples and confidence interval using Excel (using Excel (evaluate_models.xls))
• Nominal (binary) target variable - Given an error Nominal (binary) target variable - Given an error rate of rate of PP from a sample of from a sample of nn examples, then the examples, then the 95%conf. interval = 95%conf. interval = 1.96 sqrt(1.96 sqrt(P(1-P)P(1-P)//nn) = 1.96 stdev ) = 1.96 stdev
o PP = number incorrect / = number incorrect / nn
• Strictly speaking this is for n >= 30Strictly speaking this is for n >= 30
CogNovaTechnologies
9
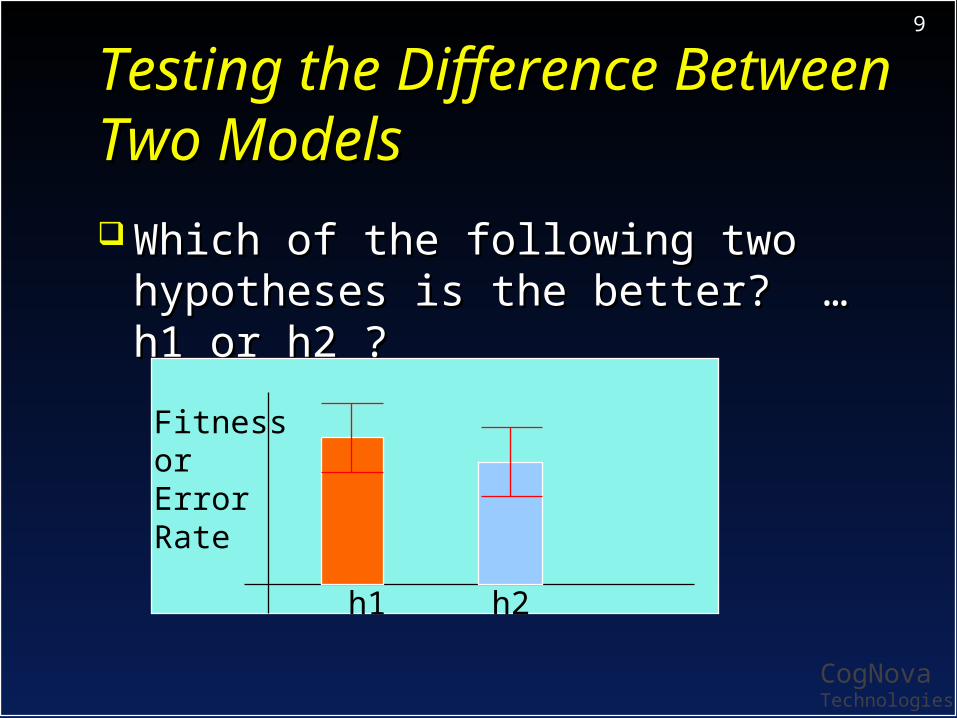
Testing the Difference Testing the Difference Between Two ModelsBetween Two Models Which of the following two Which of the following two
hypotheses is the better? … h1 or hypotheses is the better? … h1 or h2 ?h2 ?
h2 h3
FitnessorErrorRate
h1 h2

CogNovaTechnologies
10
Testing the Difference Testing the Difference Between Two ModelsBetween Two Models Assumption: If some measurable Assumption: If some measurable
characteristic of the models is characteristic of the models is statistically different then we will statistically different then we will consider the models different consider the models different
We will focus on the characteristics: We will focus on the characteristics: mean error, and error rate mean error, and error rate (proportion incorrect) which can be (proportion incorrect) which can be computed from the test resultscomputed from the test results

CogNovaTechnologies
11
Testing the Difference Testing the Difference Between Two ModelsBetween Two Models Continuous target variableContinuous target variable
• Use a Difference of Means Test Use a Difference of Means Test Nominal (binary) target variableNominal (binary) target variable
• Use a Difference of Proportions TestUse a Difference of Proportions Test For 95% confidence in a difference For 95% confidence in a difference
then p-value statistic must be <= then p-value statistic must be <= 0.050.05
(see Excel spreadsheet example)(see Excel spreadsheet example)
CogNovaTechnologies
12
Testing the Difference Testing the Difference Between Two DM MethodsBetween Two DM Methods Cross-Validation must be Cross-Validation must be
performedperformed Requires generating several Requires generating several
models with different train, test models with different train, test and verify setsand verify sets
With WEKA use the accuracy or With WEKA use the accuracy or error rate on the test setserror rate on the test sets

CogNovaTechnologies
13
Network TrainingNetwork Training
Available Examples
TrainingSet
Ver.Set
Approach #2: Approach #2: Cross-validationCross-validationProvides a sense of confidence in Provides a sense of confidence in
model ...model ...
10%90%
Repeat 10 times
Used to develop 10 different models Accumulatetest errors
Generalization determined by meantest fit and stddev
TestSet
CogNovaTechnologies
14
Testing the Difference Testing the Difference Between Two DM MethodsBetween Two DM Methods A Difference of Means T-test can A Difference of Means T-test can
be used to determine a p-value be used to determine a p-value statisticstatistic
For 95% confidence in a difference For 95% confidence in a difference then p-value statistic must be <= then p-value statistic must be <= 0.050.05
(see Excel spreadsheet example)(see Excel spreadsheet example)

CogNovaTechnologies
15
Example: Using Census Example: Using Census DataData Problem:Problem: To identify males given To identify males given
census datacensus data Performance measure:Performance measure:
• Accuracy = Goodness of fitAccuracy = Goodness of fit Model generation:Model generation: IDT and ANNIDT and ANN

CogNovaTechnologies
16
Example: Using Census Example: Using Census DataData Record results:Record results: Goodness of fit stats Goodness of fit stats
on test set for 10 different modelson test set for 10 different models• Mean fitness: ANN= 26.6, IDT = 31.8Mean fitness: ANN= 26.6, IDT = 31.8
Test difference between Test difference between modelsmodels: : Use a difference of means T-test Use a difference of means T-test (see (see evaluate_models.xls))• p-value = 0.00124p-value = 0.00124• Since p-value < 0.05, the two models are Since p-value < 0.05, the two models are
significantly different significantly different