the great recapitalization - federal reserve bank of st. louis
TRANSCRIPT
December 2008
MonetaryTrends
Views expressed do not necessarily reflect official positions of the Federal Reserve System.
On October 14, 2008, the U.S. Treasury announceda voluntary Capital Purchase Program intended toincrease the flow of financing to U.S. businesses
and consumers. Under the program, the Treasury will injectcapital directly into the banking system by purchasingsenior preferred equity shares from certain depositoryfinancial institutions. Historical precedents exist for thesemeasures, including the bolstering of bank capital withU.S. government funds by the Reconstruction FinanceCorporation in the 1930s and the recapitalization of banksby governments in the Nordic countries in the 1990s. Thisnew Treasury recapitalization program is simply the latestpolicy action of its kind, implemented to respond to recentchanges in market perceptions of the risks facing the U.S.banking sector.
During the past several decades, U.S. commercialbanks have diversified, continually moving away fromtheir traditional deposit-taking and lending business intolending that is not financed by deposits or by other bankliabilities. Beginning in the 1970s, securitization permit-ted banks to originate and sell loans, rather than holdingloans on their balance sheets. Banks developed new instru-ments—such as leveraged loans and guarantees on com-mercial paper—that allowed participation in commerciallending without on-balance-sheet intermediation. Thistrend was accelerated, to some extent, by the incentive toavoid new regulations and increased capital requirements.The innovations were widely regarded as effectivelystrengthening the banking system. For example, a 2003analysis observed that “the improvements in risk manage-ment offered by securitization, loan syndication, and hedg-ing via derivatives instruments have helped banks shedunwanted risks.”1
Recent financial turmoil has strained bank balancesheets and called into question previous opinion on howsecuritization would affect bank risk. Many highly lever-
aged loans became unmarketable. Contingent liabilities,such as letters of credit, became burdensome as banks foundthemselves obliged to bring onto their balance sheets thesesecurities whose market prices were substantially below theoriginal values. House price declines called into question thevalue of mortgage-based derivatives, while the governmentconservatorship of Fannie Mae and Freddie Mac, as well asthe Lehman Brothers collapse, meant that banks incurredlosses on their investments in these institutions. The deterio-rating outlook has led financial institutions to become moreconservative in their loan-making policies and more prudentoverall: Banks are rebuilding their capital at the same timethat equity price declines have damaged their capital base.One clear result of the retrenchment of banks and the deteri-oration of balance sheets is the high spread on interest rates oninterbank loans (which have risen) over returns on Treasurysecurities (which have declined).
This contractionary pressure on banks’ balance sheets,furthermore, comes when considerations about stabilizingthe economy justify the expansion of banks’ portfolios at afaster rate. The Treasury’s Capital Purchase Program there-fore can be seen from a macroeconomic perspective as ameans of arresting the contractionary pressure on the economy.Bank equity capital is a bank liability, as are deposits. Bankequity capital is being boosted by the official recapitalizationprogram, and the safety of deposits has been reinforced byrecent legislated increases in deposit insurance. These policymeasures shore up the liabilities side of the bank’s balancesheet and, in so doing, encourage expansion of the asset side.These effects help subdue and reverse pressure for financialand economic contraction.
—Edward Nelson1 Krainer, John and Lopez, Jose A. “The Current Strength of the U.S. BankingSector.” Federal Reserve Bank of San Francisco Economic Letter, Number 2003-37,December 19, 2003, pp. 1-3; www.frbsf.org/publications/economics/letter/2003/el2003-37.html.
The Great Recapitalization
research.stlouisfed.org

Contents
Page
3 Monetary and Financial Indicators at a Glance
4 Monetary Aggregates and Their Components
6 Monetary Aggregates: Monthly Growth
7 Reserves Markets and Short-Term Credit Flows
8 Measures of Expected Inflation
9 Interest Rates
10 Policy-Based Inflation Indicators
11 Implied Forward Rates, Futures Contracts, and Inflation-Indexed Securities
12 Velocity, Gross Domestic Product, and M2
14 Bank Credit
15 Stock Market Index and Foreign Inflation and Interest Rates
16 Reference Tables
18 Definitions, Notes, and Sources
Conventions used in this publication:
1. Unless otherwise indicated, data are monthly.
2. Shaded areas indicate recessions, as determined by the National Bureau of Economic Research.
3. Percent change at an annual rate is the simple, not compounded, monthly percent change multiplied by 12. Forexample, using consecutive months, the percent change at an annual rate in x between month t –1 and the currentmonth t is: [(xt /xt – 1)–1] × 1200. Note that this differs from National Economic Trends. In that publication, monthlypercent changes are compounded and expressed as annual growth rates.
4. The percent change from year ago refers to the percent change from the same period in the previous year. For example,the percent change from year ago in x between month t –12 and the current month t is: [(xt /xt – 12)–1] × 100.
We welcome your comments addressed to:
Editor, Monetary TrendsResearch DivisionFederal Reserve Bank of St. LouisP.O. Box 442St. Louis, MO 63166-0442
or to:
Monetary Trends is published monthly by the Research Division of the Federal Reserve Bank of St. Louis. Visit the Research Division’s website at research.stlouisfed.org/publications/mt todownload the current version of this publication or register for e-mail notification updates. For more information on data in the publication, please visit research.stlouisfed.org/fred2 or call(314) 444-8590.
On March 23, 2006, the Board of Governors of the FederalReserve System ceased the publication of the M3 monetaryaggregate. It also ceased publishing the following components:large-denomination time deposits, RPs, and eurodollars.
Monetary Trendsupdated through11/18/08
3Research DivisionFederal Reserve Bank of St. Louis
2005 2006 2007 2008
Billions of dollars
M2
MZM
M2 and MZM
6300
6600
6900
7200
7500
7800
8100
8400
8700
9000
2005 2006 2007 2008 2009
2005 2006 2007 2008
Percent change at an annual rate
Adjusted Monetary Base
-30
0
30
60
90
120
150
180
210
240
270
300
2005 2006 2007 2008 2009
2005 2006 2007 2008
Percent
Reserve Market Rates
Data available as of October 2008.
0.5
1.5
2.5
3.5
4.5
5.5
6.5
7.5
8.5
2005 2006 2007 2008 2009
Effective Federal Funds RateIntended Federal Funds Rate
Primary Credit Rate
5y 7y 10y 20y
Percent
Treasury Yield Curve
2.00
2.75
3.50
4.25
5.00Week Ending Friday:
11/14/0810/17/0811/16/07
5y 7y 10y 20y
Percent
Real Treasury Yield Curve
0.75
1.50
2.25
3.00
3.75
4.50Week Ending Friday:
11/14/0810/17/0811/16/07
5y 7y 10y 20y
Percent
Inflation-Indexed Treasury Yield Spreads
-1.5
-0.5
0.5
1.5
2.5
3.5Week Ending Friday:
11/14/0810/17/0811/16/07

Monetary Trendsupdated through
11/17/08
4Research Division
Federal Reserve Bank of St. Louis
91 92 93 94 95 96 97 98 99 00 01 02 03 04 05 06 07 08
Percent change from year ago
M2
-5
0
5
10
15
1991 1992 1993 1994 1995 1996 1997 1998 1999 2000 2001 2002 2003 2004 2005 2006 2007 2008 2009
91 92 93 94 95 96 97 98 99 00 01 02 03 04 05 06 07 08
Percent change from year ago
MZM
M1
MZM and M1
-10
-5
0
5
10
15
20
25
1991 1992 1993 1994 1995 1996 1997 1998 1999 2000 2001 2002 2003 2004 2005 2006 2007 2008 2009
91 92 93 94 95 96 97 98 99 00 01 02 03 04 05 06 07 08
Percent change from year ago
M3*
*See table of contents for changes to the series.
-5
0
5
10
15
1991 1992 1993 1994 1995 1996 1997 1998 1999 2000 2001 2002 2003 2004 2005 2006 2007 2008 2009
91 92 93 94 95 96 97 98 99 00 01 02 03 04 05 06 07 08
Percent change from year ago
Monetary Services Index - M2**
**We will not update the MSI series until we revise the code to accomodate the discontinuation of M3.
-5
0
5
10
15
1991 1992 1993 1994 1995 1996 1997 1998 1999 2000 2001 2002 2003 2004 2005 2006 2007 2008 2009
Monetary Trendsupdated through11/17/08
5Research DivisionFederal Reserve Bank of St. Louis
91 92 93 94 95 96 97 98 99 00 01 02 03 04 05 06 07 08
Percent change from year ago
Adjusted Monetary Base
-5
0
5
10
15
20
25
30
35
1991 1992 1993 1994 1995 1996 1997 1998 1999 2000 2001 2002 2003 2004 2005 2006 2007 2008 2009
2001 2002 2003 2004 2005 2006 2007 2008
Percent change from year ago
Total
Federal
Domestic Nonfinancial Debt
-10
-5
0
5
10
15
2001 2002 2003 2004 2005 2006 2007 2008 20092005 2006 2007 2008
Percent change from year ago
Currency Held by the Nonbank Public
0
5
10
15
2005 2006 2007 2008 2009
2005 2006 2007 2008
Percent change from year ago
Large Denomination
Small Denomination
Time Deposits*
*See table of contents for changes to the series.
-5
0
5
10
15
20
25
30
2005 2006 2007 2008 20092005 2006 2007 2008
Percent change from year ago
Checkable
Savings
Checkable and Savings Deposits
-15
-10
-5
0
5
10
15
20
2005 2006 2007 2008 2009
2005 2006 2007 2008
Percent change from year ago
Institutional Funds
Retail Funds
Money Market Mutual Fund Shares
-20
-10
0
10
20
30
40
50
60
2005 2006 2007 2008 20092005 2006 2007 2008
Billions of dollars Billions of dollars
Eurodollars (right)
Repos (left)
Repurchase Agreements and Eurodollars*
*See table of contents for changes to these series.
400
450
500
550
600
300
350
400
450
500
Monetary Trendsupdated through
11/17/08
6Research Division
Federal Reserve Bank of St. Louis
91 92 93 94 95 96 97 98 99 00 01 02 03 04 05 06 07 08
Percent change at an annual rate
M1
*Actual values for September and October 2001 are 55.87 and -38.35 percent rate, respectively.
-60
-40
-20
0
20
40
60
1991 1992 1993 1994 1995 1996 1997 1998 1999 2000 2001 2002 2003 2004 2005 2006 2007 2008 2009
91 92 93 94 95 96 97 98 99 00 01 02 03 04 05 06 07 08
Percent change at an annual rate
MZM
*Actual value for September 2001 is 39.41 percent rate.
-20
-10
0
10
20
30
40
1991 1992 1993 1994 1995 1996 1997 1998 1999 2000 2001 2002 2003 2004 2005 2006 2007 2008 2009
91 92 93 94 95 96 97 98 99 00 01 02 03 04 05 06 07 08
Percent change at an annual rate
M2
*Actual value for September 2001 is 24.90 percent rate.
-10
0
10
20
1991 1992 1993 1994 1995 1996 1997 1998 1999 2000 2001 2002 2003 2004 2005 2006 2007 2008 2009
91 92 93 94 95 96 97 98 99 00 01 02 03 04 05 06 07 08
Percent change at an annual rate
M3*
*See table of contents for changes to the series.
-10
0
10
20
30
1991 1992 1993 1994 1995 1996 1997 1998 1999 2000 2001 2002 2003 2004 2005 2006 2007 2008 2009
Monetary Trendsupdated through11/17/08
7Research DivisionFederal Reserve Bank of St. Louis
91 92 93 94 95 96 97 98 99 00 01 02 03 04 05 06 07 08
Billions of dollars
Adjusted
Required
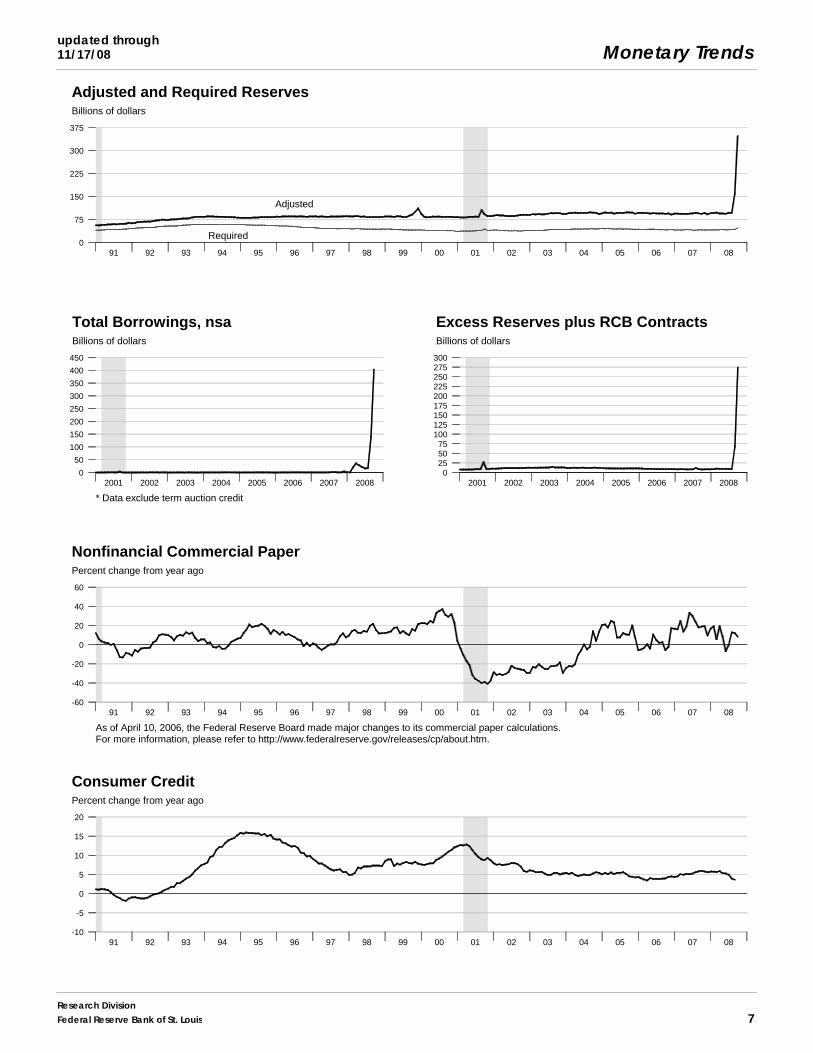
Adjusted and Required Reserves
0
75
150
225
300
375
1991 1992 1993 1994 1995 1996 1997 1998 1999 2000 2001 2002 2003 2004 2005 2006 2007 2008 2009
2001 2002 2003 2004 2005 2006 2007 2008
Billions of dollars
Excess Reserves plus RCB Contracts
0255075
100125150175200225250275300
2001 2002 2003 2004 2005 2006 2007 2008 20092001 2002 2003 2004 2005 2006 2007 2008
Billions of dollars
Total Borrowings, nsa
* Data exclude term auction credit
0
50
100
150
200
250
300
350
400
450
2001 2002 2003 2004 2005 2006 2007 2008 2009
91 92 93 94 95 96 97 98 99 00 01 02 03 04 05 06 07 08
Percent change from year ago
Consumer Credit
-10
-5
0
5
10
15
20
1991 1992 1993 1994 1995 1996 1997 1998 1999 2000 2001 2002 2003 2004 2005 2006 2007 2008 2009
91 92 93 94 95 96 97 98 99 00 01 02 03 04 05 06 07 08
Percent change from year ago
Nonfinancial Commercial Paper
As of April 10, 2006, the Federal Reserve Board made major changes to its commercial paper calculations.For more information, please refer to http://www.federalreserve.gov/releases/cp/about.htm.
-60
-40
-20
0
20
40
60
1991 1992 1993 1994 1995 1996 1997 1998 1999 2000 2001 2002 2003 2004 2005 2006 2007 2008 2009
Monetary Trendsupdated through
11/04/08
8Research Division
Federal Reserve Bank of St. Louis
99 00 01 02 03 04 05 06 07 08
Yield to maturity
10-Year less 3-Month T-Bill
3-Year less 3-Month T-Bill10-Year less 3-Year Note
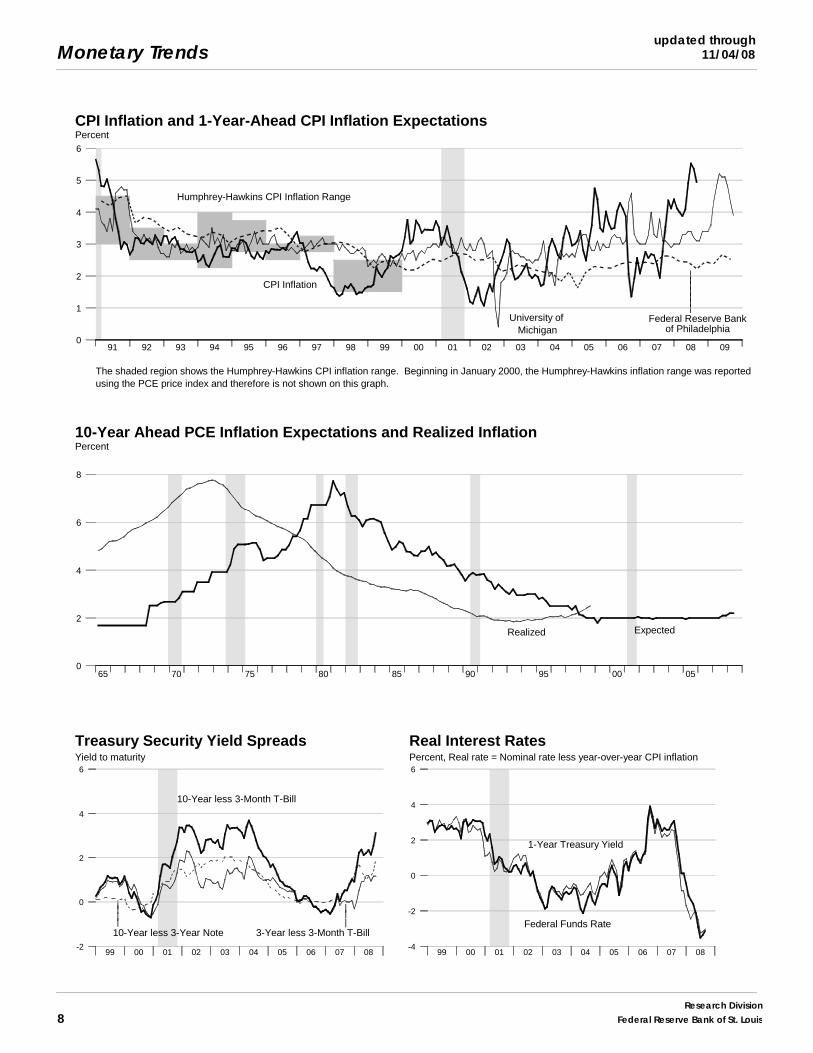
Treasury Security Yield Spreads
||||
|||
-2
0
2
4
6
1999 2000 2001 2002 2003 2004 2005 2006 2007 2008 2009
99 00 01 02 03 04 05 06 07 08
Percent, Real rate = Nominal rate less year-over-year CPI inflation
Federal Funds Rate
1-Year Treasury Yield
Real Interest Rates
-4
-2
0
2
4
6
1999 2000 2001 2002 2003 2004 2005 2006 2007 2008 2009
91 92 93 94 95 96 97 98 99 00 01 02 03 04 05 06 07 08 09
Federal Reserve Bankof Philadelphia
Humphrey-Hawkins CPI Inflation Range
University of Michigan
CPI Inflation
PercentCPI Inflation and 1-Year-Ahead CPI Inflation Expectations
The shaded region shows the Humphrey-Hawkins CPI inflation range. Beginning in January 2000, the Humphrey-Hawkins inflation range was reportedusing the PCE price index and therefore is not shown on this graph.
|||||||
0
1
2
3
4
5
6
65 70 75 80 85 90 95 00 05
10-Year Ahead PCE Inflation Expectations and Realized InflationPercent
Realized Expected
0
2
4
6
8
Monetary Trendsupdated through11/04/08
9Research DivisionFederal Reserve Bank of St. Louis
91 92 93 94 95 96 97 98 99 00 01 02 03 04 05 06 07 08
Percent
3-Month Treasury Yield
90-Day Commercial Paper
Prime Rate
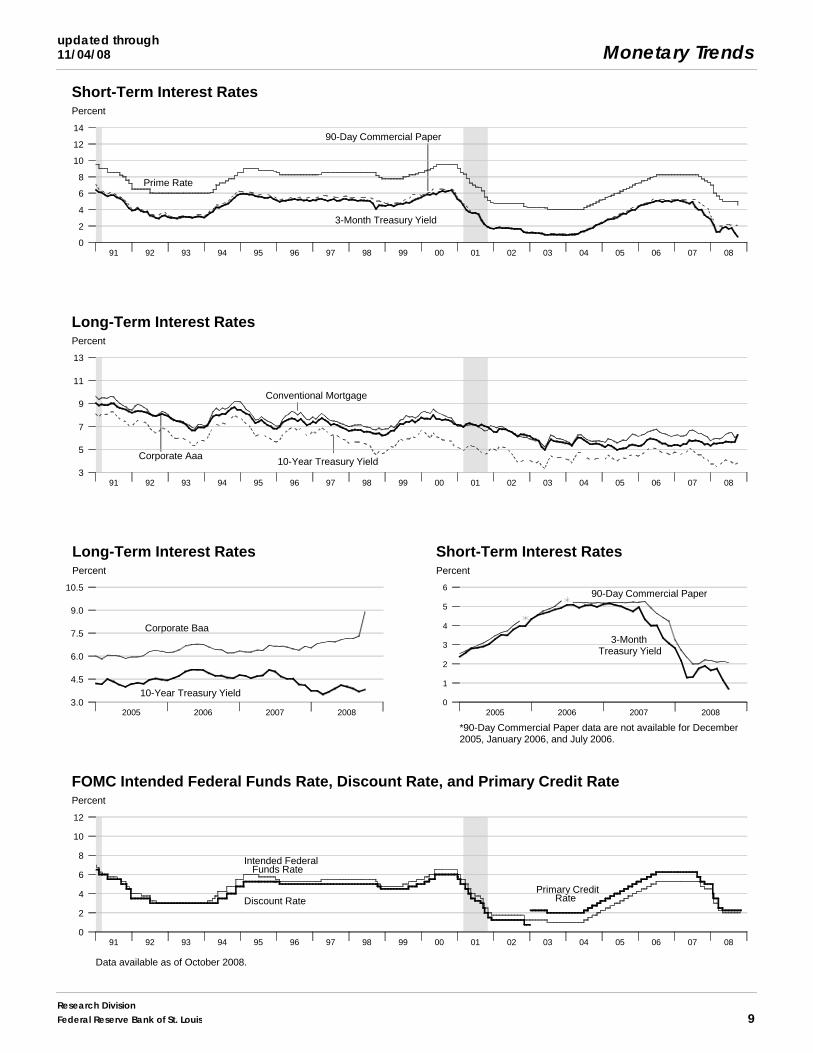
Short-Term Interest Rates
0
2
4
6
8
10
12
14
1991 1992 1993 1994 1995 1996 1997 1998 1999 2000 2001 2002 2003 2004 2005 2006 2007 2008 2009
91 92 93 94 95 96 97 98 99 00 01 02 03 04 05 06 07 08
Percent
Conventional Mortgage
Corporate Aaa10-Year Treasury Yield
Long-Term Interest Rates
3
5
7
9
11
13
1991 1992 1993 1994 1995 1996 1997 1998 1999 2000 2001 2002 2003 2004 2005 2006 2007 2008 2009
91 92 93 94 95 96 97 98 99 00 01 02 03 04 05 06 07 08
Percent
Discount Rate
Intended Federal Funds Rate
Primary Credit Rate
FOMC Intended Federal Funds Rate, Discount Rate, and Primary Credit Rate
Data available as of October 2008.
0
2
4
6
8
10
12
1991 1992 1993 1994 1995 1996 1997 1998 1999 2000 2001 2002 2003 2004 2005 2006 2007 2008 2009
2005 2006 2007 2008
Percent
Corporate Baa
10-Year Treasury Yield
Long-Term Interest Rates
3.0
4.5
6.0
7.5
9.0
10.5
2005 2006 2007 2008 20092005 2006 2007 2008
Percent
90-Day Commercial Paper
3-Month Treasury Yield
*90-Day Commercial Paper data are not available for December2005, January 2006, and July 2006.
Short-Term Interest Rates
0
1
2
3
4
5
6
2005 2006 2007 2008 2009
Monetary Trendsupdated through
11/17/08
10Research Division
Federal Reserve Bank of St. Louis
1999 2000 2001 2002 2003 2004 2005 2006 2007 2008
Percent
Actual
Target Inflation Rates4% 3% 2% 1% 0%
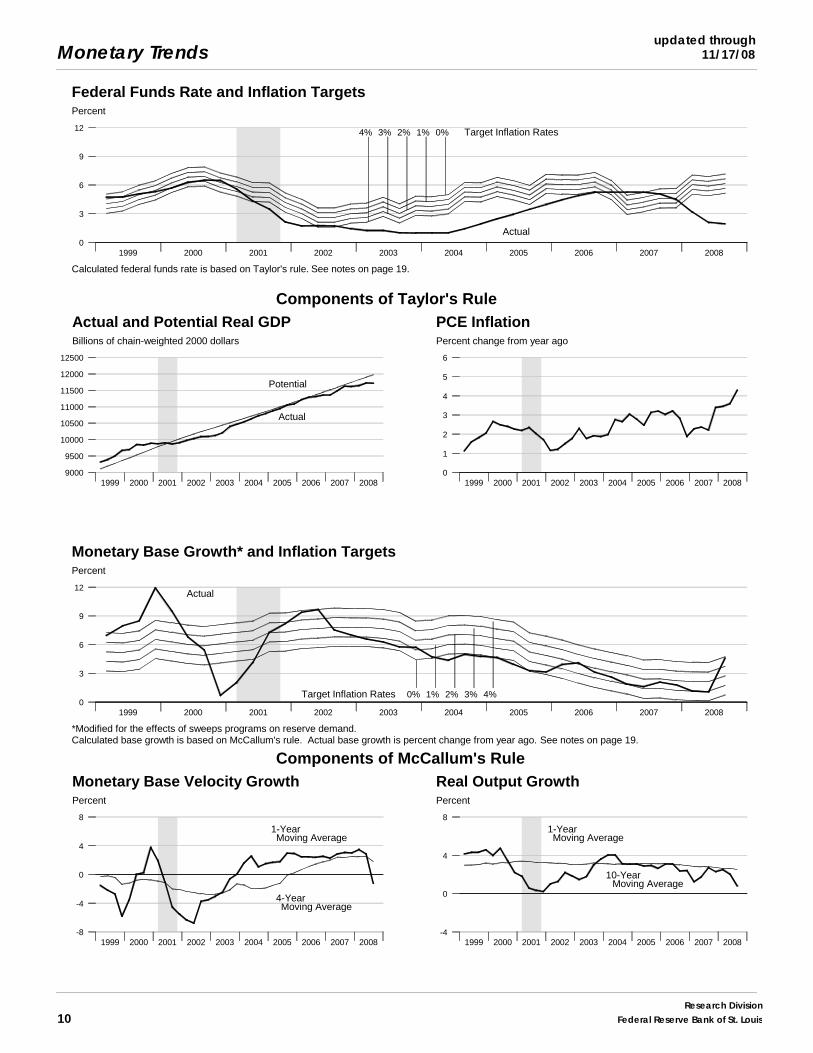
Federal Funds Rate and Inflation Targets
Calculated federal funds rate is based on Taylor's rule. See notes on page 19.
0
3
6
9
12
1999 2000 2001 2002 2003 2004 2005 2006 2007 2008 2009
1999 2000 2001 2002 2003 2004 2005 2006 2007 2008
Billions of chain-weighted 2000 dollars
Potential
Actual
Actual and Potential Real GDP
Components of Taylor's Rule
9000
9500
10000
10500
11000
11500
12000
12500
1999 2000 2001 2002 2003 2004 2005 2006 2007 2008 20091999 2000 2001 2002 2003 2004 2005 2006 2007 2008
Percent change from year ago
PCE Inflation
0
1
2
3
4
5
6
1999 2000 2001 2002 2003 2004 2005 2006 2007 2008 2009
1999 2000 2001 2002 2003 2004 2005 2006 2007 2008
Percent
Actual
Target Inflation Rates 0% 1% 2% 3% 4%
Monetary Base Growth* and Inflation Targets
*Modified for the effects of sweeps programs on reserve demand.Calculated base growth is based on McCallum's rule. Actual base growth is percent change from year ago. See notes on page 19.
0
3
6
9
12
99 00 01 02 03 04 05 06 07 08 09
1999 2000 2001 2002 2003 2004 2005 2006 2007 2008
Percent
4-YearMoving Average
1-YearMoving Average
Monetary Base Velocity Growth
Components of McCallum's Rule
-8
-4
0
4
8
99 00 01 02 03 04 05 06 07 08 091999 2000 2001 2002 2003 2004 2005 2006 2007 2008
Percent
10-YearMoving Average
1-YearMoving Average
Real Output Growth
-4
0
4
8
99 00 01 02 03 04 05 06 07 08 09
Monetary Trendsupdated through11/18/08
11Research DivisionFederal Reserve Bank of St. Louis
2y 3y 5y 7y 10y
Percent
Implied One-Year Forward Rates
0.0
1.5
3.0
4.5
6.0
7.5
9.0 Week Ending:
11/14/0810/17/0811/16/07
Percent, daily data
Jan 2009
Dec 2008
Nov 2008
Rates on SelectedFederal Funds Futures Contracts
||
||
0.1
0.4
0.7
1.0
1.3
1.6
1.9
2.2
09/15 09/22 09/29 10/06 10/13 10/20 10/27 11/03 11/10 11/17
Percent, daily data
Jan 2009
Dec 2008
Nov 2008
|||||
Rates on 3-Month Eurodollar Futures
1.5
1.8
2.1
2.4
2.7
3.0
3.3
3.6
3.9
09/15 09/22 09/29 10/06 10/13 10/20 10/27 11/03 11/10 11/17
Percent
11/14/2008
10/17/2008
09/12/2008
Rates on Federal Funds Futureson Selected Dates
Contract Month
0.0
0.5
1.0
1.5
2.0
Nov Dec Jan Feb Mar Apr
2004 2005 2006 2007 2008
Percent, weekly data
U.K.
U.S.
France
Inflation-Indexed10-Year Government Yield Spreads
0
1
2
3
4
2004 2005 2006 2007 2008 20092004 2005 2006 2007 2008
Percent, weekly data
U.K.U.S.
France
Inflation-Indexed10-Year Government Notes
||||
0
1
2
3
4
2004 2005 2006 2007 2008 2009
20092008200720062006
.5
10
1520
Maturity0
1
2
3
4
Percent
Inflation-Indexed Treasury SecuritiesWeekly data
Note: Yields are inflation-indexed constant maturityU.S. Treasury securities
20092008200720062006
.5
10
1520
Horizon-2
-1
0
1
2
3
4Percent
Inflation-Indexed Treasury Yield SpreadsWeekly data
Note: Yield spread is between nominal and inflation-indexedconstant maturity U.S. Treasury securities.
Monetary Trendsupdated through
11/17/08
12Research Division
Federal Reserve Bank of St. Louis
3.50
3.00
2.50
2.00
1.50
Vel
ocity
= N
omin
al G
DP
/ M
ZM
Ratio Scale
Interest Rate Spread = 3-Month T-Bill less MZM Own Rate
MZM Velocity and Interest Rate Spread
1974Q1 to 1993Q41994Q1 to present
0 1 2 3 4 5 6 7 8 9 10 11
2.25
2.00
1.75
1.50
1.25
Ratio Scale
Vel
ocity
= N
omin
al G
DP
/ M
2
Interest Rate Spread = 3-Month T-Bill less M2 Own Rate
M2 Velocity and Interest Rate Spread
1974Q1 to 1993Q41994Q1 to present
0.0 0.5 1.0 1.5 2.0 2.5 3.0 3.5 4.0 4.5 5.0 5.5 6.0
91 92 93 94 95 96 97 98 99 00 01 02 03 04 05 06 07 08
3.00
2.75
2.50
2.25
2.00
1.75
1.50
Nominal GDP/MZM, Nominal GDP/M2 (Ratio Scale)
MZM
M2
Velocity
11323 11688 12054 12419 12784 13149 13515 13880 14245 14610 14976 15341 15706 16071 16437 16802 17167 17532 17898
91 92 93 94 95 96 97 98 99 00 01 02 03 04 05 06 07 08
Percent
MZM Own
M2 Own
3-Month T-Bill
Interest Rates
0
2
4
6
8
10
11323 11688 12054 12419 12784 13149 13515 13880 14245 14610 14976 15341 15706 16071 16437 16802 17167 17532 17898
Monetary Trendsupdated through11/17/08
13Research DivisionFederal Reserve Bank of St. Louis
91 92 93 94 95 96 97 98 99 00 01 02 03 04 05 06 07 08
Percent change from year ago
Gross Domestic Product
Dashed lines indicate 10-year moving averages.
0
5
10
15
20
1991 1992 1993 1994 1995 1996 1997 1998 1999 2000 2001 2002 2003 2004 2005 2006 2007 2008 2009
91 92 93 94 95 96 97 98 99 00 01 02 03 04 05 06 07 08
Percent change from year ago
Real Gross Domestic Product
Dashed lines indicate 10-year moving averages.
-5
0
5
10
15
1991 1992 1993 1994 1995 1996 1997 1998 1999 2000 2001 2002 2003 2004 2005 2006 2007 2008 2009
91 92 93 94 95 96 97 98 99 00 01 02 03 04 05 06 07 08
Percent change from year ago
Gross Domestic Product Price Index
Dashed lines indicate 10-year moving averages.
0
5
10
15
20
1991 1992 1993 1994 1995 1996 1997 1998 1999 2000 2001 2002 2003 2004 2005 2006 2007 2008 2009
91 92 93 94 95 96 97 98 99 00 01 02 03 04 05 06 07 08
Percent change from year ago
M2
Dashed lines indicate 10-year moving averages.
0
5
10
15
20
1991 1992 1993 1994 1995 1996 1997 1998 1999 2000 2001 2002 2003 2004 2005 2006 2007 2008 2009
Monetary Trendsupdated through
11/17/08
14Research Division
Federal Reserve Bank of St. Louis
1999 2000 2001 2002 2003 2004 2005 2006 2007 2008
Percent change from year ago
Bank Credit
0
5
10
15
20
1999 2000 2001 2002 2003 2004 2005 2006 2007 2008 2009
1999 2000 2001 2002 2003 2004 2005 2006 2007 2008
Percent change from year ago
Investment Securities in Bank Credit at Commercial Banks
-5
0
5
10
15
20
25
1999 2000 2001 2002 2003 2004 2005 2006 2007 2008 2009
1999 2000 2001 2002 2003 2004 2005 2006 2007 2008
Percent change from year ago
Total Loans and Leases in Bank Credit at Commercial Banks
-5
0
5
10
15
20
1999 2000 2001 2002 2003 2004 2005 2006 2007 2008 2009
1999 2000 2001 2002 2003 2004 2005 2006 2007 2008
Percent change from year ago
Commercial and Industrial Loans at Commercial Banks
-10
-5
0
5
10
15
20
25
1999 2000 2001 2002 2003 2004 2005 2006 2007 2008 2009

Monetary Trendsupdated through11/04/08
15Research DivisionFederal Reserve Bank of St. Louis
4.01 4.17 4.29 5.27 4.01 3.89 3.69 3.81
2.41 1.78 2.35 . 3.76 3.60 3.50 .
2.34 2.95 3.30 . 4.69 4.40 . .
3.04 2.92 2.90 . 4.49 4.20 4.09 .
2.36 3.06 3.57 3.97 5.09 4.81 4.80 .
0.53 0.96 1.37 . 1.61 1.47 1.49 1.51
2.09 2.38 3.37 . 5.05 4.73 4.57 4.59
Recent Inflation and Long-Term Interest Rates
Percent change from year ago Percent
Consumer PriceInflation Rates
Long-TermGovernment Bond Rates
United States
Canada
France
Germany
Italy
Japan
United Kingdom
2007Q4 2008Q1 2008Q2 2008Q3 Jul08 Aug08 Sep08 Oct08
91 92 93 94 95 96 97 98 99 00 01 02 03 04 05 06 07 08
Composite Index(left)
Price/Earnings Ratio(right)
Standard & Poor's 500
0
200
400
600
800
1000
1200
1400
1600
0
6
12
18
24
30
36
42
48
2005 2006 2007 2008
Percent
Germany
Canada
Germany
Canada
Inflation differential = Foreign inflation less U.S. inflationLong-term rate differential = Foreign rate less U.S. rate
Inflation and Long-Term Interest Rate Differentials
-6
-3
0
3
01/01/2005 01/01/2006 01/01/2007 01/01/2008 01/01/20092005 2006 2007 2008
Percent
U.K.
U.K.
Japan
Japan
-6
-3
0
3
01/01/2005 01/01/2006 01/01/2007 01/01/2008 01/01/2009
Monetary Trendsupdated through
11/17/08
16Research Division
Federal Reserve Bank of St. Louis
2003. 1273.484 6318.069 5967.902 8787.321 6118.966 740.938 93.325 315.192
2004. 1344.422 6569.804 6249.938 9234.718 6595.304 776.768 96.129 329.873
2005. 1371.780 6706.774 6517.356 9786.477 7244.412 806.628 96.560 343.539
2006. 1374.386 6995.516 6842.574 10270.74 7957.088 835.040 94.913 .2007. 1369.603 7626.162 7232.850 . 8743.307 850.578 94.200 .
2006 1 1381.850 6891.629 6735.147 . 7621.982 830.534 96.495 .
. 2 1379.956 6945.088 6797.397 . 7883.623 836.387 95.082 .
. 3 1367.253 7006.517 6864.172 . 8037.437 834.610 94.829 .
. 4 1368.486 7138.831 6973.582 . 8285.309 838.627 93.247 .
2007 1 1369.946 7296.282 7089.234 . 8426.782 846.309 94.122 .
. 2 1372.969 7486.247 7192.676 . 8563.884 849.918 93.557 .
. 3 1368.271 7713.138 7277.898 . 8834.607 852.266 95.428 .
. 4 1367.227 8008.981 7371.592 . 9147.954 853.821 93.692 .
2008 1 1371.773 8385.200 7537.915 . 9354.571 856.319 96.177 .
. 2 1375.174 8669.503 7636.885 . 9395.114 859.325 94.389 .
. 3 1417.056 8723.376 7706.185 . 9462.619 892.683 117.633 .
2006 Oct 1367.925 7084.115 6936.579 . 8227.077 837.884 93.955 .
. Nov 1371.000 7129.412 6971.827 . 8275.357 840.308 94.689 .
. Dec 1366.533 7202.966 7012.339 . 8353.494 837.690 91.097 .
2007 Jan 1372.533 7246.756 7058.625 . 8393.945 843.494 94.186 .
. Feb 1367.496 7288.538 7084.824 . 8460.136 847.258 94.424 .
. Mar 1369.809 7353.552 7124.254 . 8426.264 848.174 93.757 .
. Apr 1377.704 7431.242 7173.881 . 8506.172 848.961 93.602 .
. May 1375.280 7489.817 7193.761 . 8563.990 849.615 92.772 .
. Jun 1365.924 7537.682 7210.385 . 8621.491 851.179 94.298 .
. Jul 1368.498 7593.947 7233.660 . 8705.330 851.857 94.604 .
. Aug 1369.928 7722.440 7286.098 . 8842.190 853.437 96.647 .
. Sep 1366.388 7823.027 7313.937 . 8956.300 851.505 95.032 .
. Oct 1369.502 7925.050 7338.264 . 9057.189 856.460 93.525 .
. Nov 1365.636 8015.346 7372.260 . 9180.338 857.515 95.757 .
. Dec 1366.542 8086.547 7404.252 . 9206.335 847.487 91.793 .
2008 Jan 1367.201 8173.321 7448.859 . 9273.957 851.441 95.083 .
. Feb 1372.814 8412.758 7546.783 . 9334.389 856.944 96.197 .
. Mar 1375.303 8569.521 7618.102 . 9455.368 860.571 97.250 .
. Apr 1371.297 8628.210 7631.283 . 9408.850 855.241 94.379 .
. May 1368.056 8676.231 7640.693 . 9402.533 859.685 94.935 .
. Jun 1386.168 8704.067 7638.679 . 9373.958 863.050 93.853 .
. Jul 1403.336 8734.172 7679.499 . 9398.277 870.540 96.796 .
. Aug 1393.996 8724.140 7669.926 . 9414.481 871.333 96.422 .
. Sep 1453.837 8711.816 7769.130 . 9575.099 936.176 159.682 .
. Oct 1473.062 8714.868 7878.896 . 9961.035 1142.242 347.477 .
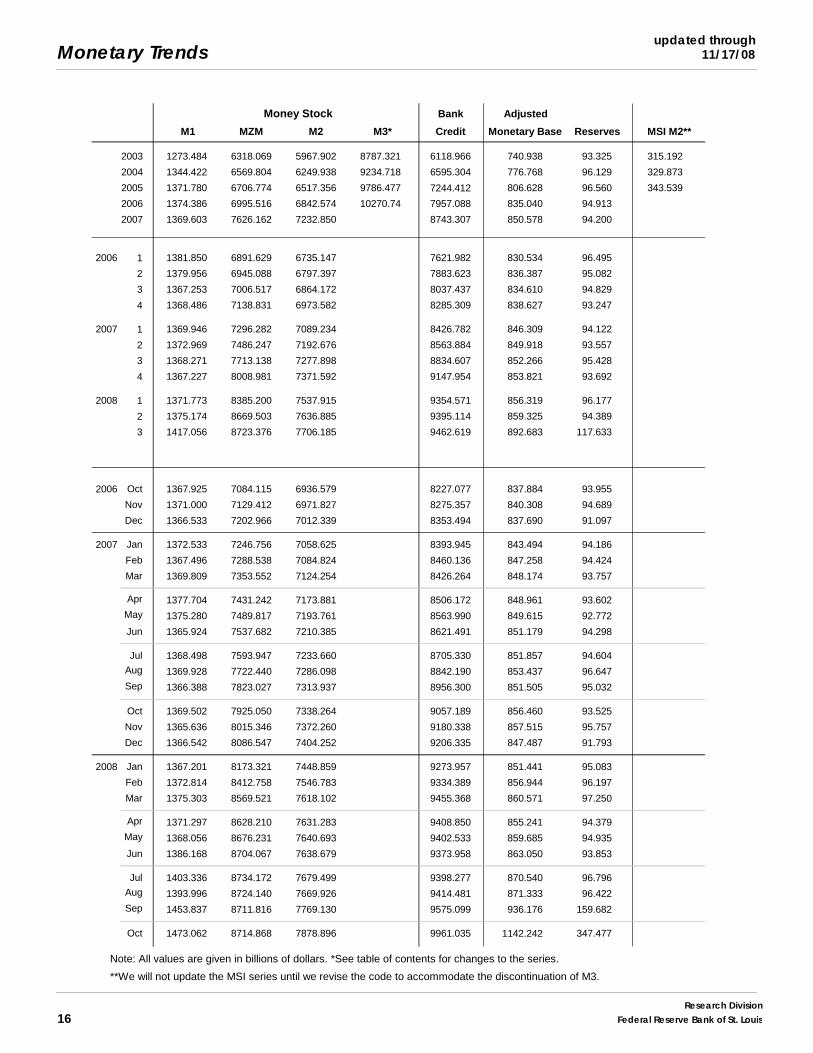
Money Stock
M1 MZM M2 M3*
Bank
Credit
Adjusted
Monetary Base Reserves MSI M2**
Note: All values are given in billions of dollars. *See table of contents for changes to the series.
**We will not update the MSI series until we revise the code to accommodate the discontinuation of M3.
Monetary Trendsupdated through11/05/08
17Research DivisionFederal Reserve Bank of St. Louis
2003. 1.13 2.11 4.12 1.15 1.03 2.11 4.02 5.67 4.52 5.82
2004. 1.35 2.34 4.34 1.56 1.40 2.78 4.27 5.63 4.50 5.84
2005. 3.21 4.19 6.19 3.51 3.21 3.93 4.29 5.23 4.28 5.86
2006. 4.96 5.96 7.96 5.15 4.85 4.77 4.79 5.59 4.15 6.41
2007. 5.02 5.86 8.05 5.27 4.47 4.34 4.63 5.56 4.13 6.34
2006 1 4.46 5.43 7.43 4.72 4.50 4.58 4.57 5.39 4.29 6.24
. 2 4.91 5.90 7.90 5.18 4.83 4.98 5.07 5.89 4.36 6.60
. 3 5.25 6.25 8.25 5.39 5.03 4.87 4.90 5.68 4.13 6.56
. 4 5.25 6.25 8.25 5.32 5.03 4.65 4.63 5.39 3.82 6.24
2007 1 5.26 6.25 8.25 5.31 5.12 4.68 4.68 5.36 3.91 6.22
. 2 5.25 6.25 8.25 5.32 4.87 4.76 4.85 5.58 4.13 6.37
. 3 5.07 5.93 8.18 5.42 4.42 4.41 4.73 5.75 4.27 6.55
. 4 4.50 5.02 7.52 5.02 3.47 3.50 4.26 5.53 4.24 6.23
2008 1 3.18 3.67 6.21 3.23 2.09 2.17 3.66 5.46 4.39 5.88
. 2 2.09 2.33 5.08 2.76 1.65 2.67 3.89 5.60 4.42 6.09
. 3 1.94 2.25 5.00 3.06 1.52 2.63 3.86 5.65 4.46 6.31
2006 Oct 5.25 6.25 8.25 5.33 5.05 4.72 4.73 5.51 3.91 6.36
. Nov 5.25 6.25 8.25 5.32 5.07 4.64 4.60 5.33 3.81 6.24
. Dec 5.24 6.25 8.25 5.32 4.97 4.58 4.56 5.32 3.76 6.14
2007 Jan 5.25 6.25 8.25 5.32 5.11 4.79 4.76 5.40 3.89 6.22
. Feb 5.26 6.25 8.25 5.31 5.16 4.75 4.72 5.39 3.95 6.29
. Mar 5.26 6.25 8.25 5.30 5.08 4.51 4.56 5.30 3.88 6.16
. Apr 5.25 6.25 8.25 5.31 5.01 4.60 4.69 5.47 3.99 6.18
. May 5.25 6.25 8.25 5.31 4.87 4.69 4.75 5.47 4.04 6.26
. Jun 5.25 6.25 8.25 5.33 4.74 5.00 5.10 5.79 4.36 6.66
. Jul 5.26 6.25 8.25 5.32 4.96 4.82 5.00 5.73 4.24 6.70
. Aug 5.02 6.01 8.25 5.49 4.32 4.34 4.67 5.79 4.30 6.57
. Sep 4.94 5.53 8.03 5.46 3.99 4.06 4.52 5.74 4.26 6.38
. Oct 4.76 5.24 7.74 5.08 4.00 4.01 4.53 5.66 4.20 6.38
. Nov 4.49 5.00 7.50 4.97 3.35 3.35 4.15 5.44 4.26 6.21
. Dec 4.24 4.83 7.33 5.02 3.07 3.13 4.10 5.49 4.25 6.10
2008 Jan 3.94 4.48 6.98 3.84 2.82 2.51 3.74 5.33 4.13 5.76
. Feb 2.98 3.50 6.00 3.06 2.17 2.19 3.74 5.53 4.42 5.92
. Mar 2.61 3.04 5.66 2.79 1.28 1.80 3.51 5.51 4.63 5.97
. Apr 2.28 2.49 5.24 2.85 1.31 2.23 3.68 5.55 4.45 5.92
. May 1.98 2.25 5.00 2.66 1.76 2.69 3.88 5.57 4.34 6.04
. Jun 2.00 2.25 5.00 2.76 1.89 3.08 4.10 5.68 4.47 6.32
. Jul 2.01 2.25 5.00 2.79 1.66 2.87 4.01 5.67 4.44 6.43
. Aug 2.00 2.25 5.00 2.79 1.75 2.70 3.89 5.64 4.44 6.48
. Sep 1.81 2.25 5.00 3.59 1.15 2.32 3.69 5.65 4.49 6.04
. Oct 0.97 1.81 4.56 4.32 0.69 1.86 3.81 6.28 5.23 6.20
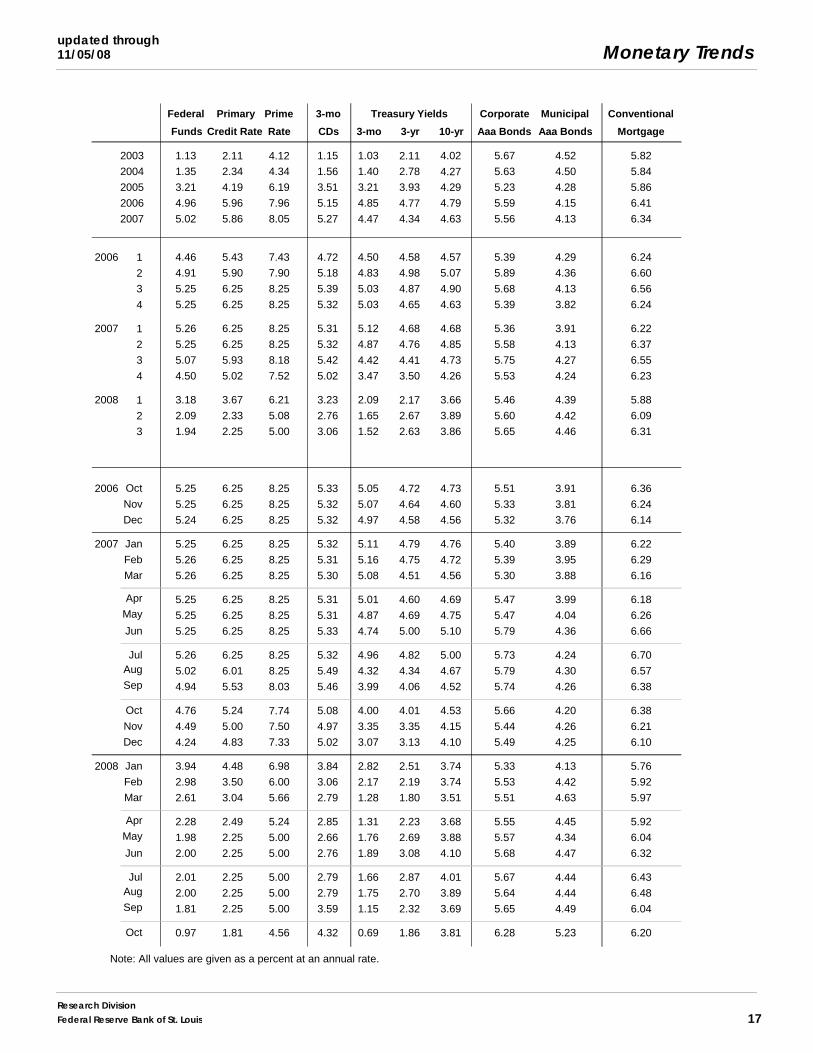
Federal
Funds
Primary
Credit Rate
Prime
Rate
3-mo
CDs
Treasury Yields
3-mo 3-yr 10-yr
Corporate
Aaa Bonds
Municipal
Aaa Bonds
Conventional
Mortgage
Note: All values are given as a percent at an annual rate.
Monetary Trendsupdated through
11/17/08
18Research Division
Federal Reserve Bank of St. Louis
2003. 6.46 7.30 6.88 6.40
2004. 5.57 3.98 4.73 5.09
2005. 2.03 2.08 4.28 5.97
2006. 0.19 4.31 4.99 4.95
2007. -0.35 9.01 5.70 .
2006 1 1.98 5.38 6.12 .
. 2 -0.55 3.10 3.70 .
. 3 -3.68 3.54 3.93 .
. 4 0.36 7.55 6.38 .
2007 1 0.43 8.82 6.63 .
. 2 0.88 10.41 5.84 .
. 3 -1.37 12.12 4.74 .
. 4 -0.31 15.34 5.15 .
2008 1 1.33 18.79 9.03 .
. 2 0.99 13.56 5.25 .
. 3 12.18 2.49 3.63 .
2006 Oct 6.13 10.06 8.92 .
. Nov 2.70 7.67 6.10 .
. Dec -3.91 12.38 6.97 .
2007 Jan 5.27 7.30 7.92 .
. Feb -4.40 6.92 4.45 .
. Mar 2.03 10.70 6.68 .
. Apr 6.92 12.68 8.36 .
. May -2.11 9.46 3.33 .
. Jun -8.16 7.67 2.77 .
. Jul 2.26 8.96 3.87 .
. Aug 1.25 20.30 8.70 .
. Sep -3.10 15.63 4.59 .
. Oct 2.73 15.65 3.99 .
. Nov -3.39 13.67 5.56 .
. Dec 0.80 10.66 5.21 .
2008 Jan 0.58 12.88 7.23 .
. Feb 4.93 35.15 15.78 .
. Mar 2.18 22.36 11.34 .
. Apr -3.50 8.22 2.08 .
. May -2.84 6.68 1.48 .
. Jun 15.89 3.85 -0.32 .
. Jul 14.86 4.15 6.41 .
. Aug -7.99 -1.38 -1.50 .
. Sep 51.51 -1.70 15.52 .
. Oct 15.87 0.42 16.95 .
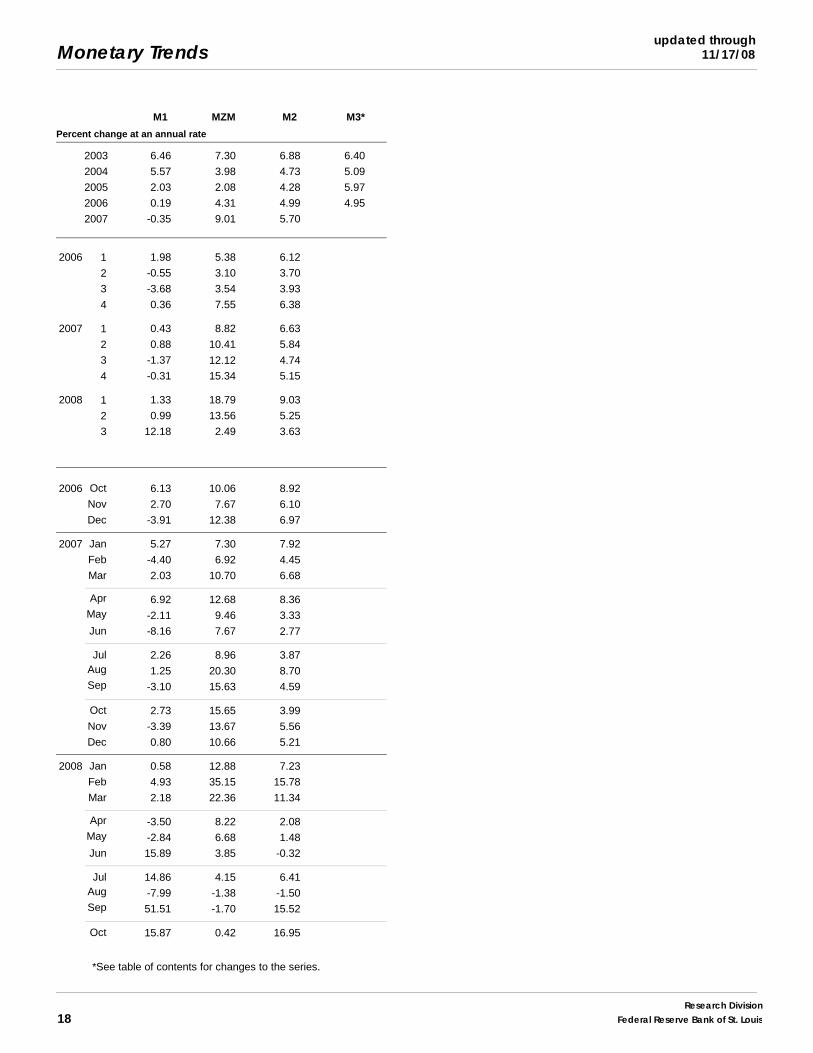
Percent change at an annual rate
M1 MZM M2 M3*
*See table of contents for changes to the series.
Definitions M1: The sum of currency held outside the vaults of depository institutions,Federal Reserve Banks, and the U.S. Treasury; travelers checks; and demandand other checkable deposits issued by financial institutions (except demanddeposits due to the Treasury and depository institutions), minus cash items inprocess of collection and Federal Reserve float.
MZM (money, zero maturity): M2 minus small-denomination time deposits,plus institutional money market mutual funds (that is, those included in M3 butexcluded from M2). The label MZM was coined by William Poole (1991); theaggregate itself was proposed earlier by Motley (1988).
M2: M1 plus savings deposits (including money market deposit accounts)and small-denomination (under $100,000) time deposits issued by financialinstitutions; and shares in retail money market mutual funds (funds with initialinvestments under $50,000), net of retirement accounts.
M3: M2 plus large-denomination ($100,000 or more) time deposits; repurchaseagreements issued by depository institutions; Eurodollar deposits, specifically,dollar-denominated deposits due to nonbank U.S. addresses held at foreignoffices of U.S. banks worldwide and all banking offices in Canada and theUnited Kingdom; and institutional money market mutual funds (funds withinitial investments of $50,000 or more).
Bank Credit: All loans, leases, and securities held by commercial banks.
Domestic Nonfinancial Debt: Total credit market liabilities of the U.S.Treasury, federally sponsored agencies, state and local governments, households,and nonfinancial firms. End-of-period basis.
Adjusted Monetary Base: The sum of currency in circulation outside FederalReserve Banks and the U.S. Treasury, deposits of depository financial institu-tions at Federal Reserve Banks, and an adjustment for the effects of changesin statutory reserve requirements on the quantity of base money held by deposi-tories. This series is a spliced chain index; see Anderson and Rasche (1996a,b,2001, 2003).
Adjusted Reserves: The sum of vault cash and Federal Reserve Bank depositsheld by depository institutions and an adjustment for the effects of changes instatutory reserve requirements on the quantity of base money held by deposi-tories. This spliced chain index is numerically larger than the Board ofGovernors’ measure, which excludes vault cash not used to satisfy statutoryreserve requirements and Federal Reserve Bank deposits used to satisfy requiredclearing balance contracts; see Anderson and Rasche (1996a, 2001, 2003).
Monetary Services Index: An index that measures the flow of monetaryservices received by households and firms from their holdings of liquid assets;see Anderson, Jones, and Nesmith (1997). Indexes are shown for the assetsincluded in M2, with additional data at research.stlouisfed.org/msi/index.html.
Note: M1, M2, M3, Bank Credit, and Domestic Nonfinancial Debt are con-structed and published by the Board of Governors of the Federal ReserveSystem. For details, see Statistical Supplement to the Federal Reserve Bulletin,tables 1.21 and 1.26. MZM, Adjusted Monetary Base, Adjusted Reserves,and Monetary Services Index are constructed and published by the ResearchDivision of the Federal Reserve Bank of St. Louis.
NotesPage 3: Readers are cautioned that, since early 1994, the level and growth ofM1 have been depressed by retail sweep programs that reclassify transactionsdeposits (demand deposits and other checkable deposits) as savings depositsovernight, thereby reducing banks’ required reserves; see Anderson and Rasche(2001) and research.stlouisfed.org/aggreg/swdata.html. Primary Credit Rate,Discount Rate, and Intended Federal Funds Rate shown in the chart ReserveMarket Rates are plotted as of the date of the change, while the EffectiveFederal Funds Rate is plotted as of the end of the month. Interest rates inthe table are monthly averages from the Board of Governors H.15 StatisticalRelease. The Treasury Yield Curve and Real Treasury Yield Curve showconstant maturity yields calculated by the U.S. Treasury for securities 5, 7, 10,and 20 years to maturity. Inflation-Indexed Treasury Yield Spreads are ameasure of inflation compensation at those horizons, and it is simply the nomi-
nal constant maturity yield less the real constant maturity yield. Daily data anddescriptions are available at research.stlouisfed.org/fred2/. See also StatisticalSupplement to the Federal Reserve Bulletin, table 1.35. The 30-year constantmaturity series was discontinued by the Treasury as of February 18, 2002.
Page 5: Checkable Deposits is the sum of demand and other checkabledeposits. Savings Deposits is the sum of money market deposit accounts andpassbook and statement savings. Time Deposits have a minimum initialmaturity of 7 days. Large Time Deposits are deposits of $100,000 or more.Retail and Institutional Money Market Mutual Funds are as included inM2 and the non-M2 component of M3, respectively.
Page 7: Excess Reserves plus RCB (Required Clearing Balance) Contractsequals the amount of deposits at Federal Reserve Banks held by depositoryinstitutions but not applied to satisfy statutory reserve requirements. (Thismeasure excludes the vault cash held by depository institutions that is notapplied to satisfy statutory reserve requirements.) Consumer Credit includesmost short- and intermediate-term credit extended to individuals. See StatisticalSupplement to the Federal Reserve Bulletin, table 1.55.
Page 8: Inflation Expectations measures include the quarterly Federal ReserveBank of Philadelphia Survey of Professional Forecasters, the monthly Universityof Michigan Survey Research Center’s Surveys of Consumers, and the annualFederal Open Market Committee (FOMC) range as reported to the Congressin the February testimony that accompanies the Monetary Policy Report tothe Congress. Beginning February 2000, the FOMC began using the personalconsumption expenditures (PCE) price index to report its inflation range; theFOMC then switched to the PCE chain-type price index excluding food andenergy prices (“core”) beginning July 2004. Accordingly, neither are shownon this graph. CPI Inflation is the percentage change from a year ago in theconsumer price index for all urban consumers. Real Interest Rates are ex postmeasures, equal to nominal rates minus year-over-year CPI inflation.
From 1991 to the present the source of the long-term PCE inflation expectationsdata is the Federal Reserve Bank of Philadelphia’s Survey of ProfessionalForecasters. Prior to 1991, the data were obtained from the Board of Governorsof the Federal Reserve System. Realized (actual) inflation is the annualized rateof change for the 40-quarter period that corresponds to the forecast horizon (theexpectations measure). For example, in 1965:Q1, annualized PCE inflationover the next 40 quarters was expected to average 1.7 percent. In actuality,the average annualized rate of change measured 4.8 percent from 1965:Q1 to1975:Q1. Thus, the vertical distance between the two lines in the chart at anypoint is the forecast error.
Page 9: FOMC Intended Federal Funds Rate is the level (or midpoint ofthe range, if applicable) of the federal funds rate that the staff of the FOMCexpected to be consistent with the desired degree of pressure on bank reservepositions. In recent years, the FOMC has set an explicit target for the federalfunds rate.
Page 10: Federal Funds Rate and Inflation Targets shows the observedfederal funds rate, quarterly, and the level of the funds rate implied by applyingTaylor’s (1993) equation
ft*= 2.5 + ≠ t –1 + (≠ t –1 –≠*)/2 + 100 ? (yt –1 – yt –1
P)/2
to five alternative target inflation rates, ≠* = 0, 1, 2, 3, 4 percent, where ft* is
the implied federal funds rate, ≠ t –1 is the previous period’s inflation rate (PCE)measured on a year-over-year basis, yt –1 is the log of the previous period’slevel of real gross domestic product (GDP), and yt –1
P is the log of an estimateof the previous period’s level of potential output. Potential Real GDP is asestimated by the Congressional Budget Office.
Monetary Base Growth and Inflation Targets shows the quarterly growthof the adjusted monetary base (modified to include an estimate of the effectof sweep programs) implied by applying McCallum’s (1988, 1993) equation
∅MBt* = ≠* + (10-year moving average growth of real GDP)
– (4-year moving average of base velocity growth)
to five alternative target inflation rates, ≠* = 0, 1, 2, 3, 4 percent, where ∅MBt*
is the implied growth rate of the adjusted monetary base. The 10-year movingaverage growth of real GDP for a quarter t is calculated as the average quarterlygrowth during the previous 40 quarters, at an annual rate, by the formula
Monetary Trends
Research DivisionFederal Reserve Bank of St. Louis 19
((yt – yt –40)/40) ? 400, where yt is the log of real GDP. The 4-year movingaverage of base velocity growth is calculated similarly. To adjust the monetarybase for the effect of retail-deposit sweep programs, we add to the monetarybase an amount equal to 10 percent of the total amount swept, as estimatedby the Federal Reserve Board staff. These estimates are imprecise, at best.Sweep program data are found at research.stlouisfed.org/aggreg/swdata.html.
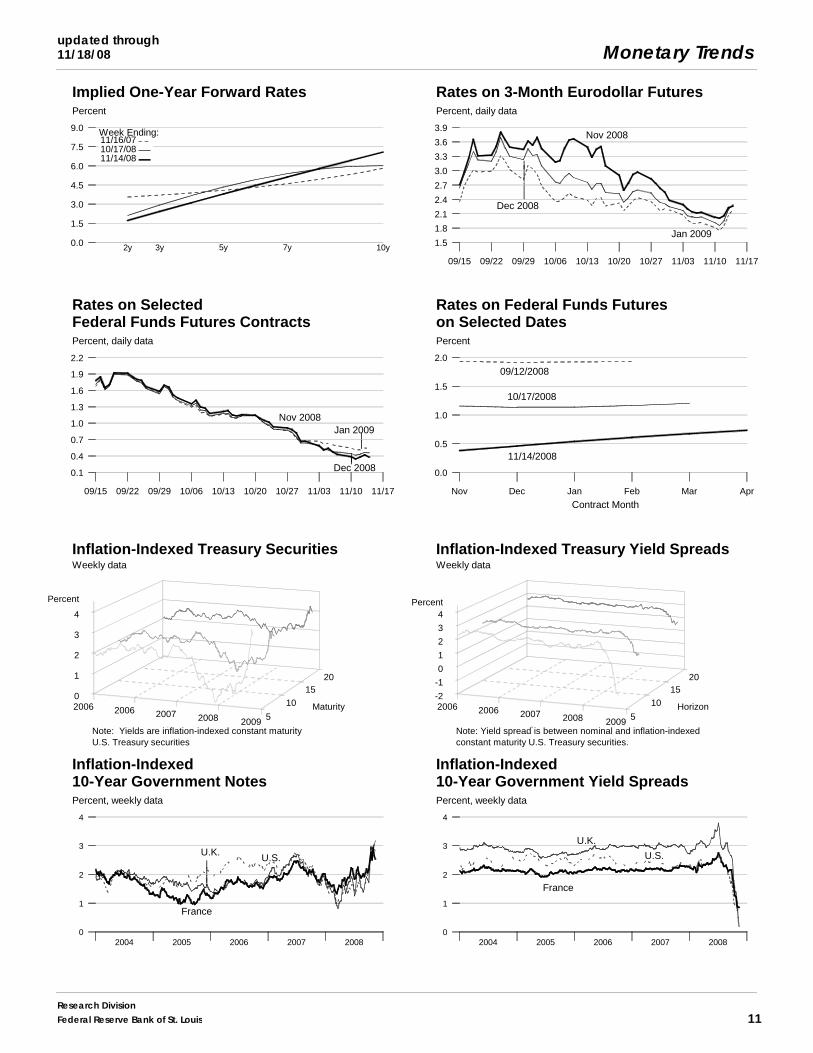
Page 11: Implied One-Year Forward Rates are calculated by this Bank fromTreasury constant maturity yields. Yields to maturity, R(m), for securities withm = 1,... , 10 years to maturity are obtained by linear interpolation betweenreported yields. These yields are smoothed by fitting the regression suggestedby Nelson and Siegel (1987),
R(m) = a0 + (a1 + a2)(1 – e–m/50)/(m/50) – a2 ? e–m/50,
and forward rates are calculated from these smoothed yields using equation(a) in table 13.1 of Shiller (1990),
f(m) = [D(m)R(m) – D(m–1)] / [D(m) – D(m–1)],
where duration is approximated as D(m) = (1 – e–R(m) ? m)/R(m). These ratesare linear approximations to the true instantaneous forward rates; see Shiller(1990). For a discussion of the use of forward rates as indicators of inflationexpectations, see Sharpe (1997). Rates on 3-Month Eurodollar Futures andRates on Selected Federal Funds Futures Contracts trace through time theyield on three specific contracts. Rates on Federal Funds Futures on SelectedDates displays a single day’s snapshot of yields for contracts expiring in themonths shown on the horizontal axis. Inflation-Indexed Treasury Securitiesand Yield Spreads are those plotted on page 3. Inflation-Indexed 10-YearGovernment Notes shows the yield of an inflation-indexed note that isscheduled to mature in approximately (but not greater than) 10 years. Thecurrent French note has a maturity date of 7/25/2015, the current U.K. notehas a maturity date of 8/16/2013, and the current U.S. note has a maturity dateof 1/15/2018. Inflation-Indexed Treasury Yield Spreads and Inflation-Indexed 10-Year Government Yield Spreads equal the difference betweenthe yields on the most recently issued inflation-indexed securities and theunadjusted security yields of similar maturity.
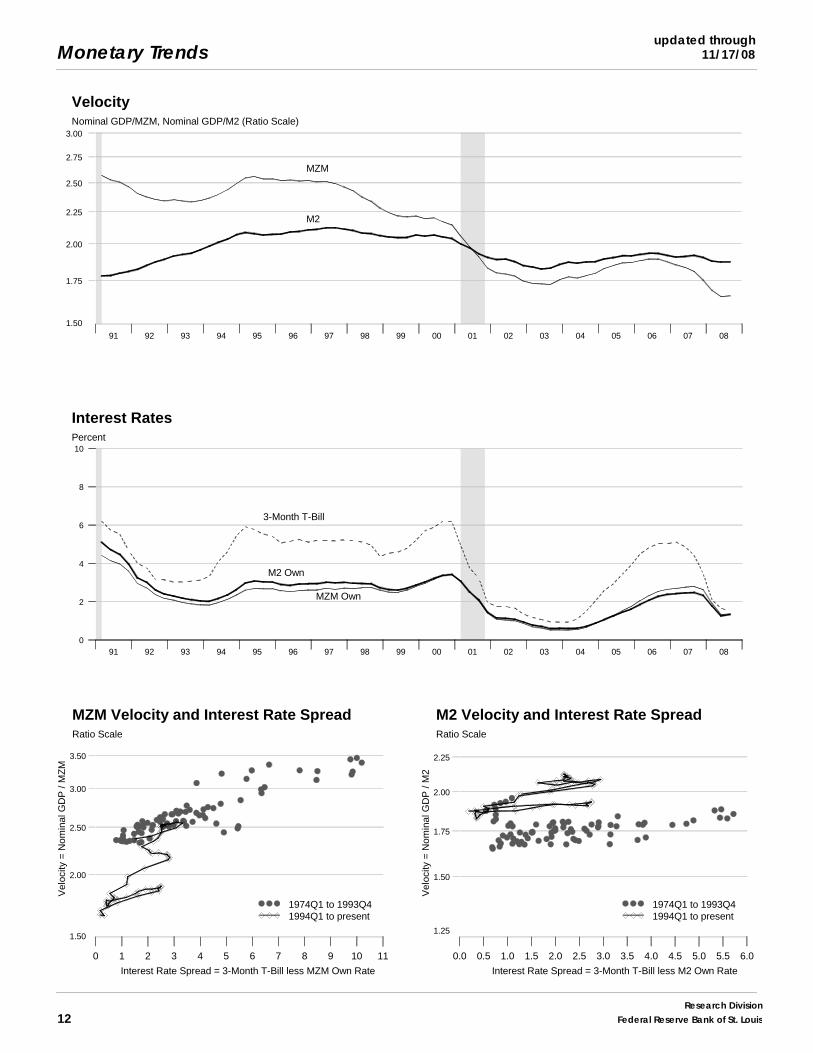
Page 12: Velocity (for MZM and M2) equals the ratio of GDP, measured incurrent dollars, to the level of the monetary aggregate. MZM and M2 OwnRates are weighted averages of the rates received by households and firmson the assets included in the aggregates. Prior to 1982, the 3-month T-billrates are secondary market yields. From 1982 forward, rates are 3-monthconstant maturity yields.
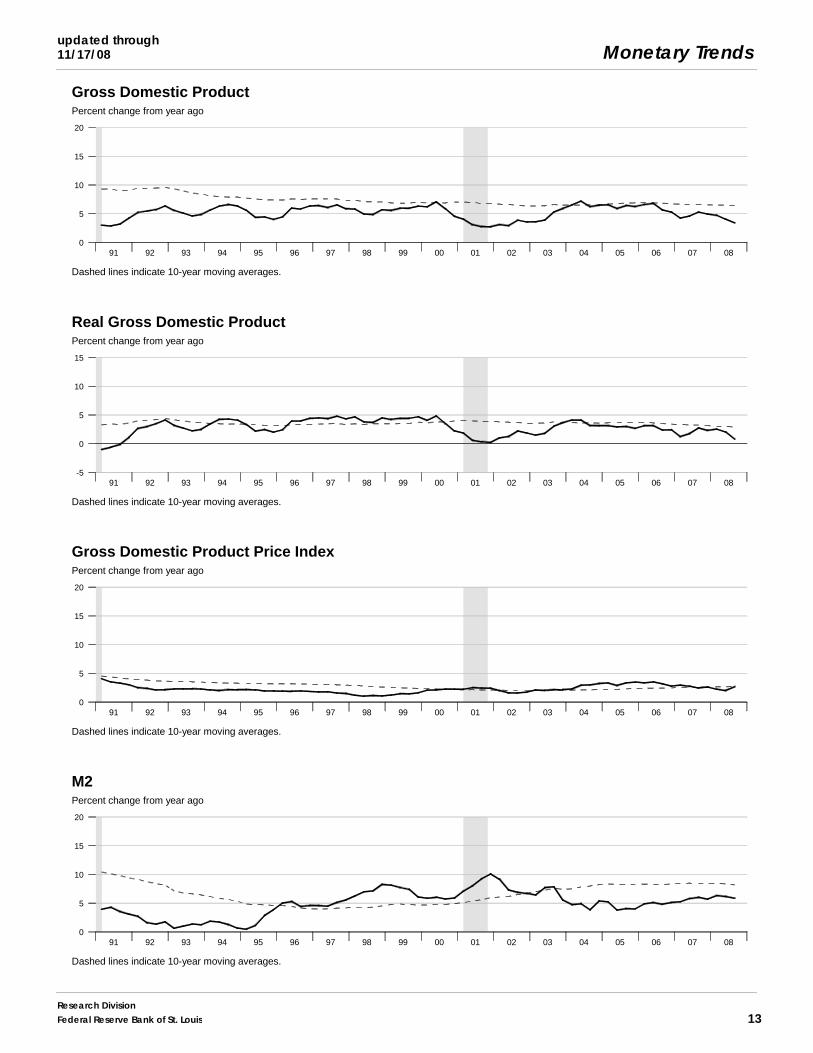
Page 13: Real Gross Domestic Product is GDP as measured in chained2000 dollars. The Gross Domestic Product Price Index is the implicit pricedeflator for GDP, which is defined by the Bureau of Economic Analysis,U.S. Depart ment of Commerce, as the ratio of GDP measured in current dol-lars to GDP measured in chained 2000 dollars.
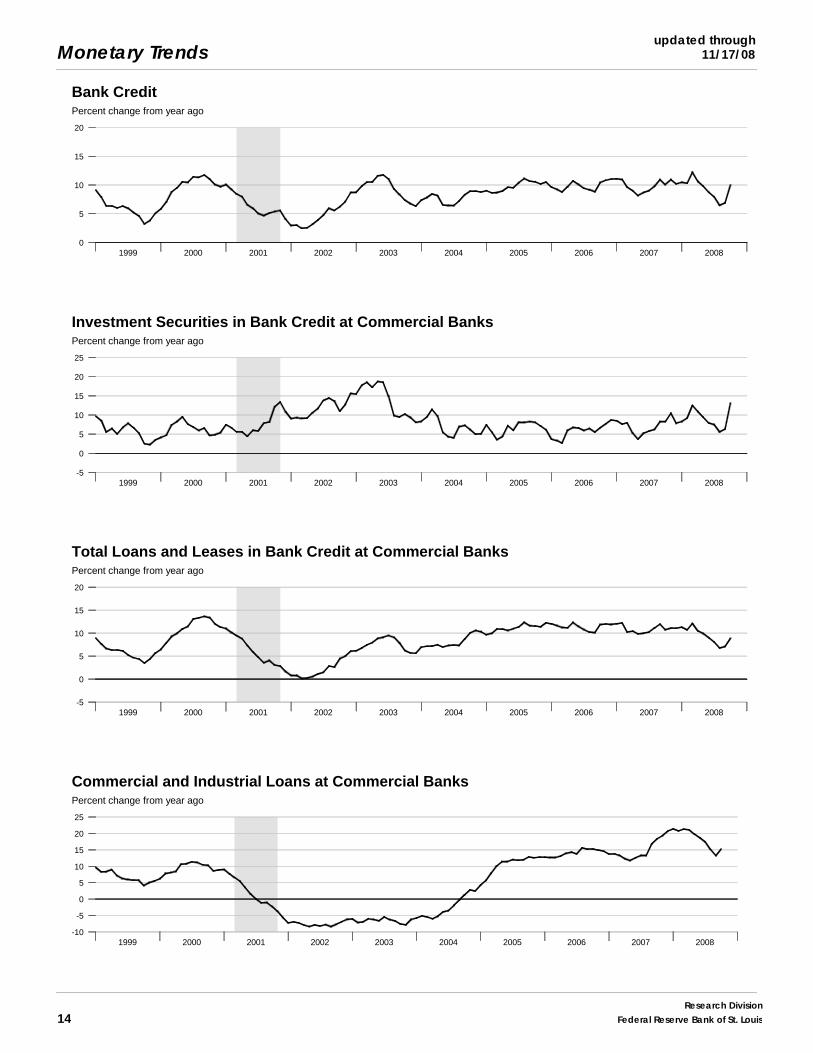
Page 14: Investment Securities are all securities held by commercial banksin both investment and trading accounts.
Page 15: Inflation Rate Differentials are the differences between the foreignconsumer price inflation rates and year-over-year changes in the U.S. all-itemsConsumer Price Index.
Page 17: Treasury Yields are Treasury constant maturities as reported in theBoard of Governors of the Federal Reserve System’s H.15 release.
SourcesAgence France Trésor : French note yields.
Bank of Canada : Canadian note yields.
Bank of England : U.K. note yields.
Board of Governors of the Federal Reserve System :Monetary aggregates and components: H.6 release. Bank credit and com-ponents: H.8 release. Consumer credit: G.19 release. Required reserves,excess reserves, clearing balance contracts, and discount window borrowing:H.4.1 and H.3 releases. Interest rates: H.15 release. Nonfinancial commercialpaper: Board of Governors website. Nonfinancial debt: Z.1 release. M2own rate.
Bureau of Economic Analysis : GDP.
Bureau of Labor Statistics : CPI.
Chicago Board of Trade : Federal funds futures contract.
Chicago Mercantile Exchange : Eurodollar futures.
Congressional Budget Office : Potential real GDP.
Federal Reserve Bank of Philadelphia : Survey of Professional Forecastersinflation expectations.
Federal Reserve Bank of St. Louis : Adjusted monetary base and adjustedreserves, monetary services index, MZM own rate, one-year forward rates.
Organization for Economic Cooperation and Development : Internationalinterest and inflation rates.
Standard & Poor’s : Stock price-earnings ratio, stock price composite index.
University of Michigan Survey Research Center : Median expected pricechange.
U.S. Department of the Treasury : U.S. security yields.
ReferencesAnderson, Richard G. and Robert H. Rasche (1996a). “A Revised Measure of
the St. Louis Adjusted Monetary Base,” Federal Reserve Bank of St. LouisReview, March/April, 78(2), pp. 3-13.*
____ and ____(1996b). “Measuring the Adjusted Monetary Base in an Era ofFinancial Change,” Federal Reserve Bank of St. Louis Review, November/December, 78(6), pp. 3-37.*
____ and ____(2001). “Retail Sweep Programs and Bank Reserves, 1994-1999,” Federal Reserve Bank of St. Louis Review, January/February,83(1), pp. 51-72.*
____ and ____ , with Jeffrey Loesel (2003). “A Reconstruction of the FederalReserve Bank of St. Louis Adjusted Monetary Base and Reserves,”Federal Reserve Bank of St. Louis Review, September/October, 85(5),pp. 39-70.*
____ , Barry E. Jones and Travis D. Nesmith (1997). “Special Report: TheMonetary Services Indexes Project of the Federal Reserve Bank of St.Louis,” Federal Reserve Bank of St. Louis Review, January/February,79(1), pp. 31-82.*
McCallum, Bennett T. (1988). “Robustness Properties of a Monetary PolicyRule,” Carnegie-Rochester Conference Series on Public Policy, vol. 29,pp. 173-204.
____(1993). “Specification and Analysis of a Monetary Policy Rule for Japan,”Bank of Japan Monetary and Economic Studies, November, pp. 1-45.
Motley, Brian (1988). “Should M2 Be Redefined?” Federal Reserve Bank ofSan Francisco Economic Review, Winter, pp. 33-51.
Nelson, Charles R. and Andrew F. Siegel (1987). “Parsimonious Modeling ofYield Curves,” Journal of Business, October, pp. 473-89.
Poole, William (1991). Statement before the Subcommittee on DomesticMonetary Policy of the Committee on Banking, Finance and Urban Affairs,U.S. House of Representatives, November 6, 1991. Government PrintingOffice, Serial No. 102-82.
Sharpe, William F. (1997). Macro-Investment Analysis, on-line textbookavailable at www.stanford.edu/~wfsharpe/mia/mia.htm.
Shiller, Robert (1990). “The Term Structure of Interest Rates,” Handbook ofMonetary Economics, vol. 1, B. Friedman and F. Hahn, eds., pp. 627-722.
Taylor, John B. (1993). “Discretion versus Policy Rules in Practice,” Carnegie-Rochester Conference Series on Public Policy, vol. 39, pp. 195-214.
Note: *Available on the Internet at research.stlouisfed.org/publications/review/.
Monetary Trends
Research Division20 Federal Reserve Bank of St. Louis