national economic trends - federal reserve bank of st. louis
TRANSCRIPT
December 2004NationalEconomicTrends
Views expressed do not necessarily reflect official positions of the Federal Reserve System.
Ringing In the New Year with anInvestment Bust?
Real outlays by firms for nonresidential capitalequipment and software (E&S) plunged 9 percentin 2001, a recession year; it was the largest decline
since 1958 and the third largest since World War II. In anattempt to kick-start business investment, President Bushsigned legislation in March 2002 that, among other things,allowed firms to immediately expense (depreciate) 30 per-cent of the cost of E&S purchased between September 10,2001, and September 11, 2004, and put into servicebefore January 2005. In subsequent tax legislation signedin May 2003, this partial expensing provision was raisedto 50 percent and the purchase date was moved back toDecember 31, 2004.
An increase in the depreciation allowance for capitalgoods increases the present value of the firm’s deductionsfor tax purposes, which, all else equal, lowers the cost ofcapital. Accordingly, when the partial expensing provisionreverts to its original level on January 1, 2005, the presentvalue of the depreciation deduction will be less—andthe cost of capital will be higher—than what it was onDecember 31, 2004.
Although other factors were also probably at work, therecent growth of investment expendituressuggests that firms responded to thisincentive, albeit with a lag. From2001:Q4 to 2003:Q1, real E&S invest-ment fell at about a 1 percent annualrate; however, in the second quarter of2003, real E&S investment surged at an11 percent annual rate and has sinceincreased at a 14.5 percent annual ratethrough the third quarter of 2004.
With the expiration of the partialexpensing provision fast approaching,some forecasters believe that manyfirms still plan to shift a portion oftheir planned capital expenditures from2005 into 2004. If these expenditures
are significant, then we would expect to see an upsurgein business investment in the final quarter of 2004 andthen a drop-off in the first quarter of 2005 (or later).
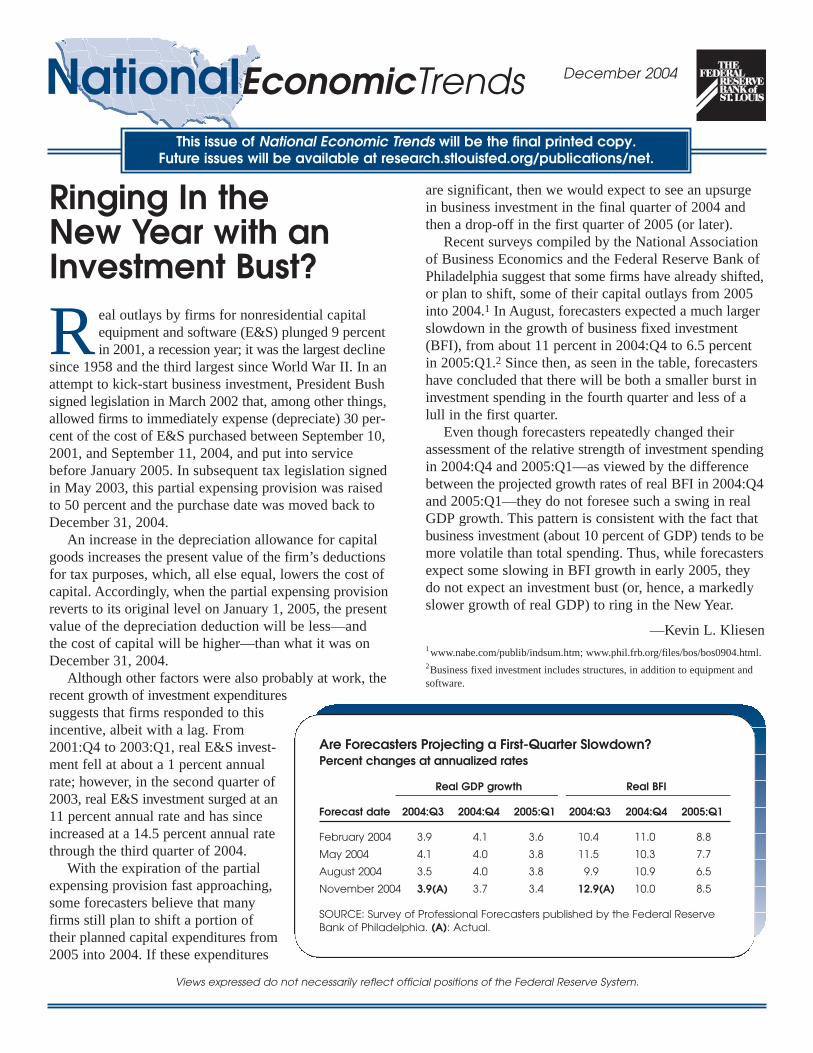
Recent surveys compiled by the National Associationof Business Economics and the Federal Reserve Bank ofPhiladelphia suggest that some firms have already shifted,or plan to shift, some of their capital outlays from 2005into 2004.1 In August, forecasters expected a much largerslowdown in the growth of business fixed investment(BFI), from about 11 percent in 2004:Q4 to 6.5 percentin 2005:Q1.2 Since then, as seen in the table, forecastershave concluded that there will be both a smaller burst ininvestment spending in the fourth quarter and less of alull in the first quarter.
Even though forecasters repeatedly changed theirassessment of the relative strength of investment spendingin 2004:Q4 and 2005:Q1—as viewed by the differencebetween the projected growth rates of real BFI in 2004:Q4and 2005:Q1—they do not foresee such a swing in realGDP growth. This pattern is consistent with the fact thatbusiness investment (about 10 percent of GDP) tends to bemore volatile than total spending. Thus, while forecastersexpect some slowing in BFI growth in early 2005, theydo not expect an investment bust (or, hence, a markedlyslower growth of real GDP) to ring in the New Year.
—Kevin L. Kliesen1www.nabe.com/publib/indsum.htm; www.phil.frb.org/files/bos/bos0904.html.2Business fixed investment includes structures, in addition to equipment andsoftware.
This issue of National Economic Trends will be the final printed copy.Future issues will be available at research.stlouisfed.org/publications/net.
Are Forecasters Projecting a First-Quarter Slowdown?Percent changes at annualized rates
Real GDP growth Real BFI
Forecast date 2004:Q3 2004:Q4 2005:Q1 2004:Q3 2004:Q4 2005:Q1
February 2004 3.9 4.1 3.6 10.4 11.0 8.8
May 2004 4.1 4.0 3.8 11.5 10.3 7.7
August 2004 3.5 4.0 3.8 9.9 10.9 6.5
November 2004 3.9(A) 3.7 3.4 12.9(A) 10.0 8.5
SOURCE: Survey of Professional Forecasters published by the Federal ReserveBank of Philadelphia. (A): Actual.

Contents
Page
3 Economy at a Glance
4 Output and Growth
7 Interest Rates
8 Inflation and Prices
10 Labor Markets
12 Consumer Spending
14 Investment Spending
16 Government Revenues, Spending, and Debt
18 International Trade
20 Productivity and Profits
22 Quick Reference Tables
27 Notes and Sources
Conventions used in this publication:
1. Shaded areas indicate recessions, as determined by the National Bureau of Economic Research.
2. Percent change refers to simple percent changes. Percent change from year ago refers to the percent change from thesame month or quarter during the previous year. Compounded annual rate of change shows what the growth rate wouldbe over an entire year if the same simple percent change continued for four quarters or twelve months. The compoundedannual rate of change of x between the previous quarter t –1 and the current quarter t is: [(xt /xt – 1)4–1] × 100.For monthly data replace 4 with 12.
3. All data with significant seasonal patterns are adjusted accordingly, unless labeled NSA.
We welcome your comments addressed to:
Editor, National Economic TrendsResearch DivisionFederal Reserve Bank of St. LouisP.O. Box 442St. Louis, MO 63166-0442
or to:
National Economic Trends is published by the Research Division of the Federal Reserve Bank of St. Louis. Visit the Research Division’s website at research.stlouisfed.org/publications/net todownload the current version of this publication or register for e-mail notification updates. For more information on data in this publication, please visit research.stlouisfed.org/fred2 or call(314) 444-8573.

National Economic Trendsupdated through12/01/04
3Research DivisionFederal Reserve Bank of St. Louis
2001 2002 2003 2004
Compounded annual rates of change
Real GDP Growth
-2
0
2
4
6
8
10
14976 15341 15706 16071 164372001 2002 2003 2004
Percent change
Consumer Price Index
-0.4
-0.2
0.0
0.2
0.4
0.6
0.8
14976 15341 15706 16071 16437
2001 2002 2003 2004
Percent change
Industrial Production
-1.0
-0.5
0.0
0.5
1.0
1.5
14976 15341 15706 16071 164372001 2002 2003 2004
Percent
10-YearTreasury
3-MonthTreasury
Interest Rates
0
1
2
3
4
5
6
7
14976 15341 15706 16071 16437
2001 2002 2003 2004
Thousands
Change in Nonfarm Payrolls
-400
-300
-200
-100
0
100
200
300
400
14976 15341 15706 16071 164372001 2002 2003 2004
Percent of labor force
Unemployment Rate
3.5
4.0
4.5
5.0
5.5
6.0
6.5
14976 15341 15706 16071 16437

National Economic Trendsupdated through
12/01/04
4Research Division
Federal Reserve Bank of St. Louis
79 80 81 82 83 84 85 86 87 88 89 90 91 92 93 94 95 96 97 98 99 00 01 02 03 04
Percent change from year ago
Real Gross Domestic Product
-5
0
5
10
79 80 81 82 83 84 85 86 87 88 89 90 91 92 93 94 95 96 97 98 99 00 01 02 03 04 05
79 80 81 82 83 84 85 86 87 88 89 90 91 92 93 94 95 96 97 98 99 00 01 02 03 04
Percent change from year ago Index
Industrial Production(left scale)
ISM(right scale)
Industrial Production and Institute for Supply Management (ISM) Indexes
-18
-12
-6
0
6
12
18
79 80 81 82 83 84 85 86 87 88 89 90 91 92 93 94 95 96 97 98 99 00 01 02 03 04 05
26
34
42
50
58
66
74
79 80 81 82 83 84 85 86 87 88 89 90 91 92 93 94 95 96 97 98 99 00 01 02 03 04
Percent change from year ago
Aggregate Private Nonfarm Hours
-8
-4
0
4
8
12
79 80 81 82 83 84 85 86 87 88 89 90 91 92 93 94 95 96 97 98 99 00 01 02 03 04 05
79 80 81 82 83 84 85 86 87 88 89 90 91 92 93 94 95 96 97 98 99 00 01 02 03 04
Percent of GDP
Real Change in Private Inventories
-2
-1
0
1
2
79 80 81 82 83 84 85 86 87 88 89 90 91 92 93 94 95 96 97 98 99 00 01 02 03 04 05
National Economic Trendsupdated through12/01/04
5Research DivisionFederal Reserve Bank of St. Louis
2002 2003 2004
Compounded annual rates of change
FinalSales
GDP (bar)
Real Final Sales and GDP
-2
0
2
4
6
8
10
15341 15706 16071 16437
2002 2003 2004
Percent change Index
ISM(right scale)
Industrial Production (bar)(left scale)
Industrial Production and ISM Index
-1.8
-1.2
-0.6
0.0
0.6
1.2
1.8
15341 15706 16071 16437
32
38
44
50
56
62
68
2002 2003 2004
Compounded annual rates of change
Nominal Gross Domestic Product
0
2
4
6
8
10
12
15341 15706 16071 16437
2002 2003 2004
Percent change
Aggregate Private Nonfarm Hours
-1.25
-1.00
-0.75
-0.50
-0.25
0.00
0.25
0.50
0.75
1.00
15341 15706 16071 164372002 2003 2004
Hours
Average Weekly Private Nonfarm Hours
33.25
33.50
33.75
34.00
34.25
15341 15706 16071 16437
2002 2003 2004
Billions of 2000 dollars
Real Change in Private Inventories
-30
-15
0
15
30
45
60
75
15341 15706 16071 164372002 2003 2004
Manufacturing and trade
Inventory-Sales Ratio
1.28
1.30
1.32
1.34
1.36
1.38
1.40
1.42
1.44
15341 15706 16071 16437
Compounded annual rates of change
Real GDP Revisions
AdvancePreliminaryFinalAnnual Revision
0123456789
101112
2003:3 2003:4 2004:1 2004:2 2004:3
National Economic Trendsupdated through
11/30/04
6Research Division
Federal Reserve Bank of St. Louis
Contribution of Components to Real GDP GrowthPercentage points at compounded annual rates
Consumption Exports Government
Imports Inventories Investment
-6
-4
-2
0
2
4
6
8
10
02Q4 03Q1 03Q2 03Q3 03Q4 04Q1 04Q2 04Q3
Final Sales 0.67 2.38 5.12 6.84 3.72 3.32 2.52 4.86
Consumption 1.74 1.84 2.72 3.58 2.50 2.90 1.10 3.53
Fixed Investment -0.13 0.35 1.55 2.59 1.57 0.69 2.07 1.37
Nonresidential -0.33 -0.01 1.10 1.50 1.07 0.42 1.21 1.27
Residential 0.20 0.36 0.44 1.09 0.50 0.27 0.86 0.10
Federal 0.58 0.04 1.40 -0.23 0.33 0.48 0.18 0.32
Government 0.75 0.05 1.35 0.03 0.31 0.48 0.41 0.23
State and Local 0.17 0.02 -0.05 0.26 -0.02 0.00 0.23 -0.09
Imports -1.27 0.29 -0.34 -0.39 -2.22 -1.46 -1.77 -0.89
Change in Inventory 0.07 -0.45 -1.01 0.57 0.47 1.17 0.78 -0.91
Exports -0.42 -0.15 -0.15 1.02 1.55 0.70 0.70 0.62
Net Exports -1.69 0.14 -0.50 0.64 -0.66 -0.76 -1.06 -0.27
Residual 0.13 0.09 0.05 -0.10 0.02 0.02 0.01 -0.09
Real GDP Growth 0.74 1.93 4.11 7.41 4.19 4.49 3.30 3.95
Contributions to Real GDP Growth Rate
4th 1st 2nd 3rd 4th 1st 2nd 3rd
200420032002
National Economic Trendsupdated through12/01/04
7Research DivisionFederal Reserve Bank of St. Louis
79 80 81 82 83 84 85 86 87 88 89 90 91 92 93 94 95 96 97 98 99 00 01 02 03 04
Percent
10-Year Treasury
3-Month Treasury
Interest Rates
0
3
6
9
12
15
18
79 80 81 82 83 84 85 86 87 88 89 90 91 92 93 94 95 96 97 98 99 00 01 02 03 04 05
79 80 81 82 83 84 85 86 87 88 89 90 91 92 93 94 95 96 97 98 99 00 01 02 03 04
Percent change from year ago
Standard and Poor's 500 Index with Reinvested Dividends
-50
-25
0
25
50
75
79 80 81 82 83 84 85 86 87 88 89 90 91 92 93 94 95 96 97 98 99 00 01 02 03 04 05
3m . 1y 2y 5y 7y 10y
Percent
Week Ending: 11/26/2004
Nov 2004
Nov 2003
Treasury Yield Curve
0.25
0.75
1.25
1.75
2.25
2.75
3.25
3.75
4.25
4.75
5.25

National Economic Trendsupdated through
11/30/04
8Research Division
Federal Reserve Bank of St. Louis
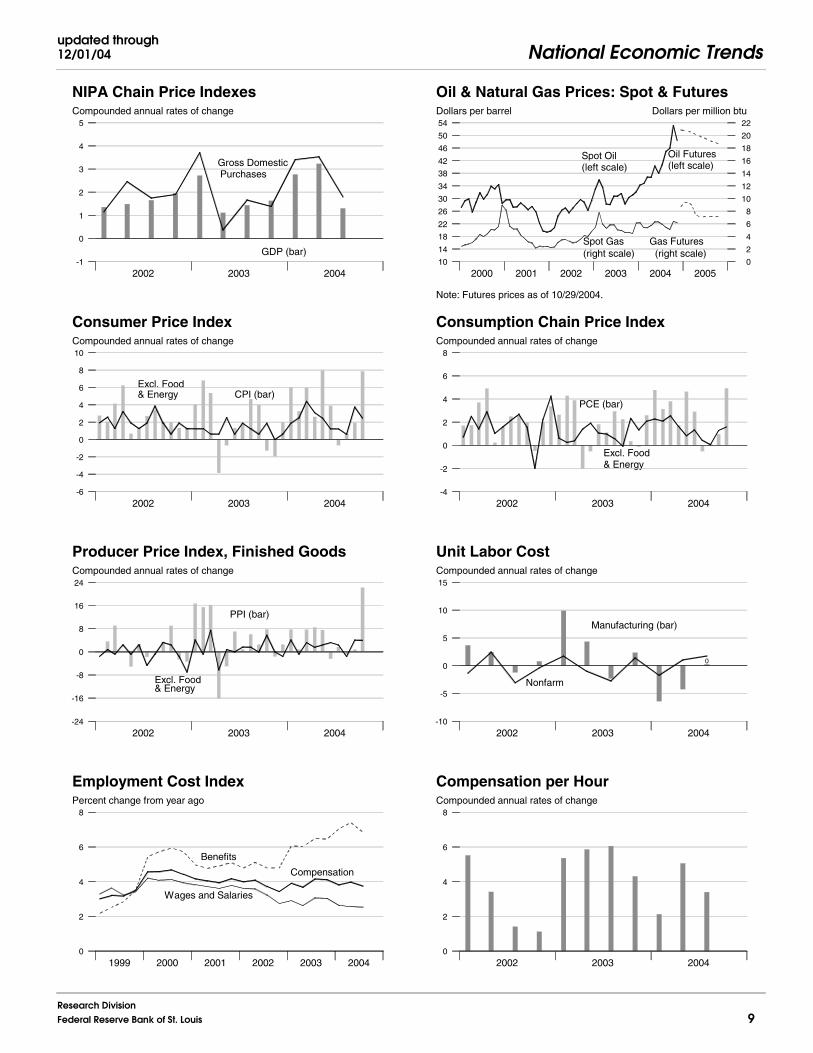
79 80 81 82 83 84 85 86 87 88 89 90 91 92 93 94 95 96 97 98 99 00 01 02 03 04
Percent change from year ago
GDP
Gross Domestic Purchases
NIPA Chain Price Indexes
0
2
4
6
8
10
12
79 80 81 82 83 84 85 86 87 88 89 90 91 92 93 94 95 96 97 98 99 00 01 02 03 04 05
79 80 81 82 83 84 85 86 87 88 89 90 91 92 93 94 95 96 97 98 99 00 01 02 03 04
Percent change from year ago
All Items
Excl. Foodand Energy
Consumer Price Index
0
3
6
9
12
15
79 80 81 82 83 84 85 86 87 88 89 90 91 92 93 94 95 96 97 98 99 00 01 02 03 04 05
79 80 81 82 83 84 85 86 87 88 89 90 91 92 93 94 95 96 97 98 99 00 01 02 03 04
Percent change from year ago
PPI
Excl. Foodand Energy
Producer Price Index, Finished Goods
-5
0
5
10
15
20
79 80 81 82 83 84 85 86 87 88 89 90 91 92 93 94 95 96 97 98 99 00 01 02 03 04 05
79 80 81 82 83 84 85 86 87 88 89 90 91 92 93 94 95 96 97 98 99 00 01 02 03 04
Percent change from year ago
ECI
Comp. per Hour
Employment Cost Index and Compensation per Hour
0
3
6
9
12
15
79 80 81 82 83 84 85 86 87 88 89 90 91 92 93 94 95 96 97 98 99 00 01 02 03 04 05
National Economic Trendsupdated through12/01/04
9Research DivisionFederal Reserve Bank of St. Louis
2002 2003 2004
Compounded annual rates of change
GDP (bar)
Gross DomesticPurchases
NIPA Chain Price Indexes
-1
0
1
2
3
4
5
15341 15706 16071 16437
2002 2003 2004
Compounded annual rates of change
CPI (bar)Excl. Food& Energy
Consumer Price Index
-6
-4
-2
0
2
4
6
8
10
15341 15706 16071 164372002 2003 2004
PCE (bar)
Excl. Food& Energy
Compounded annual rates of change
Consumption Chain Price Index
-4
-2
0
2
4
6
8
15341 15706 16071 16437
2002 2003 2004
Compounded annual rates of change
PPI (bar)
Excl. Food& Energy
Producer Price Index, Finished Goods
-24
-16
-8
0
8
16
24
15341 15706 16071 164372002 2003 2004
Compounded annual rates of change
Nonfarm
Manufacturing (bar)
Unit Labor Cost
-10
-5
0
5
10
15
15341 15706 16071 16437
0
2002 2003 2004
Compounded annual rates of change
Compensation per Hour
0
2
4
6
8
15341 15706 16071 16437
2000 2001 2002 2003 2004 2005
Dollars per barrel Dollars per million btu
Note: Futures prices as of 10/29/2004.
Spot Oil(left scale)
Oil Futures(left scale)
Spot Gas(right scale)
Gas Futures(right scale)
Oil & Natural Gas Prices: Spot & Futures
10
14
18
22
26
30
34
38
42
46
50
54
2000 2001 2002 2003 2004 2005 2006
0
2
4
6
8
10
12
14
16
18
20
22
1999 2000 2001 2002 2003 2004
Percent change from year ago
Compensation
Wages and Salaries
Benefits
Employment Cost Index
0
2
4
6
8
14245 14610 14976 15341 15706 16071 16437
National Economic Trendsupdated through
11/05/04
10Research Division
Federal Reserve Bank of St. Louis
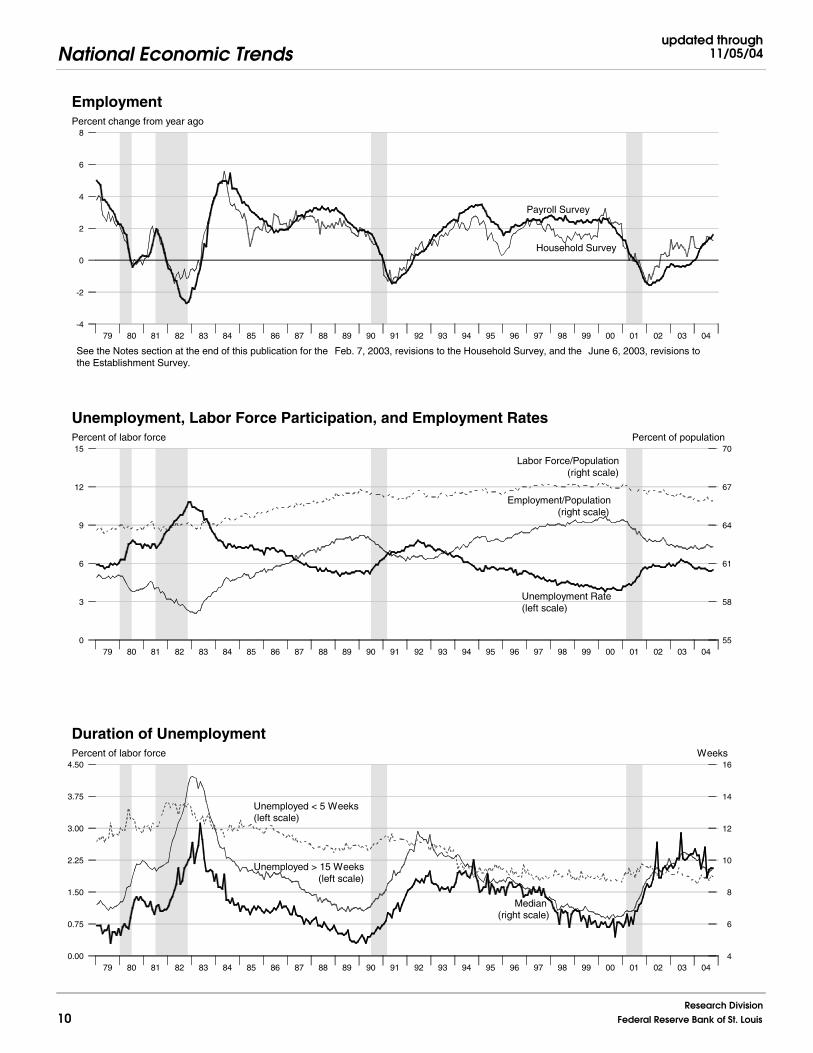
79 80 81 82 83 84 85 86 87 88 89 90 91 92 93 94 95 96 97 98 99 00 01 02 03 04
Percent change from year ago
Household Survey
Payroll Survey
See the Notes section at the end of this publication for the Feb. 7, 2003, revisions to the Household Survey, and the June 6, 2003, revisions tothe Establishment Survey.
Employment
-4
-2
0
2
4
6
8
79 80 81 82 83 84 85 86 87 88 89 90 91 92 93 94 95 96 97 98 99 00 01 02 03 04 05
79 80 81 82 83 84 85 86 87 88 89 90 91 92 93 94 95 96 97 98 99 00 01 02 03 04
Percent of labor force Percent of population
Unemployment Rate(left scale)
Employment/Population(right scale)
Labor Force/Population(right scale)
Unemployment, Labor Force Participation, and Employment Rates
0
3
6
9
12
15
79 80 81 82 83 84 85 86 87 88 89 90 91 92 93 94 95 96 97 98 99 00 01 02 03 04 05
55
58
61
64
67
70
79 80 81 82 83 84 85 86 87 88 89 90 91 92 93 94 95 96 97 98 99 00 01 02 03 04
Percent of labor force Weeks
Median(right scale)
Unemployed < 5 Weeks(left scale)
Unemployed > 15 Weeks(left scale)
Duration of Unemployment
0.00
0.75
1.50
2.25
3.00
3.75
4.50
79 80 81 82 83 84 85 86 87 88 89 90 91 92 93 94 95 96 97 98 99 00 01 02 03 04 05
4
6
8
10
12
14
16
National Economic Trendsupdated through11/24/04
11Research DivisionFederal Reserve Bank of St. Louis
2002 2003 2004
Thousands
Change in Nonfarm Payrolls
-300
-200
-100
0
100
200
300
400
15341 15706 16071 164372002 2003 2004
Thousands
Change in Manufacturing Payrolls
-150
-100
-50
0
50
15341 15706 16071 16437
2002 2003 2004
Thousands
Change in Household Employment
-700
-350
0
350
700
1050
15341 15706 16071 16437
90%
Con
fiden
ce
1999 2000 2001 2002 2003 2004
Percent of labor force
Available Labor Supply and Components
Want to Work
Unemployed
Available Labor Supply
2
3
4
5
6
7
8
9
10
11
14245 14610 14976 15341 15706 16071 16437
1999 2000 2001 2002 2003 2004
Percent change from year ago
Labor Force
Pop.
Labor Force and Population
-0.5
0.0
0.5
1.0
1.5
2.0
2.5
3.0
14245 14610 14976 15341 15706 16071 16437
1999 2000 2001 2002 2003 2004 2005
IndexPercent
Help-Wanted(right scale)
Unemployment Rate(left scale)
Unemployment Rate & Help-Wanted Index
1.5
2.0
2.5
3.0
3.5
4.0
4.5
5.0
5.5
6.0
6.5
7.0
7.5
8.0
14245 14610 14976 15341 15706 16071 16437 16802
30
35
40
45
50
55
60
65
70
75
80
85
90
95
90%
Con
fiden
ce
National Economic Trendsupdated through
11/30/04
12Research Division
Federal Reserve Bank of St. Louis
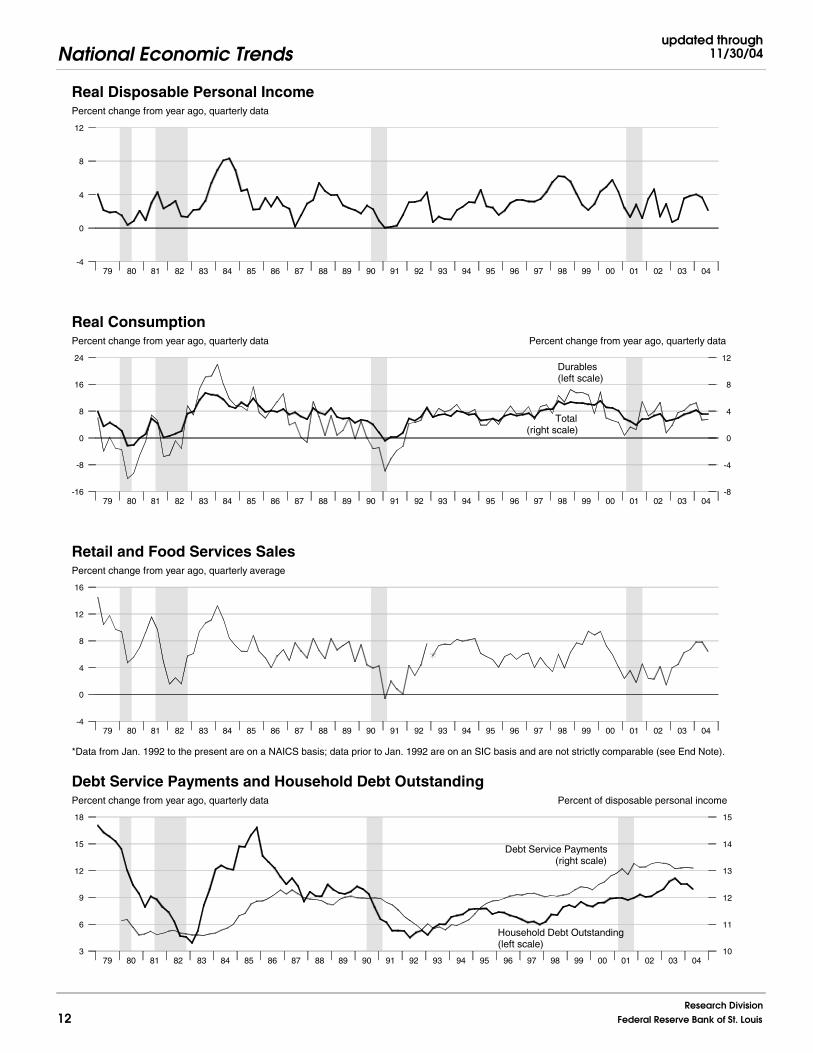
79 80 81 82 83 84 85 86 87 88 89 90 91 92 93 94 95 96 97 98 99 00 01 02 03 04
Percent change from year ago, quarterly data Percent change from year ago, quarterly data
Total(right scale)
Durables(left scale)
Real Consumption
-16
-8
0
8
16
24
79 80 81 82 83 84 85 86 87 88 89 90 91 92 93 94 95 96 97 98 99 00 01 02 03 04 05
-8
-4
0
4
8
12
79 80 81 82 83 84 85 86 87 88 89 90 91 92 93 94 95 96 97 98 99 00 01 02 03 04
Percent change from year ago, quarterly average
Retail and Food Services Sales
*Data from Jan. 1992 to the present are on a NAICS basis; data prior to Jan. 1992 are on an SIC basis and are not strictly comparable (see End Note).
-4
0
4
8
12
16
79 80 81 82 83 84 85 86 87 88 89 90 91 92 93 94 95 96 97 98 99 00 01 02 03 04 05
79 80 81 82 83 84 85 86 87 88 89 90 91 92 93 94 95 96 97 98 99 00 01 02 03 04
Percent change from year ago, quarterly data
Real Disposable Personal Income
-4
0
4
8
12
79 80 81 82 83 84 85 86 87 88 89 90 91 92 93 94 95 96 97 98 99 00 01 02 03 04 05
79 80 81 82 83 84 85 86 87 88 89 90 91 92 93 94 95 96 97 98 99 00 01 02 03 04
Percent change from year ago, quarterly data Percent of disposable personal income
Debt Service Payments(right scale)
Household Debt Outstanding(left scale)
Debt Service Payments and Household Debt Outstanding
3
6
9
12
15
18
79 80 81 82 83 84 85 86 87 88 89 90 91 92 93 94 95 96 97 98 99 00 01 02 03 04 05
10
11
12
13
14
15
National Economic Trendsupdated through12/01/04
13Research DivisionFederal Reserve Bank of St. Louis
2002 2003 2004
Compounded annual rates of change
Real Consumption
0
2
4
6
8
15341 15706 16071 164372002 2003 2004
Percent change
Real Consumption
-1.6
-0.8
0.0
0.8
1.6
15341 15706 16071 16437
2002 2003 2004
Percent change
Total (bar)
Ex. Autos
Retail & Food Services
-2
-1
0
1
2
3
15341 15706 16071 16437
2002 2003 2004
Percent change
Real Disposable Personal Income
-2
-1
0
1
2
3
15341 15706 16071 16437
2002 2003 2004
Millions of vehicles, annual ratePercent change
Autos and Light Trucks(right scale)
Durables (bar)(left scale)
Real Durables Consumption & Vehicle Sales
-6
-3
0
3
6
9
15341 15706 16071 16437
15
16
17
18
19
20
2002 2003 2004
Compounded annual rates of change
Real Durables Consumption
-10
0
10
20
30
15341 15706 16071 16437
1999 2000 2001 2002 2003 2004
Percent
Personal Saving Rate
-2
0
2
4
6
14245 14610 14976 15341 15706 16071 16437
1999 2000 2001 2002 2003 2004
Index
Consumer Sentiment (U. of Michigan)
70
80
90
100
110
120
14245 14610 14976 15341 15706 16071 16437

National Economic Trendsupdated through
11/30/04
14Research Division
Federal Reserve Bank of St. Louis
79 80 81 82 83 84 85 86 87 88 89 90 91 92 93 94 95 96 97 98 99 00 01 02 03 04
Percent of nominal GDP
Total
Private
Investment
12
14
16
18
20
22
24
79 80 81 82 83 84 85 86 87 88 89 90 91 92 93 94 95 96 97 98 99 00 01 02 03 04 05
79 80 81 82 83 84 85 86 87 88 89 90 91 92 93 94 95 96 97 98 99 00 01 02 03 04
Percent change from year ago
Private Fixed Investment
Real
Nominal
-18
-12
-6
0
6
12
18
24
30
79 80 81 82 83 84 85 86 87 88 89 90 91 92 93 94 95 96 97 98 99 00 01 02 03 04 05
79 80 81 82 83 84 85 86 87 88 89 90 91 92 93 94 95 96 97 98 99 00 01 02 03 04
Percent change from year ago
Nonresidential
Equipment &Software
Real Nonresidential Fixed and Equipment & Software Investment
-15
-10
-5
0
5
10
15
20
25
79 80 81 82 83 84 85 86 87 88 89 90 91 92 93 94 95 96 97 98 99 00 01 02 03 04 05
79 80 81 82 83 84 85 86 87 88 89 90 91 92 93 94 95 96 97 98 99 00 01 02 03 04
Percent change from year ago
Real Residential Fixed Investment
-40
-20
0
20
40
60
79 80 81 82 83 84 85 86 87 88 89 90 91 92 93 94 95 96 97 98 99 00 01 02 03 04 05

National Economic Trendsupdated through12/02/04
15Research DivisionFederal Reserve Bank of St. Louis
79 80 81 82 83 84 85 86 87 88 89 90 91 92 93 94 95 96 97 98 99 00 01 02 03 04
Gross Govt. Saving
Gross Private Saving
BOCA
Percent of GDP
Gross Saving Rates and Balance on Current Account (NIPA)
-10
-5
0
5
10
15
20
25
79 80 81 82 83 84 85 86 87 88 89 90 91 92 93 94 95 96 97 98 99 00 01 02 03 04 05
2002 2003 2004
Compounded annual rates of change
Real Private Fixed Investment
-6
-3
0
3
6
9
12
15
18
21
15341 15706 16071 16437
2002 2003 2004
Compounded annual rates of change
Real Equipment & Software Investment
-10
-5
0
5
10
15
20
25
15341 15706 16071 164372002 2003 2004
Compounded annual rates of change
Real Nonresidential Fixed Investment
-15
-10
-5
0
5
10
15
20
15341 15706 16071 16437
2002 2003 2004
Compounded annual rates of change
Real Residential Fixed Investment
-5
0
5
10
15
20
25
15341 15706 16071 164372002 2003 2004
Millions, annual rate Millions, annual rate
Housing Starts(left scale)
New Home Sales(right scale)
Housing Starts and New Home Sales
1.3
1.5
1.7
1.9
2.1
2.3
2.5
2.7
2.9
3.1
15341 15706 16071 16437
0.76
0.84
0.92
1.00
1.08
1.16
1.24
1.32
1.40
1.48
1999 2000 2001 2002 2003 2004
Percent change from year ago, excluding aircraft
Orders
Equipment & SoftwareInvestment
Nondefense Capital Goods Orders
-30
-20
-10
0
10
20
30
14245 14610 14976 15341 15706 16071 16437

National Economic Trendsupdated through
11/30/04
16Research Division
Federal Reserve Bank of St. Louis
Billions of 2000 dollars
Total
Federal
State & Local
Govt. Consumption and Investment
200
400
600
800
1000
1200
1400
1600
1800
2000
80 82 84 86 88 90 92 94 96 98 00 02 04 06
Percent of GDP
Total Receipts
Total Expenditures
Fed. Receipts
Fed. Expenditures
Govt. Current Receipts and Expenditures
15
20
25
30
35
80 82 84 86 88 90 92 94 96 98 00 02 04 06
1991 789.2 793.3 -4.1 1101.3 1315.0 -213.7 1055.0 1324.4 -269.3
1992 845.7 845.0 0.7 1147.2 1444.6 -297.4 1091.3 1381.7 -290.4
1993 886.9 886.0 0.9 1222.5 1496.0 -273.5 1154.4 1409.5 -255.1
1994 942.9 932.4 10.5 1320.8 1533.1 -212.3 1258.6 1461.9 -203.3
1995 990.2 978.2 12.0 1406.5 1603.5 -197.0 1351.8 1515.8 -164.0
1996 1043.3 1017.5 25.8 1524.0 1665.8 -141.8 1453.1 1560.5 -107.5
1997 1097.4 1058.3 39.1 1653.1 1708.9 -55.8 1579.3 1601.3 -22.0
1998 1163.2 1111.2 52.0 1773.8 1734.9 38.9 1721.8 1652.6 69.2
1999 1236.7 1186.3 50.4 1891.2 1787.6 103.6 1827.5 1701.9 125.6
2000 1319.5 1269.5 50.0 2053.8 1864.4 189.4 2025.2 1788.8 236.4
2001 1373.0 1368.2 4.8 2016.2 1969.5 46.7 1991.2 1863.8 127.4
2002 1411.9 1436.9 -25.0 1847.3 2101.8 -254.5 1853.2 2011.0 -157.8
2003 1494.9 1498.1 -3.2 1877.0 2241.6 -364.6 1782.3 2157.1 -374.8
2001Q4 1372.5 1403.1 -30.6 1999.6 2004.3 -4.7 466.3 501.7 -35.4
2002Q1 1380.9 1409.8 -28.9 1844.6 2053.1 -208.5 412.6 509.2 -96.6
2002Q2 1404.1 1427.7 -23.6 1850.5 2102.1 -251.6 522.6 506.9 15.6
2002Q3 1423.9 1445.3 -21.4 1847.9 2103.1 -255.2 451.7 493.2 -41.5
2002Q4 1438.5 1464.8 -26.3 1846.2 2148.8 -302.6 427.3 535.6 -108.2
2003Q1 1437.7 1486.6 -48.9 1888.6 2170.2 -281.6 397.7 542.6 -144.9
2003Q2 1484.6 1490.2 -5.6 1902.5 2266.9 -364.4 527.6 544.2 -16.6
2003Q3 1511.4 1504.9 6.5 1816.4 2249.4 -433.0 429.4 536.9 -107.4
2003Q4 1545.8 1510.5 35.3 1900.6 2279.8 -379.2 440.8 570.9 -130.2
2004Q1 1550.6 1538.8 11.8 1915.3 2306.3 -391.0 409.6 580.4 -170.8
2004Q2 1583.9 1565.7 18.2 1949.1 2329.1 -380.0 549.9 575.6 -25.7
2004Q3 1576.9 1568.5 8.4 1963.9 2340.1 -376.2 479.5 565.2 -85.7
Government BudgetsBillions of dollars
Receipts ExpendituresSurplus orDeficit (-) Receipts Expenditures
Surplus orDeficit (-) Receipts Outlays
Surplus orDeficit (-)
State and Local Federal Federal
National Income AccountsCalendar Years
Unified BudgetFiscal Years
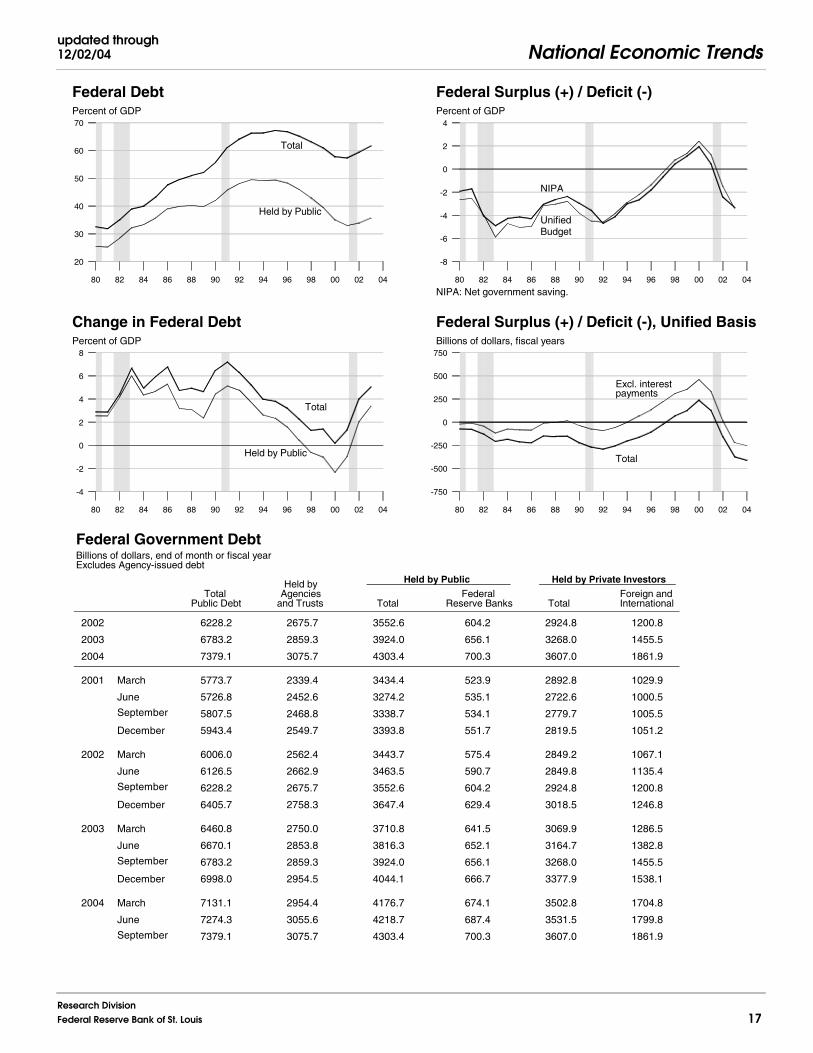
National Economic Trendsupdated through12/02/04
17Research DivisionFederal Reserve Bank of St. Louis
Percent of GDP
Total
Held by Public
Federal Debt
20
30
40
50
60
70
80 82 84 86 88 90 92 94 96 98 00 02 04
Percent of GDP
Total
Held by Public
Change in Federal Debt
-4
-2
0
2
4
6
8
80 82 84 86 88 90 92 94 96 98 00 02 04
Percent of GDP
NIPA
UnifiedBudget
Federal Surplus (+) / Deficit (-)
NIPA: Net government saving.
-8
-6
-4
-2
0
2
4
80 82 84 86 88 90 92 94 96 98 00 02 04
Billions of dollars, fiscal years
Total
Excl. interestpayments
Federal Surplus (+) / Deficit (-), Unified Basis
-750
-500
-250
0
250
500
750
80 82 84 86 88 90 92 94 96 98 00 02 04
2002 6228.2 2675.7 3552.6 604.2 2924.8 1200.8
2003 6783.2 2859.3 3924.0 656.1 3268.0 1455.5
2004 7379.1 3075.7 4303.4 700.3 3607.0 1861.9
2001 March 5773.7 2339.4 3434.4 523.9 2892.8 1029.9
June 5726.8 2452.6 3274.2 535.1 2722.6 1000.5
September 5807.5 2468.8 3338.7 534.1 2779.7 1005.5
December 5943.4 2549.7 3393.8 551.7 2819.5 1051.2
2002 March 6006.0 2562.4 3443.7 575.4 2849.2 1067.1
June 6126.5 2662.9 3463.5 590.7 2849.8 1135.4
September 6228.2 2675.7 3552.6 604.2 2924.8 1200.8
December 6405.7 2758.3 3647.4 629.4 3018.5 1246.8
2003 March 6460.8 2750.0 3710.8 641.5 3069.9 1286.5
June 6670.1 2853.8 3816.3 652.1 3164.7 1382.8
September 6783.2 2859.3 3924.0 656.1 3268.0 1455.5
December 6998.0 2954.5 4044.1 666.7 3377.9 1538.1
2004 March 7131.1 2954.4 4176.7 674.1 3502.8 1704.8
June 7274.3 3055.6 4218.7 687.4 3531.5 1799.8
September 7379.1 3075.7 4303.4 700.3 3607.0 1861.9
Federal Government DebtBillions of dollars, end of month or fiscal yearExcludes Agency-issued debt
Held by Public Held by Private Investors
TotalPublic Debt
Held byAgencies
and Trusts TotalFederal
Reserve Banks TotalForeign andInternational
National Economic Trendsupdated through
12/01/04
18Research Division
Federal Reserve Bank of St. Louis
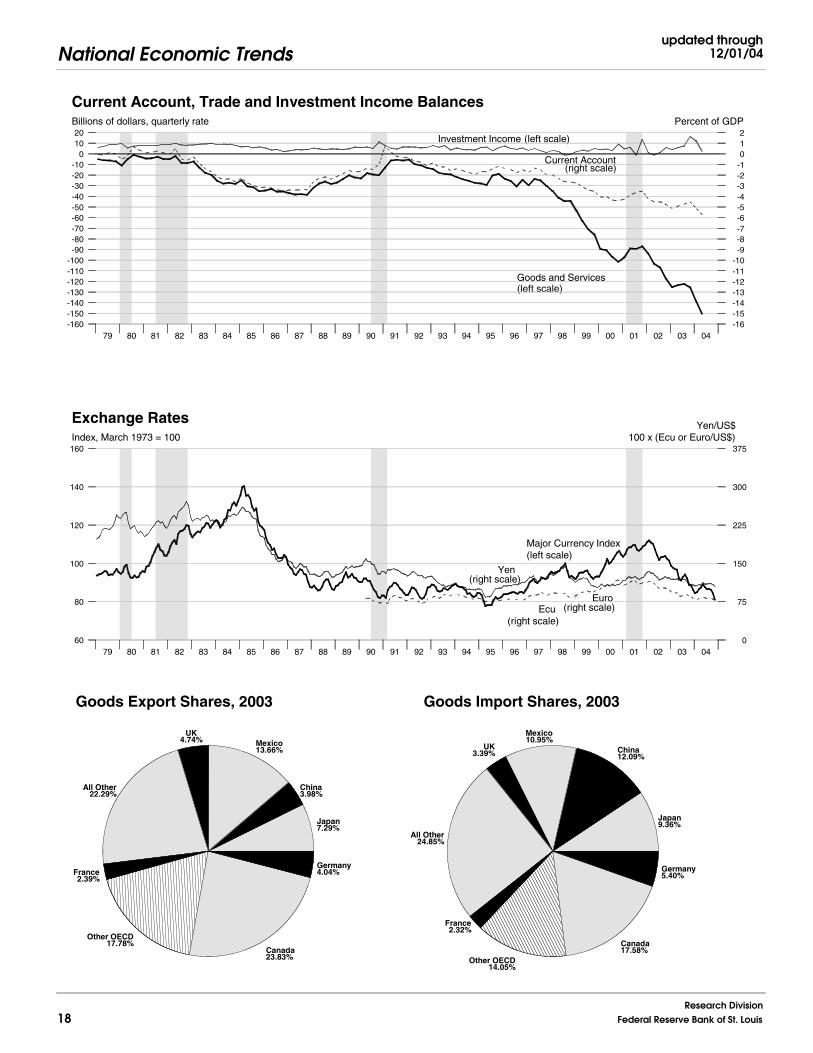
Goods Export Shares, 2003
Japan7.29%
China3.98%
Mexico13.66%
UK4.74%
All Other22.29%
France2.39%
Other OECD17.78%
Canada23.83%
Germany4.04%
Goods Import Shares, 2003
Japan9.36%
China12.09%
Mexico10.95%
UK3.39%
All Other24.85%
France2.32%
Other OECD14.05%
Canada17.58%
Germany5.40%
79 80 81 82 83 84 85 86 87 88 89 90 91 92 93 94 95 96 97 98 99 00 01 02 03 04
Billions of dollars, quarterly rate Percent of GDP
Investment Income (left scale)
Goods and Services(left scale)
Current Account(right scale)
Current Account, Trade and Investment Income Balances
-160-150-140-130-120-110-100
-90-80-70-60-50-40-30-20-10
01020
79 80 81 82 83 84 85 86 87 88 89 90 91 92 93 94 95 96 97 98 99 00 01 02 03 04 05
-16-15-14-13-12-11-10
-9-8-7-6-5-4-3-2-1012
79 80 81 82 83 84 85 86 87 88 89 90 91 92 93 94 95 96 97 98 99 00 01 02 03 04
Index, March 1973 = 100
Major Currency Index(left scale)
Yen/US$
Yen(right scale)
100 x (Ecu or Euro/US$)
Ecu (right scale)Euro
(right scale)
Exchange Rates
60
80
100
120
140
160
79 80 81 82 83 84 85 86 87 88 89 90 91 92 93 94 95 96 97 98 99 00 01 02 03 04 05
0
75
150
225
300
375

National Economic Trendsupdated through11/10/04
19Research DivisionFederal Reserve Bank of St. Louis
2002 2003 2004
Billions of dollars
Goods and Services
Goods
Trade Balance
-65-60-55-50-45-40-35-30-25-20-15-10
-50
15341 15706 16071 16437
2002 2003 2004
Billions of dollars
Current Account Balance
-180
-160
-140
-120
-100
-80
-60
-40
-20
0
15341 15706 16071 16437
2002 2003 2004
Percent change from year ago
Imports
Exports
Goods Trade
-20
-15
-10
-5
0
5
10
15
20
25
15341 15706 16071 16437
2002 2003 2004
Percent change from year ago
Imports
Exports
Services Trade
-20
-15
-10
-5
0
5
10
15
20
15341 15706 16071 16437
2002 2003 2004
United Kingdom
Real GDP Growth of Major Trading PartnersCompounded annual rates of change
-2
0
2
4
6
02 03 04 05
2002 2003 2004
Japan
-6
0
6
12
02 03 04 05
2002 2003 2004
Germany
-2
0
2
4
02 03 04 05
2002 2003 2004
France
-4
-2
0
2
4
6
02 03 04 052002 2003 2004
Canada
-2
0
2
4
6
02 03 04 05
2002 2003 2004
Mexico
-20
-10
0
10
20
30
02 03 04 05

National Economic Trendsupdated through
11/17/04
20Research Division
Federal Reserve Bank of St. Louis
79 80 81 82 83 84 85 86 87 88 89 90 91 92 93 94 95 96 97 98 99 00 01 02 03 04
Percent change from year ago Percent
Output/Hour(left scale)
Utilization Rate (level)(right scale)
Output per Hour and Capacity Utilization, Manufacturing
*Data from 1987 to the present are on a NAICS basis; data prior to 1987 are on an SIC basis and are not strictly comparable (see End Note).
-5
0
5
10
15
79 80 81 82 83 84 85 86 87 88 89 90 91 92 93 94 95 96 97 98 99 00 01 02 03 04 05
50
60
70
80
90
79 80 81 82 83 84 85 86 87 88 89 90 91 92 93 94 95 96 97 98 99 00 01 02 03 04
Percent change from year ago
Nominal
Real
Nonfarm Compensation per Hour
-5
0
5
10
15
79 80 81 82 83 84 85 86 87 88 89 90 91 92 93 94 95 96 97 98 99 00 01 02 03 04 05
79 80 81 82 83 84 85 86 87 88 89 90 91 92 93 94 95 96 97 98 99 00 01 02 03 04
Percent change from year ago
Nonfarm Business Sector
Nonfinancial Corporations
Output per Hour, Nonfarm Business and Nonfinancial Corporations
-3
0
3
6
9
79 80 81 82 83 84 85 86 87 88 89 90 91 92 93 94 95 96 97 98 99 00 01 02 03 04 05
National Economic Trendsupdated through11/30/04
21Research DivisionFederal Reserve Bank of St. Louis
2002 2003 2004
Compounded annual rates of change
Nonfarm Output per Hour
-2
0
2
4
6
8
10
15341 15706 16071 164372002 2003 2004
Compounded annual rates of change
Manufacturing Output per Hour
-2
0
2
4
6
8
10
12
15341 15706 16071 16437
79 80 81 82 83 84 85 86 87 88 89 90 91 92 93 94 95 96 97 98 99 00 01 02 03 04
Percent Percent
Compensation(right scale)
Corporate Profits(left scale)
Proprietors' Income(left scale)
Selected Component Shares of National Income
1
3
5
7
9
11
13
15
79 80 81 82 83 84 85 86 87 88 89 90 91 92 93 94 95 96 97 98 99 00 01 02 03 04 05
61
63
65
67
69
71
73
75
79 80 81 82 83 84 85 86 87 88 89 90 91 92 93 94 95 96 97 98 99 00 01 02 03 04
Percent of GDP
Profits (Before Tax)
Profits (After Tax)
Corporate Profits
0
2
4
6
8
10
12
79 80 81 82 83 84 85 86 87 88 89 90 91 92 93 94 95 96 97 98 99 00 01 02 03 04 05

National Economic Trendsupdated through
11/30/04
22Research Division
Federal Reserve Bank of St. Louis
2000. 9817.0 . 5.9 9817.000 . 3.7 9760.500 . 3.8 . 56.500
2001. 10100.8 . 2.9 9866.600 . 0.5 9901.100 . 1.4 . -36.000
2002. 10480.8 . 3.8 10083.000 . 2.2 10076.900 . 1.8 . 5.700
2003. 10987.9 . 4.8 10398.000 . 3.1 10395.000 . 3.2 . -0.700
2001 1 10021.5 2.8 4.1 9875.600 -0.5 1.9 9883.200 1.6 2.2 -7.800 47.800
. 2 10128.9 4.4 3.1 9905.900 1.2 0.6 9908.700 1.0 1.6 -2.500 22.350
. 3 10135.1 0.2 2.8 9871.100 -1.4 0.4 9899.900 -0.4 1.2 -29.900 0.825
. 4 10226.3 3.6 2.7 9910.000 1.6 0.2 9992.300 3.8 1.5 -86.700 -31.725
2002 1 10338.2 4.4 3.2 9993.500 3.4 1.2 10000.400 0.3 1.2 -7.400 -31.625
. 2 10445.7 4.2 3.1 10052.600 2.4 1.5 10044.900 1.8 1.4 7.900 -29.025
. 3 10546.5 3.9 4.1 10117.300 2.6 2.5 10095.200 2.0 2.0 22.700 -15.875
. 4 10617.5 2.7 3.8 10135.900 0.7 2.3 10112.500 0.7 1.2 23.800 11.750
2003 1 10744.6 4.9 3.9 10184.400 1.9 1.9 10173.300 2.4 1.7 9.600 16.000
. 2 10884.0 5.3 4.2 10287.400 4.1 2.3 10302.500 5.2 2.6 -17.600 9.625
. 3 11116.7 8.8 5.4 10472.800 7.4 3.5 10473.900 6.8 3.8 -3.500 3.075
. 4 11270.9 5.7 6.2 10580.700 4.2 4.4 10569.600 3.7 4.5 8.600 -0.725
2004 1 11472.6 7.4 6.8 10697.500 4.5 5.0 10655.800 3.3 4.7 40.000 6.875
. 2 11657.5 6.6 7.1 10784.700 3.3 4.8 10722.300 2.5 4.1 61.100 26.550
. 3 11810.0 5.3 6.2 10889.700 3.9 4.0 10852.000 4.9 3.6 35.900 36.400
2000. 6739.400 . 4.7 863.300 . 7.3 1679.000 . 6.5 1232.100 . 8.7
2001. 6904.600 . 2.5 899.100 . 4.1 1625.700 . -3.2 1176.800 . -4.5
2002. 7140.400 . 3.4 957.200 . 6.5 1565.800 . -3.7 1092.600 . -7.2
2003. 7365.200 . 3.1 1027.500 . 7.3 1635.200 . 4.4 1125.500 . 3.0
2001 1 6853.100 1.7 2.9 879.500 6.7 0.8 1678.200 -2.6 1.6 1234.400 -4.3 3.2
. 2 6870.300 1.0 2.5 878.900 -0.3 3.2 1640.500 -8.7 -2.9 1190.200 -13.6 -3.9
. 3 6900.500 1.8 2.0 885.600 3.1 2.5 1621.900 -4.5 -3.8 1169.300 -6.8 -6.1
. 4 7017.600 7.0 2.8 958.700 37.3 10.8 1577.000 -10.6 -6.7 1128.200 -13.3 -9.6
2002 1 7049.700 1.8 2.9 937.800 -8.4 6.6 1559.600 -4.3 -7.1 1099.800 -9.7 -10.9
. 2 7099.200 2.8 3.3 947.800 4.3 7.8 1545.900 -3.5 -5.8 1072.400 -9.6 -9.9
. 3 7149.900 2.9 3.6 979.300 14.0 10.6 1546.600 0.2 -4.6 1069.500 -1.1 -8.5
. 4 7194.600 2.5 2.5 973.400 -2.4 1.5 1543.500 -0.8 -2.1 1060.900 -3.2 -6.0
2003 1 7242.200 2.7 2.7 973.200 -0.1 3.8 1552.700 2.4 -0.4 1060.500 -0.2 -3.6
. 2 7311.400 3.9 3.0 1020.000 20.7 7.6 1593.400 10.9 3.1 1090.600 11.8 1.7
. 3 7401.700 5.0 3.5 1059.600 16.5 8.2 1660.600 18.0 7.4 1131.100 15.7 5.8
. 4 7466.800 3.6 3.8 1069.700 3.9 9.9 1702.700 10.5 10.3 1161.000 11.0 9.4
2004 1 7543.000 4.1 4.2 1075.500 2.2 10.5 1721.400 4.5 10.9 1173.000 4.2 10.6
. 2 7572.400 1.6 3.6 1074.700 -0.3 5.4 1778.300 13.9 11.6 1207.900 12.4 10.8
. 3 7666.800 5.1 3.6 1118.200 17.2 5.5 1816.300 8.8 9.4 1245.300 13.0 10.1
Nominal GDPPercent change
Billionsof $
Annualrate
Yearago
Real GDP Percent change
Billionsof 2000 $
Annualrate
Yearago
Final Sales Percent change
Billionsof 2000 $
Annualrate
Yearago
Change inPrivate Inventories Billions of 2000 $ Last qtr Year/Year ago
Consumption Percent change
Billionsof 2000 $
Annualrate
Yearago
Durables Consumption Percent change
Billionsof 2000 $
Annualrate
Yearago
Private Fixed Investment Percent change
Billionsof 2000 $
Annualrate
Yearago
NonresidentialFixed Investment
Percent change
Billionsof 2000 $
Annualrate
Yearago
National Economic Trendsupdated through11/30/04
23Research DivisionFederal Reserve Bank of St. Louis
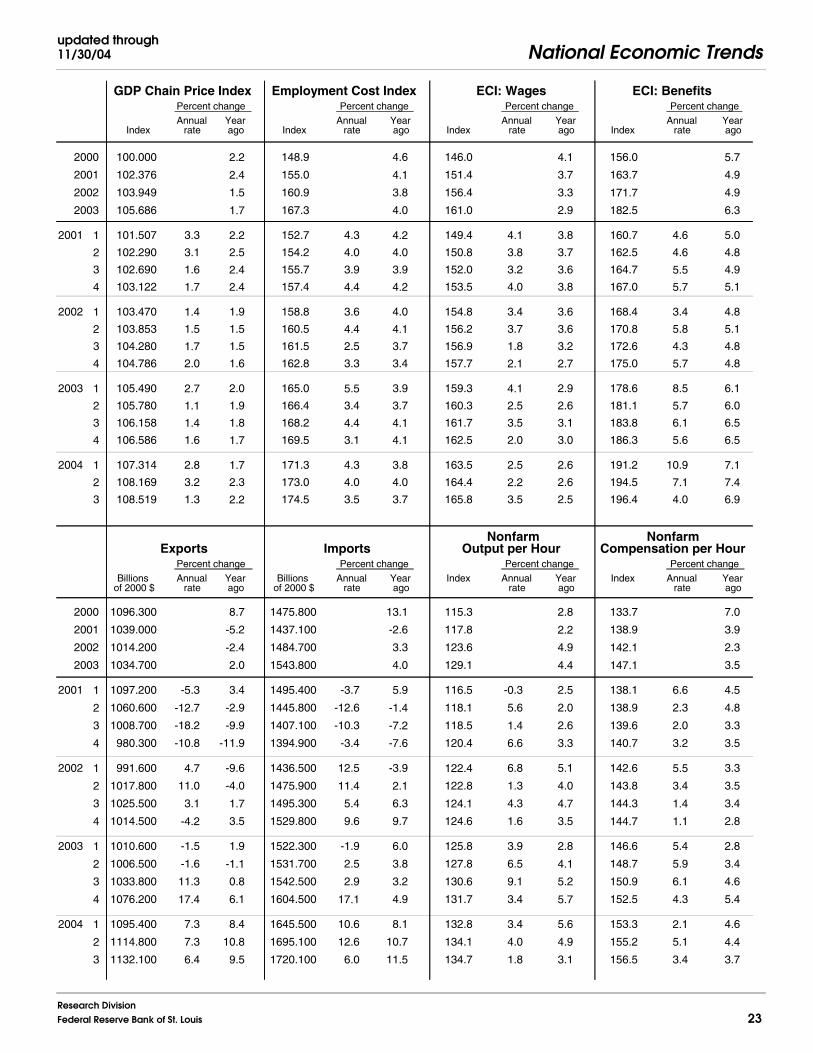
2000. 100.000 . 2.2 148.9 . 4.6 146.0 . 4.1 156.0 . 5.7
2001. 102.376 . 2.4 155.0 . 4.1 151.4 . 3.7 163.7 . 4.9
2002. 103.949 . 1.5 160.9 . 3.8 156.4 . 3.3 171.7 . 4.9
2003. 105.686 . 1.7 167.3 . 4.0 161.0 . 2.9 182.5 . 6.3
2001 1 101.507 3.3 2.2 152.7 4.3 4.2 149.4 4.1 3.8 160.7 4.6 5.0
. 2 102.290 3.1 2.5 154.2 4.0 4.0 150.8 3.8 3.7 162.5 4.6 4.8
. 3 102.690 1.6 2.4 155.7 3.9 3.9 152.0 3.2 3.6 164.7 5.5 4.9
. 4 103.122 1.7 2.4 157.4 4.4 4.2 153.5 4.0 3.8 167.0 5.7 5.1
2002 1 103.470 1.4 1.9 158.8 3.6 4.0 154.8 3.4 3.6 168.4 3.4 4.8
. 2 103.853 1.5 1.5 160.5 4.4 4.1 156.2 3.7 3.6 170.8 5.8 5.1
. 3 104.280 1.7 1.5 161.5 2.5 3.7 156.9 1.8 3.2 172.6 4.3 4.8
. 4 104.786 2.0 1.6 162.8 3.3 3.4 157.7 2.1 2.7 175.0 5.7 4.8
2003 1 105.490 2.7 2.0 165.0 5.5 3.9 159.3 4.1 2.9 178.6 8.5 6.1
. 2 105.780 1.1 1.9 166.4 3.4 3.7 160.3 2.5 2.6 181.1 5.7 6.0
. 3 106.158 1.4 1.8 168.2 4.4 4.1 161.7 3.5 3.1 183.8 6.1 6.5
. 4 106.586 1.6 1.7 169.5 3.1 4.1 162.5 2.0 3.0 186.3 5.6 6.5
2004 1 107.314 2.8 1.7 171.3 4.3 3.8 163.5 2.5 2.6 191.2 10.9 7.1
. 2 108.169 3.2 2.3 173.0 4.0 4.0 164.4 2.2 2.6 194.5 7.1 7.4
. 3 108.519 1.3 2.2 174.5 3.5 3.7 165.8 3.5 2.5 196.4 4.0 6.9
2000. 1096.300 . 8.7 1475.800 . 13.1 115.3 . 2.8 133.7 . 7.0
2001. 1039.000 . -5.2 1437.100 . -2.6 117.8 . 2.2 138.9 . 3.9
2002. 1014.200 . -2.4 1484.700 . 3.3 123.6 . 4.9 142.1 . 2.3
2003. 1034.700 . 2.0 1543.800 . 4.0 129.1 . 4.4 147.1 . 3.5
2001 1 1097.200 -5.3 3.4 1495.400 -3.7 5.9 116.5 -0.3 2.5 138.1 6.6 4.5
. 2 1060.600 -12.7 -2.9 1445.800 -12.6 -1.4 118.1 5.6 2.0 138.9 2.3 4.8
. 3 1008.700 -18.2 -9.9 1407.100 -10.3 -7.2 118.5 1.4 2.6 139.6 2.0 3.3
. 4 980.300 -10.8 -11.9 1394.900 -3.4 -7.6 120.4 6.6 3.3 140.7 3.2 3.5
2002 1 991.600 4.7 -9.6 1436.500 12.5 -3.9 122.4 6.8 5.1 142.6 5.5 3.3
. 2 1017.800 11.0 -4.0 1475.900 11.4 2.1 122.8 1.3 4.0 143.8 3.4 3.5
. 3 1025.500 3.1 1.7 1495.300 5.4 6.3 124.1 4.3 4.7 144.3 1.4 3.4
. 4 1014.500 -4.2 3.5 1529.800 9.6 9.7 124.6 1.6 3.5 144.7 1.1 2.8
2003 1 1010.600 -1.5 1.9 1522.300 -1.9 6.0 125.8 3.9 2.8 146.6 5.4 2.8
. 2 1006.500 -1.6 -1.1 1531.700 2.5 3.8 127.8 6.5 4.1 148.7 5.9 3.4
. 3 1033.800 11.3 0.8 1542.500 2.9 3.2 130.6 9.1 5.2 150.9 6.1 4.6
. 4 1076.200 17.4 6.1 1604.500 17.1 4.9 131.7 3.4 5.7 152.5 4.3 5.4
2004 1 1095.400 7.3 8.4 1645.500 10.6 8.1 132.8 3.4 5.6 153.3 2.1 4.6
. 2 1114.800 7.3 10.8 1695.100 12.6 10.7 134.1 4.0 4.9 155.2 5.1 4.4
. 3 1132.100 6.4 9.5 1720.100 6.0 11.5 134.7 1.8 3.1 156.5 3.4 3.7
GDP Chain Price Index Percent change
IndexAnnual
rateYearago
Employment Cost Index Percent change
IndexAnnual
rateYearago
ECI: Wages Percent change
IndexAnnual
rateYearago
ECI: Benefits Percent change
IndexAnnual
rateYearago
Exports Percent change
Billionsof 2000 $
Annualrate
Yearago
Imports Percent change
Billionsof 2000 $
Annualrate
Yearago
NonfarmOutput per Hour
Percent change
Index Annualrate
Yearago
NonfarmCompensation per Hour
Percent change
Index Annualrate
Yearago

National Economic Trendsupdated through
11/05/04
24Research Division
Federal Reserve Bank of St. Louis
1999 . 133501 2025 . 1.5 128992 3068 . 2.4 101.6 . . 2.1
2000 . 136902 3401 . 2.5 131791 2800 . 2.2 103.5 . . 1.8
2001 . 136944 42 . 0.0 131837 46 . 0.0 102.1 . . -1.3
2002 . 136487 -456 . -0.3 130343 -1494 . -1.1 100.0 . . -2.1
2003 . 137739 1252 . 0.9 129937 -406 . -0.3 98.6 . . -1.3
2002 1 136061 -192 -0.6 -1.2 130448 -463 -1.4 -1.5 100.3 -0.3 -1.2 -3.0
. 2 136318 257 0.8 -0.5 130389 -60 -0.2 -1.4 100.2 -0.0 -0.1 -2.3
. 3 136875 557 1.6 0.1 130287 -102 -0.3 -1.1 99.8 -0.4 -1.6 -2.0
. 4 136694 -181 -0.5 0.3 130248 -39 -0.1 -0.5 99.5 -0.4 -1.5 -1.1
2003 1 137355 661 1.9 1.0 130047 -200 -0.6 -0.3 99.0 -0.5 -1.9 -1.3
. 2 137585 230 0.7 0.9 129878 -170 -0.5 -0.4 98.5 -0.5 -2.0 -1.7
. 3 137647 62 0.2 0.6 129820 -58 -0.2 -0.4 98.2 -0.3 -1.1 -1.6
. 4 138369 722 2.1 1.2 130002 182 0.6 -0.2 98.7 0.5 1.9 -0.8
2004 1 138388 19 0.1 0.8 130367 365 1.1 0.2 99.3 0.6 2.3 0.3
. 2 138793 405 1.2 0.9 131125 758 2.3 1.0 99.8 0.5 2.2 1.3
. 3 139607 814 2.4 1.4 131521 397 1.2 1.3 100.6 0.8 3.1 2.4
2002 Oct 137079 -258 -2.2 0.5 130342 83 0.8 -0.7 99.6 -0.3 -3.5 -1.0
. Nov 136545 -534 -4.6 0.2 130305 -37 -0.3 -0.4 99.5 -0.1 -1.2 -1.0
. Dec 136459 -86 -0.8 0.3 130096 -209 -1.9 -0.4 99.3 -0.2 -2.4 -1.3
2003 Jan 137447 988 9.0 1.3 130190 94 0.9 -0.2 99.3 0.0 0.0 -1.0
. Feb 137318 -129 -1.1 0.7 130031 -159 -1.5 -0.3 98.8 -0.5 -5.9 -1.4
. Mar 137300 -18 -0.2 0.9 129921 -110 -1.0 -0.4 98.9 0.1 1.2 -1.4
. Apr 137578 278 2.5 1.1 129901 -20 -0.2 -0.4 98.3 -0.6 -7.0 -2.1
. May 137505 -73 -0.6 0.7 129873 -28 -0.3 -0.4 98.6 0.3 3.7 -1.3
. Jun 137673 168 1.5 1.0 129859 -14 -0.1 -0.4 98.6 0.0 0.0 -1.8
. Jul 137604 -69 -0.6 0.8 129814 -45 -0.4 -0.4 98.2 -0.4 -4.8 -1.5
. Aug 137693 89 0.8 0.6 129789 -25 -0.2 -0.4 98.2 0.0 0.0 -1.7
. Sep 137644 -49 -0.4 0.2 129856 67 0.6 -0.3 98.3 0.1 1.2 -1.6
. Oct 138095 451 4.0 0.7 129944 88 0.8 -0.3 98.7 0.4 5.0 -0.9
. Nov 138533 438 3.9 1.5 130027 83 0.8 -0.2 99.0 0.3 3.7 -0.5
. Dec 138479 -54 -0.5 1.5 130035 8 0.1 -0.0 98.4 -0.6 -7.0 -0.9
2004 Jan 138566 87 0.8 0.8 130194 159 1.5 0.0 99.1 0.7 8.9 -0.2
. Feb 138301 -265 -2.3 0.7 130277 83 0.8 0.2 99.2 0.1 1.2 0.4
. Mar 138298 -3 -0.0 0.7 130630 353 3.3 0.5 99.5 0.3 3.7 0.6
. Apr 138576 278 2.4 0.7 130954 324 3.0 0.8 99.5 0.0 0.0 1.2
. May 138772 196 1.7 0.9 131162 208 1.9 1.0 100.2 0.7 8.8 1.6
. Jun 139031 259 2.3 1.0 131258 96 0.9 1.1 99.7 -0.5 -5.8 1.1
. Jul 139660 629 5.6 1.5 131343 85 0.8 1.2 100.5 0.8 10.1 2.3
. Aug 139681 21 0.2 1.4 131541 198 1.8 1.3 100.4 -0.1 -1.2 2.2
. Sep 139480 -201 -1.7 1.3 131680 139 1.3 1.4 100.8 0.4 4.9 2.5
. Oct 139778 298 2.6 1.2 132017 337 3.1 1.6 101.1 0.3 3.6 2.4
Household Survey Employment Percent change
Thousands ChangeAnnual
rateYearago
Nonfarm Payroll Employment Percent change
Thousands ChangeAnnual
rateYearago
Nonfarm Aggregate Hours Percent change
IndexMonthly
rateAnnual
rateYearago
National Economic Trendsupdated through12/01/04
25Research DivisionFederal Reserve Bank of St. Louis
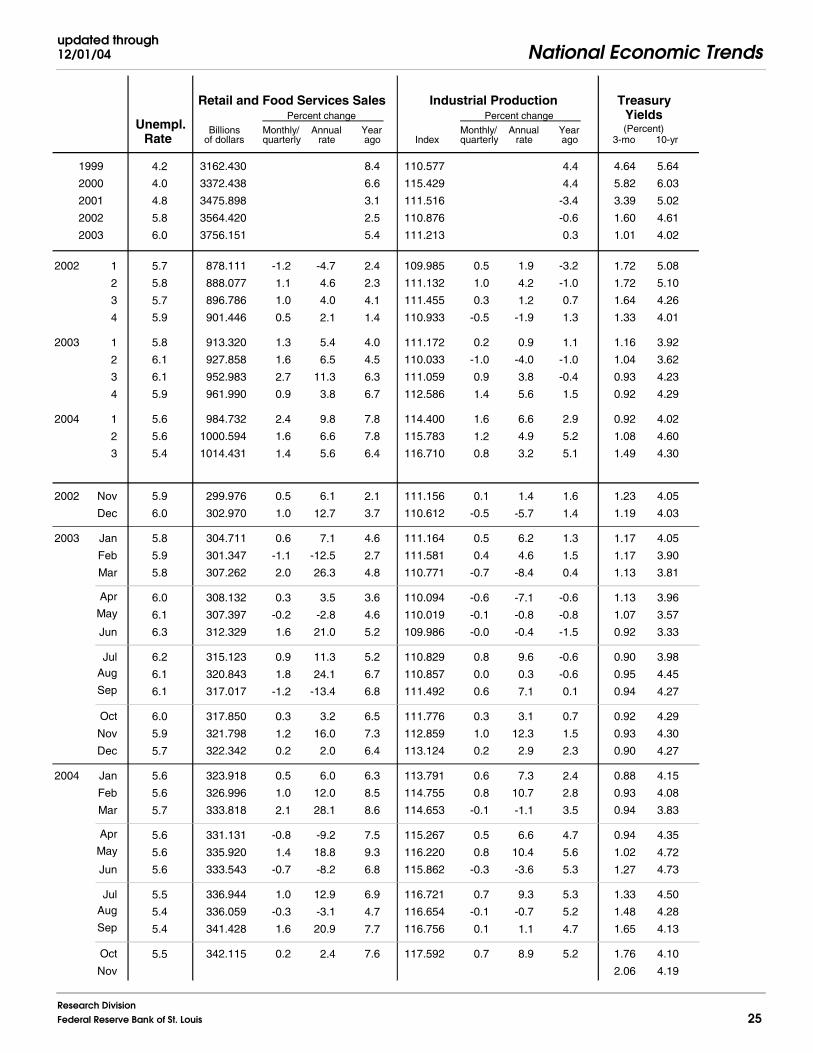
1999 . 4.2 3162.430 . . 8.4 110.577 . . 4.4 4.64 5.64
2000 . 4.0 3372.438 . . 6.6 115.429 . . 4.4 5.82 6.03
2001 . 4.8 3475.898 . . 3.1 111.516 . . -3.4 3.39 5.02
2002 . 5.8 3564.420 . . 2.5 110.876 . . -0.6 1.60 4.61
2003 . 6.0 3756.151 . . 5.4 111.213 . . 0.3 1.01 4.02
2002 1 5.7 878.111 -1.2 -4.7 2.4 109.985 0.5 1.9 -3.2 1.72 5.08
. 2 5.8 888.077 1.1 4.6 2.3 111.132 1.0 4.2 -1.0 1.72 5.10
. 3 5.7 896.786 1.0 4.0 4.1 111.455 0.3 1.2 0.7 1.64 4.26
. 4 5.9 901.446 0.5 2.1 1.4 110.933 -0.5 -1.9 1.3 1.33 4.01
2003 1 5.8 913.320 1.3 5.4 4.0 111.172 0.2 0.9 1.1 1.16 3.92
. 2 6.1 927.858 1.6 6.5 4.5 110.033 -1.0 -4.0 -1.0 1.04 3.62
. 3 6.1 952.983 2.7 11.3 6.3 111.059 0.9 3.8 -0.4 0.93 4.23
. 4 5.9 961.990 0.9 3.8 6.7 112.586 1.4 5.6 1.5 0.92 4.29
2004 1 5.6 984.732 2.4 9.8 7.8 114.400 1.6 6.6 2.9 0.92 4.02
. 2 5.6 1000.594 1.6 6.6 7.8 115.783 1.2 4.9 5.2 1.08 4.60
. 3 5.4 1014.431 1.4 5.6 6.4 116.710 0.8 3.2 5.1 1.49 4.30
2002 Nov 5.9 299.976 0.5 6.1 2.1 111.156 0.1 1.4 1.6 1.23 4.05
. Dec 6.0 302.970 1.0 12.7 3.7 110.612 -0.5 -5.7 1.4 1.19 4.03
2003 Jan 5.8 304.711 0.6 7.1 4.6 111.164 0.5 6.2 1.3 1.17 4.05
. Feb 5.9 301.347 -1.1 -12.5 2.7 111.581 0.4 4.6 1.5 1.17 3.90
. Mar 5.8 307.262 2.0 26.3 4.8 110.771 -0.7 -8.4 0.4 1.13 3.81
. Apr 6.0 308.132 0.3 3.5 3.6 110.094 -0.6 -7.1 -0.6 1.13 3.96
. May 6.1 307.397 -0.2 -2.8 4.6 110.019 -0.1 -0.8 -0.8 1.07 3.57
. Jun 6.3 312.329 1.6 21.0 5.2 109.986 -0.0 -0.4 -1.5 0.92 3.33
. Jul 6.2 315.123 0.9 11.3 5.2 110.829 0.8 9.6 -0.6 0.90 3.98
. Aug 6.1 320.843 1.8 24.1 6.7 110.857 0.0 0.3 -0.6 0.95 4.45
. Sep 6.1 317.017 -1.2 -13.4 6.8 111.492 0.6 7.1 0.1 0.94 4.27
. Oct 6.0 317.850 0.3 3.2 6.5 111.776 0.3 3.1 0.7 0.92 4.29
. Nov 5.9 321.798 1.2 16.0 7.3 112.859 1.0 12.3 1.5 0.93 4.30
. Dec 5.7 322.342 0.2 2.0 6.4 113.124 0.2 2.9 2.3 0.90 4.27
2004 Jan 5.6 323.918 0.5 6.0 6.3 113.791 0.6 7.3 2.4 0.88 4.15
. Feb 5.6 326.996 1.0 12.0 8.5 114.755 0.8 10.7 2.8 0.93 4.08
. Mar 5.7 333.818 2.1 28.1 8.6 114.653 -0.1 -1.1 3.5 0.94 3.83
. Apr 5.6 331.131 -0.8 -9.2 7.5 115.267 0.5 6.6 4.7 0.94 4.35
. May 5.6 335.920 1.4 18.8 9.3 116.220 0.8 10.4 5.6 1.02 4.72
. Jun 5.6 333.543 -0.7 -8.2 6.8 115.862 -0.3 -3.6 5.3 1.27 4.73
. Jul 5.5 336.944 1.0 12.9 6.9 116.721 0.7 9.3 5.3 1.33 4.50
. Aug 5.4 336.059 -0.3 -3.1 4.7 116.654 -0.1 -0.7 5.2 1.48 4.28
. Sep 5.4 341.428 1.6 20.9 7.7 116.756 0.1 1.1 4.7 1.65 4.13
. Oct 5.5 342.115 0.2 2.4 7.6 117.592 0.7 8.9 5.2 1.76 4.10
. Nov . . . . . . . . . 2.06 4.19
Unempl.Rate
Retail and Food Services Sales Percent change
Billionsof dollars
Monthly/quarterly
Annualrate
Yearago
Industrial Production Percent change
IndexMonthly/quarterly
Annualrate
Yearago
TreasuryYields(Percent)
3-mo 10-yr
National Economic Trendsupdated through
11/17/04
26Research Division
Federal Reserve Bank of St. Louis
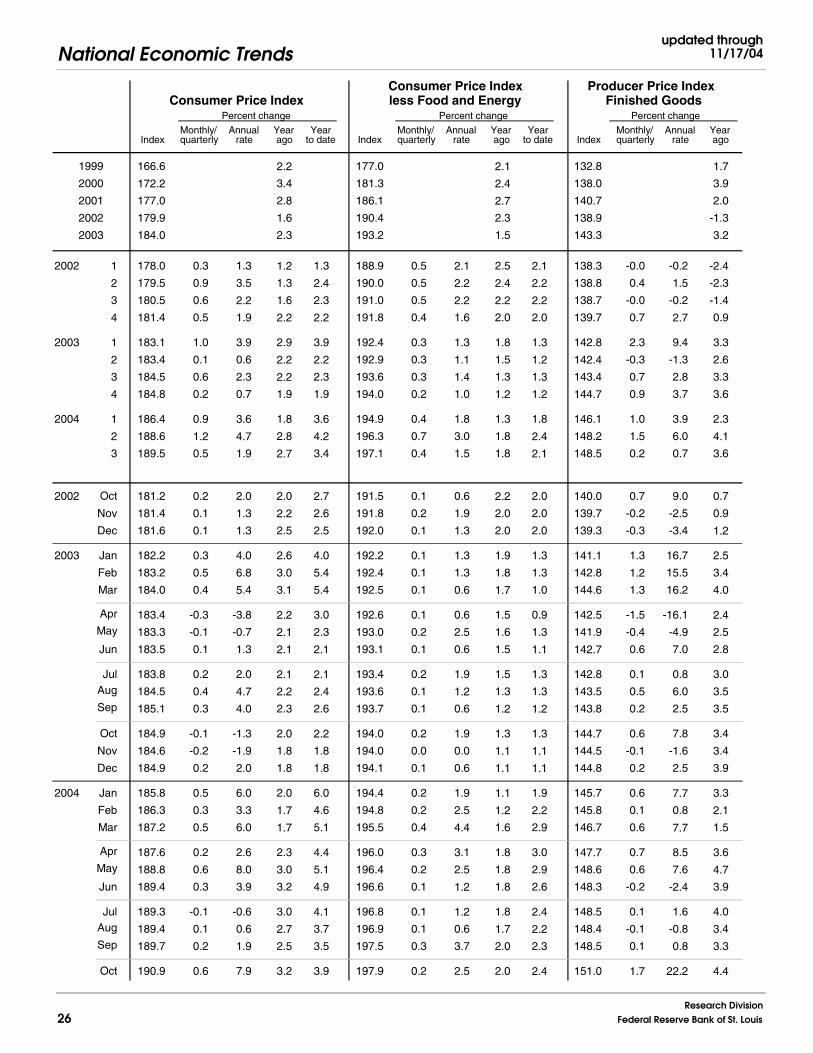
1999 . 166.6 . . 2.2 . 177.0 . . 2.1 . 132.8 . . 1.7
2000 . 172.2 . . 3.4 . 181.3 . . 2.4 . 138.0 . . 3.9
2001 . 177.0 . . 2.8 . 186.1 . . 2.7 . 140.7 . . 2.0
2002 . 179.9 . . 1.6 . 190.4 . . 2.3 . 138.9 . . -1.3
2003 . 184.0 . . 2.3 . 193.2 . . 1.5 . 143.3 . . 3.2
2002 1 178.0 0.3 1.3 1.2 1.3 188.9 0.5 2.1 2.5 2.1 138.3 -0.0 -0.2 -2.4
. 2 179.5 0.9 3.5 1.3 2.4 190.0 0.5 2.2 2.4 2.2 138.8 0.4 1.5 -2.3
. 3 180.5 0.6 2.2 1.6 2.3 191.0 0.5 2.2 2.2 2.2 138.7 -0.0 -0.2 -1.4
. 4 181.4 0.5 1.9 2.2 2.2 191.8 0.4 1.6 2.0 2.0 139.7 0.7 2.7 0.9
2003 1 183.1 1.0 3.9 2.9 3.9 192.4 0.3 1.3 1.8 1.3 142.8 2.3 9.4 3.3
. 2 183.4 0.1 0.6 2.2 2.2 192.9 0.3 1.1 1.5 1.2 142.4 -0.3 -1.3 2.6
. 3 184.5 0.6 2.3 2.2 2.3 193.6 0.3 1.4 1.3 1.3 143.4 0.7 2.8 3.3
. 4 184.8 0.2 0.7 1.9 1.9 194.0 0.2 1.0 1.2 1.2 144.7 0.9 3.7 3.6
2004 1 186.4 0.9 3.6 1.8 3.6 194.9 0.4 1.8 1.3 1.8 146.1 1.0 3.9 2.3
. 2 188.6 1.2 4.7 2.8 4.2 196.3 0.7 3.0 1.8 2.4 148.2 1.5 6.0 4.1
. 3 189.5 0.5 1.9 2.7 3.4 197.1 0.4 1.5 1.8 2.1 148.5 0.2 0.7 3.6
2002 Oct 181.2 0.2 2.0 2.0 2.7 191.5 0.1 0.6 2.2 2.0 140.0 0.7 9.0 0.7
. Nov 181.4 0.1 1.3 2.2 2.6 191.8 0.2 1.9 2.0 2.0 139.7 -0.2 -2.5 0.9
. Dec 181.6 0.1 1.3 2.5 2.5 192.0 0.1 1.3 2.0 2.0 139.3 -0.3 -3.4 1.2
2003 Jan 182.2 0.3 4.0 2.6 4.0 192.2 0.1 1.3 1.9 1.3 141.1 1.3 16.7 2.5
. Feb 183.2 0.5 6.8 3.0 5.4 192.4 0.1 1.3 1.8 1.3 142.8 1.2 15.5 3.4
. Mar 184.0 0.4 5.4 3.1 5.4 192.5 0.1 0.6 1.7 1.0 144.6 1.3 16.2 4.0
. Apr 183.4 -0.3 -3.8 2.2 3.0 192.6 0.1 0.6 1.5 0.9 142.5 -1.5 -16.1 2.4
. May 183.3 -0.1 -0.7 2.1 2.3 193.0 0.2 2.5 1.6 1.3 141.9 -0.4 -4.9 2.5
. Jun 183.5 0.1 1.3 2.1 2.1 193.1 0.1 0.6 1.5 1.1 142.7 0.6 7.0 2.8
. Jul 183.8 0.2 2.0 2.1 2.1 193.4 0.2 1.9 1.5 1.3 142.8 0.1 0.8 3.0
. Aug 184.5 0.4 4.7 2.2 2.4 193.6 0.1 1.2 1.3 1.3 143.5 0.5 6.0 3.5
. Sep 185.1 0.3 4.0 2.3 2.6 193.7 0.1 0.6 1.2 1.2 143.8 0.2 2.5 3.5
. Oct 184.9 -0.1 -1.3 2.0 2.2 194.0 0.2 1.9 1.3 1.3 144.7 0.6 7.8 3.4
. Nov 184.6 -0.2 -1.9 1.8 1.8 194.0 0.0 0.0 1.1 1.1 144.5 -0.1 -1.6 3.4
. Dec 184.9 0.2 2.0 1.8 1.8 194.1 0.1 0.6 1.1 1.1 144.8 0.2 2.5 3.9
2004 Jan 185.8 0.5 6.0 2.0 6.0 194.4 0.2 1.9 1.1 1.9 145.7 0.6 7.7 3.3
. Feb 186.3 0.3 3.3 1.7 4.6 194.8 0.2 2.5 1.2 2.2 145.8 0.1 0.8 2.1
. Mar 187.2 0.5 6.0 1.7 5.1 195.5 0.4 4.4 1.6 2.9 146.7 0.6 7.7 1.5
. Apr 187.6 0.2 2.6 2.3 4.4 196.0 0.3 3.1 1.8 3.0 147.7 0.7 8.5 3.6
. May 188.8 0.6 8.0 3.0 5.1 196.4 0.2 2.5 1.8 2.9 148.6 0.6 7.6 4.7
. Jun 189.4 0.3 3.9 3.2 4.9 196.6 0.1 1.2 1.8 2.6 148.3 -0.2 -2.4 3.9
. Jul 189.3 -0.1 -0.6 3.0 4.1 196.8 0.1 1.2 1.8 2.4 148.5 0.1 1.6 4.0
. Aug 189.4 0.1 0.6 2.7 3.7 196.9 0.1 0.6 1.7 2.2 148.4 -0.1 -0.8 3.4
. Sep 189.7 0.2 1.9 2.5 3.5 197.5 0.3 3.7 2.0 2.3 148.5 0.1 0.8 3.3
. Oct 190.9 0.6 7.9 3.2 3.9 197.9 0.2 2.5 2.0 2.4 151.0 1.7 22.2 4.4
Consumer Price Index Percent change
IndexMonthly/quarterly
Annualrate
Yearago
Yearto date
Consumer Price Indexless Food and Energy
Percent change
IndexMonthly/quarterly
Annualrate
Yearago
Yearto date
Producer Price IndexFinished Goods Percent change
IndexMonthly/quarterly
Annualrate
Yearago

transactions involving existing assets; (2) NIPA outlays exclude governmentinvestment and include consumption of government capital, while unified budgetoutlays do the reverse; (3) NIPA accounts exclude Puerto Rico and U.S. terri-tories; and (4) various timing issues are handled differently. Outlays andReceipts are from the NIPAs, except as noted. Since 1977, the federal FiscalYear starts on October 1. Excluded agency debt was 0.6 percent of federaldebt at the end of fiscal 1997. Federal Debt Held by the Public includesholdings of the Federal Reserve System and excludes holdings of the socialsecurity and other federal trust funds. Federal grants in aid to state and localgovernments appear in both state and local receipts and federal outlays.
Pages 18, 19: The Trade Balance (shown on a balance of payments basis) isthe difference between exports and imports of goods (merchandise) and services.It is nearly identical in concept to the Net Exports component of GDP, but dif-fers slightly in accounting details. The Investment Income Balance equalsincome received from U.S.-owned assets in other countries minus incomepaid on foreign-owned assets in the U.S. The investment income balance isnearly identical in concept to the difference between gross national productand gross domestic product, but differs in accounting details. The CurrentAccount Balance is the trade balance plus the balance on investment incomeplus net unilateral transfers to the U.S. from other countries.
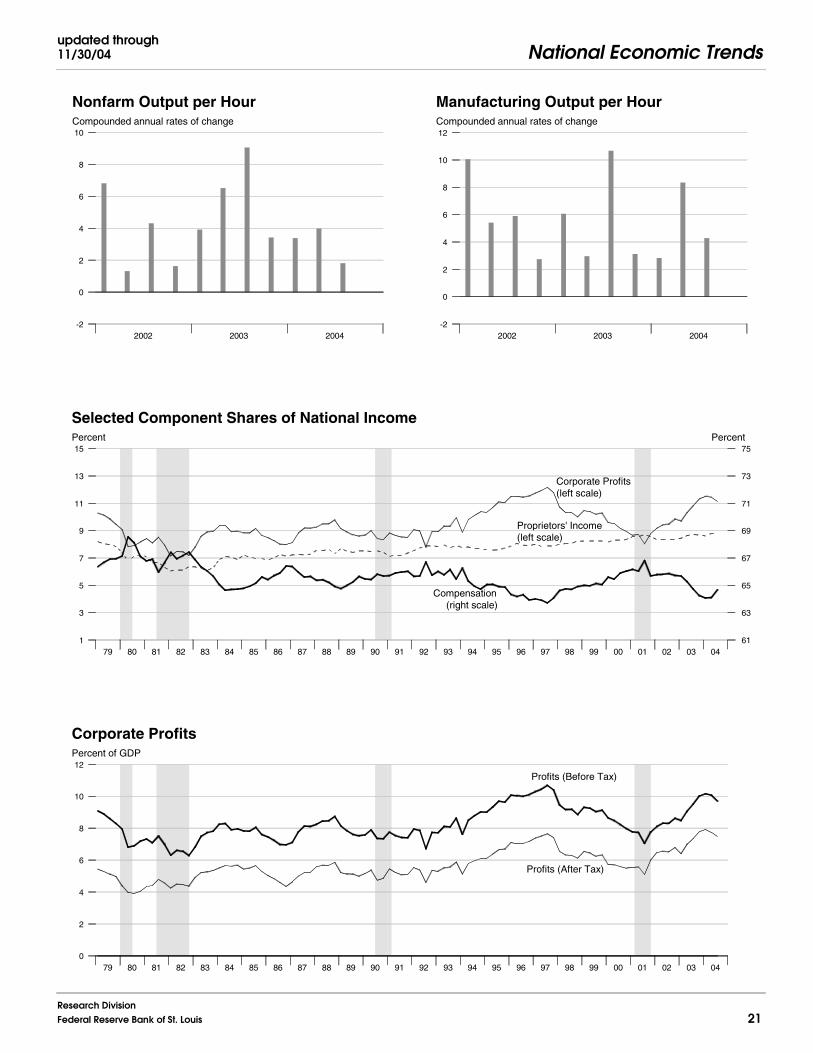
Pages 20, 21: Output per Hour (Y/H), Unit Labor Cost (C/Y), andCompensation per Hour (C/H) are indexes which approximately obey thefollowing relationship: %(Y/H) + %(C/Y) = %(C/H) with %() meaning percentchanges. Unit labor cost is shown on page 9. Real Compensation per Houruses the CPI to adjust for the effects of inflation. Nonfarm business accountedfor about 76 percent of the value of GDP in 1996, while nonfinancial corpora-tions accounted for about 54 percent. Inventory Valuation Adjustments (IVA)remove the effect of changes in the value of existing inventories from corpo-rate profits and proprietors’ income. (This change in value does not correspondto current production and therefore is not part of GDP). Capital ConsumptionAdjustments (CCAdj) increase profits and proprietors’ income by the differ-ence between estimates of economic depreciation and depreciation allowedby the tax code. Components of national income not shown are rental incomeof persons and net interest.
NOTE: Most measures of economic activity are now based on the 2002North American Industry Classification System (NAICS), which replaces the1987 Standard Industry Classification (SIC) system.
SourcesBureau of Economic Analysis (BEA), U.S. Dept. of Commerce
National income and product accounts, international trade and investmentdata (except by country), auto and light truck sales.
Census Bureau, U.S. Dept. of CommerceInventory-sales ratios, retail sales, capital goods orders, housing starts,exports and imports by country.
Bureau of Labor Statistics (BLS), U.S. Dept. of LaborAll employment-related data, employment cost index, consumer andproducer price indexes, unit labor cost, output per hour, compensationper hour, multifactor productivity.
United States Department of TreasuryUnified budget receipts, outlays, deficit, debt.
Federal Reserve BoardIndex of industrial production, treasury yields, exchange rates, capacityutilization, household debt.
The Survey Research Center, The University of MichiganConsumer sentiment index.
The Conference BoardHelp-wanted advertising index.
Organization for Economic Cooperation and Development (OECD)GDP for major trading partners (not available on FRED).
NotesPages 4, 5: Final Sales is gross domestic product (GDP) minus change inprivate inventories. Advance, Preliminary, and Final GDP Growth Ratesare released during the first, second, and third months of the following quarter.Changes result from incorporation of more complete information. Real GDPis measured in 2000 dollars. The ISM (formerly Purchasing Managers’) Indexis a weighted average of diffusion indexes for new orders, production, supplierdeliveries, inventories, and employment. Aggregate and Average WeeklyHours are paid hours of production and nonsupervisory employees. TheInventory-Sales Ratio uses nominal (current-dollar) inventory and sales data.
Page 6: For information on how to calculate the Contribution of a componentto the overall GDP growth rate, see the October 1999 issue of the Survey ofCurrent Business, p. 16. The sign is changed for Imports.
Page 7: Ten-year Treasury Yields are adjusted to constant maturity; three-month yields are secondary market averages. All rates used in the yield curvesare adjusted to constant maturity. The 30-year constant maturity series wasdiscontinued by the Treasury Department as of Feb. 18, 2002. Standard andPoor’s 500 Index with Reinvested Dividends shows the total return: capitalgains plus dividends.
Pages 8, 9: Oil (West Texas intermediate) and Natural Gas (Henry Hub) spotand futures prices are listed in the Wall Street Journal. Spot prices are monthlyaverages of daily prices; futures prices are usually taken from the last tradingday of the month. Consumer Price Index is for all urban consumers. TheConsumption Chain Price Index is the index associated with the personalconsumption expenditures component of GDP. The Employment Cost Index(ECI) covers private nonfarm employers. ECI Compensation refers to a fixedsample of jobs, while Compensation per Hour covers all workers in thenonfarm business sector in a given quarter. In both cases, compensation iswages and salaries plus benefits.
Pages 10, 11: Effective with the May 2003 Employment Situation, the estab-lishment survey data for employment, hours, and earnings have been convert-ed from the 1987 SIC system to the 2002 NAICS system. All publishedNAICS-based labor series have been revised back to at least 1990. For moreinformation see http://www.bls.gov/ces/. Nonfarm Payroll Employment iscounted in a survey of about 400,000 establishments (Current EmploymentSurvey). It excludes self-employed individuals and workers in private house-holds, but double-counts individuals with more than one job. The HouseholdSurvey (Current Population Survey) of about 60,000 households provides esti-mates of civilian employment, unemployment rate, labor force participationrate, and employment-population ratio. Population is civilian, noninstitutional,16 years and over. The 90 percent confidence intervals for the unemploymentrate (± 0.2 percentage points) and change in household survey employment(± 290,000) measure uncertainty due to sample size. Because the householdsurvey was changed in January 1994, data prior to this date are not strictlycomparable. The Bureau of Labor Statistics announced several revisions tothe Household Survey on Feb. 7, 2003, with the release of the January 2003data. For more information, see <www.bls.gov/cps/>.
Page 13: The Michigan Consumer Sentiment Index shows changes in asummary measure of consumers’ answers to five questions about their currentand expected financial situation, expectations about future economic conditions,and attitudes about making large purchases. The survey is based on a representa-tive sample of U.S. households.
Page 15: Gross Private Saving is the sum of personal saving, undistributedcorporate profits with IVA and CCAdj (see notes for pp. 18-19), and privatewage accruals less disbursements. Gross Government Saving is net govern-ment saving (surplus/deficit) plus consumption of fixed capital. Balance onCurrent Account (NIPA) is net capital transfer payments to the rest of theworld plus net lending or net borrowing (international trade and incomeflows).
Pages 16, 17: Government Consumption and Investment is current expendi-tures on goods and services, including capital consumption (depreciation) andgross investment, as reported in the NIPAs. The Unified Federal BudgetSurplus/Deficit differs from NIPA Basis in four main ways: (1) NIPA excludes
National Economic Trends
Research DivisionFederal Reserve Bank of St. Louis 27