working paper series - federal reserve bank of st. louis
TRANSCRIPT

WORKING PAPER SERIES
Government Policy and Banking Instability:
Overbanking in the1920s
David C. Wheelock
Working Paper 1992-007A
http://research.stlouisfed.org/wp/1992/92-007.pdf
PUBLISHED: Journal of Economic History, As "Government Policy and Banking
Market Structure in the 1920s." December 1993.
FEDERAL RESERVE BANK OF ST. LOUISResearch Division
411 Locust Street
St. Louis, MO 63102
______________________________________________________________________________________
The views expressed are those of the individual authors and do not necessarily reflect official positions of
the Federal Reserve Bank of St. Louis, the Federal Reserve System, or the Board of Governors.
Federal Reserve Bank of St. Louis Working Papers are preliminary materials circulated to stimulate
discussion and critical comment. References in publications to Federal Reserve Bank of St. Louis Working
Papers (other than an acknowledgment that the writer has had access to unpublished material) should be
cleared with the author or authors.
Photo courtesy of The Gateway Arch, St. Louis, MO. www.gatewayarch.com

GOVERNMENT POLICY AND BANKING INSTABILITY:
“OVERBANKING” IN THE 192Os
David C. Wheelock*
Federal Reserve Bank of St. Louis
92-007A
October 1992
Keywords: Bank deposits, bank failures, banking--U.S. history, banking--U.S. regulation, branch banking, deposit insurance.
JEL Subject Numbers: G2l, G28, N22
* Visiting ScholarFederal Reserve Bank of St. LouisP.O. Box 442St. Louis, MO 63166314-444-8570
Assistant ProfessorDepartment of EconomicsUniversity of TexasAustin, TX 78712
I thank Lee Aiston, Alison Butler, Mark Flood, Alton Gilbert, and Joe Ritter forcomments and Kevin White for research assistance.
The views in this paper do not necessarily reflect those of the Federal ReserveBank of St. Louis or the Federal Reserve System.
This paper is subject to revision and is for review and comment. Not to bequoted without the author’s permission.

Government Policy and Banking Instability:
“Overbanking” in the 1920s
Abstract
Excess capacity, or “overbanking,” was cited by contemporaries as leading cause of bankfailure during the 1920s. Many states that had high numbers of banks per capita in 1920 hadhigh bank failure rates subsequently. This article finds that the number of banks per capitawas highest in states that provided deposit insurance, set low minimum capital requirements,and restricted branching. Banks per capita declined the most over the 1920s in states wherebranching expanded, and in those suffering high failure rates because of falling incomes orinstability caused by deposit insurance. Deposit insurance and the relative dominance ofagriculture also explain the composition of state banking systems between state and federallychartered institutions.

1
Government Policy and Banking Instability:“Overbanking” in the 1920s
The bank, like the church, is a community enterprise, its stock a communityinvestment, its success a community pride. It is a community temple where thesaver and the borrower meet in a home they call their own.1
The high number of bank failures in the United States since 1980 has made banking
reform a prominent public policy issue for the first time since the Great Depression.
Researchers have blamed some New Deal policies, such as deposit insurance and restrictions
on bank activities, for contributing to recent bank failures by encouraging risk-taking and
limiting diversification.2 Although New Deal reforms reflected compromises among diverse
interests, they also were shaped by earlier state experiences with a variety ofbanking policies.3
These experiences not only help to explain the federal banking legislation of the 1930s, but
also provide a rich source of evidence on the possible effects of current reform proposals.
The number ofbanks and other financial institutions increased rapidly during the first
twenty years of the 20th century, with the federal government and every state chartering
commercial banks or trust companies.4 During the 1920s the number of banks declined by
nearly 20 percent, however, as a collapse of commodity prices in mid-1920 led to a high
number of bank failures, especially in the Midwest and South. As in the 1980s,
contemporaries laid some blame for the high number of bank failures during the 1920s on
government policies. Although the decline in commodity prices was the principal cause of
bank failure during the 1920s, many commentators argued that there would have been many
1 A New Jersey banker in a letter to the chairman of the House Banking Committee in 1930 (quoted byBremer, American Bank Failures, pp. 105-06).2 Clair and O’Driscoll, “Learning from One Another,” and Litan, “Could Broader Powers,” argue thatrestrictions on branch banking and bank portfolios contributed to failures by limiting diversification.Keeley, “Deposit Insurance,” argues that deposit insurance and more liberal chartering encouraged banksto take excessive risks during the 1980s.
For example, in debating the Banking Act of 1933, proponents of deposit insurance argued that afederal insurance system would avoid the problems of inadequate supervision, insufficient diversificationof risks, and underfunding, that had been encountered with the state insurance systems of the 1920s. SeeFlood, “The Great Deposit Insurance Debate.”
Between June 30, 1900, and June 30, 1920, the number of commercial banks grew from 12,427 to30,291. The number peaked in June, 1921, at 30,456 (Board of Governors of the Federal ReserveSystem, All Bank Statistics, p. 37).

2
fewer failures were it not for “overbanking,” a condition that existed because regulators had
issued too many bank charters “where there was no real need for them.”5
Whether or not an excessive number of banks had been established ex ante, the high
number of failures during the 1920s indicates that there were too many banks. One possible
measure of “overbanking” is the number of banks per capita. Banks per capita varied widely
across states during the 1920s, and states with high numbers at the beginning of the decade
tended to have the highest failure rates subsequently. In addition to liberal chartering, state
experiments with branch banking and deposit insurance also significantly affected the relative
performance of different state banking systems.
This article investigates three aspects of banking market structure during the 1920s: 1)
the determinants ofinterstate variation in the number of banks per capita in 1920; 2) the forces
causing the reduction in banks per capita that occurred in all but two states during the 1920s;
and 3) the distribution of state banking systems between federally-chartered and state-chartered
institutions.6 I find that government policies -- minimum capital requirements, branch banking
laws, and deposit insurance — were significant determinants of interstate differences in the
number of banks per capita, although per capita income and population density were also
important. In rural states, where political interests usually opposed branching, the
geographically diffuse demand for bank offices was met by independent banks, whose numbers
were encouraged by low minimum capital requirements and in eight states by deposit
insurance. Branch banking and deposit insurance also help to explain industry consolidation
during the 1920s. States where branching expanded the most had the greatest declines in banks
per capita. Deposit insurance was destabilizing, in that the number of banks grew rapidly in
Board of Governors of the Federal Reserve System, Bulletin, December 1937, p. 1204.6 The best general history of banking policy in the early 20th century is White, The Regulation and
Reform. Others, such as Alston, Grove and Wheelock, “Why Do Banks Fail?” Calomiris, “DoVulnerable Economies Need Deposit Insurance?” and Wheelock, “Deposit Insurance,” focus morenarrowly on bank failures or on the effects of deposit insurance. However, with the exception of theearly studies cited in the text, there has been little effort to identify the causes of interstate variation inmarket structure or rate of consolidation during the 1920s.

3
deposit insurance states before 1920, but the high failure rate of insured banks after 1920
contributed to a relatively rapid decline subsequently.
Government policies affecting the relative distribution of national and state-chartered
banks across states appear to have been those related to agricultural lending. The generally
lower minimum capital requirements and more liberal real estate lending provisions for state-
chartered banks probably explain their dominance in farm states. Deposit insurance again
played a role, however. Before 1920 deposit insurance encouraged the growth of state-
chartered banks in states with insurance sysLems by providing them with a subsidy not
available to national banks. During the 1920s, however, each of the state insurance systems
collapsed without fully reimbursing depositors. As a result, the subsidy evaporated and the
relative number of state banks declined more in insurance states than elsewhere.
Overbanking and Bank Failure
Failures, mergers and voluntary liquidations reduced the number of banks in the U.S.
from 30,291 in 1920 to 24,970 in 1929.~ From 1900 to 1920, the number of banks had
increased rapidly, spurred by the lowering of the minimum capital requirement for national
banks from $50,000 to $25,000 in 1900, the response of many states in lowering chartering
requirements for state banks, and a general increase in economic activity. Many agricultural
states experienced significant increases in banks during World War I when commodity prices
soared. These states subsequently suffered a considerable shakeout, and had among the highest
bank failure rates after the collapse of agricultural prices in 1921.
Contemporaries argued that agricultural distress would not have caused so many
failures during the 1920s were it not for overbanking. According to H. Parker Willis:
Bank failures have been numerous and they have been largely due to theunwise grant of charters to improper groups of people, often under politicalinfluence ... and as a result we have a host of weak, unreliable banks thatcrowd one another out of existence by being too numerously organized in
There were 5700 bank suspensions from 1920 to 1929. Board of Governors of the Federal ReserveSystem, All Bank Statistics, p. 37.

4
places where ther~is no support for the multifarious institutions that have beenestablished there.
A study by the American Bankers Association concluded that the “overdevelopment of banking
is more responsible than any other factor for the banking disasters of the [1920s].”9 And,
John W. Pole, Comptroller of the Currency, testified before the House Banking Committee in
1930 that
Many causes have been assigned for these bank failures; in one sectiondroughts, in another insect pests, in another failure of the cattle market, inanother a drop in the price of wheat, and so on. A great many failures havebeen attributed to mismana~ement... another cause is that too many rural bankcharters have been granted. 0
C. D. Bremer noted that “the proportion of active banks which suspended during 192 1-
1929 was generally lowest in those states which, relative to the number of inhabitants, had, in
1920, the lowest number of banks, and was highest in those states which had abundant banking
facilities.”11 Indeed, the correlation coefficient between banks per capita in 1920 and failure
rate during 1921-1929 is 0.58, which is significant at the .01 level.12 States in the Northeast
had relatively few banks per capita in 1920, and had low failure rates during the 1920s.
Western, Midwestern and a few Southern states had high numbers of banks per capita in 1920
and suffered high bank failure rates during the 1920s.13
Of the recent studies of bank failures during the 1920s, only Carl Gambs tests directly
whether overbanking was a cause of failures.14 He finds a positive influence ofthe number of
8 Quoted by Lawrence, Banking Concentration, pp. 104-05.American Bankers Association, The Causes ofBank Failures, p. 305.
10 United States House of Representatives, Branch, Group, and Chain Banking, p. 14. See also Boardof Governors of the Federal Reserve System, Bulletin, December 1937, p. 1220, Young, The BankingSituation, p. 38, and Lawrence, Banking Concentration, who argued (p. 84) that “A little birth control ofbanks on the part of states which now suffer most from bank failures might have had a wholesome effecton the rate of mortality.”
Bremer, American Bank Failures, p. 54.12 Here the failure rate is defined as the number of bank suspensions during 1921-1929 divided by the
number of banks in 1920.13 Rhode Island had the fewest banks per 1000 population (0.08) and had a failure rate of 0.06, while
North Dakota had the highest number of banks per 1000 population (1.39) and had a failure rate of 0.48.Florida had the highest failure rate (0.72) and 0.27 banks per 1000 population in 1920. Because therewere unusually many new banks chartered in Florida during the 1920s, however, for that state thecomparison of bank failures from 1921-1929 with banks per capita in 1920 is not particularlyilluminating.14 Gambs, “Bank Failures.”

5
banks per capita on a state’s failure rate during 1922~1932.15 Lee Alston, Wayne Grove and
David Wheelock also attempt to identify the causes of interstate variation in bank failure rates
during the 1920s, but include no specific term, such as banks per capita, to test the
overbanking hypothesis. They find, however, that failures rates were higher in states that had
deposit insurance systems or restricted branch banking, suggesting that in the absence of these
policies, there would have been fewer banks and hence fewer failures.16
The Determinants of Overbanking
The number of banks per capita varied widely across states during the 1920s, from as
few as 0.08 banks per 1000 inhabitants in Rhode Island to 1.39 per 1000 inhabitants in North
Dakota. As Figure 1 illustrates, the Great Plains states had the highest numbers of banks per
capita in 1920, while those in the Northeast tended to have the lowest. Figure 2 shows that,
despite having the highest failure rates and considerable contraction through mergers and
voluntary liquidation, the Plains states continued to have the highest numbers of banks per
capita in 1929. Again, states in the Northeast and South had relatively few banks per capita in
1929, as did California, Arizona and New Mexico. The latter two states had high bank failure
rates during the 1920s, while California had a large increase in branching.
There are several plausible explanations for the considerable interstate variation in
banks per capita. These include regulatory differences, inherent geographic or demographic
differences, and differences in the level of economic activity.
Obvious regulatory differences include branch banking laws, minimum capital
requirements, and deposit insurance. Banks might choose to operate branches to capture
economies of scale, diversification opportunities, or lower overhead costs. States that
15 Gambs also includes deposits per capita, an index of branch banking, agricultural income and othervariables as controls.16 Alston, et. al., “Why Do Banks Fail?” Johnson, “Postwar Optimism,” contends (p. 189), however,
that “Bank earnings and deposit trends suggest, very tentatively, that in spite of the rapid growth in thenumber of banks before 1920, the bank failure crisis of the twenties is not easily attributed to widespreadoverbanking by 1920 ... It is certain, however, that many banks operating in 1920 could continue tofunction after that date only as long as the exuberant business climate that had existed during the previousfive years continued to prevail.”

6
permitted branch banking probably had fewer banks (but not necessarily fewer bank offices)
per capita than states that restricted branching. A bank locates in a particular market only if
there is sufficient demand for it to operate at a profitable scale. Presumably, the minimum
profitable scale for a branch is smaller than that of an independent bank. In unit banking
states, small markets that were served by one or two independent banks might instead have
been served by several branch offices in the absence ofbranching restrictions.
Most states imposed minimum capital requirements that, if binding, limited the number
ofbanks. Sparsely populated states tended to set the lowest minimum capital requirements to
ensure the presence of banking facilities in rural areas. According to Eugene White,
Rural states with low population densities typically had low capitalrequirements to ensure that small communities would not be deprived of bankoffices. This created banking systems in the southern and western statesdominated by hundreds of small unit banks. Greater population densitycoupled with higher capital requirements and some branching led to theestablishment of larger, more diversified banks in the East. 17
State and federal regulators competed in the granting of bank charters. The Gold
Standard Act of 1900 halved the minimum capital requirement from $50,000 to $25,000 for
national banks located in towns of less than 3000 population. Many states responded by
lowering the minimums for state chartered banks to something less than $25,000. F. G.
Awalt, Acting Comptroller of the Currency, described the effects of this competition in his
report for 1932:
Lax state laws and the passage by the Congress of the act of March 14, 1900[the Gold Standard Act] ... facilitated the organization of thousands of smallbanks in small towns, particularly in agricultural sections throughout thecountry.... We should not lose sight of the effect of the competition in laxityexisting in the American banking system, consisting of 48 State systems incompetition with one national system....18
The demand for bank offices that produced the plethora of unit banks could have been
met by branch banking networks. Fears, however, that branching would reduce competition
17 White, “State Sponsored Insurance,” p. 539.18 United States Department of the Treasury, Office of the Comptroller of the Currency, Annual Report,
p.4.

7
and pull savings away from rural areas for use in urban centers made branch banking
politically infeasible. According to White,
State banking authorities were not anxious to see the number or proportion ofinstitutions under their control decline, the public wanted more bank offices,and the country unit bankers did not want to see the introduction of intrastatebranching. This political alignment of interests virtually ensured thatreductions in capital requirements would be the predominant legislativeresponse to the insufficient supply of banking services. ~
Deposit insurance is another government policy that might have affected the number of
banks per capita. Eight states adopted insurance systems for their state chartered banks after
the Panic of 1907.20 Flat-rate insurance provides a subsidy that encourages bank entry and
their adoption of high risk strategies, and holding constant other possible influences, bank asset
growth was more rapid in the deposit insurance states than in non-insurance states.2’ In
Kansas, which had a voluntary deposit insurance system, the number of insured banks and
deposit growth of insured banks was more rapid before 1920 than that of either non-insured
state banks or national banks.22 It seems likely, therefore, that deposit insurance caused there
to be more banks per capita in insurance states than in non-insurance states. Joseph Lawrence
also reached this conclusion:
It is certain that states which passed guarantee laws ... attracted a host of fly-by-night promoters who seemed to have no difficulty in securing charters fromstate commissions. They basked in the benign rays of state assurance of safetyto depositors. The caution with which the depositor in a small town usuallyscrutinized the character of bank ownership and management was dulled by anillusion of impregnable strength. Deposits flowed forth and manyincompetents or rascals (sometimes both) operating under the tenuous guise ofbankers pastured in clover.23
Aside from government policies, other factors likely influenced the number of banks
per capita in a state. Rural, sparsely settled states likely had more banks per capita than
predominantly urban states since high transportation costs restricted the market areas that
19 White, “The Political Economy,” p. 35.20 The eight were Kansas, Mississippi, Nebraska, North Dakota, Oklahoma, South Dakota, Texas, and
Washington. See Federal Deposit Insurance Corporation, Annual Report, or Calomiris, “DepositInsurance,” for descriptions of the various insurance plans.21 Calomiris, “Do Vulnerable Economies.”22 Wheelock, “Deposit Insurance.”23 Lawrence, Banking Concentration, p. 104.

8
banks could profitably serve. According to Ralph Young, “The multiplicity of banking offices
[in the West, Midwest, and Southi is obviously the result ofthe distribution of the agricultural
population and the relatively large number and small size of population centers.”24
As automobiles and trucks became common on farms, and as rural roads were
improved, the costs of transportation declined dramatically, which some contemporaries
thought caused many rural banks to fail~25 For example, in testimony before the House
Banking Committee in 1930, A. P. Giannini argued that “The small banks in the small
communities to-day are drying up. A man goes to the larger town, driving over the good
roads we now have, to transact his business and do his marketing, and perhaps see a picture
show, and he does his banking while he is there.”26 In other words, transportation
improvements in rural areas threw banks in formerly isolated markets into competition with
one another, causing these regions to become overbanked. Failure helped to eliminate the
excess capacity.
Finally, differences in the level of economic activity might also account for variation in
the number of banks per capita across states. Farm states had high per capita incomes during
the agricultural boom of World War I. With increased demand for financial services, the
number ofbanks per capita may have risen in those states. Low income states likely had fewer
banks per capita.27 Indeed, the sharp income declines suffered by farm states after 1920
reduced the demand for banks, and many that opened during the boom shut their doors during
the 1920s. I expect the higher a state’s per capita income, the more banks per capita it had.
The sharp increase in commodity prices during World War I caused land values to soar
and new areas to be brought into cultivation. Much of the increases in land value and
improved farm acreage was financed with money borrowed from banks. States with the
greatest increases in farm land value or improved acreage during the war subsequently suffered
24 Young, et. al., The Banking Situation, pp. 9-11.25 See Johnson, “Postwar Optimism,” and Alston, et. al., “Why Do Banks Fail?”26 United States House of Representatives, Branch, Group, and Chain Banking, p. 1540.27 The number of banks per capita is sometimes used as an indicator of fmancial sophistication or
development. See Cameron, Banking in the Early Stages of Industrialization, for example.

9
the highest farm failure rates after output prices collapsed.28 These states also had the highest
rural bank failure rates.29 It seems plausible, therefore, that the number of banks per capita
was high in areas where the agricultural boom was strongest. Comptroller Awalt argued that
while lax state and federal chartering laws made possible the entry of many new banks in rural
areas, “rising prices and increasing prosperity made it possible for these banks to thrive.”30
The Determinants of Overbanking--Econometric Evidence
To determine which of the various hypotheses can explain why the number of banks
per capita varied so widely across states in 1920 and 1929, I estimate an OLS regression in
which the dependent variable is the log of banks per capita.31 To test for the impact of
government policies, I include an index of the extent of branch banking within a state, a
dummy variable set equal to 1 if a state had a deposit insurance system and to 0 otherwise,32
and the minimum capital requirement for banks chartering in a state. The branching index
equals the number of branches operating in the state divided by the total number of banks. In
states where branching was prohibited or limited, independent banks were established to meet
the demand for bank offices. Thus I expect that the lower is the branching index, the higher
will be the number of banks per capita in a state. I also expect that banks per capita will be
higher in deposit insurance states, and lower in states that set high minimum capital
requirements.
To test for the effect of population dispersion on the number of banks per capita, I
include state population density and the percentage of the population located in rural areas as
28 Aiston, “Farm Foreclosures.”29 Alston, et. al., “Why Do Banks Fail?”
30 United States Department of the Treasury, Office of the Comptroller of the Currency, Annual Report,~. 4.~ The distribution of banks per capita is approximately log normal. Data sources and descriptivestatistics are given in the appendix.32 I do not include Washington as an insurance state since its system was short-lived, and probably hadlittle influence on the state’s banking system. See Federal Deposit Insurance Corporation, AnnualReport.

:i~0
independent variables.33 I include state per capita income to control for the importance of
income on the demand for banking services, and include also the percentage changes in farm
land value per acre and improved farm acreage from 1910 to 1920 to capture the effects of the
agricultural boom.34 I expect that the higher was a state’s per capita income, increase in land
value, or increase in improved acreage, the more banks per capita it had.
Table 1 reports results for 1920, Table 2 those for 1929, and Table 3 reports those for
the percentage change in banks per capita between 1920 and 1929. Equation 1.1 indicates that
the number of banks per capita was lower in states with comparatively more extensive branch
banking. It appears that some of the demand for bank offices was met through branches, rather
than unit banks, in those states permitting it.
The number of banks per capita also seems to have been affected by the presence of
deposit insurance. Insurance appears to have encouraged (or at least permitted) more banks to
exist per capita, than would have operated otherwise. Finally, the number of banks per capita
was negatively related to a state’s minimum capital requirement. In Eastern states, where
minimums were set high, the number of banks per capita tended to be relatively low. By
contrast, Southern and Midwestern states tended to have relatively low minimums and high
numbers ofbanks per capita.35
Equations 1.2-1.4 include population density as an independent variable, and we see
that the number of banks per capita was higher, the lower was a state’s population density. In
rural states, where transportation costs were relatively high, a higher number of bank offices
per capita was needed to accommodate the demand for bank services. Instead of permitting
The latter is defined as the percentage of population located on farms or towns of under 2500population. This variable is highly (negatively) correlated with population density, and so is notincluded in the regression results presented in the paper.
One might expect that the changes in land valueand improved acreage were correlated. The value offarm land increased most in the Midwest, however, where most land was already farmed and hencewhere improved acreage changed little. Improved acreage increased most in western states.
In Massachusetts, where the minimum capital requirement was the highest, at $100,000, there were0.14 banks per 1000 inhabitants. By contrast, North Carolina, South Carolina, Tennessee, Virginia, andWisconsin had $5,000 minimums, and 0.23, 0.27, 0.23, 0.21, and 0.37 banks per 1000 inhabitants,respectively.

11
branch banking, however, states with low population density tended to set low minimum
capital requirements to encourage banks to open in rural areas.36
In Equation 1.3, I include the ratio of national to total banks to test whether the
presence of federally chartered banks affected the overall number of banks per capita within a
state. On average, national banks were over twice the size of state chartered banks, and hence
the demand for banking services might have been accommodated with fewer banks in a state
dominated by national banks.37 Although not statistically significant, the point estimate
suggests that the number of banks per capita was lower, the higher the proportion of national
banks operating in a state. It seems likely, however, that the determinants of the national bank
ratio are those that also determine the number of banks per capita -- minimum capital
requirements, branch banking laws, deposit insurance, population density, etc. I test this
hypothesis below.
Finally, Equation 1.4 includes state per capita income, the percentage change in
improved agricultural acreage from 1910 to 1920, and the percentage change in farm land
value per acre from 1910 to 1920 as additional regressors. The demand for banking services
should increase with per capita income, and I find that the higher a state’s per capita income
the more banks per capita it had. At the same time, the number of banks per capita in 1920
appears to have been positively influenced by the expansion of agricultural land from 1910 to
1920. I find, however, no strong impact from changes in land value to banks per capita.
Overall, the evidence indicates that regulatory differences, differences in population density,
per capita income, and the expansion of agriculture explain well the interstate variation in
banks per capita in 1920.38
36 State population density and minimum capital requirement are highly collinear (correlation coefficient
of 0.77, which is significant at the .01 level). Since they appear not to be independent influences on thenumber of banks per capita, I omit the minimum capital requirement from the remaining specifications.
As of June 30, 1920, there were 8025 national banks in the U.S., holding $17,159 million ofdeposits, or an average of $2.14 million per bank. By contrast, there were 21,062 state banks, holding$18,955 million of deposits, or $0.90 million per bank (Board of Governors of the Federal ReserveSXstem, Banking and Monetary Statistics, pp. 16-17).
In order to gain further insight into the relative importance of the different independent variables, Icomputed the standardized, or “beta,” coefficients for each. For Equation 1.4, the beta coefficients for

12
The results in Table 2 show that these same variables can explain differences in banks
per capita across states in 1929. Failures, mergers, and voluntary liquidations reduced the
interstate variation between 1920 and 1929 (see appendix Table A2). But, as in 1920,
minimum capital requirements, branch banking, and deposit insurance all affected the number
of banks per capita in a state. Particularly interesting is the effect of deposit insurance.
During the 1920s bank failures had been highest in deposit insurance states, and by 1929 all of
the state insurance systems had collapsed. Nevertheless, the number of banks per capita
remained higher in 1929 in insurance states than in those that never offered deposit insurance.
Also notable is the apparent positive relationship between increases in improved farm acreage
between 1910 and 1920 and the number of banks per capita in 1929. Like those having deposit
insurance systems, states that had the largest agricultural expansions before 1920 continued to
have relatively high numbers of banks per capita in 1929. Finally, as in 1920, the number of
banks per capita in 1929 was influenced by a state’s population density and its per capita
income.39
The number of banks per capita fell in almost every state between 1920 and 1929.40
The declines tended to be highest in those states with the highest numbers of banks per capita
in 1920. In North Dakota, which had the highest number of banks per 1000 population in
1920 (1.39), the number fell 54% to 0.64 banks per 1000 inhabitants in 1929. Some states
that had large declines, however, had relatively few banks per capita in 1920. California had
the largest percentage decline (61%), but in 1920 had fewer banks per 1000 population (0.21)
Branching, Deposit Insurance, Population Density, Per Capita Income, Improved Acreage, and LandValue are —0.38, 0.38, —0.39, 0.31, 0.25, and .08. Thus, for example, a one standard deviationincrease in Branching would produce a 0.38 standard deviation decrease in the dependent variable (seeTable A2 in the appendix for descriptive statistics). Since Deposit Insurance is a dummy variable, thebeta coefficient is not particularly meaningful. The regression coefficient estimate indicates, however,that the value of the dependent variable averages 0.66, or approximately one standard deviation, higherfor insurance states than for non-insurance states.
The beta coefficients for Equation 2.5 are —0.59, 0.37, —0.52, 0.40, 0.14, and 0.17 for Branching,Deposit Insurance, Population Density, Per Capita Income, Improved Acreage, and Land Value.40 The exceptions were Delaware and NewJersey, whose numbers increased 10% and 12%.

13
than all but twelve other states. A large increase in branch banking probably accounts for the
considerable consolidation over the decade in that state.4’
Table 3 reports regression estimates for the percentage change in the number ofbanks
per capita between 1920 and 1929. I find that the number ofbanks per capita declined most in
states where branching increased the most over the decade.42 I find also that the presence of
deposit insurance increased the percentage decline in banks per capita. The number of banks
per capita in deposit insurance states was higher in 1920 and 1929 than in other states, but so
was the rate of decline in banks per capita over the decade. Deposit insurance seems to have
caused a greater expansion of banking during the World War I agricultural boom, and a greater
decline in banks after the collapse of commodity prices and agricultural income in 1920, than
would have occurred otherwise. I find a similar relationship between agricultural expansion
before 1920 and the change in the number ofbanks per capita between 1920 and 1929: states
that had the largest agricultural expansion before 1920 then had greater declines in the number
ofbanks per capita in the subsequent decade.
Equation 3.1 suggests that the number of banks per capita declined most in states that
increased their minimum capital requirement. Equations 3.3 and 3.4 indicate that banking
consolidation was also strongly related to changes in per capita income. The number of banks
per capita increased most (declined the least) in states that enjoyed the largest increases in per
capita income between 1920 and 1929.~~Changes in population density appear not to have
had much effect over the decade, however.
I include 1920 population density as a separate regressor in Equations 3.3 and 3.4. A
reduction in transportation costs caused by improvements in rural roads and the purchase of
41 In 1920, California had 179 branch offices. By 1930 the number had risen to 853. In that year
California was the only state to have more branch offices than banks.42 ~Branching is the difference between the branching index in 1929 and in 1920. ~ Mi Cap. is the
difference in minimum capital requirements between 1929 and 1920, and %L~Pop. Density and %~PerCapita Income are the percentage changes in each variable over the decade.
I omit the change in minimum capital requirement when per capita income growth is included sincethe coefficient on the former is small and insignificant, and since just 17 states changed their minimumsover the decade (15 increasing and 2 decreasing). The coefficients on the other regressors are notaffected by its exclusion.

14
automobiles and trucks by farmers during the 1920s may have caused many rural banks to
become redundant. This suggests that banking consolidation should have been greatest in rural
states with low population density. If true, we might expect that the percentage increase in
banks per capita was lower (decline was greater), the lower was a state’s 1920 population
density. The coefficient on this variable in Equation 3.3 is positive and significant, indicating
that the number of banks per capita fell most in low population density states, which is
consistent with the hypothesis.
Equation 3.4 includes the percentage changes in improved acreage and farm land value
per acre from 1910 to 1920. The coefficients on these variables indicate further the effects of
the agricultural boom and bust. Those states where agriculture had expanded the most before
1920 had the highest numbers of banks per capita in 1920, but then experienced the greatest
consolidation of banking in the subsequent decade. A great deal of this consolidation occurred
through failure.44
Dual Banking: Explaining Charter Variation Across States
The evidence in the preceding section indicates that regulatory and geographic
differences, as well as differences in economic activity, were all important in explaining
variation in the number of banks per capita across states during the 1920s. The failure of the
ratio of national to total -banks to help explain variation in the number of banks per capita (see
Equations 1.3 and 2.3) suggests that these variables were determined by many of the same
factors. This section tests that conjecture.
White examined the decision a new bank faced in choosing between a federal or state
charter. For a sample of 2,862 banks selecting a charter between 1908 and 1910, he found that
minimum capital and reserve requirements, branch banking laws, the presence of deposit
insurance, and the ratio of rural to total state population were all important for explaining a
bank’s charter decision. The lower a state’s minimum capital or reserve requirements relative
The beta coefficients for Equation 3.5 are —0.32, —0.18, —0.09, 0.40, 0.07, —0.43, and —0.27 fort~Branching,Deposit Insurance, %Li Population Density, %t~ Per Capita Income, Population Density(1920), Improved Acreage, and Land Value.

15
to the federal minimums, the more likely a bank was to select a state charter. Where
branching was permitted, state banking systems tended to expand through the opening of new
branches, rather than independent banks. Hence a new bank was more likely to choose a
federal charter. The presence of deposit insurance, on the other hand, which was available for
only state chartered banks, increased the probability that a new bank would opt for a state
charter. And finally, a bank was more likely to choose a state charter in a rural state, in order
to take advantage of weaker restrictions on real estate lending afforded state banks.45
The composition of state banking systems between federally chartered and state
chartered institutions varied widely across states during the 1920s.46 In the Northeast,
national banks were more prevalent, while in the South and Midwest, state chartered banks
tended to dominate in numbers.47 Pennsylvania and New Jersey had the highest ratios of
national to total banks in 1920, with 57% and 53% of all banks holding federal charters in
those states. Missouri had the lowest ratio, with just 8% ofbanks holding a federal charter.
Table 4 reports estimates of a state cross-section OLS regression in which the
dependent variable is the log of the ratio of national to total banks in 1920. I include the same
independent variables as used to explain the number of banks per capita. The results indicate
that these variables explain less of the interstate variation in the ratio of national to total banks
than they did of the number of banks per capita. Equation 4.1 indicates that the higher the
minimum capital requirement imposed on state-chartered banks, the higher the national bank
ratio, and Equation 4.2 shows that the ratio of national to total banks was influenced positively
by a state’s population density.48 Both results are consistent with White. The national bank
ratio was lower in deposit insurance states, although the coefficient is fairly small and not
White, The Regulation and Reform, pp. 42-62.
46 I treat trust companies and savings banks as state chartered banks. A few states in New England had
no state chartered commercial banks, but did charter trust companies and savings banks.Because they tended to be larger, national banks held larger deposit shares in all states than their
numbers alone would suggest.48 i~tsnoted in footnote 36, since population density and the minimum capital requirement are highlycollinear, they cannot be considered independent influences.

16
statistically significant. I do not find any apparent relationship between branch banking and
the national bank ratio, perhaps because branching was so limited in 1920.
When state per capita income and the variables that capture the expansion of
agriculture from 1910 to 1920 are included (Equations 4.3 and 4.4), the impact of the
minimum capital requirement and deposit insurance is reduced. Equation 4.3 suggests that a
state’s national bank ratio was influenced positively by its per capita income. Equation 4.4
indicates, however, that a state’s national bank ratio was most closely related to its change in
agricultural land value per acre from 1910 to 1920: the greater the increase in land value, the
lower a state’s national bank ratio in 1920. North Carolina, South Carolina, Mississippi,
Georgia, and Arkansas had the five largest increases in farm land value from 1910 to 1920,
and had among the lowest ratios of national to total banks in 1920. Other states with large
increases in land value and low national bank ratios included Iowa, Minnesota, and Illinois.
The apparent influence of the change in land value on the national bank ratio likely
reflects the importance of agriculture generally in these states. Land values increased the most
in Midwestern and Southern farming states, while improved acreage increased most in Western
states where agriculture did not dominate.49 In states dominated by agriculture, banking
legislation often reflected the demand of farmers for access to inexpensive sources of credit.
Farm states tended to encourage the growth of their banking systems by setting low minimum
capital requirements and minimal lending restrictions. By contrast, the relatively high
minimum capital requirements and restrictions on real estate lending imposed on national banks
limited their ability to meet the demand for credit in rural farming areas.
Table 5 reports model estimates for 1929, and the results are nearly identical to those
for 1920. Minimum capital requirements and per capita income appear important for
explaining variation in the ratio of national to total banks across states. The percentage change
I included the ratio of farm to total population as a regressor in a separate set of regressions that arenot reported here. This variable is highly correlated with the change in land value, however, and did notexertan independent influence on the dependent variable.
17
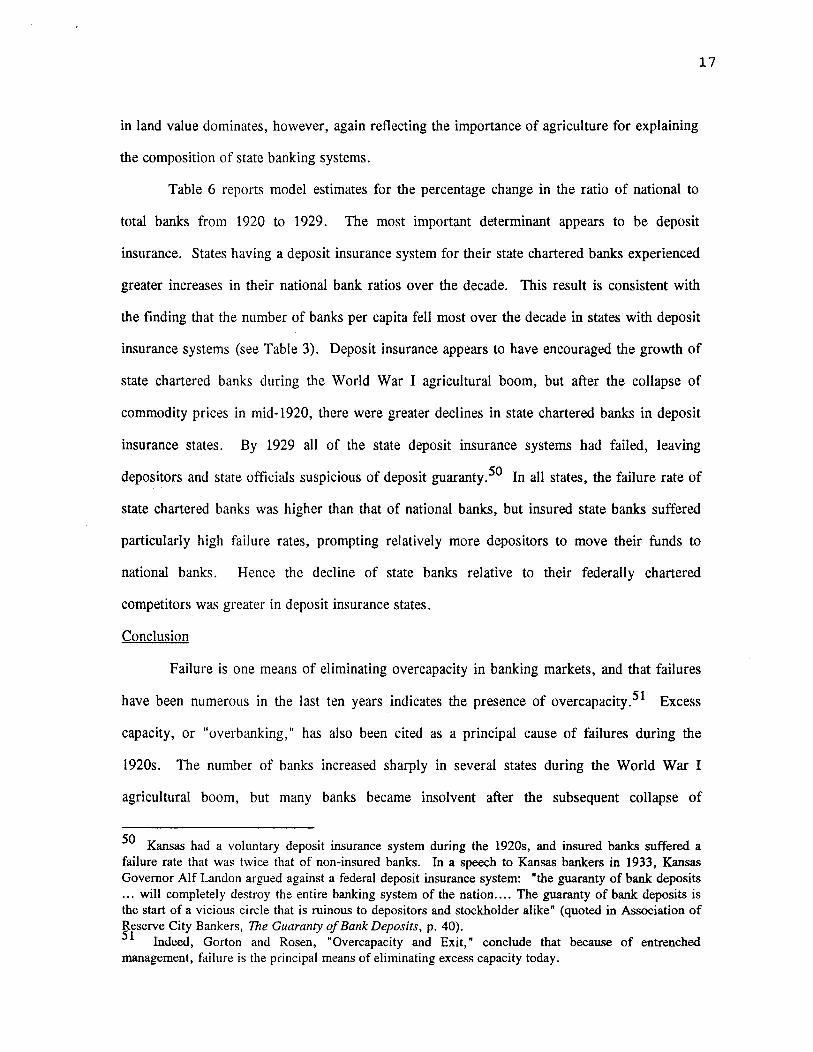
in land value dominates, however, again reflecting the importance of agriculture for explaining
the composition of state banking systems.
Table 6 reports model estimates for the percentage change in the ratio of national to
total banks from 1920 to 1929. The most important determinant appears to be deposit
insurance. States having a deposit insurance system for their state chartered banks experienced
greater increases in their national bank ratios over the decade. This result is consistent with
the finding that the number of banks per capita fell most over the decade in states with deposit
insurance systems (see Table 3). Deposit insurance appears to have encouraged the growth of
state chartered banks during the World War I agricultural boom, but after the collapse of
commodity prices in mid-1920, there were greater declines in state chartered banks in deposit
insurance states. By 1929 all of the state deposit insurance systems had failed, leaving
depositors and state officials suspicious of deposit guaranty.5° In all states, the failure rate of
state chartered banks was higher than that of national banks, but insured state banks suffered
particularly high failure rates, prompting relatively more depositors to move their funds to
national banks. Hence the decline of state banks relative to their federally chartered
competitors was greater in deposit insurance states.
Conclusion
Failure is one means of eliminating overcapacity in banking markets, and that failures
have been numerous in the last ten years indicates the presence of overcapacity.51 Excess
capacity, or “overbanking,” has also been cited as a principal cause of failures during the
1920s. The number of banks increased sharply in several states during the World War I
agricultural boom, but many banks became insolvent after the subsequent collapse of
Kansas had a voluntary deposit insurance system during the 1920s, and insured banks suffered afailure rate that was twice that of non-insured banks. In a speech to Kansas bankers in 1933, KansasGovernor Alf Landon argued against a federal deposit insurance system: “the guaranty of bank deposits
will completely destroy the entire banking system of the nation.... The guaranty of bank deposits isthe start of a vicious circle that is ruinous to depositors and stockholder alike” (quoted in Association of~eserve City Bankers, The Guaranty of BankDeposits, p. 40).
1 Indeed, Gorton and Rosen, “Overcapacity and Exit,” conclude that because of entrenchedmanagement, failure is the principal means of eliminating excess capacity today.

18
commodity prices and farm incomes. Government policies also contributed to the high
numbers of banks and failures in many states, however, and like today, reform debate focused
on the effects deposit insurance, branch banking restrictions, and other regulations.
Flat-rate deposit insurance encourages excessive risk-taking that many researchers
believe has contributed to the failure of many savings and loan institutions and commercial
banks in recent years. I find that deposit insurance also produced instability during the 1920s.
The number of insured banks increased rapidly before 1920, and in 1920 the number ofbanks
per capita was higher in deposit insurance states than elsewhere. After commodity prices
collapsed, however, insured banks had high failure rates and states with insurance systems
experienced the greatest banking consolidation.
Because they limit diversification, restrictions on branch banking have also been
blamed for contributing to the high number of financial institution failures in recent years. I
find that branching limits also caused many states to have high numbers of banks per capita
during the 1920s. Many of these institutions were “one crop” or “fair weather” banks, i.e.,
dependent on the fortunes of local agriculture, and became insolvent when the local economy
turned down.52 There were fewer banks per capita in states where branching was more
extensive, and these banks tended to be larger, more diversified geographically, and less likely
to fail.
Finally, government policies also affected the composition of state banking systems
between state-chartered and federally-chartered institutions. Because of restrictions on real
estate lending and high minimum capital requirements, national banks were least prevalent in
farm states where the demand for banks was geographically diffuse. Deposit insurance also
affected the composition of banking systems. Insurance contributed to the growth of state
banks before 1920, but from 1920 to 1929, the collapse of state deposit insurance systems
caused the ratio of national to total banks to increase more in insurance states than elsewhere.
52 Comptroller of the Currency John W. Pole used the terms “one crop” and “fair weather” to describe
small, rural unit banks. See his testimony in United States House of Representatives, Branch, Group andChain Banking.

Number of Banks Per 1000 Persons in 1920
BP2O: I I 0.00 — 0.2 II I I I II I 0.21 — 0.3 I -~10.31 — 0.4V~0.41 — 0.6 ~888~0.61 — 1.4

.2-~
op
I IP0
-mop
I I
0
zC3a.CD-‘
w
0Cl)
-5.

Table 1
The Determinants of “Overbanking”
Dependant Variable: log of Banks per 1000 Population in 1920
Variable Li. ~a 14aIntercept _0.92*** .JJ~95*** _0.89*** _1.58***
(7.96) (11.62) (6.33) (5.75)
Branching _2.72*** _2.21*** _2.19***(4.10) (3.67) (4.80) (4.75)
Deposit Insurance 0.58*** Ø~54*** Ø~53** 0.66*~(3.06) (3.21) (2.23) (2.97)
Mm. Capital(2.40)
Population Density ~~0.002*** _0.002*** _0.002***(4.46) (6.53) (4.73)
Nat’l Bank Ratio —0.26(0.58)
Per capita Income 0.001~~(2.52)
Improved Acreage 0.004*~(4.88)
Land Value 0.001(0.60)
Adj. R2 .48 .60 .59 .67
Notes: t-statistics are in parentheses; ~ ~, * indicate statistical significance at the .01, .05,and .10 levels (two-tail tests); a the t-statistics in these equations have been adjusted to accountfor model heteroscedasticity as detected using the White (1980) test.
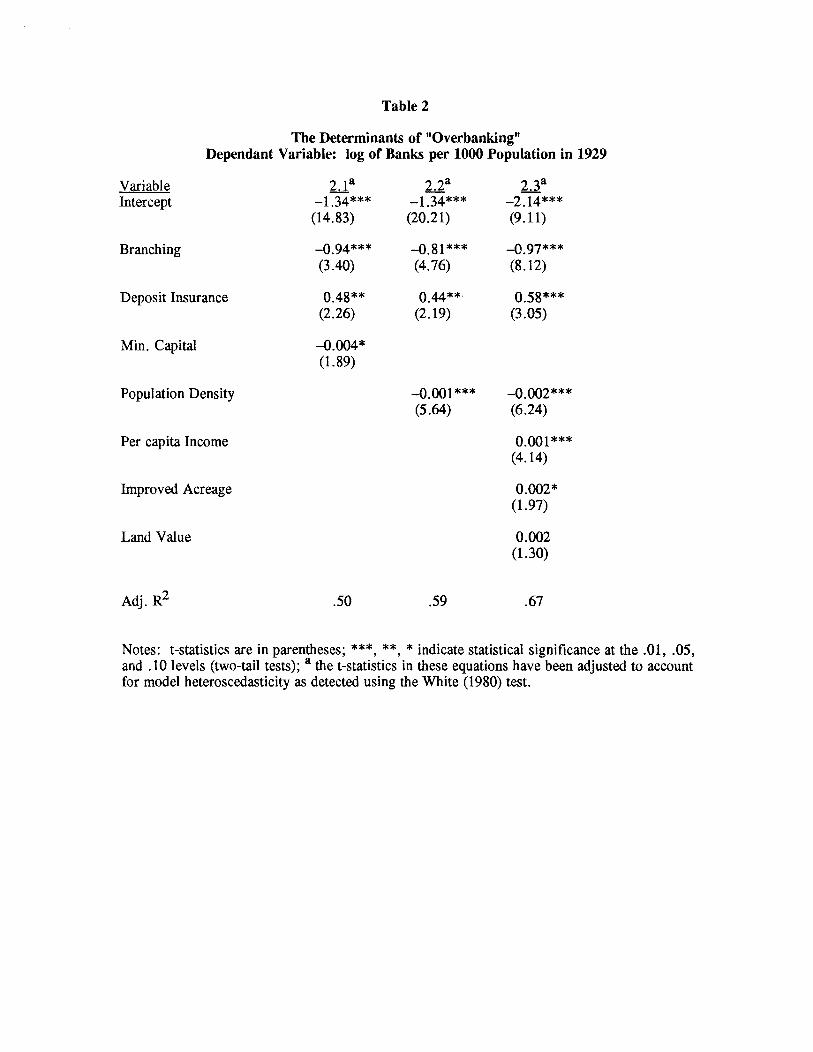
Table 2
The Determinants of “Overbanking”
Dependant Variable: log of Banks per 1000 Population in 1929
Variable ~a ~a 23aIntercept _1.34*** _1.34***
(14.83) (20.21) (9.11)
Branching .JJ94*** ~~0.81*** .J397
***
(3.40) (4.76) (8.12)
Deposit Insurance 0.48** 0.44~ 0.58***(2.26) (2.19) (3.05)
Mm. Capital _0.004*(1.89)
Population Density _0.001*** _O.002***(5.64) (6.24)
Per capita Income 0.001***(4.14)
Improved Acreage 0.002*(1.97)
Land Value 0.002(1.30)
Adj. R2 .50 .59 .67
Notes: t-statistics are in parentheses; ~ ~1c, * indicate statistical significance at the .01, .05,and .10 levels (two-tail tests); a the t-statistics in these equations have been adjusted to accountfor model heteroscedasticity as detected using the White (1980) test.

Table 3
The Determinants of “Overbanking”
Dependant Variable: Percent Change in Banks per 1000 Population, 1920-1929
Variable 32 33Intercept _0.20*** _0.21*** _0.26***
(6.52) (5.41) (7.36) (3.03)
ABranching _0.26*** _0.21* ~~0.20**(2.88) (1.91) (2.20) (2.96)
Deposit Insurance _0.14** _0.13* —0.06 _0.09*(2.13) (1.92) (1.00) (1.88)
A Mm. Cap. _0.01*(1.78)
%A Pop. Density —0.04 —0.09 —0.13(0.18) (0.45) (0.72)
%A Per capita Income 0.66*~ 0.54*(4.14) (1.87)
Pop. Density (1920) 0.0004** 0.0001(2.14) (0.47)
Improved Acreage _0.002***(4.87)
Land Value —0.001(1.26)
Adj. R2 .16 .10 .45 .59
Notes: t-statistics are in parentheses; ~ ~, * indicate statistical significance at the .01, .05,and .10 levels (two-tail tests); a the t-statistics in these equations have been adjusted to accountfor model heteroscedasticity as detected using the White (1980) test.

Table 4
The Determinants of National Banks/Total BanksDependant Variable: log of National to Total Banks in 1920
Variable 4.J. 42 43a 44aIntercept _1.53*** _1.41*** _2.03***
(13.97) (15.57) (12.38) (4.72)
Branching 0.17 0.07 —0.16 —0.24(0.27) (0.10) (0.26) (0.40)
Deposit Insurance —0.20 —0.22 —0.12 —0.18(1.14) (1.20) (0.75) (1.14)
Mm. Capital 0.01~ 0.004 0.003(2.40) (0.90) (0.74)
Population Density 0.001*(1.73)
Per capita Income 0.001*** 0.0004(3.79) (1.40)
Improved Acreage —0.001(0.85)
Land Value _0.004***(3.83)
Adj. R2 .11 .06 .24 .34
Notes: t-statistics are in parentheses; ~ ~ * indicate statistical significance at the .01, .05,and .10 levels (two-tail tests); a the t-statistics in these equations have been adjusted to accountfor model heteroscedasticity as detected using the White (1980) test.

Table S
The Determinants of National Banks/Total Banks
Dependant Variable: log of National to Total Banks in 1929
Variable 51 52 5-3a 54aIntercept _1.51*** _1.35*** 1.78***
(12.86) (16.41) (11.29) (4.45)
Branching 0.19 0.16 0.08 0.17(1.08) (0.85) (0.64) (1.02)
Deposit Insurance 0.004 —0.04 0.07 0.004(0.03) (0.24) (0.35) (0.02)
Mm. Capital 0.01** 0.01 0.003(2.17) (1.37) (1.00)
Population Density 0.001(1.13)
Per capita Income 0.001*** 0.000(2.47) (0.02)
Improved Acreage —0.001 -(0.61)
Land Value _0.005***(4.18)
Adj. R2 .07 .00 .12 .30
Notes: t-statistics are in parentheses; ~ ~, * indicate statistical significance at the .01, .05,and .10 levels (two-tail tests); a the t-statistics in these equations have been adjusted to accountfor model heteroscedasticity as detected using the White (1980) test.

Table 6
The Determinants of National Banks/Total Banks
Dependant Variable: Percent Change in National to Total Banks, 1920-1929
Variable 6.1 6.2Intercept 0.05* 0.05 0.06** 0.03
(1.76) (1.48) (2.20) (0.70)
A Branching 0.06 —0.01 0.03 0.04(0.73) (0.11) (0.45) (0.95)
Deposit Insurance 0.21*** 0.20*** 0.19*** 0.18***(3.62) (3.36) (3.14) (4.36)
A Mm. Capital 0.005* 0.004 0.003(1.86) (1.35) (1.43)
Population Density 0.14(0.64)
%A Per capita Income _0.28* _0.28**(1.68) (2.04)
Improved Acreage 0.000(0.64)
Land Value 0.000(0.82)
Adj.R2 .21 .16 .24 .22
Notes: t-statistics are in parentheses; ~ ~, * indicate statistical significance at the .01, .05,and .10 levels (two-tail tests); a the t-statistics in these equations have been adjusted to accountfor model heteroscedasticity as detected using theWhite (1980) test.

Appendix
Table Al
Variable Definitions and Data Sources
Banks Per Capita (banks per 1000 inhabitants): Banks (1920 and 1929): Board of Governorsofthe Federal Reserve System (1959); Population (1920): United States Department ofCommerce (1923, p. 22); Population (1929): United States Department of Commerce(1931b, p. 7).
Branching: Ratio of branch offices to banks. Branch Offices (1920 and 1930): Board ofGovernors of the Federal Reserve System (1943, p. 298); Banks (1920 and 1929):Board of Governors of the Federal Reserve System (1959).
Deposit Insurance: dummy variable equal to 1 for states having deposit insurance systems(Kansas, Mississippi, Nebraska, North Dakota, Oklahoma, South Dakota, Texas) andto 0 for all other states.
Improved Acreage: percentage change in improved agricultural acreage, 19 10-1920: UnitedStates Department of Commerce (1922, p. 36).
Land Value: percentage change in agricultural land value per acre, 1910-1920: United StatesDepartment of Commerce (1922, p. 58).
Minimum Capital: minimum capital required to incorporate a state chartered bank: Polk’sBankers Encyclopedia (March 1921, March 1929).
National Bank Ratio: ratio of federally chartered to all banks (1920 and 1929): Board ofGovernors of the Federal Reserve System (1959).
Per Capita Income: 1920: Leven (1925, pp. 262-63); 1929: United States Department ofCommerce (1956, p. 142).
Population Density: 1920: United States Department of Commerce (1923, p. 22); 1930:United States Department of Commerce (1931a, p. 13).

Table A2
Descriptive Statistics
Variable mean stnd. dev. mm. max.Bp2Oa 0.37 0.27 0.08 1.39in BP20 —1.20 0.62 —2.53 0.33BP29D 0.25 0.15 0.05 0.64in BP29 —1.53 0.56 —3.03 —0.45%ABP —0.26 0.18 —0.61 0.12NB2Oc 0.28 0.12 0.08 0.57in NB~0 —1.36 0.45 —2.50 —0.55NB29” 0.30 0.11 0.10 0.54in NB29 —1.28 0.41 —2.29 —0.62%A NB 0.10 0.16 —0.24 0.52Branching (1920) 0.06 0.10 0.00 0.39Branching (1929) 0.18 0.34 0.00 1.92A Branching 0.11 0.27 —0.14 1.67Deposit Insurance 0.15 0.36 0.00 1.00Mm. Capital (1920) 19.21 16.24 2.00 100.00Mm. Capital (1929) 22.19 14.55 10.00 100.00A Mm. Capital - 2.98 7.79 —25.00 23.00Pop. Density (1920) 80.44 122.52 0.70 566.40Pop. Density (1930) 92.47 142.65 0.80 644.30%A Pop. Density 0.14 0.12 —0.03 0.66Per Cap. Income (20) 608.27 195.00 253.00 1012.00Per Cap. Income (29) 616.90 223.22 270.00 1159.00%A Per Cap. Income 0.01 0.13 —0.22 0.52Improved Acreage 10.68 38.11 —29.10 202.40Land Value 73.24 47.33 —20.58 180.18
a Banks per 1000 population (1920)b Banks per 1000 population (1929)c Ratio ofnational to all banks (1920)d Ratio ofnational to all banks (1929)
Definitions and sources: see text and Appendix Table Al.

References
Alston, Lee J., “Farm Foreclosures in the United States During the Interwar Period,” JournalofEconomic History 43, December 1983, pp. 885-903.
Aiston, Lee J., Grove, Wayne A., and David C. Wheelock, “Why Do Banks Fail? Evidencefrom the 1920s,” working paper, 1992.
American Bankers Association, “The Causes of Bank Failures and Some Suggested Remedies,”
American Bankers Association Journal, November 1927, pp. 304-08.
Association ofReserve City Bankers. The Guaranty ofBankDeposits. Chicago, 1933.
Board ofGovernors ofthe Federal Reserve System. All Bank Statistics, 1896-1955. 1959.
Banking and Monetary Statistics, 1914-1941. 1943.
Bulletin, December 1937.
Bremer, C. D. American Bank Failures. New York: Columbia University Press, 1935.
Calomiris, Charles W., “Do Vulnerable Economies Need Deposit Insurance? Lessons fromthe U.S. Agricultural Boom and Bust of the 1920s,” working paper, 1989.
“Deposit Insurance: Lessons from the Record,” Economic Perspectives 13, FederalReserve Bank of Chicago, May/June 1989, pp. 10-30.
Cameron, Rondo, et. al. Banking in the Early Stages ofIndustrialization. New York: OxfordUniversity Press, 1967.
Clair, Robert T. and Gerald P. O’Driscoll, “Learning from One Another: The U.S. andEuropean Banking Experience,” research paper no. 9108, Federal Reserve Bank ofDallas, May 1991.
Federal Deposit Insurance Corporation. Annual Report. 1956.
Flood, Mark D., “The Great Deposit Insurance Debate,” Review, Federal Reserve Bank of St.Louis, July/August 1992, pp. 51-77.
Gambs, Carl M., “Bank Failures--An Historical Perspective,” Monthly Review 62, FederalReserve Bank of Kansas City, June 1977, pp. 10-20.
Gorton, Gary and Richard Rosen, “Overcapacity and Exit from Banking,” working paper,January 1992.
Johnson, H. Thomas, “Postwar Optimism and the Rural Financial Crisis of the 1920s,”Explorations in Economic History 2, Winter 1973/74, pp. 173-92.
Keeley, Michael C., “Deposit Insurance, Risk, and Market Power in Banking,” AmericanEconomic Review 80, December 1990, pp. 1183-1200.
Leven, Maurice. Income in the Various States: Its Sources and Distribution, 1919, 1920, and1921. New York: National Bureau ofEconomic Research, 1925.

Lawrence, Joseph Stagg. Banking Concentration in the United States: A Critical Analysis.New York: The Bankers Publishing Co., 1930.
Litan, Robert E., “Could Broader Powers -- Geographic and Product -- Have Saved theBanks?” in Richard J. Herring and Ashish C. Shah, eds., Reforming the AmericanBanking System, Proceedings of a Conference Sponsored by the Wharton FinancialInstitutions Center, 1991, pp. 18-40.
Polk’s Bankers Encyclopedia. New York: Bankers Encyclopedia Company (March 1921,March 1929).
United States Department of Commerce, Bureau of the Census. Fourteenth Census of theUnited States, Vol. 5: Agriculture. Washington, 1922.
Abstract of the Fourteenth Census of the United States, 1920. Washington, 1923.
FWeenrh Census of the United States, Vol. 1: Population. Washington, 193 la.
Statistical Abstract of the United States, 1931. Washington, 193 lb.
United States Department of Commerce, Office of Business Economics. Personal Income ByStates Since 1929, A Supplement to the Survey of Current Business. Washington,1956.
United States Department of the Treasury, Office ofthe Comptroller of the Currency. AnnualReport. 1932.
United States House of Representatives, Committee on Banking and Currency. Branch,Group, and Chain Banking. 71st Congress, 2nd Session, February 1930.
Wheelock, David C., “Deposit Insurance and Bank Failures: New Evidence from the 1920s,”Economic Inquiry 30, July 1992, pp. 530-43.
White, Eugene N., “State Sponsored Insurance of Bank Deposits in the United States, 1907-1929,” Journal of Economic History 41 (no. 3), September 1981, pp. 537-57.
“The Political Economy of Banking Regulation, 1864-1933,” Journal of EconomicHistory 42, 1982, pp. 33-40.
The Regulation and Reform of the American Banking System, 1900-1929. Princeton:Princeton University Press, 1983.
White, H., “A Heteroskedasticity-consistent Covariance Matrix Estimator and a Direct Test forHeteroskedasticity,” Econometrica 48, 1980, pp. 817-38.
Young, Ralph A., et. al. The Banking Situation in the United States. New York: NationalIndustrial Conference Board, 1932.