cpi detailed report - federal reserve bank of st. louis
TRANSCRIPT
CPI Detailed Report Data for September 2010
Editors
Malik Crawford
Andrew Mauro
Jonathan Church
Contents Page
Consumer Price Movements, September 2010 ............................................................................................ 1
CPI-U 12-Month Changes ............................................................................................................................ 3
Technical Notes ........................................................................................................................................... 111
CPI–U CPI–W
Index tables Table Page Table Page
U.S. city average:
Expenditure categories; commodity, service groups; special indexes .... 1 4 6 24
Seasonally adjusted expenditure categories;
commodity, service groups; special indexes ....................................... 2 6 7 26
Detailed expenditure categories ............................................................. 3 8 8 28
Seasonally adjusted detailed expenditure categories .............................. 4 15 9 34
Special detailed categories ..................................................................... 5 22
Historical:
All items, 1913-present ....................................................................... 24 68 27 86
Commodity and service groups and detailed
expenditures, indexes ...................................................................... 25 72 28 90
Commodity and service groups and detailed
expenditures, percent change from previous December .................. 26 79 29 96
Selected areas:
All items indexes .................................................................................... 10 40 17 54
Regions .................................................................................................. 11 41 18 55
Population classes .................................................................................. 12 43 19 57
Regions and population classes cross-classified .................................... 13 45 20 59
Food at home expenditure categories ..................................................... 14 49 21 63
Areas priced monthly: percent changes over the month ......................... 15 50 22 64
City indexes and percent changes .......................................................... 16 51 23 65
i CPI Detailed Report-September 2010
Contents—Continued CPI–U
Table Page
Average price tables
U.S. city average
Energy:
Residential prices ............................................................................................ P1 102
Residential units and consumption ranges....................................................... P2 103
Gasoline .......................................................................................................... P3 104
Retail Food ........................................................................................................ P4 105
Chained CPI-U (C-CPI-U) tables
U.S. city average, expenditure categories, and commodity
and service groups .......................................................................................... 1C 107
U.S. city average, all items index ....................................................................... 24C 108
Historical U.S. city average, expenditure categories, and commodity
and service groups, indexes............................................................................ 25C 109
Historical U.S. city average, expenditure categories, and commodity
and service groups, percent changes from previous December ...................... 26C 110
Scheduled Release Dates Consumer Price Index data are scheduled for initial release on the following dates:
Index month Release date
October November 17
November December 15
December January 14
ii CPI Detailed Report-September 2010
CONSUMER PRICE MOVEMENTS SEPTEMBER 2010
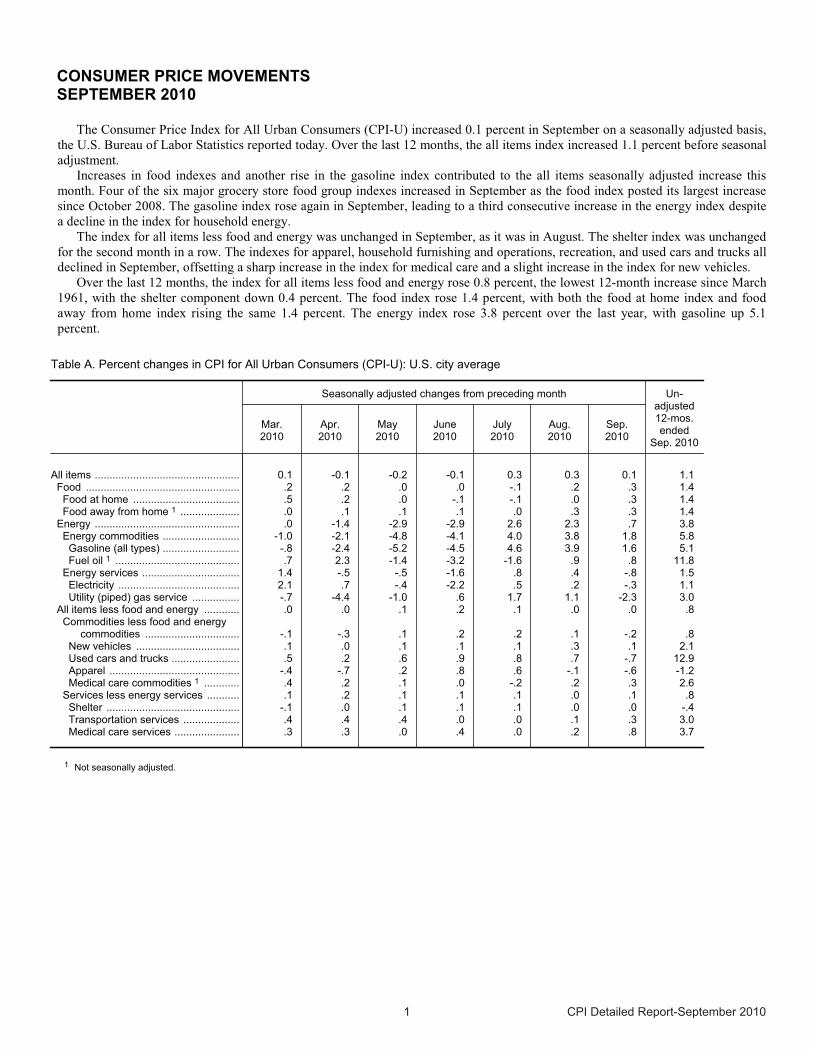
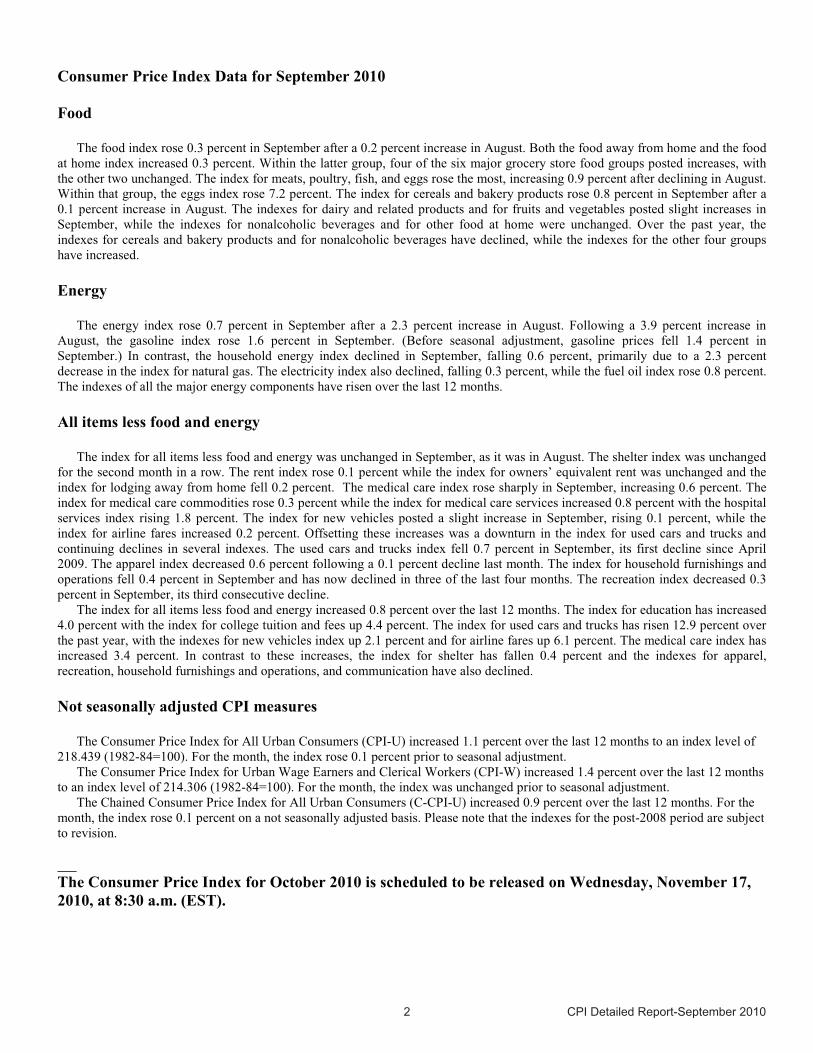
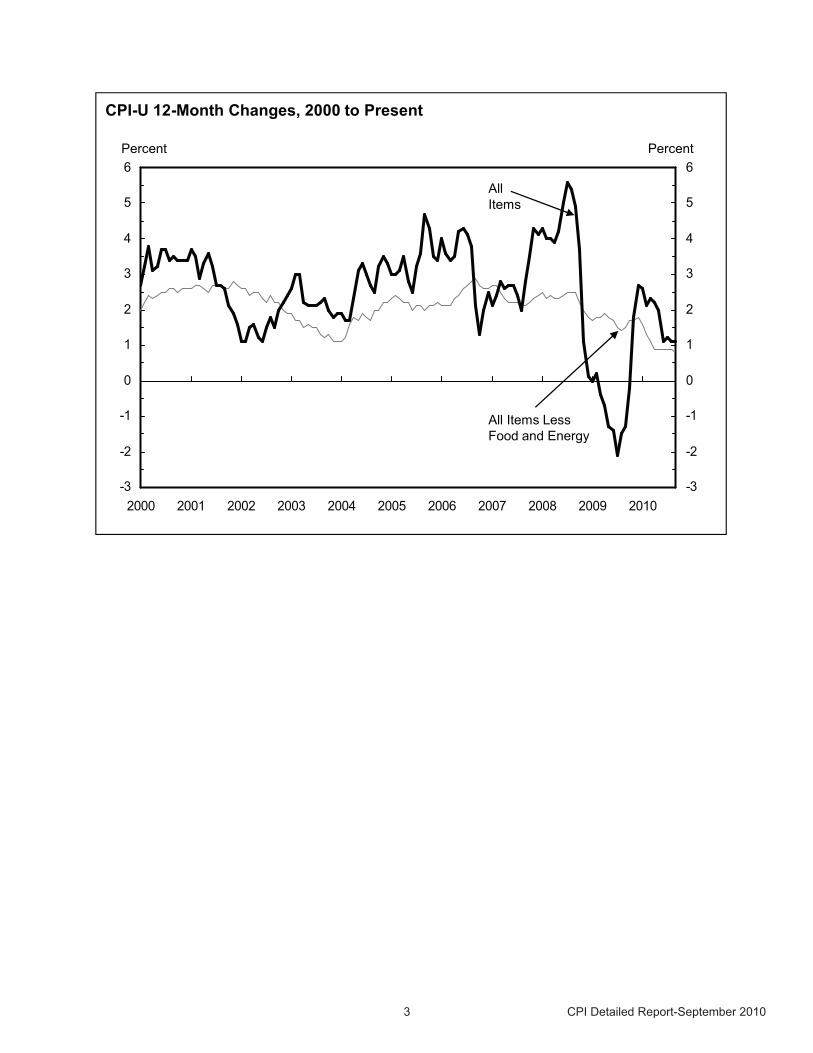
The Consumer Price Index for All Urban Consumers (CPI-U) increased 0.1 percent in September on a seasonally adjusted basis, the U.S. Bureau of Labor Statistics reported today. Over the last 12 months, the all items index increased 1.1 percent before seasonal adjustment.
Increases in food indexes and another rise in the gasoline index contributed to the all items seasonally adjusted increase this month. Four of the six major grocery store food group indexes increased in September as the food index posted its largest increase since October 2008. The gasoline index rose again in September, leading to a third consecutive increase in the energy index despite a decline in the index for household energy.
The index for all items less food and energy was unchanged in September, as it was in August. The shelter index was unchanged for the second month in a row. The indexes for apparel, household furnishing and operations, recreation, and used cars and trucks all declined in September, offsetting a sharp increase in the index for medical care and a slight increase in the index for new vehicles.
Over the last 12 months, the index for all items less food and energy rose 0.8 percent, the lowest 12-month increase since March 1961, with the shelter component down 0.4 percent. The food index rose 1.4 percent, with both the food at home index and food away from home index rising the same 1.4 percent. The energy index rose 3.8 percent over the last year, with gasoline up 5.1 percent.
Table A. Percent changes in CPI for All Urban Consumers (CPI-U): U.S. city average
Seasonally adjusted changes from preceding month Un-adjusted12-mos.ended
Sep. 2010
Mar.2010
Apr.2010
May2010
June2010
July2010
Aug.2010
Sep.2010
All items ................................................. 0.1 -0.1 -0.2 -0.1 0.3 0.3 0.1 1.1 Food .................................................... .2 .2 .0 .0 -.1 .2 .3 1.4 Food at home .................................... .5 .2 .0 -.1 -.1 .0 .3 1.4 Food away from home 1 .................... .0 .1 .1 .1 .0 .3 .3 1.4
Energy ................................................. .0 -1.4 -2.9 -2.9 2.6 2.3 .7 3.8 Energy commodities .......................... -1.0 -2.1 -4.8 -4.1 4.0 3.8 1.8 5.8
Gasoline (all types) .......................... -.8 -2.4 -5.2 -4.5 4.6 3.9 1.6 5.1 Fuel oil 1 .......................................... .7 2.3 -1.4 -3.2 -1.6 .9 .8 11.8
Energy services ................................. 1.4 -.5 -.5 -1.6 .8 .4 -.8 1.5 Electricity ......................................... 2.1 .7 -.4 -2.2 .5 .2 -.3 1.1 Utility (piped) gas service ................ -.7 -4.4 -1.0 .6 1.7 1.1 -2.3 3.0
All items less food and energy ............ .0 .0 .1 .2 .1 .0 .0 .8 Commodities less food and energy
commodities ................................ -.1 -.3 .1 .2 .2 .1 -.2 .8 New vehicles ................................... .1 .0 .1 .1 .1 .3 .1 2.1 Used cars and trucks ....................... .5 .2 .6 .9 .8 .7 -.7 12.9 Apparel ............................................ -.4 -.7 .2 .8 .6 -.1 -.6 -1.2 Medical care commodities 1 ............ .4 .2 .1 .0 -.2 .2 .3 2.6
Services less energy services ........... .1 .2 .1 .1 .1 .0 .1 .8 Shelter ............................................. -.1 .0 .1 .1 .1 .0 .0 -.4 Transportation services ................... .4 .4 .4 .0 .0 .1 .3 3.0 Medical care services ...................... .3 .3 .0 .4 .0 .2 .8 3.7
1 Not seasonally adjusted.
1 CPI Detailed Report-September 2010
Consumer Price Index Data for September 2010
Food
The food index rose 0.3 percent in September after a 0.2 percent increase in August. Both the food away from home and the food at home index increased 0.3 percent. Within the latter group, four of the six major grocery store food groups posted increases, with the other two unchanged. The index for meats, poultry, fish, and eggs rose the most, increasing 0.9 percent after declining in August. Within that group, the eggs index rose 7.2 percent. The index for cereals and bakery products rose 0.8 percent in September after a 0.1 percent increase in August. The indexes for dairy and related products and for fruits and vegetables posted slight increases in September, while the indexes for nonalcoholic beverages and for other food at home were unchanged. Over the past year, the indexes for cereals and bakery products and for nonalcoholic beverages have declined, while the indexes for the other four groups have increased.
Energy
The energy index rose 0.7 percent in September after a 2.3 percent increase in August. Following a 3.9 percent increase in August, the gasoline index rose 1.6 percent in September. (Before seasonal adjustment, gasoline prices fell 1.4 percent in September.) In contrast, the household energy index declined in September, falling 0.6 percent, primarily due to a 2.3 percent decrease in the index for natural gas. The electricity index also declined, falling 0.3 percent, while the fuel oil index rose 0.8 percent. The indexes of all the major energy components have risen over the last 12 months.
All items less food and energy
The index for all items less food and energy was unchanged in September, as it was in August. The shelter index was unchanged for the second month in a row. The rent index rose 0.1 percent while the index for owners’ equivalent rent was unchanged and the index for lodging away from home fell 0.2 percent. The medical care index rose sharply in September, increasing 0.6 percent. The index for medical care commodities rose 0.3 percent while the index for medical care services increased 0.8 percent with the hospital services index rising 1.8 percent. The index for new vehicles posted a slight increase in September, rising 0.1 percent, while the index for airline fares increased 0.2 percent. Offsetting these increases was a downturn in the index for used cars and trucks and continuing declines in several indexes. The used cars and trucks index fell 0.7 percent in September, its first decline since April 2009. The apparel index decreased 0.6 percent following a 0.1 percent decline last month. The index for household furnishings and operations fell 0.4 percent in September and has now declined in three of the last four months. The recreation index decreased 0.3 percent in September, its third consecutive decline.
The index for all items less food and energy increased 0.8 percent over the last 12 months. The index for education has increased 4.0 percent with the index for college tuition and fees up 4.4 percent. The index for used cars and trucks has risen 12.9 percent over the past year, with the indexes for new vehicles index up 2.1 percent and for airline fares up 6.1 percent. The medical care index has increased 3.4 percent. In contrast to these increases, the index for shelter has fallen 0.4 percent and the indexes for apparel, recreation, household furnishings and operations, and communication have also declined.
Not seasonally adjusted CPI measures
The Consumer Price Index for All Urban Consumers (CPI-U) increased 1.1 percent over the last 12 months to an index level of 218.439 (1982-84=100). For the month, the index rose 0.1 percent prior to seasonal adjustment.
The Consumer Price Index for Urban Wage Earners and Clerical Workers (CPI-W) increased 1.4 percent over the last 12 months to an index level of 214.306 (1982-84=100). For the month, the index was unchanged prior to seasonal adjustment.
The Chained Consumer Price Index for All Urban Consumers (C-CPI-U) increased 0.9 percent over the last 12 months. For the month, the index rose 0.1 percent on a not seasonally adjusted basis. Please note that the indexes for the post-2008 period are subject to revision.
The Consumer Price Index for October 2010 is scheduled to be released on Wednesday, November 17,
2010, at 8:30 a.m. (EST).
2 CPI Detailed Report-September 2010
-3
-2
-1
0
1
2
3
4
5
6
2000 2001 2002 2003 2004 2005 2006 2007 2008 2009 2010
-3
-2
-1
0
1
2
3
4
5
6
CPI-U 12-Month Changes, 2000 to Present
Percent Percent
All Items LessFood and Energy
All Items
3 CPI Detailed Report-September 2010
Table 1. Consumer Price Index for All Urban Consumers (CPI-U): U.S. city average, by expenditure category and commodity andservice group
(1982-84=100, unless otherwise noted)
Item and group
Relativeimportance,December
2009
Unadjustedindexes
Unadjustedpercent change toSep. 2010 from—
Seasonally adjustedpercent change from—
Aug.2010
Sep.2010
Sep.2009
Aug.2010
June toJuly
July toAug.
Aug. toSep.
Expenditure category
All items ........................................................................................ 100.000 218.312 218.439 1.1 0.1 0.3 0.3 0.1 All items (1967=100) .................................................................... - 653.966 654.346 - - - - -
Food and beverages .................................................................. 14.795 219.877 220.586 1.4 .3 .0 .1 .3 Food ......................................................................................... 13.738 219.491 220.216 1.4 .3 -.1 .2 .3
Food at home ......................................................................... 7.801 215.382 216.161 1.4 .4 -.1 .0 .3 Cereals and bakery products ............................................... 1.108 249.736 250.085 -.5 .1 -.3 .1 .8 Meats, poultry, fish, and eggs .............................................. 1.745 208.854 211.280 4.7 1.2 .3 -.3 .9 Dairy and related products 1 ................................................ .820 198.712 199.042 2.9 .2 .5 -.1 .2 Fruits and vegetables ........................................................... 1.153 265.914 268.832 .5 1.1 -1.9 .4 .1 Nonalcoholic beverages and beverage materials ................ .952 161.764 161.771 -.7 .0 .6 -.1 .0 Other food at home .............................................................. 2.023 192.026 191.289 .4 -.4 .2 .2 .0 Sugar and sweets .............................................................. .295 200.335 202.469 2.8 1.1 .6 -.1 1.1 Fats and oils ....................................................................... .232 201.764 201.971 1.0 .1 .0 .7 .1 Other foods ........................................................................ 1.496 205.857 204.322 -.2 -.7 .1 .2 -.2
Other miscellaneous foods 1 2 ......................................... .439 121.787 122.106 .0 .3 .4 -.2 .3 Food away from home 1 ......................................................... 5.937 226.422 227.075 1.4 .3 .0 .3 .3 Other food away from home 1 2 ........................................... .326 159.517 160.072 1.8 .3 .0 .1 .3
Alcoholic beverages ................................................................. 1.056 223.536 224.043 1.2 .2 .5 .0 .2
Housing ...................................................................................... 41.960 216.976 216.602 -.3 -.2 .1 .0 -.1 Shelter ...................................................................................... 32.289 248.595 248.522 -.4 .0 .1 .0 .0
Rent of primary residence 3 ................................................... 5.966 249.024 249.368 .2 .1 .1 -.1 .1 Lodging away from home 2 .................................................... .769 139.999 135.800 1.6 -3.0 .2 -1.3 -.2 Owners’ equivalent rent of residences 3 4 .............................. 25.206 256.509 256.590 -.1 .0 .1 .0 .0 Owners’ equivalent rent of primary residence 3 4 ................ 23.593 256.503 256.584 -.1 .0 .1 .0 .0
Tenants’ and household insurance 1 2 ................................... .347 126.463 126.627 3.6 .1 .5 .5 .1 Fuels and utilities ..................................................................... 5.081 219.602 217.695 2.9 -.9 .6 .4 -.4
Household energy .................................................................. 4.028 194.865 192.635 2.2 -1.1 .6 .5 -.6 Fuel oil and other fuels 1 ...................................................... .276 263.196 265.812 12.3 1.0 -1.6 .7 1.0 Gas (piped) and electricity 3 ................................................. 3.752 199.632 197.049 1.5 -1.3 .8 .4 -.8
Water and sewer and trash collection services 2 ................... 1.052 172.491 172.833 5.8 .2 .4 .2 .4 Household furnishings and operations ..................................... 4.590 125.005 124.535 -2.9 -.4 -.1 .0 -.4
Household operations 1 2 ....................................................... .781 150.630 150.346 -.1 -.2 .1 -.1 -.2
Apparel ....................................................................................... 3.695 116.667 121.011 -1.2 3.7 .6 -.1 -.6 Men’s and boys’ apparel .......................................................... .903 110.229 112.201 -.6 1.8 -.2 -.1 -.6 Women’s and girls’ apparel ...................................................... 1.580 102.702 109.217 -2.9 6.3 1.4 -.3 -1.4 Infants’ and toddlers’ apparel ................................................... .196 113.245 114.413 -1.6 1.0 2.2 -1.3 -1.3 Footwear .................................................................................. .721 125.656 129.303 .5 2.9 .2 -.5 .3
Transportation ............................................................................ 16.685 193.454 192.412 4.6 -.5 1.3 1.2 .5 Private transportation ............................................................... 15.497 188.616 187.646 4.6 -.5 1.4 1.3 .5
New and used motor vehicles 2 ............................................. 6.386 97.891 97.502 4.3 -.4 .3 .4 -.2 New vehicles ........................................................................ 3.573 137.119 137.365 2.1 .2 .1 .3 .1 Used cars and trucks ........................................................... 2.012 147.909 146.065 12.9 -1.2 .8 .7 -.7
Motor fuel ............................................................................... 4.525 235.690 232.518 5.4 -1.3 4.4 3.9 1.8 Gasoline (all types) .............................................................. 4.337 235.110 231.819 5.1 -1.4 4.6 3.9 1.6
Motor vehicle parts and equipment 1 ..................................... .401 137.646 137.802 3.3 .1 .4 .3 .1 Motor vehicle maintenance and repair 1 ................................ 1.167 248.390 249.231 1.9 .3 .0 .3 .3
Public transportation ................................................................ 1.187 254.717 252.525 5.3 -.9 -.8 -.2 .5
Medical care ............................................................................... 6.513 388.467 390.616 3.4 .6 -.1 .2 .6 Medical care commodities 1 ..................................................... 1.611 314.881 315.804 2.6 .3 -.2 .2 .3 Medical care services ............................................................... 4.902 411.182 413.807 3.7 .6 .0 .2 .8
Professional services ............................................................. 2.796 329.318 330.149 2.9 .3 .3 .2 .4
See footnotes at end of table.
4 CPI Detailed Report-September 2010
Table 1. Consumer Price Index for All Urban Consumers (CPI-U): U.S. city average, by expenditure category and commodity andservice group -Continued
(1982-84=100, unless otherwise noted)
Item and group
Relativeimportance,December
2009
Unadjustedindexes
Unadjustedpercent change toSep. 2010 from—
Seasonally adjustedpercent change from—
Aug.2010
Sep.2010
Sep.2009
Aug.2010
June toJuly
July toAug.
Aug. toSep.
Expenditure category
Hospital and related services 3 .............................................. 1.619 605.859 614.667 7.3 1.5 -0.4 0.5 1.5
Recreation 2 ............................................................................... 6.437 113.521 113.120 -1.3 -.4 -.1 -.2 -.3 Video and audio 2 .................................................................... 1.894 98.852 98.638 -2.1 -.2 -.4 -.5 .0
Education and communication 2 ................................................ 6.434 130.599 131.154 1.6 .4 .2 .0 -.1 Education 2 .............................................................................. 3.035 201.476 203.353 4.0 .9 .4 .0 -.2 Educational books and supplies ............................................. .200 504.635 508.892 3.1 .8 -.2 -1.4 .6 Tuition, other school fees, and childcare ................................ 2.835 579.833 585.271 4.0 .9 .4 .1 -.3
Communication 2 ..................................................................... 3.399 84.699 84.665 -.4 .0 .1 .0 .0 Information and information processing 1 2 ............................ 3.225 81.532 81.497 -.6 .0 .1 .0 .0 Telephone services 1 2 ......................................................... 2.392 102.534 102.633 -.3 .1 .2 .1 .1 Information technology, hardware and services 1 5 ............. .833 9.381 9.339 -1.4 -.4 -.2 -.2 -.4 Personal computers and peripheral equipment 6 ............... .246 75.798 75.570 -3.1 -.3 .4 .2 .1
Other goods and services .......................................................... 3.483 383.685 383.663 2.5 .0 .7 .3 -.1 Tobacco and smoking products 1 ............................................ .871 822.662 823.766 6.8 .1 1.6 .4 .1 Personal care ........................................................................... 2.612 207.042 206.929 1.1 -.1 .4 .2 -.2
Personal care products 1 ....................................................... .688 161.337 160.985 -.9 -.2 .8 .0 -.2 Personal care services 1 ........................................................ .642 230.354 230.332 .9 .0 .1 -.1 .0 Miscellaneous personal services ........................................... 1.048 355.429 355.964 3.0 .2 .5 .2 -.1
Commodity and service group
Commodities ................................................................................ 39.816 173.925 174.282 1.6 .2 .5 .5 .2Food and beverages .................................................................. 14.795 219.877 220.586 1.4 .3 .0 .1 .3 Commodities less food and beverages ...................................... 25.021 149.558 149.761 1.7 .1 .9 .8 .1
Nondurables less food and beverages ..................................... 15.044 187.890 188.770 1.7 .5 1.3 1.4 .4 Apparel ................................................................................... 3.695 116.667 121.011 -1.2 3.7 .6 -.1 -.6 Nondurables less food, beverages, and apparel .................... 11.349 236.498 235.211 2.7 -.5 1.9 2.0 .8
Durables ................................................................................... 9.978 111.587 111.174 1.6 -.4 .1 .4 -.3Services ....................................................................................... 60.184 262.421 262.320 .8 .0 .1 .1 .0 Rent of shelter 4 ......................................................................... 31.942 259.015 258.934 -.4 .0 -.1 .1 .3 Tenants’ and household insurance 1 2 ....................................... .347 126.463 126.627 3.6 .1 .5 .5 .1 Gas (piped) and electricity 3 ....................................................... 3.752 199.632 197.049 1.5 -1.3 .8 .4 -.8 Water and sewer and trash collection services 2 ....................... 1.052 172.491 172.833 5.8 .2 .4 .2 .4 Household operations 1 2 ........................................................... .781 150.630 150.346 -.1 -.2 .1 -.1 -.2 Transportation services .............................................................. 6.060 260.944 260.577 3.0 -.1 .0 .1 .3 Medical care services ................................................................. 4.902 411.182 413.807 3.7 .6 .0 .2 .8 Other services ............................................................................ 11.347 311.443 311.802 1.5 .1 .3 .0 -.2
Special indexes
All items less food ........................................................................ 86.262 218.147 218.179 1.1 .0 .4 .3 .1 All items less shelter .................................................................... 67.711 208.925 209.133 1.9 .1 .4 .4 .1 All items less medical care ........................................................... 93.487 209.952 210.001 1.0 .0 .3 .3 .1 Commodities less food ................................................................. 26.078 152.182 152.395 1.7 .1 .9 .7 .1 Nondurables less food ................................................................. 16.100 190.025 190.885 1.7 .5 1.4 1.3 .5 Nondurables less food and apparel ............................................. 12.405 234.212 233.089 2.6 -.5 1.7 1.8 .7 Nondurables ................................................................................. 29.838 204.111 204.920 1.6 .4 .8 .9 .3 Services less rent of shelter 4 ...................................................... 28.243 286.775 286.640 2.3 .0 .1 .2 .1 Services less medical care services ............................................ 55.282 250.766 250.516 .6 -.1 .0 .1 .1 Energy .......................................................................................... 8.553 212.663 210.003 3.8 -1.3 2.6 2.3 .7 All items less energy .................................................................... 91.447 220.619 221.030 .9 .2 .1 .1 .0
All items less food and energy ................................................... 77.708 221.551 221.907 .8 .2 .1 .0 .0 Commodities less food and energy commodities ..................... 21.276 143.206 143.866 .8 .5 .2 .1 -.2 Energy commodities ............................................................... 4.801 238.702 235.797 5.8 -1.2 4.0 3.8 1.8
Services less energy services .................................................. 56.432 268.903 269.034 .8 .0 .1 .0 .1 Purchasing power of the consumer dollar (1982-84=$1.00) ........ - $ .458 $ .458 - - - - -
Purchasing power of the consumer dollar (1967=$1.00) ............. - $ .153 $ .153 - - - - -
1 Not seasonally adjusted.2 Indexes on a December 1997=100 base.3 This index series was calculated using a Laspeyres estimator. All other
item stratum index series were calculated using a geometric means estimator.4 Indexes on a December 1982=100 base.
5 Indexes on a December 1988=100 base.6 Indexes on a December 2007=100 base.- Data not available.
NOTE: Index applies to a month as a whole, not to any specific date.
5 CPI Detailed Report-September 2010
Table 2. Consumer Price Index for All Urban Consumers (CPI-U): Seasonally adjusted U.S. city average, by expenditure categoryand commodity and service group
(1982-84=100, unless otherwise noted)
Item and group
Seasonally adjusted indexesSeasonally adjusted annual rate percent
change for
3 months ended— 6 monthsended—
June2010
July2010
Aug.2010
Sep.2010
Dec.2009
Mar.2010
June2010
Sep.2010
Mar.2010
Sep.2010
Expenditure category
All items .............................................................................. 216.929 217.597 218.150 218.372 2.5 0.9 -1.5 2.7 1.7 0.6
Food and beverages ......................................................... 219.696 219.641 219.961 220.644 1.1 2.0 .7 1.7 1.5 1.2 Food ................................................................................ 219.369 219.222 219.563 220.262 1.0 2.3 .6 1.6 1.6 1.1 Food at home ................................................................ 215.622 215.430 215.506 216.241 .7 3.7 .0 1.2 2.2 .6
Cereals and bakery products ...................................... 249.216 248.561 248.746 250.651 1.6 -2.8 -2.8 2.3 -.6 -.3 Meats, poultry, fish, and eggs ..................................... 208.669 209.196 208.537 210.311 -.2 4.1 12.0 3.2 1.9 7.5 Dairy and related products 1 ....................................... 197.947 198.991 198.712 199.042 3.0 8.5 -1.7 2.2 5.7 .2 Fruits and vegetables .................................................. 274.549 269.266 270.413 270.585 .3 19.7 -9.9 -5.7 9.6 -7.8 Nonalcoholic beverages and beverage materials ....... 160.840 161.755 161.588 161.667 -1.5 -.7 -2.6 2.1 -1.1 -.3 Other food at home ..................................................... 190.613 190.968 191.436 191.482 1.2 -1.0 -.5 1.8 .1 .7 Sugar and sweets ..................................................... 199.608 200.816 200.610 202.826 4.5 -.1 .3 6.6 2.2 3.4 Fats and oils .............................................................. 199.817 199.743 201.077 201.256 -.6 -1.3 2.9 2.9 -.9 2.9 Other foods ............................................................... 204.265 204.548 205.055 204.645 .8 -1.2 -1.1 .7 -.2 -.2
Other miscellaneous foods 1 2 ................................ 121.551 122.052 121.787 122.106 1.1 -.3 -2.5 1.8 .4 -.3 Food away from home 1 ............................................... 225.797 225.710 226.422 227.075 1.4 .4 1.4 2.3 .9 1.9 Other food away from home 1 2 .................................. 159.271 159.338 159.517 160.072 -.8 4.3 1.6 2.0 1.7 1.8
Alcoholic beverages ........................................................ 222.582 223.758 223.789 224.249 2.0 -1.5 1.2 3.0 .2 2.1
Housing ............................................................................. 215.933 216.192 216.277 216.157 .3 -1.1 -.6 .4 -.4 -.1 Shelter ............................................................................. 248.360 248.533 248.475 248.590 -.5 -2.2 .9 .4 -1.4 .6
Rent of primary residence 3 .......................................... 249.201 249.381 249.213 249.535 -.6 .3 .4 .5 -.1 .5 Lodging away from home 2 ........................................... 137.144 137.410 135.651 135.371 -3.1 -6.7 23.1 -5.1 -4.9 8.1 Owners’ equivalent rent of residences 3 4 .................... 256.370 256.521 256.580 256.667 -.4 -.8 .3 .5 -.6 .4 Owners’ equivalent rent of primary residence 3 4 ....... 256.365 256.513 256.575 256.661 -.4 -.8 .3 .5 -.6 .4
Tenants’ and household insurance 1 2 ......................... 125.289 125.865 126.463 126.627 5.5 2.0 2.8 4.3 3.7 3.6 Fuels and utilities ............................................................ 212.218 213.471 214.372 213.483 8.6 8.8 -7.1 2.4 8.7 -2.5
Household energy ......................................................... 187.134 188.333 189.216 187.999 9.5 8.9 -10.1 1.9 9.2 -4.3Fuel oil and other fuels 1 ............................................. 265.521 261.257 263.196 265.812 51.8 22.0 -14.4 .4 36.1 -7.3 Gas (piped) and electricity 3 ....................................... 191.036 192.576 193.441 191.969 6.9 8.0 -9.8 2.0 7.4 -4.1
Water and sewer and trash collection services 2 .......... 170.723 171.409 171.833 172.598 4.8 8.5 5.3 4.5 6.6 4.9 Household furnishings and operations ............................ 125.203 125.135 125.193 124.729 -2.5 -3.7 -3.7 -1.5 -3.1 -2.6
Household operations 1 2 ............................................. 150.560 150.747 150.630 150.346 -.7 -.5 1.5 -.6 -.6 .5
Apparel .............................................................................. 119.705 120.373 120.205 119.444 -.7 -4.5 1.3 -.9 -2.6 .2 Men’s and boys’ apparel ................................................. 113.432 113.220 113.094 112.412 -3.6 -3.9 9.0 -3.5 -3.7 2.5 Women’s and girls’ apparel ............................................. 106.627 108.074 107.759 106.293 -1.6 -5.0 -3.9 -1.2 -3.4 -2.6 Infants’ and toddlers’ apparel .......................................... 114.727 117.212 115.667 114.148 -7.9 1.3 2.5 -2.0 -3.4 .2 Footwear ......................................................................... 128.153 128.465 127.882 128.327 4.1 -5.0 2.6 .5 -.6 1.6
Transportation ................................................................... 188.135 190.544 192.909 193.961 12.4 4.6 -10.1 13.0 8.5 .8 Private transportation ...................................................... 183.147 185.797 188.302 189.331 12.0 5.4 -11.5 14.2 8.6 .5
New and used motor vehicles 2 .................................... 97.307 97.557 97.908 97.739 10.8 3.1 1.3 1.8 6.9 1.5 New vehicles ............................................................... 137.939 138.139 138.529 138.704 7.0 -1.2 .4 2.2 2.8 1.3Used cars and trucks .................................................. 143.950 145.088 146.093 145.139 32.5 11.4 6.6 3.3 21.5 4.9
Motor fuel ...................................................................... 215.489 224.977 233.847 238.064 20.5 9.5 -37.3 49.0 14.9 -3.4 Gasoline (all types) ..................................................... 214.321 224.135 232.965 236.714 23.6 8.6 -38.9 48.8 15.9 -4.6
Motor vehicle parts and equipment 1 ............................ 136.686 137.236 137.646 137.802 4.2 2.2 3.5 3.3 3.2 3.4 Motor vehicle maintenance and repair 1 ....................... 247.635 247.536 248.390 249.231 1.5 2.0 1.6 2.6 1.8 2.1
Public transportation ....................................................... 252.626 250.567 250.191 251.529 19.0 -5.5 11.2 -1.7 6.0 4.5
Medical care ...................................................................... 388.254 387.933 388.842 391.328 2.5 5.7 2.3 3.2 4.1 2.8 Medical care commodities 1 ............................................ 314.888 314.113 314.881 315.804 .7 7.7 1.1 1.2 4.2 1.1 Medical care services ..................................................... 410.880 410.759 411.709 414.806 3.1 5.0 2.8 3.9 4.0 3.3
Professional services .................................................... 327.522 328.610 329.413 330.705 2.2 2.9 2.6 3.9 2.6 3.3
See footnotes at end of table.
6 CPI Detailed Report-September 2010
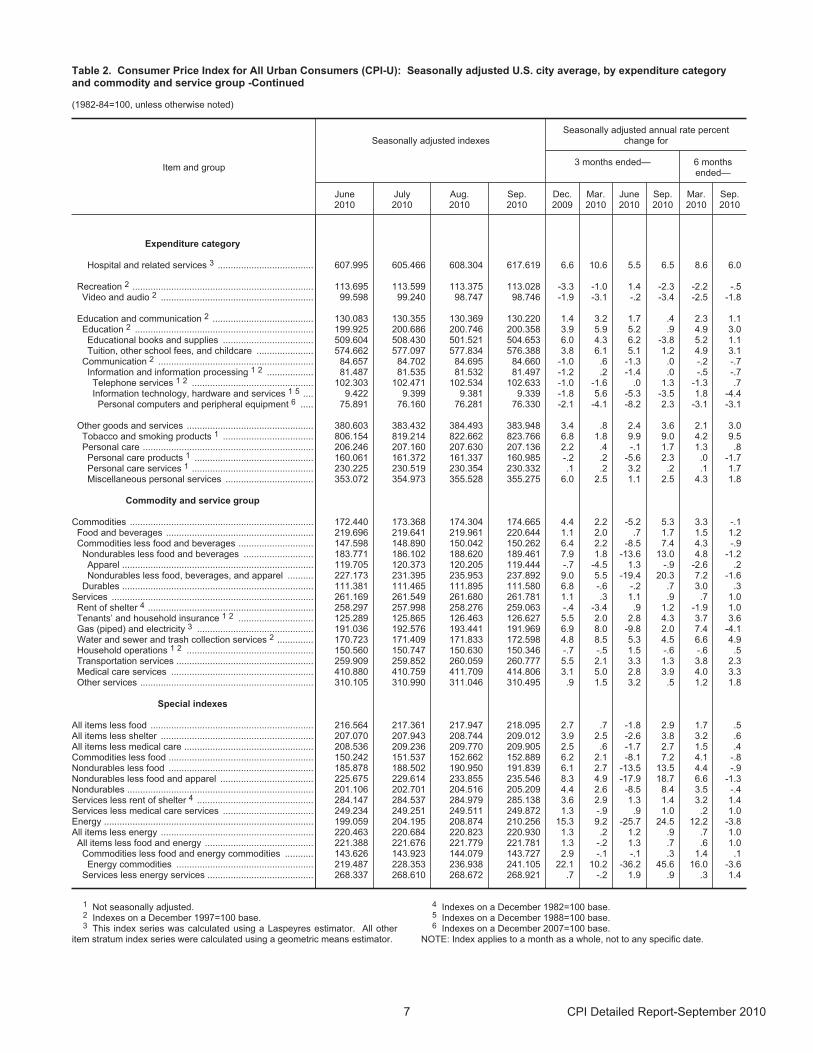
Table 2. Consumer Price Index for All Urban Consumers (CPI-U): Seasonally adjusted U.S. city average, by expenditure categoryand commodity and service group -Continued
(1982-84=100, unless otherwise noted)
Item and group
Seasonally adjusted indexesSeasonally adjusted annual rate percent
change for
3 months ended— 6 monthsended—
June2010
July2010
Aug.2010
Sep.2010
Dec.2009
Mar.2010
June2010
Sep.2010
Mar.2010
Sep.2010
Expenditure category
Hospital and related services 3 ..................................... 607.995 605.466 608.304 617.619 6.6 10.6 5.5 6.5 8.6 6.0
Recreation 2 ...................................................................... 113.695 113.599 113.375 113.028 -3.3 -1.0 1.4 -2.3 -2.2 -.5Video and audio 2 ........................................................... 99.598 99.240 98.747 98.746 -1.9 -3.1 -.2 -3.4 -2.5 -1.8
Education and communication 2 ....................................... 130.083 130.355 130.369 130.220 1.4 3.2 1.7 .4 2.3 1.1 Education 2 ..................................................................... 199.925 200.686 200.746 200.358 3.9 5.9 5.2 .9 4.9 3.0 Educational books and supplies ................................... 509.604 508.430 501.521 504.653 6.0 4.3 6.2 -3.8 5.2 1.1 Tuition, other school fees, and childcare ...................... 574.662 577.097 577.834 576.388 3.8 6.1 5.1 1.2 4.9 3.1
Communication 2 ............................................................ 84.657 84.702 84.695 84.660 -1.0 .6 -1.3 .0 -.2 -.7 Information and information processing 1 2 .................. 81.487 81.535 81.532 81.497 -1.2 .2 -1.4 .0 -.5 -.7
Telephone services 1 2 ............................................... 102.303 102.471 102.534 102.633 -1.0 -1.6 .0 1.3 -1.3 .7 Information technology, hardware and services 1 5 .... 9.422 9.399 9.381 9.339 -1.8 5.6 -5.3 -3.5 1.8 -4.4 Personal computers and peripheral equipment 6 ..... 75.891 76.160 76.281 76.330 -2.1 -4.1 -8.2 2.3 -3.1 -3.1
Other goods and services ................................................. 380.603 383.432 384.493 383.948 3.4 .8 2.4 3.6 2.1 3.0 Tobacco and smoking products 1 ................................... 806.154 819.214 822.662 823.766 6.8 1.8 9.9 9.0 4.2 9.5 Personal care .................................................................. 206.246 207.160 207.630 207.136 2.2 .4 -.1 1.7 1.3 .8
Personal care products 1 .............................................. 160.061 161.372 161.337 160.985 -.2 .2 -5.6 2.3 .0 -1.7 Personal care services 1 ............................................... 230.225 230.519 230.354 230.332 .1 .2 3.2 .2 .1 1.7 Miscellaneous personal services .................................. 353.072 354.973 355.528 355.275 6.0 2.5 1.1 2.5 4.3 1.8
Commodity and service group
Commodities ....................................................................... 172.440 173.368 174.304 174.665 4.4 2.2 -5.2 5.3 3.3 -.1 Food and beverages ......................................................... 219.696 219.641 219.961 220.644 1.1 2.0 .7 1.7 1.5 1.2 Commodities less food and beverages ............................. 147.598 148.890 150.042 150.262 6.4 2.2 -8.5 7.4 4.3 -.9
Nondurables less food and beverages ........................... 183.771 186.102 188.620 189.461 7.9 1.8 -13.6 13.0 4.8 -1.2 Apparel .......................................................................... 119.705 120.373 120.205 119.444 -.7 -4.5 1.3 -.9 -2.6 .2 Nondurables less food, beverages, and apparel .......... 227.173 231.395 235.953 237.892 9.0 5.5 -19.4 20.3 7.2 -1.6
Durables .......................................................................... 111.381 111.465 111.895 111.580 6.8 -.6 -.2 .7 3.0 .3 Services .............................................................................. 261.169 261.549 261.680 261.781 1.1 .3 1.1 .9 .7 1.0
Rent of shelter 4 ................................................................ 258.297 257.998 258.276 259.063 -.4 -3.4 .9 1.2 -1.9 1.0 Tenants’ and household insurance 1 2 ............................. 125.289 125.865 126.463 126.627 5.5 2.0 2.8 4.3 3.7 3.6 Gas (piped) and electricity 3 ............................................. 191.036 192.576 193.441 191.969 6.9 8.0 -9.8 2.0 7.4 -4.1 Water and sewer and trash collection services 2 .............. 170.723 171.409 171.833 172.598 4.8 8.5 5.3 4.5 6.6 4.9 Household operations 1 2 ................................................. 150.560 150.747 150.630 150.346 -.7 -.5 1.5 -.6 -.6 .5 Transportation services ..................................................... 259.909 259.852 260.059 260.777 5.5 2.1 3.3 1.3 3.8 2.3 Medical care services ....................................................... 410.880 410.759 411.709 414.806 3.1 5.0 2.8 3.9 4.0 3.3 Other services ................................................................... 310.105 310.990 311.046 310.495 .9 1.5 3.2 .5 1.2 1.8
Special indexes
All items less food ............................................................... 216.564 217.361 217.947 218.095 2.7 .7 -1.8 2.9 1.7 .5 All items less shelter ........................................................... 207.070 207.943 208.744 209.012 3.9 2.5 -2.6 3.8 3.2 .6 All items less medical care .................................................. 208.536 209.236 209.770 209.905 2.5 .6 -1.7 2.7 1.5 .4 Commodities less food ........................................................ 150.242 151.537 152.662 152.889 6.2 2.1 -8.1 7.2 4.1 -.8 Nondurables less food ........................................................ 185.878 188.502 190.950 191.839 6.1 2.7 -13.5 13.5 4.4 -.9 Nondurables less food and apparel .................................... 225.675 229.614 233.855 235.546 8.3 4.9 -17.9 18.7 6.6 -1.3 Nondurables ........................................................................ 201.106 202.701 204.516 205.209 4.4 2.6 -8.5 8.4 3.5 -.4 Services less rent of shelter 4 ............................................. 284.147 284.537 284.979 285.138 3.6 2.9 1.3 1.4 3.2 1.4 Services less medical care services ................................... 249.234 249.251 249.511 249.872 1.3 -.9 .9 1.0 .2 1.0 Energy ................................................................................. 199.059 204.195 208.874 210.256 15.3 9.2 -25.7 24.5 12.2 -3.8 All items less energy ........................................................... 220.463 220.684 220.823 220.930 1.3 .2 1.2 .9 .7 1.0
All items less food and energy .......................................... 221.388 221.676 221.779 221.781 1.3 -.2 1.3 .7 .6 1.0 Commodities less food and energy commodities ........... 143.626 143.923 144.079 143.727 2.9 -.1 -.1 .3 1.4 .1
Energy commodities ..................................................... 219.487 228.353 236.938 241.105 22.1 10.2 -36.2 45.6 16.0 -3.6 Services less energy services ......................................... 268.337 268.610 268.672 268.921 .7 -.2 1.9 .9 .3 1.4
1 Not seasonally adjusted.2 Indexes on a December 1997=100 base.3 This index series was calculated using a Laspeyres estimator. All other
item stratum index series were calculated using a geometric means estimator.
4 Indexes on a December 1982=100 base.5 Indexes on a December 1988=100 base.6 Indexes on a December 2007=100 base.
NOTE: Index applies to a month as a whole, not to any specific date.
7 CPI Detailed Report-September 2010
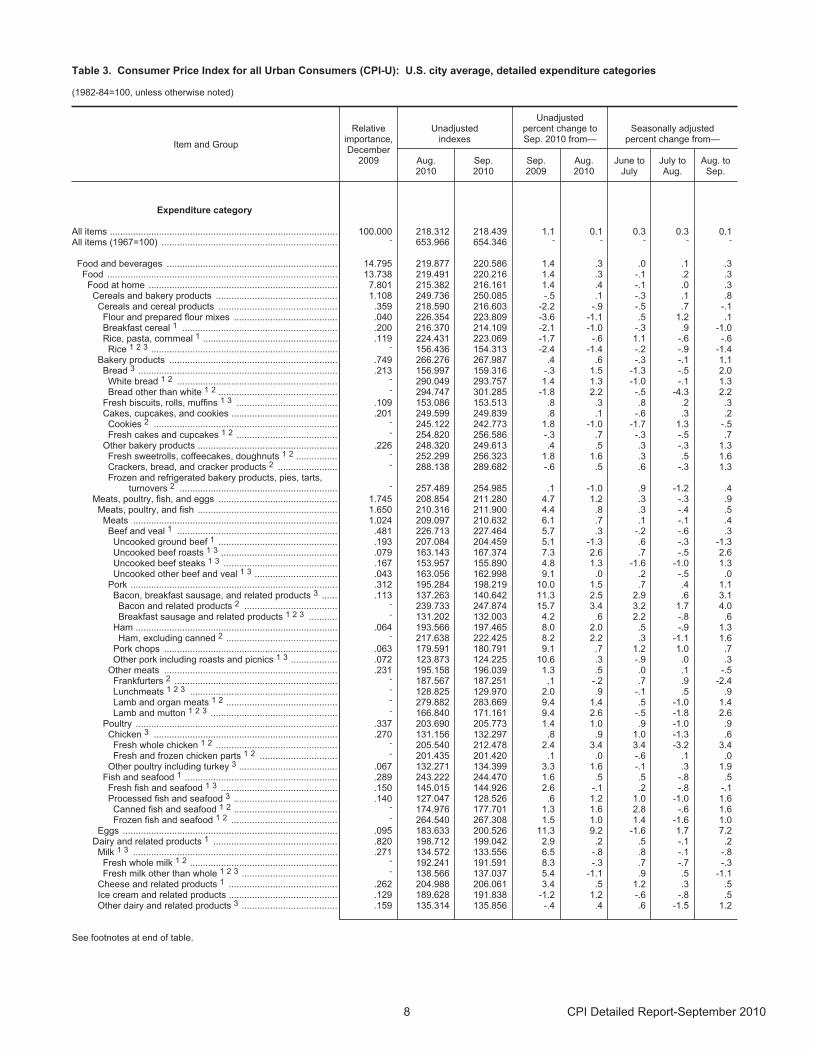
Table 3. Consumer Price Index for all Urban Consumers (CPI-U): U.S. city average, detailed expenditure categories
(1982-84=100, unless otherwise noted)
Item and Group
Relativeimportance,December
2009
Unadjustedindexes
Unadjustedpercent change toSep. 2010 from—
Seasonally adjustedpercent change from—
Aug.2010
Sep.2010
Sep.2009
Aug.2010
June toJuly
July toAug.
Aug. toSep.
Expenditure category
All items ........................................................................................ 100.000 218.312 218.439 1.1 0.1 0.3 0.3 0.1 All items (1967=100) .................................................................... - 653.966 654.346 - - - - -
Food and beverages .................................................................. 14.795 219.877 220.586 1.4 .3 .0 .1 .3 Food ......................................................................................... 13.738 219.491 220.216 1.4 .3 -.1 .2 .3
Food at home ......................................................................... 7.801 215.382 216.161 1.4 .4 -.1 .0 .3 Cereals and bakery products ............................................... 1.108 249.736 250.085 -.5 .1 -.3 .1 .8 Cereals and cereal products .............................................. .359 218.590 216.603 -2.2 -.9 -.5 .7 -.1
Flour and prepared flour mixes ........................................ .040 226.354 223.809 -3.6 -1.1 .5 1.2 .1 Breakfast cereal 1 ............................................................ .200 216.370 214.109 -2.1 -1.0 -.3 .9 -1.0 Rice, pasta, cornmeal 1 .................................................... .119 224.431 223.069 -1.7 -.6 1.1 -.6 -.6 Rice 1 2 3 ........................................................................ - 156.436 154.313 -2.4 -1.4 -.2 -.9 -1.4
Bakery products ................................................................. .749 266.276 267.987 .4 .6 -.3 -.1 1.1 Bread 3 ............................................................................. .213 156.997 159.316 -.3 1.5 -1.3 -.5 2.0 White bread 1 2 .............................................................. - 290.049 293.757 1.4 1.3 -1.0 -.1 1.3 Bread other than white 1 2 .............................................. - 294.747 301.285 -1.8 2.2 -.5 -4.3 2.2
Fresh biscuits, rolls, muffins 1 3 ....................................... .109 153.086 153.513 .8 .3 .8 .2 .3 Cakes, cupcakes, and cookies ......................................... .201 249.599 249.839 .8 .1 -.6 .3 .2
Cookies 2 ....................................................................... - 245.122 242.773 1.8 -1.0 -1.7 1.3 -.5 Fresh cakes and cupcakes 1 2 ....................................... - 254.820 256.586 -.3 .7 -.3 -.5 .7
Other bakery products ...................................................... .226 248.320 249.613 .4 .5 .3 -.3 1.3 Fresh sweetrolls, coffeecakes, doughnuts 1 2 ................ - 252.299 256.323 1.8 1.6 .3 .5 1.6 Crackers, bread, and cracker products 2 ....................... - 288.138 289.682 -.6 .5 .6 -.3 1.3 Frozen and refrigerated bakery products, pies, tarts,
turnovers 2 ............................................................. - 257.489 254.985 .1 -1.0 .9 -1.2 .4 Meats, poultry, fish, and eggs .............................................. 1.745 208.854 211.280 4.7 1.2 .3 -.3 .9 Meats, poultry, and fish ...................................................... 1.650 210.316 211.900 4.4 .8 .3 -.4 .5
Meats ............................................................................... 1.024 209.097 210.632 6.1 .7 .1 -.1 .4 Beef and veal 1 .............................................................. .481 226.713 227.464 5.7 .3 -.2 -.6 .3 Uncooked ground beef 1 .............................................. .193 207.084 204.459 5.1 -1.3 .6 -.3 -1.3 Uncooked beef roasts 1 3 ............................................. .079 163.143 167.374 7.3 2.6 .7 -.5 2.6 Uncooked beef steaks 1 3 ............................................ .167 153.957 155.890 4.8 1.3 -1.6 -1.0 1.3 Uncooked other beef and veal 1 3 ................................ .043 163.056 162.998 9.1 .0 .2 -.5 .0
Pork ................................................................................ .312 195.284 198.219 10.0 1.5 .7 .4 1.1 Bacon, breakfast sausage, and related products 3 ...... .113 137.263 140.642 11.3 2.5 2.9 .6 3.1 Bacon and related products 2 .................................... - 239.733 247.874 15.7 3.4 3.2 1.7 4.0 Breakfast sausage and related products 1 2 3 ........... - 131.202 132.003 4.2 .6 2.2 -.8 .6
Ham .............................................................................. .064 193.566 197.465 8.0 2.0 .5 -.9 1.3 Ham, excluding canned 2 ........................................... - 217.638 222.425 8.2 2.2 .3 -1.1 1.6
Pork chops ................................................................... .063 179.591 180.791 9.1 .7 1.2 1.0 .7 Other pork including roasts and picnics 1 3 .................. .072 123.873 124.225 10.6 .3 -.9 .0 .3
Other meats ................................................................... .231 195.158 196.039 1.3 .5 .0 .1 -.5 Frankfurters 2 ............................................................... - 187.567 187.251 .1 -.2 .7 .9 -2.4 Lunchmeats 1 2 3 ......................................................... - 128.825 129.970 2.0 .9 -.1 .5 .9 Lamb and organ meats 1 2 ........................................... - 279.882 283.669 9.4 1.4 .5 -1.0 1.4 Lamb and mutton 1 2 3 ................................................. - 166.840 171.161 9.4 2.6 -.5 -1.8 2.6
Poultry .............................................................................. .337 203.690 205.773 1.4 1.0 .9 -1.0 .9 Chicken 3 ....................................................................... .270 131.156 132.297 .8 .9 1.0 -1.3 .6 Fresh whole chicken 1 2 ............................................... - 205.540 212.478 2.4 3.4 3.4 -3.2 3.4 Fresh and frozen chicken parts 1 2 .............................. - 201.435 201.420 .1 .0 -.6 .1 .0
Other poultry including turkey 3 ...................................... .067 132.271 134.399 3.3 1.6 -.1 .3 1.9 Fish and seafood 1 ........................................................... .289 243.222 244.470 1.6 .5 .5 -.8 .5 Fresh fish and seafood 1 3 ............................................. .150 145.015 144.926 2.6 -.1 .2 -.8 -.1 Processed fish and seafood 3 ........................................ .140 127.047 128.526 .6 1.2 1.0 -1.0 1.6 Canned fish and seafood 1 2 ........................................ - 174.976 177.701 1.3 1.6 2.8 -.6 1.6 Frozen fish and seafood 1 2 ......................................... - 264.540 267.308 1.5 1.0 1.4 -1.6 1.0
Eggs ................................................................................... .095 183.633 200.526 11.3 9.2 -1.6 1.7 7.2Dairy and related products 1 ................................................ .820 198.712 199.042 2.9 .2 .5 -.1 .2 Milk 1 3 ............................................................................... .271 134.572 133.556 6.5 -.8 .8 -.1 -.8 Fresh whole milk 1 2 ......................................................... - 192.241 191.591 8.3 -.3 .7 -.7 -.3 Fresh milk other than whole 1 2 3 ..................................... - 138.566 137.037 5.4 -1.1 .9 .5 -1.1
Cheese and related products 1 .......................................... .262 204.988 206.061 3.4 .5 1.2 .3 .5 Ice cream and related products .......................................... .129 189.628 191.838 -1.2 1.2 -.6 -.8 .5 Other dairy and related products 3 ..................................... .159 135.314 135.856 -.4 .4 .6 -1.5 1.2
See footnotes at end of table.
8 CPI Detailed Report-September 2010
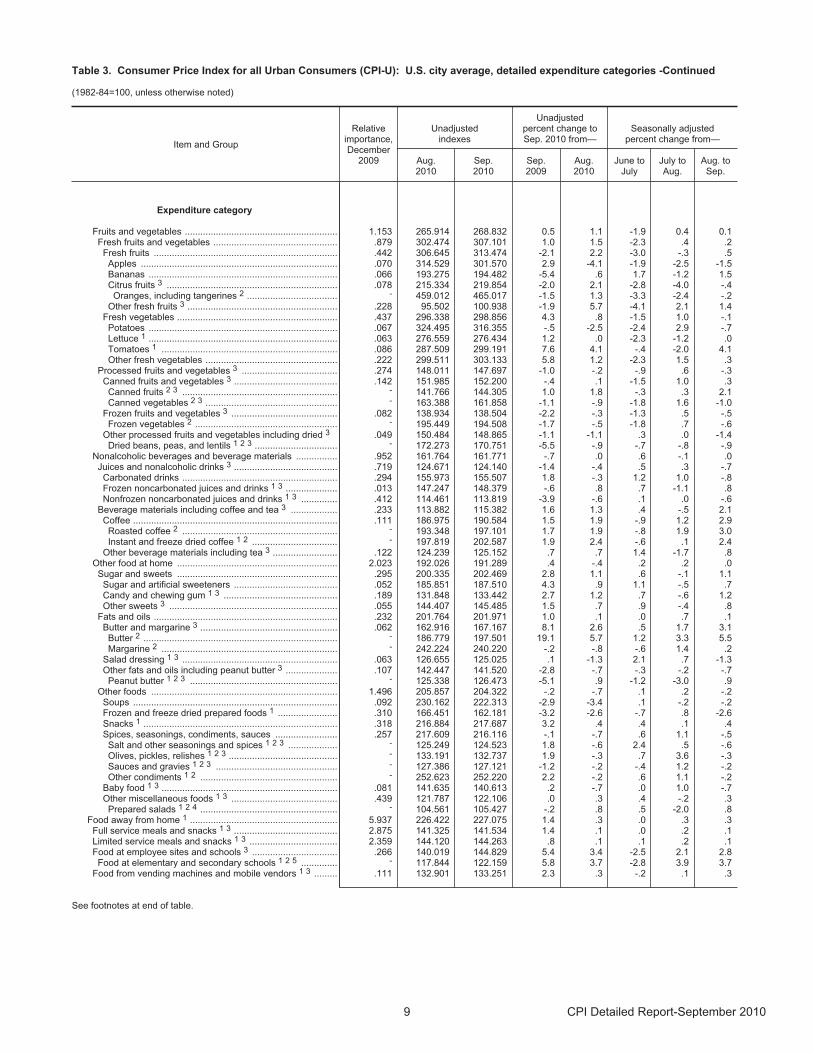
Table 3. Consumer Price Index for all Urban Consumers (CPI-U): U.S. city average, detailed expenditure categories -Continued
(1982-84=100, unless otherwise noted)
Item and Group
Relativeimportance,December
2009
Unadjustedindexes
Unadjustedpercent change toSep. 2010 from—
Seasonally adjustedpercent change from—
Aug.2010
Sep.2010
Sep.2009
Aug.2010
June toJuly
July toAug.
Aug. toSep.
Expenditure category
Fruits and vegetables ........................................................... 1.153 265.914 268.832 0.5 1.1 -1.9 0.4 0.1 Fresh fruits and vegetables ................................................ .879 302.474 307.101 1.0 1.5 -2.3 .4 .2
Fresh fruits ....................................................................... .442 306.645 313.474 -2.1 2.2 -3.0 -.3 .5 Apples ............................................................................ .070 314.529 301.570 2.9 -4.1 -1.9 -2.5 -1.5 Bananas ......................................................................... .066 193.275 194.482 -5.4 .6 1.7 -1.2 1.5 Citrus fruits 3 .................................................................. .078 215.334 219.854 -2.0 2.1 -2.8 -4.0 -.4 Oranges, including tangerines 2 ................................... - 459.012 465.017 -1.5 1.3 -3.3 -2.4 -.2
Other fresh fruits 3 .......................................................... .228 95.502 100.938 -1.9 5.7 -4.1 2.1 1.4 Fresh vegetables .............................................................. .437 296.338 298.856 4.3 .8 -1.5 1.0 -.1
Potatoes ......................................................................... .067 324.495 316.355 -.5 -2.5 -2.4 2.9 -.7 Lettuce 1 ......................................................................... .063 276.559 276.434 1.2 .0 -2.3 -1.2 .0 Tomatoes 1 .................................................................... .086 287.509 299.191 7.6 4.1 -.4 -2.0 4.1 Other fresh vegetables ................................................... .222 299.511 303.133 5.8 1.2 -2.3 1.5 .3
Processed fruits and vegetables 3 ..................................... .274 148.011 147.697 -1.0 -.2 -.9 .6 -.3 Canned fruits and vegetables 3 ........................................ .142 151.985 152.200 -.4 .1 -1.5 1.0 .3 Canned fruits 2 3 ............................................................ - 141.766 144.305 1.0 1.8 -.3 .3 2.1 Canned vegetables 2 3 ................................................... - 163.388 161.858 -1.1 -.9 -1.8 1.6 -1.0
Frozen fruits and vegetables 3 ......................................... .082 138.934 138.504 -2.2 -.3 -1.3 .5 -.5 Frozen vegetables 2 ....................................................... - 195.449 194.508 -1.7 -.5 -1.8 .7 -.6
Other processed fruits and vegetables including dried 3 .049 150.484 148.865 -1.1 -1.1 .3 .0 -1.4 Dried beans, peas, and lentils 1 2 3 ................................ - 172.273 170.751 -5.5 -.9 -.7 -.8 -.9
Nonalcoholic beverages and beverage materials ................ .952 161.764 161.771 -.7 .0 .6 -.1 .0 Juices and nonalcoholic drinks 3 ........................................ .719 124.671 124.140 -1.4 -.4 .5 .3 -.7
Carbonated drinks ............................................................ .294 155.973 155.507 1.8 -.3 1.2 1.0 -.8 Frozen noncarbonated juices and drinks 1 3 .................... .013 147.247 148.379 -.6 .8 .7 -1.1 .8 Nonfrozen noncarbonated juices and drinks 1 3 .............. .412 114.461 113.819 -3.9 -.6 .1 .0 -.6
Beverage materials including coffee and tea 3 .................. .233 113.882 115.382 1.6 1.3 .4 -.5 2.1 Coffee ............................................................................... .111 186.975 190.584 1.5 1.9 -.9 1.2 2.9
Roasted coffee 2 ............................................................ - 193.348 197.101 1.7 1.9 -.8 1.9 3.0 Instant and freeze dried coffee 1 2 ................................. - 197.819 202.587 1.9 2.4 -.6 .1 2.4
Other beverage materials including tea 3 ......................... .122 124.239 125.152 .7 .7 1.4 -1.7 .8 Other food at home .............................................................. 2.023 192.026 191.289 .4 -.4 .2 .2 .0 Sugar and sweets .............................................................. .295 200.335 202.469 2.8 1.1 .6 -.1 1.1
Sugar and artificial sweeteners ........................................ .052 185.851 187.510 4.3 .9 1.1 -.5 .7 Candy and chewing gum 1 3 ............................................ .189 131.848 133.442 2.7 1.2 .7 -.6 1.2 Other sweets 3 ................................................................. .055 144.407 145.485 1.5 .7 .9 -.4 .8
Fats and oils ....................................................................... .232 201.764 201.971 1.0 .1 .0 .7 .1 Butter and margarine 3 ..................................................... .062 162.916 167.167 8.1 2.6 .5 1.7 3.1 Butter 2 ........................................................................... - 186.779 197.501 19.1 5.7 1.2 3.3 5.5 Margarine 2 .................................................................... - 242.224 240.220 -.2 -.8 -.6 1.4 .2
Salad dressing 1 3 ............................................................ .063 126.655 125.025 .1 -1.3 2.1 .7 -1.3 Other fats and oils including peanut butter 3 .................... .107 142.447 141.520 -2.8 -.7 -.3 -.2 -.7
Peanut butter 1 2 3 ......................................................... - 125.338 126.473 -5.1 .9 -1.2 -3.0 .9 Other foods ........................................................................ 1.496 205.857 204.322 -.2 -.7 .1 .2 -.2
Soups ............................................................................... .092 230.162 222.313 -2.9 -3.4 .1 -.2 -.2 Frozen and freeze dried prepared foods 1 ....................... .310 166.451 162.181 -3.2 -2.6 -.7 .8 -2.6 Snacks 1 ........................................................................... .318 216.884 217.687 3.2 .4 .4 .1 .4 Spices, seasonings, condiments, sauces ........................ .257 217.609 216.116 -.1 -.7 .6 1.1 -.5
Salt and other seasonings and spices 1 2 3 ................... - 125.249 124.523 1.8 -.6 2.4 .5 -.6 Olives, pickles, relishes 1 2 3 .......................................... - 133.191 132.737 1.9 -.3 .7 3.6 -.3 Sauces and gravies 1 2 3 ............................................... - 127.386 127.121 -1.2 -.2 -.4 1.2 -.2 Other condiments 1 2 ..................................................... - 252.623 252.220 2.2 -.2 .6 1.1 -.2
Baby food 1 3 .................................................................... .081 141.635 140.613 .2 -.7 .0 1.0 -.7 Other miscellaneous foods 1 3 ......................................... .439 121.787 122.106 .0 .3 .4 -.2 .3 Prepared salads 1 2 4 ..................................................... - 104.561 105.427 -.2 .8 .5 -2.0 .8
Food away from home 1 ......................................................... 5.937 226.422 227.075 1.4 .3 .0 .3 .3 Full service meals and snacks 1 3 ........................................ 2.875 141.325 141.534 1.4 .1 .0 .2 .1 Limited service meals and snacks 1 3 .................................. 2.359 144.120 144.263 .8 .1 .1 .2 .1 Food at employee sites and schools 3 ................................. .266 140.019 144.829 5.4 3.4 -2.5 2.1 2.8 Food at elementary and secondary schools 1 2 5 .............. - 117.844 122.159 5.8 3.7 -2.8 3.9 3.7
Food from vending machines and mobile vendors 1 3 ......... .111 132.901 133.251 2.3 .3 -.2 .1 .3
See footnotes at end of table.
9 CPI Detailed Report-September 2010
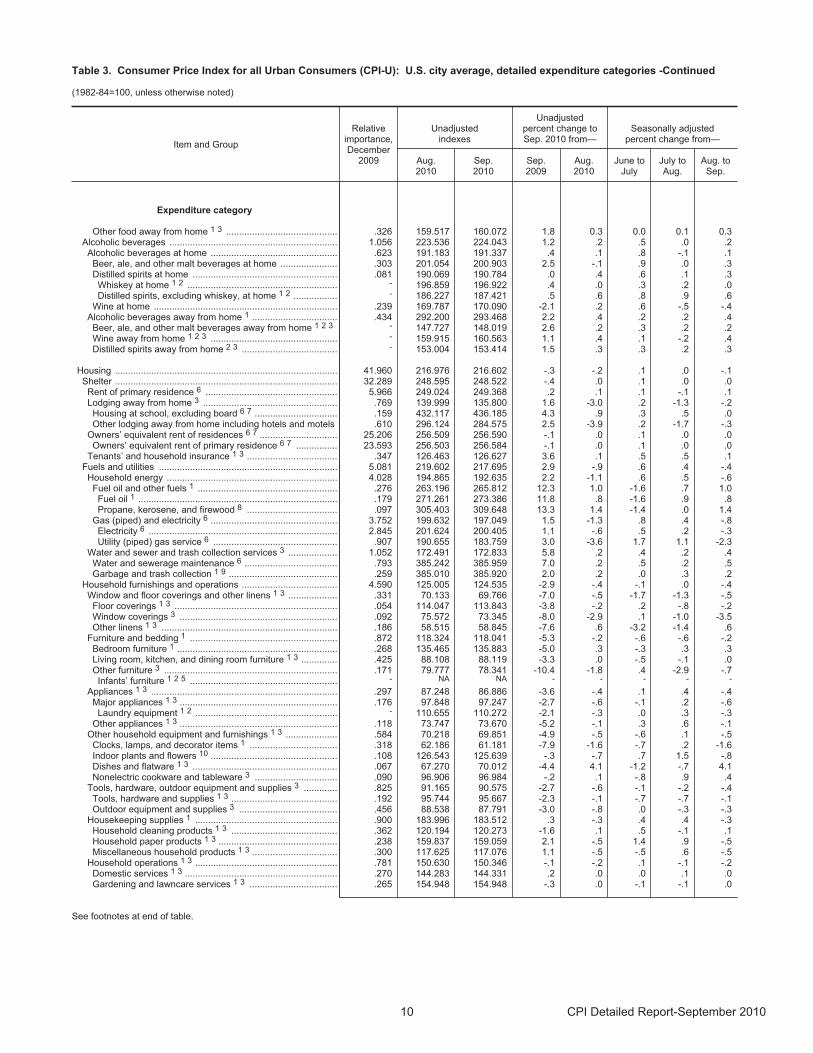
Table 3. Consumer Price Index for all Urban Consumers (CPI-U): U.S. city average, detailed expenditure categories -Continued
(1982-84=100, unless otherwise noted)
Item and Group
Relativeimportance,December
2009
Unadjustedindexes
Unadjustedpercent change toSep. 2010 from—
Seasonally adjustedpercent change from—
Aug.2010
Sep.2010
Sep.2009
Aug.2010
June toJuly
July toAug.
Aug. toSep.
Expenditure category
Other food away from home 1 3 ........................................... .326 159.517 160.072 1.8 0.3 0.0 0.1 0.3 Alcoholic beverages ................................................................. 1.056 223.536 224.043 1.2 .2 .5 .0 .2
Alcoholic beverages at home ................................................. .623 191.183 191.337 .4 .1 .8 -.1 .1 Beer, ale, and other malt beverages at home ...................... .303 201.054 200.903 2.5 -.1 .9 .0 .3 Distilled spirits at home ........................................................ .081 190.069 190.784 .0 .4 .6 .1 .3 Whiskey at home 1 2 .......................................................... - 196.859 196.922 .4 .0 .3 .2 .0 Distilled spirits, excluding whiskey, at home 1 2 ................. - 186.227 187.421 .5 .6 .8 .9 .6
Wine at home ....................................................................... .239 169.787 170.090 -2.1 .2 .6 -.5 -.4 Alcoholic beverages away from home 1 ................................. .434 292.200 293.468 2.2 .4 .2 .2 .4 Beer, ale, and other malt beverages away from home 1 2 3 - 147.727 148.019 2.6 .2 .3 .2 .2 Wine away from home 1 2 3 ................................................. - 159.915 160.563 1.1 .4 .1 -.2 .4 Distilled spirits away from home 2 3 ..................................... - 153.004 153.414 1.5 .3 .3 .2 .3
Housing ...................................................................................... 41.960 216.976 216.602 -.3 -.2 .1 .0 -.1 Shelter ...................................................................................... 32.289 248.595 248.522 -.4 .0 .1 .0 .0
Rent of primary residence 6 ................................................... 5.966 249.024 249.368 .2 .1 .1 -.1 .1 Lodging away from home 3 .................................................... .769 139.999 135.800 1.6 -3.0 .2 -1.3 -.2 Housing at school, excluding board 6 7 ................................ .159 432.117 436.185 4.3 .9 .3 .5 .0 Other lodging away from home including hotels and motels .610 296.124 284.575 2.5 -3.9 .2 -1.7 -.3
Owners’ equivalent rent of residences 6 7 .............................. 25.206 256.509 256.590 -.1 .0 .1 .0 .0 Owners’ equivalent rent of primary residence 6 7 ................ 23.593 256.503 256.584 -.1 .0 .1 .0 .0
Tenants’ and household insurance 1 3 ................................... .347 126.463 126.627 3.6 .1 .5 .5 .1 Fuels and utilities ..................................................................... 5.081 219.602 217.695 2.9 -.9 .6 .4 -.4
Household energy .................................................................. 4.028 194.865 192.635 2.2 -1.1 .6 .5 -.6 Fuel oil and other fuels 1 ...................................................... .276 263.196 265.812 12.3 1.0 -1.6 .7 1.0 Fuel oil 1 ............................................................................. .179 271.261 273.386 11.8 .8 -1.6 .9 .8 Propane, kerosene, and firewood 8 ................................... .097 305.403 309.648 13.3 1.4 -1.4 .0 1.4
Gas (piped) and electricity 6 ................................................. 3.752 199.632 197.049 1.5 -1.3 .8 .4 -.8 Electricity 6 ......................................................................... 2.845 201.624 200.405 1.1 -.6 .5 .2 -.3 Utility (piped) gas service 6 ................................................ .907 190.655 183.759 3.0 -3.6 1.7 1.1 -2.3
Water and sewer and trash collection services 3 ................... 1.052 172.491 172.833 5.8 .2 .4 .2 .4 Water and sewerage maintenance 6 .................................... .793 385.242 385.959 7.0 .2 .5 .2 .5 Garbage and trash collection 1 9 .......................................... .259 385.010 385.920 2.0 .2 .0 .3 .2
Household furnishings and operations ..................................... 4.590 125.005 124.535 -2.9 -.4 -.1 .0 -.4 Window and floor coverings and other linens 1 3 ................... .331 70.133 69.766 -7.0 -.5 -1.7 -1.3 -.5 Floor coverings 1 3 ............................................................... .054 114.047 113.843 -3.8 -.2 .2 -.8 -.2 Window coverings 3 ............................................................. .092 75.572 73.345 -8.0 -2.9 .1 -1.0 -3.5 Other linens 1 3 .................................................................... .186 58.515 58.845 -7.6 .6 -3.2 -1.4 .6
Furniture and bedding 1 ......................................................... .872 118.324 118.041 -5.3 -.2 -.6 -.6 -.2 Bedroom furniture 1 .............................................................. .268 135.465 135.883 -5.0 .3 -.3 .3 .3 Living room, kitchen, and dining room furniture 1 3 .............. .425 88.108 88.119 -3.3 .0 -.5 -.1 .0 Other furniture 3 ................................................................... .171 79.777 78.341 -10.4 -1.8 .4 -2.9 -.7 Infants’ furniture 1 2 5 ......................................................... - NA NA - - - - -
Appliances 1 3 ........................................................................ .297 87.248 86.886 -3.6 -.4 .1 .4 -.4 Major appliances 1 3 ............................................................. .176 97.848 97.247 -2.7 -.6 -.1 .2 -.6 Laundry equipment 1 2 ....................................................... - 110.655 110.272 -2.1 -.3 .0 .3 -.3
Other appliances 1 3 ............................................................. .118 73.747 73.670 -5.2 -.1 .3 .6 -.1 Other household equipment and furnishings 1 3 .................... .584 70.218 69.851 -4.9 -.5 -.6 .1 -.5 Clocks, lamps, and decorator items 1 .................................. .318 62.186 61.181 -7.9 -1.6 -.7 .2 -1.6 Indoor plants and flowers 10 ................................................. .108 126.543 125.639 -.3 -.7 .7 1.5 -.8 Dishes and flatware 1 3 ........................................................ .067 67.270 70.012 -4.4 4.1 -1.2 -.7 4.1 Nonelectric cookware and tableware 3 ................................ .090 96.906 96.984 -.2 .1 -.8 .9 .4
Tools, hardware, outdoor equipment and supplies 3 ............. .825 91.165 90.575 -2.7 -.6 -.1 -.2 -.4 Tools, hardware and supplies 1 3 ......................................... .192 95.744 95.667 -2.3 -.1 -.7 -.7 -.1 Outdoor equipment and supplies 3 ...................................... .456 88.538 87.791 -3.0 -.8 .0 -.3 -.3
Housekeeping supplies 1 ....................................................... .900 183.996 183.512 .3 -.3 .4 .4 -.3 Household cleaning products 1 3 ......................................... .362 120.194 120.273 -1.6 .1 .5 -.1 .1 Household paper products 1 3 .............................................. .238 159.837 159.059 2.1 -.5 1.4 .9 -.5 Miscellaneous household products 1 3 ................................. .300 117.625 117.076 1.1 -.5 -.5 .6 -.5
Household operations 1 3 ....................................................... .781 150.630 150.346 -.1 -.2 .1 -.1 -.2 Domestic services 1 3 ........................................................... .270 144.283 144.331 .2 .0 .0 .1 .0 Gardening and lawncare services 1 3 .................................. .265 154.948 154.948 -.3 .0 -.1 -.1 .0
See footnotes at end of table.
10 CPI Detailed Report-September 2010
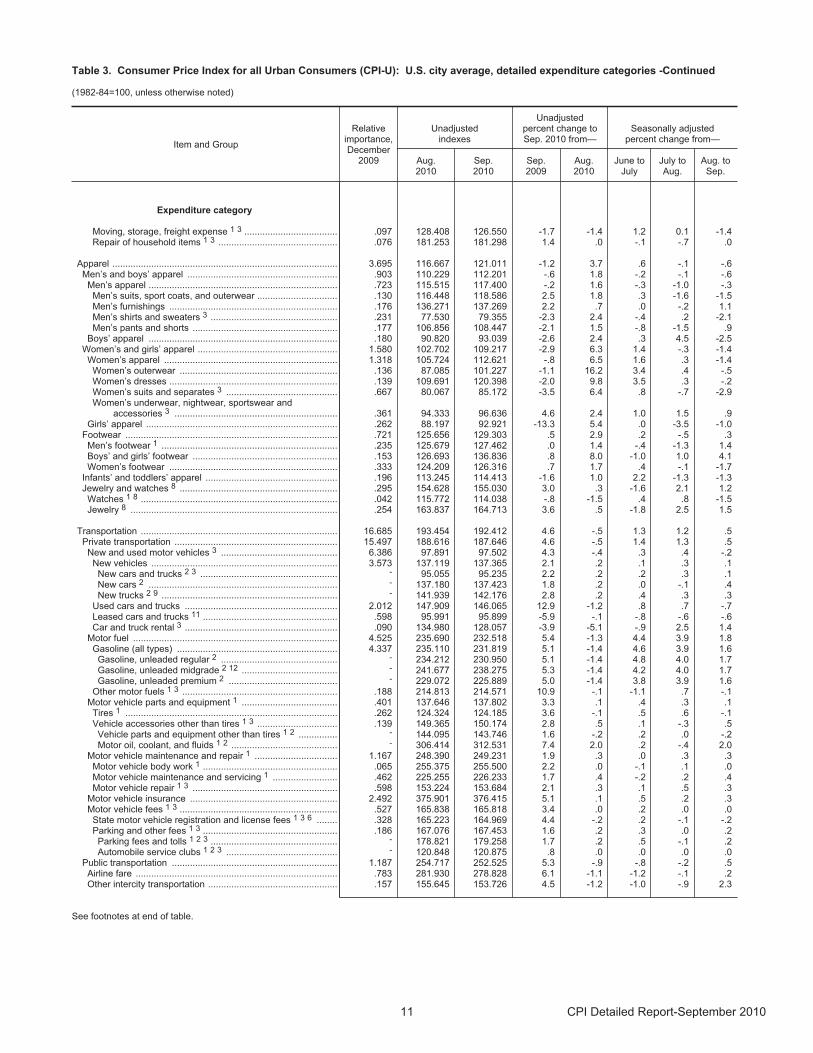
Table 3. Consumer Price Index for all Urban Consumers (CPI-U): U.S. city average, detailed expenditure categories -Continued
(1982-84=100, unless otherwise noted)
Item and Group
Relativeimportance,December
2009
Unadjustedindexes
Unadjustedpercent change toSep. 2010 from—
Seasonally adjustedpercent change from—
Aug.2010
Sep.2010
Sep.2009
Aug.2010
June toJuly
July toAug.
Aug. toSep.
Expenditure category
Moving, storage, freight expense 1 3 .................................... .097 128.408 126.550 -1.7 -1.4 1.2 0.1 -1.4 Repair of household items 1 3 .............................................. .076 181.253 181.298 1.4 .0 -.1 -.7 .0
Apparel ....................................................................................... 3.695 116.667 121.011 -1.2 3.7 .6 -.1 -.6 Men’s and boys’ apparel .......................................................... .903 110.229 112.201 -.6 1.8 -.2 -.1 -.6
Men’s apparel ......................................................................... .723 115.515 117.400 -.2 1.6 -.3 -1.0 -.3 Men’s suits, sport coats, and outerwear ............................... .130 116.448 118.586 2.5 1.8 .3 -1.6 -1.5 Men’s furnishings ................................................................. .176 136.271 137.269 2.2 .7 .0 -.2 1.1 Men’s shirts and sweaters 3 ................................................. .231 77.530 79.355 -2.3 2.4 -.4 .2 -2.1 Men’s pants and shorts ........................................................ .177 106.856 108.447 -2.1 1.5 -.8 -1.5 .9
Boys’ apparel ......................................................................... .180 90.820 93.039 -2.6 2.4 .3 4.5 -2.5 Women’s and girls’ apparel ...................................................... 1.580 102.702 109.217 -2.9 6.3 1.4 -.3 -1.4
Women’s apparel ................................................................... 1.318 105.724 112.621 -.8 6.5 1.6 .3 -1.4 Women’s outerwear ............................................................. .136 87.085 101.227 -1.1 16.2 3.4 .4 -.5 Women’s dresses ................................................................. .139 109.691 120.398 -2.0 9.8 3.5 .3 -.2 Women’s suits and separates 3 ........................................... .667 80.067 85.172 -3.5 6.4 .8 -.7 -2.9 Women’s underwear, nightwear, sportswear and
accessories 3 ............................................................... .361 94.333 96.636 4.6 2.4 1.0 1.5 .9 Girls’ apparel .......................................................................... .262 88.197 92.921 -13.3 5.4 .0 -3.5 -1.0
Footwear .................................................................................. .721 125.656 129.303 .5 2.9 .2 -.5 .3Men’s footwear 1 .................................................................... .235 125.679 127.462 .0 1.4 -.4 -1.3 1.4 Boys’ and girls’ footwear ........................................................ .153 126.693 136.836 .8 8.0 -1.0 1.0 4.1 Women’s footwear ................................................................. .333 124.209 126.316 .7 1.7 .4 -.1 -1.7
Infants’ and toddlers’ apparel ................................................... .196 113.245 114.413 -1.6 1.0 2.2 -1.3 -1.3 Jewelry and watches 8 ............................................................. .295 154.628 155.030 3.0 .3 -1.6 2.1 1.2
Watches 1 8 ............................................................................ .042 115.772 114.038 -.8 -1.5 .4 .8 -1.5 Jewelry 8 ................................................................................ .254 163.837 164.713 3.6 .5 -1.8 2.5 1.5
Transportation ............................................................................ 16.685 193.454 192.412 4.6 -.5 1.3 1.2 .5 Private transportation ............................................................... 15.497 188.616 187.646 4.6 -.5 1.4 1.3 .5
New and used motor vehicles 3 ............................................. 6.386 97.891 97.502 4.3 -.4 .3 .4 -.2 New vehicles ........................................................................ 3.573 137.119 137.365 2.1 .2 .1 .3 .1 New cars and trucks 2 3 ..................................................... - 95.055 95.235 2.2 .2 .2 .3 .1 New cars 2 ......................................................................... - 137.180 137.423 1.8 .2 .0 -.1 .4 New trucks 2 9 .................................................................... - 141.939 142.176 2.8 .2 .4 .3 .3
Used cars and trucks ........................................................... 2.012 147.909 146.065 12.9 -1.2 .8 .7 -.7 Leased cars and trucks 11 .................................................... .598 95.991 95.899 -5.9 -.1 -.8 -.6 -.6 Car and truck rental 3 ........................................................... .090 134.980 128.057 -3.9 -5.1 -.9 2.5 1.4
Motor fuel ............................................................................... 4.525 235.690 232.518 5.4 -1.3 4.4 3.9 1.8 Gasoline (all types) .............................................................. 4.337 235.110 231.819 5.1 -1.4 4.6 3.9 1.6 Gasoline, unleaded regular 2 ............................................. - 234.212 230.950 5.1 -1.4 4.8 4.0 1.7 Gasoline, unleaded midgrade 2 12 ..................................... - 241.677 238.275 5.3 -1.4 4.2 4.0 1.7 Gasoline, unleaded premium 2 .......................................... - 229.072 225.889 5.0 -1.4 3.8 3.9 1.6
Other motor fuels 1 3 ............................................................ .188 214.813 214.571 10.9 -.1 -1.1 .7 -.1 Motor vehicle parts and equipment 1 ..................................... .401 137.646 137.802 3.3 .1 .4 .3 .1 Tires 1 .................................................................................. .262 124.324 124.185 3.6 -.1 .5 .6 -.1 Vehicle accessories other than tires 1 3 ............................... .139 149.365 150.174 2.8 .5 .1 -.3 .5 Vehicle parts and equipment other than tires 1 2 ............... - 144.095 143.746 1.6 -.2 .2 .0 -.2 Motor oil, coolant, and fluids 1 2 ......................................... - 306.414 312.531 7.4 2.0 .2 -.4 2.0
Motor vehicle maintenance and repair 1 ................................ 1.167 248.390 249.231 1.9 .3 .0 .3 .3 Motor vehicle body work 1 .................................................... .065 255.375 255.500 2.2 .0 -.1 .1 .0 Motor vehicle maintenance and servicing 1 ......................... .462 225.255 226.233 1.7 .4 -.2 .2 .4 Motor vehicle repair 1 3 ........................................................ .598 153.224 153.684 2.1 .3 .1 .5 .3
Motor vehicle insurance ......................................................... 2.492 375.901 376.415 5.1 .1 .5 .2 .3 Motor vehicle fees 1 3 ............................................................. .527 165.838 165.818 3.4 .0 .2 .0 .0 State motor vehicle registration and license fees 1 3 6 ........ .328 165.223 164.969 4.4 -.2 .2 -.1 -.2 Parking and other fees 1 3 .................................................... .186 167.076 167.453 1.6 .2 .3 .0 .2 Parking fees and tolls 1 2 3 ................................................. - 178.821 179.258 1.7 .2 .5 -.1 .2 Automobile service clubs 1 2 3 ........................................... - 120.848 120.875 .8 .0 .0 .0 .0
Public transportation ................................................................ 1.187 254.717 252.525 5.3 -.9 -.8 -.2 .5 Airline fare .............................................................................. .783 281.930 278.828 6.1 -1.1 -1.2 -.1 .2 Other intercity transportation .................................................. .157 155.645 153.726 4.5 -1.2 -1.0 -.9 2.3
See footnotes at end of table.
11 CPI Detailed Report-September 2010
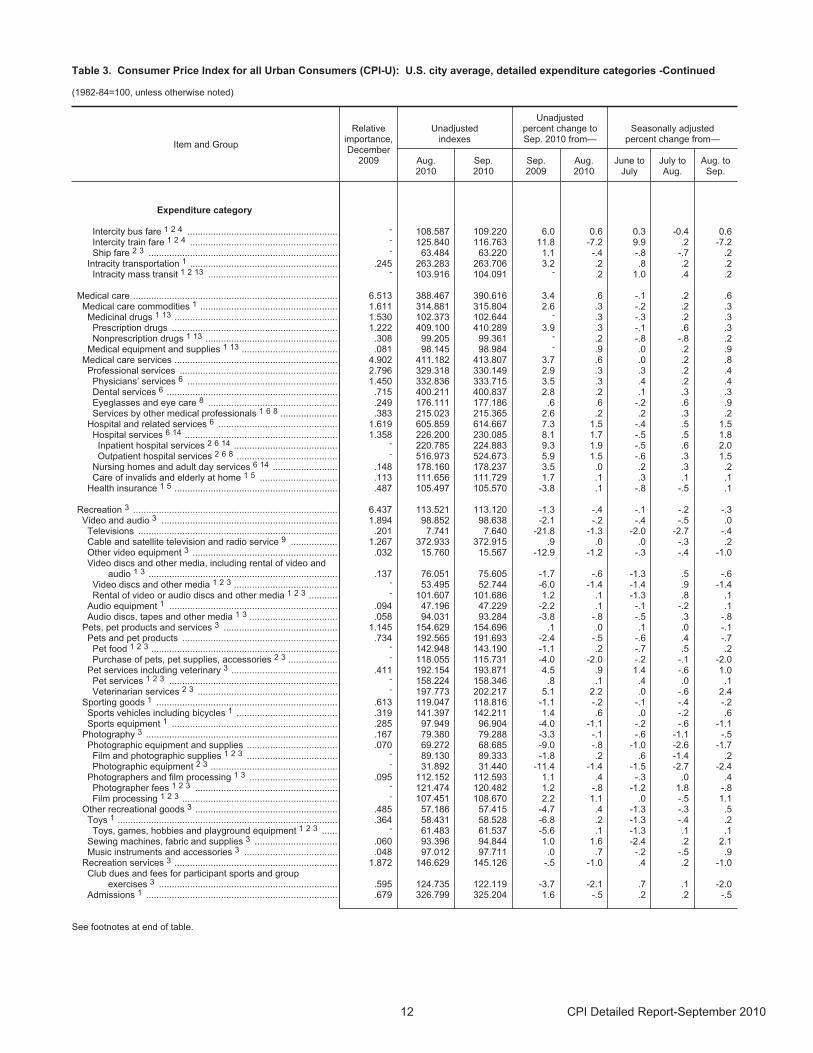
Table 3. Consumer Price Index for all Urban Consumers (CPI-U): U.S. city average, detailed expenditure categories -Continued
(1982-84=100, unless otherwise noted)
Item and Group
Relativeimportance,December
2009
Unadjustedindexes
Unadjustedpercent change toSep. 2010 from—
Seasonally adjustedpercent change from—
Aug.2010
Sep.2010
Sep.2009
Aug.2010
June toJuly
July toAug.
Aug. toSep.
Expenditure category
Intercity bus fare 1 2 4 .......................................................... - 108.587 109.220 6.0 0.6 0.3 -0.4 0.6 Intercity train fare 1 2 4 ......................................................... - 125.840 116.763 11.8 -7.2 9.9 .2 -7.2 Ship fare 2 3 ......................................................................... - 63.484 63.220 1.1 -.4 -.8 -.7 .2
Intracity transportation 1 ......................................................... .245 263.283 263.706 3.2 .2 .8 .2 .2 Intracity mass transit 1 2 13 .................................................. - 103.916 104.091 - .2 1.0 .4 .2
Medical care ............................................................................... 6.513 388.467 390.616 3.4 .6 -.1 .2 .6 Medical care commodities 1 ..................................................... 1.611 314.881 315.804 2.6 .3 -.2 .2 .3 Medicinal drugs 1 13 ............................................................... 1.530 102.373 102.644 - .3 -.3 .2 .3 Prescription drugs ................................................................ 1.222 409.100 410.289 3.9 .3 -.1 .6 .3 Nonprescription drugs 1 13 ................................................... .308 99.205 99.361 - .2 -.8 -.8 .2
Medical equipment and supplies 1 13 ..................................... .081 98.145 98.984 - .9 .0 .2 .9 Medical care services ............................................................... 4.902 411.182 413.807 3.7 .6 .0 .2 .8
Professional services ............................................................. 2.796 329.318 330.149 2.9 .3 .3 .2 .4 Physicians’ services 6 .......................................................... 1.450 332.836 333.715 3.5 .3 .4 .2 .4 Dental services 6 .................................................................. .715 400.211 400.837 2.8 .2 .1 .3 .3 Eyeglasses and eye care 8 .................................................. .249 176.111 177.186 .6 .6 -.2 .6 .9 Services by other medical professionals 1 6 8 ...................... .383 215.023 215.365 2.6 .2 .2 .3 .2
Hospital and related services 6 .............................................. 1.619 605.859 614.667 7.3 1.5 -.4 .5 1.5 Hospital services 6 14 ........................................................... 1.358 226.200 230.085 8.1 1.7 -.5 .5 1.8 Inpatient hospital services 2 6 14 ........................................ - 220.785 224.883 9.3 1.9 -.5 .6 2.0 Outpatient hospital services 2 6 8 ....................................... - 516.973 524.673 5.9 1.5 -.6 .3 1.5
Nursing homes and adult day services 6 14 ......................... .148 178.160 178.237 3.5 .0 .2 .3 .2 Care of invalids and elderly at home 1 5 .............................. .113 111.656 111.729 1.7 .1 .3 .1 .1
Health insurance 1 5 ............................................................... .487 105.497 105.570 -3.8 .1 -.8 -.5 .1
Recreation 3 ............................................................................... 6.437 113.521 113.120 -1.3 -.4 -.1 -.2 -.3 Video and audio 3 .................................................................... 1.894 98.852 98.638 -2.1 -.2 -.4 -.5 .0 Televisions ............................................................................. .201 7.741 7.640 -21.8 -1.3 -2.0 -2.7 -.4Cable and satellite television and radio service 9 .................. 1.267 372.933 372.915 .9 .0 .0 -.3 .2 Other video equipment 3 ........................................................ .032 15.760 15.567 -12.9 -1.2 -.3 -.4 -1.0 Video discs and other media, including rental of video and
audio 1 3 ......................................................................... .137 76.051 75.605 -1.7 -.6 -1.3 .5 -.6 Video discs and other media 1 2 3 ........................................ - 53.495 52.744 -6.0 -1.4 -1.4 .9 -1.4 Rental of video or audio discs and other media 1 2 3 ........... - 101.607 101.686 1.2 .1 -1.3 .8 .1
Audio equipment 1 ................................................................. .094 47.196 47.229 -2.2 .1 -.1 -.2 .1 Audio discs, tapes and other media 1 3 .................................. .058 94.031 93.284 -3.8 -.8 -.5 .3 -.8
Pets, pet products and services 3 ............................................ 1.145 154.629 154.696 .1 .0 .1 .0 -.1 Pets and pet products ............................................................ .734 192.565 191.693 -2.4 -.5 -.6 .4 -.7
Pet food 1 2 3 ........................................................................ - 142.948 143.190 -1.1 .2 -.7 .5 .2 Purchase of pets, pet supplies, accessories 2 3 ................... - 118.055 115.731 -4.0 -2.0 -.2 -.1 -2.0
Pet services including veterinary 3 ......................................... .411 192.154 193.871 4.5 .9 1.4 -.6 1.0 Pet services 1 2 3 ................................................................. - 158.224 158.346 .8 .1 .4 .0 .1 Veterinarian services 2 3 ...................................................... - 197.773 202.217 5.1 2.2 .0 -.6 2.4
Sporting goods 1 ...................................................................... .613 119.047 118.816 -1.1 -.2 -.1 -.4 -.2 Sports vehicles including bicycles 1 ....................................... .319 141.397 142.211 1.4 .6 .0 -.2 .6 Sports equipment 1 ................................................................ .285 97.949 96.904 -4.0 -1.1 -.2 -.6 -1.1
Photography 3 .......................................................................... .167 79.380 79.288 -3.3 -.1 -.6 -1.1 -.5 Photographic equipment and supplies ................................... .070 69.272 68.685 -9.0 -.8 -1.0 -2.6 -1.7
Film and photographic supplies 1 2 3 ................................... - 89.130 89.333 -1.8 .2 .6 -1.4 .2 Photographic equipment 2 3 ................................................. - 31.892 31.440 -11.4 -1.4 -1.5 -2.7 -2.4
Photographers and film processing 1 3 .................................. .095 112.152 112.593 1.1 .4 -.3 .0 .4 Photographer fees 1 2 3 ....................................................... - 121.474 120.482 1.2 -.8 -1.2 1.8 -.8 Film processing 1 2 3 ............................................................ - 107.451 108.670 2.2 1.1 .0 -.5 1.1
Other recreational goods 3 ....................................................... .485 57.186 57.415 -4.7 .4 -1.3 -.3 .5 Toys 1 ..................................................................................... .364 58.431 58.528 -6.8 .2 -1.3 -.4 .2 Toys, games, hobbies and playground equipment 1 2 3 ...... - 61.483 61.537 -5.6 .1 -1.3 .1 .1
Sewing machines, fabric and supplies 3 ................................ .060 93.396 94.844 1.0 1.6 -2.4 .2 2.1 Music instruments and accessories 3 .................................... .048 97.012 97.711 .0 .7 -.2 -.5 .9
Recreation services 3 ............................................................... 1.872 146.629 145.126 -.5 -1.0 .4 .2 -1.0 Club dues and fees for participant sports and group
exercises 3 ..................................................................... .595 124.735 122.119 -3.7 -2.1 .7 .1 -2.0 Admissions 1 .......................................................................... .679 326.799 325.204 1.6 -.5 .2 .2 -.5
See footnotes at end of table.
12 CPI Detailed Report-September 2010
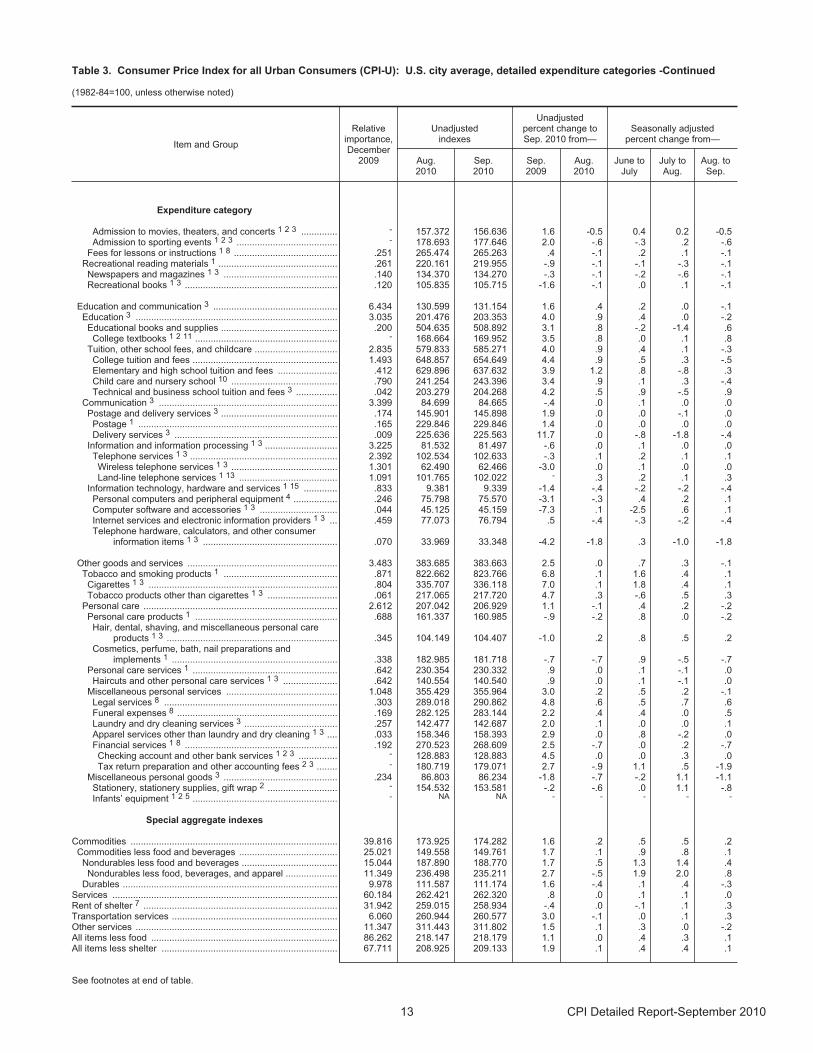
Table 3. Consumer Price Index for all Urban Consumers (CPI-U): U.S. city average, detailed expenditure categories -Continued
(1982-84=100, unless otherwise noted)
Item and Group
Relativeimportance,December
2009
Unadjustedindexes
Unadjustedpercent change toSep. 2010 from—
Seasonally adjustedpercent change from—
Aug.2010
Sep.2010
Sep.2009
Aug.2010
June toJuly
July toAug.
Aug. toSep.
Expenditure category
Admission to movies, theaters, and concerts 1 2 3 .............. - 157.372 156.636 1.6 -0.5 0.4 0.2 -0.5 Admission to sporting events 1 2 3 ....................................... - 178.693 177.646 2.0 -.6 -.3 .2 -.6
Fees for lessons or instructions 1 8 ........................................ .251 265.474 265.263 .4 -.1 .2 .1 -.1 Recreational reading materials 1 .............................................. .261 220.161 219.955 -.9 -.1 -.1 -.3 -.1
Newspapers and magazines 1 3 ............................................ .140 134.370 134.270 -.3 -.1 -.2 -.6 -.1 Recreational books 1 3 ........................................................... .120 105.835 105.715 -1.6 -.1 .0 .1 -.1
Education and communication 3 ................................................ 6.434 130.599 131.154 1.6 .4 .2 .0 -.1 Education 3 .............................................................................. 3.035 201.476 203.353 4.0 .9 .4 .0 -.2 Educational books and supplies ............................................. .200 504.635 508.892 3.1 .8 -.2 -1.4 .6
College textbooks 1 2 11 ....................................................... - 168.664 169.952 3.5 .8 .0 .1 .8 Tuition, other school fees, and childcare ................................ 2.835 579.833 585.271 4.0 .9 .4 .1 -.3
College tuition and fees ........................................................ 1.493 648.857 654.649 4.4 .9 .5 .3 -.5 Elementary and high school tuition and fees ....................... .412 629.896 637.632 3.9 1.2 .8 -.8 .3 Child care and nursery school 10 ......................................... .790 241.254 243.396 3.4 .9 .1 .3 -.4 Technical and business school tuition and fees 3 ................ .042 203.279 204.268 4.2 .5 .9 -.5 .9
Communication 3 ..................................................................... 3.399 84.699 84.665 -.4 .0 .1 .0 .0 Postage and delivery services 3 ............................................. .174 145.901 145.898 1.9 .0 .0 -.1 .0 Postage 1 ............................................................................. .165 229.846 229.846 1.4 .0 .0 .0 .0 Delivery services 3 ............................................................... .009 225.636 225.563 11.7 .0 -.8 -1.8 -.4
Information and information processing 1 3 ............................ 3.225 81.532 81.497 -.6 .0 .1 .0 .0 Telephone services 1 3 ......................................................... 2.392 102.534 102.633 -.3 .1 .2 .1 .1 Wireless telephone services 1 3 ......................................... 1.301 62.490 62.466 -3.0 .0 .1 .0 .0 Land-line telephone services 1 13 ...................................... 1.091 101.765 102.022 - .3 .2 .1 .3
Information technology, hardware and services 1 15 ............. .833 9.381 9.339 -1.4 -.4 -.2 -.2 -.4 Personal computers and peripheral equipment 4 ................. .246 75.798 75.570 -3.1 -.3 .4 .2 .1 Computer software and accessories 1 3 .............................. .044 45.125 45.159 -7.3 .1 -2.5 .6 .1 Internet services and electronic information providers 1 3 ... .459 77.073 76.794 .5 -.4 -.3 -.2 -.4 Telephone hardware, calculators, and other consumer
information items 1 3 .................................................... .070 33.969 33.348 -4.2 -1.8 .3 -1.0 -1.8
Other goods and services .......................................................... 3.483 383.685 383.663 2.5 .0 .7 .3 -.1 Tobacco and smoking products 1 ............................................ .871 822.662 823.766 6.8 .1 1.6 .4 .1 Cigarettes 1 3 ......................................................................... .804 335.707 336.118 7.0 .1 1.8 .4 .1 Tobacco products other than cigarettes 1 3 ........................... .061 217.065 217.720 4.7 .3 -.6 .5 .3
Personal care ........................................................................... 2.612 207.042 206.929 1.1 -.1 .4 .2 -.2 Personal care products 1 ....................................................... .688 161.337 160.985 -.9 -.2 .8 .0 -.2 Hair, dental, shaving, and miscellaneous personal care
products 1 3 .................................................................. .345 104.149 104.407 -1.0 .2 .8 .5 .2 Cosmetics, perfume, bath, nail preparations and
implements 1 ................................................................ .338 182.985 181.718 -.7 -.7 .9 -.5 -.7 Personal care services 1 ........................................................ .642 230.354 230.332 .9 .0 .1 -.1 .0 Haircuts and other personal care services 1 3 ..................... .642 140.554 140.540 .9 .0 .1 -.1 .0
Miscellaneous personal services ........................................... 1.048 355.429 355.964 3.0 .2 .5 .2 -.1 Legal services 8 ................................................................... .303 289.018 290.862 4.8 .6 .5 .7 .6 Funeral expenses 8 .............................................................. .169 282.125 283.144 2.2 .4 .4 .0 .5 Laundry and dry cleaning services 3 .................................... .257 142.477 142.687 2.0 .1 .0 .0 .1 Apparel services other than laundry and dry cleaning 1 3 .... .033 158.346 158.393 2.9 .0 .8 -.2 .0 Financial services 1 8 ........................................................... .192 270.523 268.609 2.5 -.7 .0 .2 -.7 Checking account and other bank services 1 2 3 ............... - 128.883 128.883 4.5 .0 .0 .3 .0 Tax return preparation and other accounting fees 2 3 ........ - 180.719 179.071 2.7 -.9 1.1 .5 -1.9
Miscellaneous personal goods 3 ............................................ .234 86.803 86.234 -1.8 -.7 -.2 1.1 -1.1 Stationery, stationery supplies, gift wrap 2 ........................... - 154.532 153.581 -.2 -.6 .0 1.1 -.8 Infants’ equipment 1 2 5 ........................................................ - NA NA - - - - -
Special aggregate indexes
Commodities ................................................................................ 39.816 173.925 174.282 1.6 .2 .5 .5 .2Commodities less food and beverages ...................................... 25.021 149.558 149.761 1.7 .1 .9 .8 .1
Nondurables less food and beverages ..................................... 15.044 187.890 188.770 1.7 .5 1.3 1.4 .4 Nondurables less food, beverages, and apparel .................... 11.349 236.498 235.211 2.7 -.5 1.9 2.0 .8
Durables ................................................................................... 9.978 111.587 111.174 1.6 -.4 .1 .4 -.3Services ....................................................................................... 60.184 262.421 262.320 .8 .0 .1 .1 .0 Rent of shelter 7 ........................................................................... 31.942 259.015 258.934 -.4 .0 -.1 .1 .3 Transportation services ................................................................ 6.060 260.944 260.577 3.0 -.1 .0 .1 .3 Other services .............................................................................. 11.347 311.443 311.802 1.5 .1 .3 .0 -.2 All items less food ........................................................................ 86.262 218.147 218.179 1.1 .0 .4 .3 .1 All items less shelter .................................................................... 67.711 208.925 209.133 1.9 .1 .4 .4 .1
See footnotes at end of table.
13 CPI Detailed Report-September 2010
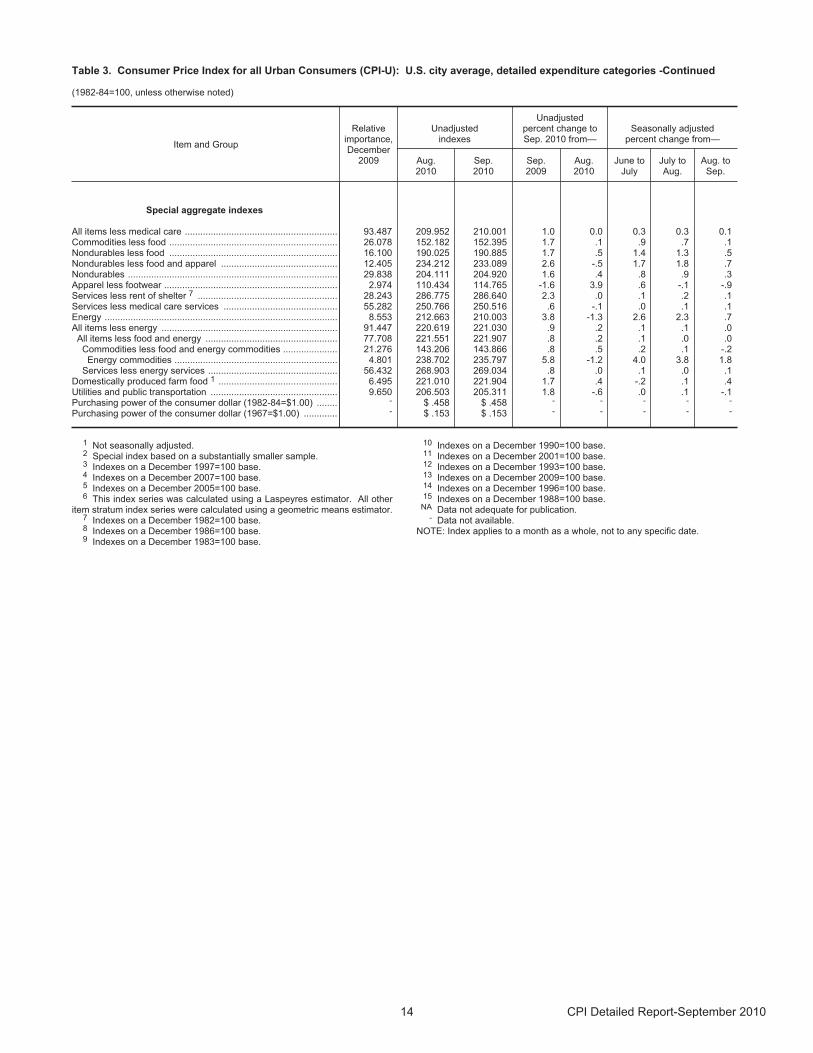
Table 3. Consumer Price Index for all Urban Consumers (CPI-U): U.S. city average, detailed expenditure categories -Continued
(1982-84=100, unless otherwise noted)
Item and Group
Relativeimportance,December
2009
Unadjustedindexes
Unadjustedpercent change toSep. 2010 from—
Seasonally adjustedpercent change from—
Aug.2010
Sep.2010
Sep.2009
Aug.2010
June toJuly
July toAug.
Aug. toSep.
Special aggregate indexes
All items less medical care ........................................................... 93.487 209.952 210.001 1.0 0.0 0.3 0.3 0.1 Commodities less food ................................................................. 26.078 152.182 152.395 1.7 .1 .9 .7 .1 Nondurables less food ................................................................. 16.100 190.025 190.885 1.7 .5 1.4 1.3 .5 Nondurables less food and apparel ............................................. 12.405 234.212 233.089 2.6 -.5 1.7 1.8 .7 Nondurables ................................................................................. 29.838 204.111 204.920 1.6 .4 .8 .9 .3 Apparel less footwear ................................................................... 2.974 110.434 114.765 -1.6 3.9 .6 -.1 -.9 Services less rent of shelter 7 ...................................................... 28.243 286.775 286.640 2.3 .0 .1 .2 .1 Services less medical care services ............................................ 55.282 250.766 250.516 .6 -.1 .0 .1 .1 Energy .......................................................................................... 8.553 212.663 210.003 3.8 -1.3 2.6 2.3 .7 All items less energy .................................................................... 91.447 220.619 221.030 .9 .2 .1 .1 .0
All items less food and energy ................................................... 77.708 221.551 221.907 .8 .2 .1 .0 .0 Commodities less food and energy commodities ..................... 21.276 143.206 143.866 .8 .5 .2 .1 -.2 Energy commodities ............................................................... 4.801 238.702 235.797 5.8 -1.2 4.0 3.8 1.8
Services less energy services .................................................. 56.432 268.903 269.034 .8 .0 .1 .0 .1 Domestically produced farm food 1 .............................................. 6.495 221.010 221.904 1.7 .4 -.2 .1 .4 Utilities and public transportation ................................................. 9.650 206.503 205.311 1.8 -.6 .0 .1 -.1 Purchasing power of the consumer dollar (1982-84=$1.00) ........ - $ .458 $ .458 - - - - -
Purchasing power of the consumer dollar (1967=$1.00) ............. - $ .153 $ .153 - - - - -
1 Not seasonally adjusted.2 Special index based on a substantially smaller sample.3 Indexes on a December 1997=100 base.4 Indexes on a December 2007=100 base.5 Indexes on a December 2005=100 base.6 This index series was calculated using a Laspeyres estimator. All other
item stratum index series were calculated using a geometric means estimator.7 Indexes on a December 1982=100 base.8 Indexes on a December 1986=100 base.9 Indexes on a December 1983=100 base.
10 Indexes on a December 1990=100 base.11 Indexes on a December 2001=100 base.12 Indexes on a December 1993=100 base.13 Indexes on a December 2009=100 base.14 Indexes on a December 1996=100 base.15 Indexes on a December 1988=100 base.
NA Data not adequate for publication.- Data not available.
NOTE: Index applies to a month as a whole, not to any specific date.
14 CPI Detailed Report-September 2010
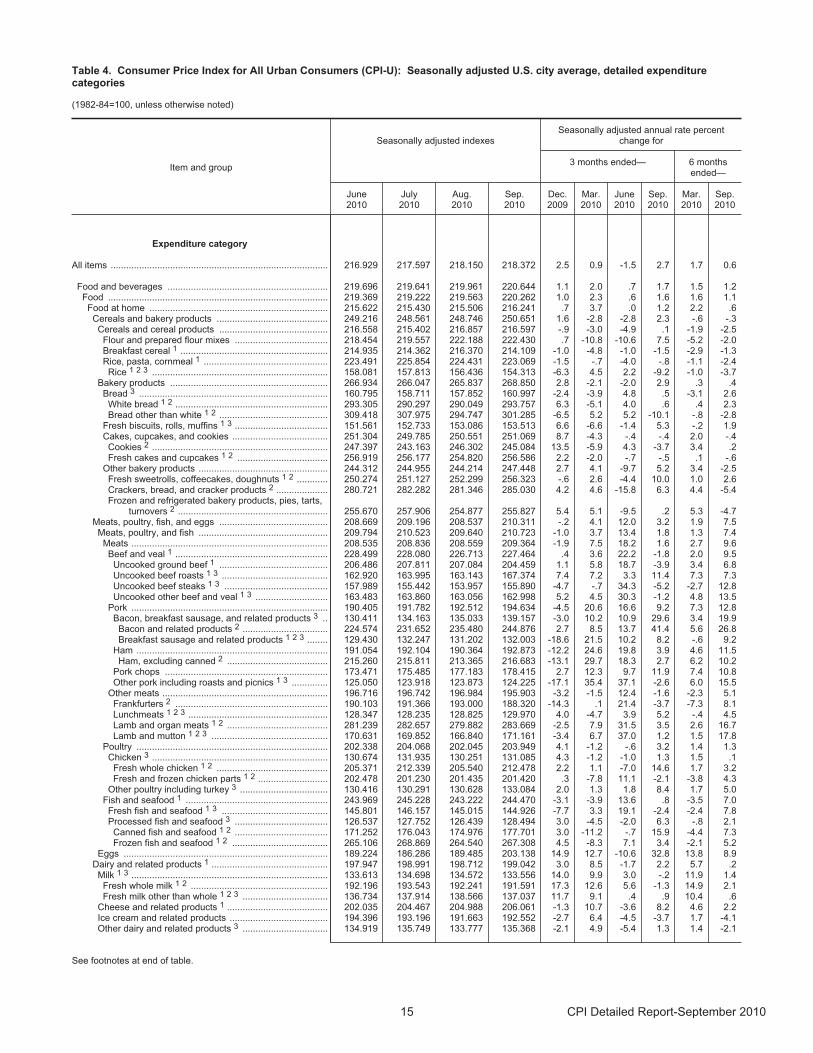
Table 4. Consumer Price Index for All Urban Consumers (CPI-U): Seasonally adjusted U.S. city average, detailed expenditurecategories
(1982-84=100, unless otherwise noted)
Item and group
Seasonally adjusted indexesSeasonally adjusted annual rate percent
change for
3 months ended— 6 monthsended—
June2010
July2010
Aug.2010
Sep.2010
Dec.2009
Mar.2010
June2010
Sep.2010
Mar.2010
Sep.2010
Expenditure category
All items .................................................................................... 216.929 217.597 218.150 218.372 2.5 0.9 -1.5 2.7 1.7 0.6
Food and beverages .............................................................. 219.696 219.641 219.961 220.644 1.1 2.0 .7 1.7 1.5 1.2 Food ..................................................................................... 219.369 219.222 219.563 220.262 1.0 2.3 .6 1.6 1.6 1.1
Food at home ..................................................................... 215.622 215.430 215.506 216.241 .7 3.7 .0 1.2 2.2 .6 Cereals and bakery products ........................................... 249.216 248.561 248.746 250.651 1.6 -2.8 -2.8 2.3 -.6 -.3 Cereals and cereal products .......................................... 216.558 215.402 216.857 216.597 -.9 -3.0 -4.9 .1 -1.9 -2.5
Flour and prepared flour mixes .................................... 218.454 219.557 222.188 222.430 .7 -10.8 -10.6 7.5 -5.2 -2.0 Breakfast cereal 1 ......................................................... 214.935 214.362 216.370 214.109 -1.0 -4.8 -1.0 -1.5 -2.9 -1.3 Rice, pasta, cornmeal 1 ................................................ 223.491 225.854 224.431 223.069 -1.5 -.7 -4.0 -.8 -1.1 -2.4 Rice 1 2 3 .................................................................... 158.081 157.813 156.436 154.313 -6.3 4.5 2.2 -9.2 -1.0 -3.7
Bakery products ............................................................. 266.934 266.047 265.837 268.850 2.8 -2.1 -2.0 2.9 .3 .4 Bread 3 ......................................................................... 160.795 158.711 157.852 160.997 -2.4 -3.9 4.8 .5 -3.1 2.6
White bread 1 2 ........................................................... 293.305 290.297 290.049 293.757 6.3 -5.1 4.0 .6 .4 2.3 Bread other than white 1 2 .......................................... 309.418 307.975 294.747 301.285 -6.5 5.2 5.2 -10.1 -.8 -2.8
Fresh biscuits, rolls, muffins 1 3 .................................... 151.561 152.733 153.086 153.513 6.6 -6.6 -1.4 5.3 -.2 1.9 Cakes, cupcakes, and cookies ..................................... 251.304 249.785 250.551 251.069 8.7 -4.3 -.4 -.4 2.0 -.4
Cookies 2 .................................................................... 247.397 243.163 246.302 245.084 13.5 -5.9 4.3 -3.7 3.4 .2 Fresh cakes and cupcakes 1 2 ................................... 256.919 256.177 254.820 256.586 2.2 -2.0 -.7 -.5 .1 -.6
Other bakery products .................................................. 244.312 244.955 244.214 247.448 2.7 4.1 -9.7 5.2 3.4 -2.5 Fresh sweetrolls, coffeecakes, doughnuts 1 2 ............ 250.274 251.127 252.299 256.323 -.6 2.6 -4.4 10.0 1.0 2.6 Crackers, bread, and cracker products 2 .................... 280.721 282.282 281.346 285.030 4.2 4.6 -15.8 6.3 4.4 -5.4 Frozen and refrigerated bakery products, pies, tarts,
turnovers 2 .......................................................... 255.670 257.906 254.877 255.827 5.4 5.1 -9.5 .2 5.3 -4.7 Meats, poultry, fish, and eggs .......................................... 208.669 209.196 208.537 210.311 -.2 4.1 12.0 3.2 1.9 7.5 Meats, poultry, and fish .................................................. 209.794 210.523 209.640 210.723 -1.0 3.7 13.4 1.8 1.3 7.4
Meats ............................................................................ 208.535 208.836 208.559 209.364 -1.9 7.5 18.2 1.6 2.7 9.6 Beef and veal 1 ........................................................... 228.499 228.080 226.713 227.464 .4 3.6 22.2 -1.8 2.0 9.5 Uncooked ground beef 1 .......................................... 206.486 207.811 207.084 204.459 1.1 5.8 18.7 -3.9 3.4 6.8 Uncooked beef roasts 1 3 ......................................... 162.920 163.995 163.143 167.374 7.4 7.2 3.3 11.4 7.3 7.3 Uncooked beef steaks 1 3 ........................................ 157.989 155.442 153.957 155.890 -4.7 -.7 34.3 -5.2 -2.7 12.8 Uncooked other beef and veal 1 3 ............................ 163.483 163.860 163.056 162.998 5.2 4.5 30.3 -1.2 4.8 13.5
Pork ............................................................................ 190.405 191.782 192.512 194.634 -4.5 20.6 16.6 9.2 7.3 12.8 Bacon, breakfast sausage, and related products 3 .. 130.411 134.163 135.033 139.157 -3.0 10.2 10.9 29.6 3.4 19.9
Bacon and related products 2 ................................. 224.574 231.652 235.480 244.876 2.7 8.5 13.7 41.4 5.6 26.8 Breakfast sausage and related products 1 2 3 ........ 129.430 132.247 131.202 132.003 -18.6 21.5 10.2 8.2 -.6 9.2
Ham .......................................................................... 191.054 192.104 190.364 192.873 -12.2 24.6 19.8 3.9 4.6 11.5 Ham, excluding canned 2 ....................................... 215.260 215.811 213.365 216.683 -13.1 29.7 18.3 2.7 6.2 10.2
Pork chops ............................................................... 173.471 175.485 177.183 178.415 2.7 12.3 9.7 11.9 7.4 10.8Other pork including roasts and picnics 1 3 .............. 125.050 123.918 123.873 124.225 -17.1 35.4 37.1 -2.6 6.0 15.5
Other meats ................................................................ 196.716 196.742 196.984 195.903 -3.2 -1.5 12.4 -1.6 -2.3 5.1 Frankfurters 2 ........................................................... 190.103 191.366 193.000 188.320 -14.3 .1 21.4 -3.7 -7.3 8.1 Lunchmeats 1 2 3 ...................................................... 128.347 128.235 128.825 129.970 4.0 -4.7 3.9 5.2 -.4 4.5 Lamb and organ meats 1 2 ....................................... 281.239 282.657 279.882 283.669 -2.5 7.9 31.5 3.5 2.6 16.7 Lamb and mutton 1 2 3 ............................................. 170.631 169.852 166.840 171.161 -3.4 6.7 37.0 1.2 1.5 17.8
Poultry .......................................................................... 202.338 204.068 202.045 203.949 4.1 -1.2 -.6 3.2 1.4 1.3 Chicken 3 .................................................................... 130.674 131.935 130.251 131.085 4.3 -1.2 -1.0 1.3 1.5 .1 Fresh whole chicken 1 2 ........................................... 205.371 212.339 205.540 212.478 2.2 1.1 -7.0 14.6 1.7 3.2 Fresh and frozen chicken parts 1 2 ........................... 202.478 201.230 201.435 201.420 .3 -7.8 11.1 -2.1 -3.8 4.3
Other poultry including turkey 3 .................................. 130.416 130.291 130.628 133.084 2.0 1.3 1.8 8.4 1.7 5.0 Fish and seafood 1 ....................................................... 243.969 245.228 243.222 244.470 -3.1 -3.9 13.6 .8 -3.5 7.0 Fresh fish and seafood 1 3 ......................................... 145.801 146.157 145.015 144.926 -7.7 3.3 19.1 -2.4 -2.4 7.8 Processed fish and seafood 3 .................................... 126.537 127.752 126.439 128.494 3.0 -4.5 -2.0 6.3 -.8 2.1 Canned fish and seafood 1 2 .................................... 171.252 176.043 174.976 177.701 3.0 -11.2 -.7 15.9 -4.4 7.3 Frozen fish and seafood 1 2 ..................................... 265.106 268.869 264.540 267.308 4.5 -8.3 7.1 3.4 -2.1 5.2
Eggs ............................................................................... 189.224 186.286 189.485 203.138 14.9 12.7 -10.6 32.8 13.8 8.9 Dairy and related products 1 ............................................. 197.947 198.991 198.712 199.042 3.0 8.5 -1.7 2.2 5.7 .2 Milk 1 3 ............................................................................ 133.613 134.698 134.572 133.556 14.0 9.9 3.0 -.2 11.9 1.4 Fresh whole milk 1 2 ..................................................... 192.196 193.543 192.241 191.591 17.3 12.6 5.6 -1.3 14.9 2.1 Fresh milk other than whole 1 2 3 ................................. 136.734 137.914 138.566 137.037 11.7 9.1 .4 .9 10.4 .6
Cheese and related products 1 ....................................... 202.035 204.467 204.988 206.061 -1.3 10.7 -3.6 8.2 4.6 2.2 Ice cream and related products ...................................... 194.396 193.196 191.663 192.552 -2.7 6.4 -4.5 -3.7 1.7 -4.1 Other dairy and related products 3 ................................. 134.919 135.749 133.777 135.368 -2.1 4.9 -5.4 1.3 1.4 -2.1
See footnotes at end of table.
15 CPI Detailed Report-September 2010
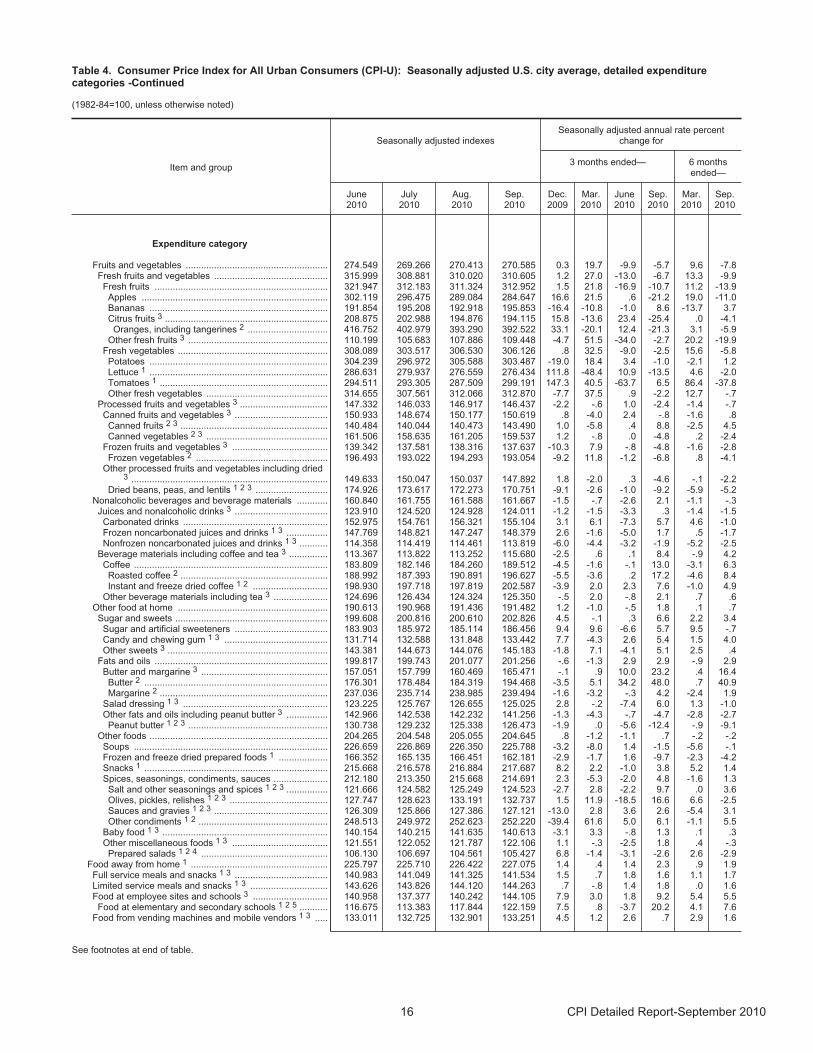
Table 4. Consumer Price Index for All Urban Consumers (CPI-U): Seasonally adjusted U.S. city average, detailed expenditurecategories -Continued
(1982-84=100, unless otherwise noted)
Item and group
Seasonally adjusted indexesSeasonally adjusted annual rate percent
change for
3 months ended— 6 monthsended—
June2010
July2010
Aug.2010
Sep.2010
Dec.2009
Mar.2010
June2010
Sep.2010
Mar.2010
Sep.2010
Expenditure category
Fruits and vegetables ....................................................... 274.549 269.266 270.413 270.585 0.3 19.7 -9.9 -5.7 9.6 -7.8 Fresh fruits and vegetables ............................................ 315.999 308.881 310.020 310.605 1.2 27.0 -13.0 -6.7 13.3 -9.9
Fresh fruits ................................................................... 321.947 312.183 311.324 312.952 1.5 21.8 -16.9 -10.7 11.2 -13.9 Apples ........................................................................ 302.119 296.475 289.084 284.647 16.6 21.5 .6 -21.2 19.0 -11.0 Bananas ..................................................................... 191.854 195.208 192.918 195.853 -16.4 -10.8 -1.0 8.6 -13.7 3.7 Citrus fruits 3 ............................................................... 208.875 202.988 194.876 194.115 15.8 -13.6 23.4 -25.4 .0 -4.1 Oranges, including tangerines 2 ............................... 416.752 402.979 393.290 392.522 33.1 -20.1 12.4 -21.3 3.1 -5.9
Other fresh fruits 3 ...................................................... 110.199 105.683 107.886 109.448 -4.7 51.5 -34.0 -2.7 20.2 -19.9 Fresh vegetables .......................................................... 308.089 303.517 306.530 306.126 .8 32.5 -9.0 -2.5 15.6 -5.8
Potatoes ..................................................................... 304.239 296.972 305.588 303.487 -19.0 18.4 3.4 -1.0 -2.1 1.2 Lettuce 1 ..................................................................... 286.631 279.937 276.559 276.434 111.8 -48.4 10.9 -13.5 4.6 -2.0 Tomatoes 1 ................................................................. 294.511 293.305 287.509 299.191 147.3 40.5 -63.7 6.5 86.4 -37.8Other fresh vegetables ............................................... 314.655 307.561 312.066 312.870 -7.7 37.5 .9 -2.2 12.7 -.7
Processed fruits and vegetables 3 .................................. 147.332 146.033 146.917 146.437 -2.2 -.6 1.0 -2.4 -1.4 -.7 Canned fruits and vegetables 3 .................................... 150.933 148.674 150.177 150.619 .8 -4.0 2.4 -.8 -1.6 .8 Canned fruits 2 3 ......................................................... 140.484 140.044 140.473 143.490 1.0 -5.8 .4 8.8 -2.5 4.5 Canned vegetables 2 3 ............................................... 161.506 158.635 161.205 159.537 1.2 -.8 .0 -4.8 .2 -2.4
Frozen fruits and vegetables 3 ..................................... 139.342 137.581 138.316 137.637 -10.3 7.9 -.8 -4.8 -1.6 -2.8 Frozen vegetables 2 ................................................... 196.493 193.022 194.293 193.054 -9.2 11.8 -1.2 -6.8 .8 -4.1
Other processed fruits and vegetables including dried3 ............................................................................ 149.633 150.047 150.037 147.892 1.8 -2.0 .3 -4.6 -.1 -2.2
Dried beans, peas, and lentils 1 2 3 ............................ 174.926 173.617 172.273 170.751 -9.1 -2.6 -1.0 -9.2 -5.9 -5.2 Nonalcoholic beverages and beverage materials ............ 160.840 161.755 161.588 161.667 -1.5 -.7 -2.6 2.1 -1.1 -.3 Juices and nonalcoholic drinks 3 .................................... 123.910 124.520 124.928 124.011 -1.2 -1.5 -3.3 .3 -1.4 -1.5 Carbonated drinks ........................................................ 152.975 154.761 156.321 155.104 3.1 6.1 -7.3 5.7 4.6 -1.0Frozen noncarbonated juices and drinks 1 3 ................ 147.769 148.821 147.247 148.379 2.6 -1.6 -5.0 1.7 .5 -1.7 Nonfrozen noncarbonated juices and drinks 1 3 ........... 114.358 114.419 114.461 113.819 -6.0 -4.4 -3.2 -1.9 -5.2 -2.5
Beverage materials including coffee and tea 3 ............... 113.367 113.822 113.252 115.680 -2.5 .6 .1 8.4 -.9 4.2 Coffee ........................................................................... 183.809 182.146 184.260 189.512 -4.5 -1.6 -.1 13.0 -3.1 6.3 Roasted coffee 2 ......................................................... 188.992 187.393 190.891 196.627 -5.5 -3.6 .2 17.2 -4.6 8.4 Instant and freeze dried coffee 1 2 ............................. 198.930 197.718 197.819 202.587 -3.9 2.0 2.3 7.6 -1.0 4.9
Other beverage materials including tea 3 ..................... 124.696 126.434 124.324 125.350 -.5 2.0 -.8 2.1 .7 .6 Other food at home .......................................................... 190.613 190.968 191.436 191.482 1.2 -1.0 -.5 1.8 .1 .7 Sugar and sweets ........................................................... 199.608 200.816 200.610 202.826 4.5 -.1 .3 6.6 2.2 3.4
Sugar and artificial sweeteners .................................... 183.903 185.972 185.114 186.456 9.4 9.6 -6.6 5.7 9.5 -.7 Candy and chewing gum 1 3 ........................................ 131.714 132.588 131.848 133.442 7.7 -4.3 2.6 5.4 1.5 4.0 Other sweets 3 .............................................................. 143.381 144.673 144.076 145.183 -1.8 7.1 -4.1 5.1 2.5 .4
Fats and oils ................................................................... 199.817 199.743 201.077 201.256 -.6 -1.3 2.9 2.9 -.9 2.9 Butter and margarine 3 ................................................. 157.051 157.799 160.469 165.471 -.1 .9 10.0 23.2 .4 16.4 Butter 2 ....................................................................... 176.301 178.484 184.319 194.468 -3.5 5.1 34.2 48.0 .7 40.9Margarine 2 ................................................................. 237.036 235.714 238.985 239.494 -1.6 -3.2 -.3 4.2 -2.4 1.9
Salad dressing 1 3 ........................................................ 123.225 125.767 126.655 125.025 2.8 -.2 -7.4 6.0 1.3 -1.0 Other fats and oils including peanut butter 3 ................ 142.966 142.538 142.232 141.256 -1.3 -4.3 -.7 -4.7 -2.8 -2.7 Peanut butter 1 2 3 ...................................................... 130.738 129.232 125.338 126.473 -1.9 .0 -5.6 -12.4 -.9 -9.1
Other foods ..................................................................... 204.265 204.548 205.055 204.645 .8 -1.2 -1.1 .7 -.2 -.2 Soups ........................................................................... 226.659 226.869 226.350 225.788 -3.2 -8.0 1.4 -1.5 -5.6 -.1 Frozen and freeze dried prepared foods 1 ................... 166.352 165.135 166.451 162.181 -2.9 -1.7 1.6 -9.7 -2.3 -4.2 Snacks 1 ....................................................................... 215.668 216.578 216.884 217.687 8.2 2.2 -1.0 3.8 5.2 1.4Spices, seasonings, condiments, sauces ..................... 212.180 213.350 215.668 214.691 2.3 -5.3 -2.0 4.8 -1.6 1.3
Salt and other seasonings and spices 1 2 3 ................ 121.666 124.582 125.249 124.523 -2.7 2.8 -2.2 9.7 .0 3.6 Olives, pickles, relishes 1 2 3 ...................................... 127.747 128.623 133.191 132.737 1.5 11.9 -18.5 16.6 6.6 -2.5 Sauces and gravies 1 2 3 ............................................ 126.309 125.866 127.386 127.121 -13.0 2.8 3.6 2.6 -5.4 3.1 Other condiments 1 2 .................................................. 248.513 249.972 252.623 252.220 -39.4 61.6 5.0 6.1 -1.1 5.5
Baby food 1 3 ................................................................ 140.154 140.215 141.635 140.613 -3.1 3.3 -.8 1.3 .1 .3 Other miscellaneous foods 1 3 ..................................... 121.551 122.052 121.787 122.106 1.1 -.3 -2.5 1.8 .4 -.3 Prepared salads 1 2 4 ................................................. 106.130 106.697 104.561 105.427 6.8 -1.4 -3.1 -2.6 2.6 -2.9
Food away from home 1 ..................................................... 225.797 225.710 226.422 227.075 1.4 .4 1.4 2.3 .9 1.9 Full service meals and snacks 1 3 .................................... 140.983 141.049 141.325 141.534 1.5 .7 1.8 1.6 1.1 1.7 Limited service meals and snacks 1 3 .............................. 143.626 143.826 144.120 144.263 .7 -.8 1.4 1.8 .0 1.6 Food at employee sites and schools 3 ............................. 140.958 137.377 140.242 144.105 7.9 3.0 1.8 9.2 5.4 5.5 Food at elementary and secondary schools 1 2 5 ........... 116.675 113.383 117.844 122.159 7.5 .8 -3.7 20.2 4.1 7.6
Food from vending machines and mobile vendors 1 3 ..... 133.011 132.725 132.901 133.251 4.5 1.2 2.6 .7 2.9 1.6
See footnotes at end of table.
16 CPI Detailed Report-September 2010
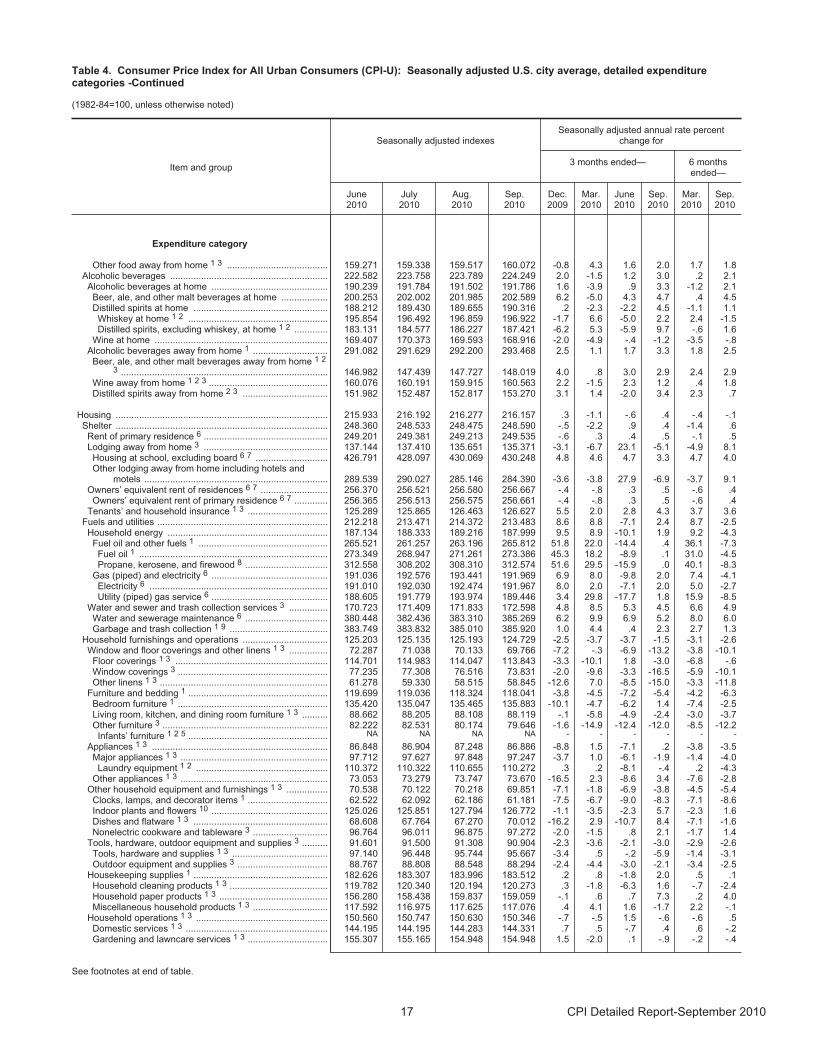
Table 4. Consumer Price Index for All Urban Consumers (CPI-U): Seasonally adjusted U.S. city average, detailed expenditurecategories -Continued
(1982-84=100, unless otherwise noted)
Item and group
Seasonally adjusted indexesSeasonally adjusted annual rate percent
change for
3 months ended— 6 monthsended—
June2010
July2010
Aug.2010
Sep.2010
Dec.2009
Mar.2010
June2010
Sep.2010
Mar.2010
Sep.2010
Expenditure category
Other food away from home 1 3 ....................................... 159.271 159.338 159.517 160.072 -0.8 4.3 1.6 2.0 1.7 1.8 Alcoholic beverages ............................................................. 222.582 223.758 223.789 224.249 2.0 -1.5 1.2 3.0 .2 2.1
Alcoholic beverages at home ............................................. 190.239 191.784 191.502 191.786 1.6 -3.9 .9 3.3 -1.2 2.1 Beer, ale, and other malt beverages at home .................. 200.253 202.002 201.985 202.589 6.2 -5.0 4.3 4.7 .4 4.5 Distilled spirits at home .................................................... 188.212 189.430 189.655 190.316 .2 -2.3 -2.2 4.5 -1.1 1.1 Whiskey at home 1 2 ...................................................... 195.854 196.492 196.859 196.922 -1.7 6.6 -5.0 2.2 2.4 -1.5 Distilled spirits, excluding whiskey, at home 1 2 ............. 183.131 184.577 186.227 187.421 -6.2 5.3 -5.9 9.7 -.6 1.6
Wine at home ................................................................... 169.407 170.373 169.593 168.916 -2.0 -4.9 -.4 -1.2 -3.5 -.8 Alcoholic beverages away from home 1 ............................. 291.082 291.629 292.200 293.468 2.5 1.1 1.7 3.3 1.8 2.5
Beer, ale, and other malt beverages away from home 1 2
3 ................................................................................ 146.982 147.439 147.727 148.019 4.0 .8 3.0 2.9 2.4 2.9 Wine away from home 1 2 3 .............................................. 160.076 160.191 159.915 160.563 2.2 -1.5 2.3 1.2 .4 1.8 Distilled spirits away from home 2 3 ................................. 151.982 152.487 152.817 153.270 3.1 1.4 -2.0 3.4 2.3 .7
Housing .................................................................................. 215.933 216.192 216.277 216.157 .3 -1.1 -.6 .4 -.4 -.1 Shelter .................................................................................. 248.360 248.533 248.475 248.590 -.5 -2.2 .9 .4 -1.4 .6 Rent of primary residence 6 ................................................ 249.201 249.381 249.213 249.535 -.6 .3 .4 .5 -.1 .5 Lodging away from home 3 ................................................ 137.144 137.410 135.651 135.371 -3.1 -6.7 23.1 -5.1 -4.9 8.1 Housing at school, excluding board 6 7 ............................ 426.791 428.097 430.069 430.248 4.8 4.6 4.7 3.3 4.7 4.0 Other lodging away from home including hotels and
motels ....................................................................... 289.539 290.027 285.146 284.390 -3.6 -3.8 27.9 -6.9 -3.7 9.1 Owners’ equivalent rent of residences 6 7 .......................... 256.370 256.521 256.580 256.667 -.4 -.8 .3 .5 -.6 .4 Owners’ equivalent rent of primary residence 6 7 ............. 256.365 256.513 256.575 256.661 -.4 -.8 .3 .5 -.6 .4
Tenants’ and household insurance 1 3 ............................... 125.289 125.865 126.463 126.627 5.5 2.0 2.8 4.3 3.7 3.6 Fuels and utilities .................................................................. 212.218 213.471 214.372 213.483 8.6 8.8 -7.1 2.4 8.7 -2.5
Household energy .............................................................. 187.134 188.333 189.216 187.999 9.5 8.9 -10.1 1.9 9.2 -4.3 Fuel oil and other fuels 1 .................................................. 265.521 261.257 263.196 265.812 51.8 22.0 -14.4 .4 36.1 -7.3 Fuel oil 1 ......................................................................... 273.349 268.947 271.261 273.386 45.3 18.2 -8.9 .1 31.0 -4.5 Propane, kerosene, and firewood 8 ................................ 312.558 308.202 308.310 312.574 51.6 29.5 -15.9 .0 40.1 -8.3
Gas (piped) and electricity 6 ............................................. 191.036 192.576 193.441 191.969 6.9 8.0 -9.8 2.0 7.4 -4.1 Electricity 6 ..................................................................... 191.010 192.030 192.474 191.967 8.0 2.0 -7.1 2.0 5.0 -2.7 Utility (piped) gas service 6 ............................................. 188.605 191.779 193.974 189.446 3.4 29.8 -17.7 1.8 15.9 -8.5
Water and sewer and trash collection services 3 ............... 170.723 171.409 171.833 172.598 4.8 8.5 5.3 4.5 6.6 4.9 Water and sewerage maintenance 6 ................................ 380.448 382.436 383.310 385.269 6.2 9.9 6.9 5.2 8.0 6.0 Garbage and trash collection 1 9 ...................................... 383.749 383.832 385.010 385.920 1.0 4.4 .4 2.3 2.7 1.3
Household furnishings and operations ................................. 125.203 125.135 125.193 124.729 -2.5 -3.7 -3.7 -1.5 -3.1 -2.6Window and floor coverings and other linens 1 3 ............... 72.287 71.038 70.133 69.766 -7.2 -.3 -6.9 -13.2 -3.8 -10.1 Floor coverings 1 3 ........................................................... 114.701 114.983 114.047 113.843 -3.3 -10.1 1.8 -3.0 -6.8 -.6 Window coverings 3 .......................................................... 77.235 77.308 76.516 73.831 -2.0 -9.6 -3.3 -16.5 -5.9 -10.1 Other linens 1 3 ................................................................. 61.278 59.330 58.515 58.845 -12.6 7.0 -8.5 -15.0 -3.3 -11.8
Furniture and bedding 1 ...................................................... 119.699 119.036 118.324 118.041 -3.8 -4.5 -7.2 -5.4 -4.2 -6.3 Bedroom furniture 1 .......................................................... 135.420 135.047 135.465 135.883 -10.1 -4.7 -6.2 1.4 -7.4 -2.5 Living room, kitchen, and dining room furniture 1 3 .......... 88.662 88.205 88.108 88.119 -.1 -5.8 -4.9 -2.4 -3.0 -3.7 Other furniture 3 ................................................................ 82.222 82.531 80.174 79.646 -1.6 -14.9 -12.4 -12.0 -8.5 -12.2 Infants’ furniture 1 2 5 ...................................................... NA NA NA NA - - - - - -
Appliances 1 3 .................................................................... 86.848 86.904 87.248 86.886 -8.8 1.5 -7.1 .2 -3.8 -3.5 Major appliances 1 3 ......................................................... 97.712 97.627 97.848 97.247 -3.7 1.0 -6.1 -1.9 -1.4 -4.0 Laundry equipment 1 2 ................................................... 110.372 110.322 110.655 110.272 .3 .2 -8.1 -.4 .2 -4.3
Other appliances 1 3 ......................................................... 73.053 73.279 73.747 73.670 -16.5 2.3 -8.6 3.4 -7.6 -2.8 Other household equipment and furnishings 1 3 ................ 70.538 70.122 70.218 69.851 -7.1 -1.8 -6.9 -3.8 -4.5 -5.4 Clocks, lamps, and decorator items 1 ............................... 62.522 62.092 62.186 61.181 -7.5 -6.7 -9.0 -8.3 -7.1 -8.6 Indoor plants and flowers 10 ............................................. 125.026 125.851 127.794 126.772 -1.1 -3.5 -2.3 5.7 -2.3 1.6 Dishes and flatware 1 3 .................................................... 68.608 67.764 67.270 70.012 -16.2 2.9 -10.7 8.4 -7.1 -1.6 Nonelectric cookware and tableware 3 ............................. 96.764 96.011 96.875 97.272 -2.0 -1.5 .8 2.1 -1.7 1.4
Tools, hardware, outdoor equipment and supplies 3 .......... 91.601 91.500 91.308 90.904 -2.3 -3.6 -2.1 -3.0 -2.9 -2.6 Tools, hardware and supplies 1 3 ..................................... 97.140 96.448 95.744 95.667 -3.4 .5 -.2 -5.9 -1.4 -3.1 Outdoor equipment and supplies 3 ................................... 88.767 88.808 88.548 88.294 -2.4 -4.4 -3.0 -2.1 -3.4 -2.5
Housekeeping supplies 1 .................................................... 182.626 183.307 183.996 183.512 .2 .8 -1.8 2.0 .5 .1 Household cleaning products 1 3 ...................................... 119.782 120.340 120.194 120.273 .3 -1.8 -6.3 1.6 -.7 -2.4 Household paper products 1 3 .......................................... 156.280 158.438 159.837 159.059 -.1 .6 .7 7.3 .2 4.0 Miscellaneous household products 1 3 ............................. 117.592 116.975 117.625 117.076 .4 4.1 1.6 -1.7 2.2 -.1
Household operations 1 3 ................................................... 150.560 150.747 150.630 150.346 -.7 -.5 1.5 -.6 -.6 .5 Domestic services 1 3 ....................................................... 144.195 144.195 144.283 144.331 .7 .5 -.7 .4 .6 -.2 Gardening and lawncare services 1 3 ............................... 155.307 155.165 154.948 154.948 1.5 -2.0 .1 -.9 -.2 -.4
See footnotes at end of table.
17 CPI Detailed Report-September 2010
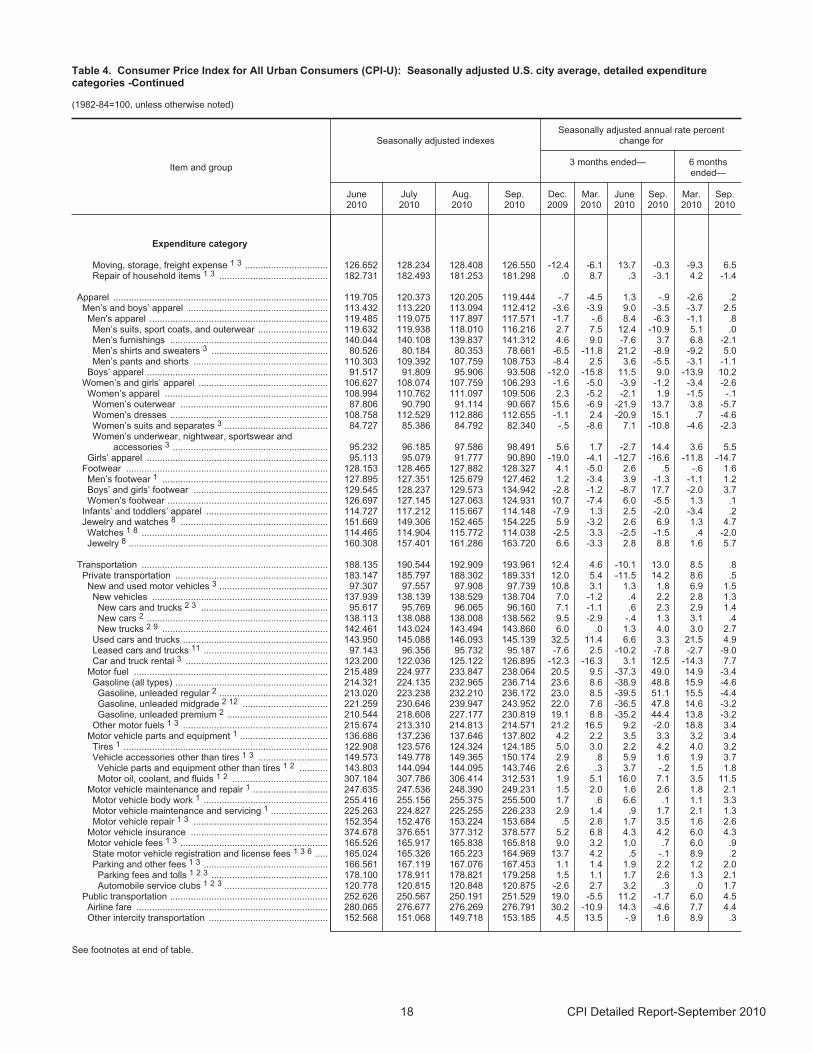
Table 4. Consumer Price Index for All Urban Consumers (CPI-U): Seasonally adjusted U.S. city average, detailed expenditurecategories -Continued
(1982-84=100, unless otherwise noted)
Item and group
Seasonally adjusted indexesSeasonally adjusted annual rate percent
change for
3 months ended— 6 monthsended—
June2010
July2010
Aug.2010
Sep.2010
Dec.2009
Mar.2010
June2010
Sep.2010
Mar.2010
Sep.2010
Expenditure category
Moving, storage, freight expense 1 3 ................................ 126.652 128.234 128.408 126.550 -12.4 -6.1 13.7 -0.3 -9.3 6.5 Repair of household items 1 3 .......................................... 182.731 182.493 181.253 181.298 .0 8.7 .3 -3.1 4.2 -1.4
Apparel ................................................................................... 119.705 120.373 120.205 119.444 -.7 -4.5 1.3 -.9 -2.6 .2 Men’s and boys’ apparel ...................................................... 113.432 113.220 113.094 112.412 -3.6 -3.9 9.0 -3.5 -3.7 2.5 Men’s apparel ..................................................................... 119.485 119.075 117.897 117.571 -1.7 -.6 8.4 -6.3 -1.1 .8
Men’s suits, sport coats, and outerwear ........................... 119.632 119.938 118.010 116.216 2.7 7.5 12.4 -10.9 5.1 .0 Men’s furnishings ............................................................. 140.044 140.108 139.837 141.312 4.6 9.0 -7.6 3.7 6.8 -2.1 Men’s shirts and sweaters 3 ............................................. 80.526 80.184 80.353 78.661 -6.5 -11.8 21.2 -8.9 -9.2 5.0 Men’s pants and shorts .................................................... 110.303 109.392 107.759 108.753 -8.4 2.5 3.6 -5.5 -3.1 -1.1
Boys’ apparel ...................................................................... 91.517 91.809 95.906 93.508 -12.0 -15.8 11.5 9.0 -13.9 10.2 Women’s and girls’ apparel .................................................. 106.627 108.074 107.759 106.293 -1.6 -5.0 -3.9 -1.2 -3.4 -2.6
Women’s apparel ............................................................... 108.994 110.762 111.097 109.506 2.3 -5.2 -2.1 1.9 -1.5 -.1 Women’s outerwear ......................................................... 87.806 90.790 91.114 90.667 15.6 -6.9 -21.9 13.7 3.8 -5.7Women’s dresses ............................................................. 108.758 112.529 112.886 112.655 -1.1 2.4 -20.9 15.1 .7 -4.6 Women’s suits and separates 3 ........................................ 84.727 85.386 84.792 82.340 -.5 -8.6 7.1 -10.8 -4.6 -2.3 Women’s underwear, nightwear, sportswear and
accessories 3 ............................................................ 95.232 96.185 97.586 98.491 5.6 1.7 -2.7 14.4 3.6 5.5 Girls’ apparel ...................................................................... 95.113 95.079 91.777 90.890 -19.0 -4.1 -12.7 -16.6 -11.8 -14.7
Footwear .............................................................................. 128.153 128.465 127.882 128.327 4.1 -5.0 2.6 .5 -.6 1.6 Men’s footwear 1 ................................................................ 127.895 127.351 125.679 127.462 1.2 -3.4 3.9 -1.3 -1.1 1.2 Boys’ and girls’ footwear .................................................... 129.545 128.237 129.573 134.942 -2.8 -1.2 -8.7 17.7 -2.0 3.7 Women’s footwear .............................................................. 126.697 127.145 127.063 124.931 10.7 -7.4 6.0 -5.5 1.3 .1
Infants’ and toddlers’ apparel ............................................... 114.727 117.212 115.667 114.148 -7.9 1.3 2.5 -2.0 -3.4 .2 Jewelry and watches 8 ......................................................... 151.669 149.306 152.465 154.225 5.9 -3.2 2.6 6.9 1.3 4.7
Watches 1 8 ........................................................................ 114.465 114.904 115.772 114.038 -2.5 3.3 -2.5 -1.5 .4 -2.0Jewelry 8 ............................................................................. 160.308 157.401 161.286 163.720 6.6 -3.3 2.8 8.8 1.6 5.7
Transportation ........................................................................ 188.135 190.544 192.909 193.961 12.4 4.6 -10.1 13.0 8.5 .8 Private transportation ........................................................... 183.147 185.797 188.302 189.331 12.0 5.4 -11.5 14.2 8.6 .5
New and used motor vehicles 3 .......................................... 97.307 97.557 97.908 97.739 10.8 3.1 1.3 1.8 6.9 1.5 New vehicles .................................................................... 137.939 138.139 138.529 138.704 7.0 -1.2 .4 2.2 2.8 1.3 New cars and trucks 2 3 ................................................. 95.617 95.769 96.065 96.160 7.1 -1.1 .6 2.3 2.9 1.4 New cars 2 ...................................................................... 138.113 138.088 138.008 138.562 9.5 -2.9 -.4 1.3 3.1 .4 New trucks 2 9 ................................................................ 142.461 143.024 143.494 143.860 6.0 .0 1.3 4.0 3.0 2.7
Used cars and trucks ........................................................ 143.950 145.088 146.093 145.139 32.5 11.4 6.6 3.3 21.5 4.9 Leased cars and trucks 11 ................................................ 97.143 96.356 95.732 95.187 -7.6 2.5 -10.2 -7.8 -2.7 -9.0 Car and truck rental 3 ....................................................... 123.200 122.036 125.122 126.895 -12.3 -16.3 3.1 12.5 -14.3 7.7
Motor fuel ........................................................................... 215.489 224.977 233.847 238.064 20.5 9.5 -37.3 49.0 14.9 -3.4 Gasoline (all types) ........................................................... 214.321 224.135 232.965 236.714 23.6 8.6 -38.9 48.8 15.9 -4.6 Gasoline, unleaded regular 2 .......................................... 213.020 223.238 232.210 236.172 23.0 8.5 -39.5 51.1 15.5 -4.4 Gasoline, unleaded midgrade 2 12 ................................. 221.259 230.646 239.947 243.952 22.0 7.6 -36.5 47.8 14.6 -3.2 Gasoline, unleaded premium 2 ....................................... 210.544 218.608 227.177 230.819 19.1 8.8 -35.2 44.4 13.8 -3.2
Other motor fuels 1 3 ........................................................ 215.674 213.310 214.813 214.571 21.2 16.5 9.2 -2.0 18.8 3.4 Motor vehicle parts and equipment 1 .................................. 136.686 137.236 137.646 137.802 4.2 2.2 3.5 3.3 3.2 3.4 Tires 1 ............................................................................... 122.908 123.576 124.324 124.185 5.0 3.0 2.2 4.2 4.0 3.2 Vehicle accessories other than tires 1 3 ........................... 149.573 149.778 149.365 150.174 2.9 .8 5.9 1.6 1.9 3.7 Vehicle parts and equipment other than tires 1 2 ........... 143.803 144.094 144.095 143.746 2.6 .3 3.7 -.2 1.5 1.8 Motor oil, coolant, and fluids 1 2 ..................................... 307.184 307.786 306.414 312.531 1.9 5.1 16.0 7.1 3.5 11.5
Motor vehicle maintenance and repair 1 ............................. 247.635 247.536 248.390 249.231 1.5 2.0 1.6 2.6 1.8 2.1 Motor vehicle body work 1 ................................................ 255.416 255.156 255.375 255.500 1.7 .6 6.6 .1 1.1 3.3 Motor vehicle maintenance and servicing 1 ...................... 225.263 224.827 225.255 226.233 2.9 1.4 .9 1.7 2.1 1.3 Motor vehicle repair 1 3 .................................................... 152.354 152.476 153.224 153.684 .5 2.6 1.7 3.5 1.6 2.6
Motor vehicle insurance ..................................................... 374.678 376.651 377.312 378.577 5.2 6.8 4.3 4.2 6.0 4.3 Motor vehicle fees 1 3 ......................................................... 165.526 165.917 165.838 165.818 9.0 3.2 1.0 .7 6.0 .9 State motor vehicle registration and license fees 1 3 6 ..... 165.024 165.326 165.223 164.969 13.7 4.2 .5 -.1 8.9 .2 Parking and other fees 1 3 ................................................ 166.561 167.119 167.076 167.453 1.1 1.4 1.9 2.2 1.2 2.0 Parking fees and tolls 1 2 3 ............................................. 178.100 178.911 178.821 179.258 1.5 1.1 1.7 2.6 1.3 2.1 Automobile service clubs 1 2 3 ........................................ 120.778 120.815 120.848 120.875 -2.6 2.7 3.2 .3 .0 1.7
Public transportation ............................................................. 252.626 250.567 250.191 251.529 19.0 -5.5 11.2 -1.7 6.0 4.5 Airline fare .......................................................................... 280.065 276.677 276.269 276.791 30.2 -10.9 14.3 -4.6 7.7 4.4 Other intercity transportation .............................................. 152.568 151.068 149.718 153.185 4.5 13.5 -.9 1.6 8.9 .3
See footnotes at end of table.
18 CPI Detailed Report-September 2010
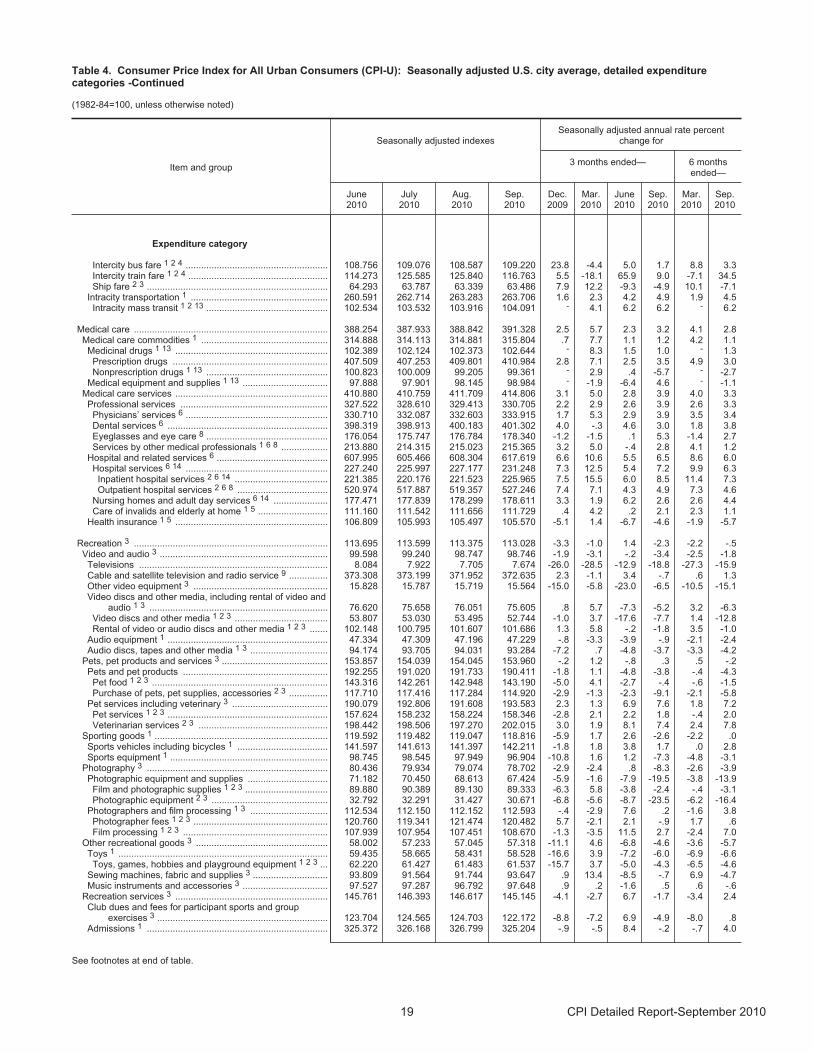
Table 4. Consumer Price Index for All Urban Consumers (CPI-U): Seasonally adjusted U.S. city average, detailed expenditurecategories -Continued
(1982-84=100, unless otherwise noted)
Item and group
Seasonally adjusted indexesSeasonally adjusted annual rate percent
change for
3 months ended— 6 monthsended—
June2010
July2010
Aug.2010
Sep.2010
Dec.2009
Mar.2010
June2010
Sep.2010
Mar.2010
Sep.2010
Expenditure category
Intercity bus fare 1 2 4 ....................................................... 108.756 109.076 108.587 109.220 23.8 -4.4 5.0 1.7 8.8 3.3 Intercity train fare 1 2 4 ...................................................... 114.273 125.585 125.840 116.763 5.5 -18.1 65.9 9.0 -7.1 34.5 Ship fare 2 3 ...................................................................... 64.293 63.787 63.339 63.486 7.9 12.2 -9.3 -4.9 10.1 -7.1
Intracity transportation 1 ..................................................... 260.591 262.714 263.283 263.706 1.6 2.3 4.2 4.9 1.9 4.5 Intracity mass transit 1 2 13 ............................................... 102.534 103.532 103.916 104.091 - 4.1 6.2 6.2 - 6.2
Medical care ........................................................................... 388.254 387.933 388.842 391.328 2.5 5.7 2.3 3.2 4.1 2.8 Medical care commodities 1 ................................................. 314.888 314.113 314.881 315.804 .7 7.7 1.1 1.2 4.2 1.1 Medicinal drugs 1 13 ........................................................... 102.389 102.124 102.373 102.644 - 8.3 1.5 1.0 - 1.3 Prescription drugs ............................................................ 407.509 407.253 409.801 410.984 2.8 7.1 2.5 3.5 4.9 3.0 Nonprescription drugs 1 13 ............................................... 100.823 100.009 99.205 99.361 - 2.9 .4 -5.7 - -2.7
Medical equipment and supplies 1 13 ................................. 97.888 97.901 98.145 98.984 - -1.9 -6.4 4.6 - -1.1 Medical care services ........................................................... 410.880 410.759 411.709 414.806 3.1 5.0 2.8 3.9 4.0 3.3
Professional services ......................................................... 327.522 328.610 329.413 330.705 2.2 2.9 2.6 3.9 2.6 3.3 Physicians’ services 6 ....................................................... 330.710 332.087 332.603 333.915 1.7 5.3 2.9 3.9 3.5 3.4 Dental services 6 .............................................................. 398.319 398.913 400.183 401.302 4.0 -.3 4.6 3.0 1.8 3.8 Eyeglasses and eye care 8 ............................................... 176.054 175.747 176.784 178.340 -1.2 -1.5 .1 5.3 -1.4 2.7 Services by other medical professionals 1 6 8 .................. 213.880 214.315 215.023 215.365 3.2 5.0 -.4 2.8 4.1 1.2
Hospital and related services 6 ........................................... 607.995 605.466 608.304 617.619 6.6 10.6 5.5 6.5 8.6 6.0 Hospital services 6 14 ....................................................... 227.240 225.997 227.177 231.248 7.3 12.5 5.4 7.2 9.9 6.3 Inpatient hospital services 2 6 14 .................................... 221.385 220.176 221.523 225.965 7.5 15.5 6.0 8.5 11.4 7.3 Outpatient hospital services 2 6 8 ................................... 520.974 517.887 519.357 527.246 7.4 7.1 4.3 4.9 7.3 4.6
Nursing homes and adult day services 6 14 ..................... 177.471 177.839 178.299 178.611 3.3 1.9 6.2 2.6 2.6 4.4 Care of invalids and elderly at home 1 5 ........................... 111.160 111.542 111.656 111.729 .4 4.2 .2 2.1 2.3 1.1
Health insurance 1 5 ........................................................... 106.809 105.993 105.497 105.570 -5.1 1.4 -6.7 -4.6 -1.9 -5.7
Recreation 3 ........................................................................... 113.695 113.599 113.375 113.028 -3.3 -1.0 1.4 -2.3 -2.2 -.5 Video and audio 3 ................................................................. 99.598 99.240 98.747 98.746 -1.9 -3.1 -.2 -3.4 -2.5 -1.8 Televisions ......................................................................... 8.084 7.922 7.705 7.674 -26.0 -28.5 -12.9 -18.8 -27.3 -15.9 Cable and satellite television and radio service 9 ............... 373.308 373.199 371.952 372.635 2.3 -1.1 3.4 -.7 .6 1.3 Other video equipment 3 .................................................... 15.828 15.787 15.719 15.564 -15.0 -5.8 -23.0 -6.5 -10.5 -15.1 Video discs and other media, including rental of video and
audio 1 3 ..................................................................... 76.620 75.658 76.051 75.605 .8 5.7 -7.3 -5.2 3.2 -6.3 Video discs and other media 1 2 3 .................................... 53.807 53.030 53.495 52.744 -1.0 3.7 -17.6 -7.7 1.4 -12.8 Rental of video or audio discs and other media 1 2 3 ....... 102.148 100.795 101.607 101.686 1.3 5.8 -.2 -1.8 3.5 -1.0
Audio equipment 1 .............................................................. 47.334 47.309 47.196 47.229 -.8 -3.3 -3.9 -.9 -2.1 -2.4 Audio discs, tapes and other media 1 3 .............................. 94.174 93.705 94.031 93.284 -7.2 .7 -4.8 -3.7 -3.3 -4.2
Pets, pet products and services 3 ......................................... 153.857 154.039 154.045 153.960 -.2 1.2 -.8 .3 .5 -.2 Pets and pet products ........................................................ 192.255 191.020 191.733 190.411 -1.8 1.1 -4.8 -3.8 -.4 -4.3
Pet food 1 2 3 .................................................................... 143.316 142.261 142.948 143.190 -5.0 4.1 -2.7 -.4 -.6 -1.5 Purchase of pets, pet supplies, accessories 2 3 ............... 117.710 117.416 117.284 114.920 -2.9 -1.3 -2.3 -9.1 -2.1 -5.8
Pet services including veterinary 3 ..................................... 190.079 192.806 191.608 193.583 2.3 1.3 6.9 7.6 1.8 7.2 Pet services 1 2 3 .............................................................. 157.624 158.232 158.224 158.346 -2.8 2.1 2.2 1.8 -.4 2.0 Veterinarian services 2 3 .................................................. 198.442 198.506 197.270 202.015 3.0 1.9 8.1 7.4 2.4 7.8
Sporting goods 1 ................................................................... 119.592 119.482 119.047 118.816 -5.9 1.7 2.6 -2.6 -2.2 .0 Sports vehicles including bicycles 1 ................................... 141.597 141.613 141.397 142.211 -1.8 1.8 3.8 1.7 .0 2.8 Sports equipment 1 ............................................................. 98.745 98.545 97.949 96.904 -10.8 1.6 1.2 -7.3 -4.8 -3.1
Photography 3 ...................................................................... 80.436 79.934 79.074 78.702 -2.9 -2.4 .8 -8.3 -2.6 -3.9 Photographic equipment and supplies ............................... 71.182 70.450 68.613 67.424 -5.9 -1.6 -7.9 -19.5 -3.8 -13.9
Film and photographic supplies 1 2 3 ................................ 89.880 90.389 89.130 89.333 -6.3 5.8 -3.8 -2.4 -.4 -3.1 Photographic equipment 2 3 ............................................. 32.792 32.291 31.427 30.671 -6.8 -5.6 -8.7 -23.5 -6.2 -16.4
Photographers and film processing 1 3 .............................. 112.534 112.150 112.152 112.593 -.4 -2.9 7.6 .2 -1.6 3.8 Photographer fees 1 2 3 .................................................... 120.760 119.341 121.474 120.482 5.7 -2.1 2.1 -.9 1.7 .6 Film processing 1 2 3 ........................................................ 107.939 107.954 107.451 108.670 -1.3 -3.5 11.5 2.7 -2.4 7.0
Other recreational goods 3 ................................................... 58.002 57.233 57.045 57.318 -11.1 4.6 -6.8 -4.6 -3.6 -5.7 Toys 1 ................................................................................. 59.435 58.665 58.431 58.528 -16.6 3.9 -7.2 -6.0 -6.9 -6.6 Toys, games, hobbies and playground equipment 1 2 3 ... 62.220 61.427 61.483 61.537 -15.7 3.7 -5.0 -4.3 -6.5 -4.6
Sewing machines, fabric and supplies 3 ............................. 93.809 91.564 91.744 93.647 .9 13.4 -8.5 -.7 6.9 -4.7 Music instruments and accessories 3 ................................. 97.527 97.287 96.792 97.648 .9 .2 -1.6 .5 .6 -.6
Recreation services 3 ........................................................... 145.761 146.393 146.617 145.145 -4.1 -2.7 6.7 -1.7 -3.4 2.4 Club dues and fees for participant sports and group
exercises 3 .................................................................. 123.704 124.565 124.703 122.172 -8.8 -7.2 6.9 -4.9 -8.0 .8 Admissions 1 ...................................................................... 325.372 326.168 326.799 325.204 -.9 -.5 8.4 -.2 -.7 4.0
See footnotes at end of table.
19 CPI Detailed Report-September 2010
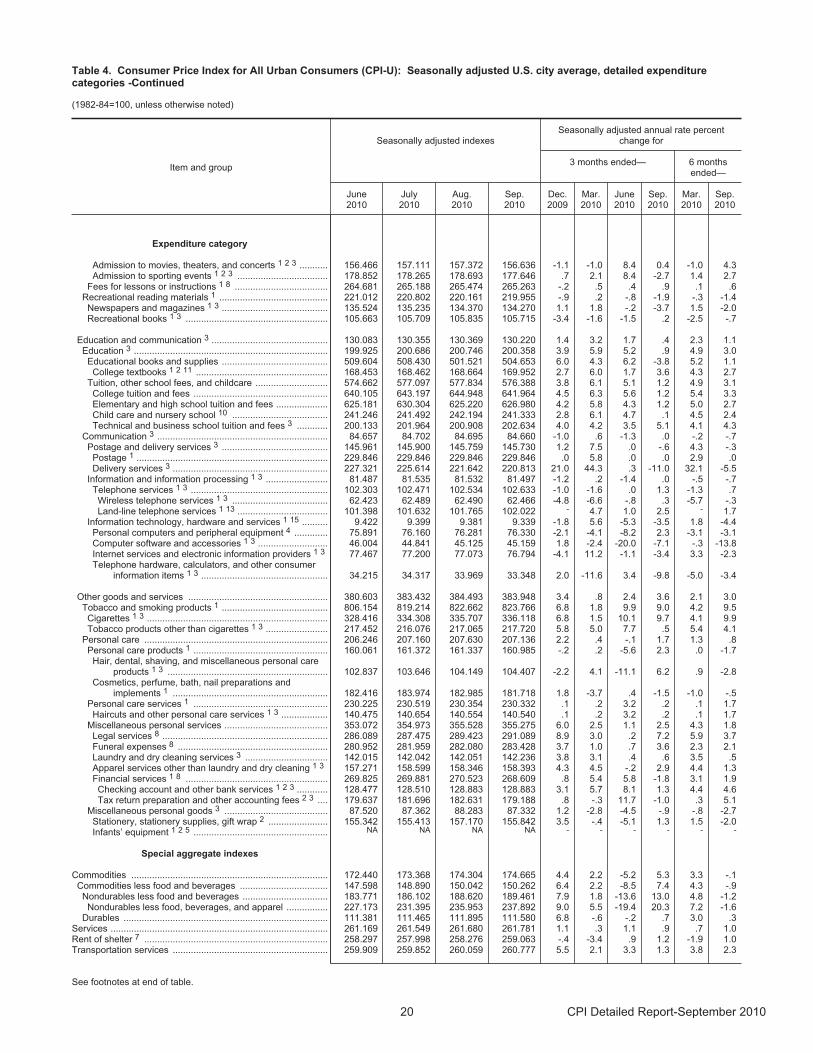
Table 4. Consumer Price Index for All Urban Consumers (CPI-U): Seasonally adjusted U.S. city average, detailed expenditurecategories -Continued
(1982-84=100, unless otherwise noted)
Item and group
Seasonally adjusted indexesSeasonally adjusted annual rate percent
change for
3 months ended— 6 monthsended—
June2010
July2010
Aug.2010
Sep.2010
Dec.2009
Mar.2010
June2010
Sep.2010
Mar.2010
Sep.2010
Expenditure category
Admission to movies, theaters, and concerts 1 2 3 ........... 156.466 157.111 157.372 156.636 -1.1 -1.0 8.4 0.4 -1.0 4.3 Admission to sporting events 1 2 3 ................................... 178.852 178.265 178.693 177.646 .7 2.1 8.4 -2.7 1.4 2.7
Fees for lessons or instructions 1 8 .................................... 264.681 265.188 265.474 265.263 -.2 .5 .4 .9 .1 .6 Recreational reading materials 1 .......................................... 221.012 220.802 220.161 219.955 -.9 .2 -.8 -1.9 -.3 -1.4 Newspapers and magazines 1 3 ......................................... 135.524 135.235 134.370 134.270 1.1 1.8 -.2 -3.7 1.5 -2.0 Recreational books 1 3 ....................................................... 105.663 105.709 105.835 105.715 -3.4 -1.6 -1.5 .2 -2.5 -.7
Education and communication 3 ............................................. 130.083 130.355 130.369 130.220 1.4 3.2 1.7 .4 2.3 1.1 Education 3 ........................................................................... 199.925 200.686 200.746 200.358 3.9 5.9 5.2 .9 4.9 3.0
Educational books and supplies ......................................... 509.604 508.430 501.521 504.653 6.0 4.3 6.2 -3.8 5.2 1.1 College textbooks 1 2 11 ................................................... 168.453 168.462 168.664 169.952 2.7 6.0 1.7 3.6 4.3 2.7
Tuition, other school fees, and childcare ............................ 574.662 577.097 577.834 576.388 3.8 6.1 5.1 1.2 4.9 3.1 College tuition and fees .................................................... 640.105 643.197 644.948 641.964 4.5 6.3 5.6 1.2 5.4 3.3 Elementary and high school tuition and fees .................... 625.181 630.304 625.220 626.980 4.2 5.8 4.3 1.2 5.0 2.7 Child care and nursery school 10 ..................................... 241.246 241.492 242.194 241.333 2.8 6.1 4.7 .1 4.5 2.4 Technical and business school tuition and fees 3 ............ 200.133 201.964 200.908 202.634 4.0 4.2 3.5 5.1 4.1 4.3
Communication 3 .................................................................. 84.657 84.702 84.695 84.660 -1.0 .6 -1.3 .0 -.2 -.7 Postage and delivery services 3 ......................................... 145.961 145.900 145.759 145.730 1.2 7.5 .0 -.6 4.3 -.3 Postage 1 .......................................................................... 229.846 229.846 229.846 229.846 .0 5.8 .0 .0 2.9 .0 Delivery services 3 ............................................................ 227.321 225.614 221.642 220.813 21.0 44.3 .3 -11.0 32.1 -5.5
Information and information processing 1 3 ........................ 81.487 81.535 81.532 81.497 -1.2 .2 -1.4 .0 -.5 -.7 Telephone services 1 3 ..................................................... 102.303 102.471 102.534 102.633 -1.0 -1.6 .0 1.3 -1.3 .7 Wireless telephone services 1 3 ..................................... 62.423 62.489 62.490 62.466 -4.8 -6.6 -.8 .3 -5.7 -.3 Land-line telephone services 1 13 ................................... 101.398 101.632 101.765 102.022 - 4.7 1.0 2.5 - 1.7
Information technology, hardware and services 1 15 .......... 9.422 9.399 9.381 9.339 -1.8 5.6 -5.3 -3.5 1.8 -4.4 Personal computers and peripheral equipment 4 ............. 75.891 76.160 76.281 76.330 -2.1 -4.1 -8.2 2.3 -3.1 -3.1 Computer software and accessories 1 3 ........................... 46.004 44.841 45.125 45.159 1.8 -2.4 -20.0 -7.1 -.3 -13.8 Internet services and electronic information providers 1 3 77.467 77.200 77.073 76.794 -4.1 11.2 -1.1 -3.4 3.3 -2.3 Telephone hardware, calculators, and other consumer
information items 1 3 ................................................. 34.215 34.317 33.969 33.348 2.0 -11.6 3.4 -9.8 -5.0 -3.4
Other goods and services ...................................................... 380.603 383.432 384.493 383.948 3.4 .8 2.4 3.6 2.1 3.0 Tobacco and smoking products 1 ......................................... 806.154 819.214 822.662 823.766 6.8 1.8 9.9 9.0 4.2 9.5 Cigarettes 1 3 ...................................................................... 328.416 334.308 335.707 336.118 6.8 1.5 10.1 9.7 4.1 9.9 Tobacco products other than cigarettes 1 3 ........................ 217.452 216.076 217.065 217.720 5.8 5.0 7.7 .5 5.4 4.1
Personal care ....................................................................... 206.246 207.160 207.630 207.136 2.2 .4 -.1 1.7 1.3 .8 Personal care products 1 .................................................... 160.061 161.372 161.337 160.985 -.2 .2 -5.6 2.3 .0 -1.7 Hair, dental, shaving, and miscellaneous personal care
products 1 3 .............................................................. 102.837 103.646 104.149 104.407 -2.2 4.1 -11.1 6.2 .9 -2.8 Cosmetics, perfume, bath, nail preparations and
implements 1 ............................................................ 182.416 183.974 182.985 181.718 1.8 -3.7 .4 -1.5 -1.0 -.5 Personal care services 1 .................................................... 230.225 230.519 230.354 230.332 .1 .2 3.2 .2 .1 1.7
Haircuts and other personal care services 1 3 .................. 140.475 140.654 140.554 140.540 .1 .2 3.2 .2 .1 1.7 Miscellaneous personal services ........................................ 353.072 354.973 355.528 355.275 6.0 2.5 1.1 2.5 4.3 1.8
Legal services 8 ................................................................ 286.089 287.475 289.423 291.089 8.9 3.0 .2 7.2 5.9 3.7 Funeral expenses 8 .......................................................... 280.952 281.959 282.080 283.428 3.7 1.0 .7 3.6 2.3 2.1 Laundry and dry cleaning services 3 ................................ 142.015 142.042 142.051 142.236 3.8 3.1 .4 .6 3.5 .5 Apparel services other than laundry and dry cleaning 1 3 157.271 158.599 158.346 158.393 4.3 4.5 -.2 2.9 4.4 1.3 Financial services 1 8 ....................................................... 269.825 269.881 270.523 268.609 .8 5.4 5.8 -1.8 3.1 1.9 Checking account and other bank services 1 2 3 ............ 128.477 128.510 128.883 128.883 3.1 5.7 8.1 1.3 4.4 4.6 Tax return preparation and other accounting fees 2 3 .... 179.637 181.696 182.631 179.188 .8 -.3 11.7 -1.0 .3 5.1
Miscellaneous personal goods 3 ........................................ 87.520 87.362 88.283 87.332 1.2 -2.8 -4.5 -.9 -.8 -2.7 Stationery, stationery supplies, gift wrap 2 ....................... 155.342 155.413 157.170 155.842 3.5 -.4 -5.1 1.3 1.5 -2.0 Infants’ equipment 1 2 5 .................................................... NA NA NA NA - - - - - -
Special aggregate indexes
Commodities ............................................................................ 172.440 173.368 174.304 174.665 4.4 2.2 -5.2 5.3 3.3 -.1 Commodities less food and beverages .................................. 147.598 148.890 150.042 150.262 6.4 2.2 -8.5 7.4 4.3 -.9
Nondurables less food and beverages ................................. 183.771 186.102 188.620 189.461 7.9 1.8 -13.6 13.0 4.8 -1.2 Nondurables less food, beverages, and apparel ................ 227.173 231.395 235.953 237.892 9.0 5.5 -19.4 20.3 7.2 -1.6
Durables ............................................................................... 111.381 111.465 111.895 111.580 6.8 -.6 -.2 .7 3.0 .3 Services .................................................................................... 261.169 261.549 261.680 261.781 1.1 .3 1.1 .9 .7 1.0 Rent of shelter 7 ....................................................................... 258.297 257.998 258.276 259.063 -.4 -3.4 .9 1.2 -1.9 1.0Transportation services ............................................................ 259.909 259.852 260.059 260.777 5.5 2.1 3.3 1.3 3.8 2.3
See footnotes at end of table.
20 CPI Detailed Report-September 2010
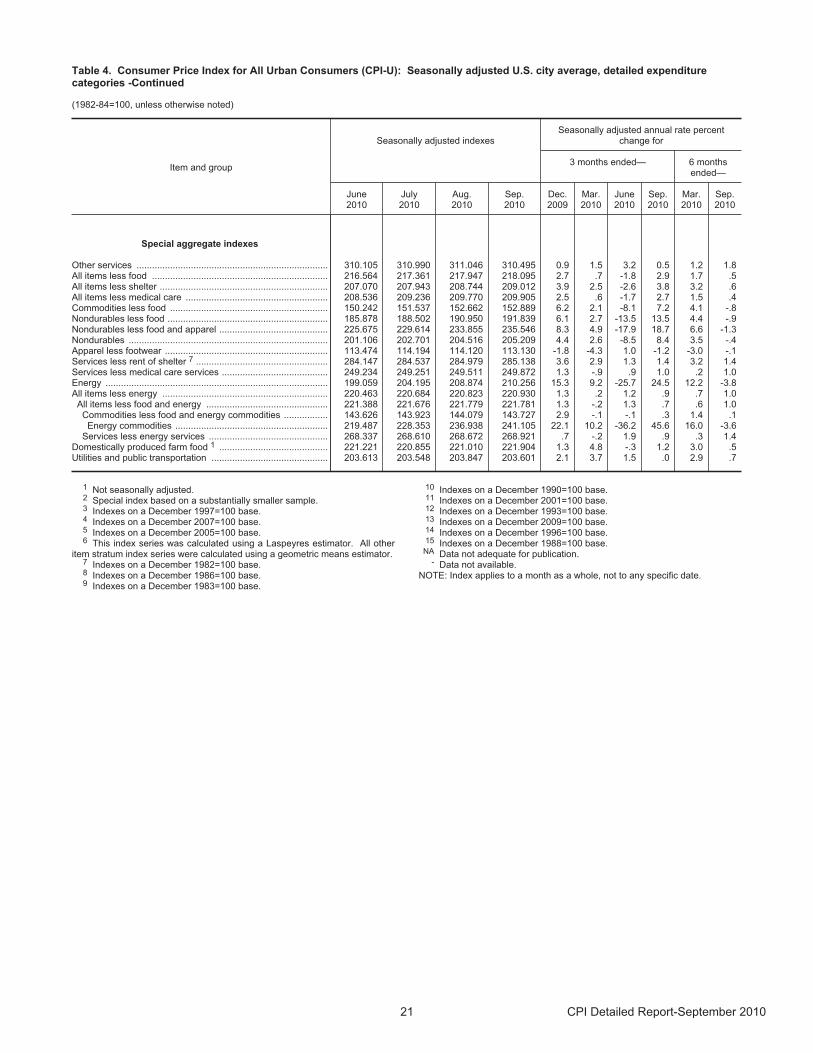
Table 4. Consumer Price Index for All Urban Consumers (CPI-U): Seasonally adjusted U.S. city average, detailed expenditurecategories -Continued
(1982-84=100, unless otherwise noted)
Item and group
Seasonally adjusted indexesSeasonally adjusted annual rate percent
change for
3 months ended— 6 monthsended—
June2010
July2010
Aug.2010
Sep.2010
Dec.2009
Mar.2010
June2010
Sep.2010
Mar.2010
Sep.2010
Special aggregate indexes
Other services .......................................................................... 310.105 310.990 311.046 310.495 0.9 1.5 3.2 0.5 1.2 1.8 All items less food .................................................................... 216.564 217.361 217.947 218.095 2.7 .7 -1.8 2.9 1.7 .5 All items less shelter ................................................................. 207.070 207.943 208.744 209.012 3.9 2.5 -2.6 3.8 3.2 .6 All items less medical care ....................................................... 208.536 209.236 209.770 209.905 2.5 .6 -1.7 2.7 1.5 .4 Commodities less food ............................................................. 150.242 151.537 152.662 152.889 6.2 2.1 -8.1 7.2 4.1 -.8 Nondurables less food .............................................................. 185.878 188.502 190.950 191.839 6.1 2.7 -13.5 13.5 4.4 -.9 Nondurables less food and apparel .......................................... 225.675 229.614 233.855 235.546 8.3 4.9 -17.9 18.7 6.6 -1.3 Nondurables ............................................................................. 201.106 202.701 204.516 205.209 4.4 2.6 -8.5 8.4 3.5 -.4 Apparel less footwear ............................................................... 113.474 114.194 114.120 113.130 -1.8 -4.3 1.0 -1.2 -3.0 -.1 Services less rent of shelter 7 ................................................... 284.147 284.537 284.979 285.138 3.6 2.9 1.3 1.4 3.2 1.4 Services less medical care services ......................................... 249.234 249.251 249.511 249.872 1.3 -.9 .9 1.0 .2 1.0 Energy ...................................................................................... 199.059 204.195 208.874 210.256 15.3 9.2 -25.7 24.5 12.2 -3.8 All items less energy ................................................................ 220.463 220.684 220.823 220.930 1.3 .2 1.2 .9 .7 1.0
All items less food and energy ............................................... 221.388 221.676 221.779 221.781 1.3 -.2 1.3 .7 .6 1.0 Commodities less food and energy commodities ................. 143.626 143.923 144.079 143.727 2.9 -.1 -.1 .3 1.4 .1 Energy commodities ........................................................... 219.487 228.353 236.938 241.105 22.1 10.2 -36.2 45.6 16.0 -3.6
Services less energy services .............................................. 268.337 268.610 268.672 268.921 .7 -.2 1.9 .9 .3 1.4 Domestically produced farm food 1 .......................................... 221.221 220.855 221.010 221.904 1.3 4.8 -.3 1.2 3.0 .5 Utilities and public transportation ............................................. 203.613 203.548 203.847 203.601 2.1 3.7 1.5 .0 2.9 .7
1 Not seasonally adjusted.2 Special index based on a substantially smaller sample.3 Indexes on a December 1997=100 base.4 Indexes on a December 2007=100 base.5 Indexes on a December 2005=100 base.6 This index series was calculated using a Laspeyres estimator. All other
item stratum index series were calculated using a geometric means estimator.7 Indexes on a December 1982=100 base.8 Indexes on a December 1986=100 base.9 Indexes on a December 1983=100 base.
10 Indexes on a December 1990=100 base.11 Indexes on a December 2001=100 base.12 Indexes on a December 1993=100 base.13 Indexes on a December 2009=100 base.14 Indexes on a December 1996=100 base.15 Indexes on a December 1988=100 base.
NA Data not adequate for publication.- Data not available.
NOTE: Index applies to a month as a whole, not to any specific date.
21 CPI Detailed Report-September 2010
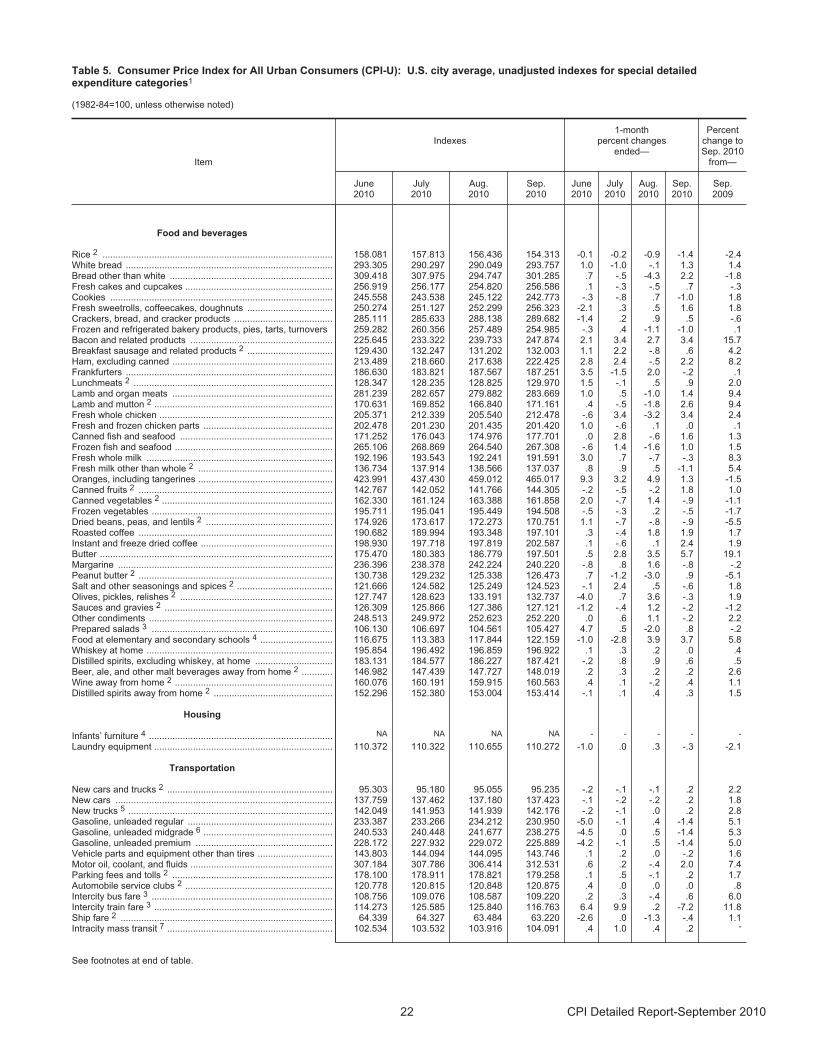
Table 5. Consumer Price Index for All Urban Consumers (CPI-U): U.S. city average, unadjusted indexes for special detailedexpenditure categories1
(1982-84=100, unless otherwise noted)
Item
Indexes1-month
percent changesended—
Percentchange toSep. 2010
from—
June2010
July2010
Aug.2010
Sep.2010
June2010
July2010
Aug.2010
Sep.2010
Sep.2009
Food and beverages
Rice 2 ......................................................................................... 158.081 157.813 156.436 154.313 -0.1 -0.2 -0.9 -1.4 -2.4 White bread ................................................................................ 293.305 290.297 290.049 293.757 1.0 -1.0 -.1 1.3 1.4 Bread other than white ............................................................... 309.418 307.975 294.747 301.285 .7 -.5 -4.3 2.2 -1.8 Fresh cakes and cupcakes ......................................................... 256.919 256.177 254.820 256.586 .1 -.3 -.5 .7 -.3 Cookies ...................................................................................... 245.558 243.538 245.122 242.773 -.3 -.8 .7 -1.0 1.8 Fresh sweetrolls, coffeecakes, doughnuts ................................. 250.274 251.127 252.299 256.323 -2.1 .3 .5 1.6 1.8 Crackers, bread, and cracker products ...................................... 285.111 285.633 288.138 289.682 -1.4 .2 .9 .5 -.6 Frozen and refrigerated bakery products, pies, tarts, turnovers 259.282 260.356 257.489 254.985 -.3 .4 -1.1 -1.0 .1 Bacon and related products ....................................................... 225.645 233.322 239.733 247.874 2.1 3.4 2.7 3.4 15.7 Breakfast sausage and related products 2 ................................. 129.430 132.247 131.202 132.003 1.1 2.2 -.8 .6 4.2 Ham, excluding canned .............................................................. 213.489 218.660 217.638 222.425 2.8 2.4 -.5 2.2 8.2 Frankfurters ................................................................................ 186.630 183.821 187.567 187.251 3.5 -1.5 2.0 -.2 .1 Lunchmeats 2 ............................................................................. 128.347 128.235 128.825 129.970 1.5 -.1 .5 .9 2.0 Lamb and organ meats .............................................................. 281.239 282.657 279.882 283.669 1.0 .5 -1.0 1.4 9.4 Lamb and mutton 2 ..................................................................... 170.631 169.852 166.840 171.161 .4 -.5 -1.8 2.6 9.4 Fresh whole chicken ................................................................... 205.371 212.339 205.540 212.478 -.6 3.4 -3.2 3.4 2.4 Fresh and frozen chicken parts .................................................. 202.478 201.230 201.435 201.420 1.0 -.6 .1 .0 .1 Canned fish and seafood ........................................................... 171.252 176.043 174.976 177.701 .0 2.8 -.6 1.6 1.3 Frozen fish and seafood ............................................................. 265.106 268.869 264.540 267.308 -.6 1.4 -1.6 1.0 1.5 Fresh whole milk ........................................................................ 192.196 193.543 192.241 191.591 3.0 .7 -.7 -.3 8.3 Fresh milk other than whole 2 .................................................... 136.734 137.914 138.566 137.037 .8 .9 .5 -1.1 5.4 Oranges, including tangerines .................................................... 423.991 437.430 459.012 465.017 9.3 3.2 4.9 1.3 -1.5 Canned fruits 2 ........................................................................... 142.767 142.052 141.766 144.305 -.2 -.5 -.2 1.8 1.0 Canned vegetables 2 .................................................................. 162.330 161.124 163.388 161.858 2.0 -.7 1.4 -.9 -1.1 Frozen vegetables ...................................................................... 195.711 195.041 195.449 194.508 -.5 -.3 .2 -.5 -1.7 Dried beans, peas, and lentils 2 ................................................. 174.926 173.617 172.273 170.751 1.1 -.7 -.8 -.9 -5.5 Roasted coffee ........................................................................... 190.682 189.994 193.348 197.101 .3 -.4 1.8 1.9 1.7 Instant and freeze dried coffee ................................................... 198.930 197.718 197.819 202.587 .1 -.6 .1 2.4 1.9 Butter .......................................................................................... 175.470 180.383 186.779 197.501 .5 2.8 3.5 5.7 19.1 Margarine ................................................................................... 236.396 238.378 242.224 240.220 -.8 .8 1.6 -.8 -.2 Peanut butter 2 ........................................................................... 130.738 129.232 125.338 126.473 .7 -1.2 -3.0 .9 -5.1Salt and other seasonings and spices 2 ..................................... 121.666 124.582 125.249 124.523 -.1 2.4 .5 -.6 1.8 Olives, pickles, relishes 2 ........................................................... 127.747 128.623 133.191 132.737 -4.0 .7 3.6 -.3 1.9 Sauces and gravies 2 ................................................................. 126.309 125.866 127.386 127.121 -1.2 -.4 1.2 -.2 -1.2 Other condiments ....................................................................... 248.513 249.972 252.623 252.220 .0 .6 1.1 -.2 2.2 Prepared salads 3 ...................................................................... 106.130 106.697 104.561 105.427 4.7 .5 -2.0 .8 -.2 Food at elementary and secondary schools 4 ............................ 116.675 113.383 117.844 122.159 -1.0 -2.8 3.9 3.7 5.8 Whiskey at home ........................................................................ 195.854 196.492 196.859 196.922 .1 .3 .2 .0 .4 Distilled spirits, excluding whiskey, at home .............................. 183.131 184.577 186.227 187.421 -.2 .8 .9 .6 .5 Beer, ale, and other malt beverages away from home 2 ............ 146.982 147.439 147.727 148.019 .2 .3 .2 .2 2.6 Wine away from home 2 ............................................................. 160.076 160.191 159.915 160.563 .4 .1 -.2 .4 1.1 Distilled spirits away from home 2 .............................................. 152.296 152.380 153.004 153.414 -.1 .1 .4 .3 1.5
Housing
Infants’ furniture 4 ....................................................................... NA NA NA NA - - - - -
Laundry equipment ..................................................................... 110.372 110.322 110.655 110.272 -1.0 .0 .3 -.3 -2.1
Transportation
New cars and trucks 2 ................................................................ 95.303 95.180 95.055 95.235 -.2 -.1 -.1 .2 2.2 New cars .................................................................................... 137.759 137.462 137.180 137.423 -.1 -.2 -.2 .2 1.8 New trucks 5 ............................................................................... 142.049 141.953 141.939 142.176 -.2 -.1 .0 .2 2.8Gasoline, unleaded regular ........................................................ 233.387 233.266 234.212 230.950 -5.0 -.1 .4 -1.4 5.1 Gasoline, unleaded midgrade 6 .................................................. 240.533 240.448 241.677 238.275 -4.5 .0 .5 -1.4 5.3 Gasoline, unleaded premium ..................................................... 228.172 227.932 229.072 225.889 -4.2 -.1 .5 -1.4 5.0 Vehicle parts and equipment other than tires ............................. 143.803 144.094 144.095 143.746 .1 .2 .0 -.2 1.6 Motor oil, coolant, and fluids ....................................................... 307.184 307.786 306.414 312.531 .6 .2 -.4 2.0 7.4 Parking fees and tolls 2 .............................................................. 178.100 178.911 178.821 179.258 .1 .5 -.1 .2 1.7 Automobile service clubs 2 ......................................................... 120.778 120.815 120.848 120.875 .4 .0 .0 .0 .8 Intercity bus fare 3 ...................................................................... 108.756 109.076 108.587 109.220 .2 .3 -.4 .6 6.0 Intercity train fare 3 ..................................................................... 114.273 125.585 125.840 116.763 6.4 9.9 .2 -7.2 11.8 Ship fare 2 .................................................................................. 64.339 64.327 63.484 63.220 -2.6 .0 -1.3 -.4 1.1Intracity mass transit 7 ................................................................ 102.534 103.532 103.916 104.091 .4 1.0 .4 .2 -
See footnotes at end of table.
22 CPI Detailed Report-September 2010
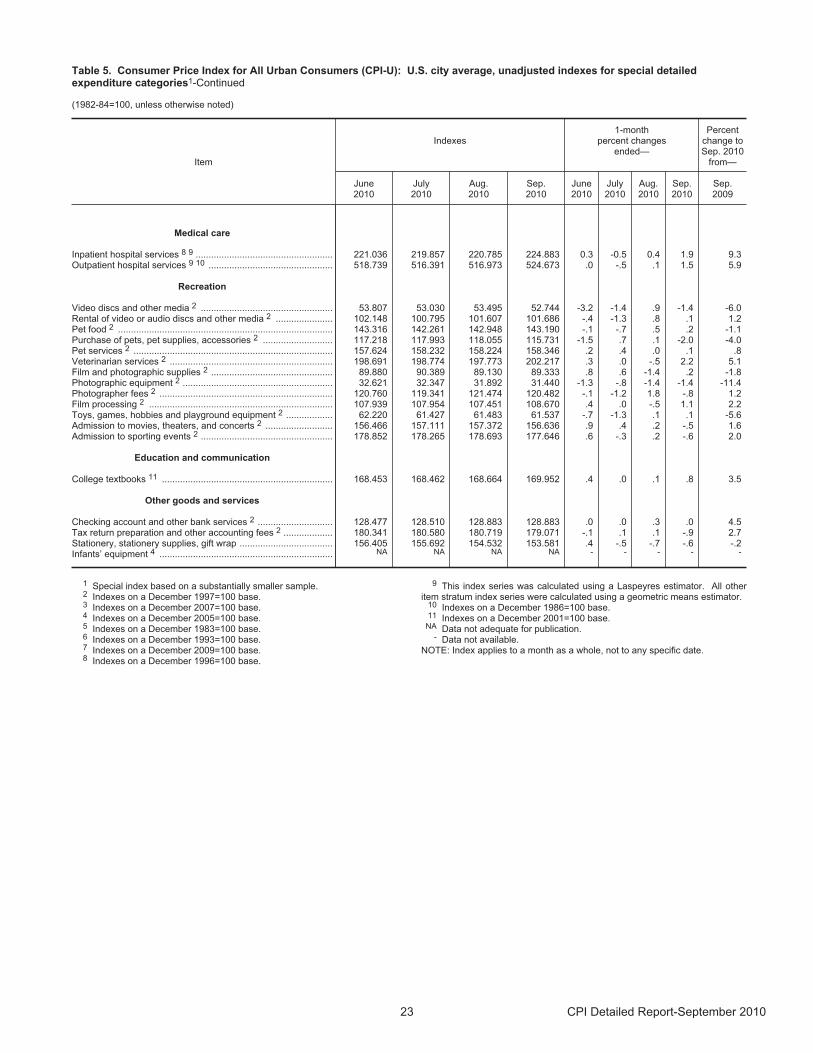
Table 5. Consumer Price Index for All Urban Consumers (CPI-U): U.S. city average, unadjusted indexes for special detailedexpenditure categories1-Continued
(1982-84=100, unless otherwise noted)
Item
Indexes1-month
percent changesended—
Percentchange toSep. 2010
from—
June2010
July2010
Aug.2010
Sep.2010
June2010
July2010
Aug.2010
Sep.2010
Sep.2009
Medical care
Inpatient hospital services 8 9 ..................................................... 221.036 219.857 220.785 224.883 0.3 -0.5 0.4 1.9 9.3 Outpatient hospital services 9 10 ................................................ 518.739 516.391 516.973 524.673 .0 -.5 .1 1.5 5.9
Recreation
Video discs and other media 2 ................................................... 53.807 53.030 53.495 52.744 -3.2 -1.4 .9 -1.4 -6.0 Rental of video or audio discs and other media 2 ...................... 102.148 100.795 101.607 101.686 -.4 -1.3 .8 .1 1.2 Pet food 2 ................................................................................... 143.316 142.261 142.948 143.190 -.1 -.7 .5 .2 -1.1 Purchase of pets, pet supplies, accessories 2 ........................... 117.218 117.993 118.055 115.731 -1.5 .7 .1 -2.0 -4.0 Pet services 2 ............................................................................. 157.624 158.232 158.224 158.346 .2 .4 .0 .1 .8 Veterinarian services 2 ............................................................... 198.691 198.774 197.773 202.217 .3 .0 -.5 2.2 5.1 Film and photographic supplies 2 ............................................... 89.880 90.389 89.130 89.333 .8 .6 -1.4 .2 -1.8 Photographic equipment 2 .......................................................... 32.621 32.347 31.892 31.440 -1.3 -.8 -1.4 -1.4 -11.4 Photographer fees 2 ................................................................... 120.760 119.341 121.474 120.482 -.1 -1.2 1.8 -.8 1.2 Film processing 2 ....................................................................... 107.939 107.954 107.451 108.670 .4 .0 -.5 1.1 2.2 Toys, games, hobbies and playground equipment 2 .................. 62.220 61.427 61.483 61.537 -.7 -1.3 .1 .1 -5.6 Admission to movies, theaters, and concerts 2 .......................... 156.466 157.111 157.372 156.636 .9 .4 .2 -.5 1.6 Admission to sporting events 2 ................................................... 178.852 178.265 178.693 177.646 .6 -.3 .2 -.6 2.0
Education and communication
College textbooks 11 .................................................................. 168.453 168.462 168.664 169.952 .4 .0 .1 .8 3.5
Other goods and services
Checking account and other bank services 2 ............................. 128.477 128.510 128.883 128.883 .0 .0 .3 .0 4.5 Tax return preparation and other accounting fees 2 ................... 180.341 180.580 180.719 179.071 -.1 .1 .1 -.9 2.7 Stationery, stationery supplies, gift wrap .................................... 156.405 155.692 154.532 153.581 .4 -.5 -.7 -.6 -.2 Infants’ equipment 4 ................................................................... NA NA NA NA - - - - -
1 Special index based on a substantially smaller sample.2 Indexes on a December 1997=100 base.3 Indexes on a December 2007=100 base.4 Indexes on a December 2005=100 base.5 Indexes on a December 1983=100 base.6 Indexes on a December 1993=100 base.7 Indexes on a December 2009=100 base.8 Indexes on a December 1996=100 base.
9 This index series was calculated using a Laspeyres estimator. All otheritem stratum index series were calculated using a geometric means estimator.
10 Indexes on a December 1986=100 base.11 Indexes on a December 2001=100 base.
NA Data not adequate for publication.- Data not available.
NOTE: Index applies to a month as a whole, not to any specific date.
23 CPI Detailed Report-September 2010
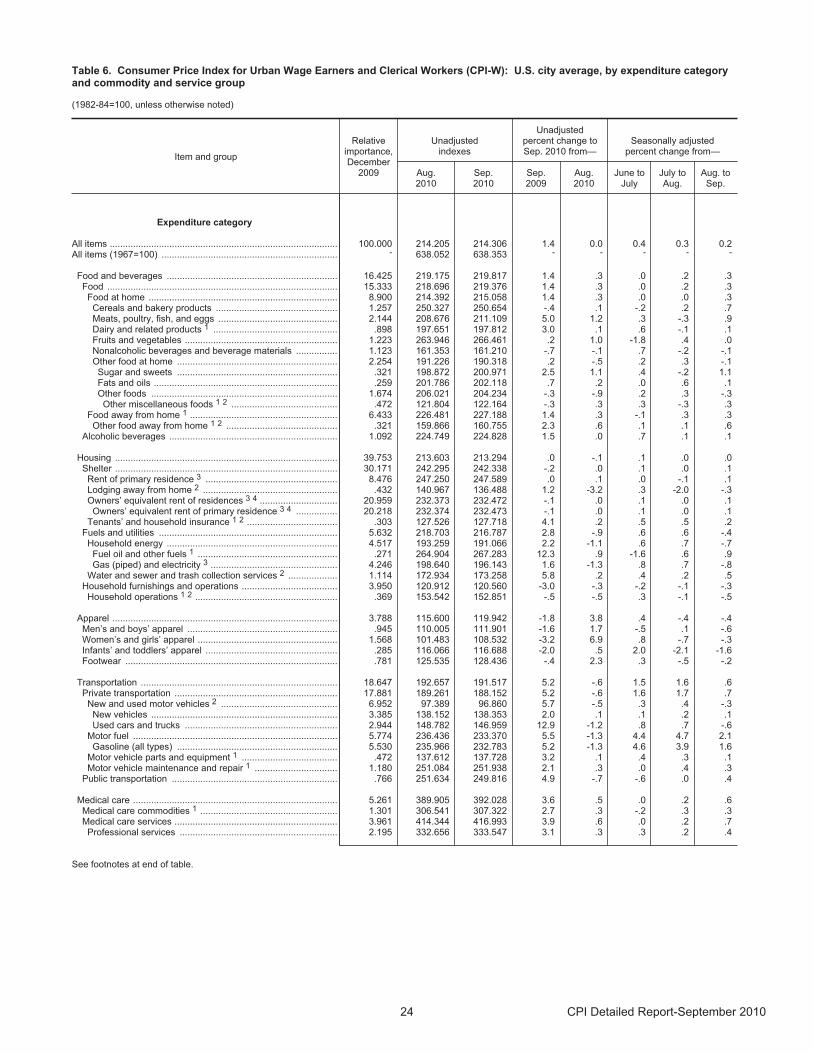
Table 6. Consumer Price Index for Urban Wage Earners and Clerical Workers (CPI-W): U.S. city average, by expenditure categoryand commodity and service group
(1982-84=100, unless otherwise noted)
Item and group
Relativeimportance,December
2009
Unadjustedindexes
Unadjustedpercent change toSep. 2010 from—
Seasonally adjustedpercent change from—
Aug.2010
Sep.2010
Sep.2009
Aug.2010
June toJuly
July toAug.
Aug. toSep.
Expenditure category
All items ........................................................................................ 100.000 214.205 214.306 1.4 0.0 0.4 0.3 0.2 All items (1967=100) .................................................................... - 638.052 638.353 - - - - -
Food and beverages .................................................................. 16.425 219.175 219.817 1.4 .3 .0 .2 .3 Food ......................................................................................... 15.333 218.696 219.376 1.4 .3 .0 .2 .3
Food at home ......................................................................... 8.900 214.392 215.058 1.4 .3 .0 .0 .3 Cereals and bakery products ............................................... 1.257 250.327 250.654 -.4 .1 -.2 .2 .7 Meats, poultry, fish, and eggs .............................................. 2.144 208.676 211.109 5.0 1.2 .3 -.3 .9 Dairy and related products 1 ................................................ .898 197.651 197.812 3.0 .1 .6 -.1 .1 Fruits and vegetables ........................................................... 1.223 263.946 266.461 .2 1.0 -1.8 .4 .0 Nonalcoholic beverages and beverage materials ................ 1.123 161.353 161.210 -.7 -.1 .7 -.2 -.1 Other food at home .............................................................. 2.254 191.226 190.318 .2 -.5 .2 .3 -.1 Sugar and sweets .............................................................. .321 198.872 200.971 2.5 1.1 .4 -.2 1.1 Fats and oils ....................................................................... .259 201.786 202.118 .7 .2 .0 .6 .1 Other foods ........................................................................ 1.674 206.021 204.234 -.3 -.9 .2 .3 -.3
Other miscellaneous foods 1 2 ......................................... .472 121.804 122.164 -.3 .3 .3 -.3 .3 Food away from home 1 ......................................................... 6.433 226.481 227.188 1.4 .3 -.1 .3 .3 Other food away from home 1 2 ........................................... .321 159.866 160.755 2.3 .6 .1 .1 .6
Alcoholic beverages ................................................................. 1.092 224.749 224.828 1.5 .0 .7 .1 .1
Housing ...................................................................................... 39.753 213.603 213.294 .0 -.1 .1 .0 .0 Shelter ...................................................................................... 30.171 242.295 242.338 -.2 .0 .1 .0 .1
Rent of primary residence 3 ................................................... 8.476 247.250 247.589 .0 .1 .0 -.1 .1 Lodging away from home 2 .................................................... .432 140.967 136.488 1.2 -3.2 .3 -2.0 -.3 Owners’ equivalent rent of residences 3 4 .............................. 20.959 232.373 232.472 -.1 .0 .1 .0 .1 Owners’ equivalent rent of primary residence 3 4 ................ 20.218 232.374 232.473 -.1 .0 .1 .0 .1
Tenants’ and household insurance 1 2 ................................... .303 127.526 127.718 4.1 .2 .5 .5 .2 Fuels and utilities ..................................................................... 5.632 218.703 216.787 2.8 -.9 .6 .6 -.4
Household energy .................................................................. 4.517 193.259 191.066 2.2 -1.1 .6 .7 -.7 Fuel oil and other fuels 1 ...................................................... .271 264.904 267.283 12.3 .9 -1.6 .6 .9 Gas (piped) and electricity 3 ................................................. 4.246 198.640 196.143 1.6 -1.3 .8 .7 -.8
Water and sewer and trash collection services 2 ................... 1.114 172.934 173.258 5.8 .2 .4 .2 .5 Household furnishings and operations ..................................... 3.950 120.912 120.560 -3.0 -.3 -.2 -.1 -.3
Household operations 1 2 ....................................................... .369 153.542 152.851 -.5 -.5 .3 -.1 -.5
Apparel ....................................................................................... 3.788 115.600 119.942 -1.8 3.8 .4 -.4 -.4 Men’s and boys’ apparel .......................................................... .945 110.005 111.901 -1.6 1.7 -.5 .1 -.6 Women’s and girls’ apparel ...................................................... 1.568 101.483 108.532 -3.2 6.9 .8 -.7 -.3 Infants’ and toddlers’ apparel ................................................... .285 116.066 116.688 -2.0 .5 2.0 -2.1 -1.6 Footwear .................................................................................. .781 125.535 128.436 -.4 2.3 .3 -.5 -.2
Transportation ............................................................................ 18.647 192.657 191.517 5.2 -.6 1.5 1.6 .6 Private transportation ............................................................... 17.881 189.261 188.152 5.2 -.6 1.6 1.7 .7
New and used motor vehicles 2 ............................................. 6.952 97.389 96.860 5.7 -.5 .3 .4 -.3 New vehicles ........................................................................ 3.385 138.152 138.353 2.0 .1 .1 .2 .1 Used cars and trucks ........................................................... 2.944 148.782 146.959 12.9 -1.2 .8 .7 -.6
Motor fuel ............................................................................... 5.774 236.436 233.370 5.5 -1.3 4.4 4.7 2.1 Gasoline (all types) .............................................................. 5.530 235.966 232.783 5.2 -1.3 4.6 3.9 1.6
Motor vehicle parts and equipment 1 ..................................... .472 137.612 137.728 3.2 .1 .4 .3 .1 Motor vehicle maintenance and repair 1 ................................ 1.180 251.084 251.938 2.1 .3 .0 .4 .3
Public transportation ................................................................ .766 251.634 249.816 4.9 -.7 -.6 .0 .4
Medical care ............................................................................... 5.261 389.905 392.028 3.6 .5 .0 .2 .6Medical care commodities 1 ..................................................... 1.301 306.541 307.322 2.7 .3 -.2 .3 .3 Medical care services ............................................................... 3.961 414.344 416.993 3.9 .6 .0 .2 .7
Professional services ............................................................. 2.195 332.656 333.547 3.1 .3 .3 .2 .4
See footnotes at end of table.
24 CPI Detailed Report-September 2010
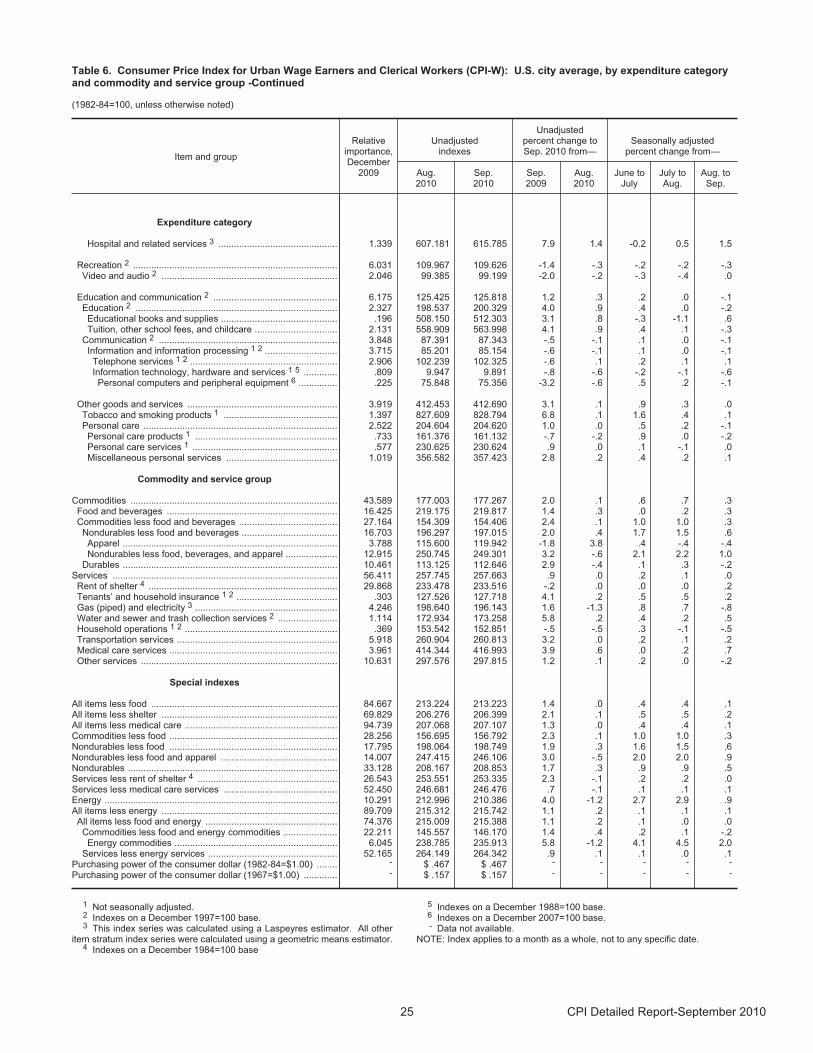
Table 6. Consumer Price Index for Urban Wage Earners and Clerical Workers (CPI-W): U.S. city average, by expenditure categoryand commodity and service group -Continued
(1982-84=100, unless otherwise noted)
Item and group
Relativeimportance,December
2009
Unadjustedindexes
Unadjustedpercent change toSep. 2010 from—
Seasonally adjustedpercent change from—
Aug.2010
Sep.2010
Sep.2009
Aug.2010
June toJuly
July toAug.
Aug. toSep.
Expenditure category
Hospital and related services 3 .............................................. 1.339 607.181 615.785 7.9 1.4 -0.2 0.5 1.5
Recreation 2 ............................................................................... 6.031 109.967 109.626 -1.4 -.3 -.2 -.2 -.3 Video and audio 2 .................................................................... 2.046 99.385 99.199 -2.0 -.2 -.3 -.4 .0
Education and communication 2 ................................................ 6.175 125.425 125.818 1.2 .3 .2 .0 -.1 Education 2 .............................................................................. 2.327 198.537 200.329 4.0 .9 .4 .0 -.2 Educational books and supplies ............................................. .196 508.150 512.303 3.1 .8 -.3 -1.1 .6 Tuition, other school fees, and childcare ................................ 2.131 558.909 563.998 4.1 .9 .4 .1 -.3
Communication 2 ..................................................................... 3.848 87.391 87.343 -.5 -.1 .1 .0 -.1 Information and information processing 1 2 ............................ 3.715 85.201 85.154 -.6 -.1 .1 .0 -.1 Telephone services 1 2 ......................................................... 2.906 102.239 102.325 -.6 .1 .2 .1 .1 Information technology, hardware and services 1 5 ............. .809 9.947 9.891 -.8 -.6 -.2 -.1 -.6 Personal computers and peripheral equipment 6 ............... .225 75.848 75.356 -3.2 -.6 .5 .2 -.1
Other goods and services .......................................................... 3.919 412.453 412.690 3.1 .1 .9 .3 .0 Tobacco and smoking products 1 ............................................ 1.397 827.609 828.794 6.8 .1 1.6 .4 .1 Personal care ........................................................................... 2.522 204.604 204.620 1.0 .0 .5 .2 -.1
Personal care products 1 ....................................................... .733 161.376 161.132 -.7 -.2 .9 .0 -.2 Personal care services 1 ........................................................ .577 230.625 230.624 .9 .0 .1 -.1 .0 Miscellaneous personal services ........................................... 1.019 356.582 357.423 2.8 .2 .4 .2 .1
Commodity and service group
Commodities ................................................................................ 43.589 177.003 177.267 2.0 .1 .6 .7 .3Food and beverages .................................................................. 16.425 219.175 219.817 1.4 .3 .0 .2 .3 Commodities less food and beverages ...................................... 27.164 154.309 154.406 2.4 .1 1.0 1.0 .3
Nondurables less food and beverages ..................................... 16.703 196.297 197.015 2.0 .4 1.7 1.5 .6 Apparel ................................................................................... 3.788 115.600 119.942 -1.8 3.8 .4 -.4 -.4 Nondurables less food, beverages, and apparel .................... 12.915 250.745 249.301 3.2 -.6 2.1 2.2 1.0
Durables ................................................................................... 10.461 113.125 112.646 2.9 -.4 .1 .3 -.2 Services ....................................................................................... 56.411 257.745 257.663 .9 .0 .2 .1 .0 Rent of shelter 4 ......................................................................... 29.868 233.478 233.516 -.2 .0 .0 .0 .2 Tenants’ and household insurance 1 2 ....................................... .303 127.526 127.718 4.1 .2 .5 .5 .2 Gas (piped) and electricity 3 ....................................................... 4.246 198.640 196.143 1.6 -1.3 .8 .7 -.8 Water and sewer and trash collection services 2 ....................... 1.114 172.934 173.258 5.8 .2 .4 .2 .5 Household operations 1 2 ........................................................... .369 153.542 152.851 -.5 -.5 .3 -.1 -.5 Transportation services .............................................................. 5.918 260.904 260.813 3.2 .0 .2 .1 .2 Medical care services ................................................................. 3.961 414.344 416.993 3.9 .6 .0 .2 .7 Other services ............................................................................ 10.631 297.576 297.815 1.2 .1 .2 .0 -.2
Special indexes
All items less food ........................................................................ 84.667 213.224 213.223 1.4 .0 .4 .4 .1 All items less shelter .................................................................... 69.829 206.276 206.399 2.1 .1 .5 .5 .2 All items less medical care ........................................................... 94.739 207.068 207.107 1.3 .0 .4 .4 .1 Commodities less food ................................................................. 28.256 156.695 156.792 2.3 .1 1.0 1.0 .3 Nondurables less food ................................................................. 17.795 198.064 198.749 1.9 .3 1.6 1.5 .6 Nondurables less food and apparel ............................................. 14.007 247.415 246.106 3.0 -.5 2.0 2.0 .9 Nondurables ................................................................................. 33.128 208.167 208.853 1.7 .3 .9 .9 .5 Services less rent of shelter 4 ...................................................... 26.543 253.551 253.335 2.3 -.1 .2 .2 .0 Services less medical care services ............................................ 52.450 246.681 246.476 .7 -.1 .1 .1 .1 Energy .......................................................................................... 10.291 212.996 210.386 4.0 -1.2 2.7 2.9 .9 All items less energy .................................................................... 89.709 215.312 215.742 1.1 .2 .1 .1 .1
All items less food and energy ................................................... 74.376 215.009 215.388 1.1 .2 .1 .0 .0 Commodities less food and energy commodities ..................... 22.211 145.557 146.170 1.4 .4 .2 .1 -.2 Energy commodities ............................................................... 6.045 238.785 235.913 5.8 -1.2 4.1 4.5 2.0
Services less energy services .................................................. 52.165 264.149 264.342 .9 .1 .1 .0 .1 Purchasing power of the consumer dollar (1982-84=$1.00) ........ - $ .467 $ .467 - - - - -
Purchasing power of the consumer dollar (1967=$1.00) ............. - $ .157 $ .157 - - - - -
1 Not seasonally adjusted.2 Indexes on a December 1997=100 base.3 This index series was calculated using a Laspeyres estimator. All other
item stratum index series were calculated using a geometric means estimator.4 Indexes on a December 1984=100 base
5 Indexes on a December 1988=100 base.6 Indexes on a December 2007=100 base.- Data not available.
NOTE: Index applies to a month as a whole, not to any specific date.
25 CPI Detailed Report-September 2010
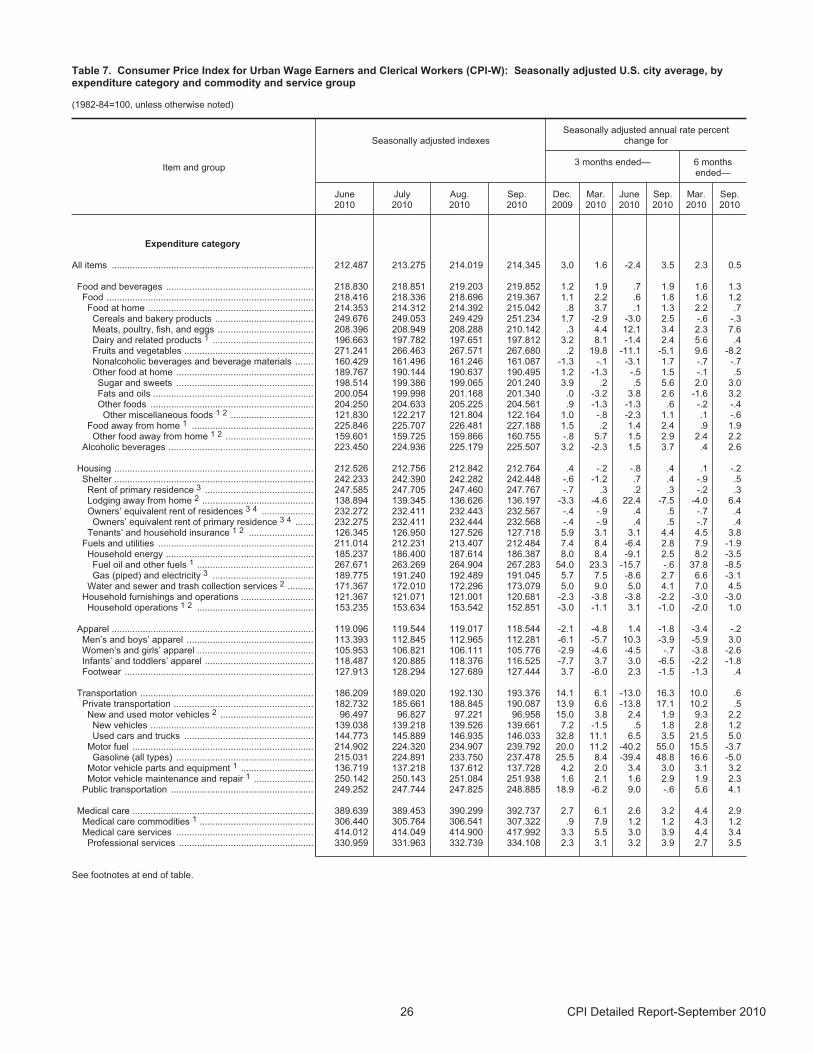
Table 7. Consumer Price Index for Urban Wage Earners and Clerical Workers (CPI-W): Seasonally adjusted U.S. city average, byexpenditure category and commodity and service group
(1982-84=100, unless otherwise noted)
Item and group
Seasonally adjusted indexesSeasonally adjusted annual rate percent
change for
3 months ended— 6 monthsended—
June2010
July2010
Aug.2010
Sep.2010
Dec.2009
Mar.2010
June2010
Sep.2010
Mar.2010
Sep.2010
Expenditure category
All items .............................................................................. 212.487 213.275 214.019 214.345 3.0 1.6 -2.4 3.5 2.3 0.5
Food and beverages ......................................................... 218.830 218.851 219.203 219.852 1.2 1.9 .7 1.9 1.6 1.3 Food ................................................................................ 218.416 218.336 218.696 219.367 1.1 2.2 .6 1.8 1.6 1.2 Food at home ................................................................ 214.353 214.312 214.392 215.042 .8 3.7 .1 1.3 2.2 .7
Cereals and bakery products ...................................... 249.676 249.053 249.429 251.234 1.7 -2.9 -3.0 2.5 -.6 -.3 Meats, poultry, fish, and eggs ..................................... 208.396 208.949 208.288 210.142 .3 4.4 12.1 3.4 2.3 7.6 Dairy and related products 1 ....................................... 196.663 197.782 197.651 197.812 3.2 8.1 -1.4 2.4 5.6 .4 Fruits and vegetables .................................................. 271.241 266.463 267.571 267.680 .2 19.8 -11.1 -5.1 9.6 -8.2 Nonalcoholic beverages and beverage materials ....... 160.429 161.496 161.246 161.087 -1.3 -.1 -3.1 1.7 -.7 -.7 Other food at home ..................................................... 189.767 190.144 190.637 190.495 1.2 -1.3 -.5 1.5 -.1 .5 Sugar and sweets ..................................................... 198.514 199.386 199.065 201.240 3.9 .2 .5 5.6 2.0 3.0 Fats and oils .............................................................. 200.054 199.998 201.168 201.340 .0 -3.2 3.8 2.6 -1.6 3.2 Other foods ............................................................... 204.250 204.633 205.225 204.561 .9 -1.3 -1.3 .6 -.2 -.4
Other miscellaneous foods 1 2 ................................ 121.830 122.217 121.804 122.164 1.0 -.8 -2.3 1.1 .1 -.6 Food away from home 1 ............................................... 225.846 225.707 226.481 227.188 1.5 .2 1.4 2.4 .9 1.9 Other food away from home 1 2 .................................. 159.601 159.725 159.866 160.755 -.8 5.7 1.5 2.9 2.4 2.2
Alcoholic beverages ........................................................ 223.450 224.936 225.179 225.507 3.2 -2.3 1.5 3.7 .4 2.6
Housing ............................................................................. 212.526 212.756 212.842 212.764 .4 -.2 -.8 .4 .1 -.2 Shelter ............................................................................. 242.233 242.390 242.282 242.448 -.6 -1.2 .7 .4 -.9 .5
Rent of primary residence 3 .......................................... 247.585 247.705 247.460 247.767 -.7 .3 .2 .3 -.2 .3 Lodging away from home 2 ........................................... 138.894 139.345 136.626 136.197 -3.3 -4.6 22.4 -7.5 -4.0 6.4 Owners’ equivalent rent of residences 3 4 .................... 232.272 232.411 232.443 232.567 -.4 -.9 .4 .5 -.7 .4 Owners’ equivalent rent of primary residence 3 4 ....... 232.275 232.411 232.444 232.568 -.4 -.9 .4 .5 -.7 .4
Tenants’ and household insurance 1 2 ......................... 126.345 126.950 127.526 127.718 5.9 3.1 3.1 4.4 4.5 3.8 Fuels and utilities ............................................................ 211.014 212.231 213.407 212.484 7.4 8.4 -6.4 2.8 7.9 -1.9
Household energy ......................................................... 185.237 186.400 187.614 186.387 8.0 8.4 -9.1 2.5 8.2 -3.5Fuel oil and other fuels 1 ............................................. 267.671 263.269 264.904 267.283 54.0 23.3 -15.7 -.6 37.8 -8.5 Gas (piped) and electricity 3 ....................................... 189.775 191.240 192.489 191.045 5.7 7.5 -8.6 2.7 6.6 -3.1
Water and sewer and trash collection services 2 .......... 171.367 172.010 172.296 173.079 5.0 9.0 5.0 4.1 7.0 4.5 Household furnishings and operations ............................ 121.367 121.071 121.001 120.681 -2.3 -3.8 -3.8 -2.2 -3.0 -3.0
Household operations 1 2 ............................................. 153.235 153.634 153.542 152.851 -3.0 -1.1 3.1 -1.0 -2.0 1.0
Apparel .............................................................................. 119.096 119.544 119.017 118.544 -2.1 -4.8 1.4 -1.8 -3.4 -.2 Men’s and boys’ apparel ................................................. 113.393 112.845 112.965 112.281 -6.1 -5.7 10.3 -3.9 -5.9 3.0 Women’s and girls’ apparel ............................................. 105.953 106.821 106.111 105.776 -2.9 -4.6 -4.5 -.7 -3.8 -2.6 Infants’ and toddlers’ apparel .......................................... 118.487 120.885 118.376 116.525 -7.7 3.7 3.0 -6.5 -2.2 -1.8 Footwear ......................................................................... 127.913 128.294 127.689 127.444 3.7 -6.0 2.3 -1.5 -1.3 .4
Transportation ................................................................... 186.209 189.020 192.130 193.376 14.1 6.1 -13.0 16.3 10.0 .6 Private transportation ...................................................... 182.732 185.661 188.845 190.087 13.9 6.6 -13.8 17.1 10.2 .5
New and used motor vehicles 2 .................................... 96.497 96.827 97.221 96.958 15.0 3.8 2.4 1.9 9.3 2.2 New vehicles ............................................................... 139.038 139.218 139.526 139.661 7.2 -1.5 .5 1.8 2.8 1.2Used cars and trucks .................................................. 144.773 145.889 146.935 146.033 32.8 11.1 6.5 3.5 21.5 5.0
Motor fuel ...................................................................... 214.902 224.320 234.907 239.792 20.0 11.2 -40.2 55.0 15.5 -3.7 Gasoline (all types) ..................................................... 215.031 224.891 233.750 237.478 25.5 8.4 -39.4 48.8 16.6 -5.0
Motor vehicle parts and equipment 1 ............................ 136.719 137.218 137.612 137.728 4.2 2.0 3.4 3.0 3.1 3.2 Motor vehicle maintenance and repair 1 ....................... 250.142 250.143 251.084 251.938 1.6 2.1 1.6 2.9 1.9 2.3
Public transportation ....................................................... 249.252 247.744 247.825 248.885 18.9 -6.2 9.0 -.6 5.6 4.1
Medical care ...................................................................... 389.639 389.453 390.299 392.737 2.7 6.1 2.6 3.2 4.4 2.9 Medical care commodities 1 ............................................ 306.440 305.764 306.541 307.322 .9 7.9 1.2 1.2 4.3 1.2 Medical care services ..................................................... 414.012 414.049 414.900 417.992 3.3 5.5 3.0 3.9 4.4 3.4
Professional services .................................................... 330.959 331.963 332.739 334.108 2.3 3.1 3.2 3.9 2.7 3.5
See footnotes at end of table.
26 CPI Detailed Report-September 2010
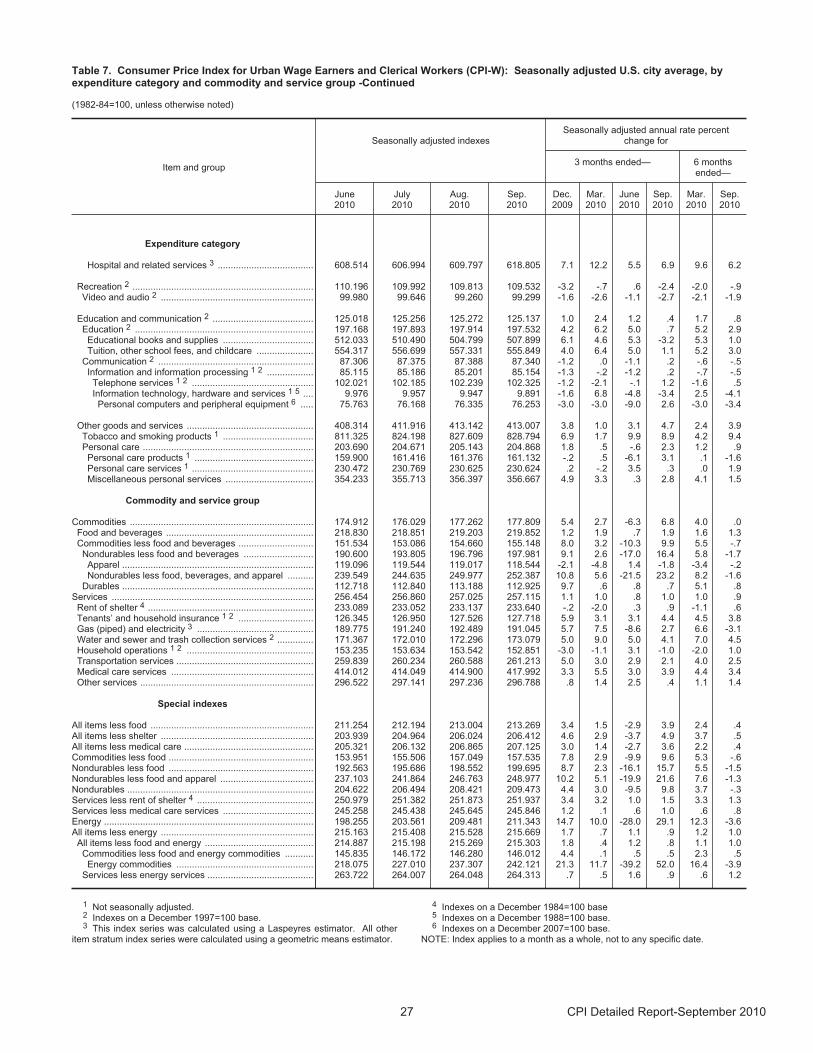
Table 7. Consumer Price Index for Urban Wage Earners and Clerical Workers (CPI-W): Seasonally adjusted U.S. city average, byexpenditure category and commodity and service group -Continued
(1982-84=100, unless otherwise noted)
Item and group
Seasonally adjusted indexesSeasonally adjusted annual rate percent
change for
3 months ended— 6 monthsended—
June2010
July2010
Aug.2010
Sep.2010
Dec.2009
Mar.2010
June2010
Sep.2010
Mar.2010
Sep.2010
Expenditure category
Hospital and related services 3 ..................................... 608.514 606.994 609.797 618.805 7.1 12.2 5.5 6.9 9.6 6.2
Recreation 2 ...................................................................... 110.196 109.992 109.813 109.532 -3.2 -.7 .6 -2.4 -2.0 -.9Video and audio 2 ........................................................... 99.980 99.646 99.260 99.299 -1.6 -2.6 -1.1 -2.7 -2.1 -1.9
Education and communication 2 ....................................... 125.018 125.256 125.272 125.137 1.0 2.4 1.2 .4 1.7 .8 Education 2 ..................................................................... 197.168 197.893 197.914 197.532 4.2 6.2 5.0 .7 5.2 2.9 Educational books and supplies ................................... 512.033 510.490 504.799 507.899 6.1 4.6 5.3 -3.2 5.3 1.0 Tuition, other school fees, and childcare ...................... 554.317 556.699 557.331 555.849 4.0 6.4 5.0 1.1 5.2 3.0
Communication 2 ............................................................ 87.306 87.375 87.388 87.340 -1.2 .0 -1.1 .2 -.6 -.5 Information and information processing 1 2 .................. 85.115 85.186 85.201 85.154 -1.3 -.2 -1.2 .2 -.7 -.5
Telephone services 1 2 ............................................... 102.021 102.185 102.239 102.325 -1.2 -2.1 -.1 1.2 -1.6 .5 Information technology, hardware and services 1 5 .... 9.976 9.957 9.947 9.891 -1.6 6.8 -4.8 -3.4 2.5 -4.1 Personal computers and peripheral equipment 6 ..... 75.763 76.168 76.335 76.253 -3.0 -3.0 -9.0 2.6 -3.0 -3.4
Other goods and services ................................................. 408.314 411.916 413.142 413.007 3.8 1.0 3.1 4.7 2.4 3.9 Tobacco and smoking products 1 ................................... 811.325 824.198 827.609 828.794 6.9 1.7 9.9 8.9 4.2 9.4 Personal care .................................................................. 203.690 204.671 205.143 204.868 1.8 .5 -.6 2.3 1.2 .9
Personal care products 1 .............................................. 159.900 161.416 161.376 161.132 -.2 .5 -6.1 3.1 .1 -1.6 Personal care services 1 ............................................... 230.472 230.769 230.625 230.624 .2 -.2 3.5 .3 .0 1.9 Miscellaneous personal services .................................. 354.233 355.713 356.397 356.667 4.9 3.3 .3 2.8 4.1 1.5
Commodity and service group
Commodities ....................................................................... 174.912 176.029 177.262 177.809 5.4 2.7 -6.3 6.8 4.0 .0 Food and beverages ......................................................... 218.830 218.851 219.203 219.852 1.2 1.9 .7 1.9 1.6 1.3 Commodities less food and beverages ............................. 151.534 153.086 154.660 155.148 8.0 3.2 -10.3 9.9 5.5 -.7
Nondurables less food and beverages ........................... 190.600 193.805 196.796 197.981 9.1 2.6 -17.0 16.4 5.8 -1.7 Apparel .......................................................................... 119.096 119.544 119.017 118.544 -2.1 -4.8 1.4 -1.8 -3.4 -.2 Nondurables less food, beverages, and apparel .......... 239.549 244.635 249.977 252.387 10.8 5.6 -21.5 23.2 8.2 -1.6
Durables .......................................................................... 112.718 112.840 113.188 112.925 9.7 .6 .8 .7 5.1 .8 Services .............................................................................. 256.454 256.860 257.025 257.115 1.1 1.0 .8 1.0 1.0 .9
Rent of shelter 4 ................................................................ 233.089 233.052 233.137 233.640 -.2 -2.0 .3 .9 -1.1 .6 Tenants’ and household insurance 1 2 ............................. 126.345 126.950 127.526 127.718 5.9 3.1 3.1 4.4 4.5 3.8 Gas (piped) and electricity 3 ............................................. 189.775 191.240 192.489 191.045 5.7 7.5 -8.6 2.7 6.6 -3.1 Water and sewer and trash collection services 2 .............. 171.367 172.010 172.296 173.079 5.0 9.0 5.0 4.1 7.0 4.5 Household operations 1 2 ................................................. 153.235 153.634 153.542 152.851 -3.0 -1.1 3.1 -1.0 -2.0 1.0 Transportation services ..................................................... 259.839 260.234 260.588 261.213 5.0 3.0 2.9 2.1 4.0 2.5 Medical care services ....................................................... 414.012 414.049 414.900 417.992 3.3 5.5 3.0 3.9 4.4 3.4 Other services ................................................................... 296.522 297.141 297.236 296.788 .8 1.4 2.5 .4 1.1 1.4
Special indexes
All items less food ............................................................... 211.254 212.194 213.004 213.269 3.4 1.5 -2.9 3.9 2.4 .4 All items less shelter ........................................................... 203.939 204.964 206.024 206.412 4.6 2.9 -3.7 4.9 3.7 .5 All items less medical care .................................................. 205.321 206.132 206.865 207.125 3.0 1.4 -2.7 3.6 2.2 .4 Commodities less food ........................................................ 153.951 155.506 157.049 157.535 7.8 2.9 -9.9 9.6 5.3 -.6 Nondurables less food ........................................................ 192.563 195.686 198.552 199.695 8.7 2.3 -16.1 15.7 5.5 -1.5 Nondurables less food and apparel .................................... 237.103 241.864 246.763 248.977 10.2 5.1 -19.9 21.6 7.6 -1.3 Nondurables ........................................................................ 204.622 206.494 208.421 209.473 4.4 3.0 -9.5 9.8 3.7 -.3 Services less rent of shelter 4 ............................................. 250.979 251.382 251.873 251.937 3.4 3.2 1.0 1.5 3.3 1.3 Services less medical care services ................................... 245.258 245.438 245.645 245.846 1.2 .1 .6 1.0 .6 .8 Energy ................................................................................. 198.255 203.561 209.481 211.343 14.7 10.0 -28.0 29.1 12.3 -3.6 All items less energy ........................................................... 215.163 215.408 215.528 215.669 1.7 .7 1.1 .9 1.2 1.0
All items less food and energy .......................................... 214.887 215.198 215.269 215.303 1.8 .4 1.2 .8 1.1 1.0 Commodities less food and energy commodities ........... 145.835 146.172 146.280 146.012 4.4 .1 .5 .5 2.3 .5
Energy commodities ..................................................... 218.075 227.010 237.307 242.121 21.3 11.7 -39.2 52.0 16.4 -3.9 Services less energy services ......................................... 263.722 264.007 264.048 264.313 .7 .5 1.6 .9 .6 1.2
1 Not seasonally adjusted.2 Indexes on a December 1997=100 base.3 This index series was calculated using a Laspeyres estimator. All other
item stratum index series were calculated using a geometric means estimator.
4 Indexes on a December 1984=100 base5 Indexes on a December 1988=100 base.6 Indexes on a December 2007=100 base.
NOTE: Index applies to a month as a whole, not to any specific date.
27 CPI Detailed Report-September 2010
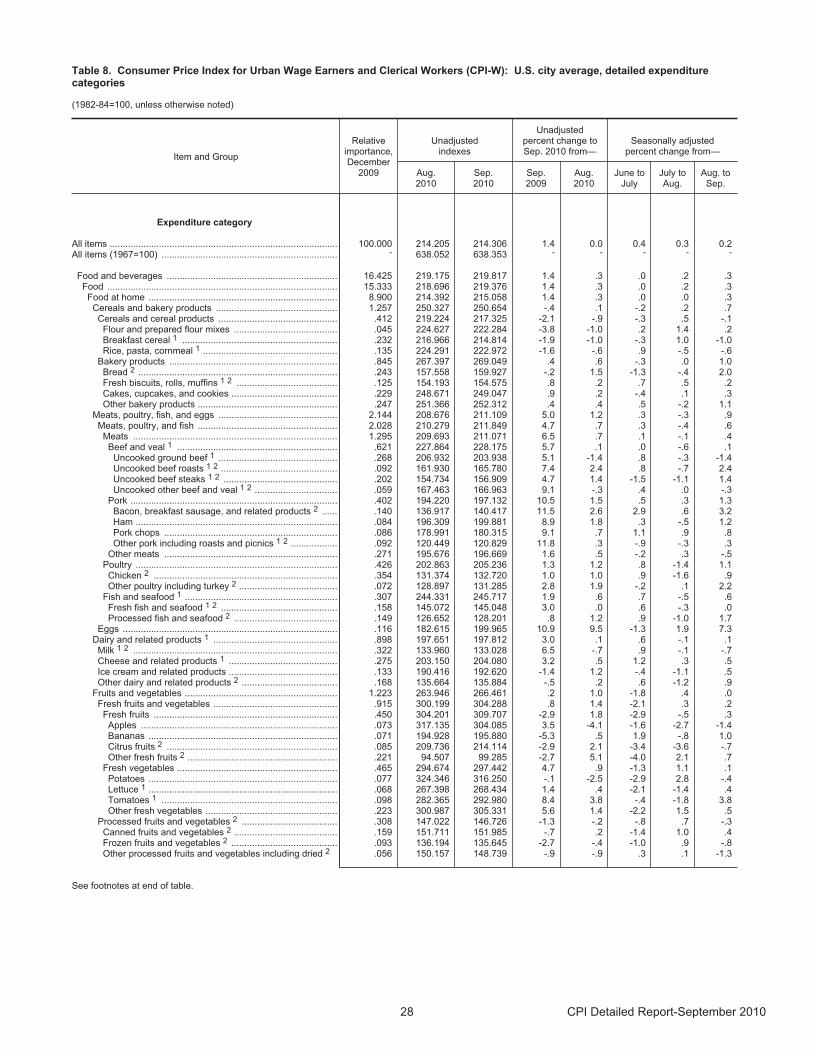
Table 8. Consumer Price Index for Urban Wage Earners and Clerical Workers (CPI-W): U.S. city average, detailed expenditurecategories
(1982-84=100, unless otherwise noted)
Item and Group
Relativeimportance,December
2009
Unadjustedindexes
Unadjustedpercent change toSep. 2010 from—
Seasonally adjustedpercent change from—
Aug.2010
Sep.2010
Sep.2009
Aug.2010
June toJuly
July toAug.
Aug. toSep.
Expenditure category
All items ........................................................................................ 100.000 214.205 214.306 1.4 0.0 0.4 0.3 0.2 All items (1967=100) .................................................................... - 638.052 638.353 - - - - -
Food and beverages .................................................................. 16.425 219.175 219.817 1.4 .3 .0 .2 .3 Food ......................................................................................... 15.333 218.696 219.376 1.4 .3 .0 .2 .3
Food at home ......................................................................... 8.900 214.392 215.058 1.4 .3 .0 .0 .3 Cereals and bakery products ............................................... 1.257 250.327 250.654 -.4 .1 -.2 .2 .7 Cereals and cereal products .............................................. .412 219.224 217.325 -2.1 -.9 -.3 .5 -.1
Flour and prepared flour mixes ........................................ .045 224.627 222.284 -3.8 -1.0 .2 1.4 .2 Breakfast cereal 1 ............................................................ .232 216.966 214.814 -1.9 -1.0 -.3 1.0 -1.0 Rice, pasta, cornmeal 1 .................................................... .135 224.291 222.972 -1.6 -.6 .9 -.5 -.6
Bakery products ................................................................. .845 267.397 269.049 .4 .6 -.3 .0 1.0 Bread 2 ............................................................................. .243 157.558 159.927 -.2 1.5 -1.3 -.4 2.0 Fresh biscuits, rolls, muffins 1 2 ....................................... .125 154.193 154.575 .8 .2 .7 .5 .2 Cakes, cupcakes, and cookies ......................................... .229 248.671 249.047 .9 .2 -.4 .1 .3 Other bakery products ...................................................... .247 251.366 252.312 .4 .4 .5 -.2 1.1
Meats, poultry, fish, and eggs .............................................. 2.144 208.676 211.109 5.0 1.2 .3 -.3 .9 Meats, poultry, and fish ...................................................... 2.028 210.279 211.849 4.7 .7 .3 -.4 .6
Meats ............................................................................... 1.295 209.693 211.071 6.5 .7 .1 -.1 .4 Beef and veal 1 .............................................................. .621 227.864 228.175 5.7 .1 .0 -.6 .1 Uncooked ground beef 1 .............................................. .268 206.932 203.938 5.1 -1.4 .8 -.3 -1.4 Uncooked beef roasts 1 2 ............................................. .092 161.930 165.780 7.4 2.4 .8 -.7 2.4 Uncooked beef steaks 1 2 ............................................ .202 154.734 156.909 4.7 1.4 -1.5 -1.1 1.4 Uncooked other beef and veal 1 2 ................................ .059 167.463 166.963 9.1 -.3 .4 .0 -.3
Pork ................................................................................ .402 194.220 197.132 10.5 1.5 .5 .3 1.3 Bacon, breakfast sausage, and related products 2 ...... .140 136.917 140.417 11.5 2.6 2.9 .6 3.2 Ham .............................................................................. .084 196.309 199.881 8.9 1.8 .3 -.5 1.2 Pork chops ................................................................... .086 178.991 180.315 9.1 .7 1.1 .9 .8 Other pork including roasts and picnics 1 2 .................. .092 120.449 120.829 11.8 .3 -.9 -.3 .3
Other meats ................................................................... .271 195.676 196.669 1.6 .5 -.2 .3 -.5 Poultry .............................................................................. .426 202.863 205.236 1.3 1.2 .8 -1.4 1.1
Chicken 2 ....................................................................... .354 131.374 132.720 1.0 1.0 .9 -1.6 .9 Other poultry including turkey 2 ...................................... .072 128.897 131.285 2.8 1.9 -.2 .1 2.2
Fish and seafood 1 ........................................................... .307 244.331 245.717 1.9 .6 .7 -.5 .6 Fresh fish and seafood 1 2 ............................................. .158 145.072 145.048 3.0 .0 .6 -.3 .0 Processed fish and seafood 2 ........................................ .149 126.652 128.201 .8 1.2 .9 -1.0 1.7
Eggs ................................................................................... .116 182.615 199.965 10.9 9.5 -1.3 1.9 7.3Dairy and related products 1 ................................................ .898 197.651 197.812 3.0 .1 .6 -.1 .1 Milk 1 2 ............................................................................... .322 133.960 133.028 6.5 -.7 .9 -.1 -.7 Cheese and related products 1 .......................................... .275 203.150 204.080 3.2 .5 1.2 .3 .5 Ice cream and related products .......................................... .133 190.416 192.620 -1.4 1.2 -.4 -1.1 .5 Other dairy and related products 2 ..................................... .168 135.664 135.884 -.5 .2 .6 -1.2 .9
Fruits and vegetables ........................................................... 1.223 263.946 266.461 .2 1.0 -1.8 .4 .0 Fresh fruits and vegetables ................................................ .915 300.199 304.288 .8 1.4 -2.1 .3 .2
Fresh fruits ....................................................................... .450 304.201 309.707 -2.9 1.8 -2.9 -.5 .3 Apples ............................................................................ .073 317.135 304.085 3.5 -4.1 -1.6 -2.7 -1.4 Bananas ......................................................................... .071 194.928 195.880 -5.3 .5 1.9 -.8 1.0 Citrus fruits 2 .................................................................. .085 209.736 214.114 -2.9 2.1 -3.4 -3.6 -.7 Other fresh fruits 2 .......................................................... .221 94.507 99.285 -2.7 5.1 -4.0 2.1 .7
Fresh vegetables .............................................................. .465 294.674 297.442 4.7 .9 -1.3 1.1 .1 Potatoes ......................................................................... .077 324.346 316.250 -.1 -2.5 -2.9 2.8 -.4 Lettuce 1 ......................................................................... .068 267.398 268.434 1.4 .4 -2.1 -1.4 .4 Tomatoes 1 .................................................................... .098 282.365 292.980 8.4 3.8 -.4 -1.8 3.8 Other fresh vegetables ................................................... .223 300.987 305.331 5.6 1.4 -2.2 1.5 .5
Processed fruits and vegetables 2 ..................................... .308 147.022 146.726 -1.3 -.2 -.8 .7 -.3 Canned fruits and vegetables 2 ........................................ .159 151.711 151.985 -.7 .2 -1.4 1.0 .4 Frozen fruits and vegetables 2 ......................................... .093 136.194 135.645 -2.7 -.4 -1.0 .9 -.8 Other processed fruits and vegetables including dried 2 .056 150.157 148.739 -.9 -.9 .3 .1 -1.3
See footnotes at end of table.
28 CPI Detailed Report-September 2010
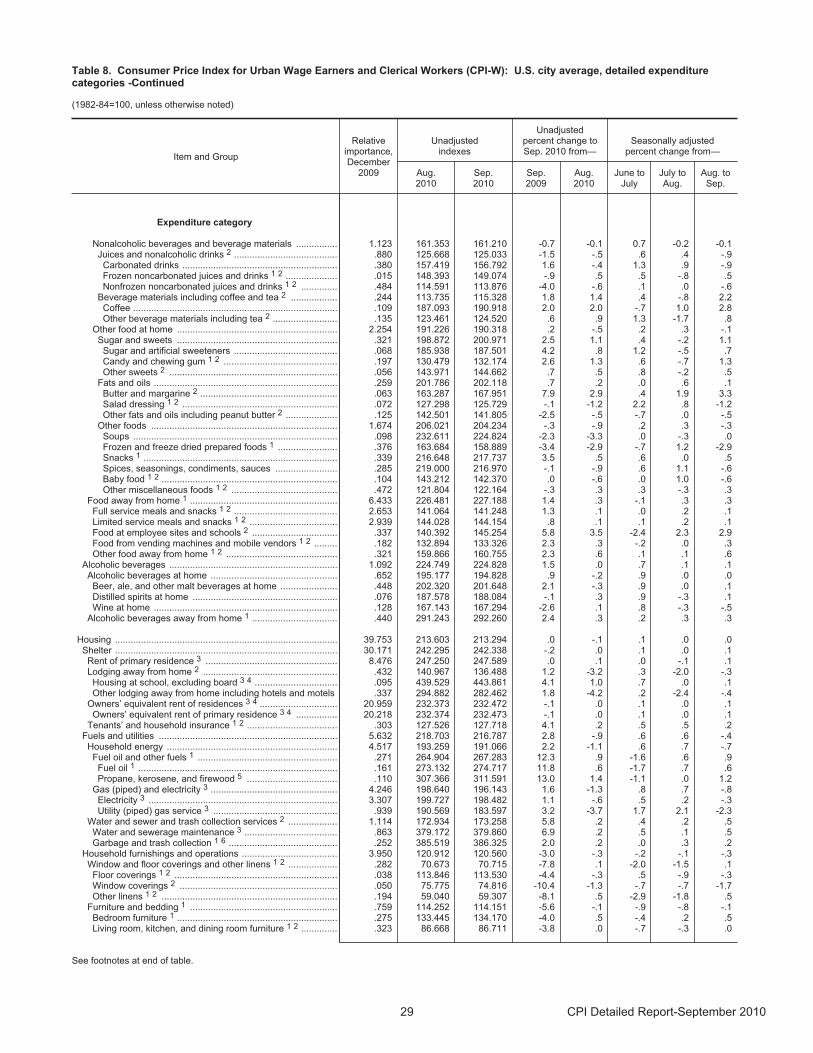
Table 8. Consumer Price Index for Urban Wage Earners and Clerical Workers (CPI-W): U.S. city average, detailed expenditurecategories -Continued
(1982-84=100, unless otherwise noted)
Item and Group
Relativeimportance,December
2009
Unadjustedindexes
Unadjustedpercent change toSep. 2010 from—
Seasonally adjustedpercent change from—
Aug.2010
Sep.2010
Sep.2009
Aug.2010
June toJuly
July toAug.
Aug. toSep.
Expenditure category
Nonalcoholic beverages and beverage materials ................ 1.123 161.353 161.210 -0.7 -0.1 0.7 -0.2 -0.1 Juices and nonalcoholic drinks 2 ........................................ .880 125.668 125.033 -1.5 -.5 .6 .4 -.9
Carbonated drinks ............................................................ .380 157.419 156.792 1.6 -.4 1.3 .9 -.9 Frozen noncarbonated juices and drinks 1 2 .................... .015 148.393 149.074 -.9 .5 .5 -.8 .5 Nonfrozen noncarbonated juices and drinks 1 2 .............. .484 114.591 113.876 -4.0 -.6 .1 .0 -.6
Beverage materials including coffee and tea 2 .................. .244 113.735 115.328 1.8 1.4 .4 -.8 2.2 Coffee ............................................................................... .109 187.093 190.918 2.0 2.0 -.7 1.0 2.8 Other beverage materials including tea 2 ......................... .135 123.461 124.520 .6 .9 1.3 -1.7 .8
Other food at home .............................................................. 2.254 191.226 190.318 .2 -.5 .2 .3 -.1 Sugar and sweets .............................................................. .321 198.872 200.971 2.5 1.1 .4 -.2 1.1
Sugar and artificial sweeteners ........................................ .068 185.938 187.501 4.2 .8 1.2 -.5 .7 Candy and chewing gum 1 2 ............................................ .197 130.479 132.174 2.6 1.3 .6 -.7 1.3 Other sweets 2 ................................................................. .056 143.971 144.662 .7 .5 .8 -.2 .5
Fats and oils ....................................................................... .259 201.786 202.118 .7 .2 .0 .6 .1 Butter and margarine 2 ..................................................... .063 163.287 167.951 7.9 2.9 .4 1.9 3.3 Salad dressing 1 2 ............................................................ .072 127.298 125.729 -.1 -1.2 2.2 .8 -1.2 Other fats and oils including peanut butter 2 .................... .125 142.501 141.805 -2.5 -.5 -.7 .0 -.5
Other foods ........................................................................ 1.674 206.021 204.234 -.3 -.9 .2 .3 -.3 Soups ............................................................................... .098 232.611 224.824 -2.3 -3.3 .0 -.3 .0 Frozen and freeze dried prepared foods 1 ....................... .376 163.684 158.889 -3.4 -2.9 -.7 1.2 -2.9 Snacks 1 ........................................................................... .339 216.648 217.737 3.5 .5 .6 .0 .5 Spices, seasonings, condiments, sauces ........................ .285 219.000 216.970 -.1 -.9 .6 1.1 -.6 Baby food 1 2 .................................................................... .104 143.212 142.370 .0 -.6 .0 1.0 -.6 Other miscellaneous foods 1 2 ......................................... .472 121.804 122.164 -.3 .3 .3 -.3 .3
Food away from home 1 ......................................................... 6.433 226.481 227.188 1.4 .3 -.1 .3 .3 Full service meals and snacks 1 2 ........................................ 2.653 141.064 141.248 1.3 .1 .0 .2 .1 Limited service meals and snacks 1 2 .................................. 2.939 144.028 144.154 .8 .1 .1 .2 .1 Food at employee sites and schools 2 ................................. .337 140.392 145.254 5.8 3.5 -2.4 2.3 2.9 Food from vending machines and mobile vendors 1 2 ......... .182 132.894 133.326 2.3 .3 -.2 .0 .3 Other food away from home 1 2 ........................................... .321 159.866 160.755 2.3 .6 .1 .1 .6
Alcoholic beverages ................................................................. 1.092 224.749 224.828 1.5 .0 .7 .1 .1 Alcoholic beverages at home ................................................. .652 195.177 194.828 .9 -.2 .9 .0 .0
Beer, ale, and other malt beverages at home ...................... .448 202.320 201.648 2.1 -.3 .9 .0 .1 Distilled spirits at home ........................................................ .076 187.578 188.084 -.1 .3 .9 -.3 .1 Wine at home ....................................................................... .128 167.143 167.294 -2.6 .1 .8 -.3 -.5
Alcoholic beverages away from home 1 ................................. .440 291.243 292.260 2.4 .3 .2 .3 .3
Housing ...................................................................................... 39.753 213.603 213.294 .0 -.1 .1 .0 .0 Shelter ...................................................................................... 30.171 242.295 242.338 -.2 .0 .1 .0 .1
Rent of primary residence 3 ................................................... 8.476 247.250 247.589 .0 .1 .0 -.1 .1 Lodging away from home 2 .................................................... .432 140.967 136.488 1.2 -3.2 .3 -2.0 -.3 Housing at school, excluding board 3 4 ................................ .095 439.529 443.861 4.1 1.0 .7 .0 .1 Other lodging away from home including hotels and motels .337 294.882 282.462 1.8 -4.2 .2 -2.4 -.4
Owners’ equivalent rent of residences 3 4 .............................. 20.959 232.373 232.472 -.1 .0 .1 .0 .1 Owners’ equivalent rent of primary residence 3 4 ................ 20.218 232.374 232.473 -.1 .0 .1 .0 .1
Tenants’ and household insurance 1 2 ................................... .303 127.526 127.718 4.1 .2 .5 .5 .2 Fuels and utilities ..................................................................... 5.632 218.703 216.787 2.8 -.9 .6 .6 -.4
Household energy .................................................................. 4.517 193.259 191.066 2.2 -1.1 .6 .7 -.7 Fuel oil and other fuels 1 ...................................................... .271 264.904 267.283 12.3 .9 -1.6 .6 .9 Fuel oil 1 ............................................................................. .161 273.132 274.717 11.8 .6 -1.7 .7 .6 Propane, kerosene, and firewood 5 ................................... .110 307.366 311.591 13.0 1.4 -1.1 .0 1.2
Gas (piped) and electricity 3 ................................................. 4.246 198.640 196.143 1.6 -1.3 .8 .7 -.8 Electricity 3 ......................................................................... 3.307 199.727 198.482 1.1 -.6 .5 .2 -.3 Utility (piped) gas service 3 ................................................ .939 190.569 183.597 3.2 -3.7 1.7 2.1 -2.3
Water and sewer and trash collection services 2 ................... 1.114 172.934 173.258 5.8 .2 .4 .2 .5 Water and sewerage maintenance 3 .................................... .863 379.172 379.860 6.9 .2 .5 .1 .5 Garbage and trash collection 1 6 .......................................... .252 385.519 386.325 2.0 .2 .0 .3 .2
Household furnishings and operations ..................................... 3.950 120.912 120.560 -3.0 -.3 -.2 -.1 -.3 Window and floor coverings and other linens 1 2 ................... .282 70.673 70.715 -7.8 .1 -2.0 -1.5 .1 Floor coverings 1 2 ............................................................... .038 113.846 113.530 -4.4 -.3 .5 -.9 -.3 Window coverings 2 ............................................................. .050 75.775 74.816 -10.4 -1.3 -.7 -.7 -1.7 Other linens 1 2 .................................................................... .194 59.040 59.307 -8.1 .5 -2.9 -1.8 .5
Furniture and bedding 1 ......................................................... .759 114.252 114.151 -5.6 -.1 -.9 -.8 -.1 Bedroom furniture 1 .............................................................. .275 133.445 134.170 -4.0 .5 -.4 .2 .5 Living room, kitchen, and dining room furniture 1 2 .............. .323 86.668 86.711 -3.8 .0 -.7 -.3 .0
See footnotes at end of table.
29 CPI Detailed Report-September 2010
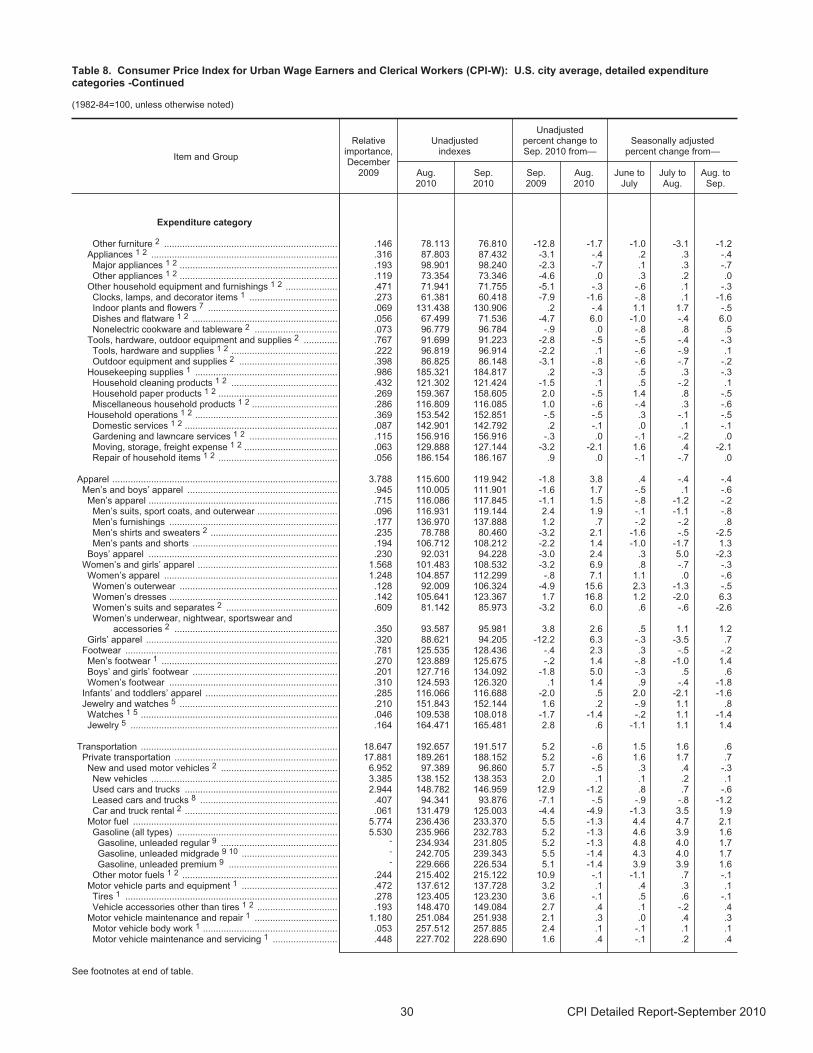
Table 8. Consumer Price Index for Urban Wage Earners and Clerical Workers (CPI-W): U.S. city average, detailed expenditurecategories -Continued
(1982-84=100, unless otherwise noted)
Item and Group
Relativeimportance,December
2009
Unadjustedindexes
Unadjustedpercent change toSep. 2010 from—
Seasonally adjustedpercent change from—
Aug.2010
Sep.2010
Sep.2009
Aug.2010
June toJuly
July toAug.
Aug. toSep.
Expenditure category
Other furniture 2 ................................................................... .146 78.113 76.810 -12.8 -1.7 -1.0 -3.1 -1.2 Appliances 1 2 ........................................................................ .316 87.803 87.432 -3.1 -.4 .2 .3 -.4 Major appliances 1 2 ............................................................. .193 98.901 98.240 -2.3 -.7 .1 .3 -.7 Other appliances 1 2 ............................................................. .119 73.354 73.346 -4.6 .0 .3 .2 .0
Other household equipment and furnishings 1 2 .................... .471 71.941 71.755 -5.1 -.3 -.6 .1 -.3 Clocks, lamps, and decorator items 1 .................................. .273 61.381 60.418 -7.9 -1.6 -.8 .1 -1.6 Indoor plants and flowers 7 .................................................. .069 131.438 130.906 .2 -.4 1.1 1.7 -.5 Dishes and flatware 1 2 ........................................................ .056 67.499 71.536 -4.7 6.0 -1.0 -.4 6.0 Nonelectric cookware and tableware 2 ................................ .073 96.779 96.784 -.9 .0 -.8 .8 .5
Tools, hardware, outdoor equipment and supplies 2 ............. .767 91.699 91.223 -2.8 -.5 -.5 -.4 -.3 Tools, hardware and supplies 1 2 ......................................... .222 96.819 96.914 -2.2 .1 -.6 -.9 .1 Outdoor equipment and supplies 2 ...................................... .398 86.825 86.148 -3.1 -.8 -.6 -.7 -.2
Housekeeping supplies 1 ....................................................... .986 185.321 184.817 .2 -.3 .5 .3 -.3 Household cleaning products 1 2 ......................................... .432 121.302 121.424 -1.5 .1 .5 -.2 .1 Household paper products 1 2 .............................................. .269 159.367 158.605 2.0 -.5 1.4 .8 -.5 Miscellaneous household products 1 2 ................................. .286 116.809 116.085 1.0 -.6 -.4 .3 -.6
Household operations 1 2 ....................................................... .369 153.542 152.851 -.5 -.5 .3 -.1 -.5 Domestic services 1 2 ........................................................... .087 142.901 142.792 .2 -.1 .0 .1 -.1 Gardening and lawncare services 1 2 .................................. .115 156.916 156.916 -.3 .0 -.1 -.2 .0 Moving, storage, freight expense 1 2 .................................... .063 129.888 127.144 -3.2 -2.1 1.6 .4 -2.1 Repair of household items 1 2 .............................................. .056 186.154 186.167 .9 .0 -.1 -.7 .0
Apparel ....................................................................................... 3.788 115.600 119.942 -1.8 3.8 .4 -.4 -.4 Men’s and boys’ apparel .......................................................... .945 110.005 111.901 -1.6 1.7 -.5 .1 -.6
Men’s apparel ......................................................................... .715 116.086 117.845 -1.1 1.5 -.8 -1.2 -.2 Men’s suits, sport coats, and outerwear ............................... .096 116.931 119.144 2.4 1.9 -.1 -1.1 -.8 Men’s furnishings ................................................................. .177 136.970 137.888 1.2 .7 -.2 -.2 .8 Men’s shirts and sweaters 2 ................................................. .235 78.788 80.460 -3.2 2.1 -1.6 -.5 -2.5 Men’s pants and shorts ........................................................ .194 106.712 108.212 -2.2 1.4 -1.0 -1.7 1.3
Boys’ apparel ......................................................................... .230 92.031 94.228 -3.0 2.4 .3 5.0 -2.3 Women’s and girls’ apparel ...................................................... 1.568 101.483 108.532 -3.2 6.9 .8 -.7 -.3
Women’s apparel ................................................................... 1.248 104.857 112.299 -.8 7.1 1.1 .0 -.6 Women’s outerwear ............................................................. .128 92.009 106.324 -4.9 15.6 2.3 -1.3 -.5 Women’s dresses ................................................................. .142 105.641 123.367 1.7 16.8 1.2 -2.0 6.3 Women’s suits and separates 2 ........................................... .609 81.142 85.973 -3.2 6.0 .6 -.6 -2.6 Women’s underwear, nightwear, sportswear and
accessories 2 ............................................................... .350 93.587 95.981 3.8 2.6 .5 1.1 1.2 Girls’ apparel .......................................................................... .320 88.621 94.205 -12.2 6.3 -.3 -3.5 .7
Footwear .................................................................................. .781 125.535 128.436 -.4 2.3 .3 -.5 -.2Men’s footwear 1 .................................................................... .270 123.889 125.675 -.2 1.4 -.8 -1.0 1.4 Boys’ and girls’ footwear ........................................................ .201 127.716 134.092 -1.8 5.0 -.3 .5 .6 Women’s footwear ................................................................. .310 124.593 126.320 .1 1.4 .9 -.4 -1.8
Infants’ and toddlers’ apparel ................................................... .285 116.066 116.688 -2.0 .5 2.0 -2.1 -1.6 Jewelry and watches 5 ............................................................. .210 151.843 152.144 1.6 .2 -.9 1.1 .8
Watches 1 5 ............................................................................ .046 109.538 108.018 -1.7 -1.4 -.2 1.1 -1.4 Jewelry 5 ................................................................................ .164 164.471 165.481 2.8 .6 -1.1 1.1 1.4
Transportation ............................................................................ 18.647 192.657 191.517 5.2 -.6 1.5 1.6 .6 Private transportation ............................................................... 17.881 189.261 188.152 5.2 -.6 1.6 1.7 .7
New and used motor vehicles 2 ............................................. 6.952 97.389 96.860 5.7 -.5 .3 .4 -.3 New vehicles ........................................................................ 3.385 138.152 138.353 2.0 .1 .1 .2 .1 Used cars and trucks ........................................................... 2.944 148.782 146.959 12.9 -1.2 .8 .7 -.6 Leased cars and trucks 8 ..................................................... .407 94.341 93.876 -7.1 -.5 -.9 -.8 -1.2 Car and truck rental 2 ........................................................... .061 131.479 125.003 -4.4 -4.9 -1.3 3.5 1.9
Motor fuel ............................................................................... 5.774 236.436 233.370 5.5 -1.3 4.4 4.7 2.1 Gasoline (all types) .............................................................. 5.530 235.966 232.783 5.2 -1.3 4.6 3.9 1.6 Gasoline, unleaded regular 9 ............................................. - 234.934 231.805 5.2 -1.3 4.8 4.0 1.7 Gasoline, unleaded midgrade 9 10 ..................................... - 242.705 239.343 5.5 -1.4 4.3 4.0 1.7 Gasoline, unleaded premium 9 .......................................... - 229.666 226.534 5.1 -1.4 3.9 3.9 1.6
Other motor fuels 1 2 ............................................................ .244 215.402 215.122 10.9 -.1 -1.1 .7 -.1 Motor vehicle parts and equipment 1 ..................................... .472 137.612 137.728 3.2 .1 .4 .3 .1 Tires 1 .................................................................................. .278 123.405 123.230 3.6 -.1 .5 .6 -.1 Vehicle accessories other than tires 1 2 ............................... .193 148.470 149.084 2.7 .4 .1 -.2 .4
Motor vehicle maintenance and repair 1 ................................ 1.180 251.084 251.938 2.1 .3 .0 .4 .3 Motor vehicle body work 1 .................................................... .053 257.512 257.885 2.4 .1 -.1 .1 .1 Motor vehicle maintenance and servicing 1 ......................... .448 227.702 228.690 1.6 .4 -.1 .2 .4
See footnotes at end of table.
30 CPI Detailed Report-September 2010
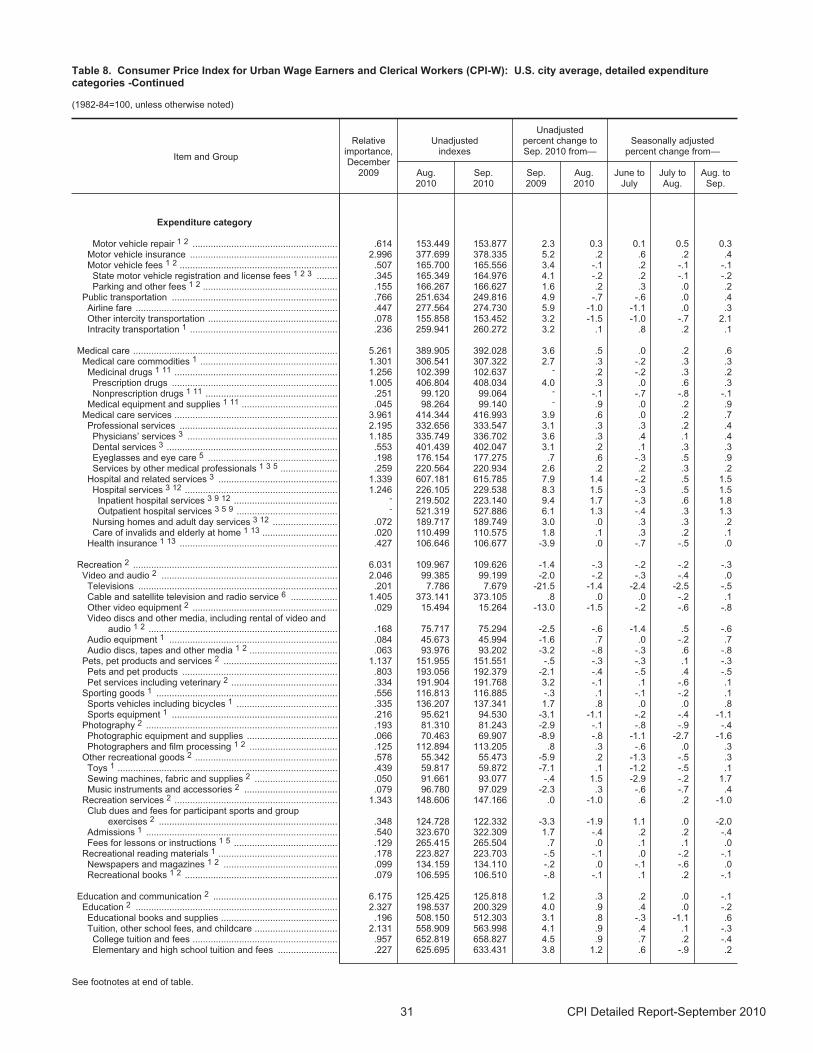
Table 8. Consumer Price Index for Urban Wage Earners and Clerical Workers (CPI-W): U.S. city average, detailed expenditurecategories -Continued
(1982-84=100, unless otherwise noted)
Item and Group
Relativeimportance,December
2009
Unadjustedindexes
Unadjustedpercent change toSep. 2010 from—
Seasonally adjustedpercent change from—
Aug.2010
Sep.2010
Sep.2009
Aug.2010
June toJuly
July toAug.
Aug. toSep.
Expenditure category
Motor vehicle repair 1 2 ........................................................ .614 153.449 153.877 2.3 0.3 0.1 0.5 0.3 Motor vehicle insurance ......................................................... 2.996 377.699 378.335 5.2 .2 .6 .2 .4 Motor vehicle fees 1 2 ............................................................. .507 165.700 165.556 3.4 -.1 .2 -.1 -.1 State motor vehicle registration and license fees 1 2 3 ........ .345 165.349 164.976 4.1 -.2 .2 -.1 -.2 Parking and other fees 1 2 .................................................... .155 166.267 166.627 1.6 .2 .3 .0 .2
Public transportation ................................................................ .766 251.634 249.816 4.9 -.7 -.6 .0 .4 Airline fare .............................................................................. .447 277.564 274.730 5.9 -1.0 -1.1 .0 .3 Other intercity transportation .................................................. .078 155.858 153.452 3.2 -1.5 -1.0 -.7 2.1 Intracity transportation 1 ......................................................... .236 259.941 260.272 3.2 .1 .8 .2 .1
Medical care ............................................................................... 5.261 389.905 392.028 3.6 .5 .0 .2 .6Medical care commodities 1 ..................................................... 1.301 306.541 307.322 2.7 .3 -.2 .3 .3 Medicinal drugs 1 11 ............................................................... 1.256 102.399 102.637 - .2 -.2 .3 .2 Prescription drugs ................................................................ 1.005 406.804 408.034 4.0 .3 .0 .6 .3 Nonprescription drugs 1 11 ................................................... .251 99.120 99.064 - -.1 -.7 -.8 -.1
Medical equipment and supplies 1 11 ..................................... .045 98.264 99.140 - .9 .0 .2 .9 Medical care services ............................................................... 3.961 414.344 416.993 3.9 .6 .0 .2 .7
Professional services ............................................................. 2.195 332.656 333.547 3.1 .3 .3 .2 .4 Physicians’ services 3 .......................................................... 1.185 335.749 336.702 3.6 .3 .4 .1 .4 Dental services 3 .................................................................. .553 401.439 402.047 3.1 .2 .1 .3 .3 Eyeglasses and eye care 5 .................................................. .198 176.154 177.275 .7 .6 -.3 .5 .9 Services by other medical professionals 1 3 5 ...................... .259 220.564 220.934 2.6 .2 .2 .3 .2
Hospital and related services 3 .............................................. 1.339 607.181 615.785 7.9 1.4 -.2 .5 1.5 Hospital services 3 12 ........................................................... 1.246 226.105 229.538 8.3 1.5 -.3 .5 1.5 Inpatient hospital services 3 9 12 ........................................ - 219.502 223.140 9.4 1.7 -.3 .6 1.8 Outpatient hospital services 3 5 9 ....................................... - 521.319 527.886 6.1 1.3 -.4 .3 1.3
Nursing homes and adult day services 3 12 ......................... .072 189.717 189.749 3.0 .0 .3 .3 .2 Care of invalids and elderly at home 1 13 ............................. .020 110.499 110.575 1.8 .1 .3 .2 .1
Health insurance 1 13 ............................................................. .427 106.646 106.677 -3.9 .0 -.7 -.5 .0
Recreation 2 ............................................................................... 6.031 109.967 109.626 -1.4 -.3 -.2 -.2 -.3 Video and audio 2 .................................................................... 2.046 99.385 99.199 -2.0 -.2 -.3 -.4 .0 Televisions ............................................................................. .201 7.786 7.679 -21.5 -1.4 -2.4 -2.5 -.5Cable and satellite television and radio service 6 .................. 1.405 373.141 373.105 .8 .0 .0 -.2 .1 Other video equipment 2 ........................................................ .029 15.494 15.264 -13.0 -1.5 -.2 -.6 -.8 Video discs and other media, including rental of video and
audio 1 2 ......................................................................... .168 75.717 75.294 -2.5 -.6 -1.4 .5 -.6 Audio equipment 1 ................................................................. .084 45.673 45.994 -1.6 .7 .0 -.2 .7 Audio discs, tapes and other media 1 2 .................................. .063 93.976 93.202 -3.2 -.8 -.3 .6 -.8
Pets, pet products and services 2 ............................................ 1.137 151.955 151.551 -.5 -.3 -.3 .1 -.3 Pets and pet products ............................................................ .803 193.056 192.379 -2.1 -.4 -.5 .4 -.5 Pet services including veterinary 2 ......................................... .334 191.904 191.768 3.2 -.1 .1 -.6 .1
Sporting goods 1 ...................................................................... .556 116.813 116.885 -.3 .1 -.1 -.2 .1 Sports vehicles including bicycles 1 ....................................... .335 136.207 137.341 1.7 .8 .0 .0 .8 Sports equipment 1 ................................................................ .216 95.621 94.530 -3.1 -1.1 -.2 -.4 -1.1
Photography 2 .......................................................................... .193 81.310 81.243 -2.9 -.1 -.8 -.9 -.4 Photographic equipment and supplies ................................... .066 70.463 69.907 -8.9 -.8 -1.1 -2.7 -1.6 Photographers and film processing 1 2 .................................. .125 112.894 113.205 .8 .3 -.6 .0 .3
Other recreational goods 2 ....................................................... .578 55.342 55.473 -5.9 .2 -1.3 -.5 .3 Toys 1 ..................................................................................... .439 59.817 59.872 -7.1 .1 -1.2 -.5 .1 Sewing machines, fabric and supplies 2 ................................ .050 91.661 93.077 -.4 1.5 -2.9 -.2 1.7 Music instruments and accessories 2 .................................... .079 96.780 97.029 -2.3 .3 -.6 -.7 .4
Recreation services 2 ............................................................... 1.343 148.606 147.166 .0 -1.0 .6 .2 -1.0 Club dues and fees for participant sports and group
exercises 2 ..................................................................... .348 124.728 122.332 -3.3 -1.9 1.1 .0 -2.0 Admissions 1 .......................................................................... .540 323.670 322.309 1.7 -.4 .2 .2 -.4 Fees for lessons or instructions 1 5 ........................................ .129 265.415 265.504 .7 .0 .1 .1 .0
Recreational reading materials 1 .............................................. .178 223.827 223.703 -.5 -.1 .0 -.2 -.1 Newspapers and magazines 1 2 ............................................ .099 134.159 134.110 -.2 .0 -.1 -.6 .0 Recreational books 1 2 ........................................................... .079 106.595 106.510 -.8 -.1 .1 .2 -.1
Education and communication 2 ................................................ 6.175 125.425 125.818 1.2 .3 .2 .0 -.1 Education 2 .............................................................................. 2.327 198.537 200.329 4.0 .9 .4 .0 -.2 Educational books and supplies ............................................. .196 508.150 512.303 3.1 .8 -.3 -1.1 .6 Tuition, other school fees, and childcare ................................ 2.131 558.909 563.998 4.1 .9 .4 .1 -.3
College tuition and fees ........................................................ .957 652.819 658.827 4.5 .9 .7 .2 -.4 Elementary and high school tuition and fees ....................... .227 625.695 633.431 3.8 1.2 .6 -.9 .2
See footnotes at end of table.
31 CPI Detailed Report-September 2010
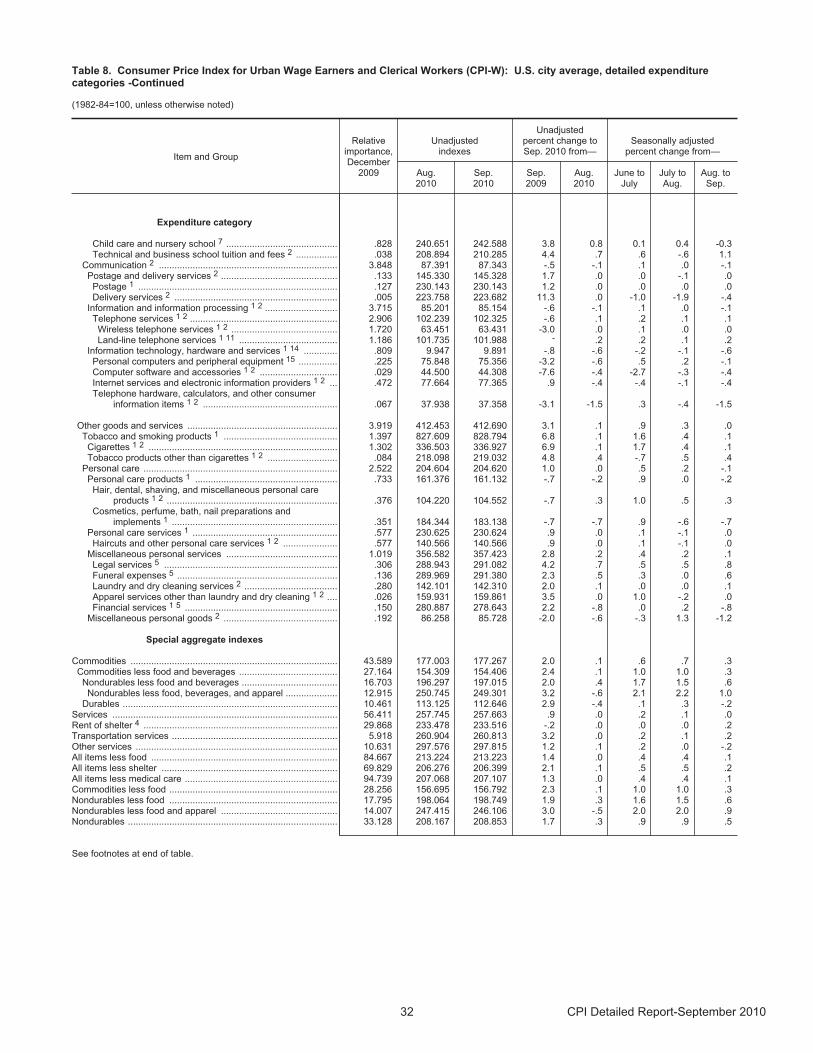
Table 8. Consumer Price Index for Urban Wage Earners and Clerical Workers (CPI-W): U.S. city average, detailed expenditurecategories -Continued
(1982-84=100, unless otherwise noted)
Item and Group
Relativeimportance,December
2009
Unadjustedindexes
Unadjustedpercent change toSep. 2010 from—
Seasonally adjustedpercent change from—
Aug.2010
Sep.2010
Sep.2009
Aug.2010
June toJuly
July toAug.
Aug. toSep.
Expenditure category
Child care and nursery school 7 ........................................... .828 240.651 242.588 3.8 0.8 0.1 0.4 -0.3 Technical and business school tuition and fees 2 ................ .038 208.894 210.285 4.4 .7 .6 -.6 1.1
Communication 2 ..................................................................... 3.848 87.391 87.343 -.5 -.1 .1 .0 -.1 Postage and delivery services 2 ............................................. .133 145.330 145.328 1.7 .0 .0 -.1 .0 Postage 1 ............................................................................. .127 230.143 230.143 1.2 .0 .0 .0 .0 Delivery services 2 ............................................................... .005 223.758 223.682 11.3 .0 -1.0 -1.9 -.4
Information and information processing 1 2 ............................ 3.715 85.201 85.154 -.6 -.1 .1 .0 -.1 Telephone services 1 2 ......................................................... 2.906 102.239 102.325 -.6 .1 .2 .1 .1 Wireless telephone services 1 2 ......................................... 1.720 63.451 63.431 -3.0 .0 .1 .0 .0 Land-line telephone services 1 11 ...................................... 1.186 101.735 101.988 - .2 .2 .1 .2
Information technology, hardware and services 1 14 ............. .809 9.947 9.891 -.8 -.6 -.2 -.1 -.6 Personal computers and peripheral equipment 15 ............... .225 75.848 75.356 -3.2 -.6 .5 .2 -.1 Computer software and accessories 1 2 .............................. .029 44.500 44.308 -7.6 -.4 -2.7 -.3 -.4 Internet services and electronic information providers 1 2 ... .472 77.664 77.365 .9 -.4 -.4 -.1 -.4 Telephone hardware, calculators, and other consumer
information items 1 2 .................................................... .067 37.938 37.358 -3.1 -1.5 .3 -.4 -1.5
Other goods and services .......................................................... 3.919 412.453 412.690 3.1 .1 .9 .3 .0 Tobacco and smoking products 1 ............................................ 1.397 827.609 828.794 6.8 .1 1.6 .4 .1 Cigarettes 1 2 ......................................................................... 1.302 336.503 336.927 6.9 .1 1.7 .4 .1 Tobacco products other than cigarettes 1 2 ........................... .084 218.098 219.032 4.8 .4 -.7 .5 .4
Personal care ........................................................................... 2.522 204.604 204.620 1.0 .0 .5 .2 -.1 Personal care products 1 ....................................................... .733 161.376 161.132 -.7 -.2 .9 .0 -.2 Hair, dental, shaving, and miscellaneous personal care
products 1 2 .................................................................. .376 104.220 104.552 -.7 .3 1.0 .5 .3 Cosmetics, perfume, bath, nail preparations and
implements 1 ................................................................ .351 184.344 183.138 -.7 -.7 .9 -.6 -.7 Personal care services 1 ........................................................ .577 230.625 230.624 .9 .0 .1 -.1 .0 Haircuts and other personal care services 1 2 ..................... .577 140.566 140.566 .9 .0 .1 -.1 .0
Miscellaneous personal services ........................................... 1.019 356.582 357.423 2.8 .2 .4 .2 .1 Legal services 5 ................................................................... .306 288.943 291.082 4.2 .7 .5 .5 .8 Funeral expenses 5 .............................................................. .136 289.969 291.380 2.3 .5 .3 .0 .6 Laundry and dry cleaning services 2 .................................... .280 142.101 142.310 2.0 .1 .0 .0 .1 Apparel services other than laundry and dry cleaning 1 2 .... .026 159.931 159.861 3.5 .0 1.0 -.2 .0 Financial services 1 5 ........................................................... .150 280.887 278.643 2.2 -.8 .0 .2 -.8
Miscellaneous personal goods 2 ............................................ .192 86.258 85.728 -2.0 -.6 -.3 1.3 -1.2
Special aggregate indexes
Commodities ................................................................................ 43.589 177.003 177.267 2.0 .1 .6 .7 .3Commodities less food and beverages ...................................... 27.164 154.309 154.406 2.4 .1 1.0 1.0 .3
Nondurables less food and beverages ..................................... 16.703 196.297 197.015 2.0 .4 1.7 1.5 .6 Nondurables less food, beverages, and apparel .................... 12.915 250.745 249.301 3.2 -.6 2.1 2.2 1.0
Durables ................................................................................... 10.461 113.125 112.646 2.9 -.4 .1 .3 -.2 Services ....................................................................................... 56.411 257.745 257.663 .9 .0 .2 .1 .0 Rent of shelter 4 ........................................................................... 29.868 233.478 233.516 -.2 .0 .0 .0 .2 Transportation services ................................................................ 5.918 260.904 260.813 3.2 .0 .2 .1 .2 Other services .............................................................................. 10.631 297.576 297.815 1.2 .1 .2 .0 -.2 All items less food ........................................................................ 84.667 213.224 213.223 1.4 .0 .4 .4 .1 All items less shelter .................................................................... 69.829 206.276 206.399 2.1 .1 .5 .5 .2 All items less medical care ........................................................... 94.739 207.068 207.107 1.3 .0 .4 .4 .1 Commodities less food ................................................................. 28.256 156.695 156.792 2.3 .1 1.0 1.0 .3 Nondurables less food ................................................................. 17.795 198.064 198.749 1.9 .3 1.6 1.5 .6 Nondurables less food and apparel ............................................. 14.007 247.415 246.106 3.0 -.5 2.0 2.0 .9 Nondurables ................................................................................. 33.128 208.167 208.853 1.7 .3 .9 .9 .5
See footnotes at end of table.
32 CPI Detailed Report-September 2010
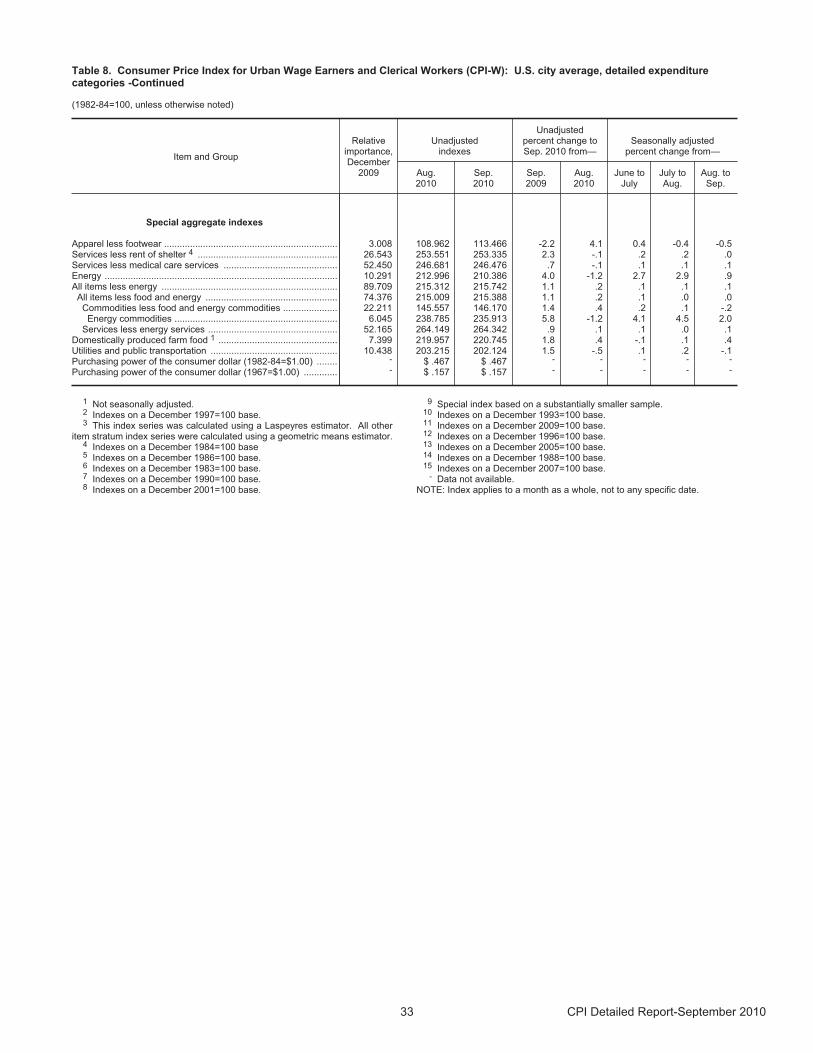
Table 8. Consumer Price Index for Urban Wage Earners and Clerical Workers (CPI-W): U.S. city average, detailed expenditurecategories -Continued
(1982-84=100, unless otherwise noted)
Item and Group
Relativeimportance,December
2009
Unadjustedindexes
Unadjustedpercent change toSep. 2010 from—
Seasonally adjustedpercent change from—
Aug.2010
Sep.2010
Sep.2009
Aug.2010
June toJuly
July toAug.
Aug. toSep.
Special aggregate indexes
Apparel less footwear ................................................................... 3.008 108.962 113.466 -2.2 4.1 0.4 -0.4 -0.5 Services less rent of shelter 4 ...................................................... 26.543 253.551 253.335 2.3 -.1 .2 .2 .0 Services less medical care services ............................................ 52.450 246.681 246.476 .7 -.1 .1 .1 .1 Energy .......................................................................................... 10.291 212.996 210.386 4.0 -1.2 2.7 2.9 .9 All items less energy .................................................................... 89.709 215.312 215.742 1.1 .2 .1 .1 .1
All items less food and energy ................................................... 74.376 215.009 215.388 1.1 .2 .1 .0 .0 Commodities less food and energy commodities ..................... 22.211 145.557 146.170 1.4 .4 .2 .1 -.2 Energy commodities ............................................................... 6.045 238.785 235.913 5.8 -1.2 4.1 4.5 2.0
Services less energy services .................................................. 52.165 264.149 264.342 .9 .1 .1 .0 .1 Domestically produced farm food 1 .............................................. 7.399 219.957 220.745 1.8 .4 -.1 .1 .4 Utilities and public transportation ................................................. 10.438 203.215 202.124 1.5 -.5 .1 .2 -.1 Purchasing power of the consumer dollar (1982-84=$1.00) ........ - $ .467 $ .467 - - - - -
Purchasing power of the consumer dollar (1967=$1.00) ............. - $ .157 $ .157 - - - - -
1 Not seasonally adjusted.2 Indexes on a December 1997=100 base.3 This index series was calculated using a Laspeyres estimator. All other
item stratum index series were calculated using a geometric means estimator.4 Indexes on a December 1984=100 base5 Indexes on a December 1986=100 base.6 Indexes on a December 1983=100 base.7 Indexes on a December 1990=100 base.8 Indexes on a December 2001=100 base.
9 Special index based on a substantially smaller sample.10 Indexes on a December 1993=100 base.11 Indexes on a December 2009=100 base.12 Indexes on a December 1996=100 base.13 Indexes on a December 2005=100 base.14 Indexes on a December 1988=100 base.15 Indexes on a December 2007=100 base.
- Data not available.NOTE: Index applies to a month as a whole, not to any specific date.
33 CPI Detailed Report-September 2010
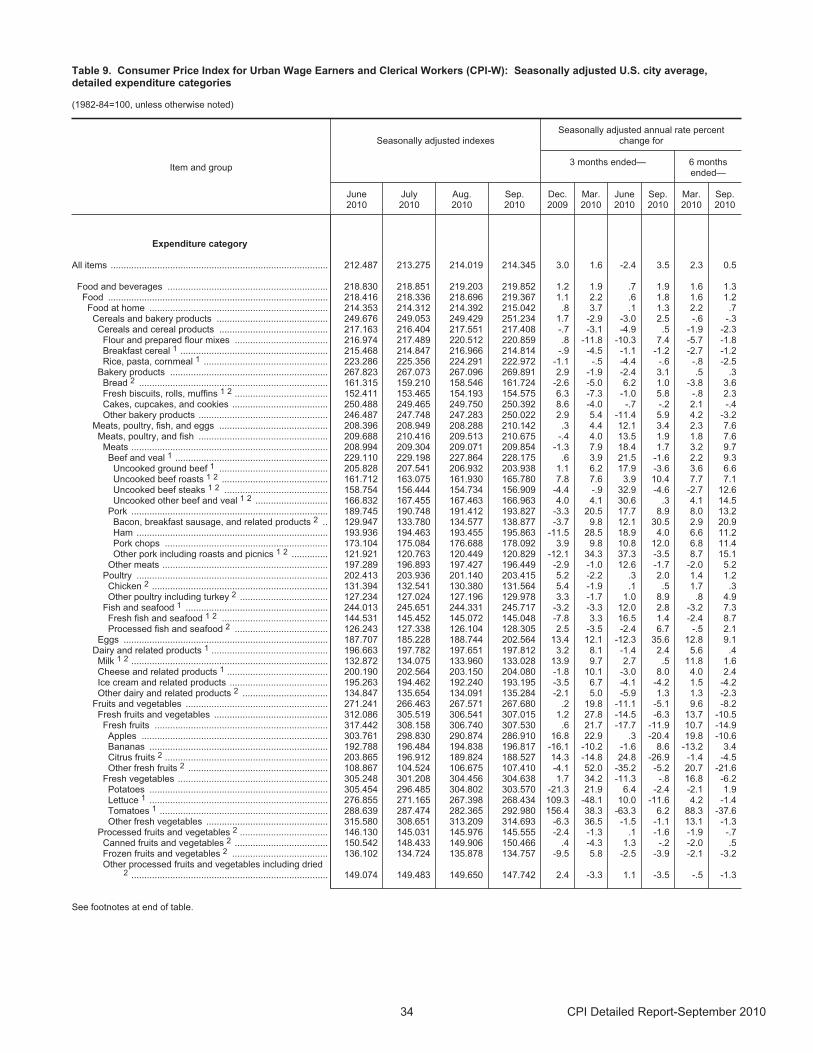
Table 9. Consumer Price Index for Urban Wage Earners and Clerical Workers (CPI-W): Seasonally adjusted U.S. city average,detailed expenditure categories
(1982-84=100, unless otherwise noted)
Item and group
Seasonally adjusted indexesSeasonally adjusted annual rate percent
change for
3 months ended— 6 monthsended—
June2010
July2010
Aug.2010
Sep.2010
Dec.2009
Mar.2010
June2010
Sep.2010
Mar.2010
Sep.2010
Expenditure category
All items .................................................................................... 212.487 213.275 214.019 214.345 3.0 1.6 -2.4 3.5 2.3 0.5
Food and beverages .............................................................. 218.830 218.851 219.203 219.852 1.2 1.9 .7 1.9 1.6 1.3 Food ..................................................................................... 218.416 218.336 218.696 219.367 1.1 2.2 .6 1.8 1.6 1.2
Food at home ..................................................................... 214.353 214.312 214.392 215.042 .8 3.7 .1 1.3 2.2 .7 Cereals and bakery products ........................................... 249.676 249.053 249.429 251.234 1.7 -2.9 -3.0 2.5 -.6 -.3 Cereals and cereal products .......................................... 217.163 216.404 217.551 217.408 -.7 -3.1 -4.9 .5 -1.9 -2.3
Flour and prepared flour mixes .................................... 216.974 217.489 220.512 220.859 .8 -11.8 -10.3 7.4 -5.7 -1.8 Breakfast cereal 1 ......................................................... 215.468 214.847 216.966 214.814 -.9 -4.5 -1.1 -1.2 -2.7 -1.2 Rice, pasta, cornmeal 1 ................................................ 223.286 225.356 224.291 222.972 -1.1 -.5 -4.4 -.6 -.8 -2.5
Bakery products ............................................................. 267.823 267.073 267.096 269.891 2.9 -1.9 -2.4 3.1 .5 .3 Bread 2 ......................................................................... 161.315 159.210 158.546 161.724 -2.6 -5.0 6.2 1.0 -3.8 3.6 Fresh biscuits, rolls, muffins 1 2 .................................... 152.411 153.465 154.193 154.575 6.3 -7.3 -1.0 5.8 -.8 2.3 Cakes, cupcakes, and cookies ..................................... 250.488 249.465 249.750 250.392 8.6 -4.0 -.7 -.2 2.1 -.4 Other bakery products .................................................. 246.487 247.748 247.283 250.022 2.9 5.4 -11.4 5.9 4.2 -3.2
Meats, poultry, fish, and eggs .......................................... 208.396 208.949 208.288 210.142 .3 4.4 12.1 3.4 2.3 7.6 Meats, poultry, and fish .................................................. 209.688 210.416 209.513 210.675 -.4 4.0 13.5 1.9 1.8 7.6
Meats ............................................................................ 208.994 209.304 209.071 209.854 -1.3 7.9 18.4 1.7 3.2 9.7 Beef and veal 1 ........................................................... 229.110 229.198 227.864 228.175 .6 3.9 21.5 -1.6 2.2 9.3 Uncooked ground beef 1 .......................................... 205.828 207.541 206.932 203.938 1.1 6.2 17.9 -3.6 3.6 6.6 Uncooked beef roasts 1 2 ......................................... 161.712 163.075 161.930 165.780 7.8 7.6 3.9 10.4 7.7 7.1 Uncooked beef steaks 1 2 ........................................ 158.754 156.444 154.734 156.909 -4.4 -.9 32.9 -4.6 -2.7 12.6 Uncooked other beef and veal 1 2 ............................ 166.832 167.455 167.463 166.963 4.0 4.1 30.6 .3 4.1 14.5
Pork ............................................................................ 189.745 190.748 191.412 193.827 -3.3 20.5 17.7 8.9 8.0 13.2 Bacon, breakfast sausage, and related products 2 .. 129.947 133.780 134.577 138.877 -3.7 9.8 12.1 30.5 2.9 20.9 Ham .......................................................................... 193.936 194.463 193.455 195.863 -11.5 28.5 18.9 4.0 6.6 11.2 Pork chops ............................................................... 173.104 175.084 176.688 178.092 3.9 9.8 10.8 12.0 6.8 11.4Other pork including roasts and picnics 1 2 .............. 121.921 120.763 120.449 120.829 -12.1 34.3 37.3 -3.5 8.7 15.1
Other meats ................................................................ 197.289 196.893 197.427 196.449 -2.9 -1.0 12.6 -1.7 -2.0 5.2 Poultry .......................................................................... 202.413 203.936 201.140 203.415 5.2 -2.2 .3 2.0 1.4 1.2
Chicken 2 .................................................................... 131.394 132.541 130.380 131.564 5.4 -1.9 .1 .5 1.7 .3 Other poultry including turkey 2 .................................. 127.234 127.024 127.196 129.978 3.3 -1.7 1.0 8.9 .8 4.9
Fish and seafood 1 ....................................................... 244.013 245.651 244.331 245.717 -3.2 -3.3 12.0 2.8 -3.2 7.3 Fresh fish and seafood 1 2 ......................................... 144.531 145.452 145.072 145.048 -7.8 3.3 16.5 1.4 -2.4 8.7 Processed fish and seafood 2 .................................... 126.243 127.338 126.104 128.305 2.5 -3.5 -2.4 6.7 -.5 2.1
Eggs ............................................................................... 187.707 185.228 188.744 202.564 13.4 12.1 -12.3 35.6 12.8 9.1 Dairy and related products 1 ............................................. 196.663 197.782 197.651 197.812 3.2 8.1 -1.4 2.4 5.6 .4 Milk 1 2 ............................................................................ 132.872 134.075 133.960 133.028 13.9 9.7 2.7 .5 11.8 1.6 Cheese and related products 1 ....................................... 200.190 202.564 203.150 204.080 -1.8 10.1 -3.0 8.0 4.0 2.4 Ice cream and related products ...................................... 195.263 194.462 192.240 193.195 -3.5 6.7 -4.1 -4.2 1.5 -4.2 Other dairy and related products 2 ................................. 134.847 135.654 134.091 135.284 -2.1 5.0 -5.9 1.3 1.3 -2.3
Fruits and vegetables ....................................................... 271.241 266.463 267.571 267.680 .2 19.8 -11.1 -5.1 9.6 -8.2 Fresh fruits and vegetables ............................................ 312.086 305.519 306.541 307.015 1.2 27.8 -14.5 -6.3 13.7 -10.5 Fresh fruits ................................................................... 317.442 308.158 306.740 307.530 .6 21.7 -17.7 -11.9 10.7 -14.9
Apples ........................................................................ 303.761 298.830 290.874 286.910 16.8 22.9 .3 -20.4 19.8 -10.6 Bananas ..................................................................... 192.788 196.484 194.838 196.817 -16.1 -10.2 -1.6 8.6 -13.2 3.4 Citrus fruits 2 ............................................................... 203.865 196.912 189.824 188.527 14.3 -14.8 24.8 -26.9 -1.4 -4.5 Other fresh fruits 2 ...................................................... 108.867 104.524 106.675 107.410 -4.1 52.0 -35.2 -5.2 20.7 -21.6
Fresh vegetables .......................................................... 305.248 301.208 304.456 304.638 1.7 34.2 -11.3 -.8 16.8 -6.2 Potatoes ..................................................................... 305.454 296.485 304.802 303.570 -21.3 21.9 6.4 -2.4 -2.1 1.9 Lettuce 1 ..................................................................... 276.855 271.165 267.398 268.434 109.3 -48.1 10.0 -11.6 4.2 -1.4 Tomatoes 1 ................................................................. 288.639 287.474 282.365 292.980 156.4 38.3 -63.3 6.2 88.3 -37.6Other fresh vegetables ............................................... 315.580 308.651 313.209 314.693 -6.3 36.5 -1.5 -1.1 13.1 -1.3
Processed fruits and vegetables 2 .................................. 146.130 145.031 145.976 145.555 -2.4 -1.3 .1 -1.6 -1.9 -.7 Canned fruits and vegetables 2 .................................... 150.542 148.433 149.906 150.466 .4 -4.3 1.3 -.2 -2.0 .5 Frozen fruits and vegetables 2 ..................................... 136.102 134.724 135.878 134.757 -9.5 5.8 -2.5 -3.9 -2.1 -3.2 Other processed fruits and vegetables including dried
2 ............................................................................ 149.074 149.483 149.650 147.742 2.4 -3.3 1.1 -3.5 -.5 -1.3
See footnotes at end of table.
34 CPI Detailed Report-September 2010
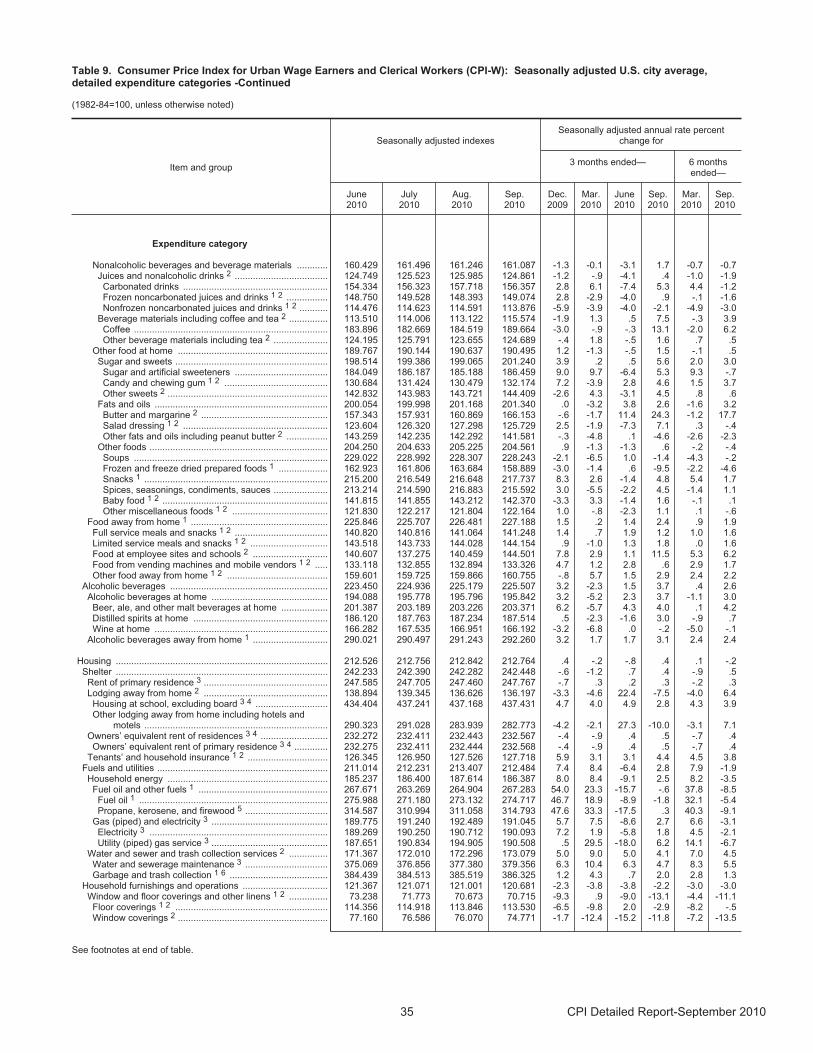
Table 9. Consumer Price Index for Urban Wage Earners and Clerical Workers (CPI-W): Seasonally adjusted U.S. city average,detailed expenditure categories -Continued
(1982-84=100, unless otherwise noted)
Item and group
Seasonally adjusted indexesSeasonally adjusted annual rate percent
change for
3 months ended— 6 monthsended—
June2010
July2010
Aug.2010
Sep.2010
Dec.2009
Mar.2010
June2010
Sep.2010
Mar.2010
Sep.2010
Expenditure category
Nonalcoholic beverages and beverage materials ............ 160.429 161.496 161.246 161.087 -1.3 -0.1 -3.1 1.7 -0.7 -0.7 Juices and nonalcoholic drinks 2 .................................... 124.749 125.523 125.985 124.861 -1.2 -.9 -4.1 .4 -1.0 -1.9 Carbonated drinks ........................................................ 154.334 156.323 157.718 156.357 2.8 6.1 -7.4 5.3 4.4 -1.2Frozen noncarbonated juices and drinks 1 2 ................ 148.750 149.528 148.393 149.074 2.8 -2.9 -4.0 .9 -.1 -1.6 Nonfrozen noncarbonated juices and drinks 1 2 ........... 114.476 114.623 114.591 113.876 -5.9 -3.9 -4.0 -2.1 -4.9 -3.0
Beverage materials including coffee and tea 2 ............... 113.510 114.006 113.122 115.574 -1.9 1.3 .5 7.5 -.3 3.9 Coffee ........................................................................... 183.896 182.669 184.519 189.664 -3.0 -.9 -.3 13.1 -2.0 6.2 Other beverage materials including tea 2 ..................... 124.195 125.791 123.655 124.689 -.4 1.8 -.5 1.6 .7 .5
Other food at home .......................................................... 189.767 190.144 190.637 190.495 1.2 -1.3 -.5 1.5 -.1 .5 Sugar and sweets ........................................................... 198.514 199.386 199.065 201.240 3.9 .2 .5 5.6 2.0 3.0
Sugar and artificial sweeteners .................................... 184.049 186.187 185.188 186.459 9.0 9.7 -6.4 5.3 9.3 -.7 Candy and chewing gum 1 2 ........................................ 130.684 131.424 130.479 132.174 7.2 -3.9 2.8 4.6 1.5 3.7 Other sweets 2 .............................................................. 142.832 143.983 143.721 144.409 -2.6 4.3 -3.1 4.5 .8 .6
Fats and oils ................................................................... 200.054 199.998 201.168 201.340 .0 -3.2 3.8 2.6 -1.6 3.2 Butter and margarine 2 ................................................. 157.343 157.931 160.869 166.153 -.6 -1.7 11.4 24.3 -1.2 17.7 Salad dressing 1 2 ........................................................ 123.604 126.320 127.298 125.729 2.5 -1.9 -7.3 7.1 .3 -.4 Other fats and oils including peanut butter 2 ................ 143.259 142.235 142.292 141.581 -.3 -4.8 .1 -4.6 -2.6 -2.3
Other foods ..................................................................... 204.250 204.633 205.225 204.561 .9 -1.3 -1.3 .6 -.2 -.4 Soups ........................................................................... 229.022 228.992 228.307 228.243 -2.1 -6.5 1.0 -1.4 -4.3 -.2 Frozen and freeze dried prepared foods 1 ................... 162.923 161.806 163.684 158.889 -3.0 -1.4 .6 -9.5 -2.2 -4.6 Snacks 1 ....................................................................... 215.200 216.549 216.648 217.737 8.3 2.6 -1.4 4.8 5.4 1.7Spices, seasonings, condiments, sauces ..................... 213.214 214.590 216.883 215.592 3.0 -5.5 -2.2 4.5 -1.4 1.1 Baby food 1 2 ................................................................ 141.815 141.855 143.212 142.370 -3.3 3.3 -1.4 1.6 -.1 .1 Other miscellaneous foods 1 2 ..................................... 121.830 122.217 121.804 122.164 1.0 -.8 -2.3 1.1 .1 -.6
Food away from home 1 ..................................................... 225.846 225.707 226.481 227.188 1.5 .2 1.4 2.4 .9 1.9 Full service meals and snacks 1 2 .................................... 140.820 140.816 141.064 141.248 1.4 .7 1.9 1.2 1.0 1.6 Limited service meals and snacks 1 2 .............................. 143.518 143.733 144.028 144.154 .9 -1.0 1.3 1.8 .0 1.6 Food at employee sites and schools 2 ............................. 140.607 137.275 140.459 144.501 7.8 2.9 1.1 11.5 5.3 6.2 Food from vending machines and mobile vendors 1 2 ..... 133.118 132.855 132.894 133.326 4.7 1.2 2.8 .6 2.9 1.7 Other food away from home 1 2 ....................................... 159.601 159.725 159.866 160.755 -.8 5.7 1.5 2.9 2.4 2.2
Alcoholic beverages ............................................................. 223.450 224.936 225.179 225.507 3.2 -2.3 1.5 3.7 .4 2.6 Alcoholic beverages at home ............................................. 194.088 195.778 195.796 195.842 3.2 -5.2 2.3 3.7 -1.1 3.0
Beer, ale, and other malt beverages at home .................. 201.387 203.189 203.226 203.371 6.2 -5.7 4.3 4.0 .1 4.2 Distilled spirits at home .................................................... 186.120 187.763 187.234 187.514 .5 -2.3 -1.6 3.0 -.9 .7 Wine at home ................................................................... 166.282 167.535 166.951 166.192 -3.2 -6.8 .0 -.2 -5.0 -.1
Alcoholic beverages away from home 1 ............................. 290.021 290.497 291.243 292.260 3.2 1.7 1.7 3.1 2.4 2.4
Housing .................................................................................. 212.526 212.756 212.842 212.764 .4 -.2 -.8 .4 .1 -.2 Shelter .................................................................................. 242.233 242.390 242.282 242.448 -.6 -1.2 .7 .4 -.9 .5
Rent of primary residence 3 ................................................ 247.585 247.705 247.460 247.767 -.7 .3 .2 .3 -.2 .3 Lodging away from home 2 ................................................ 138.894 139.345 136.626 136.197 -3.3 -4.6 22.4 -7.5 -4.0 6.4 Housing at school, excluding board 3 4 ............................ 434.404 437.241 437.168 437.431 4.7 4.0 4.9 2.8 4.3 3.9 Other lodging away from home including hotels and
motels ....................................................................... 290.323 291.028 283.939 282.773 -4.2 -2.1 27.3 -10.0 -3.1 7.1 Owners’ equivalent rent of residences 3 4 .......................... 232.272 232.411 232.443 232.567 -.4 -.9 .4 .5 -.7 .4 Owners’ equivalent rent of primary residence 3 4 ............. 232.275 232.411 232.444 232.568 -.4 -.9 .4 .5 -.7 .4
Tenants’ and household insurance 1 2 ............................... 126.345 126.950 127.526 127.718 5.9 3.1 3.1 4.4 4.5 3.8 Fuels and utilities .................................................................. 211.014 212.231 213.407 212.484 7.4 8.4 -6.4 2.8 7.9 -1.9
Household energy .............................................................. 185.237 186.400 187.614 186.387 8.0 8.4 -9.1 2.5 8.2 -3.5 Fuel oil and other fuels 1 .................................................. 267.671 263.269 264.904 267.283 54.0 23.3 -15.7 -.6 37.8 -8.5 Fuel oil 1 ......................................................................... 275.988 271.180 273.132 274.717 46.7 18.9 -8.9 -1.8 32.1 -5.4 Propane, kerosene, and firewood 5 ................................ 314.587 310.994 311.058 314.793 47.6 33.3 -17.5 .3 40.3 -9.1
Gas (piped) and electricity 3 ............................................. 189.775 191.240 192.489 191.045 5.7 7.5 -8.6 2.7 6.6 -3.1 Electricity 3 ..................................................................... 189.269 190.250 190.712 190.093 7.2 1.9 -5.8 1.8 4.5 -2.1 Utility (piped) gas service 3 ............................................. 187.651 190.834 194.905 190.508 .5 29.5 -18.0 6.2 14.1 -6.7
Water and sewer and trash collection services 2 ............... 171.367 172.010 172.296 173.079 5.0 9.0 5.0 4.1 7.0 4.5 Water and sewerage maintenance 3 ................................ 375.069 376.856 377.380 379.356 6.3 10.4 6.3 4.7 8.3 5.5 Garbage and trash collection 1 6 ...................................... 384.439 384.513 385.519 386.325 1.2 4.3 .7 2.0 2.8 1.3
Household furnishings and operations ................................. 121.367 121.071 121.001 120.681 -2.3 -3.8 -3.8 -2.2 -3.0 -3.0Window and floor coverings and other linens 1 2 ............... 73.238 71.773 70.673 70.715 -9.3 .9 -9.0 -13.1 -4.4 -11.1 Floor coverings 1 2 ........................................................... 114.356 114.918 113.846 113.530 -6.5 -9.8 2.0 -2.9 -8.2 -.5 Window coverings 2 .......................................................... 77.160 76.586 76.070 74.771 -1.7 -12.4 -15.2 -11.8 -7.2 -13.5
See footnotes at end of table.
35 CPI Detailed Report-September 2010
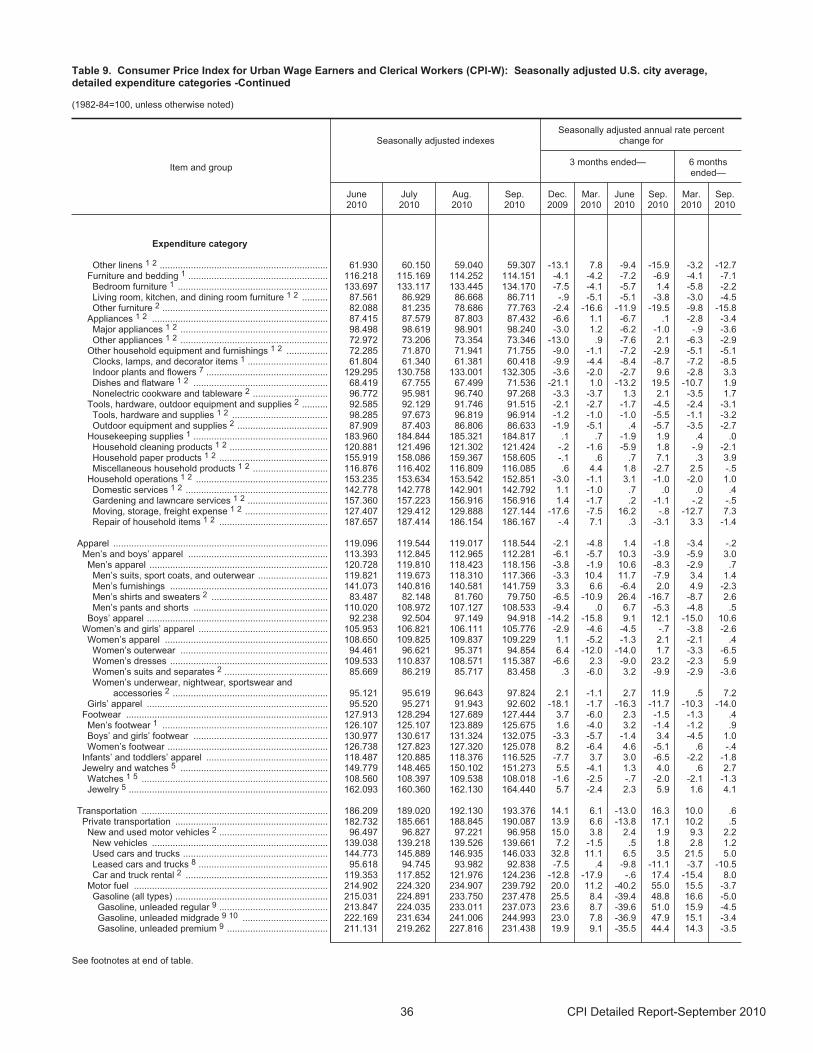
Table 9. Consumer Price Index for Urban Wage Earners and Clerical Workers (CPI-W): Seasonally adjusted U.S. city average,detailed expenditure categories -Continued
(1982-84=100, unless otherwise noted)
Item and group
Seasonally adjusted indexesSeasonally adjusted annual rate percent
change for
3 months ended— 6 monthsended—
June2010
July2010
Aug.2010
Sep.2010
Dec.2009
Mar.2010
June2010
Sep.2010
Mar.2010
Sep.2010
Expenditure category
Other linens 1 2 ................................................................. 61.930 60.150 59.040 59.307 -13.1 7.8 -9.4 -15.9 -3.2 -12.7 Furniture and bedding 1 ...................................................... 116.218 115.169 114.252 114.151 -4.1 -4.2 -7.2 -6.9 -4.1 -7.1 Bedroom furniture 1 .......................................................... 133.697 133.117 133.445 134.170 -7.5 -4.1 -5.7 1.4 -5.8 -2.2 Living room, kitchen, and dining room furniture 1 2 .......... 87.561 86.929 86.668 86.711 -.9 -5.1 -5.1 -3.8 -3.0 -4.5 Other furniture 2 ................................................................ 82.088 81.235 78.686 77.763 -2.4 -16.6 -11.9 -19.5 -9.8 -15.8
Appliances 1 2 .................................................................... 87.415 87.579 87.803 87.432 -6.6 1.1 -6.7 .1 -2.8 -3.4 Major appliances 1 2 ......................................................... 98.498 98.619 98.901 98.240 -3.0 1.2 -6.2 -1.0 -.9 -3.6 Other appliances 1 2 ......................................................... 72.972 73.206 73.354 73.346 -13.0 .9 -7.6 2.1 -6.3 -2.9
Other household equipment and furnishings 1 2 ................ 72.285 71.870 71.941 71.755 -9.0 -1.1 -7.2 -2.9 -5.1 -5.1 Clocks, lamps, and decorator items 1 ............................... 61.804 61.340 61.381 60.418 -9.9 -4.4 -8.4 -8.7 -7.2 -8.5 Indoor plants and flowers 7 ............................................... 129.295 130.758 133.001 132.305 -3.6 -2.0 -2.7 9.6 -2.8 3.3 Dishes and flatware 1 2 .................................................... 68.419 67.755 67.499 71.536 -21.1 1.0 -13.2 19.5 -10.7 1.9 Nonelectric cookware and tableware 2 ............................. 96.772 95.981 96.740 97.268 -3.3 -3.7 1.3 2.1 -3.5 1.7
Tools, hardware, outdoor equipment and supplies 2 .......... 92.585 92.129 91.746 91.515 -2.1 -2.7 -1.7 -4.5 -2.4 -3.1 Tools, hardware and supplies 1 2 ..................................... 98.285 97.673 96.819 96.914 -1.2 -1.0 -1.0 -5.5 -1.1 -3.2 Outdoor equipment and supplies 2 ................................... 87.909 87.403 86.806 86.633 -1.9 -5.1 .4 -5.7 -3.5 -2.7
Housekeeping supplies 1 .................................................... 183.960 184.844 185.321 184.817 .1 .7 -1.9 1.9 .4 .0 Household cleaning products 1 2 ...................................... 120.881 121.496 121.302 121.424 -.2 -1.6 -5.9 1.8 -.9 -2.1 Household paper products 1 2 .......................................... 155.919 158.086 159.367 158.605 -.1 .6 .7 7.1 .3 3.9 Miscellaneous household products 1 2 ............................. 116.876 116.402 116.809 116.085 .6 4.4 1.8 -2.7 2.5 -.5
Household operations 1 2 ................................................... 153.235 153.634 153.542 152.851 -3.0 -1.1 3.1 -1.0 -2.0 1.0 Domestic services 1 2 ....................................................... 142.778 142.778 142.901 142.792 1.1 -1.0 .7 .0 .0 .4 Gardening and lawncare services 1 2 ............................... 157.360 157.223 156.916 156.916 1.4 -1.7 .2 -1.1 -.2 -.5 Moving, storage, freight expense 1 2 ................................ 127.407 129.412 129.888 127.144 -17.6 -7.5 16.2 -.8 -12.7 7.3 Repair of household items 1 2 .......................................... 187.657 187.414 186.154 186.167 -.4 7.1 .3 -3.1 3.3 -1.4
Apparel ................................................................................... 119.096 119.544 119.017 118.544 -2.1 -4.8 1.4 -1.8 -3.4 -.2 Men’s and boys’ apparel ...................................................... 113.393 112.845 112.965 112.281 -6.1 -5.7 10.3 -3.9 -5.9 3.0 Men’s apparel ..................................................................... 120.728 119.810 118.423 118.156 -3.8 -1.9 10.6 -8.3 -2.9 .7
Men’s suits, sport coats, and outerwear ........................... 119.821 119.673 118.310 117.366 -3.3 10.4 11.7 -7.9 3.4 1.4 Men’s furnishings ............................................................. 141.073 140.816 140.581 141.759 3.3 6.6 -6.4 2.0 4.9 -2.3 Men’s shirts and sweaters 2 ............................................. 83.487 82.148 81.760 79.750 -6.5 -10.9 26.4 -16.7 -8.7 2.6 Men’s pants and shorts .................................................... 110.020 108.972 107.127 108.533 -9.4 .0 6.7 -5.3 -4.8 .5
Boys’ apparel ...................................................................... 92.238 92.504 97.149 94.918 -14.2 -15.8 9.1 12.1 -15.0 10.6 Women’s and girls’ apparel .................................................. 105.953 106.821 106.111 105.776 -2.9 -4.6 -4.5 -.7 -3.8 -2.6
Women’s apparel ............................................................... 108.650 109.825 109.837 109.229 1.1 -5.2 -1.3 2.1 -2.1 .4 Women’s outerwear ......................................................... 94.461 96.621 95.371 94.854 6.4 -12.0 -14.0 1.7 -3.3 -6.5Women’s dresses ............................................................. 109.533 110.837 108.571 115.387 -6.6 2.3 -9.0 23.2 -2.3 5.9 Women’s suits and separates 2 ........................................ 85.669 86.219 85.717 83.458 .3 -6.0 3.2 -9.9 -2.9 -3.6 Women’s underwear, nightwear, sportswear and
accessories 2 ............................................................ 95.121 95.619 96.643 97.824 2.1 -1.1 2.7 11.9 .5 7.2 Girls’ apparel ...................................................................... 95.520 95.271 91.943 92.602 -18.1 -1.7 -16.3 -11.7 -10.3 -14.0
Footwear .............................................................................. 127.913 128.294 127.689 127.444 3.7 -6.0 2.3 -1.5 -1.3 .4 Men’s footwear 1 ................................................................ 126.107 125.107 123.889 125.675 1.6 -4.0 3.2 -1.4 -1.2 .9 Boys’ and girls’ footwear .................................................... 130.977 130.617 131.324 132.075 -3.3 -5.7 -1.4 3.4 -4.5 1.0 Women’s footwear .............................................................. 126.738 127.823 127.320 125.078 8.2 -6.4 4.6 -5.1 .6 -.4
Infants’ and toddlers’ apparel ............................................... 118.487 120.885 118.376 116.525 -7.7 3.7 3.0 -6.5 -2.2 -1.8 Jewelry and watches 5 ......................................................... 149.779 148.465 150.102 151.273 5.5 -4.1 1.3 4.0 .6 2.7
Watches 1 5 ........................................................................ 108.560 108.397 109.538 108.018 -1.6 -2.5 -.7 -2.0 -2.1 -1.3 Jewelry 5 ............................................................................. 162.093 160.360 162.130 164.440 5.7 -2.4 2.3 5.9 1.6 4.1
Transportation ........................................................................ 186.209 189.020 192.130 193.376 14.1 6.1 -13.0 16.3 10.0 .6 Private transportation ........................................................... 182.732 185.661 188.845 190.087 13.9 6.6 -13.8 17.1 10.2 .5
New and used motor vehicles 2 .......................................... 96.497 96.827 97.221 96.958 15.0 3.8 2.4 1.9 9.3 2.2 New vehicles .................................................................... 139.038 139.218 139.526 139.661 7.2 -1.5 .5 1.8 2.8 1.2 Used cars and trucks ........................................................ 144.773 145.889 146.935 146.033 32.8 11.1 6.5 3.5 21.5 5.0 Leased cars and trucks 8 .................................................. 95.618 94.745 93.982 92.838 -7.5 .4 -9.8 -11.1 -3.7 -10.5 Car and truck rental 2 ....................................................... 119.353 117.852 121.976 124.236 -12.8 -17.9 -.6 17.4 -15.4 8.0
Motor fuel ........................................................................... 214.902 224.320 234.907 239.792 20.0 11.2 -40.2 55.0 15.5 -3.7 Gasoline (all types) ........................................................... 215.031 224.891 233.750 237.478 25.5 8.4 -39.4 48.8 16.6 -5.0 Gasoline, unleaded regular 9 .......................................... 213.847 224.035 233.011 237.073 23.6 8.7 -39.6 51.0 15.9 -4.5 Gasoline, unleaded midgrade 9 10 ................................. 222.169 231.634 241.006 244.993 23.0 7.8 -36.9 47.9 15.1 -3.4 Gasoline, unleaded premium 9 ....................................... 211.131 219.262 227.816 231.438 19.9 9.1 -35.5 44.4 14.3 -3.5
See footnotes at end of table.
36 CPI Detailed Report-September 2010
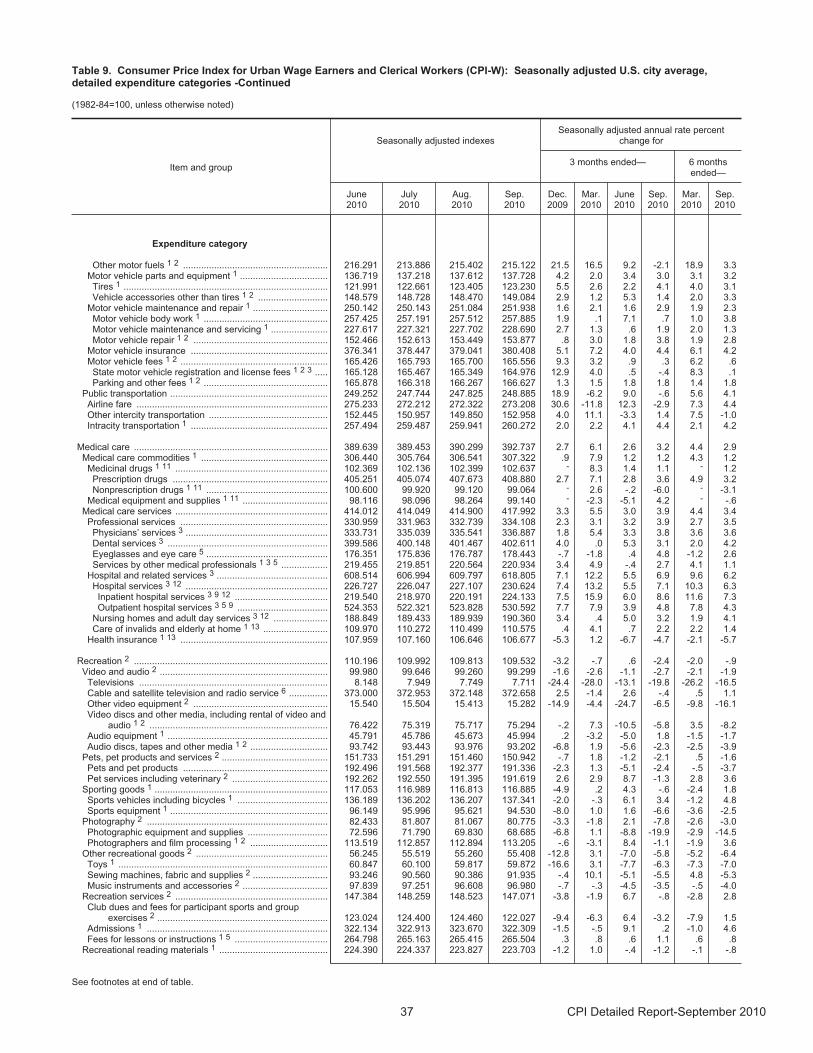
Table 9. Consumer Price Index for Urban Wage Earners and Clerical Workers (CPI-W): Seasonally adjusted U.S. city average,detailed expenditure categories -Continued
(1982-84=100, unless otherwise noted)
Item and group
Seasonally adjusted indexesSeasonally adjusted annual rate percent
change for
3 months ended— 6 monthsended—
June2010
July2010
Aug.2010
Sep.2010
Dec.2009
Mar.2010
June2010
Sep.2010
Mar.2010
Sep.2010
Expenditure category
Other motor fuels 1 2 ........................................................ 216.291 213.886 215.402 215.122 21.5 16.5 9.2 -2.1 18.9 3.3 Motor vehicle parts and equipment 1 .................................. 136.719 137.218 137.612 137.728 4.2 2.0 3.4 3.0 3.1 3.2 Tires 1 ............................................................................... 121.991 122.661 123.405 123.230 5.5 2.6 2.2 4.1 4.0 3.1 Vehicle accessories other than tires 1 2 ........................... 148.579 148.728 148.470 149.084 2.9 1.2 5.3 1.4 2.0 3.3
Motor vehicle maintenance and repair 1 ............................. 250.142 250.143 251.084 251.938 1.6 2.1 1.6 2.9 1.9 2.3 Motor vehicle body work 1 ................................................ 257.425 257.191 257.512 257.885 1.9 .1 7.1 .7 1.0 3.8 Motor vehicle maintenance and servicing 1 ...................... 227.617 227.321 227.702 228.690 2.7 1.3 .6 1.9 2.0 1.3 Motor vehicle repair 1 2 .................................................... 152.466 152.613 153.449 153.877 .8 3.0 1.8 3.8 1.9 2.8
Motor vehicle insurance ..................................................... 376.341 378.447 379.041 380.408 5.1 7.2 4.0 4.4 6.1 4.2 Motor vehicle fees 1 2 ......................................................... 165.426 165.793 165.700 165.556 9.3 3.2 .9 .3 6.2 .6 State motor vehicle registration and license fees 1 2 3 ..... 165.128 165.467 165.349 164.976 12.9 4.0 .5 -.4 8.3 .1 Parking and other fees 1 2 ................................................ 165.878 166.318 166.267 166.627 1.3 1.5 1.8 1.8 1.4 1.8
Public transportation ............................................................. 249.252 247.744 247.825 248.885 18.9 -6.2 9.0 -.6 5.6 4.1 Airline fare .......................................................................... 275.233 272.212 272.322 273.208 30.6 -11.8 12.3 -2.9 7.3 4.4 Other intercity transportation .............................................. 152.445 150.957 149.850 152.958 4.0 11.1 -3.3 1.4 7.5 -1.0 Intracity transportation 1 ..................................................... 257.494 259.487 259.941 260.272 2.0 2.2 4.1 4.4 2.1 4.2
Medical care ........................................................................... 389.639 389.453 390.299 392.737 2.7 6.1 2.6 3.2 4.4 2.9 Medical care commodities 1 ................................................. 306.440 305.764 306.541 307.322 .9 7.9 1.2 1.2 4.3 1.2 Medicinal drugs 1 11 ........................................................... 102.369 102.136 102.399 102.637 - 8.3 1.4 1.1 - 1.2 Prescription drugs ............................................................ 405.251 405.074 407.673 408.880 2.7 7.1 2.8 3.6 4.9 3.2 Nonprescription drugs 1 11 ............................................... 100.600 99.920 99.120 99.064 - 2.6 -.2 -6.0 - -3.1
Medical equipment and supplies 1 11 ................................. 98.116 98.096 98.264 99.140 - -2.3 -5.1 4.2 - -.6 Medical care services ........................................................... 414.012 414.049 414.900 417.992 3.3 5.5 3.0 3.9 4.4 3.4
Professional services ......................................................... 330.959 331.963 332.739 334.108 2.3 3.1 3.2 3.9 2.7 3.5 Physicians’ services 3 ....................................................... 333.731 335.039 335.541 336.887 1.8 5.4 3.3 3.8 3.6 3.6 Dental services 3 .............................................................. 399.586 400.148 401.467 402.611 4.0 .0 5.3 3.1 2.0 4.2 Eyeglasses and eye care 5 ............................................... 176.351 175.836 176.787 178.443 -.7 -1.8 .4 4.8 -1.2 2.6 Services by other medical professionals 1 3 5 .................. 219.455 219.851 220.564 220.934 3.4 4.9 -.4 2.7 4.1 1.1
Hospital and related services 3 ........................................... 608.514 606.994 609.797 618.805 7.1 12.2 5.5 6.9 9.6 6.2 Hospital services 3 12 ....................................................... 226.727 226.047 227.107 230.624 7.4 13.2 5.5 7.1 10.3 6.3 Inpatient hospital services 3 9 12 .................................... 219.540 218.970 220.191 224.133 7.5 15.9 6.0 8.6 11.6 7.3 Outpatient hospital services 3 5 9 ................................... 524.353 522.321 523.828 530.592 7.7 7.9 3.9 4.8 7.8 4.3
Nursing homes and adult day services 3 12 ..................... 188.849 189.433 189.939 190.360 3.4 .4 5.0 3.2 1.9 4.1 Care of invalids and elderly at home 1 13 ......................... 109.970 110.272 110.499 110.575 .4 4.1 .7 2.2 2.2 1.4
Health insurance 1 13 ......................................................... 107.959 107.160 106.646 106.677 -5.3 1.2 -6.7 -4.7 -2.1 -5.7
Recreation 2 ........................................................................... 110.196 109.992 109.813 109.532 -3.2 -.7 .6 -2.4 -2.0 -.9 Video and audio 2 ................................................................. 99.980 99.646 99.260 99.299 -1.6 -2.6 -1.1 -2.7 -2.1 -1.9 Televisions ......................................................................... 8.148 7.949 7.749 7.711 -24.4 -28.0 -13.1 -19.8 -26.2 -16.5 Cable and satellite television and radio service 6 ............... 373.000 372.953 372.148 372.658 2.5 -1.4 2.6 -.4 .5 1.1 Other video equipment 2 .................................................... 15.540 15.504 15.413 15.282 -14.9 -4.4 -24.7 -6.5 -9.8 -16.1 Video discs and other media, including rental of video and
audio 1 2 ..................................................................... 76.422 75.319 75.717 75.294 -.2 7.3 -10.5 -5.8 3.5 -8.2 Audio equipment 1 .............................................................. 45.791 45.786 45.673 45.994 .2 -3.2 -5.0 1.8 -1.5 -1.7 Audio discs, tapes and other media 1 2 .............................. 93.742 93.443 93.976 93.202 -6.8 1.9 -5.6 -2.3 -2.5 -3.9
Pets, pet products and services 2 ......................................... 151.733 151.291 151.460 150.942 -.7 1.8 -1.2 -2.1 .5 -1.6 Pets and pet products ........................................................ 192.496 191.568 192.377 191.336 -2.3 1.3 -5.1 -2.4 -.5 -3.7 Pet services including veterinary 2 ..................................... 192.262 192.550 191.395 191.619 2.6 2.9 8.7 -1.3 2.8 3.6
Sporting goods 1 ................................................................... 117.053 116.989 116.813 116.885 -4.9 .2 4.3 -.6 -2.4 1.8 Sports vehicles including bicycles 1 ................................... 136.189 136.202 136.207 137.341 -2.0 -.3 6.1 3.4 -1.2 4.8 Sports equipment 1 ............................................................. 96.149 95.996 95.621 94.530 -8.0 1.0 1.6 -6.6 -3.6 -2.5
Photography 2 ...................................................................... 82.433 81.807 81.067 80.775 -3.3 -1.8 2.1 -7.8 -2.6 -3.0 Photographic equipment and supplies ............................... 72.596 71.790 69.830 68.685 -6.8 1.1 -8.8 -19.9 -2.9 -14.5 Photographers and film processing 1 2 .............................. 113.519 112.857 112.894 113.205 -.6 -3.1 8.4 -1.1 -1.9 3.6
Other recreational goods 2 ................................................... 56.245 55.519 55.260 55.408 -12.8 3.1 -7.0 -5.8 -5.2 -6.4 Toys 1 ................................................................................. 60.847 60.100 59.817 59.872 -16.6 3.1 -7.7 -6.3 -7.3 -7.0 Sewing machines, fabric and supplies 2 ............................. 93.246 90.560 90.386 91.935 -.4 10.1 -5.1 -5.5 4.8 -5.3 Music instruments and accessories 2 ................................. 97.839 97.251 96.608 96.980 -.7 -.3 -4.5 -3.5 -.5 -4.0
Recreation services 2 ........................................................... 147.384 148.259 148.523 147.071 -3.8 -1.9 6.7 -.8 -2.8 2.8 Club dues and fees for participant sports and group
exercises 2 .................................................................. 123.024 124.400 124.460 122.027 -9.4 -6.3 6.4 -3.2 -7.9 1.5 Admissions 1 ...................................................................... 322.134 322.913 323.670 322.309 -1.5 -.5 9.1 .2 -1.0 4.6 Fees for lessons or instructions 1 5 .................................... 264.798 265.163 265.415 265.504 .3 .8 .6 1.1 .6 .8
Recreational reading materials 1 .......................................... 224.390 224.337 223.827 223.703 -1.2 1.0 -.4 -1.2 -.1 -.8
See footnotes at end of table.
37 CPI Detailed Report-September 2010
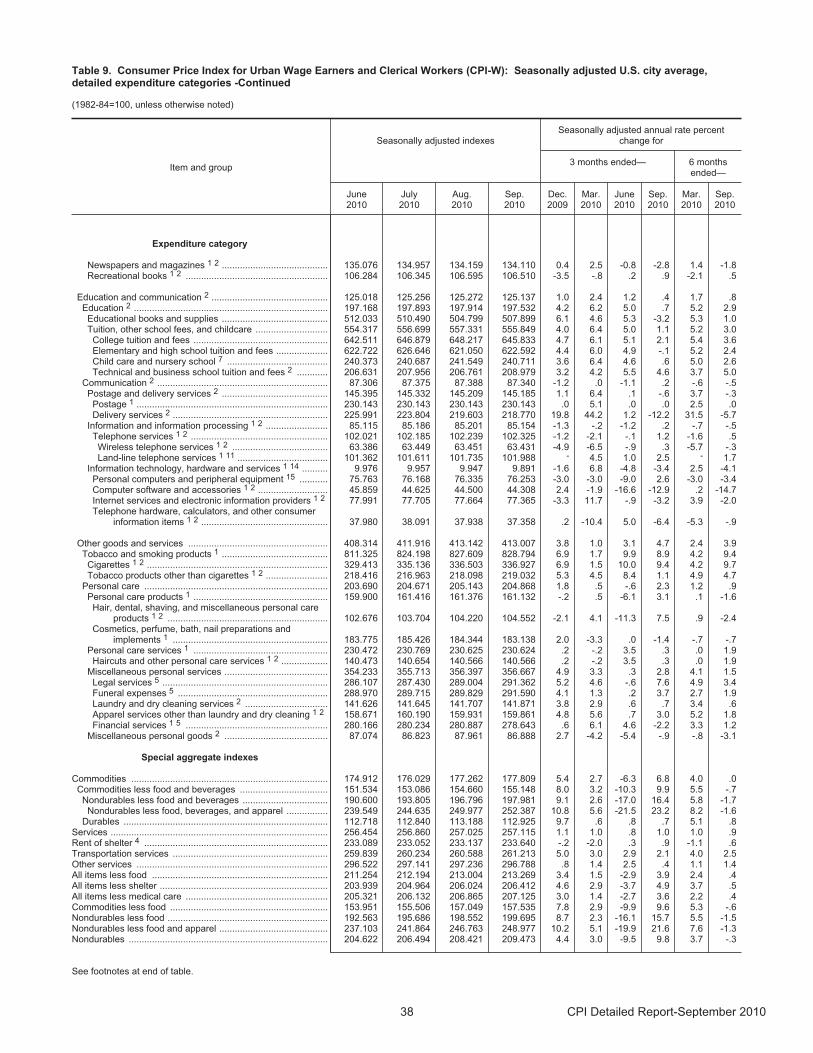
Table 9. Consumer Price Index for Urban Wage Earners and Clerical Workers (CPI-W): Seasonally adjusted U.S. city average,detailed expenditure categories -Continued
(1982-84=100, unless otherwise noted)
Item and group
Seasonally adjusted indexesSeasonally adjusted annual rate percent
change for
3 months ended— 6 monthsended—
June2010
July2010
Aug.2010
Sep.2010
Dec.2009
Mar.2010
June2010
Sep.2010
Mar.2010
Sep.2010
Expenditure category
Newspapers and magazines 1 2 ......................................... 135.076 134.957 134.159 134.110 0.4 2.5 -0.8 -2.8 1.4 -1.8 Recreational books 1 2 ....................................................... 106.284 106.345 106.595 106.510 -3.5 -.8 .2 .9 -2.1 .5
Education and communication 2 ............................................. 125.018 125.256 125.272 125.137 1.0 2.4 1.2 .4 1.7 .8 Education 2 ........................................................................... 197.168 197.893 197.914 197.532 4.2 6.2 5.0 .7 5.2 2.9
Educational books and supplies ......................................... 512.033 510.490 504.799 507.899 6.1 4.6 5.3 -3.2 5.3 1.0 Tuition, other school fees, and childcare ............................ 554.317 556.699 557.331 555.849 4.0 6.4 5.0 1.1 5.2 3.0
College tuition and fees .................................................... 642.511 646.879 648.217 645.833 4.7 6.1 5.1 2.1 5.4 3.6 Elementary and high school tuition and fees .................... 622.722 626.646 621.050 622.592 4.4 6.0 4.9 -.1 5.2 2.4 Child care and nursery school 7 ....................................... 240.373 240.687 241.549 240.711 3.6 6.4 4.6 .6 5.0 2.6 Technical and business school tuition and fees 2 ............ 206.631 207.956 206.761 208.979 3.2 4.2 5.5 4.6 3.7 5.0
Communication 2 .................................................................. 87.306 87.375 87.388 87.340 -1.2 .0 -1.1 .2 -.6 -.5 Postage and delivery services 2 ......................................... 145.395 145.332 145.209 145.185 1.1 6.4 .1 -.6 3.7 -.3 Postage 1 .......................................................................... 230.143 230.143 230.143 230.143 .0 5.1 .0 .0 2.5 .0 Delivery services 2 ............................................................ 225.991 223.804 219.603 218.770 19.8 44.2 1.2 -12.2 31.5 -5.7
Information and information processing 1 2 ........................ 85.115 85.186 85.201 85.154 -1.3 -.2 -1.2 .2 -.7 -.5 Telephone services 1 2 ..................................................... 102.021 102.185 102.239 102.325 -1.2 -2.1 -.1 1.2 -1.6 .5 Wireless telephone services 1 2 ..................................... 63.386 63.449 63.451 63.431 -4.9 -6.5 -.9 .3 -5.7 -.3 Land-line telephone services 1 11 ................................... 101.362 101.611 101.735 101.988 - 4.5 1.0 2.5 - 1.7
Information technology, hardware and services 1 14 .......... 9.976 9.957 9.947 9.891 -1.6 6.8 -4.8 -3.4 2.5 -4.1 Personal computers and peripheral equipment 15 ........... 75.763 76.168 76.335 76.253 -3.0 -3.0 -9.0 2.6 -3.0 -3.4 Computer software and accessories 1 2 ........................... 45.859 44.625 44.500 44.308 2.4 -1.9 -16.6 -12.9 .2 -14.7 Internet services and electronic information providers 1 2 77.991 77.705 77.664 77.365 -3.3 11.7 -.9 -3.2 3.9 -2.0 Telephone hardware, calculators, and other consumer
information items 1 2 ................................................. 37.980 38.091 37.938 37.358 .2 -10.4 5.0 -6.4 -5.3 -.9
Other goods and services ...................................................... 408.314 411.916 413.142 413.007 3.8 1.0 3.1 4.7 2.4 3.9 Tobacco and smoking products 1 ......................................... 811.325 824.198 827.609 828.794 6.9 1.7 9.9 8.9 4.2 9.4 Cigarettes 1 2 ...................................................................... 329.413 335.136 336.503 336.927 6.9 1.5 10.0 9.4 4.2 9.7 Tobacco products other than cigarettes 1 2 ........................ 218.416 216.963 218.098 219.032 5.3 4.5 8.4 1.1 4.9 4.7
Personal care ....................................................................... 203.690 204.671 205.143 204.868 1.8 .5 -.6 2.3 1.2 .9 Personal care products 1 .................................................... 159.900 161.416 161.376 161.132 -.2 .5 -6.1 3.1 .1 -1.6 Hair, dental, shaving, and miscellaneous personal care
products 1 2 .............................................................. 102.676 103.704 104.220 104.552 -2.1 4.1 -11.3 7.5 .9 -2.4 Cosmetics, perfume, bath, nail preparations and
implements 1 ............................................................ 183.775 185.426 184.344 183.138 2.0 -3.3 .0 -1.4 -.7 -.7 Personal care services 1 .................................................... 230.472 230.769 230.625 230.624 .2 -.2 3.5 .3 .0 1.9
Haircuts and other personal care services 1 2 .................. 140.473 140.654 140.566 140.566 .2 -.2 3.5 .3 .0 1.9 Miscellaneous personal services ........................................ 354.233 355.713 356.397 356.667 4.9 3.3 .3 2.8 4.1 1.5
Legal services 5 ................................................................ 286.107 287.430 289.004 291.362 5.2 4.6 -.6 7.6 4.9 3.4 Funeral expenses 5 .......................................................... 288.970 289.715 289.829 291.590 4.1 1.3 .2 3.7 2.7 1.9 Laundry and dry cleaning services 2 ................................ 141.626 141.645 141.707 141.871 3.8 2.9 .6 .7 3.4 .6 Apparel services other than laundry and dry cleaning 1 2 158.671 160.190 159.931 159.861 4.8 5.6 .7 3.0 5.2 1.8 Financial services 1 5 ....................................................... 280.166 280.234 280.887 278.643 .6 6.1 4.6 -2.2 3.3 1.2
Miscellaneous personal goods 2 ........................................ 87.074 86.823 87.961 86.888 2.7 -4.2 -5.4 -.9 -.8 -3.1
Special aggregate indexes
Commodities ............................................................................ 174.912 176.029 177.262 177.809 5.4 2.7 -6.3 6.8 4.0 .0 Commodities less food and beverages .................................. 151.534 153.086 154.660 155.148 8.0 3.2 -10.3 9.9 5.5 -.7
Nondurables less food and beverages ................................. 190.600 193.805 196.796 197.981 9.1 2.6 -17.0 16.4 5.8 -1.7 Nondurables less food, beverages, and apparel ................ 239.549 244.635 249.977 252.387 10.8 5.6 -21.5 23.2 8.2 -1.6
Durables ............................................................................... 112.718 112.840 113.188 112.925 9.7 .6 .8 .7 5.1 .8 Services .................................................................................... 256.454 256.860 257.025 257.115 1.1 1.0 .8 1.0 1.0 .9 Rent of shelter 4 ....................................................................... 233.089 233.052 233.137 233.640 -.2 -2.0 .3 .9 -1.1 .6 Transportation services ............................................................ 259.839 260.234 260.588 261.213 5.0 3.0 2.9 2.1 4.0 2.5 Other services .......................................................................... 296.522 297.141 297.236 296.788 .8 1.4 2.5 .4 1.1 1.4 All items less food .................................................................... 211.254 212.194 213.004 213.269 3.4 1.5 -2.9 3.9 2.4 .4 All items less shelter ................................................................. 203.939 204.964 206.024 206.412 4.6 2.9 -3.7 4.9 3.7 .5 All items less medical care ....................................................... 205.321 206.132 206.865 207.125 3.0 1.4 -2.7 3.6 2.2 .4 Commodities less food ............................................................. 153.951 155.506 157.049 157.535 7.8 2.9 -9.9 9.6 5.3 -.6 Nondurables less food .............................................................. 192.563 195.686 198.552 199.695 8.7 2.3 -16.1 15.7 5.5 -1.5 Nondurables less food and apparel .......................................... 237.103 241.864 246.763 248.977 10.2 5.1 -19.9 21.6 7.6 -1.3 Nondurables ............................................................................. 204.622 206.494 208.421 209.473 4.4 3.0 -9.5 9.8 3.7 -.3
See footnotes at end of table.
38 CPI Detailed Report-September 2010
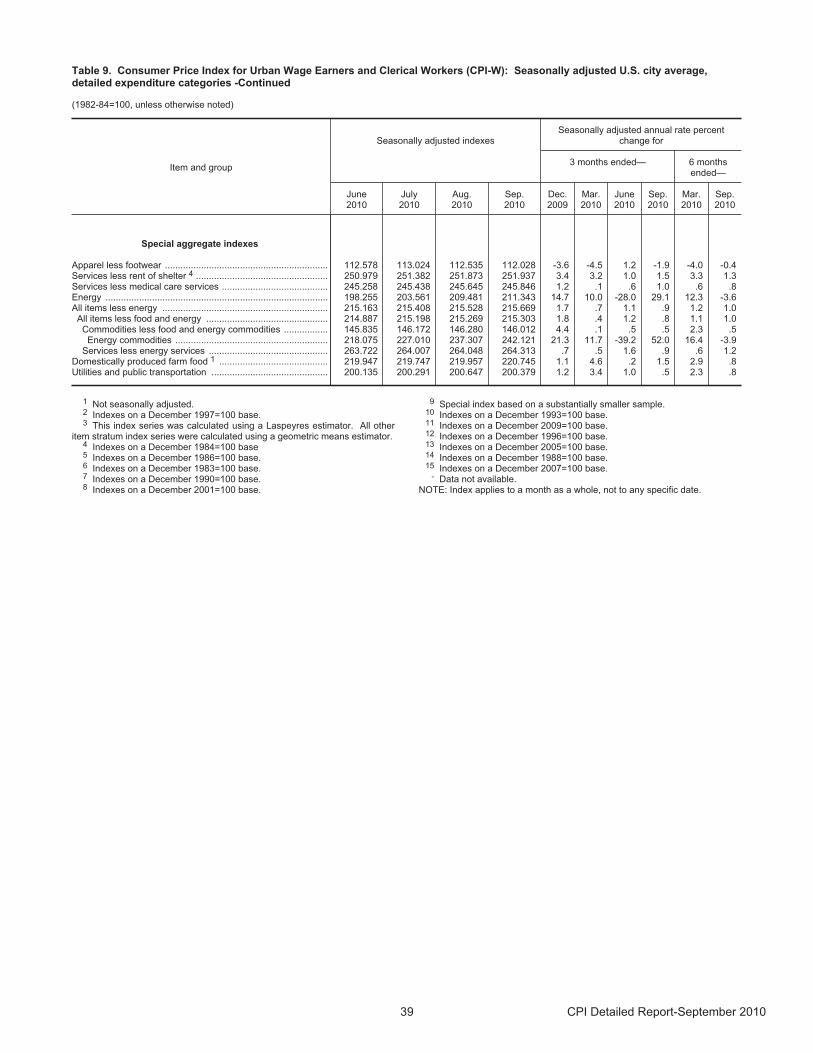
Table 9. Consumer Price Index for Urban Wage Earners and Clerical Workers (CPI-W): Seasonally adjusted U.S. city average,detailed expenditure categories -Continued
(1982-84=100, unless otherwise noted)
Item and group
Seasonally adjusted indexesSeasonally adjusted annual rate percent
change for
3 months ended— 6 monthsended—
June2010
July2010
Aug.2010
Sep.2010
Dec.2009
Mar.2010
June2010
Sep.2010
Mar.2010
Sep.2010
Special aggregate indexes
Apparel less footwear ............................................................... 112.578 113.024 112.535 112.028 -3.6 -4.5 1.2 -1.9 -4.0 -0.4 Services less rent of shelter 4 ................................................... 250.979 251.382 251.873 251.937 3.4 3.2 1.0 1.5 3.3 1.3 Services less medical care services ......................................... 245.258 245.438 245.645 245.846 1.2 .1 .6 1.0 .6 .8 Energy ...................................................................................... 198.255 203.561 209.481 211.343 14.7 10.0 -28.0 29.1 12.3 -3.6 All items less energy ................................................................ 215.163 215.408 215.528 215.669 1.7 .7 1.1 .9 1.2 1.0
All items less food and energy ............................................... 214.887 215.198 215.269 215.303 1.8 .4 1.2 .8 1.1 1.0 Commodities less food and energy commodities ................. 145.835 146.172 146.280 146.012 4.4 .1 .5 .5 2.3 .5 Energy commodities ........................................................... 218.075 227.010 237.307 242.121 21.3 11.7 -39.2 52.0 16.4 -3.9
Services less energy services .............................................. 263.722 264.007 264.048 264.313 .7 .5 1.6 .9 .6 1.2 Domestically produced farm food 1 .......................................... 219.947 219.747 219.957 220.745 1.1 4.6 .2 1.5 2.9 .8 Utilities and public transportation ............................................. 200.135 200.291 200.647 200.379 1.2 3.4 1.0 .5 2.3 .8
1 Not seasonally adjusted.2 Indexes on a December 1997=100 base.3 This index series was calculated using a Laspeyres estimator. All other
item stratum index series were calculated using a geometric means estimator.4 Indexes on a December 1984=100 base5 Indexes on a December 1986=100 base.6 Indexes on a December 1983=100 base.7 Indexes on a December 1990=100 base.8 Indexes on a December 2001=100 base.
9 Special index based on a substantially smaller sample.10 Indexes on a December 1993=100 base.11 Indexes on a December 2009=100 base.12 Indexes on a December 1996=100 base.13 Indexes on a December 2005=100 base.14 Indexes on a December 1988=100 base.15 Indexes on a December 2007=100 base.
- Data not available.NOTE: Index applies to a month as a whole, not to any specific date.
39 CPI Detailed Report-September 2010
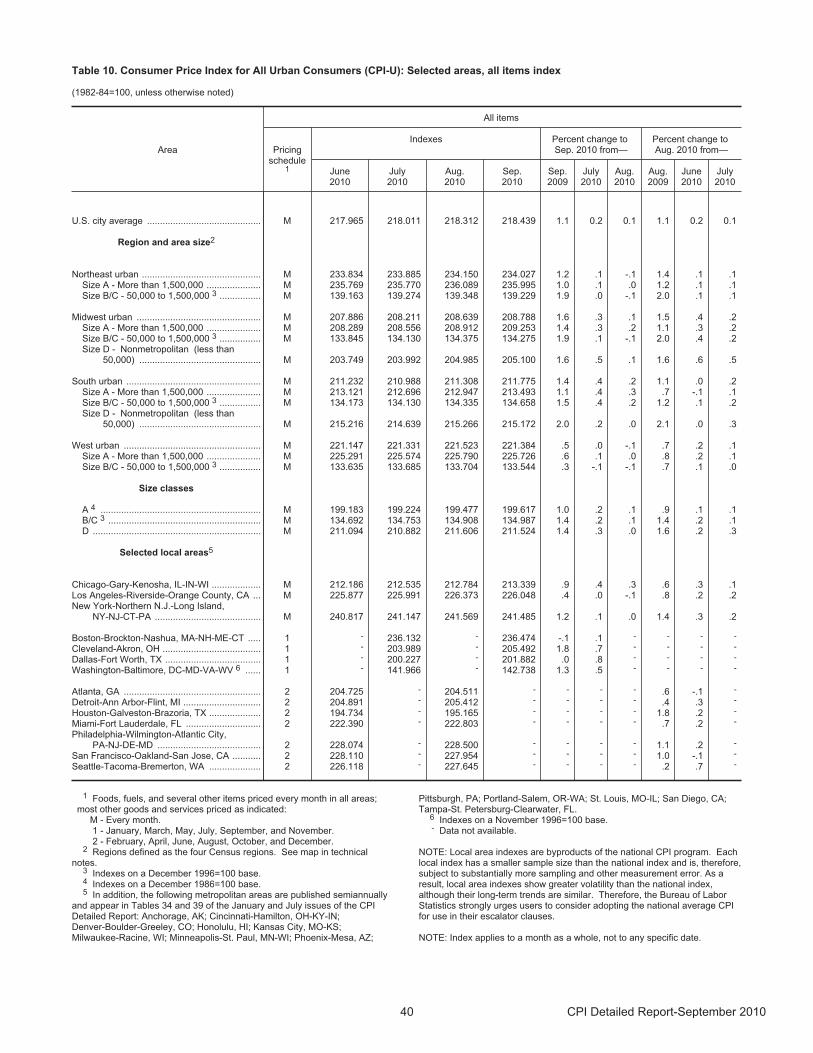
Table 10. Consumer Price Index for All Urban Consumers (CPI-U): Selected areas, all items index
(1982-84=100, unless otherwise noted)
Area
All items
Pricingschedule
1
Indexes Percent change to Sep. 2010 from—
Percent change to Aug. 2010 from—
June2010
July2010
Aug.2010
Sep.2010
Sep.2009
July2010
Aug.2010
Aug.2009
June2010
July2010
U.S. city average ............................................ M 217.965 218.011 218.312 218.439 1.1 0.2 0.1 1.1 0.2 0.1
Region and area size2
Northeast urban .............................................. M 233.834 233.885 234.150 234.027 1.2 .1 -.1 1.4 .1 .1 Size A - More than 1,500,000 ..................... M 235.769 235.770 236.089 235.995 1.0 .1 .0 1.2 .1 .1 Size B/C - 50,000 to 1,500,000 3 ................ M 139.163 139.274 139.348 139.229 1.9 .0 -.1 2.0 .1 .1
Midwest urban ................................................ M 207.886 208.211 208.639 208.788 1.6 .3 .1 1.5 .4 .2 Size A - More than 1,500,000 ..................... M 208.289 208.556 208.912 209.253 1.4 .3 .2 1.1 .3 .2 Size B/C - 50,000 to 1,500,000 3 ................ M 133.845 134.130 134.375 134.275 1.9 .1 -.1 2.0 .4 .2 Size D - Nonmetropolitan (less than
50,000) ............................................... M 203.749 203.992 204.985 205.100 1.6 .5 .1 1.6 .6 .5
South urban .................................................... M 211.232 210.988 211.308 211.775 1.4 .4 .2 1.1 .0 .2 Size A - More than 1,500,000 ..................... M 213.121 212.696 212.947 213.493 1.1 .4 .3 .7 -.1 .1 Size B/C - 50,000 to 1,500,000 3 ................ M 134.173 134.130 134.335 134.658 1.5 .4 .2 1.2 .1 .2 Size D - Nonmetropolitan (less than
50,000) ............................................... M 215.216 214.639 215.266 215.172 2.0 .2 .0 2.1 .0 .3
West urban ..................................................... M 221.147 221.331 221.523 221.384 .5 .0 -.1 .7 .2 .1 Size A - More than 1,500,000 ..................... M 225.291 225.574 225.790 225.726 .6 .1 .0 .8 .2 .1 Size B/C - 50,000 to 1,500,000 3 ................ M 133.635 133.685 133.704 133.544 .3 -.1 -.1 .7 .1 .0
Size classes
A 4 .............................................................. M 199.183 199.224 199.477 199.617 1.0 .2 .1 .9 .1 .1 B/C 3 ........................................................... M 134.692 134.753 134.908 134.987 1.4 .2 .1 1.4 .2 .1 D ................................................................. M 211.094 210.882 211.606 211.524 1.4 .3 .0 1.6 .2 .3
Selected local areas5
Chicago-Gary-Kenosha, IL-IN-WI ................... M 212.186 212.535 212.784 213.339 .9 .4 .3 .6 .3 .1 Los Angeles-Riverside-Orange County, CA ... M 225.877 225.991 226.373 226.048 .4 .0 -.1 .8 .2 .2 New York-Northern N.J.-Long Island,
NY-NJ-CT-PA ......................................... M 240.817 241.147 241.569 241.485 1.2 .1 .0 1.4 .3 .2
Boston-Brockton-Nashua, MA-NH-ME-CT ..... 1 - 236.132 - 236.474 -.1 .1 - - - -
Cleveland-Akron, OH ...................................... 1 - 203.989 - 205.492 1.8 .7 - - - -
Dallas-Fort Worth, TX ..................................... 1 - 200.227 - 201.882 .0 .8 - - - -
Washington-Baltimore, DC-MD-VA-WV 6 ...... 1 - 141.966 - 142.738 1.3 .5 - - - -
Atlanta, GA ..................................................... 2 204.725 - 204.511 - - - - .6 -.1 -
Detroit-Ann Arbor-Flint, MI .............................. 2 204.891 - 205.412 - - - - .4 .3 -
Houston-Galveston-Brazoria, TX .................... 2 194.734 - 195.165 - - - - 1.8 .2 -
Miami-Fort Lauderdale, FL ............................. 2 222.390 - 222.803 - - - - .7 .2 -
Philadelphia-Wilmington-Atlantic City,PA-NJ-DE-MD ........................................ 2 228.074 - 228.500 - - - - 1.1 .2 -
San Francisco-Oakland-San Jose, CA ........... 2 228.110 - 227.954 - - - - 1.0 -.1 -
Seattle-Tacoma-Bremerton, WA .................... 2 226.118 - 227.645 - - - - .2 .7 -
1 Foods, fuels, and several other items priced every month in all areas; most other goods and services priced as indicated: M - Every month. 1 - January, March, May, July, September, and November. 2 - February, April, June, August, October, and December.
2 Regions defined as the four Census regions. See map in technicalnotes.
3 Indexes on a December 1996=100 base.4 Indexes on a December 1986=100 base.5 In addition, the following metropolitan areas are published semiannually
and appear in Tables 34 and 39 of the January and July issues of the CPIDetailed Report: Anchorage, AK; Cincinnati-Hamilton, OH-KY-IN;Denver-Boulder-Greeley, CO; Honolulu, HI; Kansas City, MO-KS;Milwaukee-Racine, WI; Minneapolis-St. Paul, MN-WI; Phoenix-Mesa, AZ;
Pittsburgh, PA; Portland-Salem, OR-WA; St. Louis, MO-IL; San Diego, CA;Tampa-St. Petersburg-Clearwater, FL.
6 Indexes on a November 1996=100 base.- Data not available.
NOTE: Local area indexes are byproducts of the national CPI program. Eachlocal index has a smaller sample size than the national index and is, therefore,subject to substantially more sampling and other measurement error. As aresult, local area indexes show greater volatility than the national index,although their long-term trends are similar. Therefore, the Bureau of LaborStatistics strongly urges users to consider adopting the national average CPIfor use in their escalator clauses.
NOTE: Index applies to a month as a whole, not to any specific date.
40 CPI Detailed Report-September 2010
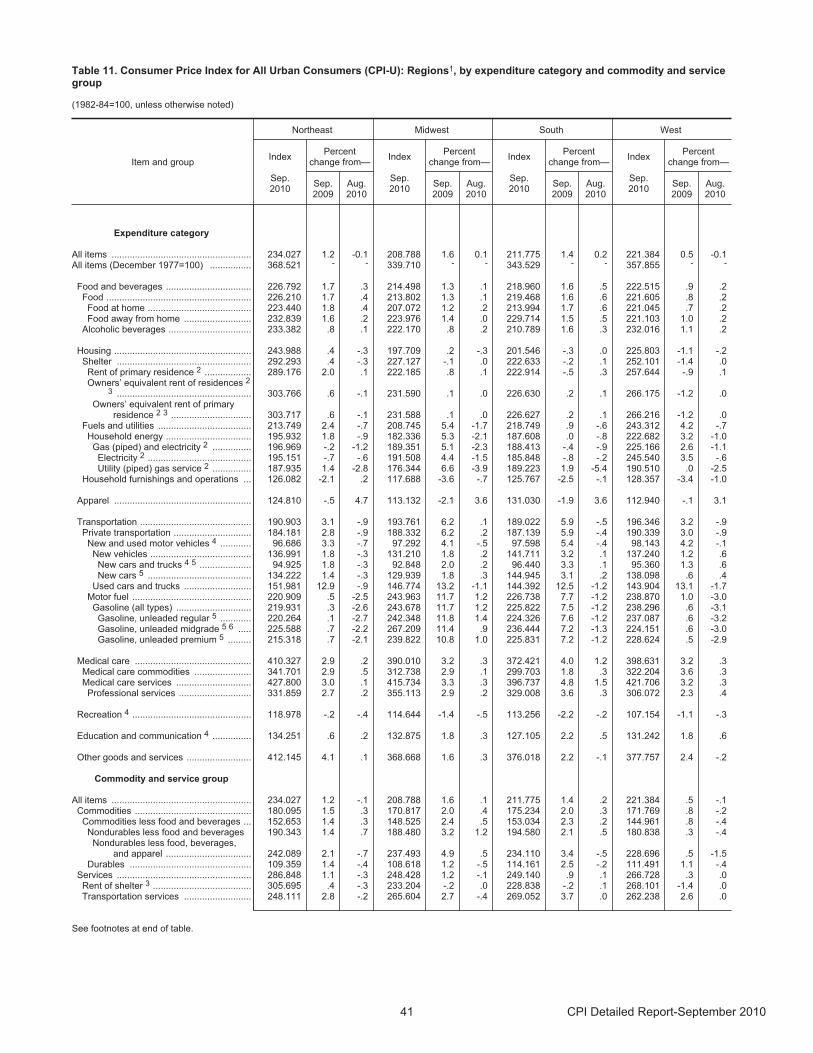
Table 11. Consumer Price Index for All Urban Consumers (CPI-U): Regions1, by expenditure category and commodity and servicegroup
(1982-84=100, unless otherwise noted)
Item and group
Northeast Midwest South West
Index
Sep.2010
Percentchange from—
Index
Sep.2010
Percentchange from—
Index
Sep.2010
Percentchange from—
Index
Sep.2010
Percentchange from—
Sep.2009
Aug.2010
Sep.2009
Aug.2010
Sep.2009
Aug.2010
Sep.2009
Aug.2010
Expenditure category
All items ...................................................... 234.027 1.2 -0.1 208.788 1.6 0.1 211.775 1.4 0.2 221.384 0.5 -0.1All items (December 1977=100) ................ 368.521 - - 339.710 - - 343.529 - - 357.855 - -
Food and beverages ................................. 226.792 1.7 .3 214.498 1.3 .1 218.960 1.6 .5 222.515 .9 .2 Food ........................................................ 226.210 1.7 .4 213.802 1.3 .1 219.468 1.6 .6 221.605 .8 .2
Food at home ........................................ 223.440 1.8 .4 207.072 1.2 .2 213.994 1.7 .6 221.045 .7 .2 Food away from home .......................... 232.839 1.6 .2 223.976 1.4 .0 229.714 1.5 .5 221.103 1.0 .2
Alcoholic beverages ................................ 233.382 .8 .1 222.170 .8 .2 210.789 1.6 .3 232.016 1.1 .2
Housing ..................................................... 243.988 .4 -.3 197.709 .2 -.3 201.546 -.3 .0 225.803 -1.1 -.2 Shelter .................................................... 292.293 .4 -.3 227.127 -.1 .0 222.633 -.2 .1 252.101 -1.4 .0
Rent of primary residence 2 .................. 289.176 2.0 .1 222.185 .8 .1 222.914 -.5 .3 257.644 -.9 .1 Owners’ equivalent rent of residences 2
3 .................................................... 303.766 .6 -.1 231.590 .1 .0 226.630 .2 .1 266.175 -1.2 .0 Owners’ equivalent rent of primary
residence 2 3 ............................... 303.717 .6 -.1 231.588 .1 .0 226.627 .2 .1 266.216 -1.2 .0 Fuels and utilities .................................... 213.749 2.4 -.7 208.745 5.4 -1.7 218.749 .9 -.6 243.312 4.2 -.7
Household energy ................................. 195.932 1.8 -.9 182.336 5.3 -2.1 187.608 .0 -.8 222.682 3.2 -1.0 Gas (piped) and electricity 2 ............... 196.969 -.2 -1.2 189.351 5.1 -2.3 188.413 -.4 -.9 225.166 2.6 -1.1 Electricity 2 ........................................ 195.151 -.7 -.6 191.508 4.4 -1.5 185.848 -.8 -.2 245.540 3.5 -.6 Utility (piped) gas service 2 ............... 187.935 1.4 -2.8 176.344 6.6 -3.9 189.223 1.9 -5.4 190.510 .0 -2.5
Household furnishings and operations ... 126.082 -2.1 .2 117.688 -3.6 -.7 125.767 -2.5 -.1 128.357 -3.4 -1.0
Apparel ..................................................... 124.810 -.5 4.7 113.132 -2.1 3.6 131.030 -1.9 3.6 112.940 -.1 3.1
Transportation ........................................... 190.903 3.1 -.9 193.761 6.2 .1 189.022 5.9 -.5 196.346 3.2 -.9 Private transportation .............................. 184.181 2.8 -.9 188.332 6.2 .2 187.139 5.9 -.4 190.339 3.0 -.9 New and used motor vehicles 4 ............ 96.686 3.3 -.7 97.292 4.1 -.5 97.598 5.4 -.4 98.143 4.2 -.1 New vehicles ....................................... 136.991 1.8 -.3 131.210 1.8 .2 141.711 3.2 .1 137.240 1.2 .6 New cars and trucks 4 5 .................... 94.925 1.8 -.3 92.848 2.0 .2 96.440 3.3 .1 95.360 1.3 .6 New cars 5 ........................................ 134.222 1.4 -.3 129.939 1.8 .3 144.945 3.1 .2 138.098 .6 .4
Used cars and trucks .......................... 151.981 12.9 -.9 146.774 13.2 -1.1 144.392 12.5 -1.2 143.904 13.1 -1.7 Motor fuel .............................................. 220.909 .5 -2.5 243.963 11.7 1.2 226.738 7.7 -1.2 238.870 1.0 -3.0
Gasoline (all types) ............................. 219.931 .3 -2.6 243.678 11.7 1.2 225.822 7.5 -1.2 238.296 .6 -3.1 Gasoline, unleaded regular 5 ............ 220.264 .1 -2.7 242.348 11.8 1.4 224.326 7.6 -1.2 237.087 .6 -3.2 Gasoline, unleaded midgrade 5 6 ..... 225.588 .7 -2.2 267.209 11.4 .9 236.444 7.2 -1.3 224.151 .6 -3.0 Gasoline, unleaded premium 5 ......... 215.318 .7 -2.1 239.822 10.8 1.0 225.831 7.2 -1.2 228.624 .5 -2.9
Medical care ............................................. 410.327 2.9 .2 390.010 3.2 .3 372.421 4.0 1.2 398.631 3.2 .3 Medical care commodities ...................... 341.701 2.9 .5 312.738 2.9 .1 299.703 1.8 .3 322.204 3.6 .3 Medical care services ............................. 427.800 3.0 .1 415.734 3.3 .3 396.737 4.8 1.5 421.706 3.2 .3
Professional services ............................ 331.859 2.7 .2 355.113 2.9 .2 329.008 3.6 .3 306.072 2.3 .4
Recreation 4 .............................................. 118.978 -.2 -.4 114.644 -1.4 -.5 113.256 -2.2 -.2 107.154 -1.1 -.3
Education and communication 4 ............... 134.251 .6 .2 132.875 1.8 .3 127.105 2.2 .5 131.242 1.8 .6
Other goods and services ......................... 412.145 4.1 .1 368.668 1.6 .3 376.018 2.2 -.1 377.757 2.4 -.2
Commodity and service group
All items ...................................................... 234.027 1.2 -.1 208.788 1.6 .1 211.775 1.4 .2 221.384 .5 -.1 Commodities ............................................. 180.095 1.5 .3 170.817 2.0 .4 175.234 2.0 .3 171.769 .8 -.2
Commodities less food and beverages ... 152.653 1.4 .3 148.525 2.4 .5 153.034 2.3 .2 144.961 .8 -.4 Nondurables less food and beverages 190.343 1.4 .7 188.480 3.2 1.2 194.580 2.1 .5 180.838 .3 -.4
Nondurables less food, beverages,and apparel ................................. 242.089 2.1 -.7 237.493 4.9 .5 234.110 3.4 -.5 228.696 .5 -1.5
Durables ............................................... 109.359 1.4 -.4 108.618 1.2 -.5 114.161 2.5 -.2 111.491 1.1 -.4 Services .................................................... 286.848 1.1 -.3 248.428 1.2 -.1 249.140 .9 .1 266.728 .3 .0 Rent of shelter 3 ...................................... 305.695 .4 -.3 233.204 -.2 .0 228.838 -.2 .1 268.101 -1.4 .0 Transportation services .......................... 248.111 2.8 -.2 265.604 2.7 -.4 269.052 3.7 .0 262.238 2.6 .0
See footnotes at end of table.
41 CPI Detailed Report-September 2010
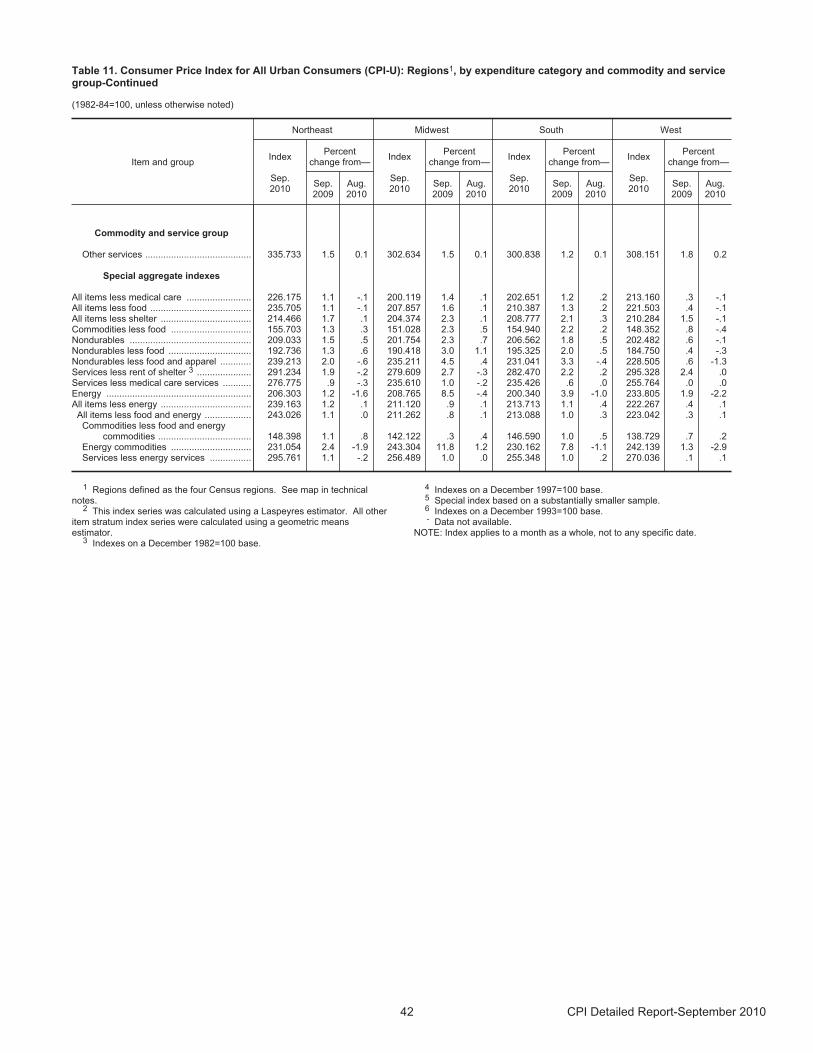
Table 11. Consumer Price Index for All Urban Consumers (CPI-U): Regions1, by expenditure category and commodity and servicegroup-Continued
(1982-84=100, unless otherwise noted)
Item and group
Northeast Midwest South West
Index
Sep.2010
Percentchange from—
Index
Sep.2010
Percentchange from—
Index
Sep.2010
Percentchange from—
Index
Sep.2010
Percentchange from—
Sep.2009
Aug.2010
Sep.2009
Aug.2010
Sep.2009
Aug.2010
Sep.2009
Aug.2010
Commodity and service group
Other services ......................................... 335.733 1.5 0.1 302.634 1.5 0.1 300.838 1.2 0.1 308.151 1.8 0.2
Special aggregate indexes
All items less medical care ......................... 226.175 1.1 -.1 200.119 1.4 .1 202.651 1.2 .2 213.160 .3 -.1 All items less food ....................................... 235.705 1.1 -.1 207.857 1.6 .1 210.387 1.3 .2 221.503 .4 -.1 All items less shelter ................................... 214.466 1.7 .1 204.374 2.3 .1 208.777 2.1 .3 210.284 1.5 -.1 Commodities less food ............................... 155.703 1.3 .3 151.028 2.3 .5 154.940 2.2 .2 148.352 .8 -.4 Nondurables ............................................... 209.033 1.5 .5 201.754 2.3 .7 206.562 1.8 .5 202.482 .6 -.1 Nondurables less food ................................ 192.736 1.3 .6 190.418 3.0 1.1 195.325 2.0 .5 184.750 .4 -.3 Nondurables less food and apparel ............ 239.213 2.0 -.6 235.211 4.5 .4 231.041 3.3 -.4 228.505 .6 -1.3 Services less rent of shelter 3 ..................... 291.234 1.9 -.2 279.609 2.7 -.3 282.470 2.2 .2 295.328 2.4 .0 Services less medical care services ........... 276.775 .9 -.3 235.610 1.0 -.2 235.426 .6 .0 255.764 .0 .0 Energy ........................................................ 206.303 1.2 -1.6 208.765 8.5 -.4 200.340 3.9 -1.0 233.805 1.9 -2.2All items less energy ................................... 239.163 1.2 .1 211.120 .9 .1 213.713 1.1 .4 222.267 .4 .1 All items less food and energy .................. 243.026 1.1 .0 211.262 .8 .1 213.088 1.0 .3 223.042 .3 .1
Commodities less food and energycommodities .................................... 148.398 1.1 .8 142.122 .3 .4 146.590 1.0 .5 138.729 .7 .2
Energy commodities ............................... 231.054 2.4 -1.9 243.304 11.8 1.2 230.162 7.8 -1.1 242.139 1.3 -2.9 Services less energy services ................ 295.761 1.1 -.2 256.489 1.0 .0 255.348 1.0 .2 270.036 .1 .1
1 Regions defined as the four Census regions. See map in technicalnotes.
2 This index series was calculated using a Laspeyres estimator. All otheritem stratum index series were calculated using a geometric meansestimator.
3 Indexes on a December 1982=100 base.
4 Indexes on a December 1997=100 base.5 Special index based on a substantially smaller sample.6 Indexes on a December 1993=100 base.- Data not available.
NOTE: Index applies to a month as a whole, not to any specific date.
42 CPI Detailed Report-September 2010
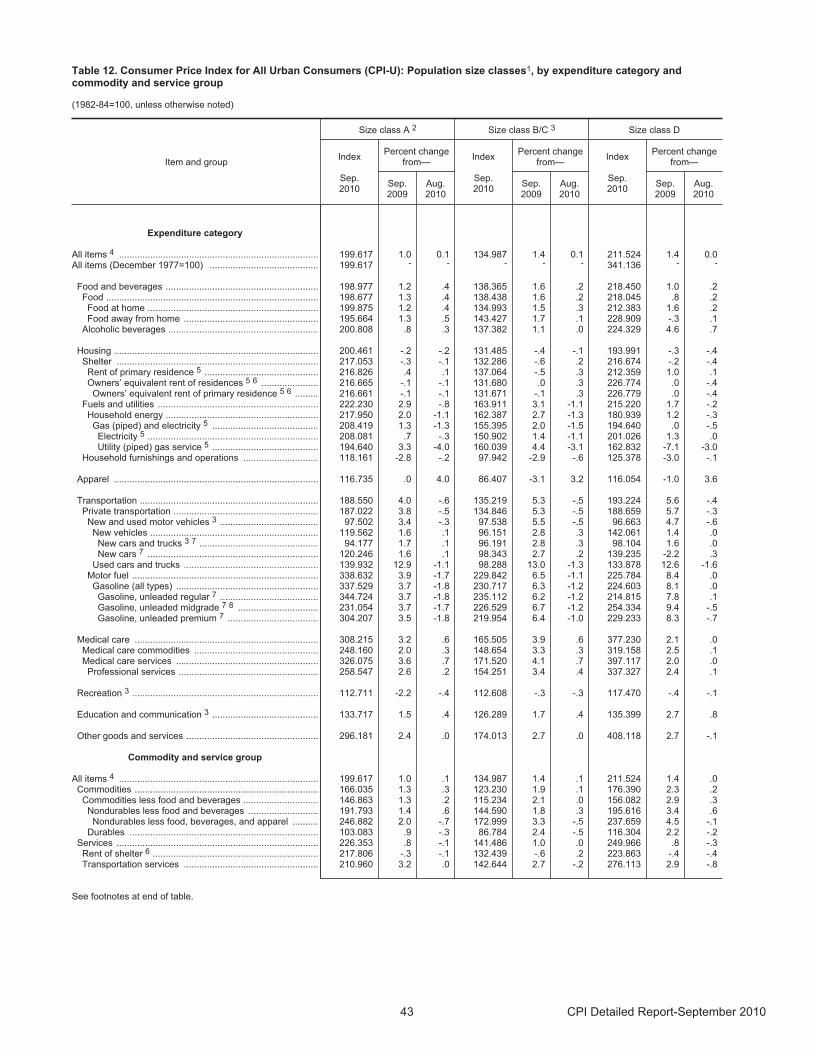
Table 12. Consumer Price Index for All Urban Consumers (CPI-U): Population size classes1, by expenditure category andcommodity and service group
(1982-84=100, unless otherwise noted)
Item and group
Size class A 2 Size class B/C 3 Size class D
Index
Sep.2010
Percent changefrom—
Index
Sep.2010
Percent changefrom—
Index
Sep.2010
Percent changefrom—
Sep.2009
Aug.2010
Sep.2009
Aug.2010
Sep.2009
Aug.2010
Expenditure category
All items 4 ............................................................................. 199.617 1.0 0.1 134.987 1.4 0.1 211.524 1.4 0.0 All items (December 1977=100) .......................................... 199.617 - - - - - 341.136 - -
Food and beverages ........................................................... 198.977 1.2 .4 138.365 1.6 .2 218.450 1.0 .2 Food .................................................................................. 198.677 1.3 .4 138.438 1.6 .2 218.045 .8 .2Food at home .................................................................. 199.875 1.2 .4 134.993 1.5 .3 212.383 1.6 .2 Food away from home .................................................... 195.664 1.3 .5 143.427 1.7 .1 228.909 -.3 .1
Alcoholic beverages .......................................................... 200.808 .8 .3 137.382 1.1 .0 224.329 4.6 .7
Housing ............................................................................... 200.461 -.2 -.2 131.485 -.4 -.1 193.991 -.3 -.4 Shelter .............................................................................. 217.053 -.3 -.1 132.286 -.6 .2 216.674 -.2 -.4
Rent of primary residence 5 ............................................ 216.826 .4 .1 137.064 -.5 .3 212.359 1.0 .1 Owners’ equivalent rent of residences 5 6 ...................... 216.665 -.1 -.1 131.680 .0 .3 226.774 .0 -.4 Owners’ equivalent rent of primary residence 5 6 ......... 216.661 -.1 -.1 131.671 -.1 .3 226.779 .0 -.4
Fuels and utilities .............................................................. 222.230 2.9 -.8 163.911 3.1 -1.1 215.220 1.7 -.2Household energy ........................................................... 217.950 2.0 -1.1 162.387 2.7 -1.3 180.939 1.2 -.3
Gas (piped) and electricity 5 ......................................... 208.419 1.3 -1.3 155.395 2.0 -1.5 194.640 .0 -.5 Electricity 5 .................................................................. 208.081 .7 -.3 150.902 1.4 -1.1 201.026 1.3 .0 Utility (piped) gas service 5 ......................................... 194.640 3.3 -4.0 160.039 4.4 -3.1 162.832 -7.1 -3.0
Household furnishings and operations ............................. 118.161 -2.8 -.2 97.942 -2.9 -.6 125.378 -3.0 -.1
Apparel ............................................................................... 116.735 .0 4.0 86.407 -3.1 3.2 116.054 -1.0 3.6
Transportation ..................................................................... 188.550 4.0 -.6 135.219 5.3 -.5 193.224 5.6 -.4Private transportation ........................................................ 187.022 3.8 -.5 134.846 5.3 -.5 188.659 5.7 -.3
New and used motor vehicles 3 ...................................... 97.502 3.4 -.3 97.538 5.5 -.5 96.663 4.7 -.6 New vehicles ................................................................. 119.562 1.6 .1 96.151 2.8 .3 142.061 1.4 .0 New cars and trucks 3 7 .............................................. 94.177 1.7 .1 96.191 2.8 .3 98.104 1.6 .0 New cars 7 .................................................................. 120.246 1.6 .1 98.343 2.7 .2 139.235 -2.2 .3
Used cars and trucks .................................................... 139.932 12.9 -1.1 98.288 13.0 -1.3 133.878 12.6 -1.6 Motor fuel ........................................................................ 338.632 3.9 -1.7 229.842 6.5 -1.1 225.784 8.4 .0
Gasoline (all types) ....................................................... 337.529 3.7 -1.8 230.717 6.3 -1.2 224.603 8.1 .0 Gasoline, unleaded regular 7 ...................................... 344.724 3.7 -1.8 235.112 6.2 -1.2 214.815 7.8 .1 Gasoline, unleaded midgrade 7 8 ............................... 231.054 3.7 -1.7 226.529 6.7 -1.2 254.334 9.4 -.5 Gasoline, unleaded premium 7 ................................... 304.207 3.5 -1.8 219.954 6.4 -1.0 229.233 8.3 -.7
Medical care ....................................................................... 308.215 3.2 .6 165.505 3.9 .6 377.230 2.1 .0Medical care commodities ................................................ 248.160 2.0 .3 148.654 3.3 .3 319.158 2.5 .1 Medical care services ....................................................... 326.075 3.6 .7 171.520 4.1 .7 397.117 2.0 .0
Professional services ...................................................... 258.547 2.6 .2 154.251 3.4 .4 337.327 2.4 .1
Recreation 3 ........................................................................ 112.711 -2.2 -.4 112.608 -.3 -.3 117.470 -.4 -.1
Education and communication 3 ......................................... 133.717 1.5 .4 126.289 1.7 .4 135.399 2.7 .8
Other goods and services ................................................... 296.181 2.4 .0 174.013 2.7 .0 408.118 2.7 -.1
Commodity and service group
All items 4 ............................................................................. 199.617 1.0 .1 134.987 1.4 .1 211.524 1.4 .0 Commodities ....................................................................... 166.035 1.3 .3 123.230 1.9 .1 176.390 2.3 .2
Commodities less food and beverages ............................. 146.863 1.3 .2 115.234 2.1 .0 156.082 2.9 .3 Nondurables less food and beverages ........................... 191.793 1.4 .6 144.590 1.8 .3 195.616 3.4 .6
Nondurables less food, beverages, and apparel .......... 246.882 2.0 -.7 172.999 3.3 -.5 237.659 4.5 -.1 Durables ......................................................................... 103.083 .9 -.3 86.784 2.4 -.5 116.304 2.2 -.2
Services .............................................................................. 226.353 .8 -.1 141.486 1.0 .0 249.966 .8 -.3Rent of shelter 6 ................................................................ 217.806 -.3 -.1 132.439 -.6 .2 223.863 -.4 -.4 Transportation services .................................................... 210.960 3.2 .0 142.644 2.7 -.2 276.113 2.9 -.8
See footnotes at end of table.
43 CPI Detailed Report-September 2010
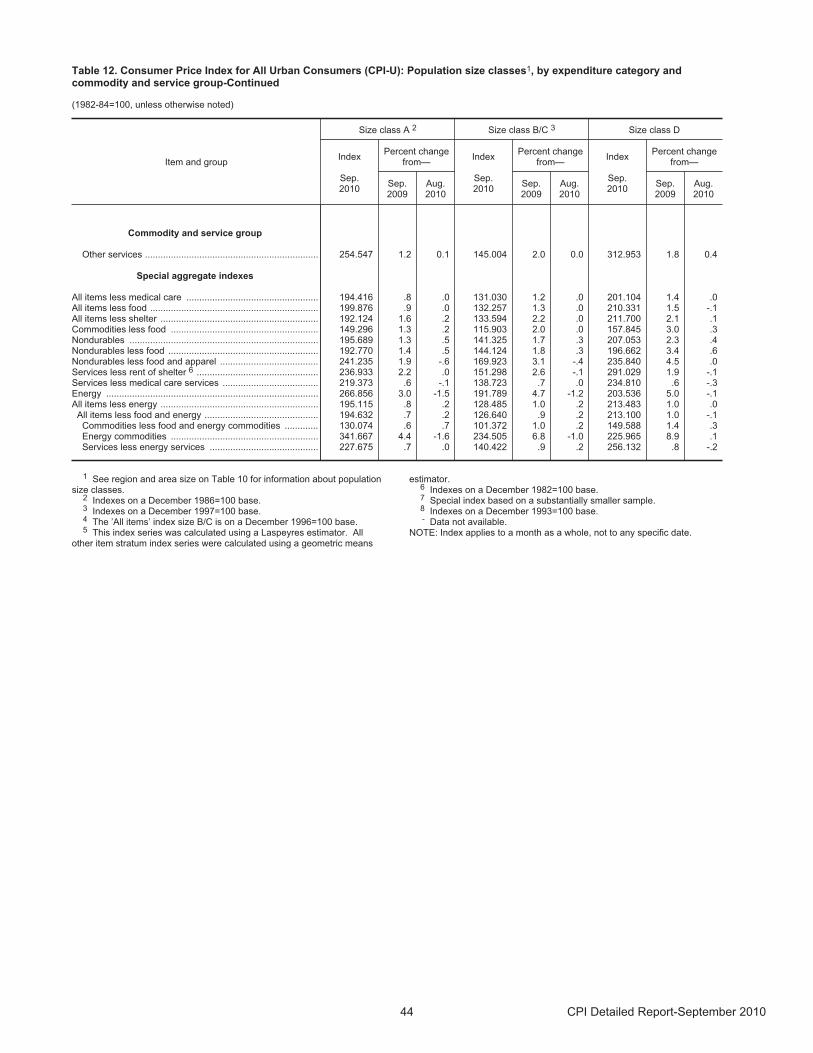
Table 12. Consumer Price Index for All Urban Consumers (CPI-U): Population size classes1, by expenditure category andcommodity and service group-Continued
(1982-84=100, unless otherwise noted)
Item and group
Size class A 2 Size class B/C 3 Size class D
Index
Sep.2010
Percent changefrom—
Index
Sep.2010
Percent changefrom—
Index
Sep.2010
Percent changefrom—
Sep.2009
Aug.2010
Sep.2009
Aug.2010
Sep.2009
Aug.2010
Commodity and service group
Other services ................................................................... 254.547 1.2 0.1 145.004 2.0 0.0 312.953 1.8 0.4
Special aggregate indexes
All items less medical care ................................................... 194.416 .8 .0 131.030 1.2 .0 201.104 1.4 .0 All items less food ................................................................. 199.876 .9 .0 132.257 1.3 .0 210.331 1.5 -.1 All items less shelter ............................................................. 192.124 1.6 .2 133.594 2.2 .0 211.700 2.1 .1 Commodities less food ......................................................... 149.296 1.3 .2 115.903 2.0 .0 157.845 3.0 .3 Nondurables ......................................................................... 195.689 1.3 .5 141.325 1.7 .3 207.053 2.3 .4Nondurables less food .......................................................... 192.770 1.4 .5 144.124 1.8 .3 196.662 3.4 .6 Nondurables less food and apparel ...................................... 241.235 1.9 -.6 169.923 3.1 -.4 235.840 4.5 .0 Services less rent of shelter 6 ............................................... 236.933 2.2 .0 151.298 2.6 -.1 291.029 1.9 -.1 Services less medical care services ..................................... 219.373 .6 -.1 138.723 .7 .0 234.810 .6 -.3 Energy .................................................................................. 266.856 3.0 -1.5 191.789 4.7 -1.2 203.536 5.0 -.1 All items less energy ............................................................. 195.115 .8 .2 128.485 1.0 .2 213.483 1.0 .0
All items less food and energy ............................................ 194.632 .7 .2 126.640 .9 .2 213.100 1.0 -.1 Commodities less food and energy commodities ............. 130.074 .6 .7 101.372 1.0 .2 149.588 1.4 .3 Energy commodities ......................................................... 341.667 4.4 -1.6 234.505 6.8 -1.0 225.965 8.9 .1 Services less energy services .......................................... 227.675 .7 .0 140.422 .9 .2 256.132 .8 -.2
1 See region and area size on Table 10 for information about populationsize classes.
2 Indexes on a December 1986=100 base.3 Indexes on a December 1997=100 base.4 The ’All items’ index size B/C is on a December 1996=100 base.5 This index series was calculated using a Laspeyres estimator. All
other item stratum index series were calculated using a geometric means
estimator.6 Indexes on a December 1982=100 base.7 Special index based on a substantially smaller sample.8 Indexes on a December 1993=100 base.- Data not available.
NOTE: Index applies to a month as a whole, not to any specific date.
44 CPI Detailed Report-September 2010
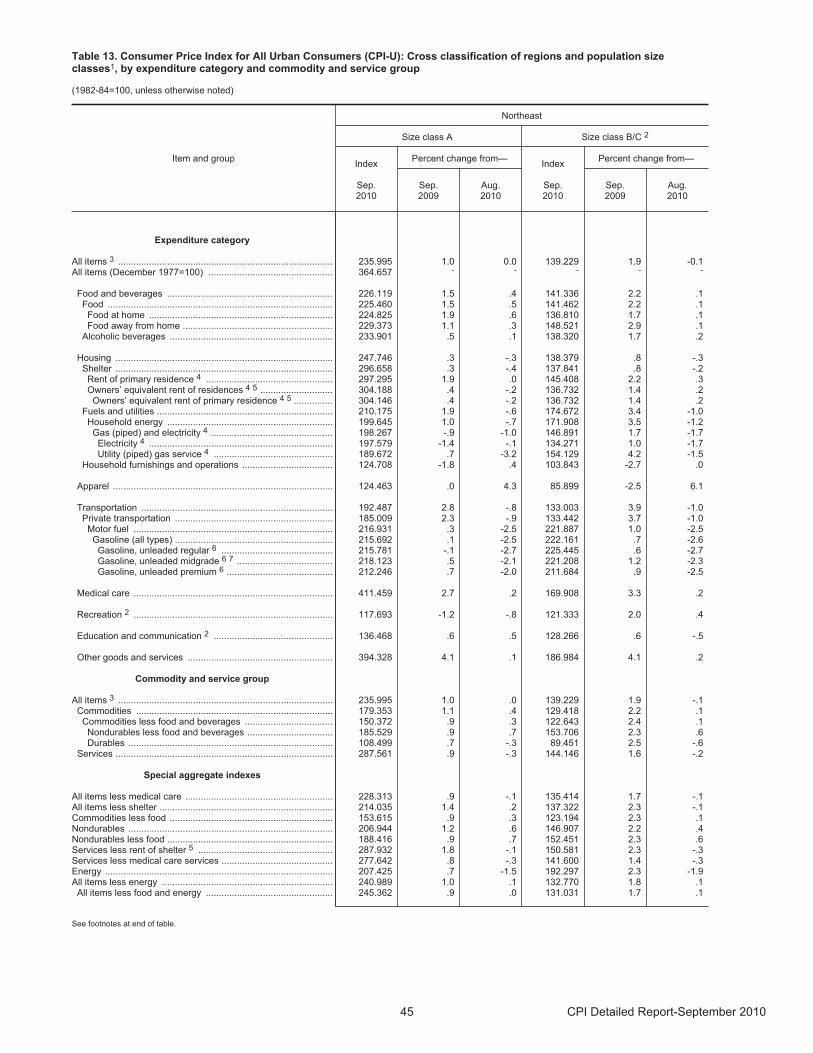
Table 13. Consumer Price Index for All Urban Consumers (CPI-U): Cross classification of regions and population sizeclasses1, by expenditure category and commodity and service group
(1982-84=100, unless otherwise noted)
Item and group
Northeast
Size class A Size class B/C 2
Index
Sep.2010
Percent change from—Index
Sep.2010
Percent change from—
Sep.2009
Aug.2010
Sep.2009
Aug.2010
Expenditure category
All items 3 ................................................................................... 235.995 1.0 0.0 139.229 1.9 -0.1 All items (December 1977=100) ................................................ 364.657 - - - - -
Food and beverages ................................................................ 226.119 1.5 .4 141.336 2.2 .1 Food ....................................................................................... 225.460 1.5 .5 141.462 2.2 .1
Food at home ....................................................................... 224.825 1.9 .6 136.810 1.7 .1 Food away from home .......................................................... 229.373 1.1 .3 148.521 2.9 .1
Alcoholic beverages ............................................................... 233.901 .5 .1 138.320 1.7 .2
Housing .................................................................................... 247.746 .3 -.3 138.379 .8 -.3 Shelter .................................................................................... 296.658 .3 -.4 137.841 .8 -.2
Rent of primary residence 4 ................................................. 297.295 1.9 .0 145.408 2.2 .3 Owners’ equivalent rent of residences 4 5 ............................ 304.188 .4 -.2 136.732 1.4 .2 Owners’ equivalent rent of primary residence 4 5 ............... 304.146 .4 -.2 136.732 1.4 .2
Fuels and utilities .................................................................... 210.175 1.9 -.6 174.672 3.4 -1.0 Household energy ................................................................ 199.645 1.0 -.7 171.908 3.5 -1.2
Gas (piped) and electricity 4 ............................................... 198.267 -.9 -1.0 146.891 1.7 -1.7 Electricity 4 ....................................................................... 197.579 -1.4 -.1 134.271 1.0 -1.7 Utility (piped) gas service 4 .............................................. 189.672 .7 -3.2 154.129 4.2 -1.5
Household furnishings and operations ................................... 124.708 -1.8 .4 103.843 -2.7 .0
Apparel ..................................................................................... 124.463 .0 4.3 85.899 -2.5 6.1
Transportation .......................................................................... 192.487 2.8 -.8 133.003 3.9 -1.0 Private transportation ............................................................. 185.009 2.3 -.9 133.442 3.7 -1.0
Motor fuel ............................................................................. 216.931 .3 -2.5 221.887 1.0 -2.5 Gasoline (all types) ............................................................. 215.692 .1 -2.5 222.161 .7 -2.6 Gasoline, unleaded regular 6 ........................................... 215.781 -.1 -2.7 225.445 .6 -2.7 Gasoline, unleaded midgrade 6 7 ..................................... 218.123 .5 -2.1 221.208 1.2 -2.3 Gasoline, unleaded premium 6 ......................................... 212.246 .7 -2.0 211.684 .9 -2.5
Medical care ............................................................................. 411.459 2.7 .2 169.908 3.3 .2
Recreation 2 ............................................................................. 117.693 -1.2 -.8 121.333 2.0 .4
Education and communication 2 .............................................. 136.468 .6 .5 128.266 .6 -.5
Other goods and services ........................................................ 394.328 4.1 .1 186.984 4.1 .2
Commodity and service group
All items 3 ................................................................................... 235.995 1.0 .0 139.229 1.9 -.1 Commodities ............................................................................ 179.353 1.1 .4 129.418 2.2 .1
Commodities less food and beverages .................................. 150.372 .9 .3 122.643 2.4 .1 Nondurables less food and beverages ................................. 185.529 .9 .7 153.706 2.3 .6 Durables ............................................................................... 108.499 .7 -.3 89.451 2.5 -.6
Services .................................................................................... 287.561 .9 -.3 144.146 1.6 -.2
Special aggregate indexes
All items less medical care ......................................................... 228.313 .9 -.1 135.414 1.7 -.1 All items less shelter ................................................................... 214.035 1.4 .2 137.322 2.3 -.1 Commodities less food ............................................................... 153.615 .9 .3 123.194 2.3 .1 Nondurables ............................................................................... 206.944 1.2 .6 146.907 2.2 .4 Nondurables less food ................................................................ 188.416 .9 .7 152.451 2.3 .6 Services less rent of shelter 5 .................................................... 287.932 1.8 -.1 150.581 2.3 -.3 Services less medical care services ........................................... 277.642 .8 -.3 141.600 1.4 -.3Energy ........................................................................................ 207.425 .7 -1.5 192.297 2.3 -1.9 All items less energy .................................................................. 240.989 1.0 .1 132.770 1.8 .1
All items less food and energy ................................................. 245.362 .9 .0 131.031 1.7 .1
See footnotes at end of table.
45 CPI Detailed Report-September 2010

Table 13. Consumer Price Index for All Urban Consumers (CPI-U): Cross classification of regions and population sizeclasses1, by expenditure category and commodity and service group-Continued
(1982-84=100, unless otherwise noted)
Item and group
Midwest
Size class A Size class B/C 2 Size class D
Index
Sep.2010
Percentchange from—
Index
Sep.2010
Percentchange from—
Index
Sep.2010
Percentchange from—
Sep.2009
Aug.2010
Sep.2009
Aug.2010
Sep.2009
Aug.2010
Expenditure category
All items 3 ................................................................................... 209.253 1.4 0.2 134.275 1.9 -0.1 205.100 1.6 0.1 All items (December 1977=100) ................................................ 345.488 - - - - - 328.821 - -
Food and beverages ................................................................ 216.655 1.5 .2 136.889 1.2 -.1 216.769 .4 .3 Food ....................................................................................... 215.972 1.6 .2 137.010 1.3 -.1 215.965 .3 .4
Food at home ....................................................................... 211.673 1.6 .3 132.472 .9 -.1 203.544 .8 .5 Food away from home .......................................................... 221.908 1.5 .0 143.248 1.9 -.1 237.183 -.4 .2
Alcoholic beverages ............................................................... 222.140 1.2 .3 137.575 .5 .1 228.578 2.1 -.2
Housing .................................................................................... 199.198 -.1 -.2 126.545 .5 -.4 194.107 1.1 -.3 Shelter .................................................................................... 230.849 -.5 .0 126.263 .2 .1 219.160 1.1 -.2
Rent of primary residence 4 ................................................. 231.953 .7 .0 127.839 .8 .3 205.252 1.9 -.1 Owners’ equivalent rent of residences 4 5 ............................ 235.536 -.3 .0 124.513 .7 .1 225.272 1.0 -.1 Owners’ equivalent rent of primary residence 4 5 ............... 235.536 -.3 .0 124.513 .7 .1 225.272 1.0 -.1
Fuels and utilities .................................................................... 203.490 5.9 -1.1 170.198 5.2 -2.7 206.884 3.5 -1.3 Household energy ................................................................ 180.000 5.7 -1.4 171.992 5.2 -3.3 163.116 3.9 -1.6
Gas (piped) and electricity 4 ............................................... 183.356 5.7 -1.5 168.770 4.7 -3.5 176.505 3.0 -2.2 Electricity 4 ....................................................................... 180.650 5.6 -.9 164.183 2.8 -2.2 172.983 4.3 -1.8 Utility (piped) gas service 4 .............................................. 170.439 5.9 -2.5 163.985 10.1 -6.9 173.980 -.4 -3.2
Household furnishings and operations ................................... 113.268 -4.3 -.9 93.733 -2.9 -.6 120.829 -1.8 .5
Apparel ..................................................................................... 112.943 -.8 4.7 83.133 -3.3 1.3 120.267 -6.4 3.9
Transportation .......................................................................... 193.911 6.2 .2 142.127 6.6 .0 173.142 4.9 -.1 Private transportation ............................................................. 189.695 6.2 .3 141.613 6.5 .1 165.710 5.1 .2
Motor fuel ............................................................................. 249.134 12.3 1.3 248.786 11.3 1.1 211.247 10.1 1.0 Gasoline (all types) ............................................................. 248.415 12.3 1.3 249.851 11.3 1.2 209.326 10.0 1.0 Gasoline, unleaded regular 6 ........................................... 248.218 12.5 1.4 254.698 11.5 1.3 201.674 9.9 1.1 Gasoline, unleaded midgrade 6 7 ..................................... 264.594 11.9 1.2 246.484 11.1 .5 242.889 10.4 .9 Gasoline, unleaded premium 6 ......................................... 239.423 11.1 1.0 235.913 10.8 1.1 215.073 9.2 .9
Medical care ............................................................................. 387.120 3.4 .4 169.328 3.6 .2 370.578 .7 .0
Recreation 2 ............................................................................. 113.693 -2.3 -.7 117.425 -.4 -.3 109.311 -.4 .0
Education and communication 2 .............................................. 133.739 1.1 .4 132.891 2.1 .3 124.701 3.9 .5
Other goods and services ........................................................ 355.774 1.0 .3 175.716 2.0 .5 388.648 3.5 -.5
Commodity and service group
All items 3 ................................................................................... 209.253 1.4 .2 134.275 1.9 -.1 205.100 1.6 .1Commodities ............................................................................ 170.106 1.9 .5 122.743 2.1 .1 174.259 1.7 .5
Commodities less food and beverages .................................. 145.597 2.2 .8 115.114 2.6 .2 153.606 2.5 .6 Nondurables less food and beverages ................................. 185.264 3.3 1.6 144.962 3.2 .6 195.039 3.0 1.0 Durables ............................................................................... 106.186 .6 -.6 84.070 1.8 -.5 111.161 1.7 .0
Services .................................................................................... 248.123 1.0 -.1 141.854 1.7 -.2 239.095 1.4 -.3
Special aggregate indexes
All items less medical care ......................................................... 201.362 1.2 .1 130.436 1.7 -.1 194.607 1.7 .1 All items less shelter ................................................................... 203.442 2.2 .2 135.683 2.5 -.2 201.719 1.8 .2 Commodities less food ............................................................... 148.594 2.1 .7 115.737 2.5 .2 155.595 2.4 .6Nondurables ............................................................................... 201.755 2.4 .9 140.982 2.2 .3 205.793 1.7 .7 Nondurables less food ................................................................ 187.910 3.1 1.5 144.183 3.0 .6 196.490 2.9 .9 Services less rent of shelter 5 .................................................... 278.287 2.6 -.2 158.055 3.2 -.5 263.330 1.9 -.4 Services less medical care services ........................................... 236.723 .7 -.1 138.537 1.5 -.2 221.488 1.5 -.3 Energy ........................................................................................ 209.299 9.1 .0 205.864 8.2 -1.0 184.874 7.2 -.2 All items less energy .................................................................. 211.421 .6 .2 127.548 1.2 .0 208.983 .9 .1
All items less food and energy ................................................. 211.279 .5 .2 125.768 1.2 .0 207.665 1.1 .0
See footnotes at end of table.
46 CPI Detailed Report-September 2010
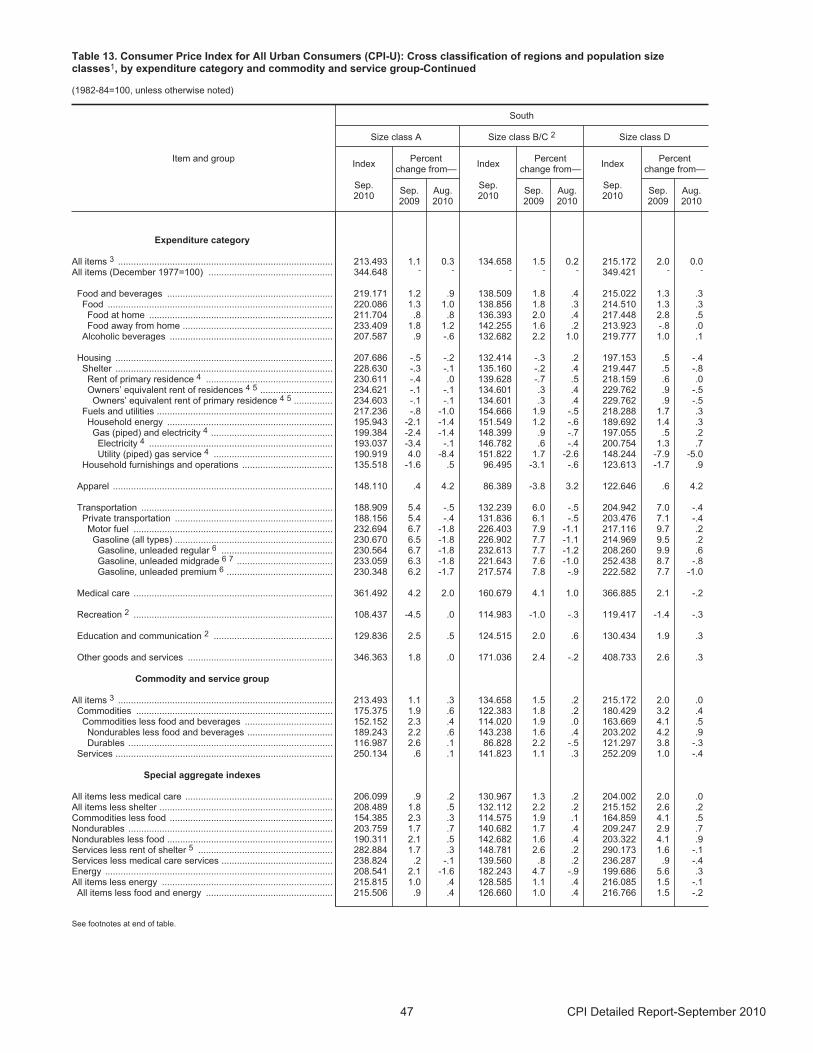
Table 13. Consumer Price Index for All Urban Consumers (CPI-U): Cross classification of regions and population sizeclasses1, by expenditure category and commodity and service group-Continued
(1982-84=100, unless otherwise noted)
Item and group
South
Size class A Size class B/C 2 Size class D
Index
Sep.2010
Percentchange from—
Index
Sep.2010
Percentchange from—
Index
Sep.2010
Percentchange from—
Sep.2009
Aug.2010
Sep.2009
Aug.2010
Sep.2009
Aug.2010
Expenditure category
All items 3 ................................................................................... 213.493 1.1 0.3 134.658 1.5 0.2 215.172 2.0 0.0All items (December 1977=100) ................................................ 344.648 - - - - - 349.421 - -
Food and beverages ................................................................ 219.171 1.2 .9 138.509 1.8 .4 215.022 1.3 .3 Food ....................................................................................... 220.086 1.3 1.0 138.856 1.8 .3 214.510 1.3 .3
Food at home ....................................................................... 211.704 .8 .8 136.393 2.0 .4 217.448 2.8 .5 Food away from home .......................................................... 233.409 1.8 1.2 142.255 1.6 .2 213.923 -.8 .0
Alcoholic beverages ............................................................... 207.587 .9 -.6 132.682 2.2 1.0 219.777 1.0 .1
Housing .................................................................................... 207.686 -.5 -.2 132.414 -.3 .2 197.153 .5 -.4 Shelter .................................................................................... 228.630 -.3 -.1 135.160 -.2 .4 219.447 .5 -.8
Rent of primary residence 4 ................................................. 230.611 -.4 .0 139.628 -.7 .5 218.159 .6 .0 Owners’ equivalent rent of residences 4 5 ............................ 234.621 -.1 -.1 134.601 .3 .4 229.762 .9 -.5 Owners’ equivalent rent of primary residence 4 5 ............... 234.603 -.1 -.1 134.601 .3 .4 229.762 .9 -.5
Fuels and utilities .................................................................... 217.236 -.8 -1.0 154.666 1.9 -.5 218.288 1.7 .3 Household energy ................................................................ 195.943 -2.1 -1.4 151.549 1.2 -.6 189.692 1.4 .3
Gas (piped) and electricity 4 ............................................... 199.384 -2.4 -1.4 148.399 .9 -.7 197.055 .5 .2 Electricity 4 ....................................................................... 193.037 -3.4 -.1 146.782 .6 -.4 200.754 1.3 .7 Utility (piped) gas service 4 .............................................. 190.919 4.0 -8.4 151.822 1.7 -2.6 148.244 -7.9 -5.0
Household furnishings and operations ................................... 135.518 -1.6 .5 96.495 -3.1 -.6 123.613 -1.7 .9
Apparel ..................................................................................... 148.110 .4 4.2 86.389 -3.8 3.2 122.646 .6 4.2
Transportation .......................................................................... 188.909 5.4 -.5 132.239 6.0 -.5 204.942 7.0 -.4 Private transportation ............................................................. 188.156 5.4 -.4 131.836 6.1 -.5 203.476 7.1 -.4
Motor fuel ............................................................................. 232.694 6.7 -1.8 226.403 7.9 -1.1 217.116 9.7 .2 Gasoline (all types) ............................................................. 230.670 6.5 -1.8 226.902 7.7 -1.1 214.969 9.5 .2Gasoline, unleaded regular 6 ........................................... 230.564 6.7 -1.8 232.613 7.7 -1.2 208.260 9.9 .6 Gasoline, unleaded midgrade 6 7 ..................................... 233.059 6.3 -1.8 221.643 7.6 -1.0 252.438 8.7 -.8 Gasoline, unleaded premium 6 ......................................... 230.348 6.2 -1.7 217.574 7.8 -.9 222.582 7.7 -1.0
Medical care ............................................................................. 361.492 4.2 2.0 160.679 4.1 1.0 366.885 2.1 -.2
Recreation 2 ............................................................................. 108.437 -4.5 .0 114.983 -1.0 -.3 119.417 -1.4 -.3
Education and communication 2 .............................................. 129.836 2.5 .5 124.515 2.0 .6 130.434 1.9 .3
Other goods and services ........................................................ 346.363 1.8 .0 171.036 2.4 -.2 408.733 2.6 .3
Commodity and service group
All items 3 ................................................................................... 213.493 1.1 .3 134.658 1.5 .2 215.172 2.0 .0Commodities ............................................................................ 175.375 1.9 .6 122.383 1.8 .2 180.429 3.2 .4
Commodities less food and beverages .................................. 152.152 2.3 .4 114.020 1.9 .0 163.669 4.1 .5 Nondurables less food and beverages ................................. 189.243 2.2 .6 143.238 1.6 .4 203.202 4.2 .9 Durables ............................................................................... 116.987 2.6 .1 86.828 2.2 -.5 121.297 3.8 -.3
Services .................................................................................... 250.134 .6 .1 141.823 1.1 .3 252.209 1.0 -.4
Special aggregate indexes
All items less medical care ......................................................... 206.099 .9 .2 130.967 1.3 .2 204.002 2.0 .0 All items less shelter ................................................................... 208.489 1.8 .5 132.112 2.2 .2 215.152 2.6 .2 Commodities less food ............................................................... 154.385 2.3 .3 114.575 1.9 .1 164.859 4.1 .5Nondurables ............................................................................... 203.759 1.7 .7 140.682 1.7 .4 209.247 2.9 .7 Nondurables less food ................................................................ 190.311 2.1 .5 142.682 1.6 .4 203.322 4.1 .9Services less rent of shelter 5 .................................................... 282.884 1.7 .3 148.781 2.6 .2 290.173 1.6 -.1 Services less medical care services ........................................... 238.824 .2 -.1 139.560 .8 .2 236.287 .9 -.4 Energy ........................................................................................ 208.541 2.1 -1.6 182.243 4.7 -.9 199.686 5.6 .3 All items less energy .................................................................. 215.815 1.0 .4 128.585 1.1 .4 216.085 1.5 -.1
All items less food and energy ................................................. 215.506 .9 .4 126.660 1.0 .4 216.766 1.5 -.2
See footnotes at end of table.
47 CPI Detailed Report-September 2010
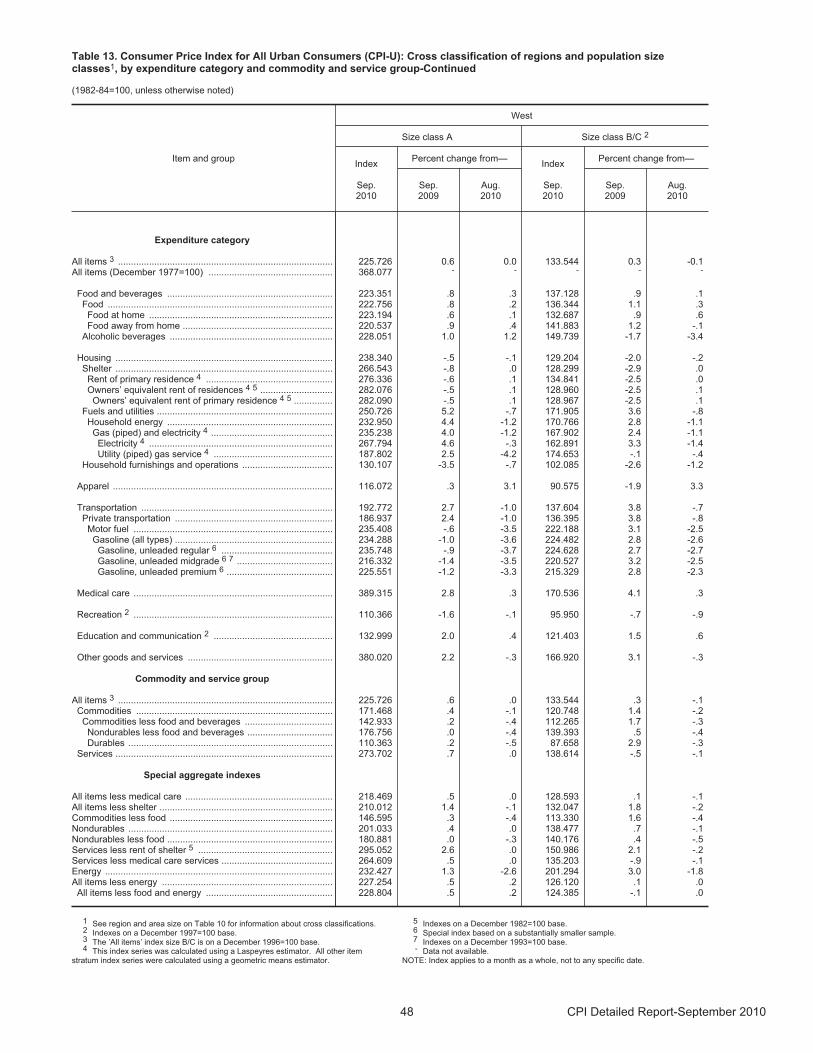
Table 13. Consumer Price Index for All Urban Consumers (CPI-U): Cross classification of regions and population sizeclasses1, by expenditure category and commodity and service group-Continued
(1982-84=100, unless otherwise noted)
Item and group
West
Size class A Size class B/C 2
Index
Sep.2010
Percent change from—Index
Sep.2010
Percent change from—
Sep.2009
Aug.2010
Sep.2009
Aug.2010
Expenditure category
All items 3 ................................................................................... 225.726 0.6 0.0 133.544 0.3 -0.1 All items (December 1977=100) ................................................ 368.077 - - - - -
Food and beverages ................................................................ 223.351 .8 .3 137.128 .9 .1 Food ....................................................................................... 222.756 .8 .2 136.344 1.1 .3
Food at home ....................................................................... 223.194 .6 .1 132.687 .9 .6 Food away from home .......................................................... 220.537 .9 .4 141.883 1.2 -.1
Alcoholic beverages ............................................................... 228.051 1.0 1.2 149.739 -1.7 -3.4
Housing .................................................................................... 238.340 -.5 -.1 129.204 -2.0 -.2 Shelter .................................................................................... 266.543 -.8 .0 128.299 -2.9 .0
Rent of primary residence 4 ................................................. 276.336 -.6 .1 134.841 -2.5 .0 Owners’ equivalent rent of residences 4 5 ............................ 282.076 -.5 .1 128.960 -2.5 .1 Owners’ equivalent rent of primary residence 4 5 ............... 282.090 -.5 .1 128.967 -2.5 .1
Fuels and utilities .................................................................... 250.726 5.2 -.7 171.905 3.6 -.8 Household energy ................................................................ 232.950 4.4 -1.2 170.766 2.8 -1.1
Gas (piped) and electricity 4 ............................................... 235.238 4.0 -1.2 167.902 2.4 -1.1 Electricity 4 ....................................................................... 267.794 4.6 -.3 162.891 3.3 -1.4 Utility (piped) gas service 4 .............................................. 187.802 2.5 -4.2 174.653 -.1 -.4
Household furnishings and operations ................................... 130.107 -3.5 -.7 102.085 -2.6 -1.2
Apparel ..................................................................................... 116.072 .3 3.1 90.575 -1.9 3.3
Transportation .......................................................................... 192.772 2.7 -1.0 137.604 3.8 -.7 Private transportation ............................................................. 186.937 2.4 -1.0 136.395 3.8 -.8
Motor fuel ............................................................................. 235.408 -.6 -3.5 222.188 3.1 -2.5 Gasoline (all types) ............................................................. 234.288 -1.0 -3.6 224.482 2.8 -2.6 Gasoline, unleaded regular 6 ........................................... 235.748 -.9 -3.7 224.628 2.7 -2.7 Gasoline, unleaded midgrade 6 7 ..................................... 216.332 -1.4 -3.5 220.527 3.2 -2.5 Gasoline, unleaded premium 6 ......................................... 225.551 -1.2 -3.3 215.329 2.8 -2.3
Medical care ............................................................................. 389.315 2.8 .3 170.536 4.1 .3
Recreation 2 ............................................................................. 110.366 -1.6 -.1 95.950 -.7 -.9
Education and communication 2 .............................................. 132.999 2.0 .4 121.403 1.5 .6
Other goods and services ........................................................ 380.020 2.2 -.3 166.920 3.1 -.3
Commodity and service group
All items 3 ................................................................................... 225.726 .6 .0 133.544 .3 -.1 Commodities ............................................................................ 171.468 .4 -.1 120.748 1.4 -.2
Commodities less food and beverages .................................. 142.933 .2 -.4 112.265 1.7 -.3 Nondurables less food and beverages ................................. 176.756 .0 -.4 139.393 .5 -.4 Durables ............................................................................... 110.363 .2 -.5 87.658 2.9 -.3
Services .................................................................................... 273.702 .7 .0 138.614 -.5 -.1
Special aggregate indexes
All items less medical care ......................................................... 218.469 .5 .0 128.593 .1 -.1 All items less shelter ................................................................... 210.012 1.4 -.1 132.047 1.8 -.2 Commodities less food ............................................................... 146.595 .3 -.4 113.330 1.6 -.4 Nondurables ............................................................................... 201.033 .4 .0 138.477 .7 -.1 Nondurables less food ................................................................ 180.881 .0 -.3 140.176 .4 -.5 Services less rent of shelter 5 .................................................... 295.052 2.6 .0 150.986 2.1 -.2 Services less medical care services ........................................... 264.609 .5 .0 135.203 -.9 -.1Energy ........................................................................................ 232.427 1.3 -2.6 201.294 3.0 -1.8All items less energy .................................................................. 227.254 .5 .2 126.120 .1 .0All items less food and energy ................................................. 228.804 .5 .2 124.385 -.1 .0
1 See region and area size on Table 10 for information about cross classifications.2 Indexes on a December 1997=100 base.3 The ’All items’ index size B/C is on a December 1996=100 base.4 This index series was calculated using a Laspeyres estimator. All other item
stratum index series were calculated using a geometric means estimator.
5 Indexes on a December 1982=100 base.6 Special index based on a substantially smaller sample.7 Indexes on a December 1993=100 base.- Data not available.
NOTE: Index applies to a month as a whole, not to any specific date.
48 CPI Detailed Report-September 2010
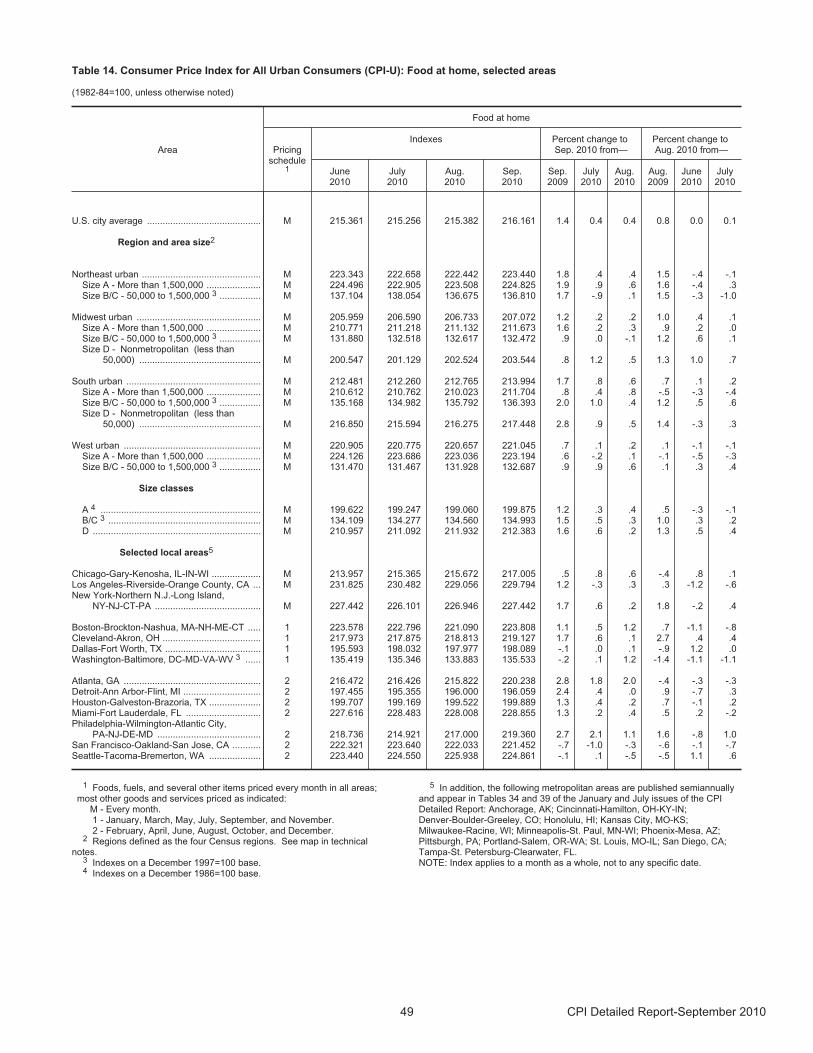
Table 14. Consumer Price Index for All Urban Consumers (CPI-U): Food at home, selected areas
(1982-84=100, unless otherwise noted)
Area
Food at home
Pricingschedule
1
Indexes Percent change to Sep. 2010 from—
Percent change to Aug. 2010 from—
June2010
July2010
Aug.2010
Sep.2010
Sep.2009
July2010
Aug.2010
Aug.2009
June2010
July2010
U.S. city average ............................................ M 215.361 215.256 215.382 216.161 1.4 0.4 0.4 0.8 0.0 0.1
Region and area size2
Northeast urban .............................................. M 223.343 222.658 222.442 223.440 1.8 .4 .4 1.5 -.4 -.1 Size A - More than 1,500,000 ..................... M 224.496 222.905 223.508 224.825 1.9 .9 .6 1.6 -.4 .3 Size B/C - 50,000 to 1,500,000 3 ................ M 137.104 138.054 136.675 136.810 1.7 -.9 .1 1.5 -.3 -1.0
Midwest urban ................................................ M 205.959 206.590 206.733 207.072 1.2 .2 .2 1.0 .4 .1 Size A - More than 1,500,000 ..................... M 210.771 211.218 211.132 211.673 1.6 .2 .3 .9 .2 .0 Size B/C - 50,000 to 1,500,000 3 ................ M 131.880 132.518 132.617 132.472 .9 .0 -.1 1.2 .6 .1 Size D - Nonmetropolitan (less than
50,000) ............................................... M 200.547 201.129 202.524 203.544 .8 1.2 .5 1.3 1.0 .7
South urban .................................................... M 212.481 212.260 212.765 213.994 1.7 .8 .6 .7 .1 .2 Size A - More than 1,500,000 ..................... M 210.612 210.762 210.023 211.704 .8 .4 .8 -.5 -.3 -.4 Size B/C - 50,000 to 1,500,000 3 ................ M 135.168 134.982 135.792 136.393 2.0 1.0 .4 1.2 .5 .6 Size D - Nonmetropolitan (less than
50,000) ............................................... M 216.850 215.594 216.275 217.448 2.8 .9 .5 1.4 -.3 .3
West urban ..................................................... M 220.905 220.775 220.657 221.045 .7 .1 .2 .1 -.1 -.1 Size A - More than 1,500,000 ..................... M 224.126 223.686 223.036 223.194 .6 -.2 .1 -.1 -.5 -.3 Size B/C - 50,000 to 1,500,000 3 ................ M 131.470 131.467 131.928 132.687 .9 .9 .6 .1 .3 .4
Size classes
A 4 .............................................................. M 199.622 199.247 199.060 199.875 1.2 .3 .4 .5 -.3 -.1 B/C 3 ........................................................... M 134.109 134.277 134.560 134.993 1.5 .5 .3 1.0 .3 .2 D ................................................................. M 210.957 211.092 211.932 212.383 1.6 .6 .2 1.3 .5 .4
Selected local areas5
Chicago-Gary-Kenosha, IL-IN-WI ................... M 213.957 215.365 215.672 217.005 .5 .8 .6 -.4 .8 .1 Los Angeles-Riverside-Orange County, CA ... M 231.825 230.482 229.056 229.794 1.2 -.3 .3 .3 -1.2 -.6 New York-Northern N.J.-Long Island,
NY-NJ-CT-PA ......................................... M 227.442 226.101 226.946 227.442 1.7 .6 .2 1.8 -.2 .4
Boston-Brockton-Nashua, MA-NH-ME-CT ..... 1 223.578 222.796 221.090 223.808 1.1 .5 1.2 .7 -1.1 -.8 Cleveland-Akron, OH ...................................... 1 217.973 217.875 218.813 219.127 1.7 .6 .1 2.7 .4 .4 Dallas-Fort Worth, TX ..................................... 1 195.593 198.032 197.977 198.089 -.1 .0 .1 -.9 1.2 .0 Washington-Baltimore, DC-MD-VA-WV 3 ...... 1 135.419 135.346 133.883 135.533 -.2 .1 1.2 -1.4 -1.1 -1.1
Atlanta, GA ..................................................... 2 216.472 216.426 215.822 220.238 2.8 1.8 2.0 -.4 -.3 -.3 Detroit-Ann Arbor-Flint, MI .............................. 2 197.455 195.355 196.000 196.059 2.4 .4 .0 .9 -.7 .3 Houston-Galveston-Brazoria, TX .................... 2 199.707 199.169 199.522 199.889 1.3 .4 .2 .7 -.1 .2 Miami-Fort Lauderdale, FL ............................. 2 227.616 228.483 228.008 228.855 1.3 .2 .4 .5 .2 -.2 Philadelphia-Wilmington-Atlantic City,
PA-NJ-DE-MD ........................................ 2 218.736 214.921 217.000 219.360 2.7 2.1 1.1 1.6 -.8 1.0 San Francisco-Oakland-San Jose, CA ........... 2 222.321 223.640 222.033 221.452 -.7 -1.0 -.3 -.6 -.1 -.7 Seattle-Tacoma-Bremerton, WA .................... 2 223.440 224.550 225.938 224.861 -.1 .1 -.5 -.5 1.1 .6
1 Foods, fuels, and several other items priced every month in all areas; most other goods and services priced as indicated: M - Every month. 1 - January, March, May, July, September, and November. 2 - February, April, June, August, October, and December.
2 Regions defined as the four Census regions. See map in technicalnotes.
3 Indexes on a December 1997=100 base.4 Indexes on a December 1986=100 base.
5 In addition, the following metropolitan areas are published semiannuallyand appear in Tables 34 and 39 of the January and July issues of the CPIDetailed Report: Anchorage, AK; Cincinnati-Hamilton, OH-KY-IN;Denver-Boulder-Greeley, CO; Honolulu, HI; Kansas City, MO-KS;Milwaukee-Racine, WI; Minneapolis-St. Paul, MN-WI; Phoenix-Mesa, AZ;Pittsburgh, PA; Portland-Salem, OR-WA; St. Louis, MO-IL; San Diego, CA;Tampa-St. Petersburg-Clearwater, FL.NOTE: Index applies to a month as a whole, not to any specific date.
49 CPI Detailed Report-September 2010
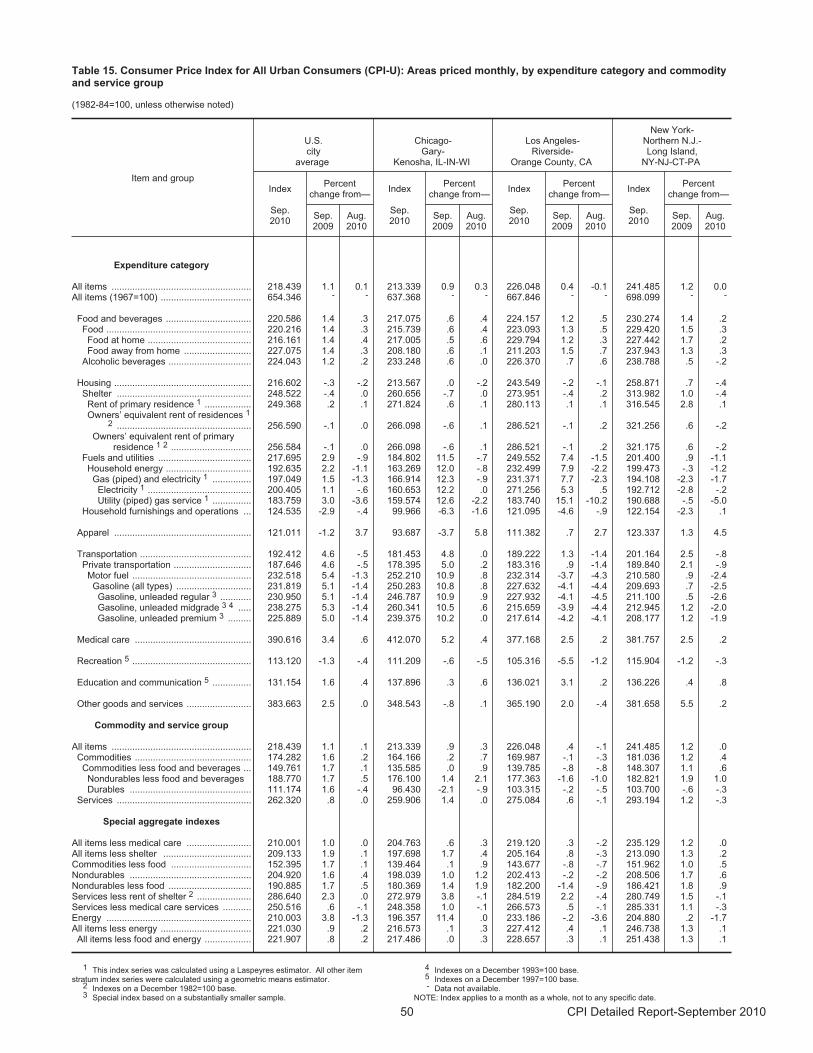
Table 15. Consumer Price Index for All Urban Consumers (CPI-U): Areas priced monthly, by expenditure category and commodityand service group
(1982-84=100, unless otherwise noted)
Item and group
U.S.city
average
Chicago-Gary-
Kenosha, IL-IN-WI
Los Angeles-Riverside-
Orange County, CA
New York-Northern N.J.-Long Island,
NY-NJ-CT-PA
Index
Sep.2010
Percentchange from—
Index
Sep.2010
Percentchange from—
Index
Sep.2010
Percentchange from—
Index
Sep.2010
Percentchange from—
Sep.2009
Aug.2010
Sep.2009
Aug.2010
Sep.2009
Aug.2010
Sep.2009
Aug.2010
Expenditure category
All items ...................................................... 218.439 1.1 0.1 213.339 0.9 0.3 226.048 0.4 -0.1 241.485 1.2 0.0All items (1967=100) ................................... 654.346 - - 637.368 - - 667.846 - - 698.099 - -
Food and beverages ................................. 220.586 1.4 .3 217.075 .6 .4 224.157 1.2 .5 230.274 1.4 .2 Food ........................................................ 220.216 1.4 .3 215.739 .6 .4 223.093 1.3 .5 229.420 1.5 .3
Food at home ........................................ 216.161 1.4 .4 217.005 .5 .6 229.794 1.2 .3 227.442 1.7 .2 Food away from home .......................... 227.075 1.4 .3 208.180 .6 .1 211.203 1.5 .7 237.943 1.3 .3
Alcoholic beverages ................................ 224.043 1.2 .2 233.248 .6 .0 226.370 .7 .6 238.788 .5 -.2
Housing ..................................................... 216.602 -.3 -.2 213.567 .0 -.2 243.549 -.2 -.1 258.871 .7 -.4 Shelter .................................................... 248.522 -.4 .0 260.656 -.7 .0 273.951 -.4 .2 313.982 1.0 -.4
Rent of primary residence 1 .................. 249.368 .2 .1 271.824 .6 .1 280.113 .1 .1 316.545 2.8 .1 Owners’ equivalent rent of residences 1
2 .................................................... 256.590 -.1 .0 266.098 -.6 .1 286.521 -.1 .2 321.256 .6 -.2 Owners’ equivalent rent of primary
residence 1 2 ............................... 256.584 -.1 .0 266.098 -.6 .1 286.521 -.1 .2 321.175 .6 -.2 Fuels and utilities .................................... 217.695 2.9 -.9 184.802 11.5 -.7 249.552 7.4 -1.5 201.400 .9 -1.1
Household energy ................................. 192.635 2.2 -1.1 163.269 12.0 -.8 232.499 7.9 -2.2 199.473 -.3 -1.2 Gas (piped) and electricity 1 ............... 197.049 1.5 -1.3 166.914 12.3 -.9 231.371 7.7 -2.3 194.108 -2.3 -1.7 Electricity 1 ........................................ 200.405 1.1 -.6 160.653 12.2 .0 271.256 5.3 .5 192.712 -2.8 -.2 Utility (piped) gas service 1 ............... 183.759 3.0 -3.6 159.574 12.6 -2.2 183.740 15.1 -10.2 190.688 -.5 -5.0
Household furnishings and operations ... 124.535 -2.9 -.4 99.966 -6.3 -1.6 121.095 -4.6 -.9 122.154 -2.3 .1
Apparel ..................................................... 121.011 -1.2 3.7 93.687 -3.7 5.8 111.382 .7 2.7 123.337 1.3 4.5
Transportation ........................................... 192.412 4.6 -.5 181.453 4.8 .0 189.222 1.3 -1.4 201.164 2.5 -.8 Private transportation .............................. 187.646 4.6 -.5 178.395 5.0 .2 183.316 .9 -1.4 189.840 2.1 -.9 Motor fuel .............................................. 232.518 5.4 -1.3 252.210 10.9 .8 232.314 -3.7 -4.3 210.580 .9 -2.4
Gasoline (all types) ............................. 231.819 5.1 -1.4 250.283 10.8 .8 227.632 -4.1 -4.4 209.693 .7 -2.5 Gasoline, unleaded regular 3 ............ 230.950 5.1 -1.4 246.787 10.9 .9 227.932 -4.1 -4.5 211.100 .5 -2.6 Gasoline, unleaded midgrade 3 4 ..... 238.275 5.3 -1.4 260.341 10.5 .6 215.659 -3.9 -4.4 212.945 1.2 -2.0 Gasoline, unleaded premium 3 ......... 225.889 5.0 -1.4 239.375 10.2 .0 217.614 -4.2 -4.1 208.177 1.2 -1.9
Medical care ............................................. 390.616 3.4 .6 412.070 5.2 .4 377.168 2.5 .2 381.757 2.5 .2
Recreation 5 .............................................. 113.120 -1.3 -.4 111.209 -.6 -.5 105.316 -5.5 -1.2 115.904 -1.2 -.3
Education and communication 5 ............... 131.154 1.6 .4 137.896 .3 .6 136.021 3.1 .2 136.226 .4 .8
Other goods and services ......................... 383.663 2.5 .0 348.543 -.8 .1 365.190 2.0 -.4 381.658 5.5 .2
Commodity and service group
All items ...................................................... 218.439 1.1 .1 213.339 .9 .3 226.048 .4 -.1 241.485 1.2 .0 Commodities ............................................. 174.282 1.6 .2 164.166 .2 .7 169.987 -.1 -.3 181.036 1.2 .4
Commodities less food and beverages ... 149.761 1.7 .1 135.585 .0 .9 139.785 -.8 -.8 148.307 1.1 .6 Nondurables less food and beverages 188.770 1.7 .5 176.100 1.4 2.1 177.363 -1.6 -1.0 182.821 1.9 1.0 Durables ............................................... 111.174 1.6 -.4 96.430 -2.1 -.9 103.315 -.2 -.5 103.700 -.6 -.3
Services .................................................... 262.320 .8 .0 259.906 1.4 .0 275.084 .6 -.1 293.194 1.2 -.3
Special aggregate indexes
All items less medical care ......................... 210.001 1.0 .0 204.763 .6 .3 219.120 .3 -.2 235.129 1.2 .0 All items less shelter .................................. 209.133 1.9 .1 197.698 1.7 .4 205.164 .8 -.3 213.090 1.3 .2 Commodities less food ............................... 152.395 1.7 .1 139.464 .1 .9 143.677 -.8 -.7 151.962 1.0 .5 Nondurables ............................................... 204.920 1.6 .4 198.039 1.0 1.2 202.413 -.2 -.2 208.506 1.7 .6 Nondurables less food ................................ 190.885 1.7 .5 180.369 1.4 1.9 182.200 -1.4 -.9 186.421 1.8 .9 Services less rent of shelter 2 ..................... 286.640 2.3 .0 272.979 3.8 -.1 284.519 2.2 -.4 280.749 1.5 -.1 Services less medical care services ........... 250.516 .6 -.1 248.358 1.0 -.1 266.573 .5 -.1 285.331 1.1 -.3 Energy ........................................................ 210.003 3.8 -1.3 196.357 11.4 .0 233.186 -.2 -3.6 204.880 .2 -1.7All items less energy ................................... 221.030 .9 .2 216.573 .1 .3 227.412 .4 .1 246.738 1.3 .1 All items less food and energy .................. 221.907 .8 .2 217.486 .0 .3 228.657 .3 .1 251.438 1.3 .1
1 This index series was calculated using a Laspeyres estimator. All other itemstratum index series were calculated using a geometric means estimator.
2 Indexes on a December 1982=100 base.3 Special index based on a substantially smaller sample.
4 Indexes on a December 1993=100 base.5 Indexes on a December 1997=100 base.- Data not available.
NOTE: Index applies to a month as a whole, not to any specific date.
50 CPI Detailed Report-September 2010
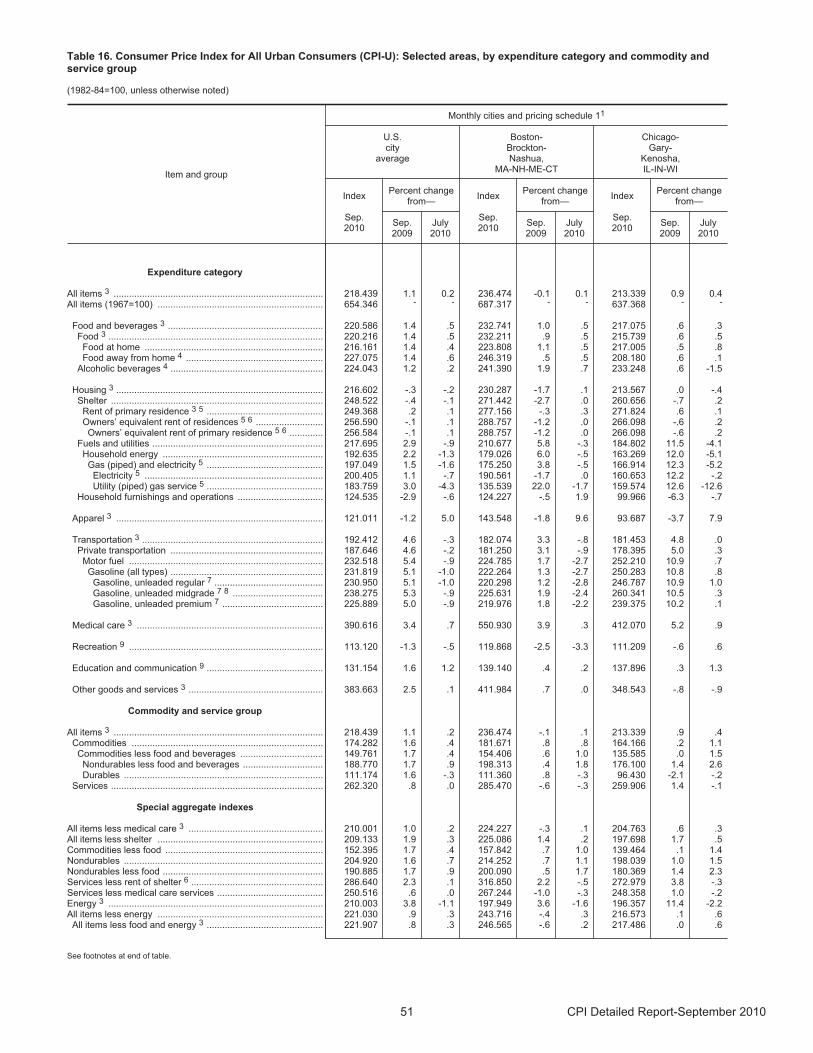
Table 16. Consumer Price Index for All Urban Consumers (CPI-U): Selected areas, by expenditure category and commodity andservice group
(1982-84=100, unless otherwise noted)
Item and group
Monthly cities and pricing schedule 11
U.S. city
average
Boston-Brockton-Nashua,
MA-NH-ME-CT
Chicago-Gary-
Kenosha, IL-IN-WI
Index
Sep.2010
Percent changefrom—
Index
Sep.2010
Percent changefrom—
Index
Sep.2010
Percent changefrom—
Sep.2009
July2010
Sep.2009
July2010
Sep.2009
July2010
Expenditure category
All items 3 ................................................................................. 218.439 1.1 0.2 236.474 -0.1 0.1 213.339 0.9 0.4All items (1967=100) ................................................................ 654.346 - - 687.317 - - 637.368 - -
Food and beverages 3 ............................................................ 220.586 1.4 .5 232.741 1.0 .5 217.075 .6 .3 Food 3 ................................................................................... 220.216 1.4 .5 232.211 .9 .5 215.739 .6 .5 Food at home ..................................................................... 216.161 1.4 .4 223.808 1.1 .5 217.005 .5 .8 Food away from home 4 ..................................................... 227.075 1.4 .6 246.319 .5 .5 208.180 .6 .1
Alcoholic beverages 4 ........................................................... 224.043 1.2 .2 241.390 1.9 .7 233.248 .6 -1.5
Housing 3 ................................................................................ 216.602 -.3 -.2 230.287 -1.7 .1 213.567 .0 -.4 Shelter .................................................................................. 248.522 -.4 -.1 271.442 -2.7 .0 260.656 -.7 .2 Rent of primary residence 3 5 ............................................. 249.368 .2 .1 277.156 -.3 .3 271.824 .6 .1 Owners’ equivalent rent of residences 5 6 .......................... 256.590 -.1 .1 288.757 -1.2 .0 266.098 -.6 .2 Owners’ equivalent rent of primary residence 5 6 ............. 256.584 -.1 .1 288.757 -1.2 .0 266.098 -.6 .2
Fuels and utilities .................................................................. 217.695 2.9 -.9 210.677 5.8 -.3 184.802 11.5 -4.1 Household energy .............................................................. 192.635 2.2 -1.3 179.026 6.0 -.5 163.269 12.0 -5.1Gas (piped) and electricity 5 ............................................. 197.049 1.5 -1.6 175.250 3.8 -.5 166.914 12.3 -5.2 Electricity 5 ..................................................................... 200.405 1.1 -.7 190.561 -1.7 .0 160.653 12.2 -.2 Utility (piped) gas service 5 ............................................. 183.759 3.0 -4.3 135.539 22.0 -1.7 159.574 12.6 -12.6
Household furnishings and operations ................................. 124.535 -2.9 -.6 124.227 -.5 1.9 99.966 -6.3 -.7
Apparel 3 ................................................................................ 121.011 -1.2 5.0 143.548 -1.8 9.6 93.687 -3.7 7.9
Transportation 3 ...................................................................... 192.412 4.6 -.3 182.074 3.3 -.8 181.453 4.8 .0 Private transportation ........................................................... 187.646 4.6 -.2 181.250 3.1 -.9 178.395 5.0 .3
Motor fuel ........................................................................... 232.518 5.4 -.9 224.785 1.7 -2.7 252.210 10.9 .7 Gasoline (all types) ........................................................... 231.819 5.1 -1.0 222.264 1.3 -2.7 250.283 10.8 .8
Gasoline, unleaded regular 7 .......................................... 230.950 5.1 -1.0 220.298 1.2 -2.8 246.787 10.9 1.0 Gasoline, unleaded midgrade 7 8 ................................... 238.275 5.3 -.9 225.631 1.9 -2.4 260.341 10.5 .3 Gasoline, unleaded premium 7 ....................................... 225.889 5.0 -.9 219.976 1.8 -2.2 239.375 10.2 .1
Medical care 3 ........................................................................ 390.616 3.4 .7 550.930 3.9 .3 412.070 5.2 .9
Recreation 9 ........................................................................... 113.120 -1.3 -.5 119.868 -2.5 -3.3 111.209 -.6 .6
Education and communication 9 ............................................. 131.154 1.6 1.2 139.140 .4 .2 137.896 .3 1.3
Other goods and services 3 .................................................... 383.663 2.5 .1 411.984 .7 .0 348.543 -.8 -.9
Commodity and service group
All items 3 ................................................................................. 218.439 1.1 .2 236.474 -.1 .1 213.339 .9 .4 Commodities .......................................................................... 174.282 1.6 .4 181.671 .8 .8 164.166 .2 1.1
Commodities less food and beverages ................................ 149.761 1.7 .4 154.406 .6 1.0 135.585 .0 1.5 Nondurables less food and beverages ............................... 188.770 1.7 .9 198.313 .4 1.8 176.100 1.4 2.6 Durables ............................................................................. 111.174 1.6 -.3 111.360 .8 -.3 96.430 -2.1 -.2
Services .................................................................................. 262.320 .8 .0 285.470 -.6 -.3 259.906 1.4 -.1
Special aggregate indexes
All items less medical care 3 .................................................... 210.001 1.0 .2 224.227 -.3 .1 204.763 .6 .3 All items less shelter ................................................................ 209.133 1.9 .3 225.086 1.4 .2 197.698 1.7 .5 Commodities less food ............................................................. 152.395 1.7 .4 157.842 .7 1.0 139.464 .1 1.4 Nondurables ............................................................................. 204.920 1.6 .7 214.252 .7 1.1 198.039 1.0 1.5 Nondurables less food .............................................................. 190.885 1.7 .9 200.090 .5 1.7 180.369 1.4 2.3 Services less rent of shelter 6 ................................................... 286.640 2.3 .1 316.850 2.2 -.5 272.979 3.8 -.3 Services less medical care services ......................................... 250.516 .6 .0 267.244 -1.0 -.3 248.358 1.0 -.2 Energy 3 ................................................................................... 210.003 3.8 -1.1 197.949 3.6 -1.6 196.357 11.4 -2.2 All items less energy ................................................................ 221.030 .9 .3 243.716 -.4 .3 216.573 .1 .6
All items less food and energy 3 ............................................. 221.907 .8 .3 246.565 -.6 .2 217.486 .0 .6
See footnotes at end of table.
51 CPI Detailed Report-September 2010
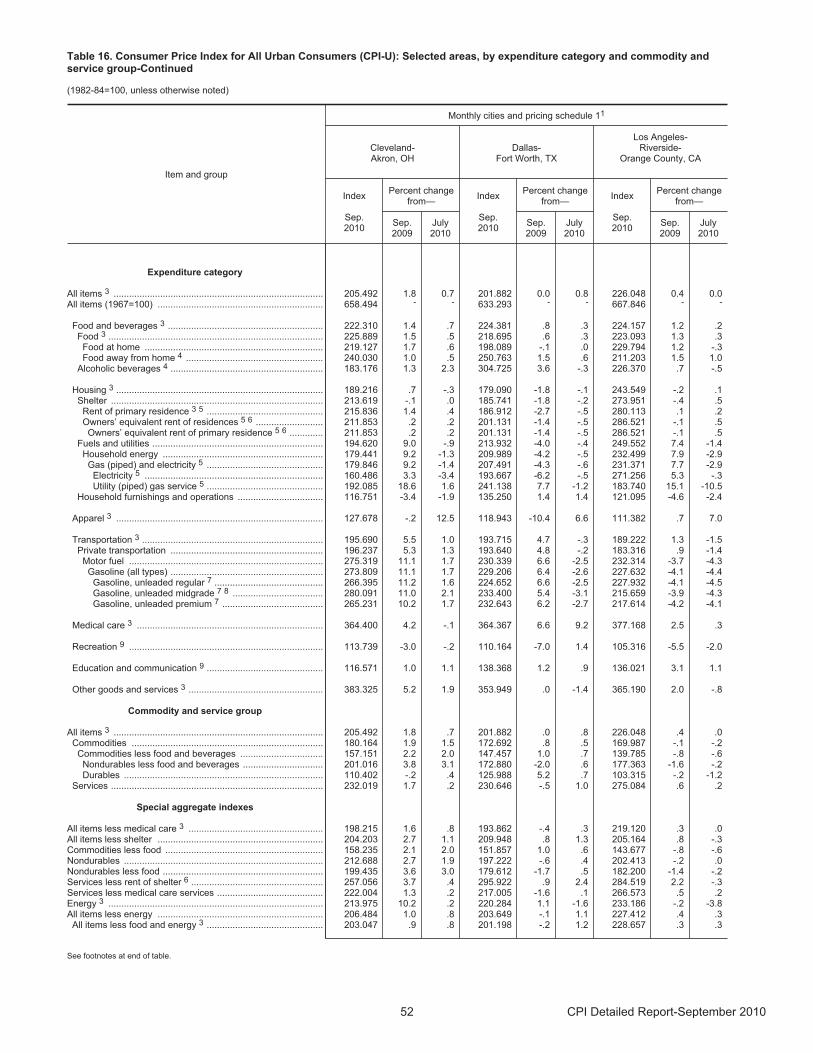
Table 16. Consumer Price Index for All Urban Consumers (CPI-U): Selected areas, by expenditure category and commodity andservice group-Continued
(1982-84=100, unless otherwise noted)
Item and group
Monthly cities and pricing schedule 11
Cleveland-Akron, OH
Dallas-Fort Worth, TX
Los Angeles-Riverside-
Orange County, CA
Index
Sep.2010
Percent changefrom—
Index
Sep.2010
Percent changefrom—
Index
Sep.2010
Percent changefrom—
Sep.2009
July2010
Sep.2009
July2010
Sep.2009
July2010
Expenditure category
All items 3 ................................................................................. 205.492 1.8 0.7 201.882 0.0 0.8 226.048 0.4 0.0All items (1967=100) ................................................................ 658.494 - - 633.293 - - 667.846 - -
Food and beverages 3 ............................................................ 222.310 1.4 .7 224.381 .8 .3 224.157 1.2 .2 Food 3 ................................................................................... 225.889 1.5 .5 218.695 .6 .3 223.093 1.3 .3 Food at home ..................................................................... 219.127 1.7 .6 198.089 -.1 .0 229.794 1.2 -.3 Food away from home 4 ..................................................... 240.030 1.0 .5 250.763 1.5 .6 211.203 1.5 1.0
Alcoholic beverages 4 ........................................................... 183.176 1.3 2.3 304.725 3.6 -.3 226.370 .7 -.5
Housing 3 ................................................................................ 189.216 .7 -.3 179.090 -1.8 -.1 243.549 -.2 .1 Shelter .................................................................................. 213.619 -.1 .0 185.741 -1.8 -.2 273.951 -.4 .5 Rent of primary residence 3 5 ............................................. 215.836 1.4 .4 186.912 -2.7 -.5 280.113 .1 .2 Owners’ equivalent rent of residences 5 6 .......................... 211.853 .2 .2 201.131 -1.4 -.5 286.521 -.1 .5 Owners’ equivalent rent of primary residence 5 6 ............. 211.853 .2 .2 201.131 -1.4 -.5 286.521 -.1 .5
Fuels and utilities .................................................................. 194.620 9.0 -.9 213.932 -4.0 -.4 249.552 7.4 -1.4 Household energy .............................................................. 179.441 9.2 -1.3 209.989 -4.2 -.5 232.499 7.9 -2.9 Gas (piped) and electricity 5 ............................................. 179.846 9.2 -1.4 207.491 -4.3 -.6 231.371 7.7 -2.9 Electricity 5 ..................................................................... 160.486 3.3 -3.4 193.667 -6.2 -.5 271.256 5.3 -.3 Utility (piped) gas service 5 ............................................. 192.085 18.6 1.6 241.138 7.7 -1.2 183.740 15.1 -10.5
Household furnishings and operations ................................. 116.751 -3.4 -1.9 135.250 1.4 1.4 121.095 -4.6 -2.4
Apparel 3 ................................................................................ 127.678 -.2 12.5 118.943 -10.4 6.6 111.382 .7 7.0
Transportation 3 ...................................................................... 195.690 5.5 1.0 193.715 4.7 -.3 189.222 1.3 -1.5 Private transportation ........................................................... 196.237 5.3 1.3 193.640 4.8 -.2 183.316 .9 -1.4
Motor fuel ........................................................................... 275.319 11.1 1.7 230.339 6.6 -2.5 232.314 -3.7 -4.3 Gasoline (all types) ........................................................... 273.809 11.1 1.7 229.206 6.4 -2.6 227.632 -4.1 -4.4
Gasoline, unleaded regular 7 .......................................... 266.395 11.2 1.6 224.652 6.6 -2.5 227.932 -4.1 -4.5 Gasoline, unleaded midgrade 7 8 ................................... 280.091 11.0 2.1 233.400 5.4 -3.1 215.659 -3.9 -4.3 Gasoline, unleaded premium 7 ....................................... 265.231 10.2 1.7 232.643 6.2 -2.7 217.614 -4.2 -4.1
Medical care 3 ........................................................................ 364.400 4.2 -.1 364.367 6.6 9.2 377.168 2.5 .3
Recreation 9 ........................................................................... 113.739 -3.0 -.2 110.164 -7.0 1.4 105.316 -5.5 -2.0
Education and communication 9 ............................................. 116.571 1.0 1.1 138.368 1.2 .9 136.021 3.1 1.1
Other goods and services 3 .................................................... 383.325 5.2 1.9 353.949 .0 -1.4 365.190 2.0 -.8
Commodity and service group
All items 3 ................................................................................. 205.492 1.8 .7 201.882 .0 .8 226.048 .4 .0 Commodities .......................................................................... 180.164 1.9 1.5 172.692 .8 .5 169.987 -.1 -.2
Commodities less food and beverages ................................ 157.151 2.2 2.0 147.457 1.0 .7 139.785 -.8 -.6 Nondurables less food and beverages ............................... 201.016 3.8 3.1 172.880 -2.0 .6 177.363 -1.6 -.2 Durables ............................................................................. 110.402 -.2 .4 125.988 5.2 .7 103.315 -.2 -1.2
Services .................................................................................. 232.019 1.7 .2 230.646 -.5 1.0 275.084 .6 .2
Special aggregate indexes
All items less medical care 3 .................................................... 198.215 1.6 .8 193.862 -.4 .3 219.120 .3 .0 All items less shelter ................................................................ 204.203 2.7 1.1 209.948 .8 1.3 205.164 .8 -.3 Commodities less food ............................................................. 158.235 2.1 2.0 151.857 1.0 .6 143.677 -.8 -.6 Nondurables ............................................................................. 212.688 2.7 1.9 197.222 -.6 .4 202.413 -.2 .0 Nondurables less food .............................................................. 199.435 3.6 3.0 179.612 -1.7 .5 182.200 -1.4 -.2 Services less rent of shelter 6 ................................................... 257.056 3.7 .4 295.922 .9 2.4 284.519 2.2 -.3 Services less medical care services ......................................... 222.004 1.3 .2 217.005 -1.6 .1 266.573 .5 .2 Energy 3 ................................................................................... 213.975 10.2 .2 220.284 1.1 -1.6 233.186 -.2 -3.8 All items less energy ................................................................ 206.484 1.0 .8 203.649 -.1 1.1 227.412 .4 .3
All items less food and energy 3 ............................................. 203.047 .9 .8 201.198 -.2 1.2 228.657 .3 .3
See footnotes at end of table.
52 CPI Detailed Report-September 2010
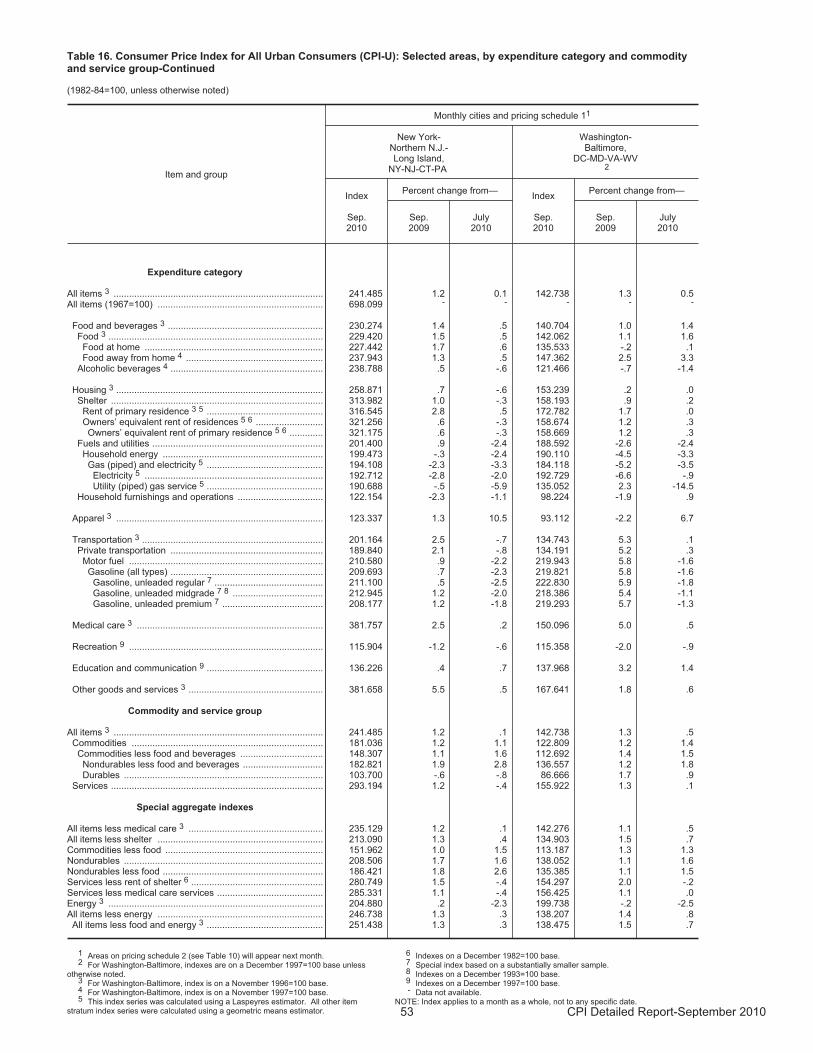
Table 16. Consumer Price Index for All Urban Consumers (CPI-U): Selected areas, by expenditure category and commodityand service group-Continued
(1982-84=100, unless otherwise noted)
Item and group
Monthly cities and pricing schedule 11
New York-Northern N.J.-Long Island,
NY-NJ-CT-PA
Washington-Baltimore,
DC-MD-VA-WV2
Index
Sep.2010
Percent change from—Index
Sep.2010
Percent change from—
Sep.2009
July2010
Sep.2009
July2010
Expenditure category
All items 3 ................................................................................. 241.485 1.2 0.1 142.738 1.3 0.5 All items (1967=100) ................................................................ 698.099 - - - - -
Food and beverages 3 ............................................................ 230.274 1.4 .5 140.704 1.0 1.4 Food 3 ................................................................................... 229.420 1.5 .5 142.062 1.1 1.6 Food at home ..................................................................... 227.442 1.7 .6 135.533 -.2 .1 Food away from home 4 ..................................................... 237.943 1.3 .5 147.362 2.5 3.3
Alcoholic beverages 4 ........................................................... 238.788 .5 -.6 121.466 -.7 -1.4
Housing 3 ................................................................................ 258.871 .7 -.6 153.239 .2 .0 Shelter .................................................................................. 313.982 1.0 -.3 158.193 .9 .2 Rent of primary residence 3 5 ............................................. 316.545 2.8 .5 172.782 1.7 .0 Owners’ equivalent rent of residences 5 6 .......................... 321.256 .6 -.3 158.674 1.2 .3 Owners’ equivalent rent of primary residence 5 6 ............. 321.175 .6 -.3 158.669 1.2 .3
Fuels and utilities .................................................................. 201.400 .9 -2.4 188.592 -2.6 -2.4 Household energy .............................................................. 199.473 -.3 -2.4 190.110 -4.5 -3.3 Gas (piped) and electricity 5 ............................................. 194.108 -2.3 -3.3 184.118 -5.2 -3.5 Electricity 5 ..................................................................... 192.712 -2.8 -2.0 192.729 -6.6 -.9 Utility (piped) gas service 5 ............................................. 190.688 -.5 -5.9 135.052 2.3 -14.5
Household furnishings and operations ................................. 122.154 -2.3 -1.1 98.224 -1.9 .9
Apparel 3 ................................................................................ 123.337 1.3 10.5 93.112 -2.2 6.7
Transportation 3 ...................................................................... 201.164 2.5 -.7 134.743 5.3 .1 Private transportation ........................................................... 189.840 2.1 -.8 134.191 5.2 .3
Motor fuel ........................................................................... 210.580 .9 -2.2 219.943 5.8 -1.6 Gasoline (all types) ........................................................... 209.693 .7 -2.3 219.821 5.8 -1.6
Gasoline, unleaded regular 7 .......................................... 211.100 .5 -2.5 222.830 5.9 -1.8 Gasoline, unleaded midgrade 7 8 ................................... 212.945 1.2 -2.0 218.386 5.4 -1.1 Gasoline, unleaded premium 7 ....................................... 208.177 1.2 -1.8 219.293 5.7 -1.3
Medical care 3 ........................................................................ 381.757 2.5 .2 150.096 5.0 .5
Recreation 9 ........................................................................... 115.904 -1.2 -.6 115.358 -2.0 -.9
Education and communication 9 ............................................. 136.226 .4 .7 137.968 3.2 1.4
Other goods and services 3 .................................................... 381.658 5.5 .5 167.641 1.8 .6
Commodity and service group
All items 3 ................................................................................. 241.485 1.2 .1 142.738 1.3 .5 Commodities .......................................................................... 181.036 1.2 1.1 122.809 1.2 1.4
Commodities less food and beverages ................................ 148.307 1.1 1.6 112.692 1.4 1.5 Nondurables less food and beverages ............................... 182.821 1.9 2.8 136.557 1.2 1.8 Durables ............................................................................. 103.700 -.6 -.8 86.666 1.7 .9
Services .................................................................................. 293.194 1.2 -.4 155.922 1.3 .1
Special aggregate indexes
All items less medical care 3 .................................................... 235.129 1.2 .1 142.276 1.1 .5 All items less shelter ................................................................ 213.090 1.3 .4 134.903 1.5 .7 Commodities less food ............................................................. 151.962 1.0 1.5 113.187 1.3 1.3 Nondurables ............................................................................. 208.506 1.7 1.6 138.052 1.1 1.6 Nondurables less food .............................................................. 186.421 1.8 2.6 135.385 1.1 1.5 Services less rent of shelter 6 ................................................... 280.749 1.5 -.4 154.297 2.0 -.2 Services less medical care services ......................................... 285.331 1.1 -.4 156.425 1.1 .0 Energy 3 ................................................................................... 204.880 .2 -2.3 199.738 -.2 -2.5 All items less energy ................................................................ 246.738 1.3 .3 138.207 1.4 .8
All items less food and energy 3 ............................................. 251.438 1.3 .3 138.475 1.5 .7
1 Areas on pricing schedule 2 (see Table 10) will appear next month. 2 For Washington-Baltimore, indexes are on a December 1997=100 base unless
otherwise noted.3 For Washington-Baltimore, index is on a November 1996=100 base.4 For Washington-Baltimore, index is on a November 1997=100 base.5 This index series was calculated using a Laspeyres estimator. All other item
stratum index series were calculated using a geometric means estimator.
6 Indexes on a December 1982=100 base.7 Special index based on a substantially smaller sample.8 Indexes on a December 1993=100 base.9 Indexes on a December 1997=100 base.- Data not available.
NOTE: Index applies to a month as a whole, not to any specific date.
53 CPI Detailed Report-September 2010

Table 17. Consumer Price Index for Urban Wage Earners and Clerical Workers (CPI-W): Selected areas, all items index
(1982-84=100, unless otherwise noted)
Area
All items
Pricingschedule
1
Indexes Percent change to Sep. 2010 from—
Percent change to Aug. 2010 from—
June2010
July2010
Aug.2010
Sep.2010
Sep.2009
July2010
Aug.2010
Aug.2009
June2010
July2010
U.S. city average ............................................ M 213.839 213.898 214.205 214.306 1.4 0.2 0.0 1.4 0.2 0.1
Region and area size2
Northeast urban .............................................. M 231.308 231.380 231.694 231.566 1.5 .1 -.1 1.8 .2 .1 Size A - More than 1,500,000 ..................... M 231.552 231.615 231.995 231.881 1.2 .1 .0 1.5 .2 .2 Size B/C - 50,000 to 1,500,000 3 ................ M 140.227 140.283 140.390 140.295 2.1 .0 -.1 2.4 .1 .1
Midwest urban ................................................ M 203.524 203.877 204.273 204.442 1.9 .3 .1 1.8 .4 .2 Size A - More than 1,500,000 ..................... M 203.063 203.363 203.593 203.946 1.7 .3 .2 1.4 .3 .1 Size B/C - 50,000 to 1,500,000 3 ................ M 133.845 134.136 134.426 134.361 2.2 .2 .0 2.2 .4 .2 Size D - Nonmetropolitan (less than
50,000) ............................................... M 201.654 201.950 202.896 203.086 1.8 .6 .1 1.8 .6 .5
South urban .................................................... M 208.640 208.440 208.740 209.155 1.7 .3 .2 1.4 .0 .1 Size A - More than 1,500,000 ..................... M 210.985 210.592 210.831 211.393 1.3 .4 .3 .9 -.1 .1 Size B/C - 50,000 to 1,500,000 3 ................ M 133.227 133.227 133.420 133.680 1.8 .3 .2 1.6 .1 .1 Size D - Nonmetropolitan (less than
50,000) ............................................... M 215.416 214.840 215.354 215.346 2.1 .2 .0 2.0 .0 .2
West urban ..................................................... M 215.681 215.824 216.048 215.804 .6 .0 -.1 1.0 .2 .1 Size A - More than 1,500,000 ..................... M 218.238 218.499 218.784 218.524 .7 .0 -.1 1.0 .3 .1 Size B/C - 50,000 to 1,500,000 3 ................ M 133.448 133.471 133.480 133.346 .4 -.1 -.1 .8 .0 .0
Size classes
A 4 .............................................................. M 197.852 197.908 198.168 198.278 1.2 .2 .1 1.2 .2 .1 B/C 3 ........................................................... M 134.349 134.420 134.581 134.644 1.7 .2 .0 1.7 .2 .1 D ................................................................. M 209.374 209.161 209.863 209.864 1.7 .3 .0 1.7 .2 .3
Selected local areas5
Chicago-Gary-Kenosha, IL-IN-WI ................... M 205.834 206.307 206.338 206.897 1.3 .3 .3 1.0 .2 .0 Los Angeles-Riverside-Orange County, CA ... M 218.222 218.367 218.752 218.427 .5 .0 -.1 1.0 .2 .2 New York-Northern N.J.-Long Island,
NY-NJ-CT-PA ......................................... M 235.916 236.330 236.820 236.725 1.4 .2 .0 1.7 .4 .2
Boston-Brockton-Nashua, MA-NH-ME-CT ..... 1 - 236.657 - 236.844 .5 .1 - - - -
Cleveland-Akron, OH ...................................... 1 - 195.477 - 196.787 2.1 .7 - - - -
Dallas-Fort Worth, TX ..................................... 1 - 203.537 - 205.602 .6 1.0 - - - -
Washington-Baltimore, DC-MD-VA-WV 6 ...... 1 - 141.926 - 142.755 1.5 .6 - - - -
Atlanta, GA ..................................................... 2 204.084 - 203.745 - - - - .7 -.2 -
Detroit-Ann Arbor-Flint, MI .............................. 2 200.703 - 201.359 - - - - .6 .3 -
Houston-Galveston-Brazoria, TX .................... 2 192.696 - 193.276 - - - - 2.0 .3 -
Miami-Fort Lauderdale, FL ............................. 2 220.384 - 220.790 - - - - .8 .2 -
Philadelphia-Wilmington-Atlantic City,PA-NJ-DE-MD ........................................ 2 228.175 - 228.523 - - - - 1.3 .2 -
San Francisco-Oakland-San Jose, CA ........... 2 224.185 - 224.195 - - - - 1.3 .0 -
Seattle-Tacoma-Bremerton, WA .................... 2 221.857 - 223.444 - - - - .7 .7 -
1 Foods, fuels, and several other items priced every month in all areas; most other goods and services priced as indicated: M - Every month. 1 - January, March, May, July, September, and November. 2 - February, April, June, August, October, and December.
2 Regions defined as the four Census regions. See map in technicalnotes.
3 Indexes on a December 1996=100 base.4 Indexes on a December 1986=100 base.5 In addition, the following metropolitan areas are published semiannually
and appear in Tables 34 and 39 of the January and July issues of the CPIDetailed Report: Anchorage, AK; Cincinnati-Hamilton, OH-KY-IN;Denver-Boulder-Greeley, CO; Honolulu, HI; Kansas City, MO-KS;Milwaukee-Racine, WI; Minneapolis-St. Paul, MN-WI; Phoenix-Mesa, AZ;
Pittsburgh, PA; Portland-Salem, OR-WA; St. Louis, MO-IL; San Diego, CA;Tampa-St. Petersburg-Clearwater, FL.
6 Indexes on a November 1996=100 base.- Data not available.
NOTE: Local area indexes are byproducts of the national CPI program. Eachlocal index has a smaller sample size than the national index and is, therefore,subject to substantially more sampling and other measurement error. As aresult, local area indexes show greater volatility than the national index,although their long-term trends are similar. Therefore, the Bureau of LaborStatistics strongly urges users to consider adopting the national average CPIfor use in their escalator clauses.
NOTE: Index applies to a month as a whole, not to any specific date.
54 CPI Detailed Report-September 2010
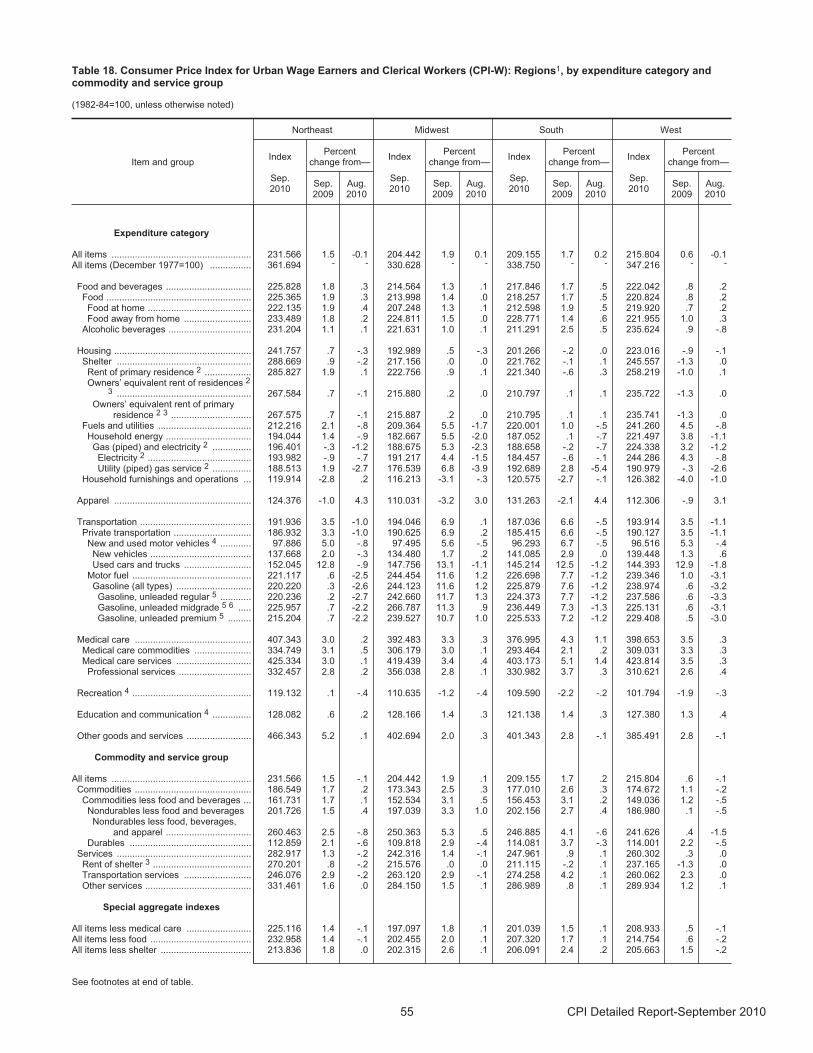
Table 18. Consumer Price Index for Urban Wage Earners and Clerical Workers (CPI-W): Regions1, by expenditure category andcommodity and service group
(1982-84=100, unless otherwise noted)
Item and group
Northeast Midwest South West
Index
Sep.2010
Percentchange from—
Index
Sep.2010
Percentchange from—
Index
Sep.2010
Percentchange from—
Index
Sep.2010
Percentchange from—
Sep.2009
Aug.2010
Sep.2009
Aug.2010
Sep.2009
Aug.2010
Sep.2009
Aug.2010
Expenditure category
All items ...................................................... 231.566 1.5 -0.1 204.442 1.9 0.1 209.155 1.7 0.2 215.804 0.6 -0.1All items (December 1977=100) ................ 361.694 - - 330.628 - - 338.750 - - 347.216 - -
Food and beverages ................................. 225.828 1.8 .3 214.564 1.3 .1 217.846 1.7 .5 222.042 .8 .2 Food ........................................................ 225.365 1.9 .3 213.998 1.4 .0 218.257 1.7 .5 220.824 .8 .2
Food at home ........................................ 222.135 1.9 .4 207.248 1.3 .1 212.598 1.9 .5 219.920 .7 .2 Food away from home .......................... 233.489 1.8 .2 224.811 1.5 .0 228.771 1.4 .6 221.955 1.0 .3
Alcoholic beverages ................................ 231.204 1.1 .1 221.631 1.0 .1 211.291 2.5 .5 235.624 .9 -.8
Housing ..................................................... 241.757 .7 -.3 192.989 .5 -.3 201.266 -.2 .0 223.016 -.9 -.1 Shelter .................................................... 288.669 .9 -.2 217.156 .0 .0 221.762 -.1 .1 245.557 -1.3 .0
Rent of primary residence 2 .................. 285.827 1.9 .1 222.756 .9 .1 221.340 -.6 .3 258.219 -1.0 .1 Owners’ equivalent rent of residences 2
3 .................................................... 267.584 .7 -.1 215.880 .2 .0 210.797 .1 .1 235.722 -1.3 .0 Owners’ equivalent rent of primary
residence 2 3 ............................... 267.575 .7 -.1 215.887 .2 .0 210.795 .1 .1 235.741 -1.3 .0 Fuels and utilities .................................... 212.216 2.1 -.8 209.364 5.5 -1.7 220.001 1.0 -.5 241.260 4.5 -.8
Household energy ................................. 194.044 1.4 -.9 182.667 5.5 -2.0 187.052 .1 -.7 221.497 3.8 -1.1 Gas (piped) and electricity 2 ............... 196.401 -.3 -1.2 188.675 5.3 -2.3 188.658 -.2 -.7 224.338 3.2 -1.2 Electricity 2 ........................................ 193.982 -.9 -.7 191.217 4.4 -1.5 184.457 -.6 -.1 244.286 4.3 -.8 Utility (piped) gas service 2 ............... 188.513 1.9 -2.7 176.539 6.8 -3.9 192.689 2.8 -5.4 190.979 -.3 -2.6
Household furnishings and operations ... 119.914 -2.8 .2 116.213 -3.1 -.3 120.575 -2.7 -.1 126.382 -4.0 -1.0
Apparel ..................................................... 124.376 -1.0 4.3 110.031 -3.2 3.0 131.263 -2.1 4.4 112.306 -.9 3.1
Transportation ........................................... 191.936 3.5 -1.0 194.046 6.9 .1 187.036 6.6 -.5 193.914 3.5 -1.1 Private transportation .............................. 186.932 3.3 -1.0 190.625 6.9 .2 185.415 6.6 -.5 190.127 3.5 -1.1 New and used motor vehicles 4 ............ 97.886 5.0 -.8 97.495 5.6 -.5 96.293 6.7 -.5 96.516 5.3 -.4 New vehicles ....................................... 137.668 2.0 -.3 134.480 1.7 .2 141.085 2.9 .0 139.448 1.3 .6 Used cars and trucks .......................... 152.045 12.8 -.9 147.756 13.1 -1.1 145.214 12.5 -1.2 144.393 12.9 -1.8
Motor fuel .............................................. 221.117 .6 -2.5 244.454 11.6 1.2 226.698 7.7 -1.2 239.346 1.0 -3.1 Gasoline (all types) ............................. 220.220 .3 -2.6 244.123 11.6 1.2 225.879 7.6 -1.2 238.974 .6 -3.2 Gasoline, unleaded regular 5 ............ 220.236 .2 -2.7 242.660 11.7 1.3 224.373 7.7 -1.2 237.586 .6 -3.3 Gasoline, unleaded midgrade 5 6 ..... 225.957 .7 -2.2 266.787 11.3 .9 236.449 7.3 -1.3 225.131 .6 -3.1 Gasoline, unleaded premium 5 ......... 215.204 .7 -2.2 239.527 10.7 1.0 225.533 7.2 -1.2 229.408 .5 -3.0
Medical care ............................................. 407.343 3.0 .2 392.483 3.3 .3 376.995 4.3 1.1 398.653 3.5 .3 Medical care commodities ...................... 334.749 3.1 .5 306.179 3.0 .1 293.464 2.1 .2 309.031 3.3 .3 Medical care services ............................. 425.334 3.0 .1 419.439 3.4 .4 403.173 5.1 1.4 423.814 3.5 .3
Professional services ............................ 332.457 2.8 .2 356.038 2.8 .1 330.982 3.7 .3 310.621 2.6 .4
Recreation 4 .............................................. 119.132 .1 -.4 110.635 -1.2 -.4 109.590 -2.2 -.2 101.794 -1.9 -.3
Education and communication 4 ............... 128.082 .6 .2 128.166 1.4 .3 121.138 1.4 .3 127.380 1.3 .4
Other goods and services ......................... 466.343 5.2 .1 402.694 2.0 .3 401.343 2.8 -.1 385.491 2.8 -.1
Commodity and service group
All items ...................................................... 231.566 1.5 -.1 204.442 1.9 .1 209.155 1.7 .2 215.804 .6 -.1 Commodities ............................................. 186.549 1.7 .2 173.343 2.5 .3 177.010 2.6 .3 174.672 1.1 -.2
Commodities less food and beverages ... 161.731 1.7 .1 152.534 3.1 .5 156.453 3.1 .2 149.036 1.2 -.5 Nondurables less food and beverages 201.726 1.5 .4 197.039 3.3 1.0 202.156 2.7 .4 186.980 .1 -.5
Nondurables less food, beverages,and apparel ................................. 260.463 2.5 -.8 250.363 5.3 .5 246.885 4.1 -.6 241.626 .4 -1.5
Durables ............................................... 112.859 2.1 -.6 109.818 2.9 -.4 114.081 3.7 -.3 114.001 2.2 -.5 Services .................................................... 282.917 1.3 -.2 242.316 1.4 -.1 247.961 .9 .1 260.302 .3 .0 Rent of shelter 3 ...................................... 270.201 .8 -.2 215.576 .0 .0 211.115 -.2 .1 237.165 -1.3 .0 Transportation services .......................... 246.076 2.9 -.2 263.120 2.9 -.1 274.258 4.2 .1 260.062 2.3 .0 Other services ......................................... 331.461 1.6 .0 284.150 1.5 .1 286.989 .8 .1 289.934 1.2 .1
Special aggregate indexes
All items less medical care ......................... 225.116 1.4 -.1 197.097 1.8 .1 201.039 1.5 .1 208.933 .5 -.1 All items less food ....................................... 232.958 1.4 -.1 202.455 2.0 .1 207.320 1.7 .1 214.754 .6 -.2 All items less shelter ................................... 213.836 1.8 .0 202.315 2.6 .1 206.091 2.4 .2 205.663 1.5 -.2
See footnotes at end of table.
55 CPI Detailed Report-September 2010
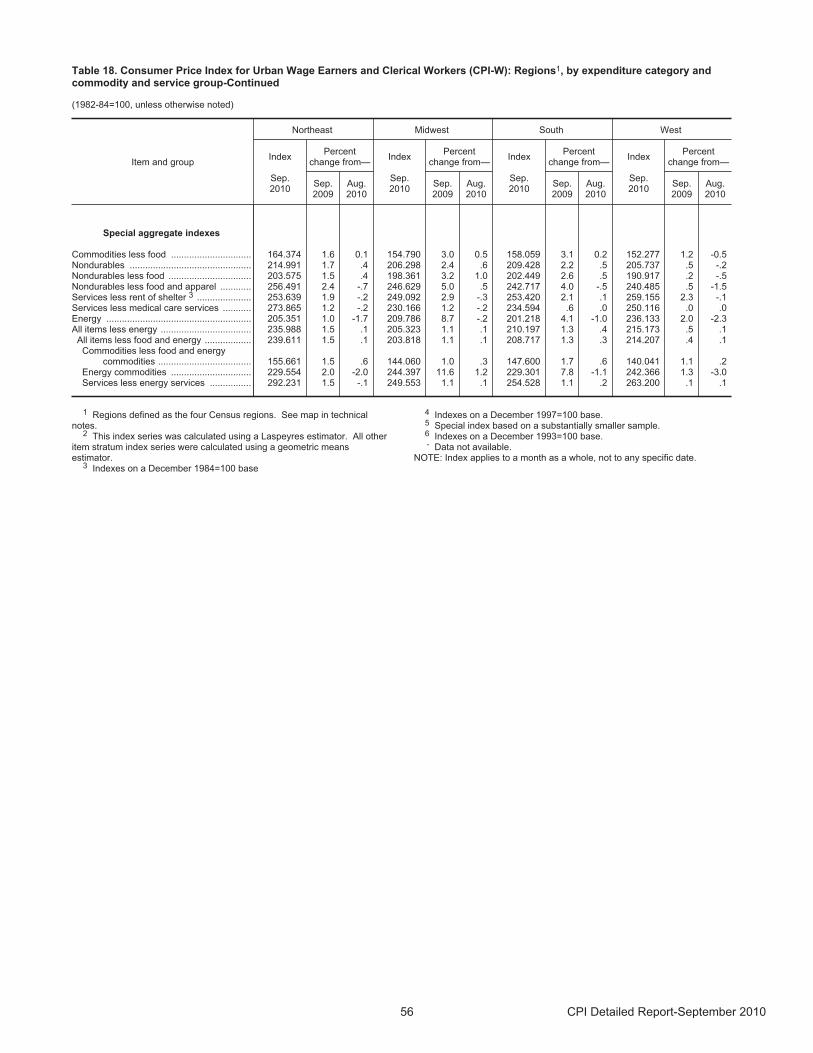
Table 18. Consumer Price Index for Urban Wage Earners and Clerical Workers (CPI-W): Regions1, by expenditure category andcommodity and service group-Continued
(1982-84=100, unless otherwise noted)
Item and group
Northeast Midwest South West
Index
Sep.2010
Percentchange from—
Index
Sep.2010
Percentchange from—
Index
Sep.2010
Percentchange from—
Index
Sep.2010
Percentchange from—
Sep.2009
Aug.2010
Sep.2009
Aug.2010
Sep.2009
Aug.2010
Sep.2009
Aug.2010
Special aggregate indexes
Commodities less food ............................... 164.374 1.6 0.1 154.790 3.0 0.5 158.059 3.1 0.2 152.277 1.2 -0.5 Nondurables ............................................... 214.991 1.7 .4 206.298 2.4 .6 209.428 2.2 .5 205.737 .5 -.2 Nondurables less food ................................ 203.575 1.5 .4 198.361 3.2 1.0 202.449 2.6 .5 190.917 .2 -.5 Nondurables less food and apparel ............ 256.491 2.4 -.7 246.629 5.0 .5 242.717 4.0 -.5 240.485 .5 -1.5 Services less rent of shelter 3 ..................... 253.639 1.9 -.2 249.092 2.9 -.3 253.420 2.1 .1 259.155 2.3 -.1 Services less medical care services ........... 273.865 1.2 -.2 230.166 1.2 -.2 234.594 .6 .0 250.116 .0 .0 Energy ........................................................ 205.351 1.0 -1.7 209.786 8.7 -.2 201.218 4.1 -1.0 236.133 2.0 -2.3All items less energy ................................... 235.988 1.5 .1 205.323 1.1 .1 210.197 1.3 .4 215.173 .5 .1 All items less food and energy .................. 239.611 1.5 .1 203.818 1.1 .1 208.717 1.3 .3 214.207 .4 .1
Commodities less food and energycommodities .................................... 155.661 1.5 .6 144.060 1.0 .3 147.600 1.7 .6 140.041 1.1 .2
Energy commodities ............................... 229.554 2.0 -2.0 244.397 11.6 1.2 229.301 7.8 -1.1 242.366 1.3 -3.0 Services less energy services ................ 292.231 1.5 -.1 249.553 1.1 .1 254.528 1.1 .2 263.200 .1 .1
1 Regions defined as the four Census regions. See map in technicalnotes.
2 This index series was calculated using a Laspeyres estimator. All otheritem stratum index series were calculated using a geometric meansestimator.
3 Indexes on a December 1984=100 base
4 Indexes on a December 1997=100 base.5 Special index based on a substantially smaller sample.6 Indexes on a December 1993=100 base.- Data not available.
NOTE: Index applies to a month as a whole, not to any specific date.
56 CPI Detailed Report-September 2010
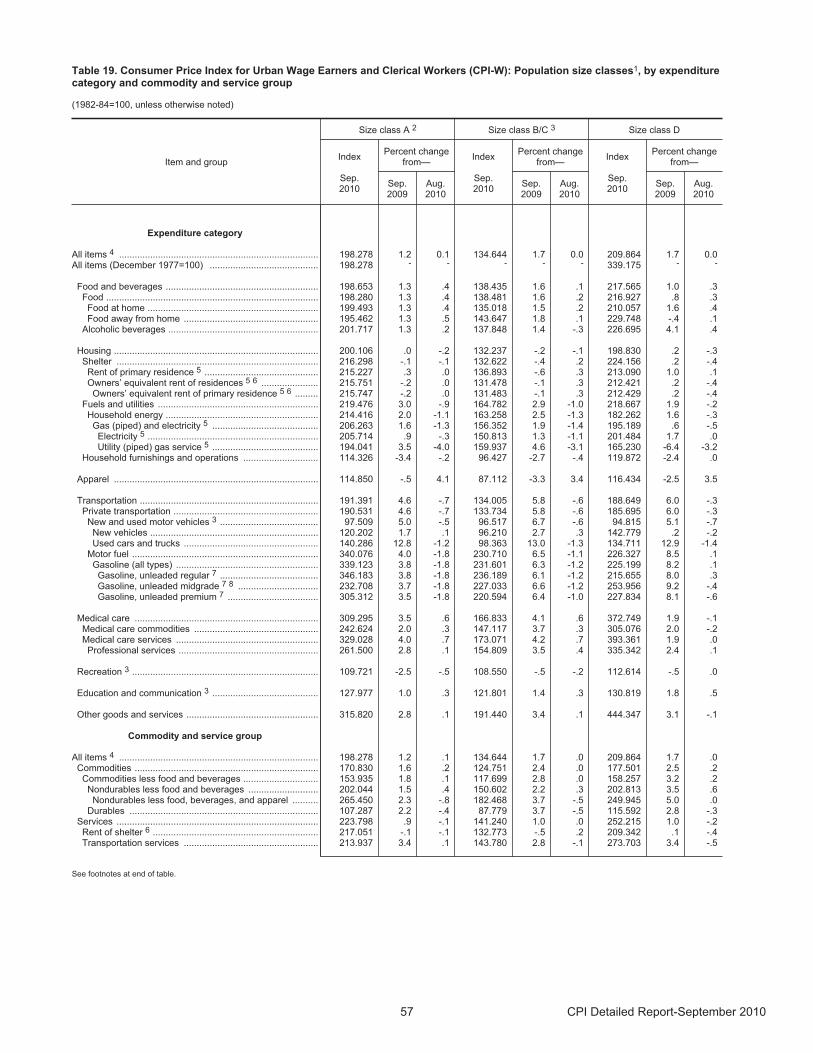
Table 19. Consumer Price Index for Urban Wage Earners and Clerical Workers (CPI-W): Population size classes1, by expenditurecategory and commodity and service group
(1982-84=100, unless otherwise noted)
Item and group
Size class A 2 Size class B/C 3 Size class D
Index
Sep.2010
Percent changefrom—
Index
Sep.2010
Percent changefrom—
Index
Sep.2010
Percent changefrom—
Sep.2009
Aug.2010
Sep.2009
Aug.2010
Sep.2009
Aug.2010
Expenditure category
All items 4 ............................................................................. 198.278 1.2 0.1 134.644 1.7 0.0 209.864 1.7 0.0 All items (December 1977=100) .......................................... 198.278 - - - - - 339.175 - -
Food and beverages ........................................................... 198.653 1.3 .4 138.435 1.6 .1 217.565 1.0 .3 Food .................................................................................. 198.280 1.3 .4 138.481 1.6 .2 216.927 .8 .3Food at home .................................................................. 199.493 1.3 .4 135.018 1.5 .2 210.057 1.6 .4 Food away from home .................................................... 195.462 1.3 .5 143.647 1.8 .1 229.748 -.4 .1
Alcoholic beverages .......................................................... 201.717 1.3 .2 137.848 1.4 -.3 226.695 4.1 .4
Housing ............................................................................... 200.106 .0 -.2 132.237 -.2 -.1 198.830 .2 -.3 Shelter .............................................................................. 216.298 -.1 -.1 132.622 -.4 .2 224.156 .2 -.4Rent of primary residence 5 ............................................ 215.227 .3 .0 136.893 -.6 .3 213.090 1.0 .1 Owners’ equivalent rent of residences 5 6 ...................... 215.751 -.2 .0 131.478 -.1 .3 212.421 .2 -.4 Owners’ equivalent rent of primary residence 5 6 ......... 215.747 -.2 .0 131.483 -.1 .3 212.429 .2 -.4
Fuels and utilities .............................................................. 219.476 3.0 -.9 164.782 2.9 -1.0 218.667 1.9 -.2Household energy ........................................................... 214.416 2.0 -1.1 163.258 2.5 -1.3 182.262 1.6 -.3
Gas (piped) and electricity 5 ......................................... 206.263 1.6 -1.3 156.352 1.9 -1.4 195.189 .6 -.5 Electricity 5 .................................................................. 205.714 .9 -.3 150.813 1.3 -1.1 201.484 1.7 .0 Utility (piped) gas service 5 ......................................... 194.041 3.5 -4.0 159.937 4.6 -3.1 165.230 -6.4 -3.2
Household furnishings and operations ............................. 114.326 -3.4 -.2 96.427 -2.7 -.4 119.872 -2.4 .0
Apparel ............................................................................... 114.850 -.5 4.1 87.112 -3.3 3.4 116.434 -2.5 3.5
Transportation ..................................................................... 191.391 4.6 -.7 134.005 5.8 -.6 188.649 6.0 -.3Private transportation ........................................................ 190.531 4.6 -.7 133.734 5.8 -.6 185.695 6.0 -.3
New and used motor vehicles 3 ...................................... 97.509 5.0 -.5 96.517 6.7 -.6 94.815 5.1 -.7 New vehicles ................................................................. 120.202 1.7 .1 96.210 2.7 .3 142.779 .2 -.2 Used cars and trucks .................................................... 140.286 12.8 -1.2 98.363 13.0 -1.3 134.711 12.9 -1.4
Motor fuel ........................................................................ 340.076 4.0 -1.8 230.710 6.5 -1.1 226.327 8.5 .1 Gasoline (all types) ....................................................... 339.123 3.8 -1.8 231.601 6.3 -1.2 225.199 8.2 .1 Gasoline, unleaded regular 7 ...................................... 346.183 3.8 -1.8 236.189 6.1 -1.2 215.655 8.0 .3 Gasoline, unleaded midgrade 7 8 ............................... 232.708 3.7 -1.8 227.033 6.6 -1.2 253.956 9.2 -.4 Gasoline, unleaded premium 7 ................................... 305.312 3.5 -1.8 220.594 6.4 -1.0 227.834 8.1 -.6
Medical care ....................................................................... 309.295 3.5 .6 166.833 4.1 .6 372.749 1.9 -.1Medical care commodities ................................................ 242.624 2.0 .3 147.117 3.7 .3 305.076 2.0 -.2 Medical care services ....................................................... 329.028 4.0 .7 173.071 4.2 .7 393.361 1.9 .0
Professional services ...................................................... 261.500 2.8 .1 154.809 3.5 .4 335.342 2.4 .1
Recreation 3 ........................................................................ 109.721 -2.5 -.5 108.550 -.5 -.2 112.614 -.5 .0
Education and communication 3 ......................................... 127.977 1.0 .3 121.801 1.4 .3 130.819 1.8 .5
Other goods and services ................................................... 315.820 2.8 .1 191.440 3.4 .1 444.347 3.1 -.1
Commodity and service group
All items 4 ............................................................................. 198.278 1.2 .1 134.644 1.7 .0 209.864 1.7 .0 Commodities ....................................................................... 170.830 1.6 .2 124.751 2.4 .0 177.501 2.5 .2
Commodities less food and beverages ............................. 153.935 1.8 .1 117.699 2.8 .0 158.257 3.2 .2 Nondurables less food and beverages ........................... 202.044 1.5 .4 150.602 2.2 .3 202.813 3.5 .6
Nondurables less food, beverages, and apparel .......... 265.450 2.3 -.8 182.468 3.7 -.5 249.945 5.0 .0 Durables ......................................................................... 107.287 2.2 -.4 87.779 3.7 -.5 115.592 2.8 -.3
Services .............................................................................. 223.798 .9 -.1 141.240 1.0 .0 252.215 1.0 -.2 Rent of shelter 6 ................................................................ 217.051 -.1 -.1 132.773 -.5 .2 209.342 .1 -.4 Transportation services .................................................... 213.937 3.4 .1 143.780 2.8 -.1 273.703 3.4 -.5
See footnotes at end of table.
57 CPI Detailed Report-September 2010
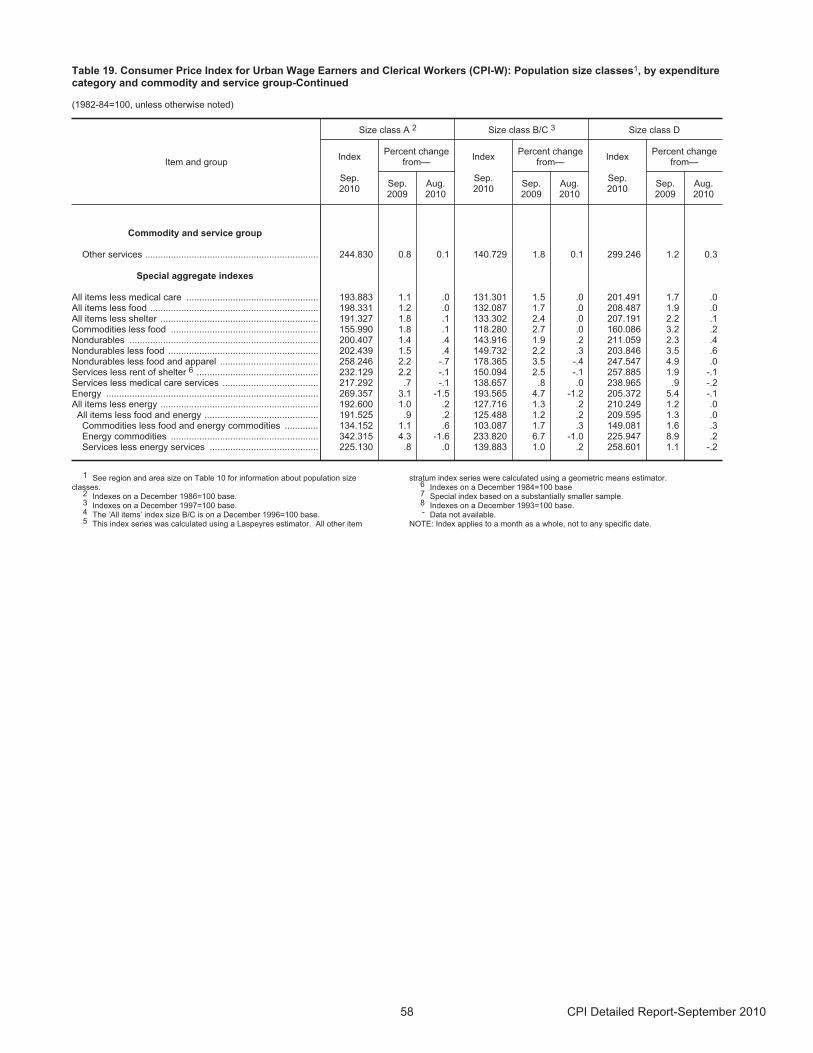
Table 19. Consumer Price Index for Urban Wage Earners and Clerical Workers (CPI-W): Population size classes1, by expenditurecategory and commodity and service group-Continued
(1982-84=100, unless otherwise noted)
Item and group
Size class A 2 Size class B/C 3 Size class D
Index
Sep.2010
Percent changefrom—
Index
Sep.2010
Percent changefrom—
Index
Sep.2010
Percent changefrom—
Sep.2009
Aug.2010
Sep.2009
Aug.2010
Sep.2009
Aug.2010
Commodity and service group
Other services ................................................................... 244.830 0.8 0.1 140.729 1.8 0.1 299.246 1.2 0.3
Special aggregate indexes
All items less medical care ................................................... 193.883 1.1 .0 131.301 1.5 .0 201.491 1.7 .0 All items less food ................................................................. 198.331 1.2 .0 132.087 1.7 .0 208.487 1.9 .0 All items less shelter ............................................................. 191.327 1.8 .1 133.302 2.4 .0 207.191 2.2 .1 Commodities less food ......................................................... 155.990 1.8 .1 118.280 2.7 .0 160.086 3.2 .2 Nondurables ......................................................................... 200.407 1.4 .4 143.916 1.9 .2 211.059 2.3 .4Nondurables less food .......................................................... 202.439 1.5 .4 149.732 2.2 .3 203.846 3.5 .6 Nondurables less food and apparel ...................................... 258.246 2.2 -.7 178.365 3.5 -.4 247.547 4.9 .0 Services less rent of shelter 6 ............................................... 232.129 2.2 -.1 150.094 2.5 -.1 257.885 1.9 -.1 Services less medical care services ..................................... 217.292 .7 -.1 138.657 .8 .0 238.965 .9 -.2 Energy .................................................................................. 269.357 3.1 -1.5 193.565 4.7 -1.2 205.372 5.4 -.1 All items less energy ............................................................. 192.600 1.0 .2 127.716 1.3 .2 210.249 1.2 .0
All items less food and energy ............................................ 191.525 .9 .2 125.488 1.2 .2 209.595 1.3 .0 Commodities less food and energy commodities ............. 134.152 1.1 .6 103.087 1.7 .3 149.081 1.6 .3 Energy commodities ......................................................... 342.315 4.3 -1.6 233.820 6.7 -1.0 225.947 8.9 .2 Services less energy services .......................................... 225.130 .8 .0 139.883 1.0 .2 258.601 1.1 -.2
1 See region and area size on Table 10 for information about population sizeclasses.
2 Indexes on a December 1986=100 base.3 Indexes on a December 1997=100 base.4 The ’All items’ index size B/C is on a December 1996=100 base.5 This index series was calculated using a Laspeyres estimator. All other item
stratum index series were calculated using a geometric means estimator.6 Indexes on a December 1984=100 base7 Special index based on a substantially smaller sample.8 Indexes on a December 1993=100 base.- Data not available.
NOTE: Index applies to a month as a whole, not to any specific date.
58 CPI Detailed Report-September 2010
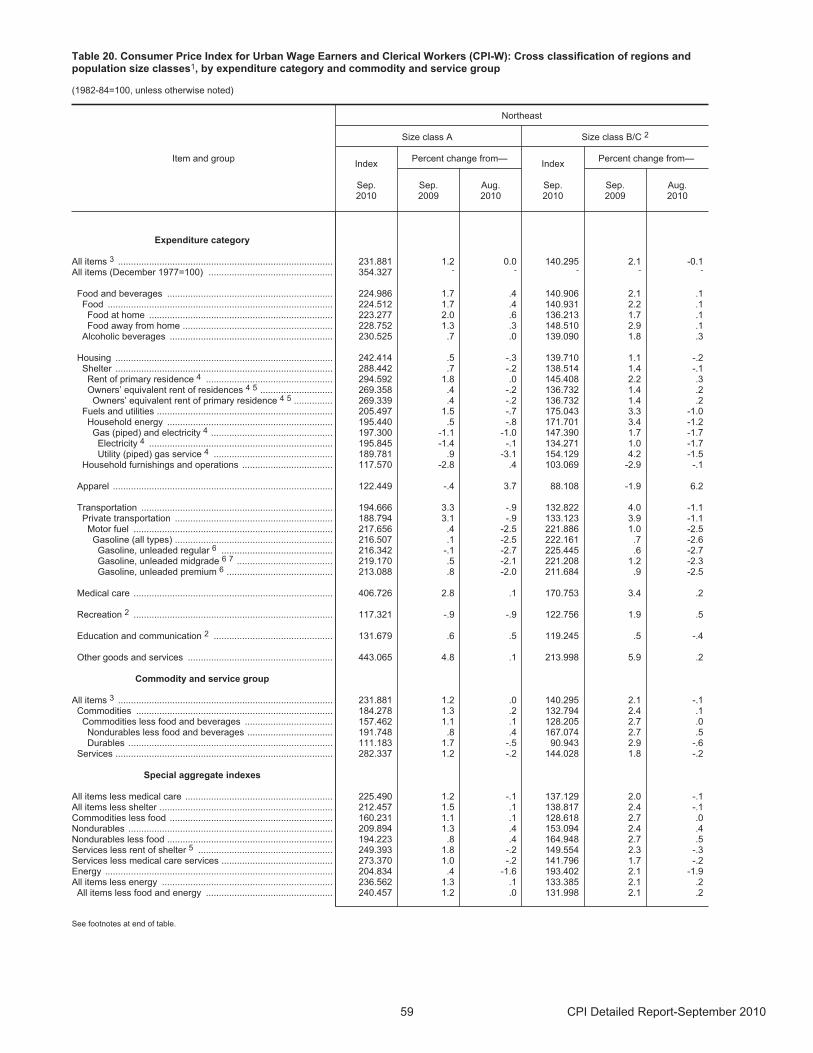
Table 20. Consumer Price Index for Urban Wage Earners and Clerical Workers (CPI-W): Cross classification of regions andpopulation size classes1, by expenditure category and commodity and service group
(1982-84=100, unless otherwise noted)
Item and group
Northeast
Size class A Size class B/C 2
Index
Sep.2010
Percent change from—Index
Sep.2010
Percent change from—
Sep.2009
Aug.2010
Sep.2009
Aug.2010
Expenditure category
All items 3 ................................................................................... 231.881 1.2 0.0 140.295 2.1 -0.1 All items (December 1977=100) ................................................ 354.327 - - - - -
Food and beverages ................................................................ 224.986 1.7 .4 140.906 2.1 .1 Food ....................................................................................... 224.512 1.7 .4 140.931 2.2 .1
Food at home ....................................................................... 223.277 2.0 .6 136.213 1.7 .1 Food away from home .......................................................... 228.752 1.3 .3 148.510 2.9 .1
Alcoholic beverages ............................................................... 230.525 .7 .0 139.090 1.8 .3
Housing .................................................................................... 242.414 .5 -.3 139.710 1.1 -.2 Shelter .................................................................................... 288.442 .7 -.2 138.514 1.4 -.1
Rent of primary residence 4 ................................................. 294.592 1.8 .0 145.408 2.2 .3 Owners’ equivalent rent of residences 4 5 ............................ 269.358 .4 -.2 136.732 1.4 .2 Owners’ equivalent rent of primary residence 4 5 ............... 269.339 .4 -.2 136.732 1.4 .2
Fuels and utilities .................................................................... 205.497 1.5 -.7 175.043 3.3 -1.0 Household energy ................................................................ 195.440 .5 -.8 171.701 3.4 -1.2
Gas (piped) and electricity 4 ............................................... 197.300 -1.1 -1.0 147.390 1.7 -1.7 Electricity 4 ....................................................................... 195.845 -1.4 -.1 134.271 1.0 -1.7 Utility (piped) gas service 4 .............................................. 189.781 .9 -3.1 154.129 4.2 -1.5
Household furnishings and operations ................................... 117.570 -2.8 .4 103.069 -2.9 -.1
Apparel ..................................................................................... 122.449 -.4 3.7 88.108 -1.9 6.2
Transportation .......................................................................... 194.666 3.3 -.9 132.822 4.0 -1.1 Private transportation ............................................................. 188.794 3.1 -.9 133.123 3.9 -1.1
Motor fuel ............................................................................. 217.656 .4 -2.5 221.886 1.0 -2.5 Gasoline (all types) ............................................................. 216.507 .1 -2.5 222.161 .7 -2.6 Gasoline, unleaded regular 6 ........................................... 216.342 -.1 -2.7 225.445 .6 -2.7 Gasoline, unleaded midgrade 6 7 ..................................... 219.170 .5 -2.1 221.208 1.2 -2.3 Gasoline, unleaded premium 6 ......................................... 213.088 .8 -2.0 211.684 .9 -2.5
Medical care ............................................................................. 406.726 2.8 .1 170.753 3.4 .2
Recreation 2 ............................................................................. 117.321 -.9 -.9 122.756 1.9 .5
Education and communication 2 .............................................. 131.679 .6 .5 119.245 .5 -.4
Other goods and services ........................................................ 443.065 4.8 .1 213.998 5.9 .2
Commodity and service group
All items 3 ................................................................................... 231.881 1.2 .0 140.295 2.1 -.1 Commodities ............................................................................ 184.278 1.3 .2 132.794 2.4 .1
Commodities less food and beverages .................................. 157.462 1.1 .1 128.205 2.7 .0 Nondurables less food and beverages ................................. 191.748 .8 .4 167.074 2.7 .5 Durables ............................................................................... 111.183 1.7 -.5 90.943 2.9 -.6
Services .................................................................................... 282.337 1.2 -.2 144.028 1.8 -.2
Special aggregate indexes
All items less medical care ......................................................... 225.490 1.2 -.1 137.129 2.0 -.1 All items less shelter ................................................................... 212.457 1.5 .1 138.817 2.4 -.1 Commodities less food ............................................................... 160.231 1.1 .1 128.618 2.7 .0 Nondurables ............................................................................... 209.894 1.3 .4 153.094 2.4 .4 Nondurables less food ................................................................ 194.223 .8 .4 164.948 2.7 .5 Services less rent of shelter 5 .................................................... 249.393 1.8 -.2 149.554 2.3 -.3 Services less medical care services ........................................... 273.370 1.0 -.2 141.796 1.7 -.2Energy ........................................................................................ 204.834 .4 -1.6 193.402 2.1 -1.9 All items less energy .................................................................. 236.562 1.3 .1 133.385 2.1 .2
All items less food and energy ................................................. 240.457 1.2 .0 131.998 2.1 .2
See footnotes at end of table.
59 CPI Detailed Report-September 2010
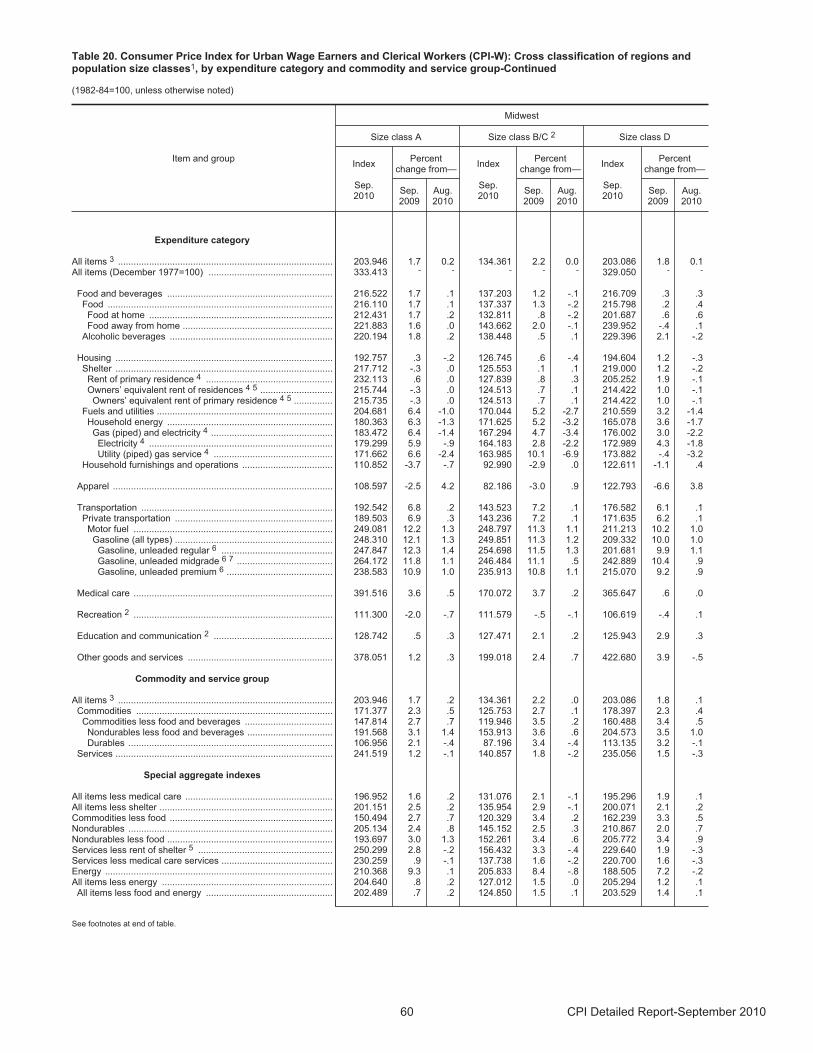
Table 20. Consumer Price Index for Urban Wage Earners and Clerical Workers (CPI-W): Cross classification of regions andpopulation size classes1, by expenditure category and commodity and service group-Continued
(1982-84=100, unless otherwise noted)
Item and group
Midwest
Size class A Size class B/C 2 Size class D
Index
Sep.2010
Percentchange from—
Index
Sep.2010
Percentchange from—
Index
Sep.2010
Percentchange from—
Sep.2009
Aug.2010
Sep.2009
Aug.2010
Sep.2009
Aug.2010
Expenditure category
All items 3 ................................................................................... 203.946 1.7 0.2 134.361 2.2 0.0 203.086 1.8 0.1All items (December 1977=100) ................................................ 333.413 - - - - - 329.050 - -
Food and beverages ................................................................ 216.522 1.7 .1 137.203 1.2 -.1 216.709 .3 .3 Food ....................................................................................... 216.110 1.7 .1 137.337 1.3 -.2 215.798 .2 .4
Food at home ....................................................................... 212.431 1.7 .2 132.811 .8 -.2 201.687 .6 .6 Food away from home .......................................................... 221.883 1.6 .0 143.662 2.0 -.1 239.952 -.4 .1
Alcoholic beverages ............................................................... 220.194 1.8 .2 138.448 .5 .1 229.396 2.1 -.2
Housing .................................................................................... 192.757 .3 -.2 126.745 .6 -.4 194.604 1.2 -.3 Shelter .................................................................................... 217.712 -.3 .0 125.553 .1 .1 219.000 1.2 -.2
Rent of primary residence 4 ................................................. 232.113 .6 .0 127.839 .8 .3 205.252 1.9 -.1 Owners’ equivalent rent of residences 4 5 ............................ 215.744 -.3 .0 124.513 .7 .1 214.422 1.0 -.1 Owners’ equivalent rent of primary residence 4 5 ............... 215.735 -.3 .0 124.513 .7 .1 214.422 1.0 -.1
Fuels and utilities .................................................................... 204.681 6.4 -1.0 170.044 5.2 -2.7 210.559 3.2 -1.4 Household energy ................................................................ 180.363 6.3 -1.3 171.625 5.2 -3.2 165.078 3.6 -1.7
Gas (piped) and electricity 4 ............................................... 183.472 6.4 -1.4 167.294 4.7 -3.4 176.002 3.0 -2.2 Electricity 4 ....................................................................... 179.299 5.9 -.9 164.183 2.8 -2.2 172.989 4.3 -1.8 Utility (piped) gas service 4 .............................................. 171.662 6.6 -2.4 163.985 10.1 -6.9 173.882 -.4 -3.2
Household furnishings and operations ................................... 110.852 -3.7 -.7 92.990 -2.9 .0 122.611 -1.1 .4
Apparel ..................................................................................... 108.597 -2.5 4.2 82.186 -3.0 .9 122.793 -6.6 3.8
Transportation .......................................................................... 192.542 6.8 .2 143.523 7.2 .1 176.582 6.1 .1 Private transportation ............................................................. 189.503 6.9 .3 143.236 7.2 .1 171.635 6.2 .1
Motor fuel ............................................................................. 249.081 12.2 1.3 248.797 11.3 1.1 211.213 10.2 1.0 Gasoline (all types) ............................................................. 248.310 12.1 1.3 249.851 11.3 1.2 209.332 10.0 1.0 Gasoline, unleaded regular 6 ........................................... 247.847 12.3 1.4 254.698 11.5 1.3 201.681 9.9 1.1 Gasoline, unleaded midgrade 6 7 ..................................... 264.172 11.8 1.1 246.484 11.1 .5 242.889 10.4 .9 Gasoline, unleaded premium 6 ......................................... 238.583 10.9 1.0 235.913 10.8 1.1 215.070 9.2 .9
Medical care ............................................................................. 391.516 3.6 .5 170.072 3.7 .2 365.647 .6 .0
Recreation 2 ............................................................................. 111.300 -2.0 -.7 111.579 -.5 -.1 106.619 -.4 .1
Education and communication 2 .............................................. 128.742 .5 .3 127.471 2.1 .2 125.943 2.9 .3
Other goods and services ........................................................ 378.051 1.2 .3 199.018 2.4 .7 422.680 3.9 -.5
Commodity and service group
All items 3 ................................................................................... 203.946 1.7 .2 134.361 2.2 .0 203.086 1.8 .1Commodities ............................................................................ 171.377 2.3 .5 125.753 2.7 .1 178.397 2.3 .4
Commodities less food and beverages .................................. 147.814 2.7 .7 119.946 3.5 .2 160.488 3.4 .5 Nondurables less food and beverages ................................. 191.568 3.1 1.4 153.913 3.6 .6 204.573 3.5 1.0 Durables ............................................................................... 106.956 2.1 -.4 87.196 3.4 -.4 113.135 3.2 -.1
Services .................................................................................... 241.519 1.2 -.1 140.857 1.8 -.2 235.056 1.5 -.3
Special aggregate indexes
All items less medical care ......................................................... 196.952 1.6 .2 131.076 2.1 -.1 195.296 1.9 .1 All items less shelter ................................................................... 201.151 2.5 .2 135.954 2.9 -.1 200.071 2.1 .2 Commodities less food ............................................................... 150.494 2.7 .7 120.329 3.4 .2 162.239 3.3 .5Nondurables ............................................................................... 205.134 2.4 .8 145.152 2.5 .3 210.867 2.0 .7 Nondurables less food ................................................................ 193.697 3.0 1.3 152.261 3.4 .6 205.772 3.4 .9 Services less rent of shelter 5 .................................................... 250.299 2.8 -.2 156.432 3.3 -.4 229.640 1.9 -.3 Services less medical care services ........................................... 230.259 .9 -.1 137.738 1.6 -.2 220.700 1.6 -.3 Energy ........................................................................................ 210.368 9.3 .1 205.833 8.4 -.8 188.505 7.2 -.2 All items less energy .................................................................. 204.640 .8 .2 127.012 1.5 .0 205.294 1.2 .1
All items less food and energy ................................................. 202.489 .7 .2 124.850 1.5 .1 203.529 1.4 .1
See footnotes at end of table.
60 CPI Detailed Report-September 2010

Table 20. Consumer Price Index for Urban Wage Earners and Clerical Workers (CPI-W): Cross classification of regions andpopulation size classes1, by expenditure category and commodity and service group-Continued
(1982-84=100, unless otherwise noted)
Item and group
South
Size class A Size class B/C 2 Size class D
Index
Sep.2010
Percentchange from—
Index
Sep.2010
Percentchange from—
Index
Sep.2010
Percentchange from—
Sep.2009
Aug.2010
Sep.2009
Aug.2010
Sep.2009
Aug.2010
Expenditure category
All items 3 ................................................................................... 211.393 1.3 0.3 133.680 1.8 0.2 215.346 2.1 0.0All items (December 1977=100) ................................................ 342.457 - - - - - 348.598 - -
Food and beverages ................................................................ 217.382 1.4 .9 138.996 1.9 .4 214.519 1.5 .3 Food ....................................................................................... 217.891 1.4 1.0 139.245 1.8 .3 213.960 1.5 .3
Food at home ....................................................................... 210.102 1.1 .7 136.751 2.1 .4 216.039 3.0 .5Food away from home .......................................................... 231.151 1.6 1.3 142.682 1.5 .2 214.604 -.7 .0
Alcoholic beverages ............................................................... 209.837 1.2 -.3 134.126 3.5 1.2 220.497 1.2 .1
Housing .................................................................................... 205.537 -.5 -.2 133.081 -.1 .2 204.704 .6 -.3 Shelter .................................................................................... 224.890 -.3 -.1 135.784 .0 .4 234.235 .6 -.6
Rent of primary residence 4 ................................................. 226.226 -.7 .0 139.628 -.7 .5 218.159 .6 .0 Owners’ equivalent rent of residences 4 5 ............................ 217.080 -.3 -.1 134.601 .3 .4 217.155 .9 -.5 Owners’ equivalent rent of primary residence 4 5 ............... 217.070 -.3 -.1 134.601 .3 .4 217.155 .9 -.5
Fuels and utilities .................................................................... 216.255 -.4 -.9 155.823 1.8 -.5 222.714 1.6 .3 Household energy ................................................................ 194.958 -1.8 -1.2 152.768 1.1 -.6 189.933 1.3 .4
Gas (piped) and electricity 4 ............................................... 199.616 -1.9 -1.3 149.930 .9 -.6 197.880 .7 .3 Electricity 4 ....................................................................... 193.382 -3.2 -.1 146.782 .6 -.4 200.924 1.3 .7 Utility (piped) gas service 4 .............................................. 197.285 5.7 -7.8 151.822 1.7 -2.6 148.337 -7.9 -5.0
Household furnishings and operations ................................... 129.515 -2.1 .5 94.516 -3.3 -.6 113.922 -1.5 .8
Apparel ..................................................................................... 148.768 .7 6.0 87.085 -4.0 3.5 119.639 -1.4 3.8
Transportation .......................................................................... 194.539 6.3 -.5 129.184 6.6 -.6 195.724 7.1 -.3 Private transportation ............................................................. 193.575 6.4 -.5 128.738 6.7 -.6 194.408 7.2 -.3
Motor fuel ............................................................................. 232.752 6.7 -1.8 226.389 7.9 -1.1 217.130 9.7 .2 Gasoline (all types) ............................................................. 230.797 6.6 -1.9 226.902 7.7 -1.1 214.979 9.5 .2Gasoline, unleaded regular 6 ........................................... 231.084 6.7 -1.9 232.613 7.7 -1.2 208.245 9.9 .6 Gasoline, unleaded midgrade 6 7 ..................................... 233.130 6.3 -1.9 221.643 7.6 -1.0 252.438 8.7 -.8 Gasoline, unleaded premium 6 ......................................... 229.930 6.2 -1.8 217.574 7.8 -.9 222.579 7.7 -1.0
Medical care ............................................................................. 367.810 4.9 1.7 162.017 4.5 1.0 365.146 2.0 -.2
Recreation 2 ............................................................................. 104.035 -4.7 .1 111.137 -1.1 -.4 115.026 -1.8 -.3
Education and communication 2 .............................................. 121.164 1.3 .3 120.085 1.5 .4 128.357 .9 .2
Other goods and services ........................................................ 362.596 2.3 .1 185.356 3.2 -.2 443.984 2.9 .2
Commodity and service group
All items 3 ................................................................................... 211.393 1.3 .3 133.680 1.8 .2 215.346 2.1 .0Commodities ............................................................................ 179.622 2.5 .6 123.111 2.5 .1 179.161 3.2 .3
Commodities less food and beverages .................................. 159.259 3.2 .5 115.278 2.8 -.1 161.731 4.1 .4 Nondurables less food and beverages ................................. 202.671 2.8 .7 147.396 2.2 .2 206.424 4.3 .8 Durables ............................................................................... 116.558 3.8 .0 87.379 3.6 -.6 117.610 3.7 -.4
Services .................................................................................... 247.175 .5 .0 141.626 1.2 .3 262.517 1.1 -.3
Special aggregate indexes
All items less medical care ......................................................... 204.460 1.1 .2 130.614 1.7 .1 205.746 2.1 .0 All items less shelter ................................................................... 207.910 2.2 .4 131.190 2.5 .1 211.539 2.7 .2 Commodities less food ............................................................... 161.158 3.1 .4 115.813 2.9 .0 162.960 4.0 .4Nondurables ............................................................................... 209.293 2.1 .8 142.462 2.1 .3 211.330 3.1 .6 Nondurables less food ................................................................ 203.036 2.7 .6 146.702 2.3 .3 206.141 4.2 .8Services less rent of shelter 5 .................................................... 250.883 1.7 .2 147.411 2.5 .1 266.787 1.7 .0 Services less medical care services ........................................... 235.537 .2 -.1 139.454 .9 .2 248.340 1.0 -.3 Energy ........................................................................................ 210.671 2.3 -1.6 184.357 4.8 -.9 198.438 5.9 .3 All items less energy .................................................................. 212.364 1.2 .5 127.242 1.4 .3 215.427 1.5 -.1
All items less food and energy ................................................. 211.375 1.1 .4 124.740 1.4 .3 216.487 1.5 -.1
See footnotes at end of table.
61 CPI Detailed Report-September 2010
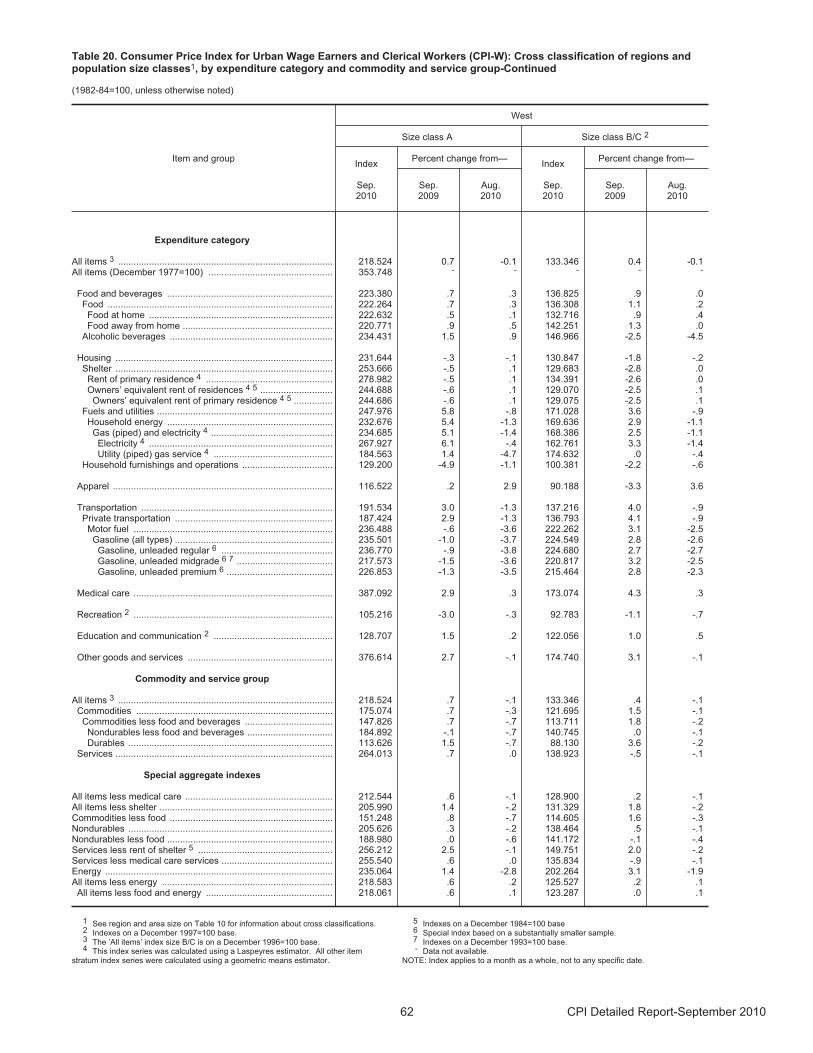
Table 20. Consumer Price Index for Urban Wage Earners and Clerical Workers (CPI-W): Cross classification of regions andpopulation size classes1, by expenditure category and commodity and service group-Continued
(1982-84=100, unless otherwise noted)
Item and group
West
Size class A Size class B/C 2
Index
Sep.2010
Percent change from—Index
Sep.2010
Percent change from—
Sep.2009
Aug.2010
Sep.2009
Aug.2010
Expenditure category
All items 3 ................................................................................... 218.524 0.7 -0.1 133.346 0.4 -0.1 All items (December 1977=100) ................................................ 353.748 - - - - -
Food and beverages ................................................................ 223.380 .7 .3 136.825 .9 .0 Food ....................................................................................... 222.264 .7 .3 136.308 1.1 .2
Food at home ....................................................................... 222.632 .5 .1 132.716 .9 .4 Food away from home .......................................................... 220.771 .9 .5 142.251 1.3 .0
Alcoholic beverages ............................................................... 234.431 1.5 .9 146.966 -2.5 -4.5
Housing .................................................................................... 231.644 -.3 -.1 130.847 -1.8 -.2 Shelter .................................................................................... 253.666 -.5 .1 129.683 -2.8 .0
Rent of primary residence 4 ................................................. 278.982 -.5 .1 134.391 -2.6 .0 Owners’ equivalent rent of residences 4 5 ............................ 244.688 -.6 .1 129.070 -2.5 .1 Owners’ equivalent rent of primary residence 4 5 ............... 244.686 -.6 .1 129.075 -2.5 .1
Fuels and utilities .................................................................... 247.976 5.8 -.8 171.028 3.6 -.9 Household energy ................................................................ 232.676 5.4 -1.3 169.636 2.9 -1.1
Gas (piped) and electricity 4 ............................................... 234.685 5.1 -1.4 168.386 2.5 -1.1 Electricity 4 ....................................................................... 267.927 6.1 -.4 162.761 3.3 -1.4 Utility (piped) gas service 4 .............................................. 184.563 1.4 -4.7 174.632 .0 -.4
Household furnishings and operations ................................... 129.200 -4.9 -1.1 100.381 -2.2 -.6
Apparel ..................................................................................... 116.522 .2 2.9 90.188 -3.3 3.6
Transportation .......................................................................... 191.534 3.0 -1.3 137.216 4.0 -.9 Private transportation ............................................................. 187.424 2.9 -1.3 136.793 4.1 -.9
Motor fuel ............................................................................. 236.488 -.6 -3.6 222.262 3.1 -2.5 Gasoline (all types) ............................................................. 235.501 -1.0 -3.7 224.549 2.8 -2.6 Gasoline, unleaded regular 6 ........................................... 236.770 -.9 -3.8 224.680 2.7 -2.7 Gasoline, unleaded midgrade 6 7 ..................................... 217.573 -1.5 -3.6 220.817 3.2 -2.5 Gasoline, unleaded premium 6 ......................................... 226.853 -1.3 -3.5 215.464 2.8 -2.3
Medical care ............................................................................. 387.092 2.9 .3 173.074 4.3 .3
Recreation 2 ............................................................................. 105.216 -3.0 -.3 92.783 -1.1 -.7
Education and communication 2 .............................................. 128.707 1.5 .2 122.056 1.0 .5
Other goods and services ........................................................ 376.614 2.7 -.1 174.740 3.1 -.1
Commodity and service group
All items 3 ................................................................................... 218.524 .7 -.1 133.346 .4 -.1 Commodities ............................................................................ 175.074 .7 -.3 121.695 1.5 -.1
Commodities less food and beverages .................................. 147.826 .7 -.7 113.711 1.8 -.2 Nondurables less food and beverages ................................. 184.892 -.1 -.7 140.745 .0 -.1 Durables ............................................................................... 113.626 1.5 -.7 88.130 3.6 -.2
Services .................................................................................... 264.013 .7 .0 138.923 -.5 -.1
Special aggregate indexes
All items less medical care ......................................................... 212.544 .6 -.1 128.900 .2 -.1 All items less shelter ................................................................... 205.990 1.4 -.2 131.329 1.8 -.2 Commodities less food ............................................................... 151.248 .8 -.7 114.605 1.6 -.3 Nondurables ............................................................................... 205.626 .3 -.2 138.464 .5 -.1 Nondurables less food ................................................................ 188.980 .0 -.6 141.172 -.1 -.4 Services less rent of shelter 5 .................................................... 256.212 2.5 -.1 149.751 2.0 -.2 Services less medical care services ........................................... 255.540 .6 .0 135.834 -.9 -.1Energy ........................................................................................ 235.064 1.4 -2.8 202.264 3.1 -1.9All items less energy .................................................................. 218.583 .6 .2 125.527 .2 .1All items less food and energy ................................................. 218.061 .6 .1 123.287 .0 .1
1 See region and area size on Table 10 for information about cross classifications.2 Indexes on a December 1997=100 base.3 The ’All items’ index size B/C is on a December 1996=100 base.4 This index series was calculated using a Laspeyres estimator. All other item
stratum index series were calculated using a geometric means estimator.
5 Indexes on a December 1984=100 base6 Special index based on a substantially smaller sample.7 Indexes on a December 1993=100 base.- Data not available.
NOTE: Index applies to a month as a whole, not to any specific date.
62 CPI Detailed Report-September 2010
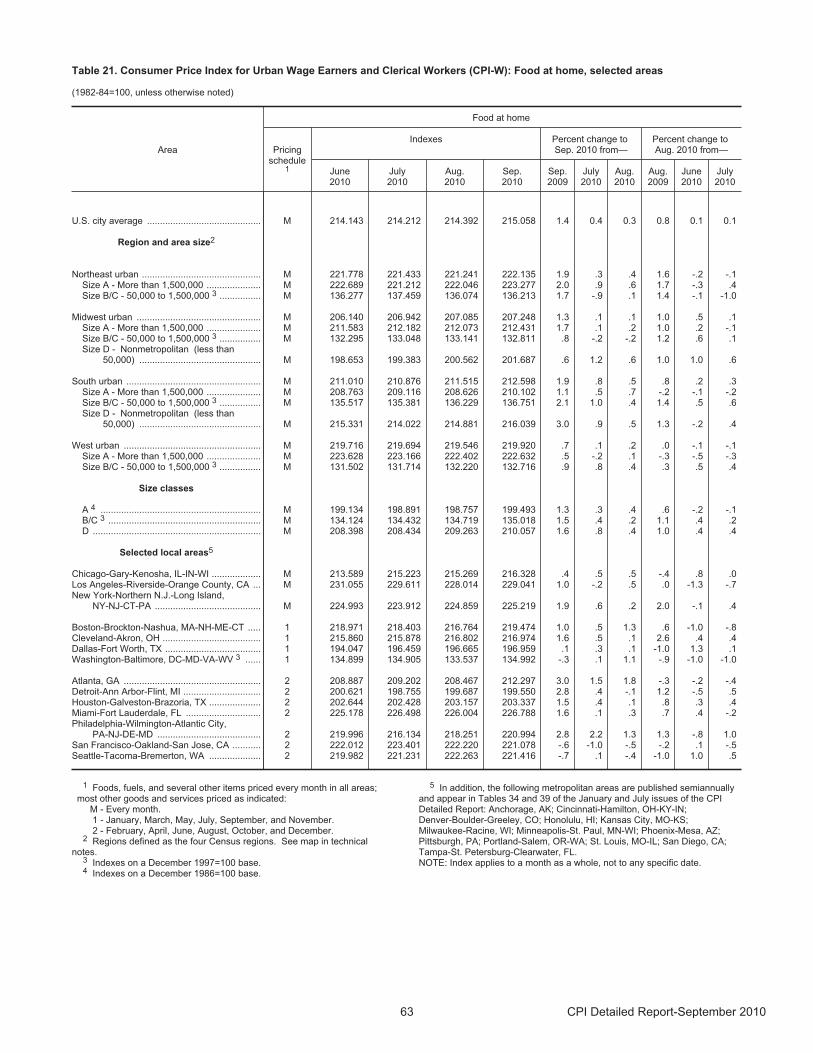
Table 21. Consumer Price Index for Urban Wage Earners and Clerical Workers (CPI-W): Food at home, selected areas
(1982-84=100, unless otherwise noted)
Area
Food at home
Pricingschedule
1
Indexes Percent change to Sep. 2010 from—
Percent change to Aug. 2010 from—
June2010
July2010
Aug.2010
Sep.2010
Sep.2009
July2010
Aug.2010
Aug.2009
June2010
July2010
U.S. city average ............................................ M 214.143 214.212 214.392 215.058 1.4 0.4 0.3 0.8 0.1 0.1
Region and area size2
Northeast urban .............................................. M 221.778 221.433 221.241 222.135 1.9 .3 .4 1.6 -.2 -.1 Size A - More than 1,500,000 ..................... M 222.689 221.212 222.046 223.277 2.0 .9 .6 1.7 -.3 .4 Size B/C - 50,000 to 1,500,000 3 ................ M 136.277 137.459 136.074 136.213 1.7 -.9 .1 1.4 -.1 -1.0
Midwest urban ................................................ M 206.140 206.942 207.085 207.248 1.3 .1 .1 1.0 .5 .1 Size A - More than 1,500,000 ..................... M 211.583 212.182 212.073 212.431 1.7 .1 .2 1.0 .2 -.1 Size B/C - 50,000 to 1,500,000 3 ................ M 132.295 133.048 133.141 132.811 .8 -.2 -.2 1.2 .6 .1 Size D - Nonmetropolitan (less than
50,000) ............................................... M 198.653 199.383 200.562 201.687 .6 1.2 .6 1.0 1.0 .6
South urban .................................................... M 211.010 210.876 211.515 212.598 1.9 .8 .5 .8 .2 .3 Size A - More than 1,500,000 ..................... M 208.763 209.116 208.626 210.102 1.1 .5 .7 -.2 -.1 -.2 Size B/C - 50,000 to 1,500,000 3 ................ M 135.517 135.381 136.229 136.751 2.1 1.0 .4 1.4 .5 .6 Size D - Nonmetropolitan (less than
50,000) ............................................... M 215.331 214.022 214.881 216.039 3.0 .9 .5 1.3 -.2 .4
West urban ..................................................... M 219.716 219.694 219.546 219.920 .7 .1 .2 .0 -.1 -.1 Size A - More than 1,500,000 ..................... M 223.628 223.166 222.402 222.632 .5 -.2 .1 -.3 -.5 -.3 Size B/C - 50,000 to 1,500,000 3 ................ M 131.502 131.714 132.220 132.716 .9 .8 .4 .3 .5 .4
Size classes
A 4 .............................................................. M 199.134 198.891 198.757 199.493 1.3 .3 .4 .6 -.2 -.1 B/C 3 ........................................................... M 134.124 134.432 134.719 135.018 1.5 .4 .2 1.1 .4 .2 D ................................................................. M 208.398 208.434 209.263 210.057 1.6 .8 .4 1.0 .4 .4
Selected local areas5
Chicago-Gary-Kenosha, IL-IN-WI ................... M 213.589 215.223 215.269 216.328 .4 .5 .5 -.4 .8 .0 Los Angeles-Riverside-Orange County, CA ... M 231.055 229.611 228.014 229.041 1.0 -.2 .5 .0 -1.3 -.7 New York-Northern N.J.-Long Island,
NY-NJ-CT-PA ......................................... M 224.993 223.912 224.859 225.219 1.9 .6 .2 2.0 -.1 .4
Boston-Brockton-Nashua, MA-NH-ME-CT ..... 1 218.971 218.403 216.764 219.474 1.0 .5 1.3 .6 -1.0 -.8 Cleveland-Akron, OH ...................................... 1 215.860 215.878 216.802 216.974 1.6 .5 .1 2.6 .4 .4 Dallas-Fort Worth, TX ..................................... 1 194.047 196.459 196.665 196.959 .1 .3 .1 -1.0 1.3 .1 Washington-Baltimore, DC-MD-VA-WV 3 ...... 1 134.899 134.905 133.537 134.992 -.3 .1 1.1 -.9 -1.0 -1.0
Atlanta, GA ..................................................... 2 208.887 209.202 208.467 212.297 3.0 1.5 1.8 -.3 -.2 -.4 Detroit-Ann Arbor-Flint, MI .............................. 2 200.621 198.755 199.687 199.550 2.8 .4 -.1 1.2 -.5 .5 Houston-Galveston-Brazoria, TX .................... 2 202.644 202.428 203.157 203.337 1.5 .4 .1 .8 .3 .4 Miami-Fort Lauderdale, FL ............................. 2 225.178 226.498 226.004 226.788 1.6 .1 .3 .7 .4 -.2 Philadelphia-Wilmington-Atlantic City,
PA-NJ-DE-MD ........................................ 2 219.996 216.134 218.251 220.994 2.8 2.2 1.3 1.3 -.8 1.0 San Francisco-Oakland-San Jose, CA ........... 2 222.012 223.401 222.220 221.078 -.6 -1.0 -.5 -.2 .1 -.5 Seattle-Tacoma-Bremerton, WA .................... 2 219.982 221.231 222.263 221.416 -.7 .1 -.4 -1.0 1.0 .5
1 Foods, fuels, and several other items priced every month in all areas; most other goods and services priced as indicated: M - Every month. 1 - January, March, May, July, September, and November. 2 - February, April, June, August, October, and December.
2 Regions defined as the four Census regions. See map in technicalnotes.
3 Indexes on a December 1997=100 base.4 Indexes on a December 1986=100 base.
5 In addition, the following metropolitan areas are published semiannuallyand appear in Tables 34 and 39 of the January and July issues of the CPIDetailed Report: Anchorage, AK; Cincinnati-Hamilton, OH-KY-IN;Denver-Boulder-Greeley, CO; Honolulu, HI; Kansas City, MO-KS;Milwaukee-Racine, WI; Minneapolis-St. Paul, MN-WI; Phoenix-Mesa, AZ;Pittsburgh, PA; Portland-Salem, OR-WA; St. Louis, MO-IL; San Diego, CA;Tampa-St. Petersburg-Clearwater, FL.NOTE: Index applies to a month as a whole, not to any specific date.
63 CPI Detailed Report-September 2010
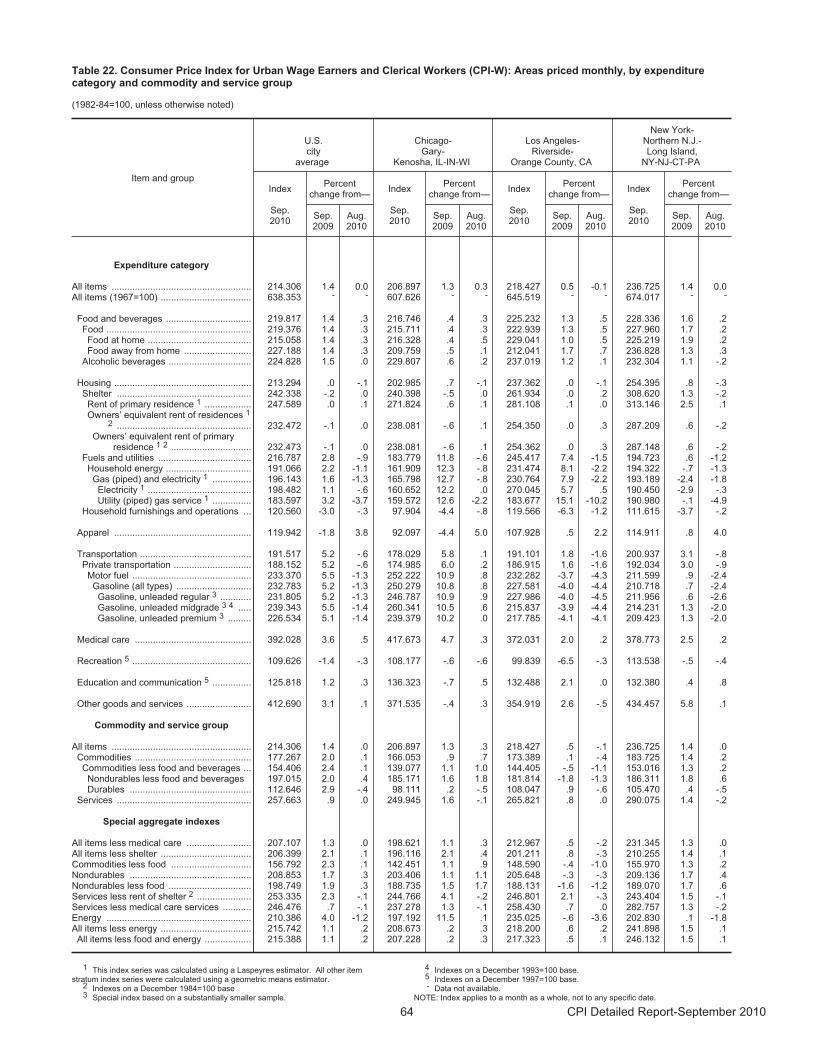
Table 22. Consumer Price Index for Urban Wage Earners and Clerical Workers (CPI-W): Areas priced monthly, by expenditurecategory and commodity and service group
(1982-84=100, unless otherwise noted)
Item and group
U.S.city
average
Chicago-Gary-
Kenosha, IL-IN-WI
Los Angeles-Riverside-
Orange County, CA
New York-Northern N.J.-Long Island,
NY-NJ-CT-PA
Index
Sep.2010
Percentchange from—
Index
Sep.2010
Percentchange from—
Index
Sep.2010
Percentchange from—
Index
Sep.2010
Percentchange from—
Sep.2009
Aug.2010
Sep.2009
Aug.2010
Sep.2009
Aug.2010
Sep.2009
Aug.2010
Expenditure category
All items ...................................................... 214.306 1.4 0.0 206.897 1.3 0.3 218.427 0.5 -0.1 236.725 1.4 0.0All items (1967=100) ................................... 638.353 - - 607.626 - - 645.519 - - 674.017 - -
Food and beverages ................................. 219.817 1.4 .3 216.746 .4 .3 225.232 1.3 .5 228.336 1.6 .2 Food ........................................................ 219.376 1.4 .3 215.711 .4 .3 222.939 1.3 .5 227.960 1.7 .2
Food at home ........................................ 215.058 1.4 .3 216.328 .4 .5 229.041 1.0 .5 225.219 1.9 .2 Food away from home .......................... 227.188 1.4 .3 209.759 .5 .1 212.041 1.7 .7 236.828 1.3 .3
Alcoholic beverages ................................ 224.828 1.5 .0 229.807 .6 .2 237.019 1.2 .1 232.304 1.1 -.2
Housing ..................................................... 213.294 .0 -.1 202.985 .7 -.1 237.362 .0 -.1 254.395 .8 -.3 Shelter .................................................... 242.338 -.2 .0 240.398 -.5 .0 261.934 .0 .2 308.620 1.3 -.2
Rent of primary residence 1 .................. 247.589 .0 .1 271.824 .6 .1 281.108 .1 .0 313.146 2.5 .1 Owners’ equivalent rent of residences 1
2 .................................................... 232.472 -.1 .0 238.081 -.6 .1 254.350 .0 .3 287.209 .6 -.2 Owners’ equivalent rent of primary
residence 1 2 ............................... 232.473 -.1 .0 238.081 -.6 .1 254.362 .0 .3 287.148 .6 -.2 Fuels and utilities .................................... 216.787 2.8 -.9 183.779 11.8 -.6 245.417 7.4 -1.5 194.723 .6 -1.2
Household energy ................................. 191.066 2.2 -1.1 161.909 12.3 -.8 231.474 8.1 -2.2 194.322 -.7 -1.3 Gas (piped) and electricity 1 ............... 196.143 1.6 -1.3 165.798 12.7 -.8 230.764 7.9 -2.2 193.189 -2.4 -1.8 Electricity 1 ........................................ 198.482 1.1 -.6 160.652 12.2 .0 270.045 5.7 .5 190.450 -2.9 -.3 Utility (piped) gas service 1 ............... 183.597 3.2 -3.7 159.572 12.6 -2.2 183.677 15.1 -10.2 190.980 -.1 -4.9
Household furnishings and operations ... 120.560 -3.0 -.3 97.904 -4.4 -.8 119.566 -6.3 -1.2 111.615 -3.7 -.2
Apparel ..................................................... 119.942 -1.8 3.8 92.097 -4.4 5.0 107.928 .5 2.2 114.911 .8 4.0
Transportation ........................................... 191.517 5.2 -.6 178.029 5.8 .1 191.101 1.8 -1.6 200.937 3.1 -.8 Private transportation .............................. 188.152 5.2 -.6 174.985 6.0 .2 186.915 1.6 -1.6 192.034 3.0 -.9 Motor fuel .............................................. 233.370 5.5 -1.3 252.222 10.9 .8 232.282 -3.7 -4.3 211.599 .9 -2.4
Gasoline (all types) ............................. 232.783 5.2 -1.3 250.279 10.8 .8 227.581 -4.0 -4.4 210.718 .7 -2.4 Gasoline, unleaded regular 3 ............ 231.805 5.2 -1.3 246.787 10.9 .9 227.986 -4.0 -4.5 211.956 .6 -2.6 Gasoline, unleaded midgrade 3 4 ..... 239.343 5.5 -1.4 260.341 10.5 .6 215.837 -3.9 -4.4 214.231 1.3 -2.0 Gasoline, unleaded premium 3 ......... 226.534 5.1 -1.4 239.379 10.2 .0 217.785 -4.1 -4.1 209.423 1.3 -2.0
Medical care ............................................. 392.028 3.6 .5 417.673 4.7 .3 372.031 2.0 .2 378.773 2.5 .2
Recreation 5 .............................................. 109.626 -1.4 -.3 108.177 -.6 -.6 99.839 -6.5 -.3 113.538 -.5 -.4
Education and communication 5 ............... 125.818 1.2 .3 136.323 -.7 .5 132.488 2.1 .0 132.380 .4 .8
Other goods and services ......................... 412.690 3.1 .1 371.535 -.4 .3 354.919 2.6 -.5 434.457 5.8 .1
Commodity and service group
All items ...................................................... 214.306 1.4 .0 206.897 1.3 .3 218.427 .5 -.1 236.725 1.4 .0 Commodities ............................................. 177.267 2.0 .1 166.053 .9 .7 173.389 .1 -.4 183.725 1.4 .2
Commodities less food and beverages ... 154.406 2.4 .1 139.077 1.1 1.0 144.405 -.5 -1.1 153.016 1.3 .2 Nondurables less food and beverages 197.015 2.0 .4 185.171 1.6 1.8 181.814 -1.8 -1.3 186.311 1.8 .6 Durables ............................................... 112.646 2.9 -.4 98.111 .2 -.5 108.047 .9 -.6 105.470 .4 -.5
Services .................................................... 257.663 .9 .0 249.945 1.6 -.1 265.821 .8 .0 290.075 1.4 -.2
Special aggregate indexes
All items less medical care ......................... 207.107 1.3 .0 198.621 1.1 .3 212.967 .5 -.2 231.345 1.3 .0 All items less shelter ................................... 206.399 2.1 .1 196.116 2.1 .4 201.211 .8 -.3 210.255 1.4 .1 Commodities less food ............................... 156.792 2.3 .1 142.451 1.1 .9 148.590 -.4 -1.0 155.970 1.3 .2 Nondurables ............................................... 208.853 1.7 .3 203.406 1.1 1.1 205.648 -.3 -.3 209.136 1.7 .4 Nondurables less food ................................ 198.749 1.9 .3 188.735 1.5 1.7 188.131 -1.6 -1.2 189.070 1.7 .6 Services less rent of shelter 2 ..................... 253.335 2.3 -.1 244.766 4.1 -.2 246.801 2.1 -.3 243.404 1.5 -.1 Services less medical care services ........... 246.476 .7 -.1 237.278 1.3 -.1 258.430 .7 .0 282.757 1.3 -.2 Energy ........................................................ 210.386 4.0 -1.2 197.192 11.5 .1 235.025 -.6 -3.6 202.830 .1 -1.8All items less energy ................................... 215.742 1.1 .2 208.673 .2 .3 218.200 .6 .2 241.898 1.5 .1 All items less food and energy .................. 215.388 1.1 .2 207.228 .2 .3 217.323 .5 .1 246.132 1.5 .1
1 This index series was calculated using a Laspeyres estimator. All other itemstratum index series were calculated using a geometric means estimator.
2 Indexes on a December 1984=100 base3 Special index based on a substantially smaller sample.
4 Indexes on a December 1993=100 base.5 Indexes on a December 1997=100 base.- Data not available.
NOTE: Index applies to a month as a whole, not to any specific date.
64 CPI Detailed Report-September 2010
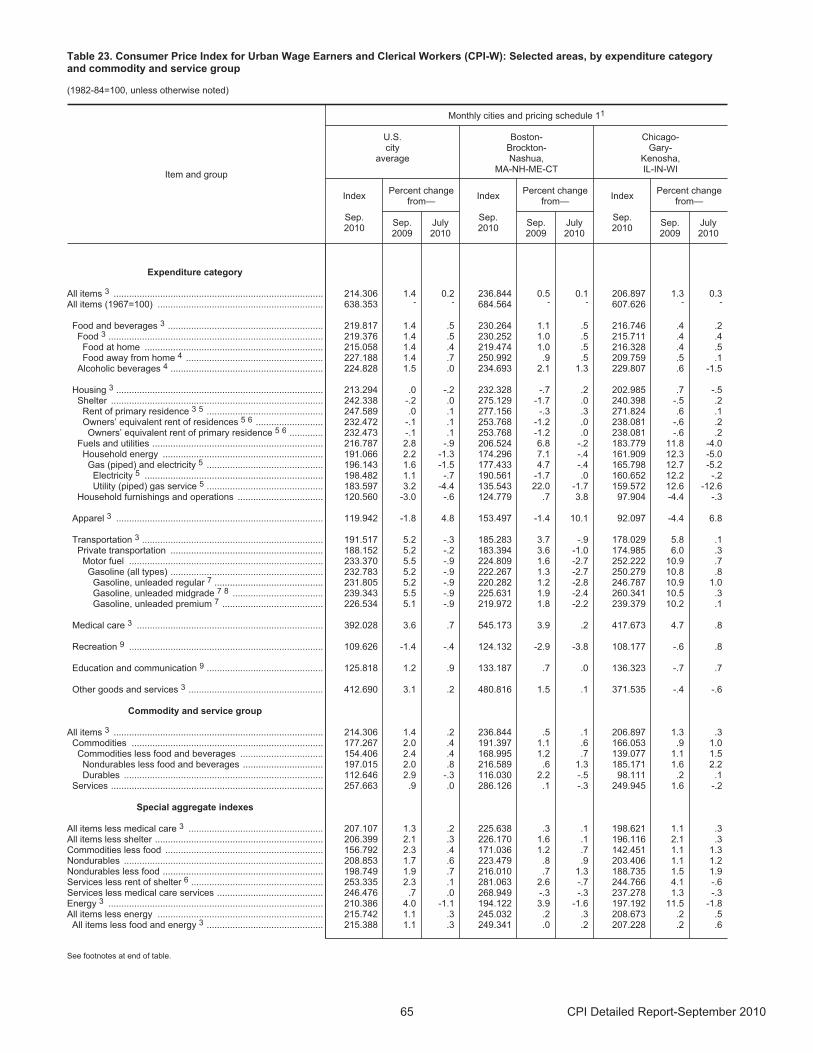
Table 23. Consumer Price Index for Urban Wage Earners and Clerical Workers (CPI-W): Selected areas, by expenditure categoryand commodity and service group
(1982-84=100, unless otherwise noted)
Item and group
Monthly cities and pricing schedule 11
U.S. city
average
Boston-Brockton-Nashua,
MA-NH-ME-CT
Chicago-Gary-
Kenosha, IL-IN-WI
Index
Sep.2010
Percent changefrom—
Index
Sep.2010
Percent changefrom—
Index
Sep.2010
Percent changefrom—
Sep.2009
July2010
Sep.2009
July2010
Sep.2009
July2010
Expenditure category
All items 3 ................................................................................. 214.306 1.4 0.2 236.844 0.5 0.1 206.897 1.3 0.3All items (1967=100) ................................................................ 638.353 - - 684.564 - - 607.626 - -
Food and beverages 3 ............................................................ 219.817 1.4 .5 230.264 1.1 .5 216.746 .4 .2 Food 3 ................................................................................... 219.376 1.4 .5 230.252 1.0 .5 215.711 .4 .4 Food at home ..................................................................... 215.058 1.4 .4 219.474 1.0 .5 216.328 .4 .5 Food away from home 4 ..................................................... 227.188 1.4 .7 250.992 .9 .5 209.759 .5 .1
Alcoholic beverages 4 ........................................................... 224.828 1.5 .0 234.693 2.1 1.3 229.807 .6 -1.5
Housing 3 ................................................................................ 213.294 .0 -.2 232.328 -.7 .2 202.985 .7 -.5 Shelter .................................................................................. 242.338 -.2 .0 275.129 -1.7 .0 240.398 -.5 .2 Rent of primary residence 3 5 ............................................. 247.589 .0 .1 277.156 -.3 .3 271.824 .6 .1 Owners’ equivalent rent of residences 5 6 .......................... 232.472 -.1 .1 253.768 -1.2 .0 238.081 -.6 .2 Owners’ equivalent rent of primary residence 5 6 ............. 232.473 -.1 .1 253.768 -1.2 .0 238.081 -.6 .2
Fuels and utilities .................................................................. 216.787 2.8 -.9 206.524 6.8 -.2 183.779 11.8 -4.0 Household energy .............................................................. 191.066 2.2 -1.3 174.296 7.1 -.4 161.909 12.3 -5.0Gas (piped) and electricity 5 ............................................. 196.143 1.6 -1.5 177.433 4.7 -.4 165.798 12.7 -5.2 Electricity 5 ..................................................................... 198.482 1.1 -.7 190.561 -1.7 .0 160.652 12.2 -.2 Utility (piped) gas service 5 ............................................. 183.597 3.2 -4.4 135.543 22.0 -1.7 159.572 12.6 -12.6
Household furnishings and operations ................................. 120.560 -3.0 -.6 124.779 .7 3.8 97.904 -4.4 -.3
Apparel 3 ................................................................................ 119.942 -1.8 4.8 153.497 -1.4 10.1 92.097 -4.4 6.8
Transportation 3 ...................................................................... 191.517 5.2 -.3 185.283 3.7 -.9 178.029 5.8 .1 Private transportation ........................................................... 188.152 5.2 -.2 183.394 3.6 -1.0 174.985 6.0 .3
Motor fuel ........................................................................... 233.370 5.5 -.9 224.809 1.6 -2.7 252.222 10.9 .7 Gasoline (all types) ........................................................... 232.783 5.2 -.9 222.267 1.3 -2.7 250.279 10.8 .8
Gasoline, unleaded regular 7 .......................................... 231.805 5.2 -.9 220.282 1.2 -2.8 246.787 10.9 1.0 Gasoline, unleaded midgrade 7 8 ................................... 239.343 5.5 -.9 225.631 1.9 -2.4 260.341 10.5 .3 Gasoline, unleaded premium 7 ....................................... 226.534 5.1 -.9 219.972 1.8 -2.2 239.379 10.2 .1
Medical care 3 ........................................................................ 392.028 3.6 .7 545.173 3.9 .2 417.673 4.7 .8
Recreation 9 ........................................................................... 109.626 -1.4 -.4 124.132 -2.9 -3.8 108.177 -.6 .8
Education and communication 9 ............................................. 125.818 1.2 .9 133.187 .7 .0 136.323 -.7 .7
Other goods and services 3 .................................................... 412.690 3.1 .2 480.816 1.5 .1 371.535 -.4 -.6
Commodity and service group
All items 3 ................................................................................. 214.306 1.4 .2 236.844 .5 .1 206.897 1.3 .3 Commodities .......................................................................... 177.267 2.0 .4 191.397 1.1 .6 166.053 .9 1.0
Commodities less food and beverages ................................ 154.406 2.4 .4 168.995 1.2 .7 139.077 1.1 1.5 Nondurables less food and beverages ............................... 197.015 2.0 .8 216.589 .6 1.3 185.171 1.6 2.2 Durables ............................................................................. 112.646 2.9 -.3 116.030 2.2 -.5 98.111 .2 .1
Services .................................................................................. 257.663 .9 .0 286.126 .1 -.3 249.945 1.6 -.2
Special aggregate indexes
All items less medical care 3 .................................................... 207.107 1.3 .2 225.638 .3 .1 198.621 1.1 .3 All items less shelter ................................................................. 206.399 2.1 .3 226.170 1.6 .1 196.116 2.1 .3 Commodities less food ............................................................. 156.792 2.3 .4 171.036 1.2 .7 142.451 1.1 1.3 Nondurables ............................................................................. 208.853 1.7 .6 223.479 .8 .9 203.406 1.1 1.2 Nondurables less food .............................................................. 198.749 1.9 .7 216.010 .7 1.3 188.735 1.5 1.9 Services less rent of shelter 6 ................................................... 253.335 2.3 .1 281.063 2.6 -.7 244.766 4.1 -.6 Services less medical care services ......................................... 246.476 .7 .0 268.949 -.3 -.3 237.278 1.3 -.3 Energy 3 ................................................................................... 210.386 4.0 -1.1 194.122 3.9 -1.6 197.192 11.5 -1.8 All items less energy ................................................................ 215.742 1.1 .3 245.032 .2 .3 208.673 .2 .5
All items less food and energy 3 ............................................. 215.388 1.1 .3 249.341 .0 .2 207.228 .2 .6
See footnotes at end of table.
65 CPI Detailed Report-September 2010
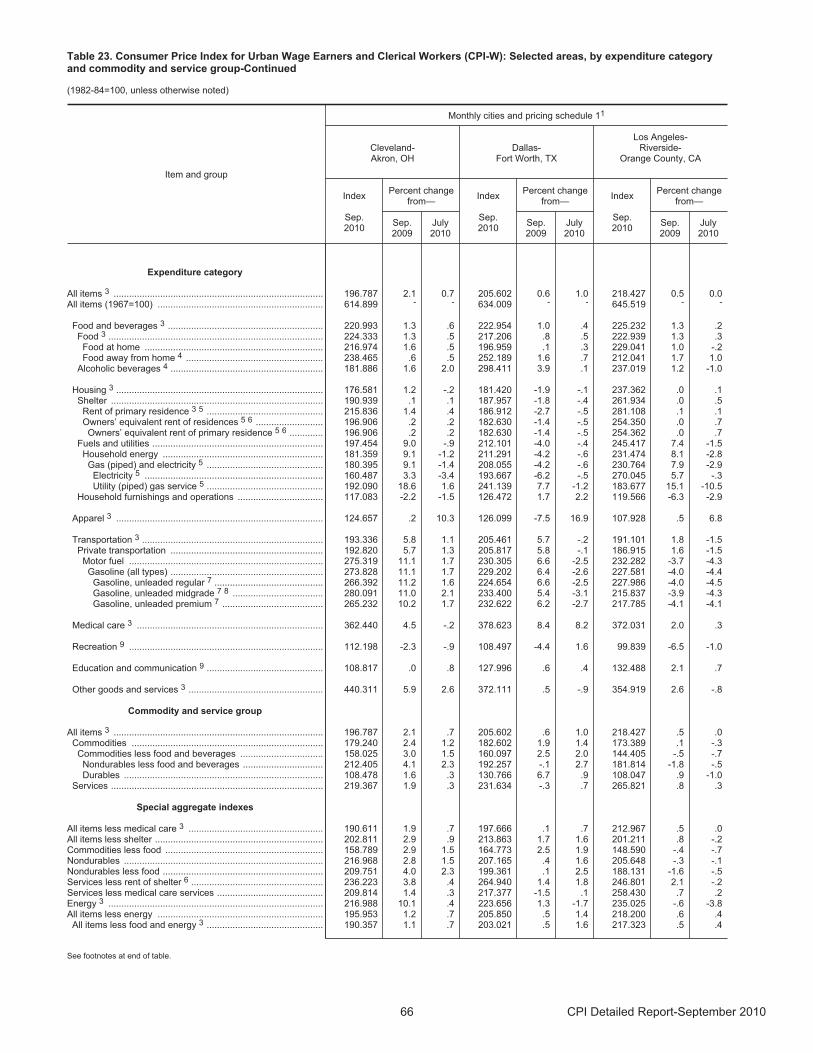
Table 23. Consumer Price Index for Urban Wage Earners and Clerical Workers (CPI-W): Selected areas, by expenditure categoryand commodity and service group-Continued
(1982-84=100, unless otherwise noted)
Item and group
Monthly cities and pricing schedule 11
Cleveland-Akron, OH
Dallas-Fort Worth, TX
Los Angeles-Riverside-
Orange County, CA
Index
Sep.2010
Percent changefrom—
Index
Sep.2010
Percent changefrom—
Index
Sep.2010
Percent changefrom—
Sep.2009
July2010
Sep.2009
July2010
Sep.2009
July2010
Expenditure category
All items 3 ................................................................................. 196.787 2.1 0.7 205.602 0.6 1.0 218.427 0.5 0.0All items (1967=100) ................................................................ 614.899 - - 634.009 - - 645.519 - -
Food and beverages 3 ............................................................ 220.993 1.3 .6 222.954 1.0 .4 225.232 1.3 .2 Food 3 ................................................................................... 224.333 1.3 .5 217.206 .8 .5 222.939 1.3 .3 Food at home ..................................................................... 216.974 1.6 .5 196.959 .1 .3 229.041 1.0 -.2 Food away from home 4 ..................................................... 238.465 .6 .5 252.189 1.6 .7 212.041 1.7 1.0
Alcoholic beverages 4 ........................................................... 181.886 1.6 2.0 298.411 3.9 .1 237.019 1.2 -1.0
Housing 3 ................................................................................ 176.581 1.2 -.2 181.420 -1.9 -.1 237.362 .0 .1 Shelter .................................................................................. 190.939 .1 .1 187.957 -1.8 -.4 261.934 .0 .5 Rent of primary residence 3 5 ............................................. 215.836 1.4 .4 186.912 -2.7 -.5 281.108 .1 .1 Owners’ equivalent rent of residences 5 6 .......................... 196.906 .2 .2 182.630 -1.4 -.5 254.350 .0 .7 Owners’ equivalent rent of primary residence 5 6 ............. 196.906 .2 .2 182.630 -1.4 -.5 254.362 .0 .7
Fuels and utilities .................................................................. 197.454 9.0 -.9 212.101 -4.0 -.4 245.417 7.4 -1.5 Household energy .............................................................. 181.359 9.1 -1.2 211.291 -4.2 -.6 231.474 8.1 -2.8 Gas (piped) and electricity 5 ............................................. 180.395 9.1 -1.4 208.055 -4.2 -.6 230.764 7.9 -2.9 Electricity 5 ..................................................................... 160.487 3.3 -3.4 193.667 -6.2 -.5 270.045 5.7 -.3 Utility (piped) gas service 5 ............................................. 192.090 18.6 1.6 241.139 7.7 -1.2 183.677 15.1 -10.5
Household furnishings and operations ................................. 117.083 -2.2 -1.5 126.472 1.7 2.2 119.566 -6.3 -2.9
Apparel 3 ................................................................................ 124.657 .2 10.3 126.099 -7.5 16.9 107.928 .5 6.8
Transportation 3 ...................................................................... 193.336 5.8 1.1 205.461 5.7 -.2 191.101 1.8 -1.5 Private transportation ........................................................... 192.820 5.7 1.3 205.817 5.8 -.1 186.915 1.6 -1.5
Motor fuel ........................................................................... 275.319 11.1 1.7 230.305 6.6 -2.5 232.282 -3.7 -4.3 Gasoline (all types) ........................................................... 273.828 11.1 1.7 229.202 6.4 -2.6 227.581 -4.0 -4.4
Gasoline, unleaded regular 7 .......................................... 266.392 11.2 1.6 224.654 6.6 -2.5 227.986 -4.0 -4.5 Gasoline, unleaded midgrade 7 8 ................................... 280.091 11.0 2.1 233.400 5.4 -3.1 215.837 -3.9 -4.3 Gasoline, unleaded premium 7 ....................................... 265.232 10.2 1.7 232.622 6.2 -2.7 217.785 -4.1 -4.1
Medical care 3 ........................................................................ 362.440 4.5 -.2 378.623 8.4 8.2 372.031 2.0 .3
Recreation 9 ........................................................................... 112.198 -2.3 -.9 108.497 -4.4 1.6 99.839 -6.5 -1.0
Education and communication 9 ............................................. 108.817 .0 .8 127.996 .6 .4 132.488 2.1 .7
Other goods and services 3 .................................................... 440.311 5.9 2.6 372.111 .5 -.9 354.919 2.6 -.8
Commodity and service group
All items 3 ................................................................................. 196.787 2.1 .7 205.602 .6 1.0 218.427 .5 .0 Commodities .......................................................................... 179.240 2.4 1.2 182.602 1.9 1.4 173.389 .1 -.3
Commodities less food and beverages ................................ 158.025 3.0 1.5 160.097 2.5 2.0 144.405 -.5 -.7 Nondurables less food and beverages ............................... 212.405 4.1 2.3 192.257 -.1 2.7 181.814 -1.8 -.5 Durables ............................................................................. 108.478 1.6 .3 130.766 6.7 .9 108.047 .9 -1.0
Services .................................................................................. 219.367 1.9 .3 231.634 -.3 .7 265.821 .8 .3
Special aggregate indexes
All items less medical care 3 .................................................... 190.611 1.9 .7 197.666 .1 .7 212.967 .5 .0 All items less shelter ................................................................. 202.811 2.9 .9 213.863 1.7 1.6 201.211 .8 -.2 Commodities less food ............................................................. 158.789 2.9 1.5 164.773 2.5 1.9 148.590 -.4 -.7 Nondurables ............................................................................. 216.968 2.8 1.5 207.165 .4 1.6 205.648 -.3 -.1 Nondurables less food .............................................................. 209.751 4.0 2.3 199.361 .1 2.5 188.131 -1.6 -.5 Services less rent of shelter 6 ................................................... 236.223 3.8 .4 264.940 1.4 1.8 246.801 2.1 -.2 Services less medical care services ......................................... 209.814 1.4 .3 217.377 -1.5 .1 258.430 .7 .2 Energy 3 ................................................................................... 216.988 10.1 .4 223.656 1.3 -1.7 235.025 -.6 -3.8 All items less energy ................................................................ 195.953 1.2 .7 205.850 .5 1.4 218.200 .6 .4
All items less food and energy 3 ............................................. 190.357 1.1 .7 203.021 .5 1.6 217.323 .5 .4
See footnotes at end of table.
66 CPI Detailed Report-September 2010
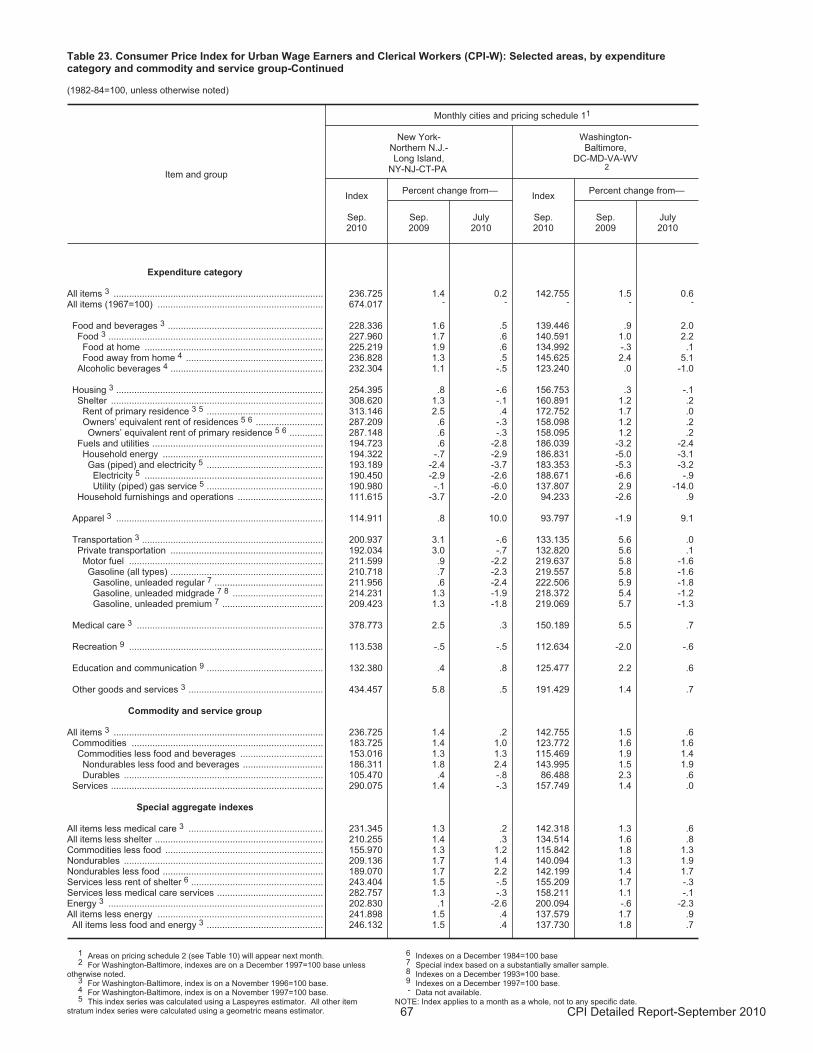
Table 23. Consumer Price Index for Urban Wage Earners and Clerical Workers (CPI-W): Selected areas, by expenditurecategory and commodity and service group-Continued
(1982-84=100, unless otherwise noted)
Item and group
Monthly cities and pricing schedule 11
New York-Northern N.J.-Long Island,
NY-NJ-CT-PA
Washington-Baltimore,
DC-MD-VA-WV2
Index
Sep.2010
Percent change from—Index
Sep.2010
Percent change from—
Sep.2009
July2010
Sep.2009
July2010
Expenditure category
All items 3 ................................................................................. 236.725 1.4 0.2 142.755 1.5 0.6 All items (1967=100) ................................................................ 674.017 - - - - -
Food and beverages 3 ............................................................ 228.336 1.6 .5 139.446 .9 2.0 Food 3 ................................................................................... 227.960 1.7 .6 140.591 1.0 2.2 Food at home ..................................................................... 225.219 1.9 .6 134.992 -.3 .1 Food away from home 4 ..................................................... 236.828 1.3 .5 145.625 2.4 5.1
Alcoholic beverages 4 ........................................................... 232.304 1.1 -.5 123.240 .0 -1.0
Housing 3 ................................................................................ 254.395 .8 -.6 156.753 .3 -.1 Shelter .................................................................................. 308.620 1.3 -.1 160.891 1.2 .2 Rent of primary residence 3 5 ............................................. 313.146 2.5 .4 172.752 1.7 .0 Owners’ equivalent rent of residences 5 6 .......................... 287.209 .6 -.3 158.098 1.2 .2 Owners’ equivalent rent of primary residence 5 6 ............. 287.148 .6 -.3 158.095 1.2 .2
Fuels and utilities .................................................................. 194.723 .6 -2.8 186.039 -3.2 -2.4 Household energy .............................................................. 194.322 -.7 -2.9 186.831 -5.0 -3.1 Gas (piped) and electricity 5 ............................................. 193.189 -2.4 -3.7 183.353 -5.3 -3.2 Electricity 5 ..................................................................... 190.450 -2.9 -2.6 188.671 -6.6 -.9 Utility (piped) gas service 5 ............................................. 190.980 -.1 -6.0 137.807 2.9 -14.0
Household furnishings and operations ................................. 111.615 -3.7 -2.0 94.233 -2.6 .9
Apparel 3 ................................................................................ 114.911 .8 10.0 93.797 -1.9 9.1
Transportation 3 ...................................................................... 200.937 3.1 -.6 133.135 5.6 .0 Private transportation ........................................................... 192.034 3.0 -.7 132.820 5.6 .1
Motor fuel ........................................................................... 211.599 .9 -2.2 219.637 5.8 -1.6 Gasoline (all types) ........................................................... 210.718 .7 -2.3 219.557 5.8 -1.6
Gasoline, unleaded regular 7 .......................................... 211.956 .6 -2.4 222.506 5.9 -1.8 Gasoline, unleaded midgrade 7 8 ................................... 214.231 1.3 -1.9 218.372 5.4 -1.2 Gasoline, unleaded premium 7 ....................................... 209.423 1.3 -1.8 219.069 5.7 -1.3
Medical care 3 ........................................................................ 378.773 2.5 .3 150.189 5.5 .7
Recreation 9 ........................................................................... 113.538 -.5 -.5 112.634 -2.0 -.6
Education and communication 9 ............................................. 132.380 .4 .8 125.477 2.2 .6
Other goods and services 3 .................................................... 434.457 5.8 .5 191.429 1.4 .7
Commodity and service group
All items 3 ................................................................................. 236.725 1.4 .2 142.755 1.5 .6 Commodities .......................................................................... 183.725 1.4 1.0 123.772 1.6 1.6
Commodities less food and beverages ................................ 153.016 1.3 1.3 115.469 1.9 1.4 Nondurables less food and beverages ............................... 186.311 1.8 2.4 143.995 1.5 1.9 Durables ............................................................................. 105.470 .4 -.8 86.488 2.3 .6
Services .................................................................................. 290.075 1.4 -.3 157.749 1.4 .0
Special aggregate indexes
All items less medical care 3 .................................................... 231.345 1.3 .2 142.318 1.3 .6 All items less shelter ................................................................. 210.255 1.4 .3 134.514 1.6 .8 Commodities less food ............................................................. 155.970 1.3 1.2 115.842 1.8 1.3 Nondurables ............................................................................. 209.136 1.7 1.4 140.094 1.3 1.9 Nondurables less food .............................................................. 189.070 1.7 2.2 142.199 1.4 1.7 Services less rent of shelter 6 ................................................... 243.404 1.5 -.5 155.209 1.7 -.3 Services less medical care services ......................................... 282.757 1.3 -.3 158.211 1.1 -.1 Energy 3 ................................................................................... 202.830 .1 -2.6 200.094 -.6 -2.3 All items less energy ................................................................ 241.898 1.5 .4 137.579 1.7 .9
All items less food and energy 3 ............................................. 246.132 1.5 .4 137.730 1.8 .7
1 Areas on pricing schedule 2 (see Table 10) will appear next month. 2 For Washington-Baltimore, indexes are on a December 1997=100 base unless
otherwise noted.3 For Washington-Baltimore, index is on a November 1996=100 base.4 For Washington-Baltimore, index is on a November 1997=100 base.5 This index series was calculated using a Laspeyres estimator. All other item
stratum index series were calculated using a geometric means estimator.
6 Indexes on a December 1984=100 base7 Special index based on a substantially smaller sample.8 Indexes on a December 1993=100 base.9 Indexes on a December 1997=100 base.- Data not available.
NOTE: Index applies to a month as a whole, not to any specific date.
67 CPI Detailed Report-September 2010
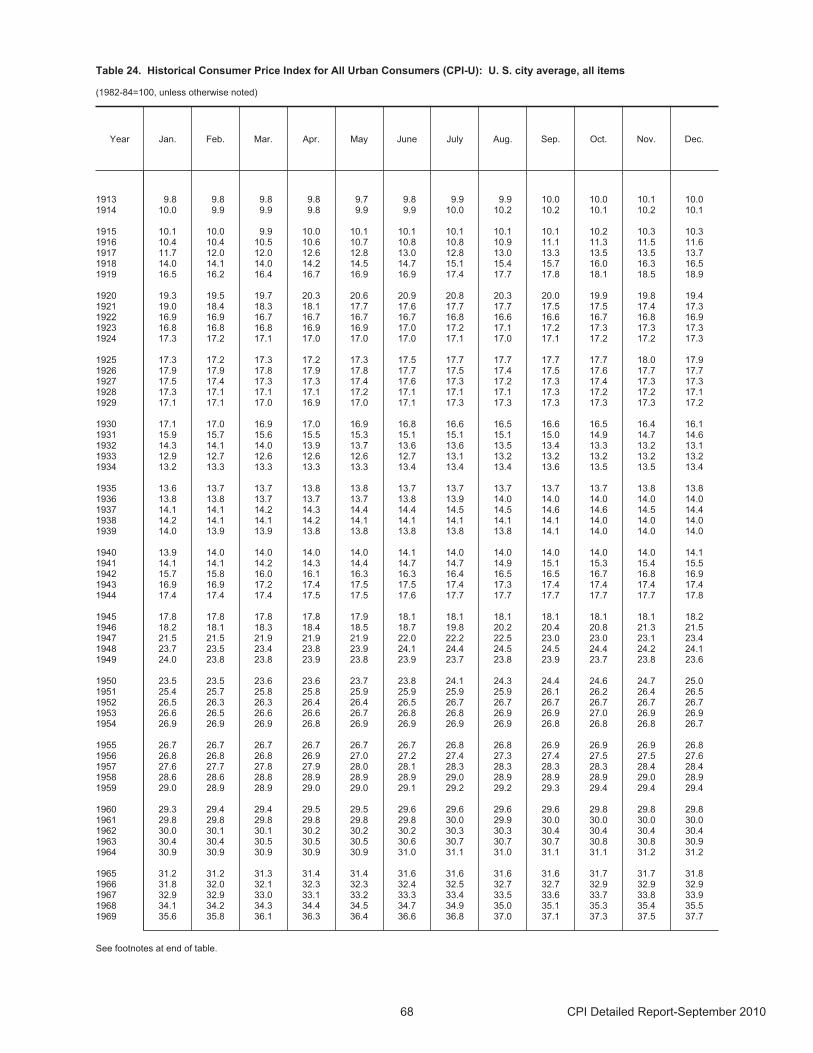
Table 24. Historical Consumer Price Index for All Urban Consumers (CPI-U): U. S. city average, all items
(1982-84=100, unless otherwise noted)
Year Jan. Feb. Mar. Apr. May June July Aug. Sep. Oct. Nov. Dec.
1913 9.8 9.8 9.8 9.8 9.7 9.8 9.9 9.9 10.0 10.0 10.1 10.0 1914 10.0 9.9 9.9 9.8 9.9 9.9 10.0 10.2 10.2 10.1 10.2 10.1
1915 10.1 10.0 9.9 10.0 10.1 10.1 10.1 10.1 10.1 10.2 10.3 10.3 1916 10.4 10.4 10.5 10.6 10.7 10.8 10.8 10.9 11.1 11.3 11.5 11.6 1917 11.7 12.0 12.0 12.6 12.8 13.0 12.8 13.0 13.3 13.5 13.5 13.7 1918 14.0 14.1 14.0 14.2 14.5 14.7 15.1 15.4 15.7 16.0 16.3 16.5 1919 16.5 16.2 16.4 16.7 16.9 16.9 17.4 17.7 17.8 18.1 18.5 18.9
1920 19.3 19.5 19.7 20.3 20.6 20.9 20.8 20.3 20.0 19.9 19.8 19.4 1921 19.0 18.4 18.3 18.1 17.7 17.6 17.7 17.7 17.5 17.5 17.4 17.3 1922 16.9 16.9 16.7 16.7 16.7 16.7 16.8 16.6 16.6 16.7 16.8 16.9 1923 16.8 16.8 16.8 16.9 16.9 17.0 17.2 17.1 17.2 17.3 17.3 17.3 1924 17.3 17.2 17.1 17.0 17.0 17.0 17.1 17.0 17.1 17.2 17.2 17.3
1925 17.3 17.2 17.3 17.2 17.3 17.5 17.7 17.7 17.7 17.7 18.0 17.9 1926 17.9 17.9 17.8 17.9 17.8 17.7 17.5 17.4 17.5 17.6 17.7 17.7 1927 17.5 17.4 17.3 17.3 17.4 17.6 17.3 17.2 17.3 17.4 17.3 17.3 1928 17.3 17.1 17.1 17.1 17.2 17.1 17.1 17.1 17.3 17.2 17.2 17.1 1929 17.1 17.1 17.0 16.9 17.0 17.1 17.3 17.3 17.3 17.3 17.3 17.2
1930 17.1 17.0 16.9 17.0 16.9 16.8 16.6 16.5 16.6 16.5 16.4 16.1 1931 15.9 15.7 15.6 15.5 15.3 15.1 15.1 15.1 15.0 14.9 14.7 14.6 1932 14.3 14.1 14.0 13.9 13.7 13.6 13.6 13.5 13.4 13.3 13.2 13.1 1933 12.9 12.7 12.6 12.6 12.6 12.7 13.1 13.2 13.2 13.2 13.2 13.2 1934 13.2 13.3 13.3 13.3 13.3 13.4 13.4 13.4 13.6 13.5 13.5 13.4
1935 13.6 13.7 13.7 13.8 13.8 13.7 13.7 13.7 13.7 13.7 13.8 13.8 1936 13.8 13.8 13.7 13.7 13.7 13.8 13.9 14.0 14.0 14.0 14.0 14.0 1937 14.1 14.1 14.2 14.3 14.4 14.4 14.5 14.5 14.6 14.6 14.5 14.4 1938 14.2 14.1 14.1 14.2 14.1 14.1 14.1 14.1 14.1 14.0 14.0 14.0 1939 14.0 13.9 13.9 13.8 13.8 13.8 13.8 13.8 14.1 14.0 14.0 14.0
1940 13.9 14.0 14.0 14.0 14.0 14.1 14.0 14.0 14.0 14.0 14.0 14.1 1941 14.1 14.1 14.2 14.3 14.4 14.7 14.7 14.9 15.1 15.3 15.4 15.5 1942 15.7 15.8 16.0 16.1 16.3 16.3 16.4 16.5 16.5 16.7 16.8 16.9 1943 16.9 16.9 17.2 17.4 17.5 17.5 17.4 17.3 17.4 17.4 17.4 17.4 1944 17.4 17.4 17.4 17.5 17.5 17.6 17.7 17.7 17.7 17.7 17.7 17.8
1945 17.8 17.8 17.8 17.8 17.9 18.1 18.1 18.1 18.1 18.1 18.1 18.2 1946 18.2 18.1 18.3 18.4 18.5 18.7 19.8 20.2 20.4 20.8 21.3 21.5 1947 21.5 21.5 21.9 21.9 21.9 22.0 22.2 22.5 23.0 23.0 23.1 23.4 1948 23.7 23.5 23.4 23.8 23.9 24.1 24.4 24.5 24.5 24.4 24.2 24.1 1949 24.0 23.8 23.8 23.9 23.8 23.9 23.7 23.8 23.9 23.7 23.8 23.6
1950 23.5 23.5 23.6 23.6 23.7 23.8 24.1 24.3 24.4 24.6 24.7 25.0 1951 25.4 25.7 25.8 25.8 25.9 25.9 25.9 25.9 26.1 26.2 26.4 26.5 1952 26.5 26.3 26.3 26.4 26.4 26.5 26.7 26.7 26.7 26.7 26.7 26.7 1953 26.6 26.5 26.6 26.6 26.7 26.8 26.8 26.9 26.9 27.0 26.9 26.9 1954 26.9 26.9 26.9 26.8 26.9 26.9 26.9 26.9 26.8 26.8 26.8 26.7
1955 26.7 26.7 26.7 26.7 26.7 26.7 26.8 26.8 26.9 26.9 26.9 26.8 1956 26.8 26.8 26.8 26.9 27.0 27.2 27.4 27.3 27.4 27.5 27.5 27.6 1957 27.6 27.7 27.8 27.9 28.0 28.1 28.3 28.3 28.3 28.3 28.4 28.4 1958 28.6 28.6 28.8 28.9 28.9 28.9 29.0 28.9 28.9 28.9 29.0 28.9 1959 29.0 28.9 28.9 29.0 29.0 29.1 29.2 29.2 29.3 29.4 29.4 29.4
1960 29.3 29.4 29.4 29.5 29.5 29.6 29.6 29.6 29.6 29.8 29.8 29.8 1961 29.8 29.8 29.8 29.8 29.8 29.8 30.0 29.9 30.0 30.0 30.0 30.0 1962 30.0 30.1 30.1 30.2 30.2 30.2 30.3 30.3 30.4 30.4 30.4 30.4 1963 30.4 30.4 30.5 30.5 30.5 30.6 30.7 30.7 30.7 30.8 30.8 30.9 1964 30.9 30.9 30.9 30.9 30.9 31.0 31.1 31.0 31.1 31.1 31.2 31.2
1965 31.2 31.2 31.3 31.4 31.4 31.6 31.6 31.6 31.6 31.7 31.7 31.8 1966 31.8 32.0 32.1 32.3 32.3 32.4 32.5 32.7 32.7 32.9 32.9 32.9 1967 32.9 32.9 33.0 33.1 33.2 33.3 33.4 33.5 33.6 33.7 33.8 33.9 1968 34.1 34.2 34.3 34.4 34.5 34.7 34.9 35.0 35.1 35.3 35.4 35.5 1969 35.6 35.8 36.1 36.3 36.4 36.6 36.8 37.0 37.1 37.3 37.5 37.7
See footnotes at end of table.
68 CPI Detailed Report-September 2010

Table 24. Historical Consumer Price Index for All UrbanConsumers (CPI-U): U. S. city average, allitems-Continued
(1982-84=100, unless otherwise noted)
Year
Semiannualaverages
Annualavg.
Percent changefrom previous
1sthalf
2ndhalf
Dec.Annual
avg.
1913 - - 9.9 - -
1914 - - 10.0 1.0 1.0
1915 - - 10.1 2.0 1.0 1916 - - 10.9 12.6 7.9 1917 - - 12.8 18.1 17.4 1918 - - 15.1 20.4 18.0 1919 - - 17.3 14.5 14.6
1920 - - 20.0 2.6 15.6 1921 - - 17.9 -10.8 -10.5 1922 - - 16.8 -2.3 -6.1 1923 - - 17.1 2.4 1.8 1924 - - 17.1 .0 .0
1925 - - 17.5 3.5 2.3 1926 - - 17.7 -1.1 1.1 1927 - - 17.4 -2.3 -1.7 1928 - - 17.1 -1.2 -1.7 1929 - - 17.1 .6 .0
1930 - - 16.7 -6.4 -2.3 1931 - - 15.2 -9.3 -9.0 1932 - - 13.7 -10.3 -9.9 1933 - - 13.0 .8 -5.1 1934 - - 13.4 1.5 3.1
1935 - - 13.7 3.0 2.2 1936 - - 13.9 1.4 1.5 1937 - - 14.4 2.9 3.6 1938 - - 14.1 -2.8 -2.1 1939 - - 13.9 .0 -1.4
1940 - - 14.0 .7 .7 1941 - - 14.7 9.9 5.0 1942 - - 16.3 9.0 10.9 1943 - - 17.3 3.0 6.1 1944 - - 17.6 2.3 1.7
1945 - - 18.0 2.2 2.3 1946 - - 19.5 18.1 8.3 1947 - - 22.3 8.8 14.4 1948 - - 24.1 3.0 8.1 1949 - - 23.8 -2.1 -1.2
1950 - - 24.1 5.9 1.3 1951 - - 26.0 6.0 7.9 1952 - - 26.5 .8 1.9 1953 - - 26.7 .7 .8 1954 - - 26.9 -.7 .7
1955 - - 26.8 .4 -.4 1956 - - 27.2 3.0 1.5 1957 - - 28.1 2.9 3.3 1958 - - 28.9 1.8 2.8 1959 - - 29.1 1.7 .7
1960 - - 29.6 1.4 1.7 1961 - - 29.9 .7 1.0 1962 - - 30.2 1.3 1.0 1963 - - 30.6 1.6 1.3 1964 - - 31.0 1.0 1.3
1965 - - 31.5 1.9 1.6 1966 - - 32.4 3.5 2.9 1967 - - 33.4 3.0 3.1 1968 - - 34.8 4.7 4.2 1969 - - 36.7 6.2 5.5
See footnotes at end of table.
69 CPI Detailed Report-September 2010
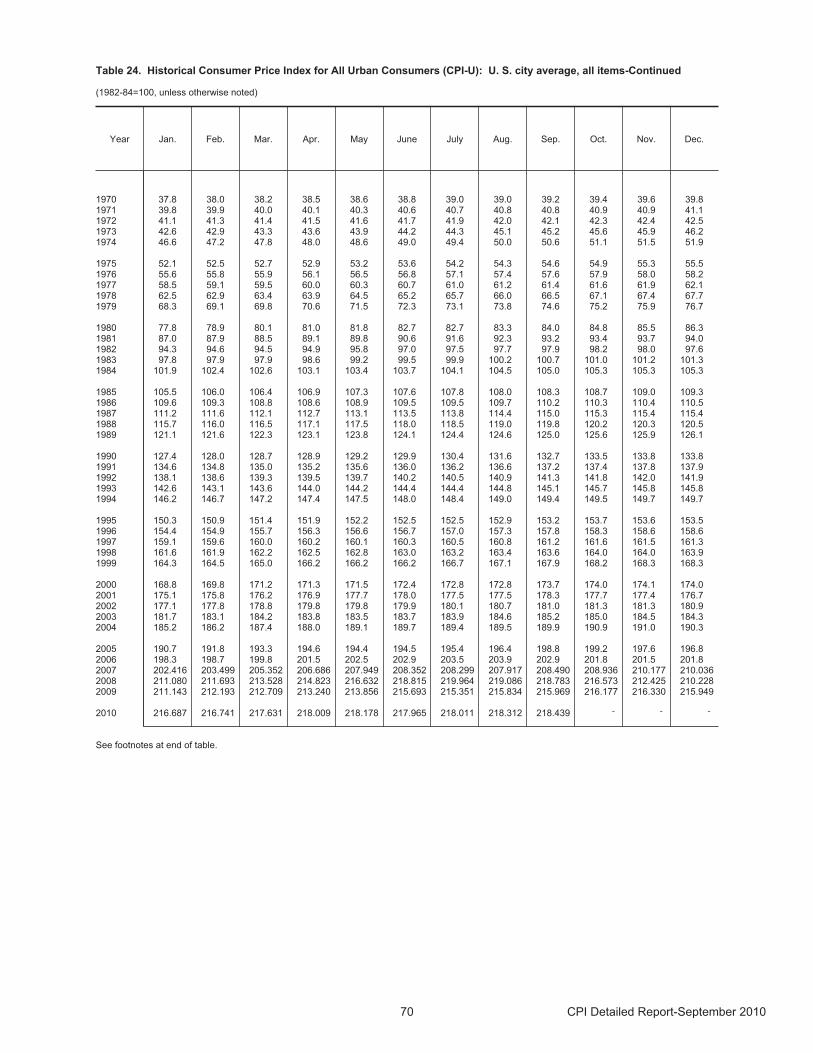
Table 24. Historical Consumer Price Index for All Urban Consumers (CPI-U): U. S. city average, all items-Continued
(1982-84=100, unless otherwise noted)
Year Jan. Feb. Mar. Apr. May June July Aug. Sep. Oct. Nov. Dec.
1970 37.8 38.0 38.2 38.5 38.6 38.8 39.0 39.0 39.2 39.4 39.6 39.8 1971 39.8 39.9 40.0 40.1 40.3 40.6 40.7 40.8 40.8 40.9 40.9 41.1 1972 41.1 41.3 41.4 41.5 41.6 41.7 41.9 42.0 42.1 42.3 42.4 42.5 1973 42.6 42.9 43.3 43.6 43.9 44.2 44.3 45.1 45.2 45.6 45.9 46.2 1974 46.6 47.2 47.8 48.0 48.6 49.0 49.4 50.0 50.6 51.1 51.5 51.9
1975 52.1 52.5 52.7 52.9 53.2 53.6 54.2 54.3 54.6 54.9 55.3 55.5 1976 55.6 55.8 55.9 56.1 56.5 56.8 57.1 57.4 57.6 57.9 58.0 58.2 1977 58.5 59.1 59.5 60.0 60.3 60.7 61.0 61.2 61.4 61.6 61.9 62.1 1978 62.5 62.9 63.4 63.9 64.5 65.2 65.7 66.0 66.5 67.1 67.4 67.7 1979 68.3 69.1 69.8 70.6 71.5 72.3 73.1 73.8 74.6 75.2 75.9 76.7
1980 77.8 78.9 80.1 81.0 81.8 82.7 82.7 83.3 84.0 84.8 85.5 86.3 1981 87.0 87.9 88.5 89.1 89.8 90.6 91.6 92.3 93.2 93.4 93.7 94.0 1982 94.3 94.6 94.5 94.9 95.8 97.0 97.5 97.7 97.9 98.2 98.0 97.6 1983 97.8 97.9 97.9 98.6 99.2 99.5 99.9 100.2 100.7 101.0 101.2 101.3 1984 101.9 102.4 102.6 103.1 103.4 103.7 104.1 104.5 105.0 105.3 105.3 105.3
1985 105.5 106.0 106.4 106.9 107.3 107.6 107.8 108.0 108.3 108.7 109.0 109.3 1986 109.6 109.3 108.8 108.6 108.9 109.5 109.5 109.7 110.2 110.3 110.4 110.5 1987 111.2 111.6 112.1 112.7 113.1 113.5 113.8 114.4 115.0 115.3 115.4 115.4 1988 115.7 116.0 116.5 117.1 117.5 118.0 118.5 119.0 119.8 120.2 120.3 120.5 1989 121.1 121.6 122.3 123.1 123.8 124.1 124.4 124.6 125.0 125.6 125.9 126.1
1990 127.4 128.0 128.7 128.9 129.2 129.9 130.4 131.6 132.7 133.5 133.8 133.8 1991 134.6 134.8 135.0 135.2 135.6 136.0 136.2 136.6 137.2 137.4 137.8 137.9 1992 138.1 138.6 139.3 139.5 139.7 140.2 140.5 140.9 141.3 141.8 142.0 141.9 1993 142.6 143.1 143.6 144.0 144.2 144.4 144.4 144.8 145.1 145.7 145.8 145.8 1994 146.2 146.7 147.2 147.4 147.5 148.0 148.4 149.0 149.4 149.5 149.7 149.7
1995 150.3 150.9 151.4 151.9 152.2 152.5 152.5 152.9 153.2 153.7 153.6 153.5 1996 154.4 154.9 155.7 156.3 156.6 156.7 157.0 157.3 157.8 158.3 158.6 158.6 1997 159.1 159.6 160.0 160.2 160.1 160.3 160.5 160.8 161.2 161.6 161.5 161.3 1998 161.6 161.9 162.2 162.5 162.8 163.0 163.2 163.4 163.6 164.0 164.0 163.9 1999 164.3 164.5 165.0 166.2 166.2 166.2 166.7 167.1 167.9 168.2 168.3 168.3
2000 168.8 169.8 171.2 171.3 171.5 172.4 172.8 172.8 173.7 174.0 174.1 174.0 2001 175.1 175.8 176.2 176.9 177.7 178.0 177.5 177.5 178.3 177.7 177.4 176.7 2002 177.1 177.8 178.8 179.8 179.8 179.9 180.1 180.7 181.0 181.3 181.3 180.9 2003 181.7 183.1 184.2 183.8 183.5 183.7 183.9 184.6 185.2 185.0 184.5 184.3 2004 185.2 186.2 187.4 188.0 189.1 189.7 189.4 189.5 189.9 190.9 191.0 190.3
2005 190.7 191.8 193.3 194.6 194.4 194.5 195.4 196.4 198.8 199.2 197.6 196.8 2006 198.3 198.7 199.8 201.5 202.5 202.9 203.5 203.9 202.9 201.8 201.5 201.8 2007 202.416 203.499 205.352 206.686 207.949 208.352 208.299 207.917 208.490 208.936 210.177 210.0362008 211.080 211.693 213.528 214.823 216.632 218.815 219.964 219.086 218.783 216.573 212.425 210.2282009 211.143 212.193 212.709 213.240 213.856 215.693 215.351 215.834 215.969 216.177 216.330 215.949
2010 216.687 216.741 217.631 218.009 218.178 217.965 218.011 218.312 218.439 - - -
See footnotes at end of table.
70 CPI Detailed Report-September 2010
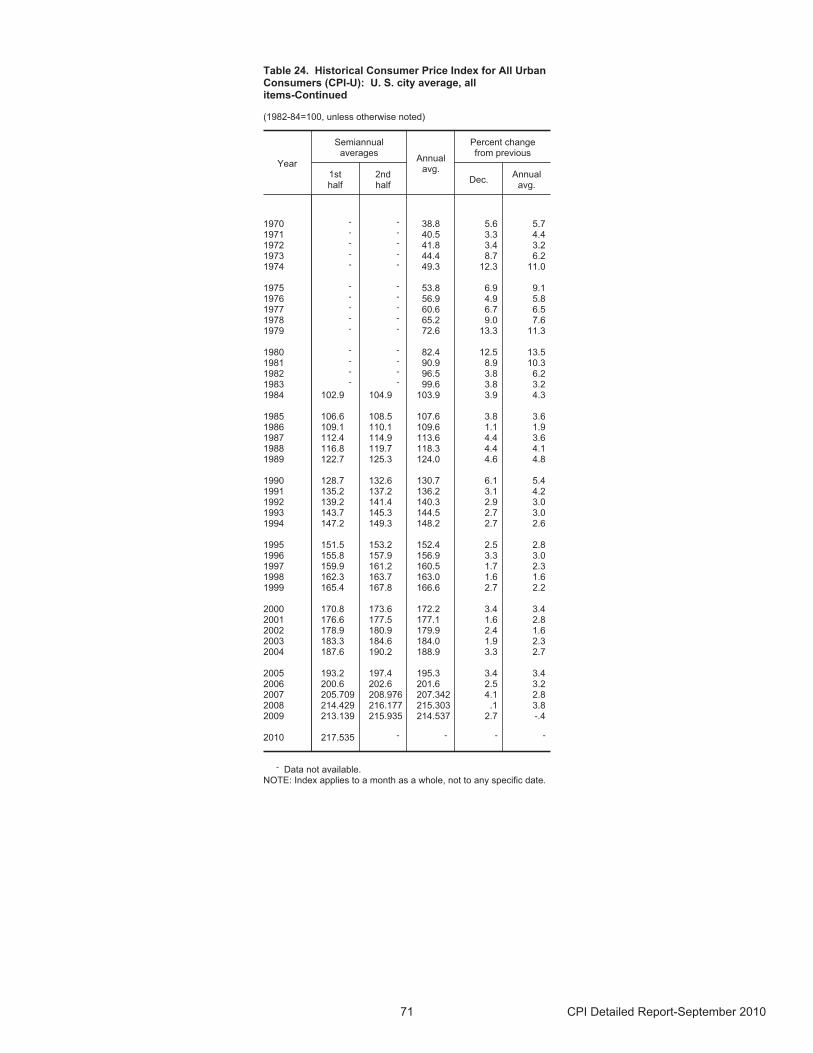
Table 24. Historical Consumer Price Index for All UrbanConsumers (CPI-U): U. S. city average, allitems-Continued
(1982-84=100, unless otherwise noted)
Year
Semiannualaverages
Annualavg.
Percent changefrom previous
1sthalf
2ndhalf
Dec.Annual
avg.
1970 - - 38.8 5.6 5.7 1971 - - 40.5 3.3 4.4 1972 - - 41.8 3.4 3.2 1973 - - 44.4 8.7 6.2 1974 - - 49.3 12.3 11.0
1975 - - 53.8 6.9 9.1 1976 - - 56.9 4.9 5.8 1977 - - 60.6 6.7 6.5 1978 - - 65.2 9.0 7.6 1979 - - 72.6 13.3 11.3
1980 - - 82.4 12.5 13.5 1981 - - 90.9 8.9 10.3 1982 - - 96.5 3.8 6.2 1983 - - 99.6 3.8 3.2 1984 102.9 104.9 103.9 3.9 4.3
1985 106.6 108.5 107.6 3.8 3.6 1986 109.1 110.1 109.6 1.1 1.9 1987 112.4 114.9 113.6 4.4 3.6 1988 116.8 119.7 118.3 4.4 4.1 1989 122.7 125.3 124.0 4.6 4.8
1990 128.7 132.6 130.7 6.1 5.4 1991 135.2 137.2 136.2 3.1 4.2 1992 139.2 141.4 140.3 2.9 3.0 1993 143.7 145.3 144.5 2.7 3.0 1994 147.2 149.3 148.2 2.7 2.6
1995 151.5 153.2 152.4 2.5 2.8 1996 155.8 157.9 156.9 3.3 3.0 1997 159.9 161.2 160.5 1.7 2.3 1998 162.3 163.7 163.0 1.6 1.6 1999 165.4 167.8 166.6 2.7 2.2
2000 170.8 173.6 172.2 3.4 3.4 2001 176.6 177.5 177.1 1.6 2.8 2002 178.9 180.9 179.9 2.4 1.6 2003 183.3 184.6 184.0 1.9 2.3 2004 187.6 190.2 188.9 3.3 2.7
2005 193.2 197.4 195.3 3.4 3.4 2006 200.6 202.6 201.6 2.5 3.2 2007 205.709 208.976 207.342 4.1 2.8 2008 214.429 216.177 215.303 .1 3.8 2009 213.139 215.935 214.537 2.7 -.4
2010 217.535 - - - -
- Data not available.NOTE: Index applies to a month as a whole, not to any specific date.
71 CPI Detailed Report-September 2010
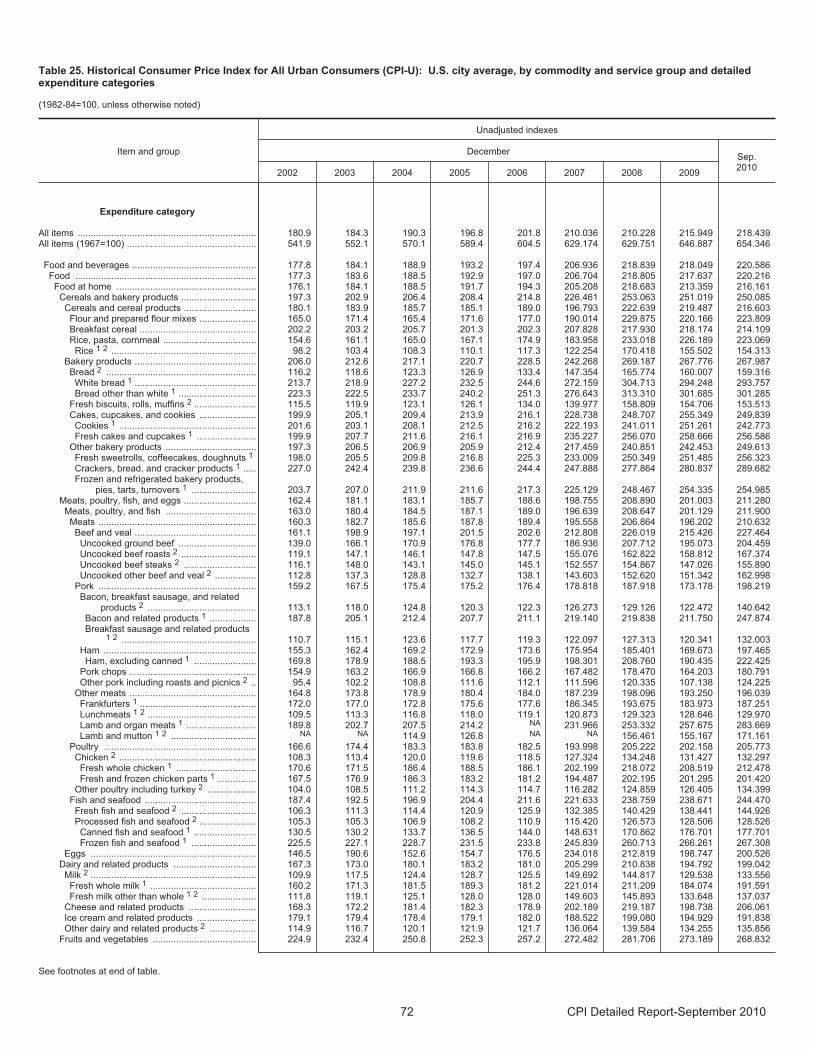
Table 25. Historical Consumer Price Index for All Urban Consumers (CPI-U): U.S. city average, by commodity and service group and detailedexpenditure categories
(1982-84=100, unless otherwise noted)
Item and group
Unadjusted indexes
DecemberSep.2010
2002 2003 2004 2005 2006 2007 2008 2009
Expenditure category
All items ..................................................................... 180.9 184.3 190.3 196.8 201.8 210.036 210.228 215.949 218.439 All items (1967=100) .................................................. 541.9 552.1 570.1 589.4 604.5 629.174 629.751 646.887 654.346
Food and beverages ................................................ 177.8 184.1 188.9 193.2 197.4 206.936 218.839 218.049 220.586 Food ...................................................................... 177.3 183.6 188.5 192.9 197.0 206.704 218.805 217.637 220.216
Food at home ...................................................... 176.1 184.1 188.5 191.7 194.3 205.208 218.683 213.359 216.161 Cereals and bakery products ............................. 197.3 202.9 206.4 208.4 214.8 226.461 253.063 251.019 250.085
Cereals and cereal products ............................ 180.1 183.9 185.7 185.1 189.0 196.793 222.639 219.487 216.603 Flour and prepared flour mixes ...................... 165.0 171.4 165.4 171.6 177.0 190.014 229.875 220.166 223.809 Breakfast cereal ............................................. 202.2 203.2 205.7 201.3 202.3 207.828 217.930 218.174 214.109 Rice, pasta, cornmeal .................................... 154.6 161.1 165.0 167.1 174.9 183.958 233.018 226.189 223.069 Rice 1 2 ........................................................ 98.2 103.4 108.3 110.1 117.3 122.254 170.418 155.502 154.313
Bakery products ............................................... 206.0 212.6 217.1 220.7 228.5 242.268 269.187 267.776 267.987 Bread 2 .......................................................... 116.2 118.6 123.3 126.9 133.4 147.354 165.774 160.007 159.316 White bread 1 ............................................... 213.7 218.9 227.2 232.5 244.6 272.159 304.713 294.248 293.757 Bread other than white 1 .............................. 223.3 222.5 233.7 240.2 251.3 276.643 313.310 301.685 301.285
Fresh biscuits, rolls, muffins 2 ........................ 115.5 119.9 123.1 126.1 134.0 139.977 158.809 154.706 153.513 Cakes, cupcakes, and cookies ...................... 199.9 205.1 209.4 213.9 216.1 228.738 248.707 255.349 249.839 Cookies 1 ..................................................... 201.6 203.1 208.1 212.5 216.2 222.193 241.011 251.261 242.773 Fresh cakes and cupcakes 1 ....................... 199.9 207.7 211.6 216.1 216.9 235.227 256.070 258.666 256.586
Other bakery products ................................... 197.3 206.5 206.9 205.9 212.4 217.459 240.851 242.453 249.613 Fresh sweetrolls, coffeecakes, doughnuts 1 198.0 205.5 209.8 216.8 225.3 233.009 250.349 251.485 256.323 Crackers, bread, and cracker products 1 ..... 227.0 242.4 239.8 236.6 244.4 247.888 277.864 280.837 289.682 Frozen and refrigerated bakery products,
pies, tarts, turnovers 1 ......................... 203.7 207.0 211.9 211.6 217.3 225.129 248.467 254.335 254.985 Meats, poultry, fish, and eggs ............................ 162.4 181.1 183.1 185.7 188.6 198.755 208.890 201.003 211.280
Meats, poultry, and fish ................................... 163.0 180.4 184.5 187.1 189.0 196.639 208.647 201.129 211.900 Meats ............................................................. 160.3 182.7 185.6 187.8 189.4 195.558 206.864 196.202 210.632Beef and veal ............................................... 161.1 198.9 197.1 201.5 202.6 212.808 226.019 215.426 227.464
Uncooked ground beef .............................. 139.0 166.1 170.9 176.8 177.7 186.936 207.712 195.073 204.459 Uncooked beef roasts 2 ............................. 119.1 147.1 146.1 147.8 147.5 155.076 162.822 158.812 167.374 Uncooked beef steaks 2 ............................ 116.1 148.0 143.1 145.0 145.1 152.557 154.867 147.026 155.890 Uncooked other beef and veal 2 ................ 112.8 137.3 128.8 132.7 138.1 143.603 152.620 151.342 162.998
Pork ............................................................. 159.2 167.5 175.4 175.2 176.4 178.818 187.918 173.178 198.219 Bacon, breakfast sausage, and related
products 2 .......................................... 113.1 118.0 124.8 120.3 122.3 126.273 129.126 122.472 140.642 Bacon and related products 1 .................. 187.8 205.1 212.4 207.7 211.1 219.140 219.838 211.750 247.874 Breakfast sausage and related products
1 2 .................................................... 110.7 115.1 123.6 117.7 119.3 122.097 127.313 120.341 132.003 Ham ........................................................... 155.3 162.4 169.2 172.9 173.6 175.954 185.401 169.673 197.465
Ham, excluding canned 1 ........................ 169.8 178.9 188.5 193.3 195.9 198.301 208.760 190.435 222.425 Pork chops ................................................. 154.9 163.2 166.9 166.8 166.2 167.482 178.470 164.203 180.791 Other pork including roasts and picnics 2 .. 95.4 102.2 108.8 111.6 112.1 111.596 120.335 107.138 124.225
Other meats ................................................. 164.8 173.8 178.9 180.4 184.0 187.239 198.096 193.250 196.039 Frankfurters 1 ............................................. 172.0 177.0 172.8 175.6 177.6 186.345 193.675 183.973 187.251 Lunchmeats 1 2 .......................................... 109.5 113.3 116.8 118.0 119.1 120.873 129.323 128.646 129.970 Lamb and organ meats 1 ........................... 189.8 202.7 207.5 214.2 NA 231.966 253.332 257.675 283.669 Lamb and mutton 1 2 ................................. NA NA 114.9 126.8 NA NA 156.461 155.167 171.161
Poultry ........................................................... 166.6 174.4 183.3 183.8 182.5 193.998 205.222 202.158 205.773Chicken 2 ..................................................... 108.3 113.4 120.0 119.6 118.5 127.324 134.248 131.427 132.297
Fresh whole chicken 1 ............................... 170.6 171.5 186.4 188.5 186.1 202.199 218.072 208.519 212.478 Fresh and frozen chicken parts 1 ............... 167.5 176.9 186.3 183.2 181.2 194.487 202.195 201.295 201.420
Other poultry including turkey 2 ................... 104.0 108.5 111.2 114.3 114.7 116.282 124.859 126.405 134.399 Fish and seafood ........................................... 187.4 192.5 196.9 204.4 211.6 221.633 238.759 238.671 244.470 Fresh fish and seafood 2 ............................. 106.3 111.3 114.4 120.9 125.9 132.385 140.429 138.441 144.926 Processed fish and seafood 2 ...................... 105.3 105.3 106.9 108.2 110.9 115.420 126.573 128.506 128.526 Canned fish and seafood 1 ........................ 130.5 130.2 133.7 136.5 144.0 148.631 170.862 176.701 177.701 Frozen fish and seafood 1 ......................... 225.5 227.1 228.7 231.5 233.8 245.839 260.713 266.261 267.308
Eggs ................................................................ 146.5 190.6 152.6 154.7 176.5 234.018 212.819 198.747 200.526Dairy and related products ................................ 167.3 173.0 180.1 183.2 181.0 205.299 210.838 194.792 199.042
Milk 2 ................................................................ 109.9 117.5 124.4 128.7 125.5 149.692 144.817 129.538 133.556 Fresh whole milk 1 ......................................... 160.2 171.3 181.5 189.3 181.2 221.014 211.209 184.074 191.591 Fresh milk other than whole 1 2 ..................... 111.8 119.1 125.1 128.0 128.0 149.603 145.893 133.648 137.037
Cheese and related products .......................... 168.3 172.2 181.4 182.3 178.9 202.189 219.187 198.738 206.061 Ice cream and related products ....................... 179.1 179.4 178.4 179.1 182.0 188.522 199.080 194.929 191.838 Other dairy and related products 2 .................. 114.9 116.7 120.1 121.9 121.7 136.064 139.584 134.255 135.856
Fruits and vegetables ........................................ 224.9 232.4 250.8 252.3 257.2 272.482 281.706 273.189 268.832
See footnotes at end of table.
72 CPI Detailed Report-September 2010
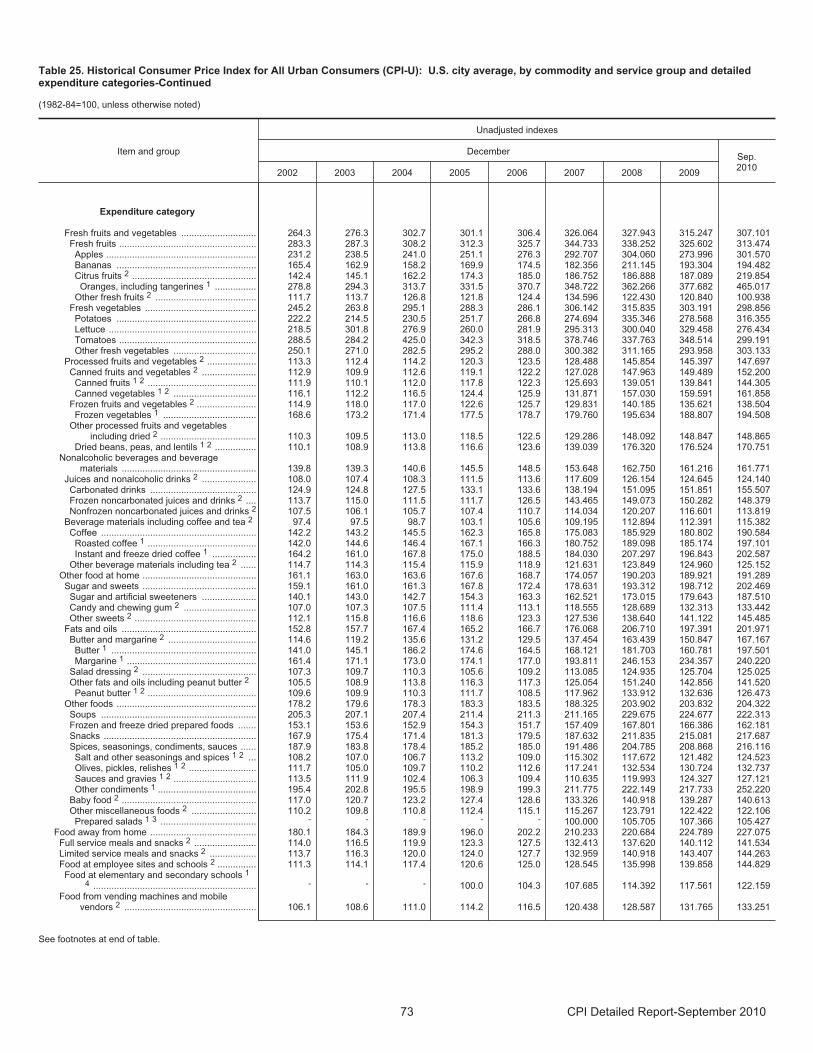
Table 25. Historical Consumer Price Index for All Urban Consumers (CPI-U): U.S. city average, by commodity and service group and detailedexpenditure categories-Continued
(1982-84=100, unless otherwise noted)
Item and group
Unadjusted indexes
DecemberSep.2010
2002 2003 2004 2005 2006 2007 2008 2009
Expenditure category
Fresh fruits and vegetables ............................. 264.3 276.3 302.7 301.1 306.4 326.064 327.943 315.247 307.101 Fresh fruits ..................................................... 283.3 287.3 308.2 312.3 325.7 344.733 338.252 325.602 313.474 Apples .......................................................... 231.2 238.5 241.0 251.1 276.3 292.707 304.060 273.996 301.570 Bananas ...................................................... 165.4 162.9 158.2 169.9 174.5 182.356 211.145 193.304 194.482 Citrus fruits 2 ................................................ 142.4 145.1 162.2 174.3 185.0 186.752 186.888 187.089 219.854 Oranges, including tangerines 1 ................ 278.8 294.3 313.7 331.5 370.7 348.722 362.266 377.682 465.017
Other fresh fruits 2 ....................................... 111.7 113.7 126.8 121.8 124.4 134.596 122.430 120.840 100.938 Fresh vegetables ........................................... 245.2 263.8 295.1 288.3 286.1 306.142 315.835 303.191 298.856 Potatoes ...................................................... 222.2 214.5 230.5 251.7 266.8 274.694 335.346 278.568 316.355 Lettuce ......................................................... 218.5 301.8 276.9 260.0 281.9 295.313 300.040 329.458 276.434 Tomatoes ..................................................... 288.5 284.2 425.0 342.3 318.5 378.746 337.763 348.514 299.191 Other fresh vegetables ................................ 250.1 271.0 282.5 295.2 288.0 300.382 311.165 293.958 303.133
Processed fruits and vegetables 2 ................... 113.3 112.4 114.2 120.3 123.5 128.488 145.854 145.397 147.697 Canned fruits and vegetables 2 ..................... 112.9 109.9 112.6 119.1 122.2 127.028 147.963 149.489 152.200 Canned fruits 1 2 .......................................... 111.9 110.1 112.0 117.8 122.3 125.693 139.051 139.841 144.305 Canned vegetables 1 2 ................................ 116.1 112.2 116.5 124.4 125.9 131.871 157.030 159.591 161.858
Frozen fruits and vegetables 2 ....................... 114.9 118.0 117.0 122.6 125.7 129.831 140.185 135.621 138.504 Frozen vegetables 1 .................................... 168.6 173.2 171.4 177.5 178.7 179.760 195.634 188.807 194.508
Other processed fruits and vegetablesincluding dried 2 ..................................... 110.3 109.5 113.0 118.5 122.5 129.286 148.092 148.847 148.865
Dried beans, peas, and lentils 1 2 ................ 110.1 108.9 113.8 116.6 123.6 139.039 176.320 176.524 170.751 Nonalcoholic beverages and beverage
materials .................................................... 139.8 139.3 140.6 145.5 148.5 153.648 162.750 161.216 161.771 Juices and nonalcoholic drinks 2 ..................... 108.0 107.4 108.3 111.5 113.6 117.609 126.154 124.645 124.140
Carbonated drinks ......................................... 124.9 124.8 127.5 133.1 133.6 138.194 151.095 151.851 155.507 Frozen noncarbonated juices and drinks 2 .... 113.7 115.0 111.5 111.7 126.5 143.465 149.073 150.282 148.379 Nonfrozen noncarbonated juices and drinks 2 107.5 106.1 105.7 107.4 110.7 114.034 120.207 116.601 113.819
Beverage materials including coffee and tea 2 97.4 97.5 98.7 103.1 105.6 109.195 112.894 112.391 115.382 Coffee ............................................................ 142.2 143.2 145.5 162.3 165.8 175.083 185.929 180.802 190.584Roasted coffee 1 .......................................... 142.0 144.6 146.4 167.1 166.3 180.752 189.098 185.174 197.101 Instant and freeze dried coffee 1 ................. 164.2 161.0 167.8 175.0 188.5 184.030 207.297 196.843 202.587
Other beverage materials including tea 2 ...... 114.7 114.3 115.4 115.9 118.9 121.631 123.849 124.960 125.152 Other food at home ............................................ 161.1 163.0 163.6 167.6 168.7 174.057 190.203 189.921 191.289 Sugar and sweets ............................................ 159.1 161.0 161.3 167.8 172.4 178.631 193.312 198.712 202.469
Sugar and artificial sweeteners ..................... 140.1 143.0 142.7 154.3 163.3 162.521 173.015 179.643 187.510 Candy and chewing gum 2 ............................ 107.0 107.3 107.5 111.4 113.1 118.555 128.689 132.313 133.442 Other sweets 2 ............................................... 112.1 115.8 116.6 118.6 123.3 127.536 138.640 141.122 145.485
Fats and oils .................................................... 152.8 157.7 167.4 165.2 166.7 176.068 206.710 197.391 201.971 Butter and margarine 2 .................................. 114.6 119.2 135.6 131.2 129.5 137.454 163.439 150.847 167.167 Butter 1 ........................................................ 141.0 145.1 186.2 174.6 164.5 168.121 181.703 160.781 197.501 Margarine 1 .................................................. 161.4 171.1 173.0 174.1 177.0 193.811 246.153 234.357 240.220
Salad dressing 2 ............................................ 107.3 109.7 110.3 105.6 109.2 113.085 124.935 125.704 125.025 Other fats and oils including peanut butter 2 105.5 108.9 113.8 116.3 117.3 125.054 151.240 142.856 141.520 Peanut butter 1 2 .......................................... 109.6 109.9 110.3 111.7 108.5 117.962 133.912 132.636 126.473
Other foods ...................................................... 178.2 179.6 178.3 183.3 183.5 188.325 203.902 203.832 204.322 Soups ............................................................ 205.3 207.1 207.4 211.4 211.3 211.165 229.675 224.677 222.313 Frozen and freeze dried prepared foods ....... 153.1 153.6 152.9 154.3 151.7 157.409 167.801 166.386 162.181 Snacks ........................................................... 167.9 175.4 171.4 181.3 179.5 187.632 211.835 215.081 217.687 Spices, seasonings, condiments, sauces ...... 187.9 183.8 178.4 185.2 185.0 191.486 204.785 208.868 216.116 Salt and other seasonings and spices 1 2 ... 108.2 107.0 106.7 113.2 109.0 115.302 117.672 121.482 124.523 Olives, pickles, relishes 1 2 .......................... 111.7 105.0 109.7 110.2 112.6 117.241 132.534 130.724 132.737 Sauces and gravies 1 2 ................................ 113.5 111.9 102.4 106.3 109.4 110.635 119.993 124.327 127.121 Other condiments 1 ...................................... 195.4 202.8 195.5 198.9 199.3 211.775 222.149 217.733 252.220
Baby food 2 .................................................... 117.0 120.7 123.2 127.4 128.6 133.326 140.918 139.287 140.613 Other miscellaneous foods 2 ......................... 110.2 109.8 110.8 112.4 115.1 115.267 123.791 122.422 122.106 Prepared salads 1 3 ..................................... - - - - - 100.000 105.705 107.366 105.427
Food away from home ......................................... 180.1 184.3 189.9 196.0 202.2 210.233 220.684 224.789 227.075 Full service meals and snacks 2 ........................ 114.0 116.5 119.9 123.3 127.5 132.413 137.620 140.112 141.534 Limited service meals and snacks 2 .................. 113.7 116.3 120.0 124.0 127.7 132.959 140.918 143.407 144.263 Food at employee sites and schools 2 ............... 111.3 114.1 117.4 120.6 125.0 128.545 135.998 139.858 144.829 Food at elementary and secondary schools 1
4 ............................................................... - - - 100.0 104.3 107.685 114.392 117.561 122.159 Food from vending machines and mobile
vendors 2 ................................................... 106.1 108.6 111.0 114.2 116.5 120.438 128.587 131.765 133.251
See footnotes at end of table.
73 CPI Detailed Report-September 2010
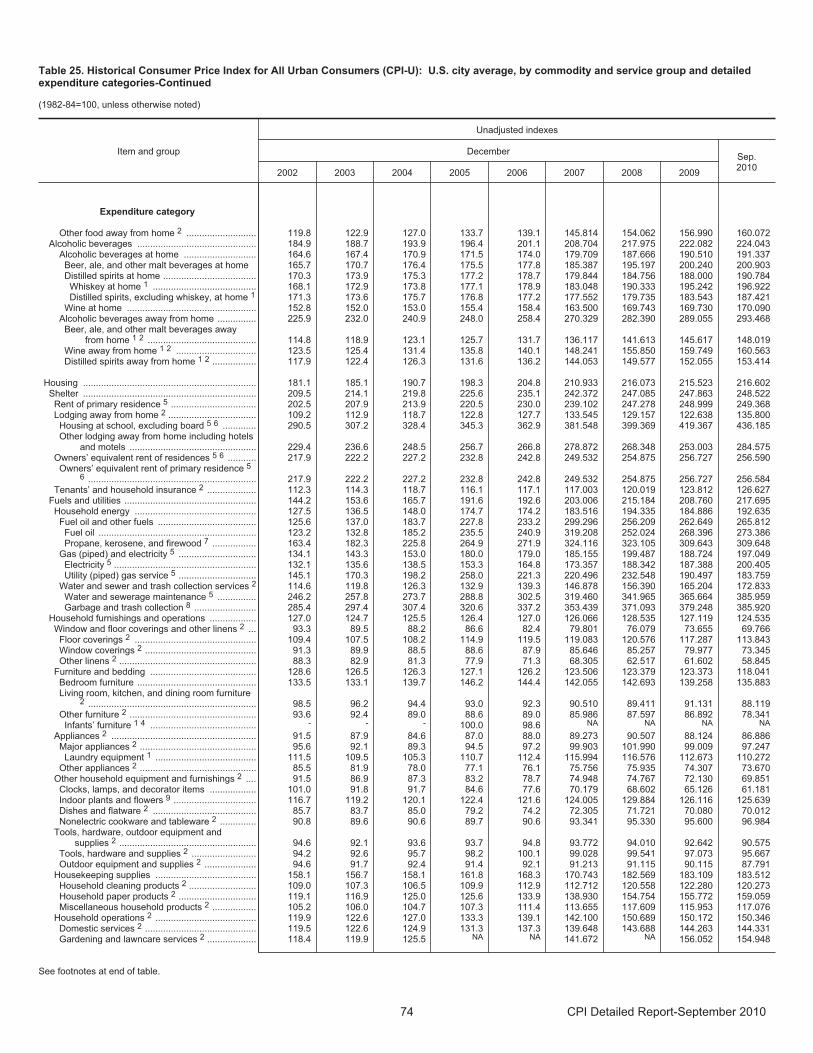
Table 25. Historical Consumer Price Index for All Urban Consumers (CPI-U): U.S. city average, by commodity and service group and detailedexpenditure categories-Continued
(1982-84=100, unless otherwise noted)
Item and group
Unadjusted indexes
DecemberSep.2010
2002 2003 2004 2005 2006 2007 2008 2009
Expenditure category
Other food away from home 2 ........................... 119.8 122.9 127.0 133.7 139.1 145.814 154.062 156.990 160.072 Alcoholic beverages .............................................. 184.9 188.7 193.9 196.4 201.1 208.704 217.975 222.082 224.043
Alcoholic beverages at home ............................ 164.6 167.4 170.9 171.5 174.0 179.709 187.666 190.510 191.337 Beer, ale, and other malt beverages at home 165.7 170.7 176.4 175.5 177.8 185.387 195.197 200.240 200.903 Distilled spirits at home .................................... 170.3 173.9 175.3 177.2 178.7 179.844 184.756 188.000 190.784
Whiskey at home 1 ........................................ 168.1 172.9 173.8 177.1 178.9 183.048 190.333 195.242 196.922 Distilled spirits, excluding whiskey, at home 1 171.3 173.6 175.7 176.8 177.2 177.552 179.735 183.543 187.421
Wine at home .................................................. 152.8 152.0 153.0 155.4 158.4 163.500 169.743 169.730 170.090 Alcoholic beverages away from home ............... 225.9 232.0 240.9 248.0 258.4 270.329 282.390 289.055 293.468
Beer, ale, and other malt beverages awayfrom home 1 2 .......................................... 114.8 118.9 123.1 125.7 131.7 136.117 141.613 145.617 148.019
Wine away from home 1 2 ............................... 123.5 125.4 131.4 135.8 140.1 148.241 155.850 159.749 160.563 Distilled spirits away from home 1 2 ................. 117.9 122.4 126.3 131.6 136.2 144.053 149.577 152.055 153.414
Housing ................................................................... 181.1 185.1 190.7 198.3 204.8 210.933 216.073 215.523 216.602 Shelter ................................................................... 209.5 214.1 219.8 225.6 235.1 242.372 247.085 247.863 248.522
Rent of primary residence 5 ................................. 202.5 207.9 213.9 220.5 230.0 239.102 247.278 248.999 249.368 Lodging away from home 2 .................................. 109.2 112.9 118.7 122.8 127.7 133.545 129.157 122.638 135.800 Housing at school, excluding board 5 6 ............. 290.5 307.2 328.4 345.3 362.9 381.548 399.369 419.367 436.185 Other lodging away from home including hotels
and motels ................................................. 229.4 236.6 248.5 256.7 266.8 278.872 268.348 253.003 284.575 Owners’ equivalent rent of residences 5 6 ........... 217.9 222.2 227.2 232.8 242.8 249.532 254.875 256.727 256.590
Owners’ equivalent rent of primary residence 56 ................................................................. 217.9 222.2 227.2 232.8 242.8 249.532 254.875 256.727 256.584
Tenants’ and household insurance 2 ................... 112.3 114.3 118.7 116.1 117.1 117.003 120.019 123.812 126.627 Fuels and utilities ................................................... 144.2 153.6 165.7 191.6 192.6 203.006 215.184 208.760 217.695
Household energy ............................................... 127.5 136.5 148.0 174.7 174.2 183.516 194.335 184.886 192.635 Fuel oil and other fuels ...................................... 125.6 137.0 183.7 227.8 233.2 299.296 256.209 262.649 265.812
Fuel oil ............................................................. 123.2 132.8 185.2 235.5 240.9 319.208 252.024 268.396 273.386Propane, kerosene, and firewood 7 ................. 163.4 182.3 225.8 264.9 271.9 324.116 323.105 309.643 309.648
Gas (piped) and electricity 5 .............................. 134.1 143.3 153.0 180.0 179.0 185.155 199.487 188.724 197.049 Electricity 5 ....................................................... 132.1 135.6 138.5 153.3 164.8 173.357 188.342 187.388 200.405 Utility (piped) gas service 5 .............................. 145.1 170.3 198.2 258.0 221.3 220.496 232.548 190.497 183.759
Water and sewer and trash collection services 2 114.6 119.8 126.3 132.9 139.3 146.878 156.390 165.204 172.833 Water and sewerage maintenance 5 ............... 246.2 257.8 273.7 288.8 302.5 319.460 341.965 365.664 385.959 Garbage and trash collection 8 ........................ 285.4 297.4 307.4 320.6 337.2 353.439 371.093 379.248 385.920
Household furnishings and operations .................. 127.0 124.7 125.5 126.4 127.0 126.066 128.535 127.119 124.535 Window and floor coverings and other linens 2 ... 93.3 89.5 88.2 86.6 82.4 79.801 76.079 73.655 69.766 Floor coverings 2 ............................................... 109.4 107.5 108.2 114.9 119.5 119.083 120.576 117.287 113.843 Window coverings 2 ........................................... 91.3 89.9 88.5 88.6 87.9 85.646 85.257 79.977 73.345 Other linens 2 ..................................................... 88.3 82.9 81.3 77.9 71.3 68.305 62.517 61.602 58.845
Furniture and bedding ......................................... 128.6 126.5 126.3 127.1 126.2 123.506 123.379 123.373 118.041 Bedroom furniture .............................................. 133.5 133.1 139.7 146.2 144.4 142.055 142.693 139.258 135.883 Living room, kitchen, and dining room furniture
2 ................................................................. 98.5 96.2 94.4 93.0 92.3 90.510 89.411 91.131 88.119 Other furniture 2 ................................................. 93.6 92.4 89.0 88.6 89.0 85.986 87.597 86.892 78.341 Infants’ furniture 1 4 ......................................... - - - 100.0 98.6 NA NA NA NA
Appliances 2 ........................................................ 91.5 87.9 84.6 87.0 88.0 89.273 90.507 88.124 86.886 Major appliances 2 ............................................. 95.6 92.1 89.3 94.5 97.2 99.903 101.990 99.009 97.247 Laundry equipment 1 ....................................... 111.5 109.5 105.3 110.7 112.4 115.994 116.576 112.673 110.272
Other appliances 2 ............................................. 85.5 81.9 78.0 77.1 76.1 75.756 75.935 74.307 73.670 Other household equipment and furnishings 2 .... 91.5 86.9 87.3 83.2 78.7 74.948 74.767 72.130 69.851
Clocks, lamps, and decorator items .................. 101.0 91.8 91.7 84.6 77.6 70.179 68.602 65.126 61.181 Indoor plants and flowers 9 ................................ 116.7 119.2 120.1 122.4 121.6 124.005 129.884 126.116 125.639 Dishes and flatware 2 ........................................ 85.7 83.7 85.0 79.2 74.2 72.305 71.721 70.080 70.012 Nonelectric cookware and tableware 2 .............. 90.8 89.6 90.6 89.7 90.6 93.341 95.330 95.600 96.984
Tools, hardware, outdoor equipment andsupplies 2 ..................................................... 94.6 92.1 93.6 93.7 94.8 93.772 94.010 92.642 90.575
Tools, hardware and supplies 2 ......................... 94.2 92.6 95.7 98.2 100.1 99.028 99.541 97.073 95.667 Outdoor equipment and supplies 2 .................... 94.6 91.7 92.4 91.4 92.1 91.213 91.115 90.115 87.791
Housekeeping supplies ....................................... 158.1 156.7 158.1 161.8 168.3 170.743 182.569 183.109 183.512 Household cleaning products 2 .......................... 109.0 107.3 106.5 109.9 112.9 112.712 120.558 122.280 120.273 Household paper products 2 .............................. 119.1 116.9 125.0 125.6 133.9 138.930 154.754 155.772 159.059 Miscellaneous household products 2 ................. 105.2 106.0 104.7 107.3 111.4 113.655 117.609 115.953 117.076
Household operations 2 ....................................... 119.9 122.6 127.0 133.3 139.1 142.100 150.689 150.172 150.346 Domestic services 2 ........................................... 119.5 122.6 124.9 131.3 137.3 139.648 143.688 144.263 144.331 Gardening and lawncare services 2 ................... 118.4 119.9 125.5 NA NA 141.672 NA 156.052 154.948
See footnotes at end of table.
74 CPI Detailed Report-September 2010
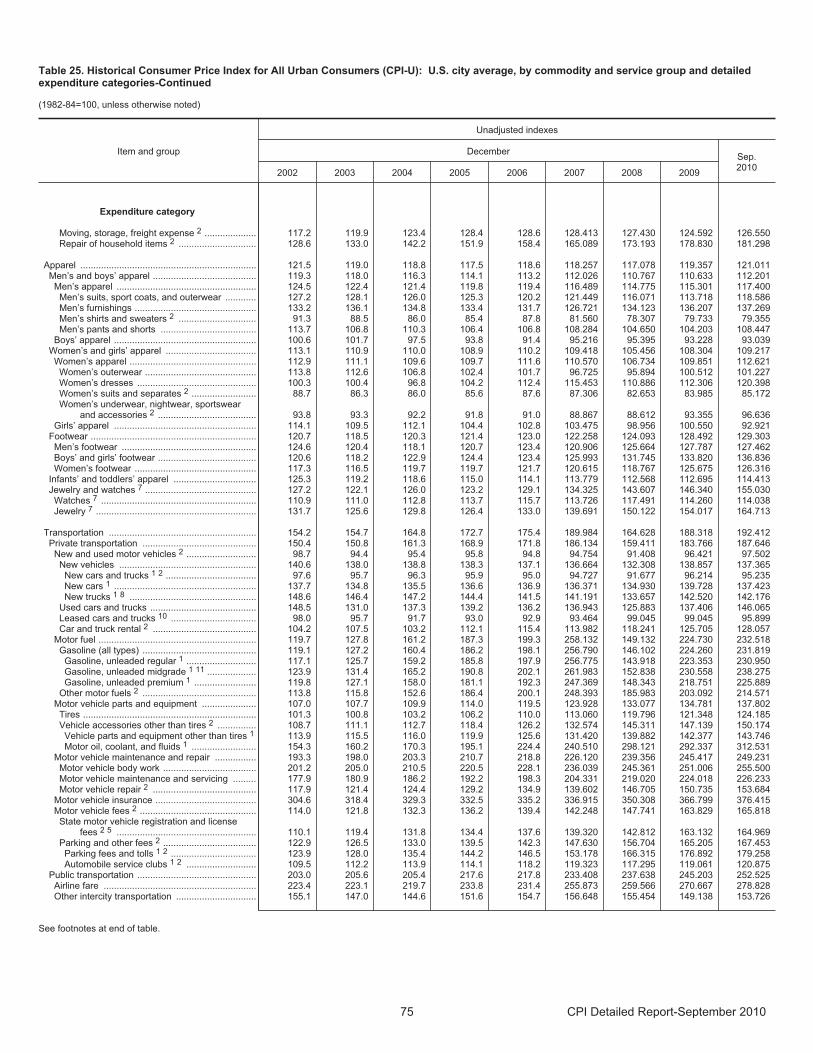
Table 25. Historical Consumer Price Index for All Urban Consumers (CPI-U): U.S. city average, by commodity and service group and detailedexpenditure categories-Continued
(1982-84=100, unless otherwise noted)
Item and group
Unadjusted indexes
DecemberSep.2010
2002 2003 2004 2005 2006 2007 2008 2009
Expenditure category
Moving, storage, freight expense 2 .................... 117.2 119.9 123.4 128.4 128.6 128.413 127.430 124.592 126.550 Repair of household items 2 .............................. 128.6 133.0 142.2 151.9 158.4 165.089 173.193 178.830 181.298
Apparel .................................................................... 121.5 119.0 118.8 117.5 118.6 118.257 117.078 119.357 121.011 Men’s and boys’ apparel ........................................ 119.3 118.0 116.3 114.1 113.2 112.026 110.767 110.633 112.201
Men’s apparel ...................................................... 124.5 122.4 121.4 119.8 119.4 116.489 114.775 115.301 117.400Men’s suits, sport coats, and outerwear ............ 127.2 128.1 126.0 125.3 120.2 121.449 116.071 113.718 118.586 Men’s furnishings ............................................... 133.2 136.1 134.8 133.4 131.7 126.721 134.123 136.207 137.269 Men’s shirts and sweaters 2 .............................. 91.3 88.5 86.0 85.4 87.8 81.560 78.307 79.733 79.355 Men’s pants and shorts ..................................... 113.7 106.8 110.3 106.4 106.8 108.284 104.650 104.203 108.447
Boys’ apparel ....................................................... 100.6 101.7 97.5 93.8 91.4 95.216 95.395 93.228 93.039 Women’s and girls’ apparel ................................... 113.1 110.9 110.0 108.9 110.2 109.418 105.456 108.304 109.217 Women’s apparel ................................................. 112.9 111.1 109.6 109.7 111.6 110.570 106.734 109.851 112.621
Women’s outerwear ........................................... 113.8 112.6 106.8 102.4 101.7 96.725 95.894 100.512 101.227 Women’s dresses .............................................. 100.3 100.4 96.8 104.2 112.4 115.453 110.886 112.306 120.398 Women’s suits and separates 2 ......................... 88.7 86.3 86.0 85.6 87.6 87.306 82.653 83.985 85.172 Women’s underwear, nightwear, sportswear
and accessories 2 ...................................... 93.8 93.3 92.2 91.8 91.0 88.867 88.612 93.355 96.636 Girls’ apparel ....................................................... 114.1 109.5 112.1 104.4 102.8 103.475 98.956 100.550 92.921
Footwear ................................................................ 120.7 118.5 120.3 121.4 123.0 122.258 124.093 128.492 129.303Men’s footwear .................................................... 124.6 120.4 118.1 120.7 123.4 120.906 125.664 127.787 127.462Boys’ and girls’ footwear ...................................... 120.6 118.2 122.9 124.4 123.4 125.993 131.745 133.820 136.836 Women’s footwear ............................................... 117.3 116.5 119.7 119.7 121.7 120.615 118.767 125.675 126.316
Infants’ and toddlers’ apparel ................................ 125.3 119.2 118.6 115.0 114.1 113.779 112.568 112.695 114.413 Jewelry and watches 7 ........................................... 127.2 122.1 126.0 123.2 129.1 134.325 143.607 146.340 155.030
Watches 7 ............................................................ 110.9 111.0 112.8 113.7 115.7 113.726 117.491 114.260 114.038 Jewelry 7 .............................................................. 131.7 125.6 129.8 126.4 133.0 139.691 150.122 154.017 164.713
Transportation ......................................................... 154.2 154.7 164.8 172.7 175.4 189.984 164.628 188.318 192.412Private transportation ............................................ 150.4 150.8 161.3 168.9 171.8 186.134 159.411 183.766 187.646
New and used motor vehicles 2 ........................... 98.7 94.4 95.4 95.8 94.8 94.754 91.408 96.421 97.502 New vehicles ..................................................... 140.6 138.0 138.8 138.3 137.1 136.664 132.308 138.857 137.365
New cars and trucks 1 2 ................................... 97.6 95.7 96.3 95.9 95.0 94.727 91.677 96.214 95.235 New cars 1 ....................................................... 137.7 134.8 135.5 136.6 136.9 136.371 134.930 139.728 137.423 New trucks 1 8 ................................................. 148.6 146.4 147.2 144.4 141.5 141.191 133.657 142.520 142.176
Used cars and trucks ......................................... 148.5 131.0 137.3 139.2 136.2 136.943 125.883 137.406 146.065 Leased cars and trucks 10 ................................. 98.0 95.7 91.7 93.0 92.9 93.464 99.045 99.045 95.899 Car and truck rental 2 ........................................ 104.2 107.5 103.2 112.1 115.4 113.982 118.241 125.705 128.057
Motor fuel ............................................................. 119.7 127.8 161.2 187.3 199.3 258.132 149.132 224.730 232.518Gasoline (all types) ............................................ 119.1 127.2 160.4 186.2 198.1 256.790 146.102 224.260 231.819
Gasoline, unleaded regular 1 ........................... 117.1 125.7 159.2 185.8 197.9 256.775 143.918 223.353 230.950 Gasoline, unleaded midgrade 1 11 ................... 123.9 131.4 165.2 190.8 202.1 261.983 152.838 230.558 238.275 Gasoline, unleaded premium 1 ........................ 119.8 127.1 158.0 181.1 192.3 247.369 148.343 218.751 225.889
Other motor fuels 2 ............................................ 113.8 115.8 152.6 186.4 200.1 248.393 185.983 203.092 214.571 Motor vehicle parts and equipment ..................... 107.0 107.7 109.9 114.0 119.5 123.928 133.077 134.781 137.802
Tires ................................................................... 101.3 100.8 103.2 106.2 110.0 113.060 119.796 121.348 124.185Vehicle accessories other than tires 2 ............... 108.7 111.1 112.7 118.4 126.2 132.574 145.311 147.139 150.174 Vehicle parts and equipment other than tires 1 113.9 115.5 116.0 119.9 125.6 131.420 139.882 142.377 143.746 Motor oil, coolant, and fluids 1 ......................... 154.3 160.2 170.3 195.1 224.4 240.510 298.121 292.337 312.531
Motor vehicle maintenance and repair ................ 193.3 198.0 203.3 210.7 218.8 226.120 239.356 245.417 249.231 Motor vehicle body work .................................... 201.2 205.0 210.5 220.5 228.1 236.039 245.361 251.006 255.500 Motor vehicle maintenance and servicing ......... 177.9 180.9 186.2 192.2 198.3 204.331 219.020 224.018 226.233 Motor vehicle repair 2 ........................................ 117.9 121.4 124.4 129.2 134.9 139.602 146.705 150.735 153.684
Motor vehicle insurance ....................................... 304.6 318.4 329.3 332.5 335.2 336.915 350.308 366.799 376.415 Motor vehicle fees 2 ............................................. 114.0 121.8 132.3 136.2 139.4 142.248 147.741 163.829 165.818 State motor vehicle registration and license
fees 2 5 ...................................................... 110.1 119.4 131.8 134.4 137.6 139.320 142.812 163.132 164.969 Parking and other fees 2 .................................... 122.9 126.5 133.0 139.5 142.3 147.630 156.704 165.205 167.453
Parking fees and tolls 1 2 ................................. 123.9 128.0 135.4 144.2 146.5 153.178 166.315 176.892 179.258 Automobile service clubs 1 2 ........................... 109.5 112.2 113.9 114.1 118.2 119.323 117.295 119.061 120.875
Public transportation .............................................. 203.0 205.6 205.4 217.6 217.8 233.408 237.638 245.203 252.525Airline fare ........................................................... 223.4 223.1 219.7 233.8 231.4 255.873 259.566 270.667 278.828Other intercity transportation ............................... 155.1 147.0 144.6 151.6 154.7 156.648 155.454 149.138 153.726
See footnotes at end of table.
75 CPI Detailed Report-September 2010
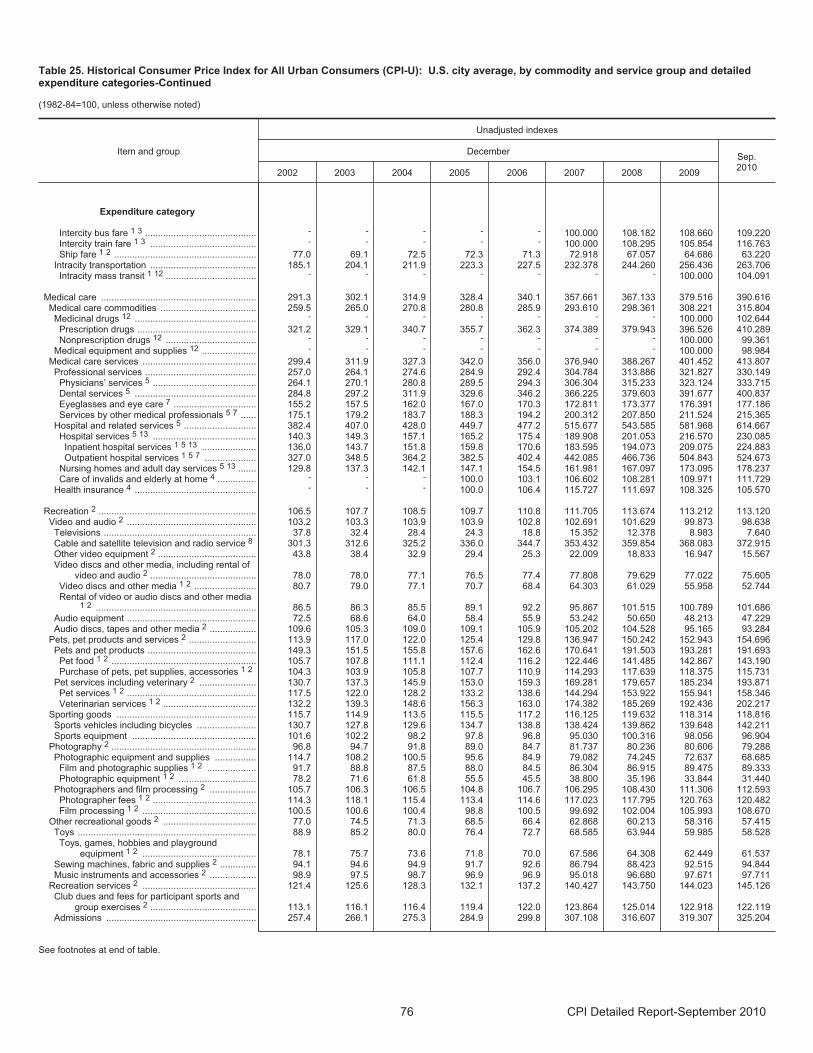
Table 25. Historical Consumer Price Index for All Urban Consumers (CPI-U): U.S. city average, by commodity and service group and detailedexpenditure categories-Continued
(1982-84=100, unless otherwise noted)
Item and group
Unadjusted indexes
DecemberSep.2010
2002 2003 2004 2005 2006 2007 2008 2009
Expenditure category
Intercity bus fare 1 3 ........................................... - - - - - 100.000 108.182 108.660 109.220 Intercity train fare 1 3 ......................................... - - - - - 100.000 108.295 105.854 116.763 Ship fare 1 2 ....................................................... 77.0 69.1 72.5 72.3 71.3 72.918 67.057 64.686 63.220
Intracity transportation ......................................... 185.1 204.1 211.9 223.3 227.5 232.378 244.260 256.436 263.706 Intracity mass transit 1 12 ................................... - - - - - - - 100.000 104.091
Medical care ............................................................ 291.3 302.1 314.9 328.4 340.1 357.661 367.133 379.516 390.616Medical care commodities ..................................... 259.5 265.0 270.8 280.8 285.9 293.610 298.361 308.221 315.804
Medicinal drugs 12 ............................................... - - - - - - - 100.000 102.644 Prescription drugs .............................................. 321.2 329.1 340.7 355.7 362.3 374.389 379.943 396.526 410.289 Nonprescription drugs 12 ................................... - - - - - - - 100.000 99.361
Medical equipment and supplies 12 ..................... - - - - - - - 100.000 98.984 Medical care services ............................................ 299.4 311.9 327.3 342.0 356.0 376.940 388.267 401.452 413.807
Professional services ........................................... 257.0 264.1 274.6 284.9 292.4 304.784 313.886 321.827 330.149 Physicians’ services 5 ........................................ 264.1 270.1 280.8 289.5 294.3 306.304 315.233 323.124 333.715 Dental services 5 ............................................... 284.8 297.2 311.9 329.6 346.2 366.225 379.603 391.677 400.837 Eyeglasses and eye care 7 ................................ 155.2 157.5 162.0 167.0 170.3 172.811 173.377 176.391 177.186 Services by other medical professionals 5 7 ...... 175.1 179.2 183.7 188.3 194.2 200.312 207.850 211.524 215.365
Hospital and related services 5 ............................ 382.4 407.0 428.0 449.7 477.2 515.677 543.585 581.968 614.667 Hospital services 5 13 ........................................ 140.3 149.3 157.1 165.2 175.4 189.908 201.053 216.570 230.085
Inpatient hospital services 1 5 13 ..................... 136.0 143.7 151.8 159.8 170.6 183.595 194.073 209.075 224.883 Outpatient hospital services 1 5 7 .................... 327.0 348.5 364.2 382.5 402.4 442.085 466.736 504.843 524.673
Nursing homes and adult day services 5 13 ....... 129.8 137.3 142.1 147.1 154.5 161.981 167.097 173.095 178.237 Care of invalids and elderly at home 4 ............... - - - 100.0 103.1 106.602 108.281 109.971 111.729
Health insurance 4 ............................................... - - - 100.0 106.4 115.727 111.697 108.325 105.570
Recreation 2 ............................................................. 106.5 107.7 108.5 109.7 110.8 111.705 113.674 113.212 113.120 Video and audio 2 .................................................. 103.2 103.3 103.9 103.9 102.8 102.691 101.629 99.873 98.638 Televisions ........................................................... 37.8 32.4 28.4 24.3 18.8 15.352 12.378 8.983 7.640 Cable and satellite television and radio service 8 301.3 312.6 325.2 336.0 344.7 353.432 359.854 368.083 372.915 Other video equipment 2 ...................................... 43.8 38.4 32.9 29.4 25.3 22.009 18.833 16.947 15.567 Video discs and other media, including rental of
video and audio 2 ......................................... 78.0 78.0 77.1 76.5 77.4 77.808 79.629 77.022 75.605 Video discs and other media 1 2 ........................ 80.7 79.0 77.1 70.7 68.4 64.303 61.029 55.958 52.744 Rental of video or audio discs and other media
1 2 .............................................................. 86.5 86.3 85.5 89.1 92.2 95.867 101.515 100.789 101.686 Audio equipment .................................................. 72.5 68.6 64.0 58.4 55.9 53.242 50.650 48.213 47.229 Audio discs, tapes and other media 2 .................. 109.6 105.3 109.0 109.1 105.9 105.202 104.528 95.165 93.284
Pets, pet products and services 2 .......................... 113.9 117.0 122.0 125.4 129.8 136.947 150.242 152.943 154.696 Pets and pet products .......................................... 149.3 151.5 155.8 157.6 162.6 170.641 191.503 193.281 191.693
Pet food 1 2 ........................................................ 105.7 107.8 111.1 112.4 116.2 122.446 141.485 142.867 143.190 Purchase of pets, pet supplies, accessories 1 2 104.3 103.9 105.8 107.7 110.9 114.293 117.639 118.375 115.731
Pet services including veterinary 2 ...................... 130.7 137.3 145.9 153.0 159.3 169.281 179.657 185.234 193.871 Pet services 1 2 .................................................. 117.5 122.0 128.2 133.2 138.6 144.294 153.922 155.941 158.346 Veterinarian services 1 2 .................................... 132.2 139.3 148.6 156.3 163.0 174.382 185.269 192.436 202.217
Sporting goods ...................................................... 115.7 114.9 113.5 115.5 117.2 116.125 119.632 118.314 118.816Sports vehicles including bicycles ....................... 130.7 127.8 129.6 134.7 138.8 138.424 139.862 139.648 142.211 Sports equipment ................................................ 101.6 102.2 98.2 97.8 96.8 95.030 100.316 98.056 96.904
Photography 2 ........................................................ 96.8 94.7 91.8 89.0 84.7 81.737 80.236 80.606 79.288 Photographic equipment and supplies ................ 114.7 108.2 100.5 95.6 84.9 79.082 74.245 72.637 68.685
Film and photographic supplies 1 2 ................... 91.7 88.8 87.5 88.0 84.5 86.304 86.915 89.475 89.333 Photographic equipment 1 2 .............................. 78.2 71.6 61.8 55.5 45.5 38.800 35.196 33.844 31.440
Photographers and film processing 2 .................. 105.7 106.3 106.5 104.8 106.7 106.295 108.430 111.306 112.593 Photographer fees 1 2 ........................................ 114.3 118.1 115.4 113.4 114.6 117.023 117.795 120.763 120.482 Film processing 1 2 ............................................ 100.5 100.6 100.4 98.8 100.5 99.692 102.004 105.993 108.670
Other recreational goods 2 .................................... 77.0 74.5 71.3 68.5 66.4 62.868 60.213 58.316 57.415 Toys ..................................................................... 88.9 85.2 80.0 76.4 72.7 68.585 63.944 59.985 58.528
Toys, games, hobbies and playgroundequipment 1 2 ............................................ 78.1 75.7 73.6 71.8 70.0 67.586 64.308 62.449 61.537
Sewing machines, fabric and supplies 2 .............. 94.1 94.6 94.9 91.7 92.6 86.794 88.423 92.515 94.844 Music instruments and accessories 2 .................. 98.9 97.5 98.7 96.9 96.9 95.018 96.680 97.671 97.711
Recreation services 2 ............................................ 121.4 125.6 128.3 132.1 137.2 140.427 143.750 144.023 145.126 Club dues and fees for participant sports and
group exercises 2 ......................................... 113.1 116.1 116.4 119.4 122.0 123.864 125.014 122.918 122.119 Admissions .......................................................... 257.4 266.1 275.3 284.9 299.8 307.108 316.607 319.307 325.204
See footnotes at end of table.
76 CPI Detailed Report-September 2010
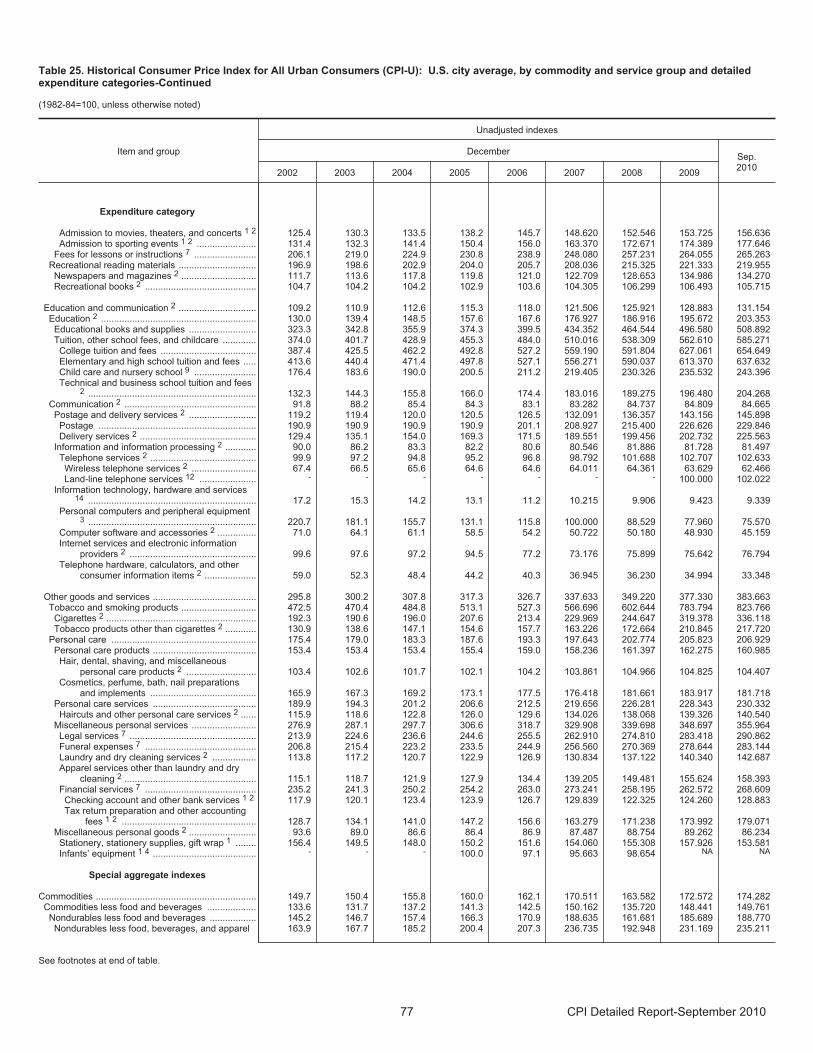
Table 25. Historical Consumer Price Index for All Urban Consumers (CPI-U): U.S. city average, by commodity and service group and detailedexpenditure categories-Continued
(1982-84=100, unless otherwise noted)
Item and group
Unadjusted indexes
DecemberSep.2010
2002 2003 2004 2005 2006 2007 2008 2009
Expenditure category
Admission to movies, theaters, and concerts 1 2 125.4 130.3 133.5 138.2 145.7 148.620 152.546 153.725 156.636 Admission to sporting events 1 2 ....................... 131.4 132.3 141.4 150.4 156.0 163.370 172.671 174.389 177.646
Fees for lessons or instructions 7 ........................ 206.1 219.0 224.9 230.8 238.9 248.080 257.231 264.055 265.263 Recreational reading materials .............................. 196.9 198.6 202.9 204.0 205.7 208.036 215.325 221.333 219.955
Newspapers and magazines 2 ............................. 111.7 113.6 117.8 119.8 121.0 122.709 128.653 134.986 134.270 Recreational books 2 ........................................... 104.7 104.2 104.2 102.9 103.6 104.305 106.299 106.493 105.715
Education and communication 2 .............................. 109.2 110.9 112.6 115.3 118.0 121.506 125.921 128.883 131.154 Education 2 ............................................................ 130.0 139.4 148.5 157.6 167.6 176.927 186.916 195.672 203.353
Educational books and supplies .......................... 323.3 342.8 355.9 374.3 399.5 434.352 464.544 496.580 508.892 Tuition, other school fees, and childcare ............. 374.0 401.7 428.9 455.3 484.0 510.016 538.309 562.610 585.271
College tuition and fees ..................................... 387.4 425.5 462.2 492.8 527.2 559.190 591.804 627.061 654.649 Elementary and high school tuition and fees ..... 413.6 440.4 471.4 497.8 527.1 556.271 590.037 613.370 637.632 Child care and nursery school 9 ........................ 176.4 183.6 190.0 200.5 211.2 219.405 230.326 235.532 243.396 Technical and business school tuition and fees
2 ................................................................. 132.3 144.3 155.8 166.0 174.4 183.016 189.275 196.480 204.268 Communication 2 ................................................... 91.8 88.2 85.4 84.3 83.1 83.282 84.737 84.809 84.665
Postage and delivery services 2 .......................... 119.2 119.4 120.0 120.5 126.5 132.091 136.357 143.156 145.898 Postage ............................................................. 190.9 190.9 190.9 190.9 201.1 208.927 215.400 226.626 229.846Delivery services 2 ............................................. 129.4 135.1 154.0 169.3 171.5 189.551 199.456 202.732 225.563
Information and information processing 2 ............ 90.0 86.2 83.3 82.2 80.6 80.546 81.886 81.728 81.497 Telephone services 2 ......................................... 99.9 97.2 94.8 95.2 96.8 98.792 101.688 102.707 102.633 Wireless telephone services 2 ......................... 67.4 66.5 65.6 64.6 64.6 64.011 64.361 63.629 62.466 Land-line telephone services 12 ...................... - - - - - - - 100.000 102.022
Information technology, hardware and services14 ................................................................. 17.2 15.3 14.2 13.1 11.2 10.215 9.906 9.423 9.339
Personal computers and peripheral equipment3 ................................................................. 220.7 181.1 155.7 131.1 115.8 100.000 88.529 77.960 75.570
Computer software and accessories 2 ............... 71.0 64.1 61.1 58.5 54.2 50.722 50.180 48.930 45.159 Internet services and electronic information
providers 2 ................................................. 99.6 97.6 97.2 94.5 77.2 73.176 75.899 75.642 76.794 Telephone hardware, calculators, and other
consumer information items 2 .................... 59.0 52.3 48.4 44.2 40.3 36.945 36.230 34.994 33.348
Other goods and services ........................................ 295.8 300.2 307.8 317.3 326.7 337.633 349.220 377.330 383.663 Tobacco and smoking products ............................. 472.5 470.4 484.8 513.1 527.3 566.696 602.644 783.794 823.766
Cigarettes 2 .......................................................... 192.3 190.6 196.0 207.6 213.4 229.969 244.647 319.378 336.118 Tobacco products other than cigarettes 2 ............ 130.9 138.6 147.1 154.6 157.7 163.226 172.664 210.845 217.720
Personal care ........................................................ 175.4 179.0 183.3 187.6 193.3 197.643 202.774 205.823 206.929Personal care products ........................................ 153.4 153.4 153.4 155.4 159.0 158.236 161.397 162.275 160.985
Hair, dental, shaving, and miscellaneouspersonal care products 2 ........................... 103.4 102.6 101.7 102.1 104.2 103.861 104.966 104.825 104.407
Cosmetics, perfume, bath, nail preparationsand implements ......................................... 165.9 167.3 169.2 173.1 177.5 176.418 181.661 183.917 181.718
Personal care services ........................................ 189.9 194.3 201.2 206.6 212.5 219.656 226.281 228.343 230.332 Haircuts and other personal care services 2 ...... 115.9 118.6 122.8 126.0 129.6 134.026 138.068 139.326 140.540
Miscellaneous personal services ......................... 276.9 287.1 297.7 306.6 318.7 329.908 339.698 348.697 355.964 Legal services 7 ................................................. 213.9 224.6 236.6 244.6 255.5 262.910 274.810 283.418 290.862 Funeral expenses 7 ........................................... 206.8 215.4 223.2 233.5 244.9 256.560 270.369 278.644 283.144 Laundry and dry cleaning services 2 ................. 113.8 117.2 120.7 122.9 126.9 130.834 137.122 140.340 142.687 Apparel services other than laundry and dry
cleaning 2 ................................................... 115.1 118.7 121.9 127.9 134.4 139.205 149.481 155.624 158.393 Financial services 7 ........................................... 235.2 241.3 250.2 254.2 263.0 273.241 258.195 262.572 268.609 Checking account and other bank services 1 2 117.9 120.1 123.4 123.9 126.7 129.839 122.325 124.260 128.883 Tax return preparation and other accounting
fees 1 2 .................................................... 128.7 134.1 141.0 147.2 156.6 163.279 171.238 173.992 179.071 Miscellaneous personal goods 2 .......................... 93.6 89.0 86.6 86.4 86.9 87.487 88.754 89.262 86.234 Stationery, stationery supplies, gift wrap 1 ........ 156.4 149.5 148.0 150.2 151.6 154.060 155.308 157.926 153.581 Infants’ equipment 1 4 ........................................ - - - 100.0 97.1 95.663 98.654 NA NA
Special aggregate indexes
Commodities .............................................................. 149.7 150.4 155.8 160.0 162.1 170.511 163.582 172.572 174.282Commodities less food and beverages ................... 133.6 131.7 137.2 141.3 142.5 150.162 135.720 148.441 149.761
Nondurables less food and beverages .................. 145.2 146.7 157.4 166.3 170.9 188.635 161.681 185.689 188.770 Nondurables less food, beverages, and apparel 163.9 167.7 185.2 200.4 207.3 236.735 192.948 231.169 235.211
See footnotes at end of table.
77 CPI Detailed Report-September 2010
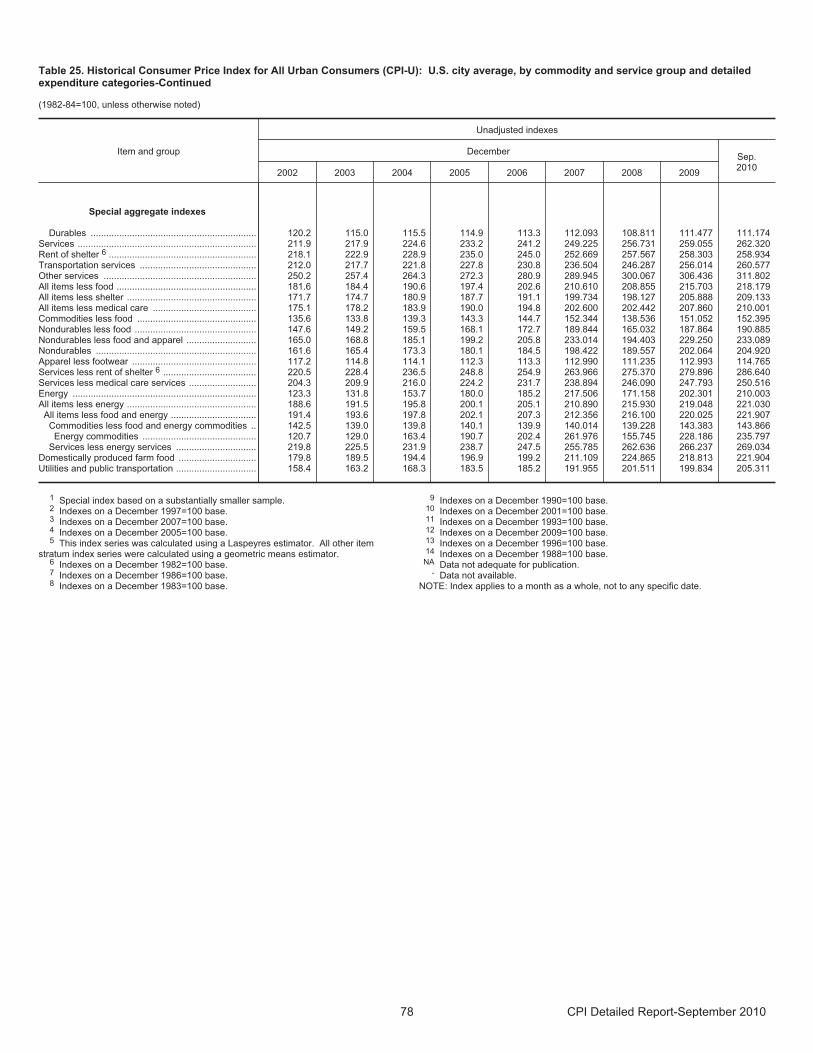
Table 25. Historical Consumer Price Index for All Urban Consumers (CPI-U): U.S. city average, by commodity and service group and detailedexpenditure categories-Continued
(1982-84=100, unless otherwise noted)
Item and group
Unadjusted indexes
DecemberSep.2010
2002 2003 2004 2005 2006 2007 2008 2009
Special aggregate indexes
Durables ................................................................ 120.2 115.0 115.5 114.9 113.3 112.093 108.811 111.477 111.174Services ..................................................................... 211.9 217.9 224.6 233.2 241.2 249.225 256.731 259.055 262.320 Rent of shelter 6 ......................................................... 218.1 222.9 228.9 235.0 245.0 252.669 257.567 258.303 258.934 Transportation services ............................................. 212.0 217.7 221.8 227.8 230.8 236.504 246.287 256.014 260.577Other services ........................................................... 250.2 257.4 264.3 272.3 280.9 289.945 300.067 306.436 311.802All items less food ...................................................... 181.6 184.4 190.6 197.4 202.6 210.610 208.855 215.703 218.179 All items less shelter .................................................. 171.7 174.7 180.9 187.7 191.1 199.734 198.127 205.888 209.133 All items less medical care ........................................ 175.1 178.2 183.9 190.0 194.8 202.600 202.442 207.860 210.001 Commodities less food .............................................. 135.6 133.8 139.3 143.3 144.7 152.344 138.536 151.052 152.395 Nondurables less food ............................................... 147.6 149.2 159.5 168.1 172.7 189.844 165.032 187.864 190.885 Nondurables less food and apparel ........................... 165.0 168.8 185.1 199.2 205.8 233.014 194.403 229.250 233.089 Nondurables .............................................................. 161.6 165.4 173.3 180.1 184.5 198.422 189.557 202.064 204.920Apparel less footwear ................................................ 117.2 114.8 114.1 112.3 113.3 112.990 111.235 112.993 114.765 Services less rent of shelter 6 .................................... 220.5 228.4 236.5 248.8 254.9 263.966 275.370 279.896 286.640 Services less medical care services .......................... 204.3 209.9 216.0 224.2 231.7 238.894 246.090 247.793 250.516 Energy ....................................................................... 123.3 131.8 153.7 180.0 185.2 217.506 171.158 202.301 210.003 All items less energy .................................................. 188.6 191.5 195.8 200.1 205.1 210.890 215.930 219.048 221.030 All items less food and energy ................................. 191.4 193.6 197.8 202.1 207.3 212.356 216.100 220.025 221.907
Commodities less food and energy commodities .. 142.5 139.0 139.8 140.1 139.9 140.014 139.228 143.383 143.866 Energy commodities ............................................ 120.7 129.0 163.4 190.7 202.4 261.976 155.745 228.186 235.797
Services less energy services ............................... 219.8 225.5 231.9 238.7 247.5 255.785 262.636 266.237 269.034 Domestically produced farm food .............................. 179.8 189.5 194.4 196.9 199.2 211.109 224.865 218.813 221.904 Utilities and public transportation ............................... 158.4 163.2 168.3 183.5 185.2 191.955 201.511 199.834 205.311
1 Special index based on a substantially smaller sample.2 Indexes on a December 1997=100 base.3 Indexes on a December 2007=100 base.4 Indexes on a December 2005=100 base.5 This index series was calculated using a Laspeyres estimator. All other item
stratum index series were calculated using a geometric means estimator.6 Indexes on a December 1982=100 base.7 Indexes on a December 1986=100 base.8 Indexes on a December 1983=100 base.
9 Indexes on a December 1990=100 base.10 Indexes on a December 2001=100 base.11 Indexes on a December 1993=100 base.12 Indexes on a December 2009=100 base.13 Indexes on a December 1996=100 base.14 Indexes on a December 1988=100 base.
NA Data not adequate for publication.- Data not available.
NOTE: Index applies to a month as a whole, not to any specific date.
78 CPI Detailed Report-September 2010
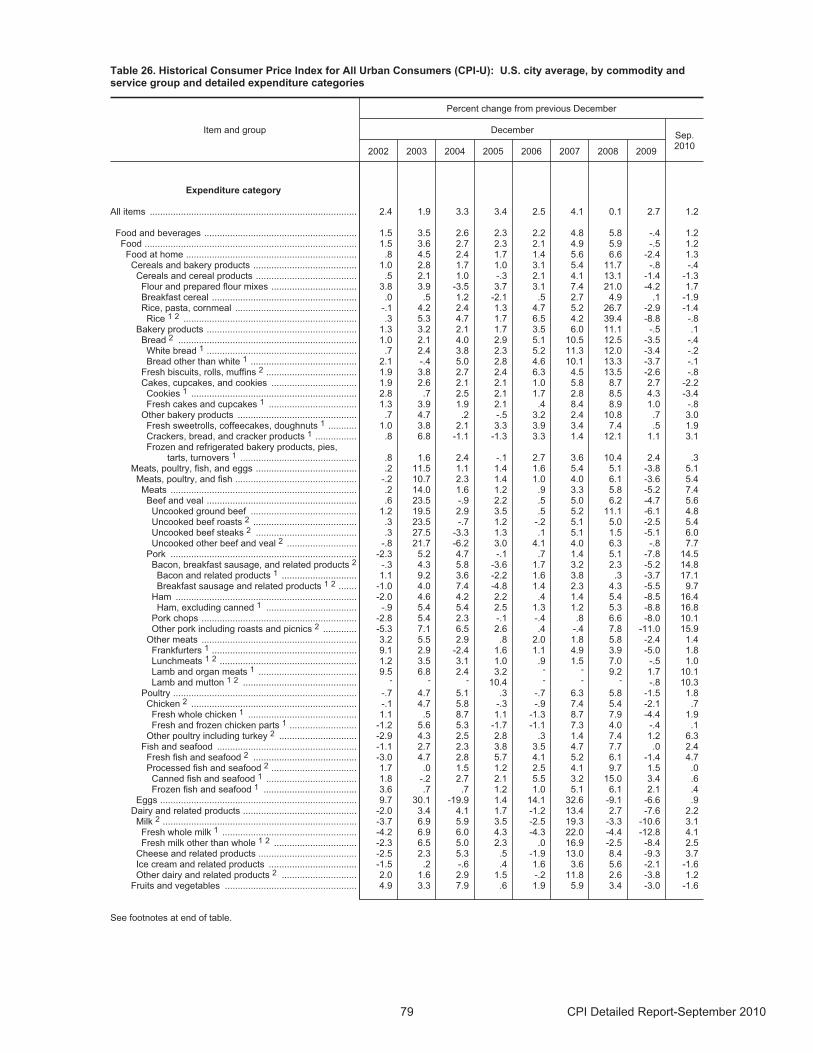
Table 26. Historical Consumer Price Index for All Urban Consumers (CPI-U): U.S. city average, by commodity andservice group and detailed expenditure categories
Item and group
Percent change from previous December
DecemberSep.2010
2002 2003 2004 2005 2006 2007 2008 2009
Expenditure category
All items ................................................................................ 2.4 1.9 3.3 3.4 2.5 4.1 0.1 2.7 1.2
Food and beverages ........................................................... 1.5 3.5 2.6 2.3 2.2 4.8 5.8 -.4 1.2 Food .................................................................................. 1.5 3.6 2.7 2.3 2.1 4.9 5.9 -.5 1.2
Food at home .................................................................. .8 4.5 2.4 1.7 1.4 5.6 6.6 -2.4 1.3 Cereals and bakery products ........................................ 1.0 2.8 1.7 1.0 3.1 5.4 11.7 -.8 -.4
Cereals and cereal products ....................................... .5 2.1 1.0 -.3 2.1 4.1 13.1 -1.4 -1.3 Flour and prepared flour mixes ................................. 3.8 3.9 -3.5 3.7 3.1 7.4 21.0 -4.2 1.7 Breakfast cereal ........................................................ .0 .5 1.2 -2.1 .5 2.7 4.9 .1 -1.9 Rice, pasta, cornmeal ............................................... -.1 4.2 2.4 1.3 4.7 5.2 26.7 -2.9 -1.4
Rice 1 2 ................................................................... .3 5.3 4.7 1.7 6.5 4.2 39.4 -8.8 -.8 Bakery products .......................................................... 1.3 3.2 2.1 1.7 3.5 6.0 11.1 -.5 .1
Bread 2 ..................................................................... 1.0 2.1 4.0 2.9 5.1 10.5 12.5 -3.5 -.4 White bread 1 .......................................................... .7 2.4 3.8 2.3 5.2 11.3 12.0 -3.4 -.2 Bread other than white 1 ......................................... 2.1 -.4 5.0 2.8 4.6 10.1 13.3 -3.7 -.1
Fresh biscuits, rolls, muffins 2 ................................... 1.9 3.8 2.7 2.4 6.3 4.5 13.5 -2.6 -.8 Cakes, cupcakes, and cookies ................................. 1.9 2.6 2.1 2.1 1.0 5.8 8.7 2.7 -2.2
Cookies 1 ................................................................ 2.8 .7 2.5 2.1 1.7 2.8 8.5 4.3 -3.4 Fresh cakes and cupcakes 1 .................................. 1.3 3.9 1.9 2.1 .4 8.4 8.9 1.0 -.8
Other bakery products .............................................. .7 4.7 .2 -.5 3.2 2.4 10.8 .7 3.0 Fresh sweetrolls, coffeecakes, doughnuts 1 ........... 1.0 3.8 2.1 3.3 3.9 3.4 7.4 .5 1.9 Crackers, bread, and cracker products 1 ................ .8 6.8 -1.1 -1.3 3.3 1.4 12.1 1.1 3.1 Frozen and refrigerated bakery products, pies,
tarts, turnovers 1 ............................................. .8 1.6 2.4 -.1 2.7 3.6 10.4 2.4 .3 Meats, poultry, fish, and eggs ....................................... .2 11.5 1.1 1.4 1.6 5.4 5.1 -3.8 5.1
Meats, poultry, and fish ............................................... -.2 10.7 2.3 1.4 1.0 4.0 6.1 -3.6 5.4 Meats ........................................................................ .2 14.0 1.6 1.2 .9 3.3 5.8 -5.2 7.4
Beef and veal .......................................................... .6 23.5 -.9 2.2 .5 5.0 6.2 -4.7 5.6 Uncooked ground beef ......................................... 1.2 19.5 2.9 3.5 .5 5.2 11.1 -6.1 4.8 Uncooked beef roasts 2 ........................................ .3 23.5 -.7 1.2 -.2 5.1 5.0 -2.5 5.4 Uncooked beef steaks 2 ....................................... .3 27.5 -3.3 1.3 .1 5.1 1.5 -5.1 6.0 Uncooked other beef and veal 2 ........................... -.8 21.7 -6.2 3.0 4.1 4.0 6.3 -.8 7.7
Pork ........................................................................ -2.3 5.2 4.7 -.1 .7 1.4 5.1 -7.8 14.5 Bacon, breakfast sausage, and related products 2 -.3 4.3 5.8 -3.6 1.7 3.2 2.3 -5.2 14.8 Bacon and related products 1 ............................. 1.1 9.2 3.6 -2.2 1.6 3.8 .3 -3.7 17.1 Breakfast sausage and related products 1 2 ....... -1.0 4.0 7.4 -4.8 1.4 2.3 4.3 -5.5 9.7
Ham ...................................................................... -2.0 4.6 4.2 2.2 .4 1.4 5.4 -8.5 16.4 Ham, excluding canned 1 ................................... -.9 5.4 5.4 2.5 1.3 1.2 5.3 -8.8 16.8
Pork chops ............................................................ -2.8 5.4 2.3 -.1 -.4 .8 6.6 -8.0 10.1 Other pork including roasts and picnics 2 ............. -5.3 7.1 6.5 2.6 .4 -.4 7.8 -11.0 15.9
Other meats ............................................................ 3.2 5.5 2.9 .8 2.0 1.8 5.8 -2.4 1.4 Frankfurters 1 ........................................................ 9.1 2.9 -2.4 1.6 1.1 4.9 3.9 -5.0 1.8 Lunchmeats 1 2 ..................................................... 1.2 3.5 3.1 1.0 .9 1.5 7.0 -.5 1.0 Lamb and organ meats 1 ...................................... 9.5 6.8 2.4 3.2 - - 9.2 1.7 10.1 Lamb and mutton 1 2 ............................................ - - - 10.4 - - - -.8 10.3
Poultry ....................................................................... -.7 4.7 5.1 .3 -.7 6.3 5.8 -1.5 1.8 Chicken 2 ................................................................ -.1 4.7 5.8 -.3 -.9 7.4 5.4 -2.1 .7 Fresh whole chicken 1 .......................................... 1.1 .5 8.7 1.1 -1.3 8.7 7.9 -4.4 1.9 Fresh and frozen chicken parts 1 .......................... -1.2 5.6 5.3 -1.7 -1.1 7.3 4.0 -.4 .1
Other poultry including turkey 2 .............................. -2.9 4.3 2.5 2.8 .3 1.4 7.4 1.2 6.3 Fish and seafood ...................................................... -1.1 2.7 2.3 3.8 3.5 4.7 7.7 .0 2.4
Fresh fish and seafood 2 ........................................ -3.0 4.7 2.8 5.7 4.1 5.2 6.1 -1.4 4.7 Processed fish and seafood 2 ................................. 1.7 .0 1.5 1.2 2.5 4.1 9.7 1.5 .0 Canned fish and seafood 1 ................................... 1.8 -.2 2.7 2.1 5.5 3.2 15.0 3.4 .6 Frozen fish and seafood 1 .................................... 3.6 .7 .7 1.2 1.0 5.1 6.1 2.1 .4
Eggs ............................................................................ 9.7 30.1 -19.9 1.4 14.1 32.6 -9.1 -6.6 .9 Dairy and related products ............................................ -2.0 3.4 4.1 1.7 -1.2 13.4 2.7 -7.6 2.2
Milk 2 ........................................................................... -3.7 6.9 5.9 3.5 -2.5 19.3 -3.3 -10.6 3.1 Fresh whole milk 1 .................................................... -4.2 6.9 6.0 4.3 -4.3 22.0 -4.4 -12.8 4.1 Fresh milk other than whole 1 2 ................................ -2.3 6.5 5.0 2.3 .0 16.9 -2.5 -8.4 2.5
Cheese and related products ...................................... -2.5 2.3 5.3 .5 -1.9 13.0 8.4 -9.3 3.7 Ice cream and related products .................................. -1.5 .2 -.6 .4 1.6 3.6 5.6 -2.1 -1.6 Other dairy and related products 2 ............................. 2.0 1.6 2.9 1.5 -.2 11.8 2.6 -3.8 1.2
Fruits and vegetables ................................................... 4.9 3.3 7.9 .6 1.9 5.9 3.4 -3.0 -1.6
See footnotes at end of table.
79 CPI Detailed Report-September 2010
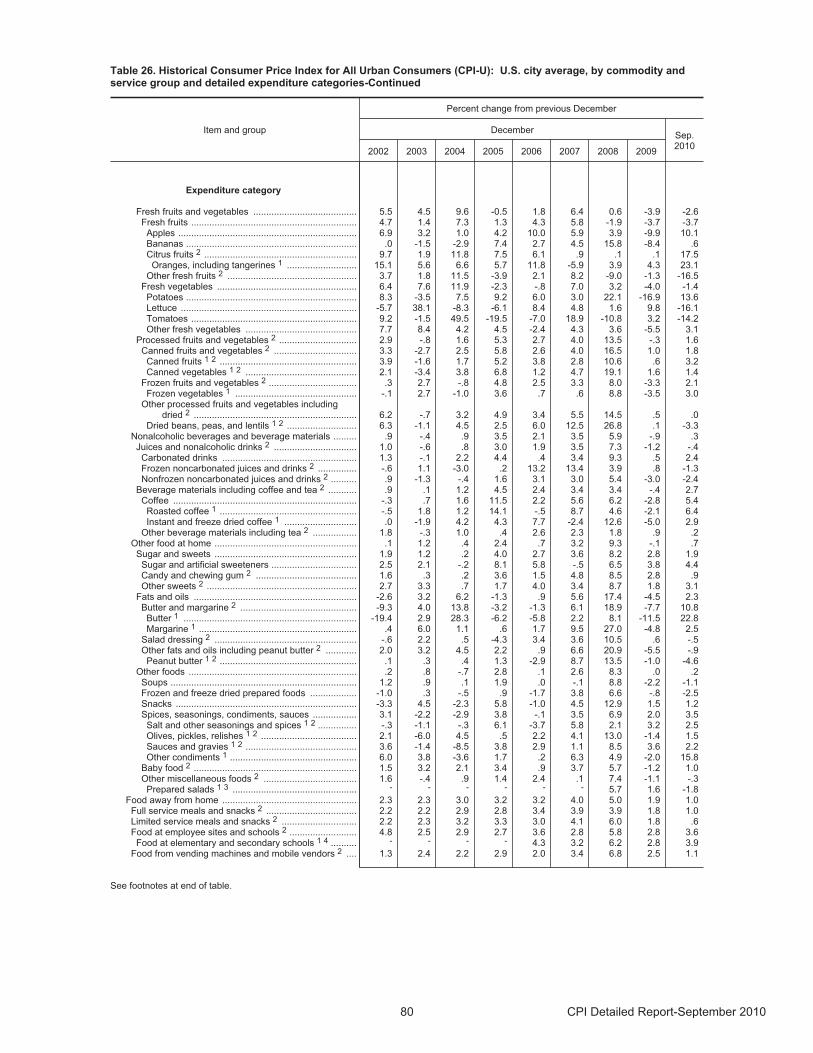
Table 26. Historical Consumer Price Index for All Urban Consumers (CPI-U): U.S. city average, by commodity andservice group and detailed expenditure categories-Continued
Item and group
Percent change from previous December
DecemberSep.2010
2002 2003 2004 2005 2006 2007 2008 2009
Expenditure category
Fresh fruits and vegetables ........................................ 5.5 4.5 9.6 -0.5 1.8 6.4 0.6 -3.9 -2.6 Fresh fruits ................................................................ 4.7 1.4 7.3 1.3 4.3 5.8 -1.9 -3.7 -3.7
Apples ..................................................................... 6.9 3.2 1.0 4.2 10.0 5.9 3.9 -9.9 10.1 Bananas .................................................................. .0 -1.5 -2.9 7.4 2.7 4.5 15.8 -8.4 .6 Citrus fruits 2 ........................................................... 9.7 1.9 11.8 7.5 6.1 .9 .1 .1 17.5 Oranges, including tangerines 1 ........................... 15.1 5.6 6.6 5.7 11.8 -5.9 3.9 4.3 23.1
Other fresh fruits 2 .................................................. 3.7 1.8 11.5 -3.9 2.1 8.2 -9.0 -1.3 -16.5 Fresh vegetables ...................................................... 6.4 7.6 11.9 -2.3 -.8 7.0 3.2 -4.0 -1.4
Potatoes .................................................................. 8.3 -3.5 7.5 9.2 6.0 3.0 22.1 -16.9 13.6 Lettuce .................................................................... -5.7 38.1 -8.3 -6.1 8.4 4.8 1.6 9.8 -16.1 Tomatoes ................................................................ 9.2 -1.5 49.5 -19.5 -7.0 18.9 -10.8 3.2 -14.2 Other fresh vegetables ........................................... 7.7 8.4 4.2 4.5 -2.4 4.3 3.6 -5.5 3.1
Processed fruits and vegetables 2 .............................. 2.9 -.8 1.6 5.3 2.7 4.0 13.5 -.3 1.6 Canned fruits and vegetables 2 ................................ 3.3 -2.7 2.5 5.8 2.6 4.0 16.5 1.0 1.8 Canned fruits 1 2 ..................................................... 3.9 -1.6 1.7 5.2 3.8 2.8 10.6 .6 3.2 Canned vegetables 1 2 ........................................... 2.1 -3.4 3.8 6.8 1.2 4.7 19.1 1.6 1.4
Frozen fruits and vegetables 2 .................................. .3 2.7 -.8 4.8 2.5 3.3 8.0 -3.3 2.1 Frozen vegetables 1 ............................................... -.1 2.7 -1.0 3.6 .7 .6 8.8 -3.5 3.0
Other processed fruits and vegetables includingdried 2 ............................................................... 6.2 -.7 3.2 4.9 3.4 5.5 14.5 .5 .0
Dried beans, peas, and lentils 1 2 ........................... 6.3 -1.1 4.5 2.5 6.0 12.5 26.8 .1 -3.3 Nonalcoholic beverages and beverage materials ......... .9 -.4 .9 3.5 2.1 3.5 5.9 -.9 .3
Juices and nonalcoholic drinks 2 ................................ 1.0 -.6 .8 3.0 1.9 3.5 7.3 -1.2 -.4 Carbonated drinks .................................................... 1.3 -.1 2.2 4.4 .4 3.4 9.3 .5 2.4 Frozen noncarbonated juices and drinks 2 ............... -.6 1.1 -3.0 .2 13.2 13.4 3.9 .8 -1.3 Nonfrozen noncarbonated juices and drinks 2 .......... .9 -1.3 -.4 1.6 3.1 3.0 5.4 -3.0 -2.4
Beverage materials including coffee and tea 2 ........... .9 .1 1.2 4.5 2.4 3.4 3.4 -.4 2.7 Coffee ....................................................................... -.3 .7 1.6 11.5 2.2 5.6 6.2 -2.8 5.4
Roasted coffee 1 ..................................................... -.5 1.8 1.2 14.1 -.5 8.7 4.6 -2.1 6.4 Instant and freeze dried coffee 1 ............................ .0 -1.9 4.2 4.3 7.7 -2.4 12.6 -5.0 2.9
Other beverage materials including tea 2 ................. 1.8 -.3 1.0 .4 2.6 2.3 1.8 .9 .2 Other food at home ....................................................... .1 1.2 .4 2.4 .7 3.2 9.3 -.1 .7
Sugar and sweets ....................................................... 1.9 1.2 .2 4.0 2.7 3.6 8.2 2.8 1.9 Sugar and artificial sweeteners ................................. 2.5 2.1 -.2 8.1 5.8 -.5 6.5 3.8 4.4 Candy and chewing gum 2 ....................................... 1.6 .3 .2 3.6 1.5 4.8 8.5 2.8 .9 Other sweets 2 .......................................................... 2.7 3.3 .7 1.7 4.0 3.4 8.7 1.8 3.1
Fats and oils ............................................................... -2.6 3.2 6.2 -1.3 .9 5.6 17.4 -4.5 2.3 Butter and margarine 2 ............................................. -9.3 4.0 13.8 -3.2 -1.3 6.1 18.9 -7.7 10.8 Butter 1 ................................................................... -19.4 2.9 28.3 -6.2 -5.8 2.2 8.1 -11.5 22.8 Margarine 1 ............................................................. .4 6.0 1.1 .6 1.7 9.5 27.0 -4.8 2.5
Salad dressing 2 ....................................................... -.6 2.2 .5 -4.3 3.4 3.6 10.5 .6 -.5 Other fats and oils including peanut butter 2 ............ 2.0 3.2 4.5 2.2 .9 6.6 20.9 -5.5 -.9 Peanut butter 1 2 ..................................................... .1 .3 .4 1.3 -2.9 8.7 13.5 -1.0 -4.6
Other foods ................................................................. .2 .8 -.7 2.8 .1 2.6 8.3 .0 .2 Soups ........................................................................ 1.2 .9 .1 1.9 .0 -.1 8.8 -2.2 -1.1 Frozen and freeze dried prepared foods .................. -1.0 .3 -.5 .9 -1.7 3.8 6.6 -.8 -2.5 Snacks ...................................................................... -3.3 4.5 -2.3 5.8 -1.0 4.5 12.9 1.5 1.2 Spices, seasonings, condiments, sauces ................. 3.1 -2.2 -2.9 3.8 -.1 3.5 6.9 2.0 3.5
Salt and other seasonings and spices 1 2 ............... -.3 -1.1 -.3 6.1 -3.7 5.8 2.1 3.2 2.5 Olives, pickles, relishes 1 2 ..................................... 2.1 -6.0 4.5 .5 2.2 4.1 13.0 -1.4 1.5 Sauces and gravies 1 2 ........................................... 3.6 -1.4 -8.5 3.8 2.9 1.1 8.5 3.6 2.2 Other condiments 1 ................................................. 6.0 3.8 -3.6 1.7 .2 6.3 4.9 -2.0 15.8
Baby food 2 ............................................................... 1.5 3.2 2.1 3.4 .9 3.7 5.7 -1.2 1.0 Other miscellaneous foods 2 .................................... 1.6 -.4 .9 1.4 2.4 .1 7.4 -1.1 -.3
Prepared salads 1 3 ................................................ - - - - - - 5.7 1.6 -1.8 Food away from home .................................................... 2.3 2.3 3.0 3.2 3.2 4.0 5.0 1.9 1.0
Full service meals and snacks 2 ................................... 2.2 2.2 2.9 2.8 3.4 3.9 3.9 1.8 1.0 Limited service meals and snacks 2 ............................. 2.2 2.3 3.2 3.3 3.0 4.1 6.0 1.8 .6 Food at employee sites and schools 2 .......................... 4.8 2.5 2.9 2.7 3.6 2.8 5.8 2.8 3.6 Food at elementary and secondary schools 1 4 .......... - - - - 4.3 3.2 6.2 2.8 3.9
Food from vending machines and mobile vendors 2 .... 1.3 2.4 2.2 2.9 2.0 3.4 6.8 2.5 1.1
See footnotes at end of table.
80 CPI Detailed Report-September 2010
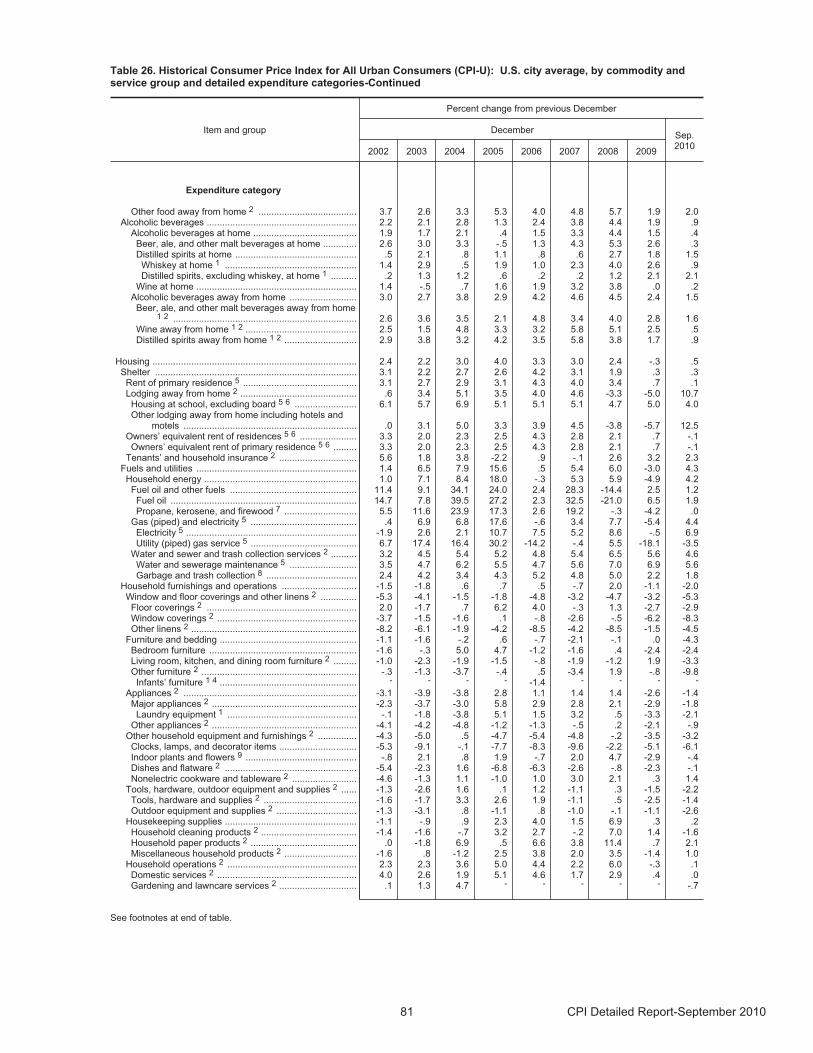
Table 26. Historical Consumer Price Index for All Urban Consumers (CPI-U): U.S. city average, by commodity andservice group and detailed expenditure categories-Continued
Item and group
Percent change from previous December
DecemberSep.2010
2002 2003 2004 2005 2006 2007 2008 2009
Expenditure category
Other food away from home 2 ...................................... 3.7 2.6 3.3 5.3 4.0 4.8 5.7 1.9 2.0 Alcoholic beverages .......................................................... 2.2 2.1 2.8 1.3 2.4 3.8 4.4 1.9 .9
Alcoholic beverages at home ........................................ 1.9 1.7 2.1 .4 1.5 3.3 4.4 1.5 .4 Beer, ale, and other malt beverages at home ............. 2.6 3.0 3.3 -.5 1.3 4.3 5.3 2.6 .3 Distilled spirits at home ............................................... .5 2.1 .8 1.1 .8 .6 2.7 1.8 1.5
Whiskey at home 1 ................................................... 1.4 2.9 .5 1.9 1.0 2.3 4.0 2.6 .9 Distilled spirits, excluding whiskey, at home 1 .......... .2 1.3 1.2 .6 .2 .2 1.2 2.1 2.1
Wine at home .............................................................. 1.4 -.5 .7 1.6 1.9 3.2 3.8 .0 .2 Alcoholic beverages away from home .......................... 3.0 2.7 3.8 2.9 4.2 4.6 4.5 2.4 1.5
Beer, ale, and other malt beverages away from home1 2 ....................................................................... 2.6 3.6 3.5 2.1 4.8 3.4 4.0 2.8 1.6
Wine away from home 1 2 ........................................... 2.5 1.5 4.8 3.3 3.2 5.8 5.1 2.5 .5 Distilled spirits away from home 1 2 ............................ 2.9 3.8 3.2 4.2 3.5 5.8 3.8 1.7 .9
Housing ............................................................................... 2.4 2.2 3.0 4.0 3.3 3.0 2.4 -.3 .5 Shelter .............................................................................. 3.1 2.2 2.7 2.6 4.2 3.1 1.9 .3 .3
Rent of primary residence 5 ............................................ 3.1 2.7 2.9 3.1 4.3 4.0 3.4 .7 .1 Lodging away from home 2 ............................................. .6 3.4 5.1 3.5 4.0 4.6 -3.3 -5.0 10.7 Housing at school, excluding board 5 6 ........................ 6.1 5.7 6.9 5.1 5.1 5.1 4.7 5.0 4.0 Other lodging away from home including hotels and
motels ................................................................... .0 3.1 5.0 3.3 3.9 4.5 -3.8 -5.7 12.5 Owners’ equivalent rent of residences 5 6 ...................... 3.3 2.0 2.3 2.5 4.3 2.8 2.1 .7 -.1 Owners’ equivalent rent of primary residence 5 6 ......... 3.3 2.0 2.3 2.5 4.3 2.8 2.1 .7 -.1
Tenants’ and household insurance 2 .............................. 5.6 1.8 3.8 -2.2 .9 -.1 2.6 3.2 2.3 Fuels and utilities .............................................................. 1.4 6.5 7.9 15.6 .5 5.4 6.0 -3.0 4.3
Household energy ........................................................... 1.0 7.1 8.4 18.0 -.3 5.3 5.9 -4.9 4.2 Fuel oil and other fuels ................................................. 11.4 9.1 34.1 24.0 2.4 28.3 -14.4 2.5 1.2
Fuel oil ........................................................................ 14.7 7.8 39.5 27.2 2.3 32.5 -21.0 6.5 1.9 Propane, kerosene, and firewood 7 ............................ 5.5 11.6 23.9 17.3 2.6 19.2 -.3 -4.2 .0
Gas (piped) and electricity 5 ......................................... .4 6.9 6.8 17.6 -.6 3.4 7.7 -5.4 4.4 Electricity 5 .................................................................. -1.9 2.6 2.1 10.7 7.5 5.2 8.6 -.5 6.9 Utility (piped) gas service 5 ......................................... 6.7 17.4 16.4 30.2 -14.2 -.4 5.5 -18.1 -3.5
Water and sewer and trash collection services 2 .......... 3.2 4.5 5.4 5.2 4.8 5.4 6.5 5.6 4.6 Water and sewerage maintenance 5 .......................... 3.5 4.7 6.2 5.5 4.7 5.6 7.0 6.9 5.6 Garbage and trash collection 8 ................................... 2.4 4.2 3.4 4.3 5.2 4.8 5.0 2.2 1.8
Household furnishings and operations ............................. -1.5 -1.8 .6 .7 .5 -.7 2.0 -1.1 -2.0 Window and floor coverings and other linens 2 .............. -5.3 -4.1 -1.5 -1.8 -4.8 -3.2 -4.7 -3.2 -5.3 Floor coverings 2 .......................................................... 2.0 -1.7 .7 6.2 4.0 -.3 1.3 -2.7 -2.9 Window coverings 2 ...................................................... -3.7 -1.5 -1.6 .1 -.8 -2.6 -.5 -6.2 -8.3 Other linens 2 ................................................................ -8.2 -6.1 -1.9 -4.2 -8.5 -4.2 -8.5 -1.5 -4.5
Furniture and bedding ..................................................... -1.1 -1.6 -.2 .6 -.7 -2.1 -.1 .0 -4.3 Bedroom furniture ......................................................... -1.6 -.3 5.0 4.7 -1.2 -1.6 .4 -2.4 -2.4 Living room, kitchen, and dining room furniture 2 ......... -1.0 -2.3 -1.9 -1.5 -.8 -1.9 -1.2 1.9 -3.3 Other furniture 2 ............................................................ -.3 -1.3 -3.7 -.4 .5 -3.4 1.9 -.8 -9.8 Infants’ furniture 1 4 ..................................................... - - - - -1.4 - - - -
Appliances 2 ................................................................... -3.1 -3.9 -3.8 2.8 1.1 1.4 1.4 -2.6 -1.4 Major appliances 2 ........................................................ -2.3 -3.7 -3.0 5.8 2.9 2.8 2.1 -2.9 -1.8 Laundry equipment 1 .................................................. -.1 -1.8 -3.8 5.1 1.5 3.2 .5 -3.3 -2.1
Other appliances 2 ........................................................ -4.1 -4.2 -4.8 -1.2 -1.3 -.5 .2 -2.1 -.9 Other household equipment and furnishings 2 ............... -4.3 -5.0 .5 -4.7 -5.4 -4.8 -.2 -3.5 -3.2
Clocks, lamps, and decorator items .............................. -5.3 -9.1 -.1 -7.7 -8.3 -9.6 -2.2 -5.1 -6.1 Indoor plants and flowers 9 ........................................... -.8 2.1 .8 1.9 -.7 2.0 4.7 -2.9 -.4 Dishes and flatware 2 ................................................... -5.4 -2.3 1.6 -6.8 -6.3 -2.6 -.8 -2.3 -.1 Nonelectric cookware and tableware 2 ......................... -4.6 -1.3 1.1 -1.0 1.0 3.0 2.1 .3 1.4
Tools, hardware, outdoor equipment and supplies 2 ...... -1.3 -2.6 1.6 .1 1.2 -1.1 .3 -1.5 -2.2 Tools, hardware and supplies 2 .................................... -1.6 -1.7 3.3 2.6 1.9 -1.1 .5 -2.5 -1.4 Outdoor equipment and supplies 2 ............................... -1.3 -3.1 .8 -1.1 .8 -1.0 -.1 -1.1 -2.6
Housekeeping supplies ................................................... -1.1 -.9 .9 2.3 4.0 1.5 6.9 .3 .2 Household cleaning products 2 ..................................... -1.4 -1.6 -.7 3.2 2.7 -.2 7.0 1.4 -1.6 Household paper products 2 ......................................... .0 -1.8 6.9 .5 6.6 3.8 11.4 .7 2.1 Miscellaneous household products 2 ............................ -1.6 .8 -1.2 2.5 3.8 2.0 3.5 -1.4 1.0
Household operations 2 .................................................. 2.3 2.3 3.6 5.0 4.4 2.2 6.0 -.3 .1 Domestic services 2 ...................................................... 4.0 2.6 1.9 5.1 4.6 1.7 2.9 .4 .0 Gardening and lawncare services 2 .............................. .1 1.3 4.7 - - - - - -.7
See footnotes at end of table.
81 CPI Detailed Report-September 2010
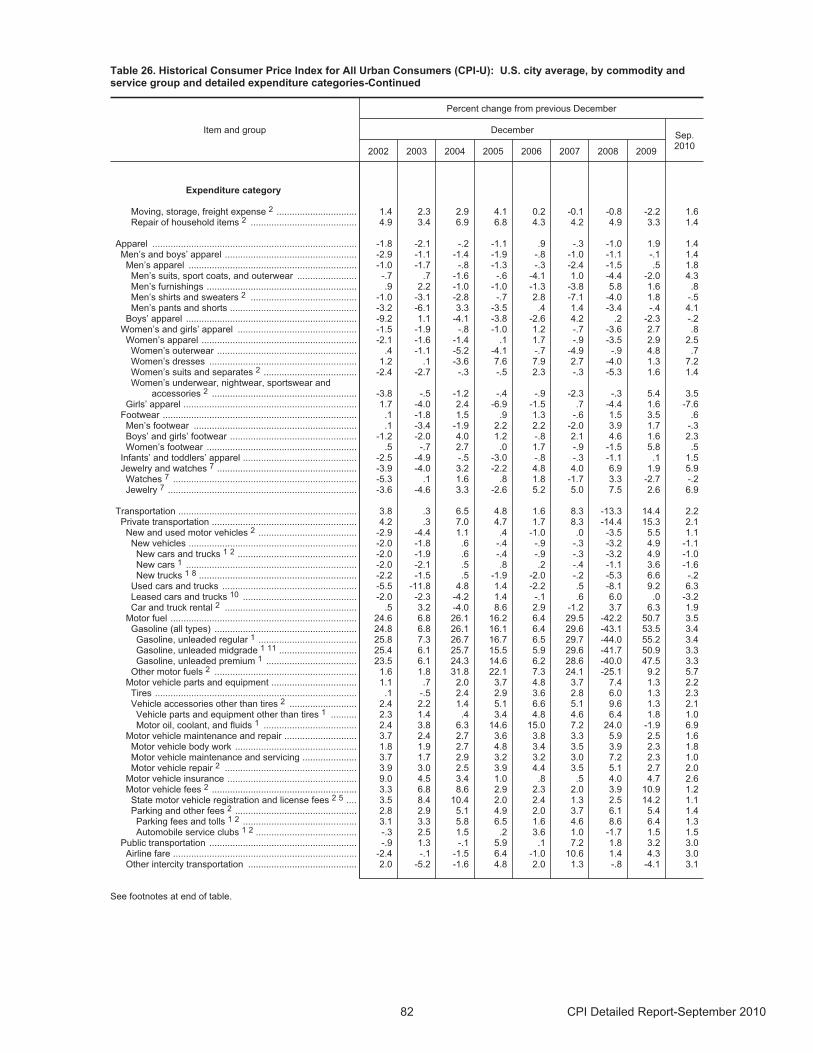
Table 26. Historical Consumer Price Index for All Urban Consumers (CPI-U): U.S. city average, by commodity andservice group and detailed expenditure categories-Continued
Item and group
Percent change from previous December
DecemberSep.2010
2002 2003 2004 2005 2006 2007 2008 2009
Expenditure category
Moving, storage, freight expense 2 ............................... 1.4 2.3 2.9 4.1 0.2 -0.1 -0.8 -2.2 1.6 Repair of household items 2 ......................................... 4.9 3.4 6.9 6.8 4.3 4.2 4.9 3.3 1.4
Apparel ............................................................................... -1.8 -2.1 -.2 -1.1 .9 -.3 -1.0 1.9 1.4 Men’s and boys’ apparel ................................................... -2.9 -1.1 -1.4 -1.9 -.8 -1.0 -1.1 -.1 1.4
Men’s apparel ................................................................. -1.0 -1.7 -.8 -1.3 -.3 -2.4 -1.5 .5 1.8 Men’s suits, sport coats, and outerwear ....................... -.7 .7 -1.6 -.6 -4.1 1.0 -4.4 -2.0 4.3 Men’s furnishings .......................................................... .9 2.2 -1.0 -1.0 -1.3 -3.8 5.8 1.6 .8 Men’s shirts and sweaters 2 ......................................... -1.0 -3.1 -2.8 -.7 2.8 -7.1 -4.0 1.8 -.5 Men’s pants and shorts ................................................. -3.2 -6.1 3.3 -3.5 .4 1.4 -3.4 -.4 4.1
Boys’ apparel .................................................................. -9.2 1.1 -4.1 -3.8 -2.6 4.2 .2 -2.3 -.2 Women’s and girls’ apparel .............................................. -1.5 -1.9 -.8 -1.0 1.2 -.7 -3.6 2.7 .8
Women’s apparel ............................................................ -2.1 -1.6 -1.4 .1 1.7 -.9 -3.5 2.9 2.5 Women’s outerwear ...................................................... .4 -1.1 -5.2 -4.1 -.7 -4.9 -.9 4.8 .7 Women’s dresses ......................................................... 1.2 .1 -3.6 7.6 7.9 2.7 -4.0 1.3 7.2 Women’s suits and separates 2 .................................... -2.4 -2.7 -.3 -.5 2.3 -.3 -5.3 1.6 1.4 Women’s underwear, nightwear, sportswear and
accessories 2 ........................................................ -3.8 -.5 -1.2 -.4 -.9 -2.3 -.3 5.4 3.5 Girls’ apparel ................................................................... 1.7 -4.0 2.4 -6.9 -1.5 .7 -4.4 1.6 -7.6
Footwear ........................................................................... .1 -1.8 1.5 .9 1.3 -.6 1.5 3.5 .6 Men’s footwear ............................................................... .1 -3.4 -1.9 2.2 2.2 -2.0 3.9 1.7 -.3 Boys’ and girls’ footwear ................................................. -1.2 -2.0 4.0 1.2 -.8 2.1 4.6 1.6 2.3 Women’s footwear .......................................................... .5 -.7 2.7 .0 1.7 -.9 -1.5 5.8 .5
Infants’ and toddlers’ apparel ............................................ -2.5 -4.9 -.5 -3.0 -.8 -.3 -1.1 .1 1.5 Jewelry and watches 7 ...................................................... -3.9 -4.0 3.2 -2.2 4.8 4.0 6.9 1.9 5.9
Watches 7 ....................................................................... -5.3 .1 1.6 .8 1.8 -1.7 3.3 -2.7 -.2 Jewelry 7 ......................................................................... -3.6 -4.6 3.3 -2.6 5.2 5.0 7.5 2.6 6.9
Transportation ..................................................................... 3.8 .3 6.5 4.8 1.6 8.3 -13.3 14.4 2.2 Private transportation ........................................................ 4.2 .3 7.0 4.7 1.7 8.3 -14.4 15.3 2.1
New and used motor vehicles 2 ...................................... -2.9 -4.4 1.1 .4 -1.0 .0 -3.5 5.5 1.1 New vehicles ................................................................. -2.0 -1.8 .6 -.4 -.9 -.3 -3.2 4.9 -1.1
New cars and trucks 1 2 .............................................. -2.0 -1.9 .6 -.4 -.9 -.3 -3.2 4.9 -1.0 New cars 1 .................................................................. -2.0 -2.1 .5 .8 .2 -.4 -1.1 3.6 -1.6 New trucks 1 8 ............................................................. -2.2 -1.5 .5 -1.9 -2.0 -.2 -5.3 6.6 -.2
Used cars and trucks .................................................... -5.5 -11.8 4.8 1.4 -2.2 .5 -8.1 9.2 6.3 Leased cars and trucks 10 ............................................ -2.0 -2.3 -4.2 1.4 -.1 .6 6.0 .0 -3.2 Car and truck rental 2 ................................................... .5 3.2 -4.0 8.6 2.9 -1.2 3.7 6.3 1.9
Motor fuel ........................................................................ 24.6 6.8 26.1 16.2 6.4 29.5 -42.2 50.7 3.5 Gasoline (all types) ....................................................... 24.8 6.8 26.1 16.1 6.4 29.6 -43.1 53.5 3.4
Gasoline, unleaded regular 1 ...................................... 25.8 7.3 26.7 16.7 6.5 29.7 -44.0 55.2 3.4 Gasoline, unleaded midgrade 1 11 .............................. 25.4 6.1 25.7 15.5 5.9 29.6 -41.7 50.9 3.3 Gasoline, unleaded premium 1 ................................... 23.5 6.1 24.3 14.6 6.2 28.6 -40.0 47.5 3.3
Other motor fuels 2 ....................................................... 1.6 1.8 31.8 22.1 7.3 24.1 -25.1 9.2 5.7 Motor vehicle parts and equipment ................................. 1.1 .7 2.0 3.7 4.8 3.7 7.4 1.3 2.2
Tires .............................................................................. .1 -.5 2.4 2.9 3.6 2.8 6.0 1.3 2.3 Vehicle accessories other than tires 2 .......................... 2.4 2.2 1.4 5.1 6.6 5.1 9.6 1.3 2.1 Vehicle parts and equipment other than tires 1 .......... 2.3 1.4 .4 3.4 4.8 4.6 6.4 1.8 1.0 Motor oil, coolant, and fluids 1 .................................... 2.4 3.8 6.3 14.6 15.0 7.2 24.0 -1.9 6.9
Motor vehicle maintenance and repair ............................ 3.7 2.4 2.7 3.6 3.8 3.3 5.9 2.5 1.6 Motor vehicle body work ............................................... 1.8 1.9 2.7 4.8 3.4 3.5 3.9 2.3 1.8 Motor vehicle maintenance and servicing ..................... 3.7 1.7 2.9 3.2 3.2 3.0 7.2 2.3 1.0 Motor vehicle repair 2 ................................................... 3.9 3.0 2.5 3.9 4.4 3.5 5.1 2.7 2.0
Motor vehicle insurance .................................................. 9.0 4.5 3.4 1.0 .8 .5 4.0 4.7 2.6 Motor vehicle fees 2 ........................................................ 3.3 6.8 8.6 2.9 2.3 2.0 3.9 10.9 1.2 State motor vehicle registration and license fees 2 5 .... 3.5 8.4 10.4 2.0 2.4 1.3 2.5 14.2 1.1 Parking and other fees 2 ............................................... 2.8 2.9 5.1 4.9 2.0 3.7 6.1 5.4 1.4 Parking fees and tolls 1 2 ............................................ 3.1 3.3 5.8 6.5 1.6 4.6 8.6 6.4 1.3 Automobile service clubs 1 2 ....................................... -.3 2.5 1.5 .2 3.6 1.0 -1.7 1.5 1.5
Public transportation ......................................................... -.9 1.3 -.1 5.9 .1 7.2 1.8 3.2 3.0 Airline fare ....................................................................... -2.4 -.1 -1.5 6.4 -1.0 10.6 1.4 4.3 3.0 Other intercity transportation .......................................... 2.0 -5.2 -1.6 4.8 2.0 1.3 -.8 -4.1 3.1
See footnotes at end of table.
82 CPI Detailed Report-September 2010
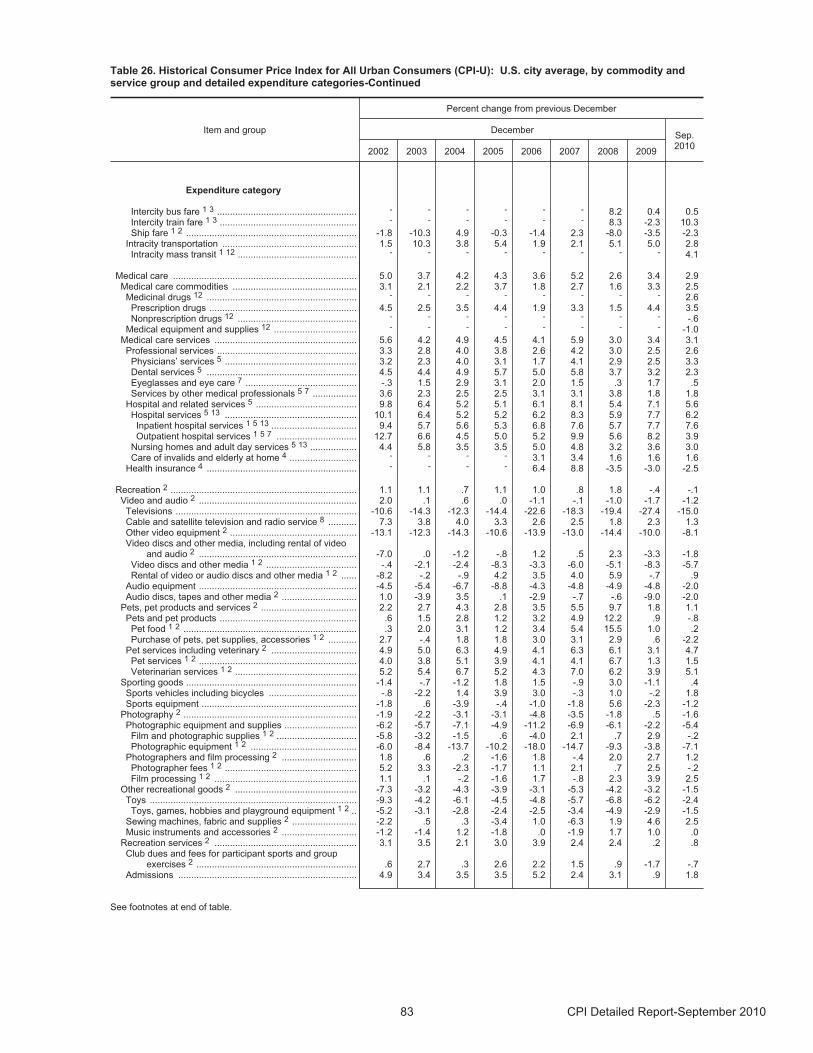
Table 26. Historical Consumer Price Index for All Urban Consumers (CPI-U): U.S. city average, by commodity andservice group and detailed expenditure categories-Continued
Item and group
Percent change from previous December
DecemberSep.2010
2002 2003 2004 2005 2006 2007 2008 2009
Expenditure category
Intercity bus fare 1 3 ...................................................... - - - - - - 8.2 0.4 0.5 Intercity train fare 1 3 ..................................................... - - - - - - 8.3 -2.3 10.3 Ship fare 1 2 .................................................................. -1.8 -10.3 4.9 -0.3 -1.4 2.3 -8.0 -3.5 -2.3
Intracity transportation .................................................... 1.5 10.3 3.8 5.4 1.9 2.1 5.1 5.0 2.8 Intracity mass transit 1 12 .............................................. - - - - - - - - 4.1
Medical care ....................................................................... 5.0 3.7 4.2 4.3 3.6 5.2 2.6 3.4 2.9 Medical care commodities ................................................ 3.1 2.1 2.2 3.7 1.8 2.7 1.6 3.3 2.5
Medicinal drugs 12 .......................................................... - - - - - - - - 2.6 Prescription drugs ......................................................... 4.5 2.5 3.5 4.4 1.9 3.3 1.5 4.4 3.5 Nonprescription drugs 12 .............................................. - - - - - - - - -.6
Medical equipment and supplies 12 ................................ - - - - - - - - -1.0 Medical care services ....................................................... 5.6 4.2 4.9 4.5 4.1 5.9 3.0 3.4 3.1
Professional services ...................................................... 3.3 2.8 4.0 3.8 2.6 4.2 3.0 2.5 2.6 Physicians’ services 5 ................................................... 3.2 2.3 4.0 3.1 1.7 4.1 2.9 2.5 3.3 Dental services 5 .......................................................... 4.5 4.4 4.9 5.7 5.0 5.8 3.7 3.2 2.3 Eyeglasses and eye care 7 ........................................... -.3 1.5 2.9 3.1 2.0 1.5 .3 1.7 .5 Services by other medical professionals 5 7 ................. 3.6 2.3 2.5 2.5 3.1 3.1 3.8 1.8 1.8
Hospital and related services 5 ....................................... 9.8 6.4 5.2 5.1 6.1 8.1 5.4 7.1 5.6 Hospital services 5 13 ................................................... 10.1 6.4 5.2 5.2 6.2 8.3 5.9 7.7 6.2 Inpatient hospital services 1 5 13 ................................. 9.4 5.7 5.6 5.3 6.8 7.6 5.7 7.7 7.6 Outpatient hospital services 1 5 7 ............................... 12.7 6.6 4.5 5.0 5.2 9.9 5.6 8.2 3.9
Nursing homes and adult day services 5 13 .................. 4.4 5.8 3.5 3.5 5.0 4.8 3.2 3.6 3.0 Care of invalids and elderly at home 4 .......................... - - - - 3.1 3.4 1.6 1.6 1.6
Health insurance 4 .......................................................... - - - - 6.4 8.8 -3.5 -3.0 -2.5
Recreation 2 ........................................................................ 1.1 1.1 .7 1.1 1.0 .8 1.8 -.4 -.1 Video and audio 2 ............................................................. 2.0 .1 .6 .0 -1.1 -.1 -1.0 -1.7 -1.2 Televisions ...................................................................... -10.6 -14.3 -12.3 -14.4 -22.6 -18.3 -19.4 -27.4 -15.0 Cable and satellite television and radio service 8 ........... 7.3 3.8 4.0 3.3 2.6 2.5 1.8 2.3 1.3 Other video equipment 2 ................................................. -13.1 -12.3 -14.3 -10.6 -13.9 -13.0 -14.4 -10.0 -8.1 Video discs and other media, including rental of video
and audio 2 ............................................................. -7.0 .0 -1.2 -.8 1.2 .5 2.3 -3.3 -1.8 Video discs and other media 1 2 ................................... -.4 -2.1 -2.4 -8.3 -3.3 -6.0 -5.1 -8.3 -5.7 Rental of video or audio discs and other media 1 2 ...... -8.2 -.2 -.9 4.2 3.5 4.0 5.9 -.7 .9
Audio equipment ............................................................. -4.5 -5.4 -6.7 -8.8 -4.3 -4.8 -4.9 -4.8 -2.0 Audio discs, tapes and other media 2 ............................. 1.0 -3.9 3.5 .1 -2.9 -.7 -.6 -9.0 -2.0
Pets, pet products and services 2 ..................................... 2.2 2.7 4.3 2.8 3.5 5.5 9.7 1.8 1.1 Pets and pet products ..................................................... .6 1.5 2.8 1.2 3.2 4.9 12.2 .9 -.8
Pet food 1 2 ................................................................... .3 2.0 3.1 1.2 3.4 5.4 15.5 1.0 .2 Purchase of pets, pet supplies, accessories 1 2 ........... 2.7 -.4 1.8 1.8 3.0 3.1 2.9 .6 -2.2
Pet services including veterinary 2 ................................. 4.9 5.0 6.3 4.9 4.1 6.3 6.1 3.1 4.7 Pet services 1 2 ............................................................. 4.0 3.8 5.1 3.9 4.1 4.1 6.7 1.3 1.5 Veterinarian services 1 2 ............................................... 5.2 5.4 6.7 5.2 4.3 7.0 6.2 3.9 5.1
Sporting goods .................................................................. -1.4 -.7 -1.2 1.8 1.5 -.9 3.0 -1.1 .4 Sports vehicles including bicycles .................................. -.8 -2.2 1.4 3.9 3.0 -.3 1.0 -.2 1.8 Sports equipment ............................................................ -1.8 .6 -3.9 -.4 -1.0 -1.8 5.6 -2.3 -1.2
Photography 2 ................................................................... -1.9 -2.2 -3.1 -3.1 -4.8 -3.5 -1.8 .5 -1.6 Photographic equipment and supplies ............................ -6.2 -5.7 -7.1 -4.9 -11.2 -6.9 -6.1 -2.2 -5.4
Film and photographic supplies 1 2 ............................... -5.8 -3.2 -1.5 .6 -4.0 2.1 .7 2.9 -.2 Photographic equipment 1 2 ......................................... -6.0 -8.4 -13.7 -10.2 -18.0 -14.7 -9.3 -3.8 -7.1
Photographers and film processing 2 ............................. 1.8 .6 .2 -1.6 1.8 -.4 2.0 2.7 1.2 Photographer fees 1 2 ................................................... 5.2 3.3 -2.3 -1.7 1.1 2.1 .7 2.5 -.2 Film processing 1 2 ....................................................... 1.1 .1 -.2 -1.6 1.7 -.8 2.3 3.9 2.5
Other recreational goods 2 ............................................... -7.3 -3.2 -4.3 -3.9 -3.1 -5.3 -4.2 -3.2 -1.5 Toys ................................................................................ -9.3 -4.2 -6.1 -4.5 -4.8 -5.7 -6.8 -6.2 -2.4Toys, games, hobbies and playground equipment 1 2 .. -5.2 -3.1 -2.8 -2.4 -2.5 -3.4 -4.9 -2.9 -1.5
Sewing machines, fabric and supplies 2 ......................... -2.2 .5 .3 -3.4 1.0 -6.3 1.9 4.6 2.5 Music instruments and accessories 2 ............................. -1.2 -1.4 1.2 -1.8 .0 -1.9 1.7 1.0 .0
Recreation services 2 ....................................................... 3.1 3.5 2.1 3.0 3.9 2.4 2.4 .2 .8 Club dues and fees for participant sports and group
exercises 2 .............................................................. .6 2.7 .3 2.6 2.2 1.5 .9 -1.7 -.7 Admissions ..................................................................... 4.9 3.4 3.5 3.5 5.2 2.4 3.1 .9 1.8
See footnotes at end of table.
83 CPI Detailed Report-September 2010
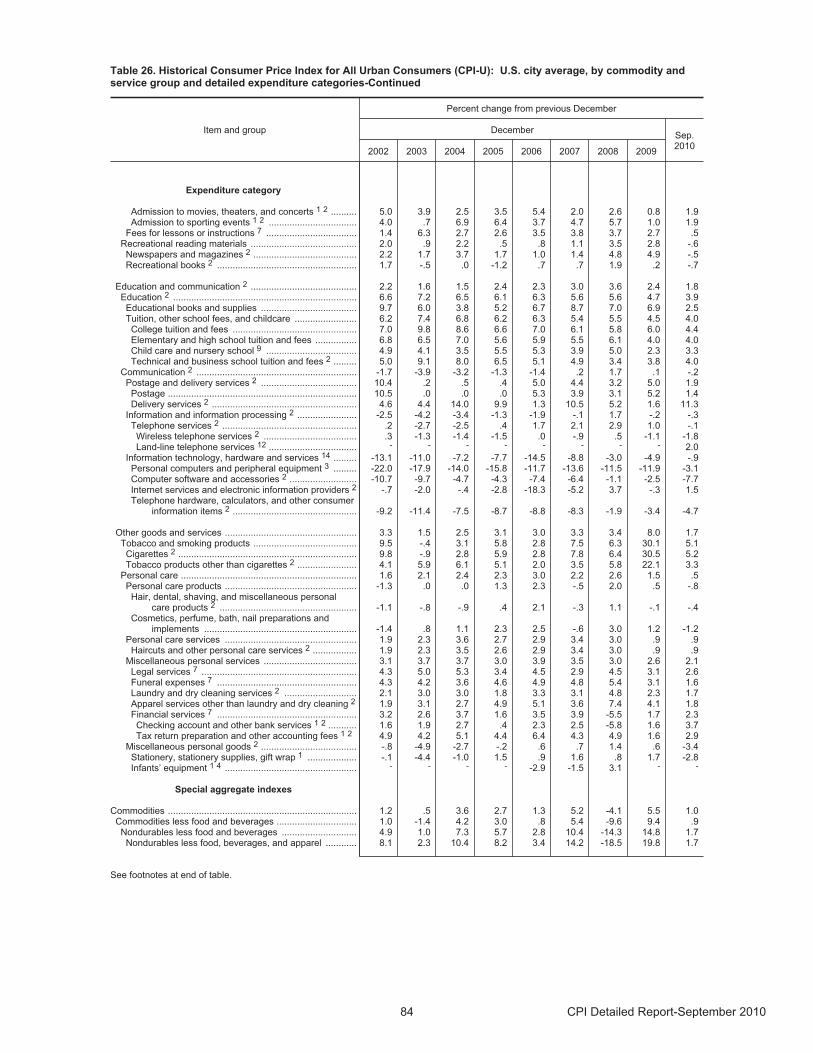
Table 26. Historical Consumer Price Index for All Urban Consumers (CPI-U): U.S. city average, by commodity andservice group and detailed expenditure categories-Continued
Item and group
Percent change from previous December
DecemberSep.2010
2002 2003 2004 2005 2006 2007 2008 2009
Expenditure category
Admission to movies, theaters, and concerts 1 2 .......... 5.0 3.9 2.5 3.5 5.4 2.0 2.6 0.8 1.9 Admission to sporting events 1 2 .................................. 4.0 .7 6.9 6.4 3.7 4.7 5.7 1.0 1.9
Fees for lessons or instructions 7 ................................... 1.4 6.3 2.7 2.6 3.5 3.8 3.7 2.7 .5 Recreational reading materials ......................................... 2.0 .9 2.2 .5 .8 1.1 3.5 2.8 -.6
Newspapers and magazines 2 ........................................ 2.2 1.7 3.7 1.7 1.0 1.4 4.8 4.9 -.5 Recreational books 2 ...................................................... 1.7 -.5 .0 -1.2 .7 .7 1.9 .2 -.7
Education and communication 2 ......................................... 2.2 1.6 1.5 2.4 2.3 3.0 3.6 2.4 1.8 Education 2 ....................................................................... 6.6 7.2 6.5 6.1 6.3 5.6 5.6 4.7 3.9 Educational books and supplies ..................................... 9.7 6.0 3.8 5.2 6.7 8.7 7.0 6.9 2.5 Tuition, other school fees, and childcare ........................ 6.2 7.4 6.8 6.2 6.3 5.4 5.5 4.5 4.0
College tuition and fees ................................................ 7.0 9.8 8.6 6.6 7.0 6.1 5.8 6.0 4.4 Elementary and high school tuition and fees ................ 6.8 6.5 7.0 5.6 5.9 5.5 6.1 4.0 4.0 Child care and nursery school 9 ................................... 4.9 4.1 3.5 5.5 5.3 3.9 5.0 2.3 3.3 Technical and business school tuition and fees 2 ......... 5.0 9.1 8.0 6.5 5.1 4.9 3.4 3.8 4.0
Communication 2 .............................................................. -1.7 -3.9 -3.2 -1.3 -1.4 .2 1.7 .1 -.2 Postage and delivery services 2 ..................................... 10.4 .2 .5 .4 5.0 4.4 3.2 5.0 1.9 Postage ......................................................................... 10.5 .0 .0 .0 5.3 3.9 3.1 5.2 1.4 Delivery services 2 ........................................................ 4.6 4.4 14.0 9.9 1.3 10.5 5.2 1.6 11.3
Information and information processing 2 ....................... -2.5 -4.2 -3.4 -1.3 -1.9 -.1 1.7 -.2 -.3 Telephone services 2 .................................................... .2 -2.7 -2.5 .4 1.7 2.1 2.9 1.0 -.1 Wireless telephone services 2 .................................... .3 -1.3 -1.4 -1.5 .0 -.9 .5 -1.1 -1.8 Land-line telephone services 12 .................................. - - - - - - - - 2.0
Information technology, hardware and services 14 ......... -13.1 -11.0 -7.2 -7.7 -14.5 -8.8 -3.0 -4.9 -.9 Personal computers and peripheral equipment 3 ......... -22.0 -17.9 -14.0 -15.8 -11.7 -13.6 -11.5 -11.9 -3.1 Computer software and accessories 2 .......................... -10.7 -9.7 -4.7 -4.3 -7.4 -6.4 -1.1 -2.5 -7.7 Internet services and electronic information providers 2 -.7 -2.0 -.4 -2.8 -18.3 -5.2 3.7 -.3 1.5 Telephone hardware, calculators, and other consumer
information items 2 ................................................ -9.2 -11.4 -7.5 -8.7 -8.8 -8.3 -1.9 -3.4 -4.7
Other goods and services ................................................... 3.3 1.5 2.5 3.1 3.0 3.3 3.4 8.0 1.7 Tobacco and smoking products ........................................ 9.5 -.4 3.1 5.8 2.8 7.5 6.3 30.1 5.1
Cigarettes 2 ..................................................................... 9.8 -.9 2.8 5.9 2.8 7.8 6.4 30.5 5.2 Tobacco products other than cigarettes 2 ....................... 4.1 5.9 6.1 5.1 2.0 3.5 5.8 22.1 3.3
Personal care .................................................................... 1.6 2.1 2.4 2.3 3.0 2.2 2.6 1.5 .5 Personal care products ................................................... -1.3 .0 .0 1.3 2.3 -.5 2.0 .5 -.8
Hair, dental, shaving, and miscellaneous personalcare products 2 ..................................................... -1.1 -.8 -.9 .4 2.1 -.3 1.1 -.1 -.4
Cosmetics, perfume, bath, nail preparations andimplements ........................................................... -1.4 .8 1.1 2.3 2.5 -.6 3.0 1.2 -1.2
Personal care services ................................................... 1.9 2.3 3.6 2.7 2.9 3.4 3.0 .9 .9 Haircuts and other personal care services 2 ................. 1.9 2.3 3.5 2.6 2.9 3.4 3.0 .9 .9
Miscellaneous personal services .................................... 3.1 3.7 3.7 3.0 3.9 3.5 3.0 2.6 2.1 Legal services 7 ............................................................ 4.3 5.0 5.3 3.4 4.5 2.9 4.5 3.1 2.6 Funeral expenses 7 ...................................................... 4.3 4.2 3.6 4.6 4.9 4.8 5.4 3.1 1.6 Laundry and dry cleaning services 2 ............................ 2.1 3.0 3.0 1.8 3.3 3.1 4.8 2.3 1.7 Apparel services other than laundry and dry cleaning 2 1.9 3.1 2.7 4.9 5.1 3.6 7.4 4.1 1.8 Financial services 7 ...................................................... 3.2 2.6 3.7 1.6 3.5 3.9 -5.5 1.7 2.3 Checking account and other bank services 1 2 ........... 1.6 1.9 2.7 .4 2.3 2.5 -5.8 1.6 3.7 Tax return preparation and other accounting fees 1 2 4.9 4.2 5.1 4.4 6.4 4.3 4.9 1.6 2.9
Miscellaneous personal goods 2 ..................................... -.8 -4.9 -2.7 -.2 .6 .7 1.4 .6 -3.4 Stationery, stationery supplies, gift wrap 1 ................... -.1 -4.4 -1.0 1.5 .9 1.6 .8 1.7 -2.8 Infants’ equipment 1 4 ................................................... - - - - -2.9 -1.5 3.1 - -
Special aggregate indexes
Commodities ......................................................................... 1.2 .5 3.6 2.7 1.3 5.2 -4.1 5.5 1.0 Commodities less food and beverages ............................... 1.0 -1.4 4.2 3.0 .8 5.4 -9.6 9.4 .9 Nondurables less food and beverages ............................. 4.9 1.0 7.3 5.7 2.8 10.4 -14.3 14.8 1.7
Nondurables less food, beverages, and apparel ............ 8.1 2.3 10.4 8.2 3.4 14.2 -18.5 19.8 1.7
See footnotes at end of table.
84 CPI Detailed Report-September 2010
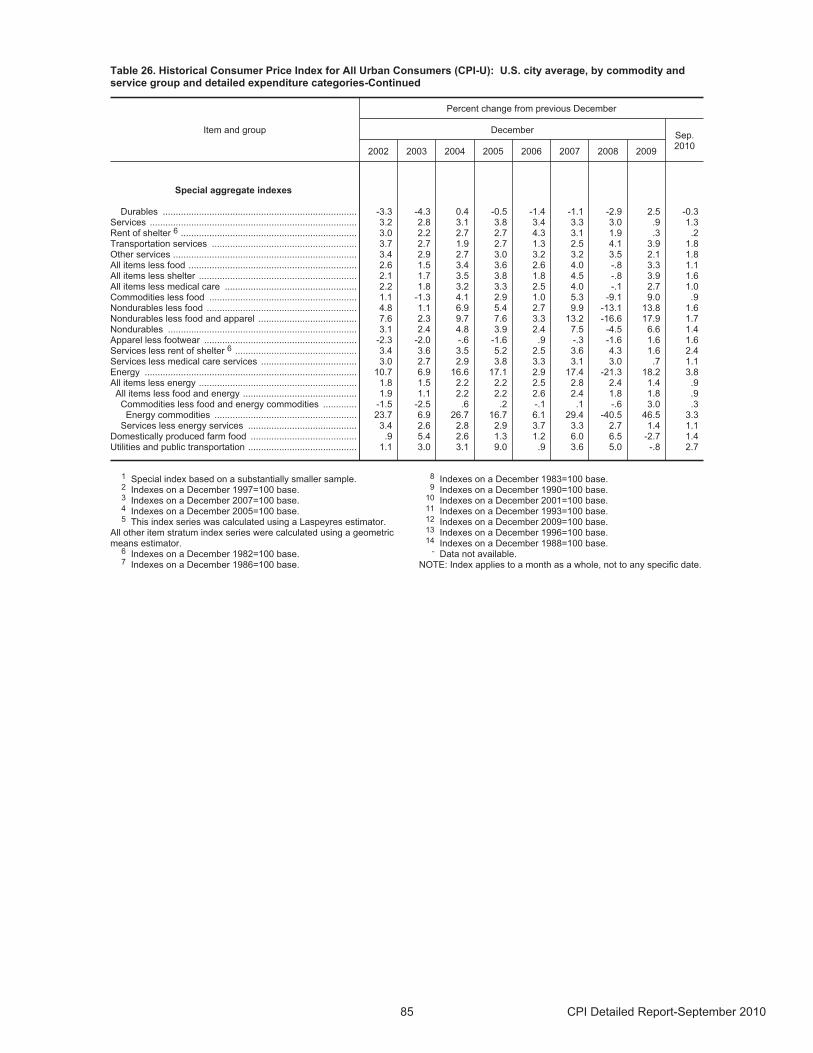
Table 26. Historical Consumer Price Index for All Urban Consumers (CPI-U): U.S. city average, by commodity andservice group and detailed expenditure categories-Continued
Item and group
Percent change from previous December
DecemberSep.2010
2002 2003 2004 2005 2006 2007 2008 2009
Special aggregate indexes
Durables ........................................................................... -3.3 -4.3 0.4 -0.5 -1.4 -1.1 -2.9 2.5 -0.3 Services ................................................................................ 3.2 2.8 3.1 3.8 3.4 3.3 3.0 .9 1.3 Rent of shelter 6 .................................................................... 3.0 2.2 2.7 2.7 4.3 3.1 1.9 .3 .2 Transportation services ........................................................ 3.7 2.7 1.9 2.7 1.3 2.5 4.1 3.9 1.8 Other services ....................................................................... 3.4 2.9 2.7 3.0 3.2 3.2 3.5 2.1 1.8 All items less food ................................................................. 2.6 1.5 3.4 3.6 2.6 4.0 -.8 3.3 1.1 All items less shelter ............................................................. 2.1 1.7 3.5 3.8 1.8 4.5 -.8 3.9 1.6 All items less medical care ................................................... 2.2 1.8 3.2 3.3 2.5 4.0 -.1 2.7 1.0 Commodities less food ......................................................... 1.1 -1.3 4.1 2.9 1.0 5.3 -9.1 9.0 .9 Nondurables less food .......................................................... 4.8 1.1 6.9 5.4 2.7 9.9 -13.1 13.8 1.6 Nondurables less food and apparel ...................................... 7.6 2.3 9.7 7.6 3.3 13.2 -16.6 17.9 1.7 Nondurables ......................................................................... 3.1 2.4 4.8 3.9 2.4 7.5 -4.5 6.6 1.4 Apparel less footwear ........................................................... -2.3 -2.0 -.6 -1.6 .9 -.3 -1.6 1.6 1.6 Services less rent of shelter 6 ............................................... 3.4 3.6 3.5 5.2 2.5 3.6 4.3 1.6 2.4 Services less medical care services ..................................... 3.0 2.7 2.9 3.8 3.3 3.1 3.0 .7 1.1 Energy .................................................................................. 10.7 6.9 16.6 17.1 2.9 17.4 -21.3 18.2 3.8All items less energy ............................................................. 1.8 1.5 2.2 2.2 2.5 2.8 2.4 1.4 .9
All items less food and energy ............................................ 1.9 1.1 2.2 2.2 2.6 2.4 1.8 1.8 .9 Commodities less food and energy commodities ............. -1.5 -2.5 .6 .2 -.1 .1 -.6 3.0 .3
Energy commodities ....................................................... 23.7 6.9 26.7 16.7 6.1 29.4 -40.5 46.5 3.3 Services less energy services .......................................... 3.4 2.6 2.8 2.9 3.7 3.3 2.7 1.4 1.1
Domestically produced farm food ......................................... .9 5.4 2.6 1.3 1.2 6.0 6.5 -2.7 1.4 Utilities and public transportation .......................................... 1.1 3.0 3.1 9.0 .9 3.6 5.0 -.8 2.7
1 Special index based on a substantially smaller sample.2 Indexes on a December 1997=100 base.3 Indexes on a December 2007=100 base.4 Indexes on a December 2005=100 base.5 This index series was calculated using a Laspeyres estimator.
All other item stratum index series were calculated using a geometricmeans estimator.
6 Indexes on a December 1982=100 base.7 Indexes on a December 1986=100 base.
8 Indexes on a December 1983=100 base.9 Indexes on a December 1990=100 base.
10 Indexes on a December 2001=100 base.11 Indexes on a December 1993=100 base.12 Indexes on a December 2009=100 base.13 Indexes on a December 1996=100 base.14 Indexes on a December 1988=100 base.
- Data not available.NOTE: Index applies to a month as a whole, not to any specific date.
85 CPI Detailed Report-September 2010
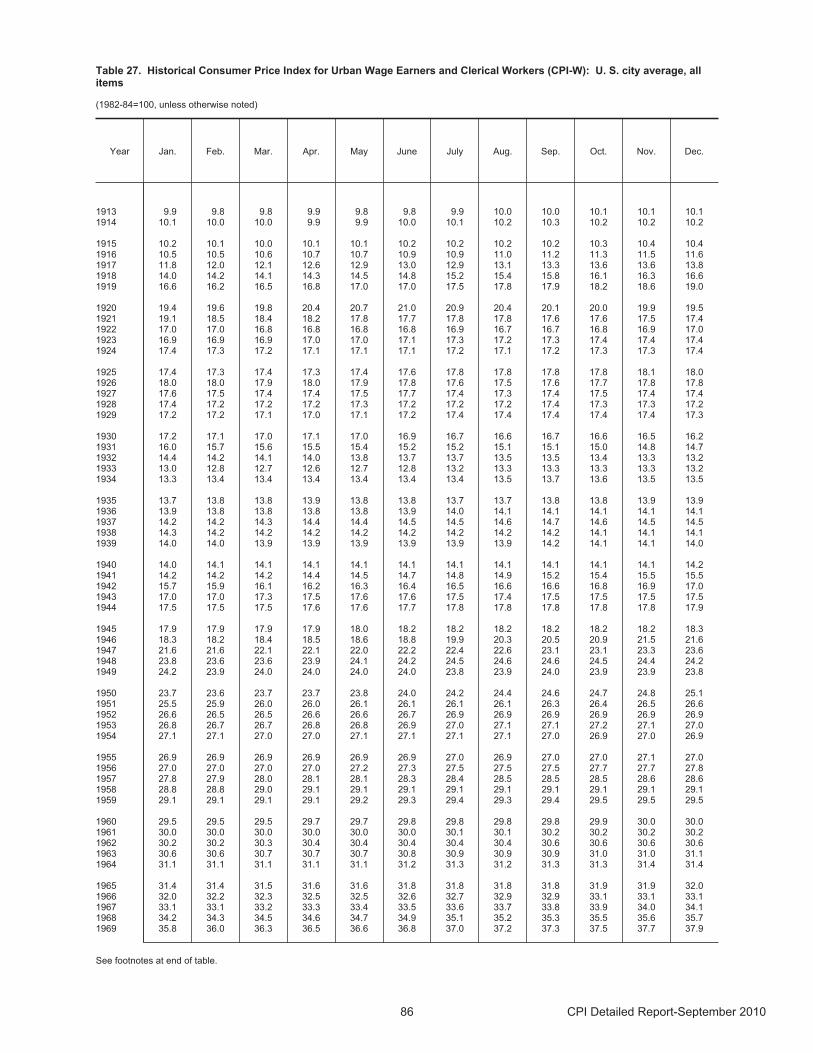
Table 27. Historical Consumer Price Index for Urban Wage Earners and Clerical Workers (CPI-W): U. S. city average, allitems
(1982-84=100, unless otherwise noted)
Year Jan. Feb. Mar. Apr. May June July Aug. Sep. Oct. Nov. Dec.
1913 9.9 9.8 9.8 9.9 9.8 9.8 9.9 10.0 10.0 10.1 10.1 10.1 1914 10.1 10.0 10.0 9.9 9.9 10.0 10.1 10.2 10.3 10.2 10.2 10.2
1915 10.2 10.1 10.0 10.1 10.1 10.2 10.2 10.2 10.2 10.3 10.4 10.4 1916 10.5 10.5 10.6 10.7 10.7 10.9 10.9 11.0 11.2 11.3 11.5 11.6 1917 11.8 12.0 12.1 12.6 12.9 13.0 12.9 13.1 13.3 13.6 13.6 13.8 1918 14.0 14.2 14.1 14.3 14.5 14.8 15.2 15.4 15.8 16.1 16.3 16.6 1919 16.6 16.2 16.5 16.8 17.0 17.0 17.5 17.8 17.9 18.2 18.6 19.0
1920 19.4 19.6 19.8 20.4 20.7 21.0 20.9 20.4 20.1 20.0 19.9 19.5 1921 19.1 18.5 18.4 18.2 17.8 17.7 17.8 17.8 17.6 17.6 17.5 17.4 1922 17.0 17.0 16.8 16.8 16.8 16.8 16.9 16.7 16.7 16.8 16.9 17.0 1923 16.9 16.9 16.9 17.0 17.0 17.1 17.3 17.2 17.3 17.4 17.4 17.4 1924 17.4 17.3 17.2 17.1 17.1 17.1 17.2 17.1 17.2 17.3 17.3 17.4
1925 17.4 17.3 17.4 17.3 17.4 17.6 17.8 17.8 17.8 17.8 18.1 18.0 1926 18.0 18.0 17.9 18.0 17.9 17.8 17.6 17.5 17.6 17.7 17.8 17.8 1927 17.6 17.5 17.4 17.4 17.5 17.7 17.4 17.3 17.4 17.5 17.4 17.4 1928 17.4 17.2 17.2 17.2 17.3 17.2 17.2 17.2 17.4 17.3 17.3 17.2 1929 17.2 17.2 17.1 17.0 17.1 17.2 17.4 17.4 17.4 17.4 17.4 17.3
1930 17.2 17.1 17.0 17.1 17.0 16.9 16.7 16.6 16.7 16.6 16.5 16.2 1931 16.0 15.7 15.6 15.5 15.4 15.2 15.2 15.1 15.1 15.0 14.8 14.7 1932 14.4 14.2 14.1 14.0 13.8 13.7 13.7 13.5 13.5 13.4 13.3 13.2 1933 13.0 12.8 12.7 12.6 12.7 12.8 13.2 13.3 13.3 13.3 13.3 13.2 1934 13.3 13.4 13.4 13.4 13.4 13.4 13.4 13.5 13.7 13.6 13.5 13.5
1935 13.7 13.8 13.8 13.9 13.8 13.8 13.7 13.7 13.8 13.8 13.9 13.9 1936 13.9 13.8 13.8 13.8 13.8 13.9 14.0 14.1 14.1 14.1 14.1 14.1 1937 14.2 14.2 14.3 14.4 14.4 14.5 14.5 14.6 14.7 14.6 14.5 14.5 1938 14.3 14.2 14.2 14.2 14.2 14.2 14.2 14.2 14.2 14.1 14.1 14.1 1939 14.0 14.0 13.9 13.9 13.9 13.9 13.9 13.9 14.2 14.1 14.1 14.0
1940 14.0 14.1 14.1 14.1 14.1 14.1 14.1 14.1 14.1 14.1 14.1 14.2 1941 14.2 14.2 14.2 14.4 14.5 14.7 14.8 14.9 15.2 15.4 15.5 15.5 1942 15.7 15.9 16.1 16.2 16.3 16.4 16.5 16.6 16.6 16.8 16.9 17.0 1943 17.0 17.0 17.3 17.5 17.6 17.6 17.5 17.4 17.5 17.5 17.5 17.5 1944 17.5 17.5 17.5 17.6 17.6 17.7 17.8 17.8 17.8 17.8 17.8 17.9
1945 17.9 17.9 17.9 17.9 18.0 18.2 18.2 18.2 18.2 18.2 18.2 18.3 1946 18.3 18.2 18.4 18.5 18.6 18.8 19.9 20.3 20.5 20.9 21.5 21.6 1947 21.6 21.6 22.1 22.1 22.0 22.2 22.4 22.6 23.1 23.1 23.3 23.6 1948 23.8 23.6 23.6 23.9 24.1 24.2 24.5 24.6 24.6 24.5 24.4 24.2 1949 24.2 23.9 24.0 24.0 24.0 24.0 23.8 23.9 24.0 23.9 23.9 23.8
1950 23.7 23.6 23.7 23.7 23.8 24.0 24.2 24.4 24.6 24.7 24.8 25.1 1951 25.5 25.9 26.0 26.0 26.1 26.1 26.1 26.1 26.3 26.4 26.5 26.6 1952 26.6 26.5 26.5 26.6 26.6 26.7 26.9 26.9 26.9 26.9 26.9 26.9 1953 26.8 26.7 26.7 26.8 26.8 26.9 27.0 27.1 27.1 27.2 27.1 27.0 1954 27.1 27.1 27.0 27.0 27.1 27.1 27.1 27.1 27.0 26.9 27.0 26.9
1955 26.9 26.9 26.9 26.9 26.9 26.9 27.0 26.9 27.0 27.0 27.1 27.0 1956 27.0 27.0 27.0 27.0 27.2 27.3 27.5 27.5 27.5 27.7 27.7 27.8 1957 27.8 27.9 28.0 28.1 28.1 28.3 28.4 28.5 28.5 28.5 28.6 28.6 1958 28.8 28.8 29.0 29.1 29.1 29.1 29.1 29.1 29.1 29.1 29.1 29.1 1959 29.1 29.1 29.1 29.1 29.2 29.3 29.4 29.3 29.4 29.5 29.5 29.5
1960 29.5 29.5 29.5 29.7 29.7 29.8 29.8 29.8 29.8 29.9 30.0 30.0 1961 30.0 30.0 30.0 30.0 30.0 30.0 30.1 30.1 30.2 30.2 30.2 30.2 1962 30.2 30.2 30.3 30.4 30.4 30.4 30.4 30.4 30.6 30.6 30.6 30.6 1963 30.6 30.6 30.7 30.7 30.7 30.8 30.9 30.9 30.9 31.0 31.0 31.1 1964 31.1 31.1 31.1 31.1 31.1 31.2 31.3 31.2 31.3 31.3 31.4 31.4
1965 31.4 31.4 31.5 31.6 31.6 31.8 31.8 31.8 31.8 31.9 31.9 32.0 1966 32.0 32.2 32.3 32.5 32.5 32.6 32.7 32.9 32.9 33.1 33.1 33.1 1967 33.1 33.1 33.2 33.3 33.4 33.5 33.6 33.7 33.8 33.9 34.0 34.1 1968 34.2 34.3 34.5 34.6 34.7 34.9 35.1 35.2 35.3 35.5 35.6 35.7 1969 35.8 36.0 36.3 36.5 36.6 36.8 37.0 37.2 37.3 37.5 37.7 37.9
See footnotes at end of table.
86 CPI Detailed Report-September 2010
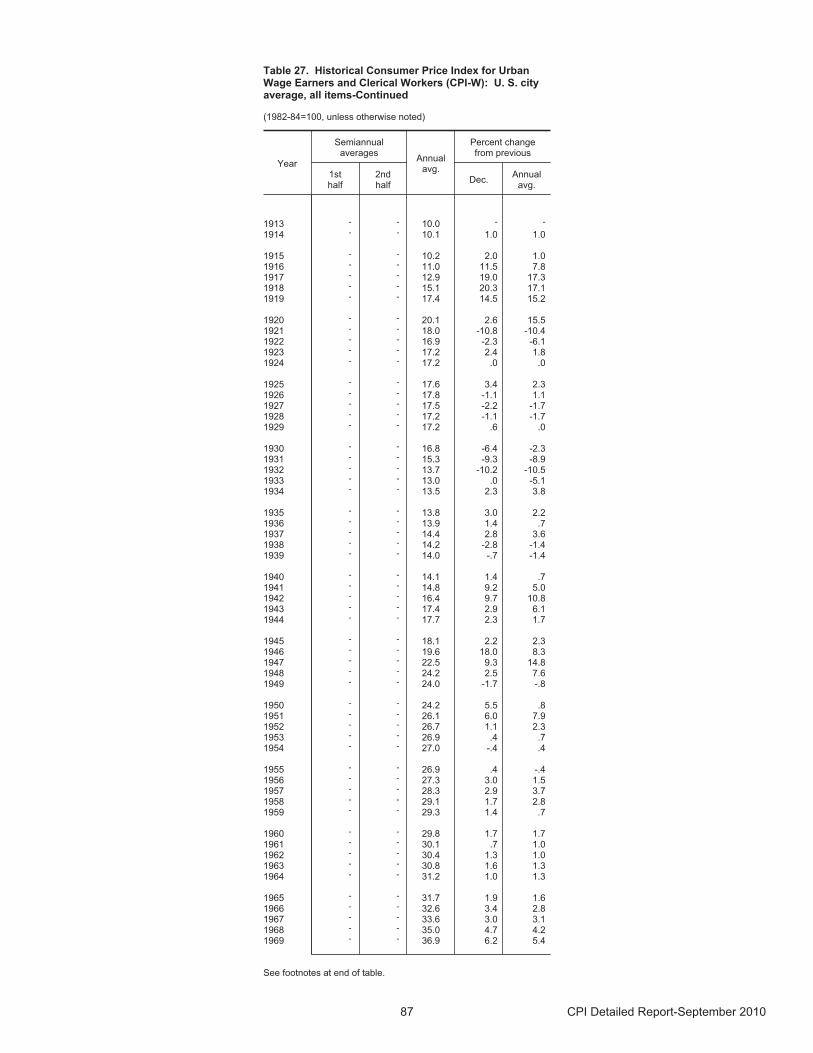
Table 27. Historical Consumer Price Index for UrbanWage Earners and Clerical Workers (CPI-W): U. S. cityaverage, all items-Continued
(1982-84=100, unless otherwise noted)
Year
Semiannualaverages
Annualavg.
Percent changefrom previous
1sthalf
2ndhalf
Dec.Annual
avg.
1913 - - 10.0 - -
1914 - - 10.1 1.0 1.0
1915 - - 10.2 2.0 1.0 1916 - - 11.0 11.5 7.8 1917 - - 12.9 19.0 17.3 1918 - - 15.1 20.3 17.1 1919 - - 17.4 14.5 15.2
1920 - - 20.1 2.6 15.5 1921 - - 18.0 -10.8 -10.4 1922 - - 16.9 -2.3 -6.1 1923 - - 17.2 2.4 1.8 1924 - - 17.2 .0 .0
1925 - - 17.6 3.4 2.3 1926 - - 17.8 -1.1 1.1 1927 - - 17.5 -2.2 -1.7 1928 - - 17.2 -1.1 -1.7 1929 - - 17.2 .6 .0
1930 - - 16.8 -6.4 -2.3 1931 - - 15.3 -9.3 -8.9 1932 - - 13.7 -10.2 -10.5 1933 - - 13.0 .0 -5.1 1934 - - 13.5 2.3 3.8
1935 - - 13.8 3.0 2.2 1936 - - 13.9 1.4 .7 1937 - - 14.4 2.8 3.6 1938 - - 14.2 -2.8 -1.4 1939 - - 14.0 -.7 -1.4
1940 - - 14.1 1.4 .7 1941 - - 14.8 9.2 5.0 1942 - - 16.4 9.7 10.8 1943 - - 17.4 2.9 6.1 1944 - - 17.7 2.3 1.7
1945 - - 18.1 2.2 2.3 1946 - - 19.6 18.0 8.3 1947 - - 22.5 9.3 14.8 1948 - - 24.2 2.5 7.6 1949 - - 24.0 -1.7 -.8
1950 - - 24.2 5.5 .8 1951 - - 26.1 6.0 7.9 1952 - - 26.7 1.1 2.3 1953 - - 26.9 .4 .7 1954 - - 27.0 -.4 .4
1955 - - 26.9 .4 -.4 1956 - - 27.3 3.0 1.5 1957 - - 28.3 2.9 3.7 1958 - - 29.1 1.7 2.8 1959 - - 29.3 1.4 .7
1960 - - 29.8 1.7 1.7 1961 - - 30.1 .7 1.0 1962 - - 30.4 1.3 1.0 1963 - - 30.8 1.6 1.3 1964 - - 31.2 1.0 1.3
1965 - - 31.7 1.9 1.6 1966 - - 32.6 3.4 2.8 1967 - - 33.6 3.0 3.1 1968 - - 35.0 4.7 4.2 1969 - - 36.9 6.2 5.4
See footnotes at end of table.
87 CPI Detailed Report-September 2010
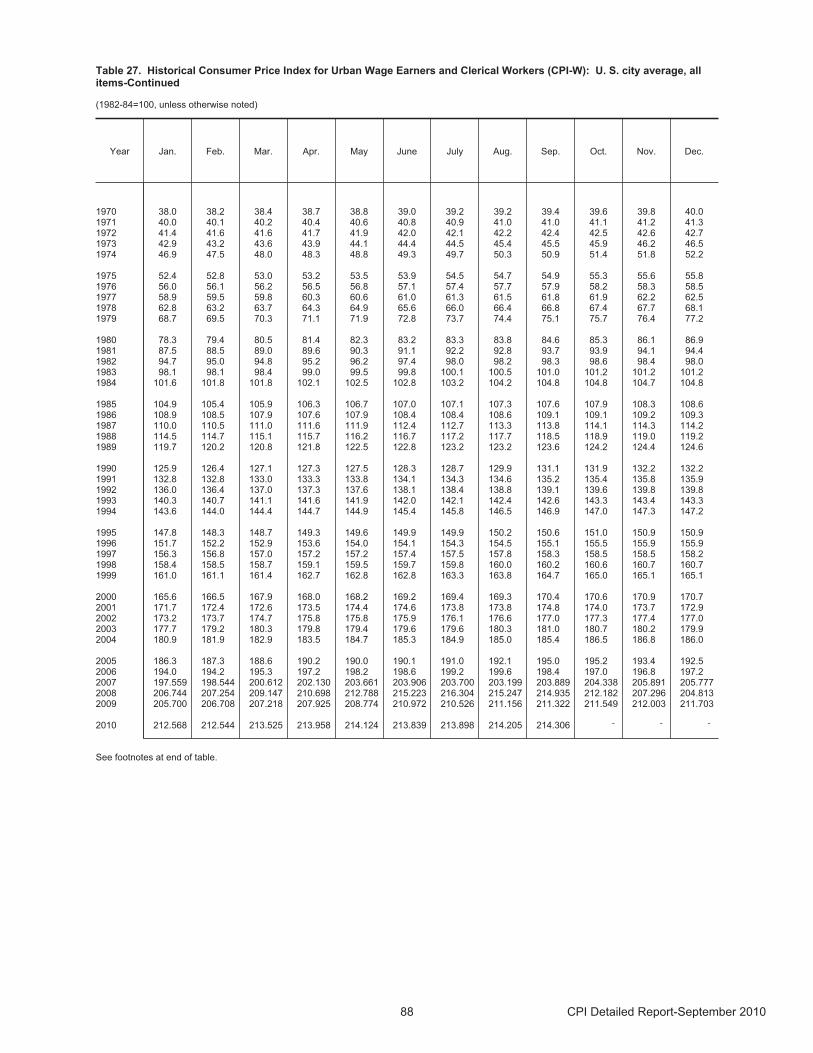
Table 27. Historical Consumer Price Index for Urban Wage Earners and Clerical Workers (CPI-W): U. S. city average, allitems-Continued
(1982-84=100, unless otherwise noted)
Year Jan. Feb. Mar. Apr. May June July Aug. Sep. Oct. Nov. Dec.
1970 38.0 38.2 38.4 38.7 38.8 39.0 39.2 39.2 39.4 39.6 39.8 40.0 1971 40.0 40.1 40.2 40.4 40.6 40.8 40.9 41.0 41.0 41.1 41.2 41.3 1972 41.4 41.6 41.6 41.7 41.9 42.0 42.1 42.2 42.4 42.5 42.6 42.7 1973 42.9 43.2 43.6 43.9 44.1 44.4 44.5 45.4 45.5 45.9 46.2 46.5 1974 46.9 47.5 48.0 48.3 48.8 49.3 49.7 50.3 50.9 51.4 51.8 52.2
1975 52.4 52.8 53.0 53.2 53.5 53.9 54.5 54.7 54.9 55.3 55.6 55.8 1976 56.0 56.1 56.2 56.5 56.8 57.1 57.4 57.7 57.9 58.2 58.3 58.5 1977 58.9 59.5 59.8 60.3 60.6 61.0 61.3 61.5 61.8 61.9 62.2 62.5 1978 62.8 63.2 63.7 64.3 64.9 65.6 66.0 66.4 66.8 67.4 67.7 68.1 1979 68.7 69.5 70.3 71.1 71.9 72.8 73.7 74.4 75.1 75.7 76.4 77.2
1980 78.3 79.4 80.5 81.4 82.3 83.2 83.3 83.8 84.6 85.3 86.1 86.9 1981 87.5 88.5 89.0 89.6 90.3 91.1 92.2 92.8 93.7 93.9 94.1 94.4 1982 94.7 95.0 94.8 95.2 96.2 97.4 98.0 98.2 98.3 98.6 98.4 98.0 1983 98.1 98.1 98.4 99.0 99.5 99.8 100.1 100.5 101.0 101.2 101.2 101.2 1984 101.6 101.8 101.8 102.1 102.5 102.8 103.2 104.2 104.8 104.8 104.7 104.8
1985 104.9 105.4 105.9 106.3 106.7 107.0 107.1 107.3 107.6 107.9 108.3 108.6 1986 108.9 108.5 107.9 107.6 107.9 108.4 108.4 108.6 109.1 109.1 109.2 109.3 1987 110.0 110.5 111.0 111.6 111.9 112.4 112.7 113.3 113.8 114.1 114.3 114.2 1988 114.5 114.7 115.1 115.7 116.2 116.7 117.2 117.7 118.5 118.9 119.0 119.2 1989 119.7 120.2 120.8 121.8 122.5 122.8 123.2 123.2 123.6 124.2 124.4 124.6
1990 125.9 126.4 127.1 127.3 127.5 128.3 128.7 129.9 131.1 131.9 132.2 132.2 1991 132.8 132.8 133.0 133.3 133.8 134.1 134.3 134.6 135.2 135.4 135.8 135.9 1992 136.0 136.4 137.0 137.3 137.6 138.1 138.4 138.8 139.1 139.6 139.8 139.8 1993 140.3 140.7 141.1 141.6 141.9 142.0 142.1 142.4 142.6 143.3 143.4 143.3 1994 143.6 144.0 144.4 144.7 144.9 145.4 145.8 146.5 146.9 147.0 147.3 147.2
1995 147.8 148.3 148.7 149.3 149.6 149.9 149.9 150.2 150.6 151.0 150.9 150.9 1996 151.7 152.2 152.9 153.6 154.0 154.1 154.3 154.5 155.1 155.5 155.9 155.9 1997 156.3 156.8 157.0 157.2 157.2 157.4 157.5 157.8 158.3 158.5 158.5 158.2 1998 158.4 158.5 158.7 159.1 159.5 159.7 159.8 160.0 160.2 160.6 160.7 160.7 1999 161.0 161.1 161.4 162.7 162.8 162.8 163.3 163.8 164.7 165.0 165.1 165.1
2000 165.6 166.5 167.9 168.0 168.2 169.2 169.4 169.3 170.4 170.6 170.9 170.7 2001 171.7 172.4 172.6 173.5 174.4 174.6 173.8 173.8 174.8 174.0 173.7 172.9 2002 173.2 173.7 174.7 175.8 175.8 175.9 176.1 176.6 177.0 177.3 177.4 177.0 2003 177.7 179.2 180.3 179.8 179.4 179.6 179.6 180.3 181.0 180.7 180.2 179.9 2004 180.9 181.9 182.9 183.5 184.7 185.3 184.9 185.0 185.4 186.5 186.8 186.0
2005 186.3 187.3 188.6 190.2 190.0 190.1 191.0 192.1 195.0 195.2 193.4 192.5 2006 194.0 194.2 195.3 197.2 198.2 198.6 199.2 199.6 198.4 197.0 196.8 197.2 2007 197.559 198.544 200.612 202.130 203.661 203.906 203.700 203.199 203.889 204.338 205.891 205.7772008 206.744 207.254 209.147 210.698 212.788 215.223 216.304 215.247 214.935 212.182 207.296 204.8132009 205.700 206.708 207.218 207.925 208.774 210.972 210.526 211.156 211.322 211.549 212.003 211.703
2010 212.568 212.544 213.525 213.958 214.124 213.839 213.898 214.205 214.306 - - -
See footnotes at end of table.
88 CPI Detailed Report-September 2010

Table 27. Historical Consumer Price Index for UrbanWage Earners and Clerical Workers (CPI-W): U. S. cityaverage, all items-Continued
(1982-84=100, unless otherwise noted)
Year
Semiannualaverages
Annualavg.
Percent changefrom previous
1sthalf
2ndhalf
Dec.Annual
avg.
1970 - - 39.0 5.5 5.7 1971 - - 40.7 3.3 4.4 1972 - - 42.1 3.4 3.4 1973 - - 44.7 8.9 6.2 1974 - - 49.6 12.3 11.0
1975 - - 54.1 6.9 9.1 1976 - - 57.2 4.8 5.7 1977 - - 60.9 6.8 6.5 1978 - - 65.6 9.0 7.7 1979 - - 73.1 13.4 11.4
1980 - - 82.9 12.6 13.4 1981 - - 91.4 8.6 10.3 1982 - - 96.9 3.8 6.0 1983 - - 99.8 3.3 3.0 1984 102.1 104.4 103.3 3.6 3.5
1985 106.0 107.8 106.9 3.6 3.5 1986 108.2 109.0 108.6 .6 1.6 1987 111.2 113.7 112.5 4.5 3.6 1988 115.5 118.4 117.0 4.4 4.0 1989 121.3 123.9 122.6 4.5 4.8
1990 127.1 131.0 129.0 6.1 5.2 1991 133.3 135.2 134.3 2.8 4.1 1992 137.1 139.3 138.2 2.9 2.9 1993 141.3 142.9 142.1 2.5 2.8 1994 144.5 146.8 145.6 2.7 2.5
1995 148.9 150.6 149.8 2.5 2.9 1996 153.1 155.2 154.1 3.3 2.9 1997 157.0 158.1 157.6 1.5 2.3 1998 159.0 160.3 159.7 1.6 1.3 1999 162.0 164.5 163.2 2.7 2.2
2000 167.6 170.2 168.9 3.4 3.5 2001 173.2 173.8 173.5 1.3 2.7 2002 174.9 176.9 175.9 2.4 1.4 2003 179.3 180.3 179.8 1.6 2.2 2004 183.2 185.8 184.5 3.4 2.6
2005 188.8 193.2 191.0 3.5 3.5 2006 196.3 198.0 197.1 2.4 3.2 2007 201.069 204.466 202.767 4.3 2.9 2008 210.309 211.796 211.053 -.5 4.1 2009 207.883 211.377 209.630 3.4 -.7
2010 213.426 - - - -
- Data not available.NOTE: Index applies to a month as a whole, not to any specific date.
89 CPI Detailed Report-September 2010
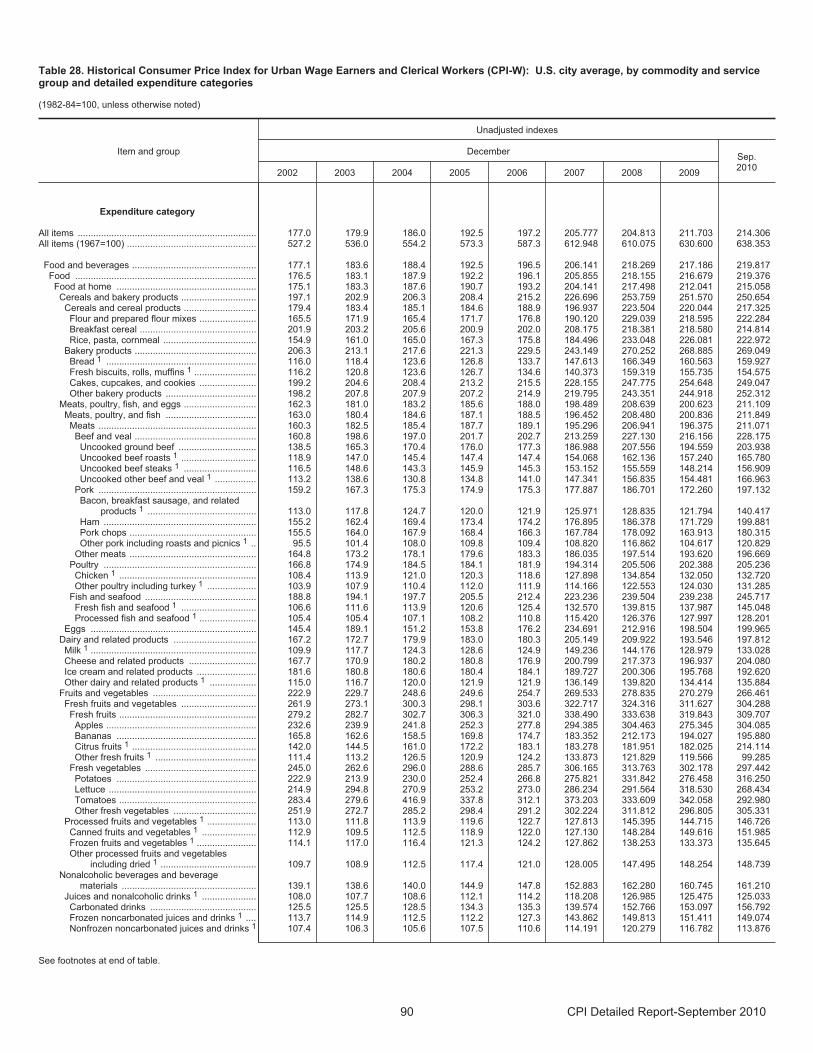
Table 28. Historical Consumer Price Index for Urban Wage Earners and Clerical Workers (CPI-W): U.S. city average, by commodity and servicegroup and detailed expenditure categories
(1982-84=100, unless otherwise noted)
Item and group
Unadjusted indexes
DecemberSep.2010
2002 2003 2004 2005 2006 2007 2008 2009
Expenditure category
All items ..................................................................... 177.0 179.9 186.0 192.5 197.2 205.777 204.813 211.703 214.306 All items (1967=100) .................................................. 527.2 536.0 554.2 573.3 587.3 612.948 610.075 630.600 638.353
Food and beverages ................................................ 177.1 183.6 188.4 192.5 196.5 206.141 218.269 217.186 219.817 Food ...................................................................... 176.5 183.1 187.9 192.2 196.1 205.855 218.155 216.679 219.376
Food at home ...................................................... 175.1 183.3 187.6 190.7 193.2 204.141 217.498 212.041 215.058 Cereals and bakery products ............................. 197.1 202.9 206.3 208.4 215.2 226.696 253.759 251.570 250.654
Cereals and cereal products ............................ 179.4 183.4 185.1 184.6 188.9 196.937 223.504 220.044 217.325 Flour and prepared flour mixes ...................... 165.5 171.9 165.4 171.7 176.8 190.120 229.039 218.595 222.284 Breakfast cereal ............................................. 201.9 203.2 205.6 200.9 202.0 208.175 218.381 218.580 214.814 Rice, pasta, cornmeal .................................... 154.9 161.0 165.0 167.3 175.8 184.496 233.048 226.081 222.972
Bakery products ............................................... 206.3 213.1 217.6 221.3 229.5 243.149 270.252 268.885 269.049 Bread 1 .......................................................... 116.0 118.4 123.6 126.8 133.7 147.613 166.349 160.563 159.927 Fresh biscuits, rolls, muffins 1 ........................ 116.2 120.8 123.6 126.7 134.6 140.373 159.319 155.735 154.575 Cakes, cupcakes, and cookies ...................... 199.2 204.6 208.4 213.2 215.5 228.155 247.775 254.648 249.047 Other bakery products ................................... 198.2 207.8 207.9 207.2 214.9 219.795 243.351 244.918 252.312
Meats, poultry, fish, and eggs ............................ 162.3 181.0 183.2 185.6 188.0 198.489 208.639 200.623 211.109 Meats, poultry, and fish ................................... 163.0 180.4 184.6 187.1 188.5 196.452 208.480 200.836 211.849
Meats ............................................................. 160.3 182.5 185.4 187.7 189.1 195.296 206.941 196.375 211.071Beef and veal ............................................... 160.8 198.6 197.0 201.7 202.7 213.259 227.130 216.156 228.175
Uncooked ground beef .............................. 138.5 165.3 170.4 176.0 177.3 186.988 207.556 194.559 203.938 Uncooked beef roasts 1 ............................. 118.9 147.0 145.4 147.4 147.4 154.068 162.136 157.240 165.780 Uncooked beef steaks 1 ............................ 116.5 148.6 143.3 145.9 145.3 153.152 155.559 148.214 156.909 Uncooked other beef and veal 1 ................ 113.2 138.6 130.8 134.8 141.0 147.341 156.835 154.481 166.963
Pork ............................................................. 159.2 167.3 175.3 174.9 175.3 177.887 186.701 172.260 197.132 Bacon, breakfast sausage, and related
products 1 .......................................... 113.0 117.8 124.7 120.0 121.9 125.971 128.835 121.794 140.417 Ham ........................................................... 155.2 162.4 169.4 173.4 174.2 176.895 186.378 171.729 199.881 Pork chops ................................................. 155.5 164.0 167.9 168.4 166.3 167.784 178.092 163.913 180.315 Other pork including roasts and picnics 1 .. 95.5 101.4 108.0 109.8 109.4 108.820 116.862 104.617 120.829
Other meats ................................................. 164.8 173.2 178.1 179.6 183.3 186.035 197.514 193.620 196.669 Poultry ........................................................... 166.8 174.9 184.5 184.1 181.9 194.314 205.506 202.388 205.236Chicken 1 ..................................................... 108.4 113.9 121.0 120.3 118.6 127.898 134.854 132.050 132.720 Other poultry including turkey 1 ................... 103.9 107.9 110.4 112.0 111.9 114.166 122.553 124.030 131.285
Fish and seafood ........................................... 188.8 194.1 197.7 205.5 212.4 223.236 239.504 239.238 245.717 Fresh fish and seafood 1 ............................. 106.6 111.6 113.9 120.6 125.4 132.570 139.815 137.987 145.048 Processed fish and seafood 1 ...................... 105.4 105.4 107.1 108.2 110.8 115.420 126.376 127.997 128.201
Eggs ................................................................ 145.4 189.1 151.2 153.8 176.2 234.691 212.916 198.504 199.965Dairy and related products ................................ 167.2 172.7 179.9 183.0 180.3 205.149 209.922 193.546 197.812
Milk 1 ................................................................ 109.9 117.7 124.3 128.6 124.9 149.236 144.176 128.979 133.028 Cheese and related products .......................... 167.7 170.9 180.2 180.8 176.9 200.799 217.373 196.937 204.080 Ice cream and related products ....................... 181.6 180.8 180.6 180.4 184.1 189.727 200.306 195.768 192.620 Other dairy and related products 1 .................. 115.0 116.7 120.0 121.9 121.9 136.149 139.820 134.414 135.884
Fruits and vegetables ........................................ 222.9 229.7 248.6 249.6 254.7 269.533 278.835 270.279 266.461 Fresh fruits and vegetables ............................. 261.9 273.1 300.3 298.1 303.6 322.717 324.316 311.627 304.288
Fresh fruits ..................................................... 279.2 282.7 302.7 306.3 321.0 338.490 333.638 319.843 309.707 Apples .......................................................... 232.6 239.9 241.8 252.3 277.8 294.385 304.463 275.345 304.085 Bananas ...................................................... 165.8 162.6 158.5 169.8 174.7 183.352 212.173 194.027 195.880 Citrus fruits 1 ................................................ 142.0 144.5 161.0 172.2 183.1 183.278 181.951 182.025 214.114 Other fresh fruits 1 ....................................... 111.4 113.2 126.5 120.9 124.2 133.873 121.829 119.566 99.285
Fresh vegetables ........................................... 245.0 262.6 296.0 288.6 285.7 306.165 313.763 302.178 297.442 Potatoes ...................................................... 222.9 213.9 230.0 252.4 266.8 275.821 331.842 276.458 316.250 Lettuce ......................................................... 214.9 294.8 270.9 253.2 273.0 286.234 291.564 318.530 268.434 Tomatoes ..................................................... 283.4 279.6 416.9 337.8 312.1 373.203 333.609 342.058 292.980 Other fresh vegetables ................................ 251.9 272.7 285.2 298.4 291.2 302.224 311.812 296.805 305.331
Processed fruits and vegetables 1 ................... 113.0 111.8 113.9 119.6 122.7 127.813 145.395 144.715 146.726 Canned fruits and vegetables 1 ..................... 112.9 109.5 112.5 118.9 122.0 127.130 148.284 149.616 151.985 Frozen fruits and vegetables 1 ....................... 114.1 117.0 116.4 121.3 124.2 127.862 138.253 133.373 135.645 Other processed fruits and vegetables
including dried 1 ..................................... 109.7 108.9 112.5 117.4 121.0 128.005 147.495 148.254 148.739 Nonalcoholic beverages and beverage
materials .................................................... 139.1 138.6 140.0 144.9 147.8 152.883 162.280 160.745 161.210 Juices and nonalcoholic drinks 1 ..................... 108.0 107.7 108.6 112.1 114.2 118.208 126.985 125.475 125.033
Carbonated drinks ......................................... 125.5 125.5 128.5 134.3 135.3 139.574 152.766 153.097 156.792 Frozen noncarbonated juices and drinks 1 .... 113.7 114.9 112.5 112.2 127.3 143.862 149.813 151.411 149.074 Nonfrozen noncarbonated juices and drinks 1 107.4 106.3 105.6 107.5 110.6 114.191 120.279 116.782 113.876
See footnotes at end of table.
90 CPI Detailed Report-September 2010
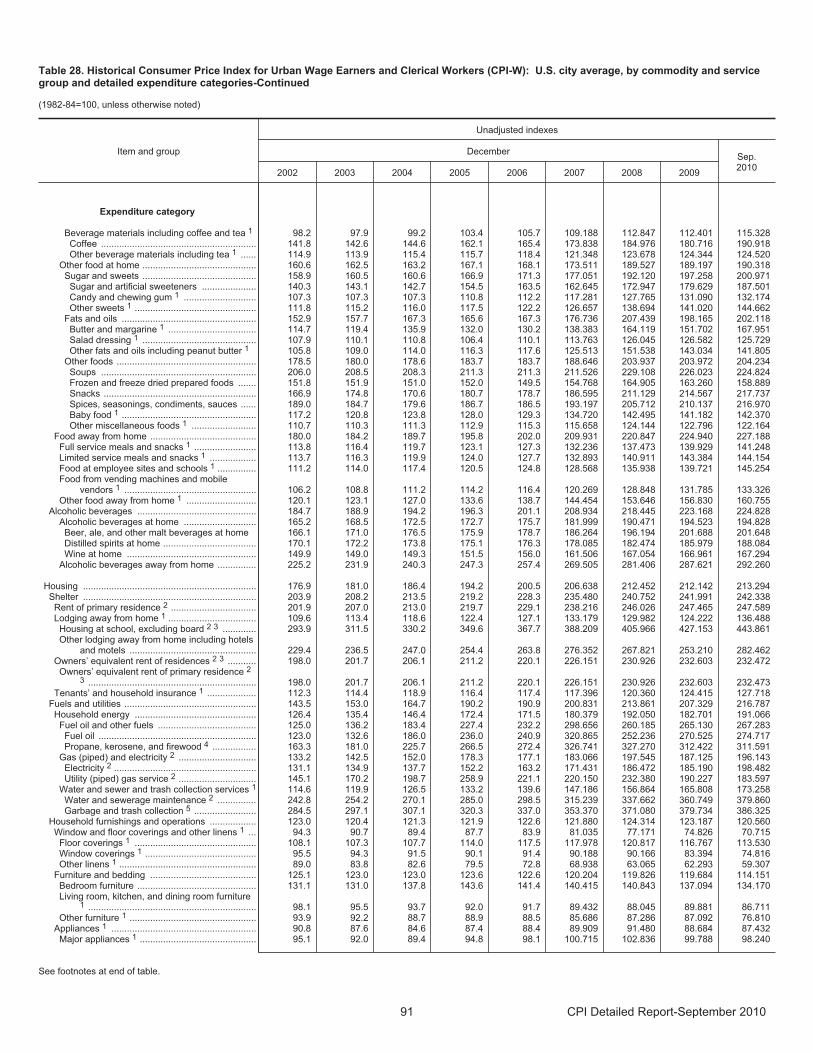
Table 28. Historical Consumer Price Index for Urban Wage Earners and Clerical Workers (CPI-W): U.S. city average, by commodity and servicegroup and detailed expenditure categories-Continued
(1982-84=100, unless otherwise noted)
Item and group
Unadjusted indexes
DecemberSep.2010
2002 2003 2004 2005 2006 2007 2008 2009
Expenditure category
Beverage materials including coffee and tea 1 98.2 97.9 99.2 103.4 105.7 109.188 112.847 112.401 115.328 Coffee ............................................................ 141.8 142.6 144.6 162.1 165.4 173.838 184.976 180.716 190.918Other beverage materials including tea 1 ...... 114.9 113.9 115.4 115.7 118.4 121.348 123.678 124.344 124.520
Other food at home ............................................ 160.6 162.5 163.2 167.1 168.1 173.511 189.527 189.197 190.318 Sugar and sweets ............................................ 158.9 160.5 160.6 166.9 171.3 177.051 192.120 197.258 200.971
Sugar and artificial sweeteners ..................... 140.3 143.1 142.7 154.5 163.5 162.645 172.947 179.629 187.501 Candy and chewing gum 1 ............................ 107.3 107.3 107.3 110.8 112.2 117.281 127.765 131.090 132.174 Other sweets 1 ............................................... 111.8 115.2 116.0 117.5 122.2 126.657 138.694 141.020 144.662
Fats and oils .................................................... 152.9 157.7 167.3 165.6 167.3 176.736 207.439 198.165 202.118 Butter and margarine 1 .................................. 114.7 119.4 135.9 132.0 130.2 138.383 164.119 151.702 167.951 Salad dressing 1 ............................................ 107.9 110.1 110.8 106.4 110.1 113.763 126.045 126.582 125.729 Other fats and oils including peanut butter 1 105.8 109.0 114.0 116.3 117.6 125.513 151.538 143.034 141.805
Other foods ...................................................... 178.5 180.0 178.6 183.7 183.7 188.646 203.937 203.972 204.234 Soups ............................................................ 206.0 208.5 208.3 211.3 211.3 211.526 229.108 226.023 224.824 Frozen and freeze dried prepared foods ....... 151.8 151.9 151.0 152.0 149.5 154.768 164.905 163.260 158.889 Snacks ........................................................... 166.9 174.8 170.6 180.7 178.7 186.595 211.129 214.567 217.737 Spices, seasonings, condiments, sauces ...... 189.0 184.7 179.6 186.7 186.5 193.197 205.712 210.137 216.970 Baby food 1 .................................................... 117.2 120.8 123.8 128.0 129.3 134.720 142.495 141.182 142.370 Other miscellaneous foods 1 ......................... 110.7 110.3 111.3 112.9 115.3 115.658 124.144 122.796 122.164
Food away from home ......................................... 180.0 184.2 189.7 195.8 202.0 209.931 220.847 224.940 227.188 Full service meals and snacks 1 ........................ 113.8 116.4 119.7 123.1 127.3 132.236 137.473 139.929 141.248 Limited service meals and snacks 1 .................. 113.7 116.3 119.9 124.0 127.7 132.893 140.911 143.384 144.154 Food at employee sites and schools 1 ............... 111.2 114.0 117.4 120.5 124.8 128.568 135.938 139.721 145.254 Food from vending machines and mobile
vendors 1 ................................................... 106.2 108.8 111.2 114.2 116.4 120.269 128.848 131.785 133.326 Other food away from home 1 ........................... 120.1 123.1 127.0 133.6 138.7 144.454 153.646 156.830 160.755
Alcoholic beverages .............................................. 184.7 188.9 194.2 196.3 201.1 208.934 218.445 223.168 224.828 Alcoholic beverages at home ............................ 165.2 168.5 172.5 172.7 175.7 181.999 190.471 194.523 194.828
Beer, ale, and other malt beverages at home 166.1 171.0 176.5 175.9 178.7 186.264 196.194 201.688 201.648 Distilled spirits at home .................................... 170.1 172.2 173.8 175.1 176.3 178.085 182.474 185.979 188.084 Wine at home .................................................. 149.9 149.0 149.3 151.5 156.0 161.506 167.054 166.961 167.294
Alcoholic beverages away from home ............... 225.2 231.9 240.3 247.3 257.4 269.505 281.406 287.621 292.260
Housing ................................................................... 176.9 181.0 186.4 194.2 200.5 206.638 212.452 212.142 213.294 Shelter ................................................................... 203.9 208.2 213.5 219.2 228.3 235.480 240.752 241.991 242.338
Rent of primary residence 2 ................................. 201.9 207.0 213.0 219.7 229.1 238.216 246.026 247.465 247.589 Lodging away from home 1 .................................. 109.6 113.4 118.6 122.4 127.1 133.179 129.982 124.222 136.488 Housing at school, excluding board 2 3 ............. 293.9 311.5 330.2 349.6 367.7 388.209 405.966 427.153 443.861 Other lodging away from home including hotels
and motels ................................................. 229.4 236.5 247.0 254.4 263.8 276.352 267.821 253.210 282.462 Owners’ equivalent rent of residences 2 3 ........... 198.0 201.7 206.1 211.2 220.1 226.151 230.926 232.603 232.472
Owners’ equivalent rent of primary residence 23 ................................................................. 198.0 201.7 206.1 211.2 220.1 226.151 230.926 232.603 232.473
Tenants’ and household insurance 1 ................... 112.3 114.4 118.9 116.4 117.4 117.396 120.360 124.415 127.718 Fuels and utilities ................................................... 143.5 153.0 164.7 190.2 190.9 200.831 213.861 207.329 216.787
Household energy ............................................... 126.4 135.4 146.4 172.4 171.5 180.379 192.050 182.701 191.066 Fuel oil and other fuels ...................................... 125.0 136.2 183.4 227.4 232.2 298.656 260.185 265.130 267.283
Fuel oil ............................................................. 123.0 132.6 186.0 236.0 240.9 320.865 252.236 270.525 274.717Propane, kerosene, and firewood 4 ................. 163.3 181.0 225.7 266.5 272.4 326.741 327.270 312.422 311.591
Gas (piped) and electricity 2 .............................. 133.2 142.5 152.0 178.3 177.1 183.066 197.545 187.125 196.143 Electricity 2 ....................................................... 131.1 134.9 137.7 152.2 163.2 171.431 186.472 185.190 198.482 Utility (piped) gas service 2 .............................. 145.1 170.2 198.7 258.9 221.1 220.150 232.380 190.227 183.597
Water and sewer and trash collection services 1 114.6 119.9 126.5 133.2 139.6 147.186 156.864 165.808 173.258 Water and sewerage maintenance 2 ............... 242.8 254.2 270.1 285.0 298.5 315.239 337.662 360.749 379.860 Garbage and trash collection 5 ........................ 284.5 297.1 307.1 320.3 337.0 353.370 371.080 379.734 386.325
Household furnishings and operations .................. 123.0 120.4 121.3 121.9 122.6 121.880 124.314 123.187 120.560 Window and floor coverings and other linens 1 ... 94.3 90.7 89.4 87.7 83.9 81.035 77.171 74.826 70.715 Floor coverings 1 ............................................... 108.1 107.3 107.7 114.0 117.5 117.978 120.817 116.767 113.530 Window coverings 1 ........................................... 95.5 94.3 91.5 90.1 91.4 90.188 90.166 83.394 74.816 Other linens 1 ..................................................... 89.0 83.8 82.6 79.5 72.8 68.938 63.065 62.293 59.307
Furniture and bedding ......................................... 125.1 123.0 123.0 123.6 122.6 120.204 119.826 119.684 114.151 Bedroom furniture .............................................. 131.1 131.0 137.8 143.6 141.4 140.415 140.843 137.094 134.170 Living room, kitchen, and dining room furniture
1 ................................................................. 98.1 95.5 93.7 92.0 91.7 89.432 88.045 89.881 86.711 Other furniture 1 ................................................. 93.9 92.2 88.7 88.9 88.5 85.686 87.286 87.092 76.810
Appliances 1 ........................................................ 90.8 87.6 84.6 87.4 88.4 89.909 91.480 88.684 87.432 Major appliances 1 ............................................. 95.1 92.0 89.4 94.8 98.1 100.715 102.836 99.788 98.240
See footnotes at end of table.
91 CPI Detailed Report-September 2010
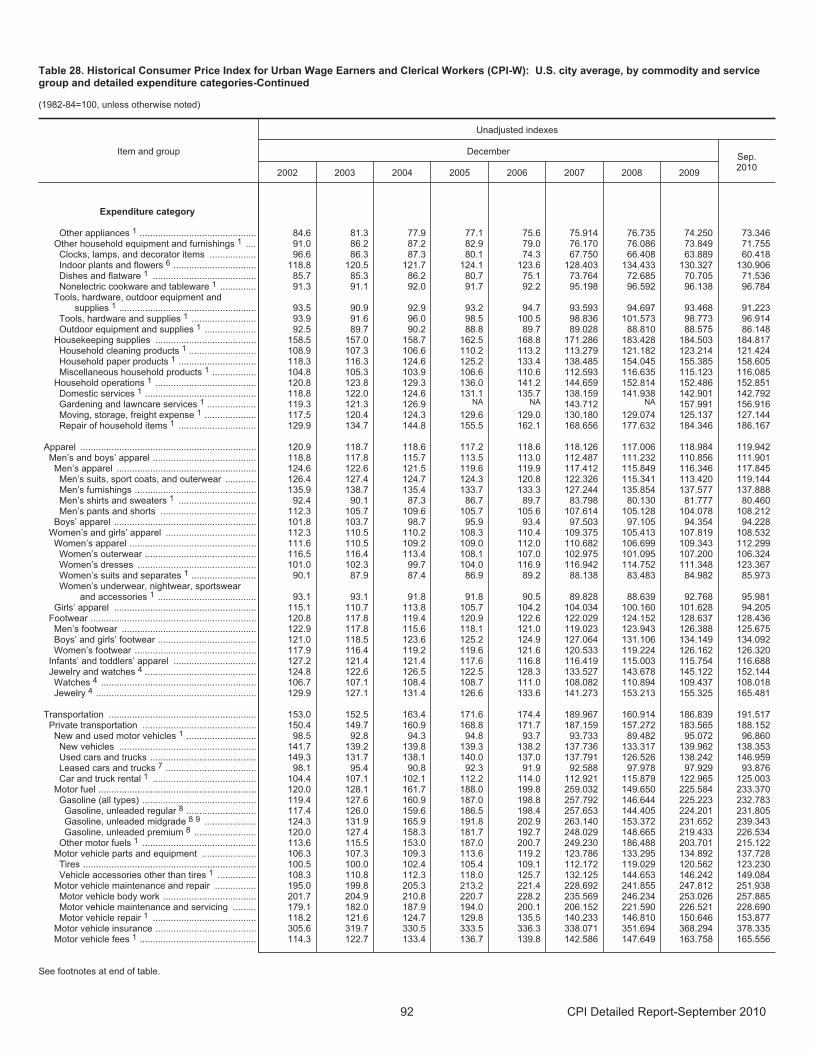
Table 28. Historical Consumer Price Index for Urban Wage Earners and Clerical Workers (CPI-W): U.S. city average, by commodity and servicegroup and detailed expenditure categories-Continued
(1982-84=100, unless otherwise noted)
Item and group
Unadjusted indexes
DecemberSep.2010
2002 2003 2004 2005 2006 2007 2008 2009
Expenditure category
Other appliances 1 ............................................. 84.6 81.3 77.9 77.1 75.6 75.914 76.735 74.250 73.346 Other household equipment and furnishings 1 .... 91.0 86.2 87.2 82.9 79.0 76.170 76.086 73.849 71.755
Clocks, lamps, and decorator items .................. 96.6 86.3 87.3 80.1 74.3 67.750 66.408 63.889 60.418 Indoor plants and flowers 6 ................................ 118.8 120.5 121.7 124.1 123.6 128.403 134.433 130.327 130.906 Dishes and flatware 1 ........................................ 85.7 85.3 86.2 80.7 75.1 73.764 72.685 70.705 71.536 Nonelectric cookware and tableware 1 .............. 91.3 91.1 92.0 91.7 92.2 95.198 96.592 96.138 96.784
Tools, hardware, outdoor equipment andsupplies 1 ..................................................... 93.5 90.9 92.9 93.2 94.7 93.593 94.697 93.468 91.223
Tools, hardware and supplies 1 ......................... 93.9 91.6 96.0 98.5 100.5 98.836 101.573 98.773 96.914 Outdoor equipment and supplies 1 .................... 92.5 89.7 90.2 88.8 89.7 89.028 88.810 88.575 86.148
Housekeeping supplies ....................................... 158.5 157.0 158.7 162.5 168.8 171.286 183.428 184.503 184.817 Household cleaning products 1 .......................... 108.9 107.3 106.6 110.2 113.2 113.279 121.182 123.214 121.424 Household paper products 1 .............................. 118.3 116.3 124.6 125.2 133.4 138.485 154.045 155.385 158.605 Miscellaneous household products 1 ................. 104.8 105.3 103.9 106.6 110.6 112.593 116.635 115.123 116.085
Household operations 1 ....................................... 120.8 123.8 129.3 136.0 141.2 144.659 152.814 152.486 152.851 Domestic services 1 ........................................... 118.8 122.0 124.6 131.1 135.7 138.159 141.938 142.901 142.792 Gardening and lawncare services 1 ................... 119.3 121.3 126.9 NA NA 143.712 NA 157.991 156.916 Moving, storage, freight expense 1 .................... 117.5 120.4 124.3 129.6 129.0 130.180 129.074 125.137 127.144 Repair of household items 1 .............................. 129.9 134.7 144.8 155.5 162.1 168.656 177.632 184.346 186.167
Apparel .................................................................... 120.9 118.7 118.6 117.2 118.6 118.126 117.006 118.984 119.942 Men’s and boys’ apparel ........................................ 118.8 117.8 115.7 113.5 113.0 112.487 111.232 110.856 111.901
Men’s apparel ...................................................... 124.6 122.6 121.5 119.6 119.9 117.412 115.849 116.346 117.845Men’s suits, sport coats, and outerwear ............ 126.4 127.4 124.7 124.3 120.8 122.326 115.341 113.420 119.144 Men’s furnishings ............................................... 135.9 138.7 135.4 133.7 133.3 127.244 135.854 137.577 137.888 Men’s shirts and sweaters 1 .............................. 92.4 90.1 87.3 86.7 89.7 83.798 80.130 81.777 80.460 Men’s pants and shorts ..................................... 112.3 105.7 109.6 105.7 105.6 107.614 105.128 104.078 108.212
Boys’ apparel ....................................................... 101.8 103.7 98.7 95.9 93.4 97.503 97.105 94.354 94.228 Women’s and girls’ apparel ................................... 112.3 110.5 110.2 108.3 110.4 109.375 105.413 107.819 108.532 Women’s apparel ................................................. 111.6 110.5 109.2 109.0 112.0 110.682 106.699 109.343 112.299
Women’s outerwear ........................................... 116.5 116.4 113.4 108.1 107.0 102.975 101.095 107.200 106.324 Women’s dresses .............................................. 101.0 102.3 99.7 104.0 116.9 116.942 114.752 111.348 123.367 Women’s suits and separates 1 ......................... 90.1 87.9 87.4 86.9 89.2 88.138 83.483 84.982 85.973 Women’s underwear, nightwear, sportswear
and accessories 1 ...................................... 93.1 93.1 91.8 91.8 90.5 89.828 88.639 92.768 95.981 Girls’ apparel ....................................................... 115.1 110.7 113.8 105.7 104.2 104.034 100.160 101.628 94.205
Footwear ................................................................ 120.8 117.8 119.4 120.9 122.6 122.029 124.152 128.637 128.436Men’s footwear .................................................... 122.9 117.8 115.6 118.1 121.0 119.023 123.943 126.388 125.675Boys’ and girls’ footwear ...................................... 121.0 118.5 123.6 125.2 124.9 127.064 131.106 134.149 134.092 Women’s footwear ............................................... 117.9 116.4 119.2 119.6 121.6 120.533 119.224 126.162 126.320
Infants’ and toddlers’ apparel ................................ 127.2 121.4 121.4 117.6 116.8 116.419 115.003 115.754 116.688 Jewelry and watches 4 ........................................... 124.8 122.6 126.5 122.5 128.3 133.527 143.678 145.122 152.144
Watches 4 ............................................................ 106.7 107.1 108.4 108.7 111.0 108.082 110.894 109.437 108.018 Jewelry 4 .............................................................. 129.9 127.1 131.4 126.6 133.6 141.273 153.213 155.325 165.481
Transportation ......................................................... 153.0 152.5 163.4 171.6 174.4 189.967 160.914 186.839 191.517Private transportation ............................................ 150.4 149.7 160.9 168.8 171.7 187.159 157.272 183.565 188.152
New and used motor vehicles 1 ........................... 98.5 92.8 94.3 94.8 93.7 93.733 89.482 95.072 96.860 New vehicles ..................................................... 141.7 139.2 139.8 139.3 138.2 137.736 133.317 139.962 138.353 Used cars and trucks ......................................... 149.3 131.7 138.1 140.0 137.0 137.791 126.526 138.242 146.959 Leased cars and trucks 7 ................................... 98.1 95.4 90.8 92.3 91.9 92.588 97.978 97.929 93.876 Car and truck rental 1 ........................................ 104.4 107.1 102.1 112.2 114.0 112.921 115.879 122.965 125.003
Motor fuel ............................................................. 120.0 128.1 161.7 188.0 199.8 259.032 149.650 225.584 233.370Gasoline (all types) ............................................ 119.4 127.6 160.9 187.0 198.8 257.792 146.644 225.223 232.783
Gasoline, unleaded regular 8 ........................... 117.4 126.0 159.6 186.5 198.4 257.653 144.405 224.201 231.805 Gasoline, unleaded midgrade 8 9 .................... 124.3 131.9 165.9 191.8 202.9 263.140 153.372 231.652 239.343 Gasoline, unleaded premium 8 ........................ 120.0 127.4 158.3 181.7 192.7 248.029 148.665 219.433 226.534
Other motor fuels 1 ............................................ 113.6 115.5 153.0 187.0 200.7 249.230 186.488 203.701 215.122 Motor vehicle parts and equipment ..................... 106.3 107.3 109.3 113.6 119.2 123.786 133.295 134.892 137.728
Tires ................................................................... 100.5 100.0 102.4 105.4 109.1 112.172 119.029 120.562 123.230Vehicle accessories other than tires 1 ............... 108.3 110.8 112.3 118.0 125.7 132.125 144.653 146.242 149.084
Motor vehicle maintenance and repair ................ 195.0 199.8 205.3 213.2 221.4 228.692 241.855 247.812 251.938 Motor vehicle body work .................................... 201.7 204.9 210.8 220.7 228.2 235.569 246.234 253.026 257.885 Motor vehicle maintenance and servicing ......... 179.1 182.0 187.9 194.0 200.1 206.152 221.590 226.521 228.690 Motor vehicle repair 1 ........................................ 118.2 121.6 124.7 129.8 135.5 140.233 146.810 150.646 153.877
Motor vehicle insurance ....................................... 305.6 319.7 330.5 333.5 336.3 338.071 351.694 368.294 378.335 Motor vehicle fees 1 ............................................. 114.3 122.7 133.4 136.7 139.8 142.586 147.649 163.758 165.556
See footnotes at end of table.
92 CPI Detailed Report-September 2010
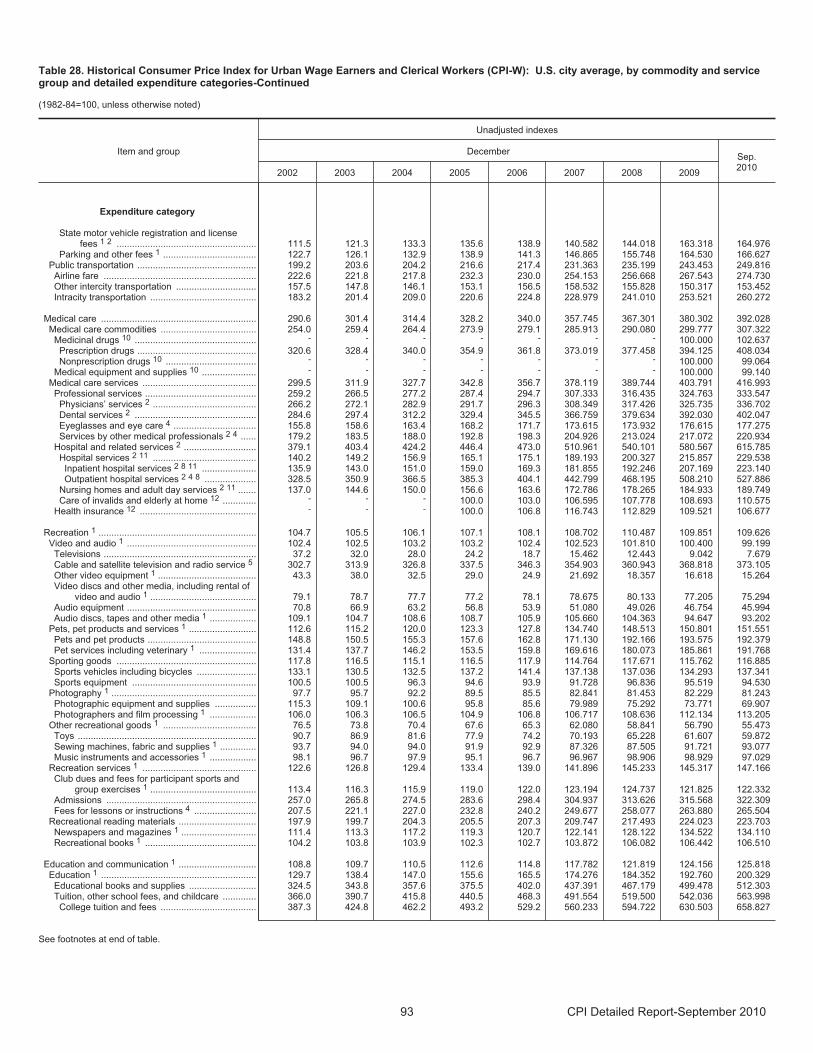
Table 28. Historical Consumer Price Index for Urban Wage Earners and Clerical Workers (CPI-W): U.S. city average, by commodity and servicegroup and detailed expenditure categories-Continued
(1982-84=100, unless otherwise noted)
Item and group
Unadjusted indexes
DecemberSep.2010
2002 2003 2004 2005 2006 2007 2008 2009
Expenditure category
State motor vehicle registration and licensefees 1 2 ...................................................... 111.5 121.3 133.3 135.6 138.9 140.582 144.018 163.318 164.976
Parking and other fees 1 .................................... 122.7 126.1 132.9 138.9 141.3 146.865 155.748 164.530 166.627 Public transportation .............................................. 199.2 203.6 204.2 216.6 217.4 231.363 235.199 243.453 249.816
Airline fare ........................................................... 222.6 221.8 217.8 232.3 230.0 254.153 256.668 267.543 274.730Other intercity transportation ............................... 157.5 147.8 146.1 153.1 156.5 158.532 155.828 150.317 153.452 Intracity transportation ......................................... 183.2 201.4 209.0 220.6 224.8 228.979 241.010 253.521 260.272
Medical care ............................................................ 290.6 301.4 314.4 328.2 340.0 357.745 367.301 380.302 392.028Medical care commodities ..................................... 254.0 259.4 264.4 273.9 279.1 285.913 290.080 299.777 307.322
Medicinal drugs 10 ............................................... - - - - - - - 100.000 102.637 Prescription drugs .............................................. 320.6 328.4 340.0 354.9 361.8 373.019 377.458 394.125 408.034 Nonprescription drugs 10 ................................... - - - - - - - 100.000 99.064
Medical equipment and supplies 10 ..................... - - - - - - - 100.000 99.140 Medical care services ............................................ 299.5 311.9 327.7 342.8 356.7 378.119 389.744 403.791 416.993
Professional services ........................................... 259.2 266.5 277.2 287.4 294.7 307.333 316.435 324.763 333.547 Physicians’ services 2 ........................................ 266.2 272.1 282.9 291.7 296.3 308.349 317.426 325.735 336.702 Dental services 2 ............................................... 284.6 297.4 312.2 329.4 345.5 366.759 379.634 392.030 402.047 Eyeglasses and eye care 4 ................................ 155.8 158.6 163.4 168.2 171.7 173.615 173.932 176.615 177.275 Services by other medical professionals 2 4 ...... 179.2 183.5 188.0 192.8 198.3 204.926 213.024 217.072 220.934
Hospital and related services 2 ............................ 379.1 403.4 424.2 446.4 473.0 510.961 540.101 580.567 615.785 Hospital services 2 11 ........................................ 140.2 149.2 156.9 165.1 175.1 189.193 200.327 215.857 229.538
Inpatient hospital services 2 8 11 ..................... 135.9 143.0 151.0 159.0 169.3 181.855 192.246 207.169 223.140 Outpatient hospital services 2 4 8 .................... 328.5 350.9 366.5 385.3 404.1 442.799 468.195 508.210 527.886
Nursing homes and adult day services 2 11 ....... 137.0 144.6 150.0 156.6 163.6 172.786 178.265 184.933 189.749 Care of invalids and elderly at home 12 ............. - - - 100.0 103.0 106.595 107.778 108.693 110.575
Health insurance 12 ............................................. - - - 100.0 106.8 116.743 112.829 109.521 106.677
Recreation 1 ............................................................. 104.7 105.5 106.1 107.1 108.1 108.702 110.487 109.851 109.626 Video and audio 1 .................................................. 102.4 102.5 103.2 103.2 102.4 102.523 101.810 100.400 99.199 Televisions ........................................................... 37.2 32.0 28.0 24.2 18.7 15.462 12.443 9.042 7.679 Cable and satellite television and radio service 5 302.7 313.9 326.8 337.5 346.3 354.903 360.943 368.818 373.105 Other video equipment 1 ...................................... 43.3 38.0 32.5 29.0 24.9 21.692 18.357 16.618 15.264 Video discs and other media, including rental of
video and audio 1 ......................................... 79.1 78.7 77.7 77.2 78.1 78.675 80.133 77.205 75.294 Audio equipment .................................................. 70.8 66.9 63.2 56.8 53.9 51.080 49.026 46.754 45.994 Audio discs, tapes and other media 1 .................. 109.1 104.7 108.6 108.7 105.9 105.660 104.363 94.647 93.202
Pets, pet products and services 1 .......................... 112.6 115.2 120.0 123.3 127.8 134.740 148.513 150.801 151.551 Pets and pet products .......................................... 148.8 150.5 155.3 157.6 162.8 171.130 192.166 193.575 192.379 Pet services including veterinary 1 ...................... 131.4 137.7 146.2 153.5 159.8 169.616 180.073 185.861 191.768
Sporting goods ...................................................... 117.8 116.5 115.1 116.5 117.9 114.764 117.671 115.762 116.885Sports vehicles including bicycles ....................... 133.1 130.5 132.5 137.2 141.4 137.138 137.036 134.293 137.341 Sports equipment ................................................ 100.5 100.5 96.3 94.6 93.9 91.728 96.836 95.519 94.530
Photography 1 ........................................................ 97.7 95.7 92.2 89.5 85.5 82.841 81.453 82.229 81.243 Photographic equipment and supplies ................ 115.3 109.1 100.6 95.8 85.6 79.989 75.292 73.771 69.907 Photographers and film processing 1 .................. 106.0 106.3 106.5 104.9 106.8 106.717 108.636 112.134 113.205
Other recreational goods 1 .................................... 76.5 73.8 70.4 67.6 65.3 62.080 58.841 56.790 55.473 Toys ..................................................................... 90.7 86.9 81.6 77.9 74.2 70.193 65.228 61.607 59.872 Sewing machines, fabric and supplies 1 .............. 93.7 94.0 94.0 91.9 92.9 87.326 87.505 91.721 93.077 Music instruments and accessories 1 .................. 98.1 96.7 97.9 95.1 96.7 96.967 98.906 98.929 97.029
Recreation services 1 ............................................ 122.6 126.8 129.4 133.4 139.0 141.896 145.233 145.317 147.166 Club dues and fees for participant sports and
group exercises 1 ......................................... 113.4 116.3 115.9 119.0 122.0 123.194 124.737 121.825 122.332 Admissions .......................................................... 257.0 265.8 274.5 283.6 298.4 304.937 313.626 315.568 322.309Fees for lessons or instructions 4 ........................ 207.5 221.1 227.0 232.8 240.2 249.677 258.077 263.880 265.504
Recreational reading materials .............................. 197.9 199.7 204.3 205.5 207.3 209.747 217.493 224.023 223.703 Newspapers and magazines 1 ............................. 111.4 113.3 117.2 119.3 120.7 122.141 128.122 134.522 134.110 Recreational books 1 ........................................... 104.2 103.8 103.9 102.3 102.7 103.872 106.082 106.442 106.510
Education and communication 1 .............................. 108.8 109.7 110.5 112.6 114.8 117.782 121.819 124.156 125.818 Education 1 ............................................................ 129.7 138.4 147.0 155.6 165.5 174.276 184.352 192.760 200.329
Educational books and supplies .......................... 324.5 343.8 357.6 375.5 402.0 437.391 467.179 499.478 512.303 Tuition, other school fees, and childcare ............. 366.0 390.7 415.8 440.5 468.3 491.554 519.500 542.036 563.998
College tuition and fees ..................................... 387.3 424.8 462.2 493.2 529.2 560.233 594.722 630.503 658.827
See footnotes at end of table.
93 CPI Detailed Report-September 2010
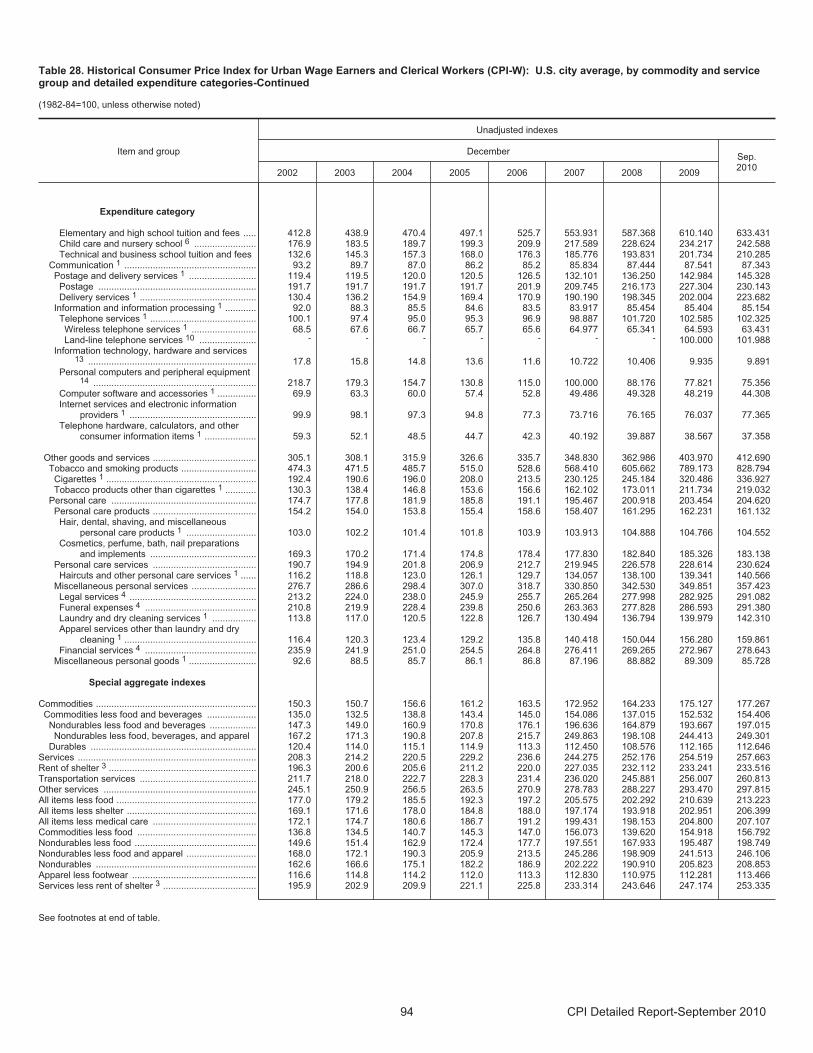
Table 28. Historical Consumer Price Index for Urban Wage Earners and Clerical Workers (CPI-W): U.S. city average, by commodity and servicegroup and detailed expenditure categories-Continued
(1982-84=100, unless otherwise noted)
Item and group
Unadjusted indexes
DecemberSep.2010
2002 2003 2004 2005 2006 2007 2008 2009
Expenditure category
Elementary and high school tuition and fees ..... 412.8 438.9 470.4 497.1 525.7 553.931 587.368 610.140 633.431 Child care and nursery school 6 ........................ 176.9 183.5 189.7 199.3 209.9 217.589 228.624 234.217 242.588 Technical and business school tuition and fees 132.6 145.3 157.3 168.0 176.3 185.776 193.831 201.734 210.285
Communication 1 ................................................... 93.2 89.7 87.0 86.2 85.2 85.834 87.444 87.541 87.343 Postage and delivery services 1 .......................... 119.4 119.5 120.0 120.5 126.5 132.101 136.250 142.984 145.328 Postage ............................................................. 191.7 191.7 191.7 191.7 201.9 209.745 216.173 227.304 230.143Delivery services 1 ............................................. 130.4 136.2 154.9 169.4 170.9 190.190 198.345 202.004 223.682
Information and information processing 1 ............ 92.0 88.3 85.5 84.6 83.5 83.917 85.454 85.404 85.154 Telephone services 1 ......................................... 100.1 97.4 95.0 95.3 96.9 98.887 101.720 102.585 102.325 Wireless telephone services 1 ......................... 68.5 67.6 66.7 65.7 65.6 64.977 65.341 64.593 63.431 Land-line telephone services 10 ...................... - - - - - - - 100.000 101.988
Information technology, hardware and services13 ................................................................. 17.8 15.8 14.8 13.6 11.6 10.722 10.406 9.935 9.891
Personal computers and peripheral equipment14 ............................................................... 218.7 179.3 154.7 130.8 115.0 100.000 88.176 77.821 75.356
Computer software and accessories 1 ............... 69.9 63.3 60.0 57.4 52.8 49.486 49.328 48.219 44.308 Internet services and electronic information
providers 1 ................................................. 99.9 98.1 97.3 94.8 77.3 73.716 76.165 76.037 77.365 Telephone hardware, calculators, and other
consumer information items 1 .................... 59.3 52.1 48.5 44.7 42.3 40.192 39.887 38.567 37.358
Other goods and services ........................................ 305.1 308.1 315.9 326.6 335.7 348.830 362.986 403.970 412.690 Tobacco and smoking products ............................. 474.3 471.5 485.7 515.0 528.6 568.410 605.662 789.173 828.794
Cigarettes 1 .......................................................... 192.4 190.6 196.0 208.0 213.5 230.125 245.184 320.486 336.927 Tobacco products other than cigarettes 1 ............ 130.3 138.4 146.8 153.6 156.6 162.102 173.011 211.734 219.032
Personal care ........................................................ 174.7 177.8 181.9 185.8 191.1 195.467 200.918 203.454 204.620Personal care products ........................................ 154.2 154.0 153.8 155.4 158.6 158.407 161.295 162.231 161.132
Hair, dental, shaving, and miscellaneouspersonal care products 1 ........................... 103.0 102.2 101.4 101.8 103.9 103.913 104.888 104.766 104.552
Cosmetics, perfume, bath, nail preparationsand implements ......................................... 169.3 170.2 171.4 174.8 178.4 177.830 182.840 185.326 183.138
Personal care services ........................................ 190.7 194.9 201.8 206.9 212.7 219.945 226.578 228.614 230.624 Haircuts and other personal care services 1 ...... 116.2 118.8 123.0 126.1 129.7 134.057 138.100 139.341 140.566
Miscellaneous personal services ......................... 276.7 286.6 298.4 307.0 318.7 330.850 342.530 349.851 357.423 Legal services 4 ................................................. 213.2 224.0 238.0 245.9 255.7 265.264 277.998 282.925 291.082 Funeral expenses 4 ........................................... 210.8 219.9 228.4 239.8 250.6 263.363 277.828 286.593 291.380 Laundry and dry cleaning services 1 ................. 113.8 117.0 120.5 122.8 126.7 130.494 136.794 139.979 142.310 Apparel services other than laundry and dry
cleaning 1 ................................................... 116.4 120.3 123.4 129.2 135.8 140.418 150.044 156.280 159.861 Financial services 4 ........................................... 235.9 241.9 251.0 254.5 264.8 276.411 269.265 272.967 278.643
Miscellaneous personal goods 1 .......................... 92.6 88.5 85.7 86.1 86.8 87.196 88.882 89.309 85.728
Special aggregate indexes
Commodities .............................................................. 150.3 150.7 156.6 161.2 163.5 172.952 164.233 175.127 177.267Commodities less food and beverages ................... 135.0 132.5 138.8 143.4 145.0 154.086 137.015 152.532 154.406
Nondurables less food and beverages .................. 147.3 149.0 160.9 170.8 176.1 196.636 164.879 193.667 197.015 Nondurables less food, beverages, and apparel 167.2 171.3 190.8 207.8 215.7 249.863 198.108 244.413 249.301
Durables ................................................................ 120.4 114.0 115.1 114.9 113.3 112.450 108.576 112.165 112.646Services ..................................................................... 208.3 214.2 220.5 229.2 236.6 244.275 252.176 254.519 257.663 Rent of shelter 3 ......................................................... 196.3 200.6 205.6 211.2 220.0 227.035 232.112 233.241 233.516 Transportation services ............................................. 211.7 218.0 222.7 228.3 231.4 236.020 245.881 256.007 260.813Other services ........................................................... 245.1 250.9 256.5 263.5 270.9 278.783 288.227 293.470 297.815All items less food ...................................................... 177.0 179.2 185.5 192.3 197.2 205.575 202.292 210.639 213.223 All items less shelter .................................................. 169.1 171.6 178.0 184.8 188.0 197.174 193.918 202.951 206.399 All items less medical care ........................................ 172.1 174.7 180.6 186.7 191.2 199.431 198.153 204.800 207.107 Commodities less food .............................................. 136.8 134.5 140.7 145.3 147.0 156.073 139.620 154.918 156.792 Nondurables less food ............................................... 149.6 151.4 162.9 172.4 177.7 197.551 167.933 195.487 198.749 Nondurables less food and apparel ........................... 168.0 172.1 190.3 205.9 213.5 245.286 198.909 241.513 246.106 Nondurables .............................................................. 162.6 166.6 175.1 182.2 186.9 202.222 190.910 205.823 208.853Apparel less footwear ................................................ 116.6 114.8 114.2 112.0 113.3 112.830 110.975 112.281 113.466 Services less rent of shelter 3 .................................... 195.9 202.9 209.9 221.1 225.8 233.314 243.646 247.174 253.335
See footnotes at end of table.
94 CPI Detailed Report-September 2010
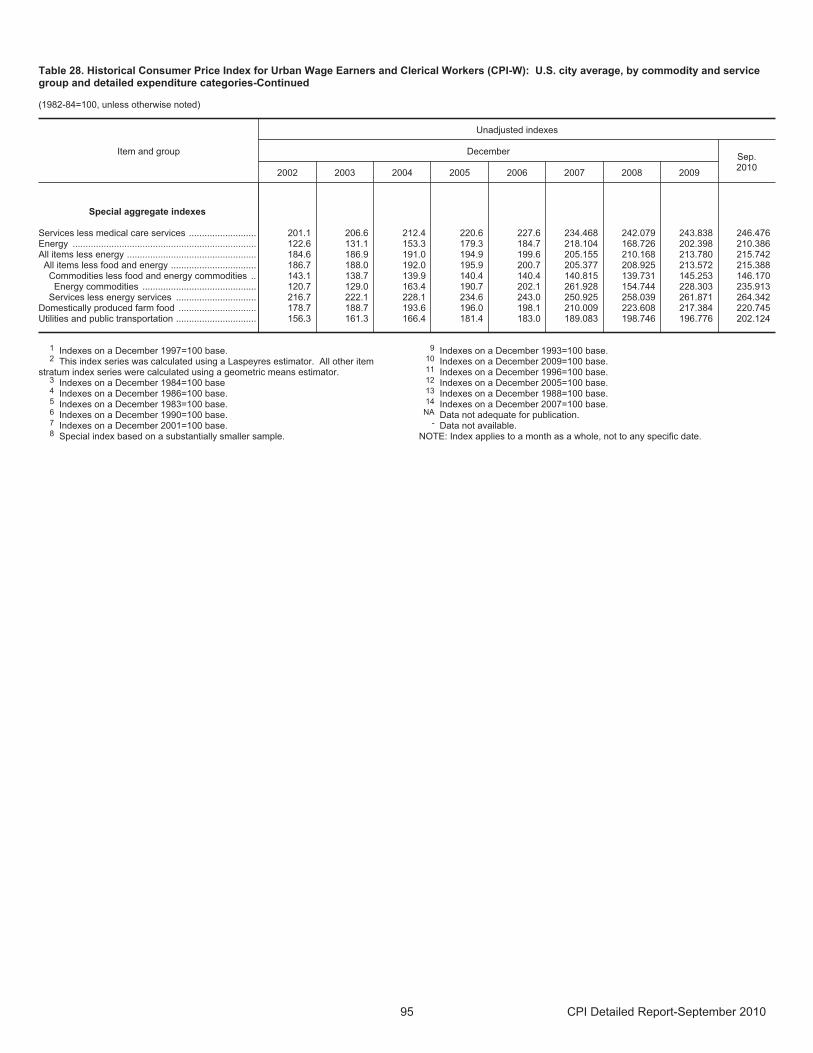
Table 28. Historical Consumer Price Index for Urban Wage Earners and Clerical Workers (CPI-W): U.S. city average, by commodity and servicegroup and detailed expenditure categories-Continued
(1982-84=100, unless otherwise noted)
Item and group
Unadjusted indexes
DecemberSep.2010
2002 2003 2004 2005 2006 2007 2008 2009
Special aggregate indexes
Services less medical care services .......................... 201.1 206.6 212.4 220.6 227.6 234.468 242.079 243.838 246.476 Energy ....................................................................... 122.6 131.1 153.3 179.3 184.7 218.104 168.726 202.398 210.386 All items less energy .................................................. 184.6 186.9 191.0 194.9 199.6 205.155 210.168 213.780 215.742
All items less food and energy ................................. 186.7 188.0 192.0 195.9 200.7 205.377 208.925 213.572 215.388 Commodities less food and energy commodities .. 143.1 138.7 139.9 140.4 140.4 140.815 139.731 145.253 146.170
Energy commodities ............................................ 120.7 129.0 163.4 190.7 202.1 261.928 154.744 228.303 235.913 Services less energy services ............................... 216.7 222.1 228.1 234.6 243.0 250.925 258.039 261.871 264.342
Domestically produced farm food .............................. 178.7 188.7 193.6 196.0 198.1 210.009 223.608 217.384 220.745 Utilities and public transportation ............................... 156.3 161.3 166.4 181.4 183.0 189.083 198.746 196.776 202.124
1 Indexes on a December 1997=100 base.2 This index series was calculated using a Laspeyres estimator. All other item
stratum index series were calculated using a geometric means estimator.3 Indexes on a December 1984=100 base4 Indexes on a December 1986=100 base.5 Indexes on a December 1983=100 base.6 Indexes on a December 1990=100 base.7 Indexes on a December 2001=100 base.8 Special index based on a substantially smaller sample.
9 Indexes on a December 1993=100 base.10 Indexes on a December 2009=100 base.11 Indexes on a December 1996=100 base.12 Indexes on a December 2005=100 base.13 Indexes on a December 1988=100 base.14 Indexes on a December 2007=100 base.
NA Data not adequate for publication.- Data not available.
NOTE: Index applies to a month as a whole, not to any specific date.
95 CPI Detailed Report-September 2010
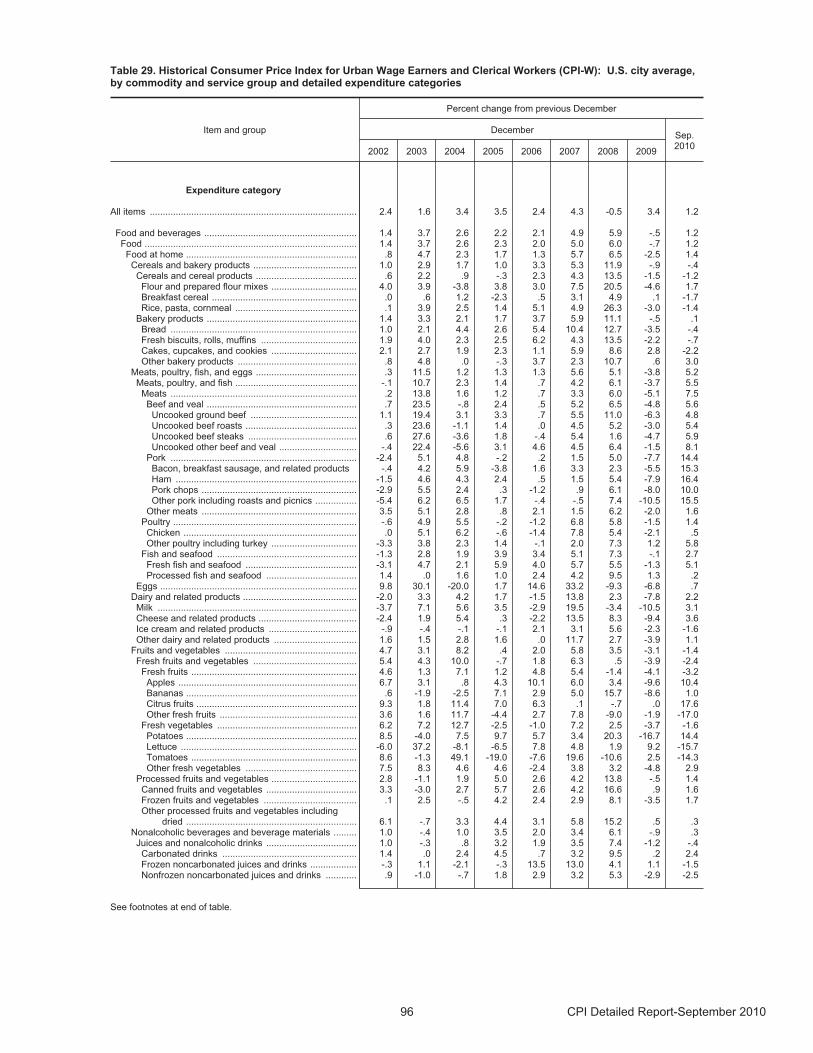
Table 29. Historical Consumer Price Index for Urban Wage Earners and Clerical Workers (CPI-W): U.S. city average,by commodity and service group and detailed expenditure categories
Item and group
Percent change from previous December
DecemberSep.2010
2002 2003 2004 2005 2006 2007 2008 2009
Expenditure category
All items ................................................................................ 2.4 1.6 3.4 3.5 2.4 4.3 -0.5 3.4 1.2
Food and beverages ........................................................... 1.4 3.7 2.6 2.2 2.1 4.9 5.9 -.5 1.2 Food .................................................................................. 1.4 3.7 2.6 2.3 2.0 5.0 6.0 -.7 1.2
Food at home .................................................................. .8 4.7 2.3 1.7 1.3 5.7 6.5 -2.5 1.4 Cereals and bakery products ........................................ 1.0 2.9 1.7 1.0 3.3 5.3 11.9 -.9 -.4
Cereals and cereal products ....................................... .6 2.2 .9 -.3 2.3 4.3 13.5 -1.5 -1.2 Flour and prepared flour mixes ................................. 4.0 3.9 -3.8 3.8 3.0 7.5 20.5 -4.6 1.7 Breakfast cereal ........................................................ .0 .6 1.2 -2.3 .5 3.1 4.9 .1 -1.7 Rice, pasta, cornmeal ............................................... .1 3.9 2.5 1.4 5.1 4.9 26.3 -3.0 -1.4
Bakery products .......................................................... 1.4 3.3 2.1 1.7 3.7 5.9 11.1 -.5 .1 Bread ........................................................................ 1.0 2.1 4.4 2.6 5.4 10.4 12.7 -3.5 -.4 Fresh biscuits, rolls, muffins ..................................... 1.9 4.0 2.3 2.5 6.2 4.3 13.5 -2.2 -.7 Cakes, cupcakes, and cookies ................................. 2.1 2.7 1.9 2.3 1.1 5.9 8.6 2.8 -2.2 Other bakery products .............................................. .8 4.8 .0 -.3 3.7 2.3 10.7 .6 3.0
Meats, poultry, fish, and eggs ....................................... .3 11.5 1.2 1.3 1.3 5.6 5.1 -3.8 5.2 Meats, poultry, and fish ............................................... -.1 10.7 2.3 1.4 .7 4.2 6.1 -3.7 5.5
Meats ........................................................................ .2 13.8 1.6 1.2 .7 3.3 6.0 -5.1 7.5 Beef and veal .......................................................... .7 23.5 -.8 2.4 .5 5.2 6.5 -4.8 5.6
Uncooked ground beef ......................................... 1.1 19.4 3.1 3.3 .7 5.5 11.0 -6.3 4.8 Uncooked beef roasts ........................................... .3 23.6 -1.1 1.4 .0 4.5 5.2 -3.0 5.4 Uncooked beef steaks .......................................... .6 27.6 -3.6 1.8 -.4 5.4 1.6 -4.7 5.9 Uncooked other beef and veal .............................. -.4 22.4 -5.6 3.1 4.6 4.5 6.4 -1.5 8.1
Pork ........................................................................ -2.4 5.1 4.8 -.2 .2 1.5 5.0 -7.7 14.4 Bacon, breakfast sausage, and related products -.4 4.2 5.9 -3.8 1.6 3.3 2.3 -5.5 15.3 Ham ...................................................................... -1.5 4.6 4.3 2.4 .5 1.5 5.4 -7.9 16.4 Pork chops ............................................................ -2.9 5.5 2.4 .3 -1.2 .9 6.1 -8.0 10.0 Other pork including roasts and picnics ................ -5.4 6.2 6.5 1.7 -.4 -.5 7.4 -10.5 15.5
Other meats ............................................................ 3.5 5.1 2.8 .8 2.1 1.5 6.2 -2.0 1.6 Poultry ....................................................................... -.6 4.9 5.5 -.2 -1.2 6.8 5.8 -1.5 1.4
Chicken ................................................................... .0 5.1 6.2 -.6 -1.4 7.8 5.4 -2.1 .5 Other poultry including turkey ................................. -3.3 3.8 2.3 1.4 -.1 2.0 7.3 1.2 5.8
Fish and seafood ...................................................... -1.3 2.8 1.9 3.9 3.4 5.1 7.3 -.1 2.7 Fresh fish and seafood ........................................... -3.1 4.7 2.1 5.9 4.0 5.7 5.5 -1.3 5.1 Processed fish and seafood ................................... 1.4 .0 1.6 1.0 2.4 4.2 9.5 1.3 .2
Eggs ............................................................................ 9.8 30.1 -20.0 1.7 14.6 33.2 -9.3 -6.8 .7 Dairy and related products ............................................ -2.0 3.3 4.2 1.7 -1.5 13.8 2.3 -7.8 2.2
Milk ............................................................................. -3.7 7.1 5.6 3.5 -2.9 19.5 -3.4 -10.5 3.1 Cheese and related products ...................................... -2.4 1.9 5.4 .3 -2.2 13.5 8.3 -9.4 3.6 Ice cream and related products .................................. -.9 -.4 -.1 -.1 2.1 3.1 5.6 -2.3 -1.6 Other dairy and related products ................................ 1.6 1.5 2.8 1.6 .0 11.7 2.7 -3.9 1.1
Fruits and vegetables ................................................... 4.7 3.1 8.2 .4 2.0 5.8 3.5 -3.1 -1.4 Fresh fruits and vegetables ........................................ 5.4 4.3 10.0 -.7 1.8 6.3 .5 -3.9 -2.4
Fresh fruits ................................................................ 4.6 1.3 7.1 1.2 4.8 5.4 -1.4 -4.1 -3.2 Apples ..................................................................... 6.7 3.1 .8 4.3 10.1 6.0 3.4 -9.6 10.4 Bananas .................................................................. .6 -1.9 -2.5 7.1 2.9 5.0 15.7 -8.6 1.0 Citrus fruits .............................................................. 9.3 1.8 11.4 7.0 6.3 .1 -.7 .0 17.6 Other fresh fruits ..................................................... 3.6 1.6 11.7 -4.4 2.7 7.8 -9.0 -1.9 -17.0
Fresh vegetables ...................................................... 6.2 7.2 12.7 -2.5 -1.0 7.2 2.5 -3.7 -1.6 Potatoes .................................................................. 8.5 -4.0 7.5 9.7 5.7 3.4 20.3 -16.7 14.4 Lettuce .................................................................... -6.0 37.2 -8.1 -6.5 7.8 4.8 1.9 9.2 -15.7 Tomatoes ................................................................ 8.6 -1.3 49.1 -19.0 -7.6 19.6 -10.6 2.5 -14.3 Other fresh vegetables ........................................... 7.5 8.3 4.6 4.6 -2.4 3.8 3.2 -4.8 2.9
Processed fruits and vegetables ................................. 2.8 -1.1 1.9 5.0 2.6 4.2 13.8 -.5 1.4 Canned fruits and vegetables ................................... 3.3 -3.0 2.7 5.7 2.6 4.2 16.6 .9 1.6 Frozen fruits and vegetables .................................... .1 2.5 -.5 4.2 2.4 2.9 8.1 -3.5 1.7 Other processed fruits and vegetables including
dried .................................................................. 6.1 -.7 3.3 4.4 3.1 5.8 15.2 .5 .3 Nonalcoholic beverages and beverage materials ......... 1.0 -.4 1.0 3.5 2.0 3.4 6.1 -.9 .3
Juices and nonalcoholic drinks ................................... 1.0 -.3 .8 3.2 1.9 3.5 7.4 -1.2 -.4 Carbonated drinks .................................................... 1.4 .0 2.4 4.5 .7 3.2 9.5 .2 2.4 Frozen noncarbonated juices and drinks .................. -.3 1.1 -2.1 -.3 13.5 13.0 4.1 1.1 -1.5 Nonfrozen noncarbonated juices and drinks ............ .9 -1.0 -.7 1.8 2.9 3.2 5.3 -2.9 -2.5
See footnotes at end of table.
96 CPI Detailed Report-September 2010
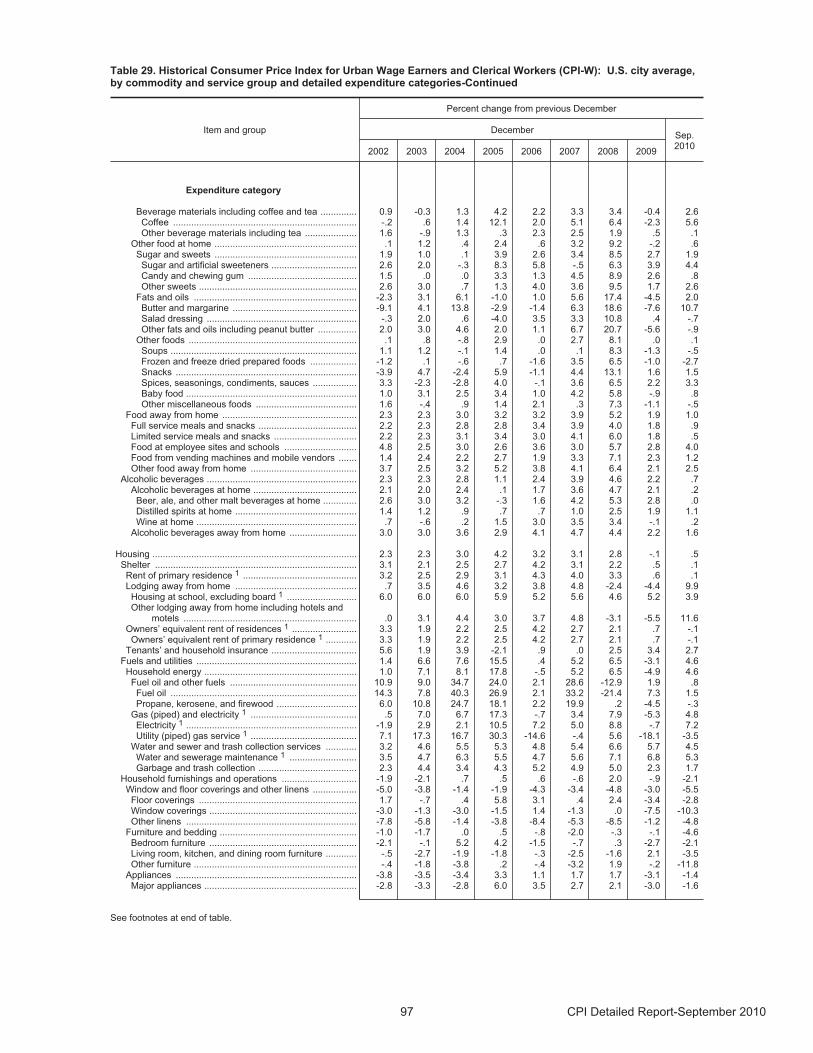
Table 29. Historical Consumer Price Index for Urban Wage Earners and Clerical Workers (CPI-W): U.S. city average,by commodity and service group and detailed expenditure categories-Continued
Item and group
Percent change from previous December
DecemberSep.2010
2002 2003 2004 2005 2006 2007 2008 2009
Expenditure category
Beverage materials including coffee and tea .............. 0.9 -0.3 1.3 4.2 2.2 3.3 3.4 -0.4 2.6 Coffee ....................................................................... -.2 .6 1.4 12.1 2.0 5.1 6.4 -2.3 5.6 Other beverage materials including tea .................... 1.6 -.9 1.3 .3 2.3 2.5 1.9 .5 .1
Other food at home ....................................................... .1 1.2 .4 2.4 .6 3.2 9.2 -.2 .6 Sugar and sweets ....................................................... 1.9 1.0 .1 3.9 2.6 3.4 8.5 2.7 1.9
Sugar and artificial sweeteners ................................. 2.6 2.0 -.3 8.3 5.8 -.5 6.3 3.9 4.4 Candy and chewing gum .......................................... 1.5 .0 .0 3.3 1.3 4.5 8.9 2.6 .8 Other sweets ............................................................. 2.6 3.0 .7 1.3 4.0 3.6 9.5 1.7 2.6
Fats and oils ............................................................... -2.3 3.1 6.1 -1.0 1.0 5.6 17.4 -4.5 2.0 Butter and margarine ................................................ -9.1 4.1 13.8 -2.9 -1.4 6.3 18.6 -7.6 10.7 Salad dressing .......................................................... -.3 2.0 .6 -4.0 3.5 3.3 10.8 .4 -.7 Other fats and oils including peanut butter ............... 2.0 3.0 4.6 2.0 1.1 6.7 20.7 -5.6 -.9
Other foods ................................................................. .1 .8 -.8 2.9 .0 2.7 8.1 .0 .1 Soups ........................................................................ 1.1 1.2 -.1 1.4 .0 .1 8.3 -1.3 -.5 Frozen and freeze dried prepared foods .................. -1.2 .1 -.6 .7 -1.6 3.5 6.5 -1.0 -2.7 Snacks ...................................................................... -3.9 4.7 -2.4 5.9 -1.1 4.4 13.1 1.6 1.5 Spices, seasonings, condiments, sauces ................. 3.3 -2.3 -2.8 4.0 -.1 3.6 6.5 2.2 3.3 Baby food .................................................................. 1.0 3.1 2.5 3.4 1.0 4.2 5.8 -.9 .8 Other miscellaneous foods ....................................... 1.6 -.4 .9 1.4 2.1 .3 7.3 -1.1 -.5
Food away from home .................................................... 2.3 2.3 3.0 3.2 3.2 3.9 5.2 1.9 1.0 Full service meals and snacks ...................................... 2.2 2.3 2.8 2.8 3.4 3.9 4.0 1.8 .9 Limited service meals and snacks ................................ 2.2 2.3 3.1 3.4 3.0 4.1 6.0 1.8 .5 Food at employee sites and schools ............................ 4.8 2.5 3.0 2.6 3.6 3.0 5.7 2.8 4.0 Food from vending machines and mobile vendors ....... 1.4 2.4 2.2 2.7 1.9 3.3 7.1 2.3 1.2 Other food away from home ......................................... 3.7 2.5 3.2 5.2 3.8 4.1 6.4 2.1 2.5
Alcoholic beverages .......................................................... 2.3 2.3 2.8 1.1 2.4 3.9 4.6 2.2 .7 Alcoholic beverages at home ........................................ 2.1 2.0 2.4 .1 1.7 3.6 4.7 2.1 .2
Beer, ale, and other malt beverages at home ............. 2.6 3.0 3.2 -.3 1.6 4.2 5.3 2.8 .0 Distilled spirits at home ............................................... 1.4 1.2 .9 .7 .7 1.0 2.5 1.9 1.1 Wine at home .............................................................. .7 -.6 .2 1.5 3.0 3.5 3.4 -.1 .2
Alcoholic beverages away from home .......................... 3.0 3.0 3.6 2.9 4.1 4.7 4.4 2.2 1.6
Housing ............................................................................... 2.3 2.3 3.0 4.2 3.2 3.1 2.8 -.1 .5 Shelter .............................................................................. 3.1 2.1 2.5 2.7 4.2 3.1 2.2 .5 .1
Rent of primary residence 1 ............................................ 3.2 2.5 2.9 3.1 4.3 4.0 3.3 .6 .1 Lodging away from home ............................................... .7 3.5 4.6 3.2 3.8 4.8 -2.4 -4.4 9.9
Housing at school, excluding board 1 ........................... 6.0 6.0 6.0 5.9 5.2 5.6 4.6 5.2 3.9 Other lodging away from home including hotels and
motels ................................................................... .0 3.1 4.4 3.0 3.7 4.8 -3.1 -5.5 11.6 Owners’ equivalent rent of residences 1 ......................... 3.3 1.9 2.2 2.5 4.2 2.7 2.1 .7 -.1
Owners’ equivalent rent of primary residence 1 ............ 3.3 1.9 2.2 2.5 4.2 2.7 2.1 .7 -.1 Tenants’ and household insurance ................................. 5.6 1.9 3.9 -2.1 .9 .0 2.5 3.4 2.7
Fuels and utilities .............................................................. 1.4 6.6 7.6 15.5 .4 5.2 6.5 -3.1 4.6 Household energy ........................................................... 1.0 7.1 8.1 17.8 -.5 5.2 6.5 -4.9 4.6
Fuel oil and other fuels ................................................. 10.9 9.0 34.7 24.0 2.1 28.6 -12.9 1.9 .8 Fuel oil ........................................................................ 14.3 7.8 40.3 26.9 2.1 33.2 -21.4 7.3 1.5 Propane, kerosene, and firewood ............................... 6.0 10.8 24.7 18.1 2.2 19.9 .2 -4.5 -.3
Gas (piped) and electricity 1 ......................................... .5 7.0 6.7 17.3 -.7 3.4 7.9 -5.3 4.8 Electricity 1 .................................................................. -1.9 2.9 2.1 10.5 7.2 5.0 8.8 -.7 7.2 Utility (piped) gas service 1 ......................................... 7.1 17.3 16.7 30.3 -14.6 -.4 5.6 -18.1 -3.5
Water and sewer and trash collection services ............ 3.2 4.6 5.5 5.3 4.8 5.4 6.6 5.7 4.5 Water and sewerage maintenance 1 .......................... 3.5 4.7 6.3 5.5 4.7 5.6 7.1 6.8 5.3 Garbage and trash collection ...................................... 2.3 4.4 3.4 4.3 5.2 4.9 5.0 2.3 1.7
Household furnishings and operations ............................. -1.9 -2.1 .7 .5 .6 -.6 2.0 -.9 -2.1 Window and floor coverings and other linens ................. -5.0 -3.8 -1.4 -1.9 -4.3 -3.4 -4.8 -3.0 -5.5
Floor coverings ............................................................. 1.7 -.7 .4 5.8 3.1 .4 2.4 -3.4 -2.8 Window coverings ......................................................... -3.0 -1.3 -3.0 -1.5 1.4 -1.3 .0 -7.5 -10.3 Other linens .................................................................. -7.8 -5.8 -1.4 -3.8 -8.4 -5.3 -8.5 -1.2 -4.8
Furniture and bedding ..................................................... -1.0 -1.7 .0 .5 -.8 -2.0 -.3 -.1 -4.6 Bedroom furniture ......................................................... -2.1 -.1 5.2 4.2 -1.5 -.7 .3 -2.7 -2.1 Living room, kitchen, and dining room furniture ............ -.5 -2.7 -1.9 -1.8 -.3 -2.5 -1.6 2.1 -3.5 Other furniture ............................................................... -.4 -1.8 -3.8 .2 -.4 -3.2 1.9 -.2 -11.8
Appliances ...................................................................... -3.8 -3.5 -3.4 3.3 1.1 1.7 1.7 -3.1 -1.4 Major appliances ........................................................... -2.8 -3.3 -2.8 6.0 3.5 2.7 2.1 -3.0 -1.6
See footnotes at end of table.
97 CPI Detailed Report-September 2010
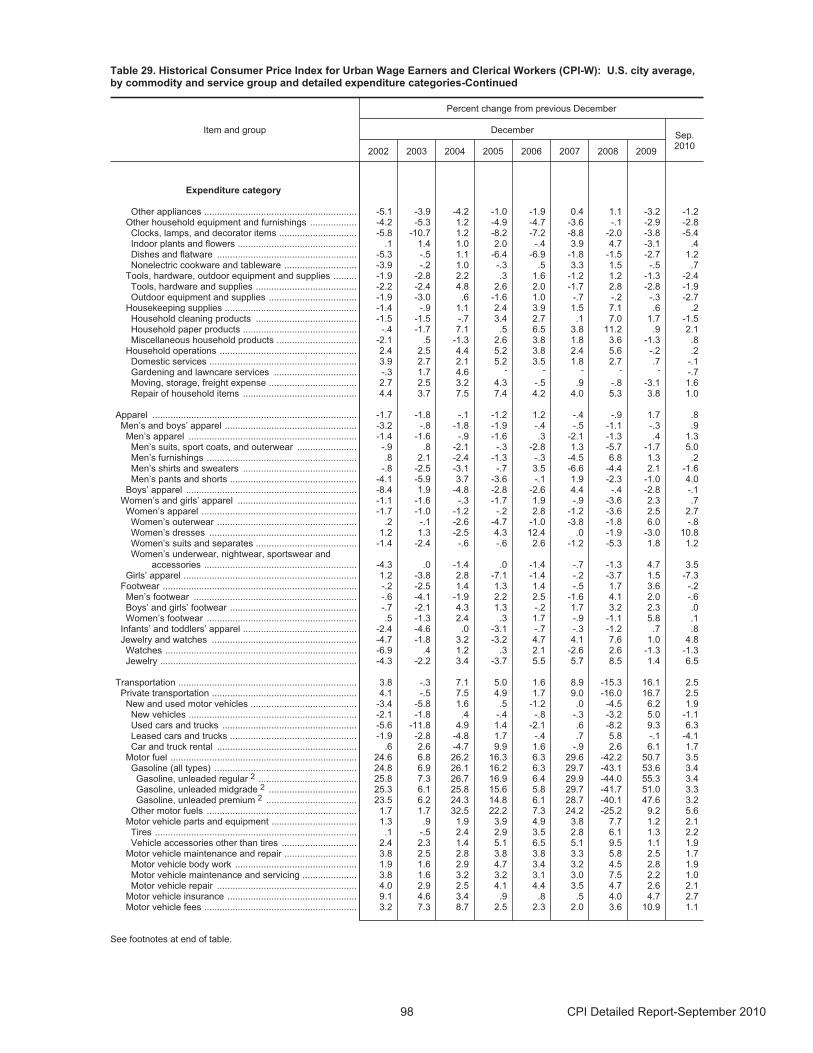
Table 29. Historical Consumer Price Index for Urban Wage Earners and Clerical Workers (CPI-W): U.S. city average,by commodity and service group and detailed expenditure categories-Continued
Item and group
Percent change from previous December
DecemberSep.2010
2002 2003 2004 2005 2006 2007 2008 2009
Expenditure category
Other appliances ........................................................... -5.1 -3.9 -4.2 -1.0 -1.9 0.4 1.1 -3.2 -1.2 Other household equipment and furnishings .................. -4.2 -5.3 1.2 -4.9 -4.7 -3.6 -.1 -2.9 -2.8
Clocks, lamps, and decorator items .............................. -5.8 -10.7 1.2 -8.2 -7.2 -8.8 -2.0 -3.8 -5.4 Indoor plants and flowers .............................................. .1 1.4 1.0 2.0 -.4 3.9 4.7 -3.1 .4 Dishes and flatware ...................................................... -5.3 -.5 1.1 -6.4 -6.9 -1.8 -1.5 -2.7 1.2 Nonelectric cookware and tableware ............................ -3.9 -.2 1.0 -.3 .5 3.3 1.5 -.5 .7
Tools, hardware, outdoor equipment and supplies ......... -1.9 -2.8 2.2 .3 1.6 -1.2 1.2 -1.3 -2.4 Tools, hardware and supplies ....................................... -2.2 -2.4 4.8 2.6 2.0 -1.7 2.8 -2.8 -1.9 Outdoor equipment and supplies .................................. -1.9 -3.0 .6 -1.6 1.0 -.7 -.2 -.3 -2.7
Housekeeping supplies ................................................... -1.4 -.9 1.1 2.4 3.9 1.5 7.1 .6 .2 Household cleaning products ....................................... -1.5 -1.5 -.7 3.4 2.7 .1 7.0 1.7 -1.5 Household paper products ............................................ -.4 -1.7 7.1 .5 6.5 3.8 11.2 .9 2.1 Miscellaneous household products ............................... -2.1 .5 -1.3 2.6 3.8 1.8 3.6 -1.3 .8
Household operations ..................................................... 2.4 2.5 4.4 5.2 3.8 2.4 5.6 -.2 .2 Domestic services ......................................................... 3.9 2.7 2.1 5.2 3.5 1.8 2.7 .7 -.1 Gardening and lawncare services ................................ -.3 1.7 4.6 - - - - - -.7 Moving, storage, freight expense .................................. 2.7 2.5 3.2 4.3 -.5 .9 -.8 -3.1 1.6 Repair of household items ............................................ 4.4 3.7 7.5 7.4 4.2 4.0 5.3 3.8 1.0
Apparel ............................................................................... -1.7 -1.8 -.1 -1.2 1.2 -.4 -.9 1.7 .8 Men’s and boys’ apparel ................................................... -3.2 -.8 -1.8 -1.9 -.4 -.5 -1.1 -.3 .9
Men’s apparel ................................................................. -1.4 -1.6 -.9 -1.6 .3 -2.1 -1.3 .4 1.3 Men’s suits, sport coats, and outerwear ....................... -.9 .8 -2.1 -.3 -2.8 1.3 -5.7 -1.7 5.0 Men’s furnishings .......................................................... .8 2.1 -2.4 -1.3 -.3 -4.5 6.8 1.3 .2 Men’s shirts and sweaters ............................................ -.8 -2.5 -3.1 -.7 3.5 -6.6 -4.4 2.1 -1.6 Men’s pants and shorts ................................................. -4.1 -5.9 3.7 -3.6 -.1 1.9 -2.3 -1.0 4.0
Boys’ apparel .................................................................. -8.4 1.9 -4.8 -2.8 -2.6 4.4 -.4 -2.8 -.1 Women’s and girls’ apparel .............................................. -1.1 -1.6 -.3 -1.7 1.9 -.9 -3.6 2.3 .7
Women’s apparel ............................................................ -1.7 -1.0 -1.2 -.2 2.8 -1.2 -3.6 2.5 2.7 Women’s outerwear ...................................................... .2 -.1 -2.6 -4.7 -1.0 -3.8 -1.8 6.0 -.8 Women’s dresses ......................................................... 1.2 1.3 -2.5 4.3 12.4 .0 -1.9 -3.0 10.8 Women’s suits and separates ....................................... -1.4 -2.4 -.6 -.6 2.6 -1.2 -5.3 1.8 1.2 Women’s underwear, nightwear, sportswear and
accessories ........................................................... -4.3 .0 -1.4 .0 -1.4 -.7 -1.3 4.7 3.5 Girls’ apparel ................................................................... 1.2 -3.8 2.8 -7.1 -1.4 -.2 -3.7 1.5 -7.3
Footwear ........................................................................... -.2 -2.5 1.4 1.3 1.4 -.5 1.7 3.6 -.2 Men’s footwear ............................................................... -.6 -4.1 -1.9 2.2 2.5 -1.6 4.1 2.0 -.6 Boys’ and girls’ footwear ................................................. -.7 -2.1 4.3 1.3 -.2 1.7 3.2 2.3 .0 Women’s footwear .......................................................... .5 -1.3 2.4 .3 1.7 -.9 -1.1 5.8 .1
Infants’ and toddlers’ apparel ............................................ -2.4 -4.6 .0 -3.1 -.7 -.3 -1.2 .7 .8 Jewelry and watches ........................................................ -4.7 -1.8 3.2 -3.2 4.7 4.1 7.6 1.0 4.8
Watches .......................................................................... -6.9 .4 1.2 .3 2.1 -2.6 2.6 -1.3 -1.3 Jewelry ............................................................................ -4.3 -2.2 3.4 -3.7 5.5 5.7 8.5 1.4 6.5
Transportation ..................................................................... 3.8 -.3 7.1 5.0 1.6 8.9 -15.3 16.1 2.5 Private transportation ........................................................ 4.1 -.5 7.5 4.9 1.7 9.0 -16.0 16.7 2.5
New and used motor vehicles ......................................... -3.4 -5.8 1.6 .5 -1.2 .0 -4.5 6.2 1.9 New vehicles ................................................................. -2.1 -1.8 .4 -.4 -.8 -.3 -3.2 5.0 -1.1 Used cars and trucks .................................................... -5.6 -11.8 4.9 1.4 -2.1 .6 -8.2 9.3 6.3 Leased cars and trucks ................................................. -1.9 -2.8 -4.8 1.7 -.4 .7 5.8 -.1 -4.1 Car and truck rental ...................................................... .6 2.6 -4.7 9.9 1.6 -.9 2.6 6.1 1.7
Motor fuel ........................................................................ 24.6 6.8 26.2 16.3 6.3 29.6 -42.2 50.7 3.5 Gasoline (all types) ....................................................... 24.8 6.9 26.1 16.2 6.3 29.7 -43.1 53.6 3.4
Gasoline, unleaded regular 2 ...................................... 25.8 7.3 26.7 16.9 6.4 29.9 -44.0 55.3 3.4 Gasoline, unleaded midgrade 2 .................................. 25.3 6.1 25.8 15.6 5.8 29.7 -41.7 51.0 3.3 Gasoline, unleaded premium 2 ................................... 23.5 6.2 24.3 14.8 6.1 28.7 -40.1 47.6 3.2
Other motor fuels .......................................................... 1.7 1.7 32.5 22.2 7.3 24.2 -25.2 9.2 5.6 Motor vehicle parts and equipment ................................. 1.3 .9 1.9 3.9 4.9 3.8 7.7 1.2 2.1
Tires .............................................................................. .1 -.5 2.4 2.9 3.5 2.8 6.1 1.3 2.2 Vehicle accessories other than tires ............................. 2.4 2.3 1.4 5.1 6.5 5.1 9.5 1.1 1.9
Motor vehicle maintenance and repair ............................ 3.8 2.5 2.8 3.8 3.8 3.3 5.8 2.5 1.7 Motor vehicle body work ............................................... 1.9 1.6 2.9 4.7 3.4 3.2 4.5 2.8 1.9 Motor vehicle maintenance and servicing ..................... 3.8 1.6 3.2 3.2 3.1 3.0 7.5 2.2 1.0 Motor vehicle repair ...................................................... 4.0 2.9 2.5 4.1 4.4 3.5 4.7 2.6 2.1
Motor vehicle insurance .................................................. 9.1 4.6 3.4 .9 .8 .5 4.0 4.7 2.7 Motor vehicle fees ........................................................... 3.2 7.3 8.7 2.5 2.3 2.0 3.6 10.9 1.1
See footnotes at end of table.
98 CPI Detailed Report-September 2010
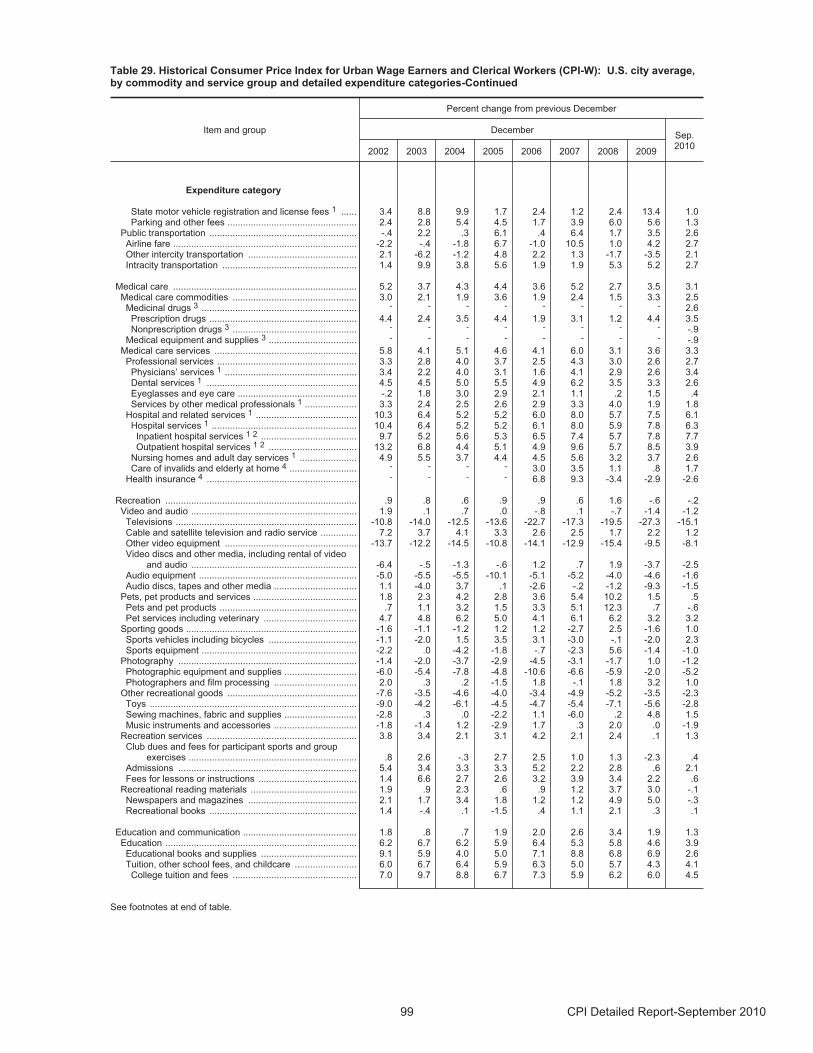
Table 29. Historical Consumer Price Index for Urban Wage Earners and Clerical Workers (CPI-W): U.S. city average,by commodity and service group and detailed expenditure categories-Continued
Item and group
Percent change from previous December
DecemberSep.2010
2002 2003 2004 2005 2006 2007 2008 2009
Expenditure category
State motor vehicle registration and license fees 1 ...... 3.4 8.8 9.9 1.7 2.4 1.2 2.4 13.4 1.0 Parking and other fees .................................................. 2.4 2.8 5.4 4.5 1.7 3.9 6.0 5.6 1.3
Public transportation ......................................................... -.4 2.2 .3 6.1 .4 6.4 1.7 3.5 2.6 Airline fare ....................................................................... -2.2 -.4 -1.8 6.7 -1.0 10.5 1.0 4.2 2.7 Other intercity transportation .......................................... 2.1 -6.2 -1.2 4.8 2.2 1.3 -1.7 -3.5 2.1 Intracity transportation .................................................... 1.4 9.9 3.8 5.6 1.9 1.9 5.3 5.2 2.7
Medical care ....................................................................... 5.2 3.7 4.3 4.4 3.6 5.2 2.7 3.5 3.1 Medical care commodities ................................................ 3.0 2.1 1.9 3.6 1.9 2.4 1.5 3.3 2.5
Medicinal drugs 3 ............................................................ - - - - - - - - 2.6 Prescription drugs ......................................................... 4.4 2.4 3.5 4.4 1.9 3.1 1.2 4.4 3.5 Nonprescription drugs 3 ................................................ - - - - - - - - -.9
Medical equipment and supplies 3 .................................. - - - - - - - - -.9 Medical care services ....................................................... 5.8 4.1 5.1 4.6 4.1 6.0 3.1 3.6 3.3
Professional services ...................................................... 3.3 2.8 4.0 3.7 2.5 4.3 3.0 2.6 2.7 Physicians’ services 1 ................................................... 3.4 2.2 4.0 3.1 1.6 4.1 2.9 2.6 3.4 Dental services 1 .......................................................... 4.5 4.5 5.0 5.5 4.9 6.2 3.5 3.3 2.6 Eyeglasses and eye care .............................................. -.2 1.8 3.0 2.9 2.1 1.1 .2 1.5 .4 Services by other medical professionals 1 .................... 3.3 2.4 2.5 2.6 2.9 3.3 4.0 1.9 1.8
Hospital and related services 1 ....................................... 10.3 6.4 5.2 5.2 6.0 8.0 5.7 7.5 6.1 Hospital services 1 ........................................................ 10.4 6.4 5.2 5.2 6.1 8.0 5.9 7.8 6.3
Inpatient hospital services 1 2 ..................................... 9.7 5.2 5.6 5.3 6.5 7.4 5.7 7.8 7.7 Outpatient hospital services 1 2 .................................. 13.2 6.8 4.4 5.1 4.9 9.6 5.7 8.5 3.9
Nursing homes and adult day services 1 ...................... 4.9 5.5 3.7 4.4 4.5 5.6 3.2 3.7 2.6 Care of invalids and elderly at home 4 .......................... - - - - 3.0 3.5 1.1 .8 1.7
Health insurance 4 .......................................................... - - - - 6.8 9.3 -3.4 -2.9 -2.6
Recreation .......................................................................... .9 .8 .6 .9 .9 .6 1.6 -.6 -.2 Video and audio ................................................................ 1.9 .1 .7 .0 -.8 .1 -.7 -1.4 -1.2
Televisions ...................................................................... -10.8 -14.0 -12.5 -13.6 -22.7 -17.3 -19.5 -27.3 -15.1 Cable and satellite television and radio service .............. 7.2 3.7 4.1 3.3 2.6 2.5 1.7 2.2 1.2 Other video equipment ................................................... -13.7 -12.2 -14.5 -10.8 -14.1 -12.9 -15.4 -9.5 -8.1 Video discs and other media, including rental of video
and audio ................................................................ -6.4 -.5 -1.3 -.6 1.2 .7 1.9 -3.7 -2.5 Audio equipment ............................................................. -5.0 -5.5 -5.5 -10.1 -5.1 -5.2 -4.0 -4.6 -1.6 Audio discs, tapes and other media ................................ 1.1 -4.0 3.7 .1 -2.6 -.2 -1.2 -9.3 -1.5
Pets, pet products and services ........................................ 1.8 2.3 4.2 2.8 3.6 5.4 10.2 1.5 .5 Pets and pet products ..................................................... .7 1.1 3.2 1.5 3.3 5.1 12.3 .7 -.6 Pet services including veterinary .................................... 4.7 4.8 6.2 5.0 4.1 6.1 6.2 3.2 3.2
Sporting goods .................................................................. -1.6 -1.1 -1.2 1.2 1.2 -2.7 2.5 -1.6 1.0 Sports vehicles including bicycles .................................. -1.1 -2.0 1.5 3.5 3.1 -3.0 -.1 -2.0 2.3 Sports equipment ............................................................ -2.2 .0 -4.2 -1.8 -.7 -2.3 5.6 -1.4 -1.0
Photography ..................................................................... -1.4 -2.0 -3.7 -2.9 -4.5 -3.1 -1.7 1.0 -1.2 Photographic equipment and supplies ............................ -6.0 -5.4 -7.8 -4.8 -10.6 -6.6 -5.9 -2.0 -5.2 Photographers and film processing ................................ 2.0 .3 .2 -1.5 1.8 -.1 1.8 3.2 1.0
Other recreational goods .................................................. -7.6 -3.5 -4.6 -4.0 -3.4 -4.9 -5.2 -3.5 -2.3 Toys ................................................................................ -9.0 -4.2 -6.1 -4.5 -4.7 -5.4 -7.1 -5.6 -2.8Sewing machines, fabric and supplies ............................ -2.8 .3 .0 -2.2 1.1 -6.0 .2 4.8 1.5 Music instruments and accessories ................................ -1.8 -1.4 1.2 -2.9 1.7 .3 2.0 .0 -1.9
Recreation services .......................................................... 3.8 3.4 2.1 3.1 4.2 2.1 2.4 .1 1.3 Club dues and fees for participant sports and group
exercises ................................................................. .8 2.6 -.3 2.7 2.5 1.0 1.3 -2.3 .4 Admissions ..................................................................... 5.4 3.4 3.3 3.3 5.2 2.2 2.8 .6 2.1 Fees for lessons or instructions ...................................... 1.4 6.6 2.7 2.6 3.2 3.9 3.4 2.2 .6
Recreational reading materials ......................................... 1.9 .9 2.3 .6 .9 1.2 3.7 3.0 -.1 Newspapers and magazines .......................................... 2.1 1.7 3.4 1.8 1.2 1.2 4.9 5.0 -.3 Recreational books ......................................................... 1.4 -.4 .1 -1.5 .4 1.1 2.1 .3 .1
Education and communication ............................................ 1.8 .8 .7 1.9 2.0 2.6 3.4 1.9 1.3 Education .......................................................................... 6.2 6.7 6.2 5.9 6.4 5.3 5.8 4.6 3.9
Educational books and supplies ..................................... 9.1 5.9 4.0 5.0 7.1 8.8 6.8 6.9 2.6 Tuition, other school fees, and childcare ........................ 6.0 6.7 6.4 5.9 6.3 5.0 5.7 4.3 4.1
College tuition and fees ................................................ 7.0 9.7 8.8 6.7 7.3 5.9 6.2 6.0 4.5
See footnotes at end of table.
99 CPI Detailed Report-September 2010
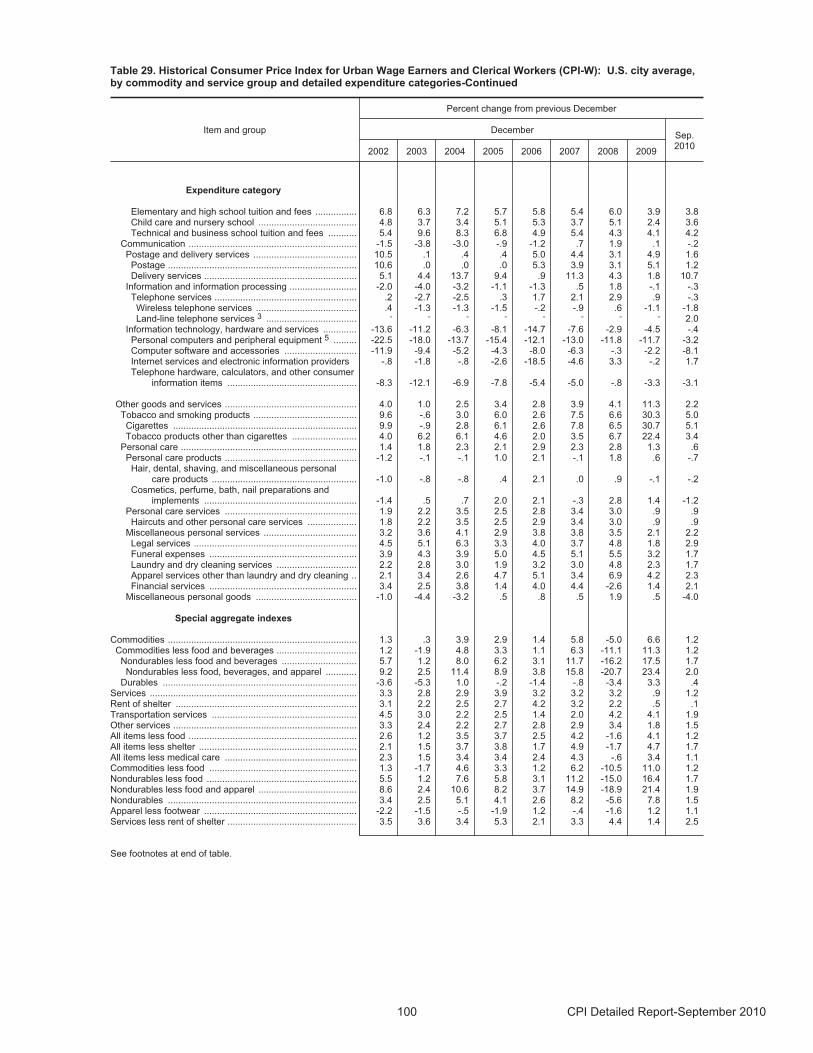
Table 29. Historical Consumer Price Index for Urban Wage Earners and Clerical Workers (CPI-W): U.S. city average,by commodity and service group and detailed expenditure categories-Continued
Item and group
Percent change from previous December
DecemberSep.2010
2002 2003 2004 2005 2006 2007 2008 2009
Expenditure category
Elementary and high school tuition and fees ................ 6.8 6.3 7.2 5.7 5.8 5.4 6.0 3.9 3.8 Child care and nursery school ...................................... 4.8 3.7 3.4 5.1 5.3 3.7 5.1 2.4 3.6 Technical and business school tuition and fees ........... 5.4 9.6 8.3 6.8 4.9 5.4 4.3 4.1 4.2
Communication ................................................................. -1.5 -3.8 -3.0 -.9 -1.2 .7 1.9 .1 -.2 Postage and delivery services ........................................ 10.5 .1 .4 .4 5.0 4.4 3.1 4.9 1.6
Postage ......................................................................... 10.6 .0 .0 .0 5.3 3.9 3.1 5.1 1.2 Delivery services ........................................................... 5.1 4.4 13.7 9.4 .9 11.3 4.3 1.8 10.7
Information and information processing .......................... -2.0 -4.0 -3.2 -1.1 -1.3 .5 1.8 -.1 -.3 Telephone services ....................................................... .2 -2.7 -2.5 .3 1.7 2.1 2.9 .9 -.3
Wireless telephone services ....................................... .4 -1.3 -1.3 -1.5 -.2 -.9 .6 -1.1 -1.8 Land-line telephone services 3 ................................... - - - - - - - - 2.0
Information technology, hardware and services ............. -13.6 -11.2 -6.3 -8.1 -14.7 -7.6 -2.9 -4.5 -.4 Personal computers and peripheral equipment 5 ......... -22.5 -18.0 -13.7 -15.4 -12.1 -13.0 -11.8 -11.7 -3.2 Computer software and accessories ............................ -11.9 -9.4 -5.2 -4.3 -8.0 -6.3 -.3 -2.2 -8.1 Internet services and electronic information providers -.8 -1.8 -.8 -2.6 -18.5 -4.6 3.3 -.2 1.7 Telephone hardware, calculators, and other consumer
information items .................................................. -8.3 -12.1 -6.9 -7.8 -5.4 -5.0 -.8 -3.3 -3.1
Other goods and services ................................................... 4.0 1.0 2.5 3.4 2.8 3.9 4.1 11.3 2.2 Tobacco and smoking products ........................................ 9.6 -.6 3.0 6.0 2.6 7.5 6.6 30.3 5.0
Cigarettes ....................................................................... 9.9 -.9 2.8 6.1 2.6 7.8 6.5 30.7 5.1 Tobacco products other than cigarettes ......................... 4.0 6.2 6.1 4.6 2.0 3.5 6.7 22.4 3.4
Personal care .................................................................... 1.4 1.8 2.3 2.1 2.9 2.3 2.8 1.3 .6 Personal care products ................................................... -1.2 -.1 -.1 1.0 2.1 -.1 1.8 .6 -.7
Hair, dental, shaving, and miscellaneous personalcare products ........................................................ -1.0 -.8 -.8 .4 2.1 .0 .9 -.1 -.2
Cosmetics, perfume, bath, nail preparations andimplements ........................................................... -1.4 .5 .7 2.0 2.1 -.3 2.8 1.4 -1.2
Personal care services ................................................... 1.9 2.2 3.5 2.5 2.8 3.4 3.0 .9 .9 Haircuts and other personal care services ................... 1.8 2.2 3.5 2.5 2.9 3.4 3.0 .9 .9
Miscellaneous personal services .................................... 3.2 3.6 4.1 2.9 3.8 3.8 3.5 2.1 2.2 Legal services ............................................................... 4.5 5.1 6.3 3.3 4.0 3.7 4.8 1.8 2.9 Funeral expenses ......................................................... 3.9 4.3 3.9 5.0 4.5 5.1 5.5 3.2 1.7 Laundry and dry cleaning services ............................... 2.2 2.8 3.0 1.9 3.2 3.0 4.8 2.3 1.7 Apparel services other than laundry and dry cleaning .. 2.1 3.4 2.6 4.7 5.1 3.4 6.9 4.2 2.3 Financial services ......................................................... 3.4 2.5 3.8 1.4 4.0 4.4 -2.6 1.4 2.1
Miscellaneous personal goods ....................................... -1.0 -4.4 -3.2 .5 .8 .5 1.9 .5 -4.0
Special aggregate indexes
Commodities ......................................................................... 1.3 .3 3.9 2.9 1.4 5.8 -5.0 6.6 1.2 Commodities less food and beverages ............................... 1.2 -1.9 4.8 3.3 1.1 6.3 -11.1 11.3 1.2 Nondurables less food and beverages ............................. 5.7 1.2 8.0 6.2 3.1 11.7 -16.2 17.5 1.7
Nondurables less food, beverages, and apparel ............ 9.2 2.5 11.4 8.9 3.8 15.8 -20.7 23.4 2.0 Durables ........................................................................... -3.6 -5.3 1.0 -.2 -1.4 -.8 -3.4 3.3 .4
Services ................................................................................ 3.3 2.8 2.9 3.9 3.2 3.2 3.2 .9 1.2 Rent of shelter ...................................................................... 3.1 2.2 2.5 2.7 4.2 3.2 2.2 .5 .1 Transportation services ........................................................ 4.5 3.0 2.2 2.5 1.4 2.0 4.2 4.1 1.9 Other services ....................................................................... 3.3 2.4 2.2 2.7 2.8 2.9 3.4 1.8 1.5 All items less food ................................................................. 2.6 1.2 3.5 3.7 2.5 4.2 -1.6 4.1 1.2 All items less shelter ............................................................. 2.1 1.5 3.7 3.8 1.7 4.9 -1.7 4.7 1.7 All items less medical care ................................................... 2.3 1.5 3.4 3.4 2.4 4.3 -.6 3.4 1.1 Commodities less food ......................................................... 1.3 -1.7 4.6 3.3 1.2 6.2 -10.5 11.0 1.2 Nondurables less food .......................................................... 5.5 1.2 7.6 5.8 3.1 11.2 -15.0 16.4 1.7 Nondurables less food and apparel ...................................... 8.6 2.4 10.6 8.2 3.7 14.9 -18.9 21.4 1.9 Nondurables ......................................................................... 3.4 2.5 5.1 4.1 2.6 8.2 -5.6 7.8 1.5 Apparel less footwear ........................................................... -2.2 -1.5 -.5 -1.9 1.2 -.4 -1.6 1.2 1.1 Services less rent of shelter .................................................. 3.5 3.6 3.4 5.3 2.1 3.3 4.4 1.4 2.5
See footnotes at end of table.
100 CPI Detailed Report-September 2010
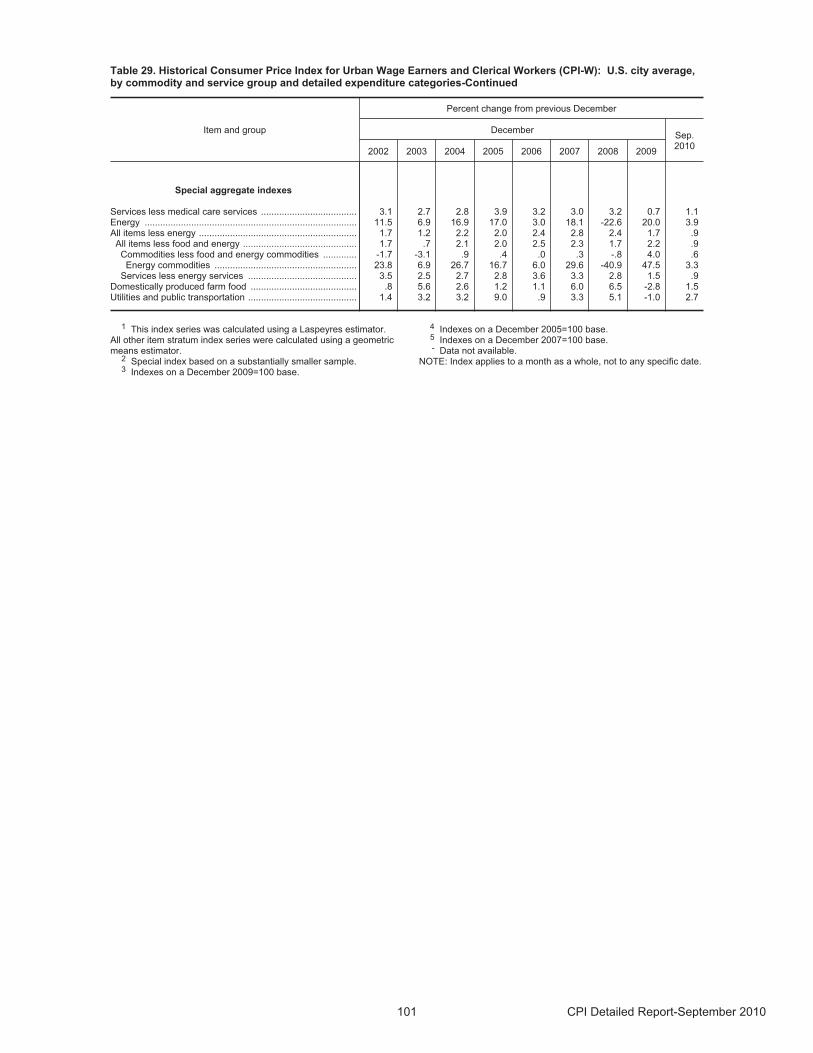
Table 29. Historical Consumer Price Index for Urban Wage Earners and Clerical Workers (CPI-W): U.S. city average,by commodity and service group and detailed expenditure categories-Continued
Item and group
Percent change from previous December
DecemberSep.2010
2002 2003 2004 2005 2006 2007 2008 2009
Special aggregate indexes
Services less medical care services ..................................... 3.1 2.7 2.8 3.9 3.2 3.0 3.2 0.7 1.1 Energy .................................................................................. 11.5 6.9 16.9 17.0 3.0 18.1 -22.6 20.0 3.9All items less energy ............................................................. 1.7 1.2 2.2 2.0 2.4 2.8 2.4 1.7 .9
All items less food and energy ............................................ 1.7 .7 2.1 2.0 2.5 2.3 1.7 2.2 .9 Commodities less food and energy commodities ............. -1.7 -3.1 .9 .4 .0 .3 -.8 4.0 .6
Energy commodities ....................................................... 23.8 6.9 26.7 16.7 6.0 29.6 -40.9 47.5 3.3 Services less energy services .......................................... 3.5 2.5 2.7 2.8 3.6 3.3 2.8 1.5 .9
Domestically produced farm food ......................................... .8 5.6 2.6 1.2 1.1 6.0 6.5 -2.8 1.5 Utilities and public transportation .......................................... 1.4 3.2 3.2 9.0 .9 3.3 5.1 -1.0 2.7
1 This index series was calculated using a Laspeyres estimator. All other item stratum index series were calculated using a geometricmeans estimator.
2 Special index based on a substantially smaller sample.3 Indexes on a December 2009=100 base.
4 Indexes on a December 2005=100 base.5 Indexes on a December 2007=100 base.- Data not available.
NOTE: Index applies to a month as a whole, not to any specific date.
101 CPI Detailed Report-September 2010
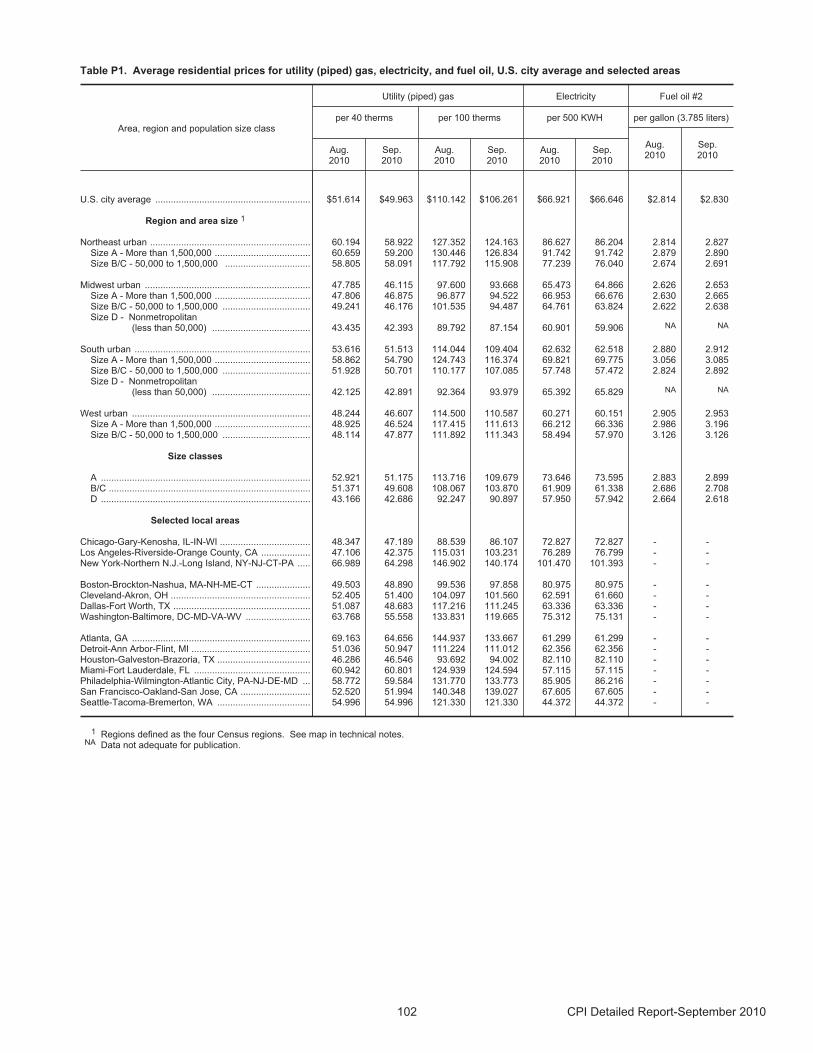
Table P1. Average residential prices for utility (piped) gas, electricity, and fuel oil, U.S. city average and selected areas
Area, region and population size class
Utility (piped) gas Electricity Fuel oil #2
per 40 therms per 100 therms per 500 KWH per gallon (3.785 liters)
Aug.2010
Sep.2010
Aug.2010
Sep.2010
Aug.2010
Sep.2010
Aug.2010
Sep.2010
U.S. city average ............................................................ $51.614 $49.963 $110.142 $106.261 $66.921 $66.646 $2.814 $2.830
Region and area size 1
Northeast urban .............................................................. 60.194 58.922 127.352 124.163 86.627 86.204 2.814 2.827 Size A - More than 1,500,000 ..................................... 60.659 59.200 130.446 126.834 91.742 91.742 2.879 2.890 Size B/C - 50,000 to 1,500,000 ................................. 58.805 58.091 117.792 115.908 77.239 76.040 2.674 2.691
Midwest urban ................................................................ 47.785 46.115 97.600 93.668 65.473 64.866 2.626 2.653 Size A - More than 1,500,000 ..................................... 47.806 46.875 96.877 94.522 66.953 66.676 2.630 2.665 Size B/C - 50,000 to 1,500,000 .................................. 49.241 46.176 101.535 94.487 64.761 63.824 2.622 2.638 Size D - Nonmetropolitan
(less than 50,000) ...................................... 43.435 42.393 89.792 87.154 60.901 59.906 NA NA
South urban .................................................................... 53.616 51.513 114.044 109.404 62.632 62.518 2.880 2.912 Size A - More than 1,500,000 ..................................... 58.862 54.790 124.743 116.374 69.821 69.775 3.056 3.085 Size B/C - 50,000 to 1,500,000 .................................. 51.928 50.701 110.177 107.085 57.748 57.472 2.824 2.892 Size D - Nonmetropolitan
(less than 50,000) ...................................... 42.125 42.891 92.364 93.979 65.392 65.829 NA NA
West urban ..................................................................... 48.244 46.607 114.500 110.587 60.271 60.151 2.905 2.953 Size A - More than 1,500,000 ..................................... 48.925 46.524 117.415 111.613 66.212 66.336 2.986 3.196 Size B/C - 50,000 to 1,500,000 .................................. 48.114 47.877 111.892 111.343 58.494 57.970 3.126 3.126
Size classes
A ................................................................................. 52.921 51.175 113.716 109.679 73.646 73.595 2.883 2.899 B/C .............................................................................. 51.371 49.608 108.067 103.870 61.909 61.338 2.686 2.708 D ................................................................................. 43.166 42.686 92.247 90.897 57.950 57.942 2.664 2.618
Selected local areas
Chicago-Gary-Kenosha, IL-IN-WI ................................... 48.347 47.189 88.539 86.107 72.827 72.827 - -Los Angeles-Riverside-Orange County, CA ................... 47.106 42.375 115.031 103.231 76.289 76.799 - -New York-Northern N.J.-Long Island, NY-NJ-CT-PA ..... 66.989 64.298 146.902 140.174 101.470 101.393 - -
Boston-Brockton-Nashua, MA-NH-ME-CT ..................... 49.503 48.890 99.536 97.858 80.975 80.975 - -Cleveland-Akron, OH ...................................................... 52.405 51.400 104.097 101.560 62.591 61.660 - -Dallas-Fort Worth, TX ..................................................... 51.087 48.683 117.216 111.245 63.336 63.336 - -Washington-Baltimore, DC-MD-VA-WV ......................... 63.768 55.558 133.831 119.665 75.312 75.131 - -
Atlanta, GA ..................................................................... 69.163 64.656 144.937 133.667 61.299 61.299 - -Detroit-Ann Arbor-Flint, MI .............................................. 51.036 50.947 111.224 111.012 62.356 62.356 - -Houston-Galveston-Brazoria, TX .................................... 46.286 46.546 93.692 94.002 82.110 82.110 - -Miami-Fort Lauderdale, FL ............................................. 60.942 60.801 124.939 124.594 57.115 57.115 - -Philadelphia-Wilmington-Atlantic City, PA-NJ-DE-MD ... 58.772 59.584 131.770 133.773 85.905 86.216 - -San Francisco-Oakland-San Jose, CA ........................... 52.520 51.994 140.348 139.027 67.605 67.605 - -Seattle-Tacoma-Bremerton, WA .................................... 54.996 54.996 121.330 121.330 44.372 44.372 - -
1 Regions defined as the four Census regions. See map in technical notes.NA Data not adequate for publication.
102 CPI Detailed Report-September 2010
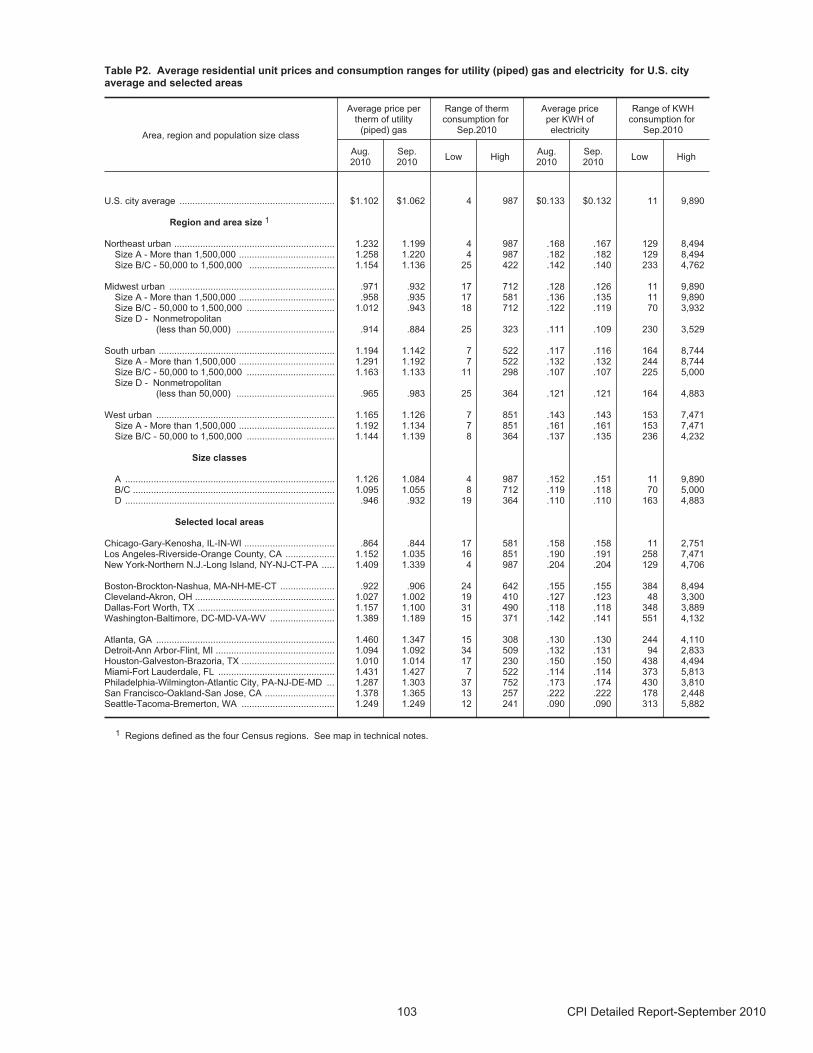
Table P2. Average residential unit prices and consumption ranges for utility (piped) gas and electricity for U.S. cityaverage and selected areas
Area, region and population size class
Average price pertherm of utility
(piped) gas
Range of thermconsumption for
Sep.2010
Average priceper KWH ofelectricity
Range of KWHconsumption for
Sep.2010
Aug.2010
Sep.2010
Low HighAug.2010
Sep.2010
Low High
U.S. city average ............................................................ $1.102 $1.062 4 987 $0.133 $0.132 11 9,890
Region and area size 1
Northeast urban .............................................................. 1.232 1.199 4 987 .168 .167 129 8,494 Size A - More than 1,500,000 ..................................... 1.258 1.220 4 987 .182 .182 129 8,494 Size B/C - 50,000 to 1,500,000 ................................. 1.154 1.136 25 422 .142 .140 233 4,762
Midwest urban ................................................................ .971 .932 17 712 .128 .126 11 9,890 Size A - More than 1,500,000 ..................................... .958 .935 17 581 .136 .135 11 9,890 Size B/C - 50,000 to 1,500,000 .................................. 1.012 .943 18 712 .122 .119 70 3,932 Size D - Nonmetropolitan
(less than 50,000) ...................................... .914 .884 25 323 .111 .109 230 3,529
South urban .................................................................... 1.194 1.142 7 522 .117 .116 164 8,744 Size A - More than 1,500,000 ..................................... 1.291 1.192 7 522 .132 .132 244 8,744 Size B/C - 50,000 to 1,500,000 .................................. 1.163 1.133 11 298 .107 .107 225 5,000 Size D - Nonmetropolitan
(less than 50,000) ...................................... .965 .983 25 364 .121 .121 164 4,883
West urban ..................................................................... 1.165 1.126 7 851 .143 .143 153 7,471 Size A - More than 1,500,000 ..................................... 1.192 1.134 7 851 .161 .161 153 7,471 Size B/C - 50,000 to 1,500,000 .................................. 1.144 1.139 8 364 .137 .135 236 4,232
Size classes
A ................................................................................. 1.126 1.084 4 987 .152 .151 11 9,890 B/C .............................................................................. 1.095 1.055 8 712 .119 .118 70 5,000 D ................................................................................. .946 .932 19 364 .110 .110 163 4,883
Selected local areas
Chicago-Gary-Kenosha, IL-IN-WI ................................... .864 .844 17 581 .158 .158 11 2,751 Los Angeles-Riverside-Orange County, CA ................... 1.152 1.035 16 851 .190 .191 258 7,471 New York-Northern N.J.-Long Island, NY-NJ-CT-PA ..... 1.409 1.339 4 987 .204 .204 129 4,706
Boston-Brockton-Nashua, MA-NH-ME-CT ..................... .922 .906 24 642 .155 .155 384 8,494 Cleveland-Akron, OH ...................................................... 1.027 1.002 19 410 .127 .123 48 3,300 Dallas-Fort Worth, TX ..................................................... 1.157 1.100 31 490 .118 .118 348 3,889 Washington-Baltimore, DC-MD-VA-WV ......................... 1.389 1.189 15 371 .142 .141 551 4,132
Atlanta, GA ..................................................................... 1.460 1.347 15 308 .130 .130 244 4,110 Detroit-Ann Arbor-Flint, MI .............................................. 1.094 1.092 34 509 .132 .131 94 2,833 Houston-Galveston-Brazoria, TX .................................... 1.010 1.014 17 230 .150 .150 438 4,494 Miami-Fort Lauderdale, FL ............................................. 1.431 1.427 7 522 .114 .114 373 5,813 Philadelphia-Wilmington-Atlantic City, PA-NJ-DE-MD ... 1.287 1.303 37 752 .173 .174 430 3,810 San Francisco-Oakland-San Jose, CA ........................... 1.378 1.365 13 257 .222 .222 178 2,448 Seattle-Tacoma-Bremerton, WA .................................... 1.249 1.249 12 241 .090 .090 313 5,882
1 Regions defined as the four Census regions. See map in technical notes.
103 CPI Detailed Report-September 2010
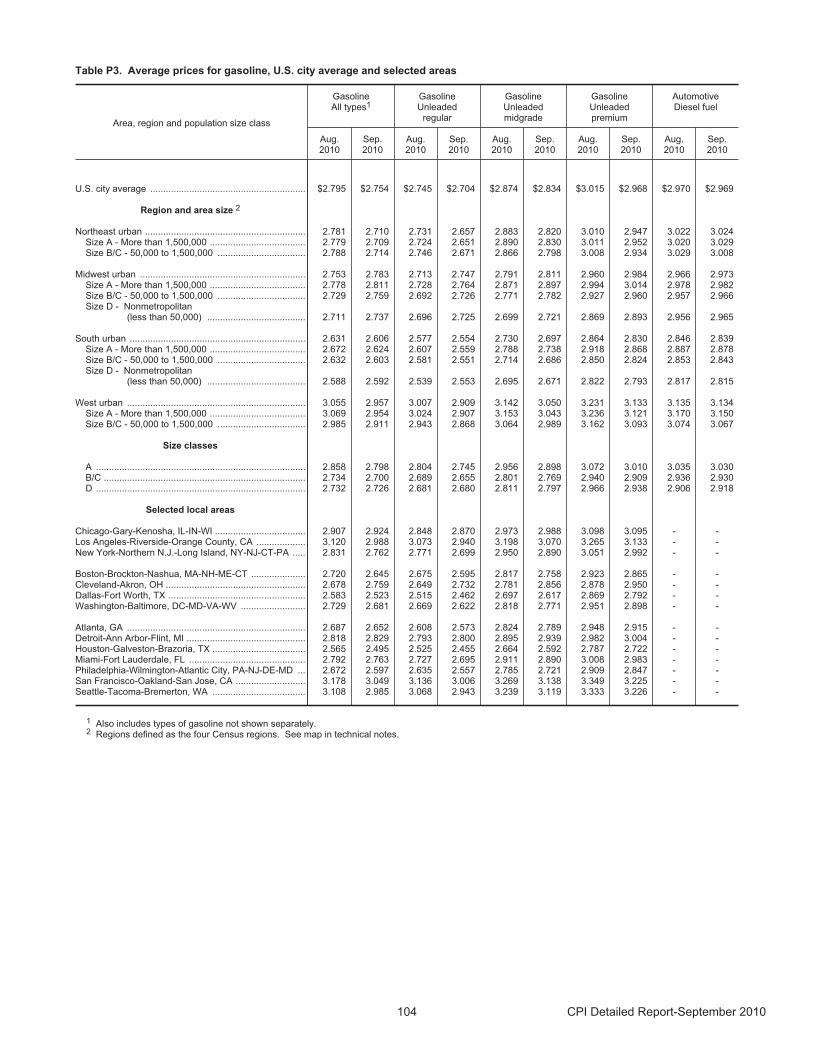
Table P3. Average prices for gasoline, U.S. city average and selected areas
Area, region and population size class
GasolineAll types1
GasolineUnleaded
regular
GasolineUnleadedmidgrade
GasolineUnleadedpremium
AutomotiveDiesel fuel
Aug.2010
Sep.2010
Aug.2010
Sep.2010
Aug.2010
Sep.2010
Aug.2010
Sep.2010
Aug.2010
Sep.2010
U.S. city average ............................................................ $2.795 $2.754 $2.745 $2.704 $2.874 $2.834 $3.015 $2.968 $2.970 $2.969
Region and area size 2
Northeast urban .............................................................. 2.781 2.710 2.731 2.657 2.883 2.820 3.010 2.947 3.022 3.024 Size A - More than 1,500,000 ..................................... 2.779 2.709 2.724 2.651 2.890 2.830 3.011 2.952 3.020 3.029 Size B/C - 50,000 to 1,500,000 .................................. 2.788 2.714 2.746 2.671 2.866 2.798 3.008 2.934 3.029 3.008
Midwest urban ................................................................ 2.753 2.783 2.713 2.747 2.791 2.811 2.960 2.984 2.966 2.973 Size A - More than 1,500,000 ..................................... 2.778 2.811 2.728 2.764 2.871 2.897 2.994 3.014 2.978 2.982 Size B/C - 50,000 to 1,500,000 .................................. 2.729 2.759 2.692 2.726 2.771 2.782 2.927 2.960 2.957 2.966 Size D - Nonmetropolitan
(less than 50,000) ...................................... 2.711 2.737 2.696 2.725 2.699 2.721 2.869 2.893 2.956 2.965
South urban .................................................................... 2.631 2.606 2.577 2.554 2.730 2.697 2.864 2.830 2.846 2.839 Size A - More than 1,500,000 ..................................... 2.672 2.624 2.607 2.559 2.788 2.738 2.918 2.868 2.887 2.878 Size B/C - 50,000 to 1,500,000 .................................. 2.632 2.603 2.581 2.551 2.714 2.686 2.850 2.824 2.853 2.843 Size D - Nonmetropolitan
(less than 50,000) ...................................... 2.588 2.592 2.539 2.553 2.695 2.671 2.822 2.793 2.817 2.815
West urban ..................................................................... 3.055 2.957 3.007 2.909 3.142 3.050 3.231 3.133 3.135 3.134 Size A - More than 1,500,000 ..................................... 3.069 2.954 3.024 2.907 3.153 3.043 3.236 3.121 3.170 3.150 Size B/C - 50,000 to 1,500,000 .................................. 2.985 2.911 2.943 2.868 3.064 2.989 3.162 3.093 3.074 3.067
Size classes
A ................................................................................. 2.858 2.798 2.804 2.745 2.956 2.898 3.072 3.010 3.035 3.030 B/C .............................................................................. 2.734 2.700 2.689 2.655 2.801 2.769 2.940 2.909 2.936 2.930 D ................................................................................. 2.732 2.726 2.681 2.680 2.811 2.797 2.966 2.938 2.906 2.918
Selected local areas
Chicago-Gary-Kenosha, IL-IN-WI ................................... 2.907 2.924 2.848 2.870 2.973 2.988 3.098 3.095 - -Los Angeles-Riverside-Orange County, CA ................... 3.120 2.988 3.073 2.940 3.198 3.070 3.265 3.133 - -New York-Northern N.J.-Long Island, NY-NJ-CT-PA ..... 2.831 2.762 2.771 2.699 2.950 2.890 3.051 2.992 - -
Boston-Brockton-Nashua, MA-NH-ME-CT ..................... 2.720 2.645 2.675 2.595 2.817 2.758 2.923 2.865 - -Cleveland-Akron, OH ...................................................... 2.678 2.759 2.649 2.732 2.781 2.856 2.878 2.950 - -Dallas-Fort Worth, TX ..................................................... 2.583 2.523 2.515 2.462 2.697 2.617 2.869 2.792 - -Washington-Baltimore, DC-MD-VA-WV ......................... 2.729 2.681 2.669 2.622 2.818 2.771 2.951 2.898 - -
Atlanta, GA ..................................................................... 2.687 2.652 2.608 2.573 2.824 2.789 2.948 2.915 - -Detroit-Ann Arbor-Flint, MI .............................................. 2.818 2.829 2.793 2.800 2.895 2.939 2.982 3.004 - -Houston-Galveston-Brazoria, TX .................................... 2.565 2.495 2.525 2.455 2.664 2.592 2.787 2.722 - -Miami-Fort Lauderdale, FL ............................................. 2.792 2.763 2.727 2.695 2.911 2.890 3.008 2.983 - -Philadelphia-Wilmington-Atlantic City, PA-NJ-DE-MD ... 2.672 2.597 2.635 2.557 2.785 2.721 2.909 2.847 - -San Francisco-Oakland-San Jose, CA ........................... 3.178 3.049 3.136 3.006 3.269 3.138 3.349 3.225 - -Seattle-Tacoma-Bremerton, WA .................................... 3.108 2.985 3.068 2.943 3.239 3.119 3.333 3.226 - -
1 Also includes types of gasoline not shown separately.2 Regions defined as the four Census regions. See map in technical notes.
104 CPI Detailed Report-September 2010
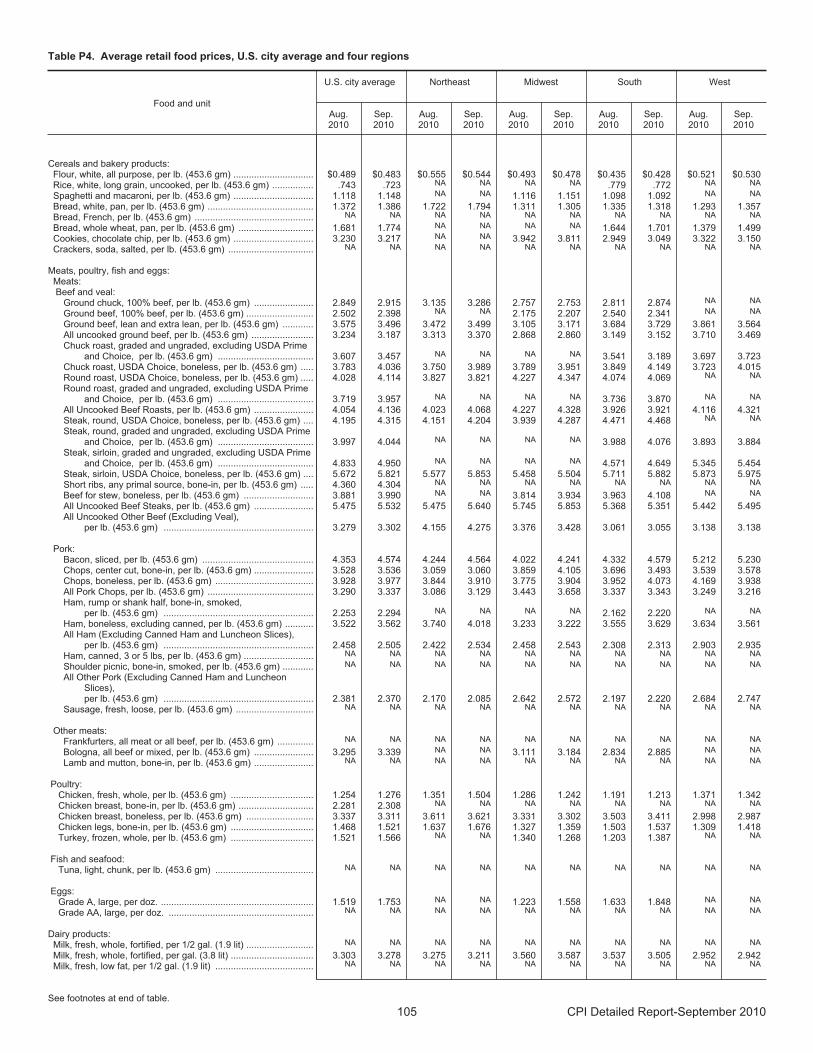
Table P4. Average retail food prices, U.S. city average and four regions
Food and unit
U.S. city average Northeast Midwest South West
Aug.2010
Sep.2010
Aug.2010
Sep.2010
Aug.2010
Sep.2010
Aug.2010
Sep.2010
Aug.2010
Sep.2010
Cereals and bakery products:Flour, white, all purpose, per lb. (453.6 gm) ............................... $0.489 $0.483 $0.555 $0.544 $0.493 $0.478 $0.435 $0.428 $0.521 $0.530 Rice, white, long grain, uncooked, per lb. (453.6 gm) ................ .743 .723 NA NA NA NA .779 .772 NA NA
Spaghetti and macaroni, per lb. (453.6 gm) ............................... 1.118 1.148 NA NA 1.116 1.151 1.098 1.092 NA NA
Bread, white, pan, per lb. (453.6 gm) ......................................... 1.372 1.386 1.722 1.794 1.311 1.305 1.335 1.318 1.293 1.357 Bread, French, per lb. (453.6 gm) .............................................. NA NA NA NA NA NA NA NA NA NA
Bread, whole wheat, pan, per lb. (453.6 gm) ............................. 1.681 1.774 NA NA NA NA 1.644 1.701 1.379 1.499 Cookies, chocolate chip, per lb. (453.6 gm) ............................... 3.230 3.217 NA NA 3.942 3.811 2.949 3.049 3.322 3.150 Crackers, soda, salted, per lb. (453.6 gm) ................................. NA NA NA NA NA NA NA NA NA NA
Meats, poultry, fish and eggs:Meats: Beef and veal:
Ground chuck, 100% beef, per lb. (453.6 gm) ....................... 2.849 2.915 3.135 3.286 2.757 2.753 2.811 2.874 NA NA
Ground beef, 100% beef, per lb. (453.6 gm) .......................... 2.502 2.398 NA NA 2.175 2.207 2.540 2.341 NA NA
Ground beef, lean and extra lean, per lb. (453.6 gm) ............ 3.575 3.496 3.472 3.499 3.105 3.171 3.684 3.729 3.861 3.564 All uncooked ground beef, per lb. (453.6 gm) ........................ 3.234 3.187 3.313 3.370 2.868 2.860 3.149 3.152 3.710 3.469 Chuck roast, graded and ungraded, excluding USDA Prime
and Choice, per lb. (453.6 gm) ..................................... 3.607 3.457 NA NA NA NA 3.541 3.189 3.697 3.723 Chuck roast, USDA Choice, boneless, per lb. (453.6 gm) ..... 3.783 4.036 3.750 3.989 3.789 3.951 3.849 4.149 3.723 4.015 Round roast, USDA Choice, boneless, per lb. (453.6 gm) ..... 4.028 4.114 3.827 3.821 4.227 4.347 4.074 4.069 NA NA
Round roast, graded and ungraded, excluding USDA Primeand Choice, per lb. (453.6 gm) ..................................... 3.719 3.957 NA NA NA NA 3.736 3.870 NA NA
All Uncooked Beef Roasts, per lb. (453.6 gm) ....................... 4.054 4.136 4.023 4.068 4.227 4.328 3.926 3.921 4.116 4.321 Steak, round, USDA Choice, boneless, per lb. (453.6 gm) .... 4.195 4.315 4.151 4.204 3.939 4.287 4.471 4.468 NA NA
Steak, round, graded and ungraded, excluding USDA Primeand Choice, per lb. (453.6 gm) ..................................... 3.997 4.044 NA NA NA NA 3.988 4.076 3.893 3.884
Steak, sirloin, graded and ungraded, excluding USDA Primeand Choice, per lb. (453.6 gm) ..................................... 4.833 4.950 NA NA NA NA 4.571 4.649 5.345 5.454
Steak, sirloin, USDA Choice, boneless, per lb. (453.6 gm) .... 5.672 5.821 5.577 5.853 5.458 5.504 5.711 5.882 5.873 5.975 Short ribs, any primal source, bone-in, per lb. (453.6 gm) ..... 4.360 4.304 NA NA NA NA NA NA NA NA
Beef for stew, boneless, per lb. (453.6 gm) ........................... 3.881 3.990 NA NA 3.814 3.934 3.963 4.108 NA NA
All Uncooked Beef Steaks, per lb. (453.6 gm) ....................... 5.475 5.532 5.475 5.640 5.745 5.853 5.368 5.351 5.442 5.495 All Uncooked Other Beef (Excluding Veal),
per lb. (453.6 gm) .......................................................... 3.279 3.302 4.155 4.275 3.376 3.428 3.061 3.055 3.138 3.138
Pork: Bacon, sliced, per lb. (453.6 gm) ........................................... 4.353 4.574 4.244 4.564 4.022 4.241 4.332 4.579 5.212 5.230 Chops, center cut, bone-in, per lb. (453.6 gm) ....................... 3.528 3.536 3.059 3.060 3.859 4.105 3.696 3.493 3.539 3.578 Chops, boneless, per lb. (453.6 gm) ...................................... 3.928 3.977 3.844 3.910 3.775 3.904 3.952 4.073 4.169 3.938 All Pork Chops, per lb. (453.6 gm) ......................................... 3.290 3.337 3.086 3.129 3.443 3.658 3.337 3.343 3.249 3.216 Ham, rump or shank half, bone-in, smoked,
per lb. (453.6 gm) .......................................................... 2.253 2.294 NA NA NA NA 2.162 2.220 NA NA
Ham, boneless, excluding canned, per lb. (453.6 gm) ........... 3.522 3.562 3.740 4.018 3.233 3.222 3.555 3.629 3.634 3.561 All Ham (Excluding Canned Ham and Luncheon Slices),
per lb. (453.6 gm) .......................................................... 2.458 2.505 2.422 2.534 2.458 2.543 2.308 2.313 2.903 2.935 Ham, canned, 3 or 5 lbs, per lb. (453.6 gm) ........................... NA NA NA NA NA NA NA NA NA NA
Shoulder picnic, bone-in, smoked, per lb. (453.6 gm) ............ NA NA NA NA NA NA NA NA NA NA
All Other Pork (Excluding Canned Ham and LuncheonSlices),per lb. (453.6 gm) .......................................................... 2.381 2.370 2.170 2.085 2.642 2.572 2.197 2.220 2.684 2.747
Sausage, fresh, loose, per lb. (453.6 gm) .............................. NA NA NA NA NA NA NA NA NA NA
Other meats: Frankfurters, all meat or all beef, per lb. (453.6 gm) .............. NA NA NA NA NA NA NA NA NA NA
Bologna, all beef or mixed, per lb. (453.6 gm) ....................... 3.295 3.339 NA NA 3.111 3.184 2.834 2.885 NA NA
Lamb and mutton, bone-in, per lb. (453.6 gm) ....................... NA NA NA NA NA NA NA NA NA NA
Poultry: Chicken, fresh, whole, per lb. (453.6 gm) ................................ 1.254 1.276 1.351 1.504 1.286 1.242 1.191 1.213 1.371 1.342 Chicken breast, bone-in, per lb. (453.6 gm) ............................. 2.281 2.308 NA NA NA NA NA NA NA NA
Chicken breast, boneless, per lb. (453.6 gm) .......................... 3.337 3.311 3.611 3.621 3.331 3.302 3.503 3.411 2.998 2.987 Chicken legs, bone-in, per lb. (453.6 gm) ................................ 1.468 1.521 1.637 1.676 1.327 1.359 1.503 1.537 1.309 1.418 Turkey, frozen, whole, per lb. (453.6 gm) ................................ 1.521 1.566 NA NA 1.340 1.268 1.203 1.387 NA NA
Fish and seafood: Tuna, light, chunk, per lb. (453.6 gm) ...................................... NA NA NA NA NA NA NA NA NA NA
Eggs: Grade A, large, per doz. ........................................................... 1.519 1.753 NA NA 1.223 1.558 1.633 1.848 NA NA
Grade AA, large, per doz. ........................................................ NA NA NA NA NA NA NA NA NA NA
Dairy products: Milk, fresh, whole, fortified, per 1/2 gal. (1.9 lit) .......................... NA NA NA NA NA NA NA NA NA NA
Milk, fresh, whole, fortified, per gal. (3.8 lit) ................................ 3.303 3.278 3.275 3.211 3.560 3.587 3.537 3.505 2.952 2.942 Milk, fresh, low fat, per 1/2 gal. (1.9 lit) ...................................... NA NA NA NA NA NA NA NA NA NA
See footnotes at end of table.
105 CPI Detailed Report-September 2010
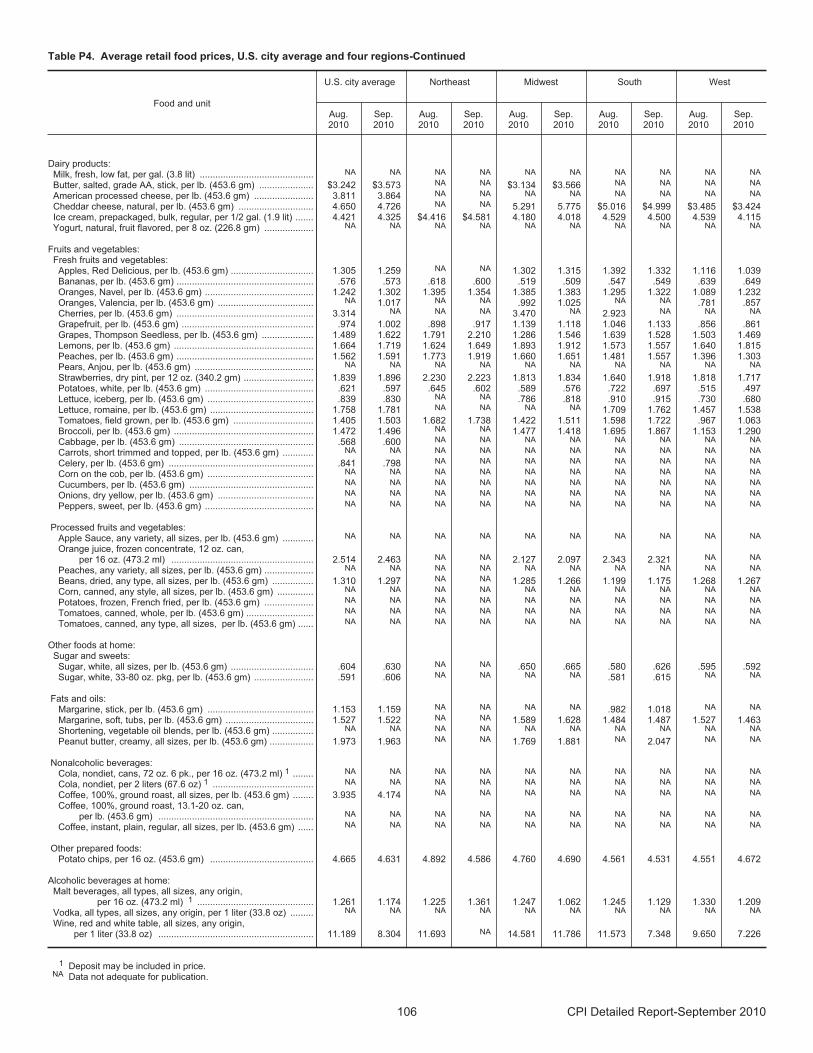
Table P4. Average retail food prices, U.S. city average and four regions-Continued
Food and unit
U.S. city average Northeast Midwest South West
Aug.2010
Sep.2010
Aug.2010
Sep.2010
Aug.2010
Sep.2010
Aug.2010
Sep.2010
Aug.2010
Sep.2010
Dairy products: Milk, fresh, low fat, per gal. (3.8 lit) ............................................ NA NA NA NA NA NA NA NA NA NA
Butter, salted, grade AA, stick, per lb. (453.6 gm) ..................... $3.242 $3.573 NA NA $3.134 $3.566 NA NA NA NA
American processed cheese, per lb. (453.6 gm) ....................... 3.811 3.864 NA NA NA NA NA NA NA NA
Cheddar cheese, natural, per lb. (453.6 gm) ............................. 4.650 4.726 NA NA 5.291 5.775 $5.016 $4.999 $3.485 $3.424 Ice cream, prepackaged, bulk, regular, per 1/2 gal. (1.9 lit) ....... 4.421 4.325 $4.416 $4.581 4.180 4.018 4.529 4.500 4.539 4.115 Yogurt, natural, fruit flavored, per 8 oz. (226.8 gm) ................... NA NA NA NA NA NA NA NA NA NA
Fruits and vegetables: Fresh fruits and vegetables:
Apples, Red Delicious, per lb. (453.6 gm) ................................ 1.305 1.259 NA NA 1.302 1.315 1.392 1.332 1.116 1.039 Bananas, per lb. (453.6 gm) ..................................................... .576 .573 .618 .600 .519 .509 .547 .549 .639 .649 Oranges, Navel, per lb. (453.6 gm) .......................................... 1.242 1.302 1.395 1.354 1.385 1.383 1.295 1.322 1.089 1.232 Oranges, Valencia, per lb. (453.6 gm) ..................................... NA 1.017 NA NA .992 1.025 NA NA .781 .857 Cherries, per lb. (453.6 gm) ..................................................... 3.314 NA NA NA 3.470 NA 2.923 NA NA NA
Grapefruit, per lb. (453.6 gm) ................................................... .974 1.002 .898 .917 1.139 1.118 1.046 1.133 .856 .861 Grapes, Thompson Seedless, per lb. (453.6 gm) .................... 1.489 1.622 1.791 2.210 1.286 1.546 1.639 1.528 1.503 1.469 Lemons, per lb. (453.6 gm) ...................................................... 1.664 1.719 1.624 1.649 1.893 1.912 1.573 1.557 1.640 1.815 Peaches, per lb. (453.6 gm) ..................................................... 1.562 1.591 1.773 1.919 1.660 1.651 1.481 1.557 1.396 1.303 Pears, Anjou, per lb. (453.6 gm) .............................................. NA NA NA NA NA NA NA NA NA NA
Strawberries, dry pint, per 12 oz. (340.2 gm) ........................... 1.839 1.896 2.230 2.223 1.813 1.834 1.640 1.918 1.818 1.717 Potatoes, white, per lb. (453.6 gm) .......................................... .621 .597 .645 .602 .589 .576 .722 .697 .515 .497 Lettuce, iceberg, per lb. (453.6 gm) ......................................... .839 .830 NA NA .786 .818 .910 .915 .730 .680 Lettuce, romaine, per lb. (453.6 gm) ........................................ 1.758 1.781 NA NA NA NA 1.709 1.762 1.457 1.538 Tomatoes, field grown, per lb. (453.6 gm) ............................... 1.405 1.503 1.682 1.738 1.422 1.511 1.598 1.722 .967 1.063 Broccoli, per lb. (453.6 gm) ...................................................... 1.472 1.496 NA NA 1.477 1.418 1.695 1.867 1.153 1.290 Cabbage, per lb. (453.6 gm) .................................................... .568 .600 NA NA NA NA NA NA NA NA
Carrots, short trimmed and topped, per lb. (453.6 gm) ............ NA NA NA NA NA NA NA NA NA NA
Celery, per lb. (453.6 gm) ........................................................ .841 .798 NA NA NA NA NA NA NA NA
Corn on the cob, per lb. (453.6 gm) ......................................... NA NA NA NA NA NA NA NA NA NA
Cucumbers, per lb. (453.6 gm) ................................................ NA NA NA NA NA NA NA NA NA NA
Onions, dry yellow, per lb. (453.6 gm) ..................................... NA NA NA NA NA NA NA NA NA NA
Peppers, sweet, per lb. (453.6 gm) .......................................... NA NA NA NA NA NA NA NA NA NA
Processed fruits and vegetables: Apple Sauce, any variety, all sizes, per lb. (453.6 gm) ............ NA NA NA NA NA NA NA NA NA NA
Orange juice, frozen concentrate, 12 oz. can, per 16 oz. (473.2 ml) ....................................................... 2.514 2.463 NA NA 2.127 2.097 2.343 2.321 NA NA
Peaches, any variety, all sizes, per lb. (453.6 gm) ................... NA NA NA NA NA NA NA NA NA NA
Beans, dried, any type, all sizes, per lb. (453.6 gm) ................ 1.310 1.297 NA NA 1.285 1.266 1.199 1.175 1.268 1.267 Corn, canned, any style, all sizes, per lb. (453.6 gm) .............. NA NA NA NA NA NA NA NA NA NA
Potatoes, frozen, French fried, per lb. (453.6 gm) ................... NA NA NA NA NA NA NA NA NA NA
Tomatoes, canned, whole, per lb. (453.6 gm) .......................... NA NA NA NA NA NA NA NA NA NA
Tomatoes, canned, any type, all sizes, per lb. (453.6 gm) ...... NA NA NA NA NA NA NA NA NA NA
Other foods at home: Sugar and sweets:
Sugar, white, all sizes, per lb. (453.6 gm) ................................ .604 .630 NA NA .650 .665 .580 .626 .595 .592 Sugar, white, 33-80 oz. pkg, per lb. (453.6 gm) ....................... .591 .606 NA NA NA NA .581 .615 NA NA
Fats and oils: Margarine, stick, per lb. (453.6 gm) ......................................... 1.153 1.159 NA NA NA NA .982 1.018 NA NA
Margarine, soft, tubs, per lb. (453.6 gm) .................................. 1.527 1.522 NA NA 1.589 1.628 1.484 1.487 1.527 1.463 Shortening, vegetable oil blends, per lb. (453.6 gm) ................ NA NA NA NA NA NA NA NA NA NA
Peanut butter, creamy, all sizes, per lb. (453.6 gm) ................. 1.973 1.963 NA NA 1.769 1.881 NA 2.047 NA NA
Nonalcoholic beverages: Cola, nondiet, cans, 72 oz. 6 pk., per 16 oz. (473.2 ml) 1 ........ NA NA NA NA NA NA NA NA NA NA
Cola, nondiet, per 2 liters (67.6 oz) 1 ....................................... NA NA NA NA NA NA NA NA NA NA
Coffee, 100%, ground roast, all sizes, per lb. (453.6 gm) ........ 3.935 4.174 NA NA NA NA NA NA NA NA
Coffee, 100%, ground roast, 13.1-20 oz. can, per lb. (453.6 gm) ............................................................ NA NA NA NA NA NA NA NA NA NA
Coffee, instant, plain, regular, all sizes, per lb. (453.6 gm) ...... NA NA NA NA NA NA NA NA NA NA
Other prepared foods: Potato chips, per 16 oz. (453.6 gm) ........................................ 4.665 4.631 4.892 4.586 4.760 4.690 4.561 4.531 4.551 4.672
Alcoholic beverages at home: Malt beverages, all types, all sizes, any origin,
per 16 oz. (473.2 ml) 1 ............................................. 1.261 1.174 1.225 1.361 1.247 1.062 1.245 1.129 1.330 1.209 Vodka, all types, all sizes, any origin, per 1 liter (33.8 oz) ......... NA NA NA NA NA NA NA NA NA NA
Wine, red and white table, all sizes, any origin, per 1 liter (33.8 oz) ............................................................ 11.189 8.304 11.693 NA 14.581 11.786 11.573 7.348 9.650 7.226
1 Deposit may be included in price.NA Data not adequate for publication.
106 CPI Detailed Report-September 2010
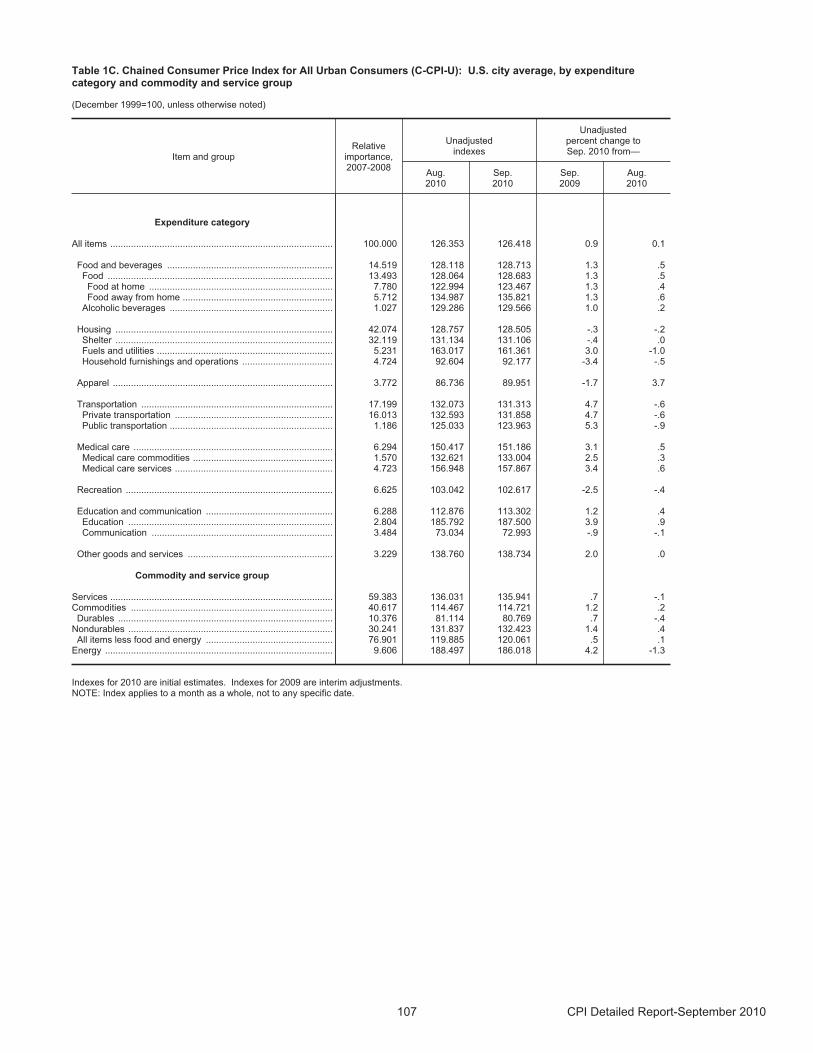
Table 1C. Chained Consumer Price Index for All Urban Consumers (C-CPI-U): U.S. city average, by expenditurecategory and commodity and service group
(December 1999=100, unless otherwise noted)
Item and groupRelative
importance,2007-2008
Unadjustedindexes
Unadjustedpercent change toSep. 2010 from—
Aug.2010
Sep.2010
Sep.2009
Aug.2010
Expenditure category
All items ...................................................................................... 100.000 126.353 126.418 0.9 0.1
Food and beverages ................................................................ 14.519 128.118 128.713 1.3 .5Food ....................................................................................... 13.493 128.064 128.683 1.3 .5
Food at home ....................................................................... 7.780 122.994 123.467 1.3 .4Food away from home .......................................................... 5.712 134.987 135.821 1.3 .6
Alcoholic beverages ............................................................... 1.027 129.286 129.566 1.0 .2
Housing .................................................................................... 42.074 128.757 128.505 -.3 -.2 Shelter .................................................................................... 32.119 131.134 131.106 -.4 .0 Fuels and utilities .................................................................... 5.231 163.017 161.361 3.0 -1.0Household furnishings and operations ................................... 4.724 92.604 92.177 -3.4 -.5
Apparel ..................................................................................... 3.772 86.736 89.951 -1.7 3.7
Transportation .......................................................................... 17.199 132.073 131.313 4.7 -.6 Private transportation ............................................................. 16.013 132.593 131.858 4.7 -.6Public transportation ............................................................... 1.186 125.033 123.963 5.3 -.9
Medical care ............................................................................. 6.294 150.417 151.186 3.1 .5Medical care commodities ...................................................... 1.570 132.621 133.004 2.5 .3Medical care services ............................................................. 4.723 156.948 157.867 3.4 .6
Recreation ................................................................................ 6.625 103.042 102.617 -2.5 -.4
Education and communication ................................................. 6.288 112.876 113.302 1.2 .4Education ............................................................................... 2.804 185.792 187.500 3.9 .9 Communication ...................................................................... 3.484 73.034 72.993 -.9 -.1
Other goods and services ........................................................ 3.229 138.760 138.734 2.0 .0
Commodity and service group
Services ...................................................................................... 59.383 136.031 135.941 .7 -.1 Commodities .............................................................................. 40.617 114.467 114.721 1.2 .2
Durables ................................................................................... 10.376 81.114 80.769 .7 -.4 Nondurables ............................................................................... 30.241 131.837 132.423 1.4 .4
All items less food and energy ................................................. 76.901 119.885 120.061 .5 .1Energy ........................................................................................ 9.606 188.497 186.018 4.2 -1.3
Indexes for 2010 are initial estimates. Indexes for 2009 are interim adjustments.NOTE: Index applies to a month as a whole, not to any specific date.
107 CPI Detailed Report-September 2010
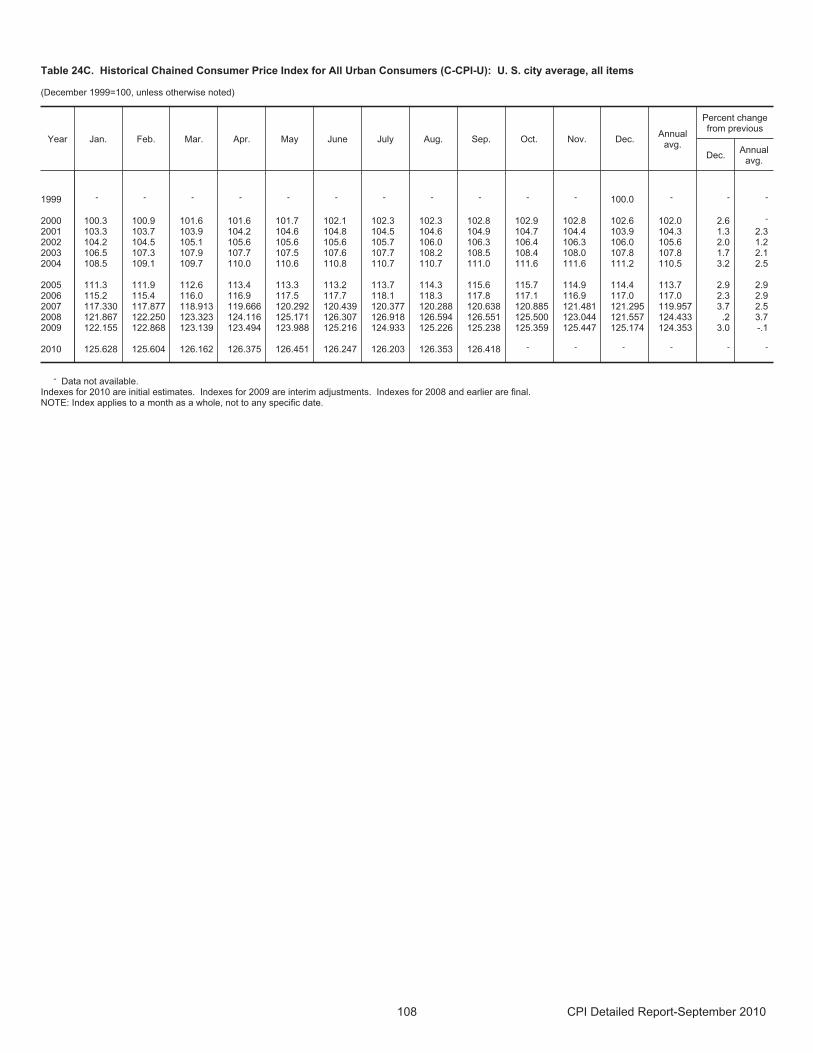
Table 24C. Historical Chained Consumer Price Index for All Urban Consumers (C-CPI-U): U. S. city average, all items
(December 1999=100, unless otherwise noted)
Year Jan. Feb. Mar. Apr. May June July Aug. Sep. Oct. Nov. Dec.Annual
avg.
Percent changefrom previous
Dec.Annual
avg.
1999 - - - - - - - - - - - 100.0 - - -
2000 100.3 100.9 101.6 101.6 101.7 102.1 102.3 102.3 102.8 102.9 102.8 102.6 102.0 2.6 -
2001 103.3 103.7 103.9 104.2 104.6 104.8 104.5 104.6 104.9 104.7 104.4 103.9 104.3 1.3 2.3 2002 104.2 104.5 105.1 105.6 105.6 105.6 105.7 106.0 106.3 106.4 106.3 106.0 105.6 2.0 1.2 2003 106.5 107.3 107.9 107.7 107.5 107.6 107.7 108.2 108.5 108.4 108.0 107.8 107.8 1.7 2.1 2004 108.5 109.1 109.7 110.0 110.6 110.8 110.7 110.7 111.0 111.6 111.6 111.2 110.5 3.2 2.5
2005 111.3 111.9 112.6 113.4 113.3 113.2 113.7 114.3 115.6 115.7 114.9 114.4 113.7 2.9 2.9 2006 115.2 115.4 116.0 116.9 117.5 117.7 118.1 118.3 117.8 117.1 116.9 117.0 117.0 2.3 2.9 2007 117.330 117.877 118.913 119.666 120.292 120.439 120.377 120.288 120.638 120.885 121.481 121.295 119.957 3.7 2.5 2008 121.867 122.250 123.323 124.116 125.171 126.307 126.918 126.594 126.551 125.500 123.044 121.557 124.433 .2 3.7 2009 122.155 122.868 123.139 123.494 123.988 125.216 124.933 125.226 125.238 125.359 125.447 125.174 124.353 3.0 -.1
2010 125.628 125.604 126.162 126.375 126.451 126.247 126.203 126.353 126.418 - - - - - -
- Data not available.Indexes for 2010 are initial estimates. Indexes for 2009 are interim adjustments. Indexes for 2008 and earlier are final.NOTE: Index applies to a month as a whole, not to any specific date.
108 CPI Detailed Report-September 2010
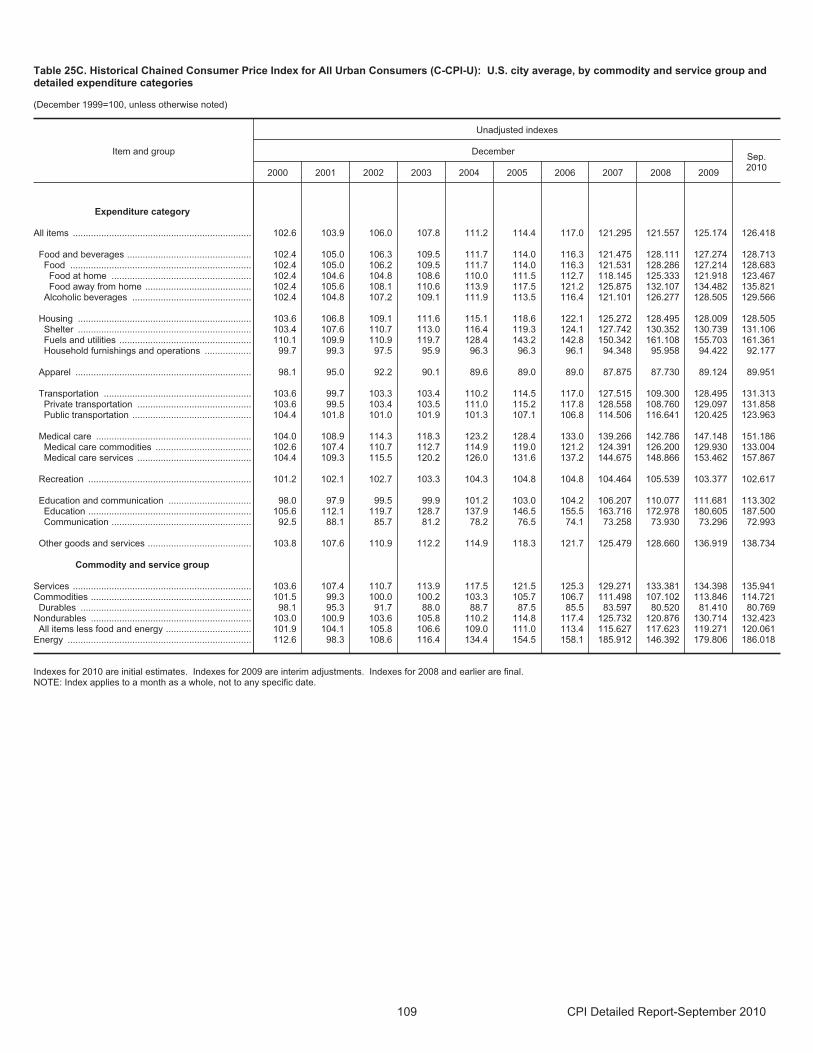
Table 25C. Historical Chained Consumer Price Index for All Urban Consumers (C-CPI-U): U.S. city average, by commodity and service group anddetailed expenditure categories
(December 1999=100, unless otherwise noted)
Item and group
Unadjusted indexes
DecemberSep.2010
2000 2001 2002 2003 2004 2005 2006 2007 2008 2009
Expenditure category
All items ..................................................................... 102.6 103.9 106.0 107.8 111.2 114.4 117.0 121.295 121.557 125.174 126.418
Food and beverages ................................................ 102.4 105.0 106.3 109.5 111.7 114.0 116.3 121.475 128.111 127.274 128.713 Food ...................................................................... 102.4 105.0 106.2 109.5 111.7 114.0 116.3 121.531 128.286 127.214 128.683
Food at home ...................................................... 102.4 104.6 104.8 108.6 110.0 111.5 112.7 118.145 125.333 121.918 123.467 Food away from home ......................................... 102.4 105.6 108.1 110.6 113.9 117.5 121.2 125.875 132.107 134.482 135.821
Alcoholic beverages .............................................. 102.4 104.8 107.2 109.1 111.9 113.5 116.4 121.101 126.277 128.505 129.566
Housing ................................................................... 103.6 106.8 109.1 111.6 115.1 118.6 122.1 125.272 128.495 128.009 128.505 Shelter ................................................................... 103.4 107.6 110.7 113.0 116.4 119.3 124.1 127.742 130.352 130.739 131.106 Fuels and utilities ................................................... 110.1 109.9 110.9 119.7 128.4 143.2 142.8 150.342 161.108 155.703 161.361 Household furnishings and operations .................. 99.7 99.3 97.5 95.9 96.3 96.3 96.1 94.348 95.958 94.422 92.177
Apparel .................................................................... 98.1 95.0 92.2 90.1 89.6 89.0 89.0 87.875 87.730 89.124 89.951
Transportation ......................................................... 103.6 99.7 103.3 103.4 110.2 114.5 117.0 127.515 109.300 128.495 131.313 Private transportation ............................................ 103.6 99.5 103.4 103.5 111.0 115.2 117.8 128.558 108.760 129.097 131.858 Public transportation .............................................. 104.4 101.8 101.0 101.9 101.3 107.1 106.8 114.506 116.641 120.425 123.963
Medical care ............................................................ 104.0 108.9 114.3 118.3 123.2 128.4 133.0 139.266 142.786 147.148 151.186 Medical care commodities ..................................... 102.6 107.4 110.7 112.7 114.9 119.0 121.2 124.391 126.200 129.930 133.004Medical care services ............................................ 104.4 109.3 115.5 120.2 126.0 131.6 137.2 144.675 148.866 153.462 157.867
Recreation ............................................................... 101.2 102.1 102.7 103.3 104.3 104.8 104.8 104.464 105.539 103.377 102.617
Education and communication ................................ 98.0 97.9 99.5 99.9 101.2 103.0 104.2 106.207 110.077 111.681 113.302Education ............................................................... 105.6 112.1 119.7 128.7 137.9 146.5 155.5 163.716 172.978 180.605 187.500 Communication ...................................................... 92.5 88.1 85.7 81.2 78.2 76.5 74.1 73.258 73.930 73.296 72.993
Other goods and services ........................................ 103.8 107.6 110.9 112.2 114.9 118.3 121.7 125.479 128.660 136.919 138.734
Commodity and service group
Services ..................................................................... 103.6 107.4 110.7 113.9 117.5 121.5 125.3 129.271 133.381 134.398 135.941 Commodities .............................................................. 101.5 99.3 100.0 100.2 103.3 105.7 106.7 111.498 107.102 113.846 114.721
Durables .................................................................. 98.1 95.3 91.7 88.0 88.7 87.5 85.5 83.597 80.520 81.410 80.769 Nondurables .............................................................. 103.0 100.9 103.6 105.8 110.2 114.8 117.4 125.732 120.876 130.714 132.423
All items less food and energy ................................. 101.9 104.1 105.8 106.6 109.0 111.0 113.4 115.627 117.623 119.271 120.061 Energy ....................................................................... 112.6 98.3 108.6 116.4 134.4 154.5 158.1 185.912 146.392 179.806 186.018
Indexes for 2010 are initial estimates. Indexes for 2009 are interim adjustments. Indexes for 2008 and earlier are final.NOTE: Index applies to a month as a whole, not to any specific date.
109 CPI Detailed Report-September 2010
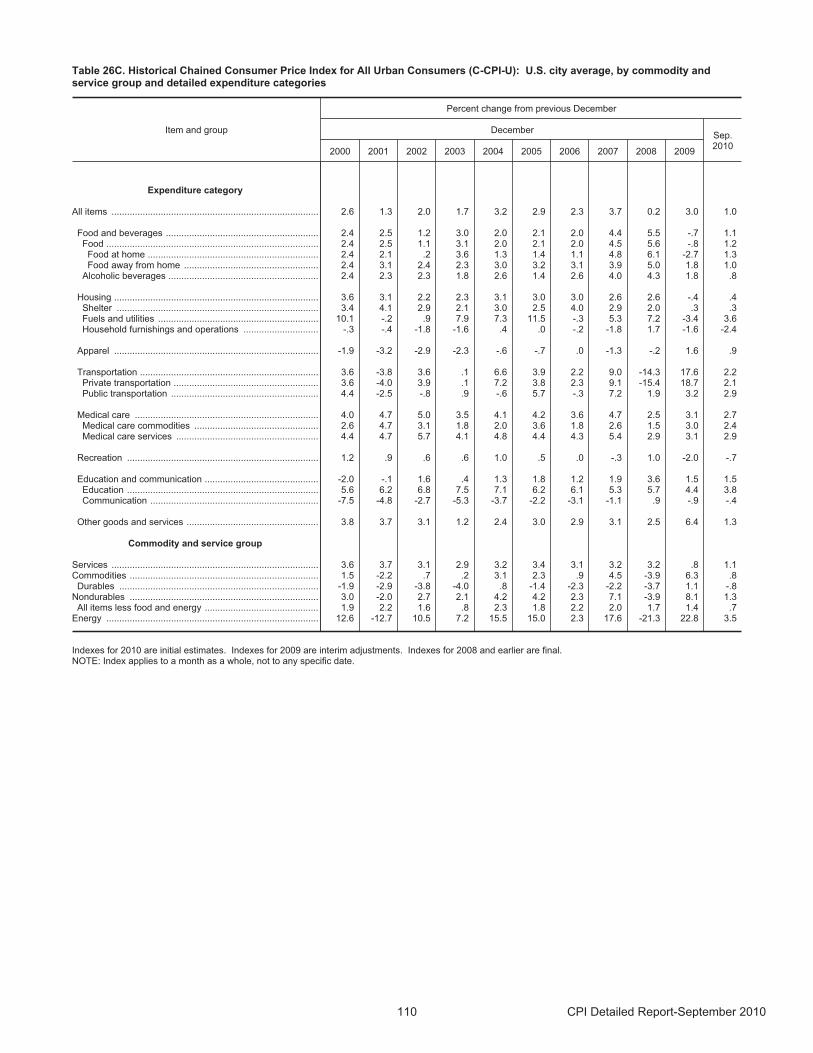
Table 26C. Historical Chained Consumer Price Index for All Urban Consumers (C-CPI-U): U.S. city average, by commodity andservice group and detailed expenditure categories
Item and group
Percent change from previous December
DecemberSep.2010
2000 2001 2002 2003 2004 2005 2006 2007 2008 2009
Expenditure category
All items ................................................................................ 2.6 1.3 2.0 1.7 3.2 2.9 2.3 3.7 0.2 3.0 1.0
Food and beverages ........................................................... 2.4 2.5 1.2 3.0 2.0 2.1 2.0 4.4 5.5 -.7 1.1 Food .................................................................................. 2.4 2.5 1.1 3.1 2.0 2.1 2.0 4.5 5.6 -.8 1.2
Food at home .................................................................. 2.4 2.1 .2 3.6 1.3 1.4 1.1 4.8 6.1 -2.7 1.3 Food away from home .................................................... 2.4 3.1 2.4 2.3 3.0 3.2 3.1 3.9 5.0 1.8 1.0
Alcoholic beverages .......................................................... 2.4 2.3 2.3 1.8 2.6 1.4 2.6 4.0 4.3 1.8 .8
Housing ............................................................................... 3.6 3.1 2.2 2.3 3.1 3.0 3.0 2.6 2.6 -.4 .4Shelter .............................................................................. 3.4 4.1 2.9 2.1 3.0 2.5 4.0 2.9 2.0 .3 .3 Fuels and utilities .............................................................. 10.1 -.2 .9 7.9 7.3 11.5 -.3 5.3 7.2 -3.4 3.6 Household furnishings and operations ............................. -.3 -.4 -1.8 -1.6 .4 .0 -.2 -1.8 1.7 -1.6 -2.4
Apparel ............................................................................... -1.9 -3.2 -2.9 -2.3 -.6 -.7 .0 -1.3 -.2 1.6 .9
Transportation ..................................................................... 3.6 -3.8 3.6 .1 6.6 3.9 2.2 9.0 -14.3 17.6 2.2Private transportation ........................................................ 3.6 -4.0 3.9 .1 7.2 3.8 2.3 9.1 -15.4 18.7 2.1 Public transportation ......................................................... 4.4 -2.5 -.8 .9 -.6 5.7 -.3 7.2 1.9 3.2 2.9
Medical care ....................................................................... 4.0 4.7 5.0 3.5 4.1 4.2 3.6 4.7 2.5 3.1 2.7 Medical care commodities ................................................ 2.6 4.7 3.1 1.8 2.0 3.6 1.8 2.6 1.5 3.0 2.4 Medical care services ....................................................... 4.4 4.7 5.7 4.1 4.8 4.4 4.3 5.4 2.9 3.1 2.9
Recreation .......................................................................... 1.2 .9 .6 .6 1.0 .5 .0 -.3 1.0 -2.0 -.7
Education and communication ............................................ -2.0 -.1 1.6 .4 1.3 1.8 1.2 1.9 3.6 1.5 1.5 Education .......................................................................... 5.6 6.2 6.8 7.5 7.1 6.2 6.1 5.3 5.7 4.4 3.8 Communication ................................................................. -7.5 -4.8 -2.7 -5.3 -3.7 -2.2 -3.1 -1.1 .9 -.9 -.4
Other goods and services ................................................... 3.8 3.7 3.1 1.2 2.4 3.0 2.9 3.1 2.5 6.4 1.3
Commodity and service group
Services ................................................................................ 3.6 3.7 3.1 2.9 3.2 3.4 3.1 3.2 3.2 .8 1.1Commodities ......................................................................... 1.5 -2.2 .7 .2 3.1 2.3 .9 4.5 -3.9 6.3 .8
Durables ............................................................................. -1.9 -2.9 -3.8 -4.0 .8 -1.4 -2.3 -2.2 -3.7 1.1 -.8 Nondurables ......................................................................... 3.0 -2.0 2.7 2.1 4.2 4.2 2.3 7.1 -3.9 8.1 1.3
All items less food and energy ............................................ 1.9 2.2 1.6 .8 2.3 1.8 2.2 2.0 1.7 1.4 .7 Energy .................................................................................. 12.6 -12.7 10.5 7.2 15.5 15.0 2.3 17.6 -21.3 22.8 3.5
Indexes for 2010 are initial estimates. Indexes for 2009 are interim adjustments. Indexes for 2008 and earlier are final.NOTE: Index applies to a month as a whole, not to any specific date.
110 CPI Detailed Report-September 2010
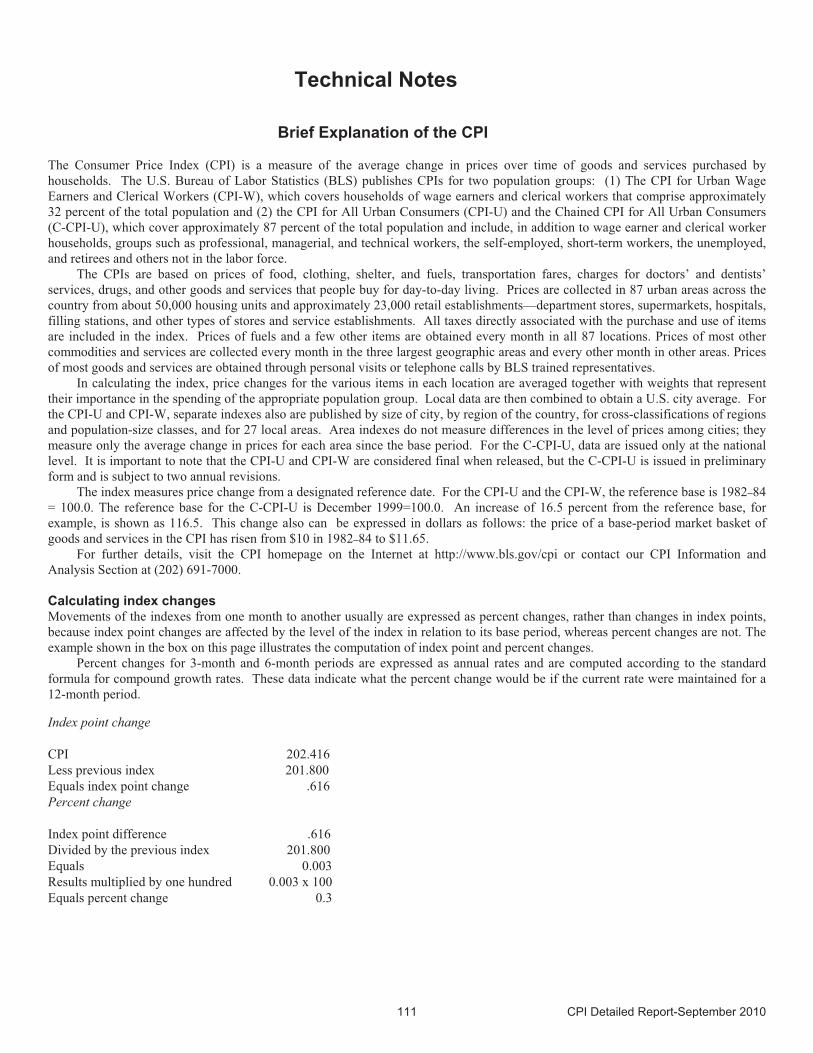
Technical Notes
Brief Explanation of the CPI
The Consumer Price Index (CPI) is a measure of the average change in prices over time of goods and services purchased by
households. The U.S. Bureau of Labor Statistics (BLS) publishes CPIs for two population groups: (1) The CPI for Urban Wage
Earners and Clerical Workers (CPI-W), which covers households of wage earners and clerical workers that comprise approximately
32 percent of the total population and (2) the CPI for All Urban Consumers (CPI-U) and the Chained CPI for All Urban Consumers
(C-CPI-U), which cover approximately 87 percent of the total population and include, in addition to wage earner and clerical worker
households, groups such as professional, managerial, and technical workers, the self-employed, short-term workers, the unemployed,
and retirees and others not in the labor force.
The CPIs are based on prices of food, clothing, shelter, and fuels, transportation fares, charges for doctors’ and dentists’
services, drugs, and other goods and services that people buy for day-to-day living. Prices are collected in 87 urban areas across the
country from about 50,000 housing units and approximately 23,000 retail establishments—department stores, supermarkets, hospitals,
filling stations, and other types of stores and service establishments. All taxes directly associated with the purchase and use of items
are included in the index. Prices of fuels and a few other items are obtained every month in all 87 locations. Prices of most other
commodities and services are collected every month in the three largest geographic areas and every other month in other areas. Prices
of most goods and services are obtained through personal visits or telephone calls by BLS trained representatives.
In calculating the index, price changes for the various items in each location are averaged together with weights that represent
their importance in the spending of the appropriate population group. Local data are then combined to obtain a U.S. city average. For
the CPI-U and CPI-W, separate indexes also are published by size of city, by region of the country, for cross-classifications of regions
and population-size classes, and for 27 local areas. Area indexes do not measure differences in the level of prices among cities; they
measure only the average change in prices for each area since the base period. For the C-CPI-U, data are issued only at the national
level. It is important to note that the CPI-U and CPI-W are considered final when released, but the C-CPI-U is issued in preliminary
form and is subject to two annual revisions.The index measures price change from a designated reference date. For the CPI-U and the CPI-W, the reference base is 1982–84
= 100.0. The reference base for the C-CPI-U is December 1999=100.0. An increase of 16.5 percent from the reference base, for
example, is shown as 116.5. This change also can be expressed in dollars as follows: the price of a base-period market basket of
goods and services in the CPI has risen from $10 in 1982–84 to $11.65.
For further details, visit the CPI homepage on the Internet at http://www.bls.gov/cpi or contact our CPI Information and
Analysis Section at (202) 691-7000.
Calculating index changesMovements of the indexes from one month to another usually are expressed as percent changes, rather than changes in index points,
because index point changes are affected by the level of the index in relation to its base period, whereas percent changes are not. The
example shown in the box on this page illustrates the computation of index point and percent changes.
Percent changes for 3-month and 6-month periods are expressed as annual rates and are computed according to the standard
formula for compound growth rates. These data indicate what the percent change would be if the current rate were maintained for a
12-month period.
Index point change
CPI 202.416
Less previous index 201.800
Equals index point change .616
Percent change
Index point difference .616
Divided by the previous index 201.800
Equals 0.003
Results multiplied by one hundred 0.003 x 100
Equals percent change 0.3
111 CPI Detailed Report-September 2010
Regions defined The states in the four regions are listed below.
The Northeast--Connecticut, Maine, Massachusetts, New Hampshire, New York, New Jersey, Pennsylvania, Rhode Island, and
Vermont.
The Midwest--Illinois, Indiana, Iowa, Kansas, Michigan, Minnesota, Missouri, Nebraska, North Dakota, Ohio, South Dakota, and
Wisconsin.
The South--Alabama, Arkansas, Delaware, Florida, Georgia, Kentucky, Louisiana, Maryland, Mississippi, North Carolina, Oklahoma,
South Carolina, Tennessee, Texas, Virginia, West Virginia, and the District of Columbia.
The West--Alaska, Arizona, California, Colorado, Hawaii, Idaho, Montana, Nevada, New Mexico, Oregon, Utah, Washington, and
Wyoming.
Energy prices Prices usually are available for the U.S. city average, 13 large metropolitan areas, the 4 census regions, 3 size classifications, and 10
areas reflecting the 4 census regions cross-classified by the 3 population sizes. However, not all energy commodities and services are
used in every area of the country. Fuel oil, for example, is not a common heating fuel in some urban areas, particularly in the South
and West. Where no average prices are available, the designation NA appears. This designation also appears if the data sufficiency
criteria have not been met in any given month. For example, if there are fewer than five usable fuel oil prices for a published city or
region size class, no fuel oil prices for the area will be published.
All prices are collected monthly by BLS representatives in the urban areas priced for the CPI. Prices for natural gas and
electricity include fuel and purchased gas adjustments and all applicable taxes. Fuel oil and gasoline prices include applicable
Federal, State, and local taxes.
Natural gas and electricity. Natural gas prices are reported in therms, which are a measure of heating value. Electricity prices are
given in kilowatt hours (kwh). For both utility services, the consumption ranges specified in table P2 are the upper and lower limits
of the bill sizes priced for the CPI. The average prices per therm and per kilowatt hour are calculated from bills priced within these
ranges. It should be noted that bills priced for the CPI not only are for different consumption amounts, but may also be calculated
from different types of residential rate schedules. The average prices per therm and per kilowatt hour are not, therefore, generally
suitable for use in place-to-place price comparisons. The average prices for 40 and 100 therms of natural gas, and for 500 kilowatt
hours of electricity (shown in table P1) are calculated from a special price collection program. They are not used in the calculation of
the CPI. Because heating and air-conditioning requirements vary by geographic location, climate, and weather conditions, it cannot
be inferred that these consumption amounts represent those used by a typical residential consumer. These bills are used merely
to track price changes over time for constant amounts of consumption, and to provide continuity with prices of natural gas and
electricity formerly published in conjunction with the unrevised CPI.
Fuel oil. Only #2 fuel oil (home heating oil) is priced. (See table P1.) Prices are collected, in most cases, for quantities greater than 1
gallon. These prices are converted to a gallon price for this program. Fuel oil prices reflect discounts for quantity or quick payment.
Gasoline and automotive diesel fuel. Gasoline and diesel prices, shown in table P3, are collected at the pump from a sample of full
service, miniservice, and self-service gas stations. Approximate British Thermal Unit (BTU) values for some energy items are as
follows, according to the source indicated:
1 therm = 100,000 BTUs (U.S. Department of Energy)
1 kwh = 3,412 BTUs (Edison Electric Institute)
1 gallon #2 fuel oil = 140,000 BTUs (U.S. Department of Energy)
Food and beverage prices Actual weighted average prices for food and beverages are calculated each month at the national level and for the four census
geographic regions, as shown in table P4. As a result of changes in price collection methodology and sample sizes,
average prices for individual cities cannot, in general, be produced. It is hoped, however, that regional average prices will help to
satisfy the need for local area data. It should be noted that the average prices for food in this report reflect variations in brand, quality, and size among geographic areas. Users of average food prices should be aware that these differences exist.
Because a number of food commodities are not available in all areas on a year-round basis, prices will not appear in some
months for some regions or for the U.S. city average. In other instances, sufficient prices may not be available due to temporary
112 CPI Detailed Report-September 2010
disruptions in supplies. Where no average prices are available, the designation NA appears. When a price is not available from an
individual store in any month, an estimated price will be calculated for the missing item and used in computing the average price. For
cases in which the proportion of estimated prices used to calculate the average is considered too high, the average price is not
published, and NA appears for that item in the table.
Because of space limitations in the table, the description for each item is abbreviated. Detailed specifications are available from
BLS information offices or from the Washington office, upon request.
Seasonally adjusted and unadjusted data
Because price data are used for different purposes by different groups, the Bureau of Labor Statistics publishes seasonally adjusted as
well as unadjusted changes each month.
For analyzing general price trends in the economy, seasonally adjusted changes are usually preferred since they eliminate the
effect of changes that normally occur at the same time and in about the same magnitude every year--such as price movements
resulting from changing climatic conditions, production cycles, model changeovers, holidays, and sales.
The unadjusted data are of primary interest to consumers concerned about the prices they actually pay. Unadjusted data also are
used extensively for escalation purposes. Many collective bargaining contract agreements and pension plans, for example, tie
compensation changes to the Consumer Price Index before adjustment for seasonal variation.
Seasonal factors used in computing the seasonally adjusted indexes are derived by the X-12-ARIMA Seasonal Adjustment
Method. Seasonally adjusted indexes and seasonal factors are computed annually. Each year, the last 5 years of seasonally adjusted
data are revised. Data from January 2005 through December 2009 were replaced in January 2010. Exceptions to the usual revision
schedule were: the updated seasonal data at the end of 1977 replaced data from 1967 through 1977; and, in January 2002, dependently
seasonally adjusted series were revised for January 1987-December 2001 as a result of a change in the aggregation weights for
dependently adjusted series. For further information, please see “Aggregation of Dependently Adjusted Seasonally Adjusted Series,”
in the October 2001 issue of the CPI Detailed Report.
The seasonal movement of all items and 54 other aggregations is derived by combining the seasonal movement of 73 selected
components. Each year the seasonal status of every series is reevaluated based upon certain statistical criteria. If any of the 73
components change their seasonal adjustment status from seasonally adjusted to not seasonally adjusted, not seasonally adjusted data
will be used in the aggregation of the dependent series for the last 5 years, but the seasonally adjusted indexes will be used before that
period. Note: 46 of the 73 components are seasonally adjusted for 2010.
Seasonally adjusted data, including the all items index levels, are subject to revision for up to five years after their original
release. For this reason, BLS advises against the use of these data in escalation agreements.
Effective with the calculation of the seasonal factors for 1990, the Bureau of Labor Statistics has used an enhanced seasonal
adjustment procedure called Intervention Analysis Seasonal Adjustment for some CPI series. Intervention Analysis Seasonal
Adjustment allows for better estimates of seasonally adjusted data. Extreme values and/or sharp movements which might distort the
seasonal pattern are estimated and removed from the data prior to calculation of seasonal factors. Beginning with the calculation of
seasonal factors for 1996, X-12-ARIMA software was used for Intervention Analysis Seasonal Adjustment.
For the seasonal factors introduced in January 2010, BLS adjusted 30 series using Intervention Analysis Seasonal Adjustment,
including selected food and beverage items, motor fuels, electricity and vehicles. For example, this procedure was used for the Motor
fuel series to offset the effects of events such as damage to oil refineries from Hurricane Katrina.
For a complete list of Intervention Analysis Seasonal Adjustment series and explanations, please refer to the article “Intervention
Analysis Seasonal Adjustment”, located on our website at http://www.bls.gov/cpi/cpisapage.htm.
For additional information on seasonal adjustment in the CPI, please write to the Bureau of Labor Statistics, Division of
Consumer Prices and Price Indexes, Washington, DC 20212 or contact David Levin at (202) 691-6968, or by e-mail at
[email protected]. If you have general questions about the CPI, please call our information staff at (202) 691-7000.
113 CPI Detailed Report-September 2010
Metropolitan areas BLS publishes price indexes for three major metropolitan areas monthly:
Chicago-Gary-Kenosha, IL-IN-WI
Los Angeles-Riverside-Orange County, CA
New York-Northern New Jersey-Long Island,
NY-NJ-CT-PA
Data for an additional 11 metropolitan areas are published every other month [on an odd- (January, March, etc.) or even- (February,
April, and so forth) month schedule] for the following areas:
Atlanta, GA -even
Boston-Brockton-Nashua, MA-
NH -ME-CT -odd
Cleveland-Akron, OH -odd
Dallas-Fort Worth, TX -odd
Detroit-Ann Arbor-Flint, MI -even
Houston-Galveston-Brazoria, TX -even
Miami-Fort Lauderdale, FL -even
Philadelphia-Wilmington
-Atlantic City, PA-NJ-DE-MD -even
San Francisco-Oakland
-San Jose, CA -even
Seattle-Tacoma-Bremerton,
WA -even
Washington-Baltimore,
DC-MD-VA-WV -odd
(Note: The designation even or odd refers to the month during which the area’s price change is measured. Due to the time needed for
processing, data are released 2 to 3 weeks into the following month.)
Data are published for another group of 13 metropolitan areas on a semiannual basis. These indexes, which refer to the
arithmetic average for the 6-month periods from January through June and July through December, are published with release of the
CPI for July and January, respectively, in August and February for
Anchorage, AK
Cincinnati-Hamilton, OH-KY-IN
Denver-Boulder-Greeley, CO
Honolulu, HI
Kansas City, MO-KS
Milwaukee-Racine, WI
Minneapolis-St. Paul, MN-WI
Phoenix-Mesa, AZ
Pittsburgh, PA
Portland-Salem, OR-WA
San Diego, CA
St. Louis, MO-IL
Tampa-St. Petersburg-Clearwater, FL
114 CPI Detailed Report-September 2010
How to Obtain Consumer Price Index Information
CPI information is available from BLS electronically, through publication subscriptions, and via telephone and fax through automated
recordings. Information specialists also are available in the national and information offices to provide help and to respond to
questions.
Electronic access to CPI data
BLS on the Internet. Through the Internet, BLS provides free, continuous access to published CPI data and press releases. The most
recent month’s CPI is made available immediately at the time of release. Additionally, a database called LABSTAT, containing
current and historical data for the CPI, is accessible.
World Wide Web. BLS maintains a Web site at http://www.bls.gov on the Internet. This BLS homepage provides access to
LABSTAT, as well as links to program-specific homepages. The CPI homepage http://www.bls.gov/cpi/ provides other CPI
information, as well as indexes. This includes a brief explanation of methodology, frequently asked questions and answers, contacts
for further information, and explanations of how the CPI program handles special items, such as medical care and housing. In
addition, CPI press releases and historical data for metropolitan areas can be accessed by linking to the regional office home pages
from the main BLS Web site listed above.
Recorded CPI data
Summary CPI data are provided on 24-hour recorded messages. Detailed CPI information may be obtained by calling (202) 691-5200.
A touch-tone telephone is recommended, as this system allows the user to select specific indexes from lists of available data.
Recorded summaries of CPI data also may be obtained by calling any one of the metropolitan area CPI hotlines listed next.
These hotline summaries typically include data for the U.S. city average, as well as for the specified area. The recordings are
approximately 3 minutes in length, do not require a touch-tone telephone, and are available 24 hours a day, 7 days a week.
Area Hotline number
Anchorage (907) 271-2770
Atlanta (404) 893-4222
Baltimore (410) 962-4898
Boston (617) 565-2327
Chicago (312) 353-1880
Cincinnati (513) 684-2349
Cleveland (216) 522-3852
Dallas (214) 767-6970
Denver (816) 285-7000
Detroit (313) 226-7558
Honolulu (808) 541-2808
Houston (214) 767-6970
Indianapolis (317) 226-7885
Kansas City (816) 285-7000
Los Angeles (310) 235-6884
Milwaukee (414) 276-2579
Minneapolis-St. Paul (612) 725-3580
New York (646) 264-3600
Philadelphia (215) 656-3948
Phoenix-Mesa (480) 503-9075
Pittsburgh (412) 644-2900
Portland (503) 326-5818
San Diego (619) 557-6538
San Francisco (415) 625-2270
Seattle (206) 553-0645
St. Louis (816) 285-7000
Washington, DC (202) 691-6994
115 CPI Detailed Report-September 2010
Other sources of CPI data
Fax-on-Demand. This fax service has been discontinued as of April 27, 2007.
Technical information may be obtained during normal working hours, Monday through Friday, by calling the Washington, DC
national office at (202) 691-7000 or any of the information offices listed below.
Office Telephone
Atlanta (404) 331-3415
Boston (617) 565-2327
Chicago (312) 353-1880
Dallas (214) 767-6970
Kansas City (816) 285-7000
New York (212) 337-2400
Philadelphia (215) 597-3282
San Francisco (415) 625-2270
Washington, DC (202) 691-7000
Historical tables. These include all published indexes for each of the detailed CPI components. These tables may be obtained via the
Internet, by calling (202) 691-7000 in the national office, or by contacting any of the information offices just listed.
Descriptive publications. These publications describe the CPI and ways in which to use it. They include simple factsheets discussing
specific topics about the CPI, a broader, non-technical overview of the CPI in a question-and-answer format, and a technical and
thorough description of the CPI and its methodology. These publications may be obtained by calling (202) 691-7000, and many are
included on the CPI homepage on the Internet.
Special publications. Also available are various special publications, such as Relative Importance of Components in the Consumer
Price Index and materials describing the annual revisions of seasonally adjusted CPI data. For more information, call (202) 691-
7000.
Further information can be obtained by writing the Office of Prices and Living Conditions, Bureau of Labor Statistics, 2
Massachusetts Avenue, NE., Room 3615, Washington, DC 20212-0001, or by calling any of the information offices listed earlier.
116 CPI Detailed Report-September 2010