the future is now the digital medical office of the future the
TRANSCRIPT
The Future is NowThe Future is NowThe Digital Medical Office of the FutureThe Digital Medical Office of the Future
The Electronic Health RecordThe Electronic Health Record
Exploring Functionality and the Exploring Functionality and the
Return on InvestmentReturn on Investment

Mark Anderson, FHIMSS, CPHIMSSMark Anderson, FHIMSS, CPHIMSSHealthcare IT FuturistHealthcare IT Futurist
34+ Years In Healthcare IT34+ Years In Healthcare ITInstalled over $1B in technologies since 1972Installed over $1B in technologies since 1972
Hospital ExperienceHospital Experience–– CIO Position at Three Multi Facility Regional IDNCIO Position at Three Multi Facility Regional IDN’’ss–– Executive Team Member at 5 Different IDNExecutive Team Member at 5 Different IDN’’ss–– Worked In 158 Hospitals and 21 Payer OrganizationsWorked In 158 Hospitals and 21 Payer Organizations
Physician ExperiencePhysician Experience–– Managed 50 Physician Practices in the Late 1980Managed 50 Physician Practices in the Late 1980’’ss–– CIO of a 2,300+ physician (500+ Practices) IPACIO of a 2,300+ physician (500+ Practices) IPA–– Currently Conducting EHR Searches for > 100 PracticesCurrently Conducting EHR Searches for > 100 Practices–– National Speaker on EHR > 400 sessions since 2001 National Speaker on EHR > 400 sessions since 2001
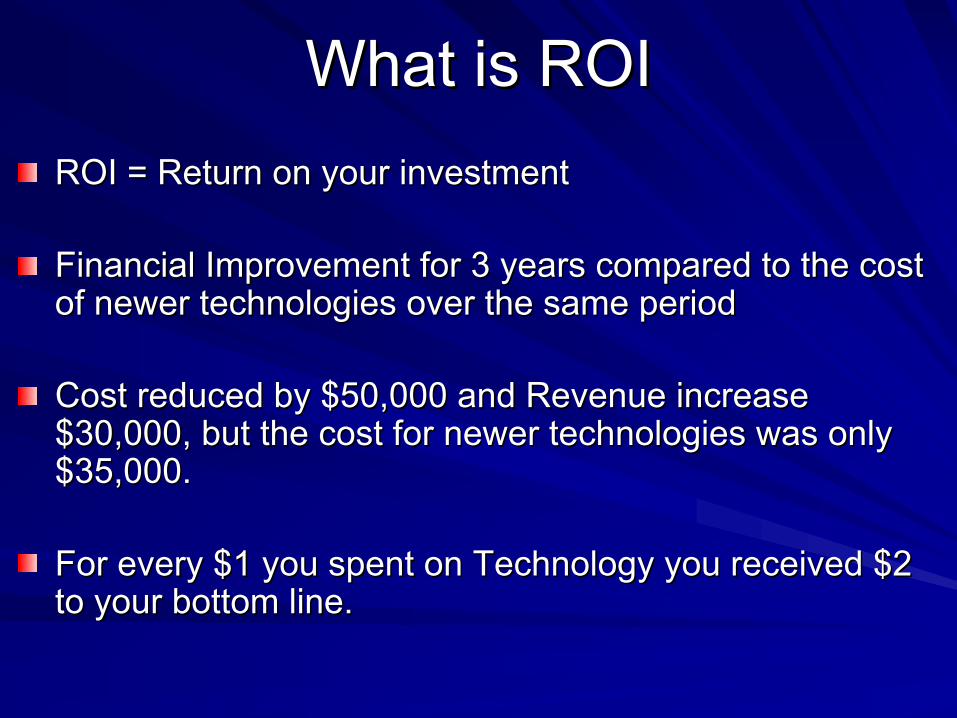
What is ROIWhat is ROIROI = Return on your investmentROI = Return on your investment
Financial Improvement for 3 years compared to the cost Financial Improvement for 3 years compared to the cost of newer technologies over the same periodof newer technologies over the same period
Cost reduced by $50,000 and Revenue increase Cost reduced by $50,000 and Revenue increase $30,000, but the cost for newer technologies was only $30,000, but the cost for newer technologies was only $35,000.$35,000.
For every $1 you spent on Technology you received $2 For every $1 you spent on Technology you received $2 to your bottom line.to your bottom line.

TodayToday’’s Agendas Agenda
Before you can determine ROI you have to Before you can determine ROI you have to know know youryour costscosts
Business ChangesBusiness Changes
What are you going to implement?What are you going to implement?
ROIROI
Who is Paying?Who is Paying?
EHR COSTSEHR COSTS
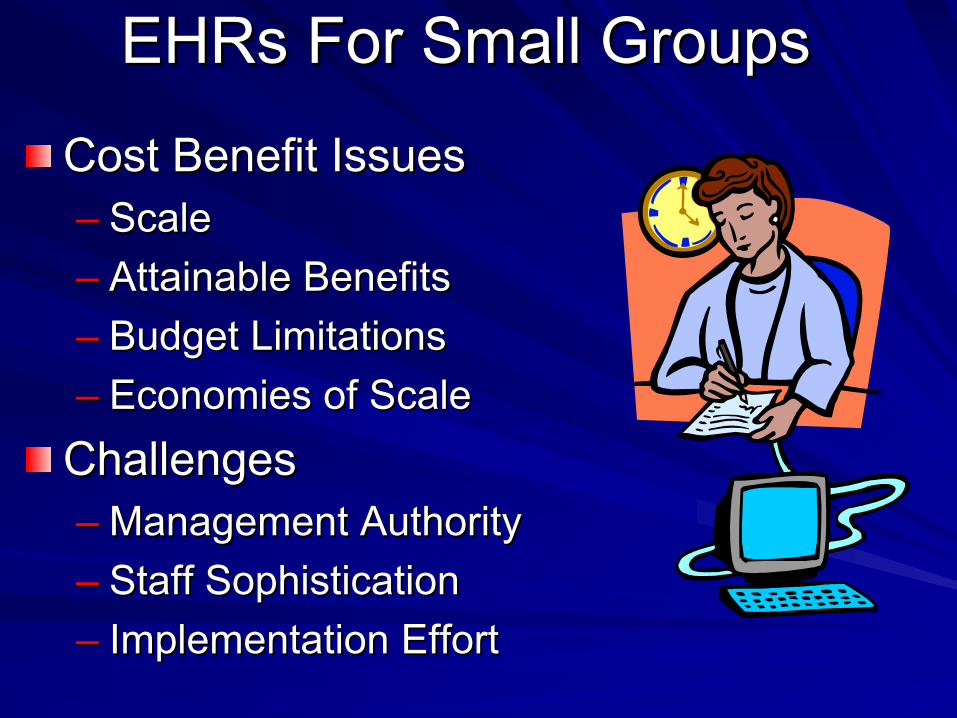
EHRs For Small GroupsEHRs For Small Groups
Cost Benefit IssuesCost Benefit Issues–– ScaleScale–– Attainable BenefitsAttainable Benefits–– Budget LimitationsBudget Limitations–– Economies of ScaleEconomies of ScaleChallengesChallenges–– Management AuthorityManagement Authority–– Staff SophisticationStaff Sophistication–– Implementation EffortImplementation Effort
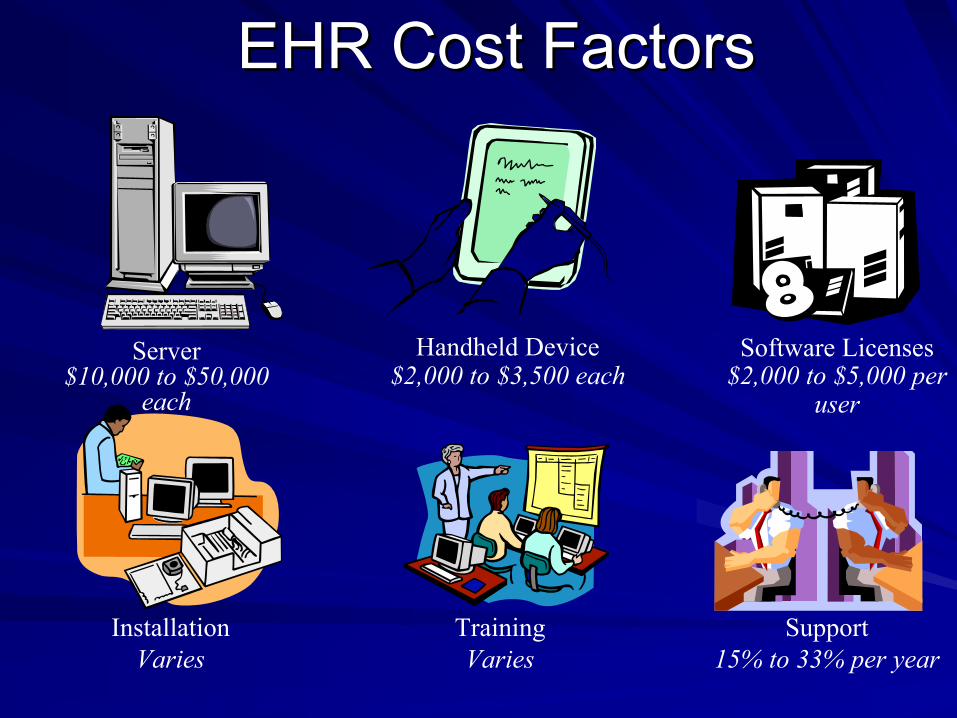
Server$10,000 to $50,000
each
Handheld Device$2,000 to $3,500 each
Software Licenses$2,000 to $5,000 per
user
InstallationVaries
TrainingVaries
Support15% to 33% per year
EHR Cost FactorsEHR Cost Factors
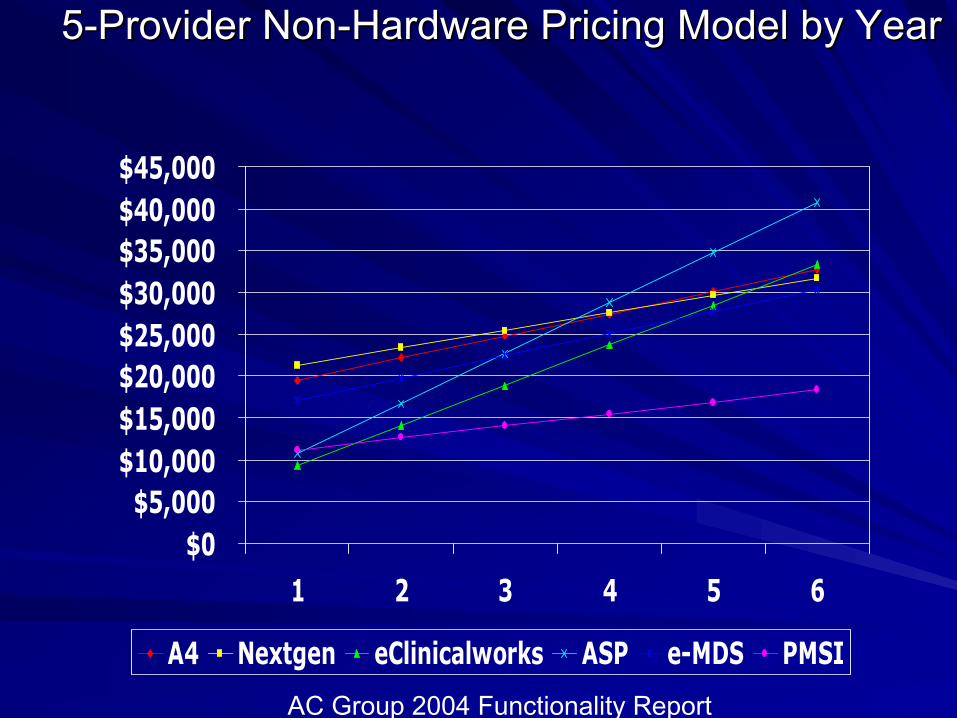
55--Provider NonProvider Non--Hardware Pricing Model by YearHardware Pricing Model by Year
$0$5,000$10,000$15,000$20,000$25,000$30,000$35,000$40,000$45,000
1 2 3 4 5 6
A4 Nextgen eClinicalworks ASP e-MDS PMSI
AC Group 2004 Functionality Report
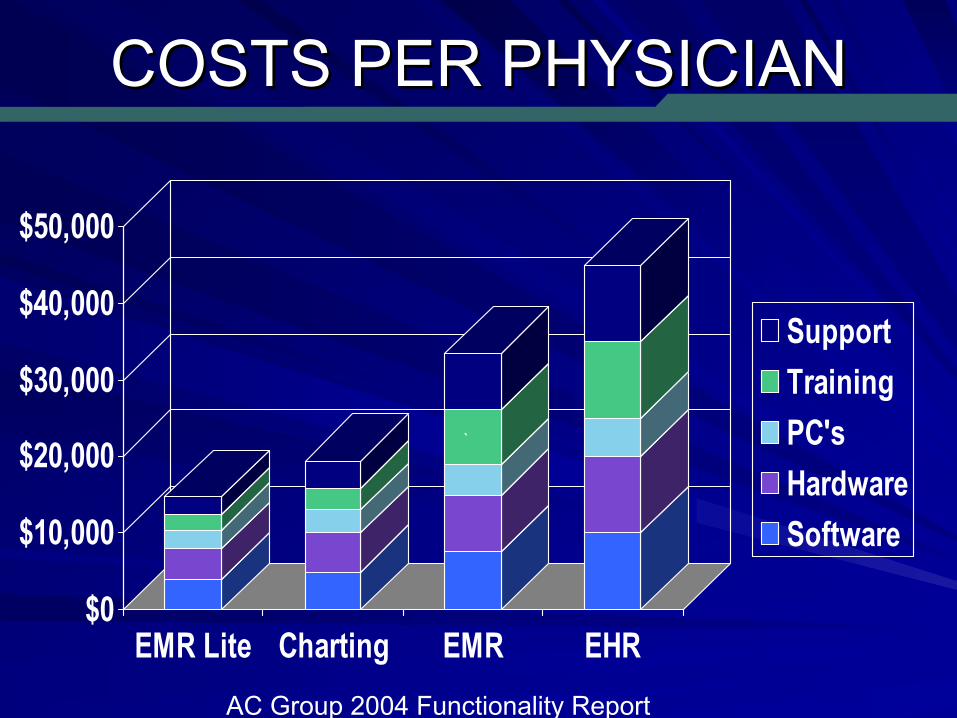
COSTS PER PHYSICIANCOSTS PER PHYSICIAN
$0
$10,000
$20,000
$30,000
$40,000
$50,000
EMR Lite Charting EMR EHR
SupportTrainingPC'sHardwareSoftware
`
AC Group 2004 Functionality Report
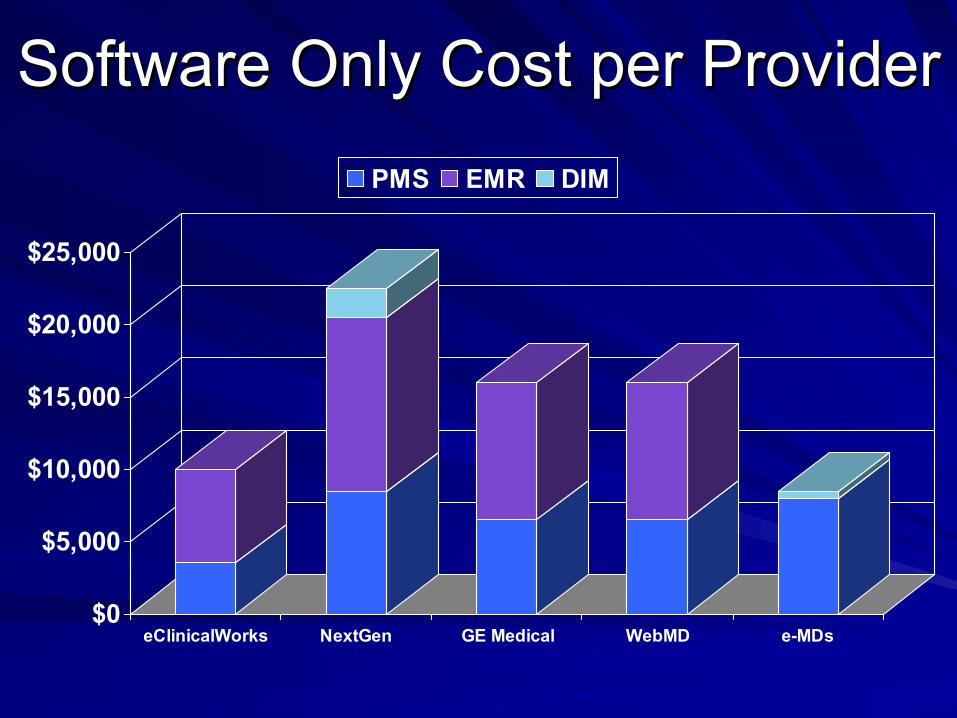
Software Only Cost per ProviderSoftware Only Cost per Provider
$0
$5,000
$10,000
$15,000
$20,000
$25,000
eClinicalWorks NextGen GE Medical WebMD e-MDs
PMS EMR DIM
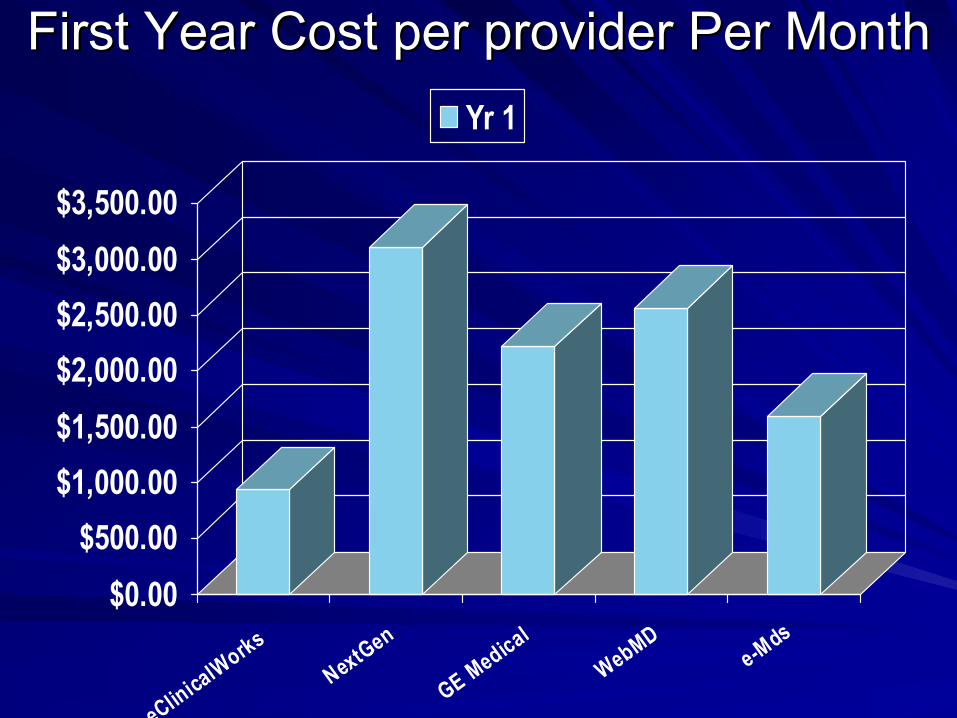
First Year Cost per provider Per MonthFirst Year Cost per provider Per Month
$0.00$500.00
$1,000.00$1,500.00$2,000.00$2,500.00$3,000.00$3,500.00
eClinicalWorksNextGen
GE MedicalWebMD
e-Mds
Yr 1
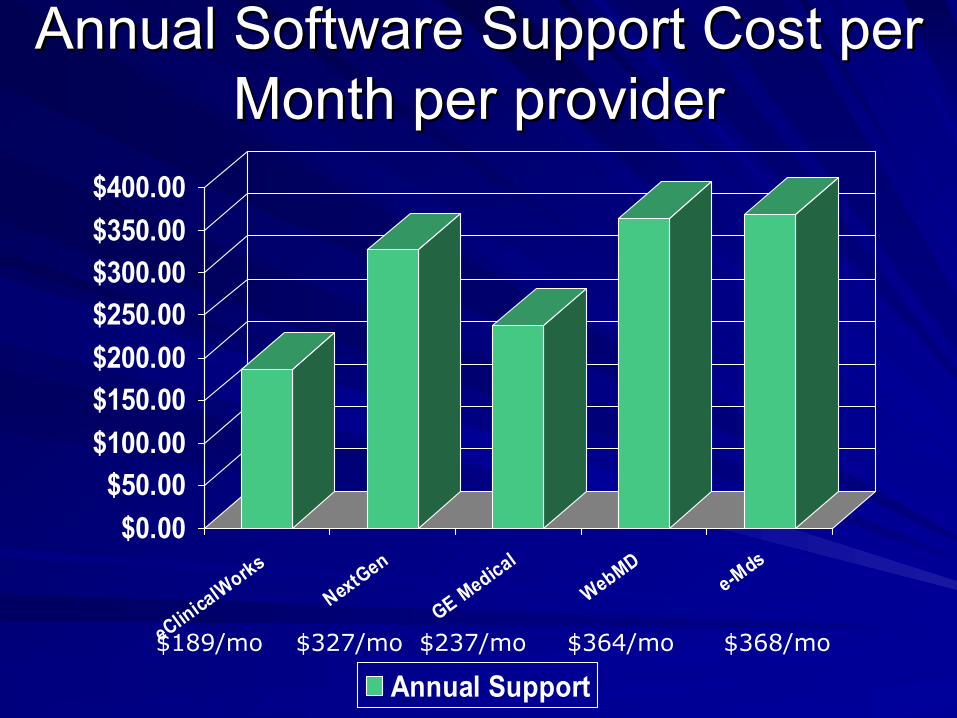
Annual Software Support Cost per Annual Software Support Cost per Month per providerMonth per provider
$0.00$50.00
$100.00$150.00$200.00$250.00$300.00$350.00$400.00
eClinicalWorks
NextGen
GE Medical
WebMDe-Mds
Annual Support$189/mo $327/mo $237/mo $364/mo $368/mo
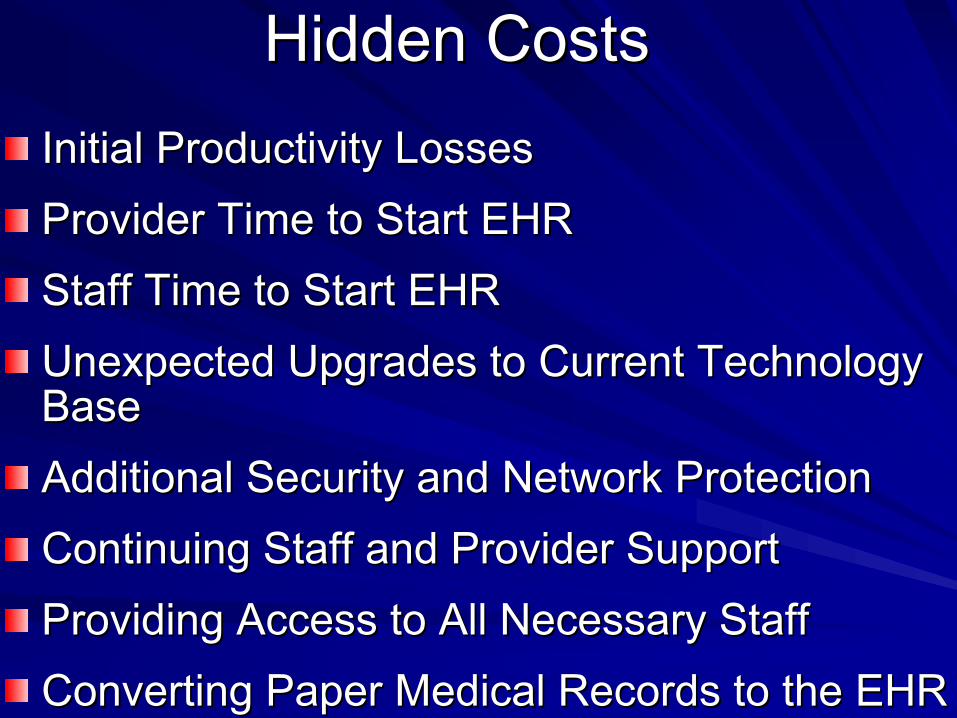
Hidden CostsHidden CostsInitial Productivity LossesInitial Productivity LossesProvider Time to Start EHRProvider Time to Start EHRStaff Time to Start EHRStaff Time to Start EHRUnexpected Upgrades to Current Technology Unexpected Upgrades to Current Technology BaseBaseAdditional Security and Network ProtectionAdditional Security and Network ProtectionContinuing Staff and Provider SupportContinuing Staff and Provider SupportProviding Access to All Necessary StaffProviding Access to All Necessary StaffConverting Paper Medical Records to the EHRConverting Paper Medical Records to the EHR
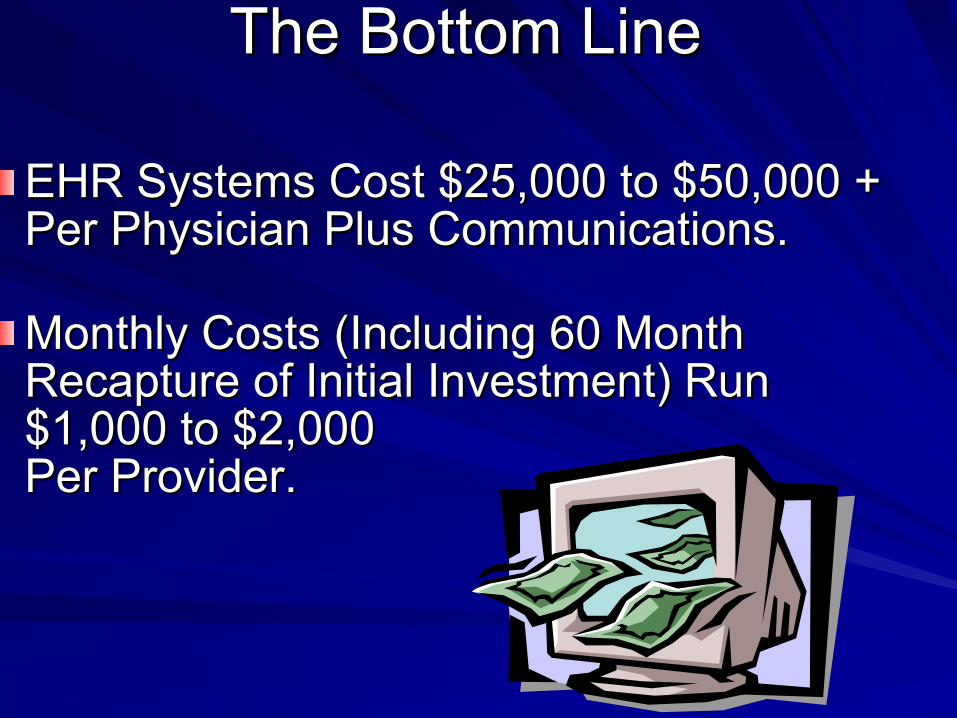
The Bottom LineThe Bottom Line
EHR Systems Cost $25,000 to $50,000 + EHR Systems Cost $25,000 to $50,000 + Per Physician Plus Communications.Per Physician Plus Communications.
Monthly Costs (Including 60 Month Monthly Costs (Including 60 Month Recapture of Initial Investment) Run Recapture of Initial Investment) Run $1,000 to $2,000 $1,000 to $2,000 Per Provider.Per Provider.

Potential Return on Potential Return on InvestmentInvestment
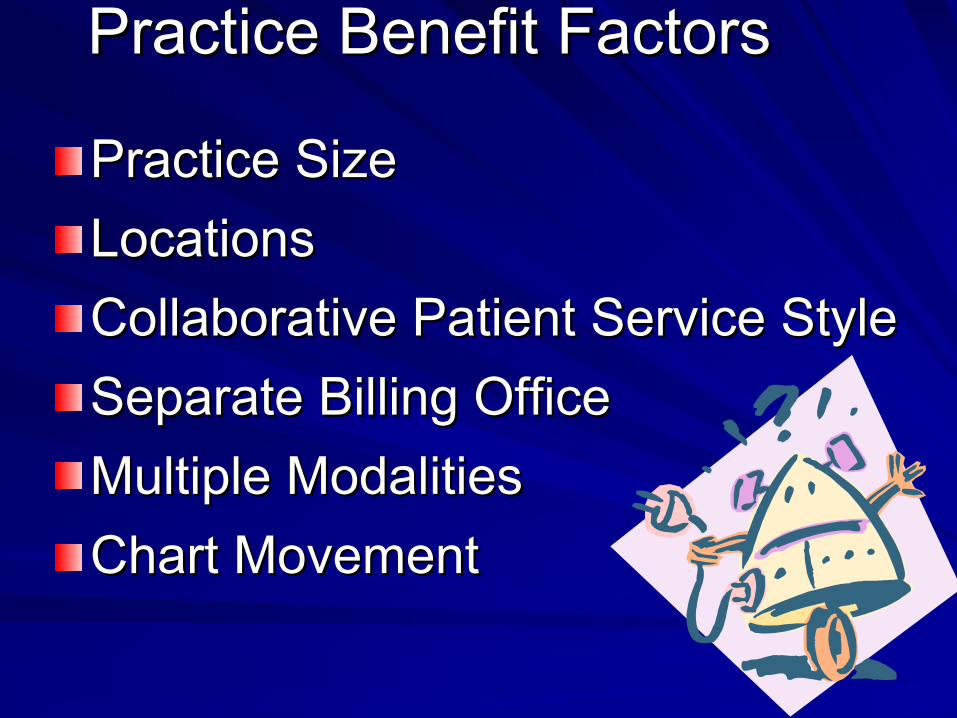
Practice Benefit FactorsPractice Benefit Factors
Practice SizePractice SizeLocationsLocationsCollaborative Patient Service Style Collaborative Patient Service Style Separate Billing OfficeSeparate Billing OfficeMultiple ModalitiesMultiple ModalitiesChart MovementChart Movement
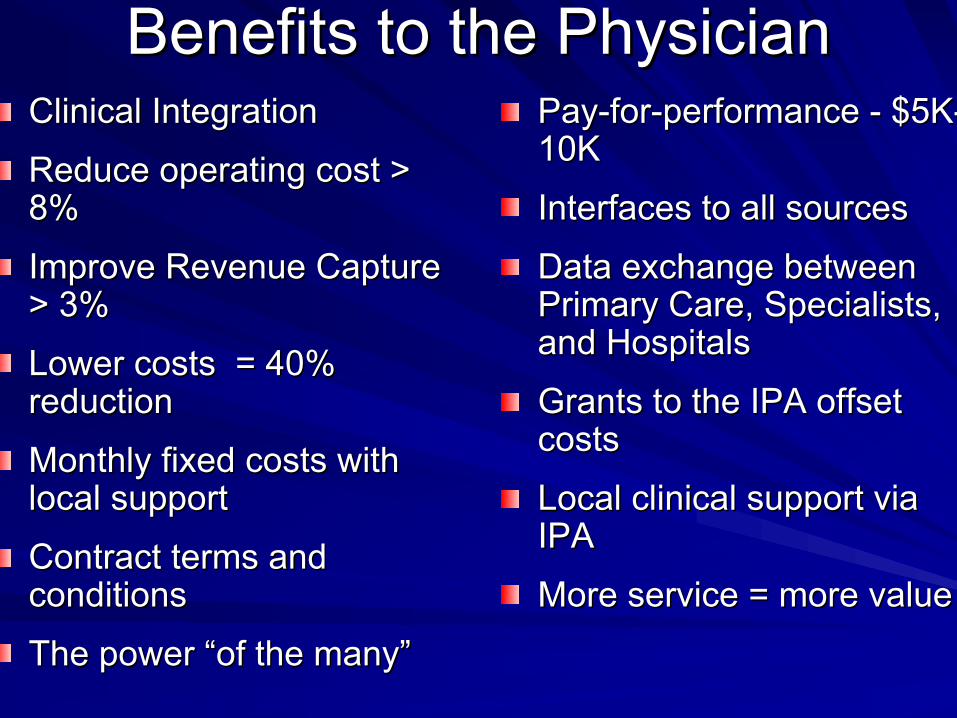
Benefits to the PhysicianBenefits to the PhysicianClinical IntegrationClinical Integration
Reduce operating cost > Reduce operating cost > 8%8%
Improve Revenue Capture Improve Revenue Capture > 3%> 3%
Lower costs = 40% Lower costs = 40% reductionreduction
Monthly fixed costs with Monthly fixed costs with local supportlocal support
Contract terms and Contract terms and conditionsconditions
The power The power ““of the manyof the many””
PayPay--forfor--performance performance -- $5K$5K--10K10K
Interfaces to all sourcesInterfaces to all sources
Data exchange between Data exchange between Primary Care, Specialists, Primary Care, Specialists, and Hospitalsand Hospitals
Grants to the IPA offset Grants to the IPA offset costscosts
Local clinical support via Local clinical support via IPAIPA
More service = more valueMore service = more value
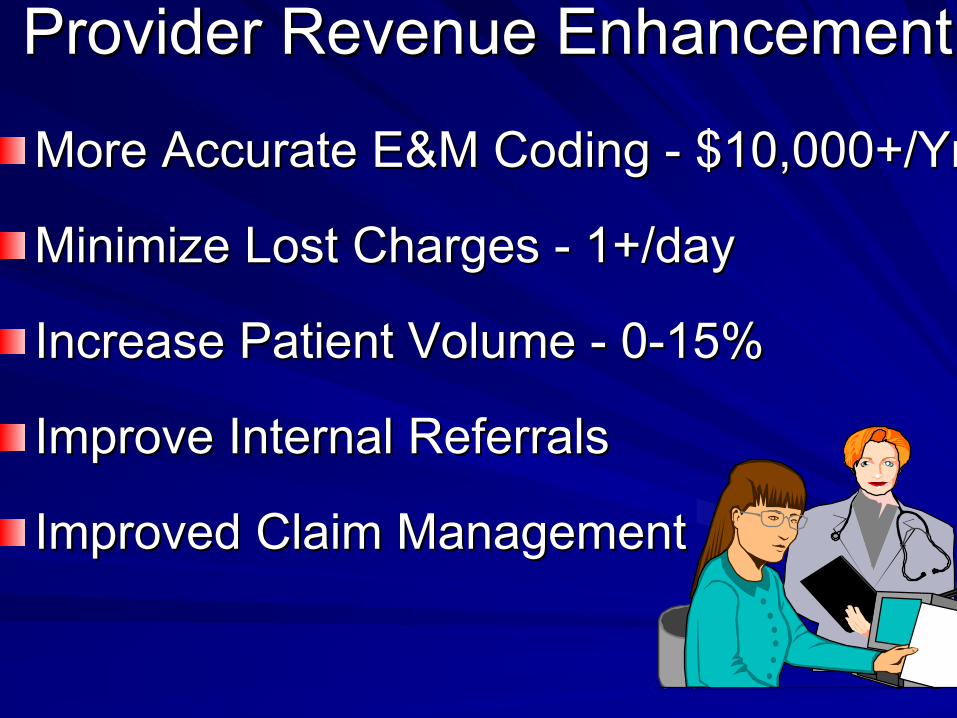
Provider Revenue EnhancementProvider Revenue Enhancement
More Accurate E&M Coding More Accurate E&M Coding -- $10,000+/Yr$10,000+/Yr
Minimize Lost Charges Minimize Lost Charges -- 1+/day1+/day
Increase Patient Volume Increase Patient Volume -- 00--15%15%
Improve Internal ReferralsImprove Internal Referrals
Improved Claim ManagementImproved Claim Management

Case StudyCase Study
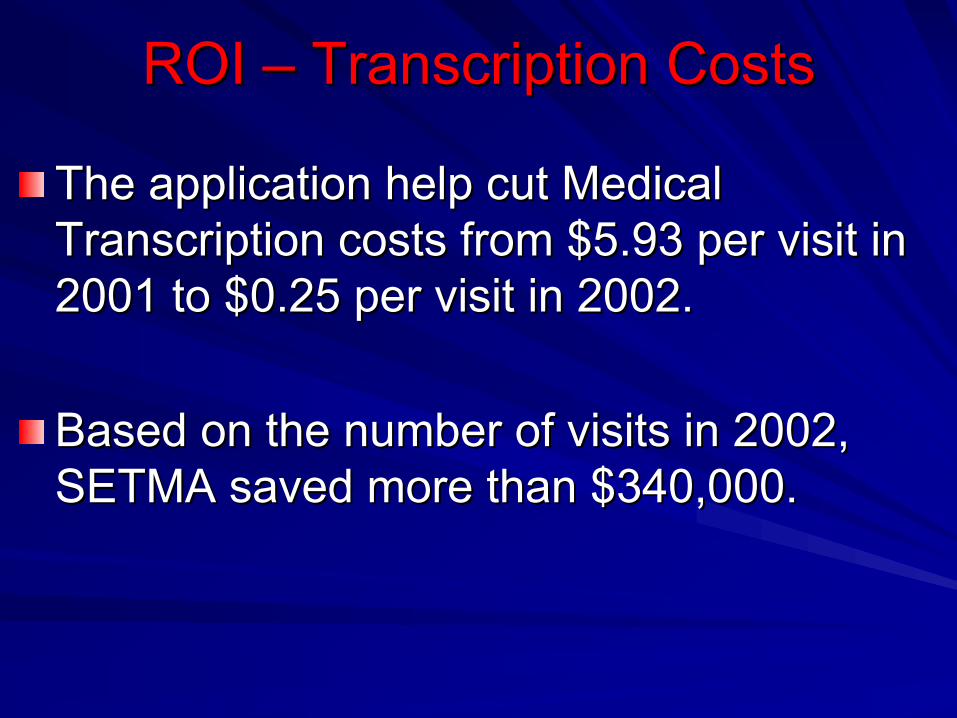
ROI ROI –– Transcription CostsTranscription Costs
The application help cut Medical The application help cut Medical Transcription costs from $5.93 per visit in Transcription costs from $5.93 per visit in 2001 to $0.25 per visit in 2002. 2001 to $0.25 per visit in 2002.
Based on the number of visits in 2002, Based on the number of visits in 2002, SETMA saved more than $340,000.SETMA saved more than $340,000.
SETMASETMA
5 physicians expanded to 16 Physicians5 physicians expanded to 16 PhysiciansInstalled EMR 5 years agoInstalled EMR 5 years agoTotal PaperlessTotal PaperlessCharting in Clinic, Hospital, Home, Home Charting in Clinic, Hospital, Home, Home HealthHealth
ROI ROI –– E & M CodingE & M Coding
The EMR application helped improved The EMR application helped improved E&M coding and thus, increased average E&M coding and thus, increased average billable charges for office visits by 4.23%. billable charges for office visits by 4.23%.
These coding improvements added more These coding improvements added more than $150,000 in billable charges.than $150,000 in billable charges.
ROI ROI –– Billing and CollectionsBilling and Collections
Average charge per patient visit increased Average charge per patient visit increased from $171 to $206 (a 20% increase) from $171 to $206 (a 20% increase) Average collection increased from $80 to Average collection increased from $80 to $104 (a 30% increase). $104 (a 30% increase). Based on the number of patients seen in Based on the number of patients seen in 2002, total billable charges increased by 2002, total billable charges increased by $2.1M and overall collections increased by $2.1M and overall collections increased by $1.4M.$1.4M.

ROI ROI -- Administrative StaffAdministrative Staff
Number of administrative staff required to Number of administrative staff required to handle the patienthandle the patient’’s chart decrease by s chart decrease by 76.7% ($2.65 per visit down to $0.62). 76.7% ($2.65 per visit down to $0.62).
The new procedure saved the clinic more The new procedure saved the clinic more than $120,000 per year in administrative than $120,000 per year in administrative costs.costs.

ROI ROI -- StaffStaff
The average manThe average man--hour cost to establish a hour cost to establish a chart decreased 85% from 8.0 minutes per chart decreased 85% from 8.0 minutes per new chart to 1.2 minutes, an annual new chart to 1.2 minutes, an annual savings of more than $22,000.savings of more than $22,000.

ROI ROI -- SuppliesSupplies
The average cost for administrative The average cost for administrative supplies decreased from an average of supplies decreased from an average of $8.00 per patient to $0.97, a decrease of $8.00 per patient to $0.97, a decrease of more than 87%. more than 87%. Based on the number of actual patients Based on the number of actual patients (55,000), the practice saved more than (55,000), the practice saved more than $380,000 in paper and supply costs.$380,000 in paper and supply costs.
Phone CallsPhone Calls
The amount of time required to handle The amount of time required to handle phone call inquiries that required the chart phone call inquiries that required the chart has been reduced by 73%. The number has been reduced by 73%. The number of tasks decreased from 18 down to 2. of tasks decreased from 18 down to 2.
Total annual savings exceed $103,000.Total annual savings exceed $103,000.
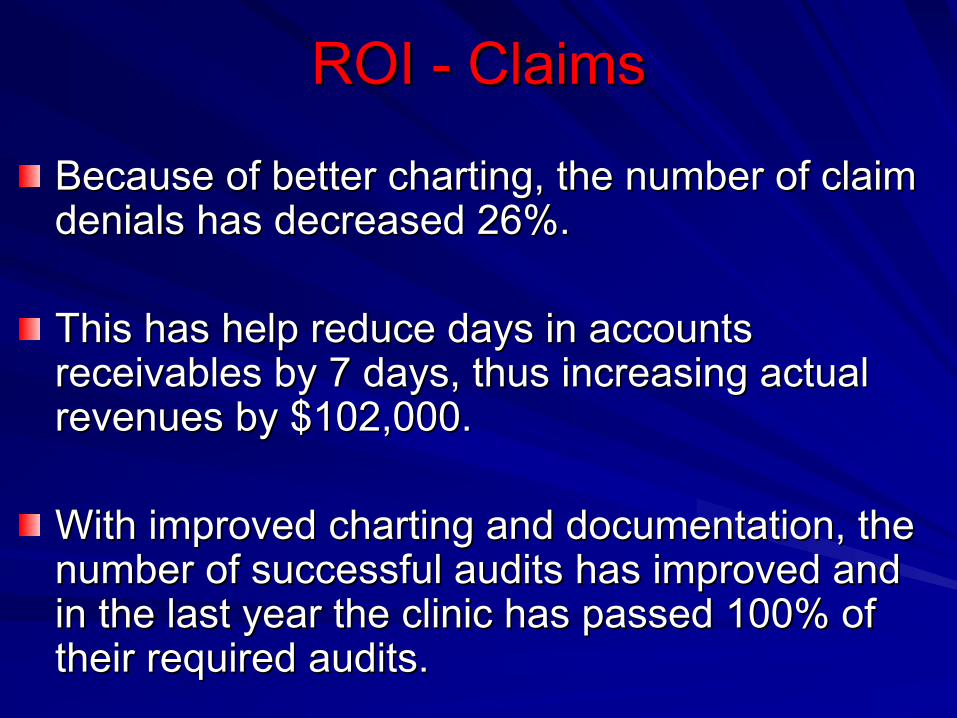
ROI ROI -- ClaimsClaims
Because of better charting, the number of claim Because of better charting, the number of claim denials has decreased 26%.denials has decreased 26%.
This has help reduce days in accounts This has help reduce days in accounts receivables by 7 days, thus increasing actual receivables by 7 days, thus increasing actual revenues by $102,000.revenues by $102,000.
With improved charting and documentation, the With improved charting and documentation, the number of successful audits has improved and number of successful audits has improved and in the last year the clinic has passed 100% of in the last year the clinic has passed 100% of their required audits.their required audits.

ROI ROI -- Eliminating No ShowsEliminating No Shows
Electronically calling our patients each day to Electronically calling our patients each day to remind them of their appointments has remind them of their appointments has decreased our "no shows" by 65%.decreased our "no shows" by 65%.
This has resulted in an 8% increase in number This has resulted in an 8% increase in number of daily visits without increasing practice size.of daily visits without increasing practice size.
At an average reimbursement of $100 per visit, At an average reimbursement of $100 per visit, this represents a $60,000 per month increase in this represents a $60,000 per month increase in revenue.revenue.

Calculating your own ROICalculating your own ROI
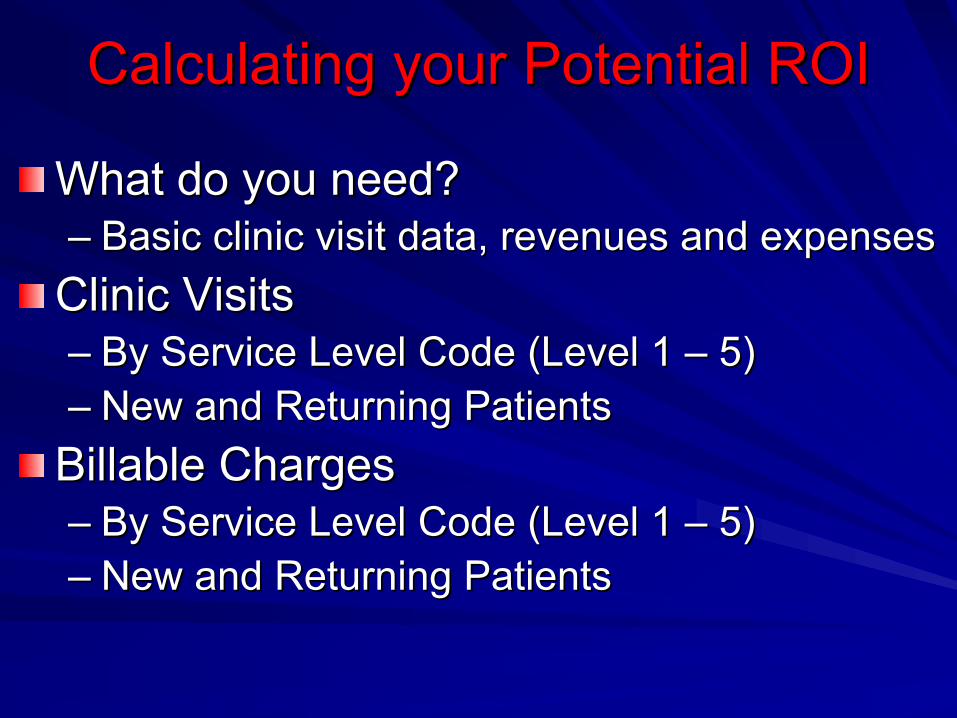
Calculating your Potential ROICalculating your Potential ROI
What do you need?What do you need?–– Basic clinic visit data, revenues and expensesBasic clinic visit data, revenues and expensesClinic VisitsClinic Visits–– By Service Level Code (Level 1 By Service Level Code (Level 1 –– 5)5)–– New and Returning PatientsNew and Returning PatientsBillable ChargesBillable Charges–– By Service Level Code (Level 1 By Service Level Code (Level 1 –– 5)5)–– New and Returning PatientsNew and Returning Patients
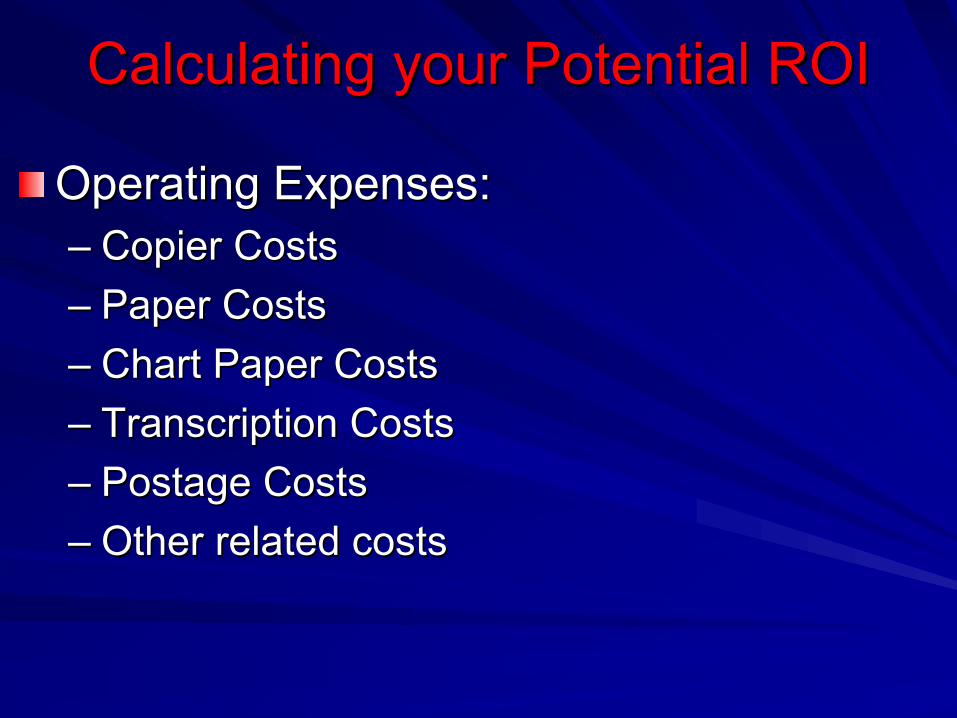
Calculating your Potential ROICalculating your Potential ROI
Operating Expenses:Operating Expenses:–– Copier CostsCopier Costs–– Paper CostsPaper Costs–– Chart Paper CostsChart Paper Costs–– Transcription CostsTranscription Costs–– Postage CostsPostage Costs–– Other related costsOther related costs
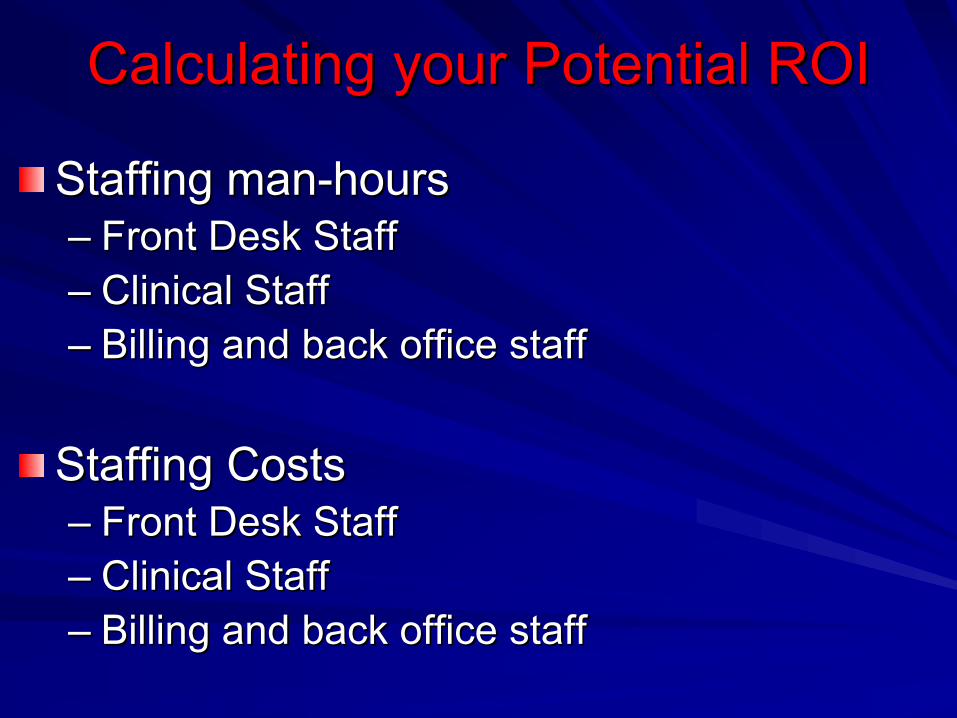
Calculating your Potential ROICalculating your Potential ROI
Staffing manStaffing man--hourshours–– Front Desk StaffFront Desk Staff–– Clinical StaffClinical Staff–– Billing and back office staffBilling and back office staff
Staffing CostsStaffing Costs–– Front Desk StaffFront Desk Staff–– Clinical StaffClinical Staff–– Billing and back office staffBilling and back office staff
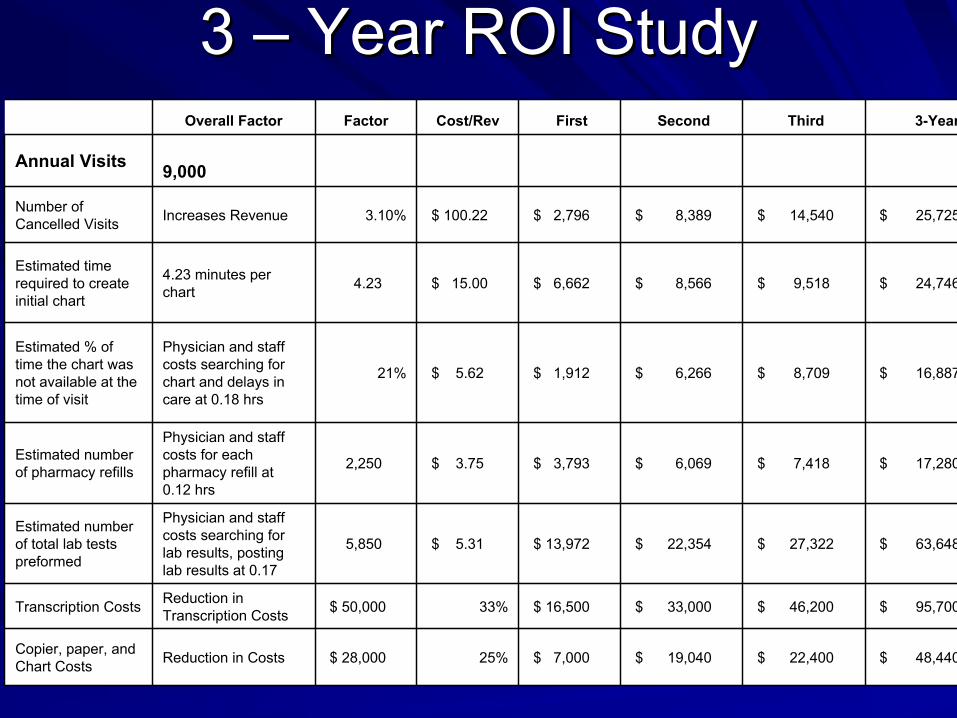
3 3 –– Year ROI StudyYear ROI Study
$ 48,440 $ 22,400 $ 19,040 $ 7,000 25%$ 28,000 Reduction in CostsCopier, paper, and Chart Costs
$ 95,700 $ 46,200 $ 33,000 $ 16,500 33%$ 50,000 Reduction in Transcription CostsTranscription Costs
$ 63,648 $ 27,322 $ 22,354 $ 13,972 $ 5.31 5,850
Physician and staff costs searching for lab results, posting lab results at 0.17
Estimated number of total lab tests preformed
$ 17,280 $ 7,418 $ 6,069 $ 3,793 $ 3.75 2,250
Physician and staff costs for each pharmacy refill at 0.12 hrs
Estimated number of pharmacy refills
$ 16,887 $ 8,709 $ 6,266 $ 1,912 $ 5.62 21%
Physician and staff costs searching for chart and delays in care at 0.18 hrs
Estimated % of time the chart was not available at the time of visit
$ 24,746 $ 9,518 $ 8,566 $ 6,662 $ 15.00 4.23 4.23 minutes per chart
Estimated time required to create initial chart
$ 25,725 $ 14,540 $ 8,389 $ 2,796 $ 100.22 3.10%Increases RevenueNumber of Cancelled Visits
9,000 Annual Visits
3-Year Third Second First Cost/RevFactorOverall Factor
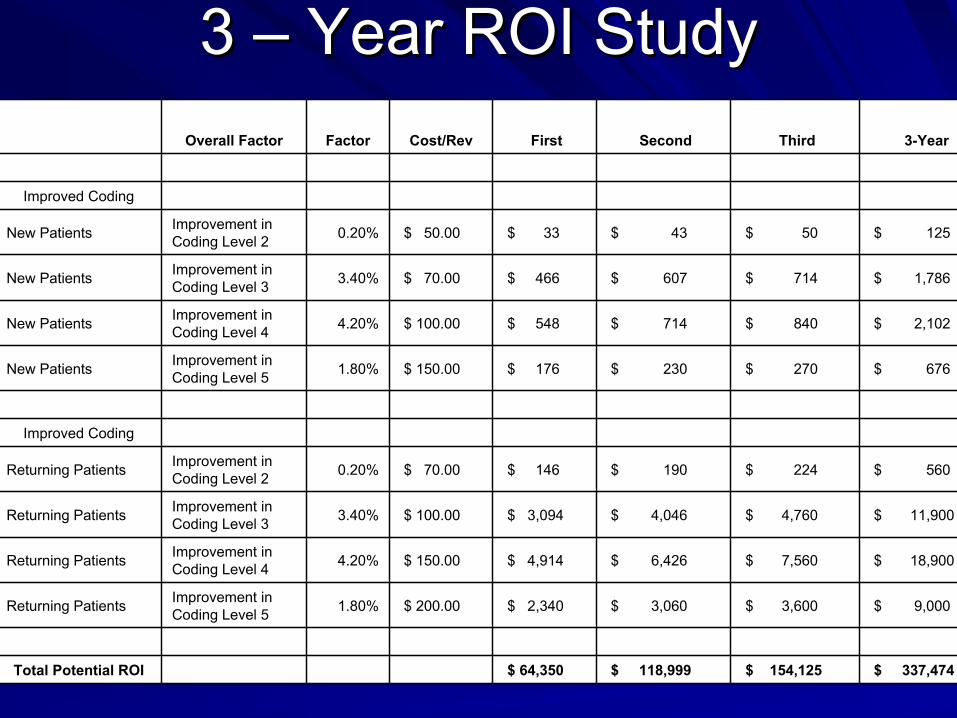
3 3 –– Year ROI StudyYear ROI Study
$ 337,474 $ 154,125 $ 118,999 $ 64,350 Total Potential ROI
$ 9,000 $ 3,600 $ 3,060 $ 2,340 $ 200.00 1.80%Improvement in Coding Level 5Returning Patients
$ 18,900 $ 7,560 $ 6,426 $ 4,914 $ 150.00 4.20%Improvement in Coding Level 4Returning Patients
$ 11,900 $ 4,760 $ 4,046 $ 3,094 $ 100.00 3.40%Improvement in Coding Level 3Returning Patients
$ 560 $ 224 $ 190 $ 146 $ 70.00 0.20%Improvement in Coding Level 2Returning Patients
Improved Coding
$ 676 $ 270 $ 230 $ 176 $ 150.00 1.80%Improvement in Coding Level 5New Patients
$ 2,102 $ 840 $ 714 $ 548 $ 100.00 4.20%Improvement in Coding Level 4New Patients
$ 1,786 $ 714 $ 607 $ 466 $ 70.00 3.40%Improvement in Coding Level 3New Patients
$ 125 $ 50 $ 43 $ 33 $ 50.00 0.20%Improvement in Coding Level 2New Patients
Improved Coding
3-Year Third Second First Cost/RevFactorOverall Factor

Who is Paying?Who is Paying?
Case StudyCase Study
Taconic Healthcare Taconic Healthcare Information Network Information Network
and Community and Community (THINC)(THINC)
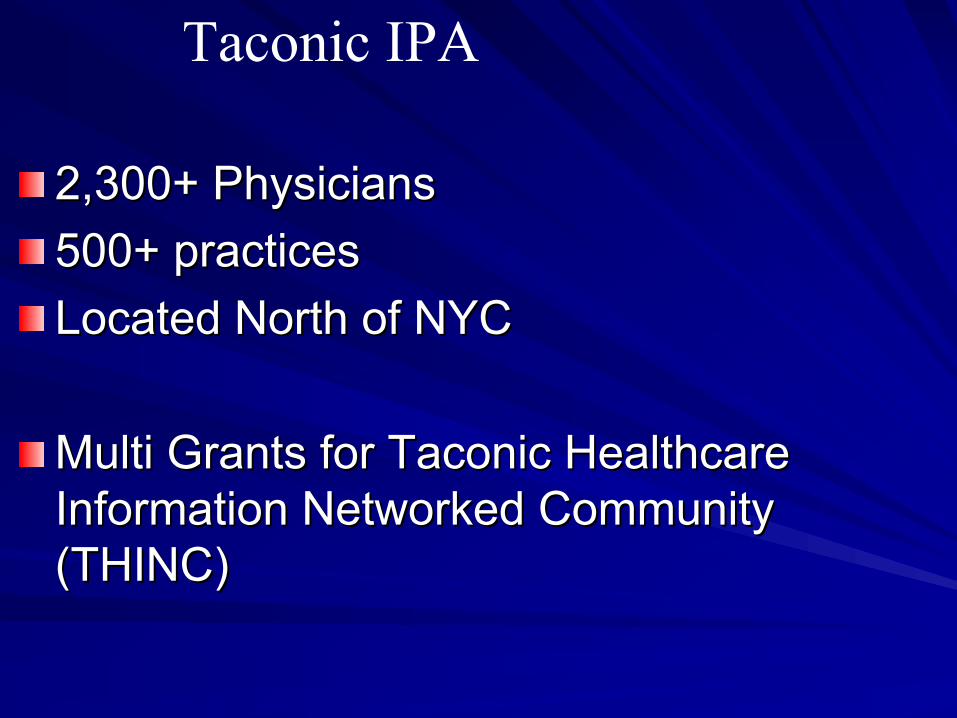
2,300+ Physicians 2,300+ Physicians 500+ practices500+ practicesLocated North of NYCLocated North of NYC
Multi Grants for Taconic Healthcare Multi Grants for Taconic Healthcare Information Networked Community Information Networked Community (THINC)(THINC)
Taconic IPA
THINC GoalsTHINC Goals
Improve QualityImprove QualityReduce Operating CostsReduce Operating CostsImprove Disease Management TrackingImprove Disease Management TrackingImprove Outcomes MeasurementImprove Outcomes Measurement
Provide Technologies within the community as a Provide Technologies within the community as a lower cost.lower cost.Provide Local SupportProvide Local Support
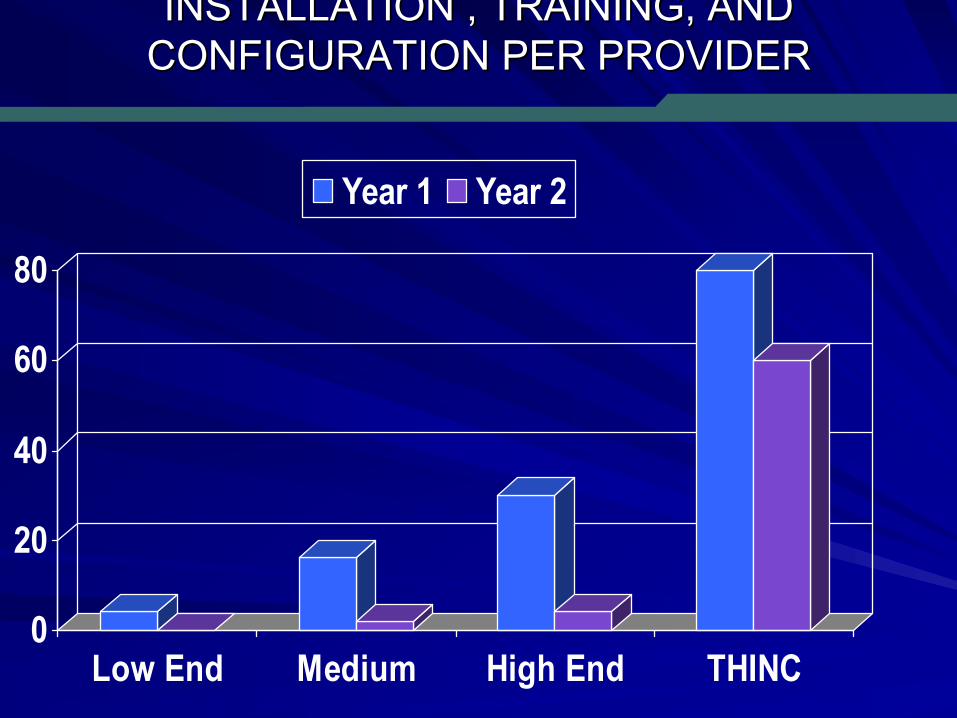
INSTALLATION , TRAINING, ANDINSTALLATION , TRAINING, ANDCONFIGURATION PER PROVIDERCONFIGURATION PER PROVIDER
0
20
40
60
80
Low End Medium High End THINC
Year 1 Year 2
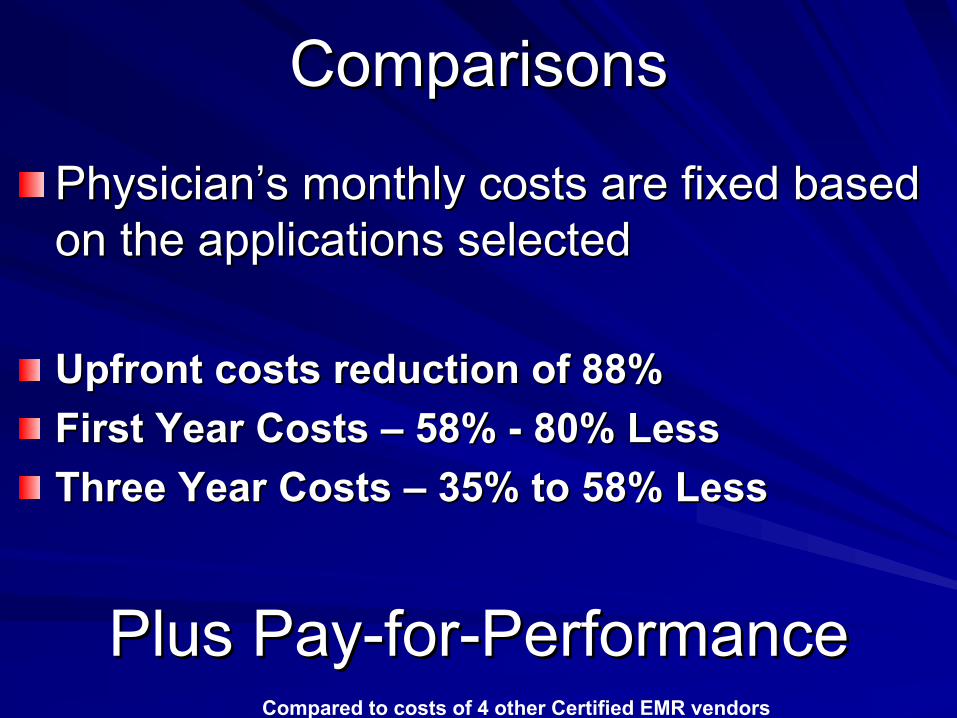
ComparisonsComparisons
PhysicianPhysician’’s monthly costs are fixed based s monthly costs are fixed based on the applications selectedon the applications selected
Upfront costs reduction of 88%Upfront costs reduction of 88%First Year Costs First Year Costs –– 58% 58% -- 80% Less80% LessThree Year Costs Three Year Costs –– 35% to 58% Less35% to 58% Less
Plus PayPlus Pay--forfor--PerformancePerformanceCompared to costs of 4 other Certified EMR vendors

Who is PayingWho is Paying
P4PP4P

Why the Gap in EBM?Why the Gap in EBM?
NOTICE TO OUR PATIENTS:
Doctors in our clinic do not practice according to national
guidelines. Our reasons include:
• We are too busy.
• We don’t agree with the guideline.
• We don’t get paid extra to do it.
• It wasn’t done that way 20 years ago when we were trained.
• We tried it once and it didn’t seem to work.
• We are the doctors, and who are these guideline people to tell
us what to do?
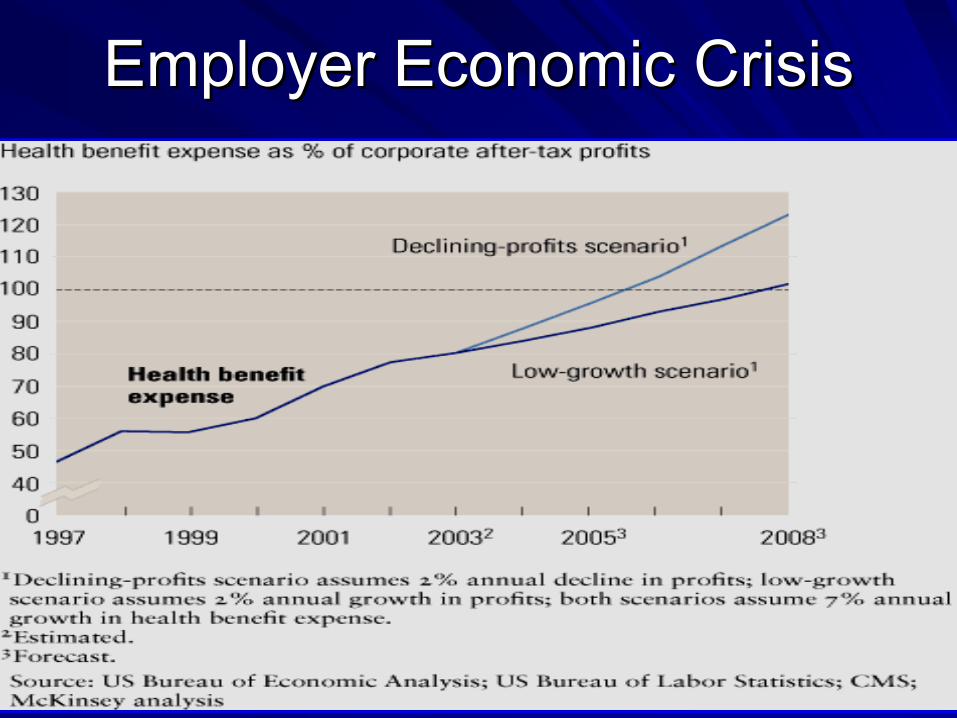
Employer Economic CrisisEmployer Economic Crisis
- a Rewarding Results National Grant
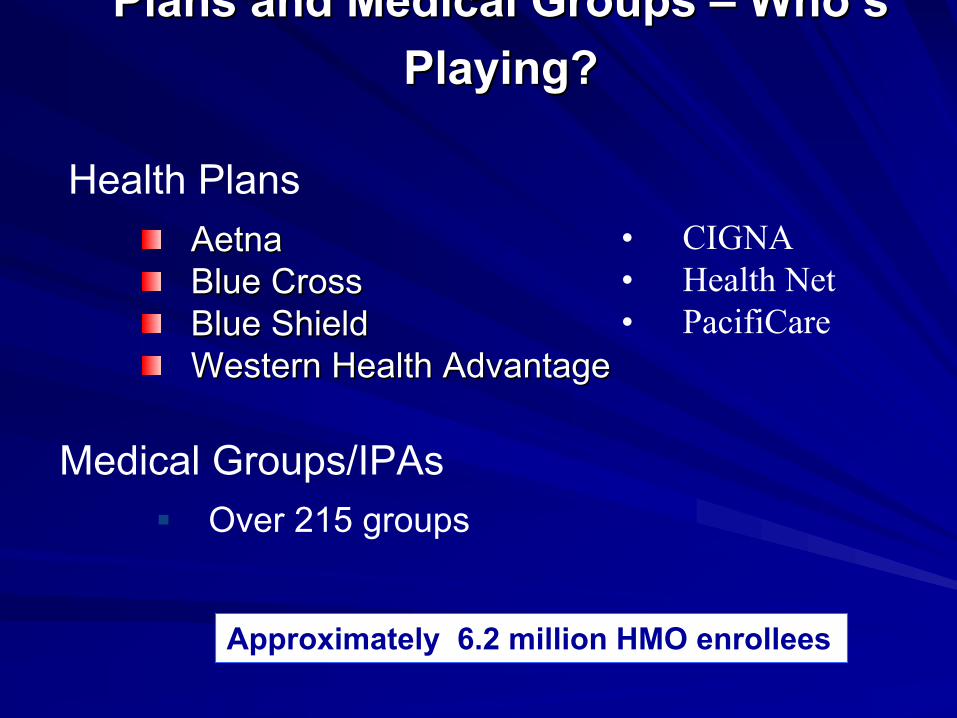
Plans and Medical Groups Plans and Medical Groups –– WhoWho’’s s Playing?Playing?
AetnaAetnaBlue CrossBlue CrossBlue Shield Blue Shield Western Health Advantage Western Health Advantage
Medical Groups/IPAsOver 215 groups
Approximately 6.2 million HMO enrollees
Health Plans • CIGNA• Health Net• PacifiCare
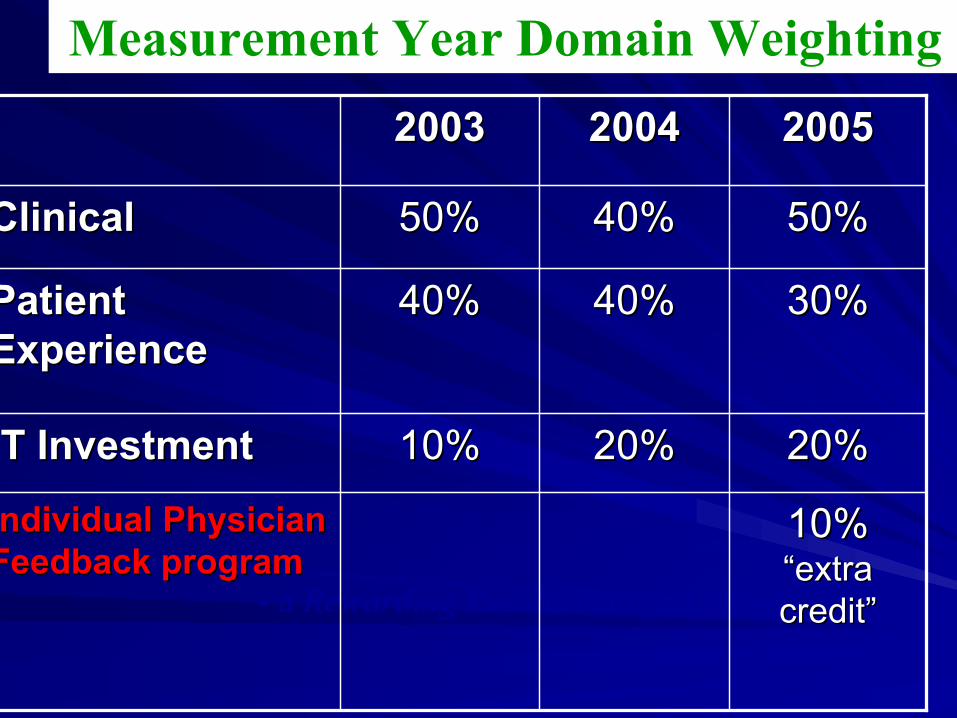
Measurement Year Domain Weighting
- a Rewarding Results National Grant
10%10%
40%40%
50%50%
20032003
30%30%40%40%Patient Patient ExperienceExperience
2005200520042004
10% 10% ““extra extra creditcredit””
Individual Physician Individual Physician Feedback programFeedback program
20%20%20%20%IT InvestmentIT Investment
50%50%40%40%ClinicalClinical
- a Rewarding Results National Grant
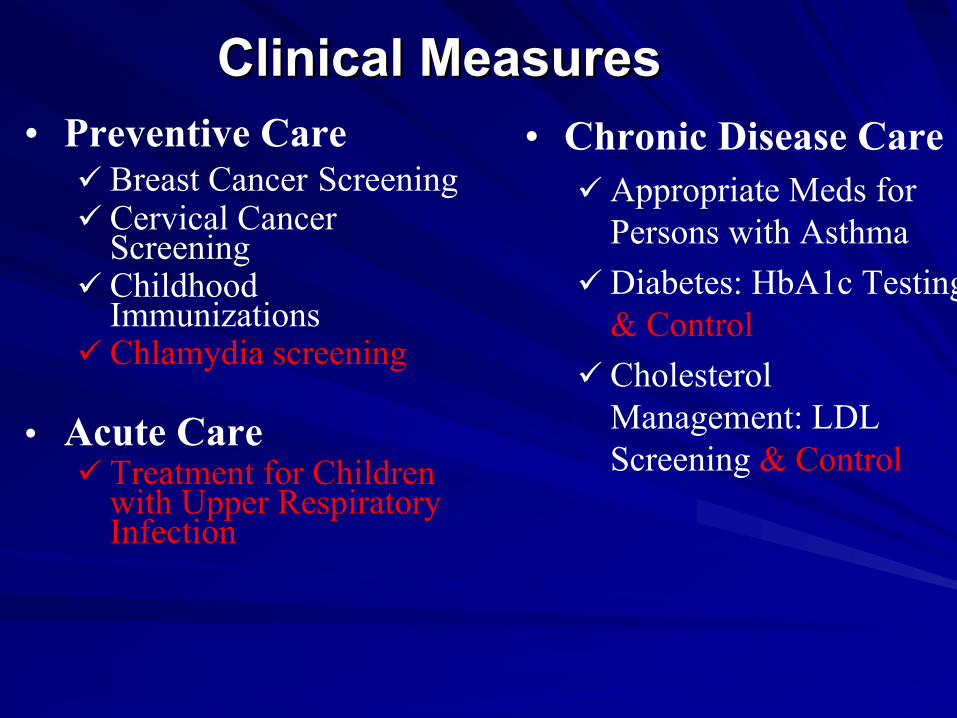
Clinical MeasuresClinical Measures• Preventive Care
Breast Cancer ScreeningCervical Cancer ScreeningChildhood ImmunizationsChlamydia screening
• Acute CareTreatment for Children with Upper Respiratory Infection
• Chronic Disease CareAppropriate Meds for Persons with AsthmaDiabetes: HbA1c Testing & ControlCholesterol Management: LDL Screening & Control
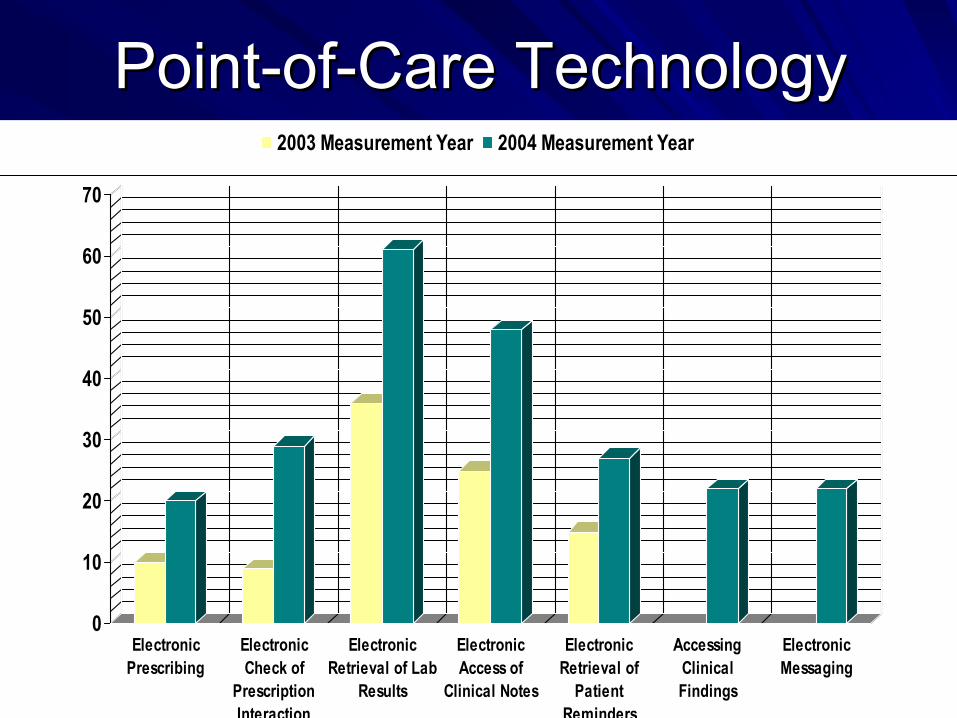
PointPoint--ofof--Care TechnologyCare Technology
0
10
20
30
40
50
60
70
ElectronicPrescribing
ElectronicCheck of
PrescriptionInteraction
ElectronicRetrieval of Lab
Results
ElectronicAccess of
Clinical Notes
ElectronicRetrieval of
PatientReminders
AccessingClinicalFindings
ElectronicMessaging
2003 Measurement Year 2004 Measurement Year

2003 and 2004 Incentive Payments
- a Rewarding Results National Grant
Aggregate payment of $60 million to physician Aggregate payment of $60 million to physician groups for IHA P4P program in 2003groups for IHA P4P program in 2003
Two participating plans in 2004 paid about Two participating plans in 2004 paid about 70% of total payout70% of total payout
Expected payout in 2005 for 2004 data will be Expected payout in 2005 for 2004 data will be $88 million, payments starting on July 1, 2005$88 million, payments starting on July 1, 2005
5050
Bottom Lines
EMR is finally becoming Cost JustifiedFinancial SavingsDoes NOT reduce time in front of PatientsSaves time after the visitEvery vendor is NOT the sameHealthplans starting to pay more for EMRMalpractice rates will decrease with EMR
Start IncrementallyRemember, you still have paperEMR changes the way you workTherefore, change Incrementally

For More InformationFor More InformationMark R. Anderson, FHIMSS, CPHIMSMark R. Anderson, FHIMSS, CPHIMS
CEO and Healthcare FuturistCEO and Healthcare FuturistAC Group, Inc.AC Group, Inc.
118 Lyndsey Drive118 Lyndsey DriveMontgomery, TX 77316Montgomery, TX 77316
(281) 413(281) 413--55725572eMail: mark.anderson @ acgroup.org eMail: mark.anderson @ acgroup.org
www.acgroup.orgwww.acgroup.org