the demographics of wealth
TRANSCRIPT

The Bigger They Are, The Harder They Fall:The Decline of the White Working Class
The Demographics of Wealth
2018 Series
Essay No. 3: Race, Ethnicity, and Education | September 2018
Executive Summary

2 Federal Reserve Bank of St. Louis
About the Center for Household Financial Stability
The Center for Household Financial Stability at the Federal Reserve Bank of St. Louis focuses on family
balance sheets, especially those of struggling American families. The Center researches the determinants
of healthy family balance sheets, their links to the broader economy and new ideas to improve them.
The Center’s original research, publications and public events aim to impact future research, community
practice and public policy. For more information, see www.stlouisfed.org/hfs.
Staff
Ray Boshara is an assistant vice president at the St. Louis Fed and director of the Center.
He is also a senior fellow in the Financial Security Program at the Aspen Institute.
William R. Emmons is an assistant vice president and economist at the St. Louis Fed and the lead
economist with the Center.
Lowell R. Ricketts is the lead analyst for the Center.
Ana Hernández Kent is a policy analyst for the Center.
Research Fellows
Barry Z. Cynamon is a senior research fellow at the Jain Family Institute and CFO of Better Future Forward.
Michael Stegman, senior research fellow, also holds senior fellow positions at the Milken Institute Center for
Financial Markets, and the Center for Community Capital at the University of North Carolina.
Visiting ScholarsFenaba R. Addo is an assistant professor of consumer science at the University of Wisconsin-Madison.
Emily Gallagher is an assistant professor of finance and real estate at the University of Colorado at Boulder
and a faculty affiliate of the Social Policy Institute at Washington University in St. Louis.
Bradley L. Hardy is an associate professor of public administration and policy at the American University in
Washington, D.C., and a nonresident senior fellow in economic studies at the Brookings Institution.

3 Federal Reserve Bank of St. Louis
William R. Emmons is the lead economist with the Center for House-
hold Financial Stability at the Federal Reserve Bank of St. Louis, where
he also serves as assistant vice president. His areas of focus at the Center
include household balance sheets and their relationship to the broader
economy. He also speaks and writes frequently on banking, financial
markets, financial regulation, housing, the economy, and other topics.
His work has been highlighted in major publications including The New
York Times, The Wall Street Journal and American Banker, and he has
appeared on PBS NewsHour, Bloomberg News, and other national
programs. Emmons received a Ph.D. in finance from the Kellogg School
of Management at Northwestern University. He received his bachelor’s
and master’s degrees from the University of Illinois at Urbana-Champaign.
Lowell R. Ricketts is the lead analyst for the Center for Household Finan-
cial Stability at the Federal Reserve Bank of St. Louis, where he conducts
primary and secondary research and policy analysis on household bal-
ance sheet issues. His primary research focus has centered on household
liabilities and wealth outcomes. Prior to joining the team, he worked in
the Research division of the Federal Reserve Bank of St. Louis as a senior
research associate. Ricketts received a bachelor’s degree in economics
with a math emphasis from the University of Wisconsin-Madison. He
continues to be involved with the university’s Department of Economics
as a member of the Wisconsin Economics Young Alumni Council. He is
pursuing a Master of Arts in statistics at Washington University in St. Louis.
Authors
Ana Hernández Kent is a policy analyst for the Center for Household
Financial Stability at the Federal Reserve Bank of St. Louis. She conducts
primary and secondary research and data analysis on household balance
sheet issues. Her primary research interests at the Fed include economic
disparities and opportunity, wealth outcomes, class and racial biases, and
the role of psychological factors in making financial decisions.
Kent received her Ph.D. in experimental psychology with concentrations
in social psychology and quantitative methods in behavioral sciences
from Saint Louis University. Kent received her Master of Science in exper-
imental psychology from Saint Louis University and her bachelor’s degree
in psychology from the University of Notre Dame.
The Demographics of Wealth 3

4 Federal Reserve Bank of St. Louis
Income and wealth rebounded for many
families between 2013 and 2016, the dates
of the two most recent waves of the Federal
Reserve’s Survey of Consumer Finances
(SCF). Groups that had struggled the most
during and after the Great Recession, includ-
ing less-educated, Hispanic and black, and
young families, participated in the recovery.
Nonetheless, long-standing income and
wealth gaps across education levels, races
and ethnicities, and age groups remain large.
This is the third in a series of three new
essays that the Center for Household Financial Stability is publishing on how
a family’s demographic characteristics—
including educational attainment, race and
ethnicity, and birth year—are related to the
family’s financial outcomes. Like the previous
essay series published in 2015, the 2018 series
focuses on these three key demographic
dimensions in turn. An important new
feature of the 2018 series is the inclusion of
two generations of educational data for each
family. In addition to the educational attain-
ment of the SCF respondent, the 2016 SCF for
the first time contains detailed information
on the respondents’ parents’ education. This
new information reveals even more clearly
that inherited demographic characteristics—
your race or ethnicity, your age and birth
year, and even your parents’ level of educa-
tion—profoundly shape the economic and
financial opportunities you have and the
outcomes you achieve.
As before, our primary data source is
the triennial SCF, which provides the most
comprehensive picture available of American
families’ balance sheets and financial behav-
ior over time. In some of our analyses, we
use information from 47,776 families, each
of which was surveyed in one of 10 survey
waves between 1989 and 2016. When we
focus on the education of SCF respondents’
parents, we draw upon data collected from
6,248 families in 2016. In every case, the SCF
has been designed to be nationally represen-
tative, so we can safely generalize about the
population as a whole.
As we documented three years ago,
demographic characteristics remain
remarkably powerful in predicting a family’s
income and wealth. By expanding the scope
of inherited demographic characteristics to
include parents’ education, we believe the
2018 Demographics of Wealth series sheds
additional light on the deeply rooted sources
of economic and financial disparities. Fruitful
approaches to policy should be based on the
facts established here.
The Demographics of WealthHow Education, Race and Birth Year
Shape Financial Outcomes
An Introduction to the Series
By William R. Emmons, Ana H. Kent and Lowell R. Ricketts
5 Federal Reserve Bank of St. Louis
This essay explores the intersection of race, eth-
nicity and education, which we use as a proxy
for class. We examine five measures of well-being
between 1989 and 2016, the range spanned by the
Federal Reserve’s Survey of Consumer Finances.
We document three main findings:
1. Large racial and ethnic gaps in a range of measures of well-being lessened solely because of improvements for nonwhite families without college degrees. Over time, nonwhite working
class families—those without a four-year college
degree—became more similar to working class
non-Hispanic whites in terms of family income
and wealth. This also was true of the likelihood of
being a homeowner, of being married or cohabit-
ing and of reporting good or excellent health.
Conversely, families headed by someone with
a four-year college degree who identified as
non-Hispanic black or Hispanic of any race fell
further behind similarly educated white families on
all of those measures. More families are working
class than college educated, so declining gaps are
evident in the population as a whole.
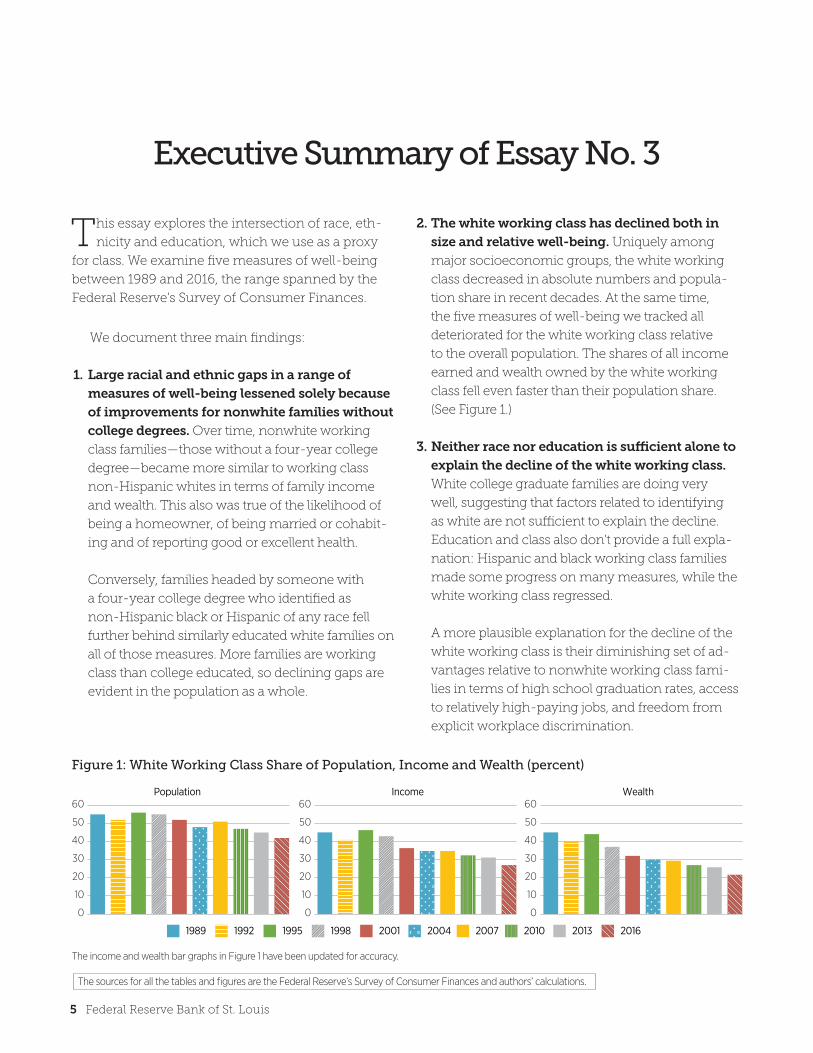
2. The white working class has declined both in size and relative well-being. Uniquely among
major socioeconomic groups, the white working
class decreased in absolute numbers and popula-
tion share in recent decades. At the same time,
the five measures of well-being we tracked all
deteriorated for the white working class relative
to the overall population. The shares of all income
earned and wealth owned by the white working
class fell even faster than their population share.
(See Figure 1.)
3. Neither race nor education is sufficient alone to explain the decline of the white working class. White college graduate families are doing very
well, suggesting that factors related to identifying
as white are not sufficient to explain the decline.
Education and class also don’t provide a full expla-
nation: Hispanic and black working class families
made some progress on many measures, while the
white working class regressed.
A more plausible explanation for the decline of the
white working class is their diminishing set of ad-
vantages relative to nonwhite working class fami-
lies in terms of high school graduation rates, access
to relatively high-paying jobs, and freedom from
explicit workplace discrimination.
Executive Summary of Essay No. 3
Figure 1: White Working Class Share of Population, Income and Wealth (percent)
Population Income Wealth
0
10
20
30
40
50
60
0
10
20
30
40
50
60
0
10
20
30
40
50
60
1989 1992 1995 1998 2001 2004 2007 2010 2013 2016
The sources for all the tables and figures are the Federal Reserve’s Survey of Consumer Finances and authors’ calculations.
The income and wealth bar graphs in Figure 1 have been updated for accuracy.

6 Federal Reserve Bank of St. Louis
Race and class remain defining demographic
dimensions in American society. This essay
explores the socioeconomic implications of the
intersection of race, ethnicity and class. We pro-
vide both a broad overview of trends in well-being
between 1989 and 2016, as well as a detailed inves-
tigation of a singularly important group—the white
working class, which we define as families headed
by a non-Hispanic white person without a four-
year college degree.1
We focus attention on the white working class
for several reasons: first, because this group is by far
the largest among the subgroups formed by race
and education levels; second, because the group’s
outcomes have diverged from otherwise similar
groups in some respects; and third, because it is the
focus of intense scholarly discussion and popular
discourse.2
To explore long-term socioeconomic changes
along race and class lines, we track five measures in
the Federal Reserve’s triennial Survey of Consumer
Finances (SCF): family income; family wealth; the
share of a group that is made up of homeowners;
the share of respondents married or cohabiting
with another adult of the same or opposite sex;
and the share reporting good or excellent health.
The evidence points toward both the tightening
and widening of gaps along racial and ethnic lines,
depending on how narrowly groups of families are
defined. The fate of the white working class turns
out to be the key to reconciling what at first appear
to be contradictory results.
We show that the white working class is in
decline, as measured by a broad set of indicators.
Which aspect of the white working class’s identity
is responsible for its decline—class, defined here
by college degree status, or race? We conclude
that the decline of the white working class cannot
be explained by factors related either to race or
class alone:
• As a group, white college graduates are thriving,
so identifying as white is not itself a sufficient
explanation for decline.
• Nonwhite working classes showed improvements
in a range of measures of well-being over time,
while the white working class had declines, so
lack of a college degree likewise is not definitive.
We suggest the broad-based decline that is
unique to the white working class may be due in
part to the group’s loss over time of advantages it
once enjoyed relative to those of nonwhite working
classes. These included more years of education
and plentiful high-paying jobs available in white
working class communities. And, as the explicit
discrimination minorities faced in the workplace
has diminished, so has the advantage that it had
given the white working class. As these advantages
eroded, income, wealth and other measures of
well-being also may have weakened.
The essay has four parts. In Section I, we provide
an overview of income and wealth trends since 1989
among the major racial and ethnic groups in the U.S.,
The Bigger They Are, The Harder They Fall:The Decline of the White Working Class
By William R. Emmons, Ana H. Kent and Lowell R. Ricketts
Essay No. 3
7 Federal Reserve Bank of St. Louis
using data from the SCF. We describe median family
income and wealth trends, as well as changes in the
shares of total income earned and wealth owned
by each racial or ethnic group. Share comparisons
take into account the changing composition of the
population, notably the declining share made up of
white—and especially white working class—
families. We also track changes in the share of
families in each group that owned their own
homes, were married or cohabiting and reported
good or excellent health.
Section II combines each SCF respondent’s
education level with his or her race or ethnicity to
form six major socioeconomic groups—three racial
or ethnic groups subdivided by four-year college
degree status (completed or not).3 Trends in median
income, median wealth, income and wealth shares
and three nonfinancial measures illustrate the un-
usual decline of the white working class. The black
and Hispanic working classes generally show im-
provement over time, while their college-educated
peer families show declines.
Section III takes a closer look at the white
working class to uncover similarities to and dif-
ferences among related groups. We compare the
white working class both to whites with college
degrees and to nonwhite working classes. We
offer tentative explanations for the patterns we
document but leave detailed exploration to future
research.4 Section IV concludes.
I. Overall, Racial and Ethnic Gaps in Well-Being Measures are Shrinking
Convergence—that is, narrowing gaps—of
economic, financial and other socioeconomic
measures of well-being by Hispanic (of any race),
non-Hispanic African-American or black (hence-
forth “black”) and other nonwhite (henceforth
“other-race”) families toward levels enjoyed by
non-Hispanic white (henceforth “white”) families
has been slow and uneven since 1989, but it is
unmistakable nonetheless.5
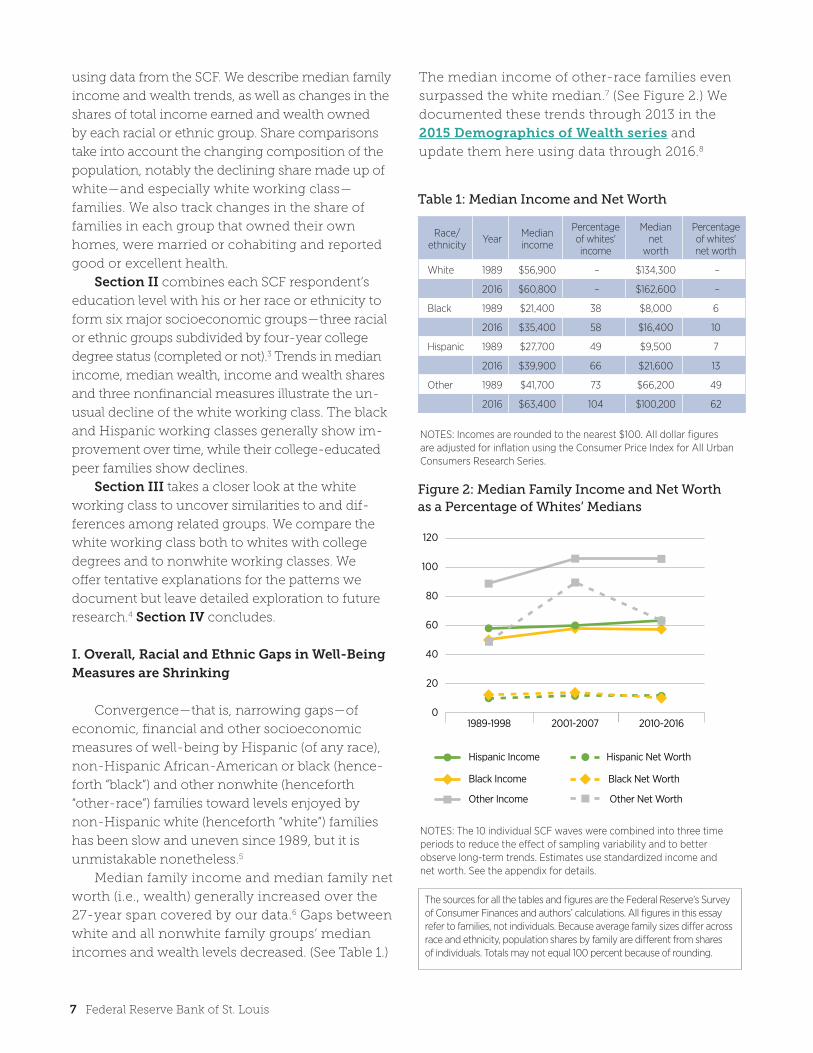
Median family income and median family net
worth (i.e., wealth) generally increased over the
27-year span covered by our data.6 Gaps between
white and all nonwhite family groups’ median
incomes and wealth levels decreased. (See Table 1.)
The median income of other-race families even
surpassed the white median.7 (See Figure 2.) We
documented these trends through 2013 in the
2015 Demographics of Wealth series and
update them here using data through 2016.8
The sources for all the tables and figures are the Federal Reserve’s Survey of Consumer Finances and authors’ calculations. All figures in this essay refer to families, not individuals. Because average family sizes differ across race and ethnicity, population shares by family are different from shares of individuals. Totals may not equal 100 percent because of rounding.
Table 1: Median Income and Net Worth
Race/ethnicity Year Median
income
Percentage of whites' income
Median net
worth
Percentage of whites' net worth
White 1989 $56,900 – $134,300 –
2016 $60,800 – $162,600 –
Black 1989 $21,400 38 $8,000 6
2016 $35,400 58 $16,400 10
Hispanic 1989 $27,700 49 $9,500 7
2016 $39,900 66 $21,600 13
Other 1989 $41,700 73 $66,200 49
2016 $63,400 104 $100,200 62
NOTES: Incomes are rounded to the nearest $100. All dollar figures are adjusted for inflation using the Consumer Price Index for All Urban Consumers Research Series.
NOTES: The 10 individual SCF waves were combined into three time periods to reduce the effect of sampling variability and to better observe long-term trends. Estimates use standardized income and net worth. See the appendix for details.
Figure 2: Median Family Income and Net Worth as a Percentage of Whites’ Medians
2010-20162001-20071989-19980
20
40
60
80
100
120
Hispanic Net Worth
Other Income
Hispanic Income
Black Income Black Net Worth
Other Net Worth

8 Federal Reserve Bank of St. Louis
Figure 3 shows how population, income and
wealth shares changed between 1989 and 2016.
The share of total income and total wealth owned
by whites declined but became even more dispro-
portionate to their share in the population. White
families remain the largest racial or ethnic group
in the United States by far. While the representation
of both Hispanic and black families grew notice-
ably, their income and wealth didn’t increase as
much because their average incomes and wealth
are low.
Table 2 summarizes three nonfinancial measures
of well-being by race and ethnicity. Homeownership
was more common in the latest period (2010-16) than
in the earliest period (1989-98) among all four groups.
The Hispanic and other-race homeownership rates
increased by more than the white rate, while the
increase was slightly less among blacks.
Black and Hispanic marriage or cohabitation
rates came closer to the white rate over time, albeit
from different directions. The other-race group
went from slightly below to slightly above the
white rate. Finally, self-reported good or excellent
health of all nonwhite groups came closer to the
white level over time.9
In sum, there is evidence of declining racial and
ethnic gaps in family income, family wealth, home-
ownership, marriage rates and self-reported health.
When we take college degree status into account,
however, the picture becomes more complex.
II. Racial and Ethnic Gaps Are Closing Only among the Working Class10
Racial and ethnic gaps in well-being turn out to
be narrowing only among working class (nongrad-
uate) groups. Gaps actually have increased between
groups of college graduates by race and ethnicity;
white college graduates are faring much better than
their black or Hispanic peers.11
The existence of those growing gaps does not
negate or reverse the overall conclusion of racial
and ethnic convergence because working class
families are much more numerous and the patterns
they exhibit dominate the population statistics.
Distinguishing between families with and with-
out college degrees reveals another complication:
Whether college graduates are pulling away from
Table 2: Other Indicators of Well-Being
1989-1998
2001-2007
2010-2016
Change between early and
late periods (% points)
Net improve-ment vs.
white households?
Homeownership rate (percent)
White 70.8 74.9 73.2 2.4 N/A
Black 43.7 48.8 45.1 1.4 No
Hispanic 42.2 47.3 45.5 3.3 Yes
Other 53.6 58.7 57.9 4.2 Yes
Marriage or cohabitation rate (percent)
White 61.5 61.6 60.5 -0.9 N/A
Black 34.0 37.7 37.3 3.3 Yes
Hispanic 64.5 66.1 61.3 -3.2 No
Other 60.0 66.0 62.7 2.7 Yes
Healthy share (percent)
White 78.1 76.6 74.6 -3.5 N/A
Black 66.1 69.6 67.9 1.8 Yes
Hispanic 67.8 67.9 71.4 3.6 Yes
Other 74.6 77.3 72.4 -2.2 Yes
NOTES: The 10 individual SCF waves were combined into three time periods to reduce the effect of sampling variability and to better observe long-term trends. See the appendix for details. Numbers have been rounded. The differences in values noted in the “Change” column were calculated before rounding.
NOTE: Numbers may not equal 100 percent because of rounding.
Figure 3: Shares of Households in Population, Total Family Income, and Total Family Net Worth
1989 2016
Population Income Net Worth
1989 2016 1989 20160
20
40
60
80
Perc
ent
100
Hispanic BlackOther White
58
13
75
511
16
68
446
86
568
80
42
3
91
5
89
3
3
The sources for all the tables and figures are the Federal Reserve’s Survey of Consumer Finances and authors’ calculations.

9 Federal Reserve Bank of St. Louis
To measure income for the SCF, the interviewers requested information on the family’s cash income,
before taxes, for the full calendar year preceding the survey. The components of income in the SCF are wages, self-employment and business income, taxable and tax-exempt interest, dividends, realized capital gains, food stamps and other related support programs provided by government, pensions and withdrawals from retirement accounts, Social Security, alimony and other support payments, and miscella-neous sources of income for all members of the prima-ry economic unit in the household. All income figures were adjusted for inflation to be comparable to values recorded in 2016.
Wealth is a family’s net worth, consisting of the excess of its assets over its debts at a point in time. Total assets include both financial assets (such as bank accounts, mutual funds and securities) and tangible assets (including real estate, vehicles and durable goods). Total debt includes home-secured borrowing, or mortgages; other secured borrowing (such as vehicle loans); and unsecured debts (such as credit cards and student loans). Debt incurred in association with a privately owned business or to finance investment real estate is subtracted from the asset’s value, rather than being included in the family’s debt. All wealth figures were adjusted for inflation.
Sidebar 1: Family Income and Wealth
working class families of the same race or ethnicity
depends on race. Among whites, well-being gaps
are growing; among blacks and Hispanics, the gaps
are shrinking.
A particularly dramatic way to illustrate the
diverging fortunes of white college graduates and
the white working class is to track their respective
shares of all income earned and wealth owned.
Income and wealth shares combine trends in pop-
ulation and average income or wealth. (See Figures
4 and 5.) The trends are virtual mirror images of
each other.
We first illustrate the complexities of race and
class before proposing explanations in the next
section for the crosscurrents we observe. The white
working class and its relationship to nonwhite
working classes turn out to be keys to the complex
patterns revealed by the data.
Figure 4: Share of Total Family Income for Whites by Education (percent)
Figure 5: Share of Total Family Net Worth for Whites by Education (percent)
20
30
40
50
60
1989 1992 1995 1998 2001 2004 2007 2010 2013 201610
White, No CollegeWhite, College
10
20
30
40
50
60
70
80
White, No CollegeWhite, College
1989 1992 1995 1998 2001 2004 2007 2010 2013 2016

10 Federal Reserve Bank of St. Louis
Population shares. The white working class
made up by far the largest group of families defined
by race, ethnicity and college degree status in 1989;
they accounted for 55 percent of all families. (See
Figure 6.) By 2016, the white working class share
had dropped a sizable 13 percentage points. Mean-
while, white college graduate families increased by
6 percentage points. Most other groups increased
as the white working class shrank.
Median incomes. Median family incomes
of college graduates of all races and ethnicities
are significantly higher than those of their
noncollege-educated counterparts of the same
race and ethnicity. Moreover, there are income
gaps across races and ethnicities at the same ed-
ucation level. The result is a wide range of typical
incomes earned by families when they are grouped
by race, ethnicity and education.
The $43,300 median income among white
working class families in the 1989-98 period, for
example, was about half the median income among
white college-educated families ($86,100) and almost
twice as high as the median income among black
working class families ($22,200). By 2010-16, the
former gap had grown while the latter gap
had shrunk.
Figure 7 shows the median incomes of college
graduate families by race and ethnicity relative to
the overall population median over time. Black
college graduate families’ median income grew at
a slower pace than the overall population median
from the early (1989-98) to middle periods (2001-07).
Both Hispanic and black college graduate families’
median incomes declined relative to the overall
population median after the middle period (2001-07).
Median white college graduate family incomes,
on the other hand, grew faster than the population
median throughout the entire sample period. Thus,
typical incomes diverged between white and non-
white college graduates.
Figure 8 shows virtually the opposite pattern
among families without college degrees. Hispanic
and black median family incomes grew faster than
the overall population median, while white median
family incomes declined slightly relative to the over-
all rate. As a result, median incomes across race and
ethnicity were closer together in the late period than
in the early period.
Disaggregating families into four or eight groups of unequal size means that the
number of families interviewed was very small in some cells in some years. This adds a significant amount of sampling variability to the estimates reported here. Nonwhite groups with college education are most subject to this small-sample variability; this is par-ticularly true in the early years of the sample and should be kept in mind when viewing the data. To reduce the effect of sampling variability caused by very small cell sizes and to better view long-term trends, we combined individual SCF waves into three time periods, as described in the appendix.
Sidebar 2: SCF Sample Sizes and Sampling Variability
The sources for all the tables and figures are the Federal Reserve’s Survey of Consumer Finances and authors’ calculations.
Figure 6: Share of Families in Population (percent)
1989 2016
0 10 20 30 40 50 60
Hispanic, College
Black, College
Other, College
Other, No College
Hispanic, No College
Black, No College
White, College
White, No College55%
42%
20%26%
11%
7%
3%
3%
1%
1%
4%
2%
2%
2%
9%
12%

11 Federal Reserve Bank of St. Louis
NOTE: In Figures 7-10, the 10 individual SCF waves were combined into three time periods to reduce the effect of sampling variability and to better observe long-term trends. See the appendix for details.
Figure 7: Median Income Relative to Population Median, College Graduate Families
50
100
150
200
2010-20162001-20071989-1998
Hispanic BlackWhite
Perc
ent
Hispanic BlackWhite
40
60
80
100
2010-20162001-20071989-1998
Perc
ent
Figure 8: Median Income Relative to Population Median, Noncollege-Graduate Families
Median net worth. Wealth gaps, already large
when comparing different races and ethnicities,
are even larger when taking educational attainment
into account.12 Among all families, white median
wealth was 10 times black median wealth in 2016.
When college degree status is taken into account:
• The largest gap was between white college
families and noncollege-graduate black
families, with the white families’ having 35
times more median wealth.
• White college graduate families had about
six times more wealth than their black
counterparts.
• White working class families had nine times
more wealth than their black counterparts.
Figure 9 shows dramatic divergence of medi-
an wealth levels across race and ethnicity among
college graduates, especially between the middle
and late periods. It includes the loss of ground in
Hispanic and black median wealth due to the Great
Recession and rapidly rising median wealth for
white college graduate families.
As was true for income, the pattern across
Figure 9: Median Net Worth Relative to Population Median, College Graduate Families
2010-20162001-20071989-19980
100
200
300
400
500
Hispanic BlackWhite
Perc
ent

12 Federal Reserve Bank of St. Louis
race and ethnicity in median wealth holdings of
working class families tells a different story from
that of college graduates. (See Figure 10.) Hispanic
median wealth grew slightly faster than the population
median over the sample period, while white
median family wealth lost ground relative to the
population median. Median wealth levels across
race and ethnicity were a bit closer together in
the late period than in the early period.
Shares of total income and wealth. As previ-
ously shown in Figure 4, white college graduates’
share of income increased from 41 percent in
1989 to 53 percent in 2016, despite their increase
in population share of only 6 percentage points.
At the same time, working class whites’ decline in
total income share, from 45 to 27 percent, exceed-
ed even their population-share decline, reflecting
substantially sharper declines in average incomes
than in the population as a whole. Collectively, all
nonwhite groups earned 14 percent of all income
in 1989, rising to 20 percent in 2016.
The decline in share of total wealth owned by
working class whites is even more stunning than
their falling income share:
• In 1989, working class whites and white college
graduates owned nearly the same share of all
wealth—45 percent and 46 percent, respectively.
• By 2016, white college graduate families’ share
of all wealth was three times that of working
class white families—67 percent to 22 percent,
respectively. (See Figure 5.)
Most other groups (not shown in figures)
experienced little change—between 0.1 and 1.4
percentage points—in their shares of total wealth.
As with income, these shares each remained under
5 percent. Collectively, nonwhite families owned
9 percent of all wealth in 1989, with the percentage
rising to 11 percent in 2016.
Nonfinancial measures’ similar patterns. With few exceptions, trends in the nonfinancial
measures of well-being we tracked mimicked those
for income and wealth. Table 3 summarizes three
nonfinancial measures of well-being by race and
ethnicity among college graduates.
Figure 10: Median Net Worth Relative to Population Median, Noncollege-Graduate Families
Table 3: Other Indicators of Well-being, College Graduates Only
1989-1998
2001-2007
2010-2016
Change between
early and late periods
(% points)
Net im-provement vs. white college
graduates?
Homeownership rate (percent)
White 74.5 81.8 80.4 5.9 N/A
Black 61.0 69.4 59.9 -1.0 No
Hispanic 56.6 65.7 56.5 -0.1 No
Other 54.8 64.7 64.6 9.8 Yes
Marriage or cohabitation rate (percent)
White 66.3 69.1 66.4 0.1 N/A
Black 46.6 44.7 36.7 -9.9 No
Hispanic 57.0 67.8 49.3 -7.7 No
Other 67.4 72.1 68.8 1.4 Yes
Healthy share (percent)
White 89.6 89.6 87.2 -2.4 N/A
Black 88.8 86.2 81.2 -7.7 No
Hispanic 80.1 80.7 85.5 5.4 Yes
Other 88.5 85.4 84.4 -4.1 No
NOTES FOR TABLES 3 AND 4: The 10 individual SCF waves were combined into three time periods to reduce the effect of sampling variability and to better observe long-term trends. See the appendix for details. Numbers have been rounded. The differences in values noted in the “Change” column were calculated before rounding.
The sources for all the tables and figures are the Federal Reserve’s Survey of Consumer Finances and authors’ calculations.
2010-20162001-20071989-1998
Hispanic BlackWhite
0
20
40
60
80
100
120
Perc
ent

13 Federal Reserve Bank of St. Louis
Homeowners as a share of white college gradu-
ate families increased by almost 6 percentage points
between the early and late periods. Their marriage
rate remained steady and the share of white college
graduate families reporting good or excellent health
declined slightly but remained the highest level
reported by any group.
Among black and Hispanic college graduates,
homeownership and marriage rates declined.
Trends were generally more favorable among
other-race college graduates. Self-reported good
or excellent health decreased among black college
graduates, although not among Hispanics.
Table 4 summarizes the three nonfinancial
measures of well-being by race and ethnicity
among families without college degrees. Among
working class families, whites slipped on all three
measures. Black and Hispanic working class
metrics generally improved. Even though the
marriage rate slipped among Hispanic working
class families, it declined less than it did among
white working class families and it remained
higher than the white rate. Trends generally were
poor among other-race working class families.
III. Why Is the White Working Class in Decline?
Until recently, the white working class arguably
constituted the economic and political backbone
of the country.13 Today, the white working class is
greatly diminished. Alone among major socio-
economic groups defined by race, ethnicity and
college degree status, the white working class
shrank not only as a share of the population
but even in absolute numbers over the past two
decades. Their long-term economic and financial
declines are even steeper.
To gauge whether the decline of the white
working class has been driven primarily by factors
associated with race or education, we compared
the group first to white college graduate families
and then to working classes of other races and
ethnicities. We conclude that neither race nor
education in isolation is sufficient to explain
the trends we have documented.
Comparison with white college graduate families. If race—more specifically, being non-
Hispanic white—is the key demographic factor
behind the decline of the white working class, we
Table 4: Other Indicators of Well-being, Working Class Only
1989-1998
2001-2007
2010-2016
Change between early and
late periods(% points)
Net im-provement vs. white working class?
Homeownership rate (percent)
White 69.4 71.6 69.2 -0.2 N/A
Black 41.0 44.3 41.1 0.0 Yes
Hispanic 40.8 45.0 43.6 2.8 Yes
Other 53.1 52.2 50.5 -2.6 No
Marriage or cohabitation rate (percent)
White 59.5 58.0 57.3 -2.3 N/A
Black 32.1 36.2 37.5 5.4 Yes
Hispanic 65.2 65.9 63.4 -1.8 Yes
Other 56.4 59.4 56.0 -0.5 Yes
Healthy share (percent)
White 73.4 70.4 67.5 -5.9 N/A
Black 62.6 66.1 64.4 1.7 Yes
Hispanic 66.6 66.2 69.0 2.3 Yes
Other 68.0 68.2 59.3 -8.6 No
would expect to see similar, if not identical, patterns in
the group of white college graduate families over time.
In fact, trends in the two groups are better
described as mirror images of each other than par-
allel developments, as we documented in Section II.
Thus, factors related to race alone do not appear
to be a compelling explanation. Diverging trends
between white working class and white college
graduate families are clear in all of the following
indicators; in each case, we compare the early
(1989-98) to the late period (2010-16) in our sample:14
• The white working class’s median family income
declined from 91 to 87 percent of the overall me-
dian income, while the white college graduates’
median family income increased from 181 to 193
percent. (See Figures 8 and 7, respectively.)
• The white working class’s median family wealth
declined from 110 to 99 percent of the overall popu-
lation median wealth, while the white college grad-
uates’ median family wealth increased from 255 to
414 percent. (See Figures 10 and 9, respectively.)
• White working class homeownership and mar-
riage rates, as well as self-reported health metrics,
all declined while trends in all three measures were
more favorable among white college graduates.
(See Tables 4 and 3, respectively.)

14 Federal Reserve Bank of St. Louis
Comparison with working class families of other races and ethnicities. If an increasing pre-
mium associated with a four-year college degree is
the primary factor contributing to the decline of the
white working class, we would expect the working
classes of other races and ethnicities to demon-
strate similar trends. As with race, we find that class,
as defined by college degree status, also is inade-
quate by itself to explain the declines experienced
by the white working class.
Trends visible among the white working class
differ noticeably from those evident among the
Hispanic working class and the black working class.
Thus, broad economic changes related to four-year
college degree status alone do not appear sufficient
to explain the decline of the white working class.
As before, we compare the early (1989-98) to the
late period (2010-16) in our sample to document
the contrast between the declines and the increases
in the white working class measures of well-being
and the increases for Hispanic and black working
class families:15
• Median income rose by 3 percentage points to
67 percent of the population median for Hispanic
working class families, and by 12 percentage points
to 58 percent for black working class families, while
the white measure declined from 91 to 87 percent.
(See Figure 8.)
• Hispanic working class median wealth increased
from 13 to 17 percent of the population median,
and the black working class’s median wealth held
steady at about 12 percent, while the white mea-
sure declined from 110 to 99 percent.
(See Figure 10.)
• Among working class families, all nonfinancial
metrics improved for black and Hispanic families
except for the Hispanic marriage rate, while all
three metrics for the white and other-race working
classes deteriorated. (See Table 4.)
Conclusions from cross-education and cross-race/ethnicity comparisons. Evidence
from all of the indicators we considered in this
essay casts doubt on factors related either to race
or education alone as singular explanations for the
decline of the white working class. White college
graduate families are doing very well, suggesting
that a “white disadvantage” or “reverse discrimination”
theory is not a plausible explanation.
As for education or class as an explanation,
Hispanic and black working classes, while still
clearly disadvantaged in many respects, are making
broad-based progress over time, while the white
working class has slipped. Thus, the economic
disadvantages associated with not having a four-
year college degree—while clearly present—do not
appear solely responsible for the deterioration in
well-being for the white working class.
A more plausible set of explanations combines
race and education; that is, the group’s unusual
outcomes may be the result of circumstances
unique to the white working class.
It is possible that the loss over time of advantages
enjoyed by members of the white working class
over Hispanic and black working class families may
be contributing to their relative decline. While not
conclusive, developments that may have adversely
affected the white working class (through the less-
ening of previous advantage) include:
• Rising high school graduation rates and
postsecondary school attendance among blacks
and especially Hispanics, decreasing racial and
ethnic education gaps and increasing competition
for low- and medium-skill jobs;16
• Structural changes in the economy,
including globalization, the China trade
shock, de-industrialization and technological
advancement, which may have disproportion-
ately reduced job opportunities in white working
class communities;17
• Increased enforcement of antidiscrimination laws
and the declining significance of explicit racial and
ethnic discrimination in the labor market.18
These changes, together with ongoing trends
in the labor market favoring workers with college-
level skills, suggest mechanisms that could explain
weak income and wealth growth among the white
working class. As incomes and wealth stagnated,
other socioeconomic indicators (homeownership,
marriage or cohabitation, and health) also may
have deteriorated.

15 Federal Reserve Bank of St. Louis
IV. Summary and Conclusions
This essay documented the changing income
and wealth of American families since 1989 along
racial and ethnic lines, as well as by college degree
status. We paid particular attention to the decline of
the white working class, which remains the single
largest socioeconomic group in the U.S. by far.
There is evidence of racial and ethnic con-
vergence at the broadest level across a range of
indicators. Moreover, whites declined as a share of
all families between 1989 and 2016, while all other
major groups increased. Nonetheless, the share of
all income earned and wealth owned by white fam-
ilies became even more disproportionate, and other
key socioeconomic indicators generally remained
more favorable for whites than for other groups.
We showed that the convergence seen across
racial and ethnic lines on many indicators is due
entirely to trends among noncollege graduates,
who made up two-thirds of all families in 2016.
We suggested that nonwhite families’ starting to
“catch up” to whites’ economic standing and levels
of socioeconomic well-being may be related to
adverse developments within the white working class.
This group’s vital indicators have declined
relative both to white families with college degrees
and to nonwhite working class families. We suggest
that the long-term decline of the white working
class may be due, in part, to the reduction over time
of their previous advantages over nonwhite work-
ing classes. Rising Hispanic and black high school
graduation rates, structural changes in the economy
impacting white working class communities and
the decline of explicit racial discrimination in the
workplace all may have increased competition for
jobs traditionally held by members of the white
working class. Corroborating evidence from several
nonfinancial indicators of well-being testifies to the
distress being experienced by many members of
the white working class.

16 Federal Reserve Bank of St. Louis
To increase the cell sizes of very small groups
(e.g., Hispanic college graduates) and to make
long-term trends easier to see, we grouped the
10 SCF waves into three periods:
• 1989, 1992, 1995 and 1998, which we term the early
period (15,653 families);
• 2001, 2004 and 2007, which we term the middle
period (13,378 families); and
• 2010, 2013 and 2016, which we term the late period
(18,745 families).
This grouping method was used for Tables 2-4
and Figures 2 and 7-10.
Our aim was to preserve the population repre-
sentativeness of the individual survey waves while
combining observations on income and wealth
from different years. To do so, we first transformed
each family’s income and wealth into standardized
measures for that survey year (i.e., the ratio of actual
income or wealth to median or mean income or
wealth in that year).
Then we calculated medians and means of
standardized income and wealth for groups in a
particular period (early, middle or late). The statistical
representativeness of the individual survey waves
would be lost without that standardization before
the observations are pooled into multiyear groups.
All SCF data are expressed in dollars of constant
purchasing power using the Consumer Price Index
for All Urban Consumers Research Series so infla-
tion does not affect pooling across different years.
For homeownership rates, marriage or co-
habitation rates, self-assessed health status, and
income and wealth shares, we simply pooled the
individual year observations into periods. We did
not standardize them first because the sample
weights were representative of the population in
each SCF year and contiguous surveys were of
approximately the same size.
We calculated standardized income and net
worth as follows:
where Oi,y
is observation i in year y; and Xy is
the median in year y being standardized. We used
the standardization for white median income and
net worth (Figure 2), population median income
(Figures 7 and 8), and population median net worth
(Figures 9 and 10). Period medians for each group
(race/ethnicity and education) are then calculated
on these standardized statistics.
This approach yields estimates that are within
3 percentage points of estimates using a non-
standardized approach. We believe our approach
is more accurate because it allows for trends across
individual years to be taken into account while still
combining results into three periods, so that long-
term patterns are clear. When these figures are
mentioned in the text, the numbers refer to
the standardized estimates.
AppendixGrouping and Standardization of the Data
Oi,y
Xy

17 Federal Reserve Bank of St. Louis
Endnotes
1 Scholars typically define class by education, oc-
cupation, income, self-identification, aspirations
and/or other criteria. Because education level is
established in early adulthood and remains fixed
thereafter for most people, we use only educa-
tion here. See Abramowitz and Teixeira (2009).
2 An internet search of the term “white working
class” brings up hundreds of recent books and
articles on the topic.
3 Our main discussion follows white, black and
Hispanic families. We also report on the other-
race group when its outcomes are of particular
interest.
4 Other important demographic dimensions we
do not discuss in this essay, but which may be
important, are age and the closely related but
distinct concept of birth year, or generation.
See Emmons, Kent and Ricketts (May 2018a).
5 The “other” category includes Asians, American
Indians, Alaska Natives, Native Hawaiians, Pacific
Islanders, other races and respondents who report
more than one racial identification. Because
of confidentiality concerns, responses for all of
these groups are combined, and further disag-
gregation by race and ethnicity is unavailable.
Classification is based on respondents’ self-
reported identification. All population figures
cited in this essay refer to families, not individ-
uals. Because average family sizes differ across
race and ethnicity, population shares by family
are different from shares of individuals. Totals
may not equal 100 percent because of rounding.
6 See Sidebar 1 for the definitions of income and
wealth in the SCF. Median income (net worth)
is the income (net worth) earned (owned) by
the family exactly in the middle of its distribu-
tion. Using the median reduces the influence of
extreme observations and sampling variability,
which is discussed in Sidebar 2.
7 To make longer-term trends easier to see and
to reduce the effect of sampling variability, we
combined the 10 individual SCF waves into three
periods for some of our analysis. See the appen-
dix for details.
8 See Emmons and Noeth (2015a).
9 The SCF asks respondents to rate their own
health on a five-point scale. We grouped the
two highest responses—“good” and “excellent”—
to form an indicator of good health. Self-reported
health status is a strong predictor of objective
health status and various health outcomes, in-
cluding mortality. See Mossey and Shapiro (1982).
10 In this section, we discuss only white, black and
Hispanic families, except when trends in other-
race families are of particular interest. The
other-race group of families is relatively small
and heterogeneous, so the data are noisy and
somewhat difficult to interpret. In general, levels
and trends for other-race families are more
similar to those of whites with the same edu-
cation level than to those of similarly educated
black or Hispanic families.
11 See Emmons and Noeth (2015b) and Emmons
and Ricketts (2017) for extensive discussions of
income and wealth trends among Hispanic
and black college graduates. Hispanic and black
college graduate families have earned lower
incomes than whites with the same level of edu-
cation and on average they suffered large wealth
losses during and after the Great Recession.
12 See Emmons, Kent and Ricketts (February and
May 2018a).
13 See Draut (2016).
14 All of these comparisons are based on the
standardized data described in the appendix.
15 Again, these comparisons are based on the
standardized data described in the appendix.
16 See National Center for Education Statistics
(2017).
17 See Autor, Dorn, Hanson and Majlesi (2017),
and Autor, Dorn and Hanson (2017).
18 See Fryer (2011). Tables 1 and 2 show regressions
of wages and unemployment on race, age and
an assessment of skills for the 1979 and 1997
National Longitudinal Survey of Youth cohorts.
The labor market outcomes were observed in
2006. A comparison of the coefficients related to
race suggests that the potential effect of dis-
crimination had declined for the 1997 cohort
relative to the 1979 cohort. Assuming that explicit
discrimination in the workplace didn’t increase
for minority workers since 2006, this generally
supports the suggestion that explicit discrimina-
tion declined between 1989 and 2016.
The Demographics of Wealth 17

18 Federal Reserve Bank of St. Louis
References
Abramowitz, Alan; and Teixeira, Ruy. “The Decline
of the White Working Class and the Rise of a Mass
Upper-Middle Class.” Political Science Quarterly,
Fall 2009, Vol. 124, No. 3, pp. 391-422.
Autor, David; Dorn, David; and Hanson, Gordon.
“When Work Disappears: Manufacturing Decline
and the Falling Marriage-Market Value of Young
Men.” NBER Working Paper No. 23173,
February 2017.
Autor, David; Dorn, David; Hanson, Gordon; and
Majlesi, Kaveh. “Importing Political Polarization?
The Electoral Consequences of Rising Trade
Exposure.” NBER Working Paper No. 22637,
December 2017.
Draut, Tamara. “Sleeping Giant: The Untapped
Economic and Political Power of America’s New
Working Class.” New York: Anchor, 2016.
Emmons, William R.; Kent, Ana H.; and Ricketts,
Lowell R. “The Financial Returns from College
across Generations: Large but Unequal.” The
Demographics of Wealth 2018 Series, Federal
Reserve Bank of St. Louis, February 2018,
Essay No. 1.
Emmons, William R.; Kent, Ana H.; and Ricketts,
Lowell R. “A Lost Generation? Long-Lasting
Wealth Impacts of the Great Recession on Young
Families.” The Demographics of Wealth 2018
Series, Federal Reserve Bank of St. Louis,
May 2018a, Essay No. 2.
Emmons, William R.; Kent, Ana H.; and Ricketts,
Lowell R. “Is College Still Worth It? The New
Calculus of Falling Returns.” Conference
presentation, Federal Reserve Bank of St. Louis,
May 2018b, https://www.stlouisfed.org/~/media/Files/PDFs/HFS/Is-College-Worth-it/Emmons_Symposium.pdf?la=en
Emmons, William R.; and Noeth, Bryan J. “Race,
Ethnicity and Wealth.” The Demographics of
Wealth 2015 Series, Federal Reserve Bank of
St. Louis, February 2015a, Essay No. 1.
Emmons, William R.; and Noeth, Bryan J. “Why
Didn’t Higher Education Protect Hispanic and
Black Wealth?” In the Balance, Federal Reserve
Bank of St. Louis, 2015b, Issue No. 12.
Emmons, William R.; and Ricketts, Lowell R. “College
Is Not Enough: Higher Education Does Not
Eliminate Racial and Ethnic Wealth Gaps.” Review,
Federal Reserve Bank of St. Louis, 2017, Vol. 99,
Issue No. 1.
Fryer, Roland G., Jr. “Racial Inequality in the
21st Century: The Declining Significance of
Discrimination.” Handbook of Labor Economics,
Elsevier, 2011, Vol. 4, pp. 855-971.
Mossey, Jana M.; and Shapiro, Evelyn. “Self-Rated
Health: A Predictor of Mortality among the Elderly.”
American Journal of Public Health, 1982, Vol. 72,
Issue 8, pp. 800-08.
National Center for Education Statistics. Status
and Trends in the Education of Racial and
Ethnic Groups. Indicator 17: High School Status
Completion Rates. July 2017. https://nces.ed.gov/programs/raceindicators/indicator_rdd.asp.

19 Federal Reserve Bank of St. Louis The Demographics of Wealth 19
CreditsEditor: Heather Hennerich
Designer: Sarah Hamilton

All the essays in this series can be read on the website of the Center for Household Financial
Stability at www.stlouisfed.org/hfs.