the city of pleasanton
TRANSCRIPT

THE CITY OF PLEASANTON
LOCAL GOVERNMENT AND LAND USE PLANNING DAY
PRESENTED TO:
LEADERSHIP PLEASANTON
October 2, 2013


TABLE OF CONTENTS
About Pleasanton ............................................................................................................ 1
City of Pleasanton Organization Chart ............................................................................ 8
Comparative Information ................................................................................................. 9
History of Full-Time City Staffing ................................................................................... 10
Your Property Tax ......................................................................................................... 11
Sample Property Tax for Average Home ....................................................................... 11
Operating Budget Fund Summary ................................................................................. 12
Historical Changes in Major General Fund Revenue Sources ...................................... 13
Sales Tax Revenues by Major Categories .................................................................... 14
Sales Tax Revenues by Geographic Area .................................................................... 15
2013/14FY Operating Budget Revenues by Fund ......................................................... 16
2013/14FY General Fund Budget Revenues by Major Revenue Sources .................... 17
2013/14FY General Fund Budget Expenditures by Type .............................................. 18
2013/14FY General Fund Budget Expenditures by Department ................................... 19
CIP Expenditures by Category 2013/14FY .................................................................... 20
Overview of Revenue and Expenditure Trends ............................................................. 21
Losses to State/County ................................................................................................. 22
History of General Fund Revenue ................................................................................. 23
Historical Financial Trends ............................................................................................ 24
Debt Summary .............................................................................................................. 32
General Financial Policies ............................................................................................. 33
Fee Policy ..................................................................................................................... 37
Investment Policy and Guidelines ................................................................................. 45

This page intentionally left blank

1
About Pleasanton… HISTORICAL OVERVIEW The area that grew to be the City of Pleasanton played a significant role in California history – as a Native American settlement and later a Spanish settlement during the Mission period – a growing crossroads during the Gold Rush and railroad development eras – and in the agricultural and filmmaking industries. The City’s environs were settled 4,000 years ago by the Ohlone Indians and became a thriving agricultural area when the Spanish arrived in the 1770’s. Located along the first Transcontinental railway, the area was known as Alisal in the 1850’s when it served as a main mercantile stopover during the Gold Rush era and also enjoyed the nickname, “The Most Desperate Town in the West,” due to a proliferation of bandits who ambushed unsuspecting gold miners returning with their riches. Rolling grasslands were dotted with cattle and the area was home to the largest hops crop in the United States. The town was also home to a 500-acre ranch purchased in the 1880s by George and Phoebe Apperson Hearst. Pleasanton was incorporated in 1894 and named for Major General Alfred Pleasonton of the Union Army. A typographical error by the U.S. Post Office is believed to be responsible for the current spelling of the City’s name. Pleasanton enjoys a strong equestrian heritage as home to the nation’s oldest one mile race track. Located at the Alameda County Fairgrounds, the Pleasanton Race Track has seen 150 years of horse racing. The City also enjoyed brief celebrity as “Hollywood of the North”, after serving as the location for the 1917 film, Rebecca of Sunnybrook Farm. LOCATION & TOPOGRAPHY Located in northeastern Alameda County, in the Tri-Valley area, Pleasanton is situated 335 feet above sea level and is centrally located less than an hour from major commercial and recreational areas throughout the Bay Area, including San Francisco, Oakland, San Jose-Santa Clara County and Silicon Valley. Just over an hour’s drive away, residents can enjoy the Pacific Ocean to the west or a day of boating in San Joaquin Delta to the east.

2
The City is home to the Alameda County Fairgrounds, championship golf courses, lush hilly East Bay Regional Parks, and the Arroyo Mocho waterway. The eastern boundaries of the City give way to the vineyards of the Livermore Valley Wine Country. WEATHER Pleasanton enjoys a relatively mild climate, with an average rainfall of 15 inches and average maximum temperature of 89º Fahrenheit in July and average minimum temperature of 37º in December. At its most extreme, winter temperatures can drop below freezing a few days each year, and summer temperatures hover around 100 degrees Fahrenheit during July and August. The temperate weather allows residents year-round opportunities to take advantage of outdoor activities such as hiking the Pleasanton Ridge, cycling along trails and roadways, shopping in the historic downtown district and patio dining at many fine restaurants. INFRASTRUCTURE A major advantage of Pleasanton’s East Bay location is its proximity to the 580/680 Highway interchange, immediate accessibility to two commute train systems, the Bay Area Rapid Transit (BART) system and the Altamont Commuter Express (ACE) train, and easy access to three international and one regional airports. Highways The 580/680 interchange at the northern boundary of the City allows quick and easy access north, south, east and west to major Bay Area destinations such as San Francisco, the Peninsula, Stanford University, Silicon Valley, University of California, Berkeley and Oakland. Public Transit The WHEELS bus system allows inner-city travel in Pleasanton and intra-city travel between the Tri-Valley cities of Pleasanton, Livermore and Dublin. The Bay Area Rapid Transit system links Pleasanton to locations throughout the Bay Area via an existing BART station on Owens Drive, and a second BART station adjacent to the Stoneridge Shopping Center. With trains running morning and evening, the ACE train connects the San Joaquin Valley with the Silicon Valley, with Pleasanton a primary stop for employees working in Pleasanton and residents working in Silicon Valley. Airports With three international airports within a 50-mile range, residents rarely have a difficult time traveling out of the area. Mineta San Jose International Airport is located 25 miles south of Pleasanton; Oakland International Airport is 23 miles west of Pleasanton; and San Francisco International Airport lies 41 miles to the northwest.

3
The Livermore Municipal Airport (LVK) lies 5 miles east of Pleasanton and serves business and residential customers and tenants throughout the Tri-Valley. Operating around the clock, the airport is a designated General Aviation Reliever Airport for the three international airports noted. POPULATION
CITY OF PLEASANTON
Year Population Pleasanton Jobs
1898 900 N/A 1960 4,203 N/A 1970 18,328 N/A 1980 35,160 N/A 1990 50,553 27,686 99/00 63,654 54,863 00/01 65,181 58,931 01/02 65,982 57,803 02/03 66,809 56,950 03/04 67,036 57,997 04/05 67,292 58,670 05/06 67,728 57,677 06/07 68,567 58,874 07/08 69,388 53,873 08/09 09/10 10/11
70,045 70,285 70,534
52,257 51,374 52,401
11/12* 71,176 52,925 12/13* 71,871 53,454
*Projected Sources: California Department of Finance (Demographic Research Unit), California Economic Development Department and “Projections” ABAG
In the 1960’s, Pleasanton’s rural character underwent unprecedented growth, joining other burgeoning Bay Area cities, and its scant population of 4,203 in 1960 exploded to over 35,000 residents in 1980. By the mid-1980’s, Pleasanton was the third fastest growing city in California. Realizing such growth would change the face of the City forever, community leaders sought to manage development by adopting the moniker, “City of Planned Progress,” and worked to ensure that infrastructure planning met residential and commercial needs while retaining the area’s historical flavor and heritage. Pleasanton is currently home to more than 70,000 residents. A large number of Pleasanton’s residents are young families drawn to the superior elementary and secondary school system. As Pleasanton grows, its population is diversifying. Currently, there are many cultural and recreational programs for all ages and interests. Local churches, the Pleasanton Public Library and the Pleasanton Unified School District have all implemented programs to celebrate ethnic and cultural diversity.

4
Property values remain relatively stable due to the exceptional quality of life here, which includes a low crime rate, moderate climate, award-winning schools, well-planned business areas, abundant parks, numerous recreational areas and a charming historic downtown. COMMERCIAL AND BUSINESS
TOP EMPLOYERS IN 2012
Pleasanton companies positively impact the City’s financial health with over 60% of Pleasanton’s General Fund tax revenues coming directly or indirectly from business. This revenue helps pay for police and fire services, public works operations, and community services activities. Pleasanton’s business community is noted for its productivity and progressiveness. There are over 52,000 employees working within the more than 22 million square feet of commercial, office, and industrial space throughout the City. Pleasanton boasts five distinct business parks, among them the nationally recognized Hacienda Business Park. Businesses indicate they are attracted to Pleasanton for the highly educated and skilled
EMPLOYERNumber of Employees
Year Established
Kaiser Permanente 3,974 1983
Safeway* 3,225 1996
Workday Inc.* 1,699 2009
Oracle 1,479 2005
Pleasanton Unified School District* 1,272
Valley Care Medical Center 1,075 1991
Clorox Service Company 900 1973
Macy's 832 1980
Ross Dress for Less Inc.* 699 2004
State Fund - Compensation Insurance 650 2007
E M C Corporation 507 2004
Hendrick Automotive 478 1998
City of Pleasanton* 452
Roche Molecular Systems Inc.* 452 1998
Thoratec Corporation* 421 1999
Blackhawk Network* 414 2005
Nordstrom 307 1990
Ellie Mae* 300 2000
Walmart 289 1995
J C Penny Co. 265 1990* Headquarters

5
workforce. In addition to the diversified regional labor force, the Pleasanton area has a good base of executive, managerial and professionals with a wide range of skill levels including one of the nation's largest concentrations of scientific and engineering talent. CITY SERVICES Community Services The Community Services Department offers a broad array of indoor and outdoor activities, classes, services, theatrical productions and facilities for all ages through its Recreation, Civic Arts, Human Services, Landscape Architecture and Administration divisions. The City of Pleasanton Activities Guide, which can be accessed on the internet at http://www.cityofpleasantonca.gov, informs residents and visitors of the array of activities, camps and classes available. Callippe Preserve Golf Course Recently named one of the top public courses in the nation, Callippe Preserve provides golfers a challenging 18-hole course, driving range and clubhouse with indoor and outdoor seating. Facility Rentals For those planning a wedding reception, birthday party, meeting, sports tournament, or other event, the City rents several facilities to meet the community’s needs such as gymnasiums, softball fields, the Senior Center, the Amador Theater, the renovated Veterans’ Hall, Callippe Golf Course and the state-of-the-art Firehouse Art Center. Gingerbread Preschool The educational and social experiences at the Gingerbread Preschool gives 2-5 year-old children a great head start before they enter Pleasanton’s nationally recognized K-12 public school system. Parks, Trails and Open Space With several East Bay Regional Parks within a ten mile radius, there is ample opportunity to enjoy the natural wonders of the Tri-Valley. Within the City limits are 40 parks with great amenities, miles of trails including a newly dedicated segment of the Iron Horse Trail and numerous acres of open space. The Alviso Adobe Community Park provides visitors with an opportunity to look into Pleasanton’s past. Paratransit The City is pleased to offer transportation service for Pleasanton seniors (age 60 and up) and ADA-qualified persons of any age.

6
Seniors The Pleasanton Senior Center offers classes and social opportunities such as day trips, on-site activities, transportation, supporting services and vital information for its senior residents. The City also offers scholarships/limited financial assistance to qualified seniors to participate in various activities. Recreational Activities for the Developmentally Disabled The City’s RADD program offers recreational activities and events designed for developmentally disabled members of the community, ages 15 and up. Sports The City of Pleasanton and local sports clubs offer soccer, baseball, basketball, football, tennis, lacrosse, softball, golf, roller hockey, volleyball, bocce and badminton. In addition, Pleasanton features the largest active sports park in northern California, a public swimming complex with four pools, a regional park with facilities for boating, fishing and swimming, two skateboard parks, two City-owned theaters for live performances, state-of-the-art basketball facilities built jointly by the City and the Pleasanton Unified School District at all middle schools and vast open space parks connected throughout with miles of trail for horseback riding, walking, bicycling. Youth Services Several departments offer wide ranging activities and services to the community’s youth, such as Mini-Sports for children as young as 3, or serving as an appointed City Commissioner on the Youth Commission (open to middle and high school students). The City also offers scholarships/limited financial assistance to qualified youth to participate in various activities. SCHOOL DISTRICT The Pleasanton Unified School District employs over 1,000 employees to serve 14,700 students in nine elementary schools, three middle schools, two comprehensive high schools, and two alternative schools. There are a variety of excellent private schools in the Tri-Valley as well. Expansion Management Magazine identified the Pleasanton Unified School District as a "Gold Medal" district in its 1997 Education Quotient. Since then, 13 of the schools have been recognized as California Distinguished Schools; seven are designated as National Blue Ribbon Schools; and three are recognized National Schools of Character. Pleasanton's continuation high school, Village High School, received the State Department of Education's "California Model School Award." Pleasanton’s Bay Area location allows for easy access to a range of two- and four-year colleges and universities, most within an hour’s drive. These include the University of California at Berkeley, Stanford University, California State University East Bay, St. Mary's College, the recently opened University of San Francisco Pleasanton

7
campus, Mills College, Las Positas College and Chabot College. The University of California extension has classes offered in Pleasanton and San Ramon. COMMUNITY OF CHARACTER The City of Pleasanton, in partnership with the Pleasanton Unified School District and the Pleasanton Chamber of Commerce, adopted six character traits that they pledge to model and advance in the community: Responsibility, Compassion, Self-Discipline, Honesty, Respect and Integrity. Pleasanton boasts a citizenry that is committed to maintaining the standards that make the city a wonderful place to live, to raise a family, to work and to play. By embracing these character traits, the community seeks to expand character development efforts by reinforcing those values which foster strong individuals, families and neighborhoods. These character traits are woven throughout the structures and processes of the school curriculum as well as the City’s organizational culture. Additionally, as an outward example and a reminder to the community, each characteristic receives special attention during a designated month during which banners displaying the highlighted value are placed at City and schools facilities.

8
2012/13FY ORGANIZATION CHART
CITIZENS
CITY COUNCIL
CITY MANAGER
ADMINISTRATIVE SERVICES
DEPARTMENT
FIRE DEPARTMENT
COMMUNITY DEVELOPMENT DEPARTMENT
LIBRARY SERVICES
DEPARTMENT
COMMUNITY SERVICES
DEPARTMENT
OPERATIONS SERVICES
DEPARTMENT
ECONOMIC DEVELOPMENT DEPARTMENT
FINANCE DEPARTMENT
POLICE DEPARTMENT
CITY ATTORNEY
BICYCLE, PEDESTRIAN & TRAILS COMMITTEE
CIVIC ARTS COMMISSION
COMMITTEE ON ENERGY & ENVIRONMENT
ECONOMIC VITALITY COMMITTEE
HOUSING COMMISSION
HUMAN SERVICES COMMISSION
LIBRARY COMMISSION
PARKS & RECREATION COMMISSION
PLANNING COMMISSION
YOUTH COMMISSION
YOUTH MASTER PLAN OVERSIGHT COMMITTEE

9
CITY OF PLEASANTON COMPARATIVE INFORMATION
ACTUAL ACTUAL ACTUAL ADJUSTED PROJECTED
2009/10 2010/11 2011/12 2012/13 2013/14
(1) Population (calendar year) 70,285 70,537 71,176 71,871 72,230
Percentage Change 1.02% 1.02% 0.91% 0.98% 0.50%
General Fund Staffing 392.02 373.81 361.90 361.73 363.23
Percentage Change -3.70% -4.65% -3.19% -0.05% 0.41%
Staffing per 1 ,000 Capi ta 6 6 5 5 5
Percentage Change 0.00% 0.00% -15.00% -1.96% 0.00%
General Fund Revenue $84,668,134 $87,832,845 $89,817,106 $91,284,523 $92,414,679
Percentage Change -5.86% 3.74% 2.26% 1.63% 1.24%
Revenue Per Capi ta $1,205 $1,245 $1,262 $1,270 $1,279
Percentage Change -6.03% 3.37% 1.34% 0.65% 0.73%
Net Assessed Value $17,288,705,467 $16,972,068,674 $16,743,623,805 $17,031,993,627 $17,184,318,305
Percentage Change -0.48% -1.83% -1.35% 1.72% 0.89%
(2) Jobs (calendar year) 51,374 52,401 52,925 53,454 53,989
Percentage Change -1.69% 2.00% 1.00% 1.00% 1.00%
Ci ty Square Mi les 23.9 24.2 24.2 24.2 24.2
Acres o f Developed
Parks Main ta ined 397.0 397.0 397.0 397.0 397.0
Mi les o f C i ty Streets 215 216 216 216 217
Housing Uni ts (calendar year) 25,982 26,053 26,069 26,117 26,191
(3) Median Household
Incom e (Fam i ly o f 4) $109,000 $111,180 $113,404 $118,713 $121,087
Prop 4 L im i t $384,141,392 $378,502,427 $391,068,060 $410,031,764 $484,380,003
Revenue Subject to
The Prop 4 L im i t $68,101,459 $67,819,126 $68,823,905 $76,041,399 $77,532,600
(1) CA Dept of Finance(Demographic Research Unit)
(2) CA Economic Development Dept.
(3) Based on Census Income Data as of 2010

10
CITY OF PLEASANTON HISTORY OF FULL-TIME CITY STAFFING
ACTUAL ACTUAL ACTUAL ACTUAL ACTUAL ACTUAL ACTUAL ACTUAL PROJECTED
2005-06 2006-07 2007-08 2008-09 2009-10 2010-2011 2011-12 2012-13 2013-14
GENERAL FUNDGENERAL GOVERNMENT
City Manager 4.00 4.00 4.50 4.50 4.50 5.00 5.00 5.00 5.00Law 3.50 3.50 3.50 4.00 4.00 4.00 4.00 4.00 4.00Finance 15.43 16.23 16.03 16.75 15.57 14.61 11.80 11.80 11.80Administrative Services:
Administration 0.35 0.50 0.50 0.50 0.75 0.75 0.65 0.65 0.65Human Resources 5.50 5.25 5.25 5.25 5.00 4.00 4.00 4.00 4.00City Clerk 5.75 5.75 5.75 5.50 5.50 4.75 4.75 4.75 4.75Information Technologies 8.80 8.80 8.80 8.80 8.80 7.80 7.70 7.07 7.07
Human Resources (HR) moved to Admin ServicesGeneral Services moved to Admin Services
PUBLIC SAFETYFire (LPFD - Pleasanton only) 65.44 66.14 65.42 65.38 64.50 64.50 61.50 61.75 61.25Police 120.00 121.00 121.00 121.00 119.00 115.00 112.00 113.00 114.00
COMMUNITY DEVELOPMENTAdministration moved from Public Works 4.00 3.00 3.00 3.00 3.00 3.00Building & Safety moved from Public Works 13.00 12.00 11.50 11.00 9.00 9.00Permit Center moved from Bldg & Safety Division 2.00 2.00Planning 14.00 14.00 15.00 12.80 11.00 10.50 10.00 10.00 10.00Engineering and Inspection moved from Public Works 23.00 19.00 19.00 18.00 18.00 18.00Housing Division 1.15 1.25 1.25 1.25 1.25 1.25 1.35 1.35 1.35Economic Development 3.00 3.00 4.00 3.50 3.50 2.50 5.00 5.00 5.00
PUBLIC WORKSAdministration 3.95 3.95 4.95 moved to Community DevelopmentEngineering and Inspection 20.75 20.75 21.75 moved to Community DevelopmentBuilding & Safety 13.00 12.71 13.00 moved to Community DevelopmentField Services Administration 3.50 3.50 2.80 moved to Operations ServicesStreets 20.00 19.00 19.65 moved to Operations ServicesSupport Services 14.00 14.00 13.55 moved to Operations Services
OPERATIONS SERVICESAdministration moved from Community Development 4.00 3.20 3.10 3.10 3.10 3.10Support Services moved from Community Development 12.55 14.40 13.30 13.30 13.30 14.30Streets moved from Community Development 18.65 18.40 14.30 13.30 13.30 12.30Parks moved from Community Activities 31.30 28.30 27.30 27.30
COMMUNITY ACTIVITIESCommunity Services 25.50 25.50 25.50 22.40 21.40 19.90 20.90 21.11 22.11Parks Maintenance 33.00 33.00 33.00 33.00 33.00 moved to Operations ServicesLibrary Services 26.00 26.25 26.75 27.25 24.25 23.75 23.25 23.25 23.25
TOTAL GENERAL FUND 406.62 408.08 411.95 407.08 392.02 373.81 361.90 361.73 363.23Percentage Change 0.9% 0.4% 0.9% -1.2% -3.7% -4.6% -3.2% 0.0% 0.4%
ENTERPRISE FUNDSPARATRANSIT moved from Community Services 4.10 4.10 4.10 3.10 2.89 2.89WATER 22.59 22.79 22.77 22.62 22.57 19.97 19.97 20.47 20.97SEWER 9.16 9.16 8.98 9.66 8.83 8.60 8.60 8.60 9.10STORM DRAIN/URBAN RUNOFF 3.20 3.20 3.10 3.30 3.22 2.97 3.07 3.07 3.07
TOTAL ENTERPRISE FUNDS 34.95 35.15 34.85 39.68 38.72 35.64 34.74 35.03 36.03Percentage Change -0.4% 0.6% -0.9% 13.9% -2.4% -8.0% -2.5% 0.8% 2.9%
TOTAL GENERAL FUND AND ENTERPRISE FUNDS 441.57 443.23 446.80 446.76 430.74 409.45 396.64 396.76 399.26
Percentage Change 0.8% 0.4% 0.8% 0.0% -3.6% -4.9% -3.1% 0.0% 0.6%
LIMITED TERM STAFFINGCity Manager 0.80 0.80Law 0.50 0.50Police 1.00Planning 1.00 1.00 1.00Economic Development 1.00 1.00 1.00Community Development 1.00 1.00 2.00 1.00 1.00Public Works 0.75 0.75Operations Services 1.00 1.00 1.00Community Services 2.00 2.00 1.00Water 0.10 0.10Sewer 0.10 0.10
TOTAL LIMITED TERM 2.75 3.25 2.50 2.00 2.00 3.00 5.00 4.00 1.00

11
YOUR PROPERTY TAX 2013/14FY
SAMPLE 1% PROPERTY TAX FOR 2013/14FY AVERAGE ASSESSED VALUE HOME ($628,700)
Y-T-D through June 2013 Single Family Detached Average Sales Price was $1,064,170 and Median Sales Price was $860,000. (www.bayeast.org) * ERAF Shift – Educational Revenue Augmentation Fund; monies used by State to backfill Prop 98 funding for schools.
$0.16$
0.25
0.24
0.03
0.03
0.01
0.01
0.01
0.00
0.00
0.00
0.00
0.26
$1.00$
Mosquito Abatement
Alameda County Resource Conservation District
Education Revenue Augmentation Fund (ERAF)
TOTAL
Flood Zone 7
County Schools
Bay Area Rapid Transit (BART)
County Flood Control
Bay Area Air Quality
County
City of Pleasanton
Pleasanton Schools
East Bay Regional Park District (EBRPD)
So. County College District
$1,016.02
$1,551.69
$1,502.65
$191.76
$164.73
$82.36
$68.53
$40.11
$13.64
$13.64
$9.12
$1.82
$1,630.91
$6,287.00
Alameda County Resource Conservation District
Education Revenue Augmentation Fund (ERAF)
TOTAL
Flood Zone 7
County Schools
Bay Area Rapid Transit
County Flood Control
Bay Area Air Quality
City of Pleasanton
Pleasanton Schools
East Bay Regional Park
So. County College District
Mosquito Abatement
County

12
A summary from the Operating Budget and Capital Improvement Program 2012/13FY and 2013/14FY Operating Budget by fund type is provided below:
REVENUES & TRANSFERS IN BY FUND TYPE
EXPENDITURES & TRANSFERS OUT BY FUND TYPE
Adjus ted Projected2012/13 2013/14
General Fund $91,344,264 $93,314,633
Enterprise Funds 34,933,309 36,807,975
Internal Service Funds 25,742,377 29,594,893
Special Revenue Funds 4,036,853 2,033,935
Debt Service & Trust Funds 22,823,396 386,073
Total Revenue & Transfers In $178,880,199 $162,137,509
Adjus ted Projected2012/13 2013/14
General Fund $91,344,264 $93,314,633
Enterprise Funds 36,403,682 36,682,129
Internal Service Funds 36,917,819 32,439,423
Special Revenue Funds 10,736,218 1,780,422
Debt Service & Trust Funds 2,004,965 418,687
Total Expenditures & Transfers Out $177,406,948 $164,635,294

13
CITY OF PLEASANTON HISTORICAL CHANGES IN
MAJOR GENERAL FUND REVENUE SOURCES
* Projected ** Subvention of Vehicle License Fees from the State terminated in 2012/13FY.
$0
$10
$20
$30
$40
$50
$60
$70
$80
04/05 05/06 06/07 07/08 08/09 09/10 10/11 11/12 12/13 13/14*
Mill
ions
Property TaxSales TaxVehicle License Fee**Hotel Motel TaxBusiness License Tax
10 Year Total$449,949,602
191,228,096$6,696,112
$30,753,637$28,247,217

14

15

16
2013/14FY OPERATING BUDGET REVENUES BY FUND
Excludes Internal Service Funds and LPFD Operations Fund
$92,414,679
$39,349,157
$2,420,008
General Fund - 68.9% Enterprise Funds - 29.3% Trust, Debt & Spec Rev - 1.8%

17
2013/14FY GENERAL FUND BUDGET REVENUES BY MAJOR REVENUE SOURCES
$49,350,000
$27,705,000
$12,159,440
$2,453,239
$502,000$245,000
Property Taxes 53.4% Sales Tax 30.0% Fees & Charges 13.1%
Interfund Charges 2.7% Intergovernmental Rev 0.5% Interest Income 0.3%

18
2013/14FY GENERAL FUND BUDGET EXPENDITURES BY TYPE
$69,932,286
$1,751,671
$2,883,098$15,697,816
$591,316
Personnel 77.0% Transportation & Training 1.9%Repairs & Maintenance 3.2% Materials, Supplies & Services 17.3%Capital Outlay 0.6%

19
2013/14FY GENERAL FUND BUDGET EXPENDITURES BY DEPARTMENT
$12,484,337
$40,000,923$11,611,961
$15,195,553
$11,563,414
General Government 13.8% Public Safety 44.0%
Community Development 12.8% Operations Services 16.7%
Community Activities 12.7%

20
CIP EXPENDITURES BY CATEGORY 2013/14FY
$7,949,449
$2,346,482
$805,000
$4,462,529 $1,540,000
Streets - 46.5% Parks - 13.7% Miscellaneous - 4.7%
Water - 26.1% Sewer - 9.05%

21
OVERVIEW OF REVENUE AND EXPENDITURE TRENDS The City’s General Fund has experienced substantial changes in the last 20 years as shown in the following table:
REVENUE/EXPENDITURE GROWTH
Fiscal YearTotal GF
Revenues*% Change
Total GF Expenditures*
% Change
1994/95 36,191,503 6.6% 32,926,364 4.1%
1995/96 39,271,439 8.5% 35,284,732 7.2%
1996/97 45,525,489 15.9% 38,269,819 8.5%
1997/98 50,943,460 11.9% 43,039,155 12.5%
1998/99 56,684,085 11.3% 49,504,089 15.0%
1999/00 62,048,909 9.5% 54,241,284 9.6%
2000/01 72,276,459 16.5% 62,521,907 15.3%
2001/02 70,913,486 -1.9% 62,578,769 0.1%
2002/03 73,872,903 4.2% 64,844,911 3.6%
2003/04 77,431,866 4.8% 66,942,748 3.2%
2004/05 79,886,263 3.2% 70,395,244 5.2%
2005/06 86,057,094 7.7% 77,451,589 10.0%
2006/07 92,647,006 7.7% 83,865,860 8.3%
2007/08 94,101,869 1.6% 87,008,499 3.7%
2008/09 89,935,072 -4.4% 85,245,704 -2.0%
2009/10 84,668,134 -5.9% 84,511,973 -0.9%
2010/11 87,832,845 3.7% 82,586,760 -2.3%
2011/12 89,817,106 2.3% 84,829,842 2.7%
2012/13 91,284,523 1.6% 87,293,546 2.9%
2013/14** 92,414,679 1.2% 87,500,000 0.2%* Numbers do not include Transfers In and Transfers Out** Projected
22
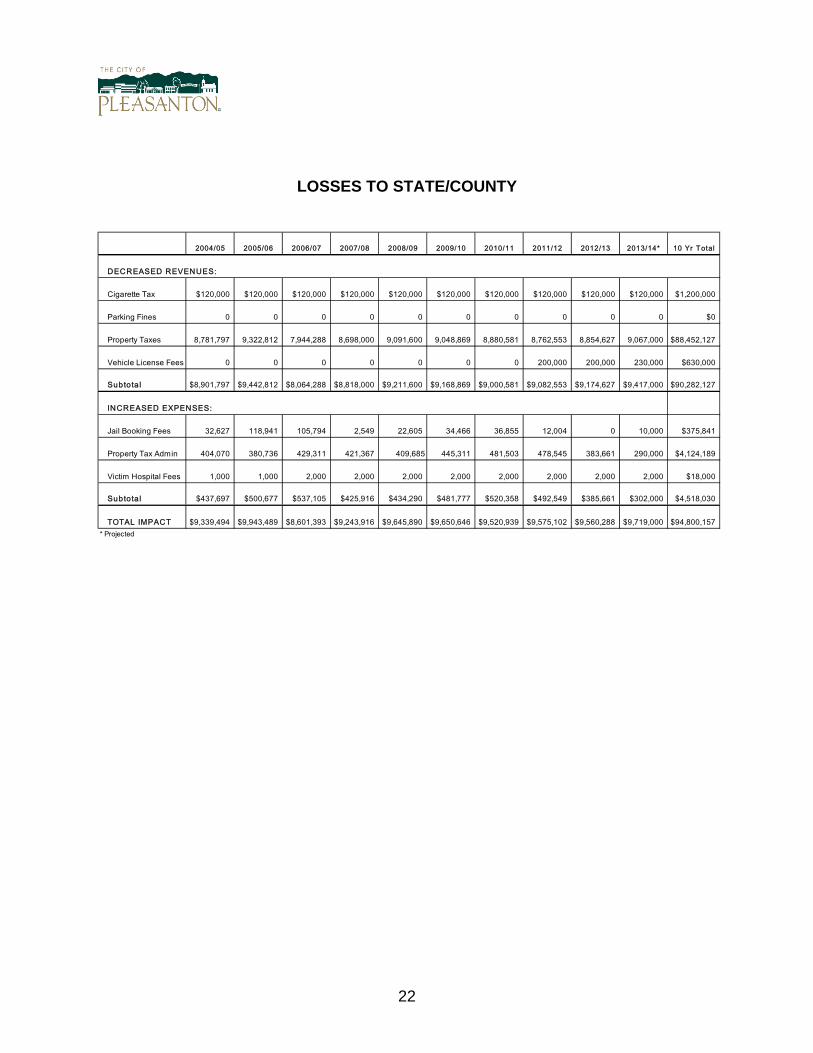
LOSSES TO STATE/COUNTY
2004/05 2005/06 2006/07 2007/08 2008/09 2009/10 2010/11 2011/12 2012/13 2013/14* 10 Yr Total
DECREASED REVENUES:
Cigarette Tax $120,000 $120,000 $120,000 $120,000 $120,000 $120,000 $120,000 $120,000 $120,000 $120,000 $1,200,000
Parking Fines 0 0 0 0 0 0 0 0 0 0 $0
Property Taxes 8,781,797 9,322,812 7,944,288 8,698,000 9,091,600 9,048,869 8,880,581 8,762,553 8,854,627 9,067,000 $88,452,127
Vehicle License Fees 0 0 0 0 0 0 0 200,000 200,000 230,000 $630,000
Subtota l $8,901,797 $9,442,812 $8,064,288 $8,818,000 $9,211,600 $9,168,869 $9,000,581 $9,082,553 $9,174,627 $9,417,000 $90,282,127
INCREASED EXPENSES:
Jail Booking Fees 32,627 118,941 105,794 2,549 22,605 34,466 36,855 12,004 0 10,000 $375,841
Property Tax Admin 404,070 380,736 429,311 421,367 409,685 445,311 481,503 478,545 383,661 290,000 $4,124,189
Victim Hospital Fees 1,000 1,000 2,000 2,000 2,000 2,000 2,000 2,000 2,000 2,000 $18,000
Subtota l $437,697 $500,677 $537,105 $425,916 $434,290 $481,777 $520,358 $492,549 $385,661 $302,000 $4,518,030
TOTAL IMPACT $9,339,494 $9,943,489 $8,601,393 $9,243,916 $9,645,890 $9,650,646 $9,520,939 $9,575,102 $9,560,288 $9,719,000 $94,800,157* Projected

23
CITY OF PLEASANTON
HISTORY OF GENERAL FUND REVENUE
Ac tual Ac tual Ac tual Adjus ted Projec ted2009/10 2010/11 2011/12 2012/13 2013/14
TAXES
Secured Property $39,509,558 $39,140,690 $38,748,410 $39,850,000 $40,100,000
Unsecured Property 2,403,347 2,395,209 2,366,462 2,350,000 2,400,000
Delinquent Taxes 2,281,672 1,515,544 1,445,750 1,200,000 1,200,000
Property Tax in Lieu of VLF 4,972,711 4,882,208 4,816,786 4,855,000 4,900,000
Supplemental Assessment 556,736 635,358 546,283 510,000 750,000
Library Property Tax 0 0 0 0 0
ERAF III 0 0 0 0 0
Subtotal $49,724,024 $48,569,009 $47,923,691 $48,765,000 $49,350,000
OTHER TAXES
Sales & Use Tax 15,420,066 18,503,316 19,107,418 19,000,000 19,740,000
Public Safety Sales Tax 306,751 319,173 348,864 360,000 360,000
Documentary Tax 455,169 465,375 536,841 680,000 690,000
Hotel/Motel 2,719,621 2,965,630 3,486,597 3,650,000 3,750,000
Misc. Taxes 91 0 41 0 0
Business Licenses 2,632,848 2,688,929 2,842,587 3,000,000 3,050,000
Off Track Fees 149,626 125,826 96,176 110,000 115,000
Subtotal $21,684,172 $25,068,249 $26,418,524 $26,800,000 $27,705,000
PERMITS 852,900 1,453,710 1,775,254 1,940,634 2,116,835
FINES & FORFEITURES 374,171 477,420 432,120 509,476 509,500
INTEREST INCOME & RENT 391,607 285,643 306,304 292,000 245,000
SUBVENTIONS & GRANTS 862,416 998,543 518,407 503,316 502,000
FRANCHISES 1,955,493 2,001,934 2,012,970 2,185,000 2,285,000
PLANNING & ZONING FEES 43,630 34,988 373,996 598,753 337,065
PLAN CHECK FEES 428,476 918,878 1,616,141 1,440,000 1,580,000
PUBLIC WORKS 194,692 76,454 51,519 30,582 74,100
CURRENT SERVICE FEES 1,047,273 945,052 1,026,830 960,501 934,900
LIBRARY SERVICES 84,421 80,553 82,605 86,399 87,600
RECREATION REVENUE 3,210,479 3,295,408 3,507,589 3,440,203 3,604,500
MISCELLANEOUS 1,362,962 1,077,761 1,236,810 1,178,557 629,940
INTERFUND REVENUES 2,451,418 2,549,243 2,534,346 2,554,102 2,453,239
TOTAL REVENUE $84,668,134 $87,832,845 $89,817,106 $91,284,523 $92,414,679
PERCENTAGE CHANGE -5.86% 3.74% 2.26% 1.63% 1.24%

24
HISTORICAL FINANCIAL TRENDS The City of Pleasanton is fortunate to have several large business employment centers located in its community that contribute to the approximately 53,000 local jobs (employment). Any financial trend analysis which utilizes only per capita information ignores the revenue generated by businesses and services provided to them. Therefore, staff has chosen to use a “per service unit” approach whenever possible in analyzing trends and making comparisons to other agencies. A common assumption used in fiscal impact analysis is that a resident is equivalent to one service unit, while a local job is equivalent to one-half a service unit. This is the assumption staff has utilized in each graph or table that refers to “service units”. The following graph displays the residential and employment growth in Pleasanton over the last ten years, and reflects the combination of these two statistics into equivalent “Service Units”. In total the growth in residential and employment population has been relatively flat over the past ten years.
*Projected
0
20,000
40,000
60,000
80,000
100,000
120,000
04/05 05/06 06/07 07/08 08/09 09/10 10/11 11/12 12/13 13/14*
Service Units Residents Employees
City Service Units

25
HISTORICAL FINANCIAL TRENDS The following graphs display the number of General Fund employees over a 10-year period. The first graph reflects the number of employees, and the second graph reflects the number of employees “per 1,000 service units”.
*projected *projected
As a result of the Great Recession that occurred between 2007 and 2010, the City reduced its number of employees by forty positions through retirements and attrition. Better equipment and improved technology has also enabled staff to more productively do their jobs and lessen the growth in the number of employees.
330
340
350
360
370
380
390
400
410
420
General Fund Employees
4
5
5
5
5
5
6
6
6
6
General Fund Employees(Per 1,000 Service Units)

26
HISTORICAL FINANCIAL TRENDS General Fund revenues grew steadily up until the economic downturn in fiscal year 2008 and are slowly returning to their pre-2008 level. The City is currently experiencing a slight increase in revenues that is projected to be sustainable over the next two years. However, General Fund revenues per service unit have remained level in the last ten years (in constant dollars), matching the trend reflected in the expenditure graphs below.
*projected * projected General Fund expenditures have grown slightly overall in the past ten years, decreasing during the recent economic downturn and then slightly increasing in the past ten years. Expenditures per service unit (adjusted for inflation) have changed slightly over the last decade also. Efficiencies in operations and economies of scale have allowed the service levels to remain fairly constant over very difficult economic times in the past ten years.
*projected * projected
$0
$40
$80
$120
General Fund Revenues(Millions)
Current 1984
$0
$200
$400
$600
$800
$1,000
$1,200
General Fund Revenues(per Service Unit)
Current 1984
$0
$40
$80
$120
General Fund Expenditures (Millions)
Current 1984
$0
$200
$400
$600
$800
$1,000
General Fund Expenditures(per Service Unit)
Current 1984

27
HISTORICAL FINANCIAL TRENDS
*projected * projected
Property taxes grew steadily until 2009/10FY, slightly decreased due to the Great Recession and have remained fairly constant as a result of the large diversified tax base of the City. The rate of property tax growth has slowed as a result of the recent economic downturn. Sales Tax grew slightly prior to the economic downturn in fiscal year 2008. The revenue is slowly returning to its pre-2008 level. The volatility of this revenue makes it difficult to project its long term trends, but for now, sales tax is projected to increase slightly in the next couple of years. Fortunately, the tax base is comprised of a very diverse mix of businesses, which helps smooth out the ups and downs.
*projected
$0
$10
$20
$30
$40
$50
$60
Mill
ion
s
Property Tax Revenues
$0
$5
$10
$15
$20
$25
Mill
ion
s
Sales Tax Revenues
$0
$10
$20
$30
$40
$50
$60
04/05 05/06 06/07 07/08 08/09 09/10 10/11 11/12 12/13 13/14*
Mill
ion
s
Property Tax Sales Tax
Property Tax & Sales Tax Revenues

28
HISTORICAL FINANCIAL TRENDS The following graph compares Pleasanton’s Stoneridge Mall to malls in nearby cities. Stoneridge Mall continues to be the highest sales tax revenue generator in the area.
$0
$500,000
$1,000,000
$1,500,000
$2,000,000
$2,500,000
$3,000,000
$3,500,000
$4,000,000
$4,500,000
$5,000,000
2008 2009 2010 2011 2012Stoneridge Mall Broadway Plaza Newpark Mall Great Mall
Sales Tax - Local Malls

29
HISTORICAL FINANCIAL TRENDS As the following pie charts display, the General Fund Revenue make-up has changed in the last ten years. Sales tax and property taxes continue to be the General Fund’s primary revenue sources, with property tax representing 53.4% of the General Fund’s revenue; up from 43% in the 2003/04FY.
* Projected
Other11.7%
Hotel / Motel Tax3.2%
Property Tax43.0%
Sales Tax24.0%
Intergovernmental0.9%
Development Services5.9%
Recreation4.1%
Business License Tax3.4%
VLF3.8%
General Fund RevenuesFY 2003/04$77,431,866
Other9.0%
Hotel / Motel Tax4.1%
Property Tax53.4%
Sales Tax21.4%
Intergovernmental0.5%
Development Services4.4%
Recreation3.9%
Business License Tax3.3%
General Fund RevenuesFY 2013/14*$92,414,679

30
HISTORICAL FINANCIAL TRENDS A comparison of Pleasanton's gross assessed property values to other cities in Alameda County reveals that Pleasanton ranks third behind the much larger cities of Oakland and Fremont for 2012/13FY.
The following graph displays the interest earnings of the General Fund for the last 10 years. On a daily basis, the City invests all its idle cash, in accordance with the City's formal investment policy. The ups and downs of interest rates over the last ten years have impacted the amount of annual interest income.
*projected
$0$5
$10$15$20$25$30$35$40$45
Bil
lio
ns
Grossed Assessed ValuationsAlameda County
$0
$200,000
$400,000
$600,000
$800,000
$1,000,000
$1,200,000
$1,400,000
04/05 05/06 06/07 07/08 08/09 09/10 10/11 11/12 12/13 13/14*
General FundInterest Income

31
HISTORICAL FINANCIAL TRENDS
*Projected General Fund contributions to CIP before 2009/10FY include debt service payments. Beginning in 2009/10FY the General Fund has been directly paying the debt service payments.
From the 1990/91FY through 2013/14FY the General Fund contributed $116 million to Capital Improvement Projects including joint City School District gymnasiums, Veteran’s Hall renovations, participation in the County’s animal shelter, the expanded and recently renovated aquatic center, the Alviso Adobe project, Val Vista Park expansion, the Bernal Property, the Callippe Golf Course in South Pleasanton, the Firehouse Arts Center and major street and park improvements.
$0
$20
$40
$60
$80
$100
$120
Mill
ions
General Fund Contributions to the CIP($115,999,827)
13/14* $ 1,000,000 12/13 $ 0 11/12 $ 0 10/11 $ 0
09/10 $ 0 08/09 $ 5,300,000 07/08 $ 7,000,000 06/07 $ 7,300,000
05/06 $ 6,600,000 04/05 $ 5,800,000 03/04 $ 7,180,000 02/03 $ 10,200,000
01/02 $ 8,730,000 00/01 $ 6,368,684 99/00 $ 9,356,318 98/99 $ 7,268,771
97/98 $ 2,548,853 96/97 $ 10,318,195 95/96 $ 2,032,594 94/95 $ 6,556,782
93/94 $ 2,268,795 92/93 $ 1,895,082 91/92 $ 3,680,227 90/91 $ 4,595,526

32
DEBT SUMMARY
PROJECTED* PROJECTED*DATE PRINC. AMT. PRINC. AMT. SAMPLE
OF ORIGINAL OUT ST A N D IN G OUT ST A N D IN G A N N UA L D EB T PAYOFFISSUE ISSUER PURPOSE SECURITY ISSUE AMOUNT AT 6/30/14 AT 6/30/15 SERVICE DATE
CERTIFICATES OF PARTICIPATION:
2004 Refunding Certif icates of City of Pleasanton Refund portion of 1994B Refunding Fire Station 2 and 3 11/18/2004 $4,040,000 380,000 0 389,000 9/1/2014
Participation Lease Revenue Bonds - 123 Main
St & Corp Yard
REVENUE BONDS:
2004 Sew er Revenue Refunding Bonds City of Pleasanton Refund the Sew er portion of 1994A Pledge of sew er revenues 11/18/2004 1,760,000 180,000 0 184,000 9/1/2014
Refunding Water and Sew erRevenue Bonds
In addition, w e have the follow ing Mortgage Revenue Bonds. The City has no obligation but acts as the conduit agency.
HOME MORTGAGE REVENUE BONDS:
1989A Variable Rate Multifamily City Refinance multifamily rental FNMA collateral pledge 10/20/1989 8,160,000.00 Ow ner's responsibility 8/1/2018
Mortgage Revenue Demand housing development
Bonds (Valley Plaza II Apts)
2001A Variable Rate Demand City Construction of multifamily FNMA under a credit facility 8/9/2001 18,925,000.00 Ow ner's responsibility 9/15/2034
Multifamily Housing Revenue residential housing development
Bonds (Bernal Apartments)
2003 Variable Rate Demand City Construction of multifamily senior FNMA credit enhancement 11/01/2003 13,360,000.00 Ow ner's responsibility 6/15/2037
Multifamily Housing Revenue residential housing development
Bonds (Busch Sr Housing)
2005 Variable Rate Demand City Construction of Parkview Assisted Citibank Irrevocable Letter of 9/28/2005 19,700,000.00 Ow ner's responsibility 11/1/2040
Certif icates - Pleasanton Living Center Credit
Assisted Living Facility
DEBT SUMMARY AS OF 6/30/2014 AND OF 6/30/2015

33
GENERAL FINANCIAL POLICIES The following Financial Policies are established to see that the City’s finances are managed in a manner which will (1) continue to provide for the delivery of quality services, (2) maintain an enhance service delivery as the community grows in accordance with the General Plan, (3) guarantee a balanced budget annually assuring that the City is always living within our means, and (4) establish reserves necessary to meet known and unknown future obligations. To achieve these goals the following Financial Policies are presented which include General Policies, Revenue Policies, cost of Service Policies, Reserve Policies, Expenditure and Budgeting Policies, Debt Policies, and Capital Improvement Policies. A. GENERAL POLICIES
The City will manage its financial assets in a sound and prudent manner.
The City will maintain sound financial practices in accordance with State law, and direct its financial resources toward meeting the City’s long-term goals.
The City will maintain and further develop programs to assure its long-term ability to pay all the costs necessary to provide the level and quality of service required by its citizens.
The City will maintain accounting systems in conformance with generally accepted accounting principles.
The City will establish and maintain investment policies in accordance with State laws that stress safety and liquidity over yield.
B. REVENUE POLICIES
The City will strive to maintain a diversified and stable revenue base that is not overly dependent on any land use, major taxpayer, revenue type, restricted revenue, inelastic revenue, or external revenue.
The City will aggressively pursue revenue collection and auditing to assure that moneys due the City are accurately received in a timely manner.
The City will seek Federal and State grants and reimbursements for mandated costs whenever possible.
The City will investigate potential new revenue sources, particularly those which will not add to the tax burden of residents or local businesses.
The City will work proactively with the League of California Cities and local communities to monitor legislation that may impact the City financially.
The City will avoid targeting revenues for specific purposes whenever possible.

34
The City will review user fees and charges and attempt to set them as close as possible to the cost of providing services, except as provided by the City’s Fee Policy or specific direction.
The City will impose user fees when appropriate.
The City will adopt a user fee policy, which establishes desired levels of cost recovery and determines the minimum frequency of user fee reviews.
The fees and charges will be set at a level that fully supports the total direct and indirect cost of the activity, including administrative overhead and depreciation, and in accordance with the City’s Fee Policy.
The City will prepare periodic financial reports of actual revenue received, for review by the City Council, to provide information on the status of the City’s financial condition.
The City will maintain and further develop methods to track major revenue sources and evaluate financial trends.
The City will establish methods to maximize the accuracy of revenue forecasts.
C. COST OF SERVICES POLICIES
The City will recover the costs of new facilities and infrastructure necessitated by development, consistent with State law.
The City will consider requiring large developments to prepare a fiscal analysis, which measures direct and indirect costs and benefits to the City.
D. RESERVE POLICIES
The City will establish, dedicate and maintain reserves annually to meet known and estimated future obligations.
The City will establish Specific Reserve Accounts which include but are not limited to designated reserves for the following:
Reserve for Economic Uncertainties equal to 10% of General Fund Revenues.
Totally funded workers compensation
Liability insurance
Estimated cost of retirees medical payments
Depreciation and replacement of vehicles and major equipment
Major maintenance and renovations of buildings, parks, and landscape maintenance
The City will establish reserves for replacement of facilities and infrastructure.
The City will establish reserves for cash flow purposes.

35
E. EXPENDITURE AND BUDGETING POLICIES
The operating budget will be prepared to fund current year expenditures with current year revenue. However, surplus fund balances may be used to increase reserves, fund Capital Improvement Projects, or be carried forward to fund future years’ operating budgets when necessary to stabilize services and fund capital outlay.
The City will deliver service in the most effective manner, including utilizing the services of volunteers in areas where it is economically viable.
The budget will state the objectives of the operating programs, and identify the service and resources being provided to accomplish the specified objectives.
The budget will fully account for and apportion all costs, fees, and General Fund transfers associated with the Enterprise Funds.
Department expenditures are limited to:
Budgeted expenditures approved by the City Council as appropriated by major category:
Employee Services; Transportation and Training
Repairs and Maintenance, Materials, Supplies and Services; and Capital Outlay.
All budget transfers require the approval of the City Manager or designee except those affecting personnel and capital outlay, which must be approved by the City Manager.
Budget transfers required to hire additional permanent personnel require the City Council’s approval.
The City will fully fund accrued unused vacation annually.
The City will periodically update replacement and maintenance financing plans, and incorporate them into the Budget.
F. DEBT POLICIES
The City will limit the use of debt so as not to place a burden on the fiscal resources of the City and its taxpayers.
The City will limit long-term borrowing to capital improvements or projects that cannot be financed from current revenues.
When capital projects are financed, the City will amortize the debt within a period not to exceed the expected useful life of the project.
The City will attempt to limit the debt ratio (debt guaranteed by the General Fund) to 10%. The debt ratio is calculated by the relationship between the debt and the General Fund revenue.
Whenever possible, the City will investigate the use of special assessment, revenue or other self-supporting bonds to limit the General Fund obligation for debt service payments.

36
The City will not use long-term debt for current operations.
The City will not use short-term borrowing to support routine operations, provided however, that it may be used to meet temporary cash flow needs.
The City will maintain strong communications with bond rating agencies about the City’s financial condition and will follow a policy of full disclosure on financial reports and bond prospectus.
The City will strive to maintain or improve the City’s bond rating.
The City will utilize inter-fund loans when possible to reduce the cost of financing capital improvements.
G. CAPITAL IMPROVEMENT POLICIES
The City will construct all capital improvements in accordance with an adopted capital improvement program.
The City will develop a five-year plan for capital improvements to be updated at least bi-annually. Future capital expenditures will be projected annually for a five-year period based on changes in the community population, real estate development or replacement of the infrastructure.
The City will coordinate preparation of the Capital Improvement Budget with preparation of the Operating Budget. Future operating costs associated with new capital improvements will be projected and included in Operating Budget forecasts.
The City will identify the estimated costs and potential funding sources for each proposed capital project before it is submitted to Council for approval.
The City will attempt to determine the least costly financing method for all new projects.
The estimated cost of Capital replacement for enterprise funds such as water and sewer will be updated at least every two years to ensure that rates and charges are covering the full cost of operating these programs.

37
FEE POLICY (Adopted by Resolution No. 92-99)
The Fee Policy is established to assist all departments in determining how any specific fee should be established, to help assure equitable treatment of all citizens and to structure the maintenance of fees at a current cost level. Furthermore, the Fee Policy establishes categories of services for which the City desires to collect such fees and upon which the level of cost recovery is determined. A. GENERAL POLICY
It is the general policy of the City of Pleasanton to recover its costs of service
from the individuals and/or groups served to the extent that individual members of the public are benefiting from specific City facilities or personnel in a way different from that enjoyed by all citizens. To the extent that the City organizes some of its activities into enterprise funds, such activities should recover all of their costs even if they benefit essentially all of the citizens.
B. CATEGORIES OF SERVICE
From a policy standpoint, the Council expects City services to be placed in one of
six categories before a fee is established or considered for any specific service:
1. Development which impacts municipal infrastructure costs.
When additional housing or commercial units are being built, it is the City's policy to charge them for the costs of the additional roadways, road widening(s), traffic control devices, water/sewer lines or processing capacity, and other related capital costs the City must spend to support the new development and the impacts it creates. The policy of the City Council is that these fees will include all cost expended or expected to be expended by the City in creating or performing these support activities, either in cash or in such in-kind as may be approved by the City Manager, as provided by State legislation.
2. Fees or charges designed to discourage improper behavior.
This would include traffic fines, parking enforcement, vandalism repair, theft or
willful destruction of City property, building code infractions, etc. There is no need for these charges to be constrained by the cost of the enforcement activity. While they should at least meet this cost, they will generally be expected to be more than the cost of enforcement to discourage repeat offenses.

38
3. Services designed to control activities which could be harmful to others. This includes fire inspection fees, many types of police permits, building
inspections, etc. In these cases, the individual has probably done nothing wrong, but is engaged in an activity which could be harmful to others if conducted incorrectly. These fees should be set at full cost recovery. Full cost recovery includes direct labor costs (salary and benefits), allocated cost of supervision, pro-rata departmental management costs, City-wide overhead allocation, and physical facility or equipment hourly costs. This does not include criminal activities for which there are other penalties.
4. Services clearly required by the payee which the City would not otherwise
be required to perform. These include most of category 3 above as well as most Planning, Engineering,
and Building department activities which are focused on a single transaction or incident. Not included in this category are Police activities with criminal penalties. This would include copying costs when the nature of the transaction fits this description. All accidents resulting in harm to City property would fall into this category.
5. Services which are supportive of general City service policies, but require
out-of-pocket expenses by the City for the benefit of the participating individuals.
Many recreation activities would fall into this category. It is the general policy of
the City for these activities to pay for their out-of-pocket costs, including any City overtime involved, but not to be charged for the otherwise allocable overhead costs, indirect supervision time, or a pro-rata share of the facility being used. If the activities being offered preclude (or collectively preclude) the facility being available for general purpose use (such as swim classes vs. general "open pool" hours), a pro-rata share of facility costs may be assigned with consent of the Council. This category would also include copying costs in support of such programs.
6. Normal City services supporting all inhabitants.
The City performs a host of functions, from street maintenance to fire fighting to
law enforcement as part of its services to all persons and property within the City limits. These general services are funded through a variety of taxing mechanisms and should not be funded by a fee for service. The key test for this type of service is that it is applied to all persons and property equally, not to a restricted subset of the population. Programs which are specifically tax or grant funded for a specific subset of the population (such as senior citizens) are also included in this category.

39
Exhibit I summarizes these categories and the fee rules associated with each.
EXHIBIT I
CATEGORY
COSTING METHODOLOGY
EXAMPLES OF FEES IN CATEGORY
A. Impact Fees
Based on capital costs of City infrastructure impacted by proposed development. Developed within AB1600 guidelines from State.
Residential construction fee Capital improvement fee Sewer connection fee Water connection fee Growth management fee "Affordable Housing" fee
B. Improper Behavior
Full City costs plus penalty amount where appropriate.
Traffic fines or parking enforcement Theft, willful destruction of property Vandalism
C. Control of Potentially Harmful Activities
Full cost recovery. Fire Inspection Fees Pawn Shop Permits Building Inspection Fees
D. Services to/for an individual or group and enterprise fund activities
Full cost recovery. Planning or Engineering work associated with processing of a subdivision map, building permits, or public R/W Company's exclusive rental of facility Water/Sewer monthly charges non-willful harm to City property
E. Service Supporting General City Policy
Out-of-pocket cost recovery.
Recreation Fee (unless facilities therefore not available to general public) Safety Training (CPR, fire prevention)
F. Normal City Services
No charge. Street Maintenance, Park Maintenance, law enforcement, fire response, etc.
In addition to and overriding the above categories are enterprise fund activities. These are typically similar to category D above, in that the City would recover all of its costs and overhead. However, with enterprise funds including Water and Sewer, the capital costs required to support the activity are typically significant, and it is the City's policy to recover their costs directly from the users of the enterprise fund services. This includes depreciation or other method of provision for capital facility replacement. No other City services would normally include provision for replacement of capital facilities.

40
C. MAINTENANCE OF FEE LEVEL
The Policy of the City is to maintain fees at a level consistent with the costs associated with each service. To accomplish this, the City will:
1. Annual departmental submission of recommended fees.
Each department is directed every November to review its costs associated with
each existing fee for service and to determine whether it has added any services during the year, or is contemplating adding any services in the upcoming fiscal year for which a fee should be charged. It should then report to the Finance Director by December 31 of each year as to the changing costs of providing services and/or the proposed new fees and the basis for each. It is not necessary for the department to report to the Finance Director on fees for which the only changes are basic inflationary changes. This directive is not intended to preclude departments bringing forth recommended adjustments at other times if State law or other circumstances make mid-year changes appropriate.
2. Finance Director annual report to Manager/Council.
The Finance Director shall review the proposed fee changes and/or additions or
deletions suggested by each department and report to the Manager and Council as part of the annual budget cycle on proposed changes. At this time, the Finance Director shall propose across the board adjustments to fees for City salary increases and other inflationary impacts.
3. Periodic review of overhead cost allocations.
Every five years the Finance Director shall analyze or cause to be analyzed the
overhead and departmental management costs allocated to each fee.
4. Annual master fee schedule adjustment. To facilitate annual adjustment, the City shall annually adopt a new master fee
schedule. The City Attorney shall propose any new fee ordinances in a manner consistent with this intent, and revise any ordinances existing requiring such adjustment so that the amount of the fees can be changed with a single new resolution each year.
D. DAMAGE REIMBURSEMENT
1. Overall basis for charges.
The City will charge the person who has damaged, destroyed, or taken City
property for the cost to the City to process the incident and to replace that item or items with a comparable new item which conforms to current City policies for the purpose the item serves, or to repair the item to a state comparable to its state at the time of the incident. Where the item damaged, destroyed, etc. was a vehicle, the City charges will not exceed the cost to replace the vehicle with a comparable

41
vehicle of similar capabilities and use, plus its processing costs. All costs incurred by the City shall be included in the time and materials charged to the perpetrator, including time to determine the nature and extent of the problem, time to determine the most effective way to restore the previous situation, time to handle the parties involved, court costs and time if needed, staff report preparation time, and the reasonable costs allocated to these direct expenses to cover their pro-rata share of direct supervision, management, support facilities, equipment used in the repair, the general City overhead.
2. Costs of items acquired or installed to replace damaged property.
The actual hydrant, lamp post, sign or signpost, or other item acquired or
installed should be charged to the claim. This cost should be determined by the actual out-of-pocket cost if purchased for this specific repair or the replacement cost value if taken out of storage. If the replacement is an upgrade from the item which was damaged, the charge should only be for the cost of the comparable item with two exceptions. First, if the only readily available item (or in an emergency, the only immediately available item) differs from the replace item, the City will charge the full cost. (Example -- they no longer make the old type, or the old type is not available on nights and weekends and we could not wait.) Second, if a wooden signpost was damaged, but the City standard for a signpost is now to use a metal signpost (or a larger wooden signpost), the City will charge for replacement at the current standard.
3. Staff labor time.
The City expends time handling the damage or theft. All of that time should be
charged to the offending party at the fully burdened hourly rate of those staff members who deal with the problem(s). The types of time which might be incurred include:
a. Investigative Time This is time required to determine who is responsible for the
damage or theft. This could be incurred by a police officer, a member of the staff who observes the incident, or a staff member asking questions to find out what happened.
b. Solution Definition Time This is time spent deciding the best thing to do to resolve the
problem. It might include time spent taking a vehicle to three repair shops to get bids, time spent determining whether to sand-blast or paint over graffiti, etc.

42
c. Preparation Time This is the time spent acquiring the materials needed to effect the
repair or replacement. It could involve determining the specifications for the item, procurement time (including centralized purchasing if applicable), or adjustment of equipment centrally so that it can be used to effect the repair/replacement.
d. Repair/Replacement/Installation Time This is the time actually spent replacing the item or repairing it.
This included the travel time involved. e. Participant Interaction Time
This is the time spent handling the parties involved in the incident. f. Accounting/Billing/Office Time This is the time spent determining the charges and preparing a bill.
It would include Finance Department time. g. Enforcement Time This is the time spent in court, including officer testimony, City
Attorney time, and Finance staff's small claims court appearance. These charges would be tracked for claiming in court if the incident goes to court.
4. Staff labor rates. Each department involved in the claim should have a labor rate for the time it spends. The labor rate consists of the following items: The direct annual salary of the individuals divided by their anticipated annual work hours ("hourly direct salary"). This can also be the average for a group of similar workers who might work on a claim -- i.e., a department-wide clerical rate or a division-wide electrician rate. Either of these approaches is equally valid. The costs of the fringe benefits of the individual staff member divided by the anticipated number of hours to be worked that year. If you used a group rate above, you must use a group rate for this. If you used an individual rate above, it is permissible to use either an individual or group rate for fringe benefits. ("Direct Hourly Fringes") If the time spent was overtime, these costs should not be added. Most City staff have a supervisor whose job is to manage and direct their time, provide technical or professional expertise and advice, etc. This person would typically manage several people, and might also be a producer of products.

43
(Example -- a supervising accountant might spend half of his or her time supervising a function and half time performing advanced level accounting work.) The percentage of the supervisor's time which is management and supervision oriented should be divided by the number of personnel supervised, and the result would be a direct overhead to the staff person. For example, if that supervising accountant managed four junior accountants, one eighth of his or her salary (50%/4 personnel) and fringes should be allocated as "Direct Supervision" costs. In addition to the above, the general management of the department should be added to the rate. This consists of the department head, his/her secretary, and the general expenses of the department. These costs are then divided by the direct salary costs of the rest of the department to determine the percentage which departmental overhead is of the direct departmental costs. Citywide overhead (determined by this study to be approximately 33.89%) would be added to the result from the above step. Reviewing all of the above, the formula for determining the hourly rate would be a follows: Rate = (hourly direct labor salary + direct fringe rate) x (1+supervision overhead %) x (1+ departmental overhead %) x 1.3389 (Citywide overhead factor) If a rate for supervision or departmental overhead is not readily available, 15% and 5% will be used respectively. The actual rate, when calculated, will likely be higher than these, however. 5. Equipment used. In addition to labor and materials used to repair/replace the damaged item, some operations require the use of City equipment. This includes passenger vehicles, police cruisers, and heavy equipment. The Support Services Division will provide an estimate of the appropriate hourly rate for passenger vehicles or Police cruisers. A heavy equipment rate can be developed by taking the original cost of the unit and dividing it by the anticipated number of hours of use it will get in its life. For example, if a "cherry-picker" gets used 3 days each week for 8 hours a day and is expected to last 8 years, the procurement cost would be divided by 9,984 (23 hours per week x 52 weeks per year x 8 years). For example, if the units cost $50,000 to procure, paint, decal, etc., the rate would be about $5/hour. In addition to this, the appropriate hourly share of the annual maintenance, gas, oil, etc., must be added. An easier and equally acceptable approach for many types of equipment is to use 85% of the cost of renting the unit on a commercial basis. The 85% factor is used to eliminate the profit aspect of such a rate. (This approach should only be used if the City does not have similar equipment in another department.)
44
6. Materials, supplies, and out-of-pocket expenses. These expenses will be included in the charges. In the case of water losses from a hydrant, an estimate will be made based on pressure, size of opening, and estimated duration of the unchecked flow.
E. PARK AND COMMUNITY SERVICES The City Council authorizes staff to adjust fees and charges for services and facilities for up to twenty percent of the approved fees and charges without resubmitting the adjustment to the City Council. The City Council authorizes staff to adjust to provide new programs/classes at a fee based on the cost of service or established guidelines, and that fees for such programs or classes be submitted to the Council for approval within a one-year period from initiation of the class or program. The City Council authorizes the Recreation Supervisors or Director of Park and Community Services to continue to enter into contractual agreements for program services, in forms as approved by the City Attorney. The cost of fee classes is set to attempt to return the full cost of the instructor(s) and materials plus an additional thirty percent for program supervision and office support.

45
INVESTMENT POLICY AND GUIDELINES Adopted April 16, 2013
(For 2013/14 FY) POLICY
It is the policy of the City of Pleasanton to invest public funds in a manner which will provide the highest investment return with the maximum security while meeting the daily cash flow demands of the City and conforming to all state and local statutes governing the investment of public funds.
SCOPE
This investment policy applies to all financial assets of the City. These funds are accounted for in the City's Comprehensive Annual Financial Report and include: General Fund Enterprise Funds Internal Service Funds Capital Projects Funds Special Revenue Funds Private-Purpose Trust Funds Agency Funds Debt Service Funds
PRUDENCE
Investments shall be made with judgment and care – under circumstances then prevailing – in which persons of prudence, discretion and intelligence exercise in the management of their own affairs, not for speculation, but for investment, considering the probable safety of their capital as well as the probable income to be derived (i.e. the “prudent person” standard as defined by Civil Code #2261). Investment officers acting in accordance with written procedures and the investment policy and exercising due diligence shall be relieved of personal responsibility for an individual security's credit risk or market price changes, provided deviations from expectations are reported in a timely fashion and appropriate action is taken to control adverse developments.
OBJECTIVE
The primary objectives, in priority order, of the City's investment action shall be:

46
a. Safety: Safety of principal is the foremost objective of the investment program. Investments of the City shall be undertaken in a manner that seeks to ensure the preservation of capital in the overall portfolio. To attain this objective, diversification is required in order that potential losses on individual securities do not exceed the income generated from the remainder of the portfolio.
b. Liquidity: The City's investment portfolio will remain sufficiently liquid to
enable the City to meet all operating requirements which might be reasonably anticipated.
c. Return on Investment: The City's investment portfolio shall be designed
with the objective of attaining a market rate of return throughout budgetary and economic cycles, taking into account the City's investment risk constraints and the cash flow characteristics of the portfolio.
CONCENTRATION OF RISK
Government Accounting Standards Board (GASB) statement No. 40 recognizes that there are many factors that can affect the value of investments. Investment risk factors include credit risk, custodial credit risk, concentration of credit risk, interest rate risk, and foreign currency risk. Credit risk is the risk of loss due to failure of an issuer of a security or a financial institution. The City purchases U.S. Treasuries and high-grade securities which will lessen this type of risk. In addition, the portfolio will be diversified so that the failure of any one issuer will not unduly harm the City’s cash flow. Custodial credit risk is the risk that in the event of the failure of the custodian, the investments may not be returned. The City’s investment securities are to be held by a third party custodian designated by the City and evidenced by safekeeping receipts. Concentration of credit risk is the risk associated with a lack of diversification of having too much invested in a few individual issuers, thereby exposing the organization to greater risks resulting from adverse economic, political, regulatory, geographic, or credit developments. The City’s investments will be diversified and will not exceed maximum percentages allowed in the California Government Code. Interest rate risk is the risk that the market value of securities in the portfolio will fall due to an increase in general interest rates. Interest rate risk may be reduced by structuring the portfolio so that securities are maturing periodically to meet cash requirements for ongoing operations, thereby avoiding the need to sell securities on the open market prior to maturity. The City will limit investments to a maximum maturity of five years (unless otherwise authorized by City Council). Foreign currency risk results from investment in foreign currency-denominated securities. The City will not invest in foreign currency investments.

47
DELEGATION OF AUTHORITY
Authority to manage the City's investment program is derived from Section 53600 et seq. of the Government Code and Chapter 2.16 of the Pleasanton Municipal Code. Management responsibility for the investment program is delegated by the City Council and City Manager to the Director of Finance.
ETHICS AND CONFLICTS OF INTEREST
Officers and employees involved in the investment process shall refrain from personal business activity that could conflict with proper execution of the investment program, or which could impair their ability to make impartial investment decisions. Employees and investment officials who manage the investment of public funds must file an annual Statement of Economic Interests with the Fair Political Practices Commission.
AUTHORIZED FINANCIAL DEALERS AND INSTITUTIONS
The Director of Finance will maintain a list of financial institutions authorized to provide investment services. In addition, a list will also be maintained of approved security broker/dealers selected by credit worthiness, who maintain an office in the State of California. These may include "primary" dealers or regional dealers that qualify under Security & Exchange Commission Rule 15C3-1 (uniform net capital rule). All broker investment transactions require the approval of authorized City staff. No public deposit shall be made except in a qualified public depository as established by state laws. All financial institutions and broker/dealers who desire to become qualified bidders for investment transactions must supply the Director of Finance with the following: audited financial statements, completed broker/dealer questionnaire, and certification of having read the City's investment policy.
AUTHORIZED AND SUITABLE INVESTMENTS
The City's investment portfolio may include the following instruments: a. Fully-insured or collateralized certificates of deposits (C/D's) of banks and
savings and loan associations. b. Negotiable C/D's issued by the top 25 banks or top 15 regional banks. The
aggregate investment in Negotiable C/D's shall not exceed 30% of the City’s total portfolio.
c. Banker’s Acceptances not to exceed 180 days maturity from date of
purchase. No more than 5% of the City’s total portfolio shall be invested in banker’s acceptances of any one issuer and the aggregate investment in banker’s acceptances shall not exceed 40% of the City’s total portfolio.
48
d. U.S. Treasury Obligations (Bills, Notes, Bonds). e. Securities of the U.S. Government or its Agencies. f. A1/P1 Commercial Paper not to exceed 270 days maturity from date of
purchase. No more than 5% of the City’s total portfolio shall be invested in commercial paper of any one issuer and the aggregate investment in commercial paper shall not exceed 25% of the City’s total portfolio.
g. State of California Local Agency Investment Fund (LAIF). h. Passbook Savings Accounts. i. Medium-term corporate notes rated A or better. The aggregate
investment in Medium-term corporate notes shall not exceed 30% of the City’s total portfolio.
j. Repurchase and Reverse Repurchase Agreements collateralized by
securities of the U.S. Government or its Agencies. The purchase securities shall have a minimum market value including accrued interest of 102% of the dollar value of funds borrowed and a term not to exceed one year. The aggregate investment in repurchase and reverse repurchase agreements shall not exceed 20% of the City’s total portfolio.
k. Money market and mutual funds whose portfolios consist of government
securities or diversified money market securities such as acceptable C/D's, banker's acceptances, agency discount notes, commercial paper, and other full-faith and credit obligations of the U.S. Government or its Agencies. The aggregate investment in Government Security Mutual Funds shall not exceed 20% of the City’s total portfolio.
COLLATERALIZATION
Collateralization will be required on active and inactive deposits in accordance with Government Code Section 53651, 53651.2, and 53652, which set forth the eligible securities and the required value of the securities to collateralize these deposits. Whenever possible, the City shall request that U.S. Treasury and Government securities be used as collateral. Repurchase agreements will be collateralized 102% with securities of the U.S. Government or its Agencies, marked to market daily.
SAFEKEEPING AND CUSTODY
Securities purchased from brokers/dealers will be held by a third party custodian designated by the Director of Finance and evidenced by safekeeping receipts. Securities do not literally have to be held in the name of the City but ownership is evidenced through safekeeping or custodial receipts and/or statements.

49
TRUST AGREEMENTS
The City shall direct the investment activities of trustees. Such direction shall be in keeping with the terms and conditions of its bond agreements, applicable law and policies set forth in this document.
DIVERSIFICATION
The City will diversify its instruments by security type and institution, meeting at least the minimum requirements as outlined in Government Code Section 53601. Current limits of the California Government Code:
Banker’s Acceptance 40% Code Section 53601 (g) Commercial Paper 25% Code Section 53601 (h) Negotiable Cert. of Deposits 30% Code Section 53601 (i) Medium-Term Corporate Notes 30% Code Section 53601 (k) Government Security Mutual Funds 20% Code Section 53601 (l)
MAXIMUM MATURITIES
To the extent possible, the City will attempt to match its investments with anticipated cash flow requirements. The City may directly invest in securities maturing more than five years from the date of purchase if they are authorized by the City Council. After Council authorization, no waiting period is required before such an investment is made. The City may invest proceeds of bond issuances or certificates of participation for a term exceeding five years, provided the City Council authorizes such investments as part of the legal documents.
INTERNAL CONTROL
The Director of Finance shall establish an annual process of independent review by an external auditor. This review will provide internal control by assuring compliance with policies and procedures.
PERFORMANCE STANDARDS
The investment portfolio will be designed to obtain a market average rate of return. Safety and liquidity, however, will continue to be the predominant emphasis.

50
REPORTING
The Director of Finance will submit a monthly report to the City Council on the status of the City's investment portfolio no later than sixty days after the end of each month. This report shall include the types of investments, the amount of money invested with various institutions, purchase and maturity dates, and yield on investments. The Director of Finance will certify that the investment portfolio is in compliance with the investment policy and that it will meet cash flow needs for the next six months.
INVESTMENT POLICY ADOPTION
The City's investment policy will be submitted annually to Council for adoption.