thailand strategy
TRANSCRIPT

ed: KK / sa:TP, PY, CS
External risks trump local positives
• Our portfolio outperformed the SET in June and YTD
• The market slump makes current valuations attractive, but
increased volatility in global financial markets could cap near-
term upsides
• Accumulate on dips stock with good fundamentals, reasonable
valuations and generous yields
• Top picks for July are AEONTS, CPN, LH, DIF, and IVL
• Top picks for 2H18 are ADVANC, AEONTS, AMATA, BBL,
CPALL, CPN, DIF, IVL, LH, and STEC.
Stock market slumped in 1H18. The Stock Exchange of
Thailand (SET) hit a peak of 1852 points in February but the index
has since headed downwards to end 1H18 at 1595.58, down
9.0% from end-2017. It underperformed regional peers which
dropped 5.5% during the same period. This was mainly due to
heavy selling by foreign investors.
Accumulate on dips. Our regional equity strategist rates
Thailand as Neutral in 3Q18. After tumbling over 200 points
from its recent peak in February, the Thai stock market is now
trading on a 2018 PE of 14.6x, which is in line with its historical
average. While the domestic economy is now on an upward
momentum, key risks are lingering concerns on; (i) the Thai baht
weakening against the greenback; (ii) the length and depth of
the US-China trade tension and its potential impact on global
growth; (iii) rising interest rate trend and; (iv) potential election
delays. We still prefer domestic plays and recommend investors
to accumulate on dips those strong fundamental stocks with
reasonable valuation and high yields. Among the sectors we like
are Commerce, Tourism, and Residential Property. The REIT
sector should also offers a safe bet amidst rising volatility.
Top picks for July 2018. They are Aeon Thana Sinsap (AEONTS),
Central Pattana (CPN), Land & Houses (LH), Digital Telecom
Infrastructure Fund (DIF) and Indorama Ventures (IVL).
Key themes and top picks for 2H18. We have five themes for
the market in 2H18: (i) Recovering domestic consumption and
elections (AEONTS, CPALL). (ii) EEC theme (AMATA, BBL, STEC),
(iii) Resilient earnings (ADVANC). (iv) High growth with
reasonable valuation (IVL, CPN). (v) Generous yields (DIF, LH).
SET : 1,607.27
Analyst Chanpen SIRITHANARATTANAKUL +662 857 7824 [email protected]
Thailand Research Team +662 658 1222 [email protected]
Key Indices
Current % Chng
SET Index 1607.27 0.73%
SET 100 Index 2339.76 0.82%
SET 50 Index 1058.12 0.62%
Bt/US$ Exchange Rate 33.16 0.36%
Daily Volume (m shrs) 12,098
Daily Turnover (US$m) 1,457
Source: Bloomberg Finance L.P.
Market Key Data
(%) EPS Gth Div Yield
2017F 6.0 3.1
2018F 10.0 3.6
2019F 8.0 3.8
(x) PE EV/EBITDA
2017F 16.1 8.3
2018F 14.6 7.6
2019F 13.5 7.2
DBS Group Research . Equity 3 Jul 2018
Thailand Market Focus
Strategy Refer to important disclosures at the end of this report
STOCKS
12-mth
Price Mkt Cap Target Performance (%)
Bt US$m Bt 3 mth 12 mth Rating
Aeon Thana Sinsap Thailand 168 1,268 208 (6.2) 55.1 BUY Amata Corporation 18.70 604 30.00 (10.1) 6.9 BUY Advanced Info Service 185 16,654 232 (11.1) 4.5 BUY Bangkok Bank 196 11,299 218 (0.8) 6.5 BUY CP ALL 73.50 19,991 95.00 (16.5) 18.1 BUY Central Pattana 69.75 9,478 85.00 (10.6) 3.3 BUY Digital Telecom Infrastructure Fund 14.50 4,231 15.90 (0.7) 0.0 BUY Indorama Ventures 54.75 9,197 71.00 (4.4) 42.2 BUY Land & Houses 11.30 4,089 12.80 7.6 10.8 BUY Sino-Thai Engineering 18.10 836 23.00 (5.2) (35.9) BUY
Source: DBSVTH, Bloomberg Finance L.P.
Closing price as of 29 Jun 2018

Market Focus
External risks trump local positives
Page 2
Our portfolio performance
Our top picks slightly outperformed the market in Jun 2018. The
value of our portfolio dropped 6.7% in Jun 2018, slightly
outperforming the general market which dropped 7.2% during
the same period. This was led by Land & Houses (LH), which
saw its share price increase 0.9% during the period. The stock
managed to stay in positive territory mainly due to Khun Anant
Asavabhokin’s announcement of a tender offer for 10% stakes
in LH at Bt11.80 apiece.
YTD…
The value of our portfolio rose 5.3% in 6M18, outperforming the
general market’s 9.0% loss. This was led by IVL and Aeon Thana
Sinsap (AEONTS).
Our picks slightly outperformed the market in June 2018
Source: DBSTH
Our monthly picks’ performance vs SET Index
Source: DBSTH
…and since end-February 2016. Our portfolio has posted an
impressive 132% price return since end-February 2016 when we
started to track our monthly performance vs the market’s 21%
rise during the same period.
Outperforming the market since we initiated our portfolio
Source: DBSTH
1- J un-18 29- J un-18 Change
AP 9.15 8.15 -10.9%
CK 26.50 23.90 -9.8%
IVL 57.75 54.75 -5.2%
LH 11.20 11.30 0.9%
CPN 76.25 69.75 -8.5%
-6.7%
Index change 1719.82 1595.58 -7.2%
Outperformance 0.5%
Our port folio's price return
-8.0%
-6.0%
-4.0%
-2.0%
0.0%
2.0%
4.0%
6.0%
8.0%
Jan
-17
Feb
-17
Mar
-17
Ap
r-1
7
May
-17
Jun
-17
Jul-
17
Au
g-1
7
Sep
-17
Oct
-17
No
v-1
7
De
c-1
7
Jan
-18
Feb
-18
Mar
-18
Ap
r-1
8
May
-18
Jun
-18
Market Our portfolio
80
100
120
140
160
180
200
220
240
260
280
Feb
-16
Ap
r-1
6
Jun
-16
Au
g-1
6
Oct
-16
De
c-16
Feb
-17
Ap
r-1
7
Jun
-17
Au
g-1
7
Oct
-17
De
c-17
Feb
-18
Ap
r-1
8
Jun
-18
Market
Our portfolio

Market Focus
External risks trump local positives
Page 3
Top picks for July 2018
Aeon Thana Sinsap (BUY; TP: Bt208)
We like AEONTS for its strong position in the retail finance
industry and strong balance sheet health. AEONTS is one of the
largest non-bank players in Thailand and commands the largest
share of the personal loan market. It also provides various other
finance services, including credit cards, hire purchase, debt
collection and insurance brokerage. More than half of its
revenue is derived from personal loans, followed by credit cards.
Improving consumer confidence, on the back of promising
economic growth outlook, should translate into stronger retail
spending, which is in turn the key driver for retail loan demand
and AEONTS’s operating performance.
Central Pattana (BUY; TP: Bt85.00)
CPN is Thailand's largest shopping mall developer. We like the
company for its dominant position in the industry, strong
recurring income base from its 32 quality shopping malls across
Thailand, clear expansion plans, solid management team and
strong earnings growth of 26% in 2018 and 13% in 2019. CPN
has a rock-solid balance sheet, with net gearing of only 3.4% at
end-1Q18. Our TP on the stock is Bt85, based on DCF valuation.
Digital Telecommunications Infrastructure Fund (BUY; TP:
Bt15.90)
DIF is one of the top picks under our telecommunications
coverage, thanks to its c.7% yield guaranteed over the long-
term. On 18 May 2018, DIF raised capital with total proceeds of
Bt53.2bn. The capital raised and additional debts of Bt2.0bn
issued were used to purchase Phase II assets (including fibre from
TRUE). With Phase II assets investment, distribution per unit
(DPU) is expected to increase from Bt1.01 in FY18F to Bt1.04 in
FY19F. The weighted average investment contract tenor is
extended from 12 years to 21 years post Phase II assets
acquisition
Indorama Ventures (BUY; TP: Bt71.00)
IVL is a global integrated polyethylene terephthalate/ purified
terephthalic acid (PET/PTA) producer with combined PET, fibre
and PTA capacity of 9.8mtpa. Including capacities for mono-
ethylene glycol (MEG) and other high value-added (HVA)
chemical products, its total capacity is currently 10.7mtpa. The
group operates production facilities in 21 countries, with its sales
footprint covering over 100 countries. We are still very positive
on IVL’s earnings outlook, which could be driven by sales volume
growth, increased contribution from HVA chemical products, as
well as improving margins from a balancing of the PET industry.
Land & Houses (BUY; TP: Bt12.80)
LH is Thailand’s leading residential property developer. The
company has several recurring income assets and investment
portfolio in listed companies such as Quality Houses (QH), Home
Product Center (HMPRO) and Land & Houses Bank (LHBANK).
We see several positive catalysts for LH including; i) potential
jump in pre-sales in 2018 amidst aggressive condominium
launches in 2Q18 and; ii) huge gain from US asset divestment in
2Q18. The tender offer by Khun Anant Asavabhokin for 10% of
its shares at Bt11.80 apiece should provide good support for
share price.
Stock picks for July 2018
Mkt Price Target % PE PBV Div Yield ROE
Bloomberg Cap 29 Jun Price Upside (x) (x) (%) (x)
Code (US$m) (Bt) (Bt) 18F 19F 18F 19F 18F 19F 18F Rcmd
AEONTS TB 1,268 167.50 208.00 24% 12.8 11.3 2.3 2.0 2.2 2.3 19.4 BUY CPN TB 9,479 69.75 85.00 22% 25.1 22.1 4.6 4.1 1.6 1.8 19.2 HOLD DIF TB 4,232 14.50 15.90 10% 14.4 14.0 0.6 0.6 7.0 7.2 6.7 BUY IVL TB 9,198 54.75 71.00 30% 13.3 11.1 2.2 1.9 2.6 3.2 17.2 BUY LH TB 4,089 11.30 12.80 13% 13.8 13.3 1.1 1.1 7.6 7.8 7.7 BUY
Source: Company, DBSVTH

Market Focus
External risks trump local positives
Page 4
Top picks for 2H18
Aeon Thana Sinsap (BUY; TP: Bt208)
We like AEONTS for its strong position in the retail finance
industry and strong balance sheet health. AEONTS is one of the
largest non-bank players in Thailand and commands the largest
share of the personal loan market. It also provides various other
finance services, including credit cards, hire purchase, debt
collection, and insurance brokerage. More than half of its
revenue is derived from personal loans, followed by credit cards.
Improving consumer confidence, on the back of promising
economic growth outlook, should translate into stronger retail
spending, which is in turn the key driver for retail loan demand
and AEONTS’s operating performance.
Amata Corporation (BUY; TP: Bt30)
AMATA should be a prime beneficiary of the Eastern Economic
Corridor (EEC) initiative, thanks to its huge land bank in both
Chonburi and Rayong, both of which are in the EEC area. While
current land sales remain weak, we see positive outlook for
foreign direct investments (FD)I and consequently land sales.
Thailand is having a general election early next year and more
infrastructure projects could be developed in the EEC area.
Advanced Info Service (BUY; TP: Bt232)
ADVANC is Thailand's largest cellular operator with over 40%
market share. We expect the company to show an earnings
turnaround with earnings growth of 13% this year and 10%
next year (after two years of earnings contraction), thanks to the
improving competitive landscape. Its earnings are also quite
resilient against the global economic slowdown. The stock now
offers a decent 2018 yield of 4.3% and 25% upside to our DCF-
based TP of Bt232.
Bangkok Bank (BUY; TP: Bt222)
We believe that the resumption of investments will play a key
role in driving Thailand’s economy and the banking sector in
general in 2018. Big banks should benefit from such
investments, given their large exposure to business loans
(corporate + SME loans), and so far their loan growth
momentum has reflected this. BBL fits into this theme and is our
top pick for the sector. Besides, we believe the recent
bancassurance agreement between BBL and AIA will also help
boost BBL’s fee income in 2018-19. BBL is one of the big banks
that would feel the least impact from the fee waiver scheme. At
Bt195.5, the stock is trading slightly below its book value of
equity per share (BVPS) at Bt201.5. It now offers a moderate
2018 dividend yield of 3.6%. We maintain BUY with a TP of
Bt222, based on the Gordon Growth Model, implying 1.0x
FY18F BV.
CP All (BUY; TP: Bt95)
CPALL is an operator of convenience stores (7-Eleven) in Thailand
with the highest market share. It also operates other related
businesses such as bill payment services, manufacturing and
sales of frozen foods and bakery. We like CPALL for its
dominant position in the industry, defensive nature, business
resilience, visible expansion plans and high return on assets
(ROE). With its strong product strategy and new products, we
expect CPALL to continue delivering healthy profits at a
compounded annual growth rate (CAGR) of 17% in the next
three years. We rate the stock a BUY with a DCF-based TP of
Bt95.
Central Pattana (BUY; TP: Bt85.00)
CPN is Thailand's largest shopping mall developer. We like the
company for its dominant position in the industry, strong
recurring income base from its 32 quality shopping malls across
Thailand, clear expansion plans, solid management team and
strong earnings growth of 26% in 2018 and 13% in 2019. CPN
has a rock-solid balance sheet, with net gearing of only 3.4% at
end-1Q18. Our TP on the stock is Bt85, based on DCF valuation.
Digital Telecommunications Infrastructure Fund (BUY; TP:
Bt15.90)
DIF is one of the top picks under our telecommunications
coverage, thanks to its c.7% yield guaranteed over the long-
term. On 18 May 2018, DIF raised capital with total proceed of
Bt53.2bn. The capital raised and additional debts of Bt2.0bn
issued were used to purchase Phase II assets (including fibre from
TRUE. With Phase II assets investment, DPU is expected to
increase from Bt1.01 in FY18F to Bt1.04 in FY19F. The weighted
average investment contract tenor is extended from 12 years to
21 years post Phase II assets acquisition.
Indorama Ventures (BUY; TP: Bt71.00)
IVL is a global integrated polyethylene terephthalate/ purified
terephthalic acid (PET/PTA) producer with combined PET, fibre
and PTA capacity of 9.8mtpa. Including capacities for mono-
ethylene glycol (MEG) and other high value-added (HVA)
chemical products, its total capacity is currently 10.7mtpa. The
group operates production facilities in 21 countries, with its sales
footprint covering over 100 countries. We are still very positive
on IVL’s earnings outlook, which could be driven by sales volume
growth, increased contribution from HVA chemical products, as
well as improving margins from a balancing of the PET industry.

Market Focus
External risks trump local positives
Page 5
Land & Houses (BUY; TP: Bt12.80)
LH is Thailand’s leading residential property developer. The
company has several recurring income assets and investment
portfolio in listed companies such as Quality Houses (QH), Home
Product Center (HMPRO) and Land & Houses Bank (LHBANK).
We see several positive catalysts for LH including; i) potential
jump in pre-sales in 2018 amidst aggressive condominium
launches in 2Q18 and; ii) huge gain from US asset divestment in
2Q18. The tender offer by Khun Anant Asavabhokin for 10% of
its shares at Bt11.80 apiece should provide good support for
share price.
Sino-Thai Engineering (BUY; TP: Bt23)
One of Thailand’s top four construction contractors, STEC should
be a prime beneficiary of rising infrastructure spending next year.
We like the company for its large backlog of about Bt120bn which
should provide revenue stream for the next 4-5 years, more project
wins next year, strong earnings growth outlook and solid balance
sheet with a net cash position. We believe concerns over losses at
the Parliament House project should have already been priced in.
Our TP on the stock is Bt23, based on 30x and 25x PE for this year
and next, respectively.
Stock picks for 2H18
Mkt Price Target % PE PBV Div Yield ROE
Bloomberg Cap 29 Jun Price Upside (x) (x) (%) (x)
Code (US$m) (Bt) (Bt) 18F 19F 18F 19F 18F 19F 18F Rcmd
AEONTS TB 1,268 167.50 208.00 24% 12.8 11.3 2.3 2.0 2.2 2.3 19.4 BUY AMATA TB 604 18.70 30.00 60% 11.9 9.9 1.5 1.3 3.4 4.0 12.9 BUY ADVANC TB 16,654 185.00 232.00 25% 16.2 14.8 8.9 7.4 4.3 4.7 60.3 BUY BBL TB 11,300 195.50 218.00 12% 10.5 10.0 0.9 0.8 3.6 3.8 8.6 BUY CPALL TB 19,992 73.50 95.00 29% 29.1 25.1 7.5 6.5 1.7 2.0 27.7 BUY CPN TB 9,479 69.75 85.00 22% 25.1 22.1 4.6 4.1 1.6 1.8 19.2 BUY DIF TB 4,232 14.50 15.90 10% 14.4 14.0 0.6 0.6 7.0 7.2 6.7 BUY IVL TB 9,198 54.75 71.00 30% 13.3 11.1 2.2 1.9 2.6 3.2 17.2 BUY LH TB 4,089 11.30 12.80 13% 12.6 13.8 2.6 2.5 6.6 6.1 20.7 BUY STEC TB 836 18.10 23.00 27% 23.7 20.0 2.8 2.6 2.1 2.5 12.2 BUY
Source: Company, DBSVTH

Market Focus
External risks trump local positives
Page 6
Stock Picks
BUY Bt167.50 Forecasts and Valuation
Aeon Thana Sinsap Thailand (AEONTS TB; TP: Bt208.00)
Robust outlook
FY Feb (Btm) 2016A 2017A 2018F 2019F
Pre-prov. Profit 8,140 8,392 9,323 10,545
Net Profit 2,403 2,966 3,277 3,708
Net Pft (Pre Ex.) 2,403 2,966 3,277 3,708
Net Pft Gth (Pre-ex) (%) (7.4) 23.4 10.5 13.1
EPS (Bt) 9.61 11.9 13.1 14.8
EPS Pre Ex. (Bt) 9.61 11.9 13.1 14.8
EPS Gth Pre Ex (%) (7) 23 10 13
Diluted EPS (Bt) 9.61 11.9 13.1 14.8
PE Pre Ex. (X) 17.4 14.1 12.8 11.3
Net DPS (Bt) 3.45 3.85 3.65 3.90
Div Yield (%) 2.1 2.3 2.2 2.3
ROAE Pre Ex. (%) 18.6 20.2 19.4 19.1
ROAE (%) 18.6 20.2 19.4 19.1
ROA (%) 3.3 3.9 3.9 3.9
BV Per Share (Bt) 54.8 62.9 72.2 83.3
P/Book Value (x) 3.1 2.7 2.3 2.0
Source: Company, DBSVTH
▪ AEONTS is one of the largest non-bank players in Thailand
and commands the largest share of the personal loan
market. More than half of its revenues are derived from
personal loans, followed by credit cards
▪ AEONTS’s retail finance businesses, as well as debt
collection (both for itself and others), should see stronger
performance this year in line recovering domestic
economy. Though credit card business will be the key
driver for FY18 top-line growth, AEONTS’s spread should
still be maintained, as the company expects to roll over
some of its long-term debts at lower interest rates
▪ Strong growth prospects remain for its overseas
businesses. Currently, its overseas operations collectively
contribute only 3% to AEONTS’s top-line and 2% to the
bottom-line. AEONTS expects revenue and earnings
contribution from CLM countries to reach 10% by 2020,
driven by a younger population, better yields, and stronger
asset quality in those countries, relative to Thailand’s
▪ Trading at undemanding valuations of 2.3x FY18F P/BV
and 12.7x FY18F PE, with a dividend yield of 2.2%. Our TP
is based on the Gordon Growth Model and implies 2.9x
FY18F P/BV and 15.9x FY18F PE.
BUY Bt18.70 Forecasts and Valuation
Amata Corporation (AMATA TB; TP: Bt30.0)
A key beneficiary of the EEC
FY Dec (Btm) 2016A 2017A 2018F 2019F
Revenue 4,427 4,491 5,169 6,131
EBITDA 2,496 2,563 2,965 3,572
Pre-tax Profit 1,662 2,019 2,352 2,836
Net Profit 1,198 1,409 1,680 2,015
Net Pft (Pre Ex.) 1,438 1,409 1,680 2,015
Net Pft Gth (Pre-ex) (%) 66.3 (2.0) 19.2 20.0
EPS (Bt) 1.12 1.32 1.57 1.89
EPS Pre Ex. (Bt) 1.35 1.32 1.57 1.89
EPS Gth Pre Ex (%) 66 (2) 19 20
Diluted EPS (Bt) 1.12 1.32 1.57 1.89
Net DPS (Bt) 0.45 0.53 0.63 0.76
BV Per Share (Bt) 11.2 11.8 12.7 13.9
PE (X) 16.7 14.2 11.9 9.9
PE Pre Ex. (X) 13.9 14.2 11.9 9.9
P/Cash Flow (X) 12.1 16.9 15.2 14.8
EV/EBITDA (X) 10.7 11.3 10.5 9.4
Net Div Yield (%) 2.4 2.8 3.4 4.0
P/Book Value (X) 1.7 1.6 1.5 1.3
Net Debt/Equity (X) 0.3 0.4 0.5 0.6
ROAE (%) 10.4 11.5 12.9 14.2
Source: Company, DBSVTH
▪ We see Amata among the first key beneficiaries of the EEC
given its huge 13,634 rai (1 rai = 0.4 acre) land bank in
Chonburi and Rayong. Land prices in the area should
continue to rise as more infrastructure projects are
developed.
▪ Increased contribution from its power business should be
another key earnings driver during 2018-2019 and should
help reduce its earnings volatility going forward. Its
megawatt (MW) share by equity will jump by 58% from
165MW currently to 260MW by end-2018, as three new
power plants in Rayong start commercial operations.
▪ Rising contribution from Vietnam. Amata Vietnam, its
subsidiary, has secured three investment certificates to
develop a high-tech industrial park (410ha, 1ha = 6.25 rai),
a service city (107ha) and a township (753ha) in Long
Thanh. The company is now undertaking a land
compensation process for the hi-tech park and expects to
start construction and land sales in late 2018. We
conservatively assume revenue contribution from Long
Thanh to come in from 2019 onwards.

Market Focus
External risks trump local positives
Page 7
BUY Bt185.00 Forecasts and Valuation
Advanced Info Service (ADVANC TB; TP: Bt232.0)
Safer bet on the telecommunications sector
FY Dec (Btm) 2016A 2017F 2018F 2019F
FY Dec (Btm) 2016A 2017A 2018F 2019F
Revenue 152,150 157,722 166,978 176,039
EBITDA 61,263 70,969 77,627 85,618
Pre-tax Profit 35,841 35,916 39,478 43,355
Net Profit 30,667 30,077 33,854 37,096
Net Pft (Pre Ex.) 30,389 29,852 33,854 37,096
Net Pft Gth (Pre-ex) (%) (21.9) (1.8) 13.4 9.6
EPS (Bt) 10.3 10.1 11.4 12.5
EPS Pre Ex. (Bt) 10.2 10.0 11.4 12.5
EPS Gth Pre Ex (%) (22) (2) 13 10
Diluted EPS (Bt) 10.3 10.1 11.4 12.5
Net DPS (Bt) 10.1 7.08 7.97 8.73
BV Per Share (Bt) 14.3 16.9 20.8 24.9
PE (X) 18.6 18.9 16.8 15.3
PE Pre Ex. (X) 18.7 19.1 16.8 15.3
P/Cash Flow (X) 9.5 11.4 7.0 7.2
EV/EBITDA (X) 10.7 9.4 8.6 7.7
Net Div Yield (%) 5.3 3.7 4.2 4.6
P/Book Value (X) 13.4 11.3 9.2 7.7
Net Debt/Equity (X) 2.0 1.9 1.6 1.2
Source: Company, DBSVTH
▪ We expect to see the earnings turnaround in FY18F after
two years of earnings contraction, thanks to the improving
competitive landscape.
▪ Due to more favourable terms of 1800MHz spectrum
auction (9 license with 5MHz bandwidth per license), we
expect ADVANC to participate in the auction to be set on
19 August 2018.
▪ Pending for the official auction rules to be published on
the Royal Gazette on 5 July 2018, there could be a
potential Capex revision in our forecast post the
announcement.
▪ We like ADVANC for the earnings turnarounds story in
FY18F/FY19F, and dividend yield of c.4% over the next
two years. In addition, ADVANC could potentially benefit
from the relaxation of the 1800MHz auction rule. We think
ADVANC will be a safer bet for the telecommunication
sector during this period.
BUY Bt195.00 Forecasts and Valuation
Bangkok Bank (BBL TB; TP: Bt218.0)
Riding the investment cycle
FY Dec (Btm) 2016A 2017A 2018F 2019F
Pre-prov. Profit 55,256 63,315 64,586 68,114
Net Profit 31,815 33,009 35,383 37,352
Net Pft (Pre Ex.) 31,815 33,009 35,383 37,352
Net Pft Gth (Pre-ex) (%) (6.9) 3.8 7.2 5.6
EPS (Bt) 16.7 17.3 18.5 19.6
EPS Pre Ex. (Bt) 16.7 17.3 18.5 19.6
EPS Gth Pre Ex (%) (7) 4 7 6
Diluted EPS (Bt) 16.7 17.3 18.5 19.6
PE Pre Ex. (X) 11.7 11.3 10.5 10.0
Net DPS (Bt) 6.50 6.50 7.00 7.50
Div Yield (%) 3.3 3.3 3.6 3.8
ROAE Pre Ex. (%) 8.6 8.5 8.6 8.6
ROAE (%) 8.6 8.5 8.6 8.6
ROA (%) 1.1 1.1 1.1 1.1
BV Per Share (Bt) 199 210 222 235
P/Book Value (x) 1.0 0.9 0.9 0.8
Source: Company, DBSVTH
▪ With its large exposure to business loans (41% corporate +
30% SME), BBL should be one of the banks to clinch the
opportunity to grow amid a widely expected investment
upcycle that can lead to a loan demand recovery in 2018.
Besides, with the bank’s strong position in international
loans (15% of its total portfolio, the highest among
Thailand banks), BBL stands to seize the opportunities
arising from regionalisation and urbanisation
▪ We believe decent top line growth (+5% y-o-y) and lower
provision expense (-10% y-o-y) will be the key earnings
growth (+11% y-o-y) drivers for BBL in FY18F
▪ BBL targets to grow its loan portfolio by 5-6% in 2018,
driven by infrastructure-related investments, auto-supply
chain investments, investment resumption from property
developers, and energy-related investments. Fee income is
expected to grow in the mid-to-high single digits, with
new bancassurance agreement with AIA to be a fee
income booster from 2H18 going forward.
▪ The bank believes its NPL ratio would be stable from 2017,
while it targets to set aside some Bt20bn provisions in
2018, vs. Bt22bn in 2017.

Market Focus
External risks trump local positives
Page 8
BUY Bt73.50 Forecasts and Valuation
CPALL (CPALL TB; TP: Bt95.00)
A strong player among domestic retailers
FY Dec (Btm) 2016A 2017A 2018F 2019F
Revenue 434,712 471,069 521,283 568,504
EBITDA 36,473 40,788 45,017 49,518
Pre-tax Profit 20,142 23,506 27,585 32,308
Net Profit 16,677 19,908 22,725 26,306
Net Pft (Pre Ex.) 16,599 19,908 22,725 26,306
Net Pft Gth (Pre-ex) (%) 21.3 19.9 14.1 15.8
EPS (Bt) 1.86 2.22 2.53 2.93
EPS Pre Ex. (Bt) 1.85 2.22 2.53 2.93
EPS Gth Pre Ex (%) 21 20 14 16
Diluted EPS (Bt) 1.86 2.22 2.53 2.93
Net DPS (Bt) 0.90 1.00 1.26 1.46
BV Per Share (Bt) 6.14 8.38 9.86 11.3
PE (X) 39.6 33.2 29.1 25.1
PE Pre Ex. (X) 39.8 33.2 29.1 25.1
P/Cash Flow (X) 17.4 14.3 15.9 15.3
EV/EBITDA (X) 22.5 19.7 17.5 15.7
Net Div Yield (%) 1.2 1.4 1.7 2.0
P/Book Value (X) 12.0 8.8 7.5 6.5
Net Debt/Equity (X) 2.6 1.7 1.3 1.0
ROAE (%) 36.0 30.5 27.7 27.6
Source: Company, DBSVTH
▪ We don’t expect SSSG to rebound significantly this year
but should be at least at a low to mid-single-digit pace for
CPALL.
▪ CPALL’s cash-and-carry business might be pressured by the
opening of new stores overseas, which will still contribute
losses to the group.
▪ However, we expect its convenient store business to still be
miles ahead of its competitors and continue to do well
with positive SSSG, with new products and services to
cater customers’ changing demand.
▪ The strong operations of CVS would lead to solid earnings
growth (FY18F earnings growth forecast of 16% y-o-y) for
the whole group.
BUY Bt76.25 Forecasts and Valuation
Central Pattana (CPN, TP: Bt85.00)
More condominium revenue in 2Q and 3Q18
FY Dec (Btm) 2016A 2017A 2018F 2019F
Revenue 27,634 28,785 35,631 39,522
EBITDA 16,762 17,444 21,098 23,656
Pre-tax Profit 11,033 15,464 14,868 16,881
Net Profit 9,244 13,567 12,468 14,136
Net Pft (Pre Ex.) 9,244 9,892 12,468 14,136
Net Pft Gth (Pre-ex) (%) 17.3 7.0 26.0 13.4
EPS (Bt) 2.06 3.02 2.78 3.15
EPS Pre Ex. (Bt) 2.06 2.20 2.78 3.15
EPS Gth Pre Ex (%) 17 7 26 13
Diluted EPS (Bt) 2.06 3.02 2.78 3.15
Net DPS (Bt) 0.83 1.40 1.11 1.26
BV Per Share (Bt) 11.6 13.8 15.1 17.2
PE (X) 33.9 23.1 25.1 22.1
PE Pre Ex. (X) 33.9 31.6 25.1 22.1
P/Cash Flow (X) 21.8 11.8 20.9 18.5
EV/EBITDA (X) 19.6 18.3 15.5 14.0
Net Div Yield (%) 1.2 2.0 1.6 1.8
P/Book Value (X) 6.0 5.1 4.6 4.1
Net Debt/Equity (X) 0.3 0.1 0.2 0.2
ROAE (%) 18.9 23.8 19.2 19.5
Source: Company, DBSVTH
▪ Strong recurring income base from 32 quality shopping
malls across Thailand. These malls enjoyed high average
occupancy rate of 91% at end 1Q18. This should
improve steadily in 4Q18 and 2019, when major
renovation at CentralWorld is completed and tenants
open their shops.
▪ CPN has a clear expansion plan and is targeting to grow
revenue by 13% CAGR during 2018-2022. This will be
achieved via; (i) rental reversion of 3-5% per annum and
improve in occupancies; (ii) asset enhancement; (iii)
opening of 2-3 new malls per annum and; (iv) expansion
into other assets (e.g. residential, office, hotels, etc.) to
complement its mall business.
▪ Strong earnings growth of 26% this year and 13% next
year. Note that residential condominium revenue will
start to kick in this year. In 1Q18, CPN started to realise
Bt216m revenue from its condominiums. We expect
more revenue to be realised in 2Q and 3Q18, as the
company transfers units at three condominium projects to
its buyers.

Market Focus
External risks trump local positives
Page 9
BUY Bt14.50 Forecasts and Valuation
Digital Telecommunications Infrastructure Fund (DIF, TP: Bt15.90)
Lofty yield with secured long-term income streams
FY Dec (Btm) 2016A 2017A 2018F 2019F
Revenue 6,381 6,741 9,755 11,854
EBITDA 6,111 6,477 9,358 11,390
Pre-tax Profit 18,855 11,105 7,786 9,987
Net Profit 18,855 11,105 7,786 9,987
Net Pft (Pre Ex.) 5,370 5,687 7,786 9,987
Net Pft Gth (Pre-ex) (%) 6.4 5.9 36.9 28.3
EPS (Bt) 3.25 1.91 1.01 1.04
EPS Pre Ex. (Bt) 0.92 0.98 1.01 1.04
EPS Gth Pre Ex (%) 6 6 3 3
Diluted EPS (Bt) 3.25 1.91 1.01 1.04
Net DPS (Bt) 0.96 0.98 1.01 1.04
BV Per Share (Bt) 14.6 15.6 24.7 24.7
PE (X) 4.5 7.6 14.4 14.0
PE Pre Ex. (X) 15.7 14.8 14.4 14.0
P/Cash Flow (X) 16.0 13.8 12.2 13.7
EV/EBITDA (X) 15.8 16.8 14.7 14.5
Net Div Yield (%) 6.6 6.7 7.0 7.2
P/Book Value (X) 1.0 0.9 0.6 0.6
Net Debt/Equity (X) 0.1 0.3 0.2 0.2
ROAE (%) 24.1 12.7 6.7 7.0
Source: Company, DBSVTH
▪ DIF raised additional capital of Bt53.2bn on 18 May 2018,
with the final offering price of Bt13.90 per share.
▪ The proceeds from share offering and additional debt
issuance of Bt2.0bn are used to buy new fibre and tower
from TRUE (Phase II assets), worth of Bt55.2bn.
▪ With Phase II asset, DPU is expected to increase from
Bt1.01 in FY18F to Bt1.04 in FY19F. Additionally, the
weighted average rental agreement tenor has been
extended from 12 years to 21 years.
▪ We like DIF for its c.7% yield and its long-term rental
guarantee, which is highly attractive as compared to other
options available in the market.
▪ Our Bt15.90 TP is based on DCF.
BUY Bt54.75 Forecasts and Valuation
Indorama Ventures (IVL, TP: Bt71.00)
Strong growth outlook continues in FY18-FY19
FY Dec (Btm) 2016A 2017A 2018F 2019F
Revenue 254,620 286,332 331,130 358,471
EBITDA 26,951 34,946 45,065 49,570
Pre-tax Profit 18,421 23,218 28,118 32,227
Net Profit 16,197 20,883 21,566 25,903
Net Pft (Pre Ex.) 9,563 16,610 21,566 25,903
Net Pft Gth (Pre-ex) (%) 225.8 73.7 29.8 20.1
EPS (Bt) 3.36 4.19 4.11 4.94
EPS Pre Ex. (Bt) 1.99 3.33 4.11 4.94
EPS Gth Pre Ex (%) 226 68 23 20
Diluted EPS (Bt) 3.36 4.19 4.11 4.94
Net DPS (Bt) 0.66 0.63 1.44 1.73
BV Per Share (Bt) 18.5 22.3 25.4 28.7
PE (X) 16.3 13.1 13.3 11.1
PE Pre Ex. (X) 27.6 16.4 13.3 11.1
P/Cash Flow (X) 10.6 9.4 5.7 7.6
EV/EBITDA (X) 13.3 10.3 8.0 7.0
Net Div Yield (%) 1.2 1.1 2.6 3.2
P/Book Value (X) 3.0 2.5 2.2 1.9
Net Debt/Equity (X) 1.0 0.7 0.5 0.4
ROAE (%) 19.2 20.3 17.2 18.2
Source: Company, DBSVTH
▪ Strong earnings growth of 30% in 2018F to be driven by
sales volume growth from its acquisition and higher
contribution from HVA products
▪ Increase in earnings before interest, taxes, depreciation and
amortisation per tonne (EBITDA/tonne) in 2018 and
beyond, thanks to the wider spread of PET given the global
PET industry rebalancing, anti-dumping investigation of
PET imports in the US and Canada, and import ban on
waste plastic in China effective from Jan 2018
▪ Several acquisitions of HVA products since 2016 have
enhanced its market positioning in specialty chemical
markets, which would be the key factor in stabilising IVL’s
core EBITDA/tonne in the longer term given its steady
margins
▪ Maintain BUY with TP of Bt71, pegged to 17.5x FY18F PE.

Market Focus
External risks trump local positives
Page 10
BUY Bt11.30 Forecasts and Valuation
Land & Houses (LH TB; TP: Bt12.80)
Offering generous yield of 6.6% with low risks FY Dec (Btm) 2016A 2017A 2018F 2019F
Revenue 29,909 34,922 36,781 35,115
EBITDA 10,796 12,465 13,018 13,102
Pre-tax Profit 10,142 11,790 12,331 11,328
Net Profit 8,618 10,463 10,599 9,686
Net Pft (Pre Ex.) 7,997 9,459 9,676 9,686
Net Pft Gth (Pre-ex) (%) 18.5 18.3 2.3 0.1
EPS (Bt) 0.73 0.89 0.90 0.82
EPS Pre Ex. (Bt) 0.68 0.80 0.82 0.82
EPS Gth Pre Ex (%) 18 18 2 0
Diluted EPS (Bt) 0.73 0.89 0.90 0.82
Net DPS (Bt) 0.65 0.75 0.75 0.69
BV Per Share (Bt) 3.98 4.19 4.36 4.47
PE (X) 15.5 12.7 12.6 13.8
PE Pre Ex. (X) 16.7 14.1 13.8 13.8
P/Cash Flow (X) 18.1 13.4 14.7 9.5
EV/EBITDA (X) 16.2 14.3 14.0 13.8
Net Div Yield (%) 5.8 6.6 6.6 6.1
P/Book Value (X) 2.8 2.7 2.6 2.5
Net Debt/Equity (X) 0.8 0.9 0.9 0.9
ROAE (%) 18.6 21.6 20.7 18.4
Source: Company, DBSVTH
▪ Thailand’s leading residential property developer
▪ 2Q18 earnings to be boosted by gain from divestment of
one of its US assets
▪ Planning for aggressive new project launches this year,
which should help boost presales in 2018
▪ Offering generous dividend yield of 6.6% at current price
▪ Downside risk protected near-term, as Khun Anant
Asavabhokhin will make a voluntary partial tender offer to
purchase 10% of LH shares at Bt11.80 apiece. This should
help support LH’s share price near term.
▪ Maintain BUY with Bt12.80 price, based on RNAV
BUY Bt18.10 Forecasts and Valuation
Sino-Thai Engineering & Con. (STEC TB; TP: Bt23.00)
Time to ride the investment cycle
FY Dec (Btm) 2016A 2017A 2018F 2019F
Revenue 17,953 20,075 25,121 30,183
EBITDA 1,515 (1,440) 1,726 2,089
Pre-tax Profit 1,753 (797) 1,446 1,720
Net Profit 1,381 (611) 1,164 1,383
Net Pft (Pre Ex.) 906 (1,390) 1,164 1,383
Net Pft Gth (Pre-ex) (%) (16.0) nm nm 18.8
EPS (Bt) 0.91 (0.4) 0.76 0.91
EPS Pre Ex. (Bt) 0.59 (0.9) 0.76 0.91
EPS Gth Pre Ex (%) (16) nm nm 19
Diluted EPS (Bt) 0.91 (0.4) 0.76 0.91
Net DPS (Bt) 0.26 0.22 0.38 0.45
BV Per Share (Bt) 6.79 6.04 6.44 6.96
PE (X) 20.0 nm 23.7 20.0
PE Pre Ex. (X) 30.5 nm 23.7 20.0
P/Cash Flow (X) 65.6 30.8 15.6 nm
EV/EBITDA (X) 17.5 nm 13.5 11.9
Net Div Yield (%) 1.4 1.2 2.1 2.5
P/Book Value (X) 2.7 3.0 2.8 2.6
Net Debt/Equity (X) CASH CASH CASH CASH
ROAE (%) 14.1 (6.2) 12.2 13.5
Source: Company, DBSVTH
▪ Expect Bt643bn infrastructure to be up for bidding in
FY18F to be a key catalyst to drive up the share price
▪ STEC has already bought the Term Of References (TORs) of
the Bt237bn of the EEC track high-speed railway for 3
international airports, implying its intention to participate
in this PPP project
▪ STEC’s backlog stood at Bt125bn as of 31 Mar 18 (vs
average 5-year backlogs of Bt50bn), implying more than
four years of its revenue
▪ Expect FY19F earnings to turn into positive with a strong
earnings growth (vs its FY17 loss of Bt1.4bn due to the
recorded provision from its construction projects)
▪ Our TP on STEC is Bt23, based on 30x FY18F PE

Market Focus
External risks trump local positives
Page 11
Politics
Coronation before general election
According to Prime Minister Prayut Chan-o-cha, His Majesty King
Maha Vajiralongkorn’s coronation will take place before the
general election next year. His Majesty King ascended the throne
on December 26, 2016, but the date for his coronation has not
been determined yet. It is widely expected that the general
election will be held in February 2019.
Economy
1Q18 GDP rose 4.8% y-o-y, beating consensus estimates
Gross Domestic Product (GDP) rose 4.8% y-o-y in 1Q18, the
highest in 5 years. This was boosted by all economic engines.
Private consumption grew 3.6% y-o-y, due to an expansion in
service items (+4.9%), non-durable (+2.0%) and semi-durable
items (+2.4%). Durable items expanded by 9.4%. Government
consumption increased 1.9% y-o-y. Gross fixed capital formation
rose 3.4% y-o-y. Private investment grew 3.1% due to an
expansion of both construction and machinery items. Public
investment increased 4.0% due mainly to the growth of
investment in machineries while construction dropped slightly.
For the external sector, exports/imports of goods and services
rose by 6.0% and 9.0% respectively. After seasonal adjustments,
the Thai economy expanded by 2.0% q-o-q in 1Q18.
Thailand’s quarterly GDP growth
Source: National Economic and Social Development Board, DBSVTH
Thailand’s GDP breakdown
Source: National Economic and Social Development Board, DBSVTH
Growth momentum continued in April and May 2018
Domestic demand continued to expand, led by private
consumption which increased in all spending categories. Farm
income showed strong improvement, supported by higher
agricultural production.
Private investment also showed encouraging signs. Public
spending expanded in both current and capital spending.
Private consumption index
Source: Bank of Thailand, DBSVTH
Thailand’s nominal farm income
Source: Bank of Thailand, Office of Agricultural Economics, DBSVTH
Export continued its robust performance, rising 12% and 11% y-
o-y in April and May 2018. Growth came mainly from all
markets except the Middle East. In terms of products, products
showing strong export growth in 5M18 included vehicles & parts
+20%, plastic pellets +20%, chemicals +27%, finished oil +37%,
rice +21%, tapioca products +20%, frozen and processed
chicken +14%, etc.
3.1
3.63.2
3.03.3
3.8
4.34.0
4.8
1.0 0.90.5 0.5
1.3 1.41.0
0.5
2.0
0.0
1.0
2.0
3.0
4.0
5.0
6.0
1Q16 2Q16 3Q16 4Q16 1Q17 2Q17 3Q17 4Q17 1Q18
%
GDP (yoy) GDP (q-o-q SA)
(% y-o-y) 4Q17 1Q18
GDP Growth 4.0 4.8
Private consumption 3.4 3.6
Private investment 2.4 3.1
Government consumption 0.2 1.9
Publ ic investment -6.0 4.0
Exports of goods & services 11.6 9.9
Imports of goods & services 14.6 16.3
Headl ine Inflation 0.9 0.6
0%
1%
2%
3%
4%
5%
6%
7%
8%
80
85
90
95
100
105
110
115
120
125
130
Jan-
16
Mar
-16
May
-16
Jul-
16
Sep
-16
No
v-16
Jan-
17
Mar
-17
May
-17
Jul-
17
Sep
-17
No
v-17
Jan-
18
Mar
-18
May
-18
Private Consumption Index YoY Growth (RHS)
-20%
-10%
0%
10%
20%
30%
40%
Jan
-16
Ma
r-16
Ma
y-1
6
Jul-
16
Sep
-16
No
v-1
6
Jan
-17
Ma
r-17
Ma
y-1
7
Jul-
17
Sep
-17
No
v-1
7
Jan
-18
Ma
r-18
Ma
y-1
8
Nominal farm income
Agricultural production
Agricultural price

Market Focus
External risks trump local positives
Page 12
Thailand’s monthly exports
Source: Ministry of Commerce, DBSVTH
Thailand’s export markets are quite diversified. The country does not rely too much on any single market. China and the US are both key export markets, representing 12.0% and 10.7% of the country’s total exports in 5M18.
Thailand’s monthly export by markets
Source: Ministry of Commerce, DBSVTH
Tourist arrivals continued to grow, albeit at a softer rate of 9.4% and 6.4% in Apr and May 2018, respectively. This was down from 15.4% growth in 1Q18. For 5M18, total tourist arrivals to Thailand were 16.5m people, up 12.6% y-o-y.
Thailand’s tourist arrivals
Source: BOT, DBSVTH
Thailand’s tourist arrivals by country of origin
Source: Ministry of Tourism and Sports, DBSVTH
Financial stability
Headline and core inflation increased slightly
Headline inflation accelerated to +1.49% y-o-y in May 2018,
from 1.07% in the previous month. This was due to increased
retail petroleum and liquefied petroleum gas (LPG) prices, as well
as accelerated core inflation +0.80% y-o-y.
For 5M18, headline inflation grew 0.89% y-o-y. Core inflation
(excluding raw food and energy) inched up 0.66% y-o-y, while
energy prices surged 4.28% and raw food eased 0.49%.
-15%
-10%
-5%
0%
5%
10%
15%
20%
10
12
14
16
18
20
22
24
Jan
-15
Ap
r-1
5
Jul-
15
Oct
-15
Jan
-16
Ap
r-1
6
Jul-
16
Oct
-16
Jan
-17
Ap
r-1
7
Jul-
17
Oct
-17
Jan
-18
Ap
r-1
8
US$bn
Exports (US$bn) YoY Growth (RHS)
Expo rt
M ay-18 5M 18 M ay-18 5M 18 M ay-18 5M 18
Total 22,257 104,032 11.4 11.6 100.0 100.0
1.Matured mk t 6,693 31,318 8.2 13.0 30.1 30.1
USA 2,435 11,126 3.9 7.9 10.9 10.7
Japan 2,229 10,430 11.6 20.3 10.0 10.0
EU 15 2,029 9,762 10.0 11.8 9.1 9.4
2.Dy namic mk t 11,462 53,082 13.7 11.1 51.6 51.0
ASEAN 9 5,934 27,059 14.8 13.1 26.7 26.0
ASEAN 5 3,394 15,580 12.9 11.2 15.2 15.0
CLMV 4 2,540 11,479 17.3 15.8 11.4 11.0
China 2,709 12,443 14.8 6.6 12.2 12.0
South Asia 8 996 4,786 24.8 24.7 4.6 4.6
India 725 3,306 31.2 31.0 3.3 3.2
3.Other mk ts 3,750 17,782 8.4 11.9 16.8 17.1
The Australia 25 1,271 5,529 20.9 15.9 5.7 5.3
Middle East 15 734 3,678 -14.1 2.0 3.3 3.5
Russia and CIS 102 557 7.7 32.5 0.5 0.5
Value (US$ m) Gro wth (% y-o -y) C o ntribut io n
Count ry % of
Total 4Q17 1Q18 A pr-18 May -18
China 27.7 67.2 30.2 31.9 14.0
Hong Kong 2.3 24.6 31.2 -5.9 25.7
Malaysia 9.5 -7.6 3.9 -4.4 -7.3
ASEAN exc. Malaysia 16.3 15.7 10.6 6.1 8.6
Asia exc China & Malaysia 29.6 17.5 11.7 5.7 9.2
Russia 3.8 21 26.6 18.5 -13.0
Europe exc. Russia 14.6 2.6 8.2 -6.1 3.6
Middle East 2.2 -5.6 -3.2 -17.8 -31.3
Total 100.0 19.5 15.4 9.4 6.4
% Change y -o-y

Market Focus
External risks trump local positives
Page 13
Headline and core inflation (y-o-y change)
Source: Ministry of Commerce, DBSVTH
Breakdown of headline inflation and growth
Source: Ministry of Commerce, DBSVTH
Unemployment rate remained low at 1.0%
Unemployment rate eased slightly to 1.0% in May 2018, due to
the falling employment rate in the service sector. Nonetheless,
employment rates in the agriculture, manufacturing and
construction sectors increased.
External stability remained strong and resilient
Thailand’s external stability remained strong and should be able
to withstand volatility in global financial markets.
External stability indicators
Source: BOT, DBSVTH
Thailand’s current account balance and as a % of GDP
Source: BOT, DBSVTH
Thailand’s international reserve
Source: BOT, DBSVTH
-1
-0.5
0
0.5
1
1.5
2
Jan
-16
Mar
-16
May
-16
Jul-
16
Sep
-16
Nov
-16
Jan
-17
Mar
-17
Ma
y-1
7
Jul-
17
Sep
-17
Nov
-17
Jan
-18
Ma
r-1
8
May
-18
%
Headline CPI Core CPI
Weight
% Apr-18 May-18 5M18
All commodities 100.0 1.07 1.49 0.89
Food & Non-alcohol beverages 36.1 0.68 0.74 0.31
Meat, poultry and fi sh 6.5 -0.42 -0.45 -1.18
Vegetable & frui ts 4.5 1.48 0.22 0.15
Prepared food - at home 8.7 1.24 1.37 1.25
Food away from home 8.5 0.95 1.31 0.99
Non Food & beverages 63.9 1.31 1.93 1.23
Hous ing & Furnishing 22.8 1.50 1.12 1.34
Transport & Communication 24.3 1.41 3.31 1.33
- Publ ic transportation 2.0 0.47 0.67 0.52
- Fuel 8.1 3.90 9.86 5.51
- Commu. & equipment 4.2 -0.05 -0.06 -0.04
Tobacco & a lcohol beverages 1.6 5.98 5.94 5.94
Core inflation * 72.5 0.64 0.80 0.66
Raw food & energy 27.5 2.27 3.36 1.53
Raw food 15.5 0.49 0.24 -0.49
Energy 12.1 4.69 7.68 4.28
* Inflation exc raw food & energy
Inflation (% Chg y-o-y)
2017 3Q17 4Q17 1Q18
Solve nc y ind ic a tors
Current account/GDP (%) 11.2 12.5 10.2 11.6
Debt/GDP (%) 35.3 35.5 35.3 35.4
Debt/Exports (%) 51.6 51.6 51.6 51.8
Debt service ratio (%) 5.7 8.1 4.5 6.3
Liqu id i ty ind ic a tors
Gross reserves/ST debt 3.2 3.3 3.2 3.4
Gross reserves/imports 9.8 10.0 9.8 10.0
ST debt/total debt (%) 42.1 40.9 42.1 41.2
-6
-4
-2
0
2
4
6
8
10
12
14
-20
-10
0
10
20
30
40
50
60
20
00
20
01
20
02
20
03
20
04
20
05
20
06
20
07
20
08
20
09
20
10
20
11
20
12
20
13
20
14
20
15
2016
r
2017
r
5M18
% of GDPUS$ bn
Current Account Balance (US$bn) As a % of GDP (RHS)
0
50
100
150
200
250
2000
2001
2002
2003
2004
2005
2006
2007
2008
2009
2010
2011
2012
2013
2014
2015
2016
r
2017
r
5M18
US$ bn
Market Focus
External risks trump local positives
Page 14
Market Overview and Outlook
June 2018 and 1H18 Recap
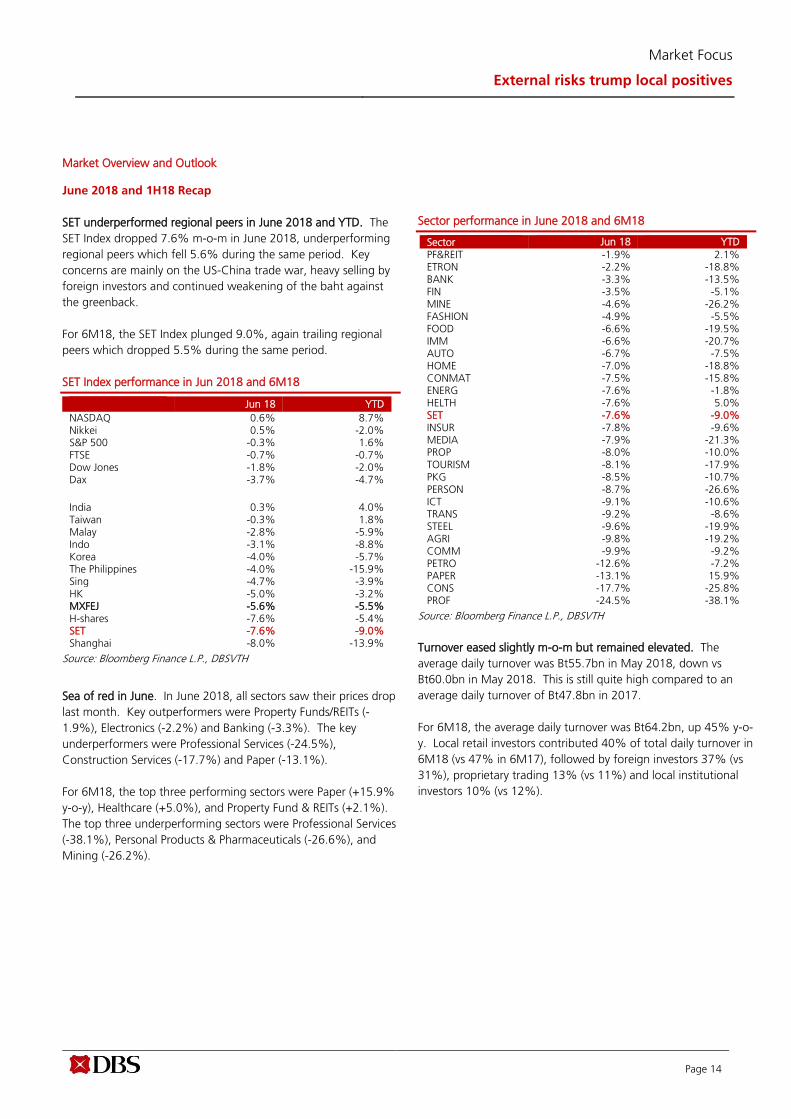
SET underperformed regional peers in June 2018 and YTD. The
SET Index dropped 7.6% m-o-m in June 2018, underperforming
regional peers which fell 5.6% during the same period. Key
concerns are mainly on the US-China trade war, heavy selling by
foreign investors and continued weakening of the baht against
the greenback.
For 6M18, the SET Index plunged 9.0%, again trailing regional
peers which dropped 5.5% during the same period.
SET Index performance in Jun 2018 and 6M18
Jun 18 YTD
NASDAQ 0.6% 8.7% Nikkei 0.5% -2.0% S&P 500 -0.3% 1.6% FTSE -0.7% -0.7% Dow Jones -1.8% -2.0% Dax -3.7% -4.7%
India 0.3% 4.0% Taiwan -0.3% 1.8% Malay -2.8% -5.9% Indo -3.1% -8.8% Korea -4.0% -5.7% The Philippines -4.0% -15.9% Sing -4.7% -3.9% HK -5.0% -3.2% MXFEJ -5.6% -5.5% H-shares -7.6% -5.4% SET -7.6% -9.0% Shanghai -8.0% -13.9%
Source: Bloomberg Finance L.P., DBSVTH
Sea of red in June. In June 2018, all sectors saw their prices drop
last month. Key outperformers were Property Funds/REITs (-
1.9%), Electronics (-2.2%) and Banking (-3.3%). The key
underperformers were Professional Services (-24.5%),
Construction Services (-17.7%) and Paper (-13.1%).
For 6M18, the top three performing sectors were Paper (+15.9%
y-o-y), Healthcare (+5.0%), and Property Fund & REITs (+2.1%).
The top three underperforming sectors were Professional Services
(-38.1%), Personal Products & Pharmaceuticals (-26.6%), and
Mining (-26.2%).
Sector performance in June 2018 and 6M18
Sector Jun 18 YTD
PF&REIT -1.9% 2.1% ETRON -2.2% -18.8% BANK -3.3% -13.5% FIN -3.5% -5.1% MINE -4.6% -26.2% FASHION -4.9% -5.5% FOOD -6.6% -19.5% IMM -6.6% -20.7% AUTO -6.7% -7.5% HOME -7.0% -18.8% CONMAT -7.5% -15.8% ENERG -7.6% -1.8% HELTH -7.6% 5.0% SET -7.6% -9.0% INSUR -7.8% -9.6% MEDIA -7.9% -21.3% PROP -8.0% -10.0% TOURISM -8.1% -17.9% PKG -8.5% -10.7% PERSON -8.7% -26.6% ICT -9.1% -10.6% TRANS -9.2% -8.6% STEEL -9.6% -19.9% AGRI -9.8% -19.2% COMM -9.9% -9.2% PETRO -12.6% -7.2% PAPER -13.1% 15.9% CONS -17.7% -25.8% PROF -24.5% -38.1%
Source: Bloomberg Finance L.P., DBSVTH
Turnover eased slightly m-o-m but remained elevated. The
average daily turnover was Bt55.7bn in May 2018, down vs
Bt60.0bn in May 2018. This is still quite high compared to an
average daily turnover of Bt47.8bn in 2017.
For 6M18, the average daily turnover was Bt64.2bn, up 45% y-o-
y. Local retail investors contributed 40% of total daily turnover in
6M18 (vs 47% in 6M17), followed by foreign investors 37% (vs
31%), proprietary trading 13% (vs 11%) and local institutional
investors 10% (vs 12%).

Market Focus
External risks trump local positives
Page 15
Foreign investors were heavy net sellers, with a heavy net sell
position of Bt48.7bn in June 2018. Local brokers’ proprietary
ports were also net sellers, with a net sell position of Bt14.3bn.
Local retail investors and local institutional investors were all net
buyers, with net buy positions of Bt40.8bn and Bt22.2bn
respectively.
For 6M18, foreign investors were heavy net sellers, with a net sell
position of Bt180.1bn. Local brokers’ proprietary ports were also
net sellers, with a net sell position of Bt11.2bn. Local retail
investors and local institutional investors were net buyers with
net buy positions of Bt114.3bn and Bt77.0bn respectively.
Foreign ownership (foreign + NVDR) in Thai stocks has dropped
steadily to 29% in June 2018, down from its peak of 35% in
2012. Most sectors saw declining foreign ownership over the
past few years, except for the Petrochemical sector which has
seen foreign ownership rise steadily to 53% in June 2018 from
about 40% at end 2012.
Foreign net buy/net sell position
Source: Bloomberg Finance L.P., DBSVTH
0
200
400
600
800
1000
1200
1400
1600
1800
2000
(250,000)
(200,000)
(150,000)
(100,000)
(50,000)
0
50,000
100,000
150,000
1992
1993
1994
1995
1996
1997
1998
1999
2000
2001
2002
2003
2004
2005
2006
2007
2008
2009
2010
2011
2012
2013
2014
2015
2016
2017
2018
Foreign Net Buy-Sell
SET Index (RHS)
Btm SET Index

Market Focus
External risks trump local positives
Page 16
Foreign ownership (%) in Thai stocks
Source: SET, DBSVTH
Foreign ownership (%) in Thai stocks by major sectors
Source: SET, DBSVTH
27
.07
2
6.9
1
26
.82
2
7.2
5
26
.93
2
6.6
7
27
.05
2
6.2
3
26
.15
2
6.7
6
26
.76
2
7.1
6
28
.02
27.5
4
28
.20
27.4
6
27
.00
26.6
8
27
.10
29.2
8
28
.91
29.0
2
28
.10
27.7
9
27
.18
26.9
6
26
.73
2
7.3
3
27
.53
2
7.0
4
27
.68
2
7.1
8
27
.47
2
8.5
3
28
.33
2
8.0
9
28
.08
2
8.2
5
29
.06
2
8.6
6
28
.36
2
7.7
1
26
.74
2
6.9
1
26
.55
2
5.5
5
25
.47
2
5.7
0
25.3
5
24
.97
25.1
0
25
.05
24.9
0
24
.75
24.6
4
24
.65
24.2
9
24
.40
24.6
0
24
.28
24.3
6
24
.17
2
4.1
9
24
.06
2
3.8
2
23
.77
2
3.1
4
22
.60
2
3.1
2
23
.42
2
2.8
2
22
.61
2
2.4
4
22
.47
2
2.6
7
22
.56
2
2.2
6
22
.40
2
2.2
2
22
.22
2
2.1
7
22
.42
2
2.4
5
22.4
6
22
.65
22.7
5
22
.94
22.8
1
22
.96
22.8
8
22
.78
22.8
5
22
.87
22.6
7
22
.62
2
2.3
8
22
.01
2
1.8
2
29
.93
0.2
30
.4 30
.83
0.6
30
.13
0.2
29
.22
9.4
30
.5 30
.93
1.1
32
.031.7
33
.031.8
31
.931.6 32
.134.9
34
.534.4
33
.933.1
31
.830.9
30
.63
2.1 3
2.9
32
.73
3.7
32
.63
3.5
34
.73
4.5
33
.93
3.8
34
.13
5.6
35
.53
5.3
34
.73
4.1
34
.23
3.8
32
.13
2.0
32
.231.8
31
.431.7
31
.631.4
31
.231.2
31
.130.5
30
.630.8
30
.530.6
30
.33
0.3
30
.12
9.8
29
.82
9.2
28
.3 28
.9 29
.32
8.9
28
.72
8.5
28
.5 29
.02
9.0
28
.72
8.7
28
.42
8.4
28
.6 29
.02
8.9
29.0
29
.129.3
29
.529.5 29
.829.8
29
.829.8
29
.829.7
29
.62
9.4
28
.92
8.7
20.0
22.0
24.0
26.0
28.0
30.0
32.0
34.0
36.0
38.0
3Q
02
1Q
03
3Q
03
1Q
04
3Q
04
1Q
05
3Q
05
1Q
06
3Q
06
1Q
07
3Q
07
1Q
08
3Q
08
1Q
09
3Q
09
1Q
10
3Q
10
1Q
11
3Q
11
1Q
12
3Q
12
1Q
13
3Q
13
Mar-
14
4-J
un
Jul-14
Sep-1
4
Nov-
14
Jan-1
5
Mar-
15
May-
15
Jul-15
Sep-1
5
Nov-
15
Jan-1
6
Mar-
16
May-
16
Jul-16
Sep-1
6
Nov-
16
Jan-1
7
Mar-
17
May-
17
Jul-17
Sep-1
7
Nov-
17
Jan-1
8
Mar-
18
May-
18
Foreign Holding Foreign Holding+NVDR
10.0
15.0
20.0
25.0
30.0
35.0
40.0
45.0
50.0
55.0
60.0
1Q02
4Q02
3Q03
2Q04
1Q05
4Q05
3Q06
2Q07
1Q08
4Q08
3Q09
2Q10
1Q11
4Q11
3Q12
2Q13
Mar
-14
Jun-
14Se
p-14
Dec-
14M
ar-1
5Ju
n-15
Sep-
15De
c-15
Mar
-16
Jun-
16Se
p-16
Dec-
16M
ar-1
7Ju
n-17
Sep-
17De
c-17
Mar
-18
Jun-
18Bank Conmat Energy Food ICT Petro Property Steel

Market Focus
External risks trump local positives
Page 17
Foreign investors were net sellers in most regional markets YTD.
In the table below, we can see that foreign investors were net
sellers in most major markets YTD. The net sell positions were
higher in Japan, Taiwan, Thailand and Indonesia.
Regional: Foreign net buy (sell) positions
US$m India Indonesia Japan Malaysia Philippines S. Korea Taiwan Thailand
2005 10,901 (1,737) 113,338 354 (3,549) 23,990 2,947
2006 8,338 1,996 68,885 720 (12,659) 16,962 2,135
2007 18,518 3,141 32,759 1,354 (29,095) 477 1,853
2008 (12,918) 1,801 (66,817) (1,135) (36,742) (16,364) (4,942)
2009 17,639 1,384 (6,513) 420 24,446 15,617 1,137
2010 29,321 2,345 22,926 1,232 19,657 9,577 2,687
2011 (396) 2,853 (1,069) 1,329 (8,584) (9,076) (167)
2012 24,548 1,703 27,733 2,548 15,069 4,907 2,504
2013 19,986 (1,804) 149,920 678 4,855 9,178 (6,211)
2014 16,162 3,766 22,545 (1,849) 1,287 5,967 13,551 (974)
2015 3,274 (1,580) 3,485 (4,989) (1,194) (3,626) 3,322 (4,372)
2016 2,903 1,259 (38,067) (573) 83 10,480 10,956 2,240
2017 10,095 (2,828) 9,384 2,456 1,140 10,234 8,969 (973)
2018 YTD (875) (3,570) (37,776) (1,772) (1,219) (3,702) (8,919) (5,642)
Jan-17 (6) (73) 587 98 6 1,246 1,456 178
Feb-17 1,564 (60) (4,110) 219 (103) 389 1,617 (107)
Mar-17 5,141 759 (14,439) 998 (251) 3,131 2,509 113
Apr-17 (345) 1,050 13,627 597 198 952 1,158 52
May-17 1,542 (48) 6,352 468 173 1,635 1,565 161
Jun-17 610 (325) 274 88 386 1,659 720 (5)
Jul-17 389 (798) 4,237 99 38 (381) 22 (200)
Aug-17 (1,732) (468) (8,110) (48) 50 (1,415) (299) (125)
Sep-17 (1,656) (844) (15,478) (171) 570 (981) (1,910) 211
Oct-17 296 (459) 30,660 (50) 2 2,713 1,724 (220)
Nov-17 2,952 (1,376) (2,797) (6) (28) 418 (1,351) (581)
Dec-17 (739) (319) (7,092) 235 55 (1,097) (1,095) (274)
Jan-18 2,080 132 5,674 868 45 1,967 2,856 (177)
Feb-18 (1,931) (760) (4,401) (277) (296) (2,598) (3,480) (1,310)
Mar-18 2,018 (1,085) (37,497) (18) (371) (449) (2,060) (352)
Apr-18 (943) (750) 10,447 389 (171) (1,213) (2,873) (684)
May-18 (1,427) (460) (1,427) (1,414) (174) (262) (1,064) (1,620)
Jun-18 (630) (647) (10,572) (1,296) (253) (1,148) (2,638) (1,499)
1Q17 6,699 626 (17,962) 1,315 (349) 4,766 5,581 185
2Q17 1,808 678 20,253 1,154 757 4,245 3,442 208
3Q17 (3,000) (2,110) (19,352) (120) 658 (2,777) (2,187) (113)
4Q17 4,588 (2,021) 26,444 1,048 74 4,000 2,133 (1,253)
1Q18 2,167 (1,713) (36,225) 573 (621) (1,080) (2,684) (1,838)
QTD (3,000) (1,857) (1,552) (2,322) (598) (2,622) (6,555) (3,803)
As of 29 Jun 2018
Source: Bloomberg Finance L.P., DBSVTH

Market Focus
External risks trump local positives
Page 18
Strategy
Our regional strategist rates Thailand as Neutral. DBS’ regional
equity strategist believes Asia markets are all likely to be
adversely affected by concerns over peaking growth and strong
US dollar, as well as rising domestic inflation and interest rates.
We rate HK/China and Singapore (relatively safe haven plays) as
Overweight, and India and Taiwan - whose relative resilience so
far poses downside risks and limits rebound upside – as
Underweight. We are Neutral on the rest of the market
including the Philippines, Indonesia, Thailand, and Korea.
DBS Bank’s 3Q18 Asia market recommendations
Source: DBS Bank
Increased volatility in global financial markets could cap near-
term upside. After tumbling over 200 points from its recent
peak in February, the Thai stock market is now trading on 2018
PE of 14.6x, which is in line with its historical average. While the
domestic economy is now on an upward momentum, key risks
remain on; (i) continued selling by foreign investors; (ii) the
weakening of the Thai baht against the greenback; (iii) the
length and depth of the US-China trade tension and its potential
impact on global growth and; (iv) potential election delays.
Corporate earnings to grow 10% in 2018. This represents an
improvement from 6% growth in 2017. Sectors that should
report strong earnings growth in 2018 are Paper, Finance,
Transportation, Tourism, Media, Commerce, and Property
Fund/REIT.
Valuation. The market is now trading at 2018 PE of 14.6x. Our
target SET Index is now 1860, based on 17x PE (+1.0x SD of
historical average).
Accumulate on dips. We recommend investors to accumulate
stocks with solid fundamentals, reasonable valuation, and
decent yields. We still like the Commerce and Tourism, as well
as the Property sectors.
Downgrading Contractor to Neutral. Our hope for more
bidding activities for infrastructure projects in 2H18 has now
faded. It is estimated that the new Financial and Fiscal Discipline
Act 2018, which has been enforced since 19 April 2018, could
result in further delays for these infrastructure projects. Note
that these projects will need to be vetted and approved by the
Monetary and Fiscal Policy Committee.
Among the projects that could see further delays include the 9
routes of dual-track railways phase II worth Bt427bn; the
Orange Line mass transit worth Bt120bn; Purple Line Southern
Part valued at Bt101bn; Nakhon Pathom – Cha Am motorway
worth Bt80.6bn; Bangkok-Wang Manao motorway worth
Bt15bn; Rangsit-Bangpain tollway extension worth Bt30.5bn;
Boromrajchonnanee-Bhuddamonthon Sai 4 extension valued at
Bt7bn; and the motorway toll collection system worth Bt60bn.
Upgrading Property Fund/REIT sector to Overweight. We are
upgrading the Property Fund/REIT sector to Overweight from
Neutral. We believe the sector should offer a safe bet amidst
high market volatility, thanks to its strong recurring income
bases and minimum 90% dividend payout, both of which
should ensure a steady distribution to unitholders. The sector is
now offering a decent distribution yield of 6.3%, which is still
quite attractive compared with the current 10-year Thai
government bond yield of 2.79%.
Key themes and top picks for 2H18. We have five themes for the
market in 2H18: (i) Recovering domestic consumption and
elections (AEONTS, CPALL). (ii) EEC theme (AMATA, BBL, STEC),
(iii) Resilient earnings (ADVANC). (iv) High growth with
reasonable valuation (IVL, CPN). (v) Generous yields (DIF, LH).
SET PE Band
Source: Bloomberg Finance L.P., DBSVTH
Ov erweight Neut ral Underweight
China/Hong Kong The Philippines Taiwan
Singapore Indonesia India
Malaysia Thailand
Korea
China 'A'
4
6
8
10
12
14
16
18
20
22
24
0 08 0 10 11 12 13 1 15 1 1 18
PE (x)
-2 sd
-1 sd
Mean
+1 sd
+2 sd

Market Focus
External risks trump local positives
Page 19
Corporate earnings
Net profit Growth (%) PE (x) YE Dec (Btm) FY18F FY19F FY18F FY19F
Banking 4% 4% 10.4 10.1
Finance 12% 25% 15.9 12.7
Con. Mat. 3% 7% 8.7 8.2
Chemicals 4% 9% 9.8 9.0
Automotive 11% 9% 8.5 7.9
Contractors 117% 8% 23.0 21.3
Paper & Printing Materials 85% 11% 11.8 10.7
Property 9% 10% 12.6 11.5
- Commercial -8% 13% 25.1 22.1
- Residential 16% 8% 9.0 8.3
- Industrial -1% 15% 11.2 9.7
Property Fund 15% 20% 13.2 12.4
Energy 14% 4% 6.4 6.1
Media 0% 8% 18.4 17.0
Commerce 16% 16% 29.0 25.1
Transport 53% 10% 31.9 29.1
Tourism 17% 20% 25.3 21.0
Telecom 13% 16% 17.5 15.0
Electronics -4% 25% 14.7 11.8
Food -13% 10% 18.6 16.8
Health Care Services -1% 14% 36.2 31.8
Total 10% 8% 14.6 13.5
Source: Bloomberg Finance L.P., DBSVTH
Regional Comparison EPS Gth (%) PE (x)
18F 19F 18F 19F
Singapore 15.8 8.2 13.9 12.8
HK HSI 15.4 10.5 11.5 10.4
HK HSCCI (Red) 39.6 13.8 10.3 9.1
HK HSCEI (H) 13.2 10.3 7.6 6.9
CSI300 22.2 15.2 11.8 10.3
SH Comp 27.9 13.5 11.4 10.0
SZ Comp 54.6 22.3 17.7 14.5
Malaysia (0.7) 7.1 16.1 15.0
Thailand 9.6 8.0 14.6 13.5
Indonesia 20.2 10.9 16.0 14.2
Simple Average 21.8 12.0 13.1 11.7
Source: Bloomberg Finance L.P., DBSVTH
SET: Our sector weightings
Source: DBSVTH
Se c tor Re a son Top buys
Ove rwe ight
Commerce Recovering consumption CPALL, HMPRO
Property
- Residential Attractive valuation, with high yield ANAN, LH, ORI
- Commercial Still positive outlook for office and retail properties CPN
PFPOs/REITs Offering stable yields LHHOTEL, QHHR
Tourism Beneficiary of the strong tourism industry AOT, CENTEL
Ne utra l
Bank Beneficiary of recovering economy BBL
Building Materials Supported by high value-added and innovative products SCC
Contractor Beneficiary of rising government infrastructure spending CK, STEC
Electronics Strong baht is hurting margins KCE
Energy Market has factored in oil price recovery assumption PTT
Finance Rising competition and regulatory risks AEONTS
Healthcare Weak earnings outlook and too rich valuation RJH
Industrial Estate Improving outlook supported by EEC AMATA, WHA
Petrochemicals Prefer IVL for volume expansion and improving PET spread IVL
Telecom Improving outlook on easing competition ADVANC, DIF
Transportation A beneficiary of strong tourism industry AAV, BEM
Unde rwe ight
Media Beneficiary of recovering economy, but competition to remain intense VGI
Foods Prolonged challenging environment at both CPF and TU TKN

Market Focus
External risks trump local positives
Page 20
Sector Update
Our Sector View Chart/Table Sector: Commerce Overweight
Top BUY: CP ALL (CPALL; BUY; Bt95.00 TP) Least preferred stock: n.a.
Overall, we don’t expect same-store sales growth (SSSG) to
rebound significantly but should at least improve for most of
the retailers this year. However, this should be driven mostly by
Bangkok, big provinces, and tourist cities which have higher
purchasing power as domestic consumption is still not broad-
based. Many upcountry retailers’ SSSG are still in negative
territory, albeit at a lesser magnitude. On top of a pick-up in
sales revenue growth this year, operating margins should also
improve and drive earnings growth of the retailers under our
coverage to stay at double-digits in FY18F.
We maintain CPALL as one of our favourites as it has been the
market leader in the Convenient Store sector and miles ahead
of its competitors. With its strong product strategy and new
products, we expect CPALL to continue delivering healthy
CAGR of 17% in the next three years. We also like HMPRO,
based on several positive catalysts; i) improving SSSG; ii)
increasing operational efficiency; iii) its ability to anticipate and
adjust to lifestyle changes and; iv) healthy FY18F profit growth
of 16%.
Thailand: Consumer Confidence Index (CCI)
Source: UTCC, DBSVTH
Sector: Tourism Overweight
Top BUYs: The Erawan Group (ERW, BUY, Bt7.70 TP), Asia Aviation (AAV; BUY; Bt7.05 TP )
Least preferred stock: -
The Tourism Authority of Thailand is targeting international
tourist arrivals to reach 37m in 2018 (+4.5% y-o-y). In 4M18,
international tourist arrivals grew 14% y-o-y to 13.7m, driven
by growth of Chinese arrivals that turned positive since May
2017. However, we believe the growth momentum of
international arrivals into Thailand may weaken from May 2018
onwards.
Despite an impressive 1Q18 result, we expect 2Q18 earnings to
drop q-o-q given due to low seasonality, as well as high costs
from the rise in oil price during the period. However,
performance in 2H18 should improve on seasonal factors and
expected lower oil price. On a yearly basis, we believe the sector
will continue growing driven by an increase in number of tourist
arrivals as well as an improving yield due to less domestic
competition.
We like i) CENTEL as it will be beneficiary from strong tourism in Thailand and recovering tourism overseas, and ii) AAV, whose earnings are expected to remain solid, driven by strong tourism growth and efficient cost management.
Thailand: International tourist arrivals
Source: BOT, DBSVTH
40
50
60
70
80
90
100
110
120
2001
2002
2003
200
2005
200
200
2008
200
2010
2011
2012
2013
201
2015
201
201
CCI of Overall economy
CCI of future employment
CCI of future income
600
1,000
1,400
1,800
2,200
2,600
3,000
3,400
Jan
Feb
Mar
Apr
May
Jun
Jul
Aug
Sep
Oct
Nov
Dec
'000 People
2010 2011 2012 2013 2014
2015 2016 2017 2018
Market Focus
External risks trump local positives
Page 21
Sector: Banking Neutral
Top BUYs: Bangkok Bank (BBL; BUY; Bt218 TP); TMB Bank (TMB; BUY; Bt3.10 TP) Least preferred stock: Krung Thai Bank (KTB; HOLD, Bt20.00 TP)
The banking sector has been hit by the fee waiver scheme for
electronic banking transactions since late March 2018. While we
believe the potential negative impact to the banks’
revenue/earnings should largely be reflected in the consensus
and our estimates, we still see some downside risks from the
banks’ expenses, especially for SCB. Nonetheless, the trend of
lower provisions at banks could be key to the sector’s earnings in
FY18F. Our top picks are BBL and TMB.
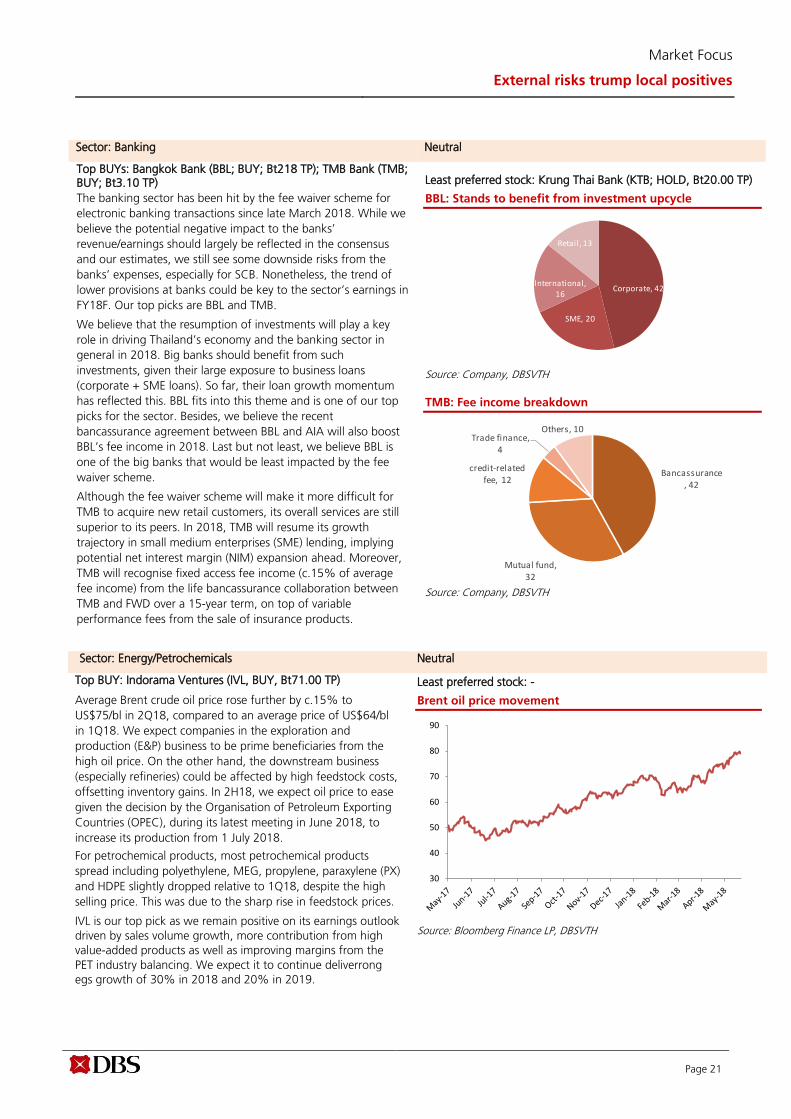
We believe that the resumption of investments will play a key
role in driving Thailand’s economy and the banking sector in
general in 2018. Big banks should benefit from such
investments, given their large exposure to business loans
(corporate + SME loans). So far, their loan growth momentum
has reflected this. BBL fits into this theme and is one of our top
picks for the sector. Besides, we believe the recent
bancassurance agreement between BBL and AIA will also boost
BBL’s fee income in 2018. Last but not least, we believe BBL is
one of the big banks that would be least impacted by the fee
waiver scheme.
Although the fee waiver scheme will make it more difficult for
TMB to acquire new retail customers, its overall services are still
superior to its peers. In 2018, TMB will resume its growth
trajectory in small medium enterprises (SME) lending, implying
potential net interest margin (NIM) expansion ahead. Moreover,
TMB will recognise fixed access fee income (c.15% of average
fee income) from the life bancassurance collaboration between
TMB and FWD over a 15-year term, on top of variable
performance fees from the sale of insurance products.
BBL: Stands to benefit from investment upcycle
Source: Company, DBSVTH
TMB: Fee income breakdown
Source: Company, DBSVTH
Sector: Energy/Petrochemicals Neutral
Top BUY: Indorama Ventures (IVL, BUY, Bt71.00 TP) Least preferred stock: -
Average Brent crude oil price rose further by c.15% to
US$75/bl in 2Q18, compared to an average price of US$64/bl
in 1Q18. We expect companies in the exploration and
production (E&P) business to be prime beneficiaries from the
high oil price. On the other hand, the downstream business
(especially refineries) could be affected by high feedstock costs,
offsetting inventory gains. In 2H18, we expect oil price to ease
given the decision by the Organisation of Petroleum Exporting
Countries (OPEC), during its latest meeting in June 2018, to
increase its production from 1 July 2018.
For petrochemical products, most petrochemical products
spread including polyethylene, MEG, propylene, paraxylene (PX)
and HDPE slightly dropped relative to 1Q18, despite the high
selling price. This was due to the sharp rise in feedstock prices.
IVL is our top pick as we remain positive on its earnings outlook
driven by sales volume growth, more contribution from high
value-added products as well as improving margins from the
PET industry balancing. We expect it to continue deliverrong
egs growth of 30% in 2018 and 20% in 2019.
Brent oil price movement
Source: Bloomberg Finance LP, DBSVTH
Corporate, 42
SME, 20
International, 16
Retail , 13
Bancassurance , 42
Mutual fund, 32
credit-related fee, 12
Trade finance, 4
Others, 10
30
40
50
60
70
80
90

Market Focus
External risks trump local positives
Page 22
Sector: Contractor Neutral
Top BUY: CK, STEC Least preferred stock: -
Our hope for more bidding activities for infrastructure projects
worth Bt780bn to take place in 2H18 has now faded. It is
estimated that the new Financial and Fiscal Discipline Act
2018, which has been enforced since 19 April 2018, could
result in further delays for these infrastructure projects. Note
that these projects will need to be vetted and approved by the
Monetary and Fiscal Policy Committee. We are therefore
downgrading our rating on the sector to Neutral.
The first infrastructure project up for bidding this year should
be the high-speed Railway link 3 international airports, a
Bt237bn public-private-partnership. The project’s Term Of
References (TORs) has been released and we expect the
winning bidder(s) to be announced by 4Q18F.
Other projects to follow suit are the Rama III – Dao Kanong
Expressway valued at Bt31bn, the MRT Purple Line worth
Bt100bn, and the Bt261bn dual-track railway projects (phase II)
in seven routes (from Chira Junction to Nong Khai). Other
projects may be delayed until next year.
Our top picks for the sector are Ch. Karnchang (CK) and Sino-
Thai Engineering and Construction (STEC). Both should stand
to benefit from these planned biddings in 2H18.
Contractor Sector: Projects up for bidding in 2H18F
Projects Project
Value (Btm) Bidding schedule
Rama III - Dao Kanong Expressway 31
To be bidded in
2H18
Fast track: Motorway: Bang Pa In - Nakhon Ratchasima (Construction Part) 7
Fast track: Motorway: Bang Yai - Kanchanaburi (Construction Part) 6
EEC Track: High-Speed Railway link 3 International Airports 237
TORs announced
Fast Track: MRT Purple line (Tao Poon - Ratburana) 101
To be bidded in
2H18
Double Track : Chira Junction - Ubon Ratchathani 36
Double Track : Den Chai - Chiang Mai 60
Double Track : Chumphon - Surat Thani 23
Double Track : Surat Thani - Hat Yai - Songkla 52
Double Track : Hat Yai - Padang Besar 8
Double Track : Paknam Po - Den Chai 56
Double Track : Khon Kaen - Nong Khai 26
643
Source: DBSVTH
Sector: Finance Neutral
Top BUY: Aeon Thana Sinsap Thailand (AEONTS; BUY; Bt208 TP) Least preferred stock: -
The upcoming non-bank Act may continue to pressure non-bank
finance companies. So far, the details of the Act are not known
yet, but the market expects it to be some kind of interest rate
cap. In the short run, we prefer AEONTS among the three
finance stocks under our coverage, as it should see no negative
impact from the upcoming Act. In the long run, we like MTC for
its strong growth profile and healthy balance sheet.
The credit card and personal loan businesses are governed by the
Bank of Thailand (BoT). These markets are crowded with bank
and non-bank players, although their target customers are quite
different (non-banks target lower-end customers). Last year, BoT
imposed new regulations for both credit cards and personal
loans, which should hurt small players rather than big ones.
Our top pick is AEONTS which has the largest market share in
the personal loan market. It should benefit from the ongoing
economic recovery and improving retail spending.
AEONTS: Revenue breakdown
Source: Companies, DBSVTH
AEONTS: Portfolio breakdown
Source: Companies, DBSVTH
Personal loans, 51%
Credit cards, 37%
HP, 2%
Others, 10%

Market Focus
External risks trump local positives
Page 23
Sector: Electronics Neutral
Top BUY: KCE Electronics (KCE; BUY; Bt42.50 TP) and HANA
Microelectronics (HANA; BUY; Bt40.00 TP)
Least preferred stock: -
Thailand’s M18 electronic export sales continued to be strong
with solid y-o-y growth of 13.8%, driven by strong growth in
telecommunications and computer products. We expect sales
growth to persist throughout 2018 as demand for electronics
products continue to grow. In the long term, we believe the
sector should continue growing on the back of the emergence
of new technological trends, including automotive electronics,
Internet of Things, Big Data and Artificial Intelligence (AI).
Our top pick for the sector is KCE which is a beneficiary of the
growing demand in the automotive industry (autonomous and
electric cars). We believe KCE’s earnings performance has
bottomed out in 1Q18, no thanks to the bottleneck in the
production process, strong baht and high copper price. We
expect to see earnings improvement in 2Q18F due to the
debottlenecking done in 2Q18F, weakening baht, and declining
copper price starting in mid-June.
We also like HANA Microelectronics (HANA) because the stock
is now a laggard in the sector. HANA also offers a generous
yield of 5-6% p.a. given its solid balance sheet with cash on
hand of Bt11.4 per share. In addition, HANA is least likely to be
impacted by raw material shortages because its customers bear
the bulk of raw material costs.
Thailand’s electronics export sales (in USD)
Source: Bank of Thailand, DBSVTH
Sector: Property Development Overweight on Residential and Commercial, Neutral on Industrial
Top BUYs: Ananda Dev. (ANAN; BUY, Bt5.30 TP), Land & Houses (LH; BUY, Bt11.30 TP), Central Pattana (CPN; BUY, Bt85 TP) Least preferred stock: Sansiri (SIRI; FV; Bt1.70)
Residential: We are positive on the residential sector in 2018,
supported by more aggressive launches, improving consumer
confidence, and large backlogs. We expect sector core earnings
to increase 16% y-o-y to Bt39.7bn in 2018. The sector is now
trading on attractive 2018 PE of 8.7x, while offering a generous
dividend yield of 6%.
ANAN and LH are our top picks for the sector. We like ANAN for
its strong earnings growth outlook, high secured revenue
through its large backlog, attractive valuation at only 7x PE while
offering a decent yield of 4.2%. We like LH for its generous yield
of 6.7%. Khun Anant Asavabhokin’s tender offer for 10% of
LH’s shares at Bt11.80 apiece should limit downside risks on the
stock near term.
Commercial: We still have a positive outlook for both office and
retail subsectors, given limited new supply in the short- to
medium-term. Both are still able to raise rents by about 3-5%
p.a. Our top pick in this space is Central Pattana (CPN; Bt85 TP).
Industrial: We rate this subsector as Neutral. We see an
improving long-term outlook for the sector, supported by the
government’s emphasis on the Eastern Economic Corridor (EEC)
project as a future growth engine for the Thai economy.
Nonetheless, industrial land sales have yet to pick up, pending
the development of infrastructure projects in the area.
Property sector – earnings growth
Source: Company, DBSVTH
2,000
2,200
2,400
2,600
2,800
3,000
3,200
3,400
3,600
3,800
Jan Feb Mar Apr May Jun Jul Aug Sep Oct Nov Dec
2016 2017 2018
2017 2018F 2019F 2018F 2019F
Residential
ANAN 1,257 2,242 2,825 78% 26%
AP 3,157 3,494 3,464 11% -1%
LH 10,463 10,599 9,686 1% -9%
LPN 1,062 1,746 2,221 64% 27%
ORI 2,020 3,536 4,319 75% 22%
PSH 5,456 6,617 7,383 21% 12%
QH 3,502 4,077 4,736 16% 16%
SIRI 2,825 2,971 3,002 5% 1%
SPALI 5,812 6,076 7,141 5% 18%
Total 35,555 41,359 44,777 16% 8%
Commercial
CPN TB 13,567 12,468 14,136 -8% 13%
Industrial
AMATA 1,409 1,680 2,015 19% 20%
ROJNA 1,313 1,019 1,092 -22% 7%
WHA 3,266 3,303 3,470 1% 5%
Total 5,989 6,002 6,578 0% 10%
Net Profit (Btm) Net Profit Growth

Market Focus
External risks trump local positives
Page 24
Sector: Food Underweight
Top BUY: Taokaenoi Food & Marketing (TKN; BUY; Bt23.00 TP) Least preferred stock: Thai Union Group (TU); HOLD; Bt20TP)
We believe 1Q18 was already a trough for agri-food companies
under our coverage. We expect their core earnings to improve
in the following quarters. Nevertheless, we are waiting for more
meaningful margins recovery. More time should be needed for
supply rationalisation to have an impact on domestic meat
prices. The price uptrend of key raw materials, particularly corn,
will be an additional risk to profitability. Volatility on tuna and
salmon raw material prices, as well as stiff competition are
expected to weigh on TU’s operations.
We prefer small-cap stocks with strong growth opportunities in
new markets. Taokaenoi Food & Marketing (TKN) is our top pick
for its strong growth prospects, after a hiccup in 2017 arising
from a rise in seaweed prices, as well as a steep learning period
for operating its new plant that has achieved 3-year earnings
CAGR of 34% (FY17-FY20F). Strong earnings growth will be
driven by new capacity at its new plant (+100% from 2016
capacity) which will support high demand from international
markets, especially China.
Swine and broiler product prices
Source: CPF, DBSVTH
CPF: Raw material prices
Source: CPF, DBSVTH
Sector: Property Fund/REIT Overweight
Top BUYs: LH Hotel Leasehold REIT (LHHOTEL, BUY, Bt17 TP), Quality Houses Hotel & Residence (QHHR, BUY, Bt10.6 TP) Least preferred stock: -
The sector has gone up 2.1% in 1H18, strongly outperforming
the SET Index’s .0% loss amidst heavy selling by foreign
investors.
With plenty of external risks ahead, we believe the Property
Fund/REIT sector should be a safe bet amidst the highly volatile
market. The sector is now offering a market-cap weighted
distribution yield of 6.3%, about 3.5% over the 10-year Thai
government bond yield of 2.79%. Such a premium is attractive
vs the historical yield-spread of about 3.0%.
Our top picks for the sector are LHHOTEL and QHHR. Both are
benefiting from strong tourist arrivals. They are also offering
generous distribution yields of 7.2% and 7.1% respectively.
QHHR is now trading at a deep discount of 36% to its NAV of
Bt13.76. Around 87% of its asset value are from freehold assets
(Centre Point Hotel Pratunam and Sukhumvit 10), while
leasehold assets (Centre Point Hotel Chidlom) make up only 13%
of asset value.
PFPO/REIT: Yield-spread over 10-yr govt bond
Source: DBSVTH
0
50
100
150
200
250
300
25
35
45
55
65
75
85
Sep
/12
Jan/1
3
May/
13
Sep
/13
Jan/1
4
May/
14
Sep
/14
Jan/1
5
May/
15
Sep
/15
Jan/1
6
May/
16
Sep
/16
Jan/1
7
May/
17
Sep
/17
Jan/1
8
May/
18
Bt/kg
Swine Broiler Shrimp (RHS)
0
5
10
15
20
25
Bt/kg
Corn Soybean
1.0
2.0
3.0
4.0
5.0
6.0
7.0
8.0
9.0
10.0
2005
200
200
2008
200
2010
2011
2012
2013
201
2015
201
2017F
2018F
%
Dividend Yield Bond 10Y (GTTHB10Y Govt)

Market Focus
External risks trump local positives
Page 25
Sector: Healthcare Neutral
Top BUY: Rajthanee Hospital (RJH, BUY, Bt32) Least preferred stock: Ladprao General Hospital (LPH, FULLY VALUED, 7.20 TP)
2Q18 is typically a low period for the healthcare sector, because
there are a number of holidays in the period. Also note that in
2Q18F there was the same number of holidays for the Ramadan
period as in 1Q17.
However, due to the better-than-expected patient volume (both
Thai and international), we expect 2Q18F earnings growth for
the majority of hospitals under our coverage to be healthy at
c.10%. Credit goes to the low base in 2Q17, coupled with
recovery of international patients’ volume, as well as healthy
healthcare demand in the quarter.
Our top pick is Rajthanee Hospital (RJH) given a bright outlook
against its current valuation of 26.7x FY18F PE (vs the average of
the healthcare industry of 35x FY18F PE) which is attractive
compared to the expected 16% earnings growth in FY18F.
Healthcare sector: share price performance vs SET
Source: DBSVTH
Sector: Telecom Neutral
Top BUYs: Advanced Info Service (ADVANC, BUY, Bt232 TP), Digital Infrastructure (DIF, BUY, Bt15.90 TP) Least preferred stock: -
Post the aborted 1800MHz spectrum auction, the interim board of
the National Broadcasting and Telecommunications Commission
(NBTC) has announced the 850MHz spectrum auction (11 licenses
at 5MHz bandwidth) on 18 Aug 2018 (less than a month before
DTAC’s concession expiry date). In addition, NBTC also plans to
revise the rules for the1800MHz auction repackaging it into 9
smaller licenses with 5MHz each, from its earlier plan of 3 licenses
with 15MHz each. Both 850MHz and 1800MHz spectrums to be
auctioned are currently under DTAC’s concession with CAT. More
details of rules for both spectrum auctions will be published in the
Royal Gazette on 5 Jul 2018.
As both 850MHz and 1800MHz spectrums will be auctioned, we
expect no remedy period for DTAC if it does not win the auctions.
In our base case scenario, we expect DTAC to participate in and
win both - the 5MHz 850MHz spectrum for Bt37bn with an
obligation to build guardband worth of Bt2bn and the 5MHz
1800MHz spectrum for Bt13bn. We also expect ADVANC to
participate in the repackaged1800MHz auction due to its smaller
licenses.
Nevertheless, there are still uncertainties related to the spectrum
auctions, especially for DTAC (BUY, Bt53.50 TP). We think
ADVANC is a safer bet for the telecommunications sector at the
moment. Our top picks for the sectors are ADVANC (BUY, Bt232
TP) and DIF (BUY, Bt15.90 TP).
Revenue market share in Thailand
Source: Company data, DBSVTH
90%
95%
100%
105%
110%
115%
Jan-18 Feb-18 Mar-18 Apr-18 May-18 Jun-18
SET Index Health Care Sector

Market Focus
External risks trump local positives
Page 26
Revisions to recommendations
Company Revision to Rec. Revision Reason
Current Previous Date
Upgrade
CPN BUY HOLD 13 Jun 18 Share price has come down a lot since our downgrade
to BUY recommendation, while its strong fundamental remains intact. It now reaches a level that provides a good upside to our TP, we therefore upgrade the stock from Hold to BUY.
Downgrade
None
Source: DBSVTH

Market Focus
External risks trump local positives
Page 27
DBSVTH recommendations are based an Absolute Total Return* Rating system, defined as follows:
STRONG BUY (>20% total return over the next 3 months, with identifiable share price catalysts within this time frame)
BUY (>15% total return over the next 12 months for small caps, >10% for large caps)
HOLD (-10% to +15% total return over the next 12 months for small caps, -10% to +10% for large caps)
FULLY VALUED (negative total return i.e. > -10% over the next 12 months)
SELL (negative total return of > -20% over the next 3 months, with identifiable catalysts within this time frame)
Share price appreciation + dividends
Completed Date: 4 Jun 2018 15:59:27 (THA) Dissemination Date: 3 Jul 2018 07:21:37 (THA)
Sources for all charts and tables are DBSVTH unless otherwise specified.
GENERAL DISCLOSURE/DISCLAIMER
This report is prepared by DBS Vickers Securities (Thailand) Co Ltd (''DBSVTH''). This report is solely intended for the clients of DBS Bank Ltd, its
respective connected and associated corporations and affiliates only and no part of this document may be (i) copied, photocopied or duplicated in
any form or by any means or (ii) redistributed without the prior written consent of DBS Vickers Securities (Thailand) Co Ltd (''DBSVTH'').
The research set out in this report is based on information obtained from sources believed to be reliable, but we (which collectively refers to DBS
Bank Ltd, its respective connected and associated corporations, affiliates and their respective directors, officers, employees and agents (collectively,
the “DBS Group”) have not conducted due diligence on any of the companies, verified any information or sources or taken into account any other
factors which we may consider to be relevant or appropriate in preparing the research. Accordingly, we do not make any representation or
warranty as to the accuracy, completeness or correctness of the research set out in this report. Opinions expressed are subject to change without
notice. This research is prepared for general circulation. Any recommendation contained in this document does not have regard to the specific
investment objectives, financial situation and the particular needs of any specific addressee. This document is for the information of addressees
only and is not to be taken in substitution for the exercise of judgement by addressees, who should obtain separate independent legal or financial
advice. The DBS Group accepts no liability whatsoever for any direct, indirect and/or consequential loss (including any claims for loss of profit)
arising from any use of and/or reliance upon this document and/or further communication given in relation to this document. This document is not
to be construed as an offer or a solicitation of an offer to buy or sell any securities. The DBS Group, along with its affiliates and/or persons
associated with any of them may from time to time have interests in the securities mentioned in this document. The DBS Group, may have
positions in, and may effect transactions in securities mentioned herein and may also perform or seek to perform broking, investment banking and
other banking services for these companies.
Any valuations, opinions, estimates, forecasts, ratings or risk assessments herein constitutes a judgment as of the date of this report, and there can
be no assurance that future results or events will be consistent with any such valuations, opinions, estimates, forecasts, ratings or risk assessments.
The information in this document is subject to change without notice, its accuracy is not guaranteed, it may be incomplete or condensed, it may
not contain all material information concerning the company (or companies) referred to in this report and the DBS Group is under no obligation to
update the information in this report.
This publication has not been reviewed or authorized by any regulatory authority in Singapore, Hong Kong or elsewhere. There is no planned
schedule or frequency for updating research publication relating to any issuer.
The valuations, opinions, estimates, forecasts, ratings or risk assessments described in this report were based upon a number of estimates and
assumptions and are inherently subject to significant uncertainties and contingencies. It can be expected that one or more of the estimates on
which the valuations, opinions, estimates, forecasts, ratings or risk assessments were based will not materialize or will vary significantly from actual
results. Therefore, the inclusion of the valuations, opinions, estimates, forecasts, ratings or risk assessments described herein IS NOT TO BE RELIED
UPON as a representation and/or warranty by the DBS Group (and/or any persons associated with the aforesaid entities), that:
(a) such valuations, opinions, estimates, forecasts, ratings or risk assessments or their underlying assumptions will be achieved, and
(b) there is any assurance that future results or events will be consistent with any such valuations, opinions, estimates, forecasts, ratings or risk
assessments stated therein.

Market Focus
External risks trump local positives
Page 28
Please contact the primary analyst for valuation methodologies and assumptions associated with the covered companies or price targets.
Any assumptions made in this report that refers to commodities, are for the purposes of making forecasts for the company (or companies)
mentioned herein. They are not to be construed as recommendations to trade in the physical commodity or in the futures contract relating to the
commodity referred to in this report.
DBSVUSA, a US-registered broker-dealer, does not have its own investment banking or research department, has not participated in any public
offering of securities as a manager or co-manager or in any other investment banking transaction in the past twelve months and does not engage
in market-making.
ANALYST CERTIFICATION
The research analyst(s) primarily responsible for the content of this research report, in part or in whole, certifies that the views about the
companies and their securities expressed in this report accurately reflect his/her personal views. The analyst(s) also certifies that no part of his/her
compensation was, is, or will be, directly or indirectly, related to specific recommendations or views expressed in the report. The research analyst (s)
primarily responsible for the content of this research report, in part or in whole, certifies that he or his associate1 does not serve as an officer of the
issuer or the new listing applicant (which includes in the case of a real estate investment trust, an officer of the management company of the real
estate investment trust; and in the case of any other entity, an officer or its equivalent counterparty of the entity who is responsible for the
management of the issuer or the new listing applicant) and the research analyst(s) primarily responsible for the content of this research report or
his associate does not have financial interests2 in relation to an issuer or a new listing applicant that the analyst reviews. DBS Group has
procedures in place to eliminate, avoid and manage any potential conflicts of interests that may arise in connection with the production of
research reports. The research analyst(s) responsible for this report operates as part of a separate and independent team to the investment
banking function of the DBS Group and procedures are in place to ensure that confidential information held by either the research or investment
banking function is handled appropriately. There is no direct link of DBS Group's compensation to any specific investment banking function of the
DBS Group.
COMPANY-SPECIFIC / REGULATORY DISCLOSURES
1. DBS Bank Ltd, DBS HK, DBS Vickers Securities (Singapore) Pte Ltd (''DBSVS''), DBSV HK or their subsidiaries and/or other affiliates have a
proprietary position in ADVANC, AOT, BBL. BCP, BTS, CPF. CPALL, CPN, DELTA, DTAC, HMPRO, ITD, IVL, KBANK, KCE, LH, MINT, PTT, PTTEP,
PTTGC, SCC, TISCO, TMB, TOP recommended in this report as of 30 Jun 2018.
2. Neither DBS Bank Ltd, DBS HK nor DBSV HK market makes in equity securities of the issuer(s) or company(ies) mentioned in this Research
Report.
3. DBSVTH and its affiliates hold a proprietary position on BBL-F, KTECH, LRH, IVL-R, KCE-R as of 29 Jun 2018
4. DBS Bank Ltd, DBS HK, DBSVS, DBSV HK, their subsidiaries and/or other affiliates have a net long position exceeding 0.5% of the total issued
share capital in TMB Bank PCL recommended in this report as of 30 March 2018. recommended in this report as of 30 March 2018..
5. DBS Bank Ltd, DBS HK, DBSVS, DBSVUSA, DBSV HK or their subsidiaries and/or other affiliates beneficially own a total of 1% of any class of
common equity securities of TMB Bank PCL as of 30 March 2018..
Compensation for investment banking services:
6. DBSVUSA does not have its own investment banking or research department, nor has it participated in any public offering of securities as a
manager or co-manager or in any other investment banking transaction in the past twelve months. Any US persons wishing to obtain further
information, including any clarification on disclosures in this disclaimer, or to effect a transaction in any security discussed in this document
should contact DBSVUSA exclusively.
Disclosure of previous investment recommendation produced:
7. DBS Bank Ltd, DBS Vickers Securities (Singapore) Pte Ltd (''DBSVS''), their subsidiaries and/or other affiliates may have published other
investment recommendations in respect of the same securities / instruments recommended in this research report during the preceding 12
months. Please contact the primary analyst listed in the first page of this report to view previous investment recommendations published by
DBS Bank Ltd, DBS Vickers Securities (Singapore) Pte Ltd (''DBSVS''), their subsidiaries and/or other affiliates in the preceding 12 months.
1 An associate is defined as (i) the spouse, or any minor child (natural or adopted) or minor step-child, of the analyst; (ii) the trustee of a trust of
which the analyst, his spouse, minor child (natural or adopted) or minor step-child, is a beneficiary or discretionary object; or (iii) another person accustomed or obliged to act in accordance with the directions or instructions of the analyst.
2 Financial interest is defined as interests that are commonly known financial interest, such as investment in the securities in respect of an issuer or a new listing applicant, or financial accommodation arrangement between the issuer or the new listing applicant and the firm or analysis. This term does not include commercial lending conducted at arm's length, or investments in any collective investment scheme other than an issuer or new listing applicant notwithstanding the fact that the scheme has investments in securities in respect of an issuer or a new listing applicant.

Market Focus
External risks trump local positives
Page 29
RESTRICTIONS ON DISTRIBUTION
General This report is not directed to, or intended for distribution to or use by, any person or entity who is a citizen or resident of or located in any locality, state, country or other jurisdiction where such distribution, publication, availability or use would be contrary to law or regulation.
Australia This report is being distributed in Australia by DBS Bank Ltd. (“DBS”) or DBS Vickers Securities (Singapore) Pte Ltd (“DBSVS”). DBS holds Australian Financial Services Licence no. 5 .
DBSVS is exempted from the requirement to hold an Australian Financial Services Licence under the Corporation Act 2001 (“CA”) in respect of financial services provided to the recipients. DBSVS is regulated by the Monetary Authority of Singapore under the laws of Singapore, which differ from Australian laws.
Distribution of this report is intended only for “wholesale investors” within the meaning of the CA.
Hong Kong This report has been prepared by an entity(ies) which is not licensed by the Hong Kong Securities and Futures Commission to carry on the regulated activity of advising on securities pursuant to the Securities and Futures Ordinance (Chapter 571 of the Laws of Hong Kong). This report is being distributed in Hong Kong and is attributable to DBS Vickers Hong Kong Limited, a licensed corporation licensed by the Hong Kong Securities and Futures Commission to carry on the regulated activity of advising on securities pursuant to the Securities and Futures Ordinance (Chapter 571 of the Laws of Hong Kong).
For any query regarding the materials herein, please contact Paul Yong (CE. No. ASE988) at [email protected].
Indonesia This report is being distributed in Indonesia by PT DBS Vickers Sekuritas Indonesia.
Malaysia This report is distributed in Malaysia by AllianceDBS Research Sdn Bhd ("ADBSR"). Recipients of this report, received from ADBSR are to contact the undersigned at 603-2604 3333 in respect of any matters arising from or in connection with this report. In addition to the General Disclosure/Disclaimer found at the preceding page, recipients of this report are advised that ADBSR (the preparer of this report), its holding company Alliance Investment Bank Berhad, their respective connected and associated corporations, affiliates, their directors, officers, employees, agents and parties related or associated with any of them may have positions in, and may effect transactions in the securities mentioned herein and may also perform or seek to perform broking, investment banking/corporate advisory and other services for the subject companies. They may also have received compensation and/or seek to obtain compensation for broking, investment banking/corporate advisory and other services from the subject companies.
Wong Ming Tek, Executive Director, ADBSR
Singapore This report is distributed in Singapore by DBS Bank Ltd (Company Regn. No. 196800306E) or DBSVS (Company Regn No. 198600294G), both of which are Exempt Financial Advisers as defined in the Financial Advisers Act and regulated by the Monetary Authority of Singapore. DBS Bank Ltd and/or DBSVS, may distribute reports produced by its respective foreign entities, affiliates or other foreign research houses pursuant to an arrangement under Regulation 32C of the Financial Advisers Regulations. Where the report is distributed in Singapore to a person who is not an Accredited Investor, Expert Investor or an Institutional Investor, DBS Bank Ltd accepts legal responsibility for the contents of the report to such persons only to the extent required by law. Singapore recipients should contact DBS Bank Ltd at 6327 2288 for matters arising from, or in connection with the report.
Thailand This report is being distributed in Thailand by DBS Vickers Securities (Thailand) Co Ltd.
Market Focus
External risks trump local positives
Page 30
United Kingdom
This report is produced by DBS Vickers Securities (Thailand) Co Ltd which is regulated by the Securities and Exchange Commission, Thailand.
This report is disseminated in the United Kingdom by DBS Vickers Securities (UK) Ltd, ("DBSVUK"). DBSVUK is authorised and regulated by the Financial Conduct Authority in the United Kingdom.
In respect of the United Kingdom, this report is solely intended for the clients of DBSVUK, its respective connected and associated corporations and affiliates only and no part of this document may be (i) copied, photocopied or duplicated in any form or by any means or (ii) redistributed without the prior written consent of DBSVUK. This communication is directed at persons having professional experience in matters relating to investments. Any investment activity following from this communication will only be engaged in with such persons. Persons who do not have professional experience in matters relating to investments should not rely on this communication.
Dubai International Financial Centre
This research report is being distributed by DBS Bank Ltd., (DIFC Branch) having its office at PO Box 506538, 3rd Floor, Building 3, East Wing, Gate Precinct, Dubai International Financial Centre (DIFC), Dubai, United Arab Emirates. DBS Bank Ltd., (DIFC Branch) is regulated by The Dubai Financial Services Authority. This research report is intended only for professional clients (as defined in the DFSA rulebook) and no other person may act upon it.
United Arab Emirates
This report is provided by DBS Bank Ltd (Company Regn. No. 196800306E) which is an Exempt Financial Adviser as defined in the Financial Advisers Act and regulated by the Monetary Authority of Singapore. This report is for information purposes only and should not be relied upon or acted on by the recipient or considered as a solicitation or inducement to buy or sell any financial product. It does not constitute a personal recommendation or take into account the particular investment objectives, financial situation, or needs of individual clients. You should contact your relationship manager or investment adviser if you need advice on the merits of buying, selling or holding a particular investment. You should note that the information in this report may be out of date and it is not represented or warranted to be accurate, timely or complete. This report or any portion thereof may not be reprinted, sold or redistributed without our written consent.
United States This report was prepared by DBS Vickers Securities (Thailand) Co Ltd (''DBSVTH''). DBSVUSA did not participate in its preparation. The research analyst(s) named on this report are not registered as research analysts with FINRA and are not associated persons of DBSVUSA. The research analyst(s) are not subject to FINRA Rule 2241 restrictions on analyst compensation, communications with a subject company, public appearances and trading securities held by a research analyst. This report is being distributed in the United States by DBSVUSA, which accepts responsibility for its contents. This report may only be distributed to Major U.S. Institutional Investors (as defined in SEC Rule 15a-6) and to such other institutional investors and qualified persons as DBSVUSA may authorize. Any U.S. person receiving this report who wishes to effect transactions in any securities referred to herein should contact DBSVUSA directly and not its affiliate.
Other jurisdictions
In any other jurisdictions, except if otherwise restricted by laws or regulations, this report is intended only for qualified, professional, institutional or sophisticated investors as defined in the laws and regulations of such jurisdictions.

Market Focus
External risks trump local positives
Page 31
DBS Regional Research Offices
HONG KONG DBS Vickers (Hong Kong) Ltd Contact: Paul Yong 18th Floor Man Yee Building 68 Des Voeux Road Central Central, Hong Kong Tel: 65 6878 8888 Fax: 65 65353 418 e-mail: [email protected] Participant of the Stock Exchange of Hong Kong
MALAYSIA AllianceDBS Research Sdn Bhd Contact: Wong Ming Tek (128540 U) 19th Floor, Menara Multi-Purpose, Capital Square, 8 Jalan Munshi Abdullah 50100 Kuala Lumpur, Malaysia. Tel.: 603 2604 3333 Fax: 603 2604 3921 e-mail: [email protected]
SINGAPORE DBS Bank Ltd Contact: Janice Chua 12 Marina Boulevard, Marina Bay Financial Centre Tower 3 Singapore 018982 Tel: 65 6878 8888 Fax: 65 65353 418 e-mail: [email protected] Company Regn. No. 196800306E
INDONESIA PT DBS Vickers Sekuritas (Indonesia) Contact: Maynard Priajaya Arif DBS Bank Tower Ciputra World 1, 32/F Jl. Prof. Dr. Satrio Kav. 3-5 Jakarta 12940, Indonesia Tel: 62 21 3003 4900 Fax: 6221 3003 4943 e-mail: [email protected]
THAILAND DBS Vickers Securities (Thailand) Co Ltd Contact: Chanpen Sirithanarattanakul 989 Siam Piwat Tower Building, 9th, 14th-15th Floor Rama 1 Road, Pathumwan, Bangkok Thailand 10330 Tel. 66 2 857 7831 Fax: 66 2 658 1269 e-mail: [email protected] Company Regn. No 0105539127012 Securities and Exchange Commission, Thailand