tamburi investment partners group
TRANSCRIPT

TAMBURI INVESTMENT PARTNERS GROUP
We should all feel nothing but shame for the reputation that finance has earned itself in the
last few years, but if you manage to guide healthy capital from successful businesses and the
assets of families that wish to invest them intelligently in companies that want to grow, you
are doing one of the most beneficial jobs in the world.
2020 annual report of the tamburi investment partners group
(TRANSLATION FROM THE ITALIAN ORIGINAL WHICH REMAINS THE DEFINITIVE VERSION)

TAMBURI INVESTMENT PARTNERS GROUP
Page 2
CONTENTS
Corporate Boards 3 Directors’ Report 4
Motion for allocation of the result for the year of Tamburi Investment Partners S.p.A. 20 Consolidated Financial Statements Financial Statements 21
▪ Consolidated Income Statement
▪ Consolidated Comprehensive Income Statement
▪ Consolidated Statement of Financial Position
▪ Statement of Changes in Consolidated Equity
▪ Consolidated Statement of Cash Flows
Explanatory notes to the 2020 Consolidated Financial Statements 27
Attachments 55 ▪ Declaration of the Executive Officer for Financial Reporting
▪ List of investments held
▪ Changes in investments measured at FVOCI
▪ Changes in associated companies measured under the equity method
▪ Independent Auditors’ Report
▪ Fees for audit services
Separate Financial Statements Financial Statements 69
▪ Income Statement
▪ Comprehensive Income Statement
▪ Statement of Financial Position
▪ Statement of Changes in Equity
▪ Statement of Cash Flows
Explanatory notes to the 2020 Separate Financial Statements 75
Attachments 96 ▪ Declaration of the Executive Officer for Financial Reporting
▪ List of investments held
▪ Changes in investments measured at FVOCI
▪ 2020 key financial highlights of the subsidiaries
▪ Changes in investments in associated companies
▪ Board of Statutory Auditors’ Report
▪ Independent Auditors’ Report

TAMBURI INVESTMENT PARTNERS GROUP
Page 3
Corporate Boards
Board of Directors of Tamburi Investment Partners S.p.A.
Giovanni Tamburi Chairman and Chief Executive Officer Alessandra Gritti Vice Chairperson and Chief Executive Officer
Cesare d’Amico Vice Chairman Claudio Berretti Executive Director & General Manager Alberto Capponi (1)(2) Independent Director* Giuseppe Ferrero (1) Independent Director *
Manuela Mezzetti (1)(2) Independent Director *
Daniela Palestra (2) Independent Director *
Paul Simon Schapira Independent Director *
Board of Statutory Auditors
Myriam Amato Chairperson
Fabio Pasquini Statutory Auditor
Alessandra Tronconi Statutory Auditor
Andrea Mariani Alternate Auditor Massimiliano Alberto Tonarini Alternate Auditor
Independent Audit Firm
PricewaterhouseCoopers S.p.A.
(1) Member of the appointments and remuneration committee
(2) Member of the control and risks and related parties committee
* In accordance with the Self-Governance Code
TAMBURI INVESTMENT PARTNERS GROUP
Page 4
2020 Directors’ Report of the Tamburi Investment Partners Group
In 2020 – a year on which any other comment is now superfluous – Tamburi Investment Partners
(TIP) reported a pro forma profit of approximately Euro 36.4 million and equity of over Euro
1,070 million, up by about Euro 167 million compared to 2019.
At present, as the vaccines gradually roll out, the light at the end of the tunnel is clear, although
how far it is or how long it will take to get there still is not easy to determine.
In the period just ended, TIP observed three types of reactions from the largest of its investees:
those most specialised in specific areas, namely IT services and finance, e.g. SESA, BE and
Welcome, significantly improved on their 2019 results, setting all-time highs; industrial companies
narrowly defined, such as Prysmian, Interpump, Azimut Benetti, Elica, Beta and Chiorino, which,
in addition to Amplifon, Moncler and Roche Bobois, lost some revenues and some margins, but
substantially capitalised on their leadership positions and performed very well. On the other hand,
OVS and Eataly suffered a little due to store closures that are still partly in place, while managing
to achieve more-than-satisfactory results - given the situation - in terms of financial performance.
The only company that truly slumped was Alpitour, but we are not worried about it: on the contrary.
The big picture for the TIP group is therefore very positive. It is no coincidence that almost all
listed companies recently reached new high prices and TIP also returned to its all-time highs.
In addition to the strong increase in equity already mentioned, a key element for shareholders is
that the INV - Intrinsic Net Value - of TIP stock is now more than Euro 9.2.
It is no coincidence that one of the most significant investments in 2020 was treasury shares.
TIP's pro-forma profit for 2020 - which, as we know, is much more meaningful than its IFRS 9
result - benefits from the proceeds of the assignment of Amplifon shares to the shareholders of
Asset Italia who had participated in the investment in Ampliter and in relation to the acquisition of
a significant interest in ITH/SESA.
Following the conclusion of the shareholder agreement between Asset Italia 2 S.r.l. and Amplifin
S.r.l., the parent of Amplifon S.p.A. through Ampliter S.r.l., a transaction was completed involving
the allocation of approximately 6,100,000 Amplifon shares to Asset Italia S.p.A. shareholders (of
which 1,346,661 to TIP) who invested in Ampliter. In the pro forma income statement, this
transaction resulted in the recognition of a capital gain of approximately Euro 28.5 million. TIP at
December 31, 2020 holds 7,384,697 Amplifon shares, equal to 3.26% of the share capital.
In addition, in July TIP invested in the capital increase of ITH S.p.A., the parent of SESA S.p.A.,
thus boosting its holding in ITH to 20.64%, which therefore became an associated company. The
transaction further strengthens the partnership between TIP and the SESA Group, which has

TAMBURI INVESTMENT PARTNERS GROUP
Page 5
gained additional market share in Italy and is gradually penetrating the European market. The
reclassification of the investment to associated companies resulted in the recording of the increase
in the fair value recognised on the portion of the investment held until the acquisition date in a
similar manner to that which would be applied for the holding’s divestment.
TIP’s Consolidated equity at December 31, 2020 was over Euro 1,070 million - after distributing
dividends in the period of Euro 14.3 million, acquiring treasury shares of nearly Euro 37 million
and benefiting from the proceeds of the warrants for the year for approximately Euro 67 million -
compared to approximately Euro 902.5 million at December 31, 2019 and approximately Euro 835
million at June 30, 2020.
As in previous periods, the pro-forma income statement for the period January 1 - December 31,
2020 is presented below, calculated considering the capital gains and losses realised and the write-
downs of investments in equity, as per IAS 39 in force at December 31, 2017. The Directors’ Report
comments upon the pro-forma figures; the Explanatory Notes provide disclosure upon the figures
calculated as per IFRS 9.
The IFRS 9 income statement does not include directly and indirectly realised income, capital gains and capital losses during the period on investments and shares of Euro 61.6 million or negative adjustments to financial assets of Euro 26.8 million.
The pro-forma financial income in the period benefitted from, in addition to the ITH transaction,
gains of approximately Euro 7.7 million on divesting the Ferrari shares.
The pro-forma profit also includes write-downs of equity investments for Euro 26.8 million, mainly
referring to Hugo Boss, still at incredibly low price levels for the sector and the type of company.
The share of profit/(loss) of associated companies - income of approximately Euro 27.8 million -
includes, in addition to the Ampliter transaction’s positive effects, the losses of Alpitour and OVS,
Consolidated income statement
IFRS 9
31/12/2020
Reclassification to
income statement
of capital gain
(loss) realised
Reclassification to
income statement
of adjustments to
financial assets
Reversal of
convertible fair
value adjustments
PRO FORMA
31/12/2020
PRO FORMA
31/12/2019
(in Euro)
Total revenues 4.402.239 4.402.239 6.996.283
Purchases, service and other costs (2.270.267) (2.270.267) (3.055.205)
Personnel expenses (12.886.384) (12.886.384) (20.267.359)
Other income 0 0 3.429.524
Amortisation (344.956) (344.956) (356.399)
Operating profit/(loss) (11.099.368) 0 0 0 (11.099.368) (13.253.156)
Financial income 24.710.501 39.237.953 161.717 64.110.171 73.230.875
Financial charges (18.001.402) (35.034) 0 (18.036.436) (12.927.381)
Profit before adjustments to investments (4.390.269) 39.202.919 0 161.717 34.974.367 47.050.339
Share of profit/(loss) of associates measured
under the equity method 5.447.898 22.389.732 27.837.630 64.357.396
Adjustments to financial assets (26.789.563) (26.789.563) (12.985.291)
Profit / (loss) before taxes 1.057.629 61.592.651 (26.789.563) 161.717 36.022.433 98.422.444
Current and deferred taxes 896.780 (470.357) 0 0 426.423 1.518.240
Profit / (loss) of the period 1.954.409 61.122.293 (26.789.563) 161.717 36.448.856 99.940.684
Profit/(loss) of the period attributable to
the shareholders of the parent 148.159 34.642.60698.098.714
Profit/(loss) of the period attributable to
the minority interest 1.806.250 1.806.2501.841.970
TAMBURI INVESTMENT PARTNERS GROUP
Page 6
i.e. two of the companies hit hardest by the lockdown. These losses were offset by the good results
of other companies, in particular Interpump, Roche Bobois, BE and SESA. The equity investment
held through TIPO in the Chiorino Group has become an associated company for TIPO. The
reclassification of the investment to associated companies resulted in the recording by TIPO of the
increase in the fair value recognised on the portion of the investment held until the acquisition date
in a similar manner to that which would be applied for the holding’s divestment. Consequently,
significant influence, the higher accumulated fair value recognised in the OCI reserve was charged
to the income statement among the portions of profit (loss) of equity-accounted investees, with a
positive impact of approximately Euro 4.5 million on the pro forma income statement, and
reclassified among retained earnings in equity in accordance with IFRS 9.
Advisory revenues were approximately Euro 4.4 million, compared to approximately Euro 7 million
in 2019, while operating costs were lower than in 2019; executive director fees were much lower as
they, as previously reported, correlated with TIP Group's pro-forma income statement
performance.
The liquidity from the proceeds of the bond issued in December 2019 and from the exercise of the
warrants was invested in bonds and government securities, both in Euro and USD. Investments
were also made to hedge assets in portfolio. This made it possible to offset the stock market declines
over the initial months of the year, with capital gains of over 5 million, while the update to the fair
value of the ETF shorts in portfolio at December 31, 2020 resulted in a charge of approximately
Euro 2.5 million.
Dividends collected, at the consolidated level, amounted to Euro 3.7 million, down from Euro 5.5
million in 2019.
Interest income, changes in fair value to the income statement and exchange gains amounted to
approximately Euro 15.8 million. Interest and other financial charges impacted for approximately
Euro 15.5 million.
In May 2020 TIP subscribed to a more-than-proportional share of its investment in the capital
increase promoted by the associated company Clubitaly.
In October, after a previous additional investment of around Euro 250 thousand, the investment
in Buzzoole was further increased by around Euro 500 thousand as part of a capital increase
totalling Euro 5 million that also saw an investment by CDP Venture Capital Sgr.
In November TIP acquired a further 5,500,000 shares of BE - Shaping the Future S.p.A. ("BE" -
best.mi), a company also listed on the STAR segment of the Italian Stock Exchange. As a result of
the transaction, TIP's interest in BE rose from 23.412% to 27.489%.
In November equity instruments issued by the associated company Digital Magics were also
subscribed for an investment of approximately Euro 450 thousand.

TAMBURI INVESTMENT PARTNERS GROUP
Page 7
Treasury share purchases of nearly Euro 37 million were made, in addition to Prysmian shares for
approximately Euro 23.7 million, OVS shares for approximately Euro 2.2 million and FCA shares
for approximately Euro 17.8 million. In March, all Prysmian shares held directly by TIP were sold,
against an interest-bearing loan, to the subsidiary Clubtre.
Of the 37 million treasury shares acquired, approximately Euro 2.7 million refers to the plan
announced on September 26, 2019, as part of the treasury share buy-back programme approved by
the Shareholders’ Meeting of April 30, 2019, with execution delegated completely to third parties,
to acquire a maximum additional eight million treasury shares in addition to those held at the
communication date, to be undertaken on the market by January 31, 2020. Following the expiry of
this plan, which overall entailed the purchase of 1,988,910 ordinary shares with a total value of
approximately Euro 13 million, on February 2, 2020 a new buy-back programme was launched for
up to six million additional shares, also on a fully delegated basis, to be completed by August 31,
2020. The second plan concluded on August 31, with 5,194,866 shares purchased for an outlay of
approximately Euro 29.5 million.
On September 10, 2020, a further buy-back programme was launched, also in a fully delegated
manner, up to an additional 20 million shares to be executed by October 29, 2021. As part of this
additional plan, by December 31, 798,130 shares had been acquired for an outlay of approximately
Euro 4.7 million.
The TIP group consolidated net debt totalled approximately Euro 336.3 million at December 31,
2020 – also taking into account the bond and Clubtre’s loan – but without considering the non-
current financial assets, viewed by management as liquidity available in the short-term, compared
to approximately Euro 300 million at December 31, 2019.
The TIP 2014-2020 bond of Euro 100 million was repaid in April.
Also in April, TIP received approximately Euro 5 million from Tefin (the OCTO Telematics
holding company) in repayment of interest matured and of a portion of the loan capital.
In July, Clubtre’s refinancing was finalised with the drawdown of a new Euro 100 million margin
loan and the repayment of the Euro 99.1 million previous residual loan maturing in 2020.
Major listed investees, Amplifon, BE, Elica, Interpump, Moncler, OVS, Prysmian and Sesa
reported 2020 full-year or interim figures, presenting strong results for the fourth quarter - up
considerably on the third quarter– partially offsetting the adverse impacts of the pandemic, which
mainly occurred in the first half of the year. The other direct and indirect equity investments also
reported encouraging figures in the fourth quarter. As already mentioned, Alpitour and, in part,
Eataly, continue to be severely affected.
In 2020, after a good start as far as mid-February, the TIP share price - although to a lesser extent
than many other shares - dropped due to the knock-on effects of the virus. Recently, TIP's share
price has returned to satisfactory levels, though still misaligned with the underlying portfolio
investments. The usual five-year TIP share chart at March 24, 2021 nonetheless continue to

TAMBURI INVESTMENT PARTNERS GROUP
Page 8
highlight the excellent performance of the TIP share, up 145.1%; the total return(1) for TIP
shareholders over the five years was 151.9% (annual average of 30.4%).
TIP workings on data collected on 24/3/2020 at 6.05 pm source Bloomberg
INVESTMENTS – PRINCIPAL HOLDINGS AT DECEMBER 31, 2020
The financial results reported below refer, where available, to the 2020 Annual Report already
approved by the Board of Directors of the investees by the current date; in the absence of such
figures, reference is made to the report for the first nine months of 2020 or prior year annual
accounts.
A) SUBSIDIARIES
Clubtre S.p.A. TIP shareholding at December 31, 2020: 37.67% (66.23% fully diluted)
At December 31, 2020, Clubtre S.p.A. held approximately 5% of Prysmian and was therefore -
except for a group of funds - the single largest shareholder in Prysmian S.p.A. As reported in the
section on subsequent events, in January 2021 Clubtre sold 10 million Prysmian shares, realising a
significant capital gain. Following this transaction, Clubtre retains 3,577,436 Prysmian shares,
representing 1.334% of capital and, after repaying the loans received from shareholders and credit
institutions and distributing a dividend of approximately Euro 39.5 million, has Euro 82.8 million
in cash.
1 The total return is calculated by taking into account the performance of the TIP shares, the distributed dividends and the performance of the 2015-
2020 TIP Warrants freely assigned to shareholders.
0,5
1,5
2,5
3,5
4,5
5,5
6,5
7,5
8,5
9,5
FTSE MIB
+33,3%
FTSE Small Cap
+42,5%
IT Star
+101,5%
MSCI Eur
+24,4%
+145,1%
S&P 500
+93,1%
DOW JONES
+ 86,6%
Nasdaq
+174,9%

TAMBURI INVESTMENT PARTNERS GROUP
Page 9
Prysmian is the world leader in the production of energy and telecommunication cables.
Prysmian reported consolidated revenues of about Euro 10 billion in 2020, down 8.3% from 2019.
Adjusted EBITDA was Euro 840 million. Its financial structure remains sound, with net debt of
just under Euro 2 billion.
StarTIP S.r.l. TIP shareholding at December 31, 2020: 100%
Company held 100% by TIP which holds the digital and innovation start-up investments, and in
particular those in Bending Spoons, Digital Magics, Heroes, (company with an investment of over
40% in Talent Garden), in Alkemy, Buzzoole, MyWoWo, Centy and Telesia.
StarTIP's investees - except for Alkemy and Bending Spoons - did suffer from the effects of the
virus, while still proving resilient.
During 2020 CDP Venture Capital SGR S.p.A. through several funds under management also
acquired a stake in the Talent Garden group as part of an overall investment – including the share
of other investors – of Euro 9 million.
In early 2021, StarTIP acquired a 20% interest in DV Holding S.p.A., the parent company of
DoveVivo Group, and an 8% interest in Alimentiamoci.
DoveVivo is Europe’s largest co-living company, with a presence in 13 cities in Italy, France and
Spain, over 1,500 properties under management, eight thousand beds and three hundred thousand
square meters of accommodations; the estimated value of its real estate portfolio is nearly Euro 1
billion. It is among the most active, innovative prop-tech companies in Italy and Europe, capable
of innovating in a traditional sector such as real estate by applying best-of-breed, scalable
technologies and providing integrated, advanced services to its communities of owners, investors
and customers. In 2020, despite the impact of COVID, it reported revenue of approximately Euro
40 million, up around 30% on 2019.
Alimentiamoci S.r.l. is an innovative start-up that through the website Planeat.eco promotes a new
way of shopping for food by offering its users - families, singles and businesses - weekly meal
planning based on the purchase of online kits of fresh, high-quality ingredients, ready to be used to
prepare recipes.

TAMBURI INVESTMENT PARTNERS GROUP
Page 10
TXR S.r.l (company which holds 34.84% of Roche Bobois S.A.) TIP shareholding at December 31, 2020: 51.00%
TXR, a 51.0% subsidiary of TIP, holds a 34.84% interest in Roche Bobois S.A., a company listed
on the B segment of Euronext Paris.
The group operates the largest chain worldwide of high-end design furniture, with a network –
direct and/or franchising – comprising over 330 sales points (of which approximately 110 owned)
located in prestigious commercial areas, with a presence in the most important cities worldwide,
including Europe, North, Central and South America, Africa, Asia and the Middle East.
In 2020, consolidated sales - albeit impacted by pandemic lockdowns - declined modestly (-2.8% at
like-for-like exchange rates) from Euro 274.7 million to Euro 266.0 million, with significant growth
in the fourth quarter of 2020, 18% higher than in the fourth quarter of 2019. Sales were buoyed by
the excellent performance of owned stores, increased by the opening of 4 new locations, 2 re-
openings and the purchase of 3 previously franchised units locations, but which also had some
closures. Aggregate business volumes (hence including franchised stores) were Euro 484.5 million,
down slightly on Euro 490.2 million in 2019. The margin increased despite the circumstances in
which the company operated and the Ebit was 17.1 million, up 7.8%, with a net result of 10.1
million, up 5%.
B) ASSOCIATED COMPANIES
Asset Italia S.p.A. TIP shareholding at December 31, 2020: 20.00% excluding the shares related to specific investments
Asset Italia, incorporated in 2016 with the subscription, in addition to TIP, of approximately 30
family offices, with total capital funding of Euro 550 million, is an investment holding and gives
shareholders the opportunity to choose for each proposal their individual investments and the
receipt of shares for the specific asset class related to the investment subscribed.
TIP holds 20% of Asset Italia, in addition to shares related to specific investments, undertaking at
least a pro-quota holding and providing support for the identification, selection, assessment and
execution of investment projects.
In September, as mentioned above, a transaction was carried out that involved the assignment of
approximately 6,100,000 Amplifon shares to the shareholders of Asset Italia S.p.A. Asset Italia 2
closed its final liquidation accounts in December and the final liquidation distribution will take place
in March 2021. The results of Amplifon S.p.A. are illustrated in the section on investments in listed
companies.
As of December 31, 2020, Asset Italia holds the shares in Alpitour through Asset Italia 1.

TAMBURI INVESTMENT PARTNERS GROUP
Page 11
Alpitour S.p.A.
Asset Italia 1 owns both 49.9% of Alpiholding, which in turn owns 36.76% (40.5% on a fully
diluted basis) of Alpitour, and a direct stake in Alpitour of 31.14% (34.31% on a fully diluted
basis). TIP holds 35.81% of the shares related to Asset Italia 1.
For Alpitour, 2020 (the financial year ended October 31) was adversely impacted to an
extraordinary degree by the spread of COVID-19 and the consequent travel restrictions. As
revenues in the sector fell nearly to zero in February, the Alpitour group recorded a drop in
consolidated revenues from Euro 1,992 million to Euro 725 million and a negative EBITDA,
before the effects of IFRS 16, of Euro 112 million, this despite the many steps taken to contain
costs. The loss for 2020 of approximately Euro 102 million, did not benefit from public grants,
which although approved at various levels have yet to be paid. In 2020 the company obtained a
loan of Euro 225 million with a guarantee from SACE. As of December 31, net debt stood at
Euro 377 million.
The company nonetheless continued to make strategic investments in the hotel and resort,
aviation and IT sectors to be fully prepared to resume operations as soon as conditions are in
place, and most importantly, reinforced its robust leadership position in Italy thanks to its strong
presence in the various sectors (off-line and on-line tour operating, aviation, hotels, travel
agencies and incoming).
However, the economic forecasts for the current year remain deeply conditioned by the timing
and circumstances of the end of the pandemic, which are still very uncertain. The psychological
factor of the fear of infection and the reduced spending capacity of families strained by the long
lockdown period and the economic crisis are additional factors that could significantly affect the
recovery of the demand for tourism services. BE Think, Solve, Execute S.p.A. (“BE”) TIP shareholding at December 31, 2020: 27.489% Listed on the Italian Stock Exchange - STAR Segment.
The BE Group is one of the leading Italian operators in professional services for the financial
industry. In November TIP acquired an additional 5,500,000 shares of BE, increasing its stake to
27.489%.
In 2020 the BE group continued to grow, buoyed in part by rising demand relating to projects
associated with the effects of the pandemic, reporting revenues of Euro 178.8 million (+17%) and
an operating profit of Euro 14.6 million, up 19% on 2019.
Clubitaly S.p.A. TIP shareholding at December 31, 2020: 43.24%
Clubitaly, incorporated in 2014 jointly with a number of business-owning families and family
offices, holds 19.80% of Eataly S.r.l, the only international Italian food retail business which
operates both in distribution and catering and which symbolises high-quality “made in Italy” food.

TAMBURI INVESTMENT PARTNERS GROUP
Page 12
Eataly operates in Italy, America and the Middle and the Far East and is implementing a store
opening programme in some of the world’s major cities through direct sales points and franchises.
The company was impacted by the virus in terms of the major restrictions on catering operations
across the world, particularly in North America in which excellent earnings and growth have always
been generated.
Eataly's preliminary results for 2020 include revenues of about Euro 353.4 million, down 29% from
Euro 501 million in 2019, a negative EBITDA of around Euro 14.6 million and net debt of Euro
116 million.
Economic forecasts for the coming year are highly conditioned by the timing and circumstances of
the end of the pandemic, which are currently very uncertain, although the progress of the
vaccination campaign in the United States may have positive effects for Eataly.
Elica S.p.A. TIP shareholding at December 31, 2020: 20.15%
With sales in over 100 countries, seven production facilities worldwide and approximately 3,800
employees, Elica is one of the world’s main players in design, technology and high-end solutions
for ventilation, filtration and air purification, with products conceived to improve the welfare of
individuals and the environment.
Revenues for 2020 were Euro 452.6 million, down 4.4% on 2019 at constant exchange rates. After
a first half of the year penalised by the consequences of the virus, which led to both closures of
production facilities and reduced demand, there was a strong acceleration during the third and
fourth quarters (revenues in the fourth quarter of 2020 were over 15% higher than in 2019).
Adjusted EBITDA was Euro 42.2 million, declining 6.3% compared to Euro 45 million in 2019,
significantly narrowing the gap with the first half of the year.
Ongoing restrictions and closures related to the COVID-19 pandemic could continue to harm the
investee's operations in 2021.
Gruppo IPG Holding S.p.A. TIP shareholding at December 31, 2020: 32.18%
Gruppo IPG Holding S.p.A. holds 26,406,799 shares (equal to 24.76% of the share capital, net of
treasury shares) of Interpump Group S.p.A., world leader in the production of high pressure piston
pumps, power take-offs (PTOs), distributors and hydraulic systems.
Interpump Group reported slightly weaker results in 2020 than in 2019, with consolidated revenues
of Euro 1.294 billion, -5.4% on 2019 and an EBITDA of Euro 294.1 million, -7.5%. Performance
in the fourth quarter of 2020, with revenues in line with the previous year and higher EBITDA in
absolute terms and free cash flow in 2020 of nearly Euro 204 million, compared to Euro 125 million
in 2019, represents a solid foundation for the coming years.

TAMBURI INVESTMENT PARTNERS GROUP
Page 13
Gruppo IPG Holding has an outstanding loan of Euro 100 million maturing in December 2023.
ITH S.p.A. TIP shareholding at December 31, 2020: 20.64%
TIP acquired 14.95% of ITH S.p.A., the parent company of Sesa S.p.A., a company listed on the
STAR segment of Borsa Italiana. In July 2020, TIP invested in the capital increase of ITH S.p.A.,
boosting its holding in ITH from 14.95% to 20.64%, which therefore became an associated
company.
The Sesa Group is a leading Italian provider, with an international presence, of extremely innovative
high value-added IT solutions and services for businesses. The solutions it has developed include,
in particular, support for the demand for digital transformation from medium-size enterprises.
Sesa ended the third quarter of 2019/20 (its year ends on April 30) with revenues and income of
Euro 1,534.3 million, up 14.1%, and an EBITDA of Euro 92.2 million, +32.7% on the same period
of the previous year, driven by rising demand for digital transformation fuelled by the events of
recent months. The company continues its acquisitions-led growth reinforced at the same time as
TIP acquired its stake.
OVS S.p.A. TIP shareholding at December 31, 2020: 23.32%
TIP further increased its stake during 2020 to a total of 23.32%.
OVS was severely penalised by the restrictions imposed from time to time in response to the
pandemic, which led to prolonged lockdowns and store closures. However, its results benefited
from a very strong performance while stores were open, partially offsetting the declines imposed.
OVS ended the first nine months (to October 2020) with net sales of Euro 736.7 million compared
to Euro 990.9 million in the same period last year but with a third quarter up 6% on the same
period in 2019. Adjusted EBITDA for the nine months was Euro 40.1 million, recovering thanks
to a third quarter that generated adjusted EBITDA of Euro 38.1 million. Adjusted net debt
decreased to Euro 356.9 million, an improvement of Euro 38.3 million compared to October 2019.
Economic forecasts for the coming year of course remain strongly conditioned by possible new
general lockdowns entailing store closures; in any case, the fact that shopping centres have been
closed on holidays and pre-holidays for months now is continuing to reduce sales.
It was against this backdrop that OVS finalised the acquisition of the Stefanel brand and its 23
directly operated stores. The stores, located in high-quality locations, will be gradually reopened
and represent the starting point for the revitalisation of the brand.
In 2020 OVS approved a divisible capital increase of up to Euro 80 million to secure advance
financial resources for acquisitions and business combinations enabling it to continue the process
of consolidation it has been pursuing for years in keeping with its position as market leader.

TAMBURI INVESTMENT PARTNERS GROUP
Page 14
TIP-PRE IPO S.p.A. – TIPO TIP shareholding at December 31, 2020: 29.29%
The company in 2020 distributed additional amounts of available liquidity, following on from the
very significant pay-outs in 2019, in addition to the Fagerhult shares and today holds the following
investments:
Beta Utensili S.p.A.
TIPO holds directly 3.94% in the share capital of Beta Utensili S.p.A. and indirectly 30.87%
through Betaclub S.r.l., in turn controlled by TIPO with 58.417%. Beta Utensili is the leader in
Italy in the distribution and production of high quality utensils.
Beta Utensili S.p.A.'s preliminary results in 2020 indicate that the negative impacts on volume
in the first half of 2020 were partially recouped in the second half of the year, and particularly
in the fourth quarter, with consolidated revenues of approximately Euro 164.7 million in 2020,
down approximately 7% on 2019, and an adjusted EBITDA of approximately Euro 21.5 million.
The net financial debt at December 31, 2020 amounted to approximately Euro 47.2 million.
Sant’Agata S.p.A. - Chiorino Group
TIPO holds 20% of Sant’Agata S.p.A., the parent of the Chiorino Group. The Chiorino Group
is a global leader in the manufacture of process and conveyor belts for industrial processes.
The Chiorino Group's preliminary results for 2020 point to a substantial recovery of the
moderate decline in the first half of the year, with consolidated revenues of approximately Euro
113 million, down slightly on 2019 (-2.3%), and an EBITDA, pre IFRS 16, of approximately
Euro 23 million, substantially in line with the previous year. Chiorino and Sant’Agata had
cumulative net cash and cash, pre IFRS 16, equivalents of Euro 27.5 million at December 31,
2020.
Both investees were thus able to face the difficulties caused by the pandemic while protecting
their businesses and strategic positioning and proving their ability to resume operation as soon
as the conditions were in place.
Ongoing restrictions and closures related to the COVID-19 pandemic could continue to harm
the investee's operations in 2021. Consequently, their 2021 budgets will be updated as the
pandemic and its effects take shape.
TIP recently has tendered an offer for TIPO, BETA and Betaclub shares held by the family
offices that had participated in the transactions.
OTHER ASSOCIATED COMPANIES
TIP in addition holds:
- a 29.97% stake in Gatti & Co. GmbH, a corporate finance boutique with headquarters in
Frankfurt (Germany), primarily operating on the cross-border M&A market between Germany
and Italy;

TAMBURI INVESTMENT PARTNERS GROUP
Page 15
- a stake of 30% in Palazzari & Turries Ltd, a finance boutique based in Hong Kong which has
a long tradition of assisting numerous Italian companies in start-up, joint ventures and
corporate finance in China, building upon its long-standing experience in China and Hong
Kong.
C) OTHER COMPANIES
INVESTMENTS IN LISTED COMPANIES
Amplifon S.p.A. TIP shareholding at December 31, 2020: 3.26% Listed on the Italian Stock Exchange - STAR Segment.
The Amplifon Group is world leader in the distribution and personalised application of hearing
aids with around 11,000 sales points between direct and affiliates.
It ended 2020 with excellent results in terms of revenues, profitability and cash flow, continuing to
show remarkable resilience. Consolidated revenues were Euro 1,555.5 million, down 9.3% on 2019,
although significantly recovering in the third and fourth quarters. EBITDA was Euro 371.0 million,
equal to 23.8% of revenues, due to the adoption of strong cost containment measures. The financial
debt and free cash flow improved.
Ongoing developments in the COVID-19 pandemic, as well as uncertainties surrounding the timing
of vaccinations in many countries worldwide, limit visibility regarding the coming months and urge
caution. The company currently expects the hearing care market to normalise gradually over the
course of the year as vaccination campaigns are rolled out and measures are eased progressively.
Digital Magics S.p.A. TIP shareholding at December 31, 2020: 22.72% Listed on the Alternative Investment Market (AIM) Italy
Digital Magics S.p.A. is the leading Italian incubator and accelerator of both digital and non-digital
innovative start-ups and currently has 70 active investments and 13 completed exists.
Digital Magics designs and develops Open Innovation programmes to support Italian businesses
in innovative processes, services and products thanks to innovative technologies; it also launched
and is supporting the development, thanks to the active involvement of TIP, of the largest
innovative hub in partnership with Talent Garden - the largest European co-working platform -
WebWorking, WithFounders and Innogest.
The placement of 4,000 SFP DM 2020 equity instruments was completed in January 2021,
representing the entire total offer, amounting to Euro 2 million, of which 908 instruments
subscribed by StarTIP for an outlay of approximately Euro 450 thousand. The proceeds of the
placement will mainly be used to invest in the most deserving companies in the portfolio and in the
new companies that will be selected for the incubation and acceleration programs.
TAMBURI INVESTMENT PARTNERS GROUP
Page 16
Hugo Boss AG TIP shareholding at December 31, 2020: 1.53% 1.39% Listed on the Frankfurt Stock Exchange
Hugo Boss AG is market leader in the premium segment of the medium-high and high-end apparel
market for men and women, with a diversified range from fashionable clothing to footwear and
accessories.
Hugo Boss products are distributed in over 1,000 shops worldwide.
Hugo Boss was impacted by the pandemic with closures of stores and a total reduction in sales as
of 31 December of 33% from Euro 2,884 million to Euro 1,946 million, with EBITDA of Euro
230 million. The drop in sales was more contained in the fourth quarter than in the first half of the
year, while EBIT returned to positive territory in the fourth quarter.
We foresee good news from the arrival of the new CEO, expected within two months.
Moncler S.p.A. TIP shareholding at December 31, 2020: 0.79% Listed on the Italian Stock Exchange - STAR Segment
Moncler is a global leader in the apparel luxury segment.
The drop in the first nine months, due to the effects of the virus containment measures adopted in
the various countries was partly recouped in the fourth quarter of 2020. The Moncler Group ended
2020 with consolidated revenues of Euro 1,440 million, down 12% at constant exchange rates, and
an EBIT of Euro 368.8 million, down from Euro 491.8 million in 2019.
In December, agreements were finalised for the acquisition of Sportswear Company S.p.A., the
company that owns the Stone Island brand. This company will thus be integrated into the Moncler
Group in 2021.
Moncler’s 2021 results will also depend on the course of COVID-19 countermeasures and the
resulting possible store closures or restrictions on movement and travel that have been significantly
impacting the luxury sector for over a year.
INVESTMENTS IN NON-LISTED COMPANIES
Azimut Benetti S.p.A. TIP shareholding at December 31, 2020: 12.07%
Azimut Benetti S.p.A. is one of the most prestigious constructors of mega yachts worldwide. The
company has ranked as “Global Order Book” leader for over 20 consecutive years, which ranks
the major global constructors of yachts and mega yachts of over 24 metres worldwide. It has 6
boatyards and one of the world’s most comprehensive sales networks.

TAMBURI INVESTMENT PARTNERS GROUP
Page 17
The effects on the global economy resulting from COVID-19 also had a negative impact on the
global nautical market, which contracted by between 10% and 20%. Against this backdrop, in its
latest financial statements for the year ending August 31, 2020 the company reports a reduction in
value of production of 12% to about Euro 758 million and an adjusted EBITDA of Euro 57.2
million.
The outlook for 20/21 is currently positive and the order backlog available, albeit with the
unknowns associated with the pandemic trends and resulting market volatility.
Welcome Italia S.p.A. TIP shareholding at December 31, 2020: 12.04%
In December 2019 TIP purchased a 12.04% interest in Welcome Italia, a leading Italian provider
of innovative integrated telecommunication and IT services to businesses with a network of partner
firms (and agents) that act as system integrators, selling, installing and maintaining the services and
devices offered by the group. It also manages two data centres, hosted by the company offices in
direct contact with the network operation centre.
Welcome Italia’s results for 2020 report consolidated revenues of approximately Euro 61.8 million,
up by 7.2% on 2019, and an EBITDA of approximately Euro 16.7 million, up by 13.4% on 2019.
Net cash and cash equivalents were approximately Euro 13.1 million at December 31.
In 2020 the company's financial performance benefited from the acceleration in demand for
connectivity, telecommunications and related services that occurred as a result of the pandemic.
The outlook for 2021 is that this trend will be consolidated.
D) OTHER INVESTMENTS AND FINANCIAL INSTRUMENTS
In 2015 TIP subscribed a partially convertible bond of approximately Euro 8 million in one of the
holdings with an investment in Octo Telematics, the principal global provider of telematic services
for the insurance and automotive market.
In addition to the investments listed, TIP holds stakes in other listed and non-listed companies
which in terms of amounts invested, are not considered significant.
RELATED PARTY TRANSACTIONS
The transactions with related parties are detailed in Note 35 of the notes to the consolidated
financial statements and in note 34 to the notes to the separate financial statements.
EVENTS AFTER DECEMBER 31, 2020
On January 12, 2021, Clubtre sold 10 million Prysmian shares through an accelerated bookbuilding
procedure for Euro 29.10 per share, net of commissions. This transaction generated a capital gain,
at consolidated level, of approximately Euro 98 million (approximately Euro 140.3 million in
Clubtre's separate financial statements). The proceeds of the sale, Euro 291 million, were thus
partially used:

TAMBURI INVESTMENT PARTNERS GROUP
Page 18
- Euro 100,442,297 for early repayment in full of the BNL loan (including interest and breakage
fees);
- Euro 66,025,879 for early repayment in full of the TIP interest-bearing shareholder loan
(amount including interest);
- Euro 2,600,000 for repayment of the non-interest-bearing shareholder loan (proportional
repayment for the two shareholders);
- Euro 39,523,698 to distribute retained earnings to shareholders (proportional distribution for
the two shareholders, of which Euro 26.2 million to TIP), as approved by the Clubtre
shareholders' meeting on January 26, 2021.
This transaction represents a partial realisation of the significant investment made in 2010 as part
of a club deal involving major family offices. Following the transaction, Clubtre retains a significant
investment in Prysmian of 3,577,436 shares, representing 1.334% of the share capital.
The extraordinary FCA dividend, amounting to Euro 2.7 million for TIP, was collected in January.
The steps needed to render the ITACA EQUITY project operational were finalised in February,
with funding of Euro 600 million, of which around Euro 100 million from TIP, Euro 2 million of
which have already been paid. The ITACA project, promoted by TIP with three top-level partners
in this specific segment: Sergio Iasi, Angelo Catapano and Massimo Lucchini, led to the creation of
ITACA EQUITY HOLDING S.p.A., which will invest in the equity of companies experiencing
financial difficulties and/or needing strategic and/or organisational turnaround. This structure will
allow the approximately 40 participating family offices to analyse the tangible proposals and invest
in each one - according to the company scheme already tested with Asset Italia - only in the event
of interest.
In February TIP also launched a cash offer to purchase 100% of TIPO's shares, of which TIP
already holds 29.29%. The offer also seeks to purchase the shares held by the participants in the
Beta Utensili S.p.A. club deal (other then those held by the majority shareholder of Beta Utensili
S.p.A.) for a maximum total outlay of Euro 134.5 million. It is expected to be concluded by April.
Treasury shares purchases amounting to approximately Euro 5.4 million and the investment of
liquidity in listed bonds and shares also continued.
In March TIP acquired 20% of DV Holding S.p.A., parent company of the DoveVivo group, the
European co-living leader, along with 8% of Alimentiamoci.
OUTLOOK
The start of vaccinations worldwide is the most important aspect of being able to formulate any
forecasts. The time needed for a definitive return to normal remains uncertain, but the real question
is what the new normal will be like: habits have shifted and in some cases been transformed,
attitudes towards consumption and investment - and, even more so, their impact on the financial
performance of companies in all corners of the globe - remain to be understood. Many economists
and banks have also recently resumed their scrutiny of possible increases in inflation which, until a
few weeks ago, was to be chased and stimulated, and now ranks among their greatest fears. Raw
TAMBURI INVESTMENT PARTNERS GROUP
Page 19
materials and shipping costs - with considerable consequences for corporate logistics - are rising
unexpectedly and significantly, thus adding further elements of risk and uncertainty.
In response, TIP continues to present itself to the markets as having three main strengths:
1. its portfolio of equity investments is objectively composed of leading global, European and
Italian firms, and thus as in other crises, the strength of its positioning will be fundamental and
the effects at both the strategic and operational level should be more limited than for weaker
companies, as was also seen for very many of the equity investments in portfolio over the past
twelve months;
2. the level of debt of all companies in which TIP holds an interest is quite limited, and this
characteristic has also historically been very important to limiting the damage caused by periods
of crisis of all kinds;
3. TIP has never had so much immediately available cash. It has the proceeds of the Euro 300
million bond issued in December 2019, gross of the repayment of the previous Euro 100
million bond and the proceeds of the partial divestment of Prysmian, but also the funds of the
investee Asset Italia, which has so far invested about half of the Euro 550 million available and
the Euro 600 million of ITACA, which has just begun to operate.
At a time like that which lies ahead, the above three factors will be very important to supporting
and developing the business. Given the nature of the activities of TIP it is not easy, as always, to
forecast the performance for the current year. The results will depend a great deal on market
performance, the course of vaccination and the opportunities that arise in the future. The 2021
budgets of investees and potential target companies are all still subject to considerable uncertainty,
and this is even more so in the case of long-term plans. Accordingly, it would be rash, to say the
least, to imagine scenarios or formulate specific plans.
RESEARCH AND DEVELOPMENT
During the year the Company did not carry out any research and development activity.
PRINCIPAL RISKS AND UNCERTAINTIES
In relation to the principal Group risks and uncertainties, reference should be made to Note 32 of
the consolidated financial statements.
TREASURY SHARES
The treasury shares in portfolio at December 31, 2020 totalled 16,131,801, equal to 8.749% of the
share capital. At March 25, 2021, treasury shares in portfolio total 16,887,893, equal to 9.159% of
the share capital.

TAMBURI INVESTMENT PARTNERS GROUP
Page 20
MOTION FOR ALLOCATION OF THE RESULT FOR THE YEAR OF TAMBURI INVESTMENT
PARTNERS S.P.A.
Dear Shareholders,
we invite you to approve the 2020 statutory financial statements of Tamburi Investment Partners
S.p.A., as presented. The financial statements present a profit of Euro 32,277,899, that does not
reflect the income and capital gains of approximately Euro 38.5 million, which, following the
adoption of IFRS 9, do not pass through the income statement, but were transferred directly
through equity to retained earnings.
In view of the above, we propose that you allocate the profit for the year as follows:
- to the legal reserve Euro 1,287,162.96;
- to outstanding ordinary shares (*), a dividend of Euro 0.100 per share, gross of withholding
taxes, with dividend coupon date of May 24, 2021 and payment on May 26, 2021;
- the residual to retained earnings.
(*) Net of the 16,887,893 treasury shares held by the Company at the dividend coupon date.
On behalf of the Board of Directors
The Chairman
Giovanni Tamburi
Milan, March 25, 2021

TAMBURI INVESTMENT PARTNERS GROUP
Page 21
(1) The 2020 income statement (as for 2019) has been prepared in accordance with IFRS 9 and therefore does not include the income and capital gains in the period on the sale of equity investments of Euro 61.1 million, in addition to write-downs of Euro 26.8 million. In the Directors’ Report (page 4), the proforma income statement is presented, drawn up considering the capital gains and losses realised and the write-downs of investments in equity, as per IAS 39 in force at December 31, 2017, which reports a net profit of approximately Euro 36.4 million.
Consolidated Income Statement Tamburi Investment Partners Group (1)
(in Euro) 2020
of which related parties 2019
of which related parties Note
Revenue from sales and services 4,330,409 1,683,526 6,783,583 3,324,698 4
Other revenues 71,830 212,700
Total revenues 4,402,239 6,996,283 Purchases, service and other costs (2,270,267) 63,355 (3,055,205) 104,924 5 Personnel expense (12,886,834) (20,267,359) 6
Other income 0 3,429,524 2
Amortisation, depreciation and write-downs (344,956) (356,399)
Operating Loss (11,099,368) (13,253,156)
Financial income 24,710,501 26,250,247 7
Financial charges (18,001,402) (12,927,381) 7
Profit/(loss) before adjustments to investments (4,390,269) 69,710
Share of profit of associated companies measured under the equity method 5,447,898 30,708,637 8
Profit/(loss) before taxes 1,057,629 30,778,347
Current and deferred taxes 896,780 2,049,209 9
Profit 1,954,409 32,827,556
Profit / (loss) attributable to the shareholders of the parent 148,159 30,985,586
Profit attributable to minority interests 1,806,250 1,841,970
Basic earnings per share 0.001 0.19 24 Diluted earnings per share 0.001 0.19 24
Number of shares in circulation 168,247,500 162,246,224

TAMBURI INVESTMENT PARTNERS GROUP
Page 22
Consolidated Comprehensive Income Statement
Tamburi Investment Partners Group
(in Euro) 2020 2019 Note
Profit 1,954,409 32,827,556 24
Other comprehensive income items
Income through P&L
Increase/(decrease) in associated companies measured under the equity method (6,921,666) 777,480
13
Unrealised profit/(loss) (6,998,764) 786,921
Tax effect 77,099 (9,441)
Increases/decreases in the value of current financial assets measured at FVOCI 1,318,136 1,626,529
19
Unrealised profit/(loss) 1,869,155 1,733,312
Tax effect (551,019) (106,784)
Income/(loss) not through P&L
Increase/decrease investments measured at FVOCI 159,722,079 174,933,857 12 Profit 172,021,275 177,038,820 Tax effect (12,299,196) (2,104,963)
Increase/(decrease) in associated companies measured under the equity method (9,662,642) 4,343,716
13
Profit/(loss) (9,855,390) 4,396,621
Tax effect 192,748 (52,905)
Other components 10,059 (15,158)
Total other comprehensive income items 144,465,966 181,666,424
Total comprehensive income 146,420,375 214,493,981
Total income attributable to the shareholders of the parent 113,211,442 203,216,055
Total income attributable to minority interests 33,208,933 11,277,925

TAMBURI INVESTMENT PARTNERS GROUP
Page 23
Consolidated Statement of Financial Position Tamburi Investment Partners Group
(in Euro) December 31,
2020
of which related parties
December 31, 2019
of which related parties Note
Non-current assets Property, plant and equipment 95,690 113,616 10 Right-of-use 2,600,791 2,896,989 2 Goodwill 9,806,574 9,806,574 11 Other intangible assets 17,283 26,906 11 Investments measured at FVOCI 880,159,540 686,906,500 12 Associated companies measured under the equity method 526,156,105 511,452,686 13 Financial receivables measured at amortised cost 3,611,418 7,503,330 14 Financial assets measured at FVTPL 2,883,243 3,217,817 15 Tax assets 299,730 608,269 21
Total non-current assets 1,425,630,374 1,222,532,687
Current assets Trade receivables 1,449,106 519,844 779,999 559,044 16 Current financial receivables measured at amortised cost 15,651 556,513 540,862 17 Derivative instruments 5,559,926 923,063 18 Current financial assets measured at FVOCI 179,859,731 96,688,111 19 Cash and cash equivalents 3,250,495 171,948,302 20 Tax assets 2,295,841 966,458 21 Other current assets 111,058 246,181
Total current assets 192,541,808 272,108,627
Total assets 1,618,172,182 1,494,641,314
Equity Share capital 95,877,237 89,441,422 23 Reserves 477,180,422 395,172,971 24 Retained earnings 386,974,911 310,536,546 24 Result attributable to the shareholders of the parent 148,159 30,985,586 25 Total equity attributable to the shareholders of the parent 960,180,729 826,136,525 Equity attributable to minority interests 109,534,852 76,341,604
Total equity 1,069,715,581 902,478,129
Non-current liabilities Post-employment benefit 362,309 342,039 26 Derivative instruments 285,846 3,709,973 27 Financial liabilities for leasing 2,305,767 2,627,341 2 Financial payables 451,403,080 351,718,955 28 Deferred tax liabilities 13,272,362 1,570,707 22
Total non-current liabilities 467,629,364 359,969,015
Current liabilities Trade payables 528,409 30,687 756,545 31,094 Current financial liabilities for leasing 321,574 269,648 Current financial liabilities 70,695,363 211,420,916 29 Tax liabilities 120,237 73,516 30 Other liabilities 9,161,654 19,673,545 31
Total current liabilities 80,827,237 232,194,170
Total liabilities 548,456,601 592,163,185
Total equity and liabilities 1,618,172,182 1,494,641,314

TAMBURI INVESTMENT PARTNERS GROUP
Page 24
Statement of changes in Consolidated Equity
(in Euro)
Share Share legal FV OCI reserve FV OCI reserve Treasury Other IFRS Merger Retained Result Equity Net equity Result Equity
capital premium reserve without reversal with reversal shares reserve reserve surplus earnings for the period shareholders minorities for period
reserve to profit and loss to profit and loss reserve business shareholders of parent minorities
combination of parent
At January 1, 2019 consolidated 85,509,667 175,716,503 16,646,394 127,203,259 (1,076,522) (31,111,031) (3,313,964) (483,655) 5,060,152 231,264,083 27,004,846 632,419,732 31,101,835 2,830,199 666,351,766
Change in fair value of investments
measured at FVOCI 165,590,501 165,590,501 9,343,356 174,933,857
Change in associated companies measured under the equity method 4,343,716 684,881 5,028,597 92,599 5,121,196
Change in fair value of current financial assets measured at FVOCI 1,626,529 1,626,529 1,626,529
Employee benefits (15,158) (15,158) (15,158)
Total other comprehensive income items 169,934,217 2,311,410 (15,158) 172,230,469 9,435,955 181,666,424
Profit/(loss) 2019 30,985,586 30,985,586 1,841,970 32,827,556
Total comprehensive income 169,934,217 2,311,410 (15,158) 30,985,586 203,216,055 9,435,955 1,841,970 214,493,980
Change in consolidation area 0 32,081,263 32,081,263
Reversal of Fv reserve due to capital gain realised (70,922,623) 70,922,623 0 0
Change in reserves of associated companies measure under equity method (297,650) (297,650) (459,618) (757,269)
Change in other reserves (4) (4) (4)
Dividends distribution (11,072,967) (11,072,967) (490,000) (11,562,967)
Warrant exercise 3,931,755 33,873,580 37,805,335 37,805,335
Allocation profit 2018 455,539 26,549,307 (27,004,846) 0 2,830,199 (2,830,199) 0
Stock Option exercise (4,219,050) (7,126,500) (11,345,550) (11,345,550)
Allocation of Units related to performace shares 212,706 212,706 212,706
Acquisition of treasury shares (25,489,792) (25,489,792) (25,489,792)
Sale of treasury shares (733,571) 2,057,893 (635,662) 688,660 688,660
At December 31, 2019 consolidated 89,441,422 208,856,512 17,101,933 226,214,853 1,234,888 (54,542,930) (8,268,782) (483,655) 5,060,152 310,536,546 30,985,586 826,136,525 74,499,634 1,841,970 902,478,129
Share Share legal FV OCI reserve FV OCI reserve Treasury Other IFRS Merger Retained Result Equity Net equity Result Equity
capital premium reserve without reversal with reversal shares reserve reserve surplus earnings for the period shareholders minorities for period
reserve to profit and loss to profit and loss reserve business shareholders of parent minorities
combination of parent
At January 1, 2020 consolidated 89,441,422 208,856,512 17,101,933 226,214,853 1,234,888 (54,542,930) (8,268,782) (483,655) 5,060,152 310,536,546 30,985,586 826,136,525 74,499,634 1,841,970 902,478,129
Change in fair value of investments
measured at FVOCI 128,102,489 128,102,489 31,619,590 159,722,079
Change in associated companies measured under the equity method (9,662,642) (6,704,759) (16,367,401) (216,906) (16,584,308)
Change in fair value of current financial assets measured at FVOCI 1,318,136 1,318,136 1,318,136
Employee benefits 10,059 10,059 10,059
Total other comprehensive income items 118,439,847 (5,386,623) 10,059 113,063,282 31,402,684 144,465,966
Profit/(loss) 148,159 148,159 1,806,250 1,954,409
Total comprehensive income 118,439,847 (5,386,623) 10,059 148,159 113,211,442 31,402,684 1,806,250 146,420,375
Reversal of Fv reserve due to capital gain realised (60,528,961) 60,528,961 0 0
Change in reserves of associated companies measure under equity method 1,641,016 1,641,016 (15,686) 1,625,330
Change in oher reserves 6 6 6
Dividends distribution (14,289,831) (14,289,831) (14,289,831)
Warrant exercise 6,435,815 60,521,413 66,957,228 66,957,228
Allocation profit 2019 786,351 30,199,235 (30,985,586) 0 1,841,970 (1,841,970) 0
Allocation of Units related to performance shares 3,538,660 3,538,660 3,538,660
Acquisition of treasury shares (37,031,277) (37,031,277) (37,031,277)
Sale of treasury shares (23,374) 56,559 (16,225) 16,960 16,960
At December 31, 2020 consolidated 95,877,237 269,354,551 17,888,284 284,125,739 (4,151,736) (91,517,648) (3,095,265) (483,655) 5,060,152 386,974,911 148,159 960,180,729 107,728,602 1,806,250 1,069,715,581
TAMBURI INVESTMENT PARTNERS GROUP
Page 25
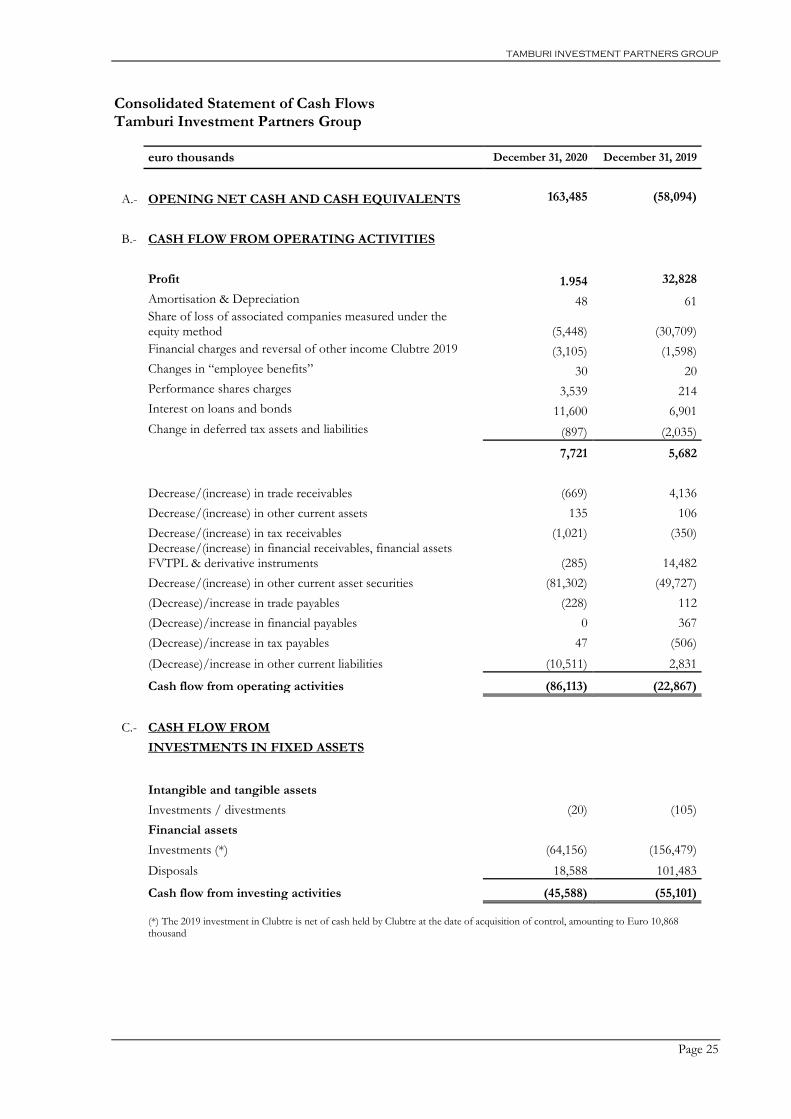
Consolidated Statement of Cash Flows Tamburi Investment Partners Group
euro thousands December 31, 2020 December 31, 2019
A.- OPENING NET CASH AND CASH EQUIVALENTS 163,485 (58,094)
B.- CASH FLOW FROM OPERATING ACTIVITIES
Profit 1.954 32,828
Amortisation & Depreciation 48 61
Share of loss of associated companies measured under the equity method (5,448) (30,709)
Financial charges and reversal of other income Clubtre 2019 (3,105) (1,598)
Changes in “employee benefits” 30 20
Performance shares charges 3,539 214
Interest on loans and bonds 11,600 6,901
Change in deferred tax assets and liabilities (897) (2,035)
7,721 5,682
Decrease/(increase) in trade receivables (669) 4,136
Decrease/(increase) in other current assets 135 106
Decrease/(increase) in tax receivables (1,021) (350)
Decrease/(increase) in financial receivables, financial assets FVTPL & derivative instruments (285) 14,482
Decrease/(increase) in other current asset securities (81,302) (49,727)
(Decrease)/increase in trade payables (228) 112
(Decrease)/increase in financial payables 0 367
(Decrease)/increase in tax payables 47 (506)
(Decrease)/increase in other current liabilities (10,511) 2,831
Cash flow from operating activities (86,113) (22,867)
C.- CASH FLOW FROM
INVESTMENTS IN FIXED ASSETS
Intangible and tangible assets
Investments / divestments (20) (105)
Financial assets Investments (*) (64,156) (156,479)
Disposals 18,588 101,483
Cash flow from investing activities (45,588) (55,101)
(*) The 2019 investment in Clubtre is net of cash held by Clubtre at the date of acquisition of control, amounting to Euro 10,868 thousand

TAMBURI INVESTMENT PARTNERS GROUP
Page 26
euro thousands December 31, 2020 December 31, 2019
D.- CASH FLOW FROM
FINANCING
Loans
New loans 813 349,667
Repayment of loans (100,948) (34,338)
Interest paid on loans and bonds (14,229) (5,877)
Share capital Share capital increase and capital contributions on account 66,957 37,805
Payment of dividends (14,290) (11,563)
Changes from purchase/sale of treasury shares (37,031) (25,490)
Exercise SOP 17 (10,657)
Cash flow from financing activities (98,711) 299,548
E.- NET CASH FLOW FOR THE YEAR (230,413) 221,580
F. CLOSING CASH AND CASH EQUIVALENTS (66,928) 163,485
The breakdown of the net available liquidity was as follows:
Cash and cash equivalents 3,250 171,948
Bank payables due within one year (70,179) (8,463)
Closing cash and cash equivalents (66,928) 163,485

TAMBURI INVESTMENT PARTNERS GROUP
Page 27
NOTES TO THE CONSOLIDATED FINANCIAL STATEMENTS AT DECEMBER 31, 2020
(1) Group activities
The TIP Group is an independent investment/merchant bank focused on Italian medium-sized
companies, with a particular involvement in:
1. 1. investments: as an active shareholder in companies (listed and non-listed) capable of
achieving “excellence” in their relative fields of expertise and, with regards to the StarTIP
project, in start-ups and innovative companies;
2. advisory: in corporate finance operations, in particular acquisitions and sales through the
division Tamburi & Associati (T&A).
It will also make investments through ITACA EQUITY HOLDING in companies that are
experiencing temporary financial difficulties and need both a strategic and organisational refocus.
(2) Accounting standards
The parent company TIP was incorporated in Italy as a limited liability company and with
registered office in Italy.
The company was listed in November 2005 and on December 20, 2010 Borsa Italiana S.p.A.
assigned the STAR classification to TIP ordinary shares.
These consolidated financial statements for the year ended December 31, 2020 were approved by
the Board of Directors on March 25, 2021 which authorised their publication.
The consolidated financial statements at December 31, 2020 were prepared in accordance with the
going-concern concept and in accordance with International Financial Reporting Standards and
International Accounting Standards (hereafter “IFRS”, “IAS” or international accounting
standards) issued by the International Accounting Standards Boards (IASB) and the relative
interpretations of the International Financial Reporting Interpretations Committee (IFRIC), and
adopted by the European Commission with Regulation No. 1725/2003 and subsequent
modifications, in accordance with Regulation No. 1606/2002 of the European Parliament.
The consolidated financial statements in accordance with IAS1 are comprised of the income
statement, the comprehensive income statement, the statement of financial position, the statement
of changes in equity, the statement of cash flow and the explanatory notes, together with the
Directors’ Report. The financial statements were prepared in units of Euro, without decimal
amounts.
The accounting policies and methods utilised for the preparation of these consolidated financial
statements have changed from those utilised for the preparation of the consolidated financial
statements for the year ended December 31, 2019, as outlined below in the paragraph “new
accounting standards”. Other new accounting standards effective for periods beginning on or after
January 1, 2020 had no impact on the Company's financial statements.

TAMBURI INVESTMENT PARTNERS GROUP
Page 28
The income statement, the statement of comprehensive income and the statement of cash flows
for the year 2019 and the statement of financial position at December 31, 2019 were utilised for
comparative purposes.
During the year, no special circumstances arose requiring recourse to the exceptions allowed under
IAS 1.
The preparation of the consolidated financial statements at December 31, 2020 requires the
formulation of valuations, estimates and assumptions which impact the application of the
accounting principles and the amounts of the assets, liabilities, costs and revenues recorded in the
financial statements. These estimates and relative assumptions are based on historical experience
and other factors considered reasonable. However it should be noted as these refer to estimates,
the results obtained will not necessarily be the same as those represented. The estimates are used
to value the provisions for risks on receivables, measurement at fair value of financial instruments,
impairment tests, employee benefits and income taxes.
New accounting standards
New accounting standards, amendments and interpretations applicable for periods
beginning January 1, 2020
▪ Amendments to IFRS 10 and IAS 28: the amendments introduced better define the accounting
treatment of gains or losses from transactions with joint ventures or associated companies
measured at equity.
▪ In March 2018, the IASB published the reviewed version of the Conceptual Framework for
Financial Reporting (“Conceptual Framework”). Simultaneously, it published a document
updating the references in IFRS to the previous Conceptual Framework.
▪ Amendments to IFRS 3 - “Business Combinations”. On October 22, 2018, the IASB published
this amendment to aid in determining whether a transaction is an acquisition or a business or
of a group of assets that does not meet the definition of a business provided in IFRS 3.
▪ Amendments to IAS 1 and IAS 8 - “Definition of Material”. On October 31, 2018, the IASB
published this amendment to clarify the definition of “material” in order to aid companies in
assessing whether information is to be included in the financial statements.
▪ Amendments to IFRS 9, IAS 39 and IFRS 7: Interest Rate Benchmark Reform. On September
26, 2019, the IASB published these amendments with the objective of providing useful financial
information to companies during the period of uncertainty arising from the phasing out of
interest rate parameters such as interbank offered rates (IBORs); they amend some specific
hedge accounting requirements to mitigate potential effects arising from the uncertainty caused
by the IBOR reform. In addition, the amendments require companies to provide additional
information to investors about their hedging relationships that are directly affected by these
uncertainties.
▪ On May 28, 2020, the IASB published an amendment called "Covid-19 Related Rent
Concessions (Amendment to IFRS 16)". The document establishes for lessees the option to
account for the reductions in rents connected with COVID-19 without having to assess,
through the analysis of contracts, whether the definition of lease modification of IFRS 16 has
been complied with. Therefore, lessees applying this option will be able to account for the

TAMBURI INVESTMENT PARTNERS GROUP
Page 29
effects of rent reductions directly in the income statement on the effective date of the reduction.
Some associated companies have opted to account for rent reductions associated with COVID-19
directly in the income statement. The application of the other amendments to the existing
accounting standards reported above did not have a significant impact on the Group consolidated
financial statements.
New standards, amendments to existing standards and interpretations applicable for
periods subsequent to January 1, 2020 and not yet adopted by the Group
At the reporting date, the relevant bodies of the European Union had not yet concluded the
process necessary for the implementation of the amendments and standards described below.
▪ On May 18, 2017, the IASB published IFRS 17 Insurance Contracts. The standard has the
objective to improve investors’ understanding of the exposure to risk, earnings and the financial
position of insurers. The standard is effective from January 1, 2023, although advance
application is permitted, only for entities applying IFRS 9 – Financial Instruments and IFRS 15
- Revenue from Contracts with Customers.
▪ On January 23, 2020, the IASB published an amendment entitled “Amendments to IAS 1
Presentation of Financial Statements: Classification of Liabilities as Current or Non-current”.
The purpose of the document is to clarify how to classify payables and other short or long-
term liabilities. The amendments enter into force on January 1, 2022, although the IASB has
issued an exposure draft to postpone their entry into force until January 1, 2023; however, early
application is permitted.
▪ On May 14, 2020, the IASB published the following amendments: - Amendments to IFRS 3
Business Combinations: the purpose of the amendments is to update the reference in IFRS 3
to the Conceptual Framework in the revised version, without this entailing any changes to the
provisions of IFRS 3. - Amendments to IAS 16 Property, Plant and Equipment: the purpose
of the amendments is not to allow the deduction from the cost of property, plant and
equipment of the amount received from the sale of goods produced during the testing phase
of the relevant asset. These sales revenues and related costs will therefore be recognised to the
income statement. - Amendments to IAS 37 Provisions, Contingent Liabilities and Contingent
Assets: the amendment clarifies that in estimating the possible onerousness of a contract, all
costs directly attributable to the contract must be considered. Accordingly, the assessment of
whether a contract is onerous includes not only incremental costs (such as the cost of direct
material used in processing), but also all costs that the enterprise cannot avoid because it has
entered into the contract (such as, for example, the share of personnel expenses and
depreciation of machinery used to perform the contract). Annual Improvements 2018-2020:
the amendments were made to IFRS 1 First-time Adoption of International Financial Reporting
Standards, IFRS 9 Financial Instruments, IAS 41 Agriculture and the Illustrative Examples of
IFRS 16 Leases. All the amendments will enter into force from January 1, 2022.
▪ On May 28, 2020, the IASB published an amendment called "Extension of the Temporary
Exemption from Applying IFRS 9 (Amendments to IFRS 4)". The amendments allow the
temporary exemption from the application of IFRS 9 to be extended until January 1, 2023. The
amendments will enter into force from January 1, 2021.

TAMBURI INVESTMENT PARTNERS GROUP
Page 30
On the basis of the analyses conducted, significant effects are not expected from the introduction
of the standard on the Group’s consolidated financial statements.
Consolidation principles and basis of consolidation
Consolidation scope
The consolidation scope includes the parent TIP - Tamburi Investment Partners S.p.A. and the
companies over which it exercises direct or indirect control. An investor controls an entity in which
an investment has been made when exposed to variable income streams or when possessing rights
to such income streams based on the relationship with the entity, and at the same time has the
capacity to affect such income steams through the exercise of its power. Subsidiaries are
consolidated from the date control is effectively transferred to the Group, and cease to be
consolidated from the date control is transferred outside the Group.
At December 31, 2020, the consolidation scope included the companies Clubdue S.r.l., Clubtre
S.p.A., StarTIP S.r.l. and TXR S.r.l..
The details of the subsidiaries were as follows:
Company Registered Office Share capital
Number of shares
Number of shares held % Held
Clubdue S.r.l. Milan 10,000 10,000 10,000 100%
Clubtre S.p.A. (1) Milan 120,000 120,000 45,207 37.67%
StarTIP S.r.l. Milan 50,000 50,000 50,000 100%
TXR S.r.l. Milan 100,000 100,000 51,000 51.00%
(1) Clubtre holds 51,738 treasury shares and consequently the fully diluted holding is 66.23%.
Consolidation procedures
The consolidation of the subsidiaries is made on the basis of the respective financial statements of
the subsidiaries, adjusted where necessary to ensure uniform accounting policies adopted by the
Parent Company.
All inter-company balances and transactions, including any unrealised gains deriving from
transactions between Group companies are fully eliminated. Unrealised losses are eliminated except
when they represent a permanent impairment in value.
Accounting policies
The most significant accounting policies adopted in the preparation of the consolidated financial
statements at December 31, 2020 are disclosed below.
PROPERTY, PLANT AND EQUIPMENT
Property, plant & equipment are recognised at historical cost, including directly allocated accessory
costs and those necessary for bringing the asset to the condition for which it was acquired. If major
components of such tangible assets have different useful lives, such components are accounted for
separately.
Tangible assets are presented net of accumulated depreciation and any losses in value, calculated as

TAMBURI INVESTMENT PARTNERS GROUP
Page 31
described below.
Depreciation is calculated on a straight-line basis according to the estimated useful life of the asset;
useful life is reviewed annually. Any changes, where necessary, are recorded in accordance with
future estimates; the main depreciation rates used are the following:
following:
- furniture & fittings 12%
- equipment & plant 15%
- EDP 20%
- mobile telephones 20%
- equipment 15%
- Automobiles 25%
The book value of tangible assets is tested to ascertain possible losses in value if events or
circumstances indicate that the book value cannot be recovered. If there is an indication of this
type and in the case where the carrying value exceeds the realisable value, the assets must be written
down to their realisable value. The realisable value of the property, plant and equipment is the
higher between the net sales price and the value in use. In defining the value of use, the expected
future cash flows are discounted using a pre-tax discount rate that reflects the current market
assessment of the time value of money and the specific risks of the activity. Losses in value are
charged to the income statement under amortisation, depreciation and write-down costs. Such
losses are restated when the reasons for their write-down no longer exist.
At the moment of the sale, or when there are no expected future economic benefits from the use
of an asset, this is eliminated from the financial statements and any loss or gain (calculated as the
difference between the disposal value and the book value) is recorded in the income statement in
the year of the above-mentioned elimination.
GOODWILL
Business combinations are recorded using the purchase method. Goodwill represents the surplus
of acquisition cost compared to the purchaser’s share of the identifiable net fair value of the assets
and liabilities acquired, current and potential. After initial recognition, goodwill is reduced by any
accumulated losses in value, calculated with the methods described below.
Goodwill deriving from acquisitions prior to January 1, 2004 are recorded at replacement cost,
equal to the value recorded in the last financial statements prepared in accordance with the previous
accounting standards (December 31, 2003). In the preparation of the opening financial statements
in accordance with international accounting standards the acquisitions before January 1, 2004 were
not reconsidered.
Goodwill is subject to a recoverability analysis conducted annually or at shorter intervals in case of
events or changes that could result in possible losses in value. Any goodwill emerging at the
acquisition date is allocated to each cash-generating unit which is expected to benefit from the
synergies of the acquisition. Any loss in value is identified by means of valuations based on the
ability of each cash-generating unit to produce cash flows for purposes of recovering the part of

TAMBURI INVESTMENT PARTNERS GROUP
Page 32
goodwill allocated to it; these valuations are conducted with the methods described in the section
referring to tangible assets. If the recoverable value of the cash-generating unit is less than the
attributed book value, the loss in value is recorded.
This loss is not restated if the reasons for the loss no longer exist.
OTHER INTANIGIBLE ASSETS
Other intangible assets are recorded at cost, in accordance with the procedures indicated for
tangible fixed assets.
The intangible assets with definite useful lives are recognised net of the relative accumulated
amortisation and any permanent impairment in value, determined in the same manner as that for
tangible assets.
Useful life is reviewed annually and any changes required are applied prospectively.
The gains and losses deriving from the disposal of intangible assets are determined as the difference
between the value of disposal and the carrying value of the asset and are recorded in the income
statement at the moment of the disposal.
LEASING
A leasing contract assigns to an entity the right to use an asset for a set period of time in exchange
for consideration. For the lessee, at accounting level there is no distinction between finance and
operating leases, with both applying a common accounting model to record leases. According to
this model, the company recognises to its balance sheet an asset, representing the relative right-of-
use, and a liability, representing the obligation to make contractually agreed payments, for all leases
with a duration of greater than twelve months whose value is not considered insignificant, while in
the income statement recording depreciation of the asset recognised and separately the interest on
the payable recorded. Rent reductions associated with Covid-19 are accounted for, without having
to assess through contract analysis whether the definition of lease modification in IFRS 16 is met,
directly in the income statement at the effective date of the reduction.
ASSOCIATED COMPANIES MEASURED UNDER THE EQUITY METHOD
Associated companies are companies in which the Group exercises a significant influence on the
financial and operating policies, although not having control. Significant influence is presumed
when between 20% and 50% of voting rights is held in another entity.
Investments in associated companies are measured under the equity method and initially recorded
at cost. The investments include the goodwill identified on acquisition, less any cumulative loss in
value. In the presence of any objective evidence of impairment, the recoverability of the book value
is verified by comparing the book value with the relative recoverable value, noting any difference
in the income statement. The consolidated financial statements include the share of profits and
losses of the investees measured under the equity method, net of any adjustments necessary to align
accounting principles and eliminate intercompany margins not realised, on the date in which
significant influence commences or the joint control until the date such influence or control ceases.
The adjustments necessary for the elimination of intercompany margins not realised are recorded
in the account “share of profits/loss of investments under equity”. When the share of the loss of
an investment measured under the equity method exceeds the book value of the investee, the
investment is written-down and the share of the further losses are not recorded except in the cases

TAMBURI INVESTMENT PARTNERS GROUP
Page 33
where there is a legal or implied contractual obligation or where payments were made on behalf of
the investee.
If the significant influence is taken on in subsequent phases, the cost of the investment is measured
as the sum of the fair value of the interests previously held and the fair value of the amounts
transferred on the date on which the investment qualifies as an associate. The effect of the
revaluation of the book value of the shares previously held is recognized similarly to what was
established in the event that the investment had been disposed of. Therefore, once the significant
influence has been ascertained, the higher cumulative fair value recognized in the OCI reserve is
reclassified under retained earnings in shareholders' equity.
INVESTMENTS MEASURED AT FVOCI
For the investments in equity, comprising generally investments with shareholdings below 20%
which are not held for trading, according to the option under IFRS 9, they are recognised recording
the changes in the fair value through Other Comprehensive Income (FVOCI) and therefore with
counter-entry to an equity reserve. The FVOCI accounting of the investments in equity provides
for, on sale, the reversal from the fair value reserve matured directly to other equity reserves. The
dividends received from the investments are therefore recognised through profit or loss.
The fair value is identified in the case of listed investments with the stock exchange price at the
balance sheet date and in the case of investments in non-listed companies utilising valuation
techniques. These valuation techniques include the comparison with the values taken from similar
recent operations and other valuation techniques which are substantially based on the analysis of
the capacity of the investee to produce future cash flows, discounted to reflect the time value of
money and the specific risks of the activities undertaken.
The investments in equity instruments which do not have a listed price on a regulated market and
whose fair value cannot be reasonably valued, are measured at cost, reduced by any loss in value.
The choice between the above-mentioned methods is not optional, as these must be applied in
hierarchal order: absolute priority is given to official prices available on active markets (effective
market quotes – level 1) or for assets and liabilities measured based on valuation techniques which
take into account observable market parameters (comparable approaches – level 2) and the lowest
priority to assets and liability whose fair value is calculated based on valuation techniques which
take as reference non-observable parameters on the market and therefore more discretional (market
model – level 3).
FINANCIAL RECEIVABLES MEASURED AT AMORTISED COST
These concern financial assets acquired by the company with the intention of maintaining them
until maturity in order to receive the relative interest, and any sales are incidental events. These
financial assets are valued at amortised cost.
FINANCIAL ASSETS MEASURED AT FVTPL
The financial assets, generally convertible loans, which generate cash flows which provide for the
allocation of shares and/or include implied derivatives relating to the conversion clauses, are
measured at fair value with the relative changes recognised to the income statement.
DERIVATIVE INSTRUMENTS
The derivative instruments not embedded in other financial instruments are measured at fair value

TAMBURI INVESTMENT PARTNERS GROUP
Page 34
through profit or loss.
CURRENT FINANCIAL ASSETS MEASURED AT FVOCI
The current financial assets measured at FVOCI are non-derivative financial assets comprising
investments in bond securities which constitute temporary liquidity investments realised in
accordance with the business model which provides for the receipt of the relative cash flows and
the sale of the bonds on an opportunistic basis. The cash flows from these financial instruments
comprise solely principal and interest.
They are measured at FVOCI, recognising to an equity reserve the fair value changes in the
securities until the date of sale and recording in the income statement interest income and any
impairments. At the time of sale, the gains/losses are recognised through profit or loss with reversal
of the fair value changes through profit or loss previously recognised in the equity reserve.
The purchases and sales of securities are recorded and cancelled at the settlement date.
TRADE RECEIVABLES
Receivables are recorded at fair value and subsequently measured at amortised cost. They are
adjustments for sums considered uncollectible.
CASH AND CASH EQUIVALENTS
Cash and cash equivalents include those values which are available on demand at short notice
(within three months), certain in nature and with no payment expenses. Financial operations are
recorded at the settlement date.
For the purposes of the Statement of Cash Flows, available liquidity is represented by cash and
cash equivalents less bank overdrafts at the balance sheet date.
TRADE AND FINANCIAL PAYABLES
Trade payables are initially recorded at fair value and subsequently measured at amortised cost.
The financial liabilities are recorded at amortised cost using the effective interest rate method.
EMPLOYEES BENEFITS
The benefits guaranteed to employees paid on the termination of employment or thereafter through
defined benefit plans are recognised in the period the right matures. The liability for defined benefit
plans, net of any plan assets, is calculated on the basis of actuarial assumptions and is recorded by
the accrual method consistent with the years of employment necessary to obtain such benefits. The
liability is calculated by independent actuaries.
The Company recognises additional benefits to a number of employees through the incentive plans.
A stock option plan and a performance shares plan are currently in place.
According to IFRS 2 – Share-based payments, these plans are a component of the remuneration of
the beneficiaries and provide for application of the “equity settlement” method. Therefore, the
relative cost is represented by the fair value of the financial instruments attributed at the grant date,
and is recognised in the income statement over the period between the grant date and the maturity
date, and directly recorded under equity.
TAMBURI INVESTMENT PARTNERS GROUP
Page 35
On the exercise of the options by the beneficiaries with the transfer of treasury shares against the
liquidity received, the stock option plan reserve is reversed for the portion attributable to the
options exercised, and the treasury shares reserve is reversed based on the average cost of the shares
transferred and the residual differential is recorded as the gains/loss on treasury shares traded with
counter-entry in the share premium reserve, in accordance with the accounting policy adopted.
Similarly, at the time of the transfer of treasury shares corresponding to the performance shares
matured, the performance shares plan reserve is reversed for the portion concerning the units
exercised and therefore the shares transferred. The treasury shares reserve is reversed based on the
average cost of the shares transferred and the residual differential is recorded as the gains/loss on
treasury shares traded with counter-entry in the share premium reserve, in accordance with the
accounting policy adopted.
TREASURY SHARES
The treasury shares held by the parent company are recorded as a reduction from equity in the
negative treasury shares reserve. The original cost of the treasury shares and the income deriving
from any subsequent sale are recognised as equity movements, recording the differential as the
gains/loss on treasury shares traded with counter-entry in the share premium reserve, in accordance
with the accounting policy adopted
REVENUES
Revenues are recognised when the customer acquires control of the services provided and,
consequently, when having the capacity to direct usage and obtain benefits. In the case in which a
contract stipulates a portion of consideration dependent on the occurrence of future events, the
estimate of the variable part is included in revenues only where such is considered highly probable.
In the case of transactions concerning the simultaneous provision of a number of services, the sales
price is allocated on the basis of the price which the company would apply to customers where
such services included in the contract were sold individually. According to this type of operation,
the revenues are recognised on the basis of the specific criteria indicated below:
- the revenues for advisory/investment banking services are recognised with reference to the
stage of completion of the activities. For practical purposes, when services are performed by
an indeterminate number of acts over a specified period of time, revenue is recognised on a
straight-line basis over the specified period unless there is evidence that some other method
better represents the stage of completion.
- the success fees which mature on the exercise of a significant deed are recorded under revenues
when the significant deed is completed;
- the variable revenue components for the provision of services other than success fees are
recognised on the basis of the state of completion, to the extent that it is highly probable that
subsequent to the resolution of the uncertainty related to the variable consideration a significant
reduction of the amount of cumulative revenues recorded does not occur.
Where it is not possible to reliably determine the value of revenues, they are recognised up to the
costs incurred which may reasonably be recovered.

TAMBURI INVESTMENT PARTNERS GROUP
Page 36
GAINS AND LOSSES DERIVING FROM THE SALE OF SECURITIES
The income and charges deriving from the sale of shares classified under current financial assets
measured at FVOCI are recorded on an accruals basis at the operation valuation date, recording
changes in fair value to the income statement which were previously recognised through equity.
FINANCIAL INCOME AND CHARGES
Financial income and charges are recorded on an accruals basis on the interest matured on the net
value of the relative financial assets and liabilities and utilising the effective interest rate.
DIVIDENDS
The dividends are recorded in the year in which the right of the shareholders to receive the payment
arises. The dividends received from investments valued under the equity method were recorded as
a reduction in the value of the investments.
INCOME TAXES
Current income taxes for the period are determined based on an estimate of the taxable assessable
income and in accordance with current legislation. Deferred tax assets and liabilities are calculated
on temporary differences between the values recorded in the financial statements and the
corresponding values recognised for fiscal purposes. The recognition of deferred tax assets is made
when their recovery is probable - that is when it is expected that there will be future assessable fiscal
income sufficient to recover the asset. The recovery of the deferred tax asset is reviewed at each
balance sheet date. Deferred tax liabilities are always recorded in accordance with the provisions of
IAS 12.
(3) Presentation
The choices adopted by the Group relating to the presentation of the consolidated financial
statements are illustrated below:
- income statement and comprehensive income statement: IAS requires alternatively
classification based on the nature or destination of the items. The Group decided to present
the accounts by nature of expenses;
- statement of financial position: in accordance with IAS 1, the assets and liabilities should be
classified as current or non-current or, alternatively, according to the liquidity order. The Group
chose the classification criteria of current and non-current;
- statement of changes in consolidated shareholders’ equity, prepared in accordance with IAS 1;
- cash flow statement: in accordance with IAS 7 the cash flow statement reports cash flows
during the period classified by operating, investing and financing activities, based on the indirect
method. (3) Segment disclosure
The company undertakes investment banking and merchant banking activities. Top management
activity in the above-mentioned areas, both at marketing contact level and institutional initiatives
and direct involvement in the various deals, is highly integrated. In addition, execution activity is
also organised with the objective to render the “on-call” commitment of advisory or equity
professional staff more flexible.

TAMBURI INVESTMENT PARTNERS GROUP
Page 37
In relation to this choice it is almost impossible to provide a clear representation of the separate
financial economic impact of the different areas of activity, as the breakdown of the personnel costs
of top management and other employees on the basis of a series of estimates related to parameters
which could be subsequently superseded by the actual operational activities would result in an
extremely high distortion of the level of profitability of the segments of activity.
In the present consolidated financial statements at December 31, 2020 only details on the
performance of the “revenues from sales and services” component is provided, related to the sole
activity of advisory, excluding therefore the account “other revenues”.
Euro 2020 2019
Revenue from sales and services 4,330,409 6,783,583
Total 4,330,409 6,783,583
Revenues are highly dependent on the timing of success fee maturation. The 2020 reduction is
largely attributable to the contraction in activity imposed by the pandemic.
(4) Purchases, service and other costs
The account comprises: Euro 2020 2019
1. Services 1,823,324 1,881,746 2. Other charges 446,943 1,173,459
Total 2,270,267 3,055,205
Service costs mainly relate to general and commercial expenses, banking commissions on the sale
of listed shares and professional and legal consultancy. They include Euro 120,574 of audit fees
and Euro 86,897 of emoluments of the Board of Statutory Auditors and the Supervisory Board.
Other charges principally include non-deductible VAT and other tax charges.
(5) Personnel expense The account comprises:
Euro 2020 2019
Wages and salaries 1,127,934 1,396,320
Social security charges 385,197 440,544
Directors’ fees 7,771,859 18,148,286
Charge for assignment of performance shares 3,538,660 212,706
Post-employment benefits 62,734 69,504
Total 12,886,384 20,267,359
The account “Wages and salaries” and “Directors’ fees” include fixed and variable remuneration
matured in the period. A pro-forma calculation was applied to the variable remuneration of the
executive directors, as approved by the Board of Directors, on the proposal of the Remuneration
Committee and with the opinion of Board of Statutory Auditors. The charges for the executive
directors reduced substantially as related to the pro-forma performances of the company.
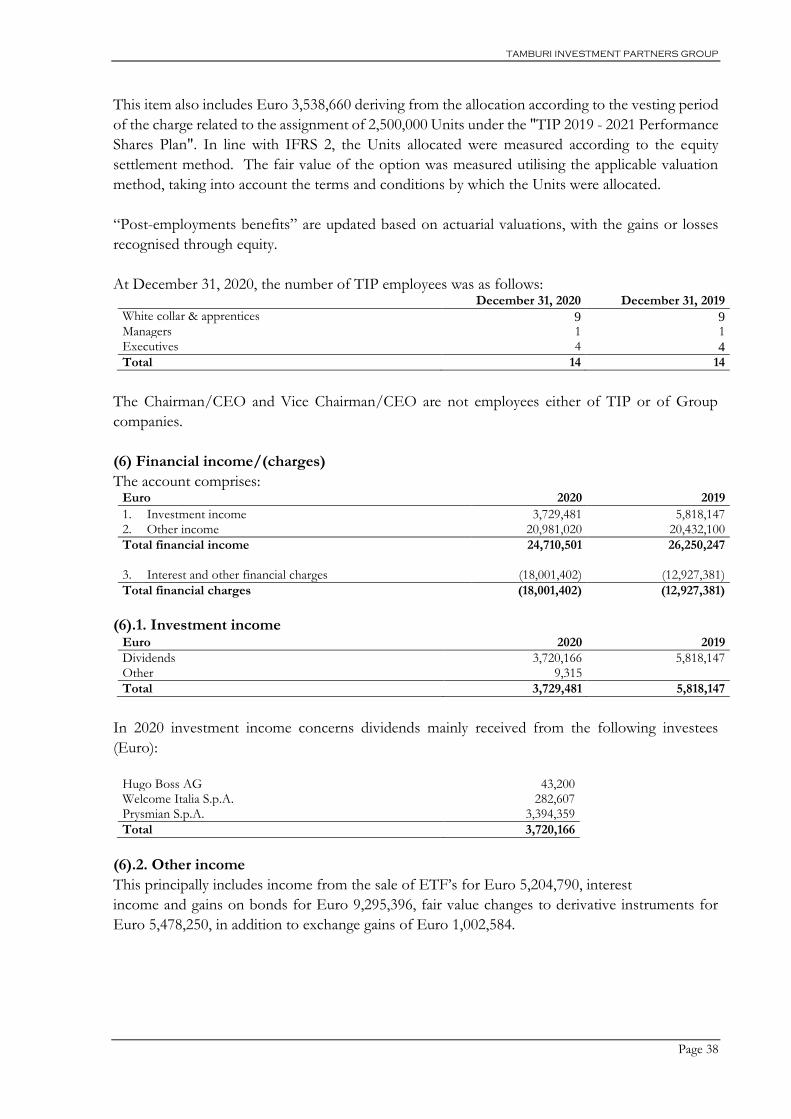
TAMBURI INVESTMENT PARTNERS GROUP
Page 38
This item also includes Euro 3,538,660 deriving from the allocation according to the vesting period
of the charge related to the assignment of 2,500,000 Units under the "TIP 2019 - 2021 Performance
Shares Plan". In line with IFRS 2, the Units allocated were measured according to the equity
settlement method. The fair value of the option was measured utilising the applicable valuation
method, taking into account the terms and conditions by which the Units were allocated.
“Post-employments benefits” are updated based on actuarial valuations, with the gains or losses
recognised through equity.
At December 31, 2020, the number of TIP employees was as follows: December 31, 2020 December 31, 2019
White collar & apprentices 9 9 Managers 1 1 Executives 4 4 Total 14 14
The Chairman/CEO and Vice Chairman/CEO are not employees either of TIP or of Group
companies.
(6) Financial income/(charges)
The account comprises: Euro 2020 2019
1. Investment income 3,729,481 5,818,147 2. Other income 20,981,020 20,432,100
Total financial income 24,710,501 26,250,247 3. Interest and other financial charges (18,001,402) (12,927,381)
Total financial charges (18,001,402) (12,927,381)
(6).1. Investment income
Euro 2020 2019
Dividends 3,720,166 5,818,147 Other 9,315
Total 3,729,481 5,818,147
In 2020 investment income concerns dividends mainly received from the following investees
(Euro):
Hugo Boss AG 43,200 Welcome Italia S.p.A. 282,607 Prysmian S.p.A. 3,394,359
Total 3,720,166
(6).2. Other income
This principally includes income from the sale of ETF’s for Euro 5,204,790, interest
income and gains on bonds for Euro 9,295,396, fair value changes to derivative instruments for
Euro 5,478,250, in addition to exchange gains of Euro 1,002,584.
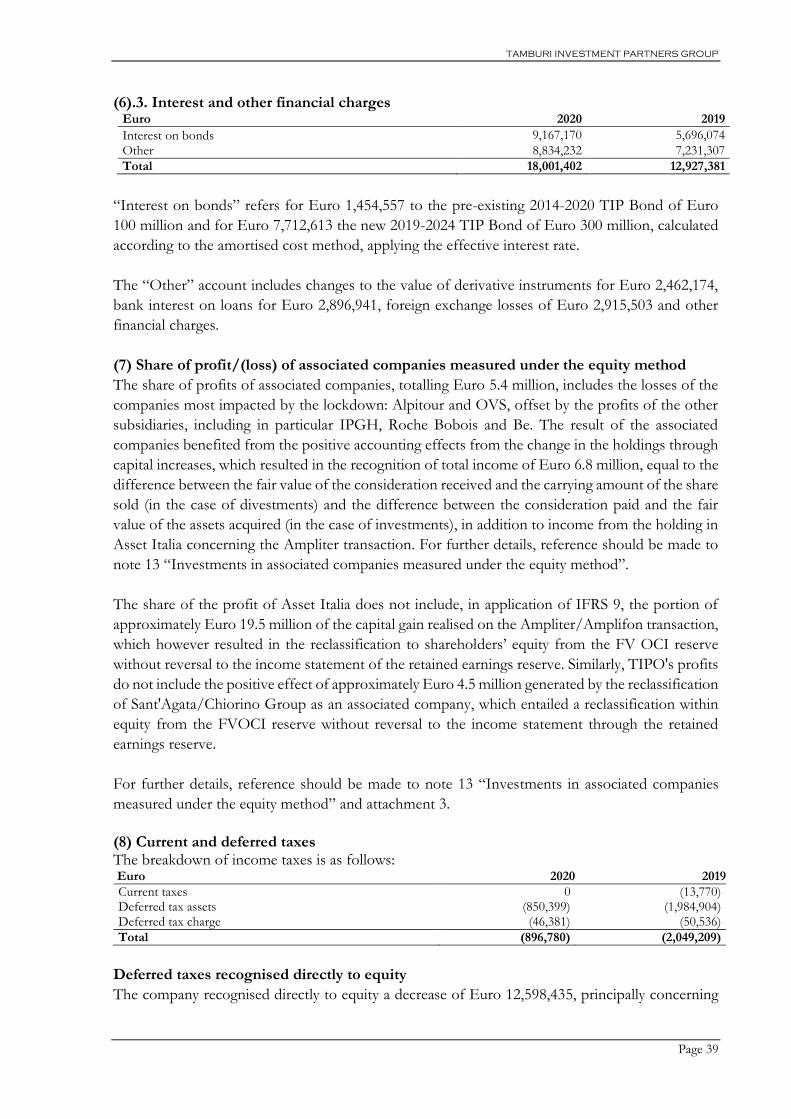
TAMBURI INVESTMENT PARTNERS GROUP
Page 39
(6).3. Interest and other financial charges Euro 2020 2019
Interest on bonds 9,167,170 5,696,074
Other 8,834,232 7,231,307
Total 18,001,402 12,927,381
“Interest on bonds” refers for Euro 1,454,557 to the pre-existing 2014-2020 TIP Bond of Euro
100 million and for Euro 7,712,613 the new 2019-2024 TIP Bond of Euro 300 million, calculated
according to the amortised cost method, applying the effective interest rate.
The “Other” account includes changes to the value of derivative instruments for Euro 2,462,174,
bank interest on loans for Euro 2,896,941, foreign exchange losses of Euro 2,915,503 and other
financial charges.
(7) Share of profit/(loss) of associated companies measured under the equity method
The share of profits of associated companies, totalling Euro 5.4 million, includes the losses of the
companies most impacted by the lockdown: Alpitour and OVS, offset by the profits of the other
subsidiaries, including in particular IPGH, Roche Bobois and Be. The result of the associated
companies benefited from the positive accounting effects from the change in the holdings through
capital increases, which resulted in the recognition of total income of Euro 6.8 million, equal to the
difference between the fair value of the consideration received and the carrying amount of the share
sold (in the case of divestments) and the difference between the consideration paid and the fair
value of the assets acquired (in the case of investments), in addition to income from the holding in
Asset Italia concerning the Ampliter transaction. For further details, reference should be made to
note 13 “Investments in associated companies measured under the equity method”.
The share of the profit of Asset Italia does not include, in application of IFRS 9, the portion of
approximately Euro 19.5 million of the capital gain realised on the Ampliter/Amplifon transaction,
which however resulted in the reclassification to shareholders’ equity from the FV OCI reserve
without reversal to the income statement of the retained earnings reserve. Similarly, TIPO's profits
do not include the positive effect of approximately Euro 4.5 million generated by the reclassification
of Sant'Agata/Chiorino Group as an associated company, which entailed a reclassification within
equity from the FVOCI reserve without reversal to the income statement through the retained
earnings reserve.
For further details, reference should be made to note 13 “Investments in associated companies
measured under the equity method” and attachment 3.
(8) Current and deferred taxes The breakdown of income taxes is as follows: Euro 2020 2019
Current taxes 0 (13,770) Deferred tax assets (850,399) (1,984,904) Deferred tax charge (46,381) (50,536)
Total (896,780) (2,049,209)
Deferred taxes recognised directly to equity
The company recognised directly to equity a decrease of Euro 12,598,435, principally concerning

TAMBURI INVESTMENT PARTNERS GROUP
Page 40
investments measured at FVOCI.
(9) Property, plant and equipment The following table illustrates the changes in the account:
Euro
Other assets
NBV at December 31, 2018 96,676
Increases 67,957 Decreases 0 Decrease depreciation provision 0 Depreciation (51,017)
NBV at December 31, 2019 113,616
Increases 21,575 Decreases 0 Decrease depreciation provision 0 Depreciation (39,501)
NBV at December 31, 2020 95,690
The increase in “Other Assets” mainly refers to the purchase of EDP, furniture and fittings and mobile telephones. (10) Rights-of-use
Euro Rights-of-use
Value at January 1, 2020 2,896,989
Increases 0 Decreases 0 Decrease depreciation provision 0 Depreciation (296,198)
NBV at December 31, 2020 2,600,791
In application of IFRS 16, current lease financial liabilities of Euro 321,574 and current lease financial liabilities of Euro 2,305,767 are recognised against rights of use. (11) Goodwill and other intangible assets
“Goodwill” for Euro 9,806,574 refers to the incorporation of the subsidiary Tamburi & Associati
S.p.A. into TIP S.p.A. in 2007. In accordance with IAS 36 the value of goodwill, having an indefinite useful life, is not amortised, but subject to an impairment test, made at least annually.
The recoverable value is estimated based on the value in use, calculated using the following
assumptions:
▪ forecast of normalised perpetual cash flows of the advisory activity;
▪ terminal value based on a “perpetual” of by 1.1%;
▪ discount rate corresponding to the cost of capital (“ke unlevered”) equal to 5.76%.
with the conclusion that the value attributed is appropriate and recoverable.
The following illustrates the changes in “Other intangible assets”:

TAMBURI INVESTMENT PARTNERS GROUP
Page 41
(12) Investments measured at FVOCI
The account refers to minority investments in listed and non-listed companies. Euro December 31, 2020 December 31, 2019
Investments in listed companies 814,441,270 584,082,600 Investments in non-listed companies 65,718,270 102,823,900
Total 880,159,540 686,906,500
The changes in the investments measured at FVOCI are shown in Attachment 2.
The TIP Group holds at December 31, 2020 investments (Digital Magics, Eataly, Buzzoole) not
classified as associated companies, although in the presence of a holding above 20% and some
indicators which would be associated with significant influence, as unable to provide periodic
financial information such as to permit the TIP Group recognition in accordance with the equity
method. The unavailability of such information represents a limitation in the exercise of significant
influence and consequently it was considered appropriate to qualify these investments as measured
at FVOCI.
The equity investment in Sant'Agata (parent company of the Chiorino Group) was reclassified as
an investment in an associate at December 31, 2020, as the investee had made available interim
financial information enabling the TIP Group to carry out the accounting processing required by
the equity method, and as the objective limitation on the exercise of significant influence no longer
applies.
In line with ESMA’s recommendations, the outbreak of the pandemic and the effects of the
consequent lockdowns and restrictions were taken into consideration as indicators of impairment.
The valuations of the non-listed companies were calculated considering the development of
alternative scenarios, as suggested by the ESMA.
The composition of the valuation methods of the investments measured at FVOCI relating to
investments in listed and non-listed companies is illustrated in the table below:
Euro
Industrial patents and intellectual property rights
Concessions, licenses and trademarks
Other Total
NBV at December 31, 2018 70 55 0 125
Increases 17,310 0 19,188 36,498 Decreases 0 0 0 0 Amortisation & Depreciation (5,480) (39) (3,838) (9,717)
NBV at December 31, 2019 11,540 16 15,350 26,906
Increases 0 0 0 0 Decreases 0 0 0 0 Amortisation & Depreciation (5,770) (16) (3,837) (9,623)
NBV at December 31, 2020 5,770 0 11,513 17,283

TAMBURI INVESTMENT PARTNERS GROUP
Page 42
Method
Listed companies
(% of total)
Non-listed companies
(% of total)
Listed prices on active markets (level 1) 100% 0.00%
Valuation models based on market inputs (level 2) 0.0% 33.70%
Other valuation techniques (level 3) 0.0% 66.00%
Purchase cost 0.0% 0.30%
Total 100.0% 100.00%
(13) Associated companies measured under the equity method
In July 2020, TIP invested, for approximately Euro 11.5 million, in the capital increase of ITH
S.p.A., the parent of SESA S.p.A., boosting its holding in ITH from 14.95% to 20.64%, which
therefore became an associated company. The reclassification of the investment to associated
companies resulted in the recording of the increase in the fair value recognised on the portion of
the investment held until the acquisition date in a similar manner to that which would be applied
for the holding’s divestment. Therefore, having ascertained significant influence, the cumulative
fair value increase of approximately Euro 31.5 million, recognised to the OCI reserve, was
reclassified as retained earnings under equity as per IFRS 9; the investment previously classified to
“Investments valued at FVOIC” was reversed and was recognised to “associated companies
measured under the equity method” for Euro 59,774,145.
The main purchases in the period consisted of approximately Euro 6.6 million relating to Be, Euro
2.2 million relating to OVS and the subscription of a capital increase by Clubitaly of approximately
Euro 1.6 million. Repayments of approximately Euro 45.8 million refer to repayments, via
dividends, mainly by Asset Italia and TIPO.
The other investments in associated companies therefore concern:
- for Euro 97,849,060 the investment in Gruppo IPG Holding S.p.A. (company which holds the
majority shareholding in Interpump Group S.p.A., to be considered a subsidiary);
- for Euro 85,239,484 the associated company OVS S.p.A.;
- for Euro 74,738,527 the company Roche Bobois S.A., held 38.34% through TXR;
- for Euro 66,513,888 the company Asset Italia S.p.A., investment holding which gives
shareholders the opportunity to choose for each proposal their individual investments. The
equity and results relating to Asset Italia 1 S.r.l., vehicle company for the investment in Alpitour,
refer for 99% to the tracking shares issued in favour of the shareholders which subscribed to
Euro December 31, 2020 December 31, 2019
Asset Italia S.p.A. 66,513,888 114,193,209 Asset Italia 2 S.r.l. 66,264 0 BE Think, Solve, Execute S.p.A. 24,981,029 17,772,901 Clubitaly S.p.A. 50,047,594 58,996,524 Elica S.p.A. 39,954,856 41,434,379 Gruppo IPG Holding S.p.A. 97,849,060 82,295,871
ITH S.p.A. 59,727,137 0 OVS S.p.A. 85,239,484 94,118,727 Roche Bobois S.A. 74,738,527 72,092,580 TIP -Pre IPO S.p.A. 26,374,834 29,768,702 Other associated companies 663,432 779,793
Total 526,156,105 511,452,686

TAMBURI INVESTMENT PARTNERS GROUP
Page 43
the initiative and for 1% to Asset Italia, or rather to all the ordinary shares. TIP’s share of the
shares tracking the investment in Alpitour is equal to 35.81%. The investment in Alpitour is
measured in Asset Italia using the equity method. In September, following the conclusion of
the shareholder agreement between Asset Italia 2 S.r.l. and Amplifin S.r.l., the parent of
Amplifon S.p.A. through Ampliter S.r.l., a transaction was completed involving the allocation
of approximately 6,100,000 Amplifon shares to Asset Italia S.p.A. shareholders (of which
1,346,661 to TIP) who invested in Ampliter. The value of the shares allocated to TIP was
recognised at approximately Euro 38.6 million. At December 31, 2020 Asset Italia thus directly
holds 59,676 Amplifon shares, whereas TIP directly holds 7,384,697 equal to 3.26% of the
share capital. Asset Italia 2 closed its final liquidation accounts in December and will be wound
up with the final liquidation distribution in March 2021;
- for Euro 59,727,137 the associated company ITH S.p.A., reclassified from the account
“Investments measured at FVOCI” following the acquisition of an associate holding in the
company;
for Euro 50,047,594 the company Clubitaly S.p.A., with a 19.74% stake in Eataly S.r.l. TIP
holds 30.20% in the share capital of the company. The investment of Clubitaly in Eataly is
measured at fair value in that the absence of the necessary financial information for the
application of the equity method determines the current limited exercise of significant influence;
- for Euro 39,954,856 the associated company Elica S.p.A.;
- for Euro 26,374,834, the investment TIP – Pre IPO S.p.A.. Within TIP – Pre IPO, the
investment in Betaclub S.r.l. is consolidated, while the investment in Beta Utensili S.p.A. is
measured using the equity method. In TIPO’s financial statements, the equity investment in
Sant'Agata (parent company of the Chiorino Group) was reclassified as an investment in an
associate at December 31, 2020, as the investee had made available interim financial
information enabling the TIP Group to carry out the accounting processing required by the
equity method, and as the objective limitation on the exercise of significant influence thus no
longer applies. As significant influence was found to exist, the greater accumulated fair value of
approximately Euro 4.5 million for TIP, taken to the OCI reserve, was reclassified to retained
earnings in equity in accordance with IFRS 9. In 2020, as a result of the shareholders decision
not to undertake new investments, TIPO distributed almost all of its available cash and
Fagerhult shares to the shareholders;
- for Euro 24,981,029 the associated company BE S.p.A.;
- for Euro 663,432 the investments in the companies Palazzari & Turries Limited, with registered
office in Hong Kong and in Gatti & Co Gmbh, with registered office in Frankfurt;
- for Euro 66,264 the company Asset Italia 2 S.r.l. in liquidation.
In line with the ESMA recommendations, the outbreak of the pandemic and the consequent
lockdowns and restrictions were taken into consideration also as indicators of the potential
impairment of the goodwill incorporated into the valuations through the equity method of the
associated companies and the investees. Also in this case, analyses were undertaken considering
the development of alternative scenarios, as suggested by the relevant ESMA recommendations.
The result of the impairment tests carried out did not identify write-downs as the recoverable
amount was higher than the carrying amount. In addition, the fair values incorporated in the
valuations of associates according to the equity method were adjusted.

TAMBURI INVESTMENT PARTNERS GROUP
Page 44
For the changes in the investments in associated companies reference should be made to
attachment 3.
(14) Financial receivables measured at amortised cost Euro December 31, 2020 December 31, 2019
Financial receivables measured at amortised cost 3,611,418 7,503,330
Total 3,611,418 7,503,330
Financial receivables measured at amortised cost principally concern the loans issued to Tefindue
S.p.A., which holds indirectly a shareholding in Octo Telematics S.p.A., international leader in the
development and management of telecommunication systems and services for the automotive
sector, mainly for the insurance market. In 2020 Euro 4,221,603 of interest and principal were
collected from Tefindue S.p.A.
(15) Financial assets measured at FVTPL Euro December 31, 2020 December 31, 2019
Financial assets measured at FVTPL 2,883,243 3,217,817
Total 2,883,243 3,217,817
Financial assets measured at FVTPL as at December 31, 2020 mainly refer to the convertible bond
issued by Tefindue S.p.A. In 2020, Euro 778,397 in interest was collected from Tefindue S.p.A.
(16) Trade receivables Euro December 31, 2020 December 31, 2019
Trade receivables (before doubtful debt provision) 1,616,915 947,808
Doubtful debt provision (167,809) (167,809)
Total 1,449,106 779,999
Trade receivables beyond 12 months 0 0
Total beyond 12 months 0 0
Changes in trade receivables is strictly related to the different revenue mix between success fees
and service revenues.
(17) Derivative instruments
Derivative instruments comprise for Euro 2,977,186 the option to purchase ITH shares and for
Euro 2,582,740 EFT SHORT instruments.
(19) Current financial assets measured at FVOCI Euro December 31, 2020 December 31, 2019
Current financial assets measured at FVOCI 179,859,731 96,688,111
Total 179,859,731 96,688,111
These concern non-derivative financial assets comprising investments in bonds and securities in
euros and dollars for the temporary utilisation of liquidity.
(20) Cash and cash equivalents
The account represents the balance of banks deposits determined by the nominal value of the current
accounts with credit institutions.

TAMBURI INVESTMENT PARTNERS GROUP
Page 45
Euro December 31, 2020 December 31, 2019
Bank deposits 3,245,830 171,942,355
Cash in hand and similar 4,665 5,947
Total 3,250,495 171,948,302
The composition of the net financial position at December 31, 2020 compared with the end of the
previous year is illustrated in the table below.
Euro December 31, 2020 December 31, 2019
A Cash and cash equivalents 3,250,495 171,948,302
B Current financial assets measured at FVOCI 179,857,731 96,688,111
C Current financial receivables & derivative instruments 5,575,577 1,479,576
D Liquidity (A+B+C)
188,683,803 270,115,989
E Non-current financial payables (451,403,080) (351,718,955)
F Non-current financial payables for leasing (2,305,767) (2,627,341)
G Liabilities for derivatives (285,846) (3,709,973)
H Current financial liabilities for leasing (321,574) (269,648)
I Current financial liabilities (70,695,363) (211,420,916)
L Net financial position (D+E+F+G+H+I) (336,327,827) (299,630,844)
Non-current financial payables mainly refer to the TIP 2019-
2024 bond for approximately 285 million, the loan with BPM bank for approximately Euro 65
million and the Clubtre loan stipulated with BNL in July 2020 for Euro 100 million.
Current financial liabilities mainly concern the credit lines from the banks and the interest matured
on the TIP 2019-2024 bond loan and other outstanding loans.
(21) Tax receivables The breakdown is as follows:
Euro December 31, 2020 December 31, 2019
Within one year 2,295,841 966,458
Beyond one year 299,730 608,269
Current tax receivables mainly include withholding tax as well as IRES and IRAP receivables arising from tax returns. The non-current component principally concerns withholding taxes and IRAP reimbursement request. (22) Deferred tax assets and liabilities The breakdown of the account at December 31, 2020 and December 31, 2019 is detailed below:
Assets Liabilities Net
Euro 31/12/2020 31/12/2019 31/12/2020 31/12/2019 31/12/2020 31/12/2019
Other intangible assets
822
2,005 822 2,005 Investments measured at FVOCI and investments measured under the equity method (18,712,977) (6,182,550) (18,712,977) (6,182,550)
Other assets/liabilities
5,480,105
4,725,591 (40,312) (115,753) 5,439,793 4,609,838
Total 5,480,927 4,727,596 (18,753,289) (6,298,302) (13,272,362) (1,570,707)

TAMBURI INVESTMENT PARTNERS GROUP
Page 46
The changes in the tax assets and liabilities were as follows:
Euro
December 31, 2019 Recorded
through P&L Recorded
through Equity
December 31, 2020
Other intangible assets 2,005 (1,183) 822 Investments measured at FVOCI and investments measured under the equity method (6,182,550) 68,008 (12,598,435) (18,712,977) Other assets/liabilities 4,609,838 829,955 5,439,793
Total (1,570,707) 896,780 (12,598,435) (13,272,362)
(23) Share capital
The share capital of TIP S.p.A. is composed of: Shares Number
ordinary shares 184,379,301
Total 184,379,301
On June 30, 2020, the fifth exercise period of the TIP S.p.A. 2015 - 2020 Warrants concluded, with
the exercise of 12,376,567 warrants and a relative share capital increase of Euro 6,435,814.84, with
the issue of 12,376,567 new ordinary TIP S.p.A. shares at a price of Euro 5.41 each, for a
total value of Euro 66,957,227.47.
The share capital of TIP S.p.A. amounts therefore to Euro 95,877,236.52, represented
by 184,379,301 ordinary shares.
The treasury shares in portfolio at December 31, 2020 totalled 16,131,801, equal to 8.749% of the
share
capital. The shares in circulation at June 31, 2020 numbered therefore 168,247,500.
No. treasury shares at December 31, 2019
No. of shares acquired in 2020
No. of shares sold in 2020
No. treasury shares at December 31, 2019
9,756,510 6,385,291 10,000 16,131,801
Shares sold during 2020 relate to the exercise of stock options.
The following additional disclosure is provided on the equity at December 31, 2020.
(24) Reserves
Legal reserve
This amounts to Euro 17,888,284, increasing Euro 786,351 following the Shareholders’ Meeting
motion of April 29, 2020 with regard to the allocation of the 2019 net profit.
Share premium reserve
The account amounts to Euro 269,354,551 and increased Euro 60,521,413 following the exercise
of the warrants.
Fair value OCI reserve without reversal to profit or loss
The positive reserve amounts to Euro 284,125,739. This concerns the fair value changes to
investments in equity, net of the relative deferred tax effect. The income and gains realised on
holdings which in application of IFRS 9 were not reversed to profit or loss were reclassified from
the reserve to retained earnings.

TAMBURI INVESTMENT PARTNERS GROUP
Page 47
Euro Book value at
31.12.2019 Change
Transferred to retained earnings
Book value
31.12.2020
Parent company & consolidated com. 198,959,550 136,615,278 (38,936,844) 296,637,984
Investments measured using the equity method
30,705,748 (9,855,390) (22,061,946) (1,211,588)
Tax effect (3,450,445) (8,320,041) 469,829 (11,300,657)
Total 226,214,853 118,439,847 (60,528,961) 284,125,739
For a breakdown of the fair value changes of investments in equity, reference should be made to
attachment 2 and note 12.
OCI reserve with reversal to profit or loss
The reserve is negative and amounts to Euro 4,151,736 and refers to the fair value changes of the
securities acquired as temporary uses of liquidity, whose relative fair value reserve will be reversed
to the income statement on the sale of the underlying security; and to reserves with reversal of the
associated companies.
Other reserves
These are negative reserves and amount to Euro 3,095,265. These mainly concern negative changes
on reserves of investments valued using the equity method. These include the residual reserve for
stock option plans set up following the granting of options to employees and the reserve to grant
Units concerning the performance shares plan.
Merger surplus
The merger surplus amounts to Euro 5,060,152. This derives from the incorporation of Secontip
S.p.A. in TIP on January 1, 2011.
Retained earnings
Retained earnings amount to Euro 386,974,911 and increased, compared to December 31, 2020,
for Euro 76,438,365. They include the reclassification from “Fair value OCI reserve without
reversal to profit or loss" equal to Euro 60,528,961, referring to income and gains realised on
investments that, in application of IFRS 9, are not reversed to profit or loss.
IFRS business combination reserve
The reserve was negative and amounts to Euro 483,655, unchanged compared to December 31,
2015.
Treasury shares acquisition reserve
The negative reserve amounts to Euro 91,517,648. This is a non-distributable reserve.
For the changes in the year and breakdown of other equity items, reference should be made to the
specific statement.

TAMBURI INVESTMENT PARTNERS GROUP
Page 48
The following table shows reconciliation between Parent Company and Consolidated net equity
and net profit.
Euro Equity at January 1,
2020 2020
Result Other
changes
Group equity at December
31, 2020
Minority interest
shareholders’ equity
Equity at December 31,
2020
Parent Company Equity as per separate financial statements 635,937,323 32,277,899 91,903,711 760,118,933 760,118,933
Eliminations in separate financial statements (31,013,328) (34,105,022) (65,118,350) (65,118,350) Carrying value and adjustments of investments measured under the equity method 167,976,003 5,447,898 (14,726,384) 158,697,517 158,697,517 Equity and result for the year (determined in accordance with uniform accounting principles) of the companies consolidated 128,632,317 (3,472,616) 56,718,718 181,878,419 109,534,852 291,413,271
Elimination carrying value of consolidated companies (75,395,790) (75,395,790) (75,395,790)
Equity attributed to the shareholders of the parent from the consolidated financial statements 826,136,525 148,159 133,896,045 960,180,729 109,534,852 1,069,715,581
(25) Net Profit for the year Basic earnings per share The basic earnings per share in 2020 – net loss divided by the number of shares in circulation in the period taking into account treasury shares held – was Euro 0.001.
Diluted earnings per share
At December 31, 2020, the diluted earnings per share was Euro 0.001. This represents the net loss
for the period divided by the number of ordinary shares in circulation at December 31, 2020,
calculated taking into account the treasury shares held and considering any dilution effects
generated from the shares servicing the stock option and performance share plan.
(26) Post-employment benefit provisions
At December 31, 2020, the balance of the account related to the Post-Employment Benefit due to
all employees of the company at the end of employment service. The liability was updated based
on actuarial calculations.
Euro December 31, 2020 December 31, 2019
Opening balance 342,039 306,489
Provisions in the year 37,508 69,504 Financial charges/(income) 2,756 4,955 Actuarial gains/losses 10,059 15,158 transfers to pension funds and utilisations (30,053) (54,067)
Total 362,309 342,039
(27) Derivative financial instruments
They refer to call options for the benefit of third parties on shares in associated companies
exercisable in 2023. They are measured at their fair value and any changes are written to the income
statement.

TAMBURI INVESTMENT PARTNERS GROUP
Page 49
(28) Financial payables
Financial payables of Euro 451,403,080 refer to:
- for 285,625,657 the TIP 2019-2024 Bond placed in December 2019, of a nominal Euro
300,000,000. The loan, with an initial rights date of December 5, 2019 and expiry date of
December 5, 2024 was issued with a discount on the par value and offers an annual coupon at
the nominal gross fixed rate of 2.5%. The loan was recognised at amortised cost applying the
effective interest rate which takes into account the transaction costs incurred for the issue of
the bond and the bond repurchases made by the company;
- for Euro 64,836,648 a medium/long-term loan of a nominal value of Euro 65,000,000,
repayable on maturity of June 30, 2022, recognised to amortised cost applying an effective
interest rate which takes account of the settlement costs incurred to obtain the loan. The bond
provides for compliance with annual financial covenants;
- for Euro 100,000,000 the loan received from BNL on behalf of Club3 at a
fixed rate of 1.4%, maturing on July 31, 2023;
- for Euro 940,775 the long-term component of the deferred payment of the purchase price of
an investment.
In accordance with the application of international accounting standards required by Consob
recommendation No. DEM 9017965 of February 6, 2009 and the Bank of Italy/Consob/Isvap
No. 4 of March 4, 2010, we report that this account does not include any exposure related to
covenants not complied with.
(29) Current financial liabilities
Financial payables of Euro 70,695,363 refer to:
- Euro 70,178,915 of bank payables, primarily in relation to the use of current account overdraft
facilities;
- Euro 516,448 of interest accrued on the TIP 2019-2024 bond. (30) Tax payables This item may be analysed as follows:
Euro December 31, 2020 December 31, 2019
VAT 15,886 0
Withholding taxes 104,351 73,516
Total 120,237 73,516
(31) Other liabilities
The account mainly refers to emoluments for directors and employees. Euro December 31, 2020 December 31, 2019
Directors and employees 7,071,054 17,540,137 Social security institutions 156,152 204,047 Others 1,934,447 1,929,361
Total 9,161,653 19,673,545
(32) Risks and uncertainties
Management of financial risks
The Group, by nature of its activities, is exposed to various types of financial risks - in particular to

TAMBURI INVESTMENT PARTNERS GROUP
Page 50
the risk of changes in market prices of investments and, marginally, to the risk of interest rates.
The policies adopted by the Group for the management of the financial risk are illustrated below.
Interest rate risk
The Group is exposed to the interest rate risk relating to the value of the current financial assets
represented by bonds and financial receivables. As these investments are mainly temporary uses of
liquidity which may be liquidated quickly, it was not considered necessary to adopt specific hedges.
Risk of change in the value of investments
The Group, by nature of its activities, is exposed to the risk of changes in the value of the
investments.
In relation to the listed investments at the present moment there is no efficient hedging instrument
of a portfolio such as those with the characteristics of the Group.
Relating to non-listed companies, the risks related:
(a) to the valuation of these investments, in consideration of: (i) absence in these companies
of control systems similar to those required for listed companies, with the consequent
unavailability of information at least equal to, under a quantitative and qualitative profile, of
those available for this later; (ii) the difficulties to undertake independent verifications in the
companies and, therefore to assess the completeness and accuracy of the information provided;
(b) the ability to impact upon the management of these investments and drive their growth, the
pre-requisite for investment, based on the Group’s relationships with management and
shareholders and, therefore, subject to verification and the development of these relationship;
(c) the liquidity of these investments, not negotiable on regulated markets;
were not hedged through specific derivative instruments as not available. The Group attempts to
minimise the risk – although within a merchant banking activity and therefore by definition risky –
through a careful analysis of the companies and sectors on entry into the share capital, as well as
through careful monitoring of the performance of the investee companies after entry in the share
capital.
A sensitivity analysis is reported below which illustrates the effects on the balance sheet, of a
hypothetical change in the fair value of the instruments held at December 31, 2020 of +/-5%
compared to the comparative figures for 2019.
Sensitivity Analysis December 31, 2020 December 31, 2019
thousands of euros -5.00% Basic 5.00% -5.00% Basic 5.00%
Investments in listed companies 773,719 814,441 855,163 554,879 548,083 613,287
Investments in non-listed companies 62,432 65,718 69,004 97,683 102,824 107,965
Investments measured at FVOCI 836,151 880,159 924,167 652,562 686,907 721,252
Effect on net equity (44,008) 44,008 (34,345) 34,345
Credit risk
The Group’s exposure to the credit risk depends on the specific characteristics of each client as
well as the type of activities undertaken and in any case at the preparation date of the present
financial statements is not considered significant.
Before undertaking an assignment careful analysis is undertaken on the credit reliability of the client.

TAMBURI INVESTMENT PARTNERS GROUP
Page 51
Liquidity risk
The Group approach in the management of liquidity guarantees, where possible, that there are
always sufficient funds to meet current obligations.
Management of capital
The capital management policies of the Board of Directors provides for maintaining high levels of
own capital in order to maintain a relationship of trust with investors, allowing for future
development.
The parent company acquired treasury shares on the market on the basis of available prices.
Hierarchy of Fair Value as per IFRS 13
The classification of financial instruments at fair value in accordance with IFRS 13 is determined
based on the quality of the input sources used in the valuation, according to the following hierarchy:
▪ level 1: determination of fair value based on prices listed (“unadjusted”) in active markets
for identical assets or liabilities. This category includes the instruments in which the TIP
company operates directly in active markets (for example investments in listed companies,
listed bond securities etc.);
▪ level 2: determination of fair value based on inputs other than the listed prices included in
“level 1” but which are directly or indirectly observable (for example recent or comparable
prices);
▪ level 3: determination of fair value based on valuation models whose input is not based on
observable market data (“unobservable inputs”). These refer for example to valuations of
non-listed investments based on Discounted Cash Flow valuation methods.
In accordance with the disclosures required by IFRS 13, the types of financial instruments recorded
in the financial statement at December 31, 2020 are illustrated below with indication of the
accounting policies applied and, in the case of financial instruments measured at fair value, of the
exposure to changes in fair value (income statement or equity), specifying also the hierarchical level
of fair value attributed.
The final column of the following table shows, where applicable, the fair value at the end of the
period of the financial instrument.

TAMBURI INVESTMENT PARTNERS GROUP
Page 52
Type of instrument
Accounting policies applied in accounts for financial instruments
fair value at 31.12.2020
fair value
Amortised cost
Invest. at cost
Book value at
31.12.2020
with change in fair value recorded through: Total
fair value
Fair value hierarchy
(in thousands of Euro) account result net
1 2 3 statement Value
Investments measured at FVOCI
880,159 880,159 880,159 880,159
- listed companies 814,441 814,441 814,441 814,441 814,441
- non-listed companies
65,718 65,718 22,310 43,194 214 65,718 65,718
Financial assets measured at FVOCI
179,859 179,859 179,859 179,859 179,859
Financial receivables measured at amortised cost
1 3,626 3,626 3,626
Financial assets measured at FVTPL (inc. derivatives)
8,443 8,443 8,443 8,443 8,443
Cash and cash equivalents
1 3,250 3,250 3,250
Non-current financial payables (inc. leasing)
2 453,709 453,709 449,598
Trade payables 1 528 528 528
Current financial liabilities (inc. leasing)
2 71,017 71,017 71,017
Financial liabilities measured at FVTPL (inc. derivatives)
286 286 286 286 286
Other liabilities 1 9,162 9,162 9,162
Note 1. For these accounts the fair value was not calculated as their carrying value approximates this value. 2. The account includes the listed bond, for which a fair value was determined at December 31, 2020.
(30) Shares held by members of the Boards and Senior Management of the Group
The following tables report the financial instruments of the parent company TIP directly and
indirectly held at the end of the period, also through trust companies, communicated to the
company by the members of the Board of Directors and the Board of Statutory Auditors. The table
also illustrates the financial instruments acquired, sold and held by the above parties in 2019.
Members of the Board of Directors
Name Office
No. of shares held at
December 31, 2019
No. of shares
acquired in 2020
No. of shares allocated from
exercise of TIP 2020 warrant
No. of shares sold
in 2020
No. of shares held at
December 31, 2020
Giovanni Tamburi(1) Chair. & CEO 13,019,801 455,530 13,475,331
Alessandra Gritti Vice Chair. & CEO
2,232,293 2,232,293
Cesare d’Amico(2) Vice-Chairman 18,680,000 1,230,000 19,910,000
Claudio Berretti Dir. & Gen. Manager
2,230,000 11,000 110,000 2,351,000
Alberto Capponi Director 0 0
Giuseppe Ferrero(3) Director 3,179,635 3,179,635
Manuela Mezzetti Director 0 0
Daniela Palestra Director 0 0
Paul Simon Schapira Director 0 10,000 10,000

TAMBURI INVESTMENT PARTNERS GROUP
Page 53
Name Office
No of warrants
held at December
31, 2019
No. of warrants
sold in 2020
No. of warrants
acquired in 2020
No. of warrants
exercised in 2020
No. of warrants
held at December
31, 2020
Giovanni Tamburi(1) Chair. & CEO 455,530 455,530 0
Alessandra Gritti Vice Chair. & CEO
158,485 158,485 0
Cesare d’Amico(2) Vice-Chairman 2,230,000 2,000,000 1,000,000 1,230,000 0
Claudio Berretti Dir. & Gen. Manager
0 110,000 110,000 0
Alberto Capponi Director 0 0
Giuseppe Ferrero(3) Director 0 0
Manuela Mezzetti Director 0 0
Daniela Palestra Director 0 0
Paul Simon Schapira Director 0 0
(1)Giovanni Tamburi holds his investment in the share capital of TIP in part directly in his own name and in part indirectly through Lippiuno S.r.l., a company in which he holds 87.26% of the share capital.
(2)Cesare d’Amico holds his investment in the share capital of TIP through d'Amico Società di Navigazione S.p.A. (a company in which he holds directly and indirectly 50% of the share capital), through the company Fi.Pa. Finanziaria di Partecipazione S.p.A. (a company which directly holds 54% of the share capital) and through family members. (3) Giuseppe Ferrero holds his investment in the share capital of TIP directly and through family members.
The members of the Board of Statutory Auditors do not hold shares or warrants of the company. (34) Remuneration of the Corporate Boards
The table below reports the monetary remuneration, expressed in Euro, to the members of the
boards in 2020.
TIP office Fees
31/12/2020
Directors 7,771,859
Statutory Auditors 70,000
The remuneration of the Supervisory Board is Euro 4,209.
TIP also signed two insurance policies with D&O and q professional TPL in favour of the Directors
and Statutory Auditors of TIP, of the subsidiaries, as well as the investees companies in which TIP
has a Board representative and the General Managers and coverage for damage to third parties in
the exercise of their functions.
(35) Transactions with related parties
The table reports the related party transactions during the year outlined according to the amounts,
type and counterparties.

TAMBURI INVESTMENT PARTNERS GROUP
Page 54
The services offered for all the above listed parties were undertaken at contractual terms and
conditions in line with the market.
(36) Subsequent events With reference to the subsequent events, reference should be made to the Directors’ Report. (37) Corporate Governance
The TIP Group adopts the provisions of the new version of the Self-Governance Code published
by Borsa Italiana as its corporate governance model.
The Corporate Governance and Ownership Structure Report for the year is approved by the Board
of Directors and published annually on the website of the company www.tipspa.it, in the
“Corporate Governance” section.
For the Board of Directors The Chairman
Giovanni Tamburi
Milan, March 25, 2021
Party Type Value/Balance
at December 31,
2020
Value/Balance at
December 31, 2019
Asset Italia S.p.A. Revenues 1,004,355 1,003,121
Asset Italia S.p.A. Trade receivables 253,075 253,075
Asset Italia 1 S.r.l. Revenues 4,100 3,075
Asset Italia 1 S.r.l. Trade receivables 3,075 3,075
Asset Italia 2 S.r.l. Revenues 4,100 3,075
Asset Italia 2 S.r.l. Trade receivables . 3,075
Betaclub S.r.l. Revenues 29,140 28,087
Betaclub S.r.l. Trade receivables 28,115 28,087
BE S.p.A. Revenues 60,000 60,000
BE S.p.A. Trade receivables 15,000 30,000
Clubitaly S.p.A. Revenues 34,180 33,089
Clubitaly S.p.A. Trade receivables 33,155 33,089
Clubitaly S.p.A. Financial receivables . 540,862
Clubtre S.p.A. Revenues . 37,500
Clubtre S.p.A. Trade receivables . 37,500
Gruppo IPG Holding S.p.A. Revenues 30,093 30,016
Gruppo IPG Holding S.p.A. Trade receivables 30,093 30,016
TIP-pre IPO S.p.A. Revenues 504,149 1,411,622
TIP-pre IPO S.p.A. Trade receivables 128,124 128,127
Services provided to companies related to the Board of Directors Revenues 11,000 752,795
Services provided to companies related to the Board of Directors Trade receivables 14,000 13,000
Services received by companies related to the Board of Directors Costs (services received) 3,554,172 8,293,310
Services received by companies related to the Board of Directors Trade payables 2,971,504 7,715,361
Services provided to the Board of Directors
Revenues (services
rendered)
2,926 2,943
Services provided to the Board of Directors Trade receivables 2,926 2,943

TAMBURI INVESTMENT PARTNERS GROUP
Page 55
ATTACHMENTS

TAMBURI INVESTMENT PARTNERS GROUP
Page 56
Declaration of the Executive Officer for Financial Reporting as per Article 81-ter of Consob
Regulation No. 11971 of May 14, 1999 and subsequent amendments and supplements.
1. The undersigned Alessandra Gritti, as Chief Executive Officer, and Claudio Berretti, as
Executive Officer for financial reporting of Tamburi Investment Partners S.p.A., affirm, and
also in consideration of Article 154-bis, paragraphs 3 and 4, of Legislative Decree No. 58 of
February 24, 1998:
▪ the adequacy considering the company`s characteristics and
▪ the effective application during the period of the consolidated financial statements
of the administrative and accounting procedures for the preparation of the consolidated
financial statements for the year ended December 31, 2020.
No significant aspect emerged concerning the above.
2. We also declare that:
a) the consolidated financial statements at December 31, 2020 correspond to the underlying
accounting documents and records;
b) the consolidated financial statements for the year ended December 31, 2020 were
prepared in accordance with International Financial Reporting Standards (IFRS) and the
relative interpretations published by the International Accounting Standards Board
(IASB) and adopted by the European Commission with Regulation No. 1725/2003 and
subsequent modifications, in accordance with Regulation No. 1606/2002 of the European
Parliament and provide a true and correct representation of the results, balance sheet and
financial position of Tamburi Investment Partners S.p.A.
c) the Directors’ Report includes a reliable analysis of the significant events in the year and
their impact on the consolidated financial statements, together with a description of the
principal risks and uncertainties. The Directors’ Report also contains a reliable analysis of
the significant transactions with related parties.
The Chief Executive Officer The Executive Officer
Milan, March 25, 2021

TAMBURI INVESTMENT PARTNERS GROUP
Page 57
Attachment 1 – List of investments held
Company Restered office share number of total number of % share of book value
capital shares net equity shares held held net equity in accounts
Associates
Asset Italia S.p.A. (1) Milan
via Pontaccio, 10 euro 3,425,114 100,000,000 211,620,619 20,000,000 20.00 42,324,124 66,513,888
Asset Italia Due S.r.l. (5) Milan
via Pontaccio, 10 euro 100,000 100,000 300,423 22,057 22.06 66,264 66,264
Be Think, Solve, Execute S.p.A. (2) Rome
viale dell’Esperanto, 71 euro 27,109,165 134,897,272 42,999,751 37,082,225 27.49 11,820,302 24,981,029
Clubitaly S.p.A. (1) Milan
via Pontaccio, 10 euro 3,864,300 3,864,300 155,271,987 1,670,873 43.24 67,137,585 50,047,594
Elica S.p,A. (2) Fabriano Ancona
Via Ermanno Casoli, 2 euro 12,664,560 63,322,800 87,302,788 12,757,000 20.15 17,588,004 39,954,856
Gatti & Co. GmbH (2) Frankfurt am Main
Bockenheimer Landstr. 51-53 euro 35,700 35,700 545,895 10,700 29.97 163,616 311,998
Gruppo IPG Holding S.p.A. (2) * Milan
via Appiani, 12 euro 142,438 226,070 87,332,184 72,739 32.18 28,099,508 97,849,060
ITH S.p,A. (6) Empoli
Via del Pino 1 euro 319,592 346,956 35,515,720 71,604 20.64 7,329,655 59,727,137
OVS S.p.A. (4) Mestre Venezia
Via Terraglio 17 euro 227,000,000 227,000,000 714,810,960 52,935,898 23.32 116,692,335 85,239,484
Palazzari & Turries Limited (3) Hong Kong
88 Queen's Road euro 300,000 300,000 567,175 90,000 30.00 170,153 351,434
Roche Bobois S.A. (2) Paris
18 Rue De Lyon euro 49,376,080 9,874,125 133,273,445 3,440,145 34.84 46,432,666 74,738,527
TIP-Pre Ipo S.p.A. (1) Milan
via Pontaccio, 10 euro 329,999 3,299,988 91,424,970 966,424 29.29 26,774,426 26,374,834
(1) Value relating to the net equity updated at 31.12.2020.
(2) Value relating to the net equity updated at 31.12.2019.
(3) Share Capital in Hong Kong dollars. Value relating to the net equity updated at 31.12.2019. The net equity was converted at the EUR/HKD rate of 0,1051 (31.12.2019).
(4) Value relating to the net equity updated at 31.1.2020.
* The fully diluted % held is 33,72%
The balance sheet values are refer to the last balance sheet filed in according to local accounting law.
(6) Value relating to the net equity updated at 30.4.2020.
(5) Value relating to the net equity updated at 11.12.2020. Closing date of the liquidation balance sheet.

TAMBURI INVESTMENT PARTNERS GROUP
Page 58
Attachment 2 - Changes in investments measured at FVOCI
in euro No. of historic fair value write-down book value acquisition or reclass. fair value decreases fair value reversal P/L movements book value
shares cost adjustments P&L fair value subscription increase decreases fair value 31/12/2020
Non-listed companies
Azimut Benetti S.p.A. 38,990,000 (7,312,229) 31,677,771 31,677,771
Bending Spoons S.p.A. 5,023,461 5,023,461 5,023,461
Buzzoole Plc. 4,641,045 (1,933,287) 2,707,758 751,077 (318,835) 3,140,000
Heroes S..r.l. 2,506,673 10,507,718 13,014,391 (145,726) 12,868,665
ITH S.p.a. 16,799,591 20,488,101 37,287,692 11,499,939 (28,299,530) 10,986,514 (31,474,615) 0
Talent Garden S.p.A. 5,502,592 868,500 6,371,092 (69,415) 6,301,677
Welcome S.p.A. 5,850,971 5,850,971 5,850,971
Other equity instr. & other minor 990,765 (100,000) 890,765 (35,041) (35,034) 35,034 855,724
Total non-listed companies 80,305,098 22,618,803 (100,000) 102,823,901 12,251,016 (28,299,530) 10,986,514 (35,041) (569,010) (31,439,581) 0 65,718,270
Listed companies
Alkemy S.p.A. 425,000 4,993,828 (1,253,828) 3,740,000 (731,000) 3,009,000
Amplifon S.p.A. 7,384,697 22,083,486 132,731,757 154,815,243 38,630,317 57,929,525 251,375,086
Digital Magics S.p.A. 1,684,719 9,922,048 152,572 10,074,620 (3,672,688) 6,401,932
Fagerhult AB 795,367 0 2,643,670 832,280 130,599 3,606,549
Ferrari N.V. USD 4,815,234 9,974,766 14,790,000 (4,815,234) (2,296,944) (7,677,822) 0
Fiat Chrysler Automobiles N.V. 1,450,000 0 17,783,734 3,473,266 21,257,000
Hugo Boss AG 1,080,000 80,298,115 (33,577,315) 46,720,800 (17,247,600) 29,473,200
Moncler S.p.A. 2,050,000 32,102,928 50,040,572 82,143,500 20,643,500 102,787,000
Prysmian S.p.A. (TIP) 42,198,416 781,584 42,980,000 23,681,807 (65,880,221) (781,586) 0
Prysmian S.p.A. (C3) 13,577,436 196,106,739 28,000,350 224,107,089 65,880,221 104,844,528 394,831,838
Telesia S.p.A. 230,000 1,792,000 (738,600) 1,053,400 (358,800) 694,600
Other listed companies 14,419,077 (314,404) (10,446,725) 3,657,948 410 (1,802,731) (1,031,121) 180,557 1,005,065
Total listed companies 408,731,871 185,797,454 (10,446,725) 584,082,600 148,619,749 0 187,723,509 (72,498,186) (26,119,739) (7,497,265) 130,599 814,441,270
Total investments 489,036,969 208,416,257 (10,546,725) 686,906,501 160,870,766 (28,299,530) 198,710,023 (72,533,227) (26,688,749) (38,936,845) 130,599 880,159,540
Balance at 1.1.2019 increases decreases

TAMBURI INVESTMENT PARTNERS GROUP
Page 59
Attachment 3 - Changes in associated companies measured under the equity method
Balance Balance
in Euro at 31.12.2018 purchases reclassifications share of increase increase increase decrease increase increase at 31.12.2019
results as per (decrease) (decrease) (decrease) FVOCI reserve retained (decrease)
equity method FVOCI reserve FVOCI reserve other reserves without reversal to P/L earnings
without reversal to P/L with reversal to P/L realised realised
Asset Italia S.p.A. 92,872,562 6,818,921 14,283,443 218,282 114,193,209
Be Think, Solve, Execute S.p.A. 17,460,151 1,259,999 47,504 (299,944) (694,809) 17,772,901
Clubitaly S.p.A. 71,539,510 269,004 (12,811,990) 58,996,524
Clubtre S.p.A. (1) 36,570,573 1,606,392 2,933,861 (41,110,826) 0
Elica S.p.A. (2) 0 273,129 41,161,250 41,434,379
Gruppo IPG Holding S.p.A. 68,740,666 14,112,157 477,499 381,639 (1,416,090) 82,295,871
OVS S.p.A. (2) 0 74,951,010 17,761,950 1,371,873 (67,331) 101,225 94,118,727
Roche Bobois S.A. 69,562,064 4,251,874 191,272 (949,389) (963,241) 72,092,580
Tip-Pre Ipo S.p.A. 47,333,740 974,108 (8,693) (80,451) (15,672,505) 15,672,505 (18,450,001) 29,768,702
Altre collegate 735,485 44,308 779,793
Totale 404,814,751 75,224,139 58,923,200 30,708,637 4,396,621 786,776 (766,470) (62,634,966) 511,452,686
(1) the decrease refers to the reclassification from associated to subsidiary
(2) the movements of the year include the reclassification from investments measured at FVOCI
Balance Balance
in Euro at 31.12.2019 purchases reclassifications share of increase increase increase decrease increase increase at 31.12.2020
results as per (decrease) (decrease) (decrease) FVOCI reserve retained (decrease)
equity method FVOCI reserve FVOCI reserve other reserves without reversal to P/L earnings
without reversal to P/L with reversal to P/L realised realised
Asset Italia S.p.A. 114,193,209 (10,378,552) 3,834,265 (2,437,310) (19,760,022) 19,760,022 (38,697,723) 66,513,888
Asset Italia 2 S.r.l. 67,406 (1,142) 66,264
Be Think, Solve, Execute S.p.A. 17,772,901 6,600,010 1,912,917 (117,489) (460,919) (726,390) 24,981,029
Clubitaly S.p.A. 58,996,524 1,639,676 2,703,054 (24,720) (13,266,940) 50,047,594
Elica S.p.A. 41,434,378 (359,808) (1,152,553) 32,838 39,954,856
Gruppo IPG Holding S.p.A. 82,295,871 4,119,857 13,113,593 (2,694,369) 2,529,437 (1,515,330) 97,849,059
ITH S.p.A. (1) 59,774,145 1,073,214 (52,326) (495,064) (572,832) 59,727,137
OVS S.p.A. 94,118,727 2,199,341 (11,097,247) (96,673) 115,336 85,239,484
Roche Bobois S.A. 72,092,580 3,470,412 (448,043) (32,401) (344,022) 74,738,527
Tip-Pre Ipo S.p.A. 29,768,702 1,032,681 (422,715) (45,827) (2,301,924) 2,301,924 (3,958,007) 26,374,834
Altre collegate 779,793 (116,361) 663,432
Totale 511,452,686 70,280,578 6,822,911 (1,375,013) (9,855,390) (6,998,763) 1,643,400 (22,061,946) 22,061,946 (45,814,304) 526,156,105
(1) the movements of the year include the reclassification from investments measured at FVOCI to associated companies measured under the equity method

TAMBURI INVESTMENT PARTNERS GROUP
Page 60

TAMBURI INVESTMENT PARTNERS GROUP
Page 61

TAMBURI INVESTMENT PARTNERS GROUP
Page 62

TAMBURI INVESTMENT PARTNERS GROUP
Page 63

TAMBURI INVESTMENT PARTNERS GROUP
Page 64

TAMBURI INVESTMENT PARTNERS GROUP
Page 65

TAMBURI INVESTMENT PARTNERS GROUP
Page 66
Audit fees and other services provided by the audit firm pursuant to Article 149 duodecies
of Consob Issuers’ Regulation.
In accordance with Article 149 duodecies of the Consob Issuer’s Regulations the information in
relation to the fees paid to the audit firm PricewaterhouseCoopers S.p.A. and to its related network
is reported in the table below:
1) Audit services, which include:
▪ the audit of the annual accounts for the expression of a professional opinion;
▪ the audit of the interim accounts.
2) Certification services, which include assignments in which the auditor evaluates a specific
aspect, whose scope is made by another party responsible, through appropriate criteria, in
order to express a conclusion on the level of reliability in relation to this specific aspect. This
category also includes services related to accounting controls.
The amounts reported in the table, relating to the year 2020, are those contractually agreed,
including any inflation rises (not including travel, contributions and V.A.T.). In accordance with
the regulation, fees paid to any secondary auditors or their respective networks are not included.

TAMBURI INVESTMENT PARTNERS GROUP
Page 67
Type of service Service provider Recipient of service Fees (Euro)
• Separate Financial Statements
PWC S.p.A. Tamburi Investment
Partners S.p.A.
52,500
• Consolidated Financial Statements 5,000
• Limited audit procedures on the
half-year financial statements 16,000
TOTAL TIP 73,500
• Audit appointments in
subsidiaries/ass. comp. PWC S.p.A. 82,500
TOTAL 156,000
The amounts above do not include expenses and Consob contributions.

TAMBURI INVESTMENT PARTNERS S.P.A
Page 68
2020 Separate financial statements of tamburi investment partners s.p.a.

TAMBURI INVESTMENT PARTNERS S.P.A
Page 69
(1) The income statement is prepared in accordance with IFRS 9. (1) In 2020 it does not reflect the income and capital gains of over Euro 38.5 million, which did not pass through the income statement, but were transferred directly through equity to retained earnings.
Income Statement Tamburi Investment Partners S.p.A. (1)
(in Euro) 2020
of which related parties 2019
of which related parties Note
Revenue from sales and services 4,411,847 1,764,926 6,853,118 3,400,973 4
Other revenue 71,421 212,698
Total revenue 4,483,268 7,065,816 Purchases, service and other costs (1,956,678) 43,863 (2,896,344) 79,701 5
Personnel expense (12,886,384) (20,267,360) 6
Amortisation, depreciation and write-downs (344,956) (356,399)
Operating loss (10,704,750) (16,454,287)
Financial income 58,079,859 36,782,777 31,372,094 5,219,097 7
Financial charges (16,737,668) (12,409,861) 7
Profit before taxes 30,637,441 2,507,946
Current and deferred taxes 1,640,458 1,889,509 8
Profit 32,277,899 4,397,455

TAMBURI INVESTMENT PARTNERS S.P.A
Page 70
Comprehensive Income Statement
Tamburi Investment Partners S.p.A.
(in Euro) 2020 2019 Note
Profit 32,277,899 4,397,455
Other comprehensive income items
Income through P&L
Increases/decreases in the value of current financial assets measured at FVOCI 1,318,136 1,626,529
21
Unrealised profit 1,869,155 1,733,312
Tax effect (551,019) (106,784)
Income/(loss) not through P&L
Employee benefits 10,059 (15,158)
Increase/decrease investments measured at FVOCI 71,383,771 150,625,874 13
Profit 72,473,210 152,394,833
Tax effect (1,089,439) (1,768,959)
Other components
Total other comprehensive income items 72,711,966 152,237,245
Total comprehensive income 104,989,865 156,634,700

TAMBURI INVESTMENT PARTNERS S.P.A
Page 71
Statement of Financial Position
Tamburi Investment Partners S.p.A.
(in Euro)
December 31,
2020
of which
related
parties
December 31,
2019
of which
related
parties Note
Non-current assets Property, plant and equipment 95,690 113,616 9
Right-of-use 2,600,791 2,896,989 2
Goodwill 9,806,574 9,806,574 10
Other intangible assets 17,283 26,906 10
Investments in subsidiaries 68,403,280 58,399,591 11
Investments in associated companies 379,666,988 319,486,409 12
Investments measured at FVOCI 447,724,159 420,650,483 13
Financial receivables measured at amortised cost 25,551,972 22,132,957 38,237,287 30,823,957 14
Financial assets measured at FVTPL 2,429,243 3,217,817 15
Tax receivables 299,730 608,269 16
Total non-current assets 936,595,710 853,443,941
Current assets
Trade receivables 1,526,793 599,232 874,534 590,540 18
Current financial receivables measured at amortised
cost 67,690,571 67,674,920
2,278,383
2,262,732 19
Derivative instruments 5,559,926 923,063 20
Current financial assets measured at FVOCI 179,859,731 96,688,111 21
Cash and cash equivalents 869,867 171,265,565 22
Tax receivables 2,065,671 735,606 16
Other current assets 109,557 239,546
Total current assets 257,682,116 273,004,808
Total assets 1,194,277,826 1,126,448,749
Equity
Share capital 95,877,237 89,441,422 23
Reserves 417,398,376 355,321,314 24
Retained earnings 214,565,421 186,777,132 24
Profit 32,277,899 4,397,455
Total Equity 760.118.933 635,937,323
Non-current liabilities
Post-employment benefits 362,309 342,039 25
Derivative instruments 285,846 3,709,973 26
Financial payables 351,403,080 351,718,955 27
Financial liabilities for leasing 2,305,767 2,627,341 2
Deferred tax liabilities 0 0 17
Total non-current liabilities 354,357,002 358,398,308
Current liabilities
Trade payables 463,079 21,653 708,712 23,126
Current financial liabilities 70,629,251 112,274,499 28
Current financial liabilities for leasing 321,574 269,648 2
Tax liabilities 119,537 68,369 29
Other liabilities 8,268,450 18,791,890 30
Total current liabilities 79,801,891 132,113,118
Total liabilities 434,158,893 490,511,426
Total equity and liabilities 1,194,277,826 1,126,448,749

TAMBURI INVESTMENT PARTNERS S.P.A
Page 72
Statement of Changes in Equity (in Euro)
Share Share Legal Revaluation FVOCI reserve FVOCI reserve Treasury Other IFRS Merger Retained Result Equity
Capital premium reserve reserve without reversal with reversal shares reserves reserve surplus earnings for the period
reserve AFS Financial to profit and loss to profit and loss reserve business
assets combination
At January 1, 2019 separate 85,509,667 183,258,304 16,646,394 0 57,935,190 (1,624,365) (31,111,031) 5,434,978 (483,655) 5,060,152 170,289,973 (2,411,369) 488,504,238
Change in fair value of investments
measured at FVOCI 150,625,874 150,625,874
Change in fair value of current financial assets measured at FVOCI 1,626,529 1,626,529
Employee benefits (15,158) (15,158)
Total other comprehensive income items 150,625,874 1,626,529 (15,158) 152,237,245
Profit/(loss) 2019 4,397,455 4,397,455
Total comprehensive income 150,625,874 1,626,529 (15,158) 4,397,455 156,634,700
Reversal of Fv reserve due to capital gain realised (37,553,535) 37,553,535 0
Change in oher reserves (7) (7)
Dividends distribution (11,072,967) (11,072,967)
Warrant exercise 3,931,755 33,873,580 37,805,335
Allocation profit 2018 455,539 (2,866,908) 2,411,369 0
Stock Option exercise (4,219,050) (7,126,500) (11,345,550)
Allocation of Units related to performance shares 212,706 212,706
Acquisition of treasury shares (25,489,792) (25,489,792)
Sale of treasury shares (733,571) 2,057,893 (635,662) 688,660
At December 31, 2019 separate 89,441,422 216,398,313 17,101,933 0 171,007,529 2,164 (54,542,930) 777,807 (483,655) 5,060,152 186,777,133 4,397,455 635,937,323
Share Share Legal Revaluation FVOCI reserve FVOCI reserve Treasury Other IFRS Merger Retained Result Equity
Capital premium reserve reserve without reversal with reversal shares reserves reserve surplus earnings for the period
reserve AFS Financial to profit and loss to profit and loss reserve business
assets combination
At January 1, 2020 separate 89,441,422 216,398,313 17,101,933 0 171,007,529 2,164 (54,542,930) 777,807 (483,655) 5,060,152 186,777,133 4,397,455 635,937,323
Change in fair value of investments
measured at FVOCI 71,383,771 71,383,771
Change in fair value of current financial assets measured at FVOCI 1,318,136 1,318,136
Employee benefits 10,059 10,059
Total other comprehensive income items 71,383,771 1,318,136 10,059 72,711,966
Profit/(loss) 2020 32,277,899 32,277,899
Total comprehensive income 71,383,771 1,318,136 10,059 32,277,899 104,989,865
Reversal of Fv reserve due to capital gain realised (38,467,015) 38,467,015 0
Change in oher reserves 6 6
Dividends distribution (14,289,831) (14,289,831)
Warrant exercise 6,435,815 60,521,413 66,957,228
Allocation profit 2019 786,351 3,611,104 (4,397,455) 0
Allocation of Units related to performance shares 3,538,660 3,538,660
Acquisition of treasury shares (37,031,277) (37,031,277)
Sale of treasury shares (23,374) 56,559 (16,225) 16,960
At December 31, 2020 separate 95,877,237 276,896,352 17,888,284 0 203,924,285 1,320,300 (91,517,648) 4,310,307 (483,655) 5,060,152 214,565,421 32,277,899 760,118,933

TAMBURI INVESTMENT PARTNERS S.P.A
Page 73
Statement of Cash Flows Tamburi Investment Partners S.p.A.
euro thousands 2020 2019
A.- OPENING NET CASH AND CASH EQUIVALENTS 162,802 (58,343)
B.- CASH FLOW FROM OPERATING ACTIVITIES
Profit 32,278 4,397
Amortisation & Depreciation 48 61
Write-downs/(revaluation) of investments (11) 0
Write-downs/(revaluation) of current financial assets (doubtful debts) 0 0
Financial income and charges (41,111) (3,348)
Changes in “employee benefits” 30 20
Performance shares charges 3,539 214
Interest on loans and bonds 10,325 6,339
Change in deferred tax assets and liabilities (1,640) (1,876)
3,458 5,807
Decrease/(increase) in trade receivables (652) 4,057
Decrease/(increase) in other current assets 130 112
Decrease/(increase) in tax receivables (1,022) (350)
Decrease/(increase) in financial receivables and assets 8,888 18,711
Decrease/(increase) in other current asset securities (81,302) (49,727)
(Decrease)/increase in trade payables (246) 153
(Decrease)/increase in financial payables derivatives 0 313
(Decrease)/increase in tax payables 51 (474)
(Decrease)/increase in other current liabilities (10,522) 1,961
Cash flow from operating activities (81,217) (19,436)
C.- CASH FLOW FROM
INVESTMENTS IN FIXED ASSETS
Intangible and tangible assets
Investments / divestments (20) (105)
Financial assets
Dividends from subsidiary and associated companies 6,771 5,209
Investments (73,420) (161,052)
Disposals 14,105 95,821
Cash flow from investing activities (52,563) (60,127)

TAMBURI INVESTMENT PARTNERS S.P.A
Page 74
euro thousands 2020 2019
D.- CASH FLOW FROM
FINANCING ACTIVITIES
Loans
New loans 0 349,746
Repayment of loans (100,922) (34,338)
Interest paid on loans and bonds (12,995) (5,284)
Share capital
Share capital increase and capital contributions on account 66,957 37,805
Changes from purchase/sale of treasury shares (37,031) (25,490)
Payment of dividends (14,290) (11,073)
Exercise of stock options 17 0
Change in reserves 0 (10,657)
Cash flow from financing activities (98,264) 300,709
E.- NET CASH FLOW FOR THE YEAR (232,045) 221,146
F. CLOSING CASH AND CASH EQUIVALENTS (69,243) 162,803
The breakdown of the net available liquidity was as follows:
Cash and cash equivalents 870 171,266
Bank payables due within one year (70,113) (8,463)
Closing cash and cash equivalents (69,243) 162,803

TAMBURI INVESTMENT PARTNERS S.P.A
Page 75
EXPLANATORY NOTES TO THE 2020 SEPARATE FINANCIAL STATEMENTS
(1) Activities of the Company
TIP is an independent investment/merchant bank focused principally on Italian medium-sized
companies, with a particular involvement in:
1. investments: as an active shareholder in companies (listed and non-listed) capable of
achieving “excellence” in their relative fields of expertise;
2. advisory: corporate finance operations, in particular acquisitions and sales through the
division Tamburi & Associati (T&A).
It will also make investments through ITACA EQUITY HOLDING in companies that are
experiencing temporary financial difficulties and need both a strategic and organisational refocus.
(2) Accounting standards
The company was incorporated in Italy as a limited liability company and with registered office in
Italy.
The company was listed in November 2005 and on December 20, 2010 Borsa Italiana S.p.A.
assigned the STAR classification to TIP S.p.A. ordinary shares.
The present financial statements at December 31, 2020 were prepared in accordance with IFRS as
separate financial statements as presented together with the consolidated financial statements at
the same date. These financial statements were approved by the Board of Directors on March 25,
2021, who authorised their publication.
The financial statements at December 31, 2020 were prepared in accordance with the going-
concern concept and in accordance with International Financial Reporting Standards and
International Accounting Standards (hereafter “IFRS”, “IAS” or international accounting
standards) issued by the International Accounting Standards Boards (IASB) and the relative
interpretations of the International Financial Reporting Interpretations Committee (IFRIC), and
adopted by the European Commission with Regulation No. 1725/2003 and subsequent
modifications, in accordance with Regulation No. 1606/2002 of the European Parliament.
The financial statements in accordance with IAS1 are comprised of the income statement, the
comprehensive income statement, the statement of financial position, the change in shareholders’
equity, the statement of cash flows and the explanatory notes, together with the Directors’ Report.
The financial statements were prepared in units of Euro, without decimal amounts.
The accounting policies and methods utilized for the preparation of these separate financial
statements, for which reference should be made to the consolidated financial statements except for
that indicated below, have not changed from those utilized for the preparation of the consolidated
financial statements for the year ended December 31, 2019, as outlined in the paragraph “New
accounting standards”. The investments in subsidiaries and associated companies are measured
under the cost method adjusted for any loss in value.

TAMBURI INVESTMENT PARTNERS S.P.A
Page 76
The periodic test of the Investments, required by IAS 36, is made in the presence of an “Impairment
indicator” which may consider that the assets have incurred a loss in value.
Associated companies are companies in which the Group exercises a significant influence on the
financial and operating policies, although not having control. Significant influence is presumed
when between 20% and 50% of voting rights is held in another entity.
The income statement, the comprehensive income statement and the statement of cash flows for
the year 2019 and the statement of financial position at December 31, 2019 were utilised for
comparative purposes.
During the year, no special circumstances arose requiring recourse to the exceptions allowed under
IAS 1.
The preparation of the separate financial statements at December 31, 2020 requires the formulation
of valuations, estimates and assumptions which impact the application of the accounting principles
and the amounts of the assets, liabilities, costs and revenues recorded in the financial statements.
These estimates and relative assumptions are based on historical experience and other factors
considered reasonable. However it should be noted as these refer to estimates, the results obtained
will not necessarily be the same as those represented. The estimates are used to value the provisions
for risks on receivables, measurement at fair value of financial instruments, impairment tests,
employee benefits and income taxes.
New accounting standards
New accounting standards, amendments and interpretations applicable for periods
beginning January 1, 2020
▪ Amendments to IFRS 10 and IAS 28: the amendments introduced better define the accounting
treatment of gains or losses from transactions with joint ventures or associated companies
measured at equity.
▪ In March 2018, the IASB published the reviewed version of the Conceptual Framework for
Financial Reporting (“Conceptual Framework”). Simultaneously, it published a document
updating the references in IFRS to the previous Conceptual Framework.
▪ Amendments to IFRS 3 - “Business Combinations”. On October 22, 2018, the IASB published
this amendment to aid in determining whether a transaction is an acquisition or a business or
of a group of assets that does not meet the definition of a business provided in IFRS 3.
▪ Amendments to IAS 1 and IAS 8 - “Definition of Material”. On October 31, 2018, the IASB
published this amendment to clarify the definition of “material” in order to aid companies in
assessing whether information is to be included in the financial statements.
▪ Amendments to IFRS 9, IAS 39 and IFRS 7: Interest Rate Benchmark Reform. On September
26, 2019, the IASB published these amendments with the objective of providing useful financial
information to companies during the period of uncertainty arising from the phasing out of
interest rate parameters such as interbank offered rates (IBORs); they amend some specific
hedge accounting requirements to mitigate potential effects arising from the uncertainty caused
by the IBOR reform. In addition, the amendments require companies to provide additional

TAMBURI INVESTMENT PARTNERS S.P.A
Page 77
information to investors about their hedging relationships that are directly affected by these
uncertainties.
▪ On May 28, 2020, the IASB published an amendment called "Covid-19 Related Rent Concessions
(Amendment to IFRS 16)". The document establishes for lessees the option to account for the
reductions in rents connected with COVID-19 without having to assess, through the analysis
of contracts, whether the definition of lease modification of IFRS 16 has been complied with.
Therefore, lessees applying this option will be able to account for the effects of rent reductions
directly in the income statement on the effective date of the reduction.
The application of the amendments to the existing accounting standards reported above do not
have a significant impact on the separate financial statements. Some associated companies have
opted to account for rent reductions associated with COVID-19 directly in the income statement.
(3) Presentation The choices adopted relating to the presentation of the financial statements is illustrated below:
- IAS requires alternatively classification based on the nature or destination of the items. The
Company chose the classification by nature of income and expenses;
- statement of financial position: in accordance with IAS 1, the assets and liabilities should be
classified as current or non-current or, alternatively, according to the liquidity order. Company
chose the classification criteria of current and non-current;
- statement of changes in shareholders’ equity, prepared in accordance with IAS 1;
- cash flow statement: in accordance with IAS 7 the cash flow statement reports cash flows
during the period classified by operating, investing and financing activities, based on the indirect
method. (4) Segment disclosure
The company undertakes investment banking and merchant banking activities. Top management
activity in the above-mentioned areas, both at marketing contact level and institutional initiatives
and direct involvement in the various deals, is highly integrated. In addition, execution activity is
also organised with the objective to render the “on-call” commitment of advisory or equity
professional staff more flexible.
In relation to this choice it is almost impossible to provide a clear representation of the separate
financial economic impact of the different areas of activity, as the breakdown of the personnel costs
of top management and other employees on the basis of a series of estimates related to parameters
which could be subsequently superseded by the actual operational activities would result in an
extremely high distortion of the level of profitability of the segments of activity.
In the present financial statements only details on the performance of the “revenues from sales and
services” component is provided, related to the sole activity of advisory, excluding therefore the
account “other revenues”.

TAMBURI INVESTMENT PARTNERS S.P.A
Page 78
Euro 2020 2019
Revenue from sales and services 4,411,847 6,853,118
Total 4,411,847 6,853,118
Revenues are highly dependent on the timing of success fee maturation. The 2020 reduction is
largely attributable to the contraction in activity imposed by the pandemic.
(5) Purchases, service and other costs
The account comprises: Euro 2020 2019
1. Services 1,700,130 1,789,249 2. Other charges 256,548 1,107,095
Total 1,956,678 2,896,344
Service costs mainly relate to general and commercial expenses, banking commissions on the sale
of listed shares and professional and legal consultancy. They include Euro 82,354 of audit fees and
Euro 74,209 of emoluments of the Board of Statutory Auditors and the Supervisory Board.
Other charges principally include non-deductible VAT and other tax charges.
(6) Personnel expense The account comprises:
Euro 2020 2019
Wages and salaries 1,127,934 1,396,320
Social security charges 385,197 440,544
Directors’ fees 7,771,859 18,148,286
Charge for assignment of performance shares 3,538,660 212,706
Post-employment benefits 62,734 69,504
Total 12,886,384 20,267,360
The account “Wages and salaries” and “Directors’ fees” include fixed and variable remuneration
matured in the period. A pro-forma calculation was applied to the variable remuneration of the
executive directors, as approved by the Board of Directors, on the proposal of the Remuneration
Committee and with the opinion of Board of Statutory Auditors. The charges for the executive
directors reduced substantially as related to the pro-forma performances of the company.
This item also includes Euro 3,538,660 deriving from the allocation according to the vesting period
of the charge related to the assignment of 2,500,000 Units under the "TIP 2019 - 2021 Performance
Shares Plan". In line with IFRS 2, the Units allocated were measured according to the equity
settlement method. The fair value of the option was measured utilising the applicable valuation
method, taking into account the terms and conditions by which the Units were allocated.
“Post-employments benefits” are updated based on actuarial valuations, with the gains or losses
recognised through equity.
At December 31, 2020, the number of TIP employees was as follows:

TAMBURI INVESTMENT PARTNERS S.P.A
Page 79
December 31, 2020 December 31, 2019
White collar & apprentices 9 9 Managers 1 1 Executives 4 4 Total 14 14
The Chairman/CEO and Vice Chairman/CEO are not employees either of TIP or of Group
companies.
(7) Financial income/(charges) The account comprises:
Euro 2020 2019
1. Investment income 35,696,089 10,942,623
3. Other income 22,383,770 20.429.47
Total financial income 58,079,859 31,372,094 4. Interest and other financial charges (16,737,668) (12,409,861)
Total financial charges (16,737,668) (12,409,861)
(7).1. Investment income
Euro 2020 2019
Dividends 7,098,365 10,942,623 Other 28,597,724 0
Total 35,696,089 10,942,623
In 2020 investment income consisting of dividends was collected from the following investees: Euro
Tip Pre-IPO 3,958,006
Hugo Boss 43,200
Gruppo IPG Holding S.p.A. 1,515,330
ITH S.p.A. 572,832
Welcome Italia S.p.A. 282,608
BE S.p.A. 726,389
Total 7,098,365
Other income, amounting to approximately Euro 28.6 million, refers to income generated by the
transaction relating to the equity investment in Asset Italia, which resulted in the assignment to TIP
of 1,346,661 Amplifon shares in a series of transactions. The shares assigned to TIP were
recognised at approximately Euro 38.6 million, compared with Euro 10.1 million invested in shares
related to the investment in Apliter through Asset Italia 2. TIP at December 31, 2020 directly holds
7,384,697 Amplifon shares, equal to 3.26% of the share capital. (7).2. Other income
This principally includes income from the sale of ETF’s for Euro 5,204,790, interest income and
gains on bonds for Euro 10,698,146, fair value changes to derivative instruments for Euro
5,478,250, in addition to exchange gains of Euro 1,002,584.

TAMBURI INVESTMENT PARTNERS S.P.A
Page 80
(7).3. Interest and other financial charges Euro December 31, 2020 December 31, 2019
Interest on bonds 9,167,170 5,696,074
Other 7,570,498 6,713,787
Total 16,737,668 12,409,861
“Interest on bonds” refers for Euro 1,454,557 to the pre-existing 2014-2020 TIP Bond of Euro
100 million and for Euro 7,712,613 the new 2019-2024 TIP Bond of Euro 300 million, calculated
according to the amortised cost method, applying the effective interest rate.
The “Other” account includes changes to the value of derivative instruments for Euro 2,462,174,
bank interest on loans for Euro 1,621,895, foreign exchange losses of Euro 2,915,503 and other
financial charges. (8) Current and deferred taxes The breakdown of income taxes is as follows: Euro 2020 2019
Current taxes 0 (13,769) Deferred tax income/(charge) (60,790) (344,181) Deferred tax income (1,579,668) (1,531,559)
Total (1,640,458) (1,889,509)
Deferred taxes recognised directly to equity
The company recognized a net increase in deferred tax liabilities amounting to Euro 1,640,458
directly in equity in relation to the change in the value of equity investments taken to OCI. (9) Property, plant and equipment The following table illustrates the changes in the account:
Euro
Other assets
NBV at December 31, 2018 96,676
Increases 67,957 Decreases 0 Decrease depreciation provision 0 Depreciation (51,017)
NBV at December 31, 2019 113,616
Increases 21,575 Decreases 0 Decrease depreciation provision 0 Depreciation (39,501)
NBV at December 31, 2020 95,690
The increase in “Other Assets” mainly refers to the purchase of EDP, furniture and fittings and mobile telephones. (10) Rights-of-use
Euro Rights-of-use
Value at January 1, 2020 2,896,989
Increases 0 Decreases 0 Decrease depreciation provision 0 Depreciation (296,198)
NBV at December 31, 2020 2,600,791

TAMBURI INVESTMENT PARTNERS S.P.A
Page 81
In application of IFRS 16, current lease financial liabilities of Euro 321,574 and current lease financial liabilities of Euro 2,305,767 are recognised against rights of use. (11) Goodwill and other intangible assets
“Goodwill” for Euro 9,806,574 refers to the incorporation of the subsidiary Tamburi & Associati
S.p.A. into TIP S.p.A. in 2007. In accordance with IAS 36 the value of goodwill, having an indefinite useful life, is not amortised, but subject to an impairment test, made at least annually.
The recoverable value is estimated based on the value in use, calculated using the following
assumptions:
▪ forecast of normalised perpetual cash flows of the advisory activity;
▪ terminal value based on a “perpetual” of by 1.1%;
▪ discount rate corresponding to the cost of capital (“ke unlevered”) equal to 5.76%.
with the conclusion that the value attributed is appropriate and recoverable.
The following illustrates the changes in “Other intangible assets”:
(12) Investments in subsidiaries This relates to the investment in the subsidiaries Clubdue S.r.l., Clubtre S.p.A:; StarTIP S.r.l. and TXR S.r.l.
The details of the subsidiaries were as follows:
Company Registered Office Share capital
Number of shares
Number of shares held % Held
Clubdue S.r.l. Milan 10,000 10,000 10,000 100%
Clubtre S.p.A. (1) Milan 120,000 120,000 45,207 37.67%
StarTIP S.r.l. Milan 50,000 50,000 50,000 100%
TXR S.r.l. Milan 100,000 100,000 51,000 51.00%
(1) Clubtre holds 51,738 treasury shares and consequently the fully diluted holding is 66.23%.
The movements in the year were as follows:
Euro
Industrial patents and intellectual property rights
Concessions, licenses and trademarks
Other Total
NBV at December 31, 2018 70 55 0 125
Increases 17,310 0 19,188 36,498 Decreases 0 0 0 0 Amortisation (5,480) (39) (3,838) (9,717)
NBV at December 31, 2019 11,540 16 15,350 26,906
Increases 0 0 0 0 Decreases 0 0 0 0 Amortisation (5,770) (16) (3,837) (9,623)
NBV at December 31, 2020 5,770 0 11,513 17,283
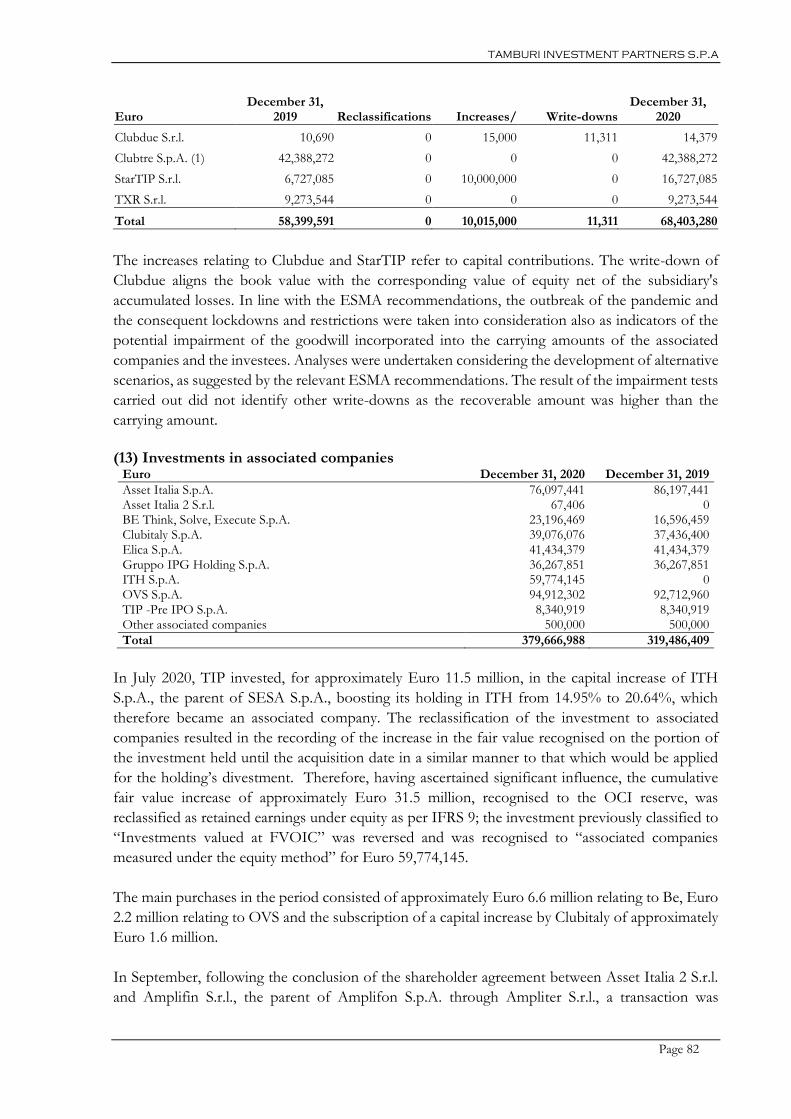
TAMBURI INVESTMENT PARTNERS S.P.A
Page 82
Euro December 31,
2019 Reclassifications Increases/ Write-downs December 31,
2020
Clubdue S.r.l. 10,690 0 15,000 11,311 14,379
Clubtre S.p.A. (1) 42,388,272 0 0 0 42,388,272
StarTIP S.r.l. 6,727,085 0 10,000,000 0 16,727,085
TXR S.r.l. 9,273,544 0 0 0 9,273,544
Total 58,399,591 0 10,015,000 11,311 68,403,280
The increases relating to Clubdue and StarTIP refer to capital contributions. The write-down of
Clubdue aligns the book value with the corresponding value of equity net of the subsidiary's
accumulated losses. In line with the ESMA recommendations, the outbreak of the pandemic and
the consequent lockdowns and restrictions were taken into consideration also as indicators of the
potential impairment of the goodwill incorporated into the carrying amounts of the associated
companies and the investees. Analyses were undertaken considering the development of alternative
scenarios, as suggested by the relevant ESMA recommendations. The result of the impairment tests
carried out did not identify other write-downs as the recoverable amount was higher than the
carrying amount.
(13) Investments in associated companies
Euro December 31, 2020 December 31, 2019
Asset Italia S.p.A. 76,097,441 86,197,441 Asset Italia 2 S.r.l. 67,406 0 BE Think, Solve, Execute S.p.A. 23,196,469 16,596,459 Clubitaly S.p.A. 39,076,076 37,436,400 Elica S.p.A. 41,434,379 41,434,379 Gruppo IPG Holding S.p.A. 36,267,851 36,267,851 ITH S.p.A. 59,774,145 0 OVS S.p.A. 94,912,302 92,712,960 TIP -Pre IPO S.p.A. 8,340,919 8,340,919 Other associated companies 500,000 500,000
Total 379,666,988 319,486,409
In July 2020, TIP invested, for approximately Euro 11.5 million, in the capital increase of ITH
S.p.A., the parent of SESA S.p.A., boosting its holding in ITH from 14.95% to 20.64%, which
therefore became an associated company. The reclassification of the investment to associated
companies resulted in the recording of the increase in the fair value recognised on the portion of
the investment held until the acquisition date in a similar manner to that which would be applied
for the holding’s divestment. Therefore, having ascertained significant influence, the cumulative
fair value increase of approximately Euro 31.5 million, recognised to the OCI reserve, was
reclassified as retained earnings under equity as per IFRS 9; the investment previously classified to
“Investments valued at FVOIC” was reversed and was recognised to “associated companies
measured under the equity method” for Euro 59,774,145.
The main purchases in the period consisted of approximately Euro 6.6 million relating to Be, Euro
2.2 million relating to OVS and the subscription of a capital increase by Clubitaly of approximately
Euro 1.6 million.
In September, following the conclusion of the shareholder agreement between Asset Italia 2 S.r.l.
and Amplifin S.r.l., the parent of Amplifon S.p.A. through Ampliter S.r.l., a transaction was

TAMBURI INVESTMENT PARTNERS S.P.A
Page 83
completed involving the allocation of approximately 6,100,000 Amplifon shares to Asset Italia
S.p.A. shareholders (of which 1,346,661 to TIP) who invested in Ampliter. The shares assigned to
TIP were recognised at approximately Euro 38.6 million, against the reduction of the investment
in Asset Italia of Euro 10.1 million corresponding to the shares related to the investment in Apliter
through Asset Italia 2.
The investments in associated companies refer to:
- for Euro 94,912,302 to the investment in OVS S.p.A.;
- for Euro 76,097,441 the company Asset Italia S.p.A., investment holding which gives
shareholders the opportunity to choose for each proposal their individual investments. The
equity and results relating to Asset Italia 1 S.r.l., vehicle company for the investment in Alpitour,
refer for 99% to the tracking shares issued in favour of the shareholders which subscribed to
the initiative and for 1% to Asset Italia, or rather to all the ordinary shares. Following the
transaction described above, Asset Italia 2 was placed in liquidation and TIP holds a direct
interest in it;
- for Euro 59,774,145 to the equity investment in ITH S.p.A., a subsidiary of Sesa S.p.A.;
- for Euro 41,434,379 to the investment in Elica S.p.A.;
- for Euro 39,076,076 the company Clubitaly S.p.A., with a 19.80% stake in Eataly Distribution
S.p.A.;
- for Euro 36,267,851 the investment in Gruppo IPG Holding S.p.A. (company which holds the
majority shareholding in Interpump Group S.p.A., to be considered a subsidiary);
- for Euro 23,196,469 the associated company BE S.p.A.;
- for Euro 8,340,919 to the equity investment in TIP - Pre IPO S.p.A. In 2020 the company
distributed the available cash and Fagerhult shares held to shareholders, retaining the equity
investments in Chiorino, Betaclub S.r.l. and Beta Utensili S.p.A. at December 31, 2020;
- for Euro 500,000 the investments in the companies Palazzari & Turries Limited, with registered
office in Hong Kong and in Gatti & Co Gmbh, with registered office in Frankfurt;
- for Euro 67,406 to the associated company Asset Italia Due S.r.l. in liquidation.
In line with the ESMA recommendations, the outbreak of the pandemic and the consequent
lockdowns and restrictions were taken into consideration also as indicators of the potential
impairment of the goodwill incorporated into the carrying amounts of the associated companies
and the investees. Analyses were undertaken considering the development of alternative scenarios,
as suggested by the relevant ESMA recommendations. The result of the impairment tests carried
out did not identify write-downs as the recoverable amount was higher than the carrying amount.
For the changes in the investments in associated companies, reference should be made to
attachment 4.

TAMBURI INVESTMENT PARTNERS S.P.A
Page 84
(13) Investments measured at FVOCI
The account refers to minority investments in listed and non-listed companies.
Euro December 31, 2020 December 31, 2019
Investments in listed companies 409,503,900 345,107,491 Investments in non-listed companies 38,220,259 75,542,992
Total 447,724,159 420,650,483
The changes in the investments measured at FVOCI are shown in Attachment 2.
In line with ESMA’s recommendations, the outbreak of the pandemic and the effects of the
consequent lockdowns and restrictions were taken into consideration as indicators of impairment.
The valuations of the non-listed companies were calculated considering the development of
alternative scenarios, as suggested by the ESMA.
The composition of the valuation methods of the non-current financial assets available for sale
relating to investments in listed and non-listed companies is illustrated in the table below:
Method
Listed companies
(% of total)
Non-listed companies
(% of total)
Listed prices on active markets (level 1) 100% 0.00%
Valuation models based on market inputs (level 2) 0.0% 0.00%
Other valuation techniques (level 3) 0.0% 99.90%
Purchase cost 0.0% 10.00%
Total 100.0% 100.00%
(14) Financial receivables measured at amortised cost Euro December 31, 2020 December 31, 2019
Financial receivables measured at amortised cost 25,551,972 38,237,287
Total 25,551,972 38,237,287
Financial receivables measured at amortised cost principally concern the loans issued to StarTIP
S.r.l. as sole shareholder for Euro 22,132,957 and Tefindue S.p.A., which holds indirectly a
shareholding in Octo Telematics S.p.A., international leader in the development and management
of telecommunication systems and services for the automotive sector, mainly for the insurance
market, for Euro 3,137,316. In 2020 Euro 4,221,603 of interest and principal were collected from
Tefindue S.p.A.
(15) Financial assets measured at FVTPL Euro December 31, 2020 December 31, 2019
Financial assets measured at FVTPL 2,429,243 3,217,817
Total 2,429,243 3,217,817
Financial assets measured at FVTPL as at December 31, 2020 refer to the convertible bond issued
by Tefindue S.p.A. In 2020 Euro 778,397 in interest was collected from Tefindue S.p.A.

TAMBURI INVESTMENT PARTNERS S.P.A
Page 85
(16) Tax receivables The breakdown is as follows:
Euro December 31, 2020 December 31, 2019
Within one year 2,065,671 735,606
Beyond one year 299,730 608,269
Current tax receivables include withholding taxes and receivables for IRES and IRAP resulting from tax returns. The non-current component principally concerns withholding taxes and IRAP reimbursement request. (17) Deferred tax assets and liabilities The breakdown of the account at December 31, 2020 and December 31, 2020 is detailed below:
Assets Liabilities Equity
Euro 31/12/2020 31/12/2019 31/12/2020 31/12/2019 31/12/2020 31/12/2019
Other intangible assets
638
1,614
638
1,614
Investments measured at FVOCI
(3,754,421)
(2,757,116)
(3,754,421)
(2,757,116)
Current financial assets
(657,803) (106,784)
(657,803) (106,784)
Other assets
122,394
122,394
(8,969)
(8,969)
113,425
113,425
Other liabilities
4,329,504
2,748,860 (31,344)
4,298,160
2,748,860
Total 4,452,536 2,872,868 (4,452,536) (2,872,868) 0 0
The changes in the tax assets and liabilities were as follows:
Euro
December 31, 2019 Recorded
through P&L Recorded
through Equity
December 31, 2020
Other intangible assets 1,614 (976) 638 Investments measured at FVOCI (2,757,116) 92,134 (1,089,439) (3,754,421) Current financial assets (106,784) (551,019) (657,803) Other assets 113,425 113,425 Other liabilities 2,748,860 1,549,300 4,298,160
Total 0 1,640,458 (1,640,458) 0
(18) Trade receivables
Euro December 31, 2020 December 31, 2019
Trade receivables (before doubtful debt provision) 1,694,602 1,042,343
Doubtful debt provision (167,809) (167,809)
Total 1,526,793 874,534
Trade receivables beyond 12 months 0 0
Total beyond 12 months 0 0
Changes in trade receivables is strictly related to the different revenue mix between success fees
and service revenues.
(19) Current financial receivables measured at amortised cost Euro December 31, 2020 December 31, 2019
Current financial receivables measured at amortised cost 67,690,571 2,278,383
Total 67,690,571 2,278,383

TAMBURI INVESTMENT PARTNERS S.P.A
Page 86
These mainly include loans granted to subsidiaries.
(20) Derivative financial instruments
These amount to Euro 5,559,926 and refer to the options which granted TIP the right to acquire
further shares in investments measured at FVOCI and an investment in short ETFs.
(21) Current financial assets measured at FVOCI Euro December 31, 2020 December 31, 2019
Current financial assets measured at FVOCI 179,859,731 96,688,111
Total 179,859,731 96,688,111
These concern non-derivative financial assets comprising investments in bonds and securities in
euros and dollars for the temporary utilisation of liquidity.
(22) Cash and cash equivalents
The account represents the balance of banks deposits determined by the nominal value of the current
accounts with credit institutions.
Euro December 31, 2020 December 31, 2019
Bank deposits 865,202 171,259,618
Cash in hand and similar 4,665 5,947
Total 869,867 171,265,565
The composition of the net financial position at December 31, 2020 compared with the end of the
previous year is illustrated in the table below.
Euro December 31, 2020 December 31, 2019
A Cash and cash equivalents 869,867 171,265,565
B Current financial assets measured at FVOCI 179,859,731 96,688,111
C Current financial receivables and derivatives 73,250,497 3,201,446
D Liquidity (A+B+C) 253,980,095 271,155,122
E Non-current financial payables (351,403,080) (351,718,955)
F Non-current financial payables for leasing (2,305,767) (2,627,341)
G Liabilities for derivatives (285,846) (3,709,973)
H Current financial liabilities for leasing (321,574) (269,648)
I Current financial liabilities (70,629,251) (112,274,499)
L Net financial position (D+E+F+G+H+I) (170.965.423) (199,445,294)
Non-current financial payables mainly refer to the TIP 2019-2024 bond and bank loans. Current
financial liabilities refer to bank payables and interest related to bonds loans matured and still not
paid. (23) Share capital
The share capital of TIP S.p.A. is composed of: shares Number
ordinary shares 184,379,301
Total 184,379,301

TAMBURI INVESTMENT PARTNERS S.P.A
Page 87
On June 30, 2020, the fifth exercise period of the TIP S.p.A. 2015 - 2020 Warrants concluded,
with the exercise of 12,376,567 warrants and a relative share capital increase of Euro 6,435,814.84,
with the
issue of 12,376,567 new ordinary TIP S.p.A. shares at a price of Euro 5.41 each, for a
total value of Euro 66,957,227.47.
The share capital of TIP S.p.A. amounts therefore to Euro 95,877,236.52, represented
184,379,301 ordinary shares
The treasury shares in portfolio at December 31, 2020 totalled 16,131,801, equal to 8.749% of the
share capital. The shares in circulation at December 31, 2020 therefore numbered 168,247,500.
No. treasury shares at December 31, 2019
No. of shares acquired in 2020
No. of shares sold in 2020
No. treasury shares at December 31, 2020
9,756,510 6,385,291 10,000 16,131,801
Analysis is provided below of the statutory and tax nature of the equity accounts.
Nature/Description Amount Poss. of
utilisation Quota
available
Utilisation in 3 previous years to cover losses
Utilisation in 3 previous years
for other reasons
Share capital 95,877,237 Legal reserve 17,888,284 B 17,888,284 Share Premium Reserve 276,896,352 A,B 276,896,352 Fair value OCI reserve without reversal to profit or loss 203,924,285 203,924,285
OCI reserve with reversal to profit or loss
1,320,300
Other reserves 4,310,307 Merger surplus 5,060,152 A,B,C 5,060,152 Retained earnings (accum. losses) 214,565,421 A,B,C 214,565,418 IFRS business combination reserve (483,655) Treasury shares acquisition reserve (91,517,648)
Total 727,841,035 718,334,491
Non-distributable quota (*) 276,896,356 A: for share capital increase, B: for coverage of losses and C: for distribution to shareholders. * Concerns the share premium reserve (Euro 276,896,352) which, in accordance with Article 2431 of the Civil Code, may not be distributed until the legal reserve has reached the limits established by Article 2430 of the Civil Code (Euro 19,175,447).
The following additional disclosure is provided on the equity at December 31, 2020.
(24) Reserves
Legal reserve
This amounts to Euro 17,888,284, increasing Euro 786,351 following the Shareholders’ Meeting
motion of April 29, 2020 with regard to the allocation of the 2019 net profit.
Share premium reserve
The account amounts to Euro 276,896,352 and increased Euro 60,521,431 following the exercise

TAMBURI INVESTMENT PARTNERS S.P.A
Page 88
of the warrants.
Fair value OCI reserve without reversal to profit or loss
The positive reserve amounts to Euro 203,924,285. This concerns the fair value changes to
investments in equity, net of the relative deferred tax effect. The income and gains realised on
holdings which in application of IFRS 9 were not reversed to profit or loss were reclassified from
the reserve to retained earnings. The reserve includes a decline in fair values of Euro 38,467,015,
which in accordance with IAS 39 would have been taken to the income statement.
For a breakdown of the fair value changes of investments in equity, reference should be made to
attachment 2 and note 12.
OCI reserve with reversal to profit or loss
The positive reserve amounts to Euro 1,320,300. These principally concern the fair value changes
of securities acquired as temporary uses of liquidity. The relative fair value was reversed to the
income statement on the sale of the underlying security.
Other reserves
These amount to Euro 4,310,307 and include the residual reserve for stock option plans set up
following the granting of options to employees and the reserve to grant Units concerning the
performance shares plan.
Merger surplus
The merger surplus amounts to Euro 5,060,152. This derives from the incorporation of Secontip
S.p.A. in TIP on January 1, 2011.
Retained earnings
Retained earnings amount to Euro 214,565,421 and increased, compared to December 31, 2019,
for Euro 27,788,288. They include the reclassification from “Fair value OCI reserve without
reversal to profit or loss" equal to Euro 38,467,015, referring to income and gains realised on
investments that, in application of IFRS 9, are not reversed to profit or loss.
IFRS business combination reserve
The reserve was negative and amounts to Euro 483,655, unchanged compared to December 31,
2015.
Treasury shares acquisition reserve
The negative reserve amounts to Euro 91,517,648. This is a non-distributable reserve.
For the changes in the year and breakdown of other equity items, reference should be made to the
specific statement.
(25) Post-employment benefit provisions
At December 31, 2020, the balance of the account related to the Post-Employment Benefit due to
all employees of the company at the end of employment service. The liability was updated based

TAMBURI INVESTMENT PARTNERS S.P.A
Page 89
on actuarial calculations.
Euro December 31, 2020 December 31, 2019
Opening balance 342,039 306,489
Provisions in the year 37,508 69,504 Financial charges/(income) 2,756 4,955 Actuarial gains/losses 10,059 15,158 transfers to pension funds and utilisations (30,053) (54,067)
Total 362,309 342,039
(26) Derivative financial instruments
They refer to call options for the benefit of third parties on shares in associated companies
exercisable in 2023. They are measured at their fair value and any changes are written to the income
statement.
(27) Financial payables
Financial payables of Euro 351,403,080 refer to:
- for 285,625,657 the TIP 2019-2024 Bond placed in December 2019, of a nominal Euro
300,000,000. The loan, with an initial rights date of December 5, 2019 and expiry date of
December 5, 2024 was issued with a discount on the par value and offers an annual coupon at
the nominal gross fixed rate of 2.5%. The loan was recognised at amortised cost applying the
effective interest rate which takes into account the transaction costs incurred for the issue of
the bond and the bond repurchases made by the company;
- for Euro 64,836,648 a medium/long-term loan of a nominal value of Euro 65,000,000,
repayable on maturity of June 30, 2022, recognised to amortised cost applying an effective
interest rate which takes account of the settlement costs incurred to obtain the loan. Against
the granting of this new loan, two existing loans with maturity in 2019 for an amount of
approximately Euro 32.9 million were settled. The bond provides for compliance with annual
financial covenants;
- for Euro 940,775 the long-term component of the deferred payment of the purchase price of
an investment.
In accordance with the application of international accounting standards required by Consob
recommendation No. DEM 9017965 of February 6, 2009 and the Bank of Italy/Consob/Isvap
No. 4 of March 4, 2010, we report that this account does not include any exposure related to
covenants not complied with.
(28) Current financial liabilities
The current financial liabilities of Euro 70,629,251 mainly concern:
- the relative interest matured on the TIP 2019-2024 bond for Euro 516,448;
- for Euro 70,112,803 bank payables on current account lines.
(29) Tax payables This item may be analysed as follows:
Euro December 31, 2020 December 31, 2019
VAT 15,886 0
Withholding taxes 103,651 68,368
Total 119,537 68,368

TAMBURI INVESTMENT PARTNERS S.P.A
Page 90
(30) Other liabilities
The account mainly refers to emoluments for directors and employees.
Euro December 31, 2020 December 31, 2019
Directors and employees 7,071,054 17,540,137 Social security institutions 156,152 204,047 Others 1,041,244 1,047,706
Total 8,268,450 18,791,890
(31) Risks and uncertainties
Management of financial risks
The Company, by nature of its activities, is exposed to various types of financial risks; in particular,
to the risk of changes in market prices of investments and, marginally, to the risk of interest rates.
The policies adopted by the company for the management of the financial risk are illustrated below.
Interest rate risk
The company is exposed to the interest rate risk relating to the value of the current financial assets
represented by bonds and financial receivables. As these investments are mainly temporary uses of
liquidity which may be liquidated quickly, it was not considered necessary to adopt specific hedges.
Risk of change in the value of investments
The company, by nature of its activities, is exposed to the risk of changes in the value of the
investments.
In relation to the listed investments at the present moment there is no efficient hedging instrument
of a portfolio such as those with the characteristics of the company.
Relating to non-listed companies, the risks related:
(a) to the valuation of these investments, in consideration of: (i) absence in these companies of
control systems similar to those required for listed companies, with the consequent
unavailability of information at least equal to, under a quantitative and qualitative profile, of
those available for this later; (ii) the difficulties to undertake independent verifications in the
companies and, therefore to assess the completeness and accuracy of the information provided;
(b) the ability to impact upon the management of these investments and drive their growth, the
pre-requisite for investment, based on the company’s relationships with management and
shareholders and, therefore, subject to verification and the development of these relationship;
(c) the liquidity of these investments, not negotiable on regulated markets;
they were not hedged through specific derivative instruments as not available. The company
attempts to minimise the risk – although within a merchant banking activity and therefore by
definition risky – through a careful analysis of the companies and sectors on entry into the share
capital, as well as through careful monitoring of the performance of the investee companies
after entry in the share capital.

TAMBURI INVESTMENT PARTNERS S.P.A
Page 91
A sensitivity analysis is reported below which illustrates the effects on the balance sheet, of a
hypothetical change in the fair value of the instruments held at December 31, 2020 of +/-5%
compared to the comparative figures for 2019.
Sensitivity Analysis December 31, 2020 December 31, 2019
thousands of euros -5.00% Basic 5.00% -5.00% Basic 5.00%
Investments in listed companies 389,029 409,504 429,979 327,852 345,107 362,362
Investments in non-listed companies 36,309 38,220 40,131 71,766 75,543 79,320
Investments measured at FVOCI 425,338 447,724 470,110 399,618 420,650 441,683
Effect on net equity (22,386) 22,386 (21,033) 21,033
Credit risk
The company’s exposure to the credit risk depends on the specific characteristics of each client as
well as the type of activities undertaken and in any case at the preparation date of the present
financial statements is not considered significant.
Before undertaking an assignment, careful analysis is undertaken on the credit reliability of the
client.
Liquidity risk
The company approach in the management of liquidity guarantees, where possible, that there are
always sufficient funds to meet current obligations.
Management of capital
Directors provide for maintaining high levels of own capital in order to maintain a relationship of
trust with investors, allowing for future development.
The company acquired treasury shares on the market in a timely manner which depends on market
prices.
Hierarchy of Fair Value as per IFRS 13
The classification of financial instruments at fair value in accordance with IFRS 13 is determined
based on the quality of the input sources used in the valuation, according to the following hierarchy:
▪ level 1: determination of fair value based on prices listed (“unadjusted”) in active markets
for identical assets or liabilities. This category includes the instruments in which the TIP
company operates directly in active markets (for example investments in listed companies,
listed bond securities etc.);
▪ level 2: determination of fair value based on inputs other than the listed prices included in
“level 1” but which are directly or indirectly observable (for example recent or comparable
prices);
▪ level 3: determination of fair value based on valuation models whose input is not based on
observable market data (“unobservable inputs”). These refer for example to valuations of
non-listed investments based on Discounted Cash Flow valuation methods.

TAMBURI INVESTMENT PARTNERS S.P.A
Page 92
In accordance with the disclosures required by IFRS 13, the types of financial instruments recorded
in the financial statement at December 31, 2020 are illustrated below with indication of the
accounting policies applied and, in the case of financial instruments measured at fair value, of the
exposure to changes in fair value (income statement or equity), specifying also the hierarchical level
of fair value attributed.
The final column of the following table shows, where applicable, the fair value at the end of the
period of the financial instrument.
Type of instrument
Accounting policies applied in accounts for financial instruments
fair value at 31.12.2020
fair value
Amortised cost
Invest. at cost
Book value at
31.12.2020
with change in fair value recorded through: Total
fair value
Fair value hierarchy
(in thousands of Euro) account result net
1 2 3 statement Result
Investments measured at FVOCI
447,724 447,724 447,724 447,724
- listed companies 409,504 409,504 409,504 409,504 409,504 - non-listed companies
38,220 38,220
0 38,170 50 38,220 38,220
Financial assets measured at FVOCI
179,860 179,860 179,860 179,860 179,860
Financial receivables measured at amortised cost
1 93,243 93,243 93,243
Financial assets measured at FVTPL (inc. derivatives)
7,989 7,989 7,989 7,989 7,989
Cash and cash equivalents
1 870 870 870
Non-current financial payables (inc. leasing)
2 353,709 353,709 349,598
Trade payables 1 463 463 463
Current financial liabilities (inc. leasing)
2 70,950 70,950 70,950
Financial liabilities measured at FVTPL (inc. derivatives)
286 286 286 286 286
Other liabilities 1 8,268 8,268 8,268
Note 1. For these accounts the fair value was not calculated as their carrying value approximates this value. 2. The account includes the listed bond, for which a fair value was determined at December 31, 2020.
(32) Shares held by members of the Boards and Senior Management of the Group
The following tables report the financial instruments of TIP directly and indirectly held at the end
of the period, also through trust companies, communicated to the company by the members of the
Board of Directors also illustrates the financial instruments acquired, sold and held by the parties
in 2020.

TAMBURI INVESTMENT PARTNERS S.P.A
Page 93
Members of the Board of Directors
Name Office
No. of shares held at
December 31, 2019
No. of shares
acquired in 2020
No. of shares allocated from
exercise of TIP 2020 warrant
No. of shares sold
in 2020
No. of shares held at
December 31, 2020
Giovanni Tamburi(1) Chair. & CEO 13,019,801 455,530 13,475,331
Alessandra Gritti Vice Chair. & CEO
2,232,293 2,232,293
Cesare d’Amico(2) Vice-Chairman 18,650,000 1,230,000 19,910,000
Claudio Berretti(3) Dir. & Gen. Manager
2,230,000 11,000 110,000 2,351,000
Alberto Capponi Director 0 0
Giuseppe Ferrero(3) Director 3,179,635 3,179,635
Manuela Mezzetti Director 0 0
Daniela Palestra Director 0 0
Paul Simon Schapira Director 0 10,000 10,000
Name Office
No of warrants
held at December
31, 2019
No. of warrants
sold in 2020
No. of warrants
acquired in 2020
No. of warrants
exercised in 2020
No. of warrants
held at December
31, 2020
Giovanni Tamburi(1) Chair. & CEO 455,530 455,530 0
Alessandra Gritti Vice Chair. & CEO
158,485 158,485 0
Cesare d’Amico(2) Vice-Chairman 2,230,000 2,000,000 1,000,000 1,230,000 0
Claudio Berretti Dir. & Gen. Manager
0 110,000 110,000 0
Alberto Capponi Director 0 0
Giuseppe Ferrero(3) Director 0 0
Manuela Mezzetti Director 0 0
Daniela Palestra Director 0 0
Paul Simon Schapira Director 0 0 (1)Giovanni Tamburi holds his investment in the share capital of TIP in part directly in his own name and in part indirectly through Lippiuno S.r.l., a company in which he holds 87.26% of the share capital.
(2)Cesare d’Amico holds his investment in the share capital of TIP through d'Amico Società di Navigazione S.p.A. (a company in which he holds directly and indirectly 50% of the share capital), through the company Fi.Pa. Finanziaria di Partecipazione S.p.A. (a company which directly holds 54% of the share capital) and through family members. (3) Giuseppe Ferrero holds his investment in the share capital of TIP directly and through family members.
The members of the Board of Statutory Auditors do not hold shares or warrants of the company. (33) Remuneration of the Corporate Boards
The table below reports the monetary remuneration, expressed in Euro, to the members of the
boards in 2020.
TIP office Fees December 31, 2020
Directors 7,771,859
Statutory Auditors 70,000
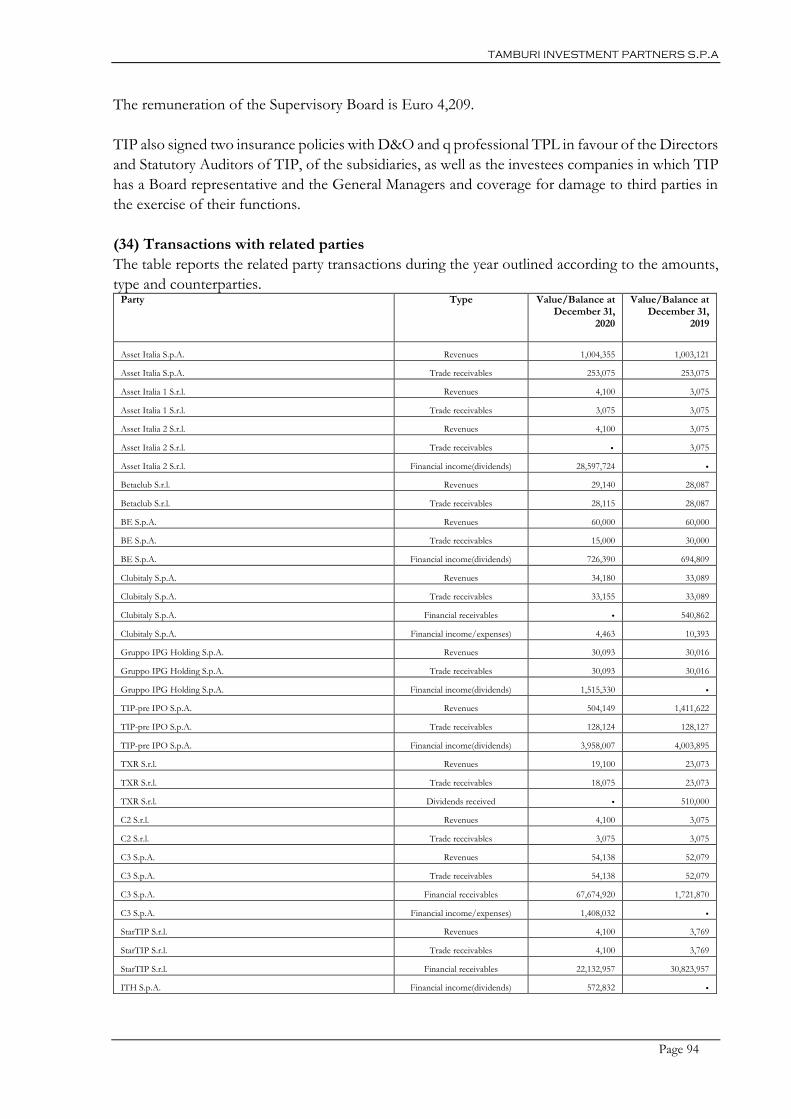
TAMBURI INVESTMENT PARTNERS S.P.A
Page 94
The remuneration of the Supervisory Board is Euro 4,209.
TIP also signed two insurance policies with D&O and q professional TPL in favour of the Directors
and Statutory Auditors of TIP, of the subsidiaries, as well as the investees companies in which TIP
has a Board representative and the General Managers and coverage for damage to third parties in
the exercise of their functions.
(34) Transactions with related parties
The table reports the related party transactions during the year outlined according to the amounts,
type and counterparties. Party Type Value/Balance at
December 31, 2020
Value/Balance at December 31,
2019
Asset Italia S.p.A. Revenues 1,004,355 1,003,121
Asset Italia S.p.A. Trade receivables 253,075 253,075
Asset Italia 1 S.r.l. Revenues 4,100 3,075
Asset Italia 1 S.r.l. Trade receivables 3,075 3,075
Asset Italia 2 S.r.l. Revenues 4,100 3,075
Asset Italia 2 S.r.l. Trade receivables . 3,075
Asset Italia 2 S.r.l. Financial income(dividends) 28,597,724 .
Betaclub S.r.l. Revenues 29,140 28,087
Betaclub S.r.l. Trade receivables 28,115 28,087
BE S.p.A. Revenues 60,000 60,000
BE S.p.A. Trade receivables 15,000 30,000
BE S.p.A. Financial income(dividends) 726,390 694,809
Clubitaly S.p.A. Revenues 34,180 33,089
Clubitaly S.p.A. Trade receivables 33,155 33,089
Clubitaly S.p.A. Financial receivables . 540,862
Clubitaly S.p.A. Financial income/expenses) 4,463 10,393
Gruppo IPG Holding S.p.A. Revenues 30,093 30,016
Gruppo IPG Holding S.p.A. Trade receivables 30,093 30,016
Gruppo IPG Holding S.p.A. Financial income(dividends) 1,515,330 .
TIP-pre IPO S.p.A. Revenues 504,149 1,411,622
TIP-pre IPO S.p.A. Trade receivables 128,124 128,127
TIP-pre IPO S.p.A. Financial income(dividends) 3,958,007 4,003,895
TXR S.r.l. Revenues 19,100 23,073
TXR S.r.l. Trade receivables 18,075 23,073
TXR S.r.l. Dividends received . 510,000
C2 S.r.l. Revenues 4,100 3,075
C2 S.r.l. Trade receivables 3,075 3,075
C3 S.p.A. Revenues 54,138 52,079
C3 S.p.A. Trade receivables 54,138 52,079
C3 S.p.A. Financial receivables 67,674,920 1,721,870
C3 S.p.A. Financial income/expenses) 1,408,032 .
StarTIP S.r.l. Revenues 4,100 3,769
StarTIP S.r.l. Trade receivables 4,100 3,769
StarTIP S.r.l. Financial receivables 22,132,957 30,823,957
ITH S.p.A. Financial income(dividends) 572,832 .

TAMBURI INVESTMENT PARTNERS S.P.A
Page 95
Party Type Value/Balance at December 31,
2020
Value/Balance at December 31,
2019
Services provided to companies related to the Board of Directors Revenues 11,000 752,795
Services provided to companies related to the Board of Directors Trade receivables 14,000 13,000
Services received by companies related to the Board of Directors Costs (services received) 3,534,680 8,268,086
Services received by companies related to the Board of Directors Trade payables 2,962,470 7,707,393
Services provided to the Board of Directors Revenues (services rendered) 2,926 2,943
Services provided to the Board of Directors Trade receivables 2,926 2,943
The services provided for all the above listed parties were undertaken at contractual terms and
conditions in line with the market.
(35) Subsequent events With reference to the subsequent events, reference should be made to the Directors’ Report. (36) Corporate Governance
TIP corporate governance adopts the provisions of the new version of the Self-Governance Code
published by Borsa Italiana.
The Corporate Governance and Ownership Structure Report for the year is approved by the Board
of Directors and published annually on the website of the company www.tipspa.it, in the
“Corporate Governance” section.
For the Board of Directors
The Chairman Giovanni Tamburi
Milan, March 25, 2021

TAMBURI INVESTMENT PARTNERS S.P.A
Page 96
ATTACHMENTS

TAMBURI INVESTMENT PARTNERS S.P.A
Page 97
Declaration of the Executive Officer for Financial Reporting as per Article 81-ter of Consob
Regulation No. 11971 of May 14, 1999 and subsequent amendments and supplements.
2. The undersigned Alessandra Gritti, as Executive Officer, and Claudio Berretti, as Executive
responsible for the preparation of the company’s financial statements of Tamburi Investment
Partners S.p.A., affirm, and also in consideration of Article 154-bis, paragraphs 3 and 4, of
Legislative Decree No. 58 of February 24, 1998:
▪ the adequacy considering the company`s characteristics and
▪ the effective application during the year of the separate financial statements
of the administrative and accounting procedures for the compilation of the separate financial
statements for the year ended December 31, 2020.
No significant aspect emerged concerning the above.
2. We also declare that:
a) the separate financial statements at December 31, 2020 correspond to the underlying
accounting documents and records;
b) the separate financial statements for the year ended December 31, 2020 were prepared in
accordance with International Financial Reporting Standards (IFRS) and the relative
interpretations published by the International Accounting Standards Board (IASB) and
adopted by the European Commission with Regulation No. 1725/2003 and subsequent
modifications, in accordance with Regulation No. 1606/2002 of the European Parliament
and provides a true and correct representation of the results, balance sheet and financial
position of Tamburi Investment Partners S.p.A.
c) the directors’ report includes a reliable analysis of the significant events in the year and their
impact on the financial statements, together with a description of the principal risks and
uncertainties. The Directors’ Report also contains a reliable analysis of the significant
transactions with related parties.
The Chief Executive Officer The Executive Officer
Milan, March 25, 2021
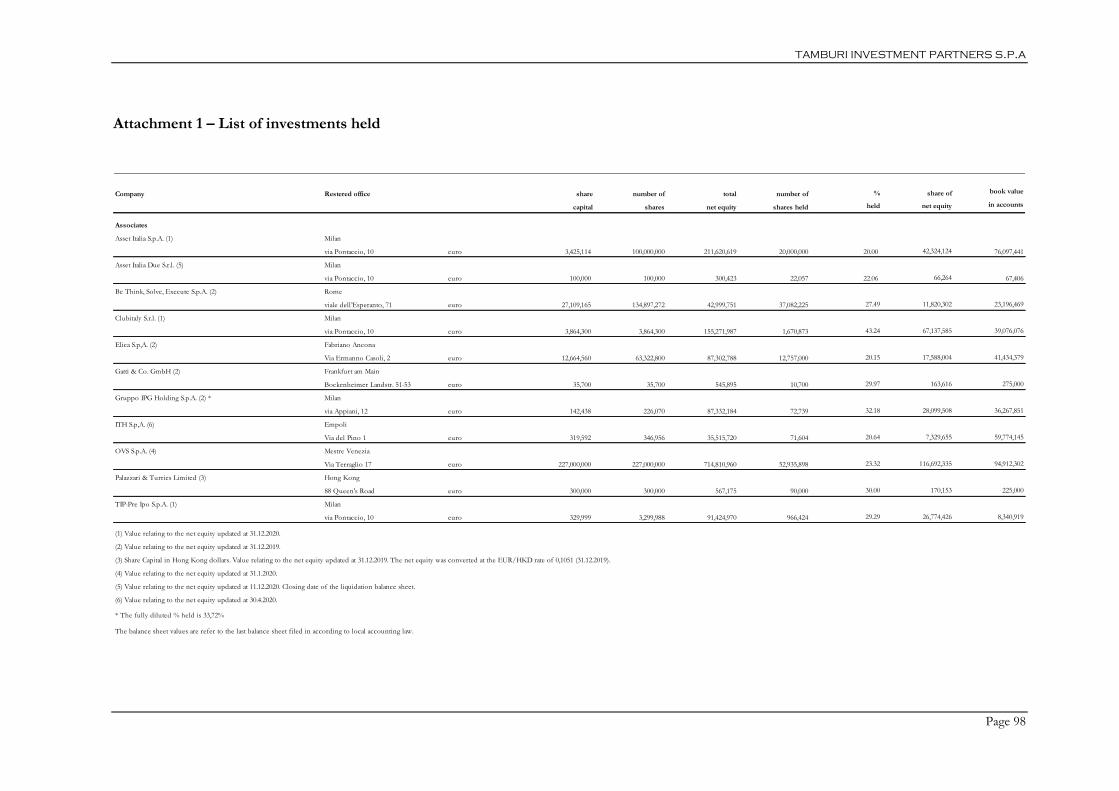
TAMBURI INVESTMENT PARTNERS S.P.A
Page 98
Attachment 1 – List of investments held
Company Restered office share number of total number of % share of book value
capital shares net equity shares held held net equity in accounts
Associates
Asset Italia S.p.A. (1) Milan
via Pontaccio, 10 euro 3,425,114 100,000,000 211,620,619 20,000,000 20.00 42,324,124 76,097,441
Asset Italia Due S.r.l. (5) Milan
via Pontaccio, 10 euro 100,000 100,000 300,423 22,057 22.06 66,264 67,406
Be Think, Solve, Execute S.p.A. (2) Rome
viale dell’Esperanto, 71 euro 27,109,165 134,897,272 42,999,751 37,082,225 27.49 11,820,302 23,196,469
Clubitaly S.r.l. (1) Milan
via Pontaccio, 10 euro 3,864,300 3,864,300 155,271,987 1,670,873 43.24 67,137,585 39,076,076
Elica S.p,A. (2) Fabriano Ancona
Via Ermanno Casoli, 2 euro 12,664,560 63,322,800 87,302,788 12,757,000 20.15 17,588,004 41,434,379
Gatti & Co. GmbH (2) Frankfurt am Main
Bockenheimer Landstr. 51-53 euro 35,700 35,700 545,895 10,700 29.97 163,616 275,000
Gruppo IPG Holding S.p.A. (2) * Milan
via Appiani, 12 euro 142,438 226,070 87,332,184 72,739 32.18 28,099,508 36,267,851
ITH S.p,A. (6) Empoli
Via del Pino 1 euro 319,592 346,956 35,515,720 71,604 20.64 7,329,655 59,774,145
OVS S.p.A. (4) Mestre Venezia
Via Terraglio 17 euro 227,000,000 227,000,000 714,810,960 52,935,898 23.32 116,692,335 94,912,302
Palazzari & Turries Limited (3) Hong Kong
88 Queen's Road euro 300,000 300,000 567,175 90,000 30.00 170,153 225,000
TIP-Pre Ipo S.p.A. (1) Milan
via Pontaccio, 10 euro 329,999 3,299,988 91,424,970 966,424 29.29 26,774,426 8,340,919
(6) Value relating to the net equity updated at 30.4.2020.
(1) Value relating to the net equity updated at 31.12.2020.
(2) Value relating to the net equity updated at 31.12.2019.
(3) Share Capital in Hong Kong dollars. Value relating to the net equity updated at 31.12.2019. The net equity was converted at the EUR/HKD rate of 0,1051 (31.12.2019).
(4) Value relating to the net equity updated at 31.1.2020.
(5) Value relating to the net equity updated at 11.12.2020. Closing date of the liquidation balance sheet.
* The fully diluted % held is 33,72%
The balance sheet values are refer to the last balance sheet filed in according to local accounting law.

TAMBURI INVESTMENT PARTNERS S.P.A
Page 99
Attachment 2 - Changes in investments measured at FVOCI
in euro No. of historic fair value write-down book value acquisition or reclass. fair value decreases fair value reversal P/L movements book value
shares cost adjustments P&L fair value subscription increase decreases fair value 31/12/2020
Non-listed companies
Azimut Benetti S.p.A. 38,990,000 (7,312,229) 31,677,771 31,677,771
ITH S.p.a. 16,799,591 20,488,101 37,287,692 11,499,939 (28,299,530) 10,986,514 (31,474,615) 0
Welcome S.p.A. 5,850,971 5,850,971 5,850,971
Other equity instr. & other minor 826,558 (100,000) 726,558 (35,041) (35,034) 35,034 691,517
Total non-listed companies 62,467,120 13,175,872 (100,000) 75,542,992 11,499,939 (28,299,530) 10,986,514 (35,041) (35,034) (31,439,581) 0 38,220,259
Listed companies
Amplifon S.p.A. 7,384,697 22,083,486 132,731,757 154,815,243 38,630,317 57,929,525 251,375,086
Fagerhult AB 795,367 0 2,643,670 832,280 130,599 3,606,549
Ferrari N.V. USD 4,815,234 9,974,766 14,790,000 (4,815,234) (2,296,944) (7,677,822) 0
Fiat Chrysler Automobiles N.V. 1,450,000 0 17,783,734 3,473,266 21,257,000
Hugo Boss AG 1,080,000 80,298,115 (33,577,315) 46,720,800 (17,247,600) 29,473,200
Moncler S.p.A. 2,050,000 31,339,079 50,804,421 82,143,501 20,643,500 102,787,001
Prysmian S.p.A. (TIP) 42,198,416 781,584 42,980,000 23,681,807 (65,880,221) (781,586) 0
Other listed companies 14,419,077 (314,404) (10,446,725) 3,657,948 410 (1,802,731) (1,031,121) 180,557 1,005,064
Total listed companies 195,153,408 160,400,809 (10,446,725) 345,107,492 82,739,528 82,878,981 (72,498,186) (21,357,251) (7,497,265) 130,599 409,503,900
Total investments 257,620,528 173,576,681 (10,546,725) 420,650,483 94,239,467 (28,299,530) 93,865,495 (72,533,227) (21,392,285) (38,936,845) 130,599 447,724,159
Balance at 1.1.2019 increases decreases
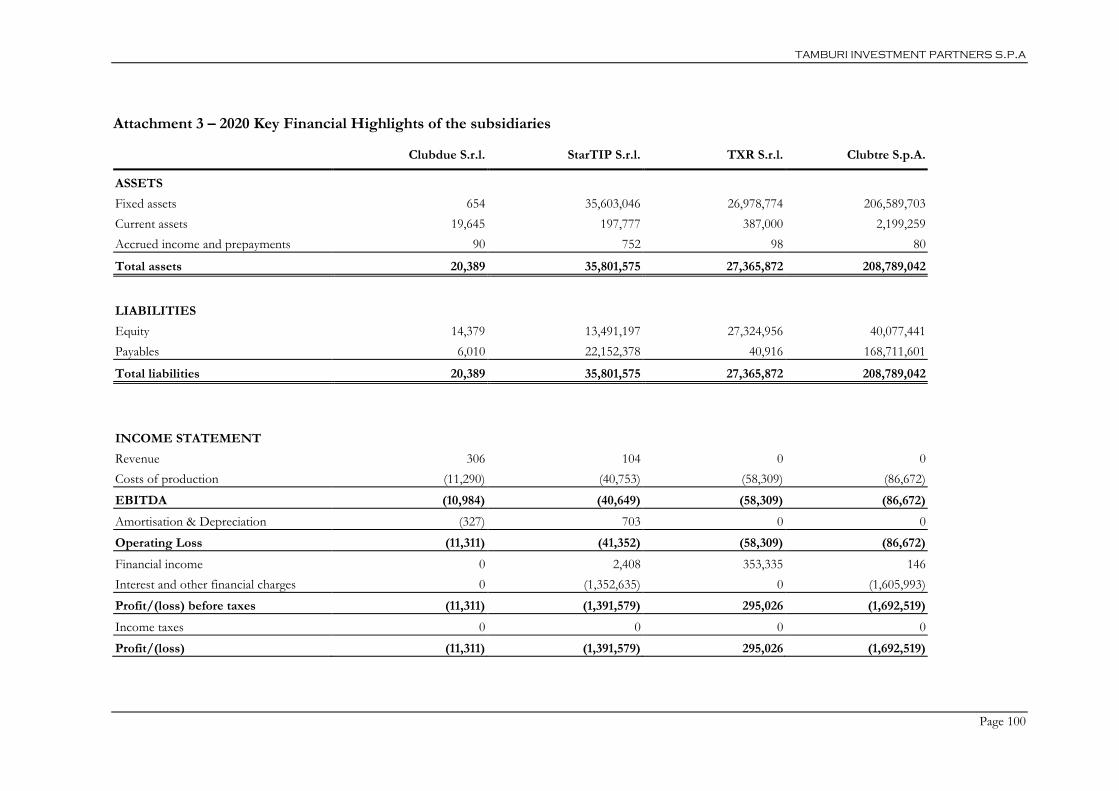
TAMBURI INVESTMENT PARTNERS S.P.A
Page 100
Attachment 3 – 2020 Key Financial Highlights of the subsidiaries
Clubdue S.r.l. StarTIP S.r.l. TXR S.r.l. Clubtre S.p.A.
ASSETS
Fixed assets 654 35,603,046 26,978,774 206,589,703
Current assets 19,645 197,777 387,000 2,199,259
Accrued income and prepayments 90 752 98 80
Total assets 20,389 35,801,575 27,365,872 208,789,042
LIABILITIES
Equity 14,379 13,491,197 27,324,956 40,077,441
Payables 6,010 22,152,378 40,916 168,711,601
Total liabilities 20,389 35,801,575 27,365,872 208,789,042
INCOME STATEMENT
Revenue 306 104 0 0
Costs of production (11,290) (40,753) (58,309) (86,672)
EBITDA (10,984) (40,649) (58,309) (86,672)
Amortisation & Depreciation (327) 703 0 0
Operating Loss (11,311) (41,352) (58,309) (86,672)
Financial income 0 2,408 353,335 146
Interest and other financial charges 0 (1,352,635) 0 (1,605,993)
Profit/(loss) before taxes (11,311) (1,391,579) 295,026 (1,692,519)
Income taxes 0 0 0 0
Profit/(loss) (11,311) (1,391,579) 295,026 (1,692,519)

TAMBURI INVESTMENT PARTNERS S.P.A
Page 101
Attachment 4 - Changes in investments in associated companies book value book value
in Euro n. shares 01/01/2019 purchases shareholders loans decreases reclassifications 31.12.2019
in equity or restitutions
Asset Italia S.p.A. 20.000.000 (1) 86,197,441 86,197,441
Be Think, Solve, Execute S.p.A. 31,582,225 16,596,459 16,596,459
ClubItaly S.p.A. 31,197 37,436,400 37,436,400
Clubtre S.p.A. 0 24,021,839 (24,021,839) 0
Elica S.p.A. 12,757,000 0 273,129 41,161,250 41,434,379
Gatti & Co Gmbh 10,700 275,000 275,000
Gruppo IPG Holding S.p.A. 67,348 37,683,941 (1,416,090) 36,267,851
OVS S.p.A. 51,635,898 0 74,951,010 17,761,950 92,712,960
Palazzari & Turries Limited 90,000 225,000 225,000
Tip-Pre Ipo S.p.A. 942,854 22,787,025 (14,446,106) 8,340,919
Total 225,223,105 75,224,139 (1,416,090) (14,446,106) 34,901,361 319,486,409
(1) Tracking shares not included
book value book value
in Euro n. shares 01/01/2020 purchases shareholders loans decreases reclassifications 31.12.2020
in equity or restitutions
Asset Italia S.p.A. 20.000.000 (1) 86,197,441 (10,100,000) 76,097,441
Asset Italia 2 S.r.l. 22,057 67,406 67,406
Be Think, Solve, Execute S.p.A. 37,082,225 16,596,459 6,600,010 23,196,469
ClubItaly S.p.A. 1,670,873 37,436,400 1,639,676 39,076,076
Elica S.p.A. 12,757,000 41,434,379 41,434,379
Gatti & Co Gmbh 10,700 275,000 275,000
Gruppo IPG Holding S.p.A. 72,739 36,267,851 36,267,851
ITH S.p.A. 71,604 59,774,145 59,774,145
OVS S.p.A. 52,935,898 92,712,960 2,199,342 94,912,302
Palazzari & Turries Limited 90,000 225,000 225,000
Tip-Pre Ipo S.p.A. 966,424 8,340,919 8,340,919
Total 319,486,409 10,506,434 0 (10,100,000) 59,774,145 379,666,988
(1) Tracking shares not included

TAMBURI INVESTMENT PARTNERS S.P.A
Page 102

TAMBURI INVESTMENT PARTNERS S.P.A
Page 103

TAMBURI INVESTMENT PARTNERS S.P.A
Page 104
TAMBURI INVESTMENT PARTNERS S.P.A
Page 105

TAMBURI INVESTMENT PARTNERS S.P.A
Page 106

TAMBURI INVESTMENT PARTNERS S.P.A
Page 107

TAMBURI INVESTMENT PARTNERS S.P.A
Page 108

TAMBURI INVESTMENT PARTNERS S.P.A
Page 109

TAMBURI INVESTMENT PARTNERS S.P.A
Page 110
TAMBURI INVESTMENT PARTNERS S.P.A
Page 111

TAMBURI INVESTMENT PARTNERS S.P.A
Page 112

TAMBURI INVESTMENT PARTNERS S.P.A
Page 113

TAMBURI INVESTMENT PARTNERS S.P.A
Page 114

TAMBURI INVESTMENT PARTNERS S.P.A
Page 115

TAMBURI INVESTMENT PARTNERS S.P.A
Page 116

TAMBURI INVESTMENT PARTNERS S.P.A
Page 117
TAMBURI INVESTMENT PARTNERS S.P.A
Page 118

TAMBURI INVESTMENT PARTNERS S.P.A
Page 119

TAMBURI INVESTMENT PARTNERS S.P.A
Page 120

TAMBURI INVESTMENT PARTNERS S.P.A
Page 121

TAMBURI INVESTMENT PARTNERS S.P.A
Page 122