2021 consolidated half-year report tamburi investment
TRANSCRIPT

2021 Consolidated Half-Year Report
tamburi investment partners group
(translation from the italian original which remains the definitive version)

Page 2
CONTENTS
Corporate Boards 3 Interim Directors’ Report 4
Condensed Consolidated Half-Year Financial Statements Financial Statements 18
▪ Consolidated Income Statement
▪ Consolidated Comprehensive Income Statement
▪ Consolidated Statement of Financial Position
▪ Statement of Changes in Consolidated Equity
▪ Consolidated Statement of Cash Flows
Notes to the 2021 condensed consolidated half-year financial statements 24
Attachments 51 ▪ Declaration of the Executive Officer for Financial Reporting
▪ Changes in investments measured at FVOCI
▪ Independent Auditors’ Report

TAMBURI INVESTMENT PARTNERS GROUP
Page 3
Corporate Boards
Board of Directors of Tamburi Investment Partners S.p.A.
Giovanni Tamburi Chairman and Chief Executive Officer Alessandra Gritti Vice Chairperson and Chief Executive Officer
Cesare d’Amico Vice Chairman Claudio Berretti Executive Director & General Manager Alberto Capponi (1)(2) Independent Director * Giuseppe Ferrero (1) Independent Director *
Manuela Mezzetti (1)(2) Independent Director *
Daniela Palestra (2) Independent Director *
Paul Simon Schapira Independent Director *
Board of Statutory Auditors
Myriam Amato Chairperson
Fabio Pasquini Statutory Auditor
Alessandra Tronconi Statutory Auditor
Andrea Mariani Alternate Auditor Massimiliano Alberto Tonarini Alternate Auditor
Independent Audit Firm
PricewaterhouseCoopers S.p.A.
(1) Member of the appointments and remuneration committee
(2) Member of the control and risks, related parties and sustainability committee
* In accordance with the Self-Governance Code

TAMBURI INVESTMENT PARTNERS GROUP
Page 4
Half Year 2021 Interim Directors’ Report of the Tamburi Investment Partners Group
It was an excellent first half of the year for the TIP group and for nearly all our investees. As it is
well known, the entire industry, around the world, has rebounded and the financial performance of
most of the companies is proving to be better than 2019, which was a record year for nearly
everyone.
At the consolidated level, TIP closed the first half with pro-forma profit of 101.2 million, the all-
time high. Consolidated shareholders’ equity at June 30, 2021 was over 1.1 billion, up from 1.07
billion at December 31, 2020, after distribution of dividends of 17 million and the purchase of 7.3
million of treasury shares.
The stock market prices of the TIP share and those of all of the publicly listed investee companies
are currently near all-time highs. As at September 3, the TIP share had risen by about 37% from
the end of 2020, in addition to the effect of the distribution of profits. The total return1 on the TIP
share over the last five years was 163.4%, with an annual average of 32.7%. The annual average
total return at ten years was over 50%.
The pro-forma result for the period significantly benefitted from both the income from the partial
divestment of Prysmian S.p.A. (Prysmian) shares and the share of earnings of the associated
companies.
In January, the subsidiary Clubtre S.r.l. (Clubtre) sold 10 million Prysmian shares through an
accelerated bookbuilding procedure and this transaction resulted in a significant capital gain.
In April, TIP acquired 33.8% of Clubtre from the minority shareholder, coming to hold 100% of
the company. Nearly at the same time, Clubtre sold 1,208,253 Prysmian shares to that shareholder.
As a result of these transactions, Clubtre now holds approximately 2.4 million Prysmian shares.
The pro-forma income statement for the first half of 2021 is reported below, calculated considering
the capital gains and losses realised and the write-downs of investments in equity. We believe that
this system, which was in effect until just a few years ago, is much more meaningful in presenting
the results of TIP operations. The Interim Directors’ Report therefore comments upon the pro-
forma figures, while the Notes provide disclosure upon the figures calculated as per IFRS 9.
1 The total return is calculated by taking into account the performance of the TIP shares, the distributed dividends and the performance of the 2015-
2020 TIP Warrants freely assigned to shareholders.

TAMBURI INVESTMENT PARTNERS GROUP
Page 5
The IFRS 9 income statement does not include capital gains in the period on the sale of equity investments of 107.9 million.
The extraordinary FCA N.V. dividend, amounting to 2.7 million for TIP, was collected in January,
and subsequently 24,692 Faurecia S.A. shares were received, whose countervalue at the date of
distribution was approximately 1.1 million, in addition to a less significant portion in cash. During
the period, we received an additional 4.8 million in dividends from investee companies.
In April, the agreements for the purchase of 70.71% of the shares of TIPO S.p.A. (TIPO), together
with 14.18% of Beta Utensili S.p.A. (Beta Utensili) and 41.58% of the shares of Betaclub S.r.l.
(Betaclub), were finalised. With this transaction, TIP came to hold (directly and indirectly) 48.99%
of Beta Utensili and 20% of Sant’Agata S.p.A. (Sant’Agata), parent company of the Chiorino group,
while TIPO and Betaclub became TIP 100% subsidiaries. The total disbursement of the transaction
was approximately 134.5 million, of which approximately 1.4 million deferred to the conclusion of
the indemnity obligations to the purchasers of iGuzzini S.p.A.
The share of earnings of the associated companies, which, following the transaction described
above, includes the results of the second quarter of Beta Utensili and of Sant’Agata, can be
quantified as a total gain of approximately 27.2 million, which includes the profits of the investee
companies IPGH S.p.A. (Interpump), ITH S.p.A. (SeSa), OVS S.p.A., Beta Utensili S.p.A, Be S.p.A.
and others, as well as the loss recognised by Alpitour S.p.A.
Advisory activity recorded revenues of approximately 3.4 million in the period.
Personnel expenses, which, as always, are significantly impacted by the variable remuneration of
the executive directors (i.e. the only remuneration tied to performance for the period), also include
the financial impact of the assignment in March of the last options (totalling 3,500,000) under the
Consolidated income statement
IFRS 9
30/6/2021
Reclassification to
income statement
of capital gain
(loss) realised
Reclassification to
income statement
of adjustments to
financial assets
PRO FORMA
30/6/2021
PRO FORMA
30/6/2020
(in Euro)
Total revenues 3,369,242 3,369,242 2,628,583
Purchases, service and other costs (3,362,167) (3,362,167) (1,187,396)
Personnel expenses (40,337,334) (40,337,334) (3,436,549)
Other income 0 0 0
Amortisation (172,131) (172,131) (172,042)
Operating profit/(loss) (40,502,390) 0 0 (40,502,390) (2,167,404)
Financial income 18,782,704 107,969,035 126,751,739 22,892,860
Financial charges (9,057,144) 0 (9,057,144) (9,560,889)
Profit before adjustments to investments (30,776,830) 107,969,035 0 77,192,205 11,164,567
Share of profit/(loss) of associates measured
under the equity method 27,166,909 0 27,166,909 (19,312,875)
Adjustments to financial assets (192,899) (192,899) (17,920,218)
Profit / (loss) before taxes (3,609,921) 107,969,035 (192,899) 104,166,215 (26,068,526)
Current and deferred taxes 8,997,240 (11,920,658) 0 (2,923,418) (661,614)
Profit / (loss) of the period 5,387,319 96,048,377 (192,899) 101,242,797 (26,730,140)
Profit/(loss) of the period attributable to
the shareholders of the parent 5,970,929 71,604,961(27,430,523)
Profit/(loss) of the period attributable to
the minority interest (583,609) 29,637,836700,383

TAMBURI INVESTMENT PARTNERS GROUP
Page 6
“2014-2021 TIP Incentive Plan” stock option plan, which has now been fully assigned. The increase
in other operating costs is correlated with the costs incurred in order to complete the transactions
of the period.
Other financial income includes mainly interest income and gains on bonds for 4.1 million, changes
in the fair value of short-term investments in listed shares for 2.3 million, exchange gains of 1.6
million and increases in the value of derivative instruments of 1.4 million. Financial charges mainly
concern the interest matured on the 300 million bond for 3.8 million, decreases in the value of
derivative instruments for 2.3 million, losses on bonds for 2 million and other interest on loans.
The ITACA EQUITY project has been operational since February, with a budget of 600 million,
of which approximately 100 million from TIP, 2 million of which have already been paid. The
ITACA project, promoted by TIP with three top-level partners in this specific segment, Sergio Iasi,
Angelo Catapano and Massimo Lucchini led to the creation of Itaca Equity Holding S.p.A., which
will invest in the equity of companies experiencing financial difficulties considered temporary
and/or needing strategic and/or organisational turnaround. This structure will allow the
approximately 40 participating family offices to analyse on a case-by-case basis the tangible projects
and invest in each one - according to the company formula already tested with Asset Italia S.p.A.
(Asset Italia).
In March, StarTIP S.r.l. (StarTIP) acquired for approximately 11 million 19% of DV Holding
S.p.A., parent company of the DoveVivo group, the European co-living leader. In June, we, along
with others, underwrote a 7 million bond issue by DV Holding S.p.A., 2.5 million of which was
underwritten by StarTIP.
In May, we increased the stake held in Bending Spoons S.p.A. by investing an additional 3.4 million.
Ferrari N.V. shares were purchased for 3.6 million, while treasury shares purchases, for
approximately 7.3 million, and other investments in listed shares and bonds continued.
The TIP Group consolidated net debt at June 30, 2021 – also taking into account the bond – but
without considering the non-current financial assets, viewed by management as liquidity available
in the short-term, totalled approximately 269 million, compared to approximately 336 million at
December 31, 2020. The change for the period is essentially due to the income in Clubtre of the
sale of the Prysmian shares, offset by investments for the period, mainly related to the TIPO/Beta
transaction and the purchase of all of Clubtre’s share capital.
The first-half results already announced by the main listed investee companies, i.e. Amplifon S.p.A.,
Be S.p.A., Elica S.p.A., Interpump Group S.p.A., Moncler S.p.A. and Prysmian S.p.A., are all strong,
and even better than most market estimates, again confirming the excellence of these companies,
as well as the solid strategic, operational and financial foundations upon which they exit the
emergency period. The numbers for OVS S.p.A. are also positive, as the company benefitted from
numerous new projects and from cost-containment efforts, as well as from the positive effects of
tax realignments. Sesa S.p.A. closed the financial year ended April 30, 2021 with record highs.

TAMBURI INVESTMENT PARTNERS GROUP
Page 7
Both direct and indirect other investments reported strong first half 2021 results, continuing the
recovery emerging in the latter months of 2020. Alpitour S.p.A. again reported poor results in the
first half of 2021, while Eataly S.p.A. posted a recovery, as both companies continued to be affected
by the restrictions on tourism and on dining out across the globe.
The growth in the value of TIP shares continued in 2021, reaching a record high above Euro 9 in
recent days, although still well below the medium-term internal intrinsic valuation estimates, which
currently call for a share value of over Euro 12. The usual five-year TIP share chart (at September
3, 2021) highlights the excellent performance of the TIP share, up 157.1%, as compared to the
main national and international indexes.
INVESTMENTS - PRINCIPAL HOLDINGS AT JUNE 30, 2021
The results reported below refer, where available, to the 2021 Half-Year Report already approved
by the Board of Directors of the investees by the current date; in the absence of such, reference is
made to the first quarter 2021 figures or the financial statements at December 31, 2020 (April 30,
2021 for Sesa).
TIP workings on data collected on September 3 at 18.01 source Bloomberg

TAMBURI INVESTMENT PARTNERS GROUP
Page 8
A) SUBSIDIARIES
Clubtre S.r.l. (formerly Clubtre S.p.A.) TIP holding at June 30, 2021: 100%
Following the transactions carried out in the first half of 2021 as described above, Clubtre S.r.l.
holds a stake of about 1% in Prysmian S.p.A. as at June 30, 2021.
Prysmian is the world leader in the production of energy and telecommunication cables.
In the first half of 2021, Prysmian posted consolidated revenues of 6,034 million, compared to
4,985 million in the first half of 2020. Adjusted EBITDA was 470 million, compared to 419 million
in the first half of 2020. The financial structure is solid, with a net financial debt decreasing to 2,387
million.
StarTIP S.r.l. TIP holding at June 30, 2021: 100%
Company held 100% by TIP that holds investments in digital and innovation, including: Alkemy
S.p.A., Alimentiamoci S.r.l., Bending Spoons S.p.A., Buzzoole S.p.A., Centy S.r.l., Digital Magics
S.p.A., Dv Holding S.p.A. (which holds a stake of about 62% in DoveVivo S.p.A.), Heroes S.r.l.
(which holds a stake of over 40% in Talent Garden S.p.A.), MyWoWo S.r.l., Talent Garden S.p.A.,
and Telesia S.p.A.
StarTIP’s investees – with the exceptions of Alkemy S.p.A. and Bending Spoons S.p.A. – generally
suffered from the effects of the virus, but they are recovering.
In early 2021, StarTIP acquired an approximately 19% interest in DV Holding S.p.A., the parent
company of DoveVivo Group, and an 8% interest in Alimentiamoci.
DoveVivo S.p.A. is Europe’s largest co-living company, with a presence in 13 cities in Italy, France
and Spain, over 1,500 properties under management, eight thousand beds and three hundred
thousand square meters of accommodations; the estimated value of its real estate portfolio is nearly
1 billion. It is among the most active, innovative prop-tech companies in Italy and Europe, capable
of innovating in a traditional sector such as real estate by applying best-of-breed, scalable
technologies and providing integrated, advanced services to its communities of owners, investors
and customers. In 2020, despite the impact of COVID, it reported revenue of approximately 40
million, up approximately 30% on 2019.
In May, we increased the stake held in Bending Spoons S.p.A. by investing an additional 3.4 million.
TIP-PRE IPO S.p.A. – TIPO TIP holding at June 30, 2021: 100%
In April, we acquired all of the shares in TIPO, which is now a wholly-owned subsidiary as at this
date. The merger of TIPO and Betaclub S.r.l. into TIP is expected to be completed by the end of

TAMBURI INVESTMENT PARTNERS GROUP
Page 9
2021. The company holds stakes in Beta Utensili S.p.A. and Sant’Agata S.p.A.
TIPO holds directly 3.94% in the share capital of Beta Utensili S.p.A. and indirectly 30.87% through
Betaclub S.r.l., in turn controlled by TIPO with 58.417%; the remaining 41.583% of Betaclub was
acquired by TIP in April. Also in April, TIP acquired the remaining shares in Beta Utensili S.p.A.
not held by the majority shareholder Centocappa S.r.l. to reach a total stake, held both directly and
indirectly, of 48.99%.
TIPO holds 20% of Sant’Agata S.p.A., the parent of the Chiorino Group.
As a result of the transactions carried out in the first half of 2021, Beta Utensili S.p.A. and
Sant’Agata S.p.A. have become associated companies of TIP.
Betaclub S.r.l. TIP holding at June 30, 2021: 100%, directly and indirectly
Betaclub S.r.l.. holds 30.87% of Beta Utensili S.p.A.
TXR S.r.l (company which at June 30, 2021 held 34.84% of Roche Bobois S.A.) TIP holding at June 30, 2021: 51.00%
The Roche Bobois group operates the largest high-end design furniture chain worldwide, with a
network – direct and/or franchising – comprising of 339 sales points (of which over 100 owned)
located in prestigious areas, with a presence in the most important cities worldwide.
The first half of 2021 was extremely positive, with business volumes of 159.6 million representing
an increase of more than 45% over the first half of 2020 and of 18.9% over the first half of 2019.
Aggregate business volumes (i.e. including franchised stores) reached an all-time high of 312.2
million. The financial structure has remained very solid, and development plans continue with the
opening of new direct and franchised stores.
B) ASSOCIATED COMPANIES
Asset Italia S.p.A. TIP holding at June 30, 2021: 20.00% excluding the shares related to specific investments
Asset Italia, incorporated in 2016 with the subscription, in addition to TIP, of approximately 30
family offices, with total capital funding of 550 million, is an investment holding and gives
shareholders the opportunity to choose for each proposal their individual investments and the
receipt of shares for the specific asset class related to the investment subscribed.
TIP holds 20% of Asset Italia, in addition to shares related to specific investments, undertaking at
least a pro-quota holding and providing support for the identification, selection, assessment and
execution of investment projects.
At June 30, 2021, Asset Italia holds, through vehicle companies set up on an ad hoc basis, the

TAMBURI INVESTMENT PARTNERS GROUP
Page 10
investment in Alpitour S.p.A.:
Alpitour S.p.A.
Asset Italia 1 S.r.l. owns both 49.9% of Alpiholding S.r.l., which in turn has a 36.76% (41.54%
on a fully diluted basis) stake in Alpitour S.p.A., and a direct stake in Alpitour S.p.A. of 31.14%
(35.18% on a fully diluted basis). TIP holds 35.81% of the shares related to Asset Italia 1 S.r.l.
Alpitour S.p.A. enjoys a dominant leadership position in Italy thanks to its strong presence in all
sectors (tour operating off line and on line, aviation, hotels, travel agencies and incoming).
Although recovering in part, the operations of Alpitour S.p.A. continue to be significantly
impacted by the pandemic. Efforts continue to contain costs and manage cash flows, while
maintaining investments in IT projects and in strategic initiatives in the areas of hotels & resorts
and aviation, in order to strengthen the company’s leadership position in Italy thanks to its
strong presence in all sectors (tour operating off line and on line, aviation, hotels, travel agencies
and incoming).
Despite receiving public grants, forecasts for the current year remain poor, with performance
being significantly compromised by both the pandemic and the containment efforts being put
into place by the various nations.
Asset Italia also holds 59,676 Amplifon S.p.A. shares. The results of Amplifon S.p.A., as also a
direct holding, are illustrated in the section on investments in listed companies.
BE Think, Solve, Execute S.p.A. (“BE”) TIP holding at June 30, 2021: 27.489% (29.029% fully diluted) Listed on the Italian Stock Exchange - STAR Segment.
The BE Group is one of the leading Italian operators in professional services for the financial
industry.
In the first six months of 2021, the BE Group delivered very strong results, with a value of
production of 106.7 million, up 28% and EBITDA of 17.5 million (13 million in the first half of
2020, +35%).
Beta Utensili S.p.A. TIP percentage held (direct and indirect) at June 30, 2021: 48.99%
Beta Utensili is the Italian leader in the sector of quality utensils.
In the first half of 2021, Beta Utensili posted consolidated revenues of 106.1 million and EBITDA of 17.3 million, on a net financial position of 48.5 million. Clubitaly S.p.A. TIP holding at June 30, 2021: 43.24%
Clubitaly S.p.A., incorporated in 2014 jointly with a number of business-owning families and family

TAMBURI INVESTMENT PARTNERS GROUP
Page 11
offices, holds 19.80% of Eataly S.p.A., the only international Italian food retail business which
operates both in distribution and catering and which symbolises high-quality “made in Italy” food.
Eataly S.p.A. operates in Italy, America and the Middle and the Far East and is implementing a
store opening programme in some of the world’s major cities through direct sales points and
franchises.
The company continues to be impacted, although to a lesser extent, by the virus in terms of the
major restrictions on catering operations, an area in which excellent earnings and growth have
always been generated. However, forecasts for the current year remain significantly compromised
by both the pandemic and the containment efforts being put into place by the various nations,
which are having a significant impact on the restaurant industry. Nonetheless, the company has
continued with planned openings, which are being met with great success, particularly at the new
point of sale in London. A new store was also opened in Japan in recent days, in the prestigious
location of Ginza.
Elica S.p.A. TIP holding at June 30, 2021: 20.15%
With sales in over 100 countries, seven production facilities worldwide and approximately 3,800
employees, Elica S.p.A. is one of the world’s main players in design, technology and high-end
solutions for ventilation, filtration and air purification, with products conceived to improve the
welfare of individuals and the environment.
Revenues in the first half of 2021 came to 269.5 million, as compared to 184.2 million for the same
period of the previous year, also increasing compared to the same period of 2019.
Adjusted EBITDA was 28.5 million, more than doubling the 12.2 million of 2020 and increasing
from the 21.2 million of the first half of 2019.
Gruppo IPG Holding S.p.A. TIP holding at June 30, 2021: 32.18%
Gruppo IPG Holding S.p.A. holds 26,406,799 shares (equal to 24.76% of the share capital, net of
treasury shares, and a relative majority) of Interpump Group S.p.A., world leader in the production
of high pressure piston pumps, power take-offs (PTOs), distributors and hydraulic systems.
Interpump Group again performed extremely well in the first six months of 2021. Interpump
Group reported revenues of 781.1 million, growth of 22.2% on the 639.5 million of the same period
of 2020, with EBITDA of 193.3 million, as compared to 139.2 million for the first half of 2020 and
162.2 million for the first half of 2019.
The IPG Holding S.p.A. Group has an outstanding loan of 100 million maturing in December
2023.

TAMBURI INVESTMENT PARTNERS GROUP
Page 12
Itaca Equity Holding S.p.A. / Itaca Equity S.r.l.
TIP holding at June 30, 2021: 29.32% Itaca Equity Holding S.p.A. / 40% Itaca Equity S.r.l.
The steps needed to render the ITACA EQUITY project operational were finalised in February,
as previously indicated, with a “soft commitment” of 600 million, of which approximately 100
million from TIP. The company is analysing a number of cases, although, at the moment, the
significant availability of public funding or funding backed by public bodies that has arrived or is
arriving to the market, along with the moratoriums granted and the expectations of additional
support for enterprises, are increasing the quantity and the quality of potential projects.
ITH S.p.A. TIP holding at June 30, 2021: 20.64%
TIP holds a 20.64% stake in ITH S.p.A., the parent company of Sesa S.p.A., a company listed on
the STAR segment of Borsa Italiana.
The Sesa Group is a leading Italian provider, with a strong and growing international presence, of
extremely innovative high value-added IT solutions and services for businesses. The solutions it
has developed include, in particular, support for the demand for digital transformation from
medium-size enterprises, in addition to the cybersecurity segment.
Sesa reports for the 2020/21 financial year (its financial year ends on April 30) revenues of 2,039
million (up 14.8%), with EBITDA of 126 million, +33.4% on the same period of the previous year,
with strong growth prospects also for 2021/22 thanks to the consolidation of digital transformation
demand over recent months. The company, with a net cash position, continues the acquisitions-led
growth strategy decided at the same time as TIP acquired its stake.
OVS S.p.A. TIP holding at June 30, 2021: 23.32%
At June 30, 2021, TIP held a 23.32% stake in OVS S.p.A. In July 2021, TIP subscribed the
company’s share of the OVS S.p.A. capital increase, out of a total of 80 million, approved to give
the company advance financial resources for acquisitions and business combinations enabling it to
continue the process of consolidation it has been pursuing for years in keeping with its position as
market leader. TIP paid approximately 21.6 million, including a portion that was not opted, which
enabled the company to slightly increase the stake held.
OVS S.p.A. was severely penalised by the restrictions imposed from time to time in response to the
pandemic, which led to prolonged lockdowns and store closures. However, its results benefited
from a very strong performance while stores were open, which at least partly offset the declines
suffered in the most challenging periods. OVS S.p.A. in the fiscal year to January 2021 saw net sales
decrease 25.7% on the twelve months to January 31, 2020. Full-year adjusted EBITDA was 72.9
million, essentially halving on 156.3 million in the previous year. The net result in the year to January
31, 2021 was a profit of 35.1 million, thanks also to the benefit on income taxes of 95.1 million
from the fiscal realignment of the OVS S.p.A. and Upim brands. The adjusted net financial position
at January 31, 2021 was 401 million, with a limited absorption of cash due to the pandemic, thanks

TAMBURI INVESTMENT PARTNERS GROUP
Page 13
to cost-cutting and procurement reduction measures.
In recent months, OVS S.p.A. finalised the acquisition of the Stefanel brand and its 23 directly
operated stores.
The first quarter of 2021 (February-April) saw a strong recovery in volumes compared to the
previous year. Net sales reached 229.6, up from 102.7 million for the first quarter of 2020, although
2019 volumes have yet to be reached.
Sant’Agata S.p.A. - Chiorino Group TIP holding at June 30, 2021: 20%
TIPO has a 20% stake in Sant’Agata S.p.A., which has a 100% holding in the Chiorino Group.
The Chiorino Group is a global leader in the conveyor belts for industrial processes sector.
In the first half of 2021, the Chiorino Group posted consolidated revenues of 68 million and EBITDA of 18.3 million on net cash of 27.4 million.
In July, the company finalised a small, yet strategically important, acquisition in the USA in the
modular-belts segment.
OTHER ASSOCIATED COMPANIES
TIP in addition holds:
- a 29.97% stake in Gatti & Co. GmbH, a corporate finance boutique with headquarters in
Frankfurt, primarily operating on the cross-border M&A market between Germany and Italy;
- a 30% stake in Palazzari & Turries Ltd, a boutique firm based in Hong Kong which assists
numerous Italian and French companies in start-ups, joint ventures and corporate finance in
China.
C) OTHER COMPANIES
INVESTMENTS IN LISTED COMPANIES
Amplifon S.p.A. TIP holding at June 30, 2021: 3.26% Listed on the Italian Stock Exchange - STAR Segment.
The Amplifon Group is world leader in the distribution and personalised application of hearing
aids with over 10,000 sales points between direct and affiliates.
In the first half of 2021, the group posted an excellent performance, including revenues of 959.5
million, up 56.3% on the first half of 2020, and recurring EBITDA of 232.7 million, up 77.2% on
the same period of 2020 and up 24.7% on the first six months of 2019, while further increasing
profitability. The net financial debt improved over December 2020, thanks to a free cash flow of
118.8 million, more than doubling also on 2019.

TAMBURI INVESTMENT PARTNERS GROUP
Page 14
Alkemy S.p.A. TIP holding at June 30, 2021: 7.58% Listed on the Alternative Investment Market (AIM) Italy
Alkemy supports medium and medium/large sized companies in the digital transformation process
of operations, through the creation, planning and activation of innovative solutions and projects
aimed at the development and renewal of their digital business.
In the first quarter of 2021, both revenues (+7%) and adjusted EBITDA (+532%) increased, while
profits came to 0.5 million and operating activities generated cash of 1.9 million.
The stock price of Alkemy S.p.A. has more than doubled in 2021.
The half-year results are not yet available.
Digital Magics S.p.A. TIP holding at June 30, 2021: 22.72% Listed on the Alternative Investment Market (AIM) Italy
Digital Magics S.p.A. is the leading Italian incubator and accelerator of both digital and non-digital
innovative start-ups and currently has over 60 active investments and 7 completed exists. Digital
Magics S.p.A. designs and develops Open Innovation programmes to support Italian businesses in
innovative processes, services and products, creating a strategic link with the digital start-ups.
The half-year results are not yet available.
Hugo Boss AG TIP holding at June 30, 2021: 1.36% Listed on the Frankfurt Stock Exchange
Hugo Boss AG is market leader in the premium and luxury segment of the medium-high end
apparel market for men and women, with a broad range from fashionable clothing to footwear and
accessories. Hugo Boss products are distributed in over 1,000 shops worldwide.
In the first half of 2021, the Hugo Boss group, while continuing to feel the effects of the pandemic,
reported a substantial recovery compared to the collapse in performance of 2020, with revenues
increasing 36%, EBITDA in positive territory at 194 million, up from the 44 million of the first
half of 2020, and the bottom line again in the black at 17 million, up from the net loss of just over
200 million in the first half of 2020. Free cash flow generated came to 103 million.
The company’s stock price is rising constantly and recently surpassed 50 per share (+78% from the
start of the year).
TAMBURI INVESTMENT PARTNERS GROUP
Page 15
Moncler S.p.A. TIP holding at June 30, 2021: 0.75% Listed on the Italian Stock Exchange - STAR Segment
Moncler is a global leader in the apparel luxury segment.
After a 2020 in which performance was impacted by the pandemic, in the first half of 2021 Moncler
S.p.A. began again to generate excellent results, with revenues increasing 57% over the first six
months of 2020 and by 11% over the same period of 2019. EBIT came to 92.8 million, as compared
to an operating loss of 35.5 million for the first six months of 2020.
The full acquisition of Sportswear Company S.p.A. (which owns the Stone Island brand) was also
completed, whose results are consolidated from the second quarter of 2021.
INVESTMENTS IN NON-LISTED COMPANIES
Azimut Benetti S.p.A. TIP holding at June 30, 2021: 12.07%
Azimut Benetti S.p.A. is one of the largest and most prestigious constructors of mega yachts
worldwide. The company has ranked as “Global Order Book” leader for 20 consecutive years,
which ranks the major global constructors of yachts and mega yachts of over 24 metres worldwide.
It has 6 boatyards and one of the world’s most comprehensive sales networks.
After a 2019-2020 in which the value of production decreased as a result of a contraction in demand
in response to the impact of COVID-19 on the global economy, preliminary figures for the 2020-
2021 financial year ended in August posted improvements, with value of production reaching 850
million, up 100 million on the previous year, and with the order backlog tripling to 1.2 billion, 508
million of which received in just the last 90 days.
Vianova S.p.A. (formerly Welcome S.p.A.) TIP holding at June 30, 2021: 12.04%
TIP holds a 12.04% interest in Vianova S.p.A, a leading Italian provider of innovative integrated
telecommunication and IT services to businesses with a network of partner firms (and agents) that
act as system integrators, selling, installing and maintaining the services and devices offered by the
group. It also manages two data centres, hosted by the company offices in direct contact with the
network operation centre.
In the first half of 2021, Vianova posted consolidated revenues of 32.8 million and EBITDA of 8.6 million on net cash of 16.7 million.

TAMBURI INVESTMENT PARTNERS GROUP
Page 16
D) OTHER INVESTMENTS AND FINANCIAL INSTRUMENTS
In addition to the investments listed, TIP subscribed to bonds and holds stakes in other listed and
non-listed companies which in terms of amounts invested, are not considered significant.
In 2021, liquidity management also included investments in publicly listed shares, which, given the
temporary nature of the investment, were categorised as current assets.
RELATED PARTY TRANSACTIONS
The transactions with related parties are detailed in note 34.
SUBSEQUENT EVENTS TO JUNE 30, 2021
In July, TIP committed to acquiring an additional 5% stake in Vianova S.p.A. in a transaction that
is expected to close in October.
In July 2021, TIP subscribed the capital increase of OVS S.p.A., investing a total of approximately
21.6 million and slightly increasing the stake held.
In July, the company subscribed the capital increase of Clubitaly S.p.A. in the amount of
approximately 1 million. Clubitaly S.p.A. in turn subscribed its share, of about 2 million, in the
capital increase of Eataly S.p.A.
In September, the respective governing bodies approved the merger of TIPO and Betaclub into
TIP, which is expected to be finalised by year end.
Treasury share and listed share purchases continued, in addition to the investment of liquidity in
bonds.
In recent days, the TIP share reached a market capitalisation of over 1.7 billion. Capital gains have
also risen further above the book values, and the intrinsic medium-term value of the group,
calculated in the usual manner, has risen above 2.2 billion.
OUTLOOK
At the moment, the growth in revenues and in margins of the industrial companies is expected to
continue at a rapid pace, so the financial performance of nearly all investees should remain strong
throughout 2021.
Given this outlook, it is reasonable to expect that the excellent consolidated profitability for the
TIP group as already seen in the first half of the year will be maintained, and may improve even
further, even without any particularly significant disposals.

TAMBURI INVESTMENT PARTNERS GROUP
Page 17
The pipeline of new, large-scale transactions is not particularly full as a result of the continuation
of the stimulus measures granted or promised to a great many companies by various governments,
but TIP’s particular business model continues to allow access to interesting deals, although often
at pricing conditions similar to those that are available on the stock markets. The pipeline remains
very interesting in relation to mid-sized transactions, particularly in the segment of tech companies
or other innovative businesses.
RESEARCH AND DEVELOPMENT
During the year the Company did not carry out any research and development activity.
PRINCIPAL RISKS AND UNCERTAINTIES
In relation to the principal Group risks and uncertainties, reference should be made to note 31.
TREASURY SHARES
At June 30, 2021, treasury shares in portfolio totalled 15,076,249, equal to 8.177% of the share
capital. As of today, they number 15,205,972 and represent 8.247% of the share capital.
On behalf of the Board of Directors
Executive Chairman
Giovanni Tamburi
Milan, September 9, 2021

TAMBURI INVESTMENT PARTNERS GROUP
Page 18
(1) The H1 2021 income statement (as for H1 2020) has been prepared in accordance with IFRS 9 and therefore
does not include the income and direct capital gains in the period on the sale of equity investments of Euro
107.9 million. In the Interim Directors’ Report (page 5), the proforma income statement is presented, drawn
up considering the capital gains and losses realised and the write-downs of investments in equity, which
reports a net profit of approximately Euro 101.2 million.
Consolidated Income Statement Tamburi Investment Partners Group (1)
(in Euro)
Six months period ended June 30, 2021
Of which
related parties
Six months period ended June 30, 2020
Of which
related parties Note
Revenue from sales and services 3,328,727 1,416,949 2,603,300 709,800 4 Other revenues 40,515 25,283 Total revenues 3,369,242 2,628,583 Purchases, service and other costs (3,362,167) 29,973 (1,187,396) 20,000 5 Personnel expenses (40,337,334) (3,436,549) 6 Amortisation, depreciation & write-downs (172,131) (172,042)
Operating profit/( loss) (40,502,390) (2,167,404)
Financial income 18,782,704 15,053,321 7
Financial charges (9,057,144) (9,423,488) 7
Profit/(loss) before adjustments to investments (30,776,830) 3,462,429
Share of profit/(loss) of associated companies measured under the equity method 27,166,909 (17,268,282) 8
Profit/(loss) before taxes (3,609,921) (13,805,853)
Current and deferred taxes 8,997,240 (569,480) 9
Profit/(loss) for the period 5,387,319 (14,375,333)
Profit/(loss) attributable to the shareholders of the parent 5,970,928 (15,075,716)
Profit/(loss) attributable to minority interests (583,609) 700,383
Basic earnings / (loss) per share
0.04
(0.09) 24 Diluted earnings / (loss) per share 0.04 (0.09) 24
Number of shares in circulation
169,303,052
169,938,969

TAMBURI INVESTMENT PARTNERS GROUP
Page 19
Consolidated comprehensive income statement Tamburi investment partners group
(in Euro)
Six months period ended June 30, 2021
Six months period ended June 30, 2020 Note
Profit / (loss) for the period 5,387,319 (14,375,333)
Other comprehensive income items
Income through P&L
23 Increase/(decrease) in associated companies measured under the equity method 4,609,016 (4,172,152)
Unrealised profit/(loss) 4,630,379 (4,222,826)
Tax effect (21,363) 50,674
Increases/decreases in the value of current financial assets measured at FVOCI (2,483,304) (5,003,094)
Unrealised loss (2,640,505) (4,912,475)
Tax effect 157,201 (90,219)
Income not through P&L 23
Increase/decrease investments measured at FVOCI 115,144,054 (57,144,758)
Profit/(Loss) 116,305,791 (57,504,082)
Tax effect (1,161,737) 359,324
Increase/(decrease) in associated companies measured under the equity method 89,786 (18,085,347)
Profit/(Loss) 89,788 (18,305,007)
Tax effect (2) 219,660
Other components 17,794 28,623
Total other comprehensive income/(loss) items 117,377,346 (84,376,728)
Total comprehensive income/(loss) 122,764,665 (98,752,061)
Comprehensive income/(loss) attributable to the shareholders of the parent 126,554,273 (96,109,101)
Comprehensive income/(loss) attributable to minority interests (3,789,607) (2,642,960)

TAMBURI INVESTMENT PARTNERS GROUP
Page 20
Consolidated Statement of Financial Position Tamburi investment partners group
(in Euro) June 30,
2021
Of which
related parties
December 31,
2020
Of which
related parties Note
Non-current assets Property, plant and equipment 171,262 95,690 Right-of-use 2,452,691 2,600,791 Goodwill 9,806,574 9,806,574 10 Other intangible assets 12,479 17,283 Investments measured at FVOCI 703,054,495 880,159,540 11 Associated companies measured under the equity method 682,778,275 526,156,105 12 Financial receivables measured at amortised cost 6,755,251 3,611,418 13 Financial assets measured at FVTPL 2,959,829 2,883,243 14 Tax receivables 313,768 299,730 20
Total non-current assets 1,408,304,624 1,425,630,374
Current assets Trade receivables 420,869 355,234 1,449,106 519,844 15 Current financial receivables measured at amortised cost 0 15,651 Derivative instruments 6,193,299 5,559,926 16 Current financial assets measured at FVOCI 153,160,783 179,859,731 17 Current financial assets measured at FVTPL 8,701,912 0 18 Cash and cash equivalents 10,221,021 3,250,495 19 Tax receivables 1,679,233 2,295,841 20 Other current assets 364,144 111,058
Total current assets 180,741,261 192,541,808
Total assets 1,589,045,885 1,618,172,182
Equity Share capital 95,877,237 95,877,237 22 Reserves 549,075,850 477,180,422 23 Retained earnings/(accumulated losses) 427,693,769 386,974,911 Result attributable to the shareholders of the parent 5,970,928 148,159 24 Total equity attributable to the shareholders of the parent 1,078,617,784 960,180,729 Equity attributable to minority interests 36,529,453 109,534,852
Total equity 1,115,147,237 1,069,715,581
Non-current liabilities Post-employment benefit 363,364 362,309 25 Derivative instruments 1,834,238 285,846 26 Financial liabilities for leasing 2,305,767 2,305,767 Financial payables 373,067,743 451,403,080 27 Deferred tax liabilities 3,052,666 13,272,362 21
Total non-current liabilities 380,623,778 467,629,364
Current liabilities Trade payables 600,576 29,973 528,409 30,687 Current financial liabilities for leasing 203,337 321,574 Current financial liabilities 69,957,062 70,695,363 28 Tax payables 3,183,625 120,237 29 Other liabilities 19,330,270 9,161,654 30
Total current liabilities 93,274,870 80,827,237
Total liabilities 473,898,648 548,456,601
Total equity & liabilities 1,589,045,885 1,618,172,182

TAMBURI INVESTMENT PARTNERS GROUP
Page 21
Statement of changes in Consolidated Equity
in Euro
Share Share Legal FV OCI reserve FV OCI reserve Treasury Other IFRS Merger Retained Result Equity Net equity Result Equity
capital premium reserve without reversal with reversal shares reserve reserve surplus earnings for the period shareholders minorities for period
reserve to profit and loss to profit and loss reserve business shareholders of parent minorities
combination of parent
At January 1, 2020 consolidated 89,441,422 208,856,512 17,101,933 226,214,853 1,234,888 (54,542,930) (8,268,782) (483,655) 5,060,152 310,536,546 30,985,586 826,136,525 74,499,634 1,841,970 902,478,129
Change in fair value of investments
measured at FVOCI (53,801,416) (53,801,416) (3,343,343) (57,144,759)
Change in associated companies measured under the equity method (18,085,347) (4,172,152) (22,257,499) (22,257,499)
Change in fair value of current financial assets measured at FVOCI (5,003,094) (5,003,094) (5,003,094)
Employee benefits 28,623 28,623 28,623
Total other comprehensive income items (71,886,763) (9,175,246) 28,623 (81,033,385) (3,343,343) (84,376,728)
Profit/(loss) of the period (15,075,716) (15,075,716) 700,383 (14,375,333)
Total comprehensive income (71,886,763) (9,175,246) (15,075,716) (96,109,101) (3,343,343) 700,383 (98,752,061)
Reversal of Fv reserve due to capital gain realised (5,196,977) 5,196,977 0 0
Change in reserves of associated companies measure under equity method 3,937,814 3,937,814 3,937,814
Change in oher reserves 5 5 5
Dividends distribution (14,289,831) (14,289,831) (14,289,831)
Warrant exercise 6,435,815 60,521,413 66,957,228 66,957,228
Allocation profit 2019 786,351 30,199,235 (30,985,586) 0 1,841,970 (1,841,970) 0
Stock Option exercise 0 0
Allocation of Units related to performance shares 1,759,662 1,759,662 1,759,662
Acquisition of treasury shares (27,095,942) (27,095,942) (27,095,942)
Sale of treasury shares 0 0
At June 30, 2020 consolidated 95,877,237 269,377,925 17,888,284 149,131,113 (7,940,358) (81,638,872) (2,542,678) (483,655) 5,060,152 331,642,928 (15,075,716) 761,296,360 72,998,261 700,383 834,995,004
Share Share Legal FV OCI reserve FV OCI reserve Treasury Other IFRS Merger Retained Result Equity Net equity Result Equity
capital premium reserve without reversal with reversal shares reserve reserve surplus earnings for the period shareholders minorities for period
reserve to profit and loss to profit and loss reserve business shareholders of parent minorities
combination of parent
At January 1, 2021 consolidated 95,877,237 269,354,551 17,888,284 284,125,739 (4,151,736) (91,517,648) (3,095,265) (483,655) 5,060,152 386,974,911 148,159 960,180,729 107,728,602 1,806,250 1,069,715,581
Change in fair value of investments
measured at FVOCI 117,972,096 117,972,096 (2,828,041) 115,144,054
Change in associated companies measured under the equity method 89,786 4,609,016 4,698,802 4,698,802
Change in fair value of current financial assets measured at FVOCI (2,105,347) (2,105,347) (377,957) (2,483,304)
Employee benefits 17,794 17,794 17,794
Total other comprehensive income items 118,061,882 2,503,669 17,794 120,583,344 (3,205,998) 117,377,346
Profit/(loss) of the period 5,970,928 5,970,928 (583,609) 5,387,319
Total comprehensive income 118,061,882 2,503,669 5,970,928 126,554,273 (3,205,998) (583,609) 122,764,665
Reversal of Fv reserve due to capital gain realised (66,770,654) 66,770,654 0 0
Change in reserves of associated companies measure under equity method (273,901) (273,901) (273,901)
Change in oher reserves 4 4 4
Dividends distribution (16,931,320) (16,931,320) (13,348,845) (30,280,165)
Allocation to legal reserve 1,287,163 (1,287,163) 0 0
Allocation profit 2020 148,159 (148,159) 0 1,806,250 (1,806,250) 0
Changes in consolidation area 8,342,333 (377,957) (7,964,377) 0 (55,866,946) (55,866,946)
Stock Option exercise 11,451,926 11,451,926 11,451,926
Allocation of Units related to performance shares 1,749,993 1,749,993 1,749,993
Stock Option exercise (326,792) (17,096) (343,888) (343,888)
Acquisition of treasury shares (7,280,502) (7,280,502) (7,280,502)
Sale of treasury shares 2,943,619 11,878,563 (11,311,712) 3,510,470 3,510,470
At June 30, 2021 consolidated 95,877,237 272,298,170 19,175,447 343,759,299 (2,026,024) (86,919,587) (1,787,954) (483,655) 5,060,152 427,693,769 5,970,928 1,078,617,784 37,113,063 (583,609) 1,115,147,237

TAMBURI INVESTMENT PARTNERS GROUP
Page 22
Consolidated Statement of Cash Flows Tamburi investment partners group
euro thousands June 30, 2021 June 30, 2020
A.- OPENING NET CASH AND CASH EQUIVALENTS (66,930) 163,485
B.- CASH FLOW FROM OPERATING ACTIVITIES
Profit/(loss) for the period 5,387 (14,375)
Amortisation & depreciation 24 23
Share of profit of associated companies measured under the equity method (27,167) 17,268
Financial income and charges (2,526) 21
Changes in “employee benefits” 19 15
Performance shares and stock options charges 13,202 1,760
Interest on loans and bonds 4,478 6,404
Change in deferred tax assets and liabilities (12,343) 376
(18,926) 11,493
Decrease/(increase) in trade receivables 1,028 (555)
Decrease/(increase) in other current assets 229 37
Decrease/(increase) in tax receivables 603 (1,300)
Decrease/(increase) financial receivables, FVTPL financial assets and derivatives (9,560) 253
Decrease/(increase) in other current asset securities 24,058 (36,157)
(Decrease)/increase in trade payables 72 (291)
(Decrease)/increase in financial payables 0 54
(Decrease)/increase in tax payables 3,063 310
(Decrease)/increase in other current liabilities 9,958 (16,987)
Cash flow from operating activities 10,525 (43,142)
C.- CASH FLOW FROM
INVESTMENTS IN FIXED ASSETS
Intangible and tangible assets
Investments / divestments (95) (11)
Financial assets
Investments (*) (216,224) (45,556)
Divestments 332,060 17,608
Cash flow from investing activities 115,741 (27,959)
(*) This includes the consideration paid to purchase shares in TIPO and Betaclub, in the amount of Euro 101.5 million, net of the cash held by the subsidiaries acquired, equal to Euro 5 million.

TAMBURI INVESTMENT PARTNERS GROUP
Page 23
euro thousands June 30, 2021 June 30, 2020
D.- CASH FLOW FROM
FINANCING
Loans
New loans 20,000 0
Loans/bond repayments (100,000) (100,000)
Interest paid on loans and bonds (562) (5,865)
Share capital
Share capital increase and capital contributions on account 0 66,957
Changes from purchase/sale of treasury shares (7,258) (27,096)
Exercise of Stock Options 3,167 0
Payment of dividends (30,280) (14,290)
Cash flow from financing activities (114,956) (80,294)
E.- NET CASH FLOW FOR THE PERIOD 11,310 (151,395)
F. CLOSING CASH AND CASH EQUIVALENTS (55,620) 12,090
The breakdown of the net available liquidity was as follows:
Cash and cash equivalents 10,221 62,150
Bank payables due within one year (65,841) (50,060)
Closing cash and cash equivalents (55,620) 12,090

TAMBURI INVESTMENT PARTNERS GROUP
Page 24
NOTES TO THE 2021 CONDENSED CONSOLIDATED HALF-YEAR FINANCIAL STATEMENTS
(1) Group activities
The TIP Group is an independent and diversified industrial group, focused on Italian medium-
sized companies, with a particular involvement in:
1. investments: as an active shareholder in companies (listed and non-listed) capable of
achieving “excellence” in their relative fields of expertise and, with regards to the StarTIP
project, in start-ups and innovative companies;
2. investment through ITACA EQUITY HOLDING in companies that are experiencing
temporary financial difficulties and need both a strategic and organisational refocus;
3. advisory: in corporate finance operations, in particular acquisitions and sales through the
division Tamburi & Associati (T&A).
(2) Accounting standards
The parent company TIP was incorporated in Italy as a limited liability company and with
registered office in Italy.
The company was listed in November 2005 and on December 20, 2010 Borsa Italiana S.p.A.
assigned the STAR classification to TIP ordinary shares.
The 2021 condensed consolidated half-year report was approved by the Board of Directors on
September 9, 2021.
The condensed consolidated half-year financial statements at June 30, 2021 were prepared in
accordance with the going-concern concept and in accordance with International Financial
Reporting Standards and International Accounting Standards (hereafter “IFRS”, “IAS” or
international accounting standards) issued by the International Accounting Standards Boards
(IASB) and the relative interpretations of the International Financial Reporting Interpretations
Committee (IFRIC), and adopted by the European Commission with Regulation No. 1725/2003
and subsequent modifications, in accordance with Regulation No. 1606/2002 of the European
Parliament and in particular the Condensed Consolidated Half-Year Financial Statements were
prepared in accordance with IAS 34.
The condensed consolidated financial statements are comprised of the income statement, the
comprehensive income statement, the statement of financial position, the change in equity, the
statement of cash flow and the explanatory notes, together with the Directors’ Report. The financial
statements were prepared in units of Euro, without decimal amounts.
The financial statements were prepared in accordance with IAS 1, while the Explanatory Notes
were prepared in condensed form in accordance with IAS 34 and therefore do not include all the
disclosures required for the annual financial statements prepared in accordance with IFRS.

TAMBURI INVESTMENT PARTNERS GROUP
Page 25
The accounting policies utilised for the preparation of this interim consolidated report are
consistent with those utilised for the preparation of the consolidated financial statements for the
year ended December 31, 2020.
The income statement, the comprehensive income statement and the consolidated statement of
cash flows at June 30, 2020 and the statement of financial position at December 31, 2020 were
utilised for comparative purposes.
During the period, no special circumstances arose requiring recourse to the exceptions allowed
under IAS 1.
The preparation of the condensed consolidated financial statements requires the formulation of
valuations, estimates and assumptions which impact the application of the accounting principles
and the amounts of the assets, liabilities, costs and revenues recorded in the financial statements.
These estimates and relative assumptions are based on historical experience and other factors
considered reasonable. However, it should be noted as these refer to estimates, the results obtained
will not necessarily be the same as those represented. The estimates are used to value the provisions
for risks on receivables, measurement at fair value of financial instruments, leasing, employee
benefits and income taxes.
New accounting standards
New standards, amendments to existing standards and interpretations applicable for
periods subsequent to January 1, 2021 and not yet adopted by the Group
At the reporting date, the relevant bodies of the European Union had not yet concluded the process
necessary for the implementation of the amendments and standards described below.
▪ On January 23, 2020, the IASB published an amendment entitled “Amendments to IAS 1
Presentation of Financial Statements: Classification of Liabilities as Current or Non-
current”. The purpose of the document is to clarify how to classify payables and other short
or long-term liabilities. The amendments enter into force on January 1, 2022, although the
IASB has issued an exposure draft to postpone their entry into force until January 1, 2023;
however, early application is permitted.
▪ On May 14, 2020 the IASB published the following amendments: - Amendments to IFRS
3 Business Combinations: the purpose of the amendments is to update the reference in
IFRS 3 to the Conceptual Framework in the revised version, without this entailing any
changes to the provisions of IFRS 3. - Amendments to IAS 16 Property, Plant and
Equipment: the purpose of the amendments is not to allow the deduction from the cost of
property, plant and equipment of the amount received from the sale of goods produced
during the testing phase of the relevant asset. These sales revenues and related costs will
therefore be recognised to the income statement. - Amendments to IAS 37 Provisions,
Contingent Liabilities and Contingent Assets: the amendment clarifies that in estimating
the possible onerousness of a contract, all costs directly attributable to the contract must
be considered. Accordingly, the assessment of whether a contract is onerous includes not

TAMBURI INVESTMENT PARTNERS GROUP
Page 26
only incremental costs (such as the cost of direct material used in processing), but also all
costs that the enterprise cannot avoid because it has entered into the contract (such as, for
example, the share of personnel expenses and depreciation of machinery used to perform
the contract). - Annual Improvements 2018-2020: the amendments were made to IFRS 1
First-time Adoption of International Financial Reporting Standards, IFRS 9 Financial
Instruments, IAS 41 Agriculture and the Illustrative Examples of IFRS 16 Leases. All the
amendments will enter into force from January 1, 2022.
▪ On May 31, 2021, the IASB published an amendment called "Covid-19 Related Rent
Concessions beyond June 30, 2021 (Amendment to IFRS 16)". The document provides for
the extension for one year of the May 2020 amendment that clarified the circumstance that
a lessee, as a practical expedient, may assess that specific rate reductions (as a direct result
of COVID-19) may not be considered as plan changes, and therefore the effects of rent
reductions may be accounted for directly in the income statement on the effective date of
the reduction. The new amendment is applied from April 1, 2021.
▪ The IASB published on February 12, 2021 Amendments to IAS 1 “Presentation of
Financial Statements” and IFRS Practice Statement 2 “Disclosure of Accounting policies”
to support companies in choosing which accounting policies to disclose in their financial
statements. The amendment will be effective for fiscal years beginning January 1, 2023, with
early application permitted.
▪ On February 12, 2021, the IASB published Amendments to IAS 8 "Accounting policies,
Changes in Accounting Estimates and Errors: Definition of Accounting Estimates”, which
introduces a new definition of accounting estimates and clarifies the distinction between
changes in accounting estimates, changes in accounting policies, and errors. The
amendment will be effective for fiscal years beginning January 1, 2023, with early
application permitted.
▪ On May 7, 2021, the IASB published Amendments to "IAS 12 Income Taxes: Deferred
Tax related to Assets and Liabilities arising from a Single Transaction” which requires
companies to recognise deferred tax assets and liabilities on particular transactions that,
upon initial recognition, give rise to equivalent (taxable and deductible) temporary
differences - e.g. transactions related to leases. The amendment will be effective for fiscal
years beginning January 1, 2023, with early application permitted.
The impacts of these amendments on the Group consolidated financial statements are currently
being assessed. Based on a preliminary review of the potential issues, direct significant impacts on
TIP are not expected.
Consolidation principles and basis of consolidation
Consolidation scope
The consolidation scope includes the parent TIP - Tamburi Investment Partners S.p.A. and the
companies over which it exercises direct or indirect control. An investor controls an entity in which
an investment has been made when exposed to variable income streams or when possessing rights
to such income streams based on the relationship with the entity, and at the same time has the
capacity to affect such income steams through the exercise of its power. Subsidiaries are
consolidated from the date control is effectively transferred to the Group, and cease to be

TAMBURI INVESTMENT PARTNERS GROUP
Page 27
consolidated from the date control is transferred outside the Group.
At June 30, 2021, the consolidation scope included the companies Clubdue S.r.l., Clubtre S.r.l.,
StarTIP S.r.l., TXR S.r.l., TIP-pre IPO S.p.A. and Betaclub S.r.l..
The details of the subsidiaries were as follows:
Company Name Registered Office Share capital
Number of shares
Number of shares held % Held
Clubdue S.r.l. Milan 10,000 10,000 10,000 100.00%
Clubtre S.r.l. Milan 120,000 120,000 120,000 100.00%
StarTIP S.r.l. Milan 50,000 50,000 50,000 100.00%
TXR S.r.l. Milan 100,000 100,000 51,000 51.00%
TIP-pre IPO S.p.A. Milan 329,999 3,299,988 3,299,988 100.00%
Betaclub S.r.l. (1) Milan 100,000 100,000 100,000 100.00%
(1) A total of 41,583.07 quote are held directly by TIP, while 58,416.93 are held indirectly through TIPO.
In April 2021, TIP acquired 23,055 shares from the minority shareholder of Clubtre with an
additional investment of Euro 55.7 million, representing an additional stake of 19.22%. Following
the transaction, TIP became the sole shareholder of Clubtre. The treasury shares were then
cancelled, and the company was transformed into a limited-liability company. The acquisition of
the stake held by the minority interests resulted in a reduction in equity attributable to minority
interests of Euro 55.9 million and a reclassification, within equity attributable to the shareholders
of the parent company, of Euro 7.9 million from retained earnings to the “OCI reserve without
reversal”, for Euro 8.3 million, and to the “OCI reserve with reversal” for a negative Euro 0.4
million, so as to realign these reserves with the similar reserves included in the equity attributable
to the minority interests, which were eliminated.
The company TIPO S.p.A. entered the consolidation scope following the acquisition in April, with
an additional investment of Euro 73.7 million (of which 1.4 million deferred to be paid within 10
days of March 31, 2023, the date set as the contractual deadline for the commitments undertaken
for the sale of the iGuzzini S.p.A. investment executed in March 2019), of a further stake of 70.71%
in the company, adding to the existing stake of 29.29%. Following this transaction, TIP now owns
100% of TIPO. The obtaining of control of TIPO and the consequent transfer of the company
from an associated company measured under the equity method to a subsidiary subject to line-by-
line consolidation resulted in the recognition of the holdings in TIPO already held similarly to as
would have occurred on the divestment of the holding and re-acquired at their fair value at the
time. This transaction resulted in the recognition of an accounting gain of approximately Euro 3.7
million.
On the same date, TIP also acquired, with an investment of Euro 29.2 million, a stake of 41.58%
in the company Betaclub S.r.l., adding to the existing stake of 58.42%. Following this transaction,
TIP now owns 100% of Betaclub either directly or indirectly.

TAMBURI INVESTMENT PARTNERS GROUP
Page 28
Allocation of the fair values of the assets and liabilities assumed in the consolidated financial
statements as a result of the TIPO and Betaclub transaction are still being completed. The
provisional allocation is as follows:
TIPO/Betaclub
Euro
A Investments in associated companies 129,482,761
B Cash and cash equivalents 5,027,084
C Other current assets 481,980
D Total assets (A+B+C) 134,991,825
E Deferred tax charges (1,100,692)
F Current liabilities (211,287)
G Total assets and liabilities assumed (D+E+F) 133,679,846
The consideration paid for the controlling stake in TIPO/Betaclub was established as follows:
A Consideration for additional investments 102,951,016
B Fair value of the share of investments already held 30,728,830
C Consideration (A+B) 133,679,846
Consolidation procedures
The consolidation of the subsidiaries is made on the basis of the respective financial statements of
the subsidiaries, adjusted where necessary to ensure uniform accounting policies adopted by the
Parent Company.
All inter-company balances and transactions, including any unrealised gains deriving from
transactions between Group companies are fully eliminated. Unrealised losses are eliminated except
when they represent a permanent impairment in value.
Accounting policies
The main accounting policies adopted in the preparation of the consolidated half-year report at
June 30, 2021 are disclosed below.
PROPERTY, PLANT AND EQUIPMENT
Property, plant & equipment are recognised at historical cost, including directly allocated accessory
costs and those necessary for bringing the asset to the condition for which it was acquired. If major
components of such tangible assets have different useful lives, such components are accounted for
separately.
Tangible assets are presented net of accumulated depreciation and any losses in value, calculated as
described below.
Depreciation is calculated on a straight-line basis according to the estimated useful life of the asset;
useful life is reviewed annually. Any changes, where necessary, are recorded in accordance with
future estimates; the main depreciation rates used are the following:
following:

TAMBURI INVESTMENT PARTNERS GROUP
Page 29
- furniture & fittings 12%
- equipment & plant 15%
- EDP 20%
- mobile telephones 20%
- equipment 15%
- Automobiles 25%
The book value of tangible assets is tested to ascertain possible losses in value if events or
circumstances indicate that the book value cannot be recovered. If there is an indication of this
type and in the case where the carrying value exceeds the realisable value, the assets must be written
down to their realisable value. The realisable value of the property, plant and equipment is the
higher between the net sales price and the value in use. In defining the value of use, the expected
future cash flows are discounted using a pre-tax discount rate that reflects the current market
assessment of the time value of money and the specific risks of the activity. Losses in value are
charged to the income statement under amortisation, depreciation and write-down costs. Such
losses are restated when the reasons for their write-down no longer exist.
At the moment of the sale, or when there are no expected future economic benefits from the use
of an asset, this is eliminated from the financial statements and any loss or gain (calculated as the
difference between the disposal value and the book value) is recorded in the income statement in
the year of the above-mentioned elimination.
GOODWILL
Business combinations are recorded using the purchase method. Goodwill represents the surplus
of acquisition cost compared to the purchaser’s share of the identifiable net fair value of the assets
and liabilities acquired, current and potential. After initial recognition, goodwill is reduced by any
accumulated losses in value, calculated with the methods described below.
Goodwill deriving from acquisitions prior to January 1, 2004 are recorded at replacement cost,
equal to the value recorded in the last financial statements prepared in accordance with the previous
accounting standards (December 31, 2003). In the preparation of the opening financial statements
in accordance with international accounting standards the acquisitions before January 1, 2004 were
not reconsidered.
Goodwill is subject to a recoverability analysis conducted annually or at shorter intervals in case of
events or changes that could result in possible losses in value. Any goodwill emerging at the
acquisition date is allocated to each cash-generating unit which is expected to benefit from the
synergies of the acquisition. Any loss in value is identified by means of valuations based on the
ability of each cash-generating unit to produce cash flows for purposes of recovering the part of
goodwill allocated to it; these valuations are conducted with the methods described in the section
referring to tangible assets. If the recoverable value of the cash-generating unit is less than the
attributed book value, the loss in value is recorded.
This loss is not restated if the reasons for the loss no longer exist.

TAMBURI INVESTMENT PARTNERS GROUP
Page 30
OTHER INTANIGIBLE ASSETS
Other intangible assets are recorded at cost, in accordance with the procedures indicated for
tangible fixed assets.
The intangible assets with definite useful lives are recognised net of the relative accumulated
amortisation and any permanent impairment in value, determined in the same manner as that for
tangible assets.
Useful life is reviewed annually and any changes required are applied prospectively.
The gains and losses deriving from the disposal of intangible assets are determined as the difference
between the value of disposal and the carrying value of the asset and are recorded in the income
statement at the moment of the disposal.
LEASING
A leasing contract assigns to an entity the right to use an asset for a set period of time in exchange
for consideration. For the lessee, at accounting level there is no distinction between finance and
operating leases, with both applying a common accounting model to record leases. According to
this model, the company recognises to its balance sheet an asset, representing the relative right-of-
use, and a liability, representing the obligation to make contractually agreed payments, for all leases
with a duration of greater than twelve months whose value is not considered insignificant, while in
the income statement recording depreciation of the asset recognised and separately the interest on
the payable recorded. Rent reductions associated with Covid-19 are accounted for, without having
to assess through contract analysis whether the definition of lease modification in IFRS 16 is met,
directly in the income statement at the effective date of the reduction.
ASSOCIATED COMPANIES MEASURED UNDER THE EQUITY METHOD
Associated companies are companies in which the Group exercises a significant influence on the
financial and operating policies, although not having control. Significant influence is presumed
when between 20% and 50% of voting rights is held in another entity.
Investments in associated companies are measured under the equity method and initially recorded
at cost. The investments include the goodwill identified on acquisition, less any cumulative loss in
value. When there is objective evidence of an impairment, recovery of the value recognised is
verified by comparing the book value with the relative recoverable value, with any difference being
recognised through profit or loss. The consolidated financial statements include the share of profits
and losses of the investees measured under the equity method, net of any adjustments necessary to
align accounting principles and eliminate intercompany margins not realised, on the date in which
significant influence commences or the joint control until the date such influence or control ceases.
The adjustments necessary for the elimination of intercompany margins not realised are recorded
in the account “share of profits/loss of investments under equity”. When the share of the loss of
an investment measured under the equity method exceeds the book value of the investee, the
investment is written-down and the share of the further losses are not recorded except in the cases
where there is a legal or implied contractual obligation or where payments were made on behalf of
the investee.

TAMBURI INVESTMENT PARTNERS GROUP
Page 31
When a company becomes an associated company in a series of stages, the cost of the investment
is measured as the sum of the fair value of the interests previously held and the fair value of the
considerations paid as at the date on which the investment becomes an associated company. The
effect of remeasurement of the book value of the shares held previously is recognised in the same
way as for the case in which the investment is sold. Therefore, as significant influence was found
to exist, the greater accumulated fair value, taken to the OCI reserve, is reclassified to retained
earnings in equity. INVESTMENTS MEASURED AT FVOCI
For the investments in equity, comprising generally investments with shareholdings below 20%
which are not held for trading, according to the option under IFRS 9, they are recognised recording
the changes in the fair value through Other Comprehensive Income (FVOCI) and therefore with
counter-entry to an equity reserve. The FVOCI accounting of the investments in equity provides
for, on sale, the reversal from the fair value reserve matured directly to other equity reserves. The
dividends received from the investments are therefore recognised through profit or loss.
The fair value is identified in the case of listed investments with the stock exchange price at the
balance sheet date and in the case of investments in non-listed companies utilising valuation
techniques. These valuation techniques include the comparison with the values taken from similar
recent operations and other valuation techniques which are substantially based on the analysis of
the capacity of the investee to produce future cash flows, discounted to reflect the time value of
money and the specific risks of the activities undertaken.
The investments in equity instruments which do not have a listed price on a regulated market and
whose fair value cannot be reasonably valued, are measured at cost, reduced by any loss in value.
The choice between the above-mentioned methods is not optional, as these must be applied in
hierarchal order: absolute priority is given to official prices available on active markets (effective
market quotes – level 1) or for assets and liabilities measured based on valuation techniques which
take into account observable market parameters (comparable approaches – level 2) and the lowest
priority to assets and liability whose fair value is calculated based on valuation techniques which
take as reference non-observable parameters on the market and therefore more discretional (market
model – level 3).
FINANCIAL RECEIVABLES MEASURED AT AMORTISED COST
These concern financial assets acquired by the company with the intention of maintaining them
until maturity in order to receive the relative interest, and any sales are incidental events. These
financial assets are valued at amortised cost.
FINANCIAL ASSETS MEASURED AT FVTPL
The financial assets, generally convertible loans, which generate cash flows which provide for the
allocation of shares and/or include implied derivatives relating to the conversion clauses, are
measured at fair value with the relative changes recognised to the income statement.
Equity investments made for the purpose of making temporary use of liquidity are measured at fair
value through profit or loss.

TAMBURI INVESTMENT PARTNERS GROUP
Page 32
DERIVATIVE INSTRUMENTS
The derivative instruments not embedded in other financial instruments are measured at fair value
through profit or loss.
CURRENT FINANCIAL ASSETS MEASURED AT FVOCI
The current financial assets measured at FVOCI are non-derivative financial assets comprising
investments in bond securities which constitute temporary liquidity investments realised in
accordance with the business model which provides for the receipt of the relative cash flows and
the sale of the bonds on an opportunistic basis. The cash flows from these financial instruments
comprise solely principal and interest.
They are measured at FVOCI, recognising to an equity reserve the fair value changes in the
securities until the date of sale and recording in the income statement interest income and any
impairments. At the time of sale, the gains/losses are recognised through profit or loss with reversal
of the fair value changes through profit or loss previously recognised in the equity reserve.
The purchases and sales of securities are recorded and cancelled at the settlement date.
TRADE RECEIVABLES
Receivables are recorded at fair value and subsequently measured at amortised cost. They are
adjustments for sums considered uncollectible.
CASH AND CASH EQUIVALENTS
Cash and cash equivalents include those values which are available on demand at short notice
(within three months), certain in nature and with no payment expenses. Financial operations are
recorded at the settlement date.
For the purposes of the Statement of Cash Flows, available liquidity is represented by cash and
cash equivalents less bank overdrafts at the balance sheet date.
TRADE AND FINANCIAL PAYABLES
Trade payables are initially recorded at fair value and subsequently measured at amortised cost.
The financial liabilities are recorded at amortised cost using the effective interest rate method.
EMPLOYEES BENEFITS
The benefits guaranteed to employees paid on the termination of employment or thereafter through
defined benefit plans are recognised in the period the right matures. The liability for defined benefit
plans, net of any plan assets, is calculated on the basis of actuarial assumptions and is recorded by
the accrual method consistent with the years of employment necessary to obtain such benefits. The
liability is calculated by independent actuaries.
The Company recognises additional benefits to a number of employees through the incentive plans.
A stock option plan and a performance shares plan are currently in place.

TAMBURI INVESTMENT PARTNERS GROUP
Page 33
According to IFRS 2 – Share-based payments, these plans are a component of the remuneration
of the beneficiaries and provide for application of the “equity settlement” method. Therefore, the
relative cost is represented by the fair value of the financial instruments attributed at the grant date,
and is recognised in the income statement over the period between the grant date and the maturity
date, and directly recorded under equity. A portion of the plan was executed as a cash settlement
in accordance with the regulations, and the relative cost, represented by the consideration paid, was
recognised in the income statement over the period between the grant date and the maturity date,
and as a reduction to cash and cash equivalents.
On the exercise of the “equity settled” options by the beneficiaries with the transfer of treasury
shares against the liquidity received, the stock option plan reserve is reversed for the portion
attributable to the options exercised, and the treasury shares reserve is reversed based on the
average cost of the shares transferred and the residual differential is recorded as the gains/loss on
treasury shares traded with counter-entry in the share premium reserve, in accordance with the
accounting policy adopted.
Similarly, at the time of the transfer of treasury shares corresponding to the performance shares
matured, the performance shares plan reserve is reversed for the portion concerning the units
exercised and therefore the shares transferred. The treasury shares reserve is reversed based on the
average cost of the shares transferred and the residual differential is recorded as the gains/loss on
treasury shares traded with counter-entry in the share premium reserve, in accordance with the
accounting policy adopted.
TREASURY SHARES
The treasury shares held by the parent company are recorded as a reduction from equity in the
negative treasury shares reserve. The original cost of the treasury shares and the income deriving
from any subsequent sale are recognised as equity movements, recording the differential as the
gains/loss on treasury shares traded with counter-entry in the share premium reserve, in accordance
with the accounting policy adopted
REVENUES
Revenues are recognised when the customer acquires control of the services provided and,
consequently, when having the capacity to direct usage and obtain benefits. In the case in which a
contract stipulates a portion of consideration dependent on the occurrence of future events, the
estimate of the variable part is included in revenues only where such is considered highly probable.
In the case of transactions concerning the simultaneous provision of a number of services, the sales
price is allocated on the basis of the price which the company would apply to customers where
such services included in the contract were sold individually. According to this type of operation,
the revenues are recognised on the basis of the specific criteria indicated below:
- the revenues for advisory/investment banking services are recognised with reference to the
stage of completion of the activities. For practical purposes, when services are performed by
an indeterminate number of acts over a specified period of time, revenue is recognised on a
straight-line basis over the specified period unless there is evidence that some other method
better represents the stage of completion.

TAMBURI INVESTMENT PARTNERS GROUP
Page 34
- the success fees which mature on the exercise of a significant deed are recorded under revenues
when the significant deed is completed;
- the variable revenue components for the provision of services other than success fees are
recognised on the basis of the state of completion, to the extent that it is highly probable that
subsequent to the resolution of the uncertainty related to the variable consideration a significant
reduction of the amount of cumulative revenues recorded does not occur.
Where it is not possible to reliably determine the value of revenues, they are recognised up to the
costs incurred which may reasonably be recovered.
GAINS AND LOSSES DERIVING FROM THE SALE OF SECURITIES
The income and charges deriving from the sale of shares classified under current financial assets
measured at FVOCI are recorded on an accruals basis at the operation valuation date, recording
changes in fair value to the income statement which were previously recognised through equity.
FINANCIAL INCOME AND CHARGES
Financial income and charges are recorded on an accruals basis on the interest matured on the net
value of the relative financial assets and liabilities and utilising the effective interest rate.
DIVIDENDS
The dividends are recorded in the year in which the right of the shareholders to receive the payment
arises. The dividends received from investments valued under the equity method were recorded as
a reduction in the value of the investments.
INCOME TAXES
Current income taxes for the period are determined based on an estimate of the taxable assessable
income and in accordance with current legislation. Deferred tax assets and liabilities are calculated
on temporary differences between the values recorded in the financial statements and the
corresponding values recognised for fiscal purposes. The recognition of deferred tax assets is made
when their recovery is probable - that is when it is expected that there will be future assessable
fiscal income sufficient to recover the asset. The recovery of the deferred tax asset is reviewed at
each balance sheet date. Deferred tax liabilities are always recorded in accordance with the
provisions of IAS 12.
(3) Presentation
The choices adopted by the Group relating to the presentation of the consolidated financial
statements are illustrated below:
- income statement and comprehensive income statement: IAS requires alternatively
classification based on the nature or destination of the items. The Group decided to utilise the
presentation of the accounts by nature of expenses;
- statement of financial position: in accordance with IAS 1, the assets and liabilities should be
classified as current or non-current or, alternatively, according to the liquidity order. The Group
chose the classification criteria of current and non-current;
- statement of changes in consolidated shareholders’ equity, prepared in accordance with IAS 1;

TAMBURI INVESTMENT PARTNERS GROUP
Page 35
- statement of cash flows: in accordance with IAS 7 the statement of cash flows reports cash
flows during the period classified by operating, investing and financing activities, based on the
indirect method. (4) Segment disclosure
The company undertakes investment banking and merchant banking activities. Top management
activity in the above-mentioned areas, both at marketing contact level and institutional initiatives
and direct involvement in the various deals, is highly integrated. In addition, execution activity is
also organised with the objective to render the “on-call” commitment of advisory or equity
professional staff more flexible.
In relation to this choice it is almost impossible to provide a clear representation of the separate
financial economic impact of the different areas of activity, as the breakdown of the personnel costs
of top management and other employees on the basis of a series of estimates related to parameters
which could be subsequently superseded by the actual operational activities would result in an
extremely high distortion of the level of profitability of the segments of activity.
In the present condensed consolidated half-year financial statements only the details of the
performance of the “revenues from sales and services” component are provided, related to the sole
activity of advisory, excluding therefore the account “other revenues”.
Euro Six months
period ended June 30, 2021
Six months period ended June 30,
2020
Revenue from sales and services 3,328,727 2,603,300
Total 3,328,727 2,603,300
Revenues are highly dependent on the timing of success fee maturation, whose distribution varies
throughout the year.
(5) Purchases, service and other costs
The account comprises:
Euro Six months period ended June 30, 2021
Six months period ended June 30, 2020
1. Services 2,871,118 867,166 3. Other charges 491,049 320,231
Total 3,362,167 1,187,396
Service costs mainly relate to banking commissions on the sale of listed shares, general and
commercial expenses and professional and legal consultancy. They include Euro 54,059 of audit
fees and Euro 69,083 of emoluments of the Board of Statutory Auditors and the Supervisory Board.
The increase in service costs on the previous period is mainly due to the commissions recognised
by Clubtre in relation to the sale of Prysmian shares through an Accelerated BookBuilding
procedure.
Other charges principally include non-deductible VAT and stamp duties.

TAMBURI INVESTMENT PARTNERS GROUP
Page 36
(6) Personnel expense The account comprises:
Euro Six months period ended June 30, 2021
Six months period ended June 30, 2020
Wages and salaries 2,553,915 418,503
Social security expenses 313,702 197,894
Directors’ fees 37,428,577 1,029,446
Post-employment benefits 37,860 30,214 Other personnel costs 3,280 1,760,491
Total 40,337,334 3,436,549
Personnel expenses, in the items “Wages and salaries” and “Directors’ fees”, include a charge of
Euro 19,616,456 for the assignment in March of 3,500,000 options under the “TIP 2014-2021
Incentive Plan” stock option plan, approved by the Shareholders’ Meeting of the company on April
9, 2014 and partially amended on April 29, 2016. The options granted were exercised in their
entirety by June 30, 2021, partially by way of cash settlement.
It includes also Euro 1,749,993 of pro-rata charges with regards to the granting in the second half
of 2019 of 2,500,000 Units of the “2019-2021 TIP Performance Shares Plan”. In line with IFRS 2,
the Units allocated were measured according to the equity settlement method.
The variable charges for directors are in line, as always, with the pro-forma performances of the
company.
“Post-employments benefits” are updated based on actuarial valuations, with the actuarial gains or
losses recognised through equity.
The Chairman/CEO and Vice Chairman/CEO are not employees either of TIP or of Group
companies.
At June 30, 2021, the number of TIP employees was as follows: Six months period
ended June 30, 2021 Six months period
ended June 30, 2020
White collar & apprentices 7 8 Managers 1 1 Executives 4 4
Total 12 13
(7) Financial income/(charges)
The account comprises: Euro Six months period
ended June 30, 2021 Six months period
ended June 30, 2020
1. Investment income 9,254,533 3,437,559
2. Other income 9,528,171 11,615,762
Total financial income 18,782,704 15,053,321 3. Interest and other financial charges (9,057,144) (9,423,488)
Total financial charges (9,057,144) (9,423,488)
Net financial income 9,725,560 5,629,833

TAMBURI INVESTMENT PARTNERS GROUP
Page 37
(7).1. Investment income
Euro Six months period
ended June 30, 2021 Six months period
ended June 30, 2020
Dividends 9,254,533 3,437,559
Total 9,254,533 3,437,559
First half 2021 investment income concerns dividends received from the following investees
(Euro): FCA N.V. 2,668,000
Prysmian S.p.A. 1,184,592
Stellantis N.V. 1,749,646
Amplifon S.p.A. 1,624,633 Moncler S.p.A. 922,500 Other companies 1,105,163
Total 9,254,533
(7).2. Other income
This mainly include interest income and gains on bonds for Euro 4,148,066, fair value changes on
available-for-sale listed share investments for Euro 2,270,181, interest income from loans and bank
interest for Euro 170,869, fair value changes of derivative instruments for Euro 1,385,633, in
addition to exchange gains of Euro 1,553,422. (7).3. Interest and other financial charges
Euro Six months period ended June 30, 2021
Six months period ended June 30, 2020
Interest on bonds 3,829,837 5,288,053
Other 5,227,307 4,135,435
Total 9,057,144 9,423,488
“Interest on bonds” refers for Euro 3,829,837 to the 2019-2024 TIP Bond of Euro 300 million
calculated in accordance with the amortised cost method applying the effective interest rate.
The “Other” account includes changes to the value of derivative instruments for Euro 2,300,652,
losses on bonds for Euro 2,003,720, bank interest on loans for Euro 800,073 and other financial
charges and exchange losses.
(8) Share of profit/(loss) of associated companies measured under the equity method
The share of profit/(loss) of associated companies, totalling a profit of approximately Euro 27.2
million, includes, in addition to the profits of the investee companies IPGH (Interpump), ITH
(SeSa), Be and others, the profit of OVS S.p.A. in the last quarter of FY 20/21, including a
significant benefit on income taxes from the fiscal realignment, the net loss of Alpitour S.p.A. and
the second quarter results of Beta Utensili S.p.A. and Sant’Agata S.p.A.
The result of the associated companies benefitted from the positive accounting effects from the
change in the holdings through capital increases, which resulted in the recognition of total income
of Euro 1.6 million, equal to the difference between the fair value of the consideration received
and the carrying amount of the share sold and the positive effects, for Euro 3.7 million, of the fair
value measurement of the holding in TIPO already held at the point of obtaining control.

TAMBURI INVESTMENT PARTNERS GROUP
Page 38
For further details, reference should be made to note 12 “Investments in associated companies
measured under the equity method”.
(9) Current and deferred taxes The breakdown of income taxes is as follows:
Euro
Six months period
ended June 30, 2021
Six months period ended
June 30, 2020
Current taxes (3,171,877) (193,384) Prepaid taxes 979,840 (675,289) Deferred taxes 11,189,277 299,193
Total 8,997,240 (569,480)
Deferred taxes recognised directly to equity
The company recognised directly to equity a decrease of Euro 1,025,901, principally concerning
the increase in deferred taxes relating to the fair value of investments measured at OCI. (10) Goodwill and other intangible assets
“Goodwill” for Euro 9,806,574 refers to the incorporation of the subsidiary Tamburi & Associati
S.p.A. into TIP S.p.A. in 2007.
At June 30, 2021, in view of the income already received and that forecast for the second half of
2021, no indications arose that the goodwill had incurred a loss in value and therefore it was not
necessary to carry out an impairment test.
(11) Investments measured at FVOCI
The account refers to minority investments in listed and non-listed companies. Euro June 30, 2021 December 31, 2020
Investments in listed companies 607,713,878 814,441,270 Investments in non-listed companies 95,340,617 65,718,270
Total 703,054,495 880,159,540
The changes in the investments measured at FVOCI are shown in Attachment 1.
The composition of the valuation methods of the investments measured at FVOCI relating to
investments in listed and non-listed companies is illustrated in the table below:
Method
Listed companies
(% of total)
Non-listed companies
(% of total)
Listed prices on active markets (level 1) 100% 0.0%
Valuation models based on market inputs (level 2) 0.0% 76.0%
Other valuation techniques (level 3) 0.0% 23.8%
Purchase cost 0.0% 0.2%
Total 100.0% 100.0%
In line with ESMA’s recommendations, the outbreak of the pandemic and the effects of the
consequent lockdown were taken into consideration as indicators of impairment. The valuations
of the non-listed companies were calculated considering the development of alternative scenarios,
as suggested by the recent ESMA measurement recommendations for the interim financial
statements.

TAMBURI INVESTMENT PARTNERS GROUP
Page 39
The TIP Group holds at June 30, 2021 investments (Digital Magics S.p.A., Eataly S.p.A., Buzzoole
S.p.A.) not classified as associated companies, although in the presence of a holding above 20%
and/or some indicators which would be associated with significant influence, as unable to provide
periodic financial information such as to permit the TIP Group recognition in accordance with the
equity method. The unavailability of such information represents a limitation in the exercise of
significant influence and consequently it was considered appropriate to qualify these investments
as measured at FVOCI.
(12) Associated companies measured under the equity method
The other investments in associated companies concern:
- for Euro 109,946,770 the associated company Beta Utensili S.p.A.;
- for Euro 106,937,004 the investment in Gruppo IPG Holding S.p.A. (company which holds
the relative majority shareholding in Interpump Group S.p.A.);
- for Euro 103,889,188 the associated company OVS S.p.A.;
- for Euro 73,018,454 the company Roche Bobois S.A., held 34.84% through TXR S.r.l., listed
on the stock market since July 2018;
- for Euro 62,503,843 to the associated company ITH S.p.A., the parent company of Sesa S.p.A.;
- for Euro 52,420,923 the associated company Saint Agatha S.p.A.;
- for Euro 51,492,863 the company Asset Italia S.p.A., investment holding which gives
shareholders the opportunity to choose for each proposal their individual investments. The
equity and results relating to Asset Italia 1 S.r.l., vehicle company for the investment in
Alpitour, refer for 99% to the tracking shares issued in favour of the shareholders which
subscribed to the initiative and for 1% to Asset Italia, or rather to all the ordinary shares. TIP’s
share of the shares tracking the investment in Alpitour is equal to 35.81%. The investment in
Alpitour is measured in Asset Italia using the equity method.
- for Euro 50,033,752 the company Clubitaly S.p.A., with a 19.8% stake in Eataly S.r.l.. The
investment of Clubitaly S.p.A. in Eataly S.p.A. is measured at fair value in that the absence of
the necessary financial information for the application of the equity method determines the
current limited exercise of significant influence;
- for Euro 41,401,136 the associated company Elica S.p.A.;
- for Euro 26,630,512 the associated company BE S.p.A.;
Euro June 30, 2021 December 31, 2020
Asset Italia S.p.A. 51,492,863 66,513,888 Asset Italia 2 S.r.l. 0 66,264 BE Think, Solve, Execute S.p.A. 26,630,512 24,981,029 Beta Utensili S.p.A. 109,946,770 0 Clubitaly S.p.A. 50,033,752 50,047,594 Elica S.p.A. 41,401,136 39,954,856 Gruppo IPG Holding S.p.A. 106,937,004 97,849,060 Itaca Equity Holding S.p.A. 2,914,996 0 Itaca Equity S.r.l. 925,402 0 ITH S.p.A. 62,503,843 59,727,137 OVS S.p.A. 103,889,188 85,239,484 Roche Bobois S.A. 73,018,454 74,738,527 Sant’Agata S.p.A. 52,420,923 0 TIP -Pre IPO S.p.A. 0 26,374,834 Other associated companies 663,432 663,432
Total 682,778,275 526,156,105

TAMBURI INVESTMENT PARTNERS GROUP
Page 40
- for Euro 2,914,996 the associated company Itaca Equity Holding S.p.A.;
- for Euro 925,402 the associated company Itaca Equity S.r.l.;
- for Euro 663,432 the investments in the companies Palazzari & Turries Limited, with
registered office in Hong Kong and in Gatti & Co Gmbh, with registered office in Frankfurt;
The main changes in the period concern for approximately Euro 2.5 million the investment in
ITACA, income and shares of the result for approximately Euro 27.2 million, commented upon in
note 8, and a positive change in the OCI reserve for approximately Euro 4.6 million. In addition,
the TIPO/Beta transaction resulted in increases for purchases and changes to the consolidation
scope for Euro 161.1 million. The changes in the associated company investments are shown in
Attachment 2.
In line with the ESMA recommendations, the outbreak of the pandemic and the consequent
lockdown were taken into consideration also as indicators of the potential impairment of the
goodwill incorporated into the valuations through the equity method of the associated companies
and the investees. Also in this case, analyses were undertaken considering the development of
alternative scenarios, as suggested by the recent ESMA recommendations concerning
measurements for the 2021 interim financial statements. The result of the impairment tests carried
out did not identify write-downs as the recoverable amount was higher than the carrying amount.
(13) Financial receivables measured at amortised cost Euro June 30, 2021 December 31, 2020
Financial receivables measured at amortised cost 6,755,251 3,611,418
Total 6,755,251 3,611,418
Financial receivables calculated at amortised cost principally concern for Euro 3,227,512 the loans
issued to Tefindue S.p.A., which holds indirectly a shareholding in Octo Telematics S.p.A. and for
Euro 2,502,397 the bond loan subscribed in June 2021 from DV Holding S.p.A.
(14) Financial assets measured at FVTPL Euro June 30, 2021 December 31, 2020
Financial assets measured at FVTPL 2,959,829 2,883,243
Total 2,955,829 2,883,243
Financial assets measured at FVTPL consist mainly of the convertible bond issued by Tefindue
S.p.A.
(15) Trade receivables
Euro June 30, 2021 December 31, 2020
Trade receivables (before doubtful debt provision) 588,678 1,616,915 Doubtful debt provision (167,809) (167,809)
Total 420,869 1,449,106
Trade receivables to clients beyond 12 months 0 0
Changes in trade receivables is strictly related to the different revenue mix between success fees
and service revenues.
(16) Derivative instruments
Derivative instruments comprise for Euro 4,362,819 the option to purchase ITH S.p.A. shares and

TAMBURI INVESTMENT PARTNERS GROUP
Page 41
for Euro 1,830,480 EFT instruments.
(17) Current financial assets measured at FVOCI Euro June 30, 2021 December 31, 2020
Current financial assets measured at FVOCI 153,160,783 179,859,731
Total 153,160,783 179,859,731
The accounts concerns non-derivative financial assets comprising investments in bonds and
securities in euros and dollars for the temporary utilisation of liquidity. A number of securities,
totalling Euro 25.5 million, are pledged as guarantee for a loan.
(18) Current financial assets measured at FVTPL Euro June 30, 2021 December 31, 2020
Current financial assets measured at FVTPL 8,701,912 0
Total 8,701,912 0
Current financial assets measured at FVTPL concern the listed shares available-for-sale as
temporary uses of liquidity.
(19) Cash and cash equivalents
The account represents the balance of banks deposits determined by the nominal value of the
current accounts with credit institutions.
Euro June 30, 2021 December 31, 2020
Bank deposits 10,217,002 3,245,830
Cash in hand and similar 4,019 4,665
Total 10,221,021 3,250,495
The composition of the net financial position at June 30, 2021 compared with December 31, 2020
is illustrated in the table below.
Euro June 30, 2021 December 31, 2020
A Cash and cash equivalents 10,221,021 3,250,495
B Current financial assets measured at FVOCI 153,160,783 179,857,731
C Current financial receivables & derivative instruments 6,193,299 5,575,577
D Current financial assets measured at FVTPL 8,701,912 0
E Liquidity (A+B+C+D)
178,277,015
188,683,803
F Non-current financial payables (373,067,743) (451,403,080)
G Non-current financial payables for leasing (2,305,767) (2,305,767)
H Liabilities for derivatives (1,834,238) (285,846)
I Current financial liabilities for leasing (203,337) (321,574)
L Current financial liabilities (69,957,062) (70,695,363)
M Net financial position (E+F+G+H+I+L) (269,091,132) (336,327,827)
The change for the period is essentially due to the income in Clubtre for the Prysmian shares, offset
by investments for the period, mainly related to the TIPO/Beta transaction and the purchase to
achieve all of Clubtre’s share capital.

TAMBURI INVESTMENT PARTNERS GROUP
Page 42
(20) Tax receivables The breakdown is as follows:
Euro June 30, 2021 December 31, 2020
Within one year 1,679,233 2,295,841
Beyond one year 313,768 299,730
Current tax receivables mainly include withholding tax as well as IRES receivables arising from tax returns. The non-current component principally concerns withholding taxes and IRAP reimbursement request. (21) Deferred tax assets and liabilities The breakdown of the account at June 30, 2021 and December 31, 2020 is detailed below: Assets Liabilities Net
Euro 30/6/2021 31/12/2020 30/6/2021 31/12/2020 30/6/2021 31/12/2020
Other intangible assets 95 822 0 0 95 822 Investments measured at FVOCI and investments measured under the equity method
0 0 (8,951,367) (18,712,977) (8,951,367) (18,712,977)
Other assets/liabilities 6,230,927 5,480,105 (332,321) (40,312) 5,898,606 5,439,793
Total 6,231,022 5,480,927 (9,283,688) (18,753,288) (3,052,666) (13,272,362)
The changes in the tax assets and liabilities were as follows:
Euro
December 31,
2020
Recorded through
P&L
Recorded through Equity
Other changes June 30, 2021
Other intangible assets 822 (727) 0 0 95 Investments measured at FVOCI and investments measured under the equity method
(18,712,977) 11,481,286 (1,004,536) (715,140) (8,951,367)
Other assets/liabilities 5,439,793 688,559 (21,365) (208,381) 5,898,606
Total (13,272,362) 12,169,117 (1,025,901) (923,521) (3,052,666)
(22) Share capital
The share capital of TIP S.p.A. is composed of:
Shares Number
ordinary shares 184,379,301
Total 184,379,301
The share capital of TIP S.p.A. amounts to Euro 95,877,236.52, represented by 184,379,301
ordinary shares.
At June 30, 2021, treasury shares in portfolio totalled 15,076,249, equal to 8.177% of the share
capital. The shares in circulation at June 30, 2021 numbered therefore 169,303,052.
No. treasury shares at
January 1, 2021 No. of shares acquired
at June 30, 2021 No. of shares sold at
June 30, 2021 No. treasury shares at
June 30, 2021
16,131,801 1,016,948 2,072,500 15,076,249
The following additional disclosures is provided on the shareholders’ equity at June 30, 2021.

TAMBURI INVESTMENT PARTNERS GROUP
Page 43
(23) Reserves
Share premium reserve
The account amounts to Euro 272,298,170 and increased Euro 2,943,619 following the exercise of
the 2015-2021 stock options plan for employees and directors.
Legal reserve
This amounts to Euro 19,175,447, increasing Euro 1,287,163 following the Shareholders’ Meeting
motion of April 29, 2021 with regard to the allocation of the 2020 net profit.
Fair value OCI reserve without reversal to profit or loss
This positive reserve amounts to Euro 343,759,299. This concerns the fair value changes to
investments in equity, net of the relative deferred tax effect. The gains realised on partial
divestments of holdings which in application of IFRS 9 were not reversed to profit or loss were
reclassified from the reserve to retained earnings.
For a breakdown of the fair value changes of investments in equity, reference should be made to
attachment 1 and to note 11, in addition to note 12.
For the changes in the year and breakdown of other equity items, reference should be made to the
specific statement.
OCI reserve with reversal to profit or loss
This negative reserve amounts to Euro 2,026,024. These principally concern the fair value changes
of securities acquired as temporary uses of liquidity. The relative fair value was reversed to the
income statement on the sale of the underlying security.
Treasury shares acquisition reserve
This negative reserve amounts to Euro 86,919,587.
Other reserves
They are negative for Euro 1,787,954 and for Euro 5,501,359 comprise the incentive plan reserve
created following the allocation of options and performance shares to employees and directors
offset by the negative changes in the investments reserve measured under the equity method.
IFRS business combination reserve
The reserve was negative and amounts to Euro 483,655, unchanged compared to December 31,
2020.
Merger surplus
The merger surplus amounts to Euro 5,060,152 and derives from the incorporation of Secontip
S.p.A. into TIP S.p.A. on January 1, 2011.
Retained earnings
Retained earnings amount to Euro 427,693,769 and increased on December 31, 2020 following the
allocation of the 2020 net profit and the reclassification from the fair value OCI reserve without

TAMBURI INVESTMENT PARTNERS GROUP
Page 44
reversal to profit or loss of the gains realised on partial divestments of holdings not recognised to
profit or loss.
(24) Net Profit for the period Basic earnings per share The basic earnings per share in the first half of 2021 – net profit divided by the number of shares in circulation in the period taking into account treasury shares held – was Euro 0.04.
Diluted earnings per share
The diluted earnings per share in the first half of 2021 was Euro 0.04. This represents the net profit
for the period divided by the number of ordinary shares in circulation at June 30, 2021, calculated
taking into account the treasury shares held and considering any dilution effects generated from
the shares servicing the stock option plan.
(25) Post-employment benefit provisions
At June 30, 2021, the balance of the account related to the Post-Employment Benefit due to all
employees of the company at the end of employment service. The liability was updated based on
actuarial calculations.
(26) Derivative financial instruments
They refer to call options for the benefit of third parties on shares in associated companies
exercisable in 2023. They are measured at their fair value and any changes are written to the income
statement.
(27) Financial payables
Financial payables of Euro 373,067,743 refer to:
- for 285,887,563 the TIP 2019-2024 Bond placed in December 2019, of a nominal Euro
300,000,000. The loan, with an initial rights date of December 5, 2019 and expiry date of
December 5, 2024 was issued with a discount on the par value and offers an annual coupon at
the nominal gross fixed rate of 2.5%. The loan was recognised at amortised cost applying the
effective interest rate which takes into account the transaction costs incurred for the issue of
the bond and the bond repurchases made by the company;
- for Euro 64,890,418 a medium/long-term loan of a nominal value of Euro 65,000,000,
repayable on maturity of June 30, 2022, recognised to amortised cost applying an effective
interest rate which takes account of the settlement costs incurred to obtain the loan. The loan
provides for compliance with annual financial covenants;
- for Euro 20,000,000 a fixed-rate, medium/long-term loan repayable on maturity of June 12,
2026.
- for Euro 940,774 the long-term component of the deferred payment of the purchase price of
an investment.
- for Euro 1,348,988 the payable to TIPO S.p.A. shareholders following the acquisition of the
company’s shares. This amount is to be paid within 10 days of March 31, 2023, the date set as
the contractual deadline for the commitments undertaken for the sale of the iGuzzini S.p.A.
investment executed in March 2019.

TAMBURI INVESTMENT PARTNERS GROUP
Page 45
In January, the margin loan with BNL, for which Prysmian shares were pledged as a guarantee and
which totalled Euro 100 million, was paid in full ahead of schedule.
In accordance with the application of international accounting standards required by Consob
recommendation No. DEM 9017965 of February 26, 2009 and the Bank of Italy/Consob/Isvap
No. 4 of March 4, 2010, we report that this account does not include any exposure related to
covenants not complied with.
(28) Current financial liabilities
The current financial liabilities of Euro 69,957,062 mainly concern:
a) the relative interest matured on the TIP 2019-2024 bond for Euro 4,084,380;
b) for Euro 65,872,682 bank payables on current account lines. (29) Tax payables This item may be analysed as follows:
Euro June 30, 2021 December 31, 2020
IRES 2,929,067 0
VAT 0 15,886
Withholding taxes 254,558 104,351
Total 3,183,625 120,237
(30) Other liabilities
The account mainly refers to emoluments for directors and employees.
Euro June 30, 2021 December 31, 2020
Directors and employees 17,749,901 7,071,054 Social security institutions 196,935 156,152 Others 1,383,434 1,934,447
Total 19,330,270 9,161,653
The increase in payables to directors concerns the increase in the variable portion of remuneration
calculated on the pro-forma period results.
(31) Risks and uncertainties
Management of financial risks
The Group, by nature of its activities, is exposed to various types of financial risks - in particular
to the risk of changes in market prices of investments and, marginally, to the risk of interest rates.
The policies adopted by the Group for the management of the financial risk are illustrated below.

TAMBURI INVESTMENT PARTNERS GROUP
Page 46
Interest rate risk
The Group is exposed to the interest rate risk relating to the value of the current financial assets
represented by bonds and financial receivables. As these investments are mainly temporary uses of
liquidity which may be liquidated quickly, it was not considered necessary to adopt specific hedges.
Risk of change in the value of investments
The Group, by nature of its activities, is exposed to the risk of changes in the value of the
investments.
In relation to the listed investments at the present moment there is no efficient hedging instrument
of a portfolio such as those with the characteristics of the Group.
Relating to non-listed companies, the risks related:
(a) to the valuation of these investments, in consideration of: (i) absence in these companies
of control systems similar to those required for listed companies, with the consequent
unavailability of information at least equal to, under a quantitative and qualitative profile, of
those available for this later; (ii) the difficulties to undertake independent verifications in the
companies and, therefore to assess the completeness and accuracy of the information provided;
(b) the ability to impact upon the management of these investments and drive their growth, the
pre-requisite for investment, based on the Group’s relationships with management and
shareholders and, therefore, subject to verification and the development of these relationship;
(c) the liquidity of these investments, not negotiable on regulated markets;
were not hedged through specific derivative instruments as not available. The Group attempts to
minimise the risk – although within a merchant banking activity and therefore by definition risky –
through a careful analysis of the companies and sectors on entry into the share capital, as well as
through careful monitoring of the performance of the investee companies after entry in the share
capital.
A sensitivity analysis is reported below which illustrates the effects on the balance sheet, of a
hypothetical change in the fair value of the instruments held at June 30, 2021 of +/-5% compared
to the comparative figures for 2020.
Sensitivity Analysis June 30, 2021 December 31, 2020
Euro thousands -5.00% -5.00% -5.00% Basic 5.00%
Investments in listed companies 577,328 607,714 638,100 773,719 814,441 855,163
Investments in non-listed companies 90,574 95,341 100,108 62,432 65,718 69,004
Investments measured at FVOCI 667,902 703,055 738,208 836,151 880,159 924,167
Effect on net equity (35,153) 35,153 (44,008) 44,008
Credit risk
The Group’s exposure to the credit risk depends on the specific characteristics of each client as
well as the type of activities undertaken and in any case at the preparation date of the present
financial statements is not considered significant.
Before undertaking an assignment careful analysis is undertaken on the credit reliability of the client.

TAMBURI INVESTMENT PARTNERS GROUP
Page 47
Liquidity risk
The Group approach in the management of liquidity guarantees, where possible, that there are
always sufficient funds to meet current obligations.
At June 30, 2021, the Group had in place sufficient credit lines to cover the group’s financial needs.
Management of capital
The capital management policies of the Board of Directors provide for maintaining high levels of
own capital in order to maintain a relationship of trust with investors, allowing for future
development.
The parent company acquired treasury shares on the market on the basis of available prices.
Hierarchy of Fair Value as per IFRS 13
The classification of financial instruments at fair value in accordance with IFRS 13 is determined
based on the quality of the input sources used in the valuation, according to the following hierarchy:
▪ level 1: determination of fair value based on prices listed (“unadjusted”) in active markets
for identical assets or liabilities. This category includes the instruments in which the TIP
company operates directly in active markets (for example investments in listed companies,
listed bond securities etc.);
▪ level 2: determination of fair value based on inputs other than the listed prices included in
“level 1” but which are directly or indirectly observable (for example recent or comparable
prices);
▪ level 3: determination of fair value based on valuation models whose input is not based on
observable market data (“unobservable inputs”). These refer for example to valuations of
non-listed investments based on Discounted Cash Flow valuation methods.
In accordance with the disclosures required by IFRS 13, the types of financial instruments recorded
in the financial statement at June 30, 2021 are illustrated below with indication of the accounting
policies applied and, in the case of financial instruments measured at fair value, of the exposure to
changes in fair value (income statement or equity), specifying also the hierarchical level of fair value
attributed.
The final column of the following tables shows, where applicable, the fair value at the end of the
period of the financial instrument.
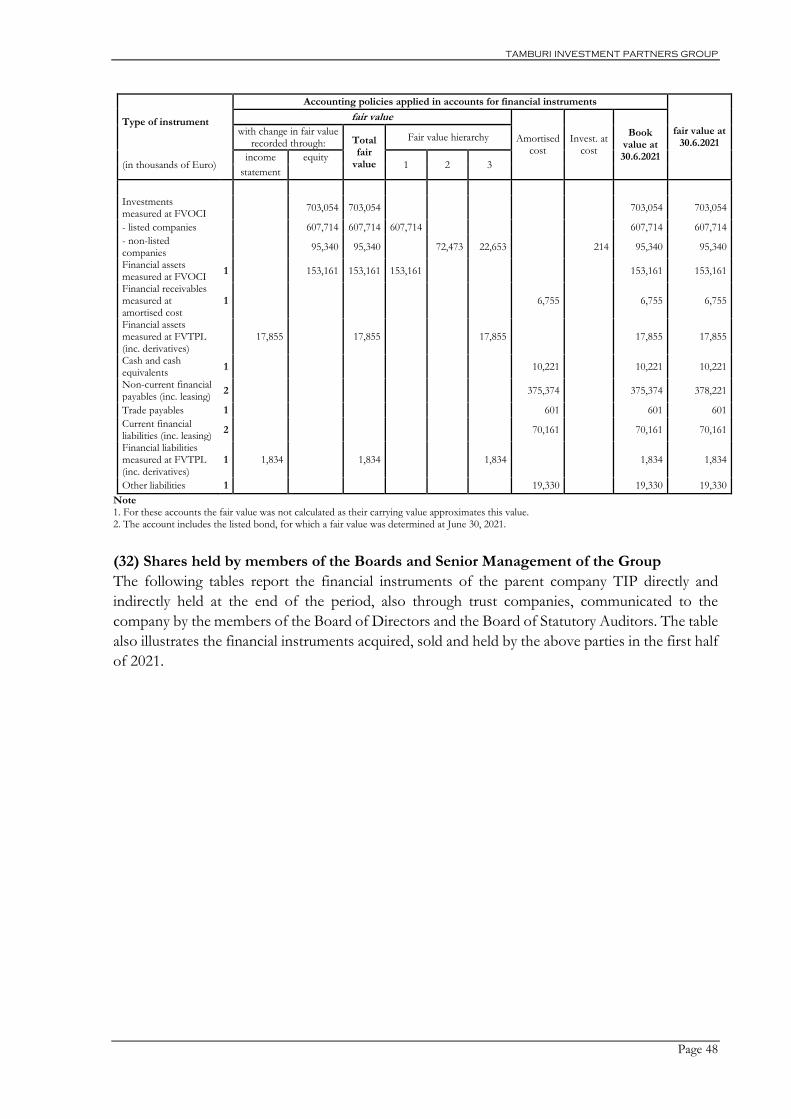
TAMBURI INVESTMENT PARTNERS GROUP
Page 48
Type of instrument
Accounting policies applied in accounts for financial instruments
fair value at 30.6.2021
fair value
Amortised cost
Invest. at cost
Book value at 30.6.2021
with change in fair value recorded through: Total
fair value
Fair value hierarchy
(in thousands of Euro) income equity
1 2 3 statement
Investments measured at FVOCI
703,054 703,054 703,054 703,054
- listed companies 607,714 607,714 607,714 607,714 607,714
- non-listed companies
95,340 95,340 72,473 22,653 214 95,340 95,340
Financial assets measured at FVOCI
1 153,161 153,161 153,161 153,161 153,161
Financial receivables measured at amortised cost
1 6,755 6,755 6,755
Financial assets measured at FVTPL (inc. derivatives)
17,855 17,855 17,855 17,855 17,855
Cash and cash equivalents
1 10,221 10,221 10,221
Non-current financial payables (inc. leasing)
2 375,374 375,374 378,221
Trade payables 1 601 601 601
Current financial liabilities (inc. leasing)
2 70,161 70,161 70,161
Financial liabilities measured at FVTPL (inc. derivatives)
1 1,834 1,834 1,834 1,834 1,834
Other liabilities 1 19,330 19,330 19,330
Note 1. For these accounts the fair value was not calculated as their carrying value approximates this value. 2. The account includes the listed bond, for which a fair value was determined at June 30, 2021.
(32) Shares held by members of the Boards and Senior Management of the Group
The following tables report the financial instruments of the parent company TIP directly and
indirectly held at the end of the period, also through trust companies, communicated to the
company by the members of the Board of Directors and the Board of Statutory Auditors. The table
also illustrates the financial instruments acquired, sold and held by the above parties in the first half
of 2021.

TAMBURI INVESTMENT PARTNERS GROUP
Page 49
Members of the Board of Directors
Name Office
No. of shares held at
December 31, 2020
No. of shares acquired in H1
2021
No. of shares sold in H1
2021
No. of shares held at June 30, 2021
Giovanni Tamburi(1) Chair. & CEO 13,475,331 850,000 14,325,331
Alessandra Gritti Vice Chair. & CEO
2,232,293 455,000 2,687,293
Cesare d’Amico(2) Vice Chairperson
19,910,000 19,910,000
Claudio Berretti Dir. & Gen. Manager
2,351,000 520,000
2,871,000
Alberto Capponi Director 0 0
Giuseppe Ferrero(3) Director 3,179,635 3,179,635
Manuela Mezzetti Director 0 0
Daniela Palestra Director 0 0
Paul Simon Schapira Director 10,000 10,000
(1) Giovanni Tamburi holds his investment in the share capital of TIP in part directly in his own name and in part indirectly through Lippiuno S.r.l.,
a company in which he holds 87.26% of the share capital. (2) Cesare d’Amico holds his investment in the share capital of TIP through d'Amico Società di Navigazione S.p.A. (a company in which he holds
directly and indirectly 50% of the share capital), through the company Fi.Pa. Finanziaria di Partecipazione S.p.A. (a company which directly holds 54% of the share capital) and through family members.
(3) Giuseppe Ferrero holds his investment in the share capital of TIP directly and through family members.
The members of the Board of Statutory Auditors do not hold shares or warrants of the company. (33) Remuneration of the Corporate Boards
The table below reports the monetary remuneration, expressed in Euro, to the members of the
boards in the first half of 2021.
TIP office Fees
30/06/2021
Directors 37,428,577
Statutory Auditors 36,400
The remuneration of the Supervisory Board is Euro 2,000.
TIP also signed two insurance policies with Chubb Insurance Company of Europe S.A.- D&O and
professional TPL - in favour of the Directors and Statutory Auditors of TIP, of the subsidiaries, as
well as the investees companies in which TIP has a Board representative and the General Managers
and coverage for damage to third parties in the exercise of their functions.
(34) Related party transactions
The table reports the related party transactions during the year outlined according to the amounts,
type and counterparties.

TAMBURI INVESTMENT PARTNERS GROUP
Page 50
The services offered for all the above listed parties were undertaken at contractual terms and
conditions in line with the market.
(35) Subsequent events With reference to the subsequent events, reference should be made to the Directors’ Report. (36) Corporate Governance
The TIP Group adopts the provisions of the Self-Governance Code in the new version published
by Borsa Italiana as its corporate governance model.
The Corporate Governance and Ownership Structure Report for the year is approved by the Board
of Directors and published annually on the website of the company www.tipspa.it, in the
“Corporate Governance” section.
On behalf of the Board of Directors
Executive Chairman Giovanni Tamburi
Milan, September 9, 2021
Party Type Payment / balance at
June 30, 2021
Payment / balance at
June 30, 2020
Asset Italia S.p.A. Revenues 502,050 502,050
Asset Italia S.p.A. Trade receivables 252,050 252,050
Asset Italia 1 S.r.l. Revenues 2,050 2,050
Asset Italia 1 S.r.l. Trade receivables 2,050 2,050
Asset Italia 2 S.r.l. Revenues . 2,050
Asset Italia 2 S.r.l. Trade receivables . 2,050
Betaclub S.r.l. Revenues 8,465 14,550
Betaclub S.r.l. Trade receivables 8,465 14,550
BE S.p.A. Revenues 30,000 30,000
BE S.p.A. Trade receivables 15,000 15,000
Clubitaly S.p.A. Revenues 17,050 17,050
Clubitaly S.p.A. Trade receivables 17,050 17,050
Gruppo IPG Holding S.p.A. Revenues 15,000 15,000
Gruppo IPG Holding S.p.A. Trade receivables 15,000 15,000
Itaca Equity Holding S.p.A. Revenues 5,000 .
Itaca Equity Holding S.p.A. Trade receivables 5,000 .
TIP-pre IPO S.p.A. Revenues 146,410 127,050
TIP-pre IPO S.p.A. Trade receivables 21,410 2,050
Services provided to companies related to the Board of Directors Revenues 690,924 .
Services provided to companies related to the Board of Directors Trade receivables 4,000 3,000
Services received by companies related to the Board of Directors Costs (services received) 8,059,547 477,231
Services received by companies related to the Board of Directors Trade payables 7,784,547 20,000

Page 51
ATTACHMENTS

Page 52
Declaration of the Executive Officer for Financial Reporting as per Article 81-ter of Consob
Regulation No. 11971 of May 14, 1999 and subsequent amendments and supplements.
1. The undersigned Alessandra Gritti, as Chief Executive Officer, and Claudio Berretti, as
Executive Officer for Financial Reporting of Tamburi Investment Partners S.p.A., affirm, and
also in consideration of Article 154-bis, paragraphs 3 and 4, of Legislative Decree No. 58 of
February 24, 1998:
▪ the adequacy considering the company’s characteristics and
▪ the effective application during the period of the condensed consolidated half-year
financial statements
of the administrative and accounting procedures for the condensed consolidated half-year
financial statements at June 30, 2021.
No significant aspect emerged concerning the above.
2. We also declare that:
a) the condensed consolidated half-year financial statements at June 30, 2021 correspond to
the underlying accounting documents and records;
b) the condensed consolidated half-year financial statements for the period June 30, 2021
were prepared in accordance with International Financial Reporting Standards (IFRS) and
the relative interpretations published by the International Accounting Standards Board
(IASB) and adopted by the European Commission with Regulation No. 1725/2003 and
subsequent modifications, in accordance with Regulation No. 1606/2002 of the European
Parliament and provides a true and correct representation of the results, balance sheet and
financial position of Tamburi Investment Partners S.p.A..
c) the directors’ report includes a reliable analysis of the significant events in the year and
their impact on the condensed consolidated half-year financial statements, together with
a description of the principal risks and uncertainties. The Directors’ Report also contains
a reliable analysis of the significant transactions with related parties.
The Chief Executive Officer The Executive Officer
Milan, September 9, 2021

TAMBURI INVESTMENT PARTNERS GROUP
53
Attachment 1 - Changes in investments measured at FVOCI
Euro historic fair value write-down book value acquisition or reclass. fair value decreases fair value reversal P/L movements book value
cost adjustments P&L fair value subscription increase decreases fair value 30/06/2021
Non-listed companies
Azimut Benetti S.p.A. 38,990,000 (7,312,229) 31,677,771 7,312,229 38,990,000
Bending Spoons S.p.A. 5,023,461 5,023,461 3,432,341 1,573,398 10,029,200
Buzzoole Plc. 5,392,122 (2,252,122) 3,140,000 (165,299) 2,974,701
Dv Holding S.p.A. 0 11,016,190 11,016,190
Heroes S..r.l. 2,506,673 10,361,992 12,868,665 12,868,665
Talent Garden S.p.A. 5,502,592 799,085 6,301,677 6,301,677
Vianova S.p.A. (già Welcome Italia S.p.A.) 5,850,971 5,850,971 6,186,890 12,037,861
Other equity instr. & other minor 955,724 855,724 400,000 (133,402) 1,122,322
Total non-listed companies 64,221,543 1,596,726 (100,000) 65,718,270 14,848,530 0 15,072,518 0 (298,701) 0 0 95,340,617
Listed companies No. of shares
Alkemy S.p.A. 425,000 4,993,828 (1,984,828) 3,009,000 3,323,500 6,332,500
Amplifon S.p.A. 7,384,697 60,713,803 190,661,283 251,375,086 56,123,697 307,498,783
Digital Magics S.p.A. 1,684,719 9,922,048 (3,520,116) 6,401,932 606,499 7,008,431
Fagerhult AB 796,889 2,643,670 832,280 130,599 3,606,549 7,477 1,813,663 (21,045) 5,406,644
Faurecia S.A. 24,692 0 1,145,464 (123,956) 1,021,508
Ferrari N.V. 22,500 0 3,617,109 297,891 3,915,000
Stellantis N.V. 1,450,000 17,783,734 3,473,266 21,257,000 2,746,300 24,003,300
Hugo Boss AG 1,080,000 80,298,115 (50,824,915) 29,473,200 20,034,000 49,507,200
Moncler S.p.A. 2,050,000 32,102,928 70,684,072 102,787,000 14,186,000 116,973,000
Prysmian S.p.A. 2,369,183 261,986,960 132,844,878 394,831,838 1,029,370 (216,271,771) (107,969,035) 71,620,402
Other listed companies 13,166,782 (2,261,956) (9,205,161) 1,699,665 11,228,167 1,526,879 (27,600) 14,427,110
Total listed companies 483,611,868 339,903,965 (9,074,562) 814,441,270 15,998,217 0 101,687,798 (216,271,771) (151,556) (107,969,035) (21,045) 607,713,878
Total investments 547,833,411 341,500,691 (9,174,562) 880,159,540 30,846,748 0 116,760,316 (216,271,771) (450,257) (107,969,035) (21,045) 703,054,495
Balance at 1.1.2021 increases decreases
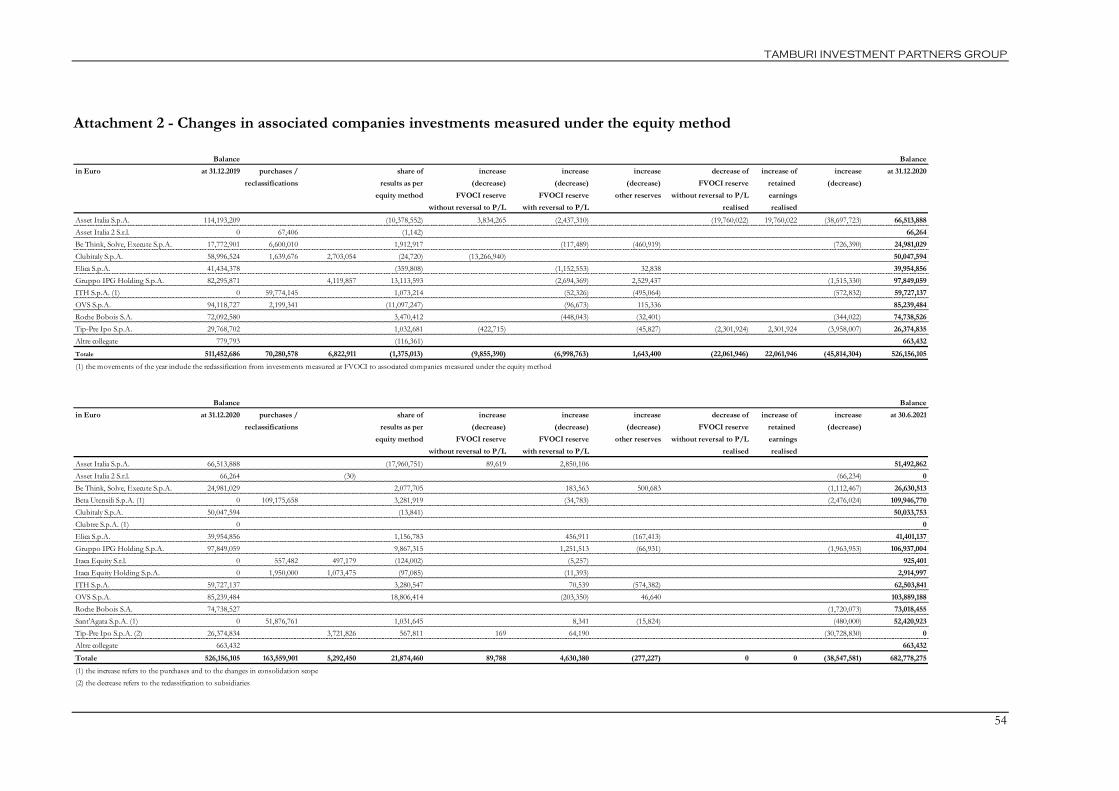
TAMBURI INVESTMENT PARTNERS GROUP
54
Attachment 2 - Changes in associated companies investments measured under the equity method
Balance Balance
in Euro at 31.12.2019 purchases / share of increase increase increase decrease of increase of increase at 31.12.2020
reclassifications results as per (decrease) (decrease) (decrease) FVOCI reserve retained (decrease)
equity method FVOCI reserve FVOCI reserve other reserves without reversal to P/L earnings
without reversal to P/L with reversal to P/L realised realised
Asset Italia S.p.A. 114,193,209 (10,378,552) 3,834,265 (2,437,310) (19,760,022) 19,760,022 (38,697,723) 66,513,888
Asset Italia 2 S.r.l. 0 67,406 (1,142) 66,264
Be Think, Solve, Execute S.p.A. 17,772,901 6,600,010 1,912,917 (117,489) (460,919) (726,390) 24,981,029
Clubitaly S.p.A. 58,996,524 1,639,676 2,703,054 (24,720) (13,266,940) 50,047,594
Elica S.p.A. 41,434,378 (359,808) (1,152,553) 32,838 39,954,856
Gruppo IPG Holding S.p.A. 82,295,871 4,119,857 13,113,593 (2,694,369) 2,529,437 (1,515,330) 97,849,059
ITH S.p.A. (1) 0 59,774,145 1,073,214 (52,326) (495,064) (572,832) 59,727,137
OVS S.p.A. 94,118,727 2,199,341 (11,097,247) (96,673) 115,336 85,239,484
Roche Bobois S.A. 72,092,580 3,470,412 (448,043) (32,401) (344,022) 74,738,526
Tip-Pre Ipo S.p.A. 29,768,702 1,032,681 (422,715) (45,827) (2,301,924) 2,301,924 (3,958,007) 26,374,835
Altre collegate 779,793 (116,361) 663,432
Totale 511,452,686 70,280,578 6,822,911 (1,375,013) (9,855,390) (6,998,763) 1,643,400 (22,061,946) 22,061,946 (45,814,304) 526,156,105
(1) the movements of the year include the reclassification from investments measured at FVOCI to associated companies measured under the equity method
Balance Balance
in Euro at 31.12.2020 purchases / share of increase increase increase decrease of increase of increase at 30.6.2021
reclassifications results as per (decrease) (decrease) (decrease) FVOCI reserve retained (decrease)
equity method FVOCI reserve FVOCI reserve other reserves without reversal to P/L earnings
without reversal to P/L with reversal to P/L realised realised
Asset Italia S.p.A. 66,513,888 (17,960,751) 89,619 2,850,106 51,492,862
Asset Italia 2 S.r.l. 66,264 (30) (66,234) 0
Be Think, Solve, Execute S.p.A. 24,981,029 2,077,705 183,563 500,683 (1,112,467) 26,630,513
Beta Utensili S.p.A. (1) 0 109,175,658 3,281,919 (34,783) (2,476,024) 109,946,770
Clubitaly S.p.A. 50,047,594 (13,841) 50,033,753
Clubtre S.p.A. (1) 0 0
Elica S.p.A. 39,954,856 1,156,783 456,911 (167,413) 41,401,137
Gruppo IPG Holding S.p.A. 97,849,059 9,867,315 1,251,513 (66,931) (1,963,953) 106,937,004
Itaca Equity S.r.l. 0 557,482 497,179 (124,002) (5,257) 925,401
Itaca Equity Holding S.p.A. 0 1,950,000 1,073,475 (97,085) (11,393) 2,914,997
ITH S.p.A. 59,727,137 3,280,547 70,539 (574,382) 62,503,841
OVS S.p.A. 85,239,484 18,806,414 (203,350) 46,640 103,889,188
Roche Bobois S.A. 74,738,527 (1,720,073) 73,018,455
Sant'Agata S.p.A. (1) 0 51,876,761 1,031,645 8,341 (15,824) (480,000) 52,420,923
Tip-Pre Ipo S.p.A. (2) 26,374,834 3,721,826 567,811 169 64,190 (30,728,830) 0
Altre collegate 663,432 663,432
Totale 526,156,105 163,559,901 5,292,450 21,874,460 89,788 4,630,380 (277,227) 0 0 (38,547,581) 682,778,275
(1) the increase refers to the purchases and to the changes in consolidation scope
(2) the decrease refers to the reclassification to subsidiaries

TAMBURI INVESTMENT PARTNERS GROUP
55