supporting information - royal society of · pdf fileraman spectroscopy the raman spectra for...
TRANSCRIPT

Supporting Information
High-energy-density electrochemical flow capacitors containing quinone derivatives impregnated in nanoporous carbon beads
Takaaki Tomai*, Hayate Saito, Itaru Honma
Institute of Multidisciplinary Research for Advanced Materials, Tohoku University, 2-
1-1 Katahira, Sendai, Miyagi 980-8577, Japan.
e-mail: [email protected]
Electronic Supplementary Material (ESI) for Journal of Materials Chemistry A.This journal is © The Royal Society of Chemistry 2016

N2 adsorption isotherm
From the N2 adsorption/desorption behaviors obtained using an automatic adsorption apparatus
(BELSORP-18, BEL Japan, Inc.), Brunauer Emmett Teller (BET) surface area and pore volume were
determined. The BET surface area and the pore volume reduced from 3200 m2 g-1 to 1820 m2 g-1 and
from 2.23 cm3 g-1 to 1.13 cm3 g-1 by the complexation with the DCAQ, and their N2 adsorption
isotherms are shown in Figure S1.
Figure S1 N2 adsorption isotherms for the nanoporous carbon beads before and after complexation
with DCAQ.

Raman spectroscopy
The Raman spectra for the pristine activated carbon beads, DCAQ, and the DCAQ/carbon complex
are shown in Figure S2. The Raman spectra were recorded using a micro-Raman system (HORIBA
Scientific, Japan) at room temperature. The powder samples were excited by using Nd:YAG laser (532
nm). The spectrum for the complex has both features of activated carbon beads and DCAQ.
Figure S2 Raman spectra for activated carbon beads, DCAQ/activated carbon beads complex, and
DCAQ. Yellow arrows indicate characteristic peaks for DCAQ, and green arrows indicate
characteristic peaks for carbon.
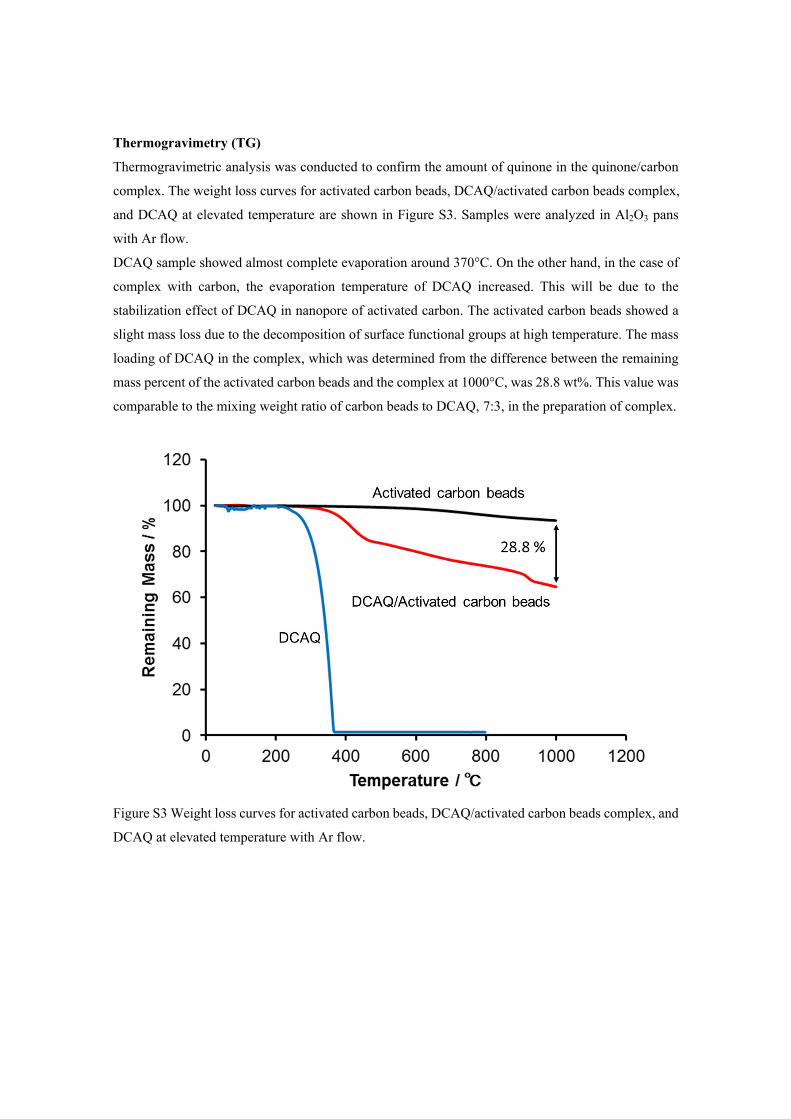
Thermogravimetry (TG)
Thermogravimetric analysis was conducted to confirm the amount of quinone in the quinone/carbon
complex. The weight loss curves for activated carbon beads, DCAQ/activated carbon beads complex,
and DCAQ at elevated temperature are shown in Figure S3. Samples were analyzed in Al2O3 pans
with Ar flow.
DCAQ sample showed almost complete evaporation around 370°C. On the other hand, in the case of
complex with carbon, the evaporation temperature of DCAQ increased. This will be due to the
stabilization effect of DCAQ in nanopore of activated carbon. The activated carbon beads showed a
slight mass loss due to the decomposition of surface functional groups at high temperature. The mass
loading of DCAQ in the complex, which was determined from the difference between the remaining
mass percent of the activated carbon beads and the complex at 1000°C, was 28.8 wt%. This value was
comparable to the mixing weight ratio of carbon beads to DCAQ, 7:3, in the preparation of complex.
Figure S3 Weight loss curves for activated carbon beads, DCAQ/activated carbon beads complex, and
DCAQ at elevated temperature with Ar flow.

XRD patterns
The XRD patterns for the pristine activated carbon beads, DCAQ, and the DCAQ/carbon complex are
shown in Figure S4. These patterns were obtained using powder X-ray diffraction (XRD; Bruker AXS
D8 Advance, 40 kV and 30 mA) with CuKα radiation (λ = 1.5406 Å).
In contrast to the XRD peaks observed in DCAQ powder, the XRD pattern for the DCAQ/carbon
complex exhibited no characteristic peaks. However, by Raman spectroscopy and thermogravimetry,
it was confirmed that this complex contained DCAQ at ~30 wt%. Therefore, this XRD result suggested
that in this complex, DCAQ was held inside the nanoporous carbon beads with a less-crystalline or
nanocrystalline structure. As shown in our previous study [21], holding the organic materials in
nanoporous carbon with less-crystalline or nanocrystalline structures is preferable, because such
adsorption state of the organic compounds in a conductive carbon material contributes to the
electrochemical utilization of insulating organic compounds.
Figure S4 XRD patterns for activated carbon beads, DCAQ/activated carbon beads complex, and
DCAQ.

Cyclic voltammogram
For the cyclic voltammogram measurements as the single electrode characteristics, we employed
carbon slurry electrolytes consisting of nanoporous activated carbon (Maxsorb® MSC-30, Kansai
Coke and Chemicals Co., Ltd.), conductive carbon particle (DENKA BLACK®FX-35), and 0.5 M
H2SO4 and 0.05 M HCl aqueous solution as a counter electrode. The weight ratio of nanoporous carbon
to conductive carbon was fixed to be 9:1. The weight ratio of the dispersed carbon materials to aqueous
solution was fixed to be 15:85, and the total weight of counter electrode was greater than five times
that of the working electrode to suppress the potential change of the counter electrode during
charge/discharge processes. Ag/AgCl electrode was employed as the reference electrode. We initiated
cyclic voltammetry measurements using a flow-cell module under ambient conditions at a scan rate
of 1 mV/s.
The cyclic voltammograms for the TCHQ/carbon slurry as the positive electrolyte and the
DCAQ/carbon slurry as the negative electrolyte are shown in Figure S5. The current density was
calculated based on the weight of the quinone derivatives in working slurry electrolytes. The anodic
and cathodic peak potentials for the TCHQ/carbon slurry were 0.46 and 0.41 V vs. Ag/AgCl,
respectively. Therefore, the redox potential of the proton insertion/extraction reaction for TCHQ was
estimated as the averaged value of the potentials, 0.44 V.
On the other hand, the anodic and cathodic peak potentials for the DCAQ/carbon slurry were −0.10
and −0.14 V (vs. Ag/AgCl), respectively. Thus, the redox potential of the proton insertion/extraction
reaction for DCAQ was estimated to be −0.12 V.
Figure S5 Cyclic voltammograms for the TCHQ/carbon slurry and the DCAQ/carbon slurry.
Cycle life analysis
Figure S6(a) shows the rechargeable energy density for the couple of complex slurry electrolytes in a
flow-cell module as a function of cycle number under static operation. These energy densities were
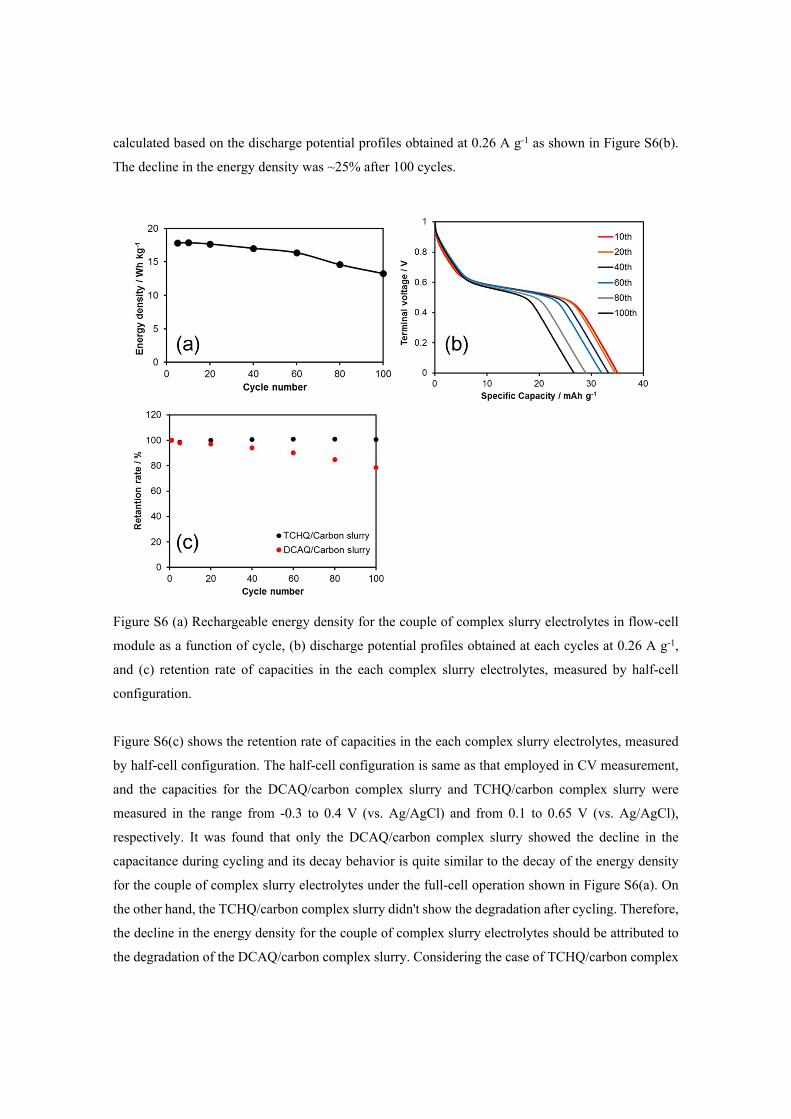
calculated based on the discharge potential profiles obtained at 0.26 A g-1 as shown in Figure S6(b).
The decline in the energy density was ~25% after 100 cycles.
Figure S6 (a) Rechargeable energy density for the couple of complex slurry electrolytes in flow-cell
module as a function of cycle, (b) discharge potential profiles obtained at each cycles at 0.26 A g-1,
and (c) retention rate of capacities in the each complex slurry electrolytes, measured by half-cell
configuration.
Figure S6(c) shows the retention rate of capacities in the each complex slurry electrolytes, measured
by half-cell configuration. The half-cell configuration is same as that employed in CV measurement,
and the capacities for the DCAQ/carbon complex slurry and TCHQ/carbon complex slurry were
measured in the range from -0.3 to 0.4 V (vs. Ag/AgCl) and from 0.1 to 0.65 V (vs. Ag/AgCl),
respectively. It was found that only the DCAQ/carbon complex slurry showed the decline in the
capacitance during cycling and its decay behavior is quite similar to the decay of the energy density
for the couple of complex slurry electrolytes under the full-cell operation shown in Figure S6(a). On
the other hand, the TCHQ/carbon complex slurry didn't show the degradation after cycling. Therefore,
the decline in the energy density for the couple of complex slurry electrolytes should be attributed to
the degradation of the DCAQ/carbon complex slurry. Considering the case of TCHQ/carbon complex

slurry, the adequate choice of the organic redox-active material will suppress the decline in the energy
density after cycling.

Rate performance
The charge-discharge potential profiles for the slurry electrolytes with and without quinone derivatives
at various current densities, which lead to Figure 5(b), are shown in Figure S7. The current density
was calculated based on the weight of the solid components in the negative slurry electrolyte. The
power densities calculated from the discharge profiles on the basis of the total weight of the solid
components in the both slurry electrolytes are also noted.
Figure S7 Charge-discharge potential profiles for the quinone/carbon complex slurry electrolytes (a)
and carbon slurry electrolytes (b) at various current densities.
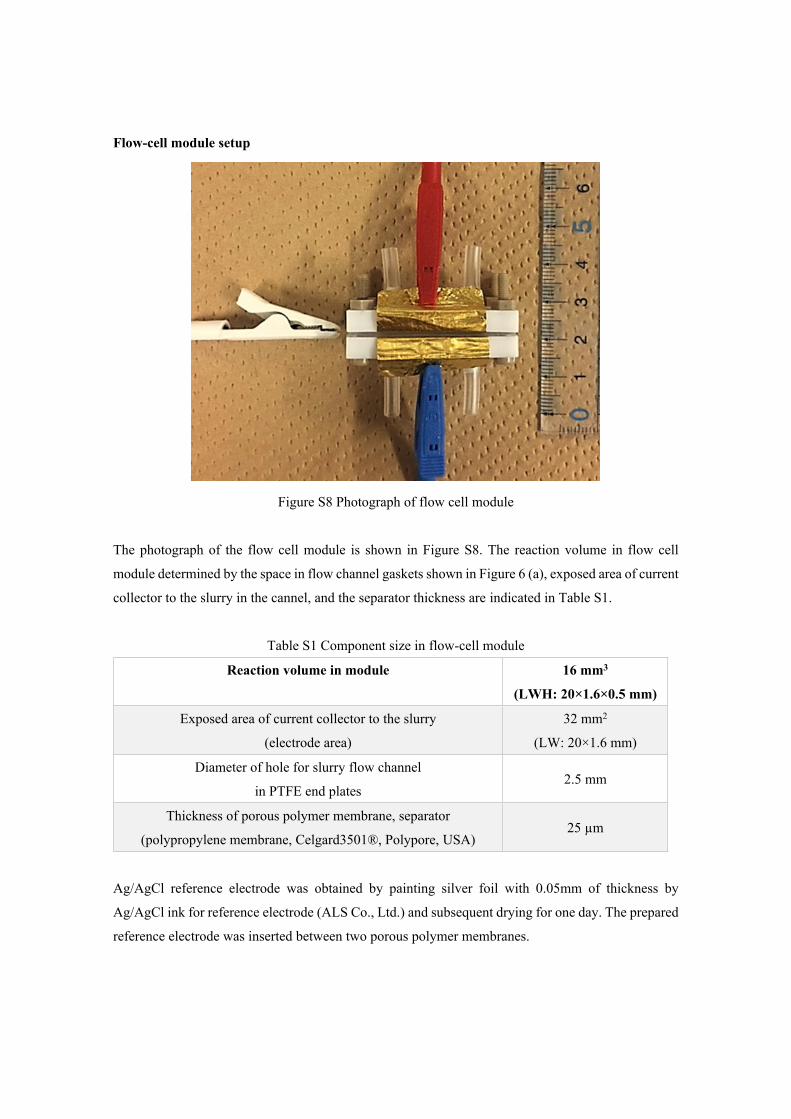
Flow-cell module setup
Figure S8 Photograph of flow cell module
The photograph of the flow cell module is shown in Figure S8. The reaction volume in flow cell
module determined by the space in flow channel gaskets shown in Figure 6 (a), exposed area of current
collector to the slurry in the cannel, and the separator thickness are indicated in Table S1.
Table S1 Component size in flow-cell module
Reaction volume in module 16 mm3
(LWH: 20×1.6×0.5 mm)
Exposed area of current collector to the slurry
(electrode area)
32 mm2
(LW: 20×1.6 mm)
Diameter of hole for slurry flow channel
in PTFE end plates2.5 mm
Thickness of porous polymer membrane, separator
(polypropylene membrane, Celgard3501®, Polypore, USA)25 µm
Ag/AgCl reference electrode was obtained by painting silver foil with 0.05mm of thickness by
Ag/AgCl ink for reference electrode (ALS Co., Ltd.) and subsequent drying for one day. The prepared
reference electrode was inserted between two porous polymer membranes.

Self-discharge behavior
The behavior of the terminal voltage during self-discharge is shown in Figure S9. After charging to 1
V, the cell was kept under electrically-open-circuit condition for 30 min without flow operation.
Subsequently, discharge operation was conducted. The current density for charge and discharge
operation was 0.26 A g-1 on the basis of the weight of the solid components in the negative slurry
electrolyte.
Under open-circuit condition, the cell exhibited a slight decrease in the terminal voltage for 30 min.
From the charge and discharge capacities, it was found that 12% of stored charge was faded away by
self-discharge for 30min.
Figure S9 Self-discharge behavior of the cell between charge and discharge operation.

Potential capacity of slurry electrolyte with solution-based electrolytes
In this estimation, we employed the value of ideal capacity and molecular weight of anthraquinone
(257 mAh/g, 208 g/mol) as a basic redox-active quinone derivative. In the case of slurry electrolyte,
the capacity of nanoporous carbon was estimated to be 30 mAh/g. Figure S10 shows ideal capacities
of quinone-solution electrolyte, which was employed in quinone redox flow battery, and
quinone/carbon complex slurry electrolytes proposed in this study. We estimated the ideal capacities
for two types of slurry electrolytes, in which the ratio carbon to aqueous solution were fixed to be
15:85 and 10:90 (this study), respectively.
Figure S10 Ideal capacity of electrolytes as a function of quinone contents in electrolytes
The upper termination of quinone-solution electrolyte was determined by the general saturation
solubility of quinone derivative (~1 M), whereas those of the slurry electrolytes was determined by
the condition, which the solid-state anthraquinone (1.31 g/cc) completely fills the pores of nanoporous
carbon (2.23 cc/g). As a result, it was indicated that the potential capacity of the slurry electrolytes
with solid-state quinone exceed that of the quinone-solution electrolytes.