access to psychological therapies dcaq in nhs lothian
TRANSCRIPT

QuEST Quality and Efficiency Support Team
Access to Psychological Therapies DCAQ in NHS Lothian Phase 2 Report
Version: Final January 2013 © Crown copyright 2013

2
Contents
1 Introduction ............................................................................................................................................. 5
1.1 Purpose of this document ................................................................................................................ 5
1.2 Acknowledgements .......................................................................................................................... 5
2 Executive Summary ................................................................................................................................. 7
2.1 Aim One: Improving waiting times without additional recurrent investments and without
impacting negatively on clinical outcomes ............................................................................................ 7
2.2 Aim Two - Sharing Learning across NHS Lothian and NHS Scotland ............................................. 16
2.3 Next Steps for NHS Lothian ............................................................................................................ 22
3 Overall Approach Used to Deliver the DCAQ Outputs ......................................................................... 25
4 Service Context ...................................................................................................................................... 27
4.1 East Lothian Psychological Therapies Service - Service Description ............................................. 27
4.2 Midlothian Psychological Therapies Service - Service Description ............................................... 28
5 Demand Analysis ................................................................................................................................... 29
5.1 Estimating Demand ........................................................................................................................ 29
5.2 Estimating Demand for ELPT and MLPT ......................................................................................... 30
6 Capacity And Activity Analysis .............................................................................................................. 39
6.1 Capacity and Activity ...................................................................................................................... 39
6.2 Calculating Current Capacity for Direct Client Work ..................................................................... 40
6.3 Setting Capacity Using Job Plans .................................................................................................... 42
6.4 Activity – understanding how time is currently spent .................................................................. 44
6.5 Optimising Capacity – Effective Administration Processes ........................................................... 53
6.6 Optimising Capacity – Reducing DNA and CNA ............................................................................. 56
6.7 Optimising Capacity – Effective Meetings ..................................................................................... 62
6.8 Optimising Capacity – Case Review and Caseload Management ................................................. 63
7 Queues/Waiting Lists............................................................................................................................. 65
7.1 Waiting Times Information ............................................................................................................ 65

3
7.2 Understanding the reasons for the queue ..................................................................................... 75
7.3 Addressing the gap between demand and capacity ..................................................................... 80
7.4 Clearing the historical queue ......................................................................................................... 82
8 Measuring Outcomes............................................................................................................................. 85
8.1 Background ..................................................................................................................................... 85
8.2 Outcomes Data Collection - The Clinical Perspective .................................................................... 86
8.3 Solutions Developed ....................................................................................................................... 87
8.4 Ongoing Challenges ........................................................................................................................ 91
8.5 Clinical Outcomes Data................................................................................................................... 93
8.6 Key Lessons Learnt .......................................................................................................................... 94
9 Data Quality and Information Flow ...................................................................................................... 97
9.1 Introduction & Recommendations from Phase One ..................................................................... 97
9.2 Related work undertaken in Phase Two ........................................................................................ 97
9.3 Additional data quality issues addressed during Phase 2 ............................................................. 99
10 Summary of Recommendations and Next Steps .............................................................................. 101
10.1 Recommended actions for NHS Lothian .................................................................................... 101
10.2 Next Steps for NHS Lothian ........................................................................................................ 107
10.3 Key Issues for further work nationally and key lessons learnt for sharing with other NHS
Boards ................................................................................................................................................. 108
Appendices .............................................................................................................................................. 115
Appendix A - Run Chart Rules for Interpretation .............................................................................. 115
Appendix B: Technical notes, Data sources, notes/ comments and Assumptions .......................... 119
Report Authors ....................................................................................................................................... 122

4

5
1 Introduction
1.1 Purpose of this document The purpose of this document is to report on phase two of the Demand, Capacity, Activity & Queue (DCAQ) work carried out with Midlothian Psychological Therapies Service and East Lothian Psychological Therapies Service between April 2011 and March 2012. The overall project was broken down into two phases and this report is a summary of the work completed in phase two. The phase one report can be accessed at the following web address; http://www.qihub.scot.nhs.uk/media/220541/nhs%20lothian%20dcaq%20phase%201%20report%20vfinal2.doc The phase two report has two main purposes:
To provide feedback on the work completed in phase two and to outline the additional service improvement opportunities that might be explored for each service participating;
To provide a learning resource for other services interested in applying DCAQ.
1.2 Acknowledgements
This report summarises a considerable amount of work undertaken by East Lothian Psychological Therapies and Midlothian Psychological Therapies services, with support from NHS Lothian’s Mental Health and Wellbeing Programme and the PiMS Team, and the Scottish Government QuEST Mental Health team. These staff have worked together to develop processes and approaches that can be rolled out across NHS Lothian and in doing so, have also generated considerable learning for sharing across NHS Scotland. Being part of this project has inevitably placed additional pressures on these teams and we are grateful for their willingness and commitment to seeing this project through. We hope that the learning generated will make it easier for others following.
The Scottish Government is particularly grateful to the teams and NHS Lothian for their willingness to share openly both the successes and the difficulties. We know that the challenges highlighted in this report will resonate with many other areas. We hope that other areas can learn from the description of the journey these services went on, including the difficulties encountered along the way. The content of this report highlights the commitment of all involved not just to improving their own services, but towards sharing whatever learning will help others who similarly aspire to delivering high quality care for individuals requiring psychological therapies as quickly and as efficiently as possible.

6

7
2 Executive Summary The main aims of this project were to:
improve access times for psychological therapies for two teams providing Psychological Therapies in NHS Lothian, within their existing resourcing frameworks and without impacting negatively on clinical outcomes, and
identify early learning from the application of DCAQ to Psychological Therapies Services, which could be shared across NHS Scotland to assist with delivery of the A12 HEAT target. It is anticipated that many boards will run into similar challenges and issues outlined below.
NHS Lothian agreed to act as an Early Implementer site to assist with these aims. This report provides a summary of the work undertaken in Phase Two of the project, between April 2011 and October 2012. The Phase One report can be accessed online by following this link.
2.1 Aim One: Improving waiting times without additional recurrent investments and without impacting negatively on clinical outcomes
2.1.1 Summary of progress towards aim A key aim for this work was to improve access times within the existing resource framework (i.e. without any recurrent increases in budgets) and without impacting negatively on clinical outcomes. It is not possible to say whether this aim has been achieved due to a lack of accurate historical waiting times data for psychological therapies and a lack of data to assess the outcomes of the various changes tested. However, the work has:
Delivered a robust information flow process which means that key data to both measure and manage waiting times is now available. This process can now be rolled out across NHS Lothian.
Used that data to conduct a DCAQ analysis that has highlighted that, with current models of service delivery, neither team has enough capacity to meet the current demand. Therefore, if nothing changes, NHS Lothian can expect to see the waiting times for both teams consistently growing.

8
There are two main options for addressing this mismatch between demand and capacity:
1. Make changes to reduce demand and/or increase the capacity for direct client work. 2. Allocate additional resources.
The financial constraints facing NHS Boards mean that option 2 will only be considered once it is clear that service redesign opportunities have been exhausted. It is not yet clear whether the mismatch in demand and capacity can be addressed through service redesign alone and at some point NHS Lothian may need to make an additional investment in its capacity to deliver psychological therapies. The work has highlighted those areas where improvements are likely to have the biggest impact on the team’s capacity to cope with the current workload. However, we don’t yet know whether these productive opportunities can be realised in practice and further work is now needed to test this. The key areas identified are:
Focused work to reduce follow-up DNA. As part of the Phase 2 work the teams tested some changes to reduce new DNAs. Focusing on follow-up DNAs appears to be counter-intuitive for teams as the new DNA rates are usually much higher. However, a 1% reduction in the follow-up DNA rate would have far greater impact on time available for clinical work than a 1% reduction in the new DNA rate (due to the number of follow-up appointments in comparison with new appointments). Going forward, the focus for psychological therapies services needs to be on follow-up DNAs. We recommend as a next step undertaking a detailed assessment of the reason why individuals are not attending or cancelling follow-up appointments, including looking at whether individuals are using DNAs to self discharge. Please see the Effective and Efficient CMHS Toolkit section on DNAs for more information on both diagnosing opportunities for improvement and ideas for delivering reductions in DNAs.
Focused work on reducing CNAs and/or processes for filling cancelled slots. The work has highlighted that the CNA rates are running at a similar level to DNA rates. Unless there is a system for rapidly filling cancelled appointments, this will also result in a significant loss of face to face clinical time. Again the initial focus should be on follow-up CNAs and the next step should be undertaking a more detailed assessment of the reason why people are cancelling so many appointments to inform what changes might lead to an improvement. Further, the teams need to have a process for rapidly filling cancelled appointment slots. However, taking this action forward depends on the teams having appropriate levels of admin resource to set up and administer such a system.

9
Administration Burden. This work has highlighted that significant clinical staff time is spent on both clinical and non-clinical admin.
ELPT MLPT
% of total time spent on clinical admin
24% 25%
% of total time spent on non clinical admin
8% 10%
% of total time spent on admin
32% 35%
It is recommended that NHS Lothian now undertake a focused piece of work to test interventions which might reduce the admin burden on psychological therapies staff. This work should consider:
Ensuring that community teams have appropriate levels of admin support so that clinicians are not spending time fulfilling basic admin tasks such as room bookings and answering general telephone calls.
What information is currently being captured and whether there are any opportunities for streamlining this. This should include, for example, looking at clinical communication, such as the information being sent to GPs, duplication of recording, the use of standardized letters/templates.
The use of new technologies to reduce the time spent collecting both qualitative and quantitative information. As an example, there is increasingly a requirement for clinical staff to input information directly to computers but differences in typing speeds can have a significant impact on time spent inputting information. Newer technologies such as digital pens (where the person writes the information and this is then automatically transmitted to the computer) and dictation software (where the person speaks and the IT system converts it to typed text) can deliver ongoing improvements in the amount of time spent inputting information.
2.1.2 Summary of key barriers to delivery of aim and actions taken One of the original objectives for this work was to carry out a DCAQ analysis and related service improvement work for two teams providing psychological therapies in NHS Lothian with the aim of reducing access times. However the ability to deliver this aim in the timescales of the project was significantly impacted by: 1. Gaps in the recording of key data and the poor quality/reliability of the data that was
being recorded. Therefore the two services were used to develop a process for collecting the data that is needed to both monitor and manage delivery of the waiting time target. Please see Section 9 of this report for more information on the approach taken. Through this work, NHS Lothian’s PIMS system has been developed so it can now capture all of the relevant data. This includes the ability to report on waiting lists by therapy type.
10
Once the process is rolled out, NHS Lothian will have a robust method for reporting and managing waiting times at an NHS Board level. However the limitations of the current PIMS system means that the current user interface is cumbersome and at times, counter-intuitive. This results in more time being spent entering data than would be the case with a more user friendly interface. Therefore collecting the additional data has impacted on the time available for direct client work due to the additional time that clinicians are spending on data input. Not collecting the data is not an option, as this is key information that is needed for the effective management of services and to inform ongoing work to improve the quality and efficiency of services. Therefore, in rolling these processes out work needs to continue with teams to identify ways to reduce this data input burden and improve the user interface.
2. Lack of information being reported back at team level. The original intention of the work
was that, once the new information flow process was in place, the teams would then receive monthly reports which would inform their ongoing management of waiting lists and the direction of service improvement work. However, difficulties with securing analyst time (even with additional funding allocated) meant that there were significant delays in extracting the data from the system. Once the data was extracted, there were then capacity issues with reporting the data in an accessible format that enabled the ongoing management of waiting lists and informed the direction of service improvement work. This presented the following issues: o Services did not have the information to enable to effectively manage current
waiting lists. o Services did not then have key information to enable them to understand where
to direct their service improvement work, or data to tell them whether the changes they were testing were making a difference.
o When data is not fed back and used, this then presents ongoing concerns with the quality of the data as feeding back meaningful information to those collecting data is key to maintaining the motivation for accurate recording.
Over the course of the project, progress was made with providing information back to teams to enable them to manage waiting lists on a day to day basis, including access to online reports which enable clinicians/team managers to see who has been waiting for how long (see Section 7.1.2 for an example). In addition, this report highlights both the type of data that teams need to receive monthly and how that data should be presented. In particular, it highlights the importance of charting key information in run charts to enable services to distinguish between normal variation and one-off special cause variation and to establish whether there are any statistically significant trends that may impact on a team’s ability to cope with the workload going forward. Finally it highlights that, when doing targeted improvement work, there is often a need to drill into key data sets to inform both the direction of the work and the evaluation of any tests of change. Prior to rolling out the new information flow process across NHS Lothian, it is highly recommended that work is undertaken to agree both the content and format of a key suite of monthly information reports at team level. Ideally, the system needs to be set up so that the reports are then automated and teams can pull them off the system themselves. Failure to automate the reporting is likely to lead to ongoing problems

11
producing them due to the pressures and capacity issues on information services departments. Ideally these reports should include clinical outcome information to ensure a focus is kept on both access issues and clinical outcomes. The 2012/13 QuEST Access Funding provides a time-limited increased analytical capacity. Part of their priorities should be to set up a sustainable process for routine information reporting that is not then dependent on analytical capacity that is not available in the longer term. However, the complexities of DCAQ analysis and the need to drill into data for improvement work, means that there will continue to be a requirement for some ongoing analytical support for mental health services. Ideally this should be part of the Business Intelligence Unit resources so that the input does not become person dependent (and hence the skills/understanding lost when the person moves job). It is recommended that NHS Lothian allocates identified analytical resource to support improvement work in mental health. Further, this resource should be attached or embedded within the Health Intelligence Unit in a way that ensures the sustainable development of the knowledge and skills for using information to drive improvement in Mental Health.

12
2.1.3 Releasing Productive Opportunities – Summary of Changes Tested The proposition that it is possible to improve waiting times within existing resource frameworks whilst maintaining or improving the quality of care is based on the hypothesis that:
The demand services experience is a mixture of what patients actually need if we did things right the first time, workload attached to having to redo things because we didn’t do it right the first time, workload that presents because we didn’t intervene earlier in the patients pathway and workload that services create by choosing to provide more than the patient needs (i.e. seeing people more times than is needed). Addressing these issues would reduce overall demand and hence reduce waiting times within existing resources.
The capacity we have to provide services (which in mental health is primarily skilled staff time) is negatively impacted by avoidable capacity losses such as time being spent doing things that add no value (including unfocused meetings, unnecessary administrative work), staff at senior grades doing work that could be done more effectively by lower banded staff (e.g. clinicians undertaking basic administrative procedures around booking appointments/rooms, senior clinicians providing interventions that can be undertaken equally as effectively by lower banded staff). Addressing these issues will increase capacity for direct client care time.
The following table summarises the tests of change already conducted and recommendations for further action/tests of change. As previously highlighted, a lack of robust data has impacted on the ability to assess the impact of the changes tested.
Table One – Releasing Time for Direct Client Care
Reducing time lost to DNAs Assessment of Productive Opportunity
ELPT lose on average 3.7 hrs a week to 1st Assessment DNA and 15.8 hrs a week to follow-up DNA.
MLPT lose on average 4.3 hrs to 1st assessment DNA and 23.5 hrs a week to follow-up DNA.
Improvements Tested to Date
ELPT have introduced an opt-in system to reduce 1st appointment DNA. Anecdotal evidence suggests this did impact DNA rates, but data is not available to verify due to a lack of historical information.
ELPT are in the process of testing if offering a choice of venue to clients impacts on DNAs.
MLPT put in place a process for responding to individuals who did not or could not attend. The data issues mean that it has not been possible to assess the impact of this.
MLPT are keen to test a voicemail reminder system for follow-up appointments. However, the use of such systems in mental health has temporarily been put on hold whilst issues around obtaining patient permissions for using text and voicemail reminders are resolved at an NHS Lothian wide level.
Recommended Next Steps
Both teams need to focus on testing actions to reduce follow-up DNA as considerably more

13
time is lost to these than new DNAs. The Effective and Efficient CMHS toolkit provides guidance on both conducting detailed analysis of the problem and some ideas for changes to test. However, creative approaches should also be used with the team to identify ideas for testing.
It is vital that DNA data is being reported to the teams in run charts so that they can then assess the impact of any changes. Whilst changes are taking place, the data ideally needs to be reported at a weekly level as this will enable statistically significant changes to be identified more rapidly.
Reducing time lost to CNAs Assessment of Productive Opportunity
In ELPT, on average 2 slots for 1st Assessment per week and 13 follow-up slots per week are CNA.
In MLPT, on average 1.5 slots for 1st assessment per week and 13 follow-up slots per week are CNA.
Each slot is typically one hour long. The following table models the loss in hours per week to CNA for each service depending on what percentage of cancelled slots they are able to refill.
Loss in hours per week comparing different rebooking rates
Percentage of slots rebooked following cancellation
100% 75% 50% 25% 0%
ELPT 1st appt CNA 0 0.5 1 1.5 2
ELPT Follow-up CNA 0 3.25 6.5 9.75 13
MLPT 1st appt CNA 0 0.4 0.75 1.2 1.5
MLPT Follow-up CNA 0 3.25 6.5 9.75 13
Improvements Tested to Date
None
Recommended Next Steps
Both teams need to focus on testing actions to reduce follow-up CNA and ensuring processes are in place to fill any slots that are available due to patient cancellations. However, a key constraint here is the lack of administrative capacity, as much of the work around reducing CNAs will be around booking procedures that are reliant on administrative capacity to reoffer appointments.
Reducing clinical time lost to administrative tasks Assessment of Productive Opportunity
ELPT spend on average 24% of their time on clinical admin and 8% of time on non-clinical admin (3% of clinical time is being spent on basic admin tasks such as room booking). This equates to 97 hrs a week or 4,074 hrs a year of clinical time.

14
MLPT spend on average 25% of their time on clinical admin and 10.4% of time on non-clinical admin (5% on non clinical emails and 5.4% on basic admin tasks such as room booking). This equates to 102 hrs a week or 4,284 hrs a year of clinical time.
Improvements Tested to Date
Clinical Letters ELPT undertook consultation with GPs to identify what information they actually want/need. The following summarises the GP requirements:
First letter should have a brief summary of key points:
(1) Diagnosis and treatment plan for patient.
(2) Summary at the start of the letter
(3) Use headings and bullet points.
(4) Is action required on behalf of GP - should be explicitly pointed out in the opening summary.
Follow-up letters should be brief and just refer back to earlier letter for detail.
Is patient still going to therapy - updates approximately 3 monthly with very brief progress and plan for the patient?
The GPs prefer emails over letters but not to their individual inbox, only to the clinical inbox, which every GP practice has. This would be a great time saver for them as they only hold electronic records so when we send letters they have to scan them in then dispose of the original letter. Emailing also saves printing and postage costs for the Mental Health services.
These changes have been implemented but data is not currently available to assess the impact of these changes.
Recommended Next Steps
The amount of clinical time being spent on administrative tasks is significant. Some of this will be necessary as clinicians must spend time writing up clinical notes.
NHS Lothian should prioritise taking work forward to look at how to reduce the administrative burden on psychological therapies staff. It is unlikely that any one action will be sufficient in isolation, rather a combination of approaches are likely to be necessary including:
Ensuring adequate admin time is allocated to teams so that clinical staff are not undertaking basic admin duties. It is not cost effective to have senior clinical staff undertaking basic administrative duties.
Reviewing, and wherever possible, streamlining information recording processes. This should not just focus on quantitative data but also clinical letters, as tested by ELPT.
Maximising the use of new technologies to reduce the time spent inputting information (e.g. voice activated dictation software, digital pens)
15
Effective Meetings Assessment of Productive Opportunity
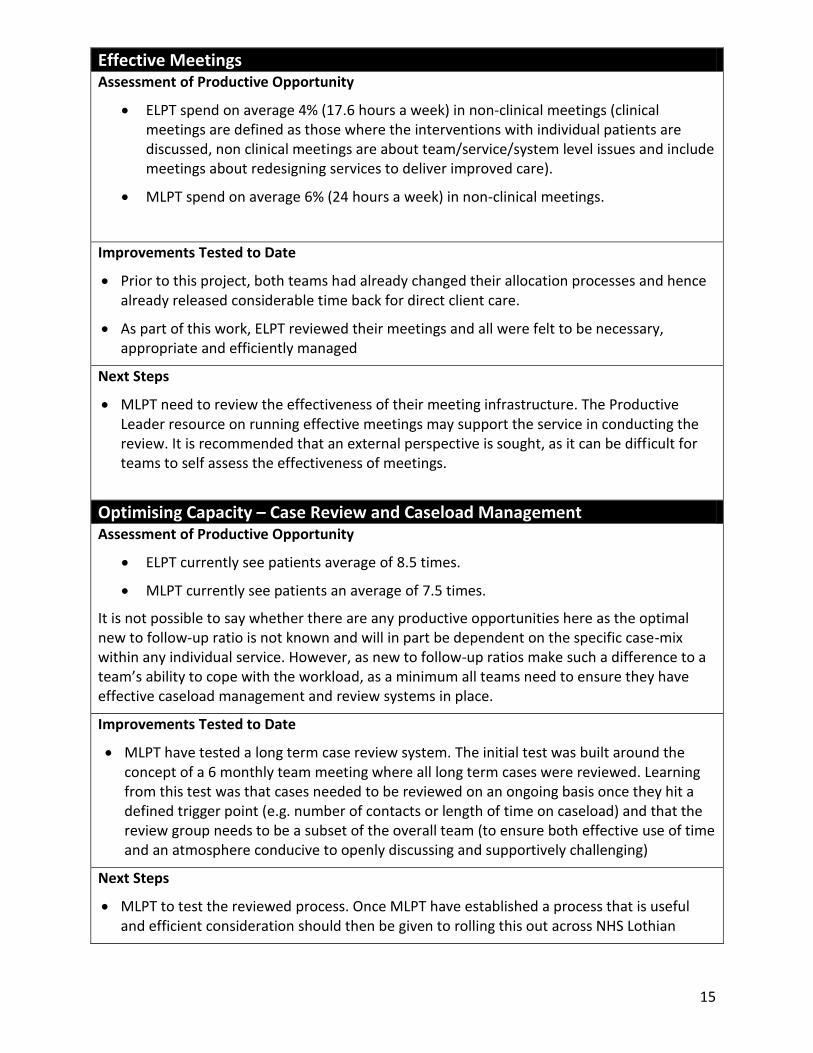
ELPT spend on average 4% (17.6 hours a week) in non-clinical meetings (clinical meetings are defined as those where the interventions with individual patients are discussed, non clinical meetings are about team/service/system level issues and include meetings about redesigning services to deliver improved care).
MLPT spend on average 6% (24 hours a week) in non-clinical meetings.
Improvements Tested to Date
Prior to this project, both teams had already changed their allocation processes and hence already released considerable time back for direct client care.
As part of this work, ELPT reviewed their meetings and all were felt to be necessary, appropriate and efficiently managed
Next Steps
MLPT need to review the effectiveness of their meeting infrastructure. The Productive Leader resource on running effective meetings may support the service in conducting the review. It is recommended that an external perspective is sought, as it can be difficult for teams to self assess the effectiveness of meetings.
Optimising Capacity – Case Review and Caseload Management Assessment of Productive Opportunity
ELPT currently see patients average of 8.5 times.
MLPT currently see patients an average of 7.5 times.
It is not possible to say whether there are any productive opportunities here as the optimal new to follow-up ratio is not known and will in part be dependent on the specific case-mix within any individual service. However, as new to follow-up ratios make such a difference to a team’s ability to cope with the workload, as a minimum all teams need to ensure they have effective caseload management and review systems in place.
Improvements Tested to Date
MLPT have tested a long term case review system. The initial test was built around the concept of a 6 monthly team meeting where all long term cases were reviewed. Learning from this test was that cases needed to be reviewed on an ongoing basis once they hit a defined trigger point (e.g. number of contacts or length of time on caseload) and that the review group needs to be a subset of the overall team (to ensure both effective use of time and an atmosphere conducive to openly discussing and supportively challenging)
Next Steps
MLPT to test the reviewed process. Once MLPT have established a process that is useful and efficient consideration should then be given to rolling this out across NHS Lothian

16
2.2 Aim Two - Sharing Learning across NHS Lothian and NHS Scotland The second key aim for this project was to generate learning about the application of DCAQ approaches to Psychological Therapies Services that would inform work across NHS Lothian and with other NHS Boards. This aim has been delivered with significant learning generated from this work.
2.2.1 Key Lessons Learnt Summary An interim lessons learnt to date report was produced in January 2012 and shared with the Psychological Therapies HEAT Implementation Group and the Mental Health Delivery Team and then subsequently was made publicly available online via the Quality Improvement Hub website. This then informed the development of the 2012/13 PT HEAT Risk Assessment Criteria and also informed and enabled the allocation of significant additional funding by QuEST in 2012/13 to enable increased capacity at NHS Board level for data analysis and improvement facilitation. Since the production of that document, additional learning has been generated and the totality of the lessons learnt during Phase 2 are summarised in this section.
Availability and quality of data. The lack of key data for Psychological Therapies DCAQ work and data quality issues significantly impacts on the ability to use data to identify productive opportunities and evaluate whether changes made have delivered an improvement. Information flow mapping can be used to support the delivery of reliable, consistent and valid data that enables delivery of the Psychological Therapies HEAT target. Through using this approach NHS Lothian now has a process in place to collect all the key information needed. This process can now be rolled out across all relevant teams. Further, this work has highlighted the need to have a regular cycle of audits in place to check the quality/accuracy of data.
Availability of analytical input. A lack of analytical input was a key issue identified in Phase One of this work and has continued to present significant barriers to progressing work in Phase Two. When staff are being asked to undertake additional work to collect data then there must be a clearly agreed mechanism and resource to ensure this data is then analysed and presented back in a user friendly format. Failure to do this will generate additional resistance to engaging in such work in the future. Further, the lack of ongoing analytical time available to mental health services means that a priority for the additional time limited staffing put in place through QuEST Access Funding must be to set up systems which automate the analysis and reporting of data as much as possible.
Admin burden on clinical staff. The work has highlighted that collecting this data has impacted on time available for direct client work due to the additional administrative burden attached to data recording. This is on top of significant amounts of clinical time spent on administrative issues. For instance, activity audits for ELPT highlighted 24% of total clinical time being spent on clinical admin and 8% on non-clinical admin and activity audit for MLPT highlighted that 25% of clinical time is being spent on clinical admin, 10.4% on non-clinical admin. This highlights the potential returns attached to focused work to reduce the administrative burden on services including making better use of new

17
technologies to reduce this burden. This is likely to be an issue across most Mental Health Services in NHS Scotland.
Availability of admin support. The extent of administration support that Psychological Therapies Services have available will be a key factor in both their ability to deliver the target and to make the significant improvements required. There are efficiency gains to be made by appropriately resourcing administration time in community mental health services. The analysis from MLPT identified that total direct contact hours could be increased by 399 hrs a year without any additional costs just by redistributing resources to ensure appropriate levels of admin are resourced (see section 6.5.2 for more info). This highlights that a narrow focus on maximising the numbers of front line staff and reducing ‘support services’ may actually be resulting in less time being available for direct clinical work. It is recognised that this focus is sometimes driven by external pressures. There is a need to promote a better understanding amongst key decision makers on the impact that administrative staff can have on enabling efficient and effective delivery of services and the potential negative impacts of cutting staff simply to reduce ‘support services’ costs.
Optimal time for direct client contact. There is a recognised need to ensure that psychological therapies staff /community mental health staff are spending optimal time in direct client contact. However, optimal time for any individual clinician will be dependent on a number of variables including: the level of experience of the clinician, the extent to which the job role includes providing consultation/liaison support to other professionals, and the intensity and complexity of the clinical work undertaken. Therefore it is not possible to set a target figure. Further, at present there is no guidance on an acceptable range. The consultant’s contract works on an 80/20 direct clinical care/supporting professional activities split. However, this includes clinical admin, travel, giving and receiving clinical supervision, multidisciplinary team meetings under direct clinical care. As such, this is a very broad definition of direct clinical care that doesn’t really provide an understanding of how time is being spent. The DCAQ work in mental health splits this work into direct client contact time and indirect client contact time. There is a need to better understand the optimal range for direct client contact time, and further work should be undertaking nationally to look at guidance for services on this issue.
Ability to redesign skill mix against demand. NHS Lothian does not at present have an organisational structure that provides a point of single operational management of its Psychological Therapies Services. Instead the nurse-led parts of the service are accountable through their professional structures, and the psychology led services through a separate structure. This type of structural accountability is true of many psychological therapies services and in this situation it is vital that there is overriding leadership in place that has the authority to address any barriers to progressing improvement. Further, as services start to collect more reliable information about the demand for their services, this is likely to highlight further issues around the current skill mix of teams. NHS Boards and Health and Social Care Partnerships need to have systems in place to enable staffing decisions to be based on need and not the historical allocation of budgets between professional groups.
Importance of having a system for allocating follow-up work separately to assessments. A key aim of DCAQ work is to understand on average how many new and how many follow-ups need to take place each week for the system to be in balance (i.e. to keep on top of the referrals presenting). The levels of variations in numbers of follow-ups each individual patient receives means that it is highly likely that an individual practitioner will have

18
capacity to take on new assessments at a given moment in time, but not the associated follow-up work. However, another member of the team is highly likely to have the capacity at that point to take on the follow-up work. This dynamic is already well understood in CAMHS services, the majority of which have now implemented the CAPA model which means that the person assessing will not normally do the follow-up work. This approach means that staff can operate to a set number of new and follow-up slots each week. However, its important to note that CAPA allows for individuals to receive treatment from the assessing clinician if they have they right skills, the individual wants to stay with them and the individual can be seen for follow-up within an acceptable time period. Both ELPT and MLPT are already set up to function in this way. However, this way of working may present significant challenges for some services who have traditionally operated on the basis that the assessor will also provide the intervention. Continuing to run the system on the basis that the person who assesses also provides the intervention will make it very difficult, if not impossible, to move to a planned approach which keeps the number of news and follow-ups in balance (unless there is very little variation in follow-up rates between individual patients). There is key learning here from the CAMHS experience that could usefully be shared across adult psychological therapies services, including resources that address clinical concerns around this model and how to ensure the service user needs remain central.
Could Not Attends. There is already a good understanding developing across Mental Health around the potential capacity loss attached to DNAs. Further, the Phase One report highlighted the value in focusing initially on follow-up DNAs. However, this work has highlighted that there are also very high levels of cancellations in the two services. If there is sufficient notice and a process of offering the slot to someone else, then the capacity losses can be reduced (though this does present an additional admin burden). Services need to test whether a move to choice booking (where the patient picks the time they want to be seen) would help in reducing the cancellation levels and hence reducing the level of rework for admin and lost capacity for late notice cancellations. However, this will not be possible without appropriately resourced admin for the teams. Further, there is a need nationally to raise the potential capacity losses being experienced by CNAs.
Maternity Leave. It is common practice across psychological therapies services to leave maternity leave uncovered, due to a lack of funding to put cover arrangements in place. This work has highlighted the risks this presents to the delivery of the 18 week target. Where teams are either running their capacity close to or less than current levels of demand, a further reduction in capacity due to uncovered maternity leave will result in increased waiting times and may impact on a services ability to meet the target. Hence, NHS Boards may need to allocate resources to fund maternity leave cover for psychological therapists.
Uni-disciplinary Resource Reviews. Analysis for MLPT highlighted that they could increase the number of hours available for direct client contact by transferring funding from vacant posts in clinical budgets to admin budgets. However, there is understandably a great deal of reluctance to do this due to concerns that a future admin review will then result in cuts to admin or a redistribution of admin resources across teams. This would then leave the team in a worse position than at present. If a team has a higher level of admin because they have moved resources out of a clinical budget to fund this then clearly redistributing their admin to other teams without also considering the number of clinical posts and

19
overall demand for each team is unfair. As Community Mental Health Services/Psychological Therapies Services work as a team, looking at any profession in isolation (including admin) and redistributing resources on the basis of a profession only analysis is rarely appropriate.
Longer Term Case Reviews. MLPT tested a process for a multidisciplinary review of longer term cases. This generated useful learning including the need to have an ongoing process for a small subgroup of the wider MDT to review cases once they reach an agreed trigger point (either number of contacts or length of time on caseload). NHS Lothian may want to consider a standardised process for rolling out across all teams.
Demand for group work and the impact on delivering 18 week target. Both MLPT and ELPT operate a system whereby a group will not start until a minimum number of people have been assessed as needing it. This is usually 12 people. For groups with low levels of annual demand this means that there can be significant waits for individuals who are referred just after a group has started and hence are waiting for the next group to start. This may impact on the ability to deliver the 18 week target. Further, with small numbers there is usually a greater level of variation which makes it harder to routinely predict when there are likely to be 12 people and hence to plan a schedule of groups in advance. One way of managing this is to offer groups for which there is a low level of demand at a cross locality level. This should both reduce the length of wait till a new group starts and make the timing of new groups more predictable. Obviously a challenge here is then finding a venue that is accessible for the whole catchment area for the group. MLPT and ELPT are now testing a cross locality approach.
Reliability of outputs from DCAQ Analysis. Undertaking DCAQ work for community mental health services is complex as there are a range of variables that need to be fed into the analysis. However, this also means that there are a range of different variables that can be worked with to impact on demand and capacity. Further, one of the major benefits of doing a DCAQ analysis is that the understanding of the data that is needed to feed the analysis is likely to result in the identification of opportunities for improving the quality and efficiency of services. Therefore the journey is as important (if not more so) than the end result. The complexity of the calculations and the necessity to use averages means that any outputs will have margins of error around them, which depending on the levels of normal variation in the system, may be significant. Therefore the outputs need to triangulate with the experience and knowledge of the local clinicians and managers, and information on what is actually happening to waiting lists over time. Section 7 provides more information on how to do this. Further, the results of the analysis in terms of the amount of group work, number of new and number of follow-ups that need to be in place each month to keep the system in balance then need to be tested in practice, with changes made at the margins depending on the actual impact on waiting times. However, the variation in monthly demand is such that care needs to be taken not to draw conclusions from simply one or two month’s worth of data.
Factors impacting DCAQ analysis. The experience of collecting and analysing data with two teams for a DCAQ analysis has highlighted a range of issues that will inform work in other teams including:

20
o The importance of presenting data in run charts to understand the level of normal variation in the system and whether there are any statistically significant trends that may impact on workload and analysis. Run charts will also be needed to assess whether the changes made have led to sustainable improvements.
o The need to attach opt-in data to the month the actual referral was received.
o The need for better information on the % of referrals that go on to access group work and the type of group work accessed.
o The need to triangulate results with changes to waiting lists over time and local clinical and managerial knowledge.
Clinical Outcomes work. The work undertaken with ELPT to look at the collection and use of clinical outcomes data has highlighted a wide range of learning including:
o Ensuring that electronic information management systems fit with existing working practices and are intuitive and easy to use from a clinical perspective. This remains a key challenge given the limitations of the current PIMS system.
o The link between clinicians motivation to record data and their perceptions about the value of this to their (or their teams) clinical activities.
o The need for having standardised clinical outcomes reporting in place that can be used at an individual level with service users, at a clinical level within supervision and at a service level for planning as a whole.
o The need for clinical outcomes data to be viewed in the context of wider service activity and hence the value in identifying a minimum data set for psychological therapies services.
o Recognising that the collection of a single global measure will not replace more sensitive condition specific measures.
o The difficulties in setting up effective data collection systems for copyrighted outcome measures, without incurring additional payments.
o Patients not attending the last appointment is a major challenge in effective outcomes measurement. Section 8 highlights a range of approaches that may help to overcome this. In addition, this provides evidence that follow-up DNAs may be disproportionately high at the end of the treatment process as patients use them to self discharge. This needs checking against the actual data, but if this is the case, then part of the solution needs to include enabling treatment to come to a planned end earlier which would at the same time address the problem of the availability of last appointment outcome data (as if the patient is in attendance, clinicians will be able to collect it).

21
2.2.2 Using learning to develop national resources to support DCAQ work A further objective for this work was to provide an early implementer site that enables the National MH QuEST team to:
develop further the existing tools to support DCAQ work in mental health;
identify and develop further tailored tools and guidance to support NHS Boards to use service improvement techniques to deliver the target;
identify what external inputs might be required to support NHS Boards to deliver the HEAT target post April 2012.
Quest Resource Allocation. This work helped inform the decision to allocate additional funding to all NHS Boards to support work to deliver the Mental Health Access Targets. It is not yet clear whether there will be any central resources allocated for 2013/14. However, if QuEST does have development funding available for 2013/14, then the learning from this work will inform discussions on how it is targeted.
Mental Health DCAQ Tool. The work has also enabled the prototype Mental Health DCAQ Tool to be tested and changes made. This tool has now been released to Mental Health Services, though only once an agreement is signed indicating that the recipient understands the tool is still in prototype and acknowledges the limitations of the outputs. The analysis contained within this report has highlighted the need to develop the tool further and in particular:
To develop the tool so it is able to model different pathways within one team
To adjust the tool to add in a separate field for cancellations
To refine the group work section of the tool
To assess whether it is possible to adjust the tool so that it can advise on the optimal balance between new, follow-up and group work in the situation where there is not enough capacity to meet the demand (the tool already advises on what is needed to match capacity to demand).
To assess whether it is possible for the summary results to include some indication of the margins of error around them.
Mental Health Activity Tracker (MHAT). The work has also informed the development of the MHAT Tool and related guidance – including information on the read across to existing tools such as Consultant Job Planning Guidance. Further, the difficulties with getting the data analysed informed the decision to develop a database that automates the MHAT analysis and the aim is to have this available for NHS Boards by Spring 2013.
Effective and Efficient CMHS Toolkit. The work has informed the development of the Effective and Efficient CMHS Toolkit – which includes sections on practically how to do Demand, Capacity and Activity Analysis within community mental health teams/psychological therapy services. The final version of this toolkit (due in Spring 2013) will include case study examples from the Lothian Early Implementer work.
Mental Health DCAQ Webinar. A series of webinar sessions is being planned for 2013 and this work will inform both the focus and content of these sessions. CMHS Improvement Dataset. Finally, this work is informing national work to develop a set of example reports to enable the effective management of community mental health services.

22
2.3 Next Steps for NHS Lothian This project has been invaluable in terms of informing our planning of what needs to be done across Lothian to enable delivery on the Psychological Therapies HEAT target. We have ensured that we have maximised this early implementer opportunity by linking to complementary workstreams which include:
o The NES funded Psychological Therapies Training Coordinator has to date made a significant contribution to establishing a baseline for staff competencies and skills in psychological therapies. Guidance has been produced in relation to the 17 formal modalities which will be delivered by staff who are trained and supervised across Lothian. It is against these 17 modalities that we have developed processes to record and measure and monitor our waiting times for psychological therapies.
o The explicit linking of the early implementer project to the work led by the
Transformation Station on collecting outcome measures as routine practice has created a firm foundation in our understanding of the differences in terms of clinical outcomes that evidence based therapies are having on patients.
o Implementation of “A Sense of Belonging” , Lothian’s joint mental health and wellbeing
strategy 2001-2015 which sets out we will improve six outcomes: o More people will have good mental health o More people with mental healthy problems will recover o More people with mental health problems will have good physical health o More people will have a positive experience of care and support o Fewer people will suffer avoidable harm o Fewer people will experience stigma and discrimination
through priority actions which tackle health inequalities, embed recovery and a living well ethos, build social capital and wellbeing and improve services for people across Lothian for people all ages.
The national Quest Funding will increase our capacity to enable a consistent model to be rolled out across Lothian using the learning from East and Midlothian to inform this. Success of this is premised on ownership of the target by all staff working in mental health services not just those delivering psychological therapies. As the funding is time limited we believe it is essential to give this work a clear identity and ensure it is managed as a distinct project using Prince 2 methodology. The “Lothian Meets A12” team will be ready to commence in early February 2012 and their aims are to:
o Ensure system-wide ownership of A12 o Drive forward wider mental health improvement work o Ensure that CORE 34 is used as standard outcome measure by all delivering
psychological therapies in Lothian and thus increase our knowledge of what works for whom and how best to deliver the various modalities in the most effective and efficient manner.

23
o Improve our understanding of referral pathways enabling informed discussion on increasing access to those who may most benefit
o Improve our understanding of patient flow and system throughput to ensure timely access and treatment
o Ensure that complete, accurate and timely reports are available to clinical teams and management and that these reports reflect end user requirements
o Build a better understanding of why patients do not attend and test different approaches to reduce DNA rates.
o Complete the necessary service redesign which will improve access to psychological therapies and address issues of equity
o Ensure that sustainable training and supervision is in place to enable the delivery of each if the identified 17 PT modalities
The Team will also ensure that we measure our waiting times for mental health services not just psychological therapies waiting times. It’s essential that we retain a wider focus on all interventions and treatment that can contribute and improve a person’s mental health and wellbeing. NHS Lothian and partners remain committed to sharing our learning to date and to learning from other Board areas and we look forward to strengthening our national learning networks.

24

25
3 Overall Approach Used to Deliver the DCAQ Outputs The following flow chart outlines broadly the steps that were undertaken in running this DCAQ project
1. Project initiation document prepared and signed of by Project Sponsor
2. Project Team identified and roles assigned
4. Assess data required for DCAQ analysis against data available in local system(s)
Clarify definitions and data flow for existing data
More than one information source?
Compare data sources to determine which is more robust. Analysis may require a combination of sources
Identify gaps in data available in relation to what’s needed for analysis
8. Refine data where necessary
3. Obtain high level process map of service in order to understand what the data should reflect
Is there a standard process for collecting data?
If not, decide whether possible to move on with analysis with current data collection issues or to implement new process before continuing
5. Agree work required to address issues identified, inclusive of clear timescales and responsibilities
6. Do initial analysis of DCAQ
Consider how best to fill gaps for this analysis and how to address for ongoing analysis of demand and capacity
If using historical data, consider whether definitions have changed in time period
7. Meet service leads to discuss initial results and to clarify any perceived data quality issues
10. Discuss results with service and scenario model changes to current processes to identify opportunities for improvement
11. Agree tests of change from analysis and timescales for revisiting analysis to assess impact of changes made
9. Redo analysis
Iden
tify and
act on
imm
ediate o
pp
ortu
nities to
man
age Dem
and
and
extend
Cap
acity

26

27
4 Service Context 4.1 East Lothian Psychological Therapies Service - Service Description East Lothian Psychological Therapies Service (ELPT) provides psychological therapies for people aged 18 – 65 who require high intensity and highly specialist levels of intervention. Individual and group models of delivery are available. Part of an integrated approach to provision of Mental Health services in East Lothian, the service also provides consultancy, supervision and liaison for those providing lower level interventions. For further details, please contact Patricia Graham [email protected] . Psychological therapies are provided by a range of professionals across the area; however this analysis focuses on two parts of the service. The analysis is split in to two groups to reflect the different streams of demand. The “Therapists” mainly see cases at levels 3 and 4 of the Matrix, and the “Psychologists” only provide psychological therapy where the need is deemed to match a high level of severity with a severe effect on functioning and who cannot be dealt with by the Therapists. People whose needs fall into level 2 of the Matrix are seen by another service in the area.
High Level Process Map
28
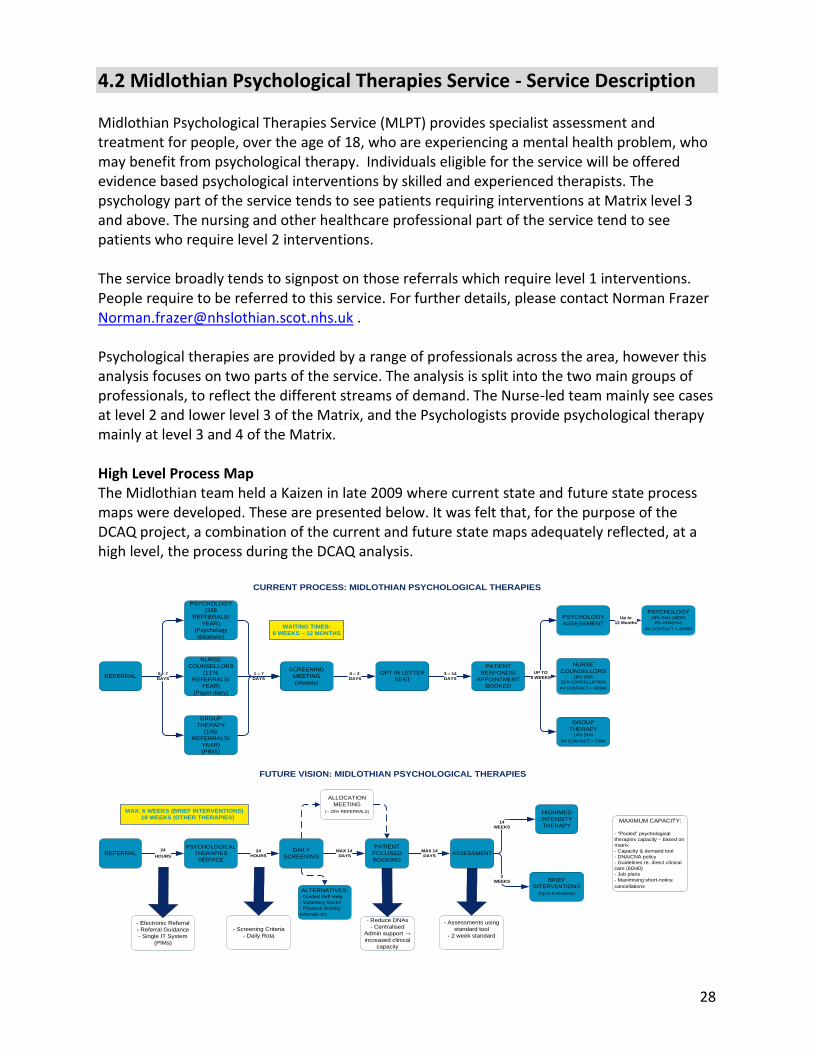
4.2 Midlothian Psychological Therapies Service - Service Description Midlothian Psychological Therapies Service (MLPT) provides specialist assessment and treatment for people, over the age of 18, who are experiencing a mental health problem, who may benefit from psychological therapy. Individuals eligible for the service will be offered evidence based psychological interventions by skilled and experienced therapists. The psychology part of the service tends to see patients requiring interventions at Matrix level 3 and above. The nursing and other healthcare professional part of the service tend to see patients who require level 2 interventions. The service broadly tends to signpost on those referrals which require level 1 interventions. People require to be referred to this service. For further details, please contact Norman Frazer [email protected] . Psychological therapies are provided by a range of professionals across the area, however this analysis focuses on two parts of the service. The analysis is split into the two main groups of professionals, to reflect the different streams of demand. The Nurse-led team mainly see cases at level 2 and lower level 3 of the Matrix, and the Psychologists provide psychological therapy mainly at level 3 and 4 of the Matrix. High Level Process Map The Midlothian team held a Kaizen in late 2009 where current state and future state process maps were developed. These are presented below. It was felt that, for the purpose of the DCAQ project, a combination of the current and future state maps adequately reflected, at a high level, the process during the DCAQ analysis.
NURSE
COUNSELLORS
(1176
REFERRALS/
YEAR)
(Paper diary)
PSYCHOLOGY
(338
REFFERALS/
YEAR)
(Psychology
database)
GROUP
THERAPY
(105/
REFERRALS/
YEAR)
(PIMS)
SCREENING
MEETING
(Weekly)
OPT IN LETTER
SENT
PATIENT
RESPONDS/
APPOINTMENT
BOOKED
GROUP
THERAPY14% DNA
AV CONTACT = 7/WK
PSYCHOLOGY19% DNA (NEW)
8% DNA(F/U)
AV CONTACT = 40/WK
NURSE
COUNSELLORS18% DNA
21% CANCELLATION
AV CONTACT = 43/WK
3 – 14
DAYS
0 – 7
DAYSREFERRAL
1 – 7
DAYS
UP TO
8 WEEKS
PSYCHOLOGY
ASSESSMENTUp to
12 Months
0 – 2
DAYS
CURRENT PROCESS: MIDLOTHIAN PSYCHOLOGICAL THERAPIES
WAITING TIMES:
8 WEEKS – 12 MONTHS
PSYCHOLOGICAL
THERAPIES
SERVICE
DAILY
SCREENING
PATIENT
FOCUSED
BOOKING
ASSESSMENT
BRIEF
INTERVENTIONS
(Up to 6 sessions)
HIGH/MED
INTENSITY
THERAPYMAXIMUM CAPACITY:
- “Pooled” psychological
therapies capacity – based on
matrix
- Capacity & demand tool
- DNA/CNA policy
- Guidelines re. direct clinical
care (60/40)
- Job plans
- Maximising short-notice
cancellations
2
WEEKS
14
WEEKS
- Electronic Referral
- Referral Guidance
- Single IT System
(PIMs)
- Screening Criteria
- Daily Rota
- Reduce DNAs
- Centralised
Admin support →
increased clinical
capacity
- Assessments using
standard tool
- 2 week standard
FUTURE VISION: MIDLOTHIAN PSYCHOLOGICAL THERAPIES
MAX: 6 WEEKS (BRIEF INTERVENTIONS)
18 WEEKS (OTHER THERAPIES)
ALLOCATION
MEETING
(~ 20% REFERRALS)
24
HOURS
24
HOURS
MAX 14
DAYS
MAX 14
DAYS
ALTERNATIVES:- Guided Self Help
- Voluntary Sector
- Physical Activity
referrals etc
REFERRAL

29
5 Demand Analysis
5.1 Estimating Demand Ideally a team needs the ability to predict the level of demand it experiences and assess whether it has enough capacity to meet it. For psychological therapy teams/community mental health services, demand is the total time needed to respond to the referrals presenting and hence estimates of demand in a given time period can be made by looking at the number of new assessments required, the average number of follow-ups per new assessment and the average length of new and follow-up appointments. In addition, where services are running groups, then data around group work also needs to be fed into the analysis. The QuEST Mental Health DCAQ resources recommend using historical activity data to derive assumptions around the predicted number of referrals, average number of contacts per person and the length of each appointment. Services can then use these to model their predicted demand. However, the accuracy of the estimate will depend on the following issues:
1. accuracy of the historical data recording (please see section 9 of report for more information on data accuracy issues for the two project sites);
2. the level of variation around the average for each of these key data points and ; 3. whether the historical data is representative of current practice.
Issues around accuracy of data recording are picked up in Section 9 of this report. Where, available, information on the level of variation around the average is included for each key data point. Further, where possible, the data has been reviewed to assess any existing trends that may need to be accommodated in the analysis. Where there are no trends, the assumption is made that the historical data is reasonable to use as a representation of current practice.

30
5.2 Estimating Demand for ELPT and MLPT
5.2.1 Key Variable One - Referrals East Lothian Psychological Therapies The following run chart shows the average number of referrals received each month by ELPT service. Applying run chart rules (see Appendix A for more info) there is no statistically significant trend at present and therefore it is reasonable to use the overall average to predict the future demand on the service. However, this conclusion may change as more data points are gathered.
East Lothian Psychological Therapies
Nov11 - Aug 12: Referrals
5262
8376
69
98 102
73 72
93
0
20
40
60
80
100
120
Nov Dec Jan Feb Mar Apr May Jun Jul Aug
Month
Refe
rrals
Referrals
Median number ofReferrals
This chart also shows that there is significant variation month on month with nearly twice the number of referrals in May 12 compared to Nov 11. Managing this level of monthly variation will present challenges for the team, though an 18 week target should present sufficient flexibility to manage even this level of monthly variation. Midlothian Psychological Therapies Service The following run chart shows the average number of referrals received each month by MLPT service. Applying run chart rules (see Appendix A for more info) there is no statistically significant trend at present and therefore it is reasonable to use the overall average to predict the future demand on the service. However, this conclusion may change as more data points are gathered.

31
Midlothian Psychological Therapies
Referrals Oct 11 - Aug 12
10396 100
8391
102
69
119
89
120
83
0
20
40
60
80
100
120
140
Oct-11 Nov-11 Dec-11 Jan-12 Feb-12 Mar-12 Apr-12 May-12 Jun-12 Jul-12 Aug-12
Month
Nu
mb
er
of
Re
ferr
als
Referrals
Median
This chart also shows that the system was relatively stable between Oct 11 and Mar 12. However, greater levels of variation between monthly referrals levels have been seen from April 12 to Aug 12. There is no known reason for this change and further it’s not clear with this amount of data whether this is a significant or sustained change. However, if it continues then managing this level of monthly variation will present challenges for the team, though an 18 week target should present sufficient flexibility to manage even this level of monthly variation.
Recommended Action Managing high levels of variation is always challenging. Sometimes there is no option as the variation is naturally occurring. Other times the variation is a symptom of the way the system is designed and/or the behaviour of individuals working in the system. It would be useful to understand more about the level of variation in referrals to psychological services to assess whether there is anything that can be done to reduce it and hence smooth the workload. NHS Lothian may want to compare the levels of variation across teams to see if there are common seasonal trends. Further, breaking the referral data down by GP practice may provide additional insights.
5.2.2 Key Variable Two - Opt Outs and Referred Elsewhere To work out the number of new assessments needed, the total number of new referrals needs to be adjusted for any opt-outs and for any individuals referred on without being seen. The number of people opting out each month is dependent in part on the number of new referrals received. Therefore it is useful to track the % of new referrals each month who opt out to see if there are any significant changes to this over time that will impact on demand and hence the ability to meet waiting time targets. However, looking at percentages only works if

32
there is a system for linking the opt-in back to the month the initial referral was received. Otherwise, the percentage data is not valid. Neither ELPT nor MLPT currently have a system to do this. Further, data input for opt-ins is batched. These two issues combined mean it is not possible to draw any conclusions about the levels of variation as:
Percentage data is not valid if the number of individuals opting out (numerator) comes from a different data set to the referrals for that month (denominator).
Looking at variation in total numbers of opt-ins/opt-outs per month is not useful as this will be partly dependent on the total number of referrals received that month.
Therefore it has not been possible to assess any trends in opt-in/opt out rates or to assess the level of variation. For the DCAQ analysis, the percentage figures has been calculated by taking the total number of individuals opting out over the time period and dividing this by the total number of referrals over that same time period. East Lothian Psychological Therapies Service 153 people opted out of ELPT from Nov 11 to Aug 12 and 28 people were referred on elsewhere without being seen. A recent change to processes in ELPT has been to stop opting in patients who are internal referrals as engagement in the service has already been established in these cases and the onus is on the referring clinician to ensure that the individual is informed and on-board with the onward referral. Midlothian Psychological Therapies Service 216 people opted out of MLPT from Nov 11 to Aug 12 and 159 people were referred on elsewhere without being seen. In June 2012, MLPT conducted a review of the reasons why individuals were opting out. Out of 135 referrals that month, 33 opted out. There were no contact details for 11 of these, 2 did not answer calls and 20 were contacted. The reasons for opting out fell into the following broad categories.
Reason for Opting Out Numbers
Feeling better or circumstances changed 5
Did not feel ready to start therapy 2
Practical problems, e.g. child care, work commitments. 6
Unhappy with the process or previous experience 7
Recommended Action Regular monitoring of referral numbers in a run chart format is a key way to spot any
statistically significant changes that may then result in an increase in the overall level of demand being experienced, and hence a services ability to meet waiting time targets. Referral data in this format should be routinely available to all community mental health services.
Ideally the chart also needs to include the actual demand for new assessments (which

33
equals referrals minus opt outs minus referrals referred on without seeing) as a significant movement in referrals may not translate to a significant increase in demand for new assessments, depending on movements in the other two variables (opt-in rates and referrals on without seeing).
However, for this run chart to be valid, the opt-in and referrals on without being seen data needs to be recorded for each individual against the initial month the referral was received.
5.2.3 Key Variable Three - New to Follow-Up Ratios Another key influence on the level of demand is the number of times an individual is seen. Again, tracking the average new to follow-up ratio over time is a useful way to identify if it is reasonable to use the historic average to predict future demand as the run chart will highlight any existing trends. The ideal is to chart the information at an individual patient level in date order of discharge. This would still be anonymous as it would only identify the date of discharge and number of follow-ups. However, as this information was not available for ELPT or MLPT the next best analysis was undertaken. This involved taking the total number of follow-up appointments that month and dividing it by the total number of new assessments conducted in the month. This gives an average no of follow-ups for each new on a monthly basis. Ideally, the average should be quoted with information on the standard distribution, to give some indication of the dispersal around the average. Further, if using this approach, services may want to consider the use of monthly box plots. For more information on calculating new to follow-up ratios please refer to QuEST Mental Health New to Follow-Up Guidance: http://www.qihub.scot.nhs.uk/media/223293/dcaq%20-%20new%20to%20follow%20up%20ratio%20methods%20paper%20v1.doc East Lothian Psychological Therapies Service
East Lothian Psychological Therapies
Nov 11 - Aug 12: 1st Appts and followups in
the month
7
14
87
10
6
8
6 5
10
0
2
4
6
8
10
12
14
16
Nov Dec Jan Feb Mar Apr May Jun Jul Aug
Month
Num
ber
of fo
llow
ups
for
each
1st
app
t
Followups for eachnew
Median

34
This chart highlights an average of 7.5 follow-ups for each new assessment. Decembers figure looks like an outlier (though more data points are needed to establish this). This is explained by a significantly lower number of new assessments being offered in December than in other months with the focus being on individuals already on the caseload. Midlothian Psychological Therapies Service
Midlothian Psychological Therapies
Oct 11 - Aug 12: 1st Appts and followups in
the month
78
7
5
6
8
6
7 8
6
4
0
1
2
3
4
5
6
7
8
9
Oct Nov Dec Jan Feb Mar Apr May Jun Jul Aug
Month
Num
ber o
f fol
low
ups f
or
each
1st
app
t
Followups for eachnew
Median
This chart highlights an average no of 6.5 follow-ups for each new assessment.
5.2.4 Key Variable Four - Group Work Calculating the demand for group work is complicated. However, for the sake of this analysis, an overall average number of sessions per group (10) and an average number of people who can be accommodated per group (12) was used. As there was limited historical data on the percentage of new referrals who access groups (either with or without individual therapy), the teams estimated that 20% of referrals go into group work and that no one receives both individual therapy and a group response.
Recommended Action Further work is needed locally to ensure accurate information on the % of new referrals
which go into groups.
Further work is needed by the MH QuEST Team to review how to effectively accommodate group work into a DCAQ analysis.

35
5.2.5 Other Variables Informing Demand Analysis The other data that was used in the demand modelling was:
ELPT Data MLPT Data Comments
Average length of assessments (1 hr), follow-up slots (1 hr) and group sessions (2 hrs)
Average length of assessments (1 hr), follow-up slots (1 hr) and group sessions (2 hrs)
Clinician estimate used
Average clinical admin time per contact (1.1 hrs)
Average clinical admin time per contact (1 hrs)
Finding from activity audit used
Average clinical admin time per group session (2 hrs)
Average clinical admin time per group session (2 hrs)
Group schedules/clinical estimate used
Average no of staff involved in delivering groups (2)
Average no of staff involved in delivering groups (2)
Group schedules/clinical estimate used
1st and follow-up DNA rates 1st and follow-up DNA rates PIMS data used. See section 6.6.3 for more detail around DNA rates.
5.2.6 Actual Estimate of Demand All of this data was then fed into the DCAQ Tool which is set up to do the relevant sums and provide an estimate of how many clinical hours are needed per week to respond to the current levels of referrals. It uses averages and assumptions within the model so there will be margins of error around this analysis. The following tables highlight the outputs from the DCAQ Tool: East Lothian Psychological Therapies Service
NB, at first sight it looks like there is a discrepancy between the previous analysis which highlighted that each new assessment has an average of 7.5 follow-ups and this analysis which shows that the service only needs 5.5 follow-up sessions for each new assessment. However, this is not a discrepancy. The difference is accounted for by the fact that 20% of new assessments receive a group intervention only. If the service didn’t operate any groups then the two figures would be the same.
DEMAND ACTUAL
Hours per week Hours per
week
Your average weekly demand: Incl. Clin.
Admin Excl. Clin.
Admin
Your average weekly demand for first assessments: 29 14
Your average weekly demand for follow ups: 163 77
Your average weekly demand for group work: 31 15
Your average weekly demand for all client work (hours) 222 107
Your average weekly demand for all client work as WTE 5.9 2.8

36
On the basis of each new and follow-up assessment taking 1 hour, this table highlights that for the system to be in balance the service needs to accommodate:
14 new sessions per week and 77 Follow-Up sessions per week (which translates to 5.7 follow-up slots for every new assessment slot).
Further if groups run for an average of 1 hour with 2 staff then this analysis indicates that for the system to be in balance Midlothian Psychological Therapies Service need to be running:
7-8 groups per week. However, the analysis does not provide information on the type of group work needed. This would need to be worked out separately. One way of doing this is to take a years worth of data and see how many people accessed which types of groups. In addition the service needs to look at the numbers on the waiting list at the end of the snapshot period by group type. The total of these two figures by group type will give the demand and from this the team can work out how many groups a year of which type would accommodate that demand.
At first sight the average demand for group work looked high and there was concern that using one overall average figure for the number of sessions per group and average number of people accommodated per group was overly inflating this. Further, the figure on % of new referrals accessing groups is estimated. However, an analysis of the time currently being spent on group work highlighted approximately 12 hours per week excluding clinical admin and 23 hours including clinical admin. Given that this calculation is looking at what is actually required to meet the ongoing demand and there are currently waiting lists, it appears to be reasonable.
Midlothian Psychological Therapies Service
DEMAND ACTUAL
Hours per week Hours per week
Your average weekly demand: Incl. Clin. Admin Excl. Clin. Admin
Your average weekly demand for first assessments: 28 14
Your average weekly demand for follow ups: 149 75
Your average weekly demand for group work: 35 18
Your average weekly demand for all client work (hours) 213 106
Your average weekly demand for all client work as WTE 5.7 2.8
On the basis of each new and follow-up assessment taking 1 hour, this table highlights that for the system to be in balance the service needs to accommodate:
14 new sessions per week and 75 follow-up sessions per week (which translates to 5.3 follow-up slots for every new assessment slot).

37
Further if groups run for an average of 1 hour with 2 staff then this analysis indicates that for the system to be in balance Midlothian Psychological Therapies Service need to be running:
9 groups per week. However, the analysis does not provide information on the type of group work needed. This would need to be worked out by looking at the group work currently in place and the numbers going onto waiting lists by group type. Further, it was not possible to get accurate information on the current group work profile to compare with this predicted need.

38

39
6 Capacity And Activity Analysis
6.1 Capacity and Activity Capacity is the total resource available to do the work. It includes staff and any equipment needed. Ideally, services should be using a job planning system to identify how a staff member should split their time over the week. A job plan should clearly identify how much time is available for direct client contact. Further, to enable effective management of the service the job plan needs to identify how much of that time should be spent seeing new assessments and how much is allocated for follow-up work. In the absence of job plans, an activity audit can be used to work out the team’s capacity for direct client work. Activity is the actual work done. It is different from capacity as a team may have the ability to see 12 service users in a week but only see 10 of them as 2 do not attend (DNA). So the capacity of the services was 12 but the activity was 10. In an ideal world, the routine activity reports would provide detailed information on how team members are currently spending their time. However, at the moment most community mental health services across Scotland can only pick this information up through the use of snapshot audits of activity.

40
6.2 Calculating Current Capacity for Direct Client Work The MH DCAQ enables services to estimate their current capacity for direct client work. It uses averages and assumptions within the model so there will be margins of error around this analysis. However, it provides a useful ball park to then compare with the estimated demand. It also highlights the total number of hours being spent at allocation meetings as this is a key area where many services could release time into clinical work. However, as both East Lothian and Midlothian have already addressed their allocation processes, there are no opportunities here for releasing time to clinical work. East Lothian Psychological Therapies Service The following table highlights the output from the DCAQ Tool for East Lothian Capacity analysis:
CAPACITY ACTUAL
Your average capacity per week: Hours per
week WTE
Capacity available for direct client work 82 2.2
Capacity available for direct client work and clinical admin: 171 4.6
Capacity spent on all other activities 115 3.1
Total no. of staff hours per week spent at allocation meeting: 2.0 0.1
Applying the ratio of 5.7 follow-ups for every new assessment, the service has the capacity to see 12 new assessments and 68 follow-ups each week. However, this assumes no time is allocated for group work. On average, the service currently spends 23 hours a week delivering groups (including clinical admin) leaving 148 hours for individual work (including clinical admin). Adjusting for clinical admin time leaves 70 hrs available for direct client work. Applying the ratio of 5.7 follow-ups for every new assessment, and applying the assumptions about the way the service currently operates, it currently has the capacity to see 10 news and 57 follow-ups each week. This compares with a predicted demand of 14 new assessments and 77 follow-up slots per week.

41
Midlothian Psychological Therapies Service At present Midlothian have 1.4 WTE staff on maternity leave and there is not cover in place for these individuals. The following table shows their currently available capacity and the budgeted capacity (which includes the two staff on maternity leave):
CAPACITY ACTUAL
CURRENT
BUDGETED
(including mat leave posts)
Your average capacity per week: Hours per
week WTE
Hours per week
WTE
Capacity available for direct client work 77 2.1 92 2.4
Capacity available for direct client work and clinical admin
155 4.1 183 4.9
Capacity spent on all other activities 117 3.1 139 3.7
Total no. of staff hours per week spent at allocation meeting:
3 0.1 3 0.1
Applying the ratio of 5.3 follow-ups for every new assessment, the service currently has the capacity to see 12 new assessments and 64 follow-ups each week. However the budgeted capacity (so including the 1.4 posts on maternity leave) is 15 new assessments and 77 follow-ups each week. However this assumes no time is allocated for group work. It has not been possible to work out the current capacity for news and follow-ups including group work without knowing how much time is currently spent on group work. As the team is currently redesigning its group work programme this data is not available.
Key Learning The current MH DCAQ Tool only provides a figure for the total hours of clinical capacity available. The aim of this is to highlight whether, in total, there is enough time available to meet the demand presenting. Where there is not enough capacity, teams may still want to know what the optimal split is between new assessments, follow-up assessments and group work to ensure that, once people have entered the system, they then move smoothly through it.
Further work is needed to assess whether it is possible/desirable to adjust the tool to do these calculations automatically. However, even if it is, the key issue will still remain getting enough capacity overall to meet the demand. Otherwise waiting lists will continue to grow.

42
6.3 Setting Capacity Using Job Plans The demand analysis in Section 5 highlighted that to meet the current level of demand:
ELPT Team needs to be providing 14 new slots and 77 follow-up slots a week and 15 groups over a two week period.
MLPT Team needs to be providing 14 new slots and 75 follow-up slots a week and 9 groups a week.
This would allow the teams to respond to the ongoing referrals into the service. However, additional one off capacity would still be needed to clear the queue. The Phase One report recommended implementing a job planning system. This would enable the team to quickly assess its capacity against the number of news and follow-ups highlighted above. If the team does not have sufficient capacity to meet the level of demand, then it should still use the ratio of new slots to follow-up slots in the job planning process, whilst at the same time pursuing other options to increase capacity.
For ELPT the ratio is 5.7 for each new slot.
For MLPT the ratio is 5.3 follow-ups for each new slot. There will be margins of error attached to this analysis, but it is a good place to start. If the overall waiting list then starts to consistently reduce, this would indicate that this is too much capacity on an ongoing basis. If it continues to increase then this will indicate that it is not enough capacity. However, the level of monthly variation identified in the demand analysis means that, with static capacity, there will be natural variation in the length of the queue and hence care needs to be taken not to jump to conclusions too quickly and hence over-interpret any changes to queue length. For this approach to work (i.e. allocating a set number of new and follow-up slots per week), the teams need to have a system whereby the treatment is not necessarily provided by the same person who assesses the individual. The reason for this is that the level of variation in the number of follow-ups needed means that an individual clinician may frequently find themselves in the situation where they are assessing someone in their new slots whilst their follow-up/treatment slots are all full. However, it will be likely that, at that point in time, another clinician in the team has spare capacity in their treatment slots. This approach is now widely used in CAMHs services and is a key component of an approach used called the CAPA model. Both East Lothian Psychological Therapies services and Midlothian Psychological Therapies Services are already set up to enable a different person to assess to the person providing the treatment, so they are well placed to use job planning processes to ensure the right balance of new and follow-up slots is in place each month to keep the system in balance.
Recommended Action The recommendation from the Phase One report to implement a job planning system is still valid. ELPT are committed to doing this, but the action was put on hold whilst work progresses to agree a consistent approach across the whole of NHS Lothian Psychological Therapies and Psychology Services. ELPT may benefit from piloting an approach to job planning so that they can move ahead with putting a planned balance of new and follow-up slots in place.

43
Key Learning Services need to move to a more planned approach to the allocation of new and follow-up slots to keep the system in balance. DCAQ analysis can help to identify ball park figures for this, which can then be altered at the margins through practical testing. However, if there are high levels of variation in new to follow-up rates then effective implementation of this approach is likely to depend on a system where the person assessing does not necessarily provide the treatment. This approach has already been rolled out across most CAMHS services and is called the CAPA model. Adult psychological therapies services may benefit from discussion with CAMHS colleagues about the model and how it works in practice. Its important to note that CAPA allows for individuals to receive treatment from the assessing clinician if they have they right skills, the individual wants to stay with them and the individual can be seen for follow-up within an acceptable time period.

44
6.4 Activity – understanding how time is currently spent In an ideal world, the routine activity reports would provide information on how team members are currently spending their time. However, at the moment most psychological therapy services / community mental health services across Scotland can only complete a detailed analysis through the use of snapshot audits of activity.
6.4.1 East Lothian Psychological Therapies Service Activity Analysis The Phase One ELPT Activity Audit identified that a significant proportion of time was being spent on ‘other’ (18%) and hence there was a need to break this down further to understand if there are opportunities within this for releasing time back to client work. In response to this, ELPT undertook a more detailed Activity Audit in June 2011. Data was collected over a period of two weeks from 14 members of the team. Some of the key results are displayed below. Analysis was fed back to the team at service level and at healthcare professional level. The following table shows the average hours per week that were available during the audit, by staff group and by direct, indirect and non-clinical activities. Percentage of available time for each staff type is also shown, subject to rounding errors.
Average hours available per week during audit, for each staff group, by activity category
All Activities
Direct Client Activities
Indirect Client Activities
Non-clinical Activities
Staff Type Total Hours available
Hours spent
% Hours spent
% Hours spent
%
Therapist 160.3 57.3 36% 62.4 39% 40.6 25%
CAAP 57.1 18.5 32% 27.1 47% 11.5 20%
Trainee 61.2 2 3% 10.1 17% 49.1 80%
Psychology 94.6 20.6 22% 38.1 40% 35.9 38%
Overall 373.2 98.4 26% 137.7 37% 137.1 37%
Percentage of average hours per week for each Staff Group by Activity
0% 20% 40% 60% 80% 100%
Sum of Psychology Total
Sum of Trainee Total
Sum of CAAP Total
Sum of Therapist Total
Direct Clinical Indirect Clinical Non-Clinical Activities

45
The above chart shows the percentage split of direct clinical, indirect clinical and supporting activities by each staff group within the team. Broadly speaking, therapists and CAAPs are achieving a similar amount of direct clinical activity in percentage of hours spent. Psychology spent less direct clinical time in comparison. This aligns with the team’s operational model of delivery where psychology provides supervision to the other groups to a degree that allows the other groups to see the majority of cases.
Trainees (Clinical Psychology & CAAPs)
Trainees were separated out from other capacity, as they represent an occasional (i.e. not constant) type of capacity, unlike staff on permanent or fixed term contracts.
Trainees differ in the type of work they are able to undertake.
Both trainees were involved in inductions during the audit period, hence the high degree of supporting activities.
Trainees’ views of what constituted direct clinical care may have been inconsistent across the audit period.
Chart 2 provides a further breakdown in each category, for all staff groups;
Percentage of Total Hours per week by Activity - All Staff Groups
0% 5% 10% 15% 20% 25%
Assessment
Case review (with patient)
Group Therapy
Other (specify)
Individual Follow up
Clinical Administration (notes, letters, data inputting, therapy prep)
Clinical meeting / discussion
Other (specify)
Supervision - giving
Supervision - receiving
Telephone - (eg other agency, patient for non-therapeutic reasons)
Dealing with emails (other than ones that are clinical admin)
Management
Meetings (non-clinical)
Other (specify)
Research
Training/ CPD (Delivering)
Training/ CPD (Receiving)
Travel
Admin tasks (eg room booking)
Direct C
linic
al
Indirect C
linic
al
Non-C
linic
al A
ctivitie
s
The activity that the highest proportion of time was spent on was Clinical Admin, such as note write-up, data input, therapy preparation and letter writing). Over the entire audit period, Clinical Admin tasks accounted for 24% of all available time. This compares with 26% of available time spent on all Direct Clinical activity taken as a whole. The audit also highlights that an average of 5% of clinical time is being spent dealing with non-clinical emails (2 hrs per staff member, 17 hours in total) and 3% of clinical time is being spent on basic admin tasks such as room booking (1 hour per staff member and 7.5 hours in total)1.
1 Figures per staff member and total hours exclude trainee time spent on this tasks
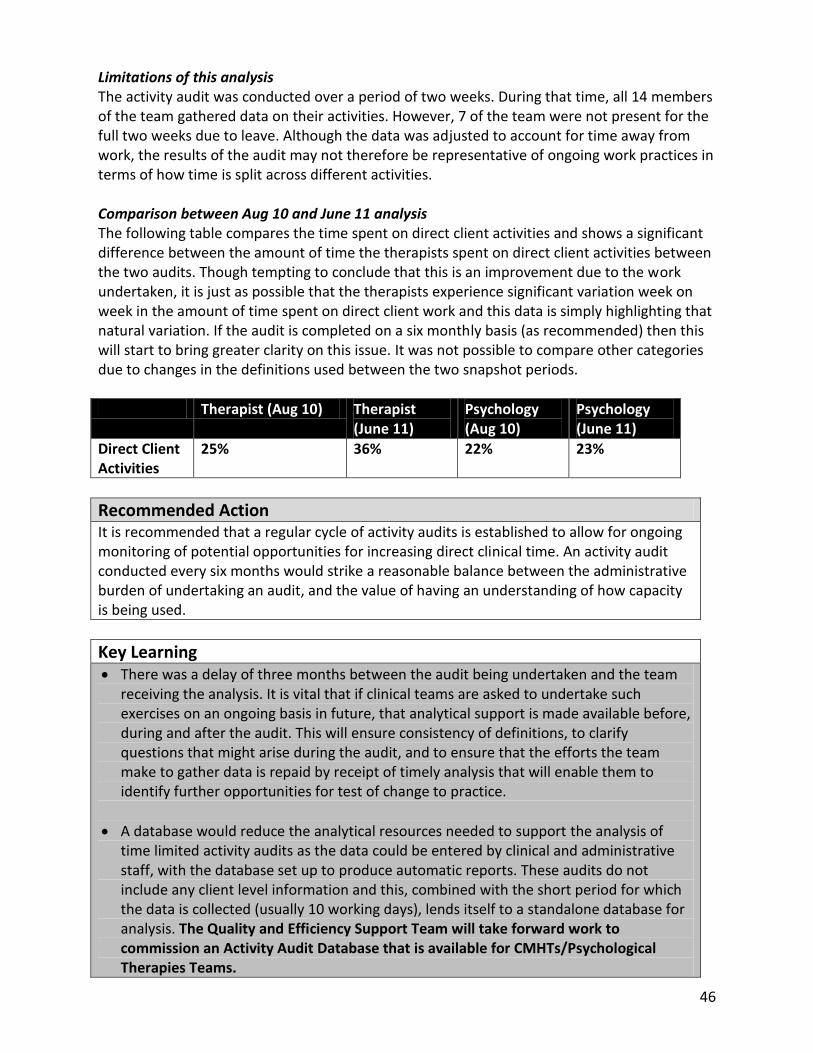
46
Limitations of this analysis The activity audit was conducted over a period of two weeks. During that time, all 14 members of the team gathered data on their activities. However, 7 of the team were not present for the full two weeks due to leave. Although the data was adjusted to account for time away from work, the results of the audit may not therefore be representative of ongoing work practices in terms of how time is split across different activities. Comparison between Aug 10 and June 11 analysis The following table compares the time spent on direct client activities and shows a significant difference between the amount of time the therapists spent on direct client activities between the two audits. Though tempting to conclude that this is an improvement due to the work undertaken, it is just as possible that the therapists experience significant variation week on week in the amount of time spent on direct client work and this data is simply highlighting that natural variation. If the audit is completed on a six monthly basis (as recommended) then this will start to bring greater clarity on this issue. It was not possible to compare other categories due to changes in the definitions used between the two snapshot periods.
Therapist (Aug 10) Therapist (June 11)
Psychology (Aug 10)
Psychology (June 11)
Direct Client Activities
25% 36% 22% 23%
Recommended Action It is recommended that a regular cycle of activity audits is established to allow for ongoing monitoring of potential opportunities for increasing direct clinical time. An activity audit conducted every six months would strike a reasonable balance between the administrative burden of undertaking an audit, and the value of having an understanding of how capacity is being used.
Key Learning There was a delay of three months between the audit being undertaken and the team
receiving the analysis. It is vital that if clinical teams are asked to undertake such exercises on an ongoing basis in future, that analytical support is made available before, during and after the audit. This will ensure consistency of definitions, to clarify questions that might arise during the audit, and to ensure that the efforts the team make to gather data is repaid by receipt of timely analysis that will enable them to identify further opportunities for test of change to practice.
A database would reduce the analytical resources needed to support the analysis of time limited activity audits as the data could be entered by clinical and administrative staff, with the database set up to produce automatic reports. These audits do not include any client level information and this, combined with the short period for which the data is collected (usually 10 working days), lends itself to a standalone database for analysis. The Quality and Efficiency Support Team will take forward work to commission an Activity Audit Database that is available for CMHTs/Psychological Therapies Teams.
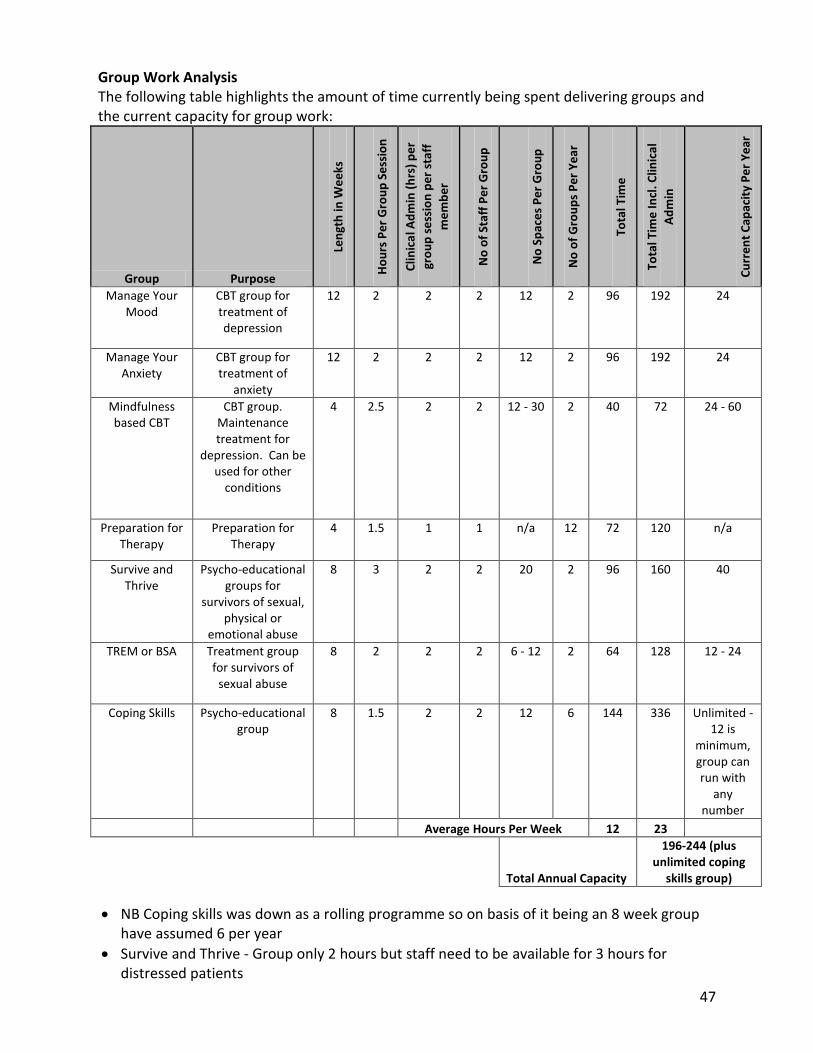
47
Group Work Analysis The following table highlights the amount of time currently being spent delivering groups and the current capacity for group work:
Group Purpose
Len
gth
in W
ee
ks
Ho
urs
Pe
r G
rou
p S
ess
ion
Clin
ica
l Ad
min
(h
rs)
pe
r
gro
up
se
ssio
n p
er
staf
f
me
mb
er
No
of
Staf
f P
er
Gro
up
No
Sp
ace
s P
er
Gro
up
No
of
Gro
up
s P
er
Ye
ar
Tota
l Tim
e
Tota
l Tim
e In
cl. C
linic
al
Ad
min
Cu
rre
nt
Cap
acit
y P
er
Ye
ar
Manage Your Mood
CBT group for treatment of depression
12 2 2 2 12 2 96 192 24
Manage Your Anxiety
CBT group for treatment of
anxiety
12 2 2 2 12 2 96 192 24
Mindfulness based CBT
CBT group. Maintenance treatment for
depression. Can be used for other
conditions
4 2.5 2 2 12 - 30 2 40 72 24 - 60
Preparation for Therapy
Preparation for Therapy
4 1.5 1 1 n/a 12 72 120 n/a
Survive and Thrive
Psycho-educational groups for
survivors of sexual, physical or
emotional abuse
8 3 2 2 20 2 96 160 40
TREM or BSA Treatment group for survivors of
sexual abuse
8 2 2 2 6 - 12 2 64 128 12 - 24
Coping Skills Psycho-educational group
8 1.5 2 2 12 6 144 336 Unlimited - 12 is
minimum, group can run with
any number
Average Hours Per Week 12 23
Total Annual Capacity
196-244 (plus unlimited coping
skills group)
NB Coping skills was down as a rolling programme so on basis of it being an 8 week group have assumed 6 per year
Survive and Thrive - Group only 2 hours but staff need to be available for 3 hours for distressed patients

48
6.4.2 Midlothian Psychological Therapies Service Activity Analysis
The Phase One report recommended that an Activity audit was undertaken across Midlothian Psychological Therapies Service services to understand if there are opportunities for releasing time back to client work. In response to this, MLPT undertook a more detailed Activity Audit in June 2011. The team met to agree categories that would be of interest to them, along with definitions that were appropriate to the local context. The categories were then tested out with two practitioners prior to the full team embarking on an activity audit using those categories. Two weeks worth of data was collected over a period of four weeks to allow for absences to be removed from the calculations. Analysis was fed back to the team leads at service level and at healthcare professional level. The activity audit also provided some data with which to feed the overall DCAQ analysis for Midlothian Psychological Therapies Service.
Key Learning The approach used by Midlothian to the activity audit provides a useful framework for other services. In particular the team’s approach to ensuring discussion and agreement of the categories, testing the amended tool with just two clinicians prior to implementing and ensuring everyone collected 10 working days worth of data, provides a model of best practice for spread.
Activity Audit Analysis The following table shows the average hours per week that were available during the audit, by staff group and by direct, indirect and non-clinical activities. Percentage of available time for each staff type is also shown, subject to rounding errors.
Average hours available per week during audit, for each staff group, by activity category
All Activities
Direct Client Activities
Indirect Client Activities
Non-clinical Activities
Staff Type Total Hours available
Hours spent
% Hours spent
% Hours spent
%
Team Manager 25 2 8% 6.6 26% 16.4 66%
Therapist 229.3 77.5 34% 88.8 39% 63 27%
CAAP 37.9 7.8 21% 17.6 46% 12.5 33%
Trainee 17 3.7 22% 5.9 35% 7.4 44%
Psychology 108.1 28.3 26% 35 32% 44.8 41%
Overall 417.3 119.3 29% 153.9 37% 144.1 35%

49
Percentage of average hours per week for each Staff Group by Activity
0% 10% 20% 30% 40% 50% 60% 70% 80% 90% 100%
Sum of Psychology Total
Sum of CAAP Total
Sum of Trainee Total
Sum of Therapist Total
Sum of Team Manager
Direct Clinical Indirect Clinical Non-Clinical Activities
The chart above shows the average number of hours per week available by Healthcare Professional, as a percentage of overall available time during the audit. Team Manager hours were separated out due to the amount of non-clinical activities that were undertaken during the audit, so as to not to skew the figures for the other categories.
Trainees (Clinical Psychology & CAAPs)
Trainees were separated out from other capacity, as they represent an occasional (i.e. not constant) type of capacity, unlike staff on permanent or fixed term contracts.
Trainees differ in the type of work they are able to undertake.
Both trainees were involved in inductions during the audit period, hence the high degree of supporting activities.
Trainees’ views of what constituted direct clinical care may have been inconsistent across the audit period.

50
Chart 2 provides a further breakdown in each category, for all staff groups;
Percentage of Total Hours per week by Activity - All Staff Groups
0% 5% 10% 15% 20% 25% 30%
Assessment
Case review (with patient)
Group Therapy
Other (specify)
Individual Follow up
Clinical Administration (notes, letters, data inputting, therapy prep)
Clinical meeting / discussion
Other (specify)
Supervision - giving
Supervision - receiving
Telephone - (eg other agency, patient for non-therapeutic reasons)
Admin tasks (eg room booking)
Dealing with emails (other than ones that are clinical admin)
Management
Meetings (non-clinical)
Other (specify)
Other leave (special, mat, pat etc)
Research
Training/ CPD (Delivering)
Training/ CPD (Receiving)
TravelD
irect C
linic
al
Indirect C
linic
al
Non-C
linic
al A
ctivitie
s
The activity that the highest proportion of time was spent on was Clinical Admin, such as note write-up, data input, therapy preparation and letter writing). Over the entire audit period, Clinical Admin tasks accounted for over 25% of all available time. This compares with 29% of available time spent on all Direct Clinical activity taken as a whole.
The audit also highlights that an average of 5% of clinical time is being spent dealing with non-clinical emails (21 hours in total) and 5.4% of clinical time is being spent on basic admin tasks such as room booking (22 hours in total)2. Please see Section 6.5 for further information and recommendations on this.
Psychology spent an average of 42% per week of available time on non-clinical activities. This was high compared with Therapists and CAAPs. However, the total figure is skewed by the inclusion of the lead psychologist whose non-clinical activity was sitting at approximately 60% of time during the audit period.
The CAAP only spent 21% of their time in direct clinical work accompanied by a disproportionately high percentage of time spent in indirect clinical work. In practice this equates to one part-time post holder who, at the time of the audit, was involved in planning/developing a depression group which would have been recorded under indirect clinical contact time. Further, the post holder was on a training course for a day during the audit period and as there only one part time post sitting under this category, the data can be highly skewed by issues such as this. This highlights the importance of using the data to develop an understanding of how time is spent, rather than jumping to judgments based on headline figures.
2 Figures per staff member and total hours exclude trainee time spent on this tasks

51
Levels of Intensity This chart shows how the follow-up work was divided amongst the staff groups in relation to levels of intensity of cases seen during the audit period. Definitions of level of intensity align with those used in The Matrix.
Intensity Levels by Staff Group - Percentage of hours
0% 10% 20% 30% 40% 50% 60% 70% 80% 90% 100%
Sum of Psychology Total
Sum of CAAP Total
Sum of Therapist Total
Sum of Trainee Total
Percentage of hours
Low Intensity High Intensity High Intensity - Specialist Highly Specialist
The largest proportion of Therapist and CAAP direct clinical time was spent doing High Intensity work.
Psychology is the only professional group that saw highly specialist work during the audit period.
Midlothian does not have comprehensive non-statutory therapy providers so the Midlothian Psychological Therapies Service continues to accept a wide range of referrals. However, there was very little time spent seeing low intensity work. This suggests that the team are making good use of lower level self-help materials, given that only a very small proportion of follow-up work was done at level 1 intensity. This aligns with anecdotal evidence of the uptake of such materials in Midlothian. The majority of referrals that do not require the expertise of the team are redirected or returned to referrer.

52
Recommended Action The team may be able to make real inroads on waiting times for the service by exploring
options to redirect some of the level two work in Midlothian to other existing appropriate services such as guided self help and telephone CBT.
The audit highlights that there are opportunities to shift the current focus of some posts so that they spend more time working at a higher intensity level. However, further training and supervision will be needed to ensure that the staff have the appropriate skills to deliver therapies at a higher intensity level. Work should progress to identify the specific therapies for which there is the biggest capacity gap, and to then ensure that current staff are trained up to work in these modalities.
Limitations of this analysis Two weeks worth of data was gathered from each member of staff (pro rata) over a period of four weeks. Although the data was adjusted to account for time away from work, the results of the audit may not be representative of ongoing work practices in terms of how time is split across different activities. For example, there was significant variation between practitioners in relation to Admin Tasks and Dealing with Emails. This variation may be explained by the different working patterns of clinicians – if a clinician had scheduled time to catch up with emails during the audit period, and then we would expect to see a proportionately higher amount of time spent on that activity than a clinician who had not.

53
6.5 Optimising Capacity – Effective Administration Processes
6.5.1 East Lothian Psychological Therapies Service The activity audits highlighted that the highest proportion of time was spent on was clinical admin (such as note write-up, data input, therapy preparation and letter writing). The activity audit highlighted that in total 32% of clinical time is spent on administrative duties which breaks down into:
24% on clinical admin, such as note write-up, data input, therapy preparation and letter writing. This compares with 29% of available time spent on all direct clinical activity taken as a whole.
5% of clinical time (17 hours per week) is being spent on non-clinical emails. This was separated out in the activity audit, as the team had a particular interest in how much time the activity of dealing with emails was taking.
3% of clinical time is being spent on basic admin tasks such as room booking (7.5 hours in total).
In addition, the work has highlighted that the new information flow process, whilst providing a wider range of data, is taking up more clinical time. Not collecting this data is not an option as it is vital for the measurement and management of waiting times. However, given the pressures on the teams, taking further time away from clinical work is also not desirable.
6.5.2 Midlothian Psychological Therapies Service The activity audits highlighted that the highest proportion of time was spent on was clinical admin (such as note write-up, data input, therapy preparation and letter writing). The activity audit highlighted that in total 35% of clinical time is spent on administrative duties which breaks down into:
25% on clinical admin, such as note write-up, data input, therapy preparation and letter writing. This compares with 29% of available time spent on all direct clinical activity taken as a whole.
5% of clinical time (21 hours per week) is being spent on non-clinical emails. This was separated out in the activity audit, as the team had a particular interest in how much time the activity of dealing with emails was taking.
5.4% of clinical time is being spent on basic admin tasks such as room booking (22 hours in total).
The table below provides a comparative costing for the basic admin work being undertaken by a AfC band 7 clinician (approximate average for the service) compared with AfC band 4 admin staff. Costs are calculated using midpoint on each scale. This analysis excludes the time that clinical staff are currently spending reading and responding to non-clinical emails (accounted for on average 5% of time).

54
Average hours per week (during audit) spent by full team on admin tasks
Average hours per week spent by clinical team on non clinical admin tasks
22
Average hours per year spent by clinical team on non clinical admin tasks
924
AfC Banding Band 4 Band 7
Midpoint hourly rate, adjusted for employer costs (21%) £12.34 £21.77
Annual cost of 22 hours per week (using 42 week year, adjusting for leave)
£11,398 £20,119
There are two options identified below for increasing clinical capacity in relation to time spent on admin tasks; Option One 22 extra admin hours per week are resourced. At band 4, using midpoint in scale, adjusted for employer costs, the net cost is £11,398. This would free up clinical time by 22 hours per week, releasing an additional 924 hours of clinical time over the course of the year. Option Two Reduce the contracted clinical hours by £11,398 and reinvest the resource in admin support. This option is cost neutral. At band 7, using midpoint in scale, adjusted for employer costs, this would result in a reduction in contracted clinical resource of 523 hours, equating to 12.5 hours per week. The clinical team would no longer need to spend 22 hours per week on admin activity, resulting in a net gain in clinical hours of 9.5 hours per week, or 399 hours over the course of the year. However, this approach is only viable provided there is no likelihood that the reinvested admin funds generated by reduction in contracted clinical resource for Midlothian Psychological Therapies Service are time-limited, redeployed elsewhere or centralised for use by other services. This would simply result in an overall reduction in clinical capacity in Midlothian Psychological Therapies Service.
Recommended Action The amount of clinical time being spent on administrative tasks is significant. Some of this will be necessary as clinicians must spend time writing up clinical notes. NHS Lothian should prioritise taking work forward to look at how to reduce the administrative burden on community mental health staff. It is unlikely that any one action will be sufficient in isolation, rather a combination of approaches are likely to be necessary including:
Ensuring adequate admin time is allocated to teams so that clinical staff are not undertaking basic admin duties. It is not cost effective to have senior clinical staff undertaking basic administrative duties.
Reviewing and where-ever possible, streamlining information recording processes. This should not just focus on quantitative data but also clinical letters, as tested by ELPT.
Maximising the use of new technologies to reduce the time spent inputting information (i.e. voice activated dictation software, digital pens, etc.).
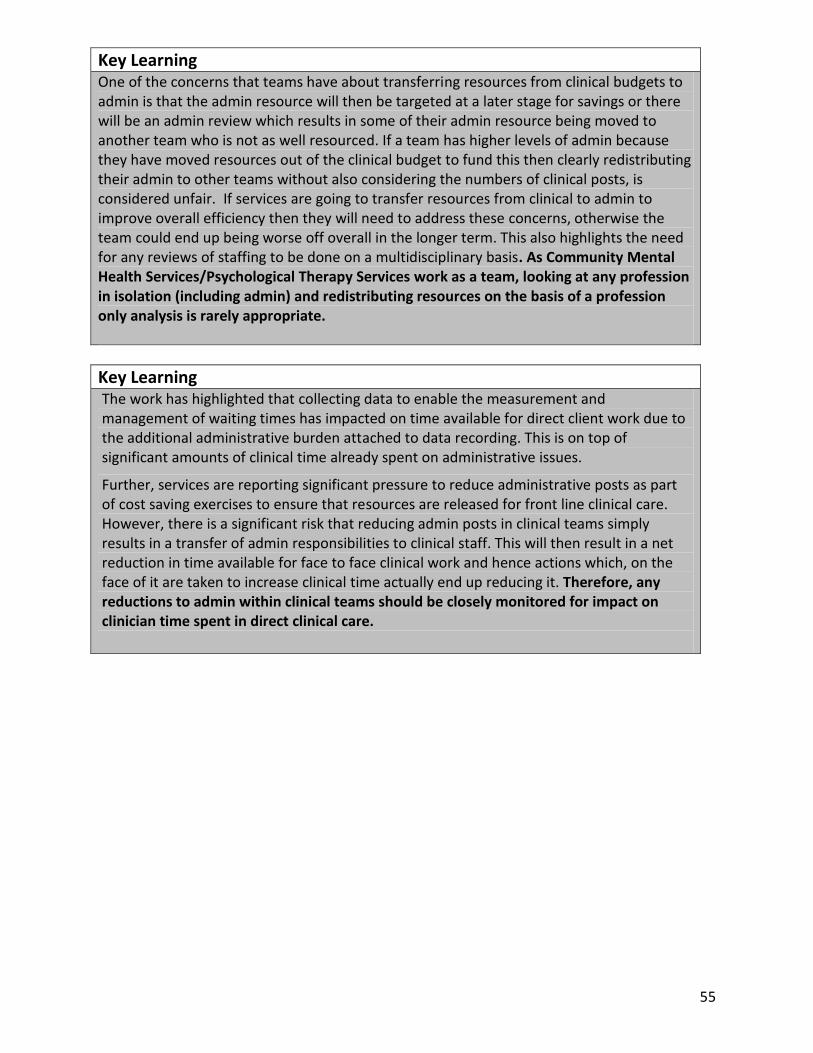
55
Key Learning One of the concerns that teams have about transferring resources from clinical budgets to admin is that the admin resource will then be targeted at a later stage for savings or there will be an admin review which results in some of their admin resource being moved to another team who is not as well resourced. If a team has higher levels of admin because they have moved resources out of the clinical budget to fund this then clearly redistributing their admin to other teams without also considering the numbers of clinical posts, is considered unfair. If services are going to transfer resources from clinical to admin to improve overall efficiency then they will need to address these concerns, otherwise the team could end up being worse off overall in the longer term. This also highlights the need for any reviews of staffing to be done on a multidisciplinary basis. As Community Mental Health Services/Psychological Therapy Services work as a team, looking at any profession in isolation (including admin) and redistributing resources on the basis of a profession only analysis is rarely appropriate.
Key Learning The work has highlighted that collecting data to enable the measurement and management of waiting times has impacted on time available for direct client work due to the additional administrative burden attached to data recording. This is on top of significant amounts of clinical time already spent on administrative issues.
Further, services are reporting significant pressure to reduce administrative posts as part of cost saving exercises to ensure that resources are released for front line clinical care. However, there is a significant risk that reducing admin posts in clinical teams simply results in a transfer of admin responsibilities to clinical staff. This will then result in a net reduction in time available for face to face clinical work and hence actions which, on the face of it are taken to increase clinical time actually end up reducing it. Therefore, any reductions to admin within clinical teams should be closely monitored for impact on clinician time spent in direct clinical care.

56
6.6 Optimising Capacity – Reducing DNA and CNA A large proportion of appointments in mental health are lost each year due to service users either not attending or cancelling their appointments. Whilst many staff use this time to catch up on clinical admin, emails or other work, as you cannot predict when it will happen, it is not the most effective way to manage time and can actually put additional stresses in the system when service users don’t DNA (if for instance the staff member was hoping to use some DNA time to pick up an urgent issue). Further, not all staff will have access to the resources they need to make the best use of the time when a service users DNAs (e.g. email, relevant case notes, etc.). Finally, you are occupying a clinical room un-necessarily that a colleague might otherwise be able to make use of.
6.6.1 Analysis of DNA/CNA rates for ELPT The following run charts highlight the DNA and CNA rates for new and follow-up appointments. Again there is significant variation around the average but no statistically significant trends over time, though a couple more data points may reveal a downward trend in the percentage of follow-ups cancelled.
East Lothian Psychological Therapies
Nov 11 - Aug 12: Percentage of 1st Appt DNA
12
23
14
18
25
8
26
16 16
22
0
5
10
15
20
25
30
Nov Dec Jan Feb Mar Apr May Jun Jul Aug
Month
Pe
rce
nta
ge
1st app DNA %
%Median
East Lothian Psychological Therapies
Nov 11 - Aug 12: Percentage of 1st Appts
Cancelled
1316
10
7
26
911
1416 16
0
5
10
15
20
25
30
Nov Dec Jan Feb Mar Apr May Jun Jul Aug
Month
Pe
rce
nta
ge
1st app Cancelled%
%Median
East Lothian Psychological Therapies
Nov 11 - Aug 12: Percentage of followup DNA
18
1314 14
17
14 14
16 16 15
0
5
10
15
20
Nov Dec Jan Feb Mar Apr May Jun Jul Aug
Month
Pe
rce
nta
ge
followup DNA %
%Median
East Lothian Psychological Therapies
Nov 11 - Aug 12: Percentage of followups
Cancelled
18
24
1416
19
11
16
1211
17
0
5
10
15
20
25
Nov Dec Jan Feb Mar Apr May Jun Jul Aug
Month
Pe
rce
nta
ge
followup Cancelled%
%Median

57
The Phase One report highlighted that, as the most hours are lost to follow-ups (even though the new rate is higher), testing ideas for reducing follow-up DNA is the best place to start. The following table is taken from the DCAQ Summary Outputs and highlights the average hours lost per week to DNAs using the more up to date data. This is still highlighting that follow-up DNAs are a much more significant issues in terms of time lost per week than new DNAs.
Recommended Action DNA and CNA rates are a key data point to track over time so that any significant changes can be picked up quickly and a response agreed. Further tracking rates in this way enables teams to quickly assess whether any changes they have made have led to an improvement. This data should be made available to teams as part of a monthly management report.
Key Learning Even though follow-up DNA rates tend to be lower than new DNA rates, because there are so many more follow-up appointments they account for a much higher number of hours lost. Therefore, when doing work to reduce DNA levels, it is more productive to start by focusing on follow-ups. It is also generally considered an easier area for interventions as the individuals are known to the service.
6.6.2 East Lothian Psychological Therapies Service - work to reduce DNA Following the Phase One report, the ELPT service decided to focus on testing an approach to reducing new DNAs. Two different versions of an opt-in system were tested out over April – May 2011. In version one the clinician set aside a number of appointment times in an electronic diary system and when the patient phoned in they could choose the most suitable appointment. In version two the patients telephoned to confirm they wanted an appointment but were not given a choice of dates, on confirmation of their desire to opt in an appointment was sent in the post. Both tests produced a reduction in new DNAs (not identified in the charts above as the tests of change took place from April to May 2011), though the data is not available to validate this. However, due to the administrative burden associated with patients scheduling an appointment when they called to opt in, a decision was made to continue with the model of patients telephoning to opt in and then being mailed an appointment.
ACTUAL
TIME LOST TO DNA Total Hours Average Hrs per
week
Time allocated for first assessments not used due to DNA 164 3.7
Time allocated to follow-ups not used due to DNA 697 15.8

58
The team have hypothesised that the location of the appointment may also be impacting on DNAs (both new and follow-up) and have now commencing tests of change around this. They recently started offering the patient the option of two sites to choose from for their first appointment. Attendance appears to have improved, but there is no data at present to confirm this. Further, this new system has created two new problems for the team:
There is a lack of rooms at the Primary Care Centre (PPC) where most individuals are choosing to be seen. This highlights that, in addition to staff time, availability of rooms can be another key constraint impacting on mental health teams. It also highlights the complexity of undertaking change work in healthcare and the benefits of using small scale tests of change to test ideas prior to embedding them as the routine way of doing things.
Patients who have been given the choice to be seen for their first assessment at PCC are now less willing to attend follow-up appointments groups which are run in Haddington. In response to this issue the service is looking at setting up groups in Musselburgh and opening them up across both East and Mid Lothian.
Recommended Action Optimising capacity through reduction of DNAs
The team have already identified that the location of the appointment may be impacting on DNAs and have agreed to commence tests of change around this. It is important that they are provided with the relevant data to support this work. Further, they may need to test a number of different approaches to find one that works within their local context.
The team may also want to consider other work on DNAs, with an initial focus on follow-ups. A range of ideas are provided in the recently published Effective and Efficient CMHS Toolkit (pg 34-35) including advice on how to undertake a more detailed assessment of the reasons why individuals are not attending.
As part of this work, it is recommended that the team look at the timing of the follow-up DNA appointments to assess whether individuals are using them to self discharge.
Key Learning ELPT have struggled to access data to inform their testing of change. For improvement purposes, it is important to track key data over time to see whether any changes are statistically significant and sustained and hence appropriate analytical support needs to be made available for services engaged in work to improve access whilst maintaining or improving quality.

59
6.6.3 Analysis of DNA/CNA rates in Midlothian The following run charts highlight the DNA and CNA rates for new and follow-up appointments. Again there is significant variation around the average but no statistically significant trends over time.
Midlothian Psychological Therapies
Oct 11 - Aug 12: Percentage of 1st Appointment DNA
15
11
56 7
1112
16
10
15
8
0
2
4
6
8
10
12
14
16
18
Oct Nov Dec Jan Feb Mar Apr May Jun Jul Aug
Month
Pe
rce
nta
ge
1st app %DNA
%Median
Midlothian Psychological Therapies
Oct 11 - Aug 12: Percentage of 1st Appts
Cancelled
109
8
14
65
8
7
11
5
10
0
2
4
6
8
10
12
14
16
Oct Nov Dec Jan Feb Mar Apr May Jun Jul Aug
Month
Pe
rce
nta
ge
1st app Cancelled%
%Median
Midlothian Psychological Therapies
Oct 11 - Aug 12: Percentage of Follow up DNA
10
13
17
10
1413
1514
13
11
14
0
2
4
6
8
10
12
14
16
18
20
Oct Nov Dec Jan Feb Mar Apr May Jun Jul Aug
Month
Pe
rce
nta
ge
Fol low Up %DNA
Fol low UpMedian
Midlothian Psychological Therapies
Oct 11 - Aug 12: Percentage of followups
Cancelled
12
16
20
22
16
1214 14
16
12
15
0
5
10
15
20
25
Oct Nov Dec Jan Feb Mar Apr May Jun Jul Aug
Month
Pe
rce
nta
ge
followup Cancelled%
%Median
The Phase One report highlighted that, as the most hours are lost to follow-ups (even though the new rate is higher), testing ideas for reducing follow-up DNA is the best place to start. The following table is taken from the DCAQ Summary Outputs and highlights the average hours lost per week to DNAs using the more up to date data. This is still highlighting that follow-up DNAs are a much more significant issues in terms of time lost per week than new DNAs.
ACTUAL
TIME LOST TO DNA Total Hours Average Hrs per week
Time allocated for first assessments not used due to DNA 204.4 4.3
Time allocated to follow-ups not used due to DNA 1126.1 23.5

60
6.6.4 Midlothian Psychological Therapies Service - Work to reduce DNA/CNA At the time of the Phase One Report the MLPT service did not have an agreed or consistent way of responding to people who did not attend or could not attend appointments. Therefore, the first step in addressing DNA and CNA rates was to establish a procedure which could be shared amongst the team, with service users and with referrers. This clarified the process that should be undertaken in circumstances where service users were either not able to, or did not attend appointments. This was achieved by representatives from psychology and from nurse therapy agreeing a procedure, along with revised information leaflets for service users and referrers. The Team are currently considering adopting a voicemail reminder system for follow-up appointments. However, the use of voicemail reminders and text reminders in mental health has temporarily been put on hold due to concerns raised about patient confidentiality and the need to have a robust process in place for obtaining the patients permission to use reminder systems.
Recommended Action Optimising capacity through reduction of DNAs
MLPT is currently considering adopting a voicemail reminder system for follow-up appointments. There is evidence of this impacting positively in other services. Ideally this intervention should be tested and DNA data used to assess its effectiveness.
In addition, the team may also want to consider other work on DNAs, with an initial focus on follow-ups. A range of ideas are provided in the recently published Effective and Efficient CMHS Toolkit (pg 34-35) including advice on how to undertake a more detailed assessment of the reasons why individuals are not attending.
As part of this work, it is recommended that the team look at the timing of the follow-up DNA appointments to assess whether individuals are using them to self discharge.
Key Learning The MH DCAQ does not currently include a separate field for cancellations. Ideally the tool needs to ask people for current cancellations rates and what % of cancelled appointment slots are used for another patient and then factor this into the analysis. In the absence of this, the % of cancelled appointment slots which are then not used can be added on to the DNA figure.

61
Recommended Action Optimising capacity through reduction and management of CNAs The cancellation rates for both East Lothian Psychological Therapies Service and Midlothian Psychological Therapies Service are relatively high with
ELPT MLPT
% New CNAs 14% 8%
% F/Up CNAs 16% 15%
The amount of clinical time actually lost to cancellations will depend on the notice given for cancellations and whether or not a system is in place for rapidly filling cancelled slots. However, even in the best case scenario where the cancellations are giving sufficient notice and slots are being filled, the time spent rebooking is rework for admin. Further work is needed to:
Understand the reasons behind the high cancellation rates.
Test ideas for reducing cancellations. Further both teams need to look at a system for routinely rapidly filling any slots that become vacant due to cancellations. It is recognised that this is an administrative role and that services will only be able to address this if appropriate admin support is in place to support such a process.

62
6.7 Optimising Capacity – Effective Meetings
6.7.1 East Lothian Psychological Therapies Service The previous activity audit in Phase One highlighted an average of 18 hrs of clinical time a week are spent in non-clinical meetings and recommended a review of the necessity of the meetings and their effectiveness may identify opportunities for releasing time back for client work. Use of meetings were examined by the team and felt to be necessary, appropriate and efficiently managed. The June 2011 activity audit highlighted that for the team as a whole, an average of 17.6 hours was spent in non-clinical meetings, representing around 4% of overall time. Though tempting to claim this as an improvement, it would be unwise to do this on the basis of two data points alone. The alternative explanation is that it is simply highlighting natural variation that occurs depending on the exact timing of the activity audit. If the audit is completed on a six monthly basis then this will bring greater clarity to this issue.
6.7.2 Midlothian Psychological Therapies Service The activity audit highlighted an average of 24 hrs of clinical time a week are spent in non-clinical meetings. Therefore a review of the necessity of the meetings and their effectiveness may identify opportunities for releasing time back for client work.
Recommended Actions Effectiveness of Meetings
A review of the effectiveness of meetings should be conducted for MLPT. There may be benefits to someone external to the team conducting this review which needs to include the necessity of the meetings, effective chairing, attendance at meetings, clarity on outcomes sought for items and whether appropriate information is available and effective capture of minutes. The Productive Leader resource includes a module on running effective meetings and may support the service in conducting their review.
The time spent in meetings should continue to be monitored in future activity audits and a focus needs to continue on ensuring good practice guidance for meetings is followed (e.g. necessity of meeting, effective chairing, who needs to be in attendance, outcomes required, effective capture of minutes).
The review of the effectiveness of meetings for East Lothian Psychological Therapies Service was conducted internally. There may be benefits to someone external to the team conducting any such reviews in the future.

63
6.8 Optimising Capacity – Case Review and Caseload Management The Phase One work highlighted that MLPT had a number of individuals on psychology caseloads for considerable lengths of time and recommended that:
All cases being seen for more than one year should be reviewed to assess whether the therapy is meeting identified needs/goals with the psychological therapy model(s) being used.
The case review processes should be reviewed, with a view to standardising and applying them consistently across the service. It is recommended that a process is drawn up which is then tested initially with a small number of patients accessing psychological therapies.
A review of the 20 longest cases was undertaken in October 2010 and in April 2011. More detailed information on the outcome of this review is available at http://www.knowledge.scot.nhs.uk/dcaq_mh/resources-library/resource-detail.aspx?id=4022269 Following on from this review the service has tested a Long Term Case Review and a number of points have come out of this initial test:
1. More junior clinicians found it valuable to hear from the more experienced clinicians how they manage their clients.
2. It is clear that a large group of clinicians will be unable to have sufficient time to address all the cases meeting the criteria for the review.
3. For some clinicians such a large group can be inhibiting and not conducive to discussing therapy situation which are problematic.
4. If groups are scheduled once every six months then this effectively results in ‘batching of the work’ and individual cases which would benefit from a wider discussion may end up waiting a considerable time for the next scheduled review.
Therefore the team is now looking at an alternative process that would ensure cases are reviewed on an ongoing basis once they reach an agreed trigger point. Further consideration is being given to conducting the reviews in smaller subgroups (rather than with the whole team) to address points 2 and 3. Reducing the numbers involved in the review reduces the total team time spent on any individual case review whilst also addressing the issue of a large group inhibiting open discussion of difficult issues. In addition, the therapists have undertaken work to assist good throughput of caseloads at level two. For example, there service has expanded its range of groups available.
Recommended Action
Routine reports should be produced that enable the team to regularly assess the throughput of work the team is undertaking and to identify where appropriate goal setting and review mechanisms can be better utilised. Used in conjunction with clinical supervision, clinical outcomes data and service user feedback, this will help the team to monitor the level of flow through the service, and to look for further opportunities in relation to management of demand.
NHS Lothian should consider a standardised process for longer term case reviews that would ensure all cases have a multidisciplinary discussion once they reach a given trigger (which could be a certain number of appointments or a length of time seen)

64

65
7 Queues/Waiting Lists
7.1 Waiting Times Information
7.1.1 Background and Local Context Improving access times to services is a key quality improvement goal that recognises the importance of speedy access to assessment and treatment for those in need. Knowing how long each individual patient has waited and what they are waiting for is key basic information to enable services to manage waiting times. However, this information has not been routinely available in mental health and one of the benefits of the 18 week HEAT waiting time target is that it is now focusing attention on ensuring that basic information, such as waiting times, is available across all services providing psychological therapies. In common with many psychological therapies services across Scotland, at the start of this work there was a lack of accurate information on the profile of current waiting lists for psychological therapies. In Phase One of the project it was recognised that waiting times data for each service involved in the project was not easily obtainable from PIMS and there was not a consistent or routine way of recording those referrals which had been received but not yet assessed or treated. Phase Two of the project also coincided with the requirement on NHS Boards to put in place mechanisms to routinely allow submission of waiting times for Psychological Therapies to ISD in line with the HEAT target on Access to Psychological Therapies. The information flow work that was carried out in Phase Two (see Section 9) has enabled a set of previously unavailable data relating to queues for each service to be produced and is a major step forward. However, there are still issues around the presentation of this data which need to be addressed as a priority as the current reports are insufficient to enable effective management of waiting lists.

66
7.1.2 Weekly Waiting Times Information The following report highlights the information that is now available at a team level to help manage waiting times. Both Midlothian Psychological Therapies Service and East Lothian Psychological Therapies Service can print these reports off on demand. Systems have been put in place at a team level to ensure the reports are routinely reviewed every week. This type of reporting at an individual patient level is vital to enable effective management of waiting times as it ensures visibility of those waiting longest, hence ensuring that routine appointments are offered in turn to those with the longest waits. Booking in turn (i.e. patients are taken from the end of the waiting list) is the recommended approach for routine appointments. Work completed in non-mental health specialities has shown that just ensuring that routine appointments are booked in turn reduces the longest waiting times. However, clinically urgent cases are expected to take priority over routine cases and teams need to have clear systems in place to identify who falls into the urgent categories and systems for ensuring this work is allocated as a priority.
Current waiting times from assessment to date
report run.
Total current waiting time from referral. For individuals who have been assessed as needing treatment this will be the total current wait from referral to date report run. For individuals not yet assessed, this will be current waiting time for assessment.

67
7.1.3 Recommended Monthly Summary Information In addition to patient level information available in the above format, teams also need to have summary information on their waiting lists that enables them to track key indicators over time. This section of the report contains examples of what data is now available and how it could potentially be presented back to teams (the presentation of the data has been undertaken centrally by QuEST).
Median lines are present on a number of the charts. The median line allows application of simple run chart rules to determine whether or not a change in the metric is statistically significant and therefore worthy of focussed work. Appendix A provides a summary of the rules for interpreting statistical significance.
Chart 1a – ELPT number of people waiting for assessment each month
East Lothian - Assessment Waiting List
86
69 68
90 94
108
137144 143
123130
0
20
40
60
80
100
120
140
160
Oct-11 Nov-11 Dec-11 Jan-12 Feb-12 Mar-12 Apr-12 May-12 Jun-12 Jul-12 Aug-12
No.
of P
atie
nts
Median :
108
Interpretation The number of people waiting for assessment for this service moves around a median of 108. At the moment there is no statistically significant shift in numbers, however a couple more data points may reveal an upward trend in the number of people waiting for assessment. Chart 1b – MLPT number of people waiting for assessment each month.
Midlothian PTS - Assessment Waiting List 146
116103
90 93105
113
142 139145
109
0
20
40
60
80
100
120
140
160
Oct-11 Nov-11 Dec-11 Jan-12 Feb-12 Mar-12 Apr-12 May-12 Jun-12 Jul-12 Aug-12
No
. o
f P
atie
nts
Median :
113
Interpretation The number of people waiting for assessment for this service moves around a median of 113. There is no statistically significant shift in numbers, which infers that the service is providing

68
enough assessments routinely to deal with the demand for assessments and that a one off time limited increase in capacity would be helpful in clearing the historical backlog. Chart 2a – ELPT - length of wait for assessment
EL Assessment Waiting List
Waiting time at 31 Aug 2012
12
18
1210
16
23
12
6 67
5
2
5
2 2 21
32 2
0
5
10
15
20
0 1 2 3 4 5 6 7 8 9 10 11 12 13 14 15 16 17 18 19 29
Weeks Waiting
No.
of P
atie
nts
Interpretation On 31 August, there were 120 people waiting for assessment. The longest wait is 29 weeks. 68 have been waiting for 4 weeks or less and 4 people have been waiting more than 18 weeks. The service has explored the reasons for the longer waits which are due to one of the following: several DNA’s or CNA’s for assessment, requests for a female worker or requests to be seen in a different area. Chart 2b – MLPT length of wait for assessment
Midlothian PTS - Assessment Waiting List
Waiting time at 31 Aug 201215
13
15
8
10
2
7
3 32 2
1
43
1 1 1 1 1
3
12
4
21 1 1 1
0
2
4
6
8
10
12
14
16
0 1 2 3 4 5 6 7 8 10 11 13 14 15 17 18 22 23 26 27 33 37 38 39 40 41 42 49
Weeks Waiting
No.
of P
atie
nts
Interpretation On 31 August, there are 109 people waiting for assessment. The longest wait is 49 weeks. 61 have been waiting for 4 weeks or less and 20 people have been waiting for more than 18 weeks. The service should explore the reasons for these longer waits as this may provide valuable information on opportunities for improvement. These charts should be updated monthly and monitored so that the team knows whether and how the profile of this waiting list is changing over time. For example, are more people waiting for longer, or are there a small number of cases that can be taken onto the caseload to have a high impact on the maximum waiting time for the service? Understanding the reasons for the longer waits will help to provide answers to this question.

69
Chart 3: Number of people waiting for individual therapy each month. The service also needs to track the total number waiting over time, as this can be an early indicator of pressure building up in the system. However, this data should be put into a run chart to ensure that natural variation in the numbers waiting (which will happen give the variation in demand) is not over-interpreted. This data was not available for analysis which is why it is not provided here. Chart 4a: ELPT length of wait for individual therapy – 31 August 2012
East Lothian PT
Individual Therapy Waiting Lists at 31 Aug 2012
0
1
2
3
4
5
6
7
8
9
0 1 2 3 4 5 6 7 8 10 11 12 13 14 15 16 18 19 23 24 29 30 38 39 40 42 47
Weeks Waiting
No.
of P
atie
nts
Interpretation On 31 August, there were 56 people waiting for an individual therapy. The longest wait was 24 weeks and 1 person waiting over 18 weeks. Though only 1 person was waiting over 18 weeks, it is still worthwhile exploring the reasons for the longer waits (i.e. over 12 weeks) as for instance, if all the waits are for a particular type of therapy this would indicate the need to train additional staff to increase the capacity available. Chart 4b: MLPT length of wait for individual therapy – 31 August 2012
Midlothian PT
Individual Therapy Waiting Lists at 31 Aug 2012
0
1
2
3
4
5
6
7
8
9
10
0 2 4 6 8 10 13 15 17 19 22 24 26 30 32 36 38 43 46 56 75Weeks Waiting
No.
of P
atie
nts
Interpretation On 31 August, there were 97 people waiting for an individual therapy. The longest wait was 99 weeks and 36 people waiting over 18 weeks (37 %). This service has a particular issue with waits over 18 weeks and should explore the reasons for these longer waits as this may provide valuable information on opportunities for improvement. For instance, are the longest waits all waiting for a particular type of therapy? If so, this would indicate the need to train additional staff to increase the capacity available.

70
These charts should be updated monthly and monitored so that the team knows whether and how the profile of this waiting list is changing over time. For example, are more people waiting for longer, or are there a small number cases that can be taken onto the caseload to have a high impact on the maximum waiting time for the service? Is the service managing to see people in a “first come first served” order? Is there equity of wait? Is the waiting time predictable? Chart 5 - number of people waiting for group therapy each month. The service also needs track the total number waiting over time for group work, as this can be an early indicator of pressure building up in the system. However, this data should be put into a run chart to ensure that natural variation in the numbers waiting (which will happen give the variation in demand) is not over-interpreted. This data was not available for analysis which is why it is not provided here. Chart 6a – ELPT length of wait for Group Therapy – 31st Aug 2012
East Lothian PT
Group Therapy Waiting Lists at 31 Aug 2012
0
1
2
3
4
5
6
7
8
9
0 1 2 3 4 5 6 7 8 10 11 12 13 14 15 16 18 19 23 24 29 30 38 39 40 42 47
Weeks Waiting
No.
of P
atie
nts
Interpretation On 31 August, there were 47 people waiting for treatment, 9 of which were waiting longer than 18 weeks (19%). The longest wait was 47 weeks. The service has reviewed the reasons for the longer waits and identified the reasons why which are a combination of data accuracy (ie some patients had actually attended a group but were still showing as waiting), patient choice, and a small number waiting for a particular group to start. Further, the team have been consistently monitoring the waits and offering individual treatment to those waiting for more than 18 weeks for a group.

71
Chart 6b – MLPT length of wait for Group Therapy – 31st Aug 2012
Midlothian PT
Group Therapy Waiting Lists at 31 Aug 2012
0
1
2
3
4
5
6
7
8
9
10
0 2 4 6 8 10 13 15 17 19 22 24 26 30 32 36 38 43 46 56 75Weeks Waiting
No.
of P
atie
nts
Interpretation On 31 August, there were 63 people waiting for treatment, 11 of which were waiting longer than 18 weeks (17%). The longest wait was 40 weeks. The service should explore the reasons for these longer waits as this may provide valuable information on opportunities for improvement. For instance, if they are waiting for a particular group where the demand is so low that it only happens a couple of times a year then this would indicate the need to run the group across more than one locality to increase the frequency of new groups starting. These charts should be updated monthly and monitored so that the team knows whether and how the profile of this waiting list is changing over time and can identify the reasons for any long waits.
7.1.4 Complementary Adhoc Waiting Times Reports In addition to the above monthly reports, the following could be made available when numbers on waiting lists are growing and the service wants to establish whether this is due to an increase in additions or a reduction in removals.
In each of the following graphs, if Additions (blue diamonds) are consistently above removals (maroon squares) then the service must have growing waits for individual treatment. Wherever removals exceed additions, the overall waiting list will be reducing. Ideally these charts should be used in conjunction with Chart 3 (Individual) and Chart 5 (Group) to assess whether there is any statistically significant change in numbers waiting over time.

72
Chart 7a: ELPT Individual Therapy Waiting Lists: Additions and Removals
East Lothian PT
Individual Therapy Waiting Lists
13 2
5 5
8 810
12
20
17
22
12
0 0 1 20
4 57
2
57
21
12
0
5
10
15
20
25
Aug-11 Sep-11 Oct-11 Nov-11 Dec-11 Jan-12 Feb-12 Mar-12 Apr-12 May-12 Jun-12 Jul-12 Aug-12
No
. o
f P
atie
nts
ADDITION REMOVAL
Interpretation Additions to this waiting list were consistently above removals throughout the year and significantly rose steadily throughout. Removals were close to level of additions in the last two months. Over the full reporting period, there was a net growth (total additions minus total removals) in the waiting list for individual therapy of 59 people. As removals were consistently below additions, it can be assumed that Chart 3 (if it was available) would show a steadily increase in the numbers on waiting lists for individual therapy, indicating a shortfall in capacity to meet the current level of demand. Chart 7b: MLPT Individual Therapy Waiting Lists: Additions and Removals
Midlothian PTS
Individual Therapy Waiting Lists
12
7 8 8
12
7 8
16
1013
11 10
18
2
6
2
11
6
25
7
1214
28
10
17
0
5
10
15
20
25
30
Aug-11 Sep-11 Oct-11 Nov-11 Dec-11 Jan-12 Feb-12 Mar-12 Apr-12 May-12 Jun-12 Jul-12 Aug-12
No
. o
f P
atie
nts
ADDITION REMOVAL
Interpretation Additions to this waiting list were fairly constant throughout the year. Removals remained close to level of additions, with a significant inroad made into number of people waiting for individual therapy in June 2012. This increase is thought to be attributed to a reduction in the non-clinical duties for the lead psychologist and hence increased capacity for client work. Over the full reporting period, there was a net growth (total additions minus total removals) in the waiting list for individual therapy of 18 people, with removals exceeding additions in only 4 out of 13 months. Though not conclusive, this is indicative of a shortfall in capacity to meet the current level of demand.

73
Chart 8a: ELPT Group Therapy Waiting Lists: Additions and Removals
East Lothian PT
Group Therapy Waiting Lists
0 0 1
6
21
13 13
9
16
23
18 18
12
0 0 0 02
10
15
21
9
4
1614
12
0
5
10
15
20
25
Aug-11 Sep-11 Oct-11 Nov-11 Dec-11 Jan-12 Feb-12 Mar-12 Apr-12 May-12 Jun-12 Jul-12 Aug-12
No.
of P
atie
nts
ADDITION REMOVAL
Interpretation Additions to the waiting list for Group Therapies fluctuated throughout the year. December and May saw a big increase in the number of additions to the list. March saw the most referrals being removed from the Group Therapy waiting lists. One might expect the pattern of removals to reflect the schedule for groups. Over the full reporting period, there was a net growth (total additions minus total removals) in the waiting list for group therapy of 47 people. Chart 8b: MLPT Group Therapy Waiting Lists: Additions and Removals
Midlothian PTS
Group Therapy Waiting Lists
3
13 13
20 1822 21
13 14 1520
25 24
0 03
17
0
6
4137
6
149 9 9
0
10
20
30
40
50
Aug-11 Sep-11 Oct-11 Nov-11 Dec-11 Jan-12 Feb-12 Mar-12 Apr-12 May-12 Jun-12 Jul-12 Aug-12
No.
of P
atie
nts
ADDITION REMOVAL
Interpretation Additions to the waiting list for Group Therapies were fairly constant throughout the year. February and March saw a big increase in the number of referrals being removed from the Group Therapy waiting lists. One might expect the pattern of removals to reflect the schedule for groups. Over the full reporting period, there was a net growth (total additions minus total removals) in the waiting list for group therapy of 70 people. However, caution needs to be applied to interpreting this data as staff were settling into using the system during this period and at some points individuals were placed on group lists in error (and hence later removed as part of data validation).

74
Recommended Action
The work to address the way queues are recorded means the teams can now have greater clarity on number of people waiting for their support, length of wait and information on what those people are waiting for. This will enable the teams to determine what impact on waiting times any improvement efforts is having on an ongoing basis. However, it is vital that teams receive the information back in a format that is useful and accessible. This has been achieved for the patient level information on waiting times which enables effective management of individual patient waiting times. However, in addition to this information, teams also need summary information that enables them to track trends over time. The above analysis has been conducted as a one off exercise by the QuEST national team to demonstrate what could be achieved with the current information.
It is recommended that an early priority for the new analytical resource in Lothian being funded by the QuEST access allocations is to ensure that automated systems are put in place to enable teams to receive back monthly reports in a format similar to that identified here.
Once rolled out across the area, all services involved will benefit from this information, and NHS Lothian will have a robust method for reporting and managing waiting times at NHS Board level.
Recommended Action
Provided that waiting times for specific therapies are now accurate, a brief exercise looking at the needs/profile of levels of intensity for those people currently waiting for the service may further identify what level of training, for which therapies, would be of greatest benefit .

75
7.2 Understanding the reasons for the queue
7.2.1 Understanding whether there is a mismatch in demand and capacity One of the aims for a DCAQ analysis is to understand whether the queue is:
1. A result of an ongoing mismatch between demand and capacity and hence will continue to grow unless action is taken to either reduce the demand on an ongoing basis or increase the capacity on an ongoing basis and/or;
2. A historical legacy that could be addressed through a one off time limited allocation of additional resource.
If it is the former then attention needs to be paid to addressing this mismatch. Otherwise the queue will continue to grow and any improvements made through allocating time limited funding (such as waiting list initiatives) will be slowly eroded over time. However, once the ongoing demand and capacity issues has been addressed, there is still likely to be a queue that is now a historical legacy and will require a one-off time limited investment of resources to clear. In these situations a one off time limited injection of additional resources to clear the queue is appropriate. There are three key sources of data that can be used to understand whether there is an ongoing mismatch between the demand presenting and the capacity of services to respond to it. Ideally a DCAQ analysis should use all three sources of information:
1. Modelling demand and capacity and comparing the two figures. The QuEST MH DCAQ Tool provides an analysis of the current capacity compared with the predicted demand. It is set up so that services enter the key data points and the relevant sums are then automatically carried out. It uses averages and assumptions so there will be margins of error around the analysis. Therefore it is important that the outputs from this tool are not used in isolation.
2. Tracking profile of waiting lists over time Another way to assess whether recurrent demand and capacity are in balance is to look at the change over time in waiting lists.
If the number of people on the waiting list remains static and the case mix remains constant, this is an indication that the recurrent demand and capacity are in balance and the queue is a historical backlog that could be cleared by a one of investment of resources.
If there is an ongoing imbalance between demand and capacity then you would expect to see the total numbers on the waiting list growing or the complexity of the demand profile on the waiting list increasing (if services are picking the low intensity cases to keep on top of numbers and leaving the higher complexity/longer term work on the waiting list to enable ongoing throughput on caseloads).
3. Local Intelligence The above two sources of data should then be shared with the local team to see if they align with the overall sense of what is happening in the system.

76
7.2.2 East Lothian Psychological Therapies Service – analysis of demand versus capacity 1) DCAQ Tool Analysis The MH DCAQ tool provides an analysis of the current capacity compared with predicted demand.
The table identifies that the service does not currently have enough capacity to meet its ongoing demand. Further it highlights that, if the shortfall in capacity is met through employing additional staff, there is a multiplier effect as at present only 57 % of each staff members time is spent on seeing clients and the associated clinical admin. Every new staff member will have some of their time spent in clinical supervision, on training courses, on leave, etc. Therefore if meeting the shortfall of 51 hours of additional client work by employing additional staff, the service would actually need to employ 2.4 additional WTE. This highlights why it is so important to make sure that services are making the best use of existing staffing time and have a reasonable balance of time spent between clinical and non-clinical work. The other potential factor impacting the demand and capacity analysis is staff working over and above their contracted hours. This analysis assumed that everyone is working contracted hours. In reality, we know that some staff do work significantly above their contracted hours. The impact of this will be that the service appears to coping better with the demand than its modelled capacity predicts. 2) Waiting List Profiles
a net growth in the waiting list for assessment of 44 people from in Oct 11 to Aug 12, with indications of an upward trend (though a couple more data points are needed to confirm this). See Waiting Times Chart 1a for more info.
a net growth in the waiting list for individual therapy of 59 people from Aug 11 to Aug 12, with additions consistently above removals indicating an upward trend in the number of people waiting. See Waiting Times Chart 7a for more info.
a net growth in the waiting list for group therapy of 47 people from Aug 11 to Aug 12, with removals exceeding additions in only 2 out of 13 months. See Waiting Times chart 8a.
Ideally, we would want to see how the total numbers waiting for individual and group therapy varied over time to see if there has been a consistent net growth. Taking a figure at a point in time may lead to over-interpretation of the data, as it may be that the net growth is simply about the timings of additions and removals. This is even more likely to be an issue with group therapy waiting lists due to the need to wait for minimum numbers to run groups. However,
DEMAND vs. CAPACITY ACTUAL
Hours per week WTE
Difference between time needed and time available for direct client work (including clinical admin): 51
If you change nothing else, additional hours and WTE needed to match demand with capacity: 89 2.4

77
this information was not available and the charts looking at additions and removals indicate a consistent trend in the number of people waiting for individual therapy. Therefore it is reasonable to interpret this data as indicating that the service does not currently have enough capacity to meet its ongoing demand. This is consistent with the outputs of the DCAQ analysis. 3) Local Intelligence The team report an increased sense of workload pressure locally over the last year which aligns with the above two data sources indicating that the service does not have enough capacity to meet its ongoing demand. It is therefore reasonable to conclude that, on the basis of the way the service currently operates, there is not enough capacity to meet ongoing demand. If nothing changes then NHS Lothian can expect to see the waiting times for East Lothian Psychological Therapies Service consistently growing. A one off injection of resources would temporarily clear the queue, but this analysis indicates that waiting times would steadily start to increase. Therefore the 18 week target cannot be sustainably delivered without taking action to either reduce demand or increase capacity.

78
7.2.4 Midlothian Psychological Therapies Service analysis of demand and capacity 1) DCAQ Tool Analysis The MH DCAQ tool provides an analysis of the current capacity compared with predicted demand.
DEMAND vs. CAPACITY ACTUAL
Hours per week WTE
Difference between time needed and time available for direct client work (including clinical admin): 58 (30)
If you change nothing else - additional hours and WTE needed to match demand with capacity: 107 (56) 2.9 (1.5)
(Figures in brackets are budgeted hours including the 1.4 WTE staff currently on mat leave) The table identifies that the service does not currently have enough capacity to meet its ongoing demand. The current level of maternity leave has doubled the shortfall in capacity in this team and hence NHS Lothian can expect to see waiting lists growing at a faster rate than previously. The table highlights that, if the shortfall in capacity is met through employing additional staff, there is a multiplier effect as at present only 54 % of each staff members time is spent on seeing clients and the associated clinical admin. Every new staff member will have some of their time spent in clinical supervision, on training courses, on leave, etc. Therefore if meeting the current shortfall of 58 hours of additional client work by employing additional staff, the service would actually need to employ 2.9 additional WTE. This highlights why it is so important to make sure that services are making the best use of existing staffing time and have a reasonable balance of time spent between clinical and non-clinical work. The other potential factor impacting the demand and capacity analysis is staff working over and above their contracted hours. This analysis assumed that everyone is working contracted hours. In reality, we know that some staff in some teams do work significantly above their contracted hours. The impact of this will be that the service appears to coping better with the demand than its modelled capacity predicts. 2) Waiting List Profiles
The overall number waiting for assessment varied from a minimum of 90 to a maximum of 146 over Oct 11 to Aug 12. However, there is no indication of any increased trend (see Waiting Times Chart 1b).
a net growth in the waiting list for individual therapy of 18 people from Aug 11 to Aug 12 with removals exceeding additions in only 4 out of 13 months.
a net growth in the waiting list for group therapy of 70 people from Aug 11 to Aug 12 Ideally, we would want to see how the total numbers waiting for individual and group therapy varied over time to see if there has been a consistent net growth. Taking a figure at a point in time may lead to over-interpretation of the data, as it may be that the net growth is simply

79
about the timings of additions and removals. This is even more likely to be an issue with group therapy waiting lists due to the need to wait for minimum numbers to run groups. However, this information was not available and the net growth data is consistent with the DCAQ analysis which shows that the service does not currently have enough capacity to meet its ongoing demand. 3) Local Intelligence The team report an increased sense of workload pressure locally over the last year which aligns with the above two data sources indicating that the service does not have enough capacity to meet its ongoing demand. It is therefore reasonable to conclude that, on the basis of the way the service currently operates, there is not enough capacity to meet ongoing demand. If nothing changes then NHS Lothian can expect to see the waiting times for Midlothian Psychological Therapies Service consistently growing. A one off injection of resources would temporarily clear the queue, but this analysis indicates that waiting times would steadily start to increase. Therefore the 18 week target cannot be sustainably delivered without taking action to either reduce demand or increase capacity. Further, the current profile of the waiting lists with long tails for both assessment and treatment waits may be an indication of a specific skills gap. As a priority MLPT should review the reason for the individuals waiting over 18 weeks and review the processes for picking from queues to ensure that all routine appointments are booked in turn.

80
7.3 Addressing the gap between demand and capacity There are a number of options for addressing the current gap between demand and capacity which can be summarised as:
1. Increasing capacity for clinical work by addressing current capacity losses in the system (see section 6.5 – 6.8 for more info).
2. Reducing the demand in the system by more effective management of failure and created demand (please see the Effective and Efficient CMHS Toolkit for more info).
3. Increasing capacity by the allocation of additional resources. The current financial pressures facing the NHS mean that the first two options need to be explored prior to any case being made for additional resources. The MH QuEST DCAQ Tool provides the ability for services to scenario model the impact of changes in their system. The following tables highlight the potential impact of changes to key variables. Scenario modelling the impact of changes to ELPT
Average hours per week released for Clinical Work
Difference between time needed and time available for direct client work
If capacity gap is met by employing additional staff, on basis of current model of working, how many additional staff are needed
No change 0 51 2.4 WTE
Reduction in Follow-Up DNA Rate to 10%
5.4 44 2 WTE
Reducing in New to F/Up Ratio from 7.5 to 6.5
22 29 1.4 WTE
Reducing time spent on clinical admin from 66 mins for each contact to 45 mins for each contact
32 19 0.9 WTE
All three of above at once*
54.8 -4 0
*NB: This is not just a net addition of the different data points as some of the changes to variables interact with each other

81
Scenario modelling the impact of changes to MLPT
Average hours per week released for Clinical Work
Difference between time needed and time available for direct client work
If capacity gap is met by employing additional staff, on basis of current model of working, how many additional staff are needed
No change 0 58 2.9 WTE
Reduction in Follow-Up DNA Rate to 8%
7 51 2.5 WTE
Reducing in New to F/Up Ratio from 6.5 to 5.5
23 35 1.7 WTE
Reducing time spent on clinical admin from 60 mins for each contact to 45 mins for each contact
22 36 1.8 WTE
All three of above at once*
47 11 0.5 WTE
*NB: This is not just a net addition of the different data points as some of the changes to variables interact with each other When interpreting/using this type of scenario modelling it is important that the following is taken into account:
As the model uses averages, the outputs will have margins of error and therefore this is not a precise analysis. However, it does show the potential impact of changes to the way the service is operating.
We don’t know whether any of the modelled changes are achievable.
We don’t know whether a reduction in new to follow-up ratios is desirable, as we don’t know what the optimal ratio is. It is simply highlighting the impact that a reduction can have and therefore the importance of ensuring effective caseload management is in place across the whole team. This table also highlights the potential benefits of investing in technology to reduce the amount of time being spent on clinical admin, and the potential leverage that focusing on this variable can have.

82
7.4 Clearing the historical queue
7.4.1 Assessing the resources needed to clear the historical queue Even if the teams get to a point where the ongoing capacity is sufficient to meet the ongoing demand, they will still have an historical backlog (i.e. current waiting list), unless the changes to the operation of the system are such that the capacity exceeds the demand. In the scenario where the capacity exceeds demand, the services would start to see the queue steadily reducing until at some point it was cleared (and at which point the service would then have excess capacity if demand stays constant). The MH QuEST DCAQ Tool enables services to model how much additional clinical time is needed to clear the current queue. As both East Lothian Psychological Therapies Service and Midlothian Psychological Therapies Service run waiting lists for both assessment and treatment, manual adjustments to the tool had to be made to model this figure (as the tool currently assumes that once individuals are assessed they will go straight on to receive treatment so only automatically models the queue to assessment). East Lothian Psychological Therapies Service: estimate of non-recurrent resource needed to clear queue
Not converted into WTE as resources deployed to clear queues often don't share same capacity constraints as established capacity.
QUEUE ACTUAL
Number of people on the assessment waiting list 130
Total hours needed to clear queue 1363
Days needed to clear queue (based on 7.5 hour day) 182
Midlothian Psychological Therapies Service: estimate of non-recurrent resource needed to clear the queue
Not converted into WTE as resources deployed to clear queues often don't share same capacity constraints as established capacity.
QUEUE ACTUAL
Number of people on ALL waiting lists (assess + treat) 263
Total hours needed to clear queue 2544
Days needed to clear queue (based on 7.5 hour day) 339
However, this analysis looks at the resources to clear the entire queue. Pragmatically (and given current resource constraints) services will probably want to model bringing the wait down to a given level, rather than completely removing the queue. We do not recommend that services manage queues to the target (i.e. 18 weeks), as this represents the minimum performance required and would not provide the flexibility to cope with the inevitable variation in demand and capacity over the year. Given that the ICP standards state that individuals should not wait more than 12 weeks from referral to treatment with a psychological therapy, then modelling the non-recurrent resources needed to reduce the

83
queue to 12 weeks seems sensible. Working to a standard of 12 weeks would also provide some flexibility to cope with peaks in demand or lows in capacity. However, before doing work to model this:
the underlying imbalance between demand and capacity needs to be addressed;
services need to ensure they have a process in place to see routine referrals in turn. Simple changes to how individuals are picked from waiting lists can significantly reduce the longest waits.
Any skills gaps that prevent routine referrals being seen in turn need to be addressed. Once these issues have been addressed, work can then take place to model the additional non-recurrent resources needed to reduce the queue to a given level. A non-recurrent increase in capacity can be delivered by temporarily increasing the hours of part-time staff (if they are willing), temporarily moving staff from another part of the service, overtime for existing full time staff, temporary fixed term appointments to the team or temporarily sending work on to another provider.
7.4.2 Implementing systems to enable routine booking in turn In response to these findings, MLPT and ELPT have reviewed their systems for booking routine appointments. One of the problems in booking routine appointments in turn for Midlothian has been the use of multiple treatment waiting lists. Some staff were taking patients from only one queue therefore there were often other patients waiting longer on different queues which they are unaware of. At one point there were high numbers waiting for level 3/4 and staff were asked to take more from this queue. During this time it appears that the level 2 waiting lists were building and there are currently more patients waiting at this level. In response to this finding, the service has requested a master waiting list report which will join all the waiting lists together and show the longest wait. This report will show the matrix level therefore the service will know how many people are waiting at each intensity level – this will aid managers to decide where the gaps are. This new report will assist staff in selecting the patient who has been waiting longest at their level of expertise. In ELPT this had been a problem therefore waiting lists were added as recurring item on the staff meeting agenda and the team discuss priorities and pressures. Patients are now only selected earlier based on need. The new report will assist the process and may reduce the need for these discussions.

84

85
8 Measuring Outcomes A key part of any DCAQ project is measuring the impacts of any changes on the quality of care provided and individual outcomes. The MH QuEST Team recommends that any work around improving access times should include work on quality outcomes. A recommendation of the Phase One work was that the progress of NHS Lothian’s knowledge transfer partnership with Queen Margaret University (the Transformation Station) which is focused on the collection and use of Clinical Outcomes data, should be incorporated into phase 2 of the DCAQ project. That would ensure that the team were able to determine the impact, if any, on clinical outcomes of changes made in relation to DCAQ, whilst ensuring no duplication of work across both projects. The project lead from the Transformation Station (Dr Duncan Pentland) joined the project team meetings throughout phase two of the project, and was involved in the work around information flows, as this has a key interface with the work around Clinical Outcomes data. This section summarises the work around clinical outcomes.
8.1 Background Work on outcome measurement with ELPT was part of a wider Knowledge Transfer Partnership (KTP) project between NHS Lothian, Queen Margaret University Edinburgh and the University of Stirling. The aim of this specific project was to enable ELPT’s routine planning and clinical decision making to be informed by reliable and up-to-date information. This included the collection, recording and interpretation of standardised outcome measurements as a priority. Initial work focused on identifying the current state of outcomes data recording including clinicians’ perspectives on what was enabling and hindering the collection and use of outcomes data. The core themes from this are detailed below in section 8.2. The second substantive element of the project was to work in partnership with the team to support the identification of local solutions that would support the collection and recording of data relevant to clinical outcomes measurement/monitoring. These are detailed below including information about potential solutions that were disregarded.

86
8.2 Outcomes Data Collection - The Clinical Perspective a) The importance of outcome measurement.
All of the ELPT personnel who participated in the early scoping activities clearly articulated reasons for undertaking standardised outcome measures with their patients. Key reasons included:
As a way of communicating improvements/alterations in conditions to other health and social care professionals;
As a tool for assessing risk in the early stages of therapy;
To demonstrate the effectiveness of core therapies;
To enable anecdotal or ‘gut feel’ knowledge about the effectiveness of different approaches to delivering therapy to be quantified.
Additionally those with managerial roles identified that routine clinical outcome measurement could support the identification of potential areas for improvement work and would also provide the information needed to rigorously evaluate the effectiveness of new models of treatment delivery.
b) Pre-Treatment Collection. In general the collection of pre-treatment measures was not reported as a significant challenge. Typically patients were provided with relevant outcome measures as part of pack sent in the post prior to first contact. This allowed therapists the opportunity to prompt and support patients to complete the measure(s) at the first appointment if they had not previously done so. However, data was not routinely kept on completion rates so it is not possible to provide a baseline for pre-treatment collection rates.
c) Post-Treatment Collection. Collecting outcome measures on discharge was noted to be (and still remains) a significant challenge. The ELPT identified several reasons for this:
First, a high number of patients do not attend their final planned appointment when the discharge measure would typically be taken. This is often because they feel they no longer need the service and thus do not present at the final consultation.
Also, there was no set process in place for the collection of outcomes measurements. This required staff to remember to administer the measure(s) at a stage in the patient journey that typically involved a high number of other administrative and clerical tasks. Consequently, members of ELPT who contributed to initial scoping activities felt that ‘forgetfulness’ was likely to contribute to missed opportunities to administer and record standardised outcomes measurements on discharge.
d) Nature of the Global Measure.
The NHS Lothian psychological therapies services had agreed to use the CORE 34 outcome measure as a global tool for monitoring patient health at roughly the same time as the project was started. The intention was to use the CORE 34 with all patients attending for therapy. The CORE 34 was felt to have a number of benefits and drawbacks by ELPT. It was recognised as easy to explain and score and as a tool that measures change well. However,

87
it was also felt to be a lengthy measure to complete which only measures one dimension of health (severity of psychological distress) and some individuals had concerns about its utility with patients suffering from severe and enduring conditions. It was recognised as being a global tool that would be an appropriate for use with the vast majority of patients despite some flaws. Working to improve the collection of CORE 34 scores composed the majority of remaining project work.
e) Recording Data. Outcomes measurements were typically recorded as both paper forms and electronically on PIMS. At the commencement of the project the use of PIMS was felt to be inadequate. At that stage there was no easy way of viewing the results of data sets including CORE scores that had been recorded on the system. This was identified as having a number of associated effects:
First, the inability to access information once it had been recorded removed many of the advantages that clinicians might have perceived in collecting data as they were unable to look at trends in outcome data at any level wider than the individual patient. In these situations it was actually easier to return to original paper notes than to use PIMS.
Second, this ‘disappearance of data into a black hole’ to paraphrase therapists’ comments contributed to a feeling of a loss of ownership among the team. Concerns were raised that, without the ability to scrutinise and contextualise the outcomes and activity information collected about their team, other members within the organisation at the strategic and planning levels might misinterpret information. There was particular concern that it might be used to scrutinise individual performance without considering confounding factors and importantly, not realising when erroneous information was being reported.
From a daily service management perspective, the data kept was not sufficiently comprehensive to allow meaningful decisions to be made. Further, the additional pressure that using PIMS placed on the administrative responsibilities of therapists was also noted. Most participants recognised the value in being able to centrally store information but reported that the current system was overly complicated and difficult to use.
8.3 Solutions Developed The information below has been broadly categorised as soft solutions and hard solutions. Soft solutions refer to actions that were taken to alter staff practices to support improved data collection. Hard solutions refer to alterations within PIMS that were identified as supportive of more effective data management.

88
8.3.1 Soft Solutions
a) Owning Data. It was recognised very early on that there was a direct link between the value therapists placed on data recording and the likelihood of them completing this in sub-optimal circumstances. In other words, the less value they saw for their own practice in recording data the less likely they were to do so regardless of understanding about the value of service monitoring and organisational directives. Consequently a key first step in developing solutions was to recognise that allowing the team to access and use their own data would need to be a key priority. Recognising and promoting this by including it as a core element of the work undertaken was an important element in maintaining the high levels of motivation the ELPT showed for making complex changes to their data recording practices over a prolonged period.
b) Global and Condition Specific Measurements.
Equally important was explicitly recognising that using the CORE 34 as a global measure was not intended to replace more sensitive condition specific outcome measurements, and was not intended to replace the clinical reasoning of therapists when it came to assessment. Clearly communicating its role as a broad measure to allow service/division level monitoring was important in enabling clinicians to consider its use in a more positive way. Ensuring that attention was given to building capacity to record more condition specific measures (such as those to assess depression, anxiety, trauma, etc.) was also an important concept.
c) Prompting Resources. One simple solution to help increase the collection of CORE 34 scores on discharge that the ELPT requested was the development of attractive posters prompting clinicians and patients to complete the measure at their last appointment. These have helped to ensure that those patients who attend their last planned appointment are routinely asked to complete the CORE 34. A collection of posters was developed and used throughout the therapy offices. An example of these can be downloaded for reproduction and use here: http://www.knowledge.scot.nhs.uk/dcaq_mh/resources-library/resource-detail.aspx?id=4022270
d) New Scoring System. To simplify the scoring and interpretation of the CORE 34 measures the team agreed to adopt a simplified scoring system. To support this, a single scoring and interpretation guidance sheet was provided for inclusion in the team documents (see below). Large A0 copies were also posted in the PST offices to support interpretation and recording. Copies of this guidance can be found here: http://www.knowledge.scot.nhs.uk/dcaq_mh/resources-library/resource-detail.aspx?id=4022271

89
e) New Paperwork.
The team also identified positive previous experiences associated with the use of comprehensive packs of paperwork. A new comprehensive assessment pack was developed which included copies of the CORE 34, the simple scoring and interpretation sheet and a data recording checklist. This paper work is currently being updated to match the needs of newly reconfigured services in Lothian. Copies of the working drafts can be found here: http://www.knowledge.scot.nhs.uk/dcaq_mh/resources-library/resource-detail.aspx?id=4022275
8.3.2 Hard Solutions
f) Identifying key data needs. One element of outcomes data collection that was identified for improvement focused on complementary data. The ELPT personnel involved in the project noted that on their own, pre and post treatment measurement data is of little value. To be worthwhile they needed to be able to look at this data in the context of other information about the services delivered. Work was competed to identify the required minimum dataset that would enable useful interpretation. This is shown in the following Table (much of this data was routinely collected, newly identified data points are shown in bold italics). These data points became the focus of work with the PIMS team in support of outcome measurement.
Dimension Data Points
Demographic Data
Unique patient number (either generated or CHI)
DOB & Age
Gender
Post code
Referral Data Referral to service date
Allocation to waiting list/treatment date
Wait time from referral to treatment
Condition Data
Primary focus of treatment
Anxiety Disorders [Panic Disorder with and without Agoraphobia; Specific Phobia; Social Phobia; Obsessive Compulsive Disorder; Type I trauma; Type II Trauma; Generalised Anxiety Disorder; Other Anxiety Disorder]
Mood Disorders [Depression; Bipolar Disorder]
Somatoform Disorders [Hypochondriasis; Other Somatoform Disorder]
Sexual and Gender Disorder (specify)
Eating Disorder [Anorexia Nervosa; Bulimia

90
Nervosa; Eating Disorder (Not Otherwise Specified)]
Sleep Disorder (specify)
Personality Disorder [Borderline Personality Disorder; Other PD (specify)]
Substance Related Disorder (specify)
Psychosis
Chronic Pain
Cardiac Health
Service Activity Data
All contact dates
Contact type at each date (e.g. therapy type- CBT, CBASP, IPT etc.)
Contact model at each date (e.g. 1-1 or group)
Therapist/clinician at each date
Duration of contact at each date
Assessment Measurement Data
Pre CORE score/date/type
Post CORE score/date/type
Any other assessment score/date
Discharge Data Discharge Date
Discharge type
g) Reconfiguration of PIMS.
It was identified that PIMS would need to be reconfigured to ensure there were opportunities to record the required data. Ensuring that these were discussed by both the clinical teams and the PIMS team was essential.
h) Additional on-site training and helpline.
In addition to reconfiguring PIMS it was recognised that the ELPT would require support to adopt new technical processes. A round of on-site training using real data (rather than theoretical examples) was the preferred option of the ELPT and this was provided by the PIMS team. Additionally a PIMS trainer made himself available for phone support on a continuing basis for a number of weeks following the training sessions. Providing this support was key to enabling the ELPT to effectively adopt changes in PIMS.
8.3.4 Disregarded Solutions Several solutions were considered that were disregarded during this project. A brief overview of these has been included below to support the decision making of other audiences.
i) Keeping local databases. Moving from keeping local databases of information to using the organisation’s central PIMS is a key strategic priority. It was agreed that as far as possible keeping data locally would be avoided.
91
j) Mobile technology support.
In the solution development workshops that were held, representatives from the ELPT were keen to explore the use of mobile technology to support data collection. In particular they felt that having tablet computers which patients could access to score outcome measures that would automatically upload with the other information stored about their contact with ELPT would be worthwhile. The therapists reported that this would significantly reduce the burden of data recording and would be likely to result in higher completion rates. This option was disregarded for two reasons:
First, there was not sufficient capacity in existing NHS Lothian IT systems to accommodate this method of recording data. As there was no way of automatically uploading the data into the current IT system, in essence it would simply move the burden of recording data on PIMS from the therapists to someone else who would receive information from the tablet.
Second, this approach would have breached the copyrights of the CORE Trust who developed and manage the CORE 34. Having the CORE 34 scored on a tablet computer would count as the unauthorised replication of the measure.
Although using mobile technology for data collection was not pursued in this project it may be worth considering elsewhere and the level of interest the therapists showed was taken to be symptomatic of the need to ensure that data collection practices fit with the typical daily pressures and challenges of clinical work.
k) Using the CORE PC. Consideration was given to using the CORE PC which provides an electronic way of recording data from the measure. This was quickly disregarded for a number of reasons.
First, it was seen to be an expensive solution to only one aspect data collection and would not support the collection of the raft of complementary information required to make sense of clinical outcomes at a team and service level.
Second, it was felt this system remains overly focussed on the measurement of individual performance and would not easily support the identification of areas requiring improvement. Finally from an organisation perspective it was felt to be a potential loss of data ownership.
8.4 Ongoing Challenges The following issues continue to present ongoing challenges to the effective recording and use of Clinical Outcomes data.
User interactions with PIMS. Ensuring that PIMS was made more intuitive to use by the clinicians had proved

92
challenging throughout the project and has in part been compensated for by providing additional on-site training and guidance materials.
Collecting discharge OM. The ELPT continues to experience challenges collecting CORE scores at discharge. This remains largely due to the tendency for patients not to attend their last planned session. Recommendations for managing this challenge are given below.
Reporting data to teams. The complex nature of clinical data including multiple variables with multiple responses has presented challenges around reporting data back to the ELPT. The potential causes for this have been discussed elsewhere in this report.

93
8.5 Clinical Outcomes Data Despite the ongoing challenges, progress has been made with collecting and reporting clinical outcomes data.
Pre-treatment CORE 34 The collection of CORE 34 before or at the start of treatment was effectively unknown. A snapshot of data from the first 3 months following the implementation of a new way of recording data on PIMS suggests that collection and recording on PIMS had reached 55.2%. It is likely that this compliance rate will increase as clinicians become more familiar with data recording procedures. Dispersal of CORE Scores at assessment is shown in the chart below:
Post -Treatment CORE 34 The collection of CORE scores for those patients who attended their last planned appointment was 50%. The actual numbers for this within the snapshot quarter were low as the majority of patients failed to attend their final scheduled session. All of the patients who were scored at admission and discharge demonstrated reliable and clinically significant change.

94
8.6 Key Lessons Learnt
Ensuring that electronic information management system fits with existing working practices is key to enabling the routine collection of outcomes measurements and related data. Above all information management systems must be intuitive and easy to use from a clinical perspective.
There appears a direct link between clinicians’ motivation to record data and their perceptions about the value of this to their (or their team’s) clinical activities. Ensuring clinical teams are able to access and scrutinise the data they record is key to establishing buy-in for elevated data recording activities.
Keeping clinicians involved in discussions regarding development of information management systems is key to ensuring that basic data needs are identified and included in system developments.
Ensuring that outcomes data can be viewed in the wider context of service activity is essential for ensuring the effort spent recording results in the ability to answer questions that are of direct clinical value and relevance. Identifying and collecting a minimum data set is strongly advised.
Recognising that the collection of a single global measure will not replace more sensitive condition specific measures is important. Efforts should be made when developing information management systems to build capacity to collect additional condition specific measures.
Teams should carefully consider the pros and cons of using outcome measures with strong copyright restrictions. Copyright levels vary between different tools and those which prevent reproduction or alteration of the way they are proofed (rather than making any substantive changes to the content of a measure which would affect its reliability and validity) without additional payment, significantly limit the degree to which they can be altered to fit with local practice without incurring additional costs. This may include translation into electronic versions which would enable more streamlined data collection.
Patients not attending last appointment are a major challenge in effective outcomes measurement if data is collected at only first and last appointment. A range of additional actions have been identified which may help to overcome this, each of which will have merits and drawbacks depending on context. These include:
o Collecting a patient recorded outcome measure (e.g. CORE 34) at each therapy contact. This may be time consuming, inappropriate for some patients and add to the burden of data recording but would ensure comprehensive data regardless of which stage a patient ceased attendance.

95
o Collecting abbreviated outcome measures (e.g. CORE 10 or 5) at each therapy contact. This is the approach currently recommended nationally, with CORE34 only collected at the initial and final contact. The services felt that, whilst this would ensure comprehensive data regardless of which stage a patient ceased attendance it may still be time consuming, inappropriate for some patients and adds to the burden of data recording. It also adds an additional set of steps in any analysis, though if appropriate systems are in place it can provide a rich source of information tracking progress over time that is of value to both the patient and the therapist.
o Scheduling discharge measurements for before the last planned
appointment. This may help to capture more data but may not ensure comprehensive recording as not all patients only default at last appointment. Also as there is an intention that the patients will be seen again it may not represent true outcome measure on discharge.
o Collecting an additional clinician scored measure on admission and
discharge. This would help to provide data that could be used for analysis which would avoid the potential for non-compliance associated with patient reported outcome measures (PROM). An appropriate measure would need to be identified.
o Clinician proxy scoring PROM. This may or may not be valid depending on the
psychometric properties of the tool used but would offer a way of ensuring more comprehensive data sets.
There are a number of simple steps which can be taken to support PSTs to collect data more routinely. There is value in discussing and developing these with teams so that any solutions are participatory and fit with existing norms and values.

96
Recommended Action
The Transformation Station work has to date focused on how to set up a reliable process within existing systems for the collection of Clinical Outcomes data. Consideration should now be given to:
Collecting data at more than the initial assessment and final treatment slot. If collection at every treatment slot is considered too onerous with current systems, then agreement should be reached to collect every x appointments.
Setting up routine outcome reporting at individual service user level, clinician level and team level.
Ensuring processes are in place for using the data at individual level with service users, at clinical level within supervision, and for service planning as a whole.
Recommended Action
There was considerable clinical support to look at the use of mobile technology to support outcome reporting. This issue should be looked at as a priority within Project Ginsberg – the new national project to look at making better use of new technologies to support self management by individuals with mental health problems. The project already includes the concept of developing applications for mobile technology that would enable service users to collect key information and forward this onto their clinical team.

97
9 Data Quality and Information Flow
9.1 Introduction & Recommendations from Phase One NHS Lothian’s community based specialist Mental Health services use Patient Information Management System (PIMS) as their electronic patient record and administrative system. During phase one of the DCAQ project, a number of pieces of analysis were undertaken, using data from PIMS for both services involved in the project. However, a combination of how the system works and how it was being used led to the following barriers to progressing with DCAQ analysis:
It was not possible to identify how many referrals were going specifically to the psychological therapies service(s) for assessment (PT services are delivered as part of wider mental health services).
It was not possible within PIMS to identify how many people were waiting for a Psychological Therapy, how long for and for what.
It was difficult for clinicians to get information back on activity, which led to low motivation to record or use data to inform service delivery and to localised development of unsupported, standalone data recording tools.
There were several different ways of capturing activity, which led to inconsistencies in how data was recorded.
There was a lack of clarity around clinical ownership of the data at service level.
Although there was a function for capturing clinical outcomes within PIMS, it was not routinely used or reported.
As a result, a number of recommendations were made in the Phase One report to address these issues. Specifically the recommendations targeted improvement in the quality and accessibility of demand, activity and queue data, and of clinical outcomes data.
9.2 Related work undertaken in Phase Two To address the above issues, a number of steps were taken; 1. For each service, PIMS data was checked against case notes. Variations across each team in current information capture processes were documented. Further detail on the findings of the case note audit can be found in section 9.3. 2. A Psychology Assistant undertook a piece of work to map the current practice for using PIMS with each service. This involved speaking with key individuals along the patient pathway both from admin support and with clinicians from each part of each service, asking each person, for each step in the pathway: a) what information is recorded? b) where is it recorded? c) who records it? d) approximately how long does it take?

98
e) what sort of timeframe is it recorded in? (e.g. 2 days after receipt of referral) Some of the questions asked either could not be answered or had several different answers. This was useful in highlighting gaps and inconsistencies in the data collection process. From the information gathered from interviews, a “current state” information flow diagram and document for discussion was developed. The new information flow process was then implemented. Data quality reports were produced to help identify issues with the new data collection process, along with random checks of case notes against data quality. As a result of the work done, NHS Lothian now has a robust information flow process, easily articulated and demonstrated, supported by training materials and expertise which will enable the approach to be rolled out across the other teams offering Psychological Therapies within the Health Board. There is now the possibility, with a little analytical support, that NHS Lothian could develop and provide a set of routine reports for each service which covering demand, activity and queue data. Examples of what is possible are provided throughout this report. Both services have made a concerted effort, along with the PIMS manager, to improve the coverage and quality of data being collected and made significant advances in terms of being able to analyse the demand being placed on them, and the waiting times for each part of the service. However, the significant delays in providing analysed data back to the team have presented an ongoing risk to the data quality and may have undermined the work undertaken. The information flow process was developed with wider rollout in mind. However the rollout will need to take an approach that allows for slight operational differences in practice to be accommodated, where there is good clinical or operational reason for doing so. If more than one or two differences in practice are encountered, then it may be beneficial to undertake a similar information flow mapping exercise to the one described above.
Recommended Action
Each service now needs to begin using the information they have at their disposal to consider what opportunities they have for improving both the quality of service provision, and for flexing capacity to meet the presenting demand.
The Psychological Therapies services involved in this work need to continue to take responsibility for the quality of data being collected. To do this effectively, each service must have ongoing, rapid access to data quality reports and to supplementary training or support should the need arise.
Whilst the work undertaken in phase two of this project has identified one solution to gathering all of the required information, the information flow process needs to be open to improvement itself; for example, if a quicker way of recording the relevant data is identified with no detriment to data quality, then this should be considered centrally by the “Lothian Meets A12” team.

99
9.3 Additional data quality issues addressed during Phase 2 Midlothian Case-note Audit 24 patients were selected at random from those discharged between June 2010 and November 2010. The sample contained 14 patients who had been in contact with the service for 12 months or longer, and represented a reasonable split between psychology and therapist cases. Numbers of contacts within the case notes were compared with numbers of contacts recorded on PIMS. Supporting Analysis
Midlothian Psychological Therapies Service: Data Validation Exercise (N=24)
Case notes PIMS
Total Number of contacts (T) 154 87
Mean number of follow-ups: X =(T-N)/N
5.4 2.6
There was a large discrepancy between the mean numbers of follow-ups for the patients audited when comparing case notes and PIMS.
15 of the 24 cases had either the same number of contacts on PIMS as in case notes, or differed by just one contact.
However, as can be seen in the table above, there were sufficient differences between PIMS and case notes in the remaining cases to result in PIMS data producing a mean number of follow-ups that was less than half of the actual mean number of follow-ups that had taken place.
Further investigation revealed that there wasn’t a standardised, agreed process for capturing information on PIMS. See previous information flow section for details of how the team addressed this issue.
East Lothian Case-note Audit 23 patients were selected at random from those discharged between June 2010 and November 2010. This number represented a reasonable split between psychology and therapist cases. Numbers of contacts within the case notes were compared with numbers of contacts recorded on PIMS. Supporting Analysis
East Lothian Psychological Therapies Service: Data Validation Exercise (N=23)
Case notes PIMS
Total Number of contacts (T) 189 104
Mean number of follow-ups: X =(T-N)/N
7.2 3.5
There was a large discrepancy between the mean numbers of follow-ups for the patients audited when comparing case notes and PIMS.
19 of the 23 cases had either the same number of contacts on PIMS as in case notes, or differed by just one contact.

100
However, one case differed by 65 (65 more contacts took place than were recorded on PIMS). This one case alone would have been enough to provide a significantly inaccurate new to follow-up ratio upon which to base a DCAQ analysis.
Further investigation revealed that there wasn’t a standardised, agreed process for capturing information on PIMS. See previous information flow section for details of how the team addressed this issue.
Recommended Action
Regularly and routinely available data quality reports, discussed as part of routine business, would provide good feedback on adherence to the new process.
Every six months, a random set of case notes for patients across the service should be audited against contacts recorded in PIMS, to ensure that the team are achieving good data quality in relation to activity and queues.
PIMS Training staff should be involved if it is felt that there is a particular area of system functionality which is causing problems for system users.

101
10 Summary of Recommendations and Next Steps
Throughout the report, a number of recommendations have been made and wider learning identified. This section summarises those recommendations and key learning.
10.1 Recommended actions for NHS Lothian In order to make for easier reading, NHS Lothian recommendations have been grouped under one of three broad headings, rather than the order in which the appear in earlier sections. The headings are:
Diagnosing and Releasing Productive Opportunities, focusing on recommendations attached to either the ongoing diagnosis of productive opportunities or recommendations which are attached to releasing productive opportunities already identified.
Data for Continuous Quality Improvement, focusing on recommendations attached to collecting and reporting data that will help teams to identify opportunities for improvement and assess whether any changes tested have delivered improvements.
Effective Management of the Service, focusing on recommendations attached to implementing processes that ensure teams are operating effectively.
10.1.1 Diagnosing and Releasing Productive Opportunities
It is recommended that a regular cycle of activity audits is established to allow for ongoing monitoring of potential opportunities for increasing direct clinical time. An activity audit conducted every six months would strike a reasonable balance between the administrative burden of undertaking an audit, and the value of having an understanding of how capacity is being used.
An internal review of the effectiveness of meetings took place within each team. There may be benefits to someone external to the team conducting a review which needs to include the necessity of the meetings, effective chairing, attendance at meetings, clarity on outcomes sought for items and whether appropriate information is available and effective capture of minutes. The Productive Leader resource includes a module on running effective meetings and may support the service in conducting their review.

102
Administration Burden. This work has highlighted that significant clinical time is spent on both clinical and non-clinical admin.
ELPT MLPT
% of total time spent on clinical admin
24% 25%
% of total time spent on non clinical admin
8% 10%
% of total time spent on admin
32% 35%
It is recommended that NHS Lothian now undertake a focused piece of work to test interventions which might reduce the admin burden on psychological therapies staff. This work should consider:
o Ensuring that community teams have appropriate levels of admin support so that clinicians are not spending time fulfilling basic admin tasks such as room bookings, etc.
o What information is currently being captured (both quantitative and qualitative) and whether there are any opportunities for streamlining this. This should include looking at clinical communication, such as the information being sent to GPs, duplication of recording, the use of standardized letters/templates, etc.
o The use of new technologies to reduce the time spent collecting both qualitative and quantitative information. As an example, there is increasingly a requirement for clinical staff to input information directly to computers but differences in typing speeds can have a significant impact on time spent inputting information. Newer technologies such as digital pens (where the person writes the information and this is then automatically transmitted to the computer) and dictation software (where the person speaks and the IT system converts it to typed text) can deliver ongoing improvements in the amount of time spent inputting information and hence release time for direct client contact.
Focused work to reduce follow-up DNA. As part of the Phase 2 work the teams tested some changes to reduce new DNAs. Focusing on follow-up DNAs appears to be counter-intuitive for teams as the new DNA rates are usually much higher. However, a 1% reduction in the follow-up DNA rate would have far greater impact on time available for clinical work than a 1% reduction in the new DNA rate (due to the number of follow-up appointments in comparison with new appointments). Going forward, the focus for psychological therapies services needs to be on follow-up DNAs. We recommend as a next step undertaking a detailed assessment of the reason why individuals are not attending or cancelling follow-up appointments, including looking at whether individuals are using DNAs to self discharge. Please see the Effective and Efficient CMHS Toolkit section on DNAs for more information on both diagnosing opportunities for improvement and ideas for delivering reductions in DNAs. It is vital that

103
regular data on DNA rates is made available to teams to support this work. As a minimum DNA rates should be reported in run charts monthly. Whilst targeted improvement work is taking place it would be useful to report weekly.
Focused work on reducing CNAs and/or processes for filling cancelled slots. The work has highlighted that the CNA rates are running at a similar level to DNA rates. Unless there is a system for rapidly filling cancelled appointments, this will also result in a significant loss of face to face clinical time. Again the initial focus should be on follow-up CNAs and the next step should be undertaking a more detailed assessment of the reason why people are cancelling so many appointments to inform what changes might lead to an improvement. Further, the teams need to have a process for rapidly filling cancelled appointment slots. However, taking this action forward depends on the teams having appropriate levels of admin resource to set up and administer such a system. However, services need to test whether a move to choice booking (where the patient picks the time they want to be seen) would help in reducing the cancellation levels and hence reducing the level of rework for admin and lost capacity for late notice cancellations. However, this will not be possible without appropriately resourced admin for the teams. Further, there is a need nationally to raise the potential capacity losses being experienced by CNAs.
Service Focus. MLPT may be able to make real inroads on waiting times for the service by exploring options to redirect some of the level two work in Midlothian to other existing appropriate services such as guided self help, telephone CBT and input from Orchard.
Training issues. The MLPT activity audit highlights that there are opportunities to shift the current focus of some posts so that they spend more time working at a higher intensity level. However, further training and supervision will be needed to ensure that the staff have the appropriate skills to deliver therapies at a higher intensity level. Work should progress to identify the specific therapies where is the biggest capacity gap and then ensure that current staff are trained up to work in these modalities. Provided that waiting times for specific therapies are now accurate, a brief exercise looking at the needs/profile of levels of intensity for those people currently waiting for the service may further identify what level of training, for which therapies, would be of greatest benefit in relation to reducing waiting times.
Skill mix. As teams start to collect more reliable information about the demand for their service, this is likely to highlight further issues about the current skill mix of teams. NHS Lothian needs to have systems in place to enable staffing decisions to be based on need and not the historical allocation of budgets between professional groups.
Long Term Case Reviews. NHS Lothian should consider a standardised process for longer term case reviews that would ensure all cases have a multidisciplinary discussion once they reach a given trigger (which could be a certain number of appointments or length of time on caseload. The testing in MLPT highlighted the benefits of conducting reviews with small subgroups of the wider multidisciplinary team as large numbers of individuals present are not conducive to open discussions and are also not cost effective.

104
10.1.2 Data for Continuous Quality Improvement
For the new information flow process to work, teams must receive back regular reports that use the data entered. Therefore, prior to rolling out the new information flow process across NHS Lothian, it is recommended that work is undertaken to agree both the content and format of a key suite of monthly information reports at team level. If the pressure for roll out is such that this can’t be held back then the work should progress in parallel. Ideally, the system needs to be set up so that the reports are automated and teams can pull them off the system themselves. Failure to automate the reporting is likely to lead to ongoing problems producing them due to the pressures and capacity issues on information services departments. Ideally these reports should include clinical outcome information to ensure a focus is kept on both access issues and clinical outcomes. The following list identifies learning from this work around what information needs to be reported to teams monthly: o Regular monitoring of referral numbers in a run chart format is a key way to spot
any statistically significant changes that may then result in an increase in the overall level of demand being experienced, and hence a services ability to meet waiting time targets. Referral data in this format should be routinely available to all community mental health services.
o Ideally the chart also needs to include the actual demand for new assessments (which equals referrals minus opt outs minus referrals referred on without seeing) as a significant movement in referrals may not translate to a significant increase in demand for new assessments, depending on movements in the other two variables (opt-in rates and referrals on without seeing). However, for this run chart to be valid, the opt-in and referrals on without being seen data needs to be recorded for each individual against the initial month the referral was received.
o DNA and CNA rates are a key data point to track over time so that any significant changes can be picked up quickly and a response agreed. Further tracking rates in this way enables teams to quickly assess whether any changes they have made have led to an improvement. This data should be made available to teams as part of a monthly management report.
o The current waiting times report enables effective local management of waiting times at an individual patient level. However the teams also need to have summary information on their waiting lists that enables them to track key indicators over time. Section 7.1.3 makes suggestions for data that should be reported monthly as part of a suite of indicators.
o Routine reports should be produced that enable the team to regularly assess the throughput of work the team is undertaking (i.e. new to follow-up ratios and no of new assessments compared with no of discharges each month) and to identify where appropriate goal setting and review mechanisms can be better utilised.
o The monthly reports need to include team level information on clinical outcomes. Further work is needed to agree the format and presentation of these reports. In addition clinicians should have access to clinical information at a service user level

105
to inform both the outcome of individual service user interventions and to use within the clinical supervision setting.
A key ongoing challenge for the clinical outcomes work has been the collection of data at discharge. A number of solutions have been considered as part of the Transformation Station work and NHS Lothian needs to identify a way forward. If collection at every treatment slot is considered too onerous with current systems, then agreement should be reached to collect every x appointments.
The 2012/13 QuEST Access Funding provides a time-limited increased analytical capacity. Part of their priorities should be to set up a sustainable process for routine information reporting that is not then dependent on analytical capacity that is not available in the longer term. Hence it is recommended that an early priority for this is to ensure that automated systems are put in place to enable teams to receive back a set of monthly reports including the indicators identified above.
However, the complexities of DCAQ analysis and the need to drill into data for improvement work, means that there will continue to be a requirement for some ongoing analytical support for mental health services. Ideally this should be part of the Business Intelligence Unit resources so that the input does not become person dependent (and hence the skills/understanding lost when the person moves job). It is recommended that NHS Lothian allocates some recurring analytical resource to support improvement work in mental health. Further, this resource should be attached to the Health Intelligence Unit in a way that ensures the sustainable development of the knowledge and skills for using information to drive improvement in Mental Health.
Every six months, a random set of case notes for patients across the service should be audited against contacts recorded in PIMS, to ensure that the team are achieving good data quality in relation to activity and queues.
Whilst the work undertaken in phase two of this project has identified one solution to gathering all of the required information, the information flow process needs to be open to improvement itself; for example, if a quicker way of recording the relevant data is identified with no detriment to data quality, then this should be considered centrally by the “Lothian Meets A12” team.
PIMS Training staff should be involved if it is felt that there is a particular area of system functionality which is causing problems for system users.
Further work is needed locally to ensure accurate information on the % of new referrals which go into groups.

106
10.1.3 Effective Management of Service
Managing high levels of variation is always challenging. Sometimes there is no option as the variation is naturally occurring. Other times the variation is a symptom of the way the system is designed and/or the behaviour of individuals working in the system. It would be useful to understand more about the level of variation in referrals to psychological services to assess whether there is anything that can be done to reduce it and hence smooth the workload. NHS Lothian may want to compare the levels of variation across teams to see if there are common seasonal trends. Further, breaking the referral data down by GP practice may provide additional insights.
Demand for group work and the impact on delivering 18 week target. Both MLPT and ELPT operate a system whereby a group will not start until a minimum number of people have been assessed as needing it. This is usually 12 people. For groups with low levels of annual demand this means that there can be significant waits for individuals who are referred just after a group has started and hence are waiting for the next group to start. This may impact on the ability to deliver the 18 week target. Further, with small numbers there is usually a greater level of variation which makes it harder to routinely predict when there are likely to be 12 people and hence to plan a schedule of groups in advance. One way of managing this is to offer groups for which there is a low level of demand at a cross locality level. This should both reduce the length of wait till a new group starts and make the timing of new groups more predictable. Obviously a challenge here is then finding a venue that is accessible for the whole catchment area for the group.
The recommendation from the Phase One report to implement a job planning system is still valid. ELPT are committed to doing this, but the action was put on hold whilst work progresses to agree a consistent approach across the whole of NHS Lothian Psychological Therapies and Psychology Services. ELPT may benefit from piloting an approach to job planning so that they can move ahead with putting a planned balance of new and follow-up slots in place.
Ability to redesign skill mix against demand. NHS Lothian does not at present have an organisational structure that provides a point of single operational management of its Psychological Therapies Services. Instead the nurse-let parts of the service are accountable through their professional structures, and the psychology led services through a separate structure. This type of structural accountability is true of many Psychological Therapies services and in this situation it is vital that there is overriding leadership in place that has the authority to address any barriers to progressing improvement. Further, as services start to collect more reliable information about the demand for their services, this is likely to highlight further issues around the current skill mix of teams. NHS Boards and Health and Social Care Partnerships need to have systems in place to enable staffing decisions to be based on need and not the historical allocation of budgets between professional groups.
Maternity Leave. It is common practice across psychological therapies services to leave maternity leave uncovered, due to a lack of funding to put cover arrangements in place. This work has highlighted the risks this presents to the delivery of the 18 week target.
107
Where teams are either running their capacity close to or less than current levels of demand, a further reduction in capacity due to uncovered maternity leave will result in increased waiting times and may impact on a services ability to meet the target. Hence, NHS Lothian may need to allocate resources to fund maternity leave cover for psychological therapists
System for booking routine appointments in turn. Services need to ensure that systems are in place for booking routine appointments in turn (i.e. appointment slots should be offered to the patients who have waited the longest). The profile of waiting lists indicates that this may be a particular issue for MLPT. MLPT should review the reasons for its longest waits to assess whether they are an indication of a particular type of capacity gap (i.e. not enough staff trained in a particular therapy, demand for group work at a locality level being too small to justify regular provision, etc.)
10.2 Next Steps for NHS Lothian This project has been invaluable in terms of informing our planning of what needs to be done across Lothian to enable delivery on the Psychological Therapies HEAT target. We have ensured that we have maximised this early implementer opportunity by linking to complimentary workstreams which include:
o The NES funded Psychological Therapies Training Coordinator has to date made a significant contribution to establishing a baseline for staff competencies and skills in psychological therapies. Guidance has been produced in relation to the 17 formal modalities which will be delivered by staff who are trained and supervised across Lothian. It is against these 17 modalities that we have developed processes to record and measure and monitor our waiting times for psychological therapies.
o The explicit linking of the early implementer project to the work led by the
Transformation Station on collecting outcome measures as routine practice has created a firm foundation in our understanding of the differences in terms of clinical outcomes that evidence based therapies are having on patients.
o Implementation of “A Sense of Belonging” , Lothian’s joint mental health and wellbeing
strategy 2001-2015 which sets out we will improve six outcomes: o More people will have good mental health o More people with mental healthy problems will recover o More people with mental health problems will have good physical health o More people will have a positive experience of care and support o Fewer people will suffer avoidable harm o Fewer people will experience stigma and discrimination
through priority actions which tackle health inequalities, embed recovery and a living well ethos, build social capital and wellbeing and improve services for people across Lothian for people all ages.
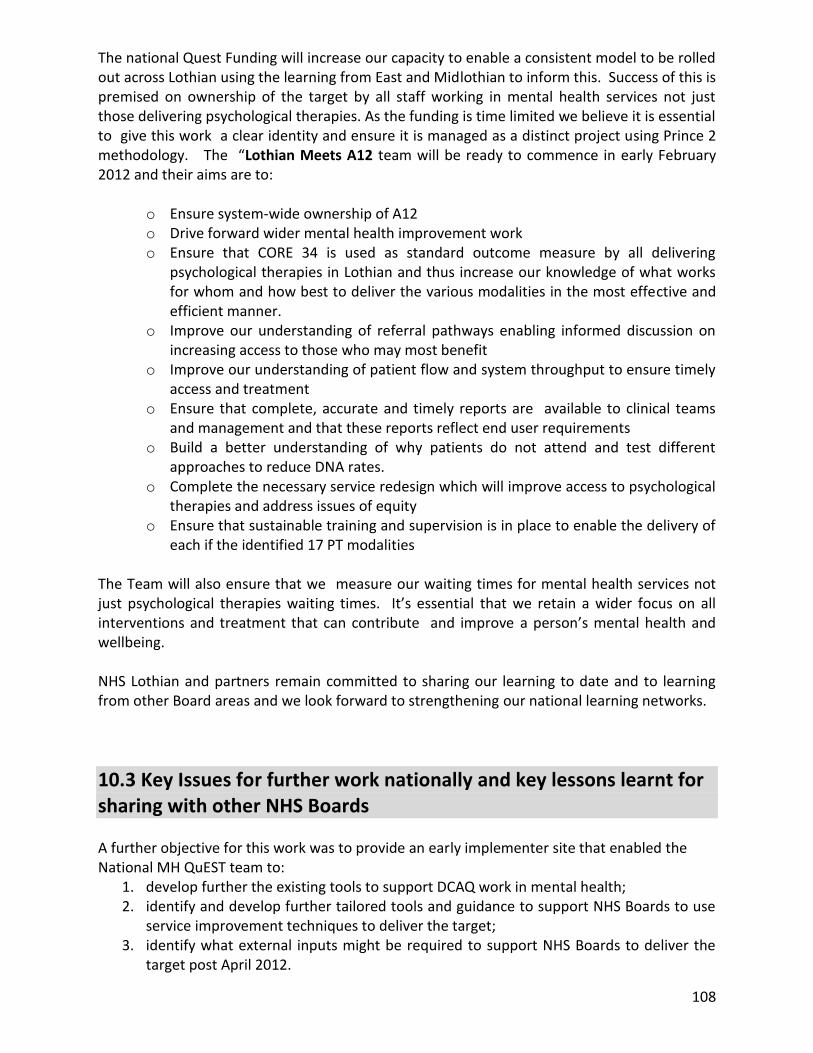
108
The national Quest Funding will increase our capacity to enable a consistent model to be rolled out across Lothian using the learning from East and Midlothian to inform this. Success of this is premised on ownership of the target by all staff working in mental health services not just those delivering psychological therapies. As the funding is time limited we believe it is essential to give this work a clear identity and ensure it is managed as a distinct project using Prince 2 methodology. The “Lothian Meets A12 team will be ready to commence in early February 2012 and their aims are to:
o Ensure system-wide ownership of A12 o Drive forward wider mental health improvement work o Ensure that CORE 34 is used as standard outcome measure by all delivering
psychological therapies in Lothian and thus increase our knowledge of what works for whom and how best to deliver the various modalities in the most effective and efficient manner.
o Improve our understanding of referral pathways enabling informed discussion on increasing access to those who may most benefit
o Improve our understanding of patient flow and system throughput to ensure timely access and treatment
o Ensure that complete, accurate and timely reports are available to clinical teams and management and that these reports reflect end user requirements
o Build a better understanding of why patients do not attend and test different approaches to reduce DNA rates.
o Complete the necessary service redesign which will improve access to psychological therapies and address issues of equity
o Ensure that sustainable training and supervision is in place to enable the delivery of each if the identified 17 PT modalities
The Team will also ensure that we measure our waiting times for mental health services not just psychological therapies waiting times. It’s essential that we retain a wider focus on all interventions and treatment that can contribute and improve a person’s mental health and wellbeing. NHS Lothian and partners remain committed to sharing our learning to date and to learning from other Board areas and we look forward to strengthening our national learning networks.
10.3 Key Issues for further work nationally and key lessons learnt for sharing with other NHS Boards A further objective for this work was to provide an early implementer site that enabled the National MH QuEST team to:
1. develop further the existing tools to support DCAQ work in mental health; 2. identify and develop further tailored tools and guidance to support NHS Boards to use
service improvement techniques to deliver the target; 3. identify what external inputs might be required to support NHS Boards to deliver the
target post April 2012.

109
10.3.1 Developing further existing tools to support DCAQ work in mental health
Mental Health DCAQ Tool. The work has also enabled the prototype Mental Health DCAQ Tool to be tested and changes made. This tool has now been released to Mental Health Services, though only once an agreement is signed indicating that the recipient understands the tool is still in prototype and acknowledges the limitations of the outputs. The analysis contained within this report has highlighted the need to develop the tool further and in particular:
o To develop the tool so it is able to model different pathways within one team. o To adjust the tool to add in a separate field for cancellations. o To refine the group work section of the tool. o To assess whether it is possible to adjust the tool so that it can advise on the
optimal balance between new, follow-up and group work in the situation where there is not enough capacity to meet the demand (the tool already advises on what is needed to match capacity to demand).
o To assess whether it is possible to for the summary results to include some indication of the margins of error around them.
Mental Health Activity Tracker (MHAT). The work has also informed the development of the MHAT Tool and related guidance – including information on the read across to existing tools such as Consultant Job Planning Guidance. Further, the difficulties with getting the data analysed informed the decision to develop a database that automates the MHAT analysis and the aim is to have this available for NHS Boards by Spring 2013.
10.3.2 Identifying and developing further tailored tools and guidance to support NHS Boards to use service improvement techniques to deliver the target
Effective and Efficient CMHS Toolkit. The work has informed the development of the Effective and Efficient CMHS Toolkit – which includes sections on practically how to do Demand, Capacity and Activity Analysis within community mental health services. The final version of this toolkit (due in Spring 2013) will include case study examples from the Lothian Early Implementer work and the additional learning generated from this work.
CMHS Improvement Dataset. This work is informing national work to develop a set of example reports to enable the effective management of community mental health services. This work will be relevant to psychological therapy teams.
Availability of admin support. This work has highlighted that there are efficiency gains to be made by appropriately resourcing administration time in community mental health services. However, a narrow focus on maximising the numbers of front line staff and reducing ‘support services’ may actually be resulting in less time being available for direct clinical work. It is recognised that this focus is sometimes driven by external pressures. There is a need to promote a better understanding amongst key decision makers on the

110
impact that administrative staff can have on enabling efficient and effective delivery of services and the potential negative impacts of cutting staff simply to reduce ‘support services’ costs.
Optimal time for direct client contact. There is a recognised need to ensure that community mental health staff are spending optimal time in direct client contact. However, optimal time for any individual clinician will be dependent on a number of variables including: the level of experience of the clinician, the extent to which the job role includes providing consultation/liaison support to other professionals, and the intensity of the clinical work undertaken. Therefore it is not possible to set a target figure. Further, at present there is no guidance on an acceptable range. The consultant’s contract works on an 80/20 direct clinical care/supporting professional activities split. However, this includes clinical admin, travel, giving and receiving clinical supervision, multidisciplinary team meetings under direct clinical care. As such, this is a very broad definition of direct clinical care that doesn’t really provide an understanding of how time is being spent. The DCAQ work in mental health splits this work into direct client contact time and indirect client contact time. There is a need to better understand the optimal range for direct client contact time, and further work should be undertaking nationally to look at guidance for services on this issue.
Importance of acknowledging MDT context (including admin) in any resource reviews. One of the concerns that teams have about transferring resources from clinical budgets to admin is that the admin resource will then be targeted at a later stage for savings or there will be an admin review which results in some of their admin resource being moved to another team who is not as well resourced. If a team has higher levels of admin because they have moved resources out of the clinical budget to fund this then clearly redistributing their admin to other teams without also considering the numbers of clinical posts, is considered unfair. If services are going to transfer resources from clinical to admin to improve overall efficiency then they will need to address these concerns, otherwise the team could end up being worse off overall in the longer term. This also highlights the need for any reviews of staffing to be done on a multidisciplinary basis. As Community Mental Health Services/Psychological Therapies Services work as a team, looking at any profession in isolation (including admin) and redistributing resources on the basis of a profession only analysis is rarely appropriate.
DNA/CNA rates. Even though follow-up DNA rates tend to be lower than new DNA rates, because there are so many more follow-up appointments they account for a much higher number of hours lost. Therefore, when doing work to reduce DNA levels, it is more productive to start by focusing on follow-ups. It is also generally considered an easier area for interventions as the individuals are known to the service.
Data to inform tests of change. The Lothian teams have struggled to access data to inform their testing of change. For improvement purposes, it is important to track key data over time to see whether any changes are statistically significant and sustained and hence appropriate analytical support needs to be made available for services engaged in work to improve access whilst maintaining or improving quality.
111
Importance of having a system for allocating follow-up work separately to assessments. A key aim of DCAQ work is to understand on average how many news and how many follow-ups need to take place each week for the system to be in balance (i.e. to keep on top of the referrals presenting). The levels of variations in numbers of follow-ups each individual patient receives means that it is highly likely that an individual practitioner will have capacity to take on new assessments at a given moment in time, but not the associated follow-up work. However, another member of the team is highly likely to have the capacity at that point to take on the follow-up work. This dynamic is already well understood in CAMHS services, the majority of which have now implemented the CAPA model which means that the person assessing will not normally do the follow-up work. This approach means that staff can operate to a set number of new and follow-up slots each week. Both ELPT and MLPT are set up to function in this way, however this way of working may present significant challenges for some services who have traditionally operated on the basis that the assessor will also provide the intervention. Continuing to run the system on the basis that the person who assesses also provides the intervention will make it very difficult, if not impossible, to move to a planned approach which keeps the number of news and follow-ups in balance (unless there is very little variation in follow-up rates between individual patients). There is key learning here from the CAMHS experience that could usefully be shared across adult psychological therapies services – including resources that address clinical concerns around this model.
Benchmarking New to Follow-up Ratios. The MH QuEST New to Follow-up paper highlights that great care needs to be taken when comparing new to follow-up ratios between individual practitioners as it would be very easy to draw inappropriate conclusions from the data. That same warning applies at a team level and is highlighted by this work. The team with the lower average new to follow-up ratio was also the team that had a higher percentage of its workload as longer term work. The reason why their average came out so low was due to the number of low complexity cases which were being seen for very short periods of time. One of the recommendations from this work is that the service looks at diverting this workload to other services in the community. The impact of this will be to increase their average new to follow-up ratios, which will be perfectly appropriate in this context. A much better understanding of what is happening within a team/system can be gained by looking at the distribution of new to follow-up ratios as this will highlight the number of individuals who had one appointment, two appointments, etc. To get a sense of how this is changing over time, anonymised patient level data should be plotted in a run chart in date order of discharge. This would also enable any outliers to be identified and pick whether any particular team members are consistently outliers. This could then lead to discussions to understand if this was due to the complexity of cases they were taking on or something else. It would also enable the team to see quickly whether there were changes to the distribution of new to follow-ups over time. The key in all of this work is to use the data to understand what is happening and to focus appropriate questions and discussions. Using the data to make judgements is rarely appropriate and can lead to individuals/teams distorting their practice or the data

112
inappropriately. A lot of the concerns expressed by clinicians to the MH QuEST team in the work we do are around managers and leaders taking data, misinterpreting it and then making poor decisions on the based on this misinterpretation. Care needs to be taken at every level of the system to ensure that this does not happen and that data is used intelligently to drive improvement forward but not in isolation of wider contextual knowledge and understanding.
Optimal New to Follow-up Ratios: Building on the above point, we don’t know what the optimal new to follow-up ratios are for mental health services and clearly, even if we did, they would vary considerably depending on the diagnosis and the complexity of issues presenting. The key from a service improvement perspective is making sure that effective caseload management and caseload review systems are in place so that there is a fair and manageable distribution of workload between team members and individual practitioners are supported to discharge service users at an appropriate time. We also recommend having trigger points in place to review longer term cases and using a small subgroup of the multidisciplinary team for this (as the multidisciplinary perspective can bring benefits over and above those gained through discussions in supervision).
Mobile Technology There was considerable clinical support to look at the use of mobile technology to support outcome reporting. This issue should be looked at as a priority within Project Ginsberg – the new national project to look at making better use of new technologies to support self management by individuals with mental health problems. The project already includes the concept of developing applications for mobile technology that would enable service users to collect key information and forward this onto their clinical team.
10.3.3 Identifying what external inputs might be required to support NHS Boards to deliver the target post April 2012.
Quest Resource Allocation. This work has helped inform the decision to allocate
additional funding to all NHS Boards to support work to deliver the Mental Health Access Targets. It is not yet clear whether there will be any central resources allocated for 2013/14, but, if QuEST does have development funding available for 2013/14 then the learning from this work will inform discussions on how it is targeted.
Analytical Time A lack of analytical input has been a key issue throughout this work, presenting ongoing barriers. For instance there were significant delays in extracting the data from the system. Once the data was extracted, there were then capacity issues with reporting the data in an accessible format that enabled the ongoing management of waiting lists and informed the direction of service improvement work. This presented the following issues:
Services did not have the information to enable to effectively manage current waiting lists.
Services did not then have key information to enable them to understand where to direct their service improvement work, or data to tell them whether the changes they were testing were making a difference.

113
When data is not fed back and used, this then presents ongoing concerns with the quality of the data as feeding back meaningful information to those collecting data is key to maintaining the motivation for accurate recording.
Most NHS Boards have used some of the 2012/13 QuEST Access Funding to resource a time-limited increased analytical capacity. Part of their priorities should be to set up a sustainable process for routine information reporting that is not then dependent on analytical capacity that is not available in the longer term. However, the complexities of DCAQ analysis and the need to drill into data for improvement work, means that there will continue to be a requirement for some ongoing analytical support for mental health services and NHS Boards will need to ensure that this resource is available on an ongoing basis to support the sustained delivery of the access targets.
Mental Health DCAQ Webex. A series of webex sessions is being planned for 2013 and this work will inform both the focus and content of these sessions.
Mental Health DCAQ Community of Practice. A CoP has been set up that is currently in the beta-testing phase. The aim is to launch it fully by the end of Jan 2013. This will provide a website where services can access all the key resources currently available to support DCAQ work. It will also enable those doing the work in different Boards to share what they are doing, ask questions of each other and jointly problem share the common challenges.

114
Scottish Government (QuEST) NHS Lothian
Paul Arbuckle National Improvement Advisor
Gail Denholm Community Mental Health Nurse Team Manager
Ruth Glassborow National Lead, Mental Health
Norman Frazer Consultant Clinical Psychologist
Patricia Graham Consultant Clinical Psychologist Head of Adult Mental Health Psychology NHS Lothian
Linda Irvine Strategic Programme Manager, Mental Health and Wellbeing
Maureen McKenna Community Mental Health Nurse Team Manager (CMHT & Psychological Therapies
Duncan Pentland
Transformation Station Project Manager, School of Health Sciences Queen Margaret University
Graeme Stoddart PIMS Manager

115
Appendices
Appendix A - Run Chart Rules for Interpretation
This section is paraphrased from: Lloyd & Provost (2011): The Health Care Data Guide – Learning from Data for Improvement, Chapter 3 and from: http://www.knowledge.scot.nhs.uk/media/CLT/ResourceUploads/1006891/Good_Practice_Guide_Data_Management_run_chart_rules.pdf
There are a number of rules that can be applied to a run chart to help determine whether or not the variation within the dataset is due to the random variation typical of performance of that process, or due to non-random attributable change in the process: o Rule One – A Shift o Rule Two – A Trend o Rule Three – A Run o Rule Four – Astronomical Data Points Below is a description of each rule and how to apply it. Rule One – A Shift A shift on a run chart is six or more consecutive points either all above or all below the median. Values that fall on the median do not add to nor break a shift. Skip values that fall on the median and continue counting. This rule is based on statistical probability. For example, for an event with two possible outcomes, where each outcome is likely to happen 50% of the time, the probability of the same outcome occurring six times in a row is less than 3 in 1000. Therefore the change is likely to be attributable to something, and not the result of random variation within a process.

116
Rule Two - Trend A trend on a run chart is five or more consecutive points all going up or all going down. If the value of two or more successive points is the same, ignore one of the points when counting. Like values do not make or break a trend.
Rule Three - Runs A run is a series of points in a row on one side of the median. A non-random pattern or signal of change is indicated by too few or too many runs or crossings of the median line. To determine the number of runs above and below the median, count the number of times the data line crosses the median and add one. Statistically significant change is signalled by too few or too many runs, again calculated using statistical probability.
The following table is used in conjunction with this rule to identify the lower and upper limit for the number of runs depending on the number of data points you have:

117
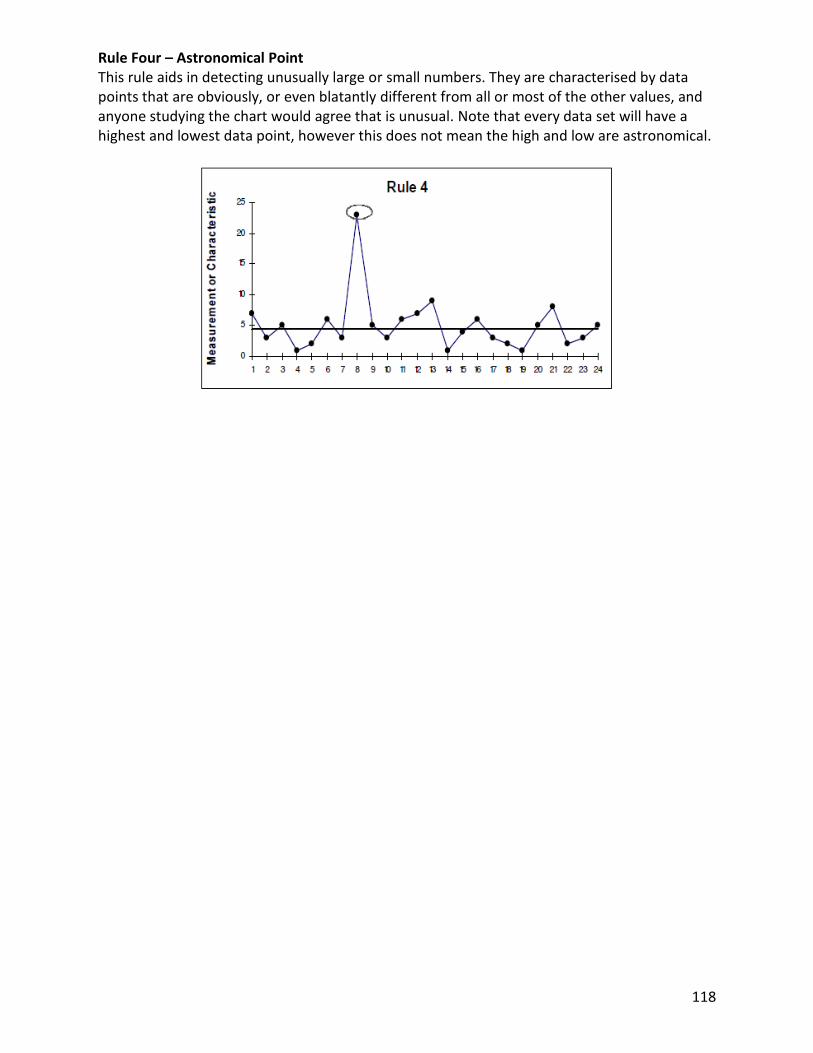
118
Rule Four – Astronomical Point This rule aids in detecting unusually large or small numbers. They are characterised by data points that are obviously, or even blatantly different from all or most of the other values, and anyone studying the chart would agree that is unusual. Note that every data set will have a highest and lowest data point, however this does not mean the high and low are astronomical.

Appendix B: Technical notes, Data sources, notes/ comments and Assumptions i) generic assumptions built into DCAQ Tool Section Field name (if applicable) Assumption/ comment
All
Sections
All fields where averages are entered or
displayed
The tool requires entry of averages (in this case, Mean) on a number of occasions, and provides averages (Mean) in the summary
data. As a result, all calculations, summary data and charts are subject to confidence intervals determined by how representative
each average entered is of the sample data it represents.Therefore the inputs into the tool are not exact and hence the outputs are
not exact. The results in the tool must be interpreted with this in mind. Where possible, you should seek to understand the variation
in each variable for your service and seek to identify opportunities to reduce that variation where not in response to service user
clinical need. For further information on how to identify variation in your data and how to respond to it, contact QuEST via the
hyperlink on the introduction page.
However, although averages are used, the tool will give a ball park indication of demand and capacity over the specified period, and
the scenario function within the tool allows you to see the effect of changing any of the variables in the calculation on your overall
demand and capacity. The tool is designed to help you identify opportunities to better manage your demand and capacity.
Demand DNA rate for first assessment slots 1st appointment DNAs are returned to referrer
Demand
Time allocated for first assessments not used
due to DNA
Time lost for new and follow-ups calculated at 100% of direct clinical time and 50% of indirect clinical time on basis that some
clinical admin is done prior to individual not turning up
Demand
Time allocated to followups not used due to
DNA
Time lost for follow-ups covers those in individual work only - not those who DNA group work as the group will normally go ahead
even if some people DNA
Demand
Average clinical contact time taken per first
assessment assumes one staff member per slot
Demand
Average clinical contact time taken per follow-
up assumes one staff member per slot
Demand Demand for Follow-ups
This assumes that the average new to f/up ratio is the average times someone is actually seen and hence excludes DNA
appointments. So the total number of f/up slots needed is adjusted to include DNAs.
Demand Average number of follow-ups This the average number of times the person is actually seen and needs to exclude DNAs.
Capacity Training (average days per person per year) Figure entered in Data Sheet is based on WTE and as such calculation later adjusts for time on leave and sickness absence
Capacity
Supervision (average hours per person, per
week) Figure entered in Data Sheet is based on WTE and as such calculation later adjusts for time on leave and sickness absence
Capacity
Time spent travelling (average hours per
person, per week) Figure entered in Data Sheet is based on WTE and as such calculation later adjusts for time on leave and sickness absence
Capacity
Meetings (eg allocation, team business
meetings etc) Figure entered in Data Sheet is based on WTE and as such calculation later adjusts for time on leave and sickness absence
Capacity Other eg projects (per person per week) Figure entered in Data Sheet is based on WTE and as such calculation later adjusts for time on leave and sickness absence
Queue Queue - full section
Those on queue have same profile of need and service dynamics as those treated - may not be true if specific reasons for being
added to queue exist eg case complexity, diagnosis
Queue Time needed to clear queue Calculated by feeding in same assumptions used for demand, but does not use capacity assumptions
Queue Number of 1st assessment slots needed Those on queue have been deemed appropriate for service, hence no deduction made for inappropriate referrals on queue
Queue Number of 1st assessment slots needed Everyone gets individual new assessment, regardless of whether f/up is group or individual
Queue Follow up DNA rate Rate is applied to total number of slots offered, NOT number of individuals requiring followup
Queue Follow up DNA rate Same average number of individual followups for those receiving just individual work and those receiving both group and individual
Queue
Number of Hours allocated for new
assessments not used as client DNAs each DNA uses all of direct time lost and half of admin time lost eg 1 hr direct and 0.5 admin = 1.25hrs lost
Queue Time needed to clear New Assessments Assumes one staff member per slot ie not multiple staff per assessment
Queue Time needed to clear Individual follow-ups Assumes one staff member per slot ie not multiple staff per follow-up
Queue Time needed to clear groups Gives total staff hours needed as tool captures how many staff members are involved in running the group
Queue Time needed to clear groups This gives an approximation - totals are subject to rounding errors due to percentages used

120
ii) Specific methods & sources – Midlothian PTS Data Item Data Source Notes / Comments Assumptions
1.1 Time Period for Collected Data (weeks)
Oct2011 - Aug2012: Longest time period where data
collection consistent and complete based on run
charts of key metrics
DEMAND
1.2 Referral InformationNumber of referrals received in time period PIMS
Opt-Outs PIMSTotal number of referrals that did not opt in during
the time period
Referred Elsewhere as Inappropriate for Team: PIMS
Includes all referrals coded as: Complete - no
treatment required; Complete - referral rejected;
Continued elsewhere in LPCT; Continued elsewhere
in NHS (non LPCT); Continued elsewhere outside
NHS; Inappropriate referral; Incomplete - patient
moved away; Incomplete - patient self
discharge;Referral not accepted
Individuals still waiting at end of snapshot PIMS
anyone still waiting for assessment and treatment,
or has been assessed and is on a treatment waiting
list as at 31st Aug 2012
1.3 Did Not Attend (DNA)
DNA Rate for 1st Assessment slots PIMScalculated as (no. 1st appt slots missed/no. 1st
appt slots offered)*1001st appointment treated as 1st assessment
DNA Rate for individual followup slots PIMScalculated as (no. followup appt slots missed/no.
followup appt slots offered)*100
followup slots treated as any slot which is not 1st
appointment.
1.4 Group Work
Does your service do group work? PIMSService offers a variety of groups both solely for
referrals and at population level
Percentage of people who only go into individual work
Percentage of people who only go into group work
Total number of people who receive both group and individual work:
Average number of sessions per group intervention:
Average number of people per group session:
Average number of staff per group session:
1.5 Slot length, Clinical Admin & Followup
Average clinical contact time taken per first assessment Clincian estimate
1st appointment time used rather than assessment.
Assessment can span several contacts in some
cases and therefore time varies. Therefore this is
accounted for within followup data
Average clinical admin time taken per first assessment Activity Audit
Average clinical contact time taken per follow-up Clincian estimate
Average clinical admin time taken per follow-up Activity Audit
Average clincal contact time taken per staff member per group session Clincian estimate see above comments pertaining to groups
Average clinical admin time taken per staff member per group session Activity Audit see above comments pertaining to groups
Average number of followup visits per client PIMSCalculated as total number of appointments in
period/ number of 1st appointments in time period
see
http://www.qihub.scot.nhs.uk/media/223293/dcaq%
20-
%20new%20to%20follow%20up%20ratio%20metho
ds%20paper%20v1.doc for assumptions around this
method
CAPACITY
1.6 Staff Allocation - Per Week WTE Hours
All Staff 7.65 37.5 Local Data
1.7 Time Allocation per PersonAnnual Leave (Average days per person, per year) Local Data
Special Leave (average over minimum of 12 weeks) Local Data
Sickness Absence (average over minimum of 12 weeks) Local Data
Time spent travelling (Average hours per person, per week) Activity Audit
Training (average hours per person) Lead Clinicians
Meetings (ie allocation, team business meetings etc) Activity Audit
Supervision (average hours per person per month) Activity Auditaverage hours in supervision (includes giving and
receiving) per week *4.33 to give monthly figure
Other (e.g. projects) Activity Audit
includes activity audit time classified as: admin
tasks, dealing with emails, research, management
and other
Average length of allocation meeting Lead Clinicians
Average number of allocation meetings per week Lead Clinicians
Average number of team in attendance at Allocation Meetings: Lead Clinicians
48
216
263
10
10.4%
Yes
2
Wherever activity audit data used, assumption is it
is indicative of the usual/ typical split of time within
the service.
2
6.5
1
2
41
1.00%
2.30%
4.9
1.25
3
2.8
5
2.2
8.2
1
159
80%
20%
13.0%
Value
1055
Number of individuals receiving both group and
individual therapy adjusted for within entries for
group only and individual only, therefore entry for
"both" set to zero.
1
1
1
For ratio of clinical admin to clinical contact time,
activity audit data was used as follows:
clinical contact time = sum of assessment,
followup, group, case review with pt, direct clinical
other.
Clin admin = sum of clin admin, telephone, clinical
mtg, indirect clin other.
same ratio of clinical admin to clinical contact time
applies regardless of whether slot is 1st appt or
followup appointment
0%
6
Information on groups changes a lot prior to and
during groups taking place. Additionally, fields in
model not easy to populate given variety of
dynamics affecting group work and how information
is stored locally.
Therefore, approximation used based on group
schedule information and lead clinician knowledge.
Group schedules/ clinician estimate

121
iii) Specific methods & sources – East Lothian PTS
Data Item Data Source Notes / Comments Assumptions
1.1 Time Period for Collected Data (weeks)
Nov2011 - Aug2012: Longest time period where data
collection consistent and complete based on run
charts of key metrics
DEMAND
1.2 Referral InformationNumber of referrals received in time period PIMS
Opt-Outs PIMSTotal number of referrals that did not opt in during
the time period
Referred Elsewhere as Inappropriate for Team: Admin records
Individuals still waiting at end of snapshot PIMS
anyone still waiting for assessment and treatment,
or has been assessed and is on a treatment waiting
list as at 31st Aug 2012
1.3 Did Not Attend (DNA)
DNA Rate for 1st Assessment slots PIMScalculated as (no. 1st appt slots missed/no. 1st
appt slots offered)*1001st appointment treated as 1st assessment
DNA Rate for individual followup slots PIMScalculated as (no. followup appt slots missed/no.
followup appt slots offered)*100
followup slots treated as any slot which is not 1st
appointment.
1.4 Group Work
Does your service do group work? PIMSService offers a variety of groups both solely for
referrals and at population level
Percentage of people who only go into individual work
Percentage of people who only go into group work
Total number of people who receive both group and individual work:
Average number of sessions per group intervention:
Average number of people per group session:
Average number of staff per group session:
1.5 Slot length, Clinical Admin & Followup
Average clinical contact time taken per first assessment Clincian estimate
1st appointment time used rather than assessment.
Assessment can span several contacts in some
cases and therefore time varies. Therefore this is
accounted for within followup data
Average clinical admin time taken per first assessment Activity Audit
Average clinical contact time taken per follow-up Clincian estimate
Average clinical admin time taken per follow-up Activity Audit
Average clincal contact time taken per staff member per group session Clincian estimate see above comments pertaining to groups
Average clinical admin time taken per staff member per group session Activity Audit see above comments pertaining to groups
Average number of followup visits per client PIMSCalculated as total number of appointments in
period/ number of 1st appointments in time period
see
http://www.qihub.scot.nhs.uk/media/223293/dcaq%
20-
%20new%20to%20follow%20up%20ratio%20metho
ds%20paper%20v1.doc for assumptions around this
method
CAPACITY
1.6 Staff Allocation - Per Week WTE Hours
All Staff 7.3 37.5 Local Data
1.7 Time Allocation per PersonAnnual Leave (Average days per person, per year) Local Data
Special Leave (average over minimum of 12 weeks) Local Data
Sickness Absence (average over minimum of 12 weeks) Local Data
Time spent travelling (Average hours per person, per week) Activity Audit
Training (average hours per person) Lead Clinicians
Meetings (ie allocation, team business meetings etc) Activity Audit
Supervision (average hours per person per month) Activity Auditaverage hours in supervision (includes giving and
receiving) per week *4.33 to give monthly figure
Other (e.g. projects) Activity Audit
includes activity audit time classified as: admin
tasks, dealing with emails, research, management
and other
Average length of allocation meeting Lead Clinicians
Average number of allocation meetings per week Lead Clinicians
Average number of team in attendance at Allocation Meetings: Lead Clinicians
44
153
329
10
17.7%
Yes
2
Wherever activity audit data used, assumption is it
is indicative of the usual/ typical split of time within
the service.
2
7.5
1.1
2
41
0.00%
4.00%
5.3
1
2
1.1
7.5
1.5
7.7
1
DCAQ Data Summary - East Lothian Psychological Therapies Service
28
80%
20%
15.2%
Value
780
Number of individuals receiving both group and
individual therapy adjusted for within entries for
group only and individual only, therefore entry for
"both" set to zero.
1
1.1
1
For ratio of clinical admin to clinical contact time,
activity audit data was used as follows:
clinical contact time = sum of assessment,
followup, group, case review with pt, direct clinical
other.
Clin admin = sum of clin admin, telephone, clinical
mtg, indirect clin other.
same ratio of clinical admin to clinical contact time
applies regardless of whether slot is 1st appt or
followup appointment
0%
6
Information on groups changes a lot prior to and
during groups taking place. Additionally, fields in
model not easy to populate given variety of
dynamics affecting group work and how information
is stored locally.
Therefore, approximation used based on group
schedule information and lead clinician knowledge.
Group schedules/ clinician estimate

122
Report Authors
Scottish Government (QuEST) NHS Lothian
Paul Arbuckle (National Improvement Advisor) Gail Denholm
(Community Mental Health Nurse Team Manager)
Ruth Glassborow (National Lead, Mental Health) Mr Norman A Frazer (Consultant Clinical Psychologist)
Dr Patricia Graham (Consultant Clinical Psychologist
Head of Adult Mental Health Psychology NHS Lothian)
Linda Irvine (Strategic Programme Manager, Mental Health and
Wellbeing)
Maureen McKenna (Community Mental Health Nurse Team Manager CMHT
& Psychological Therapies)
Dr Duncan Pentland
(Transformation Station Project Manager, School of Health Sciences, Queen Margaret University)
Graeme Stoddart (PIMS Manager)

123
© Crown copyright 2013