supplementary information - harvard university
TRANSCRIPT

SUPPLEMENTARY INFORMATION
1www.nature.com/nature
doi: 10.1038/nature08795
1
Supplementary Discussion
Population naming
In some contexts, the indigenous hunter-gatherer and pastoralist peoples of southern Africa are
referred to collectively as the Khoisan (Khoi-San) or more recently Khoesan (Khoe-San) people.
This grouping is based on the unique linguistic use of click-consonants1. Many names, often
country-specific, have been used by Bantu pastoralists and European settlers to describe the
hunter-gatherers, including San, Saan, Sonqua, Soaqua, Souqua, Sanqua, Kwankhala, Basarwa,
Batwa, Abathwa, Baroa, Bushmen, Bossiesmans, Bosjemans, or Bosquimanos. In addition,
group-specific names such as !Kung and Khwe are often used for the broader population. The
two most commonly used names, “San” and “Bushmen”, have both been associated with much
controversy due to derogatory connotations2. “San” has become the more popular term used in
Western literature, although “Bushmen” is arguably the more commonly recognized term within
the communities. Since they have no collective name for themselves, the term Bushmen was
selected for use in this paper as the term most familiar to the participants themselves.
Regarding identification of individuals
The five men identified in this study have all elected to have their identity made public
knowledge. Thus we present two complete personal genomes (KB1 and ABT), a low-coverage
personal genome (NB1), and personal exomes for all five men. On a scientific level,
identification allows for current and future correlation of genetic data with demographic and
medical histories. On a social level, identification allows for maximizing community benefit. For
!Gubi, G/aq’o, D#kgao and !Aî, their name represents not only themselves, but importantly their
extended family unit and a way of life severely under threat. For Archbishop Desmond Tutu, his
international status will have an immediate impact on providing a voice for southern Africa in
pharmaceutical developments based on genomic data.
Ethics approval
Ethics approval to conduct whole-genome sequencing and/or extended genetic diversity studies
was obtained from the Institutional Review Board (IRB) or Human Research Ethics Committee
(HREC) from three institutions, namely the Pennsylvania State University (IRB #28460 and IRB
#28890), the University of New South Wales, Australia (HREC #08089 and HREC #08244), and
the University of Limpopo, South Africa (Limpopo Provincial Government #011/2008). All
authors directly involved with the study participants and/or data generated are named on one or
more approvals. A study permit was obtained from the Ministry of Health and Social Services
(MoHSS), Namibia. In addition to the named institutions, an external advisory panel of South
African academic and medical professionals was established on the recommendation of
Archbishop Tutu. Informed consent was obtained either via written or video-recorded (in cases
of illiteracy) documentation. For the Bushmen, consent was performed in three languages and in
the presence of a caretaker and translator. All participants undergoing genome sequencing
elected to be named in the study. Study participants underwent extensive face-to-face interviews
and have been fully advised about the outcomes of the research. During the site visits, there was
no change in the desire to participate in this study. All participants provided venous whole blood,
and DNA was extracted using standard extraction procedures (Qiagen Inc., Hilden, Germany).

2www.nature.com/nature
doi: 10.1038/nature08795 SUPPLEMENTARY INFORMATION
2
Participant selection
The southern African Bushmen have been proposed to show increased within-group Y-
chromosome diversity and limited overall mtDNA diversity3. Therefore, we examined males
exclusively, to increase the amount of detectable variation. Each of the four participating
indigenous hunter-gatherer individuals is the eldest member of his community. Additional
criteria for inclusion in the study were based on linguistic group, geographical location, and the
presence of previously described population-specific non-recombining Y-chromosome (NRY)
markers4 (Figure 1, Supplementary Table 1).
A total of 20 Bushmen were genotyped via amplicon-specific Sanger sequencing for 13
Y chromosome markers5 (M2, M9, M14, M35, M51, M90, M98, M112, M115, M150, M154,
M175, and M211). The group consisted of 19 Juu-speakers (13 Ju/’hoansi, four Etosha !Kung,
two Vasekela !Kung), and a single Tuu-speaker. “Vasekala” is a local term for a group relocated
from Angola to the northern Kalahari region of Namibia after serving in the South African
Defense Force during the Namibian-Angolan war. Several candidates were excluded because of
their non-African (K-R) and Asian/Indonesian haplogroups (O); two were excluded because of a
Bantu-dominant E1b1a (previously known as E3a) haplotype.
The indigenous Kalahari Juu- and Tuu-speaking hunter-gatherers included in this study
live in scattered family groups in the vast semi-desert regions of Namibia, an 823,145-km2
country on the southwest coast of Africa with approximately 2 million inhabitants. Namibia is
home to around 38,000 Bushmen6. KB1, !Gubi, is the only member of the study belonging to the
poorly defined Tuu-speaking group of the southern Kalahari. NB1, G/aq’o, and TK1, D#kgao,
are both Ju/’hoansi of the northern Kalahari region, separated by approximately 120 km. MD8,
!Aî, belongs to the !Kung-speaking group relocated some 50 years ago from the Etosha plains
region in the northwestern Kalahari. The Ju/’hoansi and !Kung are grouped linguistically as Juu-
speakers. The four Bushmen participants represent Y haplogroups A2 (TK1), A3b1 (NB1), B2b
(KB1), and E1b1b1 (MD8).
Archbishop Desmond Tutu (ABT) is directly descended from the two major linguistic
groups in southern Africa, namely the Nguni-speakers (approximately 60% of the people of
South Africa) via his paternal Xhosa ancestry and from the Sotho-Tswana-speakers
(approximately 33% of the people of South Africa) via his maternal Motswana ancestry. These
two linguistic groups therefore represent over 90% of the South African Bantu population, who
have lived along-side the indigenous hunter-gatherer and herder peoples (Khoesan) for over
2,000 years. Archbishop Tutu is thus an ideal representative of the southern African Bantu
peoples. Using genome-wide genotypes and whole-genome sequence data, ABT was classified
in the E1b1a8a Y-haplogroup.
Genome-wide heterozygosity and potential admixture
Evaluation of population admixture within our study’s four Bushmen required a genotypic
analysis of a southern African Bantu population. For this study, we elected to use data previously
generated for the Xhosa (XHO), the paternal lineage of Archbishop Tutu. Linguistically, the
Xhosa have adopted “click” consonants within their language, suggesting an extensive period of
cohabitation with the indigenous hunter-gatherers.
Since one indicator of admixture is an elevated rate of heterozygosity, we used genome-
wide genotyping data (from Illumina 1M Human Duo arrays) to determine the overall percentage

3www.nature.com/nature
SUPPLEMENTARY INFORMATIONdoi: 10.1038/nature08795
3
of heterozygosity in our five participants, plus a South African European (SAE) and an admixed
South African Coloured (SAC) (Supplementary Figure 3A). The SAC community arose as a
consequence of slavery and a subsequent genetic mixing of East African, East Indian, and
Indonesian elements, starting with European settlement at the Cape in 1652. In a previous study
we identified a European (predominantly via paternal lines) and southern African Bantu or East
Asian (via maternal lines) admixture in this community, with negligible Bushmen contribution7.
Increased overall percentage heterozygosity in MD8 compared to KB1, NB1, and TK1
may indicate a degree of admixture. However, we were surprised that the heterozygosity
determined by this method was on average low in the Bushmen, particularly since our sequence
data indicate otherwise. The observed low heterozygosity suggests one (or more likely a
combination of) the following scenarios: (1) population isolation, (2) reduced admixture events,
and (3) reduced informativeness of this particular SNP array for Bushmen. The observed low
percentage heterozygosity in ABT compared to SAE and SAC populations also may be an
artifact of using a European-biased array.
Autosome-specific analysis of heterozygosity (Supplementary Figure 3B) demonstrated
sample-specific hotspots, for example the increased percentage heterozygosity observed in
chromosome 5 for KB1 and the reduced heterozygosity observed in chromosome 18 for TK1,
compared to the other Bushmen.
Impact of traditional life-style on gender-biased gene flow
The reported limited male-mediated gene flow8 in southern African Bantu populations
9 has
resulted in a predominance of the E1b1a (M2) Y-chromosome haplogroup across the region.
Lack of Y-chromosome divergence has been attributed to cultural practices of patrilocality
(location of family with that of the male) and polygyny (multiple wives), resulting in a lower
male migration rate and lower male effective size, respectively10
. In contrast to their Bantu
neighbors, the indigenous hunter-gatherers practice a culture of matrilocality and monogyny;
thus we can assume a male-biased migration rate resulting in greater Y-chromosome over
mtDNA diversity.
Traditionally, due to a nomadic lifestyle, the hunter-gatherer people do not own
possessions. This lack of ownership results in Bushmen men being ineligible to marry a Bantu
woman, because they cannot pay the father-in-law a “lobola” (also known as lobolo or mahadi),
a payment usually made in cattle for her hand in marriage. Male-contributed Bushmen-Bantu
admixture is therefore assumed to be minimal to absent. Bantu men marrying hunter-gatherer
women is however reported to have been quite common. A feeling of inferiority associated with
the “Bushmen” or “San” ethnic classification meant that many Bushmen women tried to uplift
their status via marriage to Bantu men. We therefore speculate the strong possibility of Bushmen
contributions to the mitochondrial genome and X-chromosome in southern African Bantu
populations.
Insertions, deletions, microsatellites, and Alu elements
We identified 463,788 putative short indels (i.e., insertions/deletions; the longest was 38 bp) in
the KB1 genome, of which 172,589 (37.2%) are homozygous. A special class consists of small
indels created by expansion or contraction of a microsatellite, here taken to mean a tandem
duplication of a core sequence of between 2 and 6 nucleotides. We identified 102,476 high-
confidence microsatellites, each having no differences among its tandem copies and separated by
sharp boundaries from the flanking non-repetitive DNA. For 16.0% of these, the number of

4www.nature.com/nature
doi: 10.1038/nature08795 SUPPLEMENTARY INFORMATION
4
copies of the core sequence appeared to differ from the orthologous repeats in the hg19 (a human
reference genome that superseded the one used for most of our analyses), Venter, and/or Watson
genomes. We also inspected KB1’s exome to determine his genotype at unstable microsatellites
in which mutations (usually expansions) have been documented or suggested to lead to disease11
.
At several such loci (Supplementary Table 15), alleles in KB1 possessed a number of repeats that
was close to the minimum value in the normal range, suggesting that longer, disease-causing
alleles were likely acquired by the non-Bushmen lineage later in its evolution.
The length distribution of longer indels (say, at least 50 bp relative to the human
reference) in KB1 shows the expected enrichment at a length of around 300 bp caused by Alu
interspersed-repeat elements, which are known to be polymorphic in the human population. We
identified 503 Alu insertions in the human reference relative to the KB1 genome, with 44.1%
belonging to the AluYa5 subfamily. Of these 503, we found 24 common to Watson, Venter, and
the human reference, but absent in chimp, KB1 and NB1. Those Alu elements may have been
inserted into the ancestor of non-Bushmen genomes after their divergence from the Bushmen
lineage.
A portion (9.7%) of our Roche/454, non-paired reads do not map to the human reference
genome at the thresholds we used (97% identity over at least 90% of the read). It has been
reported12,13
that the Roche instrument is capable of sequencing regions that are recalcitrant to
the BAC-based approach used to sequence the reference. Indeed, a number of the unmapped
reads align to regions of the chimpanzee genome that appear to be orthologous to human regions
corresponding to gaps in the current human reference assembly. For instance a 200-kb gap in
NCBI Build 36 at chromosome 6q16.1 corresponds to a chimpanzee interval where our
unmapped reads produce 7.1X average read depth and assemble into 129 contigs of total length
253,769 bp. In other cases, we find assemblies of KB1 reads that contain exons apparently
deleted from the reference assembly, e.g., parts of the GenBank mRNA sequences AK096045
and AK128592.
Genotype and phenotype correlations: lactase persistence
Lactase persistence (the ability to digest milk as adults) is an autosomal-dominant trait that is
common in European-derived populations. This evolutionary adaptation has been associated with
a SNP in intron 13 of the MCM6 gene on chromosome 2, upstream of the gene encoding for
lactase (LCT). This regulatory SNP, known as -13910 C>T (rs4988235), has been shown to
increase LCT transcription in vitro by generating an Oct-1 transcription-factor binding site
(reviewed in ref. 14). However, in contrast to Europe, the frequency of this allele in sub-Saharan
Africa is rare, and it has not been found in the remains of Neolithic Europeans. These studies
suggest that lactase persistence is an evolutionary innovation that has undergone strong
population-specific positive selection following human conversion (via either a population
replacement or cultural exchange) from forager to farmer. As expected for a foraging society, we
found the Bushmen in our study all to be homozygous for the C-allele, suggesting an inability to
tolerate milk consumption as adults.
Human pigmentation
A functional SNP that has undergone genetic selection in Europeans resulting in near fixation is
the non-synonymous rs1426654 G>A (Ala111Thr) variant in the human pigmentation gene
SLC24A5. The A-allele has undergone positive selection in the last 100,000 years, contributing
to the pale skin color of Europeans. The color of the human skin is largely determined by the

5www.nature.com/nature
SUPPLEMENTARY INFORMATIONdoi: 10.1038/nature08795
5
amount and type of melanin pigment produced in the cutaneous melanocytes, which in turn
impacts susceptibility to skin cancer, a condition mostly affecting people of pale complexion.
The SLC24A5 genotype observed in the sequence data was validated using TaqMan allelic
discrimination for our sequenced men and additional individuals, demonstrating a predominance
of the melanin-producing G-allele in the lighter-skinned Bushmen (allele frequency 0.98, n=45),
and darker-skinned southern African Bantus from the same region (allele frequency 0.90, n=31),
while being uncommon in pale-skinned southern African Europeans (allele frequency 0.07,
n=14). Retaining this allele would provide a selective advantage for survival in the harsh climate
of the Kalahari Desert.
Human pigmentation, however, is a polygenic quantitative trait with high variability
influenced by a number of candidate genes. A recent genome-wide association study (GWAS) of
natural hair color (a marker for pigmentation) identified two key polymorphisms, one located in
another potassium-dependent sodium/calcium exchanger gene SLC2A4A (rs12896399 G>T)15
.
Significantly associated with light hair color, we found this allele to be absent in our sequenced
men. These observations highlight the need for synergy between environment and phenotypic
attributes, allowing for reproductive advantage and survival.
Duffy null allele
The Duffy antigen/receptor for chemokines (DARC) gene on chromosome 1 harbors a functional
polymorphism in the promoter region (T-46C; rs2814778) responsible for the observed
decreased white blood cell count in African-Americans compared with European-Americans16,17
.
The consequence is critical for medical conditions where decreased white cell levels are
associated with diseases involving inflammation and infection. This so-called Duffy Null
polymorphism (also known as FY+/-) has been associated with an evolutionary advantage in
African populations due to protection against Plasmodium vivax malaria infection18
. More
recently, an association with susceptibility to HIV-1 infection has been reported19
. This
functional variant therefore has critical health implications relevant to southern African
populations. The C-allele in Africans and T-allele in Europeans have reached almost complete
population fixation. It has been suggested that the C-allele may have arisen in Africa as a result
of selective pressure from a more lethal ancestral form of Plasmodium vivax
20. The Asian origin
hypothesis of Plasmodium vivax may suggest that fixation in Africa took place after the
introduction of agriculture21
. The lack of the C-allele in our forager participants (unlike the
Bantu farmers) supports this latter hypothesis. We can further speculate that lack of agricultural
adaptation in this community may be responsible for the absence of this allele and question what
impact forced adaptation from forager to farmer will have on this already dwindling population.
CYP2G
KB1 and NB1 are homozygous for a SNP that retains the function of the CYP2G gene
(Supplementary Table 6). While this gene encodes a cytochrome P450 monooxygenase involved
in steroid metabolism in the olfactory mucosa of mice, it is not active in most humans because of
a nucleotide substitution leading to premature termination of translation22
. The Bushmen
genomes encode an amino acid at this position rather than a stop codon, and thus are likely to
produce an active enzyme (Supplementary Figure 8A). Indeed, their sequence is the same as the
ancestral sequence at this position. This suggests that Bushmen retain the active gene, perhaps in
response to selective pressure, but in other populations it has decreased in frequency (20% of
Bantu22
) or been lost (almost all non-African humans have inactive genes), presumably from

6www.nature.com/nature
doi: 10.1038/nature08795 SUPPLEMENTARY INFORMATION
6
relaxation of selection.
Further analysis of this variant by Sanger sequencing confirmed genotype calls for KB1
and NB1, and identified homozygosity for this allele in 27% of our extended Bushmen group
(8/30) and 7% of Bantus from the same region (2/29). All remaining samples, including 11
Europeans, were heterozygous for the active ancestral and inactive modern alleles. Distribution
of alleles occurred in a 2:1 ratio in all cases (Supplementary Figure 8B). A likely explanation is
that CYP2G is an unprocessed pseudogene formed by segmental duplication, which resulted in
one copy becoming silenced by a degenerative mutation (the T-allele). The T-allele was the
most common allele in all samples of European origin. Sequencing was confirmed in both
directions.
CYP2E1
CYP2E1 is the major ethanol-inducible cytochrome P450 enzyme that metabolizes and activates
many toxicologically important compounds, including ethanol, to more reactive toxic products.
In fact, induction of CYP2E1 is one of the central pathways by which ethanol generates oxidative
stress via the generation of reactive oxygen species (ROS) such as superoxide anion radicals and
hydrogen peroxide, and in particular of powerful oxidants like 1-hydroxyethyl radicals in the
presence of iron catalysts. Ethanol-induced oxidative stress plays a major role in the mechanisms
by which ethanol produces liver injury. We have detected and validated a 140-kb duplication
encompassing the CYP2E1 gene in KB1 (Supplementary Figure 6A) and previously described23
.
Variants in genes for lipid metabolism
We were intrigued by the apparent over-abundance of differences from the human reference
genome in genes related to lipid metabolism (Supplementary Table 6). The diet of the non-
pastoralist Bushmen is low in fats, and thus they may possess genetic variants associated with
aspects of lipid metabolism not observed in other, pastoralist populations. We found that KB1,
NB1, and ABT are heterozygous for a variant in the LIPA gene, which encodes lysosomal acid
lipase, an enzyme that catalyzes hydrolysis of cholesterol esters and triglycerides. Mutations in
LIPA that drastically reduce enzymatic activity lead to accumulation of cholesterol esters and
triglycerides in the visceral organs, manifesting as a range of disorders including Wolman
disease, a severe condition with onset in infants, and the milder cholesterol ester storage
disease24
. The G to A transition (C to T in chromosomal order; Supplementary Table 6) in the
first position of codon 23 of LIPA causes a replacement of glycine by arginine in the signal
peptide (Supplementary Figure 7). This transition was previously observed in a homozygous
compound mutation in a Wolman disease proband25
. While one of the sequence changes
abolished enzymatic activity, the glycine to arginine replacement in the signal peptide had no
effect on lipase activity. Instead, it substantially reduced the amount of enzyme secreted from
cells. The fact that this allele is present in a heterozygous state in KB1, NB1, and ABT suggests
that it is common in this population; previous studies estimated its frequency in healthy control
individuals at only 0.0526
. Thus while one may expect the arginine form of the enzyme to have
reduced secretion, it may not be a problem and in fact could even provide some advantage, as
many other mammals have an A at this position (Supplementary Figure 7).
A further complication to the interpretation of this variant is that an A to C polymorphism
is found in codon 16, still in the signal peptide (Supplementary Figure 7). This second SNP,
which is found in TK1 (homozygous), NB1, and ABT, changes the threonine encoded in the
reference sequence (ACC) to a proline (CCC). If the threonine to proline SNP is also present in

7www.nature.com/nature
SUPPLEMENTARY INFORMATIONdoi: 10.1038/nature08795
7
the allele with the glycine to arginine SNP, then the second amino acid change could affect the
secretion properties of the enzyme.
We tested the hypothesis that the sequenced Bushmen genomes have a higher SNP rate
that other ethnic groups in genes related to lipid metabolism. We focused on the following genes:
AACS, ABCA1, ABCD1, ABHD5, ACADL, ACADM, ACADS, ACADVL, ACAT1, ACSL1,
ALDH3A2, ANGPTL4, APOA2, ARSA, ASAH1, ASIP, CLN3, CLPS, CPT1A, CPT1B, CPT1C,
CPT2, CYP27A1, DECR1, DHCR7, EHHADH, ETFDH, FADS2, GALC, GBA, GLA, GLB1,
GM2A, HADH, HADHA, HADHB, HEXA, HEXB, HMGCL, HMGCS1, LIPA, LIPE, LIPF,
LPIN2, LPL, MLYCD, MTTP, NPC1, NPC2, PLA2G1B, PLTP, PNLIP, PNPLA2, PSAP, SAR1B,
SCP2, SLC22A5, SLC25A20 and SMPD1. Pooling the Bushmen’s amino-acid SNPs, we found
that 90 of their 23,430 SNPs were in these lipid-related genes. For a pooled sample of six non-
Bushmen, 126 of 36,296 SNPs were in these genes. The ratio for Bushmen (0.384%) was
slightly higher than for non-Bushmen (0.347%), but the following reasoning shows that the
difference is not significant.
We have n=23,430 approximately independent trials with x=90 successes from a
population with success probability p, and m=36,296 aproximately independent trials with y=126
successes from a population with success probability q. We want to test the null hypothesis p=q
against the alternative p>q. Because of the very large number of trials, under the null hyothesis,
the test statistic:
€
Z =
x
n−y
m
x+ y
n +m
1−
x+ y
n +m
1
n+1
m
has approximately an N(0,1) normal distribution. The observed value of the statistic is:
€
Z =0.00384 − 0.00347
216
59726
1−
216
59726
1
23430+
1
36296
=
0.00384 − 0.00347
0.00362× 0.99638× 0.00007=0.00037
0.00005= 0.7363
The (right-tail) p-value associated with this under an N(0,1) distribution is very high, namely
0.23077. Thus, we cannot reject the null hypotheses that the two populations have the same
success probability.
Bitter taste alleles
The ability or inability to sense a bitter taste from the compound phenylthiocarbamide (PTC) has
been hypothesized to directly impact human survival and maintenance of human health. The
necessity for foraging societies to accurately discriminate toxic plants, would suggest an ideal
situation for strong trait selection. The taste receptor gene TAS2R38 has therefore been an
important marker used to determine the evolution not only of modern humans, but also
Neanderthal society27,28
. Two major TAS2R38 haplotypes have been described and occur as a

8www.nature.com/nature
doi: 10.1038/nature08795 SUPPLEMENTARY INFORMATION
8
result of three non-synonymous SNPs, namely Ala49Pro (rs713598 G>C), Ala262Val
(rs1726866 C>T) and Isl296Val (rs10246939 A>G). PAV (Proline-Alanine-Valine) defines the
dominant bitter taste sense haplotype, while AVI (Alanine-Valine-Isoleucine) defines the
recessive non-taster haplotype. The predominance of the PAV haplotype in the Bushmen
compared to the non-taster AVI haplotype in ABT is suggestive that these alleles may have
undergone selective advantage in Bushmen. Further analysis of 12 Bushmen made possible by
inclusion of the Ala262Val and Isl296Val variants on the Illumina 1M SNP array identified all of
them as PAV for the bitter taste sense contributing alleles. The apparent fixation of these alleles
is suggestive of strong selection for acute taste discrimination in a hunter-gatherer, perhaps to
avoid toxic plants, but that selection has been relaxed in other populations.
Genes related to hearing
Reportedly, Bushmen have better hearing than Europeans, especially at higher frequencies and
also as they age29,30
. We found Bushmen-specific amino-acid SNPs in two genes in which other
SNPs are associated with deafness, CDH23 and USH2A (Supplementary Table 6). Given that
altered function of these genes can lead to deafness31,32
, one can speculate that other SNPs in
these genes might lead to enhanced hearing. In support of this, we note that the valine in CDH23
(heterozygous in KB1, rare in non-Bushmen) is the ancestral amino acid, based on comparisons
with other primates. Our extensive computational analysis of these SNPs in CDH23 and USH2A
can be found at:
http://genomewiki.ucsc.edu/index.php/CDH23_SNPs and
http://genomewiki.ucsc.edu/index.php/USH2A_SNPs.
Experimental testing of this hypothesis may be appropriate. In any case, this illustrates in detail
how computational analysis of our data can suggest potential genetic underpinnings for novel
Bushmen-specific phenotypes.

9www.nature.com/nature
SUPPLEMENTARY INFORMATIONdoi: 10.1038/nature08795
9
Supplementary Tables
Supplementary Table 1. Y-chromosome haplogroup distribution for 20 Bushmen hunters1
and three European control men from Namibia. Haplogrouping was based on 13 Y-
chromosome markers. “ybp” = years before present.
Population
Y-chromosome
Haplogrouping3
A: restricted
to Africa
(60,000 ybp)
B: restricted to Africa
(50,000 ybp)
E: predominant in Africa and African-
Americans (emerged via back migration
into Africa, 50,000 ybp)
Asi
an/
Ind
on
esia
n
No
n-A
fric
an
Haplogroup2 A2 A3b1 B2a B2b B2b2 B2b4b E2b E1b1a E1b1a4 E1b1b1 O K-R
1st Marker M14 M51 M150 M112 M115 M211 M90 M2 M154 M35 M175 M9
2nd Marker - - - - - - M98 - - - - -
European 3 0 0 0 0 0 0 0 0 0 0 0 3
Ju/’hoansi 13 6
4 0 0 0 0 0 1 0 2 0 0
!Kung (Etosha) 4 0 0 0 0 0 0 0 0 0 4 0 0
!Kung (Vasekela) 2 1 0 0 0 0 0 0 1 0 0 0 0
Tuu-speaker 1 0 0 0 1 0 0 0 0 0 0 0 0
1 A single individual was selected from each indigenous Namibian hunter-gatherer-identified Y-haplogroup (bold) to
undergo extensive sequencing. 2 Population grouping showing predominant representation by the selected
haplogroups33
with classification as per the Y-chromosome consortium (http://ycc.biosci.arizona.edu/) 2008
nomenclature update4.
3 Haplogroup continent restriction and estimated emergence times. Haplogroup A sub-groups
A2 and A3b1 are seen in Southern Africa, with A3b1 seen exclusively among the Khoisan. Haplogroup B sub-group
B2a is seen among Cameroonians, East Africans, and among South African Bantu speakers, while B2b is seen
among Central African Pygmies and South African Khoisan. Haplogroup E is similar to D and absent from Africa.
E1b1a is an African lineage believed to have expanded from northern African to sub-Saharan and equatorial Africa
with the Bantu agricultural expansion. E1b1a is also the most common lineage among African-Americans. Eb1b1
clusters are seen today in Western Europe, Southeast Europe, the Near East, Northeast Africa and Northwest Africa.
Haplogroup population definitions are as defined by the International Society of Genetic Genealogy Y-DNA
Haplogroup Tree 2009 (http://www.isogg.org/tree/index09.html)34
.

10www.nature.com/nature
doi: 10.1038/nature08795 SUPPLEMENTARY INFORMATION
10
Supplementary Table 2. Basic sequencing statistics for the four Bushmen and the Bantu
individual (ABT).
Dataset Reads Bases Mapped bases CCDS bases
Whole genome, KB1 102,183,3331 35,449,827,671 28,752,706,821 387,254,418
Whole genome, NB1 18,358,065 6,346,320,615 5,628,293,380 67,499,362
Exome, KB1 4,404,906 1,673,892,693 1,553,034,524 394,557,680
Exome, TK1 4,617,978 1,782,031,524 1,662,823,253 427,869,030
Exome, MD8 4,160,900 1,528,147,776 1,434,923,452 364,612,818
Exome, NB1 4,174,479 1,575,488,489 1,472,771,775 370,750,962
Exome, ABT 5,091,760 1,904,113,845 1,777,384,376 479,353,490
Illumina, KB1 539,541,278 81,072,943,456 74,755,457,2722 761,387,859
SOLiD, ABT 3,402,047,834 198,473,661,900 78,696,971,148 471,682,954
Illumina, ABT 160,174,952 24,346,592,704 22,940,710,656 218,499,375
Paired-end reads Reads Clone coverage Mapped reads
KB1 18,851,688 37,834,318,516 3,859,796
1Whole-genome reads for KB1 consist of fragment reads (83,331,226 / 29,165,432,509 / 26,100,525,922 /
283,829,027 reads / bases / mapped bases / CCDS35
bases), both halves of paired-end reads that are successfully
mapped as pairs (12,230,249 / 4,526,728,484 / 1,293,023,468 / 11,098,860), and “rejected” paired-end reads (those
that cannot be used as pairs because the linker is either non-existent or is too close to one end to leave a useful half)
(6,621,858 / 1,757,666,678 / 1,359,157,431 / 923,26,531). 2The numbers for Illumina include reads that map non-uniquely but which are assigned a genomic location at
random.
Supplementary Table 3. Statistics from whole exome sequencing.
Sample
Reads1
Bases/read2
Reads mapped
to genome3
Reads mapped
to exome4
Bases mapped
to exome
Coverage5
KB1 4,404,906 380 4,016,126 2,898,126 394,003,271 15.8X
NB1 4,174,479 377 3,833,171 2,706,077 370,095,481 14.9X
TK1 4,617,978 386 4,239,016 3,057,422 427,178,039 17.2X
MD8 4,160,900 367 3,849,275 2,697,468 364,088,625 14.6X
ABT 5,091,760 374 4,697,586 3,480,207 478,844,708 19.3X
1 Number of sequencing reads per sample/array.
2 Average or mean sequencing read length.
3 Number of reads mapped to the human genome.
4 Number of reads mapped to the targeted exome (need to use 175,829 as the denominator when calculating this
number). 5 Average coverage per exome.
Supplementary Table 4. Number of SNPs identified for pairs of mitochondrial sequences.
“CRS” = Cambridge Reference Sequence.
CRS ABT KB1 NB1 NB8
CRS - 100 89 96 95
ABT 100 - 51 84 55
KB1 89 51 - 77 38
NB1 96 84 77 - 75
NB8 95 55 38 75 -

11www.nature.com/nature
SUPPLEMENTARY INFORMATIONdoi: 10.1038/nature08795
11
Supplementary Table 5. Human divergence dating using analysis of whole genome
mitochondria data
tMRCA
Group
M. Ingman et
al 2000 Nature (Mitochondria) 14
I. McDougall
et al 2005 Nature
(Geological) 36
J. P. Noonan
et al 2006 Science
(Genomic) 37
M. K. Gonder et
al 2007 Mol.
Biol. Evol.
(Mitochondria) 38
R. E. Green et al 2008
Cell (Mitochondria)39
A. W. Briggs et
al 2009 Science (Mitochondria) 40
Our dataset
under Relaxed Clock
30 x 10M MCMC chain
Our Dataset
under Fixed Clock
27M MCMC chain
H. sapiens
sapiens and Neanderthal
NA NA 706.0 (468.0
– 1015.0) NA 660.0 (520.0 – 800.0) NA
Calibrating
Point 660.0 (520.0 –
800.0)
Calibrating
Point 660.0 (520.0 –
800.0)
H. sapiens sapiens
171.5 (121.5 – 221.5)
> 195.0 (190.0 – 200.0)
NA 194.3 (161.8 – 226.8)
NA 136.1 (94.93 – 178.7)
204.9 (116.8 – 295.7)
237.2 ()
Neanderthal NA NA NA NA NA 109.8 (84.63 –
138.5)
130.3 (89.7 –
174.3) 141.2 ()
L0 NA NA NA 146.4 (121.3 –
171.5) NA NA
158.7 (88.6 –
231.5) 187.9 ()
L0d NA NA NA 106.0 (85.8 –
126.2) NA NA
107.2 (56.8 –
159.9) 129.8 ()
Tanzanian L0d
NA NA NA 30.6 (12.8 – 48.4)
NA NA 32.0 (14.6 – 51.6)
36,5 ()
San L0d NA NA NA 90.4 (71.5 – 109.3)
NA NA 92.8 (47.6 – 139.1)
113.0 ()
L0k, L0f,
L0a NA NA NA
139.8 (115.2 –
164.4) NA NA 148.2 (NA) 176.9 ()
L0k 70.9 (51.2 –
90.6)
78.6 (37.2 –
122.0) 94.5 ()
L0f, L0a 100.1 (87.6 –
112.6)
118.8 (63.1 –
175.9) 144.0 ()
L0f 94.9 (85.5 –
104.3)
93.8 (46.9 –
139.7) 117.2 ()
L0a 54.6 (48.9 – 60.3)
61.1 (29.2 – 95.1)
71.4 ()
L1, L2, L3, M, N
NA NA NA 142.3 (104.1 – 180.5)
NA NA 172.7 (95.2 – 249.7)
200.9 ()
L3, M, N 94.3 (84.4 – 104.2)
93.3 (50.7 – 136.5)
96.0 ()
Note
Range in
parentheses is the 95% HPD
interval
Comments:
GTR + I +
Gamma4, Relaxed
Clock, Coalescence
Expansion
Growth, One tMRCA
calibration, Six carbon
dating data, MCMC chain
length 300M, 10% BEAST
burn-in. 300030 trees,
TreeAnnotator burn-in 10000
trees.
Tracer indicates all ESS > 600
GTR + I +
Gamma4, Strict Clock,
Coalescence Expansion
Growth, One
tMRCA calibration,
Six carbon dating data,
MCMC chain length 27M,
10% BEAST burn-in.
27000 trees, TreeAnnotator
burn-in 1000 trees.
Tracer
indicates all ESS > 470
*Time Unit in thousands of years.

12www.nature.com/nature
doi: 10.1038/nature08795 SUPPLEMENTARY INFORMATION
12
!"##$%&%'()*+,-).$%,/0,1"23&)',4%'5(+#%2,)22567)(%8,97(3,#3%'5(+#%20,!"#$%&'()'*+#'+,-./'0#$#0#/1#'.))#-234%'
! ! "#$
#!
%&
'(!
!!'
)*+
,!-
.!
/"
01
!23!
,4
5%
6!
(1!
7#89!
:'
;!!
%'
;!
!
01
<!
!
=:
;!
!
>'
=!
!
?$
2@
$A!
>BB
2C*
DE*
2$
!6
)4
0#,
!*,
!
!"#$%&
CF3;
;!
..
GH<
IG.
J;
!3B
;<
;K
J-
LM=
N&
!=
!&
!&
!A!
A!&
!?$
2@
$!
O&P&
Q!R
2BB
*4+S
!*$
C3#DB#
,!B
R3*
$EN
R2@
#3!
R#38
23T
D$
C#P!#$
C2,
#B!
>3U
GO&
P=Q!
T*V
!28!
BR3*
$E*
$U!W
!#$
,)
3D$
C#!T
)BC
+#BG
O=P=
Q!R
2BB
*4+S
!
*$C3
#DB#
,!#
$,
)3D
$C#
P!=
!TD?#B!
D!E
3D$
B+DE*
2$
!
E#3T
*$DE2
3!
;X
<J
L-
.K
!
"'()%!
CF3;
H!
J-
G;I
XGK
J;!
$2$
#!
=!
=N"!
=!
=!
=!
=N"
!$
2Y#+!
Z$
C2,
#B!
D!C
D,
F#3*
$[+
*?#!R
32E#
*$!*$
!
$#)
32B#
$B2
3S!#
R*E
F#+*
)T
9!\D3*
D$
EB!*$
!"'()%!
D3#
!DBB
2C*
DE#
,!@
*EF
!]BF
#3!
BS$
,32
T#!;
1!D
$,
!
,#D8$
#BB
9!^#)
M^#)
N\
D+P!\
D+!*$
!D$
C#BE
3D+!
;;
HL
H-
I;
!
"*"$+,&
CF3;
!;
.GX
K;
G-;
X!
&0
HI
HX
;.
!=
!>
N=
!>
!A!
>!
>!
?$
2@
$!
($C3
#DB#
,!C
F+2
3*,
#!C
FD$
$#+!DCE
*Y*E
SG!
DBB
2C*
DE*
2$
!@*E
F!=
!O=
F3I
<;
5#3Q
!
;I
.J
KH
KH
!
"-.)/
!CF
3;L
!I
.GX
.H
G;;
I!
3B;
HK
;-
.H
J!
=#3T
!"
!"
!=
#3T
!=
#3T
!=
#3T
!?$
2@
$!
&SE2
CF32
T#!6
IK
HG!8
DT
*+S!X
G!B)
48D
T*+
S!U
9!"#$
#!
+2BB
!*$
!T2BE
!F)
TD$
BG!4
)E!
*B!D
$!D
CE*Y
#!U
#$
#!*$
!
')
BFT
#$
9!#VR
3#BB
#,
!_#VC+
)B*
Y#+S
_!*$
!EF
#!
2+8
DCE
23S
!T)
C2BD
!28!T
*C#P!*$
Y2+Y
#,
!*$
!BE#
32*,
!
T#ED
42+*
BT9!
;<
H<
K<
;<
!
'!0"&
CF3;
!;
KJ
GII
;G-
HJ
!3B
X<
;I
JJ
<!
=!
=!
=!
=!
=N&
!&
!?$
2@
$!
0D+D
3*D!3
#B*
BED$
E!&
[D++
#+#
!;
L;
<H
X-
-!
*"#&
CF3X
!;
-.
G-X
KG;
;.
!3B
IL
<<
X-
K!
&!
&!
&!
&!
&!
&!
?$
2@
$!
^DCE
DB#
!R#3B
*BE#
$C#!=
[D++
#+#
!;
;J
<<
<X
<!
*1.!&
CF3;
H!
LH
GLL
JG-
;L
!3B
;H
K;
--
L!
&!
&N=
!&
N=
!&
!&
!&
N=
!?$
2@
$!
6)
EDE*
Y#+S
!DBB
2C*
DE#
,!@
*EF
!`2+T
D$
!,*B
#DB#
!;
;I
I;
;X
L!
2*")3!4&
CF3;
K!
I.
GX;
-GJ
J.
!3B
;I
X.
.K
I!
>!
"!
"!
"!
"!
"!
?$
2@
$!
6D+#
!R*U
T#$
EDE*
2$
!>[D
++#+#
!;
.-
KJ
XK
-!
#!2)0%5!
CF3J
!;
I;
G-;
LGH
J-
!3B
;H
XI
.L
-L
M=N&
!=
!&
!=
N&
!&
!&
!=
!?$
2@
$!
O&P&
Q!CD
$!E
DBE
#!4
*EE#
3GO&
P=Q!
CD$
!EDBE
#!
4*E
E#3G
O=P=
Q!)
$D4
+#!E
2!E
DBE
#!4
*EE#
3!
;X
KL
K.
LH
!
#!2)0%5!
CF3J
!;
I;
G-;
LG<
;I
!3B
J;
-K
L<
M&N"
!&
!"
!&
N"
!"
!"
!&
!?$
2@
$!
O"P"
Q!CD
$!E
DBE
#!4
*EE#
3GO&
P"Q!
CD$
!EDBE
#!
4*E
E#3G
O&P&
Q!)
$D4
+#!E
2!E
DBE
#!4
*EE#
3!
;X
KL
K.
LH
!
6/#7!%!
CF3X
!X
-I
G-H
XGK
IX
!&
0H
IX
;X
<!
=!
&!
=N&
!=
N&
!=
N&
!=
!?$
2@
$!
]1
6[U
+)C)
32$
2BS
+E3D
$B8
#3D
B#!D
CE*Y
*ES!*B!
F*U
F#3!
*$!E
F#!=
3R;
;>
3U!O
;X
;a
!E2!-
.L
a!C
2T
RD3#
,!E
2!
TDb2
3!D++
#+#
G!,#R
#$
,*$
U!2
$!2
EF#3!
YD3*
D$
EB!*$
!
U#$
#Q!
823!
#BE
32$
#!T
#ED
42+*
BT!
;I
L<
.;
.<
!
62()!&
CF3;
!"#$%&&&%'"(!
$2$
#!
&!
&N=
!&
N=
!&
N=
!&
!&
!$
2Y#+!
0)
EDE*
2$
B!*$
!62()!
!D3#
!?$
2@
$!E
2!C
D)
B#!]
BF#3!
BS$
,32
T#!E
SR
#!(
(DG!@
F*C
F!*B!
CFD3D
CE#3*
c#,
!4S!
,#D8$
#BB
!D$
,!U
3D,
)D+!Y*B
*2$
!+2BB!
L.
XI
HK
-!
8'0&
CF3;
X!
I.
GKK
LG;
.X
!&
0L
JX
<X
.!
=!
&!
=N&
!&
!&
!&
!?$
2@
$!
/*U
F#3!
42$
#!T
*$#3D+!,
#$
B*ES
G!DBB
2C*
DE*
2$
!@*E
F!
&P!)
B#!2
8!,
*88#
3#$
E!E3
D$
B+DE*
2$
!BED
3E!B
*E#!
L;
.L
-K
H!
'

13www.nature.com/nature
SUPPLEMENTARY INFORMATIONdoi: 10.1038/nature08795
13
Supplementary Table 7. Some Gene Ontology categories in which the 6,623 genes with
Bushmen-specific amino-acid differences are over- or under-represented.
GO identifier p-value Over (+) or under
(-) abundance
Informal GO category description
0007606 7.40e-25 + sensory perception of chemical stimulus
0007608 2.22e.23 + sensory perception of smell
0044255 6.50e-16 + cellular lipid metabolic process
0019953 3.10e-15 + sexual reproduction
0007601 6.37e-15 + visual perception
0031402 1.29e-13 + sodium ion binding
0007605 2.89e-11 + sensory perception of sound
0019882 9.40e-11 – antigen processing and presentation
0019226 6.82e-09 + transmission of nerve impulse
0007517 7.70e-09 + muscle organ development
0001501 1.32e-08 + skeletal system development
0009611 4.33e-07 + response to wounding
0006954 5.68e-06 + inflammatory response
0022603 5.50e-05 + regulation of anatomical structure morphogenesis

14www.nature.com/nature
doi: 10.1038/nature08795 SUPPLEMENTARY INFORMATION
14
Supplementary Table 8. Validated KB1 copy-number variants (CNVs).
geneName name chrm txStart txEnd size
KB1
medCN
NA18507
medCN
JDW
medCN
YH
medCN
WGAC
bp
WGAC
percent
cn-dir
increased
num-
probes mean log2
KLHL17 NM_198317 1 936,110 941,162 5,053 2.8 1.6 1.7 1.7 0 0.0% KB1 46 0.133315217
ATAD3C NM_001039211 1 1,470,336 1,490,805 20,470 4.3 3.2 4.1 3.6 16,121 78.8% KB1 127 0.040551181
ATAD3B NM_031921 1 1,492,431 1,516,848 24,418 4.5 3.1 3.4 3.4 24,418 100.0% KB1 168 -0.010464286
ATAD3A NM_018188 1 1,532,822 1,555,331 22,510 5.0 3.3 3.8 3.6 22,510 100.0% KB1 162 0.06916358
CDC2L2 NM_033529 1 1,666,332 1,687,953 21,622 4.5 3.1 3.9 3.2 16,420 75.9% KB1 152 -0.012404605
ESPN NM_031475 1 6,419,114 6,455,269 36,156 4.9 3.1 3.1 4.0 31,756 87.8% KB1 286 0.113879371
NBPF1 NM_017940 1 16,635,718 16,685,288 49,571 49.6 48.0 43.4 46.3 49,533 99.9% KB1 259 0.050870656
CROCC NM_014675 1 16,993,751 17,044,780 51,030 5.7 3.0 2.8 3.3 32,413 63.5% KB1 356 0.211876404
RHD NM_001127691 1 25,344,297 25,402,252 57,956 4.2 2.6 3.2 3.4 57,956 100.0% KB1 391 0.327299233
RHCE NM_138618 1 25,434,057 25,492,679 58,623 4.1 2.6 3.2 3.1 58,449 99.7% KB1 394 0.254420051
AMY2A NM_000699 1 103,872,020 103,880,414 8,395 14.0 10.5 5.7 10.8 8,395 100.0% KB1 65 0.399453846
AMY1A NM_004038 1 104,004,461 104,013,331 8,871 15.0 11.0 5.7 10.4 8,871 100.0% KB1 69 0.562384058
PRMT6 NM_018137 1 107,311,451 107,313,956 2,506 3.3 2.2 1.9 2.2 0 0.0% KB1 24 0.07475
GSTM2 NM_001142368 1 109,922,686 109,938,660 15,975 4.0 2.9 3.1 3.3 10,518 65.8% KB1 120 0.144604167
GSTM1 NM_000561 1 109,942,460 109,948,408 5,949 4.6 2.6 3.0 2.8 5,948 100.0% KB1 56 0.82675
IGSF3 NM_001542 1 116,829,073 116,922,356 93,284 7.1 5.9 6.8 5.0 73,003 78.3% KB1 810 0.006508025
FAM108A3 NM_001080422 1 143,545,025 143,549,782 4,758 20.0 7.4 14.6 11.2 3,724 78.3% KB1 32 0.247484375
RPTN NM_001122965 1 148,939,144 148,944,777 5,634 0.9 2.4 2.2 2.8 0 0.0% NA18507 56 -0.208571429
MSTO1 NM_018116 1 152,393,080 152,397,830 4,751 2.8 4.0 3.7 3.9 4,751 100.0% NA18507 46 -0.153967391
FCER1G NM_004106 1 157,998,160 158,002,111 3,952 0.0 1.7 1.6 1.6 0 0.0% NA18507 30 -0.187433333
FCGR2A NM_001136219 1 158,288,260 158,302,414 14,155 3.1 4.2 4.3 3.8 3,867 27.3% NA18507 116 -0.288969828
FCGR3B NM_000570 1 158,324,606 158,332,855 8,250 3.2 4.4 4.1 4.0 0 0.0% NA18507 68 -0.470294118
FCGR3A NM_001127593 1 158,324,606 158,333,468 8,863 3.1 4.4 3.9 3.8 0 0.0% NA18507 73 -0.45589726
FCGR2C NM_001005410 1 158,364,613 158,375,530 10,918 2.9 4.0 4.0 3.5 1,112 10.2% NA18507 95 -0.462821053
CFHR3 NM_021023 1 193,475,587 193,494,529 18,943 3.1 2.0 5.0 3.8 12,709 67.1% KB1 99 0.437929293
CFHR1 NM_002113 1 193,520,518 193,532,973 12,456 2.8 1.6 3.8 2.8 12,455 100.0% KB1 90 0.458661111
MRPL55 NM_181465 1 224,601,115 224,603,748 2,634 4.6 2.0 2.7 2.2 0 0.0% KB1 19 0.059
SYT15 NM_031912 10 46,378,534 46,390,607 12,074 6.8 3.8 4.0 4.3 6,052 50.1% KB1 101 0.087455446
GPRIN2 NM_014696 10 46,413,552 46,420,573 7,022 4.7 3.5 4.2 3.9 0 0.0% KB1 66 0.054537879
FAM22A NM_001099338 10 88,975,185 88,984,713 9,529 16.3 9.4 11.6 11.1 9,529 100.0% KB1 89 0.09191573
FAM22D NM_001009610 10 89,107,457 89,120,432 12,976 15.4 9.1 11.5 11.1 12,976 100.0% KB1 121 0.078115702
HPS6 NM_024747 10 103,815,137 103,817,782 2,646 3.3 2.1 2.4 1.9 0 0.0% KB1 26 0.059326923
CYP2E1 NM_000773 10 135,229,748 135,241,501 11,754 4.5 2.0 2.5 2.1 0 0.0% KB1 101 0.561806931
SYCE1 NM_130784 10 135,256,285 135,271,757 15,473 3.6 1.9 1.7 1.9 1,887 12.2% KB1 116 0.508306034
DUX4 NM_033178 10 135,372,560 135,380,764 8,205 185.8 96.6 247.8 195.7 8,205 100.0% KB1 58 0.424715517
NLRP6 NM_138329 11 268,570 275,303 6,734 2.9 1.8 2.0 1.8 0 0.0% KB1 62 0.016080645
EFCAB4A NM_173584 11 817,585 821,991 4,407 2.7 1.5 1.3 1.7 0 0.0% KB1 40 0.083725
MUC6 NM_005961 11 1,002,824 1,026,706 23,883 3.1 1.8 2.1 1.7 0 0.0% KB1 226 0.021827434
CHRNA10 NM_020402 11 3,643,393 3,649,190 5,798 0.8 1.9 1.8 1.8 0 0.0% NA18507 52 -0.179009615
KCNJ11 NM_000525 11 17,363,374 17,366,782 3,409 4.4 2.3 3.4 3.1 0 0.0% KB1 28 0.134196429
TIGD3 NM_145719 11 64,878,858 64,881,658 2,801 3.8 1.9 2.2 2.2 0 0.0% KB1 22 0.056840909
UNC93B1 NM_030930 11 67,515,151 67,528,169 13,019 3.3 2.2 2.0 2.1 5,071 39.0% KB1 92 0.017478261
FAM86C NM_152563 11 71,176,205 71,189,928 13,724 23.7 16.3 18.2 18.3 13,724 100.0% KB1 84 0.041767857
CRYAB NM_001885 11 111,284,560 111,287,683 3,124 0.9 2.2 1.8 2.1 0 0.0% NA18507 30 -0.200516667
PATE1 NM_138294 11 125,121,398 125,124,952 3,555 0.8 1.8 1.9 1.7 0 0.0% NA18507 34 -0.208338235
PRB1 NM_199353 12 11,396,024 11,399,791 3,768 3.4 12.2 6.5 10.8 3,768 100.0% NA18507 29 -0.34262069
PRB2 NM_006248 12 11,435,743 11,439,765 4,023 4.0 6.8 6.0 6.2 4,023 100.0% NA18507 28 -0.292178571
TUBA3C NM_006001 13 18,645,920 18,653,936 8,017 7.3 4.9 6.3 5.3 0 0.0% KB1 56 0.0205
PRR20 NM_198441 13 56,639,332 56,642,353 3,022 41.2 22.4 27.9 10.8 3,022 100.0% KB1 21 0.464
DHRS4L2 NM_198083 14 23,527,867 23,545,459 17,593 4.3 5.5 5.5 5.4 17,592 100.0% NA18507 115 -0.14183913
DHRS4L1 NM_001082488 14 23,575,550 23,590,420 14,871 3.8 4.9 5.1 4.7 297 2.0% NA18507 105 -0.134119048
SDR39U1 NM_020195 14 23,978,814 23,981,847 3,034 1.0 2.2 2.7 2.1 0 0.0% NA18507 27 -0.182685185
ACOT1 NM_001037161 14 73,073,681 73,080,251 6,571 2.5 1.3 1.3 2.0 6,571 100.0% KB1 38 0.393486842
LOC727832 NM_001145004 15 18,997,108 19,007,128 10,021 27.6 26.0 27.5 26.3 10,021 100.0% KB1 45 0.018655556
LOC283767 NM_001001413 15 20,287,610 20,297,366 9,757 26.0 22.1 25.7 26.1 9,757 100.0% KB1 45 0.045244444
NIPA1 NM_001142275 15 20,594,722 20,638,284 43,563 2.0 0.9 2.0 1.8 0 0.0% KB1 242 0.362549587
GOLGA8E NM_001012423 15 20,986,537 20,999,864 13,328 35.5 34.5 35.7 37.9 13,328 100.0% KB1 47 0.075031915
CHRFAM7A NM_148911 15 28,440,735 28,473,156 32,422 5.8 3.9 4.7 4.0 32,422 100.0% KB1 226 -0.008878319
GOLGA8A NM_181077 15 32,458,564 32,487,180 28,617 6.9 10.0 8.4 8.6 28,617 100.0% NA18507 196 -0.244607143
TEX9 NM_198524 15 54,444,936 54,525,363 80,428 1.9 0.9 1.7 1.7 0 0.0% KB1 435 0.198298851
GOLGA6 NM_001038640 15 72,149,251 72,161,944 12,694 16.7 13.2 17.2 16.8 12,694 100.0% KB1 80 0.21210625
RHOT2 NM_138769 16 658,134 664,171 6,038 2.7 1.6 1.6 1.6 0 0.0% KB1 54 0.124666667
STUB1 NM_005861 16 670,116 672,768 2,653 3.0 1.9 1.4 2.0 0 0.0% KB1 22 0.062727273
JMJD8 NM_001005920 16 671,668 674,440 2,773 3.3 2.2 2.0 1.8 0 0.0% KB1 23 0.107978261
WDR24 NM_032259 16 674,703 680,401 5,699 2.8 1.8 2.0 1.9 0 0.0% KB1 51 0.085029412
GNG13 NM_016541 16 788,042 790,734 2,693 2.9 1.8 1.5 1.7 0 0.0% KB1 25 0.03934
IGFALS NM_004970 16 1,780,422 1,783,710 3,289 3.1 1.8 1.5 1.7 0 0.0% KB1 32 0.089390625
PKD1 NM_000296 16 2,078,712 2,125,900 47,189 7.2 3.4 6.6 4.4 38,481 81.5% KB1 385 0.051514286
PRSS33 NM_152891 16 2,773,955 2,776,709 2,755 2.8 1.7 0.9 1.2 0 0.0% KB1 25 0.06256
ALG1 NM_019109 16 5,061,811 5,077,379 15,569 10.9 8.8 10.0 8.6 9,707 62.3% KB1 101 0.041673267
FAM86A NM_201598 16 5,074,303 5,087,790 13,488 21.0 13.6 16.0 16.9 13,488 100.0% KB1 80 0.05915625
PDXDC1 NM_015027 16 14,976,334 15,039,053 62,720 3.9 5.3 5.0 3.9 55,935 89.2% NA18507 384 -0.21915625
ORAI3 NM_152288 16 30,867,906 30,873,759 5,854 2.8 1.8 2.1 2.1 0 0.0% KB1 43 0.03355814
SLC5A2 NM_003041 16 31,401,940 31,409,592 7,653 3.1 1.9 2.3 1.9 0 0.0% KB1 63 0.094531746
TP53TG3 NM_016212 16 33,112,481 33,115,680 3,200 16.5 6.9 15.9 6.1 3,200 100.0% KB1 29 0.286844828
PDPR NM_017990 16 68,705,030 68,752,685 47,656 3.4 5.1 4.0 4.0 35,926 75.4% NA18507 261 -0.358015326
MRCL NM_173619 16 68,765,429 68,778,297 12,869 8.8 6.2 6.2 6.1 12,869 100.0% KB1 95 0.040868421
CTRB2 NM_001025200 16 73,795,496 73,798,573 3,078 4.4 2.3 3.3 2.6 1,533 49.8% KB1 27 0.107055556
CTRB1 NM_001906 16 73,810,385 73,816,322 5,938 3.7 2.2 3.1 2.6 1,533 25.8% KB1 41 0.057560976
SLC16A11 NM_153357 17 6,885,673 6,887,966 2,294 3.3 1.7 2.2 1.4 0 0.0% KB1 17 0.051205882

15www.nature.com/nature
SUPPLEMENTARY INFORMATIONdoi: 10.1038/nature08795
15
FLJ25006 NM_144610 17 23,959,109 23,965,338 6,230 0.7 2.2 1.5 2.2 0 0.0% NA18507 49 -0.216612245
ARL17 NM_001039083 17 41,989,936 42,012,375 22,440 3.8 1.6 3.9 5.2 22,440 100.0% KB1 121 0.380884298
NPEPPS NM_006310 17 42,963,443 43,055,641 92,199 3.5 8.3 4.4 3.5 62,993 68.3% NA18507 458 -0.291865721
GIP NM_004123 17 44,390,917 44,400,954 10,038 1.4 2.7 2.0 3.0 0 0.0% NA18507 43 -0.143290698
POLRMT NM_005035 19 568,223 584,568 16,346 3.0 2.0 2.5 2.3 0 0.0% KB1 118 0.037338983
KISS1R NM_032551 19 868,342 872,015 3,674 3.0 1.7 3.4 1.6 0 0.0% KB1 31 0.094887097
NDUFS7 NM_024407 19 1,334,883 1,346,588 11,706 2.8 1.8 1.8 1.7 0 0.0% KB1 86 0.049627907
FAM108A1 NM_031213 19 1,827,975 1,836,518 8,544 4.0 1.9 3.3 2.0 4,828 56.5% KB1 74 0.115695946
ZNF555 NM_152791 19 2,792,482 2,805,033 12,552 1.4 2.7 4.0 2.9 0 0.0% NA18507 75 -0.182393333
FUT5 NM_002034 19 5,816,838 5,821,551 4,714 5.2 2.7 3.3 3.1 0 0.0% KB1 29 0.033327586
MBD3L2 NM_144614 19 7,000,351 7,002,746 2,396 10.1 7.0 8.1 8.0 2,396 100.0% KB1 21 0.408261905
EPOR NM_000121 19 11,349,475 11,356,019 6,545 3.1 2.1 2.3 2.0 0 0.0% KB1 46 0.036771739
ZNF439 NM_152262 19 11,837,844 11,841,306 3,463 5.4 7.8 7.7 7.7 0 0.0% NA18507 30 -0.187483333
ZNF700 NM_144566 19 11,896,900 11,922,577 25,678 2.5 4.2 3.7 4.3 0 0.0% NA18507 139 -0.190111511
RASAL3 NM_022904 19 15,423,438 15,436,382 12,945 0.8 1.8 1.2 1.6 0 0.0% NA18507 85 -0.151923529
ISYNA1 NM_016368 19 18,406,625 18,409,943 3,319 3.4 2.0 2.9 2.1 0 0.0% KB1 27 0.102037037
FCGBP NM_003890 19 45,045,803 45,132,373 86,571 6.3 4.5 4.1 4.3 31,438 36.3% KB1 620 -0.032360484
CYP2A6 NM_000762 19 46,041,283 46,048,192 6,910 6.6 4.7 4.6 4.4 6,910 100.0% KB1 62 0.094048387
CEACAM5 NM_004363 19 46,904,370 46,926,276 21,907 3.1 4.5 4.5 4.5 0 0.0% NA18507 171 -0.133769006
CEACAM8 NM_001816 19 47,776,235 47,790,922 14,688 3.6 5.2 5.6 4.9 0 0.0% NA18507 112 -0.127348214
PSG3 NM_021016 19 47,917,635 47,936,508 18,874 10.3 11.4 10.2 9.2 18,874 100.0% NA18507 139 -0.124496403
PSG8 NM_182707 19 47,950,225 47,961,671 11,447 9.9 13.3 12.6 11.2 11,447 100.0% NA18507 93 -0.194989247
PSG1 NM_006905 19 48,063,198 48,075,711 12,514 10.3 13.4 13.0 9.9 12,514 100.0% NA18507 100 -0.18997
PSG6 NM_002782 19 48,099,608 48,113,829 14,222 8.5 13.1 13.1 9.6 14,222 100.0% NA18507 111 -0.161837838
PSG7 NM_002783 19 48,120,124 48,133,170 13,047 10.0 12.3 12.1 9.7 13,047 100.0% NA18507 109 -0.162458716
PSG11 NM_203287 19 48,203,649 48,222,471 18,823 10.3 13.1 12.4 9.9 18,823 100.0% NA18507 148 -0.11710473
PSG5 NM_002781 19 48,363,735 48,382,528 18,794 9.0 11.3 10.9 9.4 18,794 100.0% NA18507 147 -0.146755102
PSG4 NM_002780 19 48,388,696 48,401,630 12,935 10.4 13.1 13.4 10.4 12,935 100.0% NA18507 111 -0.25104955
PSG9 NM_002784 19 48,449,275 48,465,522 16,248 10.7 13.1 13.3 10.1 16,248 100.0% NA18507 129 -0.20755814
SEPW1 NM_003009 19 52,973,654 52,979,751 6,098 1.3 2.6 2.0 3.7 0 0.0% NA18507 43 -0.163174419
RPS11 NM_001015 19 54,691,446 54,694,756 3,311 1.9 3.1 3.2 2.4 0 0.0% NA18507 26 -0.175442308
RFPL4A NM_001145014 19 60,962,319 60,966,351 4,033 7.2 5.4 5.3 5.0 4,033 100.0% KB1 34 0.249617647
RHOB NM_004040 2 20,568,463 20,570,828 2,366 2.7 1.7 2.9 1.8 0 0.0% KB1 23 0.075108696
TCF23 NM_175769 2 27,283,653 27,287,384 3,732 3.3 2.1 1.9 2.1 0 0.0% KB1 29 0.013982759
C2orf78 NM_001080474 2 73,922,971 73,955,929 32,959 2.6 7.2 9.5 14.1 26,245 79.6% NA18507 186 -0.453905914
TEKT4 NM_144705 2 94,959,106 94,964,442 5,337 11.0 6.2 7.1 7.8 5,337 100.0% KB1 49 0.111010204
SMPD4 NM_017951 2 130,625,210 130,655,924 30,715 4.7 3.4 3.8 3.9 30,715 100.0% KB1 222 0.053752252
C2orf27 NM_013310 2 132,313,796 132,358,709 44,914 11.5 9.8 8.7 10.7 44,914 100.0% KB1 312 0.0876875
MGC50273 NM_214461 2 132,386,266 132,392,966 6,701 33.3 27.9 33.3 31.7 6,701 100.0% KB1 44 0.114090909
CHPF NM_024536 2 220,229,174 220,233,992 4,819 3.1 2.0 2.4 2.3 0 0.0% KB1 45 0.065577778
ALPP NM_001632 2 233,068,853 233,073,102 4,250 5.2 3.2 3.8 3.7 4,250 100.0% KB1 38 0.040736842
ALPPL2 NM_031313 2 233,097,057 233,100,930 3,874 5.2 3.5 3.8 4.2 3,874 100.0% KB1 37 0.039837838
ALPI NM_001631 2 233,146,338 233,150,247 3,910 4.0 2.9 3.8 3.2 0 0.0% KB1 39 0.063166667
NDUFA10 NM_004544 2 240,620,146 240,684,788 64,643 3.0 1.8 2.0 1.9 0 0.0% KB1 553 0.294776673
RNPEPL1 NM_018226 2 241,228,094 241,238,131 10,038 2.6 1.6 1.8 1.9 0 0.0% KB1 97 0.02164433
AQP12A NM_198998 2 241,351,252 241,357,889 6,638 4.1 2.7 2.8 3.0 6,638 100.0% KB1 63 0.146007937
GNRH2 NM_178331 20 2,972,268 2,974,391 2,124 3.6 2.2 2.2 2.2 0 0.0% KB1 20 0.062875
THBD NM_000361 20 22,974,271 22,978,301 4,031 2.7 1.6 1.8 1.9 0 0.0% KB1 40 0.08135
CST4 NM_001899 20 23,614,277 23,617,662 3,386 5.7 4.0 4.2 4.9 3,386 100.0% KB1 35 0.073871429
C20orf134 NM_001024675 20 31,717,965 31,719,991 2,027 3.4 2.0 2.9 2.5 0 0.0% KB1 19 0.093526316
SEMG1 NM_003007 20 43,269,088 43,271,822 2,735 2.5 4.1 3.2 3.4 0 0.0% NA18507 26 -0.200826923
SEMG2 NM_003008 20 43,283,424 43,286,512 3,089 2.3 4.9 5.0 4.0 0 0.0% NA18507 30 -0.161666667
NEURL2 NM_080749 20 43,950,674 43,953,308 2,635 4.4 1.9 2.0 1.9 0 0.0% KB1 19 0.074368421
THAP7 NM_001008695 22 19,678,615 19,680,958 2,344 3.7 2.0 3.2 1.7 0 0.0% KB1 23 0.133369565
LOC51233 NM_016449 22 22,275,194 22,299,041 23,848 3.2 4.4 4.0 4.0 15,467 64.9% NA18507 185 -0.135435135
DDT NM_001355 22 22,638,108 22,646,573 8,466 3.4 1.8 3.3 3.6 8,056 95.2% KB1 60 0.335975
GSTT2 NM_000854 22 22,646,868 22,650,660 3,793 3.6 2.0 2.8 3.6 3,793 100.0% KB1 30 0.38805
GSTT1 NM_000853 22 22,700,693 22,708,838 8,146 0.0 1.2 1.3 0.4 0 0.0% NA18507 54 -0.807518519
GGT1 NM_001032365 22 23,328,209 23,349,526 21,318 13.2 7.2 9.2 6.3 21,318 100.0% KB1 137 0.181193431
APOBEC3B NM_004900 22 37,702,905 37,713,283 10,379 3.3 2.2 2.6 3.1 10,290 99.1% KB1 91 0.240824176
RRP7A NM_015703 22 41,233,073 41,240,306 7,234 4.0 2.7 3.1 3.1 7,234 100.0% KB1 54 0.200611111
LMF2 NM_033200 22 49,231,524 49,236,257 4,734 3.8 1.9 2.4 1.9 0 0.0% KB1 41 0.035780488
MST1 NM_020998 3 49,696,385 49,701,200 4,816 12.7 6.0 11.5 10.7 4,776 99.2% KB1 47 2.68E-01
AMIGO3 NM_198722 3 49,729,969 49,732,127 2,159 3.5 1.7 2.7 2.1 0 0.0% KB1 22 0.115022727
CISH NM_013324 3 50,618,890 50,624,266 5,377 3.8 2.1 2.6 2.4 0 0.0% KB1 52 0.027278846
TLR9 NM_017442 3 52,230,138 52,235,219 5,082 4.0 2.1 2.0 2.5 0 0.0% KB1 47 0.0045
FAM157A NM_001145248 3 199,367,547 199,396,038 28,492 13.0 9.9 11.0 8.3 28,492 100.0% KB1 152 -0.012078947
SLC26A1 NM_213613 4 971,277 977,054 5,778 3.2 1.8 2.6 2.0 0 0.0% KB1 55 0.068145455
DRD5 NM_000798 4 9,459,527 9,461,902 2,376 19.8 8.9 10.4 12.3 2,376 100.0% KB1 23 0.156347826
UGT2B15 NM_001076 4 69,693,104 69,717,150 24,047 2.3 4.1 4.5 2.6 24,047 100.0% NA18507 139 -0.308435252
UGT2B11 NM_001073 4 70,246,807 70,261,209 14,403 5.8 8.9 9.0 7.2 14,403 100.0% NA18507 112 -0.123209821
FRG2 NM_001005217 4 191,320,672 191,323,561 2,890 10.6 9.0 12.9 9.7 2,890 100.0% KB1 24 0.055666667
MGC29506 NM_016459 5 138,751,157 138,753,504 2,348 3.1 1.7 1.9 1.8 0 0.0% KB1 20 0.078725
ZNF300 NM_052860 5 150,254,157 150,264,584 10,428 1.5 2.5 2.6 2.2 1,060 10.2% NA18507 89 -0.15955618
FGFR4 NM_022963 5 176,449,157 176,457,730 8,574 3.1 2.0 2.0 2.2 0 0.0% KB1 79 0.026537975
HSPA1A NM_005345 6 31,891,270 31,893,698 2,429 5.9 4.0 5.7 5.1 2,177 89.6% KB1 23 0.059934783
TREML1 NM_178174 6 41,225,322 41,230,048 4,727 1.2 2.3 2.5 2.4 0 0.0% NA18507 37 -0.175081081
GSTA1 NM_145740 6 52,764,138 52,776,623 12,486 5.0 6.5 6.1 5.9 12,486 100.0% NA18507 111 -0.115342342
GSTA5 NM_153699 6 52,804,502 52,818,852 14,351 4.5 5.6 5.4 5.0 14,351 100.0% NA18507 117 -0.123858974
MARCKS NM_002356 6 114,285,220 114,291,345 6,126 1.4 2.8 2.3 2.5 2,419 39.5% NA18507 40 -0.286275
CYP2W1 NM_017781 7 796,076 802,517 6,442 3.1 2.1 2.3 2.0 0 0.0% KB1 54 0.085592593
TMEM184A NM_001097620 7 1,355,112 1,369,307 14,196 3.3 2.1 2.1 2.0 0 0.0% KB1 116 0.091672414
KIAA0415 NM_014855 7 4,588,505 4,604,638 16,134 3.0 2.0 2.1 2.0 0 0.0% KB1 117 0.069333333
NCF1 NM_000265 7 73,632,960 73,648,309 15,350 5.7 4.4 5.1 4.8 15,350 100.0% KB1 82 0.061152439

16www.nature.com/nature
doi: 10.1038/nature08795 SUPPLEMENTARY INFORMATION
16
PMS2L5 NM_174930 7 73,751,552 73,766,505 14,954 22.0 18.7 17.9 16.0 14,954 100.0% KB1 23 0.242782609
LOC442590 NM_001099435 7 74,768,950 74,778,279 9,330 40.9 33.4 35.6 32.2 9,330 100.0% KB1 20 0.052
DTX2 NM_020892 7 75,735,623 75,779,963 44,341 4.9 3.4 3.9 2.7 44,341 100.0% KB1 310 0.007883871
UPK3B NM_182684 7 75,784,396 75,801,848 17,453 3.4 2.1 2.4 1.6 17,453 100.0% KB1 82 0.109890244
LOC100132832 NM_001129851 7 76,313,448 76,327,006 13,559 24.0 22.6 21.7 19.8 13,559 100.0% KB1 17 0.113088235
CYP3A4 NM_017460 7 98,999,255 99,026,459 27,205 2.6 3.7 3.4 3.4 27,205 100.0% NA18507 203 -0.129889163
STAG3 NM_012447 7 99,420,189 99,456,661 36,473 1.9 3.2 2.7 2.7 18,414 50.5% NA18507 229 -0.130454148
ACHE NM_000665 7 100,132,267 100,138,192 5,926 3.5 2.0 2.8 2.0 0 0.0% KB1 43 0.100093023
POLR2J NM_006234 7 101,707,270 101,713,101 5,832 11.5 8.5 7.8 10.4 4,996 85.7% KB1 43 0.159523256
RASA4 NM_001079877 7 101,813,883 101,851,140 37,258 11.1 6.1 6.5 7.8 37,258 100.0% KB1 225 0.253435556
POLR2J2 NM_032959 7 101,871,425 101,906,133 34,709 19.7 12.1 12.9 13.2 34,709 100.0% KB1 143 0.170545455
ZYX NM_001010972 7 142,595,197 142,605,039 9,843 3.3 2.1 2.5 2.3 0 0.0% KB1 87 0.008074713
FLJ43692 NM_001003702 7 143,321,325 143,330,384 9,060 8.8 6.0 6.4 8.5 9,051 99.9% KB1 75 0.057346667
ARHGEF5 NM_005435 7 143,490,137 143,515,372 25,236 6.2 4.0 5.0 6.1 21,888 86.7% KB1 211 0.136881517
DEFA1 NM_004084 8 6,841,698 6,844,122 2,425 12.6 7.6 9.1 6.1 2,425 100.0% KB1 23 0.314173913
DEFA3 NM_005217 8 6,860,805 6,863,226 2,422 12.0 7.6 8.6 6.2 0 0.0% KB1 24 0.324520833
SPAG11A NM_001081552 8 7,742,812 7,758,729 15,918 5.6 2.9 1.9 4.2 15,918 100.0% KB1 134 0.410011194
FAM86B2 NM_001137610 8 12,327,497 12,338,223 10,727 27.1 16.7 20.2 20.8 10,727 100.0% KB1 67 0.123007463
REXO1L1 NM_172239 8 86,755,947 86,762,978 7,032 272.4 129.9 183.7 134.9 7,032 100.0% KB1 50 0.36707
CYP11B1 NM_001026213 8 143,950,777 143,958,238 7,462 3.7 2.6 2.8 3.1 6,656 89.2% KB1 72 0.040833333
VPS28 NM_016208 8 145,619,808 145,624,735 4,928 3.3 2.0 2.1 2.0 0 0.0% KB1 43 0.049093023
PPP1R16A NM_032902 8 145,692,917 145,698,311 5,395 2.6 1.6 1.8 1.9 0 0.0% KB1 52 0.008
LRRC14 NM_014665 8 145,714,199 145,721,365 7,167 3.1 2.0 1.8 2.0 0 0.0% KB1 65 0.027130769
WASH1 NM_182905 9 4,511 19,739 15,229 26.1 16.0 25.6 19.8 15,229 100.0% KB1 133 0.16081203
AQP7 NM_001170 9 33,374,949 33,392,517 17,569 14.1 9.3 10.5 9.4 17,569 100.0% KB1 139 0.003571942
FAM75A1 NM_001085452 9 39,657,015 39,663,247 6,233 13.0 11.1 13.6 11.5 6,233 100.0% KB1 49 0.063295918
FAM22F NM_017561 9 94,160,033 94,170,481 10,449 11.3 7.5 9.0 8.6 10,449 100.0% KB1 84 0.076113095
SET NM_001122821 9 128,525,488 128,538,229 12,742 3.5 4.7 4.0 4.1 1,752 13.7% NA18507 81 -0.170783951
FBXW5 NM_018998 9 137,110,725 137,115,010 4,286 3.1 1.8 2.1 1.8 0 0.0% KB1 37 0.151310811
Validation was based on array CGH (comparative genomic hybridization) with the NA18507 (Yoruban) genome sequence41. “tx” = transcription,
“medCN” = nedian copy number, “WGAC” = whole genome assembly comparison.
Supplementary Table 9. Mitochondrial haplogroups42
based on four informative Illumina
1M Duo mitochondrial SNPs.
KB1 NB1 TK1 MD8 ABT
MitoG1440A G A A A G
MitoG2708A G A A A A
MitoG15931A G A A A G
MitoG16130A G A A A G
Supplementary Table 10. Markers for NB1 and TK1 that define Y-haplogroup A1.
SNP ID Position2
Name Haplogroup Change3
NB1 TK1
rs3897 17080420 M6 A2 T>C T C
rs3905 20181656 M14 A2 T>C T C
rs2032633 20328114 M49 A2 T>C T C
rs2032638 20353835 M71 A2 C>T C T
rs2032664 14036089 M212 A2 C>A C C#
rs9341312 21151116 P247 A2 T>A T A
rs9341314 21151209 P248 A2 G>T G T
rs2032603 13477921 M190 A3b A>G G A
1Identified using genotyping array data and/or genome sequencing data.
2Position and
3substitution based on NCBI
Build 36 (hg18 reference sequence). #Genotype according to Illumina 1M array denotes TK1 as not being in the A2
haplogroup as per the M212 marker. This discordance may indicate genotyping error or a de novo mutation in this
individual.

17www.nature.com/nature
SUPPLEMENTARY INFORMATIONdoi: 10.1038/nature08795
17
Supplementary Table 11. Markers for KB1 that define Y-haplogroup B1.
SNP ID Position2
Name Haplogroup Change3
KB1
rs2032599 13360948 M181 B T>C C
rs9341290 13529972 P85 B T>C C
- 13359973 P90 B C>T T
rs2032601 13378470 M182 B2 C>T T
- 20227347 M112 B2b C>T (G>A*) T
rs2032662 13523656 M192 B2b C>T T
- 21906455 50f2(P) B2b G>C G
- 6828265 P6 B2b1 G>C C
1Identified using genotyping array data and/or genome sequencing data.
2Position and
3substitution based on NCBI
Build 36 (hg18 reference sequence). *Strand orientation as per ref. 4.
Supplementary Table 12. Markers for ABT and MD8 that define Y-haplogroup E1.
SNP ID Position2
Name Haplogroup Change3
ABT MD8
rs9786489 10461457 * P167 DE G>T T T
rs9786634 13174651 * P152 E G>C C C
rs9786357 18009501 * P154 E G>T T T
rs9786301 14847931 * P155 E G>A A A
rs17842518 21853359 * P171 E G>T T T
rs9786191 13313471 * P175 E G>A A A
rs16980473 12669846 P177 E1b C>T T T
rs9786105 7461836 * P178 E1b1 G>A A A
- 20071555 P1 E1b1a C>T T C
rs16980394 17745841 * P182 E1b1a G>A A G
rs16981297 8835178 P293 E1b1a G>A A G
rs2032598 13359735 M180 P88 E1b1a T>C C T
rs9786252 2971033 * - E1b1a G>A A G
rs768983 6878291 * - E1b1a G>A (C>T*) A G
rs9786574 8647013 * - E1b1a C>T T C
rs16980754 8806440 * - E1b1a C>T T C
rs9785753 13176589 * - E1b1a C>T T C
rs9786100 13824441 * - E1b1a T>C C T
rs9786135 17246254 * - E1b1a C>T T C
rs16980561 21081419 * - E1b1a A>G G A
rs16980435 21531096 * - E1b1a C>T T C
rs9785875 22788755 * - E1b1a T>A A T
rs1971755 15087466 * - E1b1a A>G (T>C*) G A
rs16980457 15222712 * - E1b1a G>T T G
rs16980588 14763088 * U175 E1b1a8 G>A A G
rs16980502 15804352 * U209 E1b1a8a C>T T C
rs16980558 14088609 P277 E1b1a8a A>G G A
rs7067418 85227053 P278 E1b1a8a G>A A G
- 20201091 M35 E1b1b1 G>C G C
rs2032640 20351960 M81 E1b1b1b C>T C C
rs2032613 20391026 M107 E1b1b1b1 A>G A A
1Identified using genotyping array data and/or genome sequencing data.
2Position and
3substitution based on NCBI
Build 36 (hg18 reference sequence). *Nucleotide position or strand orientation as per ref. 4.

18www.nature.com/nature
doi: 10.1038/nature08795 SUPPLEMENTARY INFORMATION
18
Supplementary Table 13. 5-by-5 Fst (fixation index) table depicting relationships among
the five men using genome-wide SNP analysis.
KB1 NB1 TK1 MD8 ABT
KB1 Fst x1000
SD x1M
0
-
21
4372
24
4785
22
4536
80
4902
NB1 Fst x1000
SD x1M
21
4372
0
-
-7
5580
6
4398
91
4790
TK1 Fst x1000
SD x1M
24
4785
-7
5580
0
-
16
4934
88
4916
MD8 Fst x1000
SD x1M
22
4536
6
4398
16
4934
0
-
61
4867
ABT Fst x1000
SD x1M
80
4902
91
4790
88
4916
61
4867
0
-
Supplementary Table 14. Evidence for gene-flow between ancestors of ABT and KB1. An
excess of sites at which ABT and KB1 share a derived allele relative to another genome, X, is a
signal of admixture (see Ref. 43 for details). We searched for such an excess at 39,473 neutral,
freely recombining, autosomal loci, each 1kb in size. Six different genomes were used in place of
X. Positive values of the test statistic (Cabt-x ) indicate potential admixture between ancestors of
KB1 and ABT. Statistical significance was assessed using a permutation test, as described in
Ref. 43.
X Population Cabt-x
a µ0b
σ0c
pd
NA18507 Yoruban 208.13 0.06 50.88 0.00002
NA19240 Yoruban 166.75 -0.01 46.82 0.00018
NA12891 European 62.88 0.23 52.83 0.11735
NA12892 European 84.88 0.11 52.12 0.05218
Korean Korean 117.50 0.22 52.40 0.01202
Chinese Chinese 59.63 0.29 53.39 0.13180
aObserved value of test statistic, based on real data (see text).
bMean of null distribution, as assessed by permutation test.
cStandard deviation of null distribution, as assessed by permutation test.
dEmpirical one-sided p-value: fraction of 100,000 permuted data sets having test statistics at least as large as Cabt-x.
Values of p < 0.05 are highlighted in bold.
Supplementary Table 15. KB1 genotypes at various unstable microsatellite loci. Loci are
identified in Pearson et al11
. Only alleles supported by at least two reads are presented here.
“Ref.” is the human reference genome (NCBI Build 36).
Locus Normal range Disease range Ref. KB1
DRPLA 7-25 49-88 15 9
SCA10 10-22 800-4500 14 13
SCA12 7-45 55-78 10 13
SCA6 4-18 20-29 13 8/11

19www.nature.com/nature
SUPPLEMENTARY INFORMATIONdoi: 10.1038/nature08795
19
Supplementary Figures
Supplementary Figure 1A. Phylogenetic trees.
(A) Schematic tree of mitochondrial human haplogroups. (B) Bayesian phylogenetic tree of
complete mitochondrial genomes from haplogroup L0. Individuals from this study are
highlighted in red.
L0d
L0k
L0f
L0a
L1
L2
L3
A B
C D
YRINA18507
KB1
ABT
Watson
Venter
Chinese
Korean
Chimp
KB1
NB1
TK1
MD8
ABT
YRINA18507
Watson
Venter
Chinese
Chimp
20www.nature.com/nature
doi: 10.1038/nature08795 SUPPLEMENTARY INFORMATION
20
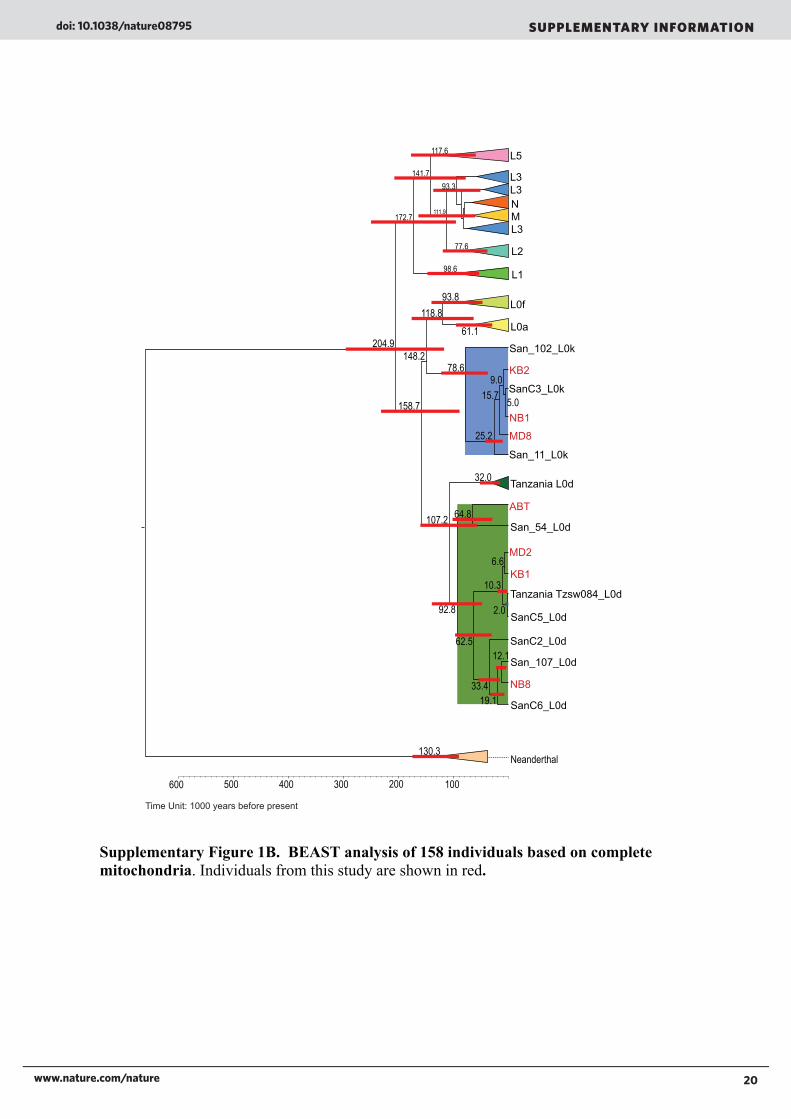
Supplementary Figure 1B. BEAST analysis of 158 individuals based on complete
mitochondria. Individuals from this study are shown in red.
!"#$%&'$(&)
*+'
!"#,-$(&)
.+%
/01
!"#$%%$(&)
2"#3"#4"5(&6
7+2
!"#$89$(&6
/0'
*+%
2"#3"#4"523:;&19$(&6
!"#,8$(&6
!"#,'$(&6
!"#$%&<$(&6
.+1
!"#,=$(&6
(8
(-
(-
(-
./
('
(%
(&>
(&"
!!"#$
%&#&
!'!#"
!!!#%
!"(#"
""#$
%)#$
%&#)
$!#!
!!)#)
(*'#%
!')#(
")#$
!+)#"
%#*
!+#"
(+#(
+#*
&(#*
$'#)!*"#(
%(#)
$#$
!*#&
(#*
$(#+
,-./0-123.4!&*#&
&&#'
!(#!
!%#!
!**(**&**'**+**$**
24?@5A#4BC5%&&&5D@"E:5F@>GE@5HE@:@#B

21www.nature.com/nature
SUPPLEMENTARY INFORMATIONdoi: 10.1038/nature08795
21
Supplementary Figure 1C. Haplogroup composition of the human mitochondrial samples
used.
A
B
Supplementary Figure 2. Sequence differences in the southern African participants’
mitochondrial genomes. A) using the Cambridge reference sequence (CRS) as a reference; B)
Using KB1 as a reference.
146
8
6
32
514
37
25
5 6
L0d
L0k
L0a
L0f
L1
L2
L3
M
N
L5
Ribosomal RNA Coding genes Transfer RNA Non-coding VNTR
rRNA rRNA CDS CDS CDS CDS
CDS
CDS CDS
CDSCDS
CDS CDS CDS CDS
0 2000 4000 6000 8000 10000 12000 14000 16569
ABT
KB1
KB2
MD2
NB1
NB8
CRS_2006
Ribosomal RNA Coding genes Transfer RNA Non-coding VNTR
0 2000 4000 6000 8000 10000 12000 14000 16569
ABT
CRS
KB2
MD2
NB1
NB8

22www.nature.com/nature
doi: 10.1038/nature08795 SUPPLEMENTARY INFORMATION
22
A
B
Supplementary Figure 3. Heterozygosity from genotyping data. Total (A) and per-autosome
(B) genome-wide percentage heterozygosity for 1,105,569 autosomal SNPs in our five southern
Africans compared to South African European (SAE) and admixed South African Coloured
(SAC) samples. Total number of SNPs evaluated per chromosome: chr1, 95,287; chr2, 91,532;
chr3, 75,838; chr4, 66,088; chr5, 68,079; chr6. 72,687; chr7. 60,929; chr8, 57,940; chr9, 49,319;
chr10, 56,474; chr11, 56,274; chr12, 55,614; chr13, 39,234; chr14, 36,407; chr15, 33,933; chr16,
36,111; chr17, 34,644; chr18, 31,002; chr19, 27,235; chr20, 28,219; chr21, 14,906; and chr22,
17,817.
29.427.6 27.1
22.5 22.2 22.324
0
5
10
15
20
25
30
35
SAC SAE ABT KB1 NB1 TK1 MD8

23www.nature.com/nature
SUPPLEMENTARY INFORMATIONdoi: 10.1038/nature08795
23
Supplementary Figure 4. Variation in SNP rate. Genome-wide SNP rates in KB1 (top, red)
and ABT (bottom, blue), relative to the average for available human genomes.

24www.nature.com/nature
doi: 10.1038/nature08795 SUPPLEMENTARY INFORMATION
24
Supplementary Figure 5. Verification of the H2 inversion in KB1. Genotyping of a
diagnostic indel confirms that KB1 is an H1/H2 heterozygote. Results for NA18507 (H1/H1)
and NA12156 (H1/H2) are also shown. (See the main paper for a discussion.)

25www.nature.com/nature
SUPPLEMENTARY INFORMATIONdoi: 10.1038/nature08795
25
Supplementary Figure 6A. Validation of 140-kb duplication on chr10 in KB1. “aCGH”
means array comparative genomic hybridization.
Supplementary Figure 6B. Estimated copy number for the 17q21.3 locus in KB1. The
circled region corresponds to a segment found to be duplicated on all other examined H2
chromosomes. Read depth and array-CGH indicate that this duplication is not present in KB1.
26www.nature.com/nature
doi: 10.1038/nature08795 SUPPLEMENTARY INFORMATION
26
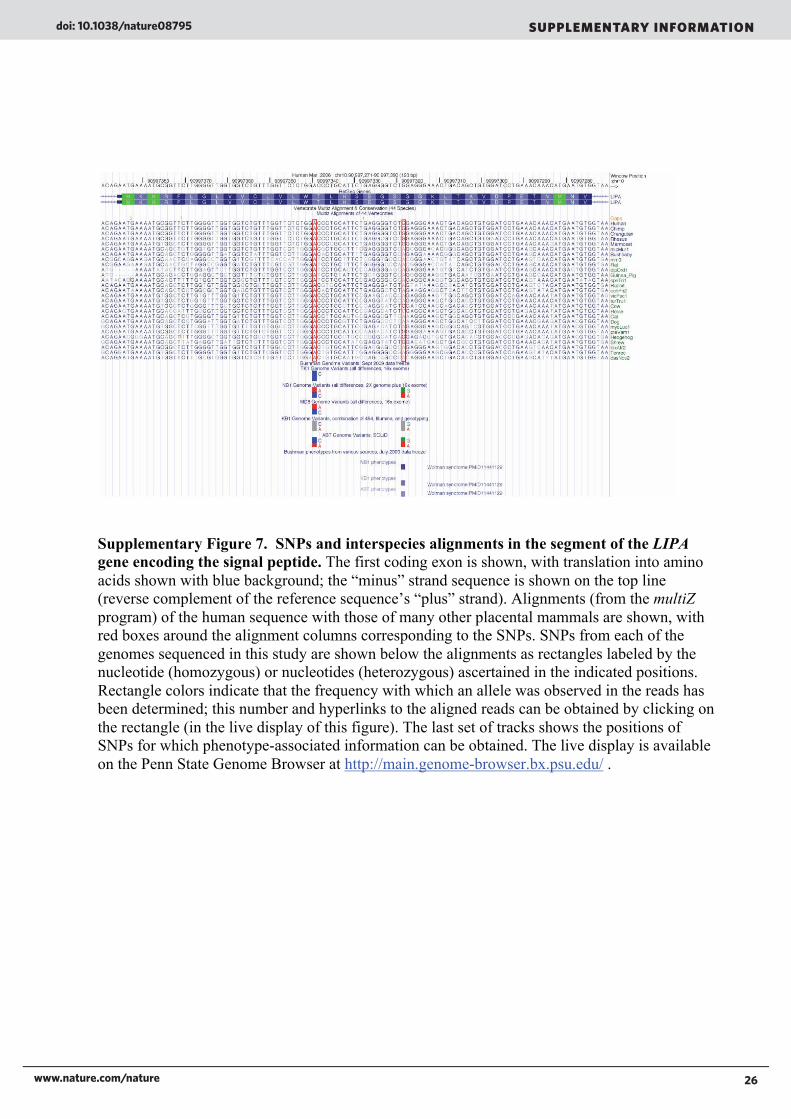
Supplementary Figure 7. SNPs and interspecies alignments in the segment of the LIPA
gene encoding the signal peptide. The first coding exon is shown, with translation into amino
acids shown with blue background; the “minus” strand sequence is shown on the top line
(reverse complement of the reference sequence’s “plus” strand). Alignments (from the multiZ
program) of the human sequence with those of many other placental mammals are shown, with
red boxes around the alignment columns corresponding to the SNPs. SNPs from each of the
genomes sequenced in this study are shown below the alignments as rectangles labeled by the
nucleotide (homozygous) or nucleotides (heterozygous) ascertained in the indicated positions.
Rectangle colors indicate that the frequency with which an allele was observed in the reads has
been determined; this number and hyperlinks to the aligned reads can be obtained by clicking on
the rectangle (in the live display of this figure). The last set of tracks shows the positions of
SNPs for which phenotype-associated information can be obtained. The live display is available
on the Penn State Genome Browser at http://main.genome-browser.bx.psu.edu/ .

27www.nature.com/nature
SUPPLEMENTARY INFORMATIONdoi: 10.1038/nature08795
27
A
Supplementary Figure 8A. Retention of an active allele of CYP2G in Bushmen. A 30-base
segment of the human reference genome assembly (hg18, March 2006, reverse complement of
the standard sequence) from the gene CYP2G is given at the top of this diagram. It reads TGA at
the center codon (a signal to stop translation of the mRNA), and thus this is not an active gene in
most humans. However, both KB1 and NB1 are homozygous for the CGA codon (boxed in blue
at the top, and shown in the variant tracks at the bottom), encoding an arginine and thus
producing an active protein product similar to that shown for the mouse and rat Cyp2g1 genes.
Other primates and many other mammals also encode an arginine at this codon (multiple
alignment in the middle), suggesting that this is the ancestral allele.
--->
HumanChimpOrangutanRhesusMarmosetBushbabyTreeShrewmm9RatdipOrd1Guinea_PigspeTri1RabbitochPri2vicPac1CowHorseDogmyoLuc1pteVam1HedgehogloxAfr2proCap1TenrecOpossum
KB1 substitutions
NB1 substitutions
Human Mar. 2006 chr19:46,260,098-46,260,127 (30 bp)
4626010046260125
GGACGGAATAAGTAAG
AG
TAAAGGTCCGTTAC
C
Mus Cyp2g1Rattus Cyp2g1
G A K N M * K W A I G A K N M R K W A I G A K N M R K W A I G A K N M R K W A I G G K N M R K W A I G G K N I R K W V L G G K N R Q K W A I G G K S T R K W A I G G R S T R K W A I G G K N I * K W A M G G K N T K K W A V G R K N I * K W A I G P K Q V R K W A I G A K T V K K W A I G G K S I R K W A I G G K S M R K W A I K R K N T Q K W A T G G K S N R K W A I G G K N I Q K W A I G G K N I Q K W A I G G K S R Q K W A I G G K S I R K W A I G G K S V R K W A I G G K S I R K W A I G G K H M R K W A I
C
C
term
Arg

28www.nature.com/nature
doi: 10.1038/nature08795 SUPPLEMENTARY INFORMATION
�
� ���
Supplementary Figure 8B. Sanger-sequencing validation of the CYP2G SNP. Depicting
homozygosity of the C-allele in KB1, and uneven allele distribution for MD8 (C:T = 2:1) and
TK1 (C:T = 1:2). Further validation of 30 Bushmen, 29 Bantu, and 11 Europeans demonstrated a
predominance of C-alleles in the Bushmen and T-alleles in Europeans.
������������������ ���������������� ����������������

29www.nature.com/nature
SUPPLEMENTARY INFORMATIONdoi: 10.1038/nature08795
�
� ���
Supplementary Figure 9. Y-chromosome SNPs. Schematic overview of 1,220 Y
chromosome SNPs genotyped on the Illumina 1M array for the five men, showing the number of
shared alleles (1,062 SNPs), Bushmen-specific alleles (75 SNPs) and ABT-unique alleles (83
SNPs). Although 59 alleles are shared by KB1, NB1, and TK1, and a few others are unique to
each of them, MD8 has no unique SNPs and shows the greatest Bantu-specific Y-allele sharing
with ABT (common ancestral lineage E1b1).
����
����������
���
���
���
���
�������
��������
������
���
��
�� ����
������������
����
��������
����
����
������������������������������������
��� ����� �����
������
��
���
���
���
���
���
���
���
���
���� ���� ���� ����
��������������������������������
����
��������
��

30www.nature.com/nature
doi: 10.1038/nature08795 SUPPLEMENTARY INFORMATION
30
Full Methods
Genome-wide genotyping
Whole-genome genotyping was performed using the Infinium HD technology with the current
content of the Human 1M-Duo BeadChip, according to the standard protocol provided by the
manufacturer (Illumina Inc., San Diego, CA, USA). The BeadChip was imaged with the Illumina
BeadArray Reader (BeadStation 500G), and the Illumina BeadStudio software (version 3.2.32)
was used for analysis of more than 1 million markers for the five selected individuals (KB1,
NB1, TK1, MD8, and ABT), five additional Ju/’hoansi, and one additional Tuu, which were
compared to those of a South African European (SAE) and South African Coloured (SAC). A
GenCall score value of 0.5 was used as the cutoff to ensure the reliability of genotypes called.
Mitochondrial sequencing
Whole-genome shotgun libraries were constructed for samples from KB1, NB1, MD8, MD2,
KB2, NB8, and ABT. Sufficient sequencing was performed to provide 16- to 134-fold coverage
of each complete mitochondrial genome. Mitochondrial reads were identified by mapping to the
Cambridge reference mitochondrial sequence, and were subsequently assembled by Newbler.
Exome sequencing
Large targeted regions can be enriched in a genomic sample using solid-phase programmable
microarrays44,45
. Although solution phase, hybridization selection, and enrichment have been
performed using DNA and RNA probes followed by short-read sequencing (<100 bp), this
combination of technologies yields low sequencing coverage for the middle of short targeted
regions46
. Currently, there are no reports of efficiently enriching the entire human exome.
Whole human exome sequencing was performed using a combination of Roche
NimbleGen and Roche/454 sequencing technologies. An optimized, previously unpublished
protocol was employed that efficiently used a total of 5 micrograms of genomic DNA. Previous
studies have required 20 micrograms of starting material. A detailed description of the workflow
is included below.
The Roche NimbleGen Whole Exome Array targets 175,278 exons covering 26,227,295
bp spanned by 197,218 probe regions covering 34,952,076 bp of the human genome. These
exons represent approximately 16,000 protein-coding genes as defined in the Consensus Coding
Sequencing (CCDS) project, build 36.235
. Chromosomal coordinates for the exon array design
were obtained from the UCSC Genome Browser (human build hg18). Additionally, 551 human
miRNA genes were targeted in the array and were identified using MiRBase (release 10). A
total of 2.1 million probes were incorporated onto the array, targeting the forward strand and
using a median probe length of 75 base pairs. Probe design has been previously described44,45
.
Sequence capture method
Protocol optimized for Roche 454 GS FLX Titanium:
5 µg of input genomic DNA is used to construct a sequencing library, following the protocol in
sections 3.1 to 3.9 of the GS FLX Titanium General DNA Library Preparation Manual.
5 µg of input DNA is nebulized according to the Library Preparation Method Manual.
31www.nature.com/nature
SUPPLEMENTARY INFORMATIONdoi: 10.1038/nature08795
31
Nebulized DNA is purified using two columns from a MinElute PCR Purification kit
(QIAGEN) according to the manufacturer’s instructions.
Eluted DNA is size-selected using the Double SPRI selection method from the 454
General Library Preparation Method Manual.
Resulting DNA is analyzed using a BioAnalyzer DNA 7500 LabChip to ensure that the
mean fragment size is between 500 and 800 bp and less than 10% of the library is
below 350 bp or greater than 1,000 bp.
Material passing the above quality control is end-polished, has adaptors ligated, small
fragments removed, and then a single-stranded DNA library is recovered using the
methods from the Library Preparation Manual.
1 µL of the resulting sstDNA library is analyzed on a BioAnalyzer 6000 Pico chip and quality
assessed based on Table 3-1 of the General Library Preparation Manual.
• The mean fragment size should be between 500 and 800 bp, and less than 10% of the
DNA should be shorter than 350 bp or longer than 1,000 bp. The total yield of the library
should be >3 ng, with the adaptor dimer peak less than 5% of the library peak height.
The samples are amplified using the Pre-Capture LM-PCR protocol in the NimbleGen Titanium
Optimized Sequence Capture User Guide.
Amplified pre-capture LM-PCR material is purified using QIAquick (QIAGEN) columns and a
modified protocol.
• 1,250 µL (5X) of Qiagen buffer PBI is added to each tube.
• The sample is applied to the QIAquick column and eluted in 50 µL of PCR-grade water.
The concentration and size distribution of the amplified library is determined using a
BioAnalyzer DNA 7500 chip. Greater than 3 µg of DNA should be recovered from the pre-
capture LM-PCR, with the same size characteristics given above.
Samples are hybridized and eluted according to the methods described in the NimbleGen
Titanium Optimized Sequence Capture User Guide.
LM-PCR is done on captured samples according to the methods described in the NimbleGen
Titanium Optimized Sequence Capture User Guide.
Post-capture LM-PCR material is cleaned up using the modified QIAquick column method
indicated above.
1 µL of the post-capture LM-PCR is assessed using a BioAnalyzer DNA 7500 chip for the same
criteria as above. A NanoDrop spectrophotometer is used to quantify the concentration and the
A260/A280 ratio.
qPCR is used to assess the enrichment success according to the methods described in the
NimbleGen Titanium Optimized Sequence Capture User Guide.
The resulting library concentration is quantified by PicoGreen fluorometry.

32www.nature.com/nature
doi: 10.1038/nature08795 SUPPLEMENTARY INFORMATION
32
Library emulsion PCR is then performed according to the GS FLX Titanium emPCR Preparation
Manual, and the remaining workflow is identical to the standard GS FLX Titanium sequencing
run.
Whole-genome sequencing of KB1
We employed previously described protocols47,48
, which were augmented as follows. Genomic
DNA fragments extracted from blood samples of KB1 and NB1 were size-selected before DNA
library construction by running the samples on a 2% unstained agarose gel along with a 100 bp
DNA ladder (NE Biolabs). The ladder was excised and stained for fragment visualization, and
for KB1 and NB1 we excised fragments between 400 and 1000 bp. The samples were then
purified using the QIAquick Gel Extraction Kit from Qiagen and used for library construction
according to the manufacturer’s instructions (Roche Applied Sciences). These samples were
sequenced on four Roche/454 GS FLX instruments using Titanium chemistry, for a total of 72
runs.
Computational methods
This section describes the details of the pipeline to call SNPs for KB1 and other Bushmen
genomes from the sequence data produced by the Roche/454 GS-FLX sequencing instrument.
The first step was to partition hg18 (the human reference genome used here) into intervals that
would be uniquely mappable using reads of length 300 bp or more. The sequenced reads were
then mapped to hg18 and assigned to one of the intervals. Newbler was then run on the reads in
those intervals, and the SNPs were collected and transferred back to the original hg18
coordinates. After about 8X of the data was mapped, we examined the mapped intervals and
discarded intervals that showed indications of pileup. These steps are described in greater detail
below.
Single-coverage regions in hg18. The “single coverage” regions are intervals of hg18 that we
expect sequenced human reads to map to uniquely. These were determined by aligning hg18 to
itself with high stringency and finding the leftover intervals — those that did not align to some
other part of hg18. Specific alignment details appear below, but we were looking for alignments
of 300 bp or longer with at least 97% identity. Many identified repeats are uniquely mappable at
this identity level. Further, some recent low copy number segmental duplications are not
uniquely mappable at this level, even though they are not annotated as repeats in the human
genome.
Approximately 49,000 single-coverage regions were identified. These are the regions
between intervals that were parts of an hg18 self-alignment (also excluding regions with long
runs of Ns). Lengths ranged from 1.7Mb down to a single base. Note that while short regions
seem paradoxical — how can a one-base region be uniquely mappable? — in fact, this means
that any 300-base read containing this position should be uniquely mappable.
Note that reads can occasionally map outside of single-coverage regions, as it’s still
possible for a read to uniquely map within a region where a strong self-alignment exists. This
can happen in many ways, which are outside the scope of this document. Since our aim is to
place reads into groups to be separately assembled, this is not a problem.
Self-alignment details. Lastz, a pairwise aligner that is freely available at

33www.nature.com/nature
SUPPLEMENTARY INFORMATIONdoi: 10.1038/nature08795
33
http://www.bx.psu.edu/miller_lab, was used to perform the self-alignment of hg18, with the goal
of identifying all alignments with length ≥ 300 bases and identity ≥ 97%. This proved to be a
challenge because of the presence of repeats (and repeats could not be excluded from this
analysis). After some experimentation, we settled on a two-stage process using different scoring
in each stage. Further, we were able to improve runtime by splitting the genome into 50-Mb
chunks.
The first stage identified HSPs (high-scoring segment pairs, i.e., alignments without any
gaps) using lastz with the following parameters, then post-processing to discard HSPs shorter
than 100 bp. (Please see the lastz documentation for a more thorough explanation of these
parameters.)
--step=32 --seed=match13 --notransitions --match=1,5 --hspthreshold=85
--identity=97
Soft-masking (marking of repetitive sequences by lower-case letters) was removed from the
input sequences so that repeat regions were included in the alignments. A step of 32 was chosen
because our target alignment (300 bp, 97% identity) has at least 291 matches and no more than 9
mismatches. Assuming no indels, such an alignment has a probability of less than 1 in 1,000 of
failing to contain a 44-base exact match. With
--step=32 and --seed=match13 we will find any exact match of length 44 or longer. With
matches scoring 1 and mismatches –5, our target HSPs (97 matches and 3 mismatches) would
score 82. However, the threshold of 85 also allows shorter, higher-identity HSPs. These were
discarded using post-processing (before the second stage).
The second stage performs gapped alignment using the HSPs from the first stage. The
following lastz parameters were used, with additional post-processing to discard alignments
shorter than 300 bp.
--match=1,20 --gap=21,20 --ydrop=221 --gappedthreshold=102 --identity=97
Soft-masking was also removed in this stage. Here the mismatch scoring is much more stringent
than for HSPs, and gap scoring is set to be nearly the same as for mismatches. Ydrop is set so
that we will tolerate a run of about 10 mismatches. The target alignment (291 matches and 9
mismatches) would score 111 (the scoring threshold of 102 is thus a little lenient). Note that
using these parameters in the first stage would have required an HSP threshold so low that the
program would be overwhelmed by low-scoring HSPs.
The self-aligning intervals identified by this process were considered to be
indistinguishable regions. They were combined by union, also including any run of 100 or more
Ns in hg18. Intervals shorter than 500 bases were discarded, since these could possibly be
bridged by a read aligning to the two flanking regions. The complement of the resulting set of
intervals is the set of single-coverage intervals discussed in this report. There are 49,179 of these
regions, with an average length of 54,821 bases. In total, they cover 2,696,041,061 bases, or
94.3% of the non-N portion of hg18.
Mapping KB1 reads
Seventy-seven sequencing runs from KB1 were compared to hg18. This was 83,331,226

34www.nature.com/nature
doi: 10.1038/nature08795 SUPPLEMENTARY INFORMATION
34
trimmed reads comprising 29,165,432,509 bases (average length 350). The reads were aligned
using lastz, and fall into four classes: mappable (84.5%), aligned but not uniquely mappable
(5.4%), not alignable (9.7%), and uninformative (0.5%). (Uninformative reads are duplicates —
only one of each group of duplicate reads is processed). The mapped reads comprised
26,100,525,922 bases, which represent 9.1X coverage of hg18 (excluding runs of Ns).
Alignment was performed using lastz with the following parameters:
--step=15 --seed=match13 --notransitions --exact=18 --maxwordcount=6 \
--match=1,3 --gap=1,3 --ydrop=10 --gappedthreshold=18 --identity=97 --coverage=90 \
--ambiguousn
Soft-masking was removed, allowing reads to align to repeats. A word-count limit of 6
corresponded to removing roughly 10% of the seed-word positions from last’s internal table.
Mapping was then performed by collecting any alignments for a given read. A read with only a
single alignment, with identity ≥ 98%, was considered mappable. A read with more than one
alignment, but with one having identity ≥ 98% and at least 1.5% better than the second best, was
also considered mappable. There is a minor mistake here, in that any alignments with identity <
97% were discarded during the alignment stage. So it is possible that a read might have, say, one
alignment at 98% and another at 96.6%, which should not pass the mappability criteria but which
slips through as “mappable”.
Calling KB1 SNPs from the whole-genome data
Each single-coverage interval was assigned a segment of the human reference sequence,
consisting of the interval itself plus an additional 500 bp on each side to handle reads mapping at
the ends of the single-coverage interval. The reads mapping to that segment were collected and
the information about them extracted from the original SFF files. This included the complete
untrimmed sequence, the quality values, and the flowgram information. This data was then
combined to form an input SFF file, and supplied to Newbler as input. The SNP calls made by
Newbler were then transferred to their original hg18 coordinates and then filtered to call SNPs
only in the regions where we did not observe a pileup of reads.
Newbler details
This section describes the algorithm used by Newbler to call SNPs. The larger set of SNPs is
called the AllDiffs set and it attempts to enumerate all the differences between the reference and
the reads using less stringent filters and thresholds. For a SNP to be identified and reported, there
must be at least two non-duplicate reads that (1) show the difference, (2) have at least 5 bases on
both sides of the difference, and (3) have at most a few other isolated sequence differences in the
read. In addition, if the –e option is used to set an expected depth, there must be at least 5% of
that depth in differing reads. Finally, for single-base overcalls or undercalls to be reported, they
must have a flow signal distribution that differs from that of the reads matching the reference
(i.e., not all overcalls and undercalls are reported as SNPs). Once the SNP is identified, all reads
that fully span the difference location and have at least 5 additional flanking nucleotides on both
sides are used in reporting it.
Newbler designates a subset of these calls as High Confidence calls (HCDiffs). The
general rules for this subset are:

35www.nature.com/nature
SUPPLEMENTARY INFORMATIONdoi: 10.1038/nature08795
35
1) There must be at least 3 non-duplicate reads containing the non-reference nucleotide,
unless the –e option is specified, in which case at least 10% of the expected depth must
contain it.
2) There must be both forward and reverse reads showing the difference, unless there are at
least 5 reads with quality scores over 20 (or 30 if the difference involves a 5-mer or
higher).
3) If the difference is a single-base overcall or undercall, the reads with the non-reference
nucleotide must form the consensus of the sequenced reads (i.e., at that location, the
overall consensus must differ from the reference) and the signal distribution of the
differing reads must vary from the matching reads (and the number of bases in that
homopolymer of the reference).
Heterozygous vs. homozygous
SNP calls for KB1, NB1, MD8, TK1, and ABT were made from 454 data. We use a simple
metric, AAF (alternate allele frequency), to call a SNP heterozygous vs. homozygous. For all of
these samples, the SNP was called homozygous if the alternate allele frequency was greater than
or equal to 80%.
Adding exome-capture sequences to the whole-genome data for KB1
We compared the SNP calls from the whole-genome fragment (non-paired-end) sequences to
those from the exome-captured sequences, in order to validate the sequences and their
subsequent analyses. For KB1, we called 3,536,132 SNPs using 9.13X whole-genome fragment
sequences, and 122,392 SNPs using 16-fold exome sequences. 99,372 of the locations were
common between the two sets of SNP calls. The difference was largely related to the
heterozygosity of the location. We found that in some cases one set included a homozygous call,
whereas the other set included a heterozygous call, and this was usually due to read coverage at
the location.
Using Illumina to validate the KB1 SNP calls
We used 23.2-fold mapped Illumina whole-genome data to verify the 454 SNP calls. We used
MAQ with default parameters to call a liberal set of SNPs from the data. We also called a high-
confidence subset using single-end mapping quality scores and discarding abnormal pairs. We
required that a read have a minimum mapping quality of 10, the SNP location have a read depth
between 6 and 75, and the SNPs not be within 10 bp of an indel. Furthermore, we filtered to keep
only SNPs in regions that we deemed mappable using the 454 reads. We called 4,215,263 liberal
and 3,835,844 high-confidence SNPs from the Illumina data. 2,943,320 of the 3,594,898 SNP
calls made using 454 sequences were confirmed using those made from the Illumina sequences.
Further analysis showed that lack of coverage was the major reason for the discrepancies
between the calls from the two technologies. This was also the primary reason that we decided to
pool the 454 and Illumina SNP calls to create a single final set of SNPs for KB1.
Using genotyping data to validate the KB1 SNP calls
We used the forward strand output from BeadStudio and the actual strand of the alleles from
dbSNP to infer the genotypes on the genome-wide array. We filtered the genotype information
to remove indels, and sorted it into two separate sets: one for locations with reference sequence
matches and the other for the SNP calls. Then, we computed two separate intersections, using

36www.nature.com/nature
doi: 10.1038/nature08795 SUPPLEMENTARY INFORMATION
36
only the positions of the sequence SNPs intersecting the genotype SNPs and the sequence SNPs
intersecting the reference sequence matches. We computed the false-negative rate (0.09) by
taking the number of genotype SNP calls that were missed (not called) by the sequencing and
dividing this by the total number of genotype SNPs. The false-positive rate (0.0009) was
calculated by taking the number of sequence SNPs intersecting the reference sequence matches
divided by the number of reference sequence matches.
The final set of KB1 SNP calls
The following rules were used to pool the SNP calls to form the final set of KB1 SNPs.
1) All SNPs from the genotyping array were included.
2) A high-confidence SNP call from 454 sequence data was not included in the final set, if
any of the following was found to be true:
1. If the 454 call was a homozygous SNP and there was no evidence supporting the
variant allele in the uniquely mapped Illumina reads. This rule was only applied to
regions with more than 3 uniquely mapped Illumina reads.
2. If the 454 call wass a heterozygous SNP and there was no evidence supporting the
variant allele in the uniquely mapped Illumina reads. Only regions with an Illumina
coverage of 10 or greater were considered for this rule.
3) A high-confidence SNP call using the Illumina data was not included in the final set, if
any of the following was found to be true:
1. If the Illumina call was a homozygous SNP, coverage by 454 reads at that location
was greater than 3, and it was not called a SNP using 454 data.
2. If the Illumina call was a heterozygous SNP, coverage by 454 reads at that location
was 10 or greater, and it was not called a SNP using 454 data.
4) A SNP was included if it was called in the liberal SNP set using both 454 and Illumina
sequences.
5) All SNPs at locations with more than two alleles were discarded.
These rules were used to decide the locations that would be included in the final set of SNPs.
The genotype calls for the final set were made using the following rules:
1) If the location was present on the genome-wide array, the genotype call from the array
was selected.
2) If the location was not present on the genome-wide array, the genotype call for the
technology with the higher coverage was selected. If the number of reads from 454
exceeded the number of reads from Illumina at that location, the 454 call was accepted as
the consensus, and vice-versa.
Whole-genome SOLiD sequencing of ABT
The genome of ABT was sequenced to over 30-fold coverage using Applied Biosystems’ short-
read technology, SOLiD, including 50-base paired-ends of various insert lengths (2,713,797,283
50-base fragments; 120,825,147 25-base paired reads; 567,425,404 50-base paired reads).
Genomic libraries were constructed from blood-extracted DNA with an average insert size of 3-5

37www.nature.com/nature
SUPPLEMENTARY INFORMATIONdoi: 10.1038/nature08795
37
kb. A total of 4,379,849 SNPs were called using the SOLiD System Software for primary and
secondary analysis. Further filtering reduced the number of SNP calls to 3,624,334.
Whole-genome Illumina sequencing of ABT
We used 7.2-fold mapped Illumina data to verify the SOLiD SNP calls. Mapping and SNP
calling were performed as described above. We called 2,894,707 liberal and 2,040,551 high-
confidence SNPs from the Illumina data. 2,366,494 of the 3,624,334 SNP calls made using
SOLiD sequences were confirmed using those made from the Illumina sequences. As with KB1,
lack of coverage was the major reason for the discrepancies between the calls from the two
technologies.
Large-insert paired-end sequencing of KB1
Sixteen runs on the Roche/454 GS FLX platform were performed on large-insert paired-end
libraries. A total of 18.8 million reads and 6.4Gb were sequenced. 3.4% of the reads were
discarded as uninformative (i.e., an exact duplicate of another read; only one read per group of
duplicates was kept for coverage calculations). The number of duplicate reads varied from less
than 1% to 15% per run.
About one quarter (26.4%) of the reads did not have the linker present that separates the
two ends. In 12.2% of all cases the linker region was too close to one end (less than 18 bp) or
had a double linker (the latter in only about 0.1%). The remaining 61.3% were used for
assembling the data, computing clone coverage, and detecting copy-number variations. Our in-
house mapping algorithm (lastz) was able to map 37% more of he reads to the human reference
assembly than the Newbler software from the manufacturer.
An additional 5% of the reads were then filtered out due to their extreme predicted insert
size, either too short or too long (the shortest and longest 2.5% of the insert lengths). In total,
43.5% of the paired ends were successfully mapped and kept. The average insert length was
determined to be 10.6 kb. The inserts covered 86.6 Gb (clone coverage), which is 30.9 times the
number of bases sequenced (mappable genome size is 2.8 Gb). Insert sizes from a total of 19
different libraries were consistent with the following three distinct profiles: Eight runs had insert
size distribution of 12 kb average, 8 kb min, 18 kb max. Six runs had had 10 Kb average with 7K
min and 15K max insert size, while wo other runs had a 7 kb average with 5kb min and 13kb
max.

38www.nature.com/nature
doi: 10.1038/nature08795 SUPPLEMENTARY INFORMATION
38
Personal genomes used in this study but sequenced elsewhere
Genome Sequence Method;
Project
Craig Venter (JCVI)49 Sanger Dr. Venter's single-base variants from the file HuRef.InternalHuRef-NCBI.gff,
filtered to include only “method 1” variants (i.e., where the variant was kept in its
original form and not post-processed), and to exclude any variants that had N as
an allele. The J. Craig Venter Institute hosts a genome browser.
James Watson (CSHL)13 Roche/454 (FLX) These single-base variants came from the file watson_snp.gff.gz. Cold Spring
Harbor Lab hosts a genome browser.
Yoruba NA1850741 Illumina/Solexa Illumina released the read sequences to the NCBI Short Read Archive. Aakrosh
Ratan (see author list) mapped the sequence reads to the human reference
assembly and called single-base variants using MAQ.
YH (Han Chinese)50 YanHuang Project The YanHuang Project released these single-base variants from the genome of a
Han Chinese individual. The data are available from the YH database in the file
yhsnp_add.gff. The YanHuang Project hosts a genome browser.
SJK (Seong-Jin Kim;
Korean)51
Illumina Researchers at Gachon University of Medicine and Science (GUMS) and the
Korean Bioinformation Center (KOBIC) released these single-base variants from
the genome of Seong-Jin Kim. The data are available from KOBIC in the file
KOREF-solexa-snp-X30_Q40d4D100.gff.
NA12891 (CEU Trio Father),
NA12892 (CEU Trio Mother),
NA19240 (Yoruba YRI Trio
Daughter)
The 1000 Genomes
Project (unpublished)
Novel SNPs
ASNPisnormallylabeled“novel”ifithasnotpreviouslybeenpublished.Todetermine
whichSNPswerenovelinthegenomessequencedelsewhere,wehadtoaccountforthe
subsequentadditionofthoseSNPstocollectivedatabases.ThereforeweuseddbSNP
version126,whichpre‐datesthepersonalgenomes,insteadofamorerecentdbSNP
release.Wethentreatedallofthepersonalgenomessequencedelsewhereasifeachhad
beenpublishedaftertheothers.Thus,inthisstudy,“novel”meansthattheSNPisnotin
dbSNP126,anyoftheotherpersonalgenomeslistedinthetableabove,PhenCode52,the
EnvironmentalGenomeProject53,orENCODE54resequencing.Inthecaseofindels,any
overlapwithapolymorphicsitecalledintheotherdatasourcesledtoitscharacterization
asnotbeingnovel.Forinstance,a10‐bpdeletionnotseeninanyothergenomebut
overlappingasinglenucleotidechangeinsomeindividualmakesdoesnotqualifyasnovel.
Similarly,forsubstitutionsanewalleleatapreviously‐knownSNPlocationdoesnotcount
asnoveleither.
Figure 3A and the chromosome 17 hotspot
For the genome-wide SNP rates in the KB1 and ABT genomes, SNPs in each (tiled) 50-kb
window were counted, including those from six genomes obtained from other sources. The
counts for KB1 and ABT were divided by the average count for the other six to obtain a ratio of
over-enrichment for each window. Those ratios are plotted in Supplementary Figure 4.
For Figure 3A in the main paper we proceeded as follows. In non-overlapping 50-kb
windows across the autosomes, we determined the average number of KB1 SNPs per kilobase of
single-copy sequence (see above). We noted an unusually high frequency of SNPs in a 15-
window (750-kb) interval of chromosome 17, at positions 41,000,000-41,750,000 in the
coordinates of NCBI Build 36. Although nearby regions on both flanks contain near-identical
segmental duplications, the interval itself is essentially free of such duplications in both Build 36

39www.nature.com/nature
SUPPLEMENTARY INFORMATIONdoi: 10.1038/nature08795
39
and KB1.
To measure the statistical significance of this hotspot, we performed the following
randomization experiment. We ranked the autosomal windows by decreasing SNP rate,
discarding windows having less than 10 kb of single-copy sequence. A collection of windows
with the same SNP rate were re-ranked so that each was given the average of their original ranks.
Of the 52,341 remaining windows, those in the putative hotspot had ranks 410, 9780, 178, 347,
7740, 151, 164, 230, 398, 792, 631, 702, 1007, 3378, and 152, whose sum is 26,060. Starting
with the list of ranks (after re-ranking to handle identical SNP rates), we performed 100,000
randomizations of the list (using the so-called Fisher-Yates shuffle), and, in each case,
determined whether any 15 consecutive numbers (of the 52,341 shuffled ranks) had a sum of
26,060 or less. That condition was never met in the 100,000 simulated events, giving an
empirical p-value of less than 10-5
.
To enable direct comparison of SNP rates from several genomes, we computed the
autosome-wide average number of SNPs per single-copy kilobase for each genome. That is, we
computed the total number of SNPs in single-copy regions (of NCBI Build 36) and divided by
the number of single-copy kilobases (2,584,574). The resulting numbers are as follows:
KB1 0.9256
NB1 0.1312
ABT 1.3043
NA18507 0.9892
NA19240 1.3329
Watson 0.7706
Venter 1.1208
YH (Chinese) 1.1519
SJK (Korean) 1.2841
In the region of chromosome 17 pictured in Fig. 3A, we determined SNPs per single-copy
kilobase, then divided by that genome’s autosome-wide average.
Predicting which amino-acid changes may have functional consequences
Amino-acid changes are more likely to be deleterious if they occur in a functional site and 55
substitute an amino acid with different biochemical properties from the original. Several
computational tools use this principle to predict which protein polymorphisms are likely to be
detrimental. Another useful computational resource is MODBASE56
, a database providing
information about protein structure models, which help in predicting the structurally and
functionally important sites of a protein sequence. Here, we describe a pipeline that we use to
identify putative deleterious SNPs.
First, we use an in-house program named ModelFinder to identify putative functional
SNPs by using protein structure model information (also used in ref 48). Our assumption is that
SNPs within a modeled sequence have a higher likelihood of being deleterious, because the 3D
structure provides the protein with a particular functionality. ModelFinder uses amino-acid
sequence and SNP information as the input, locating the protein information for each SNP by
using the UCSC annotation database57
, and querying MODBASE to determine if the residue is
covered by a model structure. The model score and sequence identity with the model template
for the covered SNPs are also obtained. In addition, the phastCons58
score and Blosum6259
score
are obtained for these SNP sites, to measure the conservation level among 44 species and various
protein families. The residues with high conservation levels are expected to be more important
functionally. Subsequently, another program attempts to map these potentially deleterious SNPs

40www.nature.com/nature
doi: 10.1038/nature08795 SUPPLEMENTARY INFORMATION
40
to known disease-associated genes in the OMIM database. We combine these sources of
information to predict which observed amino-acid-changing SNPs are likely to have a functional
consequence. The following table indicates how many of the amino-acid-changing SNPs in each
of our five participants scored using these criteria.
# of putative functional
SNPs
# of putative functional SNPs with
phastCons>0.8
# of putative functional SNPs involved in
OMIM genes
# of
novel
SNPs # % in novel
SNPs # % in putative SNPs # % in putative SNPs
ABT 2923 851 29.11% 664 78.03% 519 60.99%
MD8 2559 705 27.55% 503 71.38% 456 64.68%
KB1 3592 912 25.39% 660 72.37% 565 61.95%
NB1 3096 828 26.74% 560 67.63% 502 60.63%
TK1 3116 865 27.76% 660 76.3% 546 63.12%
Validatingpredictedduplications
GenomicDNAfragmentsfromKB1andNA18507werelabeledandhybridizedagainsta
NimbleGengenome‐widetilingmicroarray(2.1millionHD2).Wealsodesignedacustom
array(12‐plex,135,000)targetedtowardregionsofpredictedcopy‐numberdifference.On
thetargetedarray,theprobeintensitiesfromapairofreverse‐labelingexperimentswere
averagedtogether.Targetedanalysiswasperformedforeachpredictedintervalgreater
than20kb.Themeanlog2intensitiesforeachintervalwerecomparedwiththesignals
fromasetofcontrolregionsusingasingle‐tailedunequal‐variancet‐test.Validationstatus
wasdeterminedusingafalsediscoveryratethresholdof0.0160.

41www.nature.com/nature
SUPPLEMENTARY INFORMATIONdoi: 10.1038/nature08795
41
Supplementary References
1 Westphal, E. O. J., in Current trends in linguistics (Mouton, The Hague, 1971), Vol. 7,
pp. 367. 2 Smith, A., Malherbe, C., Guenther, M. & Berens, P., The Bushmen of Southern Africa: a
foraging society in transition. (David Philip Publishers, Cape Town, 2004). 3 Oota, H. et al., Human mtDNA and Y-chromosome variation is correlated with matrilocal
versus patrilocal residence. Nat Genet 29 (1), 20 (2001). 4 Karafet, T. M. et al., New binary polymorphisms reshape and increase resolution of the
human Y chromosomal haplogroup tree. Genome Res 18 (5), 830 (2008). 5 Cruciani, F. et al., A back migration from Asia to sub-Saharan Africa is supported by
high-resolution analysis of human Y-chromosome haplotypes. Am J Hum Genet 70 (5),
1197 (2002). 6 Working Group of Indigenous Minorities in Southern Africa, WIMSA, Available at
http://www.wimsanet.org/news, (2009). 7 Patterson, N. et al., Genetic structure of a unique admixed population: implications for
medical research. Hum Mol Genet (2009). 8 Berniell-Lee, G. et al., Admixture and sexual bias in the population settlement of La
Reunion Island (Indian Ocean). Am J Phys Anthropol 136 (1), 100 (2008). 9 Coelho, M. et al., On the edge of Bantu expansions: mtDNA, Y chromosome and lactase
persistence genetic variation in southwestern Angola. BMC Evol Biol 9, 80 (2009). 10
Pilkington, M. M. et al., Contrasting signatures of population growth for mitochondrial
DNA and Y chromosomes among human populations in Africa. Mol Biol Evol 25 (3),
517 (2008). 11
Pearson, C. E., Nichol Edamura, K., and Cleary, J. D., Repeat instability: mechanisms of
dynamic mutations. Nat Rev Genet 6 (10), 729 (2005). 12
Garber, M. et al., Closing gaps in the human genome using sequencing by synthesis.
Genome Biol 10 (6), R60 (2009). 13
Wheeler, D. A. et al., The complete genome of an individual by massively parallel DNA
sequencing. Nature 452 (7189), 872 (2008). 14
Ingram, C. J. et al., Lactose digestion and the evolutionary genetics of lactase persistence.
Hum Genet 124 (6), 579 (2009). 15
Han, J. et al., A genome-wide association study identifies novel alleles associated with
hair color and skin pigmentation. PLoS Genet 4 (5), e1000074 (2008). 16
Nalls, M. A. et al., Admixture mapping of white cell count: genetic locus responsible for
lower white blood cell count in the Health ABC and Jackson Heart studies. Am J Hum
Genet 82 (1), 81 (2008). 17
Reich, D. et al., Reduced neutrophil count in people of African descent is due to a
regulatory variant in the Duffy antigen receptor for chemokines gene. PLoS Genet 5 (1),
e1000360 (2009). 18
Miller, L. H., Mason, S. J., Clyde, D. F., and McGinniss, M. H., The resistance factor to
Plasmodium vivax in blacks. The Duffy-blood-group genotype, FyFy. N Engl J Med 295
(6), 302 (1976). 19
He, W. et al., Duffy antigen receptor for chemokines mediates trans-infection of HIV-1
from red blood cells to target cells and affects HIV-AIDS susceptibility. Cell Host
Microbe 4 (1), 52 (2008).

42www.nature.com/nature
doi: 10.1038/nature08795 SUPPLEMENTARY INFORMATION
42
20 Langhi, D. M., Jr. and Bordin, J. O., Duffy blood group and malaria. Hematology 11 (5),
389 (2006). 21
Escalante, A. A. et al., A monkey's tale: the origin of Plasmodium vivax as a human
malaria parasite. Proc Natl Acad Sci U S A 102 (6), 1980 (2005). 22
Sheng, J. et al., Characterization of human CYP2G genes: widespread loss-of-function
mutations and genetic polymorphism. Pharmacogenetics 10 (8), 667 (2000). 23
Itsara, A. et al., Population analysis of large copy number variants and hotspots of human
genetic disease. Am J Hum Genet 84 (2), 148 (2009). 24
Hoeg, J. M., Demosky, S. J., Jr., Pescovitz, O. H., and Brewer, H. B., Jr., Cholesteryl
ester storage disease and Wolman disease: phenotypic variants of lysosomal acid
cholesteryl ester hydrolase deficiency. Am J Hum Genet 36 (6), 1190 (1984). 25
Zschenker, O. et al., Characterization of lysosomal acid lipase mutations in the signal
peptide and mature polypeptide region causing Wolman disease. J Lipid Res 42 (7), 1033
(2001). 26
Wiebusch, H. et al., A novel missense mutation (Gly2Arg) in the human lysosomal acid
lipase gene is found in individuals with and without cholesterol ester storage disease
(CESD). Clin Genet 50 (2), 106 (1996). 27
Lalueza-Fox, C. et al., Bitter taste perception in Neanderthals through the analysis of the
TAS2R38 gene. Biol Lett (2009). 28
Wooding, S. et al., Independent evolution of bitter-taste sensitivity in humans and
chimpanzees. Nature 440 (7086), 930 (2006). 29
Dickson, R. C., The normal hearing of Bantu and Bushmen. A pilot study. J Laryngol
Otol 82 (6), 505 (1968). 30
Jarvis, J. F. and Van Heerden, H. G., The acuity of hearing in the Kalahari Bushmen . A
pilot survey. J Laryngol Otol 81 (1), 63 (1967). 31
Bork, J. M. et al., Usher syndrome 1D and nonsyndromic autosomal recessive deafness
DFNB12 are caused by allelic mutations of the novel cadherin-like gene CDH23. Am J
Hum Genet 68 (1), 26 (2001). 32
Eudy, J. D. et al., Mutation of a gene encoding a protein with extracellular matrix motifs
in Usher syndrome type IIa. Science 280 (5370), 1753 (1998). 33
Wood, E. T. et al., Contrasting patterns of Y chromosome and mtDNA variation in
Africa: evidence for sex-biased demographic processes. Eur J Hum Genet 13 (7), 867
(2005). 34
International Society of Genealogy Y-DNA Haplogroup Tree, Available at
http://www.isogg.org/tree/index09.html, (2009). 35
Pruitt, K. D. et al., The consensus coding sequence (CCDS) project: Identifying a
common protein-coding gene set for the human and mouse genomes. Genome Res 19 (7),
1316 (2009). 36
McDougall, I., Brown, F. H., and Fleagle, J. G., Stratigraphic placement and age of
modern humans from Kibish, Ethiopia. Nature 433 (7027), 733 (2005). 37
Noonan, J. P. et al., Sequencing and analysis of Neanderthal genomic DNA. Science 314
(5802), 1113 (2006). 38
Gonder, M. K. et al., Whole-mtDNA genome sequence analysis of ancient African
lineages. Mol Biol Evol 24 (3), 757 (2007). 39
Green, R. E. et al., A complete Neandertal mitochondrial genome sequence determined
by high-throughput sequencing. Cell 134 (3), 416 (2008).

43www.nature.com/nature
SUPPLEMENTARY INFORMATIONdoi: 10.1038/nature08795
43
40 Briggs, A. W. et al., Targeted retrieval and analysis of five Neandertal mtDNA genomes.
Science 325 (5938), 318 (2009). 41
Bentley, D. R. et al., Accurate whole human genome sequencing using reversible
terminator chemistry. Nature 456 (7218), 53 (2008). 42
Salas, A. et al., The making of the African mtDNA landscape. Am J Hum Genet 71 (5),
1082 (2002). 43
Caswell, J. L. et al., Analysis of chimpanzee history based on genome sequence
alignments. PLoS Genet 4 (4), e1000057 (2008). 44
Albert, T. J. et al., Direct selection of human genomic loci by microarray hybridization.
Nat Methods 4 (11), 903 (2007). 45
Okou, D. T. et al., Microarray-based genomic selection for high-throughput
resequencing. Nat Methods 4 (11), 907 (2007). 46
Herman, D. S. et al., Filter-based hybridization capture of subgenomes enables
resequencing and copy-number detection. Nat Methods 6 (7), 507 (2009). 47
Margulies, M. et al., Genome sequencing in microfabricated high-density picolitre
reactors. Nature 437 (7057), 376 (2005). 48
Miller, W. et al., Sequencing the nuclear genome of the extinct woolly mammoth. Nature
456 (7220), 387 (2008). 49
Levy, S. et al., The diploid genome sequence of an individual human. PLoS Biol 5 (10),
e254 (2007). 50
Wang, J. et al., The diploid genome sequence of an Asian individual. Nature 456 (7218),
60 (2008). 51
Ahn, S. M. et al., The first Korean genome sequence and analysis: full genome
sequencing for a socio-ethnic group. Genome Res 19 (9), 1622 (2009). 52
Giardine, B. et al., PhenCode: connecting ENCODE data with mutations and phenotype.
Hum Mutat 28 (6), 554 (2007). 53
National Institute of Environmental Health Sciences' Environmental Genome Project,
Available at http://egp.gs.washington.edu, (2009). 54
International HapMap Project: ENCODE Data, Available at
http://www.hapmap.org/downloads/encode1.html.en#Reseq, (2009). 55
Sunyaev, S., Ramensky, V., and Bork, P., Towards a structural basis of human non-
synonymous single nucleotide polymorphisms. Trends Genet 16 (5), 198 (2000). 56
Pieper, U. et al., MODBASE: a database of annotated comparative protein structure
models and associated resources. Nucleic Acids Res 34 (Database issue), D291 (2006). 57
Kuhn, R. M. et al., The UCSC genome browser database: update 2007. Nucleic Acids Res
35 (Database issue), D668 (2007). 58
Siepel, A. et al., Evolutionarily conserved elements in vertebrate, insect, worm, and yeast
genomes. Genome Res 15 (8), 1034 (2005). 59
Henikoff, S. and Henikoff, J. G., Amino acid substitution matrices from protein blocks.
Proc Natl Acad Sci U S A 89 (22), 10915 (1992). 60
Storey, J. D. and Tibshirani, R., Statistical significance for genomewide studies. Proc
Natl Acad Sci U S A 100 (16), 9440 (2003).