supplementary information - nature bar, 25m.µ associated video, supplementary video 9....
TRANSCRIPT

W W W. N A T U R E . C O M / N A T U R E | 1
SUPPLEMENTARY INFORMATIONdoi:10.1038/nature12107
Supplementary Figure 1. CLARITY preserves GFP and TdTomato signals. (a) 3D rendering of a 1mm-thick Thy1-EGFP M line mouse brain block processed by CLARITY (Bregma -1.6 ->-2.6) showing distribution of EGFP expressing neurons and projections. Scale bar, 1mm. (b) 3D rendering of a 1mm-thick mouse coronal block of PV-Cre mouse line (B6;129P2-Pvalbtm1(cre)Arbr/J) crossed with Tdtomato reporter line (B6;129S6-Gt(ROSA)26Sortm9(CAG-tdTomato)Hze/J). Scale bar, 1mm. (c) Maximum projection of 300µm-volume of the hippocampus in a showing EGFP-expressing neurons and their neurites. Scale bar, 50 µm. Associated video, Supplementary Video 1. (d) High resolution optical section from the tissue in b showing Tdtomato-expressing neurons in the cortex. Scale bar, 25 µm.
SUPPLEMENTARY INFORMATION
2 | W W W. N A T U R E . C O M / N A T U R E
RESEARCH
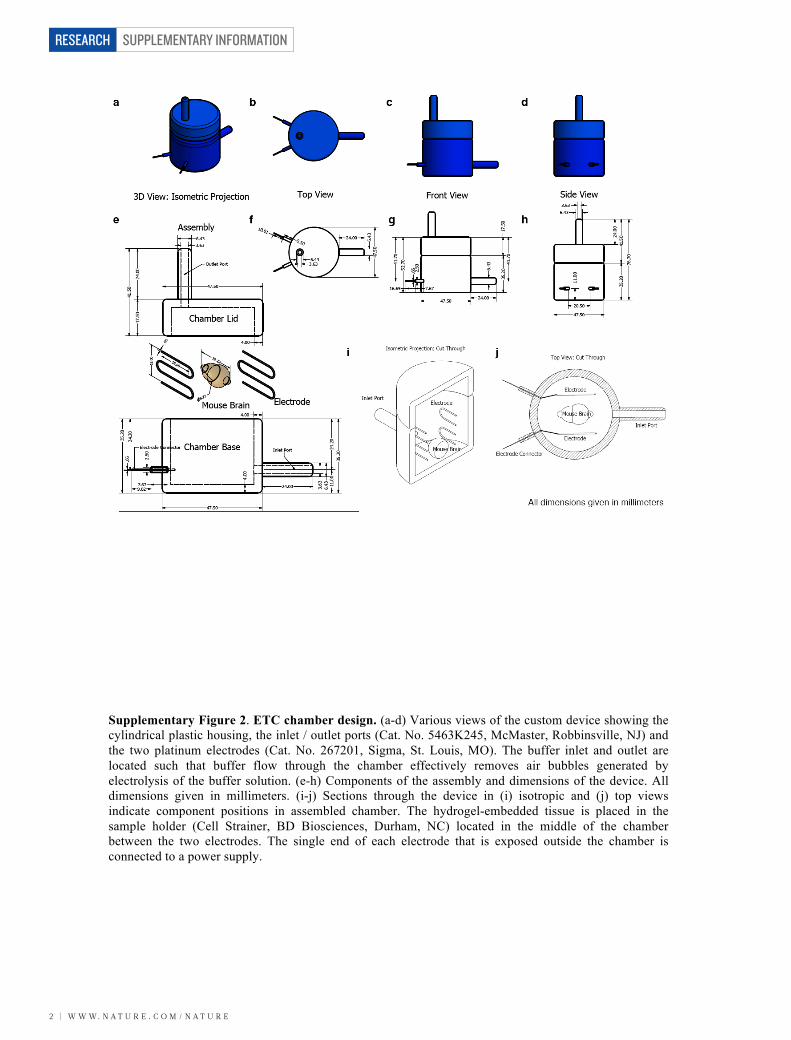
Supplementary Figure 2. ETC chamber design. (a-d) Various views of the custom device showing the cylindrical plastic housing, the inlet / outlet ports (Cat. No. 5463K245, McMaster, Robbinsville, NJ) and the two platinum electrodes (Cat. No. 267201, Sigma, St. Louis, MO). The buffer inlet and outlet are located such that buffer flow through the chamber effectively removes air bubbles generated by electrolysis of the buffer solution. (e-h) Components of the assembly and dimensions of the device. All dimensions given in millimeters. (i-j) Sections through the device in (i) isotropic and (j) top views indicate component positions in assembled chamber. The hydrogel-embedded tissue is placed in the sample holder (Cell Strainer, BD Biosciences, Durham, NC) located in the middle of the chamber between the two electrodes. The single end of each electrode that is exposed outside the chamber is connected to a power supply.

W W W. N A T U R E . C O M / N A T U R E | 3
SUPPLEMENTARY INFORMATION RESEARCH
Supplementary Figure 3. Optical tissue clearing of intact adult mouse brain using Focusclear or glycerol. (a) Image of PFA-fixed / hydrogel embedded / non-ETC cleared mouse brain (four weeks old) incubated in Focusclear for two days at room temperature. (b) The same mouse brain shown in a incubated in Focusclear for eight days at room temperature. (c) Image of PFA-fixed / hydrogel embedded / non-ETC cleared mouse brain (four weeks old) incubated in 85% glycerol for four days at 37°C. (d) Image of PFA-fixed / hydrogel embedded / ETC cleared mouse brain (four weeks old) incubated in 85% glycerol for two days at room temperature.
SUPPLEMENTARY INFORMATION
4 | W W W. N A T U R E . C O M / N A T U R E
RESEARCH
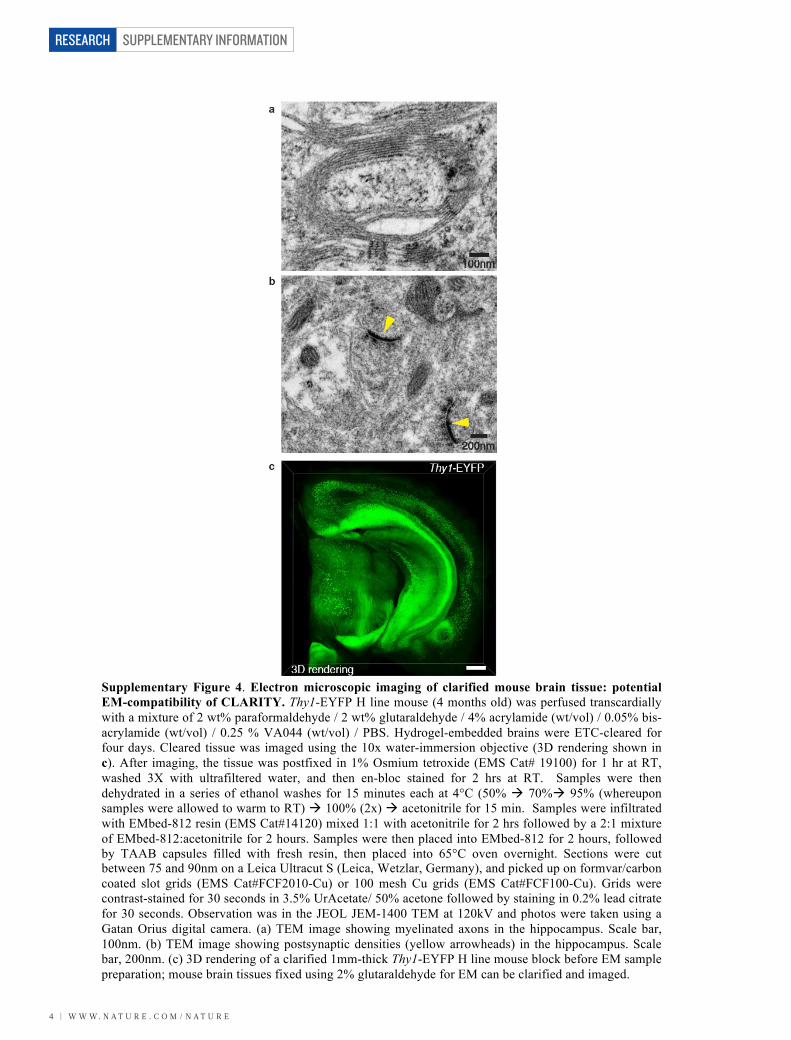
Supplementary Figure 4. Electron microscopic imaging of clarified mouse brain tissue: potential EM-compatibility of CLARITY. Thy1-EYFP H line mouse (4 months old) was perfused transcardially with a mixture of 2 wt% paraformaldehyde / 2 wt% glutaraldehyde / 4% acrylamide (wt/vol) / 0.05% bis-acrylamide (wt/vol) / 0.25 % VA044 (wt/vol) / PBS. Hydrogel-embedded brains were ETC-cleared for four days. Cleared tissue was imaged using the 10x water-immersion objective (3D rendering shown in c). After imaging, the tissue was postfixed in 1% Osmium tetroxide (EMS Cat# 19100) for 1 hr at RT, washed 3X with ultrafiltered water, and then en-bloc stained for 2 hrs at RT. Samples were then dehydrated in a series of ethanol washes for 15 minutes each at 4°C (50% à 70%à 95% (whereupon samples were allowed to warm to RT) à 100% (2x) à acetonitrile for 15 min. Samples were infiltrated with EMbed-812 resin (EMS Cat#14120) mixed 1:1 with acetonitrile for 2 hrs followed by a 2:1 mixture of EMbed-812:acetonitrile for 2 hours. Samples were then placed into EMbed-812 for 2 hours, followed by TAAB capsules filled with fresh resin, then placed into 65°C oven overnight. Sections were cut between 75 and 90nm on a Leica Ultracut S (Leica, Wetzlar, Germany), and picked up on formvar/carbon coated slot grids (EMS Cat#FCF2010-Cu) or 100 mesh Cu grids (EMS Cat#FCF100-Cu). Grids were contrast-stained for 30 seconds in 3.5% UrAcetate/ 50% acetone followed by staining in 0.2% lead citrate for 30 seconds. Observation was in the JEOL JEM-1400 TEM at 120kV and photos were taken using a Gatan Orius digital camera. (a) TEM image showing myelinated axons in the hippocampus. Scale bar, 100nm. (b) TEM image showing postsynaptic densities (yellow arrowheads) in the hippocampus. Scale bar, 200nm. (c) 3D rendering of a clarified 1mm-thick Thy1-EYFP H line mouse block before EM sample preparation; mouse brain tissues fixed using 2% glutaraldehyde for EM can be clarified and imaged.

W W W. N A T U R E . C O M / N A T U R E | 5
SUPPLEMENTARY INFORMATION RESEARCH
Supplementary Figure 5. Whole mouse brain molecular phenotyping. (a) 3D immunohistological visualization of TH-positive neurons and their fibers in the intact mouse brain. The intact brain was ETC-treated for three days and stained for six weeks: primary (2 weeks) – wash (1 week) – secondary (2 weeks) – wash (1 week), and imaged 2500 µm from ventral side using the 10x water immersion objective. Scale bar, 700 µm. (b-d) Optical sections at different depths. Note that TH-positive neurons are well labeled and clearly visible even at 2500 µm-deep in the intact brain. CPu, caudate putamen; PO, preoptic nucleus; VTA, ventral tegmental area; SNR, substantia nigra; RR, retrorubral nucleus; DR, dorsal raphe; Scale bar, 100µm. Associated video, Supplementary Video 7.
SUPPLEMENTARY INFORMATION
6 | W W W. N A T U R E . C O M / N A T U R E
RESEARCH
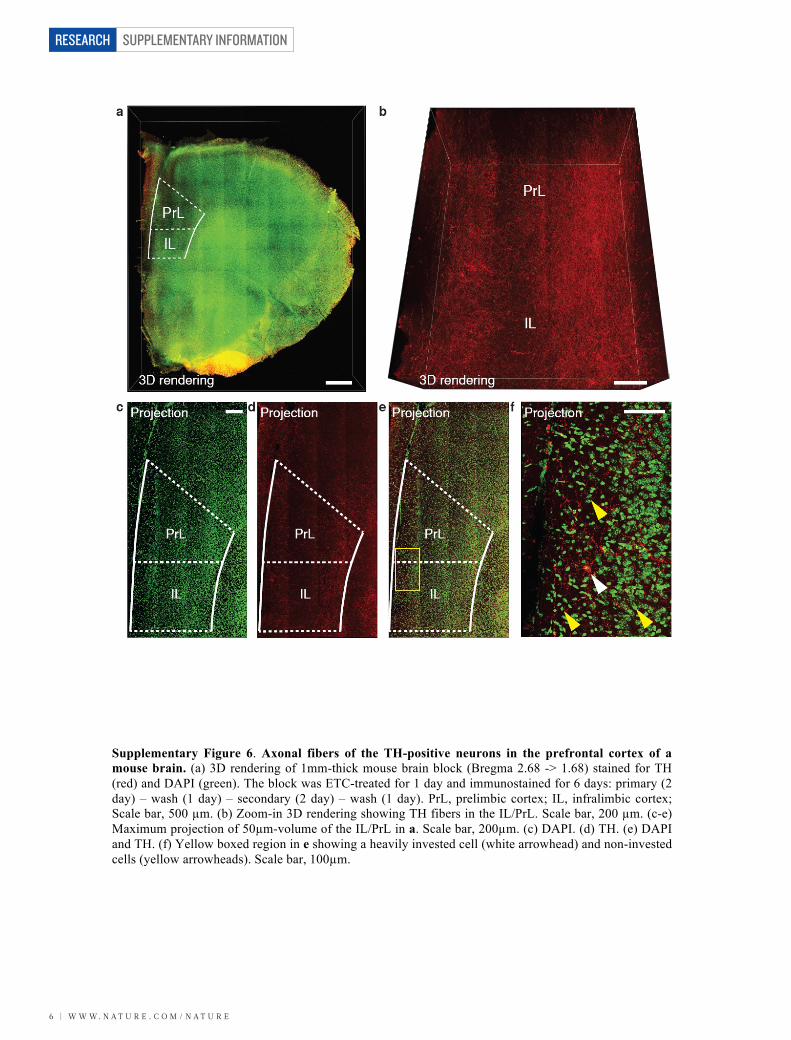
Supplementary Figure 6. Axonal fibers of the TH-positive neurons in the prefrontal cortex of a mouse brain. (a) 3D rendering of 1mm-thick mouse brain block (Bregma 2.68 -> 1.68) stained for TH (red) and DAPI (green). The block was ETC-treated for 1 day and immunostained for 6 days: primary (2 day) – wash (1 day) – secondary (2 day) – wash (1 day). PrL, prelimbic cortex; IL, infralimbic cortex; Scale bar, 500 µm. (b) Zoom-in 3D rendering showing TH fibers in the IL/PrL. Scale bar, 200 µm. (c-e) Maximum projection of 50µm-volume of the IL/PrL in a. Scale bar, 200µm. (c) DAPI. (d) TH. (e) DAPI and TH. (f) Yellow boxed region in e showing a heavily invested cell (white arrowhead) and non-invested cells (yellow arrowheads). Scale bar, 100µm.

W W W. N A T U R E . C O M / N A T U R E | 7
SUPPLEMENTARY INFORMATION RESEARCH
Supplementary Figure 7. Axonal fibers of the TH-positive neurons in the nucleus accumbens and striatum of a mouse brain. (a) Maximum projection of 20µm-volume of the CPu in Fig. 3j. The 1mm-thick mouse brain block (Bregma 1.10 -> 0.10) was ETC-treated for 1 day and immunostained for 6 days: primary (2 day) – wash (1 day) – secondary (2 day) – wash (1 day). CPu, caudate putamen; aca, anterior commissure; NAc, nucleus accumbens; Scale bar, 50µm. TH (red) and DAPI (green) (b) Optical section of the CPu in a showing cells massively invested by TH fibers. Scale bar, 50µm.

SUPPLEMENTARY INFORMATION
8 | W W W. N A T U R E . C O M / N A T U R E
RESEARCH
Supplementary Figure 8. Axonal fibers of TH-positive neurons in amygdala of mouse brain. (a-d) A 1mm-thick mouse brain block (Bregma -1.46. -> -2.46) was ETC-treated for 1 day and immunostained for six days: primary (2 day) – wash (1day) – secondary (2day) – wash (1day). (a-b) 3D rendering of the tissue stained for TH (red) and DAPI (blue). BLA, basolateral amygdaloid nucleus; CeA, central amygdale; Pir, piriform cortex; Scale bar, 300 µm. (b) TH only. (c-d) Maximum projection of 100µm-volume in a. Scale bar, 200µm. (d) TH only. Associated video, Supplementary Video 8.

W W W. N A T U R E . C O M / N A T U R E | 9
SUPPLEMENTARY INFORMATION RESEARCH
Supplementary Figure 9. Average immunofluorescence cross-section of PSD-95 puncta at different depth (0-200 µm, 20 µm interval). The average fluorescent intensity of PSD-95 puncta in clarified tissue was estimated at each depth by applying a circular hough transform to the gradient field of the PSD-95 images (custom Matlab software). This located the center of all puncta with radii ranging from 114 nm to 684 nm (N between 31 and 108). The centers were aligned to compute the average puncta at each depth and the cross-section and the full width at half maximum was calculated (shown in Fig. 3g).

SUPPLEMENTARY INFORMATION
1 0 | W W W. N A T U R E . C O M / N A T U R E
RESEARCH
Supplementary Figure 10. Average PSD-95 puncta at different depth (0-200 µm, 20 µm interval). Scale bar, 200µm. The method described in Supplementary Figure 8 was used.
W W W. N A T U R E . C O M / N A T U R E | 1 1
SUPPLEMENTARY INFORMATION RESEARCH
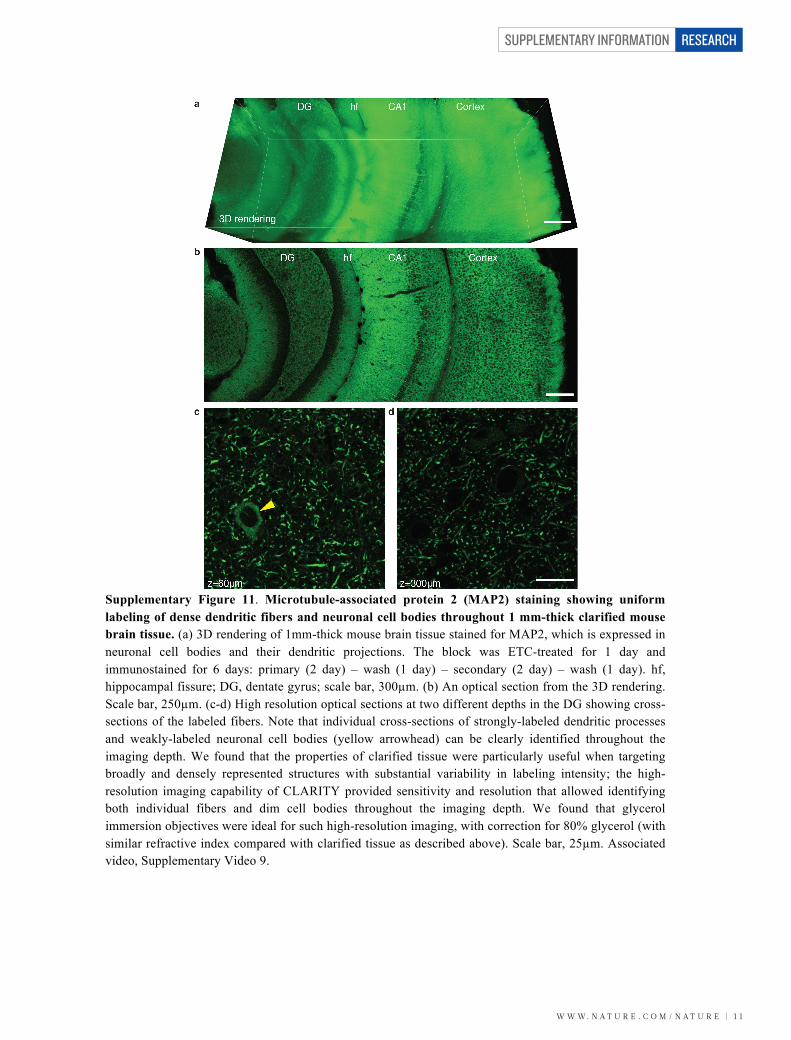
Supplementary Figure 11. Microtubule-associated protein 2 (MAP2) staining showing uniform labeling of dense dendritic fibers and neuronal cell bodies throughout 1 mm-thick clarified mouse brain tissue. (a) 3D rendering of 1mm-thick mouse brain tissue stained for MAP2, which is expressed in neuronal cell bodies and their dendritic projections. The block was ETC-treated for 1 day and immunostained for 6 days: primary (2 day) – wash (1 day) – secondary (2 day) – wash (1 day). hf, hippocampal fissure; DG, dentate gyrus; scale bar, 300µm. (b) An optical section from the 3D rendering. Scale bar, 250µm. (c-d) High resolution optical sections at two different depths in the DG showing cross-sections of the labeled fibers. Note that individual cross-sections of strongly-labeled dendritic processes and weakly-labeled neuronal cell bodies (yellow arrowhead) can be clearly identified throughout the imaging depth. We found that the properties of clarified tissue were particularly useful when targeting broadly and densely represented structures with substantial variability in labeling intensity; the high-resolution imaging capability of CLARITY provided sensitivity and resolution that allowed identifying both individual fibers and dim cell bodies throughout the imaging depth. We found that glycerol immersion objectives were ideal for such high-resolution imaging, with correction for 80% glycerol (with similar refractive index compared with clarified tissue as described above). Scale bar, 25µm. Associated video, Supplementary Video 9.
SUPPLEMENTARY INFORMATION
1 2 | W W W. N A T U R E . C O M / N A T U R E
RESEARCH
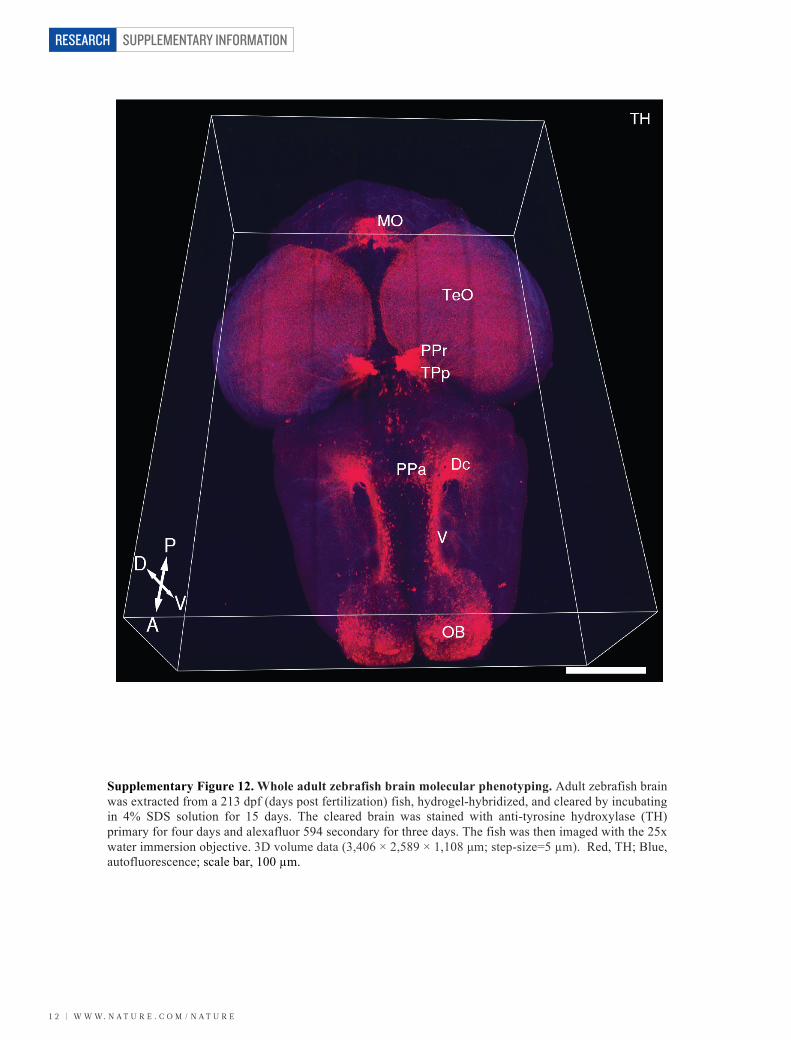
Supplementary Figure 12. Whole adult zebrafish brain molecular phenotyping. Adult zebrafish brain was extracted from a 213 dpf (days post fertilization) fish, hydrogel-hybridized, and cleared by incubating in 4% SDS solution for 15 days. The cleared brain was stained with anti-tyrosine hydroxylase (TH) primary for four days and alexafluor 594 secondary for three days. The fish was then imaged with the 25x water immersion objective. 3D volume data (3,406 × 2,589 × 1,108 µm; step-size=5 µm). Red, TH; Blue, autofluorescence; scale bar, 100 µm.

W W W. N A T U R E . C O M / N A T U R E | 1 3
SUPPLEMENTARY INFORMATION RESEARCH
Supplementary Figure 13. Traced PV-positive neurons in neocortex: autism case. A 500 µm-thick intact block of frontal lobe (BA 10) of postmortem human brain (autism case, #AN13961; age, 7 years; sex, male; PMI, 25; storage, 82 months in 10% formalin at room temperature) was ETC-treated for 1 day and immunostained for parvalbumin (PV) for 3 days: primary (1 day) – wash (0.5 day) – secondary (1 day) – wash (0.5 day). The stained block was imaged using the 25x water immersion objective. Neurons were selected randomly with the stipulation that the cell body be located in the middle 125 µm of the block, and traced in Imaris software. (a) Top view showing cortical laminar structure and traced PV-positive neurons. PV, red; scale bar, 200 µm. (b) Traced neurons only (top view) showing relative positions of the neurons (1-13) in the cortical lamina. Number of iso- or hetero-neuronal dendritic bridges for each neuron can be found in Supplementary Table 1. (c) Side view. (d) Side view, traced neurons only.

SUPPLEMENTARY INFORMATION
1 4 | W W W. N A T U R E . C O M / N A T U R E
RESEARCH
Supplementary Figure 14. Traced PV-positive neurons in neocortex: control brain. A 500 µm-thick intact block of frontal lobe (BA 10) of postmortem human brain (typical control case for #AN13961 shown in Supplementary Fig. 12, #AN10251; age, 10 years; sex, male; PMI, 19.83) was ETC-cleared for 1 day and immunostained for parvalbumin (PV) for 3 days: primary (1 day) – wash (0.5 day) – secondary (1 day) – wash (0.5 day). The stained block was imaged using the 25x water immersion objective. Neurons were selected randomly with the stipulation that the cell body be located in the middle 125 µm of the block, and traced in Imaris software. (a) Top view showing cortical laminar structure and traced PV-positive neurons. PV, red; scale bar, 200 µm. (b) The traced neurons only (top view) showing relative positions of neurons (1-8) in the cortical lamina. Number of iso- or hetero-neuronal dendritic bridges for each neuron can be found in Supplementary Table 1. (c) Side view. (d) Side view, traced neurons only.
W W W. N A T U R E . C O M / N A T U R E | 1 5
SUPPLEMENTARY INFORMATION RESEARCH
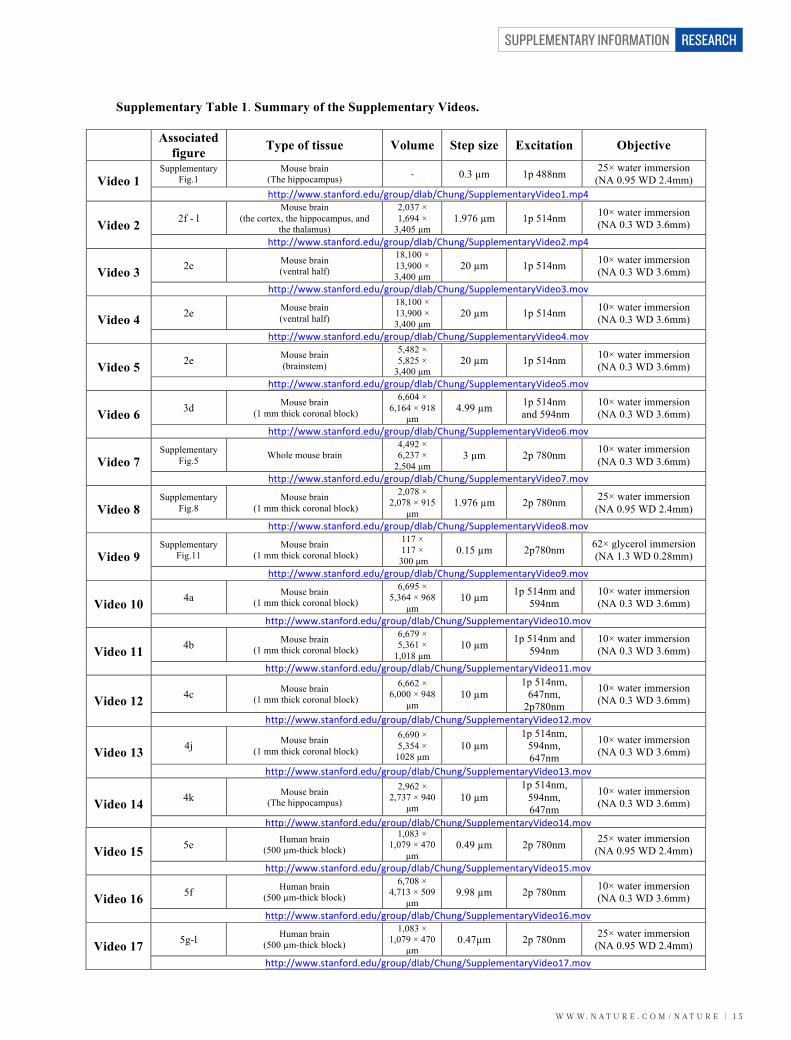
Supplementary Table 1. Summary of the Supplementary Videos.
Associated figure Type of tissue Volume Step size Excitation Objective
Video 1 Supplementary
Fig.1 Mouse brain
(The hippocampus) - 0.3 µm 1p 488nm 25× water immersion (NA 0.95 WD 2.4mm)
http://www.stanford.edu/group/dlab/Chung/SupplementaryVideo1.mp4
Video 2 2f - l Mouse brain
(the cortex, the hippocampus, and the thalamus)
2,037 × 1,694 ×
3,405 µm 1.976 µm 1p 514nm 10× water immersion
(NA 0.3 WD 3.6mm) http://www.stanford.edu/group/dlab/Chung/SupplementaryVideo2.mp4
Video 3 2e Mouse brain (ventral half)
18,100 × 13,900 × 3,400 µm
20 µm 1p 514nm 10× water immersion (NA 0.3 WD 3.6mm)
http://www.stanford.edu/group/dlab/Chung/SupplementaryVideo3.mov
Video 4 2e Mouse brain (ventral half)
18,100 × 13,900 × 3,400 µm
20 µm 1p 514nm 10× water immersion (NA 0.3 WD 3.6mm)
http://www.stanford.edu/group/dlab/Chung/SupplementaryVideo4.mov
Video 5 2e Mouse brain (brainstem)
5,482 × 5,825 ×
3,400 µm 20 µm 1p 514nm 10× water immersion
(NA 0.3 WD 3.6mm) http://www.stanford.edu/group/dlab/Chung/SupplementaryVideo5.mov
Video 6 3d Mouse brain (1 mm thick coronal block)
6,604 × 6,164 × 918
µm 4.99 µm 1p 514nm
and 594nm 10× water immersion (NA 0.3 WD 3.6mm)
http://www.stanford.edu/group/dlab/Chung/SupplementaryVideo6.mov
Video 7 Supplementary
Fig.5 Whole mouse brain 4,492 × 6,237 ×
2,504 µm 3 µm 2p 780nm 10× water immersion
(NA 0.3 WD 3.6mm) http://www.stanford.edu/group/dlab/Chung/SupplementaryVideo7.mov
Video 8 Supplementary
Fig.8 Mouse brain
(1 mm thick coronal block)
2,078 × 2,078 × 915
µm 1.976 µm 2p 780nm 25× water immersion
(NA 0.95 WD 2.4mm) http://www.stanford.edu/group/dlab/Chung/SupplementaryVideo8.mov
Video 9 Supplementary
Fig.11 Mouse brain
(1 mm thick coronal block)
117 × 117 ×
300 µm 0.15 µm 2p780nm 62× glycerol immersion
(NA 1.3 WD 0.28mm) http://www.stanford.edu/group/dlab/Chung/SupplementaryVideo9.mov
Video 10 4a Mouse brain (1 mm thick coronal block)
6,695 × 5,364 × 968
µm 10 µm 1p 514nm and
594nm 10× water immersion (NA 0.3 WD 3.6mm)
http://www.stanford.edu/group/dlab/Chung/SupplementaryVideo10.mov
Video 11 4b Mouse brain (1 mm thick coronal block)
6,679 × 5,361 ×
1,018 µm 10 µm 1p 514nm and
594nm 10× water immersion (NA 0.3 WD 3.6mm)
http://www.stanford.edu/group/dlab/Chung/SupplementaryVideo11.mov
Video 12 4c Mouse brain (1 mm thick coronal block)
6,662 × 6,000 × 948
µm 10 µm
1p 514nm, 647nm,
2p780nm
10× water immersion (NA 0.3 WD 3.6mm)
http://www.stanford.edu/group/dlab/Chung/SupplementaryVideo12.mov
Video 13 4j Mouse brain (1 mm thick coronal block)
6,690 × 5,354 ×
1028 µm 10 µm
1p 514nm, 594nm, 647nm
10× water immersion (NA 0.3 WD 3.6mm)
http://www.stanford.edu/group/dlab/Chung/SupplementaryVideo13.mov
Video 14 4k Mouse brain (The hippocampus)
2,962 × 2,737 × 940
µm 10 µm
1p 514nm, 594nm, 647nm
10× water immersion (NA 0.3 WD 3.6mm)
http://www.stanford.edu/group/dlab/Chung/SupplementaryVideo14.mov
Associated figure Type of tissue Volume Step size Excitation Objective
Video 15 5e Human brain (500 µm-thick block)
1,083 × 1,079 × 470
µm 0.49 µm 2p 780nm 25× water immersion
(NA 0.95 WD 2.4mm) http://www.stanford.edu/group/dlab/Chung/SupplementaryVideo15.mov
Video 16 5f Human brain (500 µm-thick block)
6,708 × 4,713 × 509
µm 9.98 µm 2p 780nm 10× water immersion
(NA 0.3 WD 3.6mm) http://www.stanford.edu/group/dlab/Chung/SupplementaryVideo16.mov
Video 17 5g-l Human brain (500 µm-thick block)
1,083 × 1,079 × 470
µm 0.47µm 2p 780nm 25× water immersion
(NA 0.95 WD 2.4mm) http://www.stanford.edu/group/dlab/Chung/SupplementaryVideo17.mov
SUPPLEMENTARY INFORMATION
1 6 | W W W. N A T U R E . C O M / N A T U R E
RESEARCH
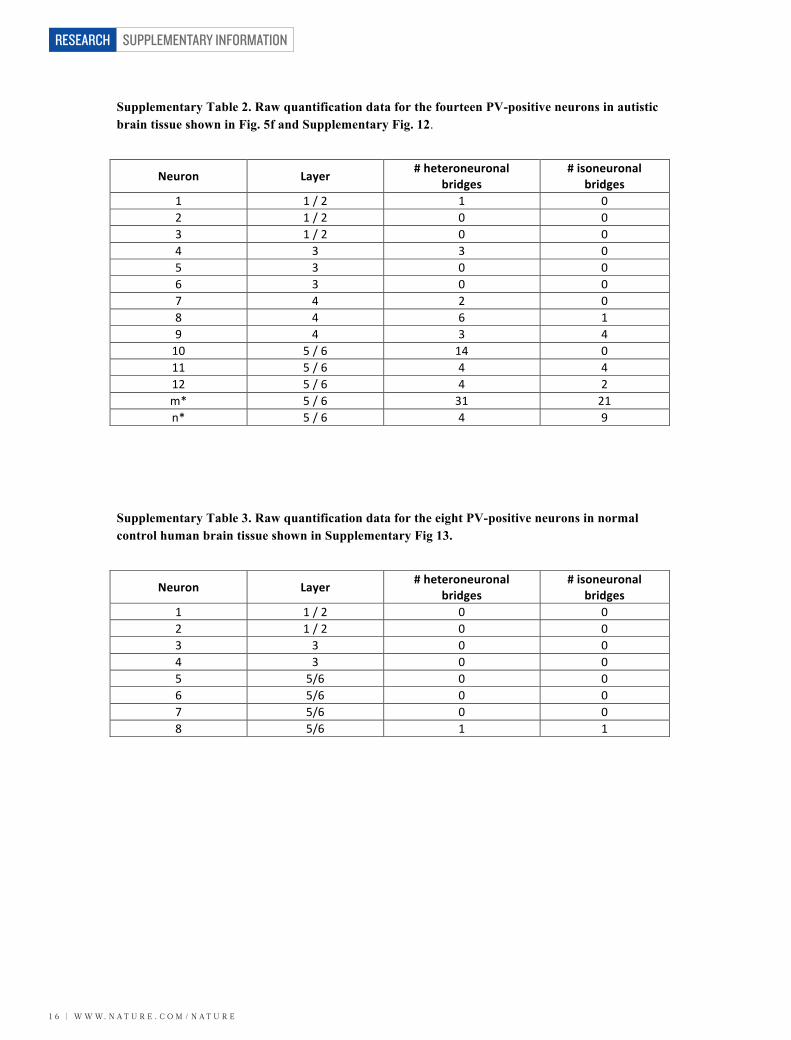
Supplementary Table 2. Raw quantification data for the fourteen PV-positive neurons in autistic brain tissue shown in Fig. 5f and Supplementary Fig. 12.
Supplementary Table 3. Raw quantification data for the eight PV-positive neurons in normal control human brain tissue shown in Supplementary Fig 13.
Neuron Layer # heteroneuronal bridges
# isoneuronal bridges
1 1 / 2 1 0 2 1 / 2 0 0 3 1 / 2 0 0 4 3 3 0 5 3 0 0 6 3 0 0 7 4 2 0 8 4 6 1 9 4 3 4 10 5 / 6 14 0 11 5 / 6 4 4 12 5 / 6 4 2 m* 5 / 6 31 21 n* 5 / 6 4 9
Neuron Layer # heteroneuronal bridges
# isoneuronal bridges
1 1 / 2 0 0 2 1 / 2 0 0 3 3 0 0 4 3 0 0 5 5/6 0 0 6 5/6 0 0 7 5/6 0 0 8 5/6 1 1