supplementary information - chemistry
TRANSCRIPT
SUPPLEMENTARY INFORMATIONDOI: 10.1038/NNANO.2015.256
NATURE NANOTECHNOLOGY | www.nature.com/naturenanotechnology 1 S1
Supplementary materials for: Reversible occlusion and reaction acceleration within dynamically self-assembling nanoflasks
Hui Zhao, Soumyo Sen, T. Udayabhaskararao, Michał Sawczyk, Kristina Kučanda,
Debasish Manna, Pintu K. Kundu, Ji-Woong Lee, Petr Král, and Rafal Klajn
Table of contents 1. Preparation of azobenzene-functionalized gold nanoparticles …………S1 2. Preparation of azobenzene-functionalized magnetite nanoparticles …………S2 3. Preparation of azobenzene-functionalized silica nanoparticles …………S3 4. Light-induced self-assembly of photoresponsive silica nanoparticles …………S8 5. Reversibility of light-induced nanoparticle self-assembly …………S9 6. Light-induced self-assembly of gold nanoparticles coated with other azobenzenes …………S9 7. Effect of methanol on light-induced nanoparticle self-assembly in toluene …………S17 8. Occlusion and release of water molecules from nanoparticle aggregates …………S18 9. Molecular dynamic simulations …………S19 10. Synthesis and occlusion studies of a model dye …………S23 11. Occlusion efficiency of compounds containing different functional groups …………S23 12. Competitive occlusion experiments …………S24 13. Synthesis and characterization of functionalized Au25 nanoclusters …………S25 14. Enantioselective occlusion within chiral nanoflasks …………S31 15. Monitoring reaction acceleration and stereoselectivity …………S36 16. Following self-assembly of nanoparticles by electron microscopy …………S40 17. Supplementary references …………S40
1. Preparation of azobenzene-functionalized gold nanoparticles
Azobenzene-functionalized gold nanoparticles (NPs) were prepared in a two step-procedure (synthesis followed by functionalization). First, gold NPs were synthesized as described previously1.
For ~2.6 nm NPs, didodecyldimethylammonium bromide (DDAB) stock solution was first prepared by dissolving DDAB (833 mg; 1.80 mmol) in toluene (18 mL) (with sonication). HAuCl4·3H2O (50 mg; 125 µmol) and dodecylamine (DDA) (450 mg; 2.43 mmol) were added to 12.5 mL of the stock solution and sonicated until completely dissolved. Gold(III) was then reduced by rapidly adding tetrabutylammonium borohydride (TBAB) (125 mg; 486 µmol) in DDAB stock solution (5 mL) under vigorous stirring. The NPs were functionalized 1 h after the synthesis by the addition of 10 eq of 1 (with respect to the number of the binding sites on Au, assuming that a single thiolate moiety occupies an area of 0.214 nm2 on the surface of gold2). After ~6 hours, functionalized NPs were purified by precipitating and copious washing with methanol, drying, and finally they were dispersed in pure toluene.
Reversible trapping and reaction acceleration within dynamically self-assembling nanoflasks
© 2015 Macmillan Publishers Limited. All rights reserved

2 NATURE NANOTECHNOLOGY | www.nature.com/naturenanotechnology
SUPPLEMENTARY INFORMATION DOI: 10.1038/NNANO.2015.256
S2
For ~6 nm NPs, a DDAB stock solution was first prepared by dissolving 925 mg DDAB in 20 mL toluene. 50 mg of HAuCl4·3H2O and 450 mg DDA were added to 12.5 mL of the stock solution and sonicated until dissolved. Gold(III) was then reduced by rapid injection of 125 mg of TBAB in 5 mL of the DDAB stock solution under vigorous stirring. A solution of ~2.5 nm NPs (“seeds”) prepared this way was aged for 24 hours. Growth solution was prepared by adding to 50 mL of pure toluene the following reagents, in the following order: 1) 1.00 g DDAB, 2) 1.85 g DDA, 3) 200 mg of HAuCl4·3H2O, and 4) 7 mL of the aged seed solution. Finally, 131 µL of hydrazine dissolved in 20 mL of the DDAB stock solution was added dropwise (~1 drop / sec) to the growth solution under vigorous stirring, and the resulting mixture was stirred overnight. Before functionalization, NPs were purified from the excess of surfactants (DDA and DDAB) by precipitating with methanol, decantation (without drying), and redissolution in pure toluene. Next, a 1:1 (molar ratio) mixture of 1 and dodecanethiol was added and the solution was shaken (on an orbital shaker) for ~6 hours. Finally, functionalized NPs were purified from unbound 1 by precipitating and copious washing with methanol, and then were dispersed in pure toluene.
Supplementary Figure 1 | TEM images of differently sized Au·1 used in this study: a) 2.6 nm, b) 6 nm. 2. Preparation of azobenzene-functionalized magnetite nanoparticles
Fe3O4 NPs (6 nm, 11 nm, 17 nm) were synthesized based on a previously published3 literature procedure. First, iron(III) oleate was prepared as follows: to a solvent mixture composed of 60 mL of distilled water, 80 mL of ethanol, and 140 mL of hexane were added sodium oleate (36.5 g; 120 mmol) (TCI, >97%; we found that the high purity of sodium oleate was critical for reproducible synthesis of high-quality, monodisperse Fe3O4 NPs) and FeCl3·6H2O (10.8 g; 40 mmol) (Alfa Aesar, 98%) and the resulting mixture was vigorously stirred at room temperature until the solids dissolved. The mixture was then heated with vigorous stirring under a nitrogen atmosphere at 70 °C for four hours. The solution was cooled down to room temperature and the upper phase (dark-red color) was collected using a separatory funnel and washed three times with distilled water. The resulting dark-red solution of iron oleate in hexane was dried over anhydrous magnesium sulfate. The solvent was evaporated in vacuo at 70 °C, resulting in a brown waxy solid.
Next, iron oleate (1.600 g; 1.78 mmol) was dissolved in 25 mL of 1-octadecene (Aldrich, 90%) and a given amount of oleic acid (Alfa Aesar, 90%) was added. The amount of oleic acid controlled the diameter of the resulting NPs: to obtain 6 nm, 11 nm, and 17 nm Fe3O4 NPs, we added 1.25 g (4.42 mmol), 0.99 g (3.55 mmol), and 0.80 g (2.83 mmol) of oleic acid, respectively. The reaction mixture was initially heated to 80 °C under reduced pressure for 30 min in order to remove any low-boiling liquids, and subsequently heated up to T = 310 °C at a constant heating rate of 3 °C / min, and it was stirred at this temperature for 30 min under a nitrogen atmosphere. The heating mantle was removed
S3
and the reaction mixture was allowed to cool down to room temperature. Nanoparticles were purified by precipitating with a mixture of solvents composed of hexane, isopropanol, and acetone (v/v/v = 1:2:2). The transparent supernatant was discarded and the solids were washed with a hexane-acetone mixture (v/v = 1:2). Residual solvent was evaporated under reduced pressure resulting in monodisperse Fe3O4 nanoparticles as a black solid. The resulting oleic acid-protected NPs were readily soluble in toluene.
Fe3O4 NPs of all sizes were functionalized by incubating with 2 (10-fold excess calculated assuming that a single molecule of 2 occupies an area of ~0.49 nm2 on the surface of magnetite4) in toluene overnight, followed by precipitation and copious washing with methanol, and redissolution in pure toluene.
Supplementary Figure 2 | TEM images of differently sized Fe3O4·2 used in this study: a) 6 nm, b) 11 nm, c) 17 nm. 3. Preparation of azobenzene-functionalized silica nanoparticles 3A. Synthesis of 1-phenyl-2-{4-[(11-trimethoxysilyl)undecyl]phenyl}diazene
The precursor of 3 {1-phenyl-2-[4-( undec-10-en-1-yloxy)phenyl]diazene} was synthesized based on a previously published procedure5.
NN
O Si(OMe)3
NN
ONN
OHRef. 5
HSi(OMe)3Pt(dvs)Toluene
© 2015 Macmillan Publishers Limited. All rights reserved

NATURE NANOTECHNOLOGY | www.nature.com/naturenanotechnology 3
SUPPLEMENTARY INFORMATIONDOI: 10.1038/NNANO.2015.256
S2
For ~6 nm NPs, a DDAB stock solution was first prepared by dissolving 925 mg DDAB in 20 mL toluene. 50 mg of HAuCl4·3H2O and 450 mg DDA were added to 12.5 mL of the stock solution and sonicated until dissolved. Gold(III) was then reduced by rapid injection of 125 mg of TBAB in 5 mL of the DDAB stock solution under vigorous stirring. A solution of ~2.5 nm NPs (“seeds”) prepared this way was aged for 24 hours. Growth solution was prepared by adding to 50 mL of pure toluene the following reagents, in the following order: 1) 1.00 g DDAB, 2) 1.85 g DDA, 3) 200 mg of HAuCl4·3H2O, and 4) 7 mL of the aged seed solution. Finally, 131 µL of hydrazine dissolved in 20 mL of the DDAB stock solution was added dropwise (~1 drop / sec) to the growth solution under vigorous stirring, and the resulting mixture was stirred overnight. Before functionalization, NPs were purified from the excess of surfactants (DDA and DDAB) by precipitating with methanol, decantation (without drying), and redissolution in pure toluene. Next, a 1:1 (molar ratio) mixture of 1 and dodecanethiol was added and the solution was shaken (on an orbital shaker) for ~6 hours. Finally, functionalized NPs were purified from unbound 1 by precipitating and copious washing with methanol, and then were dispersed in pure toluene.
Supplementary Figure 1 | TEM images of differently sized Au·1 used in this study: a) 2.6 nm, b) 6 nm. 2. Preparation of azobenzene-functionalized magnetite nanoparticles
Fe3O4 NPs (6 nm, 11 nm, 17 nm) were synthesized based on a previously published3 literature procedure. First, iron(III) oleate was prepared as follows: to a solvent mixture composed of 60 mL of distilled water, 80 mL of ethanol, and 140 mL of hexane were added sodium oleate (36.5 g; 120 mmol) (TCI, >97%; we found that the high purity of sodium oleate was critical for reproducible synthesis of high-quality, monodisperse Fe3O4 NPs) and FeCl3·6H2O (10.8 g; 40 mmol) (Alfa Aesar, 98%) and the resulting mixture was vigorously stirred at room temperature until the solids dissolved. The mixture was then heated with vigorous stirring under a nitrogen atmosphere at 70 °C for four hours. The solution was cooled down to room temperature and the upper phase (dark-red color) was collected using a separatory funnel and washed three times with distilled water. The resulting dark-red solution of iron oleate in hexane was dried over anhydrous magnesium sulfate. The solvent was evaporated in vacuo at 70 °C, resulting in a brown waxy solid.
Next, iron oleate (1.600 g; 1.78 mmol) was dissolved in 25 mL of 1-octadecene (Aldrich, 90%) and a given amount of oleic acid (Alfa Aesar, 90%) was added. The amount of oleic acid controlled the diameter of the resulting NPs: to obtain 6 nm, 11 nm, and 17 nm Fe3O4 NPs, we added 1.25 g (4.42 mmol), 0.99 g (3.55 mmol), and 0.80 g (2.83 mmol) of oleic acid, respectively. The reaction mixture was initially heated to 80 °C under reduced pressure for 30 min in order to remove any low-boiling liquids, and subsequently heated up to T = 310 °C at a constant heating rate of 3 °C / min, and it was stirred at this temperature for 30 min under a nitrogen atmosphere. The heating mantle was removed
S3
and the reaction mixture was allowed to cool down to room temperature. Nanoparticles were purified by precipitating with a mixture of solvents composed of hexane, isopropanol, and acetone (v/v/v = 1:2:2). The transparent supernatant was discarded and the solids were washed with a hexane-acetone mixture (v/v = 1:2). Residual solvent was evaporated under reduced pressure resulting in monodisperse Fe3O4 nanoparticles as a black solid. The resulting oleic acid-protected NPs were readily soluble in toluene.
Fe3O4 NPs of all sizes were functionalized by incubating with 2 (10-fold excess calculated assuming that a single molecule of 2 occupies an area of ~0.49 nm2 on the surface of magnetite4) in toluene overnight, followed by precipitation and copious washing with methanol, and redissolution in pure toluene.
Supplementary Figure 2 | TEM images of differently sized Fe3O4·2 used in this study: a) 6 nm, b) 11 nm, c) 17 nm. 3. Preparation of azobenzene-functionalized silica nanoparticles 3A. Synthesis of 1-phenyl-2-{4-[(11-trimethoxysilyl)undecyl]phenyl}diazene
The precursor of 3 {1-phenyl-2-[4-( undec-10-en-1-yloxy)phenyl]diazene} was synthesized based on a previously published procedure5.
NN
O Si(OMe)3
NN
ONN
OHRef. 5
HSi(OMe)3Pt(dvs)Toluene
© 2015 Macmillan Publishers Limited. All rights reserved

4 NATURE NANOTECHNOLOGY | www.nature.com/naturenanotechnology
SUPPLEMENTARY INFORMATION DOI: 10.1038/NNANO.2015.256
S4
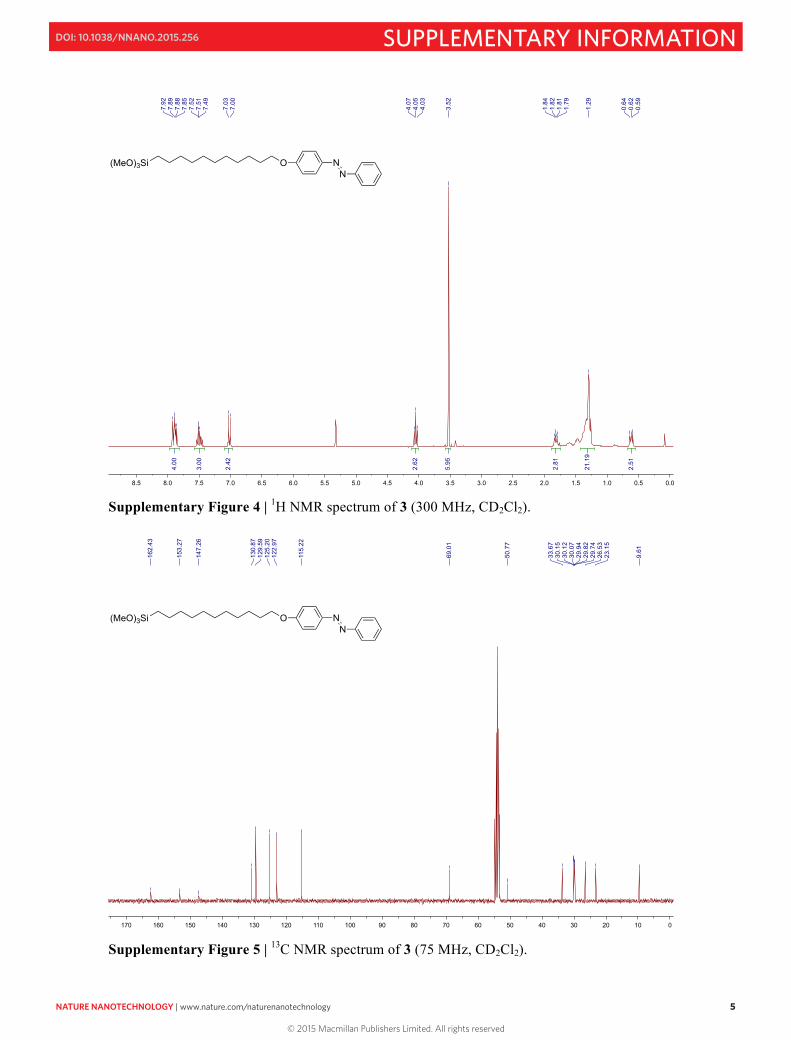
Supplementary Figure 3 | 1H NMR spectrum of 1-phenyl-2-[4-(undec-10-en-1-yloxy)phenyl]diazene (300 MHz, CDCl3). In a 100 mL two-necked round-bottomed flask, 1-phenyl-2-[4-( undec-10-en-1-yloxy)phenyl]diazene (1.0 g; 2.86 mmol) was dissolved in 10 mL of dry toluene. 100 µL of platinum(0)-1,3-divinyl-1,1,3,3-tetramethyldisiloxane (Karstedt’s catalyst) solution (in xylene; ~2% Pt) was added and the mixture was stirred at room temperature for 1 hr under nitrogen. Next, trimethoxysilane (5.0 g; 40.9 mmol) was added and the reaction mixture was refluxed for 24 hr under nitrogen. The reaction mixture was cooled down and the solvent and excess silane were removed under reduced pressure, and the crude product was purified by preparative TLC using DCM-hexane (v/v = 1:1) as the eluent. Isolated yield = 50%. 1H NMR (300 MHz, CD2Cl2): δ (ppm) 0.60–0.65 (m, 2H), 1.28–1.70 (m, 16H), 1.85 (q, 2H), 3.54 (s, 9H), 4.08 (t, 2H), 7.04 (d, 2H), 7.55 (t, 3H), 7.93 (m, 4H). 13C NMR (75 MHz, CD2Cl2): δ (ppm) 9.61, 23.15, 26.53, 29.74, 29.82, 29.94, 30.07, 30.12, 30.15, 33.67, 50.77, 69.01, 115.22, 122.97, 125.2, 129.59, 130.87, 147.26, 153.27, 162.43.
ESI MS m/z: exact mass calculated for C26H40N2O4Si [M+H]+ = 473.28; found = 473.33.
NN
O
S5
Supplementary Figure 4 | 1H NMR spectrum of 3 (300 MHz, CD2Cl2).
Supplementary Figure 5 | 13C NMR spectrum of 3 (75 MHz, CD2Cl2).
NN
O(MeO)3Si
NN
O(MeO)3Si
© 2015 Macmillan Publishers Limited. All rights reserved
NATURE NANOTECHNOLOGY | www.nature.com/naturenanotechnology 5
SUPPLEMENTARY INFORMATIONDOI: 10.1038/NNANO.2015.256
S4
Supplementary Figure 3 | 1H NMR spectrum of 1-phenyl-2-[4-(undec-10-en-1-yloxy)phenyl]diazene (300 MHz, CDCl3). In a 100 mL two-necked round-bottomed flask, 1-phenyl-2-[4-( undec-10-en-1-yloxy)phenyl]diazene (1.0 g; 2.86 mmol) was dissolved in 10 mL of dry toluene. 100 µL of platinum(0)-1,3-divinyl-1,1,3,3-tetramethyldisiloxane (Karstedt’s catalyst) solution (in xylene; ~2% Pt) was added and the mixture was stirred at room temperature for 1 hr under nitrogen. Next, trimethoxysilane (5.0 g; 40.9 mmol) was added and the reaction mixture was refluxed for 24 hr under nitrogen. The reaction mixture was cooled down and the solvent and excess silane were removed under reduced pressure, and the crude product was purified by preparative TLC using DCM-hexane (v/v = 1:1) as the eluent. Isolated yield = 50%. 1H NMR (300 MHz, CD2Cl2): δ (ppm) 0.60–0.65 (m, 2H), 1.28–1.70 (m, 16H), 1.85 (q, 2H), 3.54 (s, 9H), 4.08 (t, 2H), 7.04 (d, 2H), 7.55 (t, 3H), 7.93 (m, 4H). 13C NMR (75 MHz, CD2Cl2): δ (ppm) 9.61, 23.15, 26.53, 29.74, 29.82, 29.94, 30.07, 30.12, 30.15, 33.67, 50.77, 69.01, 115.22, 122.97, 125.2, 129.59, 130.87, 147.26, 153.27, 162.43.
ESI MS m/z: exact mass calculated for C26H40N2O4Si [M+H]+ = 473.28; found = 473.33.
NN
O
S5
Supplementary Figure 4 | 1H NMR spectrum of 3 (300 MHz, CD2Cl2).
Supplementary Figure 5 | 13C NMR spectrum of 3 (75 MHz, CD2Cl2).
NN
O(MeO)3Si
NN
O(MeO)3Si
© 2015 Macmillan Publishers Limited. All rights reserved
6 NATURE NANOTECHNOLOGY | www.nature.com/naturenanotechnology
SUPPLEMENTARY INFORMATION DOI: 10.1038/NNANO.2015.256
S6
3B. Synthesis of 3-functionalized silica nanoparticles
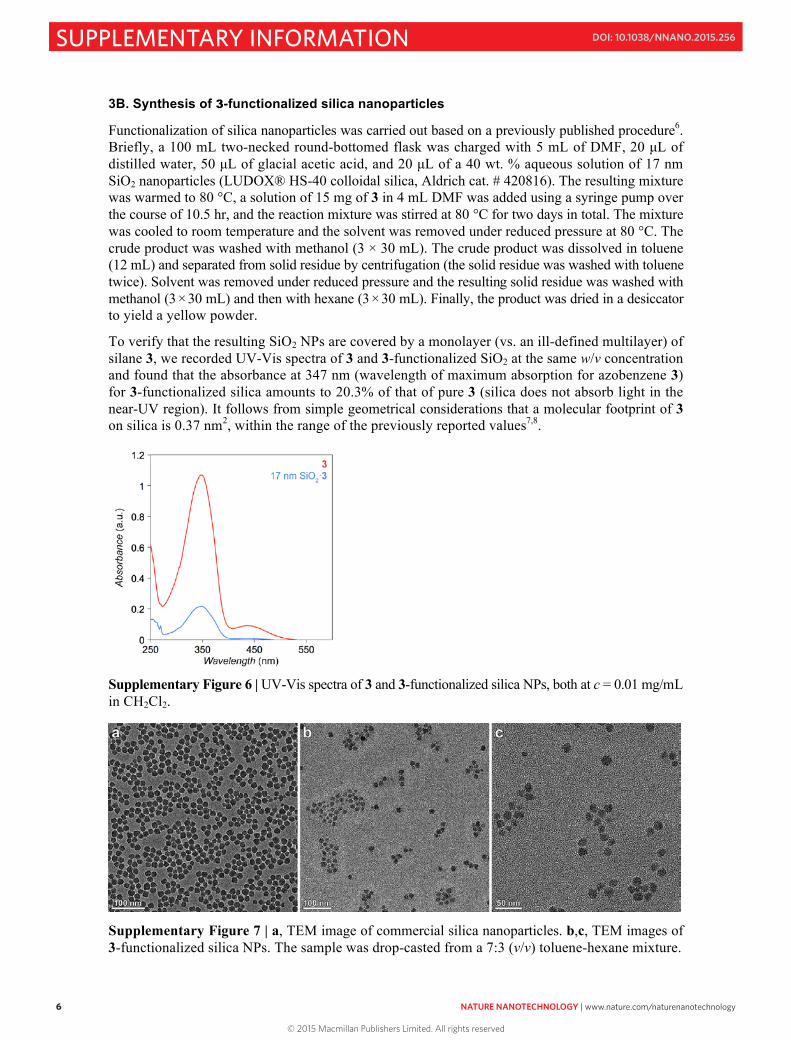
Functionalization of silica nanoparticles was carried out based on a previously published procedure6. Briefly, a 100 mL two-necked round-bottomed flask was charged with 5 mL of DMF, 20 µL of distilled water, 50 µL of glacial acetic acid, and 20 µL of a 40 wt. % aqueous solution of 17 nm SiO2 nanoparticles (LUDOX® HS-40 colloidal silica, Aldrich cat. # 420816). The resulting mixture was warmed to 80 °C, a solution of 15 mg of 3 in 4 mL DMF was added using a syringe pump over the course of 10.5 hr, and the reaction mixture was stirred at 80 °C for two days in total. The mixture was cooled to room temperature and the solvent was removed under reduced pressure at 80 °C. The crude product was washed with methanol (3 × 30 mL). The crude product was dissolved in toluene (12 mL) and separated from solid residue by centrifugation (the solid residue was washed with toluene twice). Solvent was removed under reduced pressure and the resulting solid residue was washed with methanol (3 × 30 mL) and then with hexane (3 × 30 mL). Finally, the product was dried in a desiccator to yield a yellow powder.
To verify that the resulting SiO2 NPs are covered by a monolayer (vs. an ill-defined multilayer) of silane 3, we recorded UV-Vis spectra of 3 and 3-functionalized SiO2 at the same w/v concentration and found that the absorbance at 347 nm (wavelength of maximum absorption for azobenzene 3) for 3-functionalized silica amounts to 20.3% of that of pure 3 (silica does not absorb light in the near-UV region). It follows from simple geometrical considerations that a molecular footprint of 3 on silica is 0.37 nm2, within the range of the previously reported values7,8.
Supplementary Figure 6 | UV-Vis spectra of 3 and 3-functionalized silica NPs, both at c = 0.01 mg/mL in CH2Cl2.
Supplementary Figure 7 | a, TEM image of commercial silica nanoparticles. b,c, TEM images of 3-functionalized silica NPs. The sample was drop-casted from a 7:3 (v/v) toluene-hexane mixture.
S7
Supplementary Figure 8 | 1H NMR spectra (300 MHz, CDCl3) of 3 (blue) and 3-functionalized silica (green). The signals corresponding to 3’s methyl groups (indicated in pink) are absent from the bottom spectrum, indicating a quantitative hydrolysis of 3. 3C. Photoisomerization of silica-bound 3.
Supplementary Figure 9 | a, Time-resolved UV-Vis spectra of 3-functionalized silica NPs in toluene during irradiation with a low-intensity (0.7 mW·cm–2) UV lamp. SiO2 does not absorb light in the 300-600 nm region; therefore, the optical responsive is exclusively due to silica-bound azobenzene. We found that 3-coated SiO2 NPs were soluble in toluene irrespective of the azobenzene isomer. However, UV-induced aggregation could be induced if solvent polarity was decreased by the addition of hexane (see Supplementary Section 4). b, Reversibility of isomerization of silica-bound azobenzene upon alternating exposure to UV and visible light.
© 2015 Macmillan Publishers Limited. All rights reserved

NATURE NANOTECHNOLOGY | www.nature.com/naturenanotechnology 7
SUPPLEMENTARY INFORMATIONDOI: 10.1038/NNANO.2015.256
S6
3B. Synthesis of 3-functionalized silica nanoparticles
Functionalization of silica nanoparticles was carried out based on a previously published procedure6. Briefly, a 100 mL two-necked round-bottomed flask was charged with 5 mL of DMF, 20 µL of distilled water, 50 µL of glacial acetic acid, and 20 µL of a 40 wt. % aqueous solution of 17 nm SiO2 nanoparticles (LUDOX® HS-40 colloidal silica, Aldrich cat. # 420816). The resulting mixture was warmed to 80 °C, a solution of 15 mg of 3 in 4 mL DMF was added using a syringe pump over the course of 10.5 hr, and the reaction mixture was stirred at 80 °C for two days in total. The mixture was cooled to room temperature and the solvent was removed under reduced pressure at 80 °C. The crude product was washed with methanol (3 × 30 mL). The crude product was dissolved in toluene (12 mL) and separated from solid residue by centrifugation (the solid residue was washed with toluene twice). Solvent was removed under reduced pressure and the resulting solid residue was washed with methanol (3 × 30 mL) and then with hexane (3 × 30 mL). Finally, the product was dried in a desiccator to yield a yellow powder.
To verify that the resulting SiO2 NPs are covered by a monolayer (vs. an ill-defined multilayer) of silane 3, we recorded UV-Vis spectra of 3 and 3-functionalized SiO2 at the same w/v concentration and found that the absorbance at 347 nm (wavelength of maximum absorption for azobenzene 3) for 3-functionalized silica amounts to 20.3% of that of pure 3 (silica does not absorb light in the near-UV region). It follows from simple geometrical considerations that a molecular footprint of 3 on silica is 0.37 nm2, within the range of the previously reported values7,8.
Supplementary Figure 6 | UV-Vis spectra of 3 and 3-functionalized silica NPs, both at c = 0.01 mg/mL in CH2Cl2.
Supplementary Figure 7 | a, TEM image of commercial silica nanoparticles. b,c, TEM images of 3-functionalized silica NPs. The sample was drop-casted from a 7:3 (v/v) toluene-hexane mixture.
S7
Supplementary Figure 8 | 1H NMR spectra (300 MHz, CDCl3) of 3 (blue) and 3-functionalized silica (green). The signals corresponding to 3’s methyl groups (indicated in pink) are absent from the bottom spectrum, indicating a quantitative hydrolysis of 3. 3C. Photoisomerization of silica-bound 3.
Supplementary Figure 9 | a, Time-resolved UV-Vis spectra of 3-functionalized silica NPs in toluene during irradiation with a low-intensity (0.7 mW·cm–2) UV lamp. SiO2 does not absorb light in the 300-600 nm region; therefore, the optical responsive is exclusively due to silica-bound azobenzene. We found that 3-coated SiO2 NPs were soluble in toluene irrespective of the azobenzene isomer. However, UV-induced aggregation could be induced if solvent polarity was decreased by the addition of hexane (see Supplementary Section 4). b, Reversibility of isomerization of silica-bound azobenzene upon alternating exposure to UV and visible light.
© 2015 Macmillan Publishers Limited. All rights reserved
8 NATURE NANOTECHNOLOGY | www.nature.com/naturenanotechnology
SUPPLEMENTARY INFORMATION DOI: 10.1038/NNANO.2015.256
S8
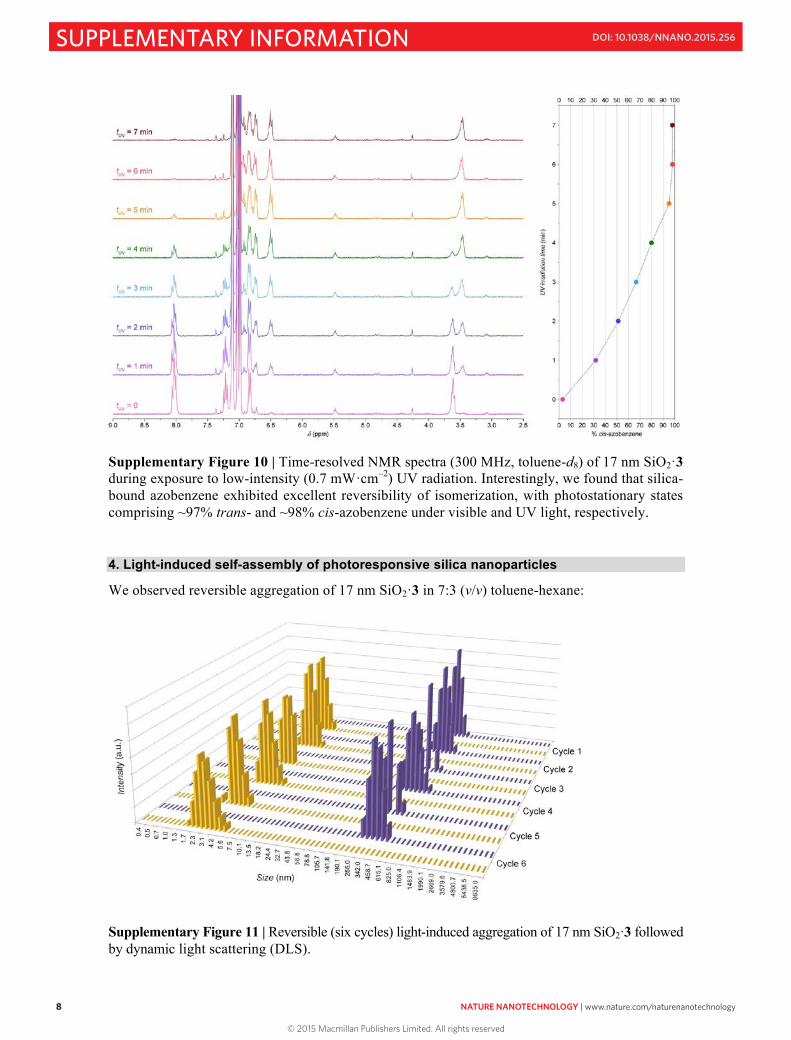
Supplementary Figure 10 | Time-resolved NMR spectra (300 MHz, toluene-d8) of 17 nm SiO2·3 during exposure to low-intensity (0.7 mW·cm–2) UV radiation. Interestingly, we found that silica-bound azobenzene exhibited excellent reversibility of isomerization, with photostationary states comprising ~97% trans- and ~98% cis-azobenzene under visible and UV light, respectively. 4. Light-induced self-assembly of photoresponsive silica nanoparticles
We observed reversible aggregation of 17 nm SiO2·3 in 7:3 (v/v) toluene-hexane:
Supplementary Figure 11 | Reversible (six cycles) light-induced aggregation of 17 nm SiO2·3 followed by dynamic light scattering (DLS).
S9
Supplementary Figure 12 | TEM images of 17 nm SiO2·3 (dispersed in 7:3 (v/v) toluene-hexane) after exposure to UV light. For the same NPs before UV irradiation, see Supplementary Figure 7b, c. 5. Reversibility of light-induced nanoparticle self-assembly
We used DLS to verify the reversibility of light-induced NP self-assembly. A solution of azobenzene-coated NPs exposed to visible light for 70 seconds (to afford a sample of free NPs; see, e.g. Fig. 1a, left, in the main text for Au·1) was subjected to a DLS measurement; it was then irradiated with UV light (λ = 365 nm; light intensity ~ 0.7 mW·cm–2) for 70 seconds (to yield NP aggregates; see, e.g., Fig. 1c in the main text for Au·1) and another DLS measurement was carried out. The sequence was repeated for at least thirty cycles and no apparent fatigue was observed (see the figure below).
Supplementary Figure 13 | Reversible light-induced self-assembly of azobenzene-functionalized 6 nm Au NPs (left), 11 nm Fe3O4 NPs (center), and 17 SiO2 NPs (right) followed by DLS. The solvent was pure toluene for Au and Fe3O4, and a 7:3 (v/v) mixture of toluene and hexane for SiO2. 6. Light-induced self-assembly of gold nanoparticles coated with other azobenzenes
To further determine the generality of the method, we also synthesized gold NPs functionalized with azobenzenes other than 1: namely, ligands 17 and 18 with shorter lengths of the alkyl chains, as well as thiol 20, in which the undecamethylene chain was replaced by a tri(ethylene glycol) bridge. 6A. Synthesis of 6-(4-(phenyldiazenyl)phenoxy)hexane-1-thiol 17 and 3-(4-(phenyldiazenyl)-phenoxy)propane-1-thiol 18
© 2015 Macmillan Publishers Limited. All rights reserved

NATURE NANOTECHNOLOGY | www.nature.com/naturenanotechnology 9
SUPPLEMENTARY INFORMATIONDOI: 10.1038/NNANO.2015.256
S8
Supplementary Figure 10 | Time-resolved NMR spectra (300 MHz, toluene-d8) of 17 nm SiO2·3 during exposure to low-intensity (0.7 mW·cm–2) UV radiation. Interestingly, we found that silica-bound azobenzene exhibited excellent reversibility of isomerization, with photostationary states comprising ~97% trans- and ~98% cis-azobenzene under visible and UV light, respectively. 4. Light-induced self-assembly of photoresponsive silica nanoparticles
We observed reversible aggregation of 17 nm SiO2·3 in 7:3 (v/v) toluene-hexane:
Supplementary Figure 11 | Reversible (six cycles) light-induced aggregation of 17 nm SiO2·3 followed by dynamic light scattering (DLS).
S9
Supplementary Figure 12 | TEM images of 17 nm SiO2·3 (dispersed in 7:3 (v/v) toluene-hexane) after exposure to UV light. For the same NPs before UV irradiation, see Supplementary Figure 7b, c. 5. Reversibility of light-induced nanoparticle self-assembly
We used DLS to verify the reversibility of light-induced NP self-assembly. A solution of azobenzene-coated NPs exposed to visible light for 70 seconds (to afford a sample of free NPs; see, e.g. Fig. 1a, left, in the main text for Au·1) was subjected to a DLS measurement; it was then irradiated with UV light (λ = 365 nm; light intensity ~ 0.7 mW·cm–2) for 70 seconds (to yield NP aggregates; see, e.g., Fig. 1c in the main text for Au·1) and another DLS measurement was carried out. The sequence was repeated for at least thirty cycles and no apparent fatigue was observed (see the figure below).
Supplementary Figure 13 | Reversible light-induced self-assembly of azobenzene-functionalized 6 nm Au NPs (left), 11 nm Fe3O4 NPs (center), and 17 SiO2 NPs (right) followed by DLS. The solvent was pure toluene for Au and Fe3O4, and a 7:3 (v/v) mixture of toluene and hexane for SiO2. 6. Light-induced self-assembly of gold nanoparticles coated with other azobenzenes
To further determine the generality of the method, we also synthesized gold NPs functionalized with azobenzenes other than 1: namely, ligands 17 and 18 with shorter lengths of the alkyl chains, as well as thiol 20, in which the undecamethylene chain was replaced by a tri(ethylene glycol) bridge. 6A. Synthesis of 6-(4-(phenyldiazenyl)phenoxy)hexane-1-thiol 17 and 3-(4-(phenyldiazenyl)-phenoxy)propane-1-thiol 18
© 2015 Macmillan Publishers Limited. All rights reserved
10 NATURE NANOTECHNOLOGY | www.nature.com/naturenanotechnology
SUPPLEMENTARY INFORMATION DOI: 10.1038/NNANO.2015.256
S10
14
OSH
NN
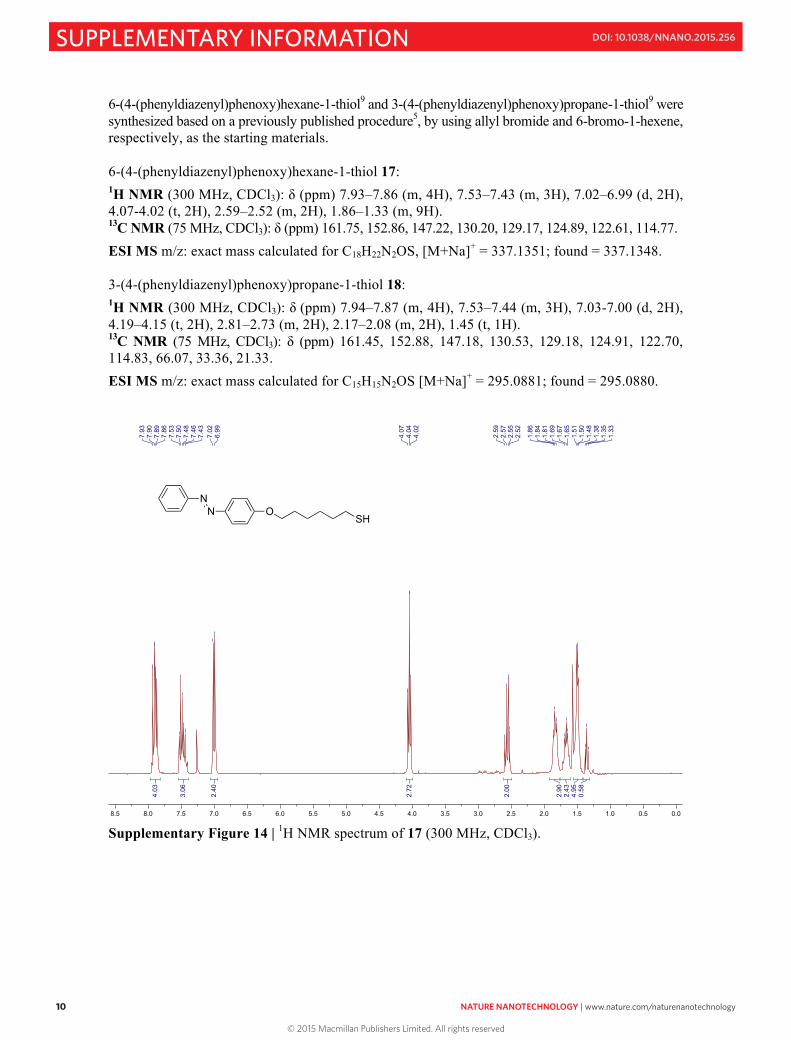
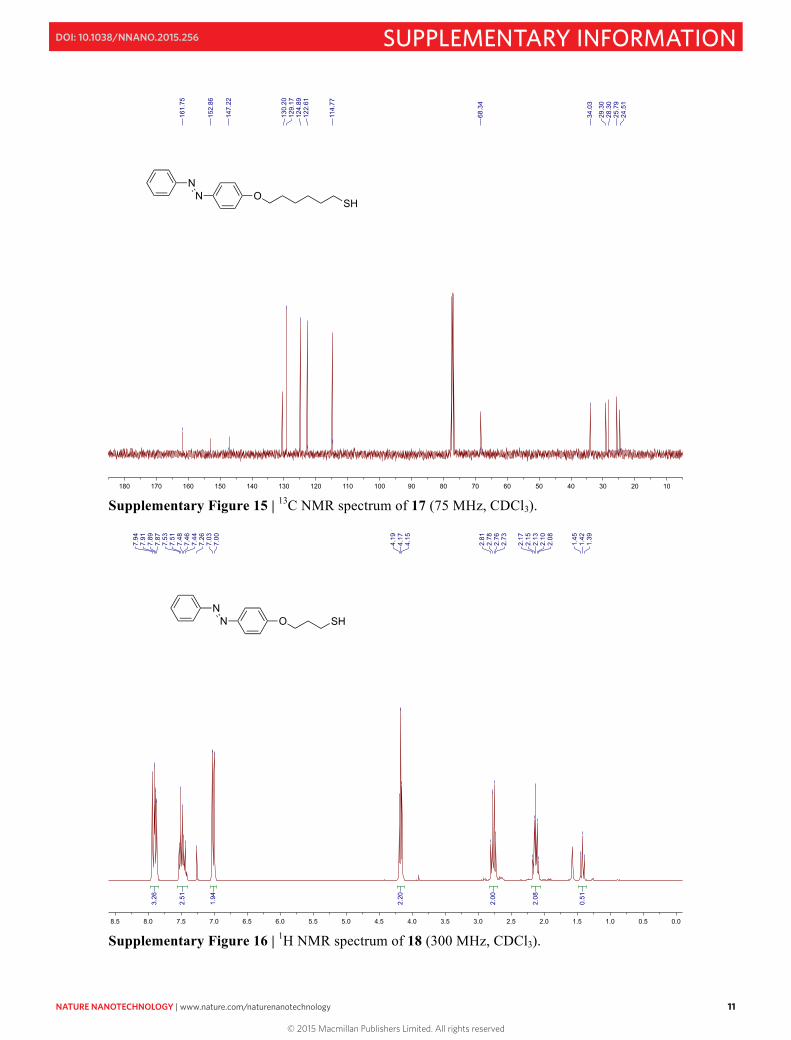
6-(4-(phenyldiazenyl)phenoxy)hexane-1-thiol9 and 3-(4-(phenyldiazenyl)phenoxy)propane-1-thiol9 were synthesized based on a previously published procedure5, by using allyl bromide and 6-bromo-1-hexene, respectively, as the starting materials. 6-(4-(phenyldiazenyl)phenoxy)hexane-1-thiol 17: 1H NMR (300 MHz, CDCl3): δ (ppm) 7.93–7.86 (m, 4H), 7.53–7.43 (m, 3H), 7.02–6.99 (d, 2H), 4.07-4.02 (t, 2H), 2.59–2.52 (m, 2H), 1.86–1.33 (m, 9H). 13C NMR (75 MHz, CDCl3): δ (ppm) 161.75, 152.86, 147.22, 130.20, 129.17, 124.89, 122.61, 114.77.
ESI MS m/z: exact mass calculated for C18H22N2OS, [M+Na]+ = 337.1351; found = 337.1348. 3-(4-(phenyldiazenyl)phenoxy)propane-1-thiol 18: 1H NMR (300 MHz, CDCl3): δ (ppm) 7.94–7.87 (m, 4H), 7.53–7.44 (m, 3H), 7.03-7.00 (d, 2H), 4.19–4.15 (t, 2H), 2.81–2.73 (m, 2H), 2.17–2.08 (m, 2H), 1.45 (t, 1H). 13C NMR (75 MHz, CDCl3): δ (ppm) 161.45, 152.88, 147.18, 130.53, 129.18, 124.91, 122.70, 114.83, 66.07, 33.36, 21.33.
ESI MS m/z: exact mass calculated for C15H15N2OS [M+Na]+ = 295.0881; found = 295.0880.
Supplementary Figure 14 | 1H NMR spectrum of 17 (300 MHz, CDCl3).
S11
13
O SHNN
14
OSH
NN
Supplementary Figure 15 | 13C NMR spectrum of 17 (75 MHz, CDCl3).
Supplementary Figure 16 | 1H NMR spectrum of 18 (300 MHz, CDCl3).
© 2015 Macmillan Publishers Limited. All rights reserved
NATURE NANOTECHNOLOGY | www.nature.com/naturenanotechnology 11
SUPPLEMENTARY INFORMATIONDOI: 10.1038/NNANO.2015.256
S10
14
OSH
NN
6-(4-(phenyldiazenyl)phenoxy)hexane-1-thiol9 and 3-(4-(phenyldiazenyl)phenoxy)propane-1-thiol9 were synthesized based on a previously published procedure5, by using allyl bromide and 6-bromo-1-hexene, respectively, as the starting materials. 6-(4-(phenyldiazenyl)phenoxy)hexane-1-thiol 17: 1H NMR (300 MHz, CDCl3): δ (ppm) 7.93–7.86 (m, 4H), 7.53–7.43 (m, 3H), 7.02–6.99 (d, 2H), 4.07-4.02 (t, 2H), 2.59–2.52 (m, 2H), 1.86–1.33 (m, 9H). 13C NMR (75 MHz, CDCl3): δ (ppm) 161.75, 152.86, 147.22, 130.20, 129.17, 124.89, 122.61, 114.77.
ESI MS m/z: exact mass calculated for C18H22N2OS, [M+Na]+ = 337.1351; found = 337.1348. 3-(4-(phenyldiazenyl)phenoxy)propane-1-thiol 18: 1H NMR (300 MHz, CDCl3): δ (ppm) 7.94–7.87 (m, 4H), 7.53–7.44 (m, 3H), 7.03-7.00 (d, 2H), 4.19–4.15 (t, 2H), 2.81–2.73 (m, 2H), 2.17–2.08 (m, 2H), 1.45 (t, 1H). 13C NMR (75 MHz, CDCl3): δ (ppm) 161.45, 152.88, 147.18, 130.53, 129.18, 124.91, 122.70, 114.83, 66.07, 33.36, 21.33.
ESI MS m/z: exact mass calculated for C15H15N2OS [M+Na]+ = 295.0881; found = 295.0880.
Supplementary Figure 14 | 1H NMR spectrum of 17 (300 MHz, CDCl3).
S11
13
O SHNN
14
OSH
NN
Supplementary Figure 15 | 13C NMR spectrum of 17 (75 MHz, CDCl3).
Supplementary Figure 16 | 1H NMR spectrum of 18 (300 MHz, CDCl3).
© 2015 Macmillan Publishers Limited. All rights reserved
12 NATURE NANOTECHNOLOGY | www.nature.com/naturenanotechnology
SUPPLEMENTARY INFORMATION DOI: 10.1038/NNANO.2015.256
S12
13
O SHNN
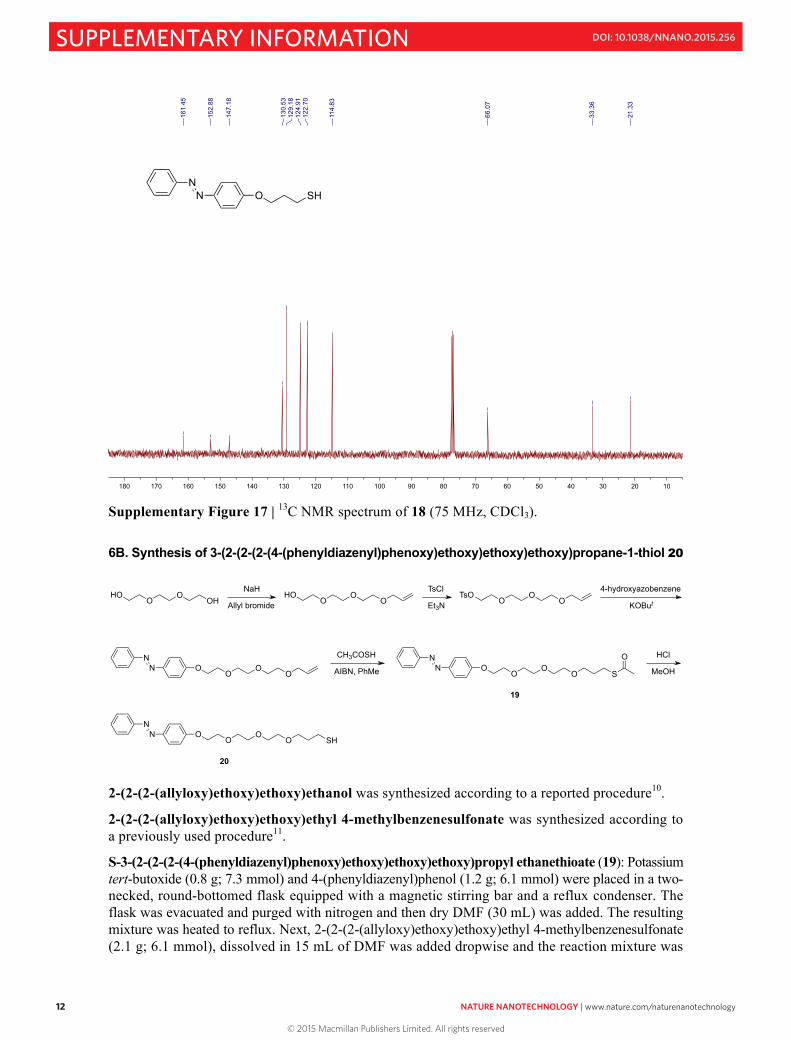
Supplementary Figure 17 | 13C NMR spectrum of 18 (75 MHz, CDCl3). 6B. Synthesis of 3-(2-(2-(2-(4-(phenyldiazenyl)phenoxy)ethoxy)ethoxy)ethoxy)propane-1-thiol 20
2-(2-(2-(allyloxy)ethoxy)ethoxy)ethanol was synthesized according to a reported procedure10.
2-(2-(2-(allyloxy)ethoxy)ethoxy)ethyl 4-methylbenzenesulfonate was synthesized according to a previously used procedure11.
S-3-(2-(2-(2-(4-(phenyldiazenyl)phenoxy)ethoxy)ethoxy)ethoxy)propyl ethanethioate (19): Potassium tert-butoxide (0.8 g; 7.3 mmol) and 4-(phenyldiazenyl)phenol (1.2 g; 6.1 mmol) were placed in a two-necked, round-bottomed flask equipped with a magnetic stirring bar and a reflux condenser. The flask was evacuated and purged with nitrogen and then dry DMF (30 mL) was added. The resulting mixture was heated to reflux. Next, 2-(2-(2-(allyloxy)ethoxy)ethoxy)ethyl 4-methylbenzenesulfonate (2.1 g; 6.1 mmol), dissolved in 15 mL of DMF was added dropwise and the reaction mixture was
20
HOO
OOH
NaH
Allyl bromideHO
OO
OTsCl
Et3NTsO
OO
O
OO
OO
NN
OO
OO
NN
S
O
OO
OO
NN
SH
4-hydroxyazobenzene
KOBut
CH3COSH
AIBN, PhMe
HCl
MeOH
19
S13
OO
OO
NN
S
O
15
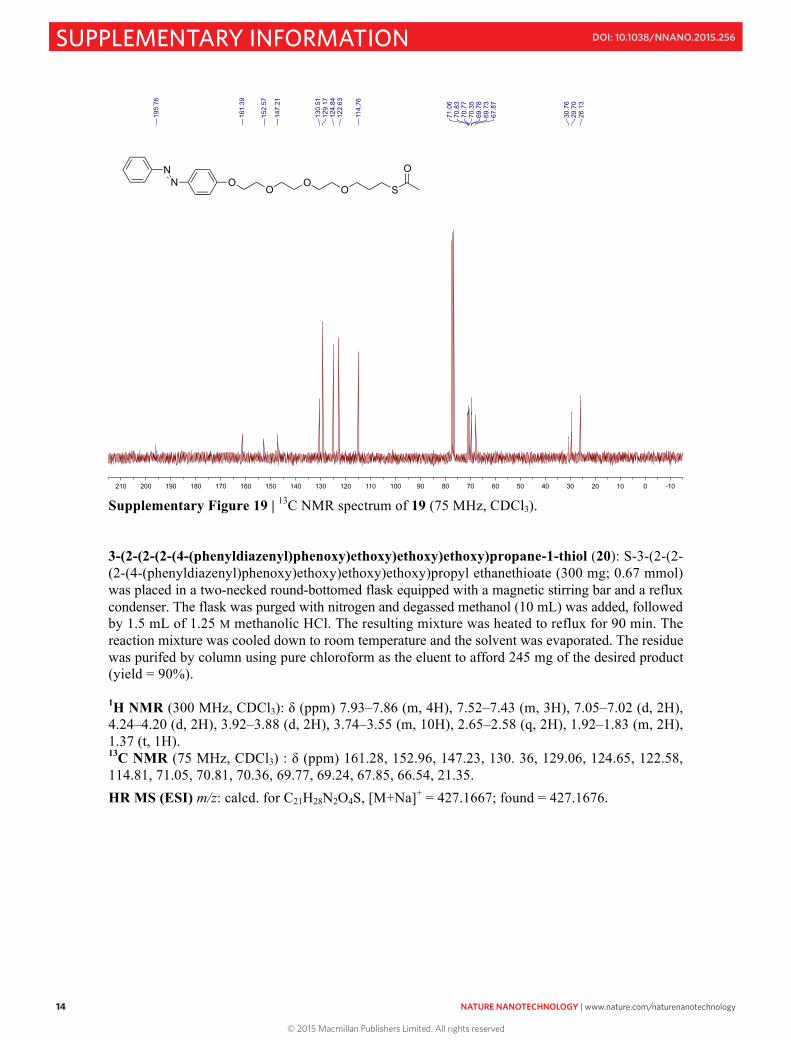
allowed to reflux for 18 hours. The progress of the reaction was monitored by TLC. The reaction mixture was cooled down to room temperature and the solvent was evaporated in vacuo. The resulting residue was dissolved in 50 mL of hexane, placed in a separatory funnel, and 50 mL of water was added. The organic layer was collected, the solvent was removed in vacuo, and the residue was purifed by column chromatography using pure chloroform as the eluent to afford 1.11 g (yield = 49%) of 1-(4-(2-(2-(2-(allyloxy)ethoxy)ethoxy)ethoxy)phenyl)-2-phenyldiazene. Next, 1-(4-(2-(2-(2-(allyloxy)ethoxy)ethoxy)ethoxy)phenyl)-2-phenyldiazene (0.60 g; 1.62 mmol) was placed in a two-necked, round-bottomed flask equipped with a magnetic stirring bar and a reflux condenser. Twenty mL of toluene was added, followed by AIBN (70 mg; 0.43 mmol) and thioacetic acid (0.55 mL; 592 mg; 7.8 mmol). The flask was flushed with nitrogen for 15 min; then the mixture was allowed to heat to reflux under nitrogen. The progress of the rection was monitored by TLC. After 5 hours, the reaction mixture was allowed to cool down to room temperature. The solvent was removed using a rotary evaporator and the resulting product was purifed by column chromatography using pure chloroform as the eluent to afford 350 mg of the desired product (yield = 48%). 1H NMR (300 MHz, CDCl3): δ (ppm) 7.92–7.86 (m, 4H), 7.52–7.43 (m, 3H), 7.04–7.01 (d, 2H), 4.24–4.20 (t, 2H), 3.92–3.89 (t, 2H), 3.76–3.49 (m, 10H), 2.97–2.92 (t, 2H), 2.31 (s, 3H), 1.90–1.83 (m, 2H). 13C NMR (75 MHz, CDCl3): δ (ppm) 195.76, 161.39, 152.57, 147.21, 130.51, 129.17, 124.84, 122.63, 114.76, 71.06, 70.83, 70.35, 69.78, 69.73, 67.87, 30.76, 29.70, 26.13.
ESI MS m/z: exact mass calculated for C23H30N2O5S, [M+Na]+ = 469.1773; found = 469.1777.
Supplementary Figure 18 | 1H NMR spectrum of 19 (300 MHz, CDCl3).
© 2015 Macmillan Publishers Limited. All rights reserved

NATURE NANOTECHNOLOGY | www.nature.com/naturenanotechnology 13
SUPPLEMENTARY INFORMATIONDOI: 10.1038/NNANO.2015.256
S12
13
O SHNN
Supplementary Figure 17 | 13C NMR spectrum of 18 (75 MHz, CDCl3). 6B. Synthesis of 3-(2-(2-(2-(4-(phenyldiazenyl)phenoxy)ethoxy)ethoxy)ethoxy)propane-1-thiol 20
2-(2-(2-(allyloxy)ethoxy)ethoxy)ethanol was synthesized according to a reported procedure10.
2-(2-(2-(allyloxy)ethoxy)ethoxy)ethyl 4-methylbenzenesulfonate was synthesized according to a previously used procedure11.
S-3-(2-(2-(2-(4-(phenyldiazenyl)phenoxy)ethoxy)ethoxy)ethoxy)propyl ethanethioate (19): Potassium tert-butoxide (0.8 g; 7.3 mmol) and 4-(phenyldiazenyl)phenol (1.2 g; 6.1 mmol) were placed in a two-necked, round-bottomed flask equipped with a magnetic stirring bar and a reflux condenser. The flask was evacuated and purged with nitrogen and then dry DMF (30 mL) was added. The resulting mixture was heated to reflux. Next, 2-(2-(2-(allyloxy)ethoxy)ethoxy)ethyl 4-methylbenzenesulfonate (2.1 g; 6.1 mmol), dissolved in 15 mL of DMF was added dropwise and the reaction mixture was
20
HOO
OOH
NaH
Allyl bromideHO
OO
OTsCl
Et3NTsO
OO
O
OO
OO
NN
OO
OO
NN
S
O
OO
OO
NN
SH
4-hydroxyazobenzene
KOBut
CH3COSH
AIBN, PhMe
HCl
MeOH
19
S13
OO
OO
NN
S
O
15
allowed to reflux for 18 hours. The progress of the reaction was monitored by TLC. The reaction mixture was cooled down to room temperature and the solvent was evaporated in vacuo. The resulting residue was dissolved in 50 mL of hexane, placed in a separatory funnel, and 50 mL of water was added. The organic layer was collected, the solvent was removed in vacuo, and the residue was purifed by column chromatography using pure chloroform as the eluent to afford 1.11 g (yield = 49%) of 1-(4-(2-(2-(2-(allyloxy)ethoxy)ethoxy)ethoxy)phenyl)-2-phenyldiazene. Next, 1-(4-(2-(2-(2-(allyloxy)ethoxy)ethoxy)ethoxy)phenyl)-2-phenyldiazene (0.60 g; 1.62 mmol) was placed in a two-necked, round-bottomed flask equipped with a magnetic stirring bar and a reflux condenser. Twenty mL of toluene was added, followed by AIBN (70 mg; 0.43 mmol) and thioacetic acid (0.55 mL; 592 mg; 7.8 mmol). The flask was flushed with nitrogen for 15 min; then the mixture was allowed to heat to reflux under nitrogen. The progress of the rection was monitored by TLC. After 5 hours, the reaction mixture was allowed to cool down to room temperature. The solvent was removed using a rotary evaporator and the resulting product was purifed by column chromatography using pure chloroform as the eluent to afford 350 mg of the desired product (yield = 48%). 1H NMR (300 MHz, CDCl3): δ (ppm) 7.92–7.86 (m, 4H), 7.52–7.43 (m, 3H), 7.04–7.01 (d, 2H), 4.24–4.20 (t, 2H), 3.92–3.89 (t, 2H), 3.76–3.49 (m, 10H), 2.97–2.92 (t, 2H), 2.31 (s, 3H), 1.90–1.83 (m, 2H). 13C NMR (75 MHz, CDCl3): δ (ppm) 195.76, 161.39, 152.57, 147.21, 130.51, 129.17, 124.84, 122.63, 114.76, 71.06, 70.83, 70.35, 69.78, 69.73, 67.87, 30.76, 29.70, 26.13.
ESI MS m/z: exact mass calculated for C23H30N2O5S, [M+Na]+ = 469.1773; found = 469.1777.
Supplementary Figure 18 | 1H NMR spectrum of 19 (300 MHz, CDCl3).
© 2015 Macmillan Publishers Limited. All rights reserved
14 NATURE NANOTECHNOLOGY | www.nature.com/naturenanotechnology
SUPPLEMENTARY INFORMATION DOI: 10.1038/NNANO.2015.256
S14
OO
OO
NN
S
O
15
Supplementary Figure 19 | 13C NMR spectrum of 19 (75 MHz, CDCl3). 3-(2-(2-(2-(4-(phenyldiazenyl)phenoxy)ethoxy)ethoxy)ethoxy)propane-1-thiol (20): S-3-(2-(2-(2-(4-(phenyldiazenyl)phenoxy)ethoxy)ethoxy)ethoxy)propyl ethanethioate (300 mg; 0.67 mmol) was placed in a two-necked round-bottomed flask equipped with a magnetic stirring bar and a reflux condenser. The flask was purged with nitrogen and degassed methanol (10 mL) was added, followed by 1.5 mL of 1.25 M methanolic HCl. The resulting mixture was heated to reflux for 90 min. The reaction mixture was cooled down to room temperature and the solvent was evaporated. The residue was purifed by column using pure chloroform as the eluent to afford 245 mg of the desired product (yield = 90%). 1H NMR (300 MHz, CDCl3): δ (ppm) 7.93–7.86 (m, 4H), 7.52–7.43 (m, 3H), 7.05–7.02 (d, 2H), 4.24–4.20 (d, 2H), 3.92–3.88 (d, 2H), 3.74–3.55 (m, 10H), 2.65–2.58 (q, 2H), 1.92–1.83 (m, 2H), 1.37 (t, 1H). 13C NMR (75 MHz, CDCl3) : δ (ppm) 161.28, 152.96, 147.23, 130. 36, 129.06, 124.65, 122.58, 114.81, 71.05, 70.81, 70.36, 69.77, 69.24, 67.85, 66.54, 21.35.
HR MS (ESI) m/z: calcd. for C21H28N2O4S, [M+Na]+ = 427.1667; found = 427.1676.
S15
16
OO
OO
NN
SH
16
OO
OO
NN
SH
Supplementary Figure 20 | 1H NMR spectrum of 20 (300 MHz, CDCl3).
Supplementary Figure 21 | 13C NMR spectrum of 20 (75 MHz, CDCl3).
© 2015 Macmillan Publishers Limited. All rights reserved

NATURE NANOTECHNOLOGY | www.nature.com/naturenanotechnology 15
SUPPLEMENTARY INFORMATIONDOI: 10.1038/NNANO.2015.256
S14
OO
OO
NN
S
O
15
Supplementary Figure 19 | 13C NMR spectrum of 19 (75 MHz, CDCl3). 3-(2-(2-(2-(4-(phenyldiazenyl)phenoxy)ethoxy)ethoxy)ethoxy)propane-1-thiol (20): S-3-(2-(2-(2-(4-(phenyldiazenyl)phenoxy)ethoxy)ethoxy)ethoxy)propyl ethanethioate (300 mg; 0.67 mmol) was placed in a two-necked round-bottomed flask equipped with a magnetic stirring bar and a reflux condenser. The flask was purged with nitrogen and degassed methanol (10 mL) was added, followed by 1.5 mL of 1.25 M methanolic HCl. The resulting mixture was heated to reflux for 90 min. The reaction mixture was cooled down to room temperature and the solvent was evaporated. The residue was purifed by column using pure chloroform as the eluent to afford 245 mg of the desired product (yield = 90%). 1H NMR (300 MHz, CDCl3): δ (ppm) 7.93–7.86 (m, 4H), 7.52–7.43 (m, 3H), 7.05–7.02 (d, 2H), 4.24–4.20 (d, 2H), 3.92–3.88 (d, 2H), 3.74–3.55 (m, 10H), 2.65–2.58 (q, 2H), 1.92–1.83 (m, 2H), 1.37 (t, 1H). 13C NMR (75 MHz, CDCl3) : δ (ppm) 161.28, 152.96, 147.23, 130. 36, 129.06, 124.65, 122.58, 114.81, 71.05, 70.81, 70.36, 69.77, 69.24, 67.85, 66.54, 21.35.
HR MS (ESI) m/z: calcd. for C21H28N2O4S, [M+Na]+ = 427.1667; found = 427.1676.
S15
16
OO
OO
NN
SH
16
OO
OO
NN
SH
Supplementary Figure 20 | 1H NMR spectrum of 20 (300 MHz, CDCl3).
Supplementary Figure 21 | 13C NMR spectrum of 20 (75 MHz, CDCl3).
© 2015 Macmillan Publishers Limited. All rights reserved

16 NATURE NANOTECHNOLOGY | www.nature.com/naturenanotechnology
SUPPLEMENTARY INFORMATION DOI: 10.1038/NNANO.2015.256
S16
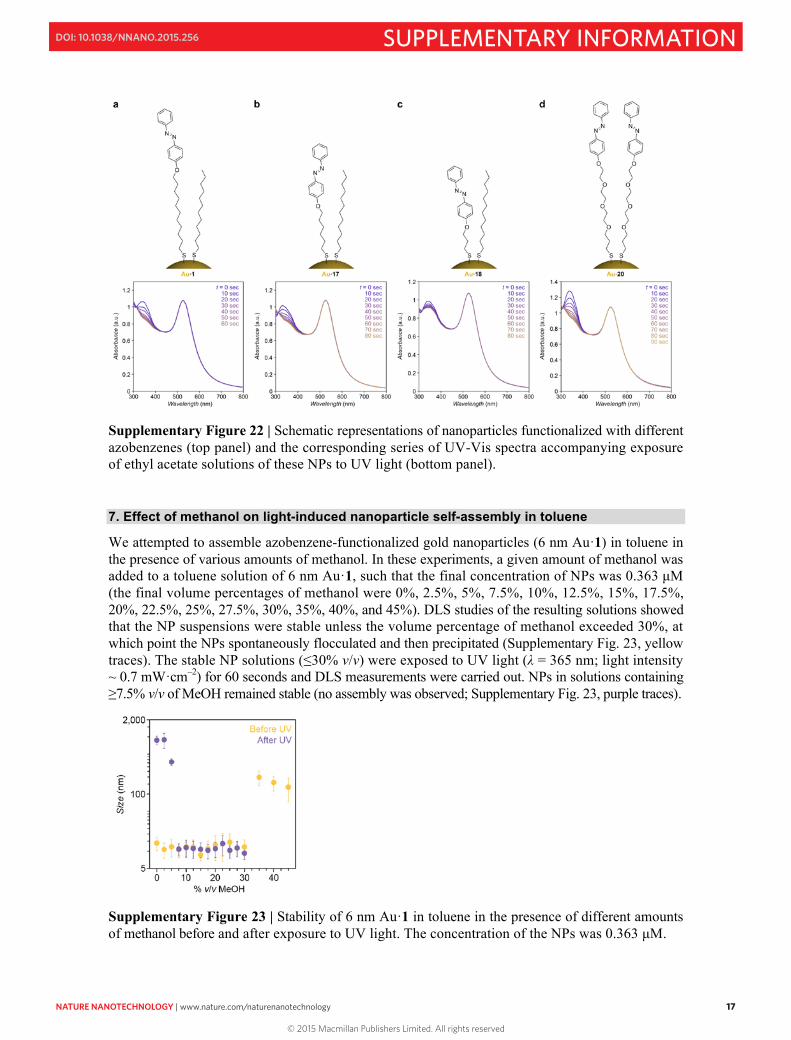
6C. Synthesis and properties of 6 nm Au NPs functionalized with ligands 17, 18, and 20 Six nm Au NPs were functionalized with ligands 17, 18, and 20 as described above (Supplementary Section 1) for 6 nm Au·1. For functionalization with 17 and 18, 1:1 molar ratios of the thiolated azobenzenes and dodecanethiol were used (Supplementary Fig. 22b, c). Ligand 20 provided excellent solubility of 6 nm Au NPs in toluene without the need to form a mixed monolayer (Supplementary Fig. 22d). The bottom panel in Supplementary Fig. 22 shows the effect of UV irradiation on solutions of azobenzene-protected gold nanoparticles in ethyl acetate (a solvent in which azobenzene isomerization is not accompanied by NP self-assembly – a process which obscures the UV-Vis spectra).
Au·17 behaved similarly to Au·1: it took about one minute for the photostationary state to be reached, and azobenzene isomerization was almost complete. Interestingly, however, the shorter azobenzene 18 isomerized only to a relatively small extent (Supplementary Fig. 22c, bottom panel), which can be attributed to i) steric hindrance imposed by the dodecanethiol background, and ii) possible electronic coupling between gold and the excited states of the chromophore12. Based on the UV-Vis spectra, we estimate that the trans→cis isomerization yield for NP-bound 18 amounts to ~40%. This reduced isomerization yield rendered solutions of Au·18 stable in toluene even after UV irradiation (no self-assembly was observed). The pronounced band at ~340 nm in the spectrum of Au·20 (Supplementary Fig. 22d, bottom) is due to the high loading of these NPs with trans-azobenzene. The good solubility of these NPs even in the absence of a diluting ligand (dodecanethiol) can be attributed to the relatively weak lateral interactions between (and consequently enhanced solvation of) oligo(ethylene glycol) chains as compared with all-methylene chains. UV irradiation of these NPs led to a near-quantitative isomerization of trans-azobenzene (Supplementary Fig. 22d, bottom).
We have also compared the occlusion abilities of Au·1, Au·17, and Au·20 towards a model compound, 1-(2-naphthyl)ethanol (10 in Fig. 3g). In these experiments, we mixed 10 with each of the NPs in a 500:1 ratio in pure toluene, subjected the mixtures to 5 minutes of UV light, centrifuged the mixtures to remove the NPs from solution, and analyzed the supernatant by GC. We found that ~154, ~170, and ~196 molecules of 10 were, on average, occluded for each NP of Au·1, Au·17, and Au·20, respectively. The higher number of molecules occluded by Au·17, as compared to Au·1, could be explained by the relatively weak lateral interactions between dodecanethiol and the short alkyl chain of 17, which provides the azobenzene unit with additional conformational flexibility allowing for more efficient hydrogen-bonding interactions with 10. The highest occlusion efficiency of Au·20 can be attributed to the high number of azobenzene moieties on the NPs.
S17
Supplementary Figure 22 | Schematic representations of nanoparticles functionalized with different azobenzenes (top panel) and the corresponding series of UV-Vis spectra accompanying exposure of ethyl acetate solutions of these NPs to UV light (bottom panel). 7. Effect of methanol on light-induced nanoparticle self-assembly in toluene
We attempted to assemble azobenzene-functionalized gold nanoparticles (6 nm Au·1) in toluene in the presence of various amounts of methanol. In these experiments, a given amount of methanol was added to a toluene solution of 6 nm Au·1, such that the final concentration of NPs was 0.363 µM (the final volume percentages of methanol were 0%, 2.5%, 5%, 7.5%, 10%, 12.5%, 15%, 17.5%, 20%, 22.5%, 25%, 27.5%, 30%, 35%, 40%, and 45%). DLS studies of the resulting solutions showed that the NP suspensions were stable unless the volume percentage of methanol exceeded 30%, at which point the NPs spontaneously flocculated and then precipitated (Supplementary Fig. 23, yellow traces). The stable NP solutions (≤30% v/v) were exposed to UV light (λ = 365 nm; light intensity ~ 0.7 mW·cm–2) for 60 seconds and DLS measurements were carried out. NPs in solutions containing ≥7.5% v/v of MeOH remained stable (no assembly was observed; Supplementary Fig. 23, purple traces).
Supplementary Figure 23 | Stability of 6 nm Au·1 in toluene in the presence of different amounts of methanol before and after exposure to UV light. The concentration of the NPs was 0.363 µM.
© 2015 Macmillan Publishers Limited. All rights reserved
NATURE NANOTECHNOLOGY | www.nature.com/naturenanotechnology 17
SUPPLEMENTARY INFORMATIONDOI: 10.1038/NNANO.2015.256
S16
6C. Synthesis and properties of 6 nm Au NPs functionalized with ligands 17, 18, and 20 Six nm Au NPs were functionalized with ligands 17, 18, and 20 as described above (Supplementary Section 1) for 6 nm Au·1. For functionalization with 17 and 18, 1:1 molar ratios of the thiolated azobenzenes and dodecanethiol were used (Supplementary Fig. 22b, c). Ligand 20 provided excellent solubility of 6 nm Au NPs in toluene without the need to form a mixed monolayer (Supplementary Fig. 22d). The bottom panel in Supplementary Fig. 22 shows the effect of UV irradiation on solutions of azobenzene-protected gold nanoparticles in ethyl acetate (a solvent in which azobenzene isomerization is not accompanied by NP self-assembly – a process which obscures the UV-Vis spectra).
Au·17 behaved similarly to Au·1: it took about one minute for the photostationary state to be reached, and azobenzene isomerization was almost complete. Interestingly, however, the shorter azobenzene 18 isomerized only to a relatively small extent (Supplementary Fig. 22c, bottom panel), which can be attributed to i) steric hindrance imposed by the dodecanethiol background, and ii) possible electronic coupling between gold and the excited states of the chromophore12. Based on the UV-Vis spectra, we estimate that the trans→cis isomerization yield for NP-bound 18 amounts to ~40%. This reduced isomerization yield rendered solutions of Au·18 stable in toluene even after UV irradiation (no self-assembly was observed). The pronounced band at ~340 nm in the spectrum of Au·20 (Supplementary Fig. 22d, bottom) is due to the high loading of these NPs with trans-azobenzene. The good solubility of these NPs even in the absence of a diluting ligand (dodecanethiol) can be attributed to the relatively weak lateral interactions between (and consequently enhanced solvation of) oligo(ethylene glycol) chains as compared with all-methylene chains. UV irradiation of these NPs led to a near-quantitative isomerization of trans-azobenzene (Supplementary Fig. 22d, bottom).
We have also compared the occlusion abilities of Au·1, Au·17, and Au·20 towards a model compound, 1-(2-naphthyl)ethanol (10 in Fig. 3g). In these experiments, we mixed 10 with each of the NPs in a 500:1 ratio in pure toluene, subjected the mixtures to 5 minutes of UV light, centrifuged the mixtures to remove the NPs from solution, and analyzed the supernatant by GC. We found that ~154, ~170, and ~196 molecules of 10 were, on average, occluded for each NP of Au·1, Au·17, and Au·20, respectively. The higher number of molecules occluded by Au·17, as compared to Au·1, could be explained by the relatively weak lateral interactions between dodecanethiol and the short alkyl chain of 17, which provides the azobenzene unit with additional conformational flexibility allowing for more efficient hydrogen-bonding interactions with 10. The highest occlusion efficiency of Au·20 can be attributed to the high number of azobenzene moieties on the NPs.
S17
Supplementary Figure 22 | Schematic representations of nanoparticles functionalized with different azobenzenes (top panel) and the corresponding series of UV-Vis spectra accompanying exposure of ethyl acetate solutions of these NPs to UV light (bottom panel). 7. Effect of methanol on light-induced nanoparticle self-assembly in toluene
We attempted to assemble azobenzene-functionalized gold nanoparticles (6 nm Au·1) in toluene in the presence of various amounts of methanol. In these experiments, a given amount of methanol was added to a toluene solution of 6 nm Au·1, such that the final concentration of NPs was 0.363 µM (the final volume percentages of methanol were 0%, 2.5%, 5%, 7.5%, 10%, 12.5%, 15%, 17.5%, 20%, 22.5%, 25%, 27.5%, 30%, 35%, 40%, and 45%). DLS studies of the resulting solutions showed that the NP suspensions were stable unless the volume percentage of methanol exceeded 30%, at which point the NPs spontaneously flocculated and then precipitated (Supplementary Fig. 23, yellow traces). The stable NP solutions (≤30% v/v) were exposed to UV light (λ = 365 nm; light intensity ~ 0.7 mW·cm–2) for 60 seconds and DLS measurements were carried out. NPs in solutions containing ≥7.5% v/v of MeOH remained stable (no assembly was observed; Supplementary Fig. 23, purple traces).
Supplementary Figure 23 | Stability of 6 nm Au·1 in toluene in the presence of different amounts of methanol before and after exposure to UV light. The concentration of the NPs was 0.363 µM.
© 2015 Macmillan Publishers Limited. All rights reserved

18 NATURE NANOTECHNOLOGY | www.nature.com/naturenanotechnology
SUPPLEMENTARY INFORMATION DOI: 10.1038/NNANO.2015.256
S18
We also studied the effect of increasing amounts of methanol on the rate of light-induced self-assembly of 6 nm Au·1 (Supplementary Fig. 24). In these experiments, 0.044 µM solutions of NPs (concentration in terms of gold atoms) were placed in toluene containing 0%, 1%, 2%, 3%, and 4% v/v of methanol (no light-induced self-assembly was observed in the presence of higher amounts of methanol in these dilute NP solutions). As the plot in Supplementary Fig. 24 shows, the rate of self-assembly is inversely proportional to the methanol content.
Supplementary Figure 24 | Kinetics of light-induced self-assembly of 6 nm Au·1 in pure toluene (a) and in toluene containing different amounts of methanol: 1% v/v (b), 2% v/v (c), 3% v/v (d), and 4% v/v (e). In all cases, the concentration of the NPs was 0.044 µM. The plot in (f) summarizes the results. 8. Occlusion and release of water molecules from nanoparticle aggregates
NP aggregates were prepared in toluene containing various amounts of water. First, we worked with dry (freshly distilled) toluene. Once the aggregates obtained in dry toluene were deposited on the TEM substrate, they remained stable even after prolonged exposure to the electron beam. In sharp contrast, aggregates obtained in technical-grade toluene (containing residual water), abruptly “exploded” after ~30 seconds of exposure to a focused electron beam (see, e.g., Supplementary Fig. 25 (left) and Fig. 2a in the main text). However, when the same aggregates were deposited on the TEM substrate and irradiated with visible light, no “explosion” events were observed during a similar inspection by TEM – instead, only disassembled NPs could be seen, indicating that the aggregates disassembled either during exposure to visible light, or more likely, when subjected to the low pressure at which the TEM operates. Finally, for NP aggregates prepared in a saturated solution of water in toluene, the aggregates remained largely intact, with only a small fraction of NPs removed in one direction (e.g. towards the left in Supplementary Fig. 25, right), most likely accompanying the release of a relatively large amount of water.
S19
Supplementary Figure 25 | TEM images of aggregates of 6 nm Au·1 prepared in the presence of small (left) and large (right) amounts of water, and exposed to a focused electron beam. 9. Molecular dynamic simulations
We modeled ligand-functionalized Au NPs using atomistic molecular dynamics (MD) simulations. Each model NP had a gold core of 2.6 nm in diameter, and was covered by 98 molecules of 1. We prepared our forcefield for trans- and cis-1 in toluene as an implicit solvent (IEFPCM continuum solvent model)13 using MP2 level ab initio calculations performed with Gaussian0914. We set up an optimized electronic structure and vibration calculations of both isomers of azobenzene. From the obtained results, we calculated the equilibrium bond distances, angles, and bond angle force constants. To optimize the dihedral parameters, we generated quantum mechanical (QM) target data of a relaxed potential energy surface scan, using three different dihedral angles (N-N-C-C, C-N-N-C, N-C-C-C). Each angle was scanned in positive and negative directions with six scan steps of 15° each. Then, we refined our dihedral parameters to obtain a potential energy plot similar to that generated from the QM target data. We used the VMD Force Field Toolkit plugin15 for refined calculations of bond, angle, and dihedral parameters. Partial atomic charges were calculated from the electrostatic potential of both the ligand and the toluene molecules in a toluene medium using the CHELPG algorithm16. We implemented the CHARMM general force field17,18 for the bond, angle, and dihedral parameters of the alkane chains of the ligands.
Nonbonding interactions were calculated using a cut-off distance of d = 10 Å whereas long-range electrostatic interactions were calculated by the PME method19 in the presence of periodic boundary conditions. Bulk van der Waals (vdW) coupling of NPs was described by the potential energy acting between the NPs’ gold cores20-22:
.
Here, A is the Hamaker constant (A = 1.95 eV), R is the radius of the gold core (R = 1.3 nm), and D is the distance between the centers of the gold core. The simulations were performed with NAMD23. The systems were simulated in the NPT ensemble, using Langevin dynamics with a damping constant of and a time step of 2 fs.
First, we modeled interactions between NPs functionalized with i) trans-1 and ii) cis-1 in a toluene box saturated (side water reservoir) with water (ratio of toluene-to-water molecules = 593/1, corresponding
V (D) = − A12
R
D 1+ D4R
⎛⎝⎜
⎞⎠⎟+ 1
1+ DR+ D2
4R2+ 2 ln
D 1+ D4R
⎛⎝⎜
⎞⎠⎟
R 1+ DR+ D2
4R2⎛⎝⎜
⎞⎠⎟
⎛
⎝
⎜⎜⎜⎜
⎞
⎠
⎟⎟⎟⎟
γ Lang = 0.1 ps−1
© 2015 Macmillan Publishers Limited. All rights reserved

NATURE NANOTECHNOLOGY | www.nature.com/naturenanotechnology 19
SUPPLEMENTARY INFORMATIONDOI: 10.1038/NNANO.2015.256
S18
We also studied the effect of increasing amounts of methanol on the rate of light-induced self-assembly of 6 nm Au·1 (Supplementary Fig. 24). In these experiments, 0.044 µM solutions of NPs (concentration in terms of gold atoms) were placed in toluene containing 0%, 1%, 2%, 3%, and 4% v/v of methanol (no light-induced self-assembly was observed in the presence of higher amounts of methanol in these dilute NP solutions). As the plot in Supplementary Fig. 24 shows, the rate of self-assembly is inversely proportional to the methanol content.
Supplementary Figure 24 | Kinetics of light-induced self-assembly of 6 nm Au·1 in pure toluene (a) and in toluene containing different amounts of methanol: 1% v/v (b), 2% v/v (c), 3% v/v (d), and 4% v/v (e). In all cases, the concentration of the NPs was 0.044 µM. The plot in (f) summarizes the results. 8. Occlusion and release of water molecules from nanoparticle aggregates
NP aggregates were prepared in toluene containing various amounts of water. First, we worked with dry (freshly distilled) toluene. Once the aggregates obtained in dry toluene were deposited on the TEM substrate, they remained stable even after prolonged exposure to the electron beam. In sharp contrast, aggregates obtained in technical-grade toluene (containing residual water), abruptly “exploded” after ~30 seconds of exposure to a focused electron beam (see, e.g., Supplementary Fig. 25 (left) and Fig. 2a in the main text). However, when the same aggregates were deposited on the TEM substrate and irradiated with visible light, no “explosion” events were observed during a similar inspection by TEM – instead, only disassembled NPs could be seen, indicating that the aggregates disassembled either during exposure to visible light, or more likely, when subjected to the low pressure at which the TEM operates. Finally, for NP aggregates prepared in a saturated solution of water in toluene, the aggregates remained largely intact, with only a small fraction of NPs removed in one direction (e.g. towards the left in Supplementary Fig. 25, right), most likely accompanying the release of a relatively large amount of water.
S19
Supplementary Figure 25 | TEM images of aggregates of 6 nm Au·1 prepared in the presence of small (left) and large (right) amounts of water, and exposed to a focused electron beam. 9. Molecular dynamic simulations
We modeled ligand-functionalized Au NPs using atomistic molecular dynamics (MD) simulations. Each model NP had a gold core of 2.6 nm in diameter, and was covered by 98 molecules of 1. We prepared our forcefield for trans- and cis-1 in toluene as an implicit solvent (IEFPCM continuum solvent model)13 using MP2 level ab initio calculations performed with Gaussian0914. We set up an optimized electronic structure and vibration calculations of both isomers of azobenzene. From the obtained results, we calculated the equilibrium bond distances, angles, and bond angle force constants. To optimize the dihedral parameters, we generated quantum mechanical (QM) target data of a relaxed potential energy surface scan, using three different dihedral angles (N-N-C-C, C-N-N-C, N-C-C-C). Each angle was scanned in positive and negative directions with six scan steps of 15° each. Then, we refined our dihedral parameters to obtain a potential energy plot similar to that generated from the QM target data. We used the VMD Force Field Toolkit plugin15 for refined calculations of bond, angle, and dihedral parameters. Partial atomic charges were calculated from the electrostatic potential of both the ligand and the toluene molecules in a toluene medium using the CHELPG algorithm16. We implemented the CHARMM general force field17,18 for the bond, angle, and dihedral parameters of the alkane chains of the ligands.
Nonbonding interactions were calculated using a cut-off distance of d = 10 Å whereas long-range electrostatic interactions were calculated by the PME method19 in the presence of periodic boundary conditions. Bulk van der Waals (vdW) coupling of NPs was described by the potential energy acting between the NPs’ gold cores20-22:
.
Here, A is the Hamaker constant (A = 1.95 eV), R is the radius of the gold core (R = 1.3 nm), and D is the distance between the centers of the gold core. The simulations were performed with NAMD23. The systems were simulated in the NPT ensemble, using Langevin dynamics with a damping constant of and a time step of 2 fs.
First, we modeled interactions between NPs functionalized with i) trans-1 and ii) cis-1 in a toluene box saturated (side water reservoir) with water (ratio of toluene-to-water molecules = 593/1, corresponding
V (D) = − A12
R
D 1+ D4R
⎛⎝⎜
⎞⎠⎟+ 1
1+ DR+ D2
4R2+ 2 ln
D 1+ D4R
⎛⎝⎜
⎞⎠⎟
R 1+ DR+ D2
4R2⎛⎝⎜
⎞⎠⎟
⎛
⎝
⎜⎜⎜⎜
⎞
⎠
⎟⎟⎟⎟
γ Lang = 0.1 ps−1
© 2015 Macmillan Publishers Limited. All rights reserved

20 NATURE NANOTECHNOLOGY | www.nature.com/naturenanotechnology
SUPPLEMENTARY INFORMATION DOI: 10.1038/NNANO.2015.256
S20
to a saturated solution of water in toluene at room temperature). We modeled two systems with i) three trans-1-coated NPs, and ii) three cis-1-coated NPs. The initial distance between the NP centers was 75-80 Å. After 15 ns of simulation, the separation between the centers of cis-1-coated NPs decreased to 50-55 Å, whereas the separation between trans-1-coated NPs increased to 90-95 Å, as shown in Fig. 2c in the main text. Therefore, only NPs functionalized with cis-azobenzene can self-assemble in water-saturated toluene. The surfaces of each of the cis-1-coated NPs had 5-7 water molecules adsorbed on them, with the H2O molecules interacting via hydrogen bonds with the N=N moieties (configuration stable for ~1 ns). However, no stable water adsorption could be seen on trans-1-coated NPs. Movies showing the behavior of cis-1- and trans-1-functionalized gold NPs can be provided upon request or accessed at https://drive.google.com/a/uic.edu/file/d/0B5lgIuuyVEaWSEpCUXZ6RmZfTk0 and https://drive.google.com/a/uic.edu/file/d/0B5lgIuuyVEaWUzBBYlZiZU5OOWM, respectively.
Next, we studied the stability of water clusters within cavities between cis-1-coated NPs. First, we prepared systems comprising four cis-1-coated NPs arranged in a tetrahedral configuration, containing 5, 10, and 20 water molecules inside the cavities, in water-saturated toluene (box of dimensions 21.5×15.5×15.5 nm3). After simulating the systems for t = 60 ns, we found that the cluster comprising five water molecules was unstable, whereas clusters comprising 10 and 20 water molecules were highly stable, with the cluster comprising 10 water molecules increasing in size (until the number of water molecules reached ~20) (Supplementary Fig. 26a). In contrast, when the same clusters of 5, 10, and 20 water molecules were placed in bulk toluene, only the largest one (20 water molecules) was stable. From these observations, we conclude that the cavity of self-assembled NPs is more supportive for water clusters than bulk toluene.
We also modeled the rearrangement of water molecules in larger systems comprising 13 assembled cis-1-coated NPs, each having 13 water molecules randomly placed on their surfaces, in water-saturated toluene. In the course of the simulations, cis-1-coated NPs quickly formed a compact aggregate (Supplementary Fig. 26b, c), whereas water molecules rearranged into nuclei or were slowly released outside the aggregate. After 90 ns, the system appeared stable (Supplementary Fig. 26b, c) with only 60-70 (out of 169) water molecules inside the NP aggregate (i.e., ~5 water molecules per NP; Supplementary Fig. 26d). The distribution of water clusters (in terms of the number of water molecules per cluster) within the aggregate of 13 cis-1-coated NPs is shown in Supplementary Fig. 26d, inset. Larger clusters of about 12-15 water molecules were found at around 60-75 ns. However, these relatively large clusters broke (at ~90 ns) into smaller ones, featuring a chain-like arrangement of water molecules and other complex structures (see the molecules in Supplementary Fig. 26d). These data show that larger NP assemblies support slightly smaller and more exotic water clusters as compared with smaller NP assemblies, where the occluded water molecules have direct contact with the solvent.
S21
Supplementary Figure 26 | Stabilization and redistribution of water molecules in the cavities of cis-1-functionalized 2.6 nm Au NPs self-assembled in water-saturated toluene. a, A stable cluster of 20 water molecules between four NPs after 60 ns. A movie showing a fluctuating water cluster can be provided upon request or accessed at https://drive.google.com/a/uic.edu/file/d/0B5lgIuuyVEaWU1NPUkE2R3h3MlU. b,c, Redistribution of water within 13 self-assembled cis-1-coated NPs after 90 ns. d, Time dependence of the total number of water molecules within self-assembled cis-1-coated NPs and their distribution (inset). Two typical clusters, each comprising seven water molecules, formed within cis-1-coated NPs, are shown.
Finally, we modeled the transformation of assemblies of cis-1-coated NPs in vacuum upon cis-to-trans isomerization. To model the experiment, we prepared a collection of 13 cis-1-coated NPs containing 80 water molecules (i.e., slightly more than the equilibrated 60-70 water molecules), and equilibrated it for 1 ns in vacuum (box having dimensions 45×45×45 nm3). Then, we simulated the system in the NVT ensemble by a Langevin dynamics with a very small damping constant of , while maintaining a time step of 0.02 fs. In the simulation, we transformed cis isomer to the trans one by changing the potential of the C-N-N-C dihedral angle from to , where θ is the dihedral angle, and K1 and K2 are the dihedral force constants. The trans potential has only one minimum, but its equilibrium dihedral strength (local curvature of V) is the same as in the cis potential; the dihedral force constant was increased four times, from K1 = 13 kcal/mol to K2 = 52 kcal/mol. We also changed the partial charges of all atoms of the moiety including the –OCH2– linkage of the ligands. The frames were saved with a 5 fs time separation to observe rapid movement of the occluded water.
Supplementary Figure 27 shows that the initial velocity of the occluded water molecules is very rapid, between 800 and 2,200 m/s, depending on their positions (fastest for the molecules close to the outer surface of the NP aggregate). For a very short time (20 ps), the outward motion of the trans-1-coated NPs was also very rapid. At the boundary of the aggregate, the NPs’ radial outward velocities were
γ Lang = 10−6 ps−1
V cis (θ ) = K1(1+ cos(2θ −180))V trans (θ ) = K2 (1+ cosθ )
© 2015 Macmillan Publishers Limited. All rights reserved

NATURE NANOTECHNOLOGY | www.nature.com/naturenanotechnology 21
SUPPLEMENTARY INFORMATIONDOI: 10.1038/NNANO.2015.256
S20
to a saturated solution of water in toluene at room temperature). We modeled two systems with i) three trans-1-coated NPs, and ii) three cis-1-coated NPs. The initial distance between the NP centers was 75-80 Å. After 15 ns of simulation, the separation between the centers of cis-1-coated NPs decreased to 50-55 Å, whereas the separation between trans-1-coated NPs increased to 90-95 Å, as shown in Fig. 2c in the main text. Therefore, only NPs functionalized with cis-azobenzene can self-assemble in water-saturated toluene. The surfaces of each of the cis-1-coated NPs had 5-7 water molecules adsorbed on them, with the H2O molecules interacting via hydrogen bonds with the N=N moieties (configuration stable for ~1 ns). However, no stable water adsorption could be seen on trans-1-coated NPs. Movies showing the behavior of cis-1- and trans-1-functionalized gold NPs can be provided upon request or accessed at https://drive.google.com/a/uic.edu/file/d/0B5lgIuuyVEaWSEpCUXZ6RmZfTk0 and https://drive.google.com/a/uic.edu/file/d/0B5lgIuuyVEaWUzBBYlZiZU5OOWM, respectively.
Next, we studied the stability of water clusters within cavities between cis-1-coated NPs. First, we prepared systems comprising four cis-1-coated NPs arranged in a tetrahedral configuration, containing 5, 10, and 20 water molecules inside the cavities, in water-saturated toluene (box of dimensions 21.5×15.5×15.5 nm3). After simulating the systems for t = 60 ns, we found that the cluster comprising five water molecules was unstable, whereas clusters comprising 10 and 20 water molecules were highly stable, with the cluster comprising 10 water molecules increasing in size (until the number of water molecules reached ~20) (Supplementary Fig. 26a). In contrast, when the same clusters of 5, 10, and 20 water molecules were placed in bulk toluene, only the largest one (20 water molecules) was stable. From these observations, we conclude that the cavity of self-assembled NPs is more supportive for water clusters than bulk toluene.
We also modeled the rearrangement of water molecules in larger systems comprising 13 assembled cis-1-coated NPs, each having 13 water molecules randomly placed on their surfaces, in water-saturated toluene. In the course of the simulations, cis-1-coated NPs quickly formed a compact aggregate (Supplementary Fig. 26b, c), whereas water molecules rearranged into nuclei or were slowly released outside the aggregate. After 90 ns, the system appeared stable (Supplementary Fig. 26b, c) with only 60-70 (out of 169) water molecules inside the NP aggregate (i.e., ~5 water molecules per NP; Supplementary Fig. 26d). The distribution of water clusters (in terms of the number of water molecules per cluster) within the aggregate of 13 cis-1-coated NPs is shown in Supplementary Fig. 26d, inset. Larger clusters of about 12-15 water molecules were found at around 60-75 ns. However, these relatively large clusters broke (at ~90 ns) into smaller ones, featuring a chain-like arrangement of water molecules and other complex structures (see the molecules in Supplementary Fig. 26d). These data show that larger NP assemblies support slightly smaller and more exotic water clusters as compared with smaller NP assemblies, where the occluded water molecules have direct contact with the solvent.
S21
Supplementary Figure 26 | Stabilization and redistribution of water molecules in the cavities of cis-1-functionalized 2.6 nm Au NPs self-assembled in water-saturated toluene. a, A stable cluster of 20 water molecules between four NPs after 60 ns. A movie showing a fluctuating water cluster can be provided upon request or accessed at https://drive.google.com/a/uic.edu/file/d/0B5lgIuuyVEaWU1NPUkE2R3h3MlU. b,c, Redistribution of water within 13 self-assembled cis-1-coated NPs after 90 ns. d, Time dependence of the total number of water molecules within self-assembled cis-1-coated NPs and their distribution (inset). Two typical clusters, each comprising seven water molecules, formed within cis-1-coated NPs, are shown.
Finally, we modeled the transformation of assemblies of cis-1-coated NPs in vacuum upon cis-to-trans isomerization. To model the experiment, we prepared a collection of 13 cis-1-coated NPs containing 80 water molecules (i.e., slightly more than the equilibrated 60-70 water molecules), and equilibrated it for 1 ns in vacuum (box having dimensions 45×45×45 nm3). Then, we simulated the system in the NVT ensemble by a Langevin dynamics with a very small damping constant of , while maintaining a time step of 0.02 fs. In the simulation, we transformed cis isomer to the trans one by changing the potential of the C-N-N-C dihedral angle from to , where θ is the dihedral angle, and K1 and K2 are the dihedral force constants. The trans potential has only one minimum, but its equilibrium dihedral strength (local curvature of V) is the same as in the cis potential; the dihedral force constant was increased four times, from K1 = 13 kcal/mol to K2 = 52 kcal/mol. We also changed the partial charges of all atoms of the moiety including the –OCH2– linkage of the ligands. The frames were saved with a 5 fs time separation to observe rapid movement of the occluded water.
Supplementary Figure 27 shows that the initial velocity of the occluded water molecules is very rapid, between 800 and 2,200 m/s, depending on their positions (fastest for the molecules close to the outer surface of the NP aggregate). For a very short time (20 ps), the outward motion of the trans-1-coated NPs was also very rapid. At the boundary of the aggregate, the NPs’ radial outward velocities were
γ Lang = 10−6 ps−1
V cis (θ ) = K1(1+ cos(2θ −180))V trans (θ ) = K2 (1+ cosθ )
© 2015 Macmillan Publishers Limited. All rights reserved

22 NATURE NANOTECHNOLOGY | www.nature.com/naturenanotechnology
SUPPLEMENTARY INFORMATION DOI: 10.1038/NNANO.2015.256
S22
120-150 m/s. Eventually the NP aggregate stabilizes, predominantly by vdW coupling of the ligands. In the simulations, the bulk vdW potential was present, but internal degrees of gold were neglected (the mass was correct).
Supplementary Figure 27 | Light-induced conversion of a cluster originally comprising 13 assembled cis-1-coated 2.6 nm Au nanoparticles, filled with 80 H2O molecules, in vacuum. At t = 0, all cis-1 were transformed into trans-1. Trans-1-coated nanoparticles expand rapidly within 30 ps, after which they rearrange into a much looser cluster, stabilized (in vacuum) by vdW and weak polar coupling. In contrast, the same cluster in vacuum remains stable if the 1 ligands are retained in the cis state. A movie corresponding to the process can be provided upon access or accessed at https://drive.google.com/a/uic.edu/file/d/0B5lgIuuyVEaWUVVSdzV4SmhsSk0.
S23
10. Synthesis and occlusion studies of a model dye
The compound was synthesized based on a previously published procedure24.
Supplementary Figure 28 | 1H NMR spectrum of 4 (300 MHz, DMSO-d6). We used absorption spectroscopy to quantify occlusion of 4 by differently sized NPs, taking advantage of the high extinction coefficient of 4. In a typical experiment, a toluene solution of 4 and Au·1 was exposed to UV light. The sample was centrifuged, resulting in the quantitative removal of NPs. The supernatant was collected and the solids were washed with toluene (in the dark, to avoid any re-isomerization of azobenzene and NP redissolution). Combined liquid fractions were analyzed spectrophotometrically, and the amount of 4 removed from the solution was calculated. At the same time, we confirmed the presence of 4 in the precipitated NP fraction. 11. Occlusion efficiency of compounds containing different functional groups
We used gas chromatography (GC) to study the occlusion of chemical compounds containing various chemical groups. In a typical experiment, we first recorded a gas chromatogram of a 1:1 (molar ratio) mixture of a given compound and dodecane (standard). (We verified that dodecane was a suitable standard by analyzing its toluene solutions before and after its possible removal by 6 nm Au·1; in these control experiments, we saw no decrease in the signal intensity caused by aggregating NPs for a variety of NP-to-dodecane ratios.) Next, the 1:1 mixture was UV-irradiated in toluene with 6 nm Au·1 for 12 minutes (the ratio of the molecules of interest to NPs was 100:1). The solution was centrifuged immediately without exposing to it visible light, resulting in the removal of aggregated NPs and occluded molecules. Finally, the supernatant was analyzed by GC, and the ratio of peaks corresponding to dodecane and the molecule of interest was used to calculate the amount of occluded
NO2HN
NON
HO
© 2015 Macmillan Publishers Limited. All rights reserved

NATURE NANOTECHNOLOGY | www.nature.com/naturenanotechnology 23
SUPPLEMENTARY INFORMATIONDOI: 10.1038/NNANO.2015.256
S22
120-150 m/s. Eventually the NP aggregate stabilizes, predominantly by vdW coupling of the ligands. In the simulations, the bulk vdW potential was present, but internal degrees of gold were neglected (the mass was correct).
Supplementary Figure 27 | Light-induced conversion of a cluster originally comprising 13 assembled cis-1-coated 2.6 nm Au nanoparticles, filled with 80 H2O molecules, in vacuum. At t = 0, all cis-1 were transformed into trans-1. Trans-1-coated nanoparticles expand rapidly within 30 ps, after which they rearrange into a much looser cluster, stabilized (in vacuum) by vdW and weak polar coupling. In contrast, the same cluster in vacuum remains stable if the 1 ligands are retained in the cis state. A movie corresponding to the process can be provided upon access or accessed at https://drive.google.com/a/uic.edu/file/d/0B5lgIuuyVEaWUVVSdzV4SmhsSk0.
S23
10. Synthesis and occlusion studies of a model dye
The compound was synthesized based on a previously published procedure24.
Supplementary Figure 28 | 1H NMR spectrum of 4 (300 MHz, DMSO-d6). We used absorption spectroscopy to quantify occlusion of 4 by differently sized NPs, taking advantage of the high extinction coefficient of 4. In a typical experiment, a toluene solution of 4 and Au·1 was exposed to UV light. The sample was centrifuged, resulting in the quantitative removal of NPs. The supernatant was collected and the solids were washed with toluene (in the dark, to avoid any re-isomerization of azobenzene and NP redissolution). Combined liquid fractions were analyzed spectrophotometrically, and the amount of 4 removed from the solution was calculated. At the same time, we confirmed the presence of 4 in the precipitated NP fraction. 11. Occlusion efficiency of compounds containing different functional groups
We used gas chromatography (GC) to study the occlusion of chemical compounds containing various chemical groups. In a typical experiment, we first recorded a gas chromatogram of a 1:1 (molar ratio) mixture of a given compound and dodecane (standard). (We verified that dodecane was a suitable standard by analyzing its toluene solutions before and after its possible removal by 6 nm Au·1; in these control experiments, we saw no decrease in the signal intensity caused by aggregating NPs for a variety of NP-to-dodecane ratios.) Next, the 1:1 mixture was UV-irradiated in toluene with 6 nm Au·1 for 12 minutes (the ratio of the molecules of interest to NPs was 100:1). The solution was centrifuged immediately without exposing to it visible light, resulting in the removal of aggregated NPs and occluded molecules. Finally, the supernatant was analyzed by GC, and the ratio of peaks corresponding to dodecane and the molecule of interest was used to calculate the amount of occluded
NO2HN
NON
HO
© 2015 Macmillan Publishers Limited. All rights reserved
24 NATURE NANOTECHNOLOGY | www.nature.com/naturenanotechnology
SUPPLEMENTARY INFORMATION DOI: 10.1038/NNANO.2015.256
S24
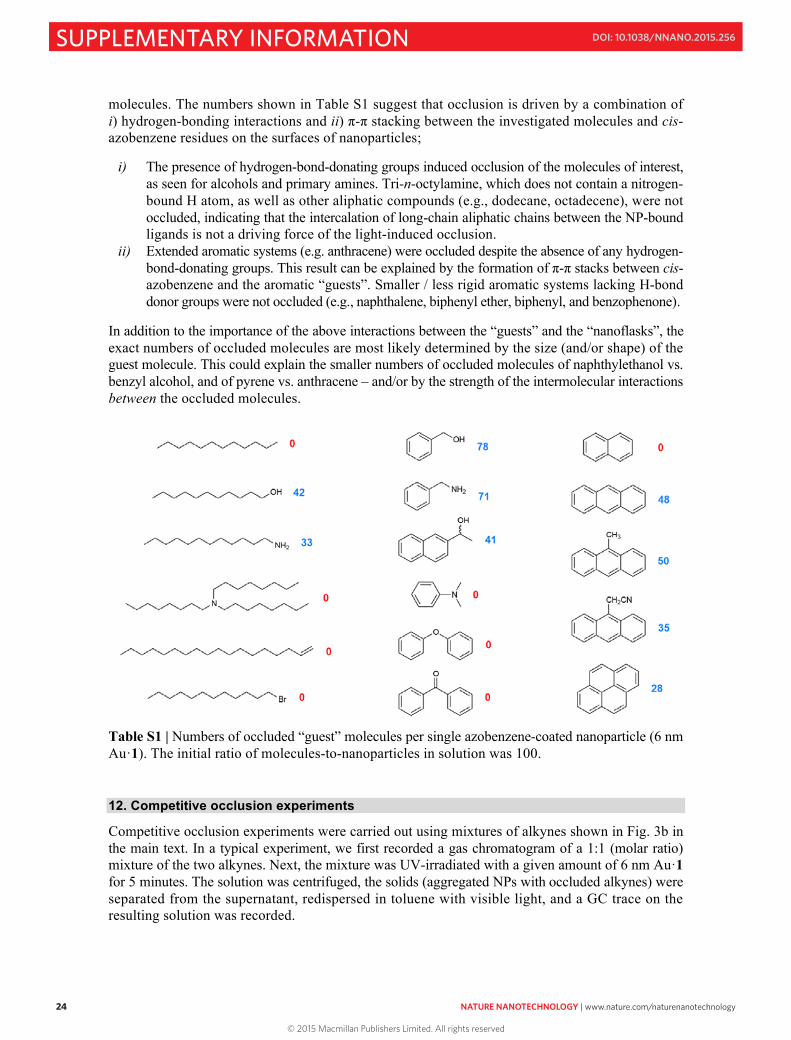
molecules. The numbers shown in Table S1 suggest that occlusion is driven by a combination of i) hydrogen-bonding interactions and ii) π-π stacking between the investigated molecules and cis-azobenzene residues on the surfaces of nanoparticles;
i) The presence of hydrogen-bond-donating groups induced occlusion of the molecules of interest, as seen for alcohols and primary amines. Tri-n-octylamine, which does not contain a nitrogen-bound H atom, as well as other aliphatic compounds (e.g., dodecane, octadecene), were not occluded, indicating that the intercalation of long-chain aliphatic chains between the NP-bound ligands is not a driving force of the light-induced occlusion.
ii) Extended aromatic systems (e.g. anthracene) were occluded despite the absence of any hydrogen-bond-donating groups. This result can be explained by the formation of π-π stacks between cis-azobenzene and the aromatic “guests”. Smaller / less rigid aromatic systems lacking H-bond donor groups were not occluded (e.g., naphthalene, biphenyl ether, biphenyl, and benzophenone).
In addition to the importance of the above interactions between the “guests” and the “nanoflasks”, the exact numbers of occluded molecules are most likely determined by the size (and/or shape) of the guest molecule. This could explain the smaller numbers of occluded molecules of naphthylethanol vs. benzyl alcohol, and of pyrene vs. anthracene – and/or by the strength of the intermolecular interactions between the occluded molecules.
Table S1 | Numbers of occluded “guest” molecules per single azobenzene-coated nanoparticle (6 nm Au·1). The initial ratio of molecules-to-nanoparticles in solution was 100. 12. Competitive occlusion experiments
Competitive occlusion experiments were carried out using mixtures of alkynes shown in Fig. 3b in the main text. In a typical experiment, we first recorded a gas chromatogram of a 1:1 (molar ratio) mixture of the two alkynes. Next, the mixture was UV-irradiated with a given amount of 6 nm Au·1 for 5 minutes. The solution was centrifuged, the solids (aggregated NPs with occluded alkynes) were separated from the supernatant, redispersed in toluene with visible light, and a GC trace on the resulting solution was recorded.
S25
13. Synthesis and characterization of PET and HPET/PET-protected Au25 nanoclusters
We attempted to directly visualize the occlusion process by using relatively large azobenzene-coated nanoparticles (we used 17 nm Fe3O4 NPs, i.e., 17 nm Fe3O4·2,; azobenzene-coated gold NPs of diameters ≥8 nm were poorly soluble) to occlude very small Au NPs (Au25 nanoclusters). In these experiments, we used the relatively polar clusters coated with mixed monolayers of 2-phenylethanethiol (PET) and 2-(4-hydroxyphenyl)ethanethiol (HPET) (occlusion expected), and, as a control, the nonpolar PET-protected nanoclusters. 13A. Synthesis of [Au25(PET)18]– TOA+
[Au25(PET)18]– TOA+ was prepared based on a previously published procedure25. HAuCl4·3H2O (80 mg; 0.203 mmol) was dissolved in 15 ml of THF. Tetra-n-octylammonium bromide (TOAB) (129 mg; 0.235 mmol) was added and the mixture was stirred vigorously for 15 min; the color turned from yellow to orange. The stirring speed was reduced and the reaction mixture was cooled to 0 °C on an ice bath. PET (140 µL; 1.02 mmol; Au:S molar ratio = 1:5) was added dropwise over a period of about 2 min. During the addition of PET, the solution turned pale yellow and then colorless. Once the solution became colorless, the stirring speed was increased and a freshly prepared, ice-cold aqueous solution of NaBH4 (77 mg; 2.03 mmol, Au:NaBH4 molar ratio = 1:10) in 5 mL of water was added immediately. The reaction mixture quickly turned black and was stirred for an additional 7 hr. THF was removed in vacuo resulting in a mixture of an aqueous phase and a black oil. The aqueous fraction was removed with a syringe and the black oil was collected and washed with deionized water three times. 15 mL of methanol was then added and Au nanoclusters were precipitated out overnight in the freezer. Supernatant was discarded and the precipitate was washed with methanol several times. Finally, the black solids were dissolved in acetonitrile and the resulting solution was centrifuged at ~5,000 rpm for 15 min, allowing for removal of AuI-PET species, while pure [Au25(PET)18]– TOA+ remained dissolved. The supernatant was collected and the solvent was evaporated in vacuo at room temperature. The resulting solids were readily soluble in toluene. Supplementary Figure 33, left, shows UV-Vis spectra of the resulting nanoclusters; a MALDI spectrum is shown in Supplementary Fig. 34.
13B. Synthesis of [Au25(PET)18-n(HPET)n]– TOA+
First, HPET was synthesized as follows:
4-hydroxyphenethyl 4-methylbenzenesulfonate: 2-(4-hydroxyphenyl)ethanol (9.80 g; 70.93 mmol) was dissolved in 15 mL of pyridine and the solution was cooled to –10 °C. Under extensive stirring, tosyl chloride (15.00 g; 78.7 mmol) was added dropwise over a period of 30 min. The reaction was stirred at 0 °C for 2 hr. The reaction mixture was poured into 400 mL of ice-cold water and stirred for 1 hr. The mixture was extracted with Et2O (2 × 100 mL) and the combined organic phases were washed with 1% HCl (2 × 100 mL) and water (2 × 100 mL). After drying over MgSO4 and evaporation of the solvent under reduced pressure, the product was purified by column chromatography (hexane-ethyl acetate, 2:1) to afford the tosylate (7.189 g; 24.59 mmol: 34.6%) as a white solid. 1H NMR (CDCl3): δ (ppm) 2.42 (s, 3H), 2.85 (t, J = 7.2 Hz, 2H), 4.15 (t, J = 7.1 Hz, 2H), 5.46 (s, br., 1H), 6.71 (d, J = 8.6 Hz, 2H), 6.94 (d, J = 8.6 Hz, 2H), 7.27 (d, J = 8.2 Hz, 2H), 7.68 (d, J = 8.2 Hz, 2H). 13C NMR (CDCl3): δ (ppm) 21.64, 34.47, 71.02, 115.46, 127.81, 128.07, 128.48, 129.83, 130.07, 144.80, 154.73.
OHHO
OHOS
O
O
OHHSTsCl, Py
-10 oC
Thiourea, NaOH
H2O/EtOH, reflux
© 2015 Macmillan Publishers Limited. All rights reserved
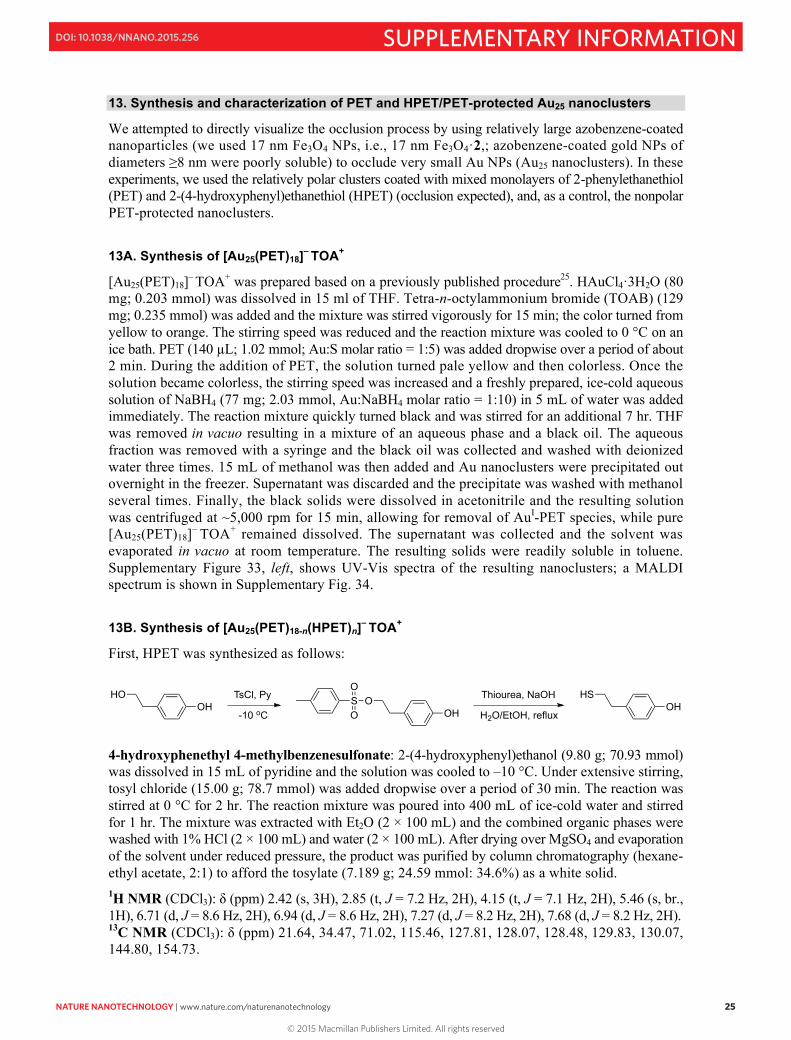
NATURE NANOTECHNOLOGY | www.nature.com/naturenanotechnology 25
SUPPLEMENTARY INFORMATIONDOI: 10.1038/NNANO.2015.256
S24
molecules. The numbers shown in Table S1 suggest that occlusion is driven by a combination of i) hydrogen-bonding interactions and ii) π-π stacking between the investigated molecules and cis-azobenzene residues on the surfaces of nanoparticles;
i) The presence of hydrogen-bond-donating groups induced occlusion of the molecules of interest, as seen for alcohols and primary amines. Tri-n-octylamine, which does not contain a nitrogen-bound H atom, as well as other aliphatic compounds (e.g., dodecane, octadecene), were not occluded, indicating that the intercalation of long-chain aliphatic chains between the NP-bound ligands is not a driving force of the light-induced occlusion.
ii) Extended aromatic systems (e.g. anthracene) were occluded despite the absence of any hydrogen-bond-donating groups. This result can be explained by the formation of π-π stacks between cis-azobenzene and the aromatic “guests”. Smaller / less rigid aromatic systems lacking H-bond donor groups were not occluded (e.g., naphthalene, biphenyl ether, biphenyl, and benzophenone).
In addition to the importance of the above interactions between the “guests” and the “nanoflasks”, the exact numbers of occluded molecules are most likely determined by the size (and/or shape) of the guest molecule. This could explain the smaller numbers of occluded molecules of naphthylethanol vs. benzyl alcohol, and of pyrene vs. anthracene – and/or by the strength of the intermolecular interactions between the occluded molecules.
Table S1 | Numbers of occluded “guest” molecules per single azobenzene-coated nanoparticle (6 nm Au·1). The initial ratio of molecules-to-nanoparticles in solution was 100. 12. Competitive occlusion experiments
Competitive occlusion experiments were carried out using mixtures of alkynes shown in Fig. 3b in the main text. In a typical experiment, we first recorded a gas chromatogram of a 1:1 (molar ratio) mixture of the two alkynes. Next, the mixture was UV-irradiated with a given amount of 6 nm Au·1 for 5 minutes. The solution was centrifuged, the solids (aggregated NPs with occluded alkynes) were separated from the supernatant, redispersed in toluene with visible light, and a GC trace on the resulting solution was recorded.
S25
13. Synthesis and characterization of PET and HPET/PET-protected Au25 nanoclusters
We attempted to directly visualize the occlusion process by using relatively large azobenzene-coated nanoparticles (we used 17 nm Fe3O4 NPs, i.e., 17 nm Fe3O4·2,; azobenzene-coated gold NPs of diameters ≥8 nm were poorly soluble) to occlude very small Au NPs (Au25 nanoclusters). In these experiments, we used the relatively polar clusters coated with mixed monolayers of 2-phenylethanethiol (PET) and 2-(4-hydroxyphenyl)ethanethiol (HPET) (occlusion expected), and, as a control, the nonpolar PET-protected nanoclusters. 13A. Synthesis of [Au25(PET)18]– TOA+
[Au25(PET)18]– TOA+ was prepared based on a previously published procedure25. HAuCl4·3H2O (80 mg; 0.203 mmol) was dissolved in 15 ml of THF. Tetra-n-octylammonium bromide (TOAB) (129 mg; 0.235 mmol) was added and the mixture was stirred vigorously for 15 min; the color turned from yellow to orange. The stirring speed was reduced and the reaction mixture was cooled to 0 °C on an ice bath. PET (140 µL; 1.02 mmol; Au:S molar ratio = 1:5) was added dropwise over a period of about 2 min. During the addition of PET, the solution turned pale yellow and then colorless. Once the solution became colorless, the stirring speed was increased and a freshly prepared, ice-cold aqueous solution of NaBH4 (77 mg; 2.03 mmol, Au:NaBH4 molar ratio = 1:10) in 5 mL of water was added immediately. The reaction mixture quickly turned black and was stirred for an additional 7 hr. THF was removed in vacuo resulting in a mixture of an aqueous phase and a black oil. The aqueous fraction was removed with a syringe and the black oil was collected and washed with deionized water three times. 15 mL of methanol was then added and Au nanoclusters were precipitated out overnight in the freezer. Supernatant was discarded and the precipitate was washed with methanol several times. Finally, the black solids were dissolved in acetonitrile and the resulting solution was centrifuged at ~5,000 rpm for 15 min, allowing for removal of AuI-PET species, while pure [Au25(PET)18]– TOA+ remained dissolved. The supernatant was collected and the solvent was evaporated in vacuo at room temperature. The resulting solids were readily soluble in toluene. Supplementary Figure 33, left, shows UV-Vis spectra of the resulting nanoclusters; a MALDI spectrum is shown in Supplementary Fig. 34.
13B. Synthesis of [Au25(PET)18-n(HPET)n]– TOA+
First, HPET was synthesized as follows:
4-hydroxyphenethyl 4-methylbenzenesulfonate: 2-(4-hydroxyphenyl)ethanol (9.80 g; 70.93 mmol) was dissolved in 15 mL of pyridine and the solution was cooled to –10 °C. Under extensive stirring, tosyl chloride (15.00 g; 78.7 mmol) was added dropwise over a period of 30 min. The reaction was stirred at 0 °C for 2 hr. The reaction mixture was poured into 400 mL of ice-cold water and stirred for 1 hr. The mixture was extracted with Et2O (2 × 100 mL) and the combined organic phases were washed with 1% HCl (2 × 100 mL) and water (2 × 100 mL). After drying over MgSO4 and evaporation of the solvent under reduced pressure, the product was purified by column chromatography (hexane-ethyl acetate, 2:1) to afford the tosylate (7.189 g; 24.59 mmol: 34.6%) as a white solid. 1H NMR (CDCl3): δ (ppm) 2.42 (s, 3H), 2.85 (t, J = 7.2 Hz, 2H), 4.15 (t, J = 7.1 Hz, 2H), 5.46 (s, br., 1H), 6.71 (d, J = 8.6 Hz, 2H), 6.94 (d, J = 8.6 Hz, 2H), 7.27 (d, J = 8.2 Hz, 2H), 7.68 (d, J = 8.2 Hz, 2H). 13C NMR (CDCl3): δ (ppm) 21.64, 34.47, 71.02, 115.46, 127.81, 128.07, 128.48, 129.83, 130.07, 144.80, 154.73.
OHHO
OHOS
O
O
OHHSTsCl, Py
-10 oC
Thiourea, NaOH
H2O/EtOH, reflux
© 2015 Macmillan Publishers Limited. All rights reserved

26 NATURE NANOTECHNOLOGY | www.nature.com/naturenanotechnology
SUPPLEMENTARY INFORMATION DOI: 10.1038/NNANO.2015.256
S26
Supplementary Figure 29 | 1H NMR spectrum of 4-hydroxyphenethyl 4-methylbenzenesulfonate (300 MHz, CDCl3).
Supplementary Figure 30 | 13C NMR spectrum of 4-hydroxyphenethyl 4-methylbenzenesulfonate (300 MHz, CDCl3).
OHOS
O
O
OHOS
O
O
S27
2-(4-hydroxyphenyl)ethanethiol (HPET): 4-hydroxyphenethyl 4-methylbenzenesulfonate (2.00 g; 6.8 mmol) was dissolved in 10 mL of EtOH. Thiourea (57 mg; 7.5 mmol) and water (300 µL) were added and the mixture was refluxed for 3 hr. NaOH (400 mg; 10 mmol) dissolved in water (3.5 mL) was added and the mixture was refluxed for another 2.5 h. The reaction mixture was allowed to cool to room temperature and the volume of the solvent was reduced by evaporation under reduced pressure. Water (20 mL) was added and the pH was adjusted to 7 by dropwise addition of HCl (1% in water). The mixture was extracted with DCM (3 × 50 mL), the combined organic phases were washed with water (50 mL), dried over MgSO4, and evaporated to dryness. The crude product was purified by column chromatography to afford HPET (553 mg; 3.59 mmol; 52.8 %) as an off-white solid. 1H NMR (CDCl3): δ (ppm) 1.40 (t, J = 7.7 Hz, 1H), 2.74 (m, 2H), 2.84 (m, 2H), 5.56 (s, br., 1H), 6.78 (d, J = 8.3 Hz, 2H), 7.05 (d, J = 8.3 Hz, 2H). 13C NMR (CDCl3): δ (ppm) 26.37, 39.28, 115.44, 129.92, 132.15, 154.02.
Supplementary Figure 31 | 1H NMR spectrum of HPET (300 MHz, CDCl3).
OHHS
© 2015 Macmillan Publishers Limited. All rights reserved
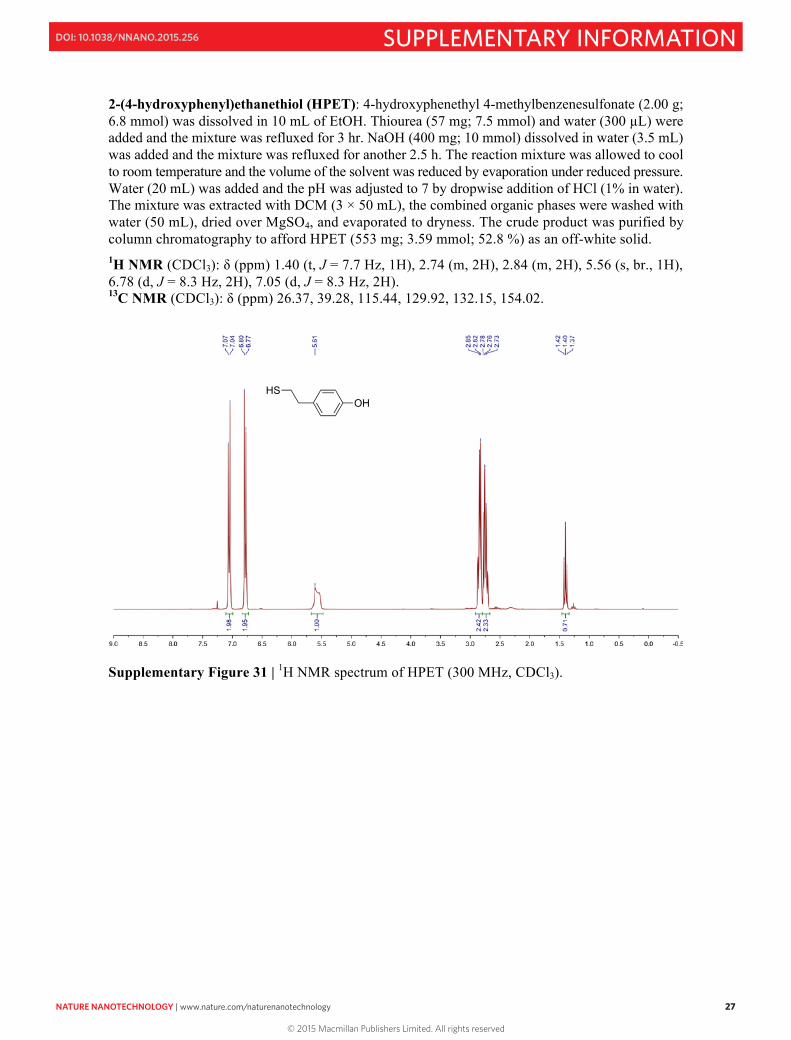
NATURE NANOTECHNOLOGY | www.nature.com/naturenanotechnology 27
SUPPLEMENTARY INFORMATIONDOI: 10.1038/NNANO.2015.256
S26
Supplementary Figure 29 | 1H NMR spectrum of 4-hydroxyphenethyl 4-methylbenzenesulfonate (300 MHz, CDCl3).
Supplementary Figure 30 | 13C NMR spectrum of 4-hydroxyphenethyl 4-methylbenzenesulfonate (300 MHz, CDCl3).
OHOS
O
O
OHOS
O
O
S27
2-(4-hydroxyphenyl)ethanethiol (HPET): 4-hydroxyphenethyl 4-methylbenzenesulfonate (2.00 g; 6.8 mmol) was dissolved in 10 mL of EtOH. Thiourea (57 mg; 7.5 mmol) and water (300 µL) were added and the mixture was refluxed for 3 hr. NaOH (400 mg; 10 mmol) dissolved in water (3.5 mL) was added and the mixture was refluxed for another 2.5 h. The reaction mixture was allowed to cool to room temperature and the volume of the solvent was reduced by evaporation under reduced pressure. Water (20 mL) was added and the pH was adjusted to 7 by dropwise addition of HCl (1% in water). The mixture was extracted with DCM (3 × 50 mL), the combined organic phases were washed with water (50 mL), dried over MgSO4, and evaporated to dryness. The crude product was purified by column chromatography to afford HPET (553 mg; 3.59 mmol; 52.8 %) as an off-white solid. 1H NMR (CDCl3): δ (ppm) 1.40 (t, J = 7.7 Hz, 1H), 2.74 (m, 2H), 2.84 (m, 2H), 5.56 (s, br., 1H), 6.78 (d, J = 8.3 Hz, 2H), 7.05 (d, J = 8.3 Hz, 2H). 13C NMR (CDCl3): δ (ppm) 26.37, 39.28, 115.44, 129.92, 132.15, 154.02.
Supplementary Figure 31 | 1H NMR spectrum of HPET (300 MHz, CDCl3).
OHHS
© 2015 Macmillan Publishers Limited. All rights reserved

28 NATURE NANOTECHNOLOGY | www.nature.com/naturenanotechnology
SUPPLEMENTARY INFORMATION DOI: 10.1038/NNANO.2015.256
S28
Supplementary Figure 32 | 13C NMR spectrum of HPET (75 MHz, CDCl3). Next, [Au25(PET)18-n(HPET)n]– TOA+ nanoclusters were synthesized as follows:
HAuCl4·3H2O (80 mg; 0.203 mmol) was dissolved in 15 ml of THF. Tetra-n-octylammonium bromide (TOAB) (129 mg; 0.235 mmol) was added and the mixture was stirred vigorously for 15 min; the color turned from yellow to orange. The stirring speed was reduced and the reaction mixture was cooled to 0 °C on an ice bath. A solution of PET (70 µL) and HPET (78 mg) (1:1 molar ratio) in 0.5 mL THF, pre-cooled to 0 °C, was added dropwise over a period of about 3 min. During the addition of the thiols, the solution turned pale yellow and then colorless. Once the solution became colorless, the stirring speed was increased and a freshly prepared, ice-cold aqueous solution of NaBH4 (77 mg, 2.03 mmol, Au:NaBH4 molar ratio = 1:10) in 5 mL of water was added at once. The reaction mixture quickly turned black and was stirred an additional 7 hr. THF was removed in vacuo resulting in a mixture of an aqueous phase and a black oil. The aqueous fraction was removed with a syringe and the black oil was collected and washed with deionized water three times, and then three times with a 1.5:1 (v/v) methanol-water mixture to remove an excess of small molecules. The relatively nonpolar nanoclusters were extracted with toluene (the HPET-rich clusters remained undissolved). Toluene was removed in vacuo, resulting in a black solid, from which pure [Au25(PET)18-n(HPET)n]–
TOA+ was extracted with acetonitrile. The PET/HPET ratio on the nanoclusters was determined using 1H NMR by integrating signals of the aromatic protons (6-8 ppm range; see Supplementary Fig. 37): according to the NMR spectra of PET and PET-protected clusters, all aromatic protons of the PET ligands of the Au25(PET)18-n(HPET)n nanoclusters are expected to appear in the 6.9-7.5 ppm range, whereas only 50% of those of HPET are expected in this range. Based on these assumptions, we concluded that the average number of HPET on the nanoclusters, n ≈ 3. Supplementary Fig. 33, right, shows a UV-Vis spectrum of the resulting clusters; a MALDI spectrum is shown in Supplementary Figures 35 and 36.
OHHS
S29
13C. Characterization of [Au25(PET)18]– TOA+ and [Au25(PET)18-n(HPET)n]– TOA+
Supplementary Figure 33 | UV-Vis spectra of PET- and PET/HPET-functionalized Au25 nanoclusters in CH3CN.
Supplementary Figure 34 | Matrix-assisted laser desorption/ionization (MALDI) mass spectrum of [Au25(PET)18]– clusters in the negative linear mode. The small peak at ~6 kDa corresponds to [Au25(PET)18]– having lost an Au4(PET)4 fragment (a common fragmentation behavior of gold nanoclusters; compare with Refs. 26, 27). (All MS studies on nanoclusters were conducted on an AB SCIEX 5800 MALDI TOF/TOF system (Applied Biosystems Intl., Inc.) equipped with a Nd:YAG 355 nm laser with 1 kHz pulse used for desorption ionization. Typical delay times employed were on the order of 550 ns. Accelerating voltage was ~12 kV. Mass spectra were collected in the negative ion mode and were averaged over 200 shots. The matrix and the analyte were both dissolved in toluene. As the matrix, trans-2-[3-(4-tert-butylphenyl)-2-methyl-2-propenylidene]malononitrile (DCTB) was used. Matrix-to-analyte mole ratios varied from 100:1 to 1000:1. The solutions of the matrix and the clusters were mixed and 1-2 µL of the resulting mixtures were applied onto the sample plate and allowed to dry under ambient conditions.)
© 2015 Macmillan Publishers Limited. All rights reserved

NATURE NANOTECHNOLOGY | www.nature.com/naturenanotechnology 29
SUPPLEMENTARY INFORMATIONDOI: 10.1038/NNANO.2015.256
S28
Supplementary Figure 32 | 13C NMR spectrum of HPET (75 MHz, CDCl3). Next, [Au25(PET)18-n(HPET)n]– TOA+ nanoclusters were synthesized as follows:
HAuCl4·3H2O (80 mg; 0.203 mmol) was dissolved in 15 ml of THF. Tetra-n-octylammonium bromide (TOAB) (129 mg; 0.235 mmol) was added and the mixture was stirred vigorously for 15 min; the color turned from yellow to orange. The stirring speed was reduced and the reaction mixture was cooled to 0 °C on an ice bath. A solution of PET (70 µL) and HPET (78 mg) (1:1 molar ratio) in 0.5 mL THF, pre-cooled to 0 °C, was added dropwise over a period of about 3 min. During the addition of the thiols, the solution turned pale yellow and then colorless. Once the solution became colorless, the stirring speed was increased and a freshly prepared, ice-cold aqueous solution of NaBH4 (77 mg, 2.03 mmol, Au:NaBH4 molar ratio = 1:10) in 5 mL of water was added at once. The reaction mixture quickly turned black and was stirred an additional 7 hr. THF was removed in vacuo resulting in a mixture of an aqueous phase and a black oil. The aqueous fraction was removed with a syringe and the black oil was collected and washed with deionized water three times, and then three times with a 1.5:1 (v/v) methanol-water mixture to remove an excess of small molecules. The relatively nonpolar nanoclusters were extracted with toluene (the HPET-rich clusters remained undissolved). Toluene was removed in vacuo, resulting in a black solid, from which pure [Au25(PET)18-n(HPET)n]–
TOA+ was extracted with acetonitrile. The PET/HPET ratio on the nanoclusters was determined using 1H NMR by integrating signals of the aromatic protons (6-8 ppm range; see Supplementary Fig. 37): according to the NMR spectra of PET and PET-protected clusters, all aromatic protons of the PET ligands of the Au25(PET)18-n(HPET)n nanoclusters are expected to appear in the 6.9-7.5 ppm range, whereas only 50% of those of HPET are expected in this range. Based on these assumptions, we concluded that the average number of HPET on the nanoclusters, n ≈ 3. Supplementary Fig. 33, right, shows a UV-Vis spectrum of the resulting clusters; a MALDI spectrum is shown in Supplementary Figures 35 and 36.
OHHS
S29
13C. Characterization of [Au25(PET)18]– TOA+ and [Au25(PET)18-n(HPET)n]– TOA+
Supplementary Figure 33 | UV-Vis spectra of PET- and PET/HPET-functionalized Au25 nanoclusters in CH3CN.
Supplementary Figure 34 | Matrix-assisted laser desorption/ionization (MALDI) mass spectrum of [Au25(PET)18]– clusters in the negative linear mode. The small peak at ~6 kDa corresponds to [Au25(PET)18]– having lost an Au4(PET)4 fragment (a common fragmentation behavior of gold nanoclusters; compare with Refs. 26, 27). (All MS studies on nanoclusters were conducted on an AB SCIEX 5800 MALDI TOF/TOF system (Applied Biosystems Intl., Inc.) equipped with a Nd:YAG 355 nm laser with 1 kHz pulse used for desorption ionization. Typical delay times employed were on the order of 550 ns. Accelerating voltage was ~12 kV. Mass spectra were collected in the negative ion mode and were averaged over 200 shots. The matrix and the analyte were both dissolved in toluene. As the matrix, trans-2-[3-(4-tert-butylphenyl)-2-methyl-2-propenylidene]malononitrile (DCTB) was used. Matrix-to-analyte mole ratios varied from 100:1 to 1000:1. The solutions of the matrix and the clusters were mixed and 1-2 µL of the resulting mixtures were applied onto the sample plate and allowed to dry under ambient conditions.)
© 2015 Macmillan Publishers Limited. All rights reserved
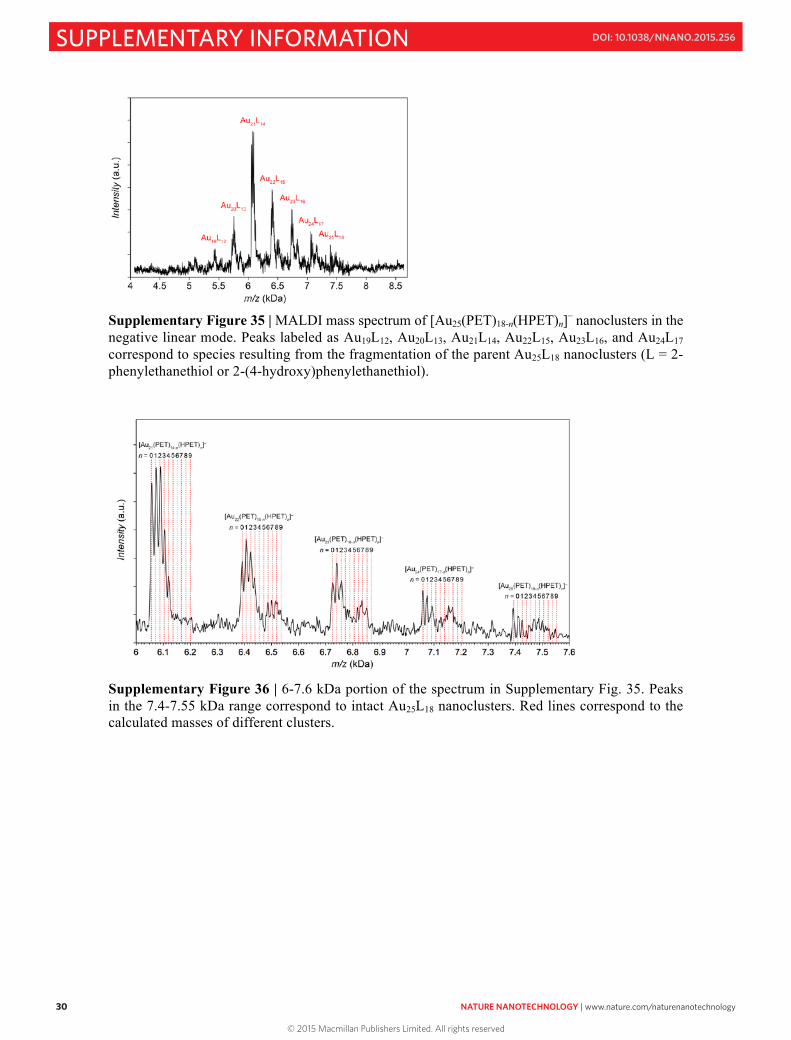
30 NATURE NANOTECHNOLOGY | www.nature.com/naturenanotechnology
SUPPLEMENTARY INFORMATION DOI: 10.1038/NNANO.2015.256
S30
Supplementary Figure 35 | MALDI mass spectrum of [Au25(PET)18-n(HPET)n]– nanoclusters in the negative linear mode. Peaks labeled as Au19L12, Au20L13, Au21L14, Au22L15, Au23L16, and Au24L17 correspond to species resulting from the fragmentation of the parent Au25L18 nanoclusters (L = 2-phenylethanethiol or 2-(4-hydroxy)phenylethanethiol).
Supplementary Figure 36 | 6-7.6 kDa portion of the spectrum in Supplementary Fig. 35. Peaks in the 7.4-7.55 kDa range correspond to intact Au25L18 nanoclusters. Red lines correspond to the calculated masses of different clusters.
S31
Supplementary Figure 37 | NMR spectra (300 MHz, CD2Cl2) of (top to bottom) PET, HPET, PET-functionalized Au25 nanoclusters, and HPET/PET-functionalized Au25 nanoclusters.
14. Enantioselective occlusion within chiral nanoflasks
14A. Synthesis of (R)-11-(2-phenylpropoxy)undecane-1-thiol (8)
(R)-(1-(undec-10-en-1-yloxy)propan-2-yl)benzene (21): A 50 mL round-bottomed flask was charged with (R)-2-phenylpropan-1-ol (300 mg; 2.2 mol), NaH (60% dispersion in mineral oil) (264 mg; 6.6 mmol), and dry DMF (5 mL). The mixture was stirred for 1 hour at room temperature. Then, 11-bromoundec-1-ene (1 g; 4.4 mmol) was added and the resulting mixture was stirred for 24 hours at room temperature. A crude product was extracted with a hexane-water (10 mL of each) mixture two times, and organic layers were collected and dried above MgSO4; thereafter, the solvent was removed under reduced pressure to afford crude product, which was purified by silica column chromatography using a 20:1 v/v hexane-ethyl acetate mixture. Yield = 530 mg (83%).
HR MS (ESI) m/z: exact mass calculated for C20H32O [M+Na]+ = 311.2351; found = 311.2354.
O SHO S
O
OOH
NaH, DMF
Br(CH2)9CH=CH2, r.t.
CH3COSH, AIBN
Toluene, N2, reflux
HCl/MeOH
N2, reflux
21
22 8
© 2015 Macmillan Publishers Limited. All rights reserved
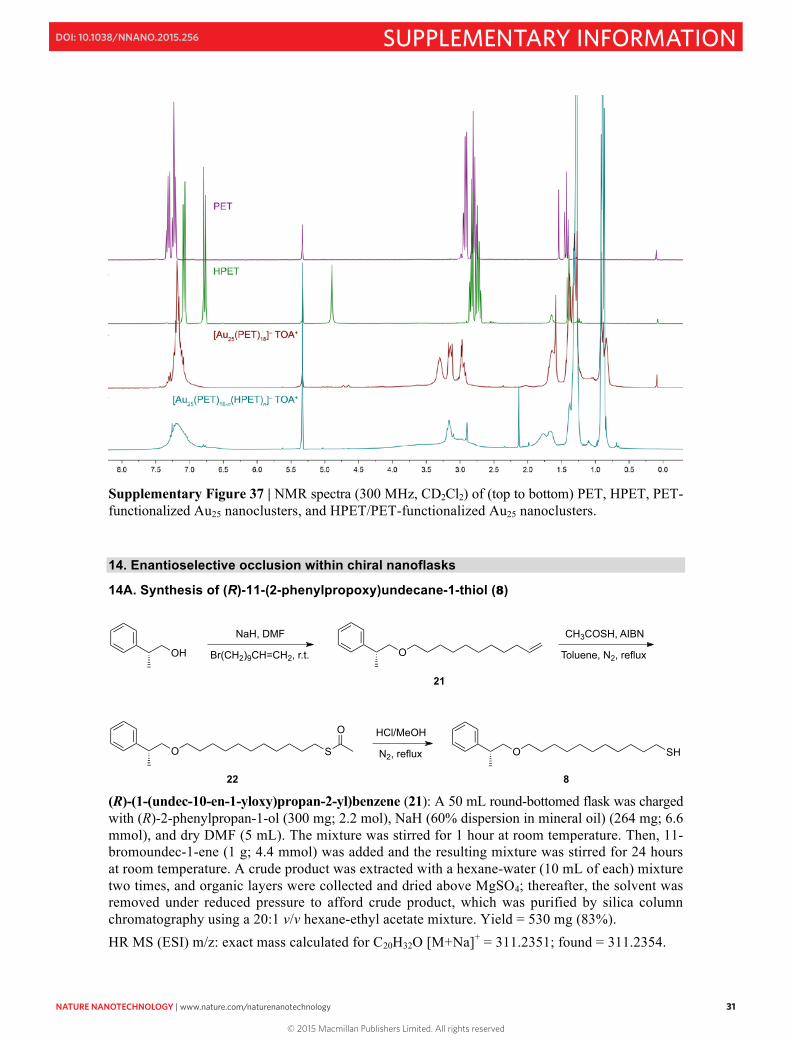
NATURE NANOTECHNOLOGY | www.nature.com/naturenanotechnology 31
SUPPLEMENTARY INFORMATIONDOI: 10.1038/NNANO.2015.256
S30
Supplementary Figure 35 | MALDI mass spectrum of [Au25(PET)18-n(HPET)n]– nanoclusters in the negative linear mode. Peaks labeled as Au19L12, Au20L13, Au21L14, Au22L15, Au23L16, and Au24L17 correspond to species resulting from the fragmentation of the parent Au25L18 nanoclusters (L = 2-phenylethanethiol or 2-(4-hydroxy)phenylethanethiol).
Supplementary Figure 36 | 6-7.6 kDa portion of the spectrum in Supplementary Fig. 35. Peaks in the 7.4-7.55 kDa range correspond to intact Au25L18 nanoclusters. Red lines correspond to the calculated masses of different clusters.
S31
Supplementary Figure 37 | NMR spectra (300 MHz, CD2Cl2) of (top to bottom) PET, HPET, PET-functionalized Au25 nanoclusters, and HPET/PET-functionalized Au25 nanoclusters.
14. Enantioselective occlusion within chiral nanoflasks
14A. Synthesis of (R)-11-(2-phenylpropoxy)undecane-1-thiol (8)
(R)-(1-(undec-10-en-1-yloxy)propan-2-yl)benzene (21): A 50 mL round-bottomed flask was charged with (R)-2-phenylpropan-1-ol (300 mg; 2.2 mol), NaH (60% dispersion in mineral oil) (264 mg; 6.6 mmol), and dry DMF (5 mL). The mixture was stirred for 1 hour at room temperature. Then, 11-bromoundec-1-ene (1 g; 4.4 mmol) was added and the resulting mixture was stirred for 24 hours at room temperature. A crude product was extracted with a hexane-water (10 mL of each) mixture two times, and organic layers were collected and dried above MgSO4; thereafter, the solvent was removed under reduced pressure to afford crude product, which was purified by silica column chromatography using a 20:1 v/v hexane-ethyl acetate mixture. Yield = 530 mg (83%).
HR MS (ESI) m/z: exact mass calculated for C20H32O [M+Na]+ = 311.2351; found = 311.2354.
O SHO S
O
OOH
NaH, DMF
Br(CH2)9CH=CH2, r.t.
CH3COSH, AIBN
Toluene, N2, reflux
HCl/MeOH
N2, reflux
21
22 8
© 2015 Macmillan Publishers Limited. All rights reserved

32 NATURE NANOTECHNOLOGY | www.nature.com/naturenanotechnology
SUPPLEMENTARY INFORMATION DOI: 10.1038/NNANO.2015.256
S32
Supplementary Figure 38 | 1H NMR spectrum of 21 (300 MHz, CDCl3).
Supplementary Figure 39 | 13C NMR spectrum of 21 (75 MHz, CDCl3).
O
O
S33
(R)-S-(11-(2-phenylpropoxy)undecyl) ethanethioate (22): A 50 mL round-bottomed flask was charged with (R)-(1-(undec-10-en-1-yloxy)propan-2-yl)benzene (500 mg; 1.4 mol), thioacetic acid (528 mg; 7.0 mmol), AIBN (2 mL of a 0.2 M solution in toluene), and 8 mL of dry toluene, after which the mixture was flushed with nitrogen for 20 min. Then the reaction mixture was refluxed for 1 hour under a nitrogen atmosphere. A crude product, which was obtained upon removal of the solvent under reduced pressure, was purified by silica column chromatography using a 20:1 v/v hexane-ethyl acetate to afford pure product as a yellow oil. Yield = 460 mg (73%).
HR MS (ESI) m/z: exact mass calculated for C22H36O2S [M+Na]+ = 387.2334; found = 387.2333.
Supplementary Figure 40 | 1H NMR spectrum of 22 (300 MHz, CDCl3).
O S
O
© 2015 Macmillan Publishers Limited. All rights reserved

NATURE NANOTECHNOLOGY | www.nature.com/naturenanotechnology 33
SUPPLEMENTARY INFORMATIONDOI: 10.1038/NNANO.2015.256
S32
Supplementary Figure 38 | 1H NMR spectrum of 21 (300 MHz, CDCl3).
Supplementary Figure 39 | 13C NMR spectrum of 21 (75 MHz, CDCl3).
O
O
S33
(R)-S-(11-(2-phenylpropoxy)undecyl) ethanethioate (22): A 50 mL round-bottomed flask was charged with (R)-(1-(undec-10-en-1-yloxy)propan-2-yl)benzene (500 mg; 1.4 mol), thioacetic acid (528 mg; 7.0 mmol), AIBN (2 mL of a 0.2 M solution in toluene), and 8 mL of dry toluene, after which the mixture was flushed with nitrogen for 20 min. Then the reaction mixture was refluxed for 1 hour under a nitrogen atmosphere. A crude product, which was obtained upon removal of the solvent under reduced pressure, was purified by silica column chromatography using a 20:1 v/v hexane-ethyl acetate to afford pure product as a yellow oil. Yield = 460 mg (73%).
HR MS (ESI) m/z: exact mass calculated for C22H36O2S [M+Na]+ = 387.2334; found = 387.2333.
Supplementary Figure 40 | 1H NMR spectrum of 22 (300 MHz, CDCl3).
O S
O
© 2015 Macmillan Publishers Limited. All rights reserved

34 NATURE NANOTECHNOLOGY | www.nature.com/naturenanotechnology
SUPPLEMENTARY INFORMATION DOI: 10.1038/NNANO.2015.256
S34
Supplementary Figure 41 | 13C NMR spectrum of 22 (75 MHz, CDCl3). (R)-11-(2-phenylpropoxy)undecane-1-thiol (8): A 50 mL round-bottomed flask was charged with (R)-S-(11-(2-phenylpropoxy)undecyl) ethanethioate (400 mg; 1.1 mmol), and HCl (20 mL of a 1 M methanolic solution) was added. The mixture was flushed with nitrogen for 20 min, and refluxed for 3 hours under a nitrogen atmosphere. Evaporation of the solvent under reduced pressure afforded crude product, which was purified by silica column chromatography using a 20:1 v/v hexane-ethyl acetate mixture to afford the final product as a yellow oil. Yield = 300 mg (85%).
HR MS (ESI) m/z: exact mass calculated for C20H34OS [M+Na]+ = 345.2228; found = 345.2224.
O S
O
S35
Supplementary Figure 42 | 1H NMR spectrum of 8 (300 MHz, CDCl3).
Supplementary Figure 43 | 13C NMR spectrum of 8 (75 MHz, CDCl3).
O SH
O SH
© 2015 Macmillan Publishers Limited. All rights reserved

NATURE NANOTECHNOLOGY | www.nature.com/naturenanotechnology 35
SUPPLEMENTARY INFORMATIONDOI: 10.1038/NNANO.2015.256
S34
Supplementary Figure 41 | 13C NMR spectrum of 22 (75 MHz, CDCl3). (R)-11-(2-phenylpropoxy)undecane-1-thiol (8): A 50 mL round-bottomed flask was charged with (R)-S-(11-(2-phenylpropoxy)undecyl) ethanethioate (400 mg; 1.1 mmol), and HCl (20 mL of a 1 M methanolic solution) was added. The mixture was flushed with nitrogen for 20 min, and refluxed for 3 hours under a nitrogen atmosphere. Evaporation of the solvent under reduced pressure afforded crude product, which was purified by silica column chromatography using a 20:1 v/v hexane-ethyl acetate mixture to afford the final product as a yellow oil. Yield = 300 mg (85%).
HR MS (ESI) m/z: exact mass calculated for C20H34OS [M+Na]+ = 345.2228; found = 345.2224.
O S
O
S35
Supplementary Figure 42 | 1H NMR spectrum of 8 (300 MHz, CDCl3).
Supplementary Figure 43 | 13C NMR spectrum of 8 (75 MHz, CDCl3).
O SH
O SH
© 2015 Macmillan Publishers Limited. All rights reserved

36 NATURE NANOTECHNOLOGY | www.nature.com/naturenanotechnology
SUPPLEMENTARY INFORMATION DOI: 10.1038/NNANO.2015.256
S36
14B. Preparation of 6 nm Au NPs co-functionalized with a mixture of ligands 1 and 8
A solution of as-prepared 6 nm Au NPs (Supplementary Section 1) (2.0 mL) was mixed with methanol (2 mL) and the NPs were allowed to sediment. After 2 hours with occasional shaking, the NPs were collected by decantation and redispersed in 2.0 mL of pure toluene. A mixture of 1 and 8 (molar ratio 1:1) (10-fold excess of thiol with respect to the number of the binding sites on the surface of Au) was added and the solution was left on an orbital shaker for 24 hours. The functionalized NPs were purified by precipitation with methanol (one volume), then centrifuged, followed by washing with pure methanol several times, and drying under reduced pressure. Finally, the black precipitate was dispersed in a toluene-hexane mixture (3:1, v/v) to afford a solution of 6 nm Au·(1+8). 14C. Enantioselective occlusion within chiral nanoflasks
We attempted to enantioselectively occlude 1-phenylethanol 9 using 6 nm Au·(1+8). Specifically, a solution of a racemic mixture of (R)- and (S)-9 (Fig. 3f, left) and 6 nm Au·(1+8) (2 mL) was exposed to UV (365 nm) light for 10 min (molar ratio of 9 to the NPs was 30). The resulting black precipitate was removed by centrifugation in the dark, and the supernatant was analyzed by high-performance liquid chromatography (HPLC) (Waters e2695) using a Chiralcel® OD column and a hexane-isopropanol (19:1 v/v) mixture as the eluent (Fig. 3f, right).
We have also attempted to characterize the occluded fraction. Here, we worked with a racemic mixture of (R)- and (S)-1-(2-naphthyl)ethanol 10 because of a higher boiling temperature of this compound (as compared to 9). Specifically, a racemic solution of (R)- and (S)-10 (Fig. 3g, left) and 6 nm Au·(1+8) (2 mL) was exposed to UV (365 nm) light for 10 min (molar ratio of 10 to the NPs was 100). The resulting black precipitate was collected by centrifugation, and then washed three times with pure toluene in the dark. Next, the precipitate was exposed to 3 min of visible light, after which it readily dispersed in 1 mL of pure toluene. The NPs were precipitated with ~10 mL of methanol (with centrifugation), the supernatant was collected, and the solvent was evaporated under reduced pressure. The residue was analyzed by HPLC (Waters e2695) using a Chiralcel® OD column and a hexane-isopropanol (19:1 v/v) mixture as the eluent (Fig. 3g, right).
15. Monitoring reaction acceleration and stereoselectivity
Acid-catalyzed hydrolysis of 11 was monitored by 1H NMR spectroscopy (300 MHz, toluene-d8), where the characteristic chemical shifts of the CH2 protons (at ~4.3 ppm for the substrate and ~4.15 ppm for the product, see Supplementary Fig. 44) were used to estimate the extent of conversion of 11 into 12. Specifically, an NMR tube was charged with 1 mg of 11 dissolved in 500 µL of toluene-d8, 0.008 mg of trifluoroacetic acid dissolved in 10 µL of toluene-d8, 1 µL of water, and 1.48 mg of 6 nm Au·1 dissolved in 500 µL of toluene-d8. NMR spectrum was recorded immediately, and the sample was subjected to cycles of 3 min of UV irradiation (λ = 365 nm; light intensity ~ 0.7 mW·cm–2) followed by white light (fluorescent bulb, light intensity ~ 1.0 mW·cm–2). Following a given amount of cycles, NMR spectra were recorded (Supplementary Fig. 44). Control experiments were performed in the same way except that i) the reaction mixture did not contain 6 nm Au·1; ii) the reaction mixture did not contain TFA and water; iii) the reaction mixture contained all components but was kept in the dark (4 min per cycle) – for example, Supplementary Fig. 45 shows the evolution of NMR spectra of 11 exposed to cycles of UV and visible light in the absence of nanoparticles. The data presented in Supplementary Figs. 44 and 45 was used to prepare the plot in Fig. 4c in the main text.
S37
Supplementary Figure 44 | Changes in 1H NMR spectra (300 MHz, toluene-d8) of 11 accompanying the hydrolysis reaction. Each cycle = 3 min of UV followed by 1 min of visible light. The emerging signal at ~9.6 ppm corresponds to the aldehyde proton.
Supplementary Figure 45 | Changes in 1H NMR spectra (300 MHz, toluene-d8) of 11 accompanying the hydrolysis reaction in a control in which no nanoparticles were used. Each cycle = 3 min of UV followed by 1 min of visible light.
© 2015 Macmillan Publishers Limited. All rights reserved
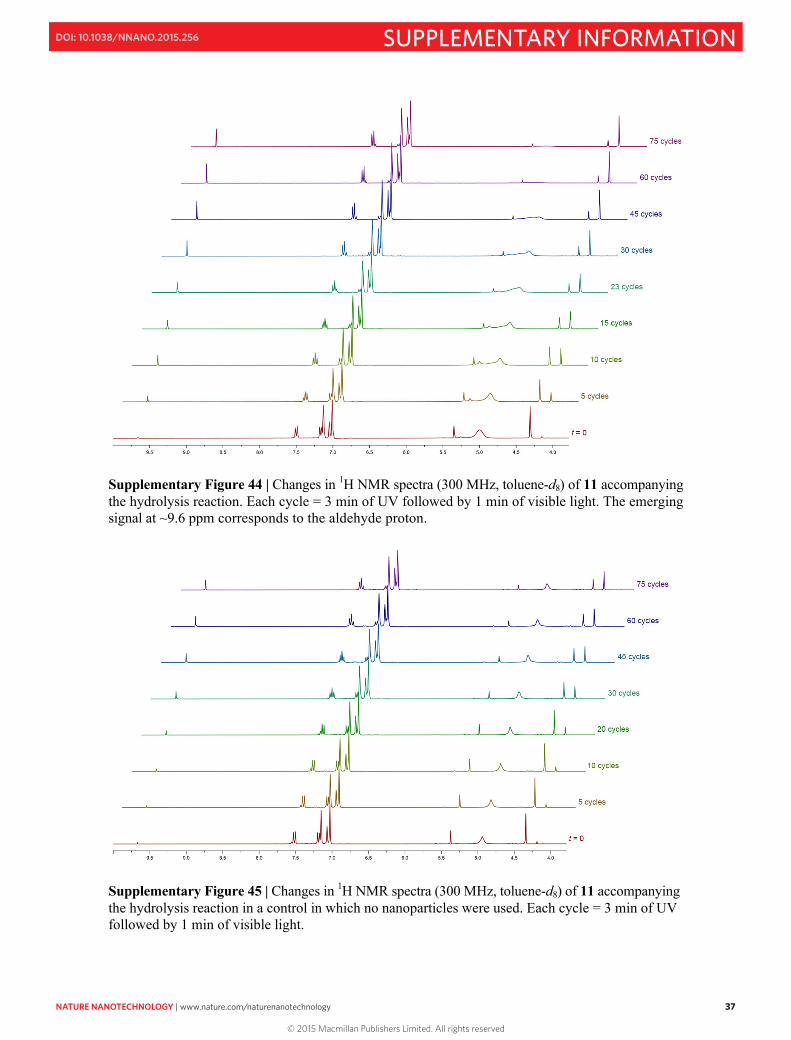
NATURE NANOTECHNOLOGY | www.nature.com/naturenanotechnology 37
SUPPLEMENTARY INFORMATIONDOI: 10.1038/NNANO.2015.256
S36
14B. Preparation of 6 nm Au NPs co-functionalized with a mixture of ligands 1 and 8
A solution of as-prepared 6 nm Au NPs (Supplementary Section 1) (2.0 mL) was mixed with methanol (2 mL) and the NPs were allowed to sediment. After 2 hours with occasional shaking, the NPs were collected by decantation and redispersed in 2.0 mL of pure toluene. A mixture of 1 and 8 (molar ratio 1:1) (10-fold excess of thiol with respect to the number of the binding sites on the surface of Au) was added and the solution was left on an orbital shaker for 24 hours. The functionalized NPs were purified by precipitation with methanol (one volume), then centrifuged, followed by washing with pure methanol several times, and drying under reduced pressure. Finally, the black precipitate was dispersed in a toluene-hexane mixture (3:1, v/v) to afford a solution of 6 nm Au·(1+8). 14C. Enantioselective occlusion within chiral nanoflasks
We attempted to enantioselectively occlude 1-phenylethanol 9 using 6 nm Au·(1+8). Specifically, a solution of a racemic mixture of (R)- and (S)-9 (Fig. 3f, left) and 6 nm Au·(1+8) (2 mL) was exposed to UV (365 nm) light for 10 min (molar ratio of 9 to the NPs was 30). The resulting black precipitate was removed by centrifugation in the dark, and the supernatant was analyzed by high-performance liquid chromatography (HPLC) (Waters e2695) using a Chiralcel® OD column and a hexane-isopropanol (19:1 v/v) mixture as the eluent (Fig. 3f, right).
We have also attempted to characterize the occluded fraction. Here, we worked with a racemic mixture of (R)- and (S)-1-(2-naphthyl)ethanol 10 because of a higher boiling temperature of this compound (as compared to 9). Specifically, a racemic solution of (R)- and (S)-10 (Fig. 3g, left) and 6 nm Au·(1+8) (2 mL) was exposed to UV (365 nm) light for 10 min (molar ratio of 10 to the NPs was 100). The resulting black precipitate was collected by centrifugation, and then washed three times with pure toluene in the dark. Next, the precipitate was exposed to 3 min of visible light, after which it readily dispersed in 1 mL of pure toluene. The NPs were precipitated with ~10 mL of methanol (with centrifugation), the supernatant was collected, and the solvent was evaporated under reduced pressure. The residue was analyzed by HPLC (Waters e2695) using a Chiralcel® OD column and a hexane-isopropanol (19:1 v/v) mixture as the eluent (Fig. 3g, right).
15. Monitoring reaction acceleration and stereoselectivity
Acid-catalyzed hydrolysis of 11 was monitored by 1H NMR spectroscopy (300 MHz, toluene-d8), where the characteristic chemical shifts of the CH2 protons (at ~4.3 ppm for the substrate and ~4.15 ppm for the product, see Supplementary Fig. 44) were used to estimate the extent of conversion of 11 into 12. Specifically, an NMR tube was charged with 1 mg of 11 dissolved in 500 µL of toluene-d8, 0.008 mg of trifluoroacetic acid dissolved in 10 µL of toluene-d8, 1 µL of water, and 1.48 mg of 6 nm Au·1 dissolved in 500 µL of toluene-d8. NMR spectrum was recorded immediately, and the sample was subjected to cycles of 3 min of UV irradiation (λ = 365 nm; light intensity ~ 0.7 mW·cm–2) followed by white light (fluorescent bulb, light intensity ~ 1.0 mW·cm–2). Following a given amount of cycles, NMR spectra were recorded (Supplementary Fig. 44). Control experiments were performed in the same way except that i) the reaction mixture did not contain 6 nm Au·1; ii) the reaction mixture did not contain TFA and water; iii) the reaction mixture contained all components but was kept in the dark (4 min per cycle) – for example, Supplementary Fig. 45 shows the evolution of NMR spectra of 11 exposed to cycles of UV and visible light in the absence of nanoparticles. The data presented in Supplementary Figs. 44 and 45 was used to prepare the plot in Fig. 4c in the main text.
S37
Supplementary Figure 44 | Changes in 1H NMR spectra (300 MHz, toluene-d8) of 11 accompanying the hydrolysis reaction. Each cycle = 3 min of UV followed by 1 min of visible light. The emerging signal at ~9.6 ppm corresponds to the aldehyde proton.
Supplementary Figure 45 | Changes in 1H NMR spectra (300 MHz, toluene-d8) of 11 accompanying the hydrolysis reaction in a control in which no nanoparticles were used. Each cycle = 3 min of UV followed by 1 min of visible light.
© 2015 Macmillan Publishers Limited. All rights reserved

38 NATURE NANOTECHNOLOGY | www.nature.com/naturenanotechnology
SUPPLEMENTARY INFORMATION DOI: 10.1038/NNANO.2015.256
S38
We used UV-Vis absorption spectroscopy to follow the progress of the dimerization of 13, taking advantage of the characteristic absorption feature in the 350-370 nm region (we verified that the reaction product (14) has no absorption in this region). In a typical experiment, 13 and azobenzene-functionalized nanoparticles (6 nm Au·1 or 6 nm Fe3O4·2) were dissolved in toluene at c13 = 10 µM and cNP = 1.41 µM. Τhe mixture was irradiated with cycles of near-UV (λ = 365 nm; ~0.7 mW·cm–2) and white (~1.0 mW·cm–2) light (3 min of UV followed by 1 min of Vis). After a given number of UV-Vis cycles, small molecules (13 + 14) were separated from NPs by filtering through a pad of silica gel with 10:1 (v/v) chloroform-ethyl acetate as the eluent, diluted to a known volume, and a UV-Vis spectrum was recorded (see, e.g., Supplementary Fig. 46).
Supplementary Figure 46 | Representative UV-Vis spectra of 13 after exposure to UV light in the presence of photoresponsive nanoparticles (a; here, Fe3O4·2) and in the absence of nanoparticles under otherwise identical conditions (b). Initial spectra are shown in red; orange spectra correspond to 15 min UV, i.e., five cycles of 3 min UV + 1 min of Vis, etc. To determine the stereoselectivity of the reaction, we used NMR, a technique for which higher absolute concentrations were necessary (here, we worked with c13 = 5 mM; the concentration of nanoparticles were kept at 1.41 µM). Anti- and syn-14 (orange and blue structural formulas in Supplementary Fig. 46, respectively) could be identified based on the chemical shifts of the tertiary H atoms adjacent to the hydroxymethyl groups (at ~4.1 ppm and ~4.4 ppm for the anti and syn isomers, respectively).
S39
Supplementary Figure 47 | Changes in partial NMR spectra (300 MHz, toluene-d8) accompanying UV-induced dimerization of 9-(hydroxymethyl)anthracene 13. Having demonstrated that extended aromatic systems (here, anthracenes) are readily occluded by self-assembling nanoparticles (see Supplementary Section 11), we have also studied reaction acceleration of additional anthracenes, 9-methylanthracene and 9-(cyanomethyl)anthracene. As expected based on the occlusion (“complexation”) studies, both anthracenes were found to dimerize faster in the presence of 6 nm Au·1. Specifically, ~60% and ~50% conversion of 9-methylanthracene and 9-(cyanomethyl)anthracene was observed after 1 hr of UV, respectively, as compared to ~4% and ~1% conversion in the absence of NPs within the same time period (Fig. 4i in the main text). Regio-selectivity of dimerization was studied by NMR as described above (Supplementary Fig. 46) for 13.
© 2015 Macmillan Publishers Limited. All rights reserved
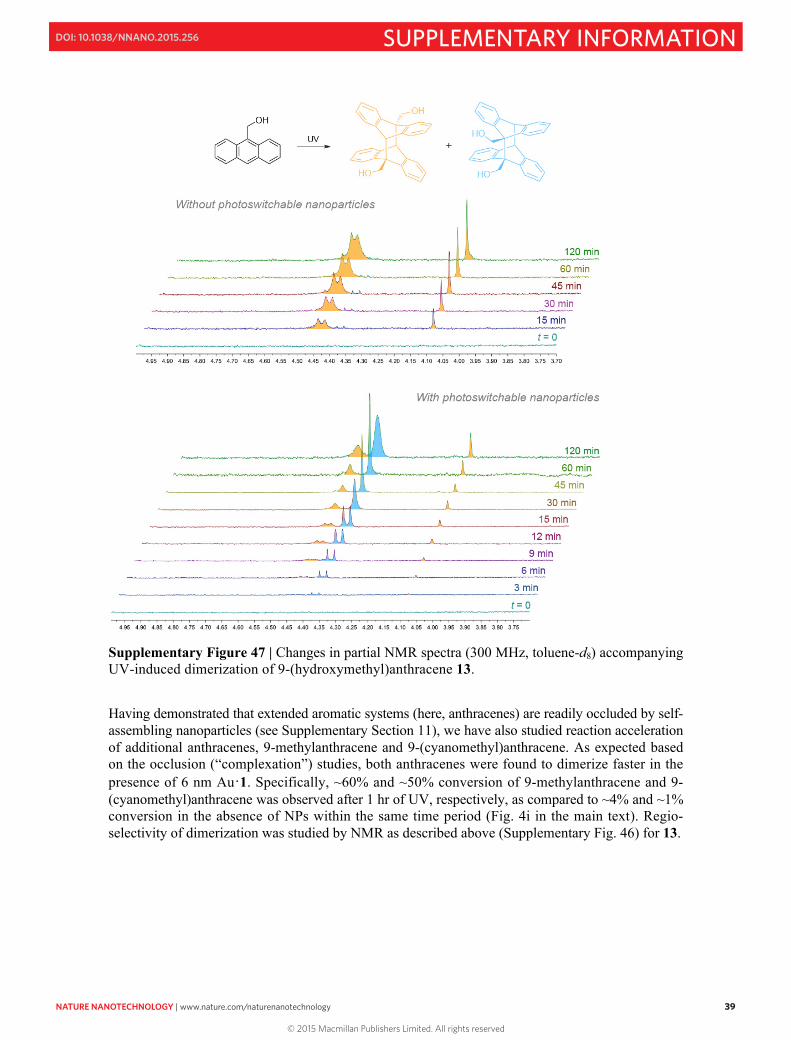
NATURE NANOTECHNOLOGY | www.nature.com/naturenanotechnology 39
SUPPLEMENTARY INFORMATIONDOI: 10.1038/NNANO.2015.256
S38
We used UV-Vis absorption spectroscopy to follow the progress of the dimerization of 13, taking advantage of the characteristic absorption feature in the 350-370 nm region (we verified that the reaction product (14) has no absorption in this region). In a typical experiment, 13 and azobenzene-functionalized nanoparticles (6 nm Au·1 or 6 nm Fe3O4·2) were dissolved in toluene at c13 = 10 µM and cNP = 1.41 µM. Τhe mixture was irradiated with cycles of near-UV (λ = 365 nm; ~0.7 mW·cm–2) and white (~1.0 mW·cm–2) light (3 min of UV followed by 1 min of Vis). After a given number of UV-Vis cycles, small molecules (13 + 14) were separated from NPs by filtering through a pad of silica gel with 10:1 (v/v) chloroform-ethyl acetate as the eluent, diluted to a known volume, and a UV-Vis spectrum was recorded (see, e.g., Supplementary Fig. 46).
Supplementary Figure 46 | Representative UV-Vis spectra of 13 after exposure to UV light in the presence of photoresponsive nanoparticles (a; here, Fe3O4·2) and in the absence of nanoparticles under otherwise identical conditions (b). Initial spectra are shown in red; orange spectra correspond to 15 min UV, i.e., five cycles of 3 min UV + 1 min of Vis, etc. To determine the stereoselectivity of the reaction, we used NMR, a technique for which higher absolute concentrations were necessary (here, we worked with c13 = 5 mM; the concentration of nanoparticles were kept at 1.41 µM). Anti- and syn-14 (orange and blue structural formulas in Supplementary Fig. 46, respectively) could be identified based on the chemical shifts of the tertiary H atoms adjacent to the hydroxymethyl groups (at ~4.1 ppm and ~4.4 ppm for the anti and syn isomers, respectively).
S39
Supplementary Figure 47 | Changes in partial NMR spectra (300 MHz, toluene-d8) accompanying UV-induced dimerization of 9-(hydroxymethyl)anthracene 13. Having demonstrated that extended aromatic systems (here, anthracenes) are readily occluded by self-assembling nanoparticles (see Supplementary Section 11), we have also studied reaction acceleration of additional anthracenes, 9-methylanthracene and 9-(cyanomethyl)anthracene. As expected based on the occlusion (“complexation”) studies, both anthracenes were found to dimerize faster in the presence of 6 nm Au·1. Specifically, ~60% and ~50% conversion of 9-methylanthracene and 9-(cyanomethyl)anthracene was observed after 1 hr of UV, respectively, as compared to ~4% and ~1% conversion in the absence of NPs within the same time period (Fig. 4i in the main text). Regio-selectivity of dimerization was studied by NMR as described above (Supplementary Fig. 46) for 13.
© 2015 Macmillan Publishers Limited. All rights reserved
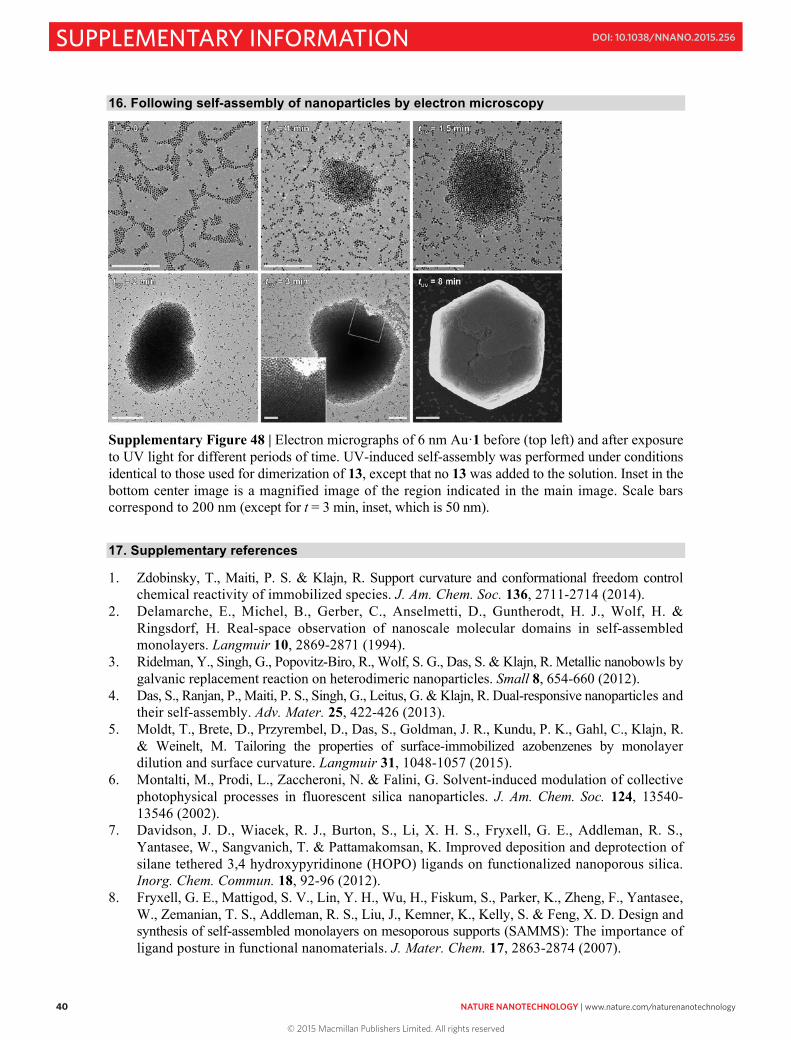
40 NATURE NANOTECHNOLOGY | www.nature.com/naturenanotechnology
SUPPLEMENTARY INFORMATION DOI: 10.1038/NNANO.2015.256
S40
16. Following self-assembly of nanoparticles by electron microscopy
Supplementary Figure 48 | Electron micrographs of 6 nm Au·1 before (top left) and after exposure to UV light for different periods of time. UV-induced self-assembly was performed under conditions identical to those used for dimerization of 13, except that no 13 was added to the solution. Inset in the bottom center image is a magnified image of the region indicated in the main image. Scale bars correspond to 200 nm (except for t = 3 min, inset, which is 50 nm). 17. Supplementary references
1. Zdobinsky, T., Maiti, P. S. & Klajn, R. Support curvature and conformational freedom control chemical reactivity of immobilized species. J. Am. Chem. Soc. 136, 2711-2714 (2014).
2. Delamarche, E., Michel, B., Gerber, C., Anselmetti, D., Guntherodt, H. J., Wolf, H. & Ringsdorf, H. Real-space observation of nanoscale molecular domains in self-assembled monolayers. Langmuir 10, 2869-2871 (1994).
3. Ridelman, Y., Singh, G., Popovitz-Biro, R., Wolf, S. G., Das, S. & Klajn, R. Metallic nanobowls by galvanic replacement reaction on heterodimeric nanoparticles. Small 8, 654-660 (2012).
4. Das, S., Ranjan, P., Maiti, P. S., Singh, G., Leitus, G. & Klajn, R. Dual-responsive nanoparticles and their self-assembly. Adv. Mater. 25, 422-426 (2013).
5. Moldt, T., Brete, D., Przyrembel, D., Das, S., Goldman, J. R., Kundu, P. K., Gahl, C., Klajn, R. & Weinelt, M. Tailoring the properties of surface-immobilized azobenzenes by monolayer dilution and surface curvature. Langmuir 31, 1048-1057 (2015).
6. Montalti, M., Prodi, L., Zaccheroni, N. & Falini, G. Solvent-induced modulation of collective photophysical processes in fluorescent silica nanoparticles. J. Am. Chem. Soc. 124, 13540-13546 (2002).
7. Davidson, J. D., Wiacek, R. J., Burton, S., Li, X. H. S., Fryxell, G. E., Addleman, R. S., Yantasee, W., Sangvanich, T. & Pattamakomsan, K. Improved deposition and deprotection of silane tethered 3,4 hydroxypyridinone (HOPO) ligands on functionalized nanoporous silica. Inorg. Chem. Commun. 18, 92-96 (2012).
8. Fryxell, G. E., Mattigod, S. V., Lin, Y. H., Wu, H., Fiskum, S., Parker, K., Zheng, F., Yantasee, W., Zemanian, T. S., Addleman, R. S., Liu, J., Kemner, K., Kelly, S. & Feng, X. D. Design and synthesis of self-assembled monolayers on mesoporous supports (SAMMS): The importance of ligand posture in functional nanomaterials. J. Mater. Chem. 17, 2863-2874 (2007).
S41
9. Zhang, W. W., Li, H. F., Liu, L., Xie, J. L., Lu, C. S., Zhou, Y., Ren, X. M. & Meng, Q. J. Preparation and electrochemistry of azobenzene self-assembled monolayers on gold - long range tunneling and end-group hydrogen bonding effect. J. Coll. Interface Sci. 261, 82-87 (2003).
10. Chuchuryukin, A. V., Chase, P. A., Dijkstra, H. P., Suijkerbuijk, B., Mills, A. M., Spek, A. L., van Klink, G. P. M. & van Koten, G. General approach for template-directed synthesis of macro-heterocycles by ring-closing metathesis (RCM). Adv. Synth. Catal. 347, 447-462 (2005).
11. Liu, T. F., Li, Y. J., Yan, Y. L., Li, Y. L., Yu, Y. W., Chen, N., Chen, S. H., Liu, C., Zhao, Y. S. & Liu, H. B. Tuning growth of low-dimensional organic nanostructures for efficient optical waveguide applications. J. Phys. Chem. C 116, 14134-14138 (2012).
12. Zhang, J., Whitesell, J. K. & Fox, M. A. Photoreactivity of self-assembled monolayers of azobenzene or stilbene derivatives capped on colloidal gold clusters. Chem. Mat. 13, 2323-2331 (2001).
13. Tomasi, J., Mennucci, B. & Cances, E. The IEF version of the PCM solvation method: an overview of a new method addressed to study molecular solutes at the QM ab initio level. J. Mol. Struct. (Theochem) 464, 211-226 (1999).
14. Frisch, M. J., Trucks, G. W., Schlegel, H. B., Scuseria, G. E., Robb, M. A., Cheeseman, J. R., Scalmani, G., Barone, V., Mennucci, B. & Petersson, G. A. Gaussian 09 (Gaussian, Inc., Wallington, CT, 2009).
15. Mayne, C. G., Saam, J., Schulten, K., Tajkhorshid, E. & Gumbart, J. C. Rapid parameterization of small molecules using the force field toolkit. J. Comput. Chem. 34, 2757-2770 (2013).
16. Breneman, C. M. & Wiberg, K. B. Determining atom-centered monopoles from molecular electrostatic potentials. The need for high sampling density in formamide conformational analysis. J. Comput. Chem. 11, 361-373 (1990).
17. Vanommeslaeghe, K., Hatcher, E., Acharya, C., Kundu, S., Zhong, S., Shim, J., Darian, E., Guvench, O., Lopes, P., Vorobyov, I. & MacKerell, A. D. CHARMM general force field: a force field for drug-like molecules compatible with the CHARMM all-atom additive biological force fields. J. Comput. Chem. 31, 671-690 (2010).
18. Yu, W. B., He, X. B., Vanommeslaeghe, K. & MacKerell, A. D. Extension of the CHARMM general force field to sulfonyl-containing compounds and its utility in biomolecular simulations. J. Comput. Chem. 33, 2451-2468 (2012).
19. Darden, T., York, D. & Pedersen, L. Particle mesh Ewald: An N·log(N) method for Ewald sums in large systems. J. Chem. Phys. 98, 10089-10092 (1993).
20. Hamaker, H. C. The London—van der Waals attraction between spherical particles. Physica 4, 1058-1072 (1937).
21. Ohara, P. C., Leff, D. V., Heath, J. R. & Gelbart, W. M. Crystallization of opals from polydisperse nanoparticles. Phys. Rev. Lett. 75, 3466-3469 (1995).
22. Korgel, B. A., Fullam, S., Connolly, S. & Fitzmaurice, D. Assembly and self-organization of silver nanocrystal superlattices: ordered "soft spheres". J. Phys. Chem. B 102, 8379-8388 (1998).
23. Phillips, J. C., Braun, R., Wang, W., Gumbart, J., Tajkhorshid, E., Villa, E., Chipot, C., Skeel, R. D., Kale, L. & Schulten, K. Scalable molecular dynamics with NAMD. J. Comput. Chem. 26, 1781-1802 (2005).
24. Onoda, M., Uchiyama, S., Santa, T. & Imai, K. A photoinduced electron-transfer reagent for peroxyacetic acid, 4-ethylthioacetylamino-7-phenylsulfonyl-2,1,3-benzoxadiazole, based on the method for predicting the fluorescence quantum yields. Anal. Chem. 74, 4089-4096 (2002).
25. Qian, H., Liu, C. & Jin, R. Controlled growth of molecularly pure Au25(SR)18 and Au38(SR)24 nanoclusters from the same polydispersed crude product. Sci. China Chem. 55, 2359-2365 (2012).
26. Dass, A., Stevenson, A., Dubay, G. R., Tracy, J. B. & Murray, R. W. Nanoparticle MALDI-TOF mass spectrometry without fragmentation: Au25(SCH2CH2Ph)18 and mixed monolayer Au25(SCH2CH2Ph)18-x(L)x. J. Am. Chem. Soc. 130, 5940-5946 (2008).
27. Harkness, K. M., Balinski, A., McLean, J. A. & Cliffel, D. E. Nanoscale phase segregation of mixed thiolates on gold nanoparticles. Angew. Chem. Int. Ed. 50, 10554-10559 (2011).
© 2015 Macmillan Publishers Limited. All rights reserved

NATURE NANOTECHNOLOGY | www.nature.com/naturenanotechnology 41
SUPPLEMENTARY INFORMATIONDOI: 10.1038/NNANO.2015.256
S40
16. Following self-assembly of nanoparticles by electron microscopy
Supplementary Figure 48 | Electron micrographs of 6 nm Au·1 before (top left) and after exposure to UV light for different periods of time. UV-induced self-assembly was performed under conditions identical to those used for dimerization of 13, except that no 13 was added to the solution. Inset in the bottom center image is a magnified image of the region indicated in the main image. Scale bars correspond to 200 nm (except for t = 3 min, inset, which is 50 nm). 17. Supplementary references
1. Zdobinsky, T., Maiti, P. S. & Klajn, R. Support curvature and conformational freedom control chemical reactivity of immobilized species. J. Am. Chem. Soc. 136, 2711-2714 (2014).
2. Delamarche, E., Michel, B., Gerber, C., Anselmetti, D., Guntherodt, H. J., Wolf, H. & Ringsdorf, H. Real-space observation of nanoscale molecular domains in self-assembled monolayers. Langmuir 10, 2869-2871 (1994).
3. Ridelman, Y., Singh, G., Popovitz-Biro, R., Wolf, S. G., Das, S. & Klajn, R. Metallic nanobowls by galvanic replacement reaction on heterodimeric nanoparticles. Small 8, 654-660 (2012).
4. Das, S., Ranjan, P., Maiti, P. S., Singh, G., Leitus, G. & Klajn, R. Dual-responsive nanoparticles and their self-assembly. Adv. Mater. 25, 422-426 (2013).
5. Moldt, T., Brete, D., Przyrembel, D., Das, S., Goldman, J. R., Kundu, P. K., Gahl, C., Klajn, R. & Weinelt, M. Tailoring the properties of surface-immobilized azobenzenes by monolayer dilution and surface curvature. Langmuir 31, 1048-1057 (2015).
6. Montalti, M., Prodi, L., Zaccheroni, N. & Falini, G. Solvent-induced modulation of collective photophysical processes in fluorescent silica nanoparticles. J. Am. Chem. Soc. 124, 13540-13546 (2002).
7. Davidson, J. D., Wiacek, R. J., Burton, S., Li, X. H. S., Fryxell, G. E., Addleman, R. S., Yantasee, W., Sangvanich, T. & Pattamakomsan, K. Improved deposition and deprotection of silane tethered 3,4 hydroxypyridinone (HOPO) ligands on functionalized nanoporous silica. Inorg. Chem. Commun. 18, 92-96 (2012).
8. Fryxell, G. E., Mattigod, S. V., Lin, Y. H., Wu, H., Fiskum, S., Parker, K., Zheng, F., Yantasee, W., Zemanian, T. S., Addleman, R. S., Liu, J., Kemner, K., Kelly, S. & Feng, X. D. Design and synthesis of self-assembled monolayers on mesoporous supports (SAMMS): The importance of ligand posture in functional nanomaterials. J. Mater. Chem. 17, 2863-2874 (2007).
S41
9. Zhang, W. W., Li, H. F., Liu, L., Xie, J. L., Lu, C. S., Zhou, Y., Ren, X. M. & Meng, Q. J. Preparation and electrochemistry of azobenzene self-assembled monolayers on gold - long range tunneling and end-group hydrogen bonding effect. J. Coll. Interface Sci. 261, 82-87 (2003).
10. Chuchuryukin, A. V., Chase, P. A., Dijkstra, H. P., Suijkerbuijk, B., Mills, A. M., Spek, A. L., van Klink, G. P. M. & van Koten, G. General approach for template-directed synthesis of macro-heterocycles by ring-closing metathesis (RCM). Adv. Synth. Catal. 347, 447-462 (2005).
11. Liu, T. F., Li, Y. J., Yan, Y. L., Li, Y. L., Yu, Y. W., Chen, N., Chen, S. H., Liu, C., Zhao, Y. S. & Liu, H. B. Tuning growth of low-dimensional organic nanostructures for efficient optical waveguide applications. J. Phys. Chem. C 116, 14134-14138 (2012).
12. Zhang, J., Whitesell, J. K. & Fox, M. A. Photoreactivity of self-assembled monolayers of azobenzene or stilbene derivatives capped on colloidal gold clusters. Chem. Mat. 13, 2323-2331 (2001).
13. Tomasi, J., Mennucci, B. & Cances, E. The IEF version of the PCM solvation method: an overview of a new method addressed to study molecular solutes at the QM ab initio level. J. Mol. Struct. (Theochem) 464, 211-226 (1999).
14. Frisch, M. J., Trucks, G. W., Schlegel, H. B., Scuseria, G. E., Robb, M. A., Cheeseman, J. R., Scalmani, G., Barone, V., Mennucci, B. & Petersson, G. A. Gaussian 09 (Gaussian, Inc., Wallington, CT, 2009).
15. Mayne, C. G., Saam, J., Schulten, K., Tajkhorshid, E. & Gumbart, J. C. Rapid parameterization of small molecules using the force field toolkit. J. Comput. Chem. 34, 2757-2770 (2013).
16. Breneman, C. M. & Wiberg, K. B. Determining atom-centered monopoles from molecular electrostatic potentials. The need for high sampling density in formamide conformational analysis. J. Comput. Chem. 11, 361-373 (1990).
17. Vanommeslaeghe, K., Hatcher, E., Acharya, C., Kundu, S., Zhong, S., Shim, J., Darian, E., Guvench, O., Lopes, P., Vorobyov, I. & MacKerell, A. D. CHARMM general force field: a force field for drug-like molecules compatible with the CHARMM all-atom additive biological force fields. J. Comput. Chem. 31, 671-690 (2010).
18. Yu, W. B., He, X. B., Vanommeslaeghe, K. & MacKerell, A. D. Extension of the CHARMM general force field to sulfonyl-containing compounds and its utility in biomolecular simulations. J. Comput. Chem. 33, 2451-2468 (2012).
19. Darden, T., York, D. & Pedersen, L. Particle mesh Ewald: An N·log(N) method for Ewald sums in large systems. J. Chem. Phys. 98, 10089-10092 (1993).
20. Hamaker, H. C. The London—van der Waals attraction between spherical particles. Physica 4, 1058-1072 (1937).
21. Ohara, P. C., Leff, D. V., Heath, J. R. & Gelbart, W. M. Crystallization of opals from polydisperse nanoparticles. Phys. Rev. Lett. 75, 3466-3469 (1995).
22. Korgel, B. A., Fullam, S., Connolly, S. & Fitzmaurice, D. Assembly and self-organization of silver nanocrystal superlattices: ordered "soft spheres". J. Phys. Chem. B 102, 8379-8388 (1998).
23. Phillips, J. C., Braun, R., Wang, W., Gumbart, J., Tajkhorshid, E., Villa, E., Chipot, C., Skeel, R. D., Kale, L. & Schulten, K. Scalable molecular dynamics with NAMD. J. Comput. Chem. 26, 1781-1802 (2005).
24. Onoda, M., Uchiyama, S., Santa, T. & Imai, K. A photoinduced electron-transfer reagent for peroxyacetic acid, 4-ethylthioacetylamino-7-phenylsulfonyl-2,1,3-benzoxadiazole, based on the method for predicting the fluorescence quantum yields. Anal. Chem. 74, 4089-4096 (2002).
25. Qian, H., Liu, C. & Jin, R. Controlled growth of molecularly pure Au25(SR)18 and Au38(SR)24 nanoclusters from the same polydispersed crude product. Sci. China Chem. 55, 2359-2365 (2012).
26. Dass, A., Stevenson, A., Dubay, G. R., Tracy, J. B. & Murray, R. W. Nanoparticle MALDI-TOF mass spectrometry without fragmentation: Au25(SCH2CH2Ph)18 and mixed monolayer Au25(SCH2CH2Ph)18-x(L)x. J. Am. Chem. Soc. 130, 5940-5946 (2008).
27. Harkness, K. M., Balinski, A., McLean, J. A. & Cliffel, D. E. Nanoscale phase segregation of mixed thiolates on gold nanoparticles. Angew. Chem. Int. Ed. 50, 10554-10559 (2011).
© 2015 Macmillan Publishers Limited. All rights reserved