solid waste in the rdn
TRANSCRIPT

Solid Waste in the RDN

Solid Waste in the RDN Where does the rest go? Economics of Waste Alternatives to RDN Disposal Solid Waste Plan
Presentation Overview

Waste in the RDN
• 50,000 tonnes/year to regional landfill • Transfer Station at Church Road • 7 large commercial haulers (a few minor) • 3 Processors (i.e paper, metal, plastic) • 2 Depots (i.e. GIRO, NRE) • 2 Composters (i.e NOW, Earthbank) • Numerous stewardship drop-off locations
(e.g. beverage containers, electronics, oil, antifreeze, HHW, tires, batteries)

Materials Received at RL/CRTS

Waste Stream Management Licenses • 12 licenses
– Processors, depots, composters
• Why? – High standard/level playing field – Protect and enhance diversion rate – Commitment in our approved SWMP – Waste Tracking

Illegal Dumping • Effective program • 2011 - 117 files
– 42,690 kgs cleaned up (3 sites)
• 2012 - 120 files – 21,920 kgs cleaned up (50 sites)
• 2013 – 143 files – 22,996 kgs cleaned up (50 sites)
• 2014 – 104 files – 16,370 kgs cleaned up (37 sites)
• 100% resolution!

Where does the rest go? • Example….electronics stewardship

E-waste processors
Recycling Vendor Standards – ensure environmentally sound recycle/reuse Processors: • Cycle Solutions, Chilliwack • Global Electric Electronic Processing,
Edmonton • Genesis Recycling Ltd., Aldergrove • Teck, Trail • FMC Recycling, Delta


Paper • Different grades (i.e. cardboard, mixed,
shredded/unshredded office, news)
• Cellmark – 14 sales offices & 10 processing facilities in
N.A. – 30 to 40% to US/Can mills
• KapStone – Kraft paper & corrugated packaging – $2.1 billion revenues; 4,500 people

• SP Fiber – Newsprint and packaging; Newberg OR. – Processing 100% post-consumer material
• JMK Fibers – 90,000 square foot building, Tacoma – 24 shipping/receiving docks – Materials sorting of paper and plastic
Economics of Waste
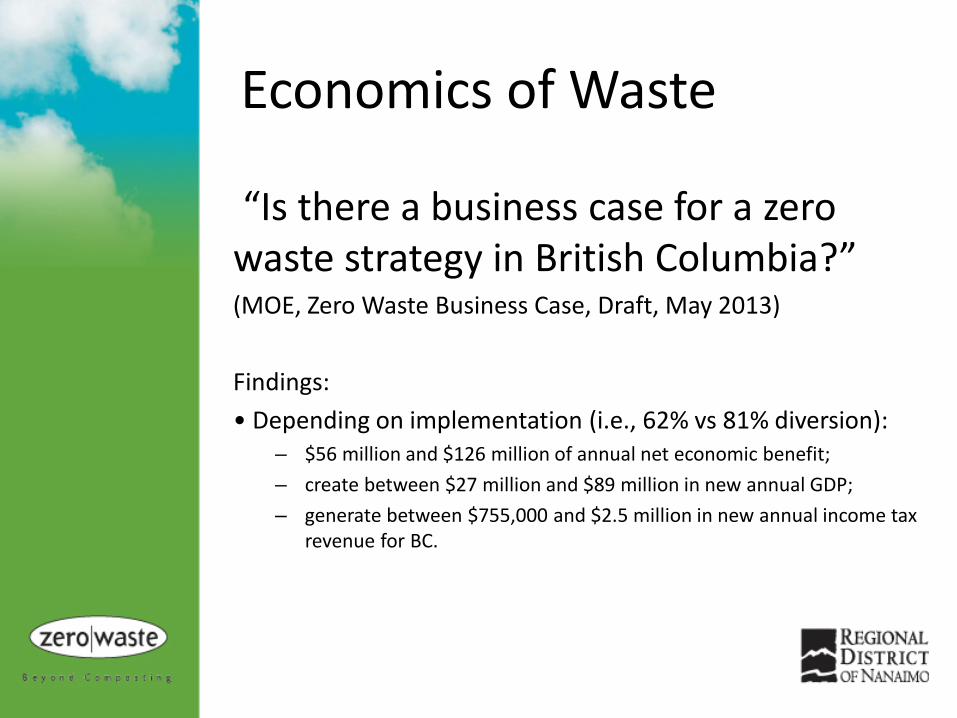
“Is there a business case for a zero waste strategy in British Columbia?” (MOE, Zero Waste Business Case, Draft, May 2013) Findings: • Depending on implementation (i.e., 62% vs 81% diversion):
– $56 million and $126 million of annual net economic benefit; – create between $27 million and $89 million in new annual GDP; – generate between $755,000 and $2.5 million in new annual income tax
revenue for BC.

Economics of Waste


Landfill tip fees Tip fees are a closely guarded secret. • Large USA landfill $25 to $30 per tonne • Roosevelt Regional Landfill, Washington
- $24us/ton - 2011/2012 data reported to the Department of
Ecology • CVRD; USA disposal
- $90/tonne (includes shipping) - $140/tonne tip fee (50% tax req.)
• RDN $125/tonne (3% tax req.)
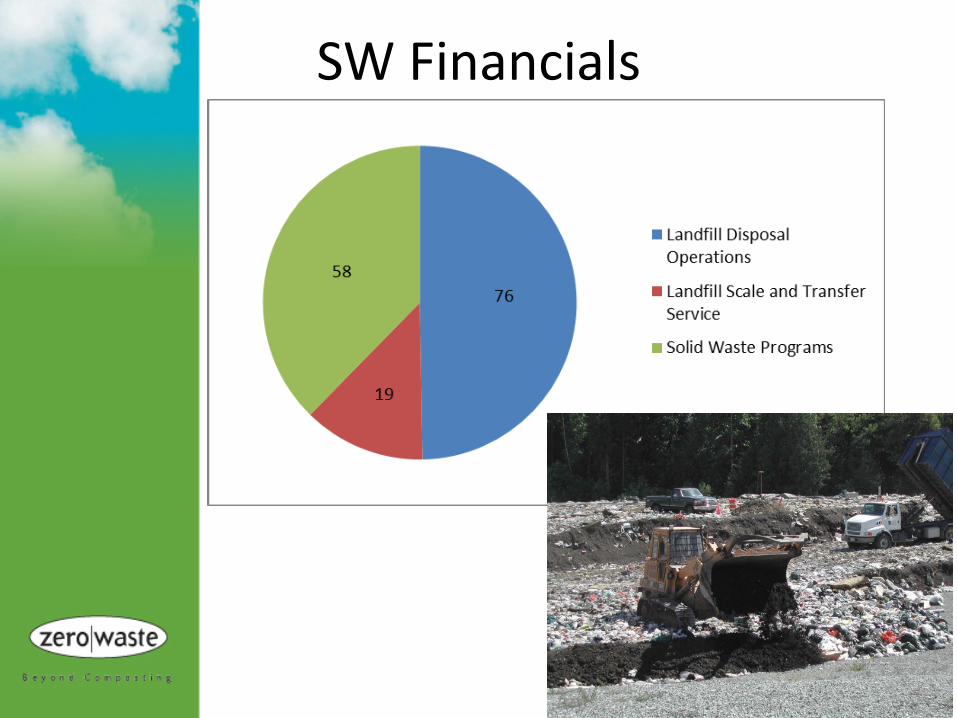
SW Financials

Alternatives to RDN Disposal

Disposal Trends by major haulers at Regional Facilities

Waste to Energy Electricity and/or heat from the incineration of waste. MOE expectations:
– 70% reduction before WTE – 60% min. efficiency to be “reduce”
Thermal Technologies: – Incineration, co-combustion, RDF – Gasification (conventional, plasma-arc) – Pyrolysis

Solid Waste Management Plan “The purpose of the implementation of solid waste management planning process was to restructure the way municipal solid waste was generated and managed in order to create a sustainable, integrated waste management system.” BC MOE

Ti
me
li
ne

ENGAGE STAKEHOLDERS THROUGHOUT SWMP REVIEW PROCESS

Questions ?