sludge management for a covered anaerobic pond at bears
TRANSCRIPT
Disclaimer: The opinions, advice and information contained in this publication have not been provided at the request of any person but are offered by Australian Pork Limited (APL) solely for
informational purposes. While APL has no reason to believe that the information contained in this publication is inaccurate, APL is unable to guarantee the accuracy of the information and, subject to any
terms implied by law which cannot be excluded, accepts no responsibility for loss suffered as a result of any party’s reliance on the accuracy or currency of the content of this publication. The information
contained in this publication should not be relied upon for any purpose, including as a substitute for professional advice. Nothing within the publication constitutes an express or implied warranty, or
representation, with respect to the accuracy or currency of the publication, any future matter or as to the value of or demand for any good.
Sludge Management for a Covered Anaerobic Pond at
Bears Lagoon Piggery
Final Report
APL Project 2009/2295
June 2013
AgSystems Design
Scott Birchall
6 Holland St
Shepparton VIC 3630
ii
This report was prepared on behalf of Australian Pork Limited (APL) in fulfilment of project
2009/2295 “Sludge management for a covered anaerobic pond at Bears Lagoon piggery”.
When referring to this document, the following reference should be used:
Birchall, S. (2013). ‘Sludge management for a covered anaerobic pond at Bears Lagoon piggery’, Final
report to Australian Pork Limited (APL), Project 2009/2295, AgSystems Design.
Project commencement and completion
Project commencement date: 1/2/2010
Project completion date: 30/6/2013
Acknowledgements
The author would like to acknowledge the contributions of Russell Gladman and Ian Connaughton of
Bears Lagoon piggery and for their assistance in conducting this project.
iii
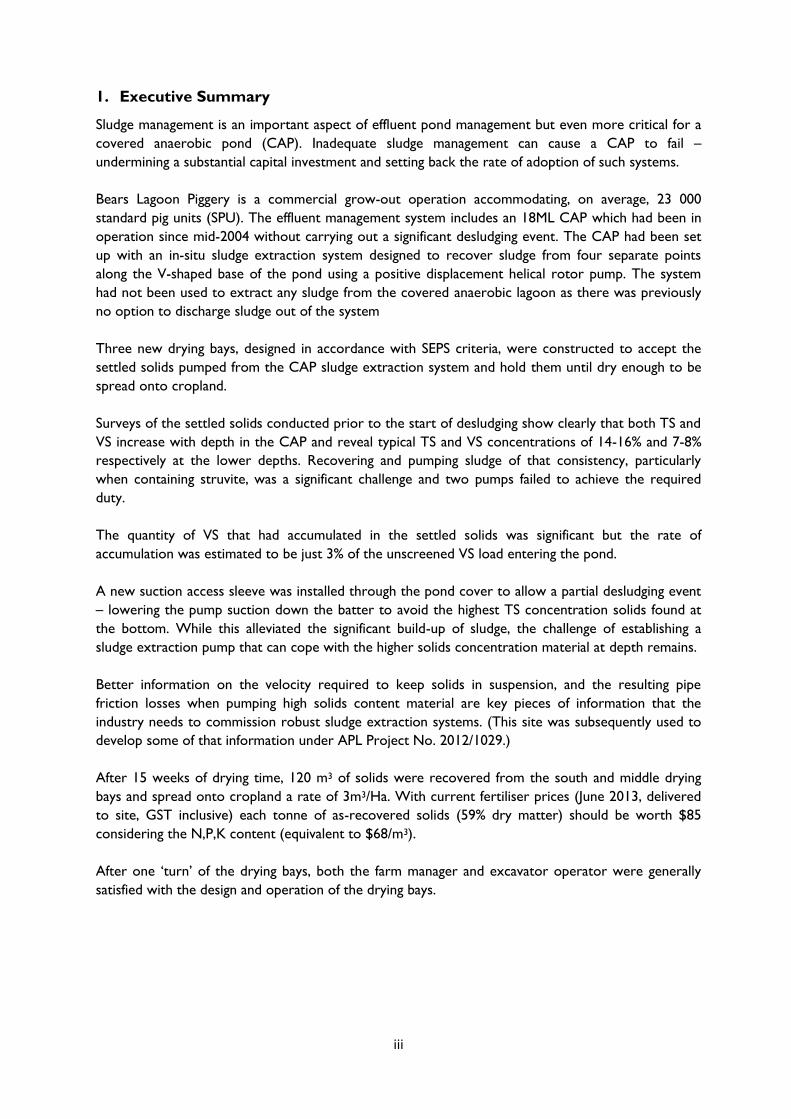
1. Executive Summary
Sludge management is an important aspect of effluent pond management but even more critical for a
covered anaerobic pond (CAP). Inadequate sludge management can cause a CAP to fail –
undermining a substantial capital investment and setting back the rate of adoption of such systems.
Bears Lagoon Piggery is a commercial grow-out operation accommodating, on average, 23 000
standard pig units (SPU). The effluent management system includes an 18ML CAP which had been in
operation since mid-2004 without carrying out a significant desludging event. The CAP had been set
up with an in-situ sludge extraction system designed to recover sludge from four separate points
along the V-shaped base of the pond using a positive displacement helical rotor pump. The system
had not been used to extract any sludge from the covered anaerobic lagoon as there was previously
no option to discharge sludge out of the system
Three new drying bays, designed in accordance with SEPS criteria, were constructed to accept the
settled solids pumped from the CAP sludge extraction system and hold them until dry enough to be
spread onto cropland.
Surveys of the settled solids conducted prior to the start of desludging show clearly that both TS and
VS increase with depth in the CAP and reveal typical TS and VS concentrations of 14-16% and 7-8%
respectively at the lower depths. Recovering and pumping sludge of that consistency, particularly
when containing struvite, was a significant challenge and two pumps failed to achieve the required
duty.
The quantity of VS that had accumulated in the settled solids was significant but the rate of
accumulation was estimated to be just 3% of the unscreened VS load entering the pond.
A new suction access sleeve was installed through the pond cover to allow a partial desludging event
– lowering the pump suction down the batter to avoid the highest TS concentration solids found at
the bottom. While this alleviated the significant build-up of sludge, the challenge of establishing a
sludge extraction pump that can cope with the higher solids concentration material at depth remains.
Better information on the velocity required to keep solids in suspension, and the resulting pipe
friction losses when pumping high solids content material are key pieces of information that the
industry needs to commission robust sludge extraction systems. (This site was subsequently used to
develop some of that information under APL Project No. 2012/1029.)
After 15 weeks of drying time, 120 m3 of solids were recovered from the south and middle drying
bays and spread onto cropland a rate of 3m3/Ha. With current fertiliser prices (June 2013, delivered
to site, GST inclusive) each tonne of as-recovered solids (59% dry matter) should be worth $85
considering the N,P,K content (equivalent to $68/m3).
After one ‘turn’ of the drying bays, both the farm manager and excavator operator were generally
satisfied with the design and operation of the drying bays.
iv
Contents
Introduction ................................................................................................................................................................... 1
Objectives .................................................................................................................................................................. 1
Milestones .................................................................................................................................................................. 1
Site description .............................................................................................................................................................. 1
Sludge extraction system ............................................................................................................................................ 3
Design solids accumulation rate ........................................................................................................................... 3
Drying bays or SEPS? ............................................................................................................................................... 4
Constructing the drying bays ................................................................................................................................ 4
Settled solids/sludge surveys ...................................................................................................................................... 7
Previous surveys (part of RIRDC PRJ2705) .................................................................................................. 7
June 2010 ............................................................................................................................................................... 7
“Pre-desludging” survey; April 2011 ............................................................................................................... 7
Desludging pump failure ...................................................................................................................................... 11
Characteristics of recovered solids ....................................................................................................................... 13
Achievements against objectives & Conclusions ................................................................................................ 17
Quantity and fate of solids partitioned to sludge ..................................................................................... 17
Management of the sludge extraction system ........................................................................................... 18
The design of the drying bays ........................................................................................................................ 18
Sharing data with the University of Queensland AWMC ....................................................................... 18
References ................................................................................................................................................................... 18
Appendix ...................................................................................................................................................................... 19
2. Introduction
Sludge management is important in effluent ponds but even more critical for a covered anaerobic
pond (CAP). Inadequate sludge management can cause a covered anaerobic pond to fail –
undermining a substantial capital investment and setting back the rate of adoption of such systems.
Bears Lagoon piggery had operated a CAP since mid-2004 without carrying out a significant
desludging event. This project was an opportunity to test an existing in-situ sludge extraction system
and establish and trial three drying bays to receive the recovered solids.
3. Objectives
The objectives of this APL funded project were to:
1. Perform detailed sludge survey to verify quantity and fate of COD and VS partitioned to
pond.
2. Document procedures for managing the in-situ sludge removal system to optimise
performance.
3. Document the performance of evaporative drying bays/SEPs and the characteristics of the
recovered sludge.
4. Provide data from objective 1 to AWMC UQ for validation of their anaerobic digestion
model.
4. Milestones
1. Start of project (1/2/2010)
2. Evaporative bays/SEPs designed and set-out for construction (30/4/2010)
3. Sludge survey pre-desludging completed and analysis of extracted sludge (30/6/2010)
4. Sampling of material recovered during the desludging event and post desludging survey
(15/6/2011)
5. One turn of evaporative bay/SEP completed including analysis of recovered sludge
(15/5/2013)
6. Final report (28/6/2013)
5. Site description
Bears Lagoon Piggery is a commercial grow-out operation (accommodating nursery through to
finisher pigs) located approximately 60 km north-west of Bendigo, Victoria. The operation is owned
by George Weston Foods Limited.
Pig numbers on-site average 23 000 standard pig units (SPU) and effluent from both unit 1 (nursery
through to weaner and grower pig groups) and unit 2 (finishers) is directed to the main pump pit
located to the west of the winter storage. Most sheds have under floor flush alleys with bore water
supplying the drinking water and water for flushing.
2
Table 1: Climate statistics for Bendigo Airport (BOM Station 081123, 1991-2009)
Jan Feb Mar Apr May Jun Jul Aug Sep Oct Nov Dec Ann
Mean Max.
(°C)
29.5 29.4 26.0 21.2 16.6 13.3 12.5 14.2 16.7 20.3 23.9 26.9 20.9
Mean Min.
(°C)
13.9 14.1 11.3 7.4 5.2 3.6 2.4 2.4 4.3 6.3 9.3 11.5 7.6
Median Rain
(mm)
22.9 22.2 12.9 22.5 32.5 39.8 57.8 48.4 40 42.4 39.7 31.4 452.4
Mean Rain
Days >1
mm
3.9 2.9 3.2 4.0 6.4 7.7 8.9 7.4 7.9 5.6 5.7 4.7 68.3
Mean clear
days
12.7 12.8 13.7 12.1 7.9 6.1 5.4 7.2 6.7 7.4 8.6 10.5 111.1
Mean
cloudy days
6.8 4.7 4.4 6.8 11.2 12.4 13.2 11.5 10.6 8.3 7.8 7.6 105.3
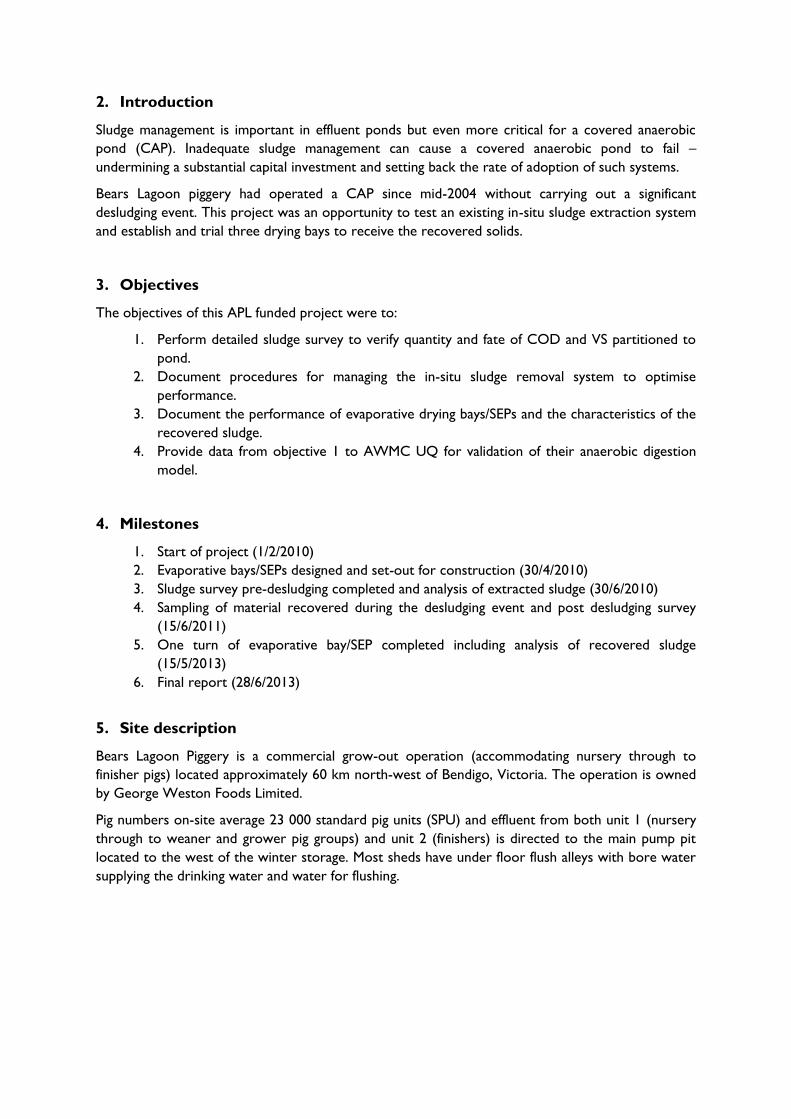
Figure 1: Wastewater treatment system
The effluent management system comprises a pair of static screens, an 18ML covered anaerobic
pond (CAP), a 9ML partially aerated basin and a 120 ML winter storage. Treated effluent is then
distributed over an area of flood irrigation on-farm.
3
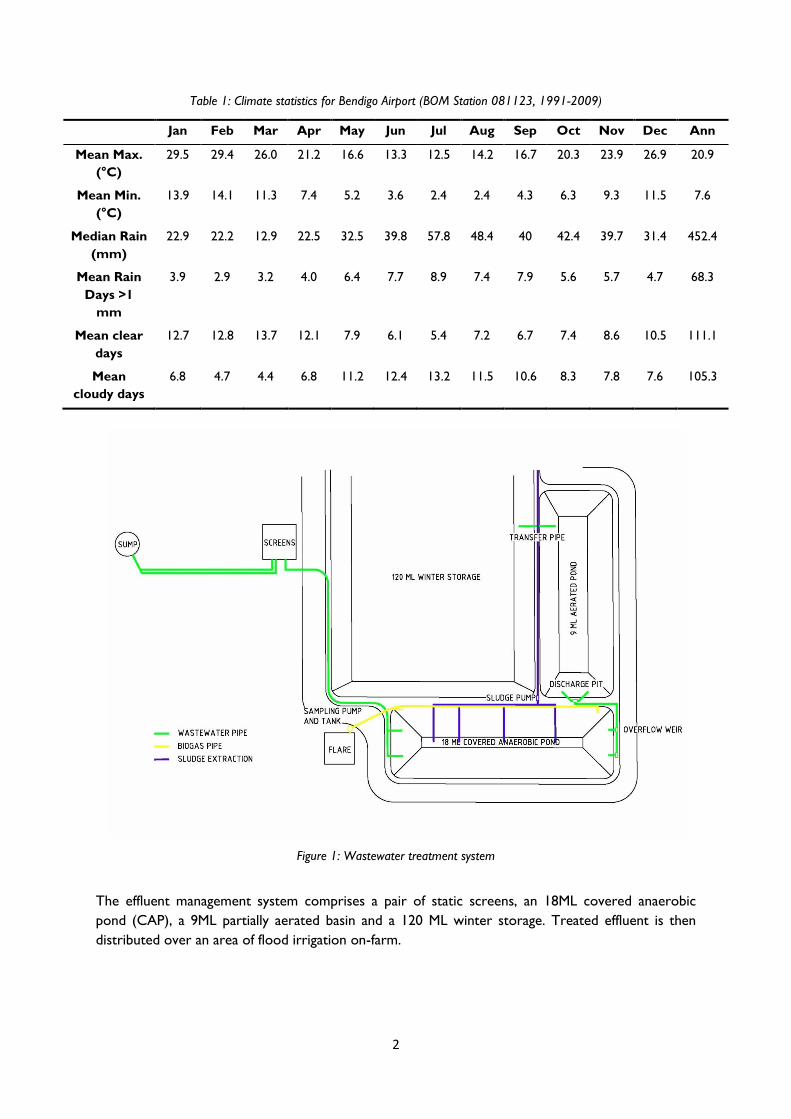
Figure 2: The completed earthworks with cover shown prior to floating (2004)
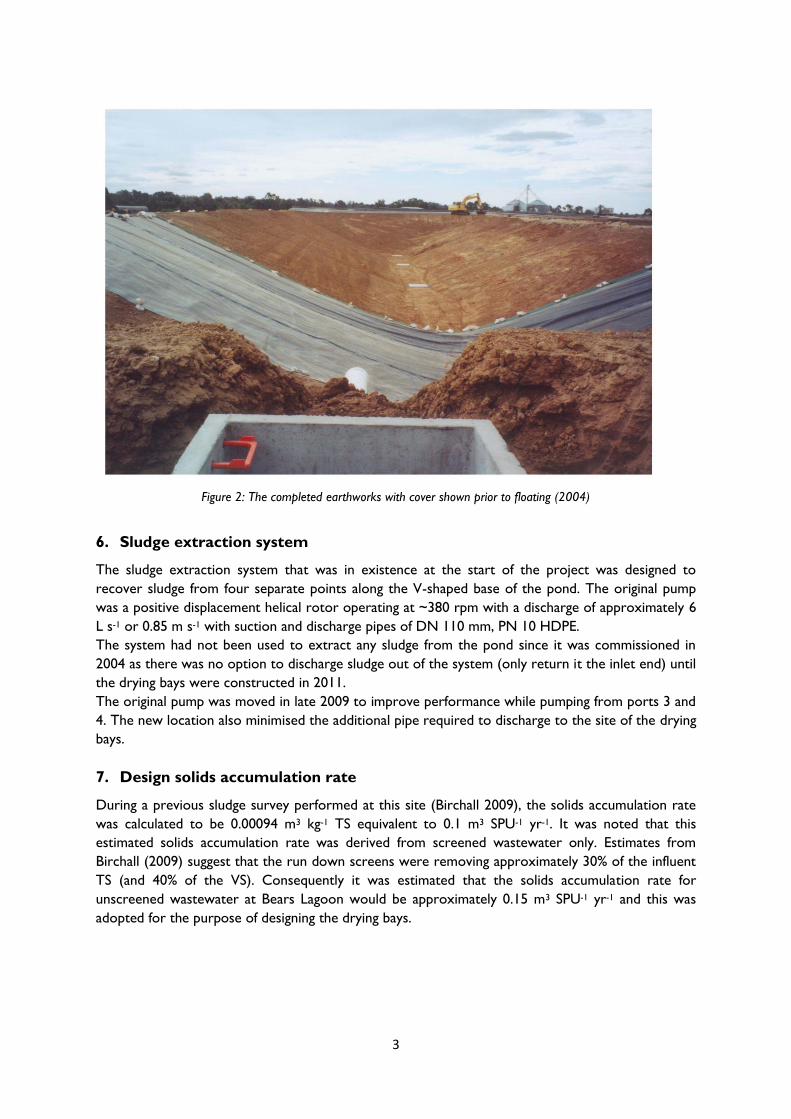
6. Sludge extraction system
The sludge extraction system that was in existence at the start of the project was designed to
recover sludge from four separate points along the V-shaped base of the pond. The original pump
was a positive displacement helical rotor operating at ~380 rpm with a discharge of approximately 6
L s-1 or 0.85 m s-1 with suction and discharge pipes of DN 110 mm, PN 10 HDPE.
The system had not been used to extract any sludge from the pond since it was commissioned in
2004 as there was no option to discharge sludge out of the system (only return it the inlet end) until
the drying bays were constructed in 2011.
The original pump was moved in late 2009 to improve performance while pumping from ports 3 and
4. The new location also minimised the additional pipe required to discharge to the site of the drying
bays.
7. Design solids accumulation rate
During a previous sludge survey performed at this site (Birchall 2009), the solids accumulation rate
was calculated to be 0.00094 m3 kg-1 TS equivalent to 0.1 m3 SPU-1 yr-1. It was noted that this
estimated solids accumulation rate was derived from screened wastewater only. Estimates from
Birchall (2009) suggest that the run down screens were removing approximately 30% of the influent
TS (and 40% of the VS). Consequently it was estimated that the solids accumulation rate for
unscreened wastewater at Bears Lagoon would be approximately 0.15 m3 SPU-1 yr-1 and this was
adopted for the purpose of designing the drying bays.
4
Figure 3: Original sludge extraction pump (previous location at inlet end)
8. Drying bays or SEPS?
Sedimentation and evaporation pond systems (SEPS) are usually designed as a primary pond receiving
daily inflows of wastewater. Solids settle out as the water moves along the bay and effluent storage is
typically provided by a separate structure (unless volumes are very small). Three bays are typically
required to allow for filling/drying/cleaning operations to continue concurrently. Design and
management issues are discussed in more detail in the draft Primefact by Kruger et al (2008).
Drying bays differ in that they are typically designed to be filled in one operation or batch and then
closed and left to dry. Given the large moisture deficit that prevails over the warmer months in their
Mediterranean climate, it is expected that drying bays could achieve two ‘turns’ each year at Bears
Lagoon. Desludging would then typically occur in early summer and late autumn each year.
At Bears Lagoon, only the settled solids/sludge is pumped from the covered anaerobic pond. Effluent
continues to pass from the CAP to the partially aerated pond and will not enter the drying bays. As
such, the system essentially operates as drying bays rather than SEPS. However, the suggested design
principles for SEPS (depth, width, clean-out procedures, etc) from Kruger et al 2008 were adopted
at Bears Lagoon:
Sludge depth; up to 800 mm
Base width; approx. 6 m
Batters; 3:1
The anticipated solids accumulation rate adopted was 0.15 m3 SPU-1 yr-1 rather than the default
capacity for SEPS (0.5 m3 SPU-1 yr-1) which must accommodate additional hydraulic loading.
9. Constructing the drying bays
Three flood irrigation bays (paddock no. 42) were identified by piggery management as the preferred
location for the drying bays. The site was within a Land Subject to Inundation Overlay thereby

5
triggering the need for development consent from the Loddon Shire Council. In addition, floodway
advice was sought from the North Central Catchment Management Authority to determine the 1%
ARI flood elevation. An embankment was required around the bays to provide flood protection to a
height of 600 mm above the 1% ARI flood elevation (109.5 m AHD).
A detailed geotechnical investigation was completed during March/April 2010. BM Civil Engineers
drilled four boreholes across the site and determined that the soils were suited to the intended
purpose provided that a 400 mm compacted clay liner was constructed. In-situ soil was suitable for
the liner when compacted to 98% of maximum dry density.
The existing irrigation bays were approximately 150 m long by 30 m wide, therefore the total area
available was 150 x 90 m. The north western corner of the site was approx 440 m from the sludge
extraction pump (200 m from pump to disused anaerobic pond, 240 m from pond to irrigation bays).
A copy of the tender drawings is included in Appendix A. The total sludge capacity of the three bays
was approximately 2,630 m3 at a sludge depth of 800 mm (equivalent to 0.23 m3 SPU-1 yr-1 if two
turns can be achieved). It is noted that the flood protection embankment provides an additional 780
mm of freeboard over and above that provided by each drying bay (320 mm at a sludge depth of 800
mm). In the event of unusually high rainfall, this additional capacity would provide sufficient storage
to contain runoff prior to excess water being pumped (using PTO pump) back up the delivery pipe
to the winter storage.
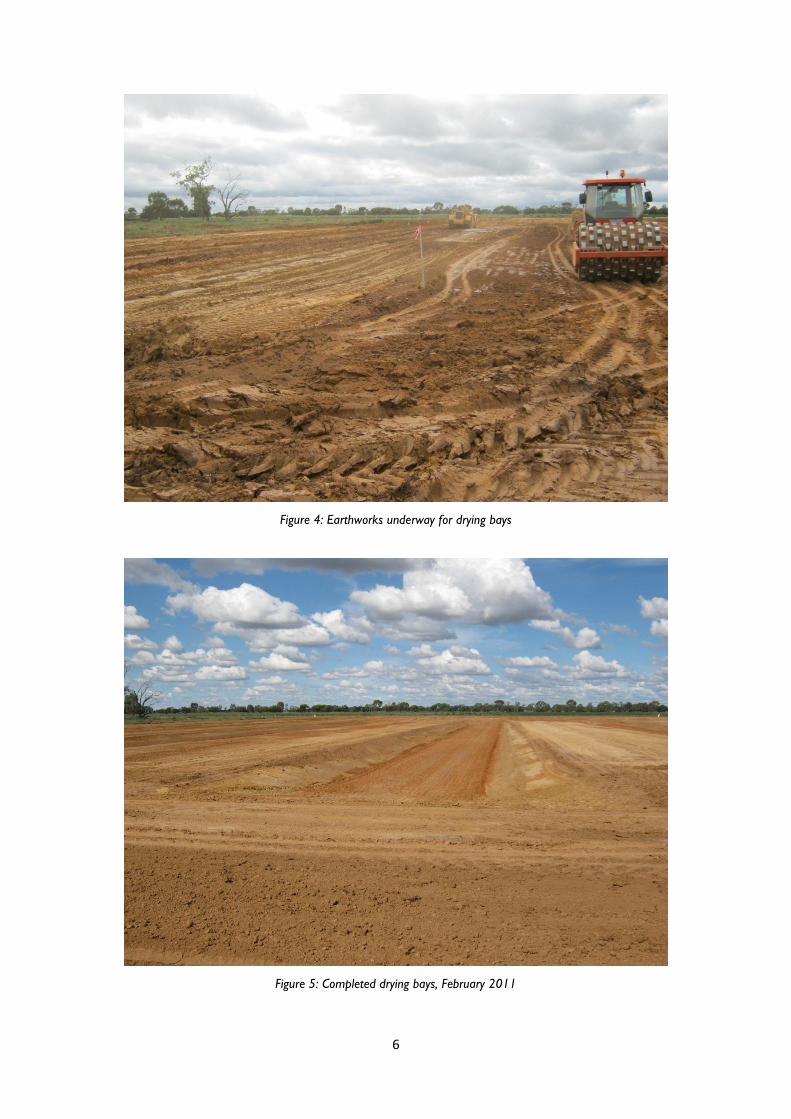
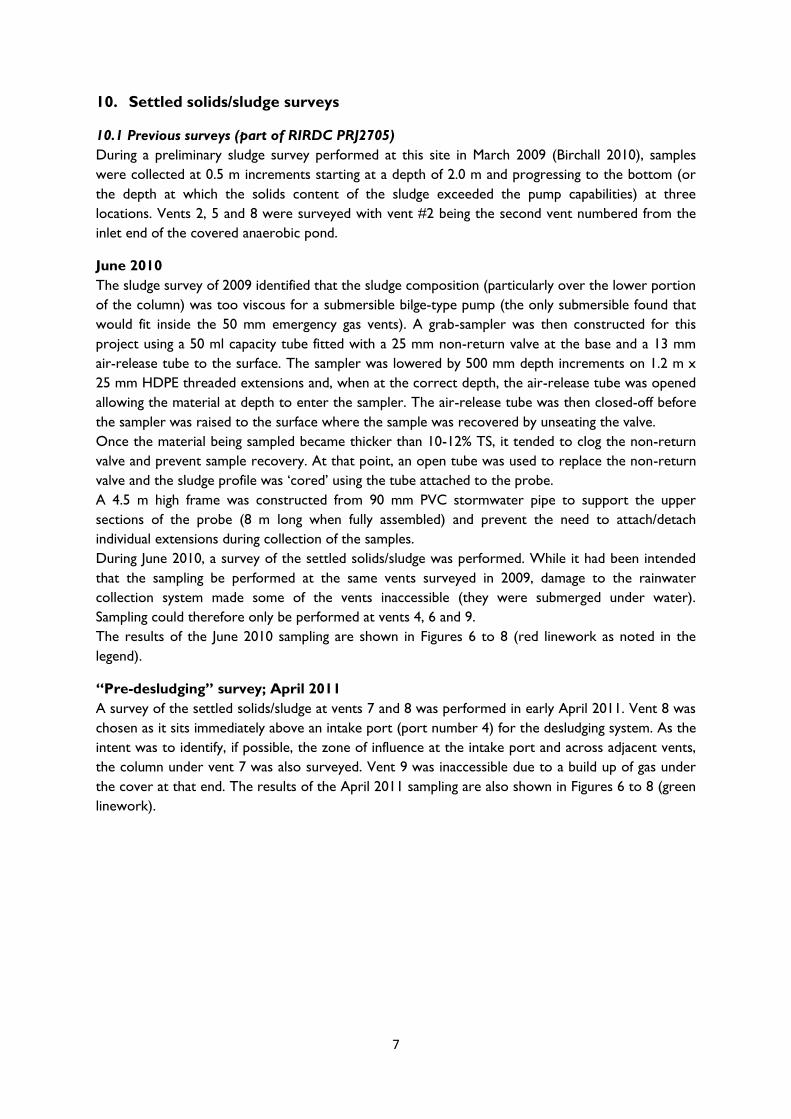
Earthworks were completed in late February 2011 followed by installation of the delivery pipework
over the following weeks. Figures 4 and 5 show the bays during construction and then at
completion.
6
Figure 4: Earthworks underway for drying bays
Figure 5: Completed drying bays, February 2011
7
10. Settled solids/sludge surveys
10.1 Previous surveys (part of RIRDC PRJ2705)
During a preliminary sludge survey performed at this site in March 2009 (Birchall 2010), samples
were collected at 0.5 m increments starting at a depth of 2.0 m and progressing to the bottom (or
the depth at which the solids content of the sludge exceeded the pump capabilities) at three
locations. Vents 2, 5 and 8 were surveyed with vent #2 being the second vent numbered from the
inlet end of the covered anaerobic pond.
June 2010
The sludge survey of 2009 identified that the sludge composition (particularly over the lower portion
of the column) was too viscous for a submersible bilge-type pump (the only submersible found that
would fit inside the 50 mm emergency gas vents). A grab-sampler was then constructed for this
project using a 50 ml capacity tube fitted with a 25 mm non-return valve at the base and a 13 mm
air-release tube to the surface. The sampler was lowered by 500 mm depth increments on 1.2 m x
25 mm HDPE threaded extensions and, when at the correct depth, the air-release tube was opened
allowing the material at depth to enter the sampler. The air-release tube was then closed-off before
the sampler was raised to the surface where the sample was recovered by unseating the valve.
Once the material being sampled became thicker than 10-12% TS, it tended to clog the non-return
valve and prevent sample recovery. At that point, an open tube was used to replace the non-return
valve and the sludge profile was ‘cored’ using the tube attached to the probe.
A 4.5 m high frame was constructed from 90 mm PVC stormwater pipe to support the upper
sections of the probe (8 m long when fully assembled) and prevent the need to attach/detach
individual extensions during collection of the samples.
During June 2010, a survey of the settled solids/sludge was performed. While it had been intended
that the sampling be performed at the same vents surveyed in 2009, damage to the rainwater
collection system made some of the vents inaccessible (they were submerged under water).
Sampling could therefore only be performed at vents 4, 6 and 9.
The results of the June 2010 sampling are shown in Figures 6 to 8 (red linework as noted in the
legend).
“Pre-desludging” survey; April 2011
A survey of the settled solids/sludge at vents 7 and 8 was performed in early April 2011. Vent 8 was
chosen as it sits immediately above an intake port (port number 4) for the desludging system. As the
intent was to identify, if possible, the zone of influence at the intake port and across adjacent vents,
the column under vent 7 was also surveyed. Vent 9 was inaccessible due to a build up of gas under
the cover at that end. The results of the April 2011 sampling are also shown in Figures 6 to 8 (green
linework).

8
Figure 6: TS concentration with depth; 2009 (blue), 2010 (red), 2011 (green)
Figure 7: VS concentration with depth; 2009 (blue), 2010 (red), 2011 (green)
0
100
200
300
400
500
600
700
800
0 2 4 6 8 10 12 14 16 18 20 D
ep
th (
cm)
TS %
V2
V5
V8
V4
V6
V9
V7
V8
0
100
200
300
400
500
600
700
800
0 1 2 3 4 5 6 7 8 9 10
De
pth
(cm
)
VS %
V2
V5
V8
V4
V6
V9
V7
V8
9
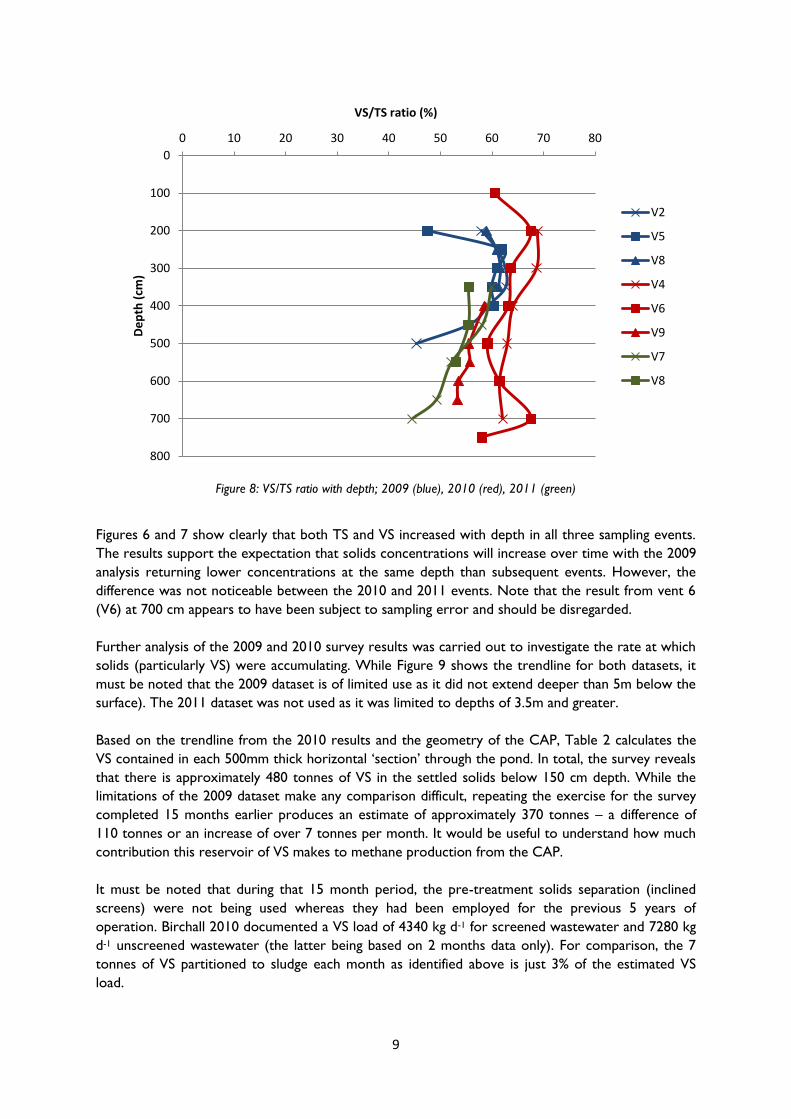
Figure 8: VS/TS ratio with depth; 2009 (blue), 2010 (red), 2011 (green)
Figures 6 and 7 show clearly that both TS and VS increased with depth in all three sampling events.
The results support the expectation that solids concentrations will increase over time with the 2009
analysis returning lower concentrations at the same depth than subsequent events. However, the
difference was not noticeable between the 2010 and 2011 events. Note that the result from vent 6
(V6) at 700 cm appears to have been subject to sampling error and should be disregarded.
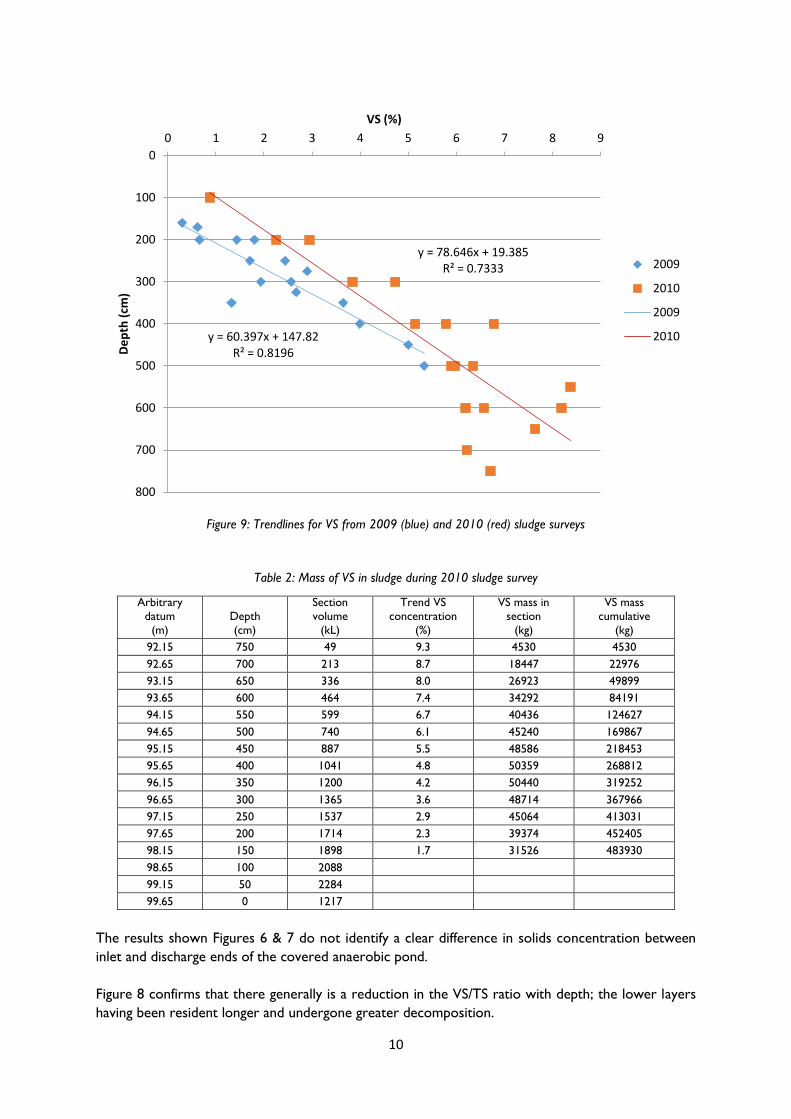
Further analysis of the 2009 and 2010 survey results was carried out to investigate the rate at which
solids (particularly VS) were accumulating. While Figure 9 shows the trendline for both datasets, it
must be noted that the 2009 dataset is of limited use as it did not extend deeper than 5m below the
surface). The 2011 dataset was not used as it was limited to depths of 3.5m and greater.
Based on the trendline from the 2010 results and the geometry of the CAP, Table 2 calculates the
VS contained in each 500mm thick horizontal ‘section’ through the pond. In total, the survey reveals
that there is approximately 480 tonnes of VS in the settled solids below 150 cm depth. While the
limitations of the 2009 dataset make any comparison difficult, repeating the exercise for the survey
completed 15 months earlier produces an estimate of approximately 370 tonnes – a difference of
110 tonnes or an increase of over 7 tonnes per month. It would be useful to understand how much
contribution this reservoir of VS makes to methane production from the CAP.
It must be noted that during that 15 month period, the pre-treatment solids separation (inclined
screens) were not being used whereas they had been employed for the previous 5 years of
operation. Birchall 2010 documented a VS load of 4340 kg d-1 for screened wastewater and 7280 kg
d-1 unscreened wastewater (the latter being based on 2 months data only). For comparison, the 7
tonnes of VS partitioned to sludge each month as identified above is just 3% of the estimated VS
load.
0
100
200
300
400
500
600
700
800
0 10 20 30 40 50 60 70 80 D
ep
th (
cm)
VS/TS ratio (%)
V2
V5
V8
V4
V6
V9
V7
V8
10
Figure 9: Trendlines for VS from 2009 (blue) and 2010 (red) sludge surveys
Table 2: Mass of VS in sludge during 2010 sludge survey
Arbitrary
datum
(m)
Depth
(cm)
Section
volume
(kL)
Trend VS
concentration
(%)
VS mass in
section
(kg)
VS mass
cumulative
(kg)
92.15 750 49 9.3 4530 4530
92.65 700 213 8.7 18447 22976
93.15 650 336 8.0 26923 49899
93.65 600 464 7.4 34292 84191
94.15 550 599 6.7 40436 124627
94.65 500 740 6.1 45240 169867
95.15 450 887 5.5 48586 218453
95.65 400 1041 4.8 50359 268812
96.15 350 1200 4.2 50440 319252
96.65 300 1365 3.6 48714 367966
97.15 250 1537 2.9 45064 413031
97.65 200 1714 2.3 39374 452405
98.15 150 1898 1.7 31526 483930
98.65 100 2088 99.15 50 2284
99.65 0 1217
The results shown Figures 6 & 7 do not identify a clear difference in solids concentration between
inlet and discharge ends of the covered anaerobic pond.
Figure 8 confirms that there generally is a reduction in the VS/TS ratio with depth; the lower layers
having been resident longer and undergone greater decomposition.
y = 60.397x + 147.82 R² = 0.8196
y = 78.646x + 19.385 R² = 0.7333
0
100
200
300
400
500
600
700
800
0 1 2 3 4 5 6 7 8 9 D
ep
th (
cm)
VS (%)
2009
2010
2009
2010
11
No data was collected for COD levels in the sludge column due to the laboratory’s concern about
the accuracy of the analysis on the high solids content material.
11. Desludging pump failure
Desludging was scheduled to begin immediately after the last sludge survey in April 2011. However,
when pumping began, the stator within the helical rotor pump failed after only several hours of
operation. The reason for failure was believed to be either that an air leak caused loss of prime and
subsequently damage to the stator while running dry, or that the small grit-like grains of struvite that
are present in the sludge damaged the stator. As this was the second time the stator had failed with
relatively low hours of use, Bears Lagoon management decided to investigate replacing the pump
with an alternative unit.
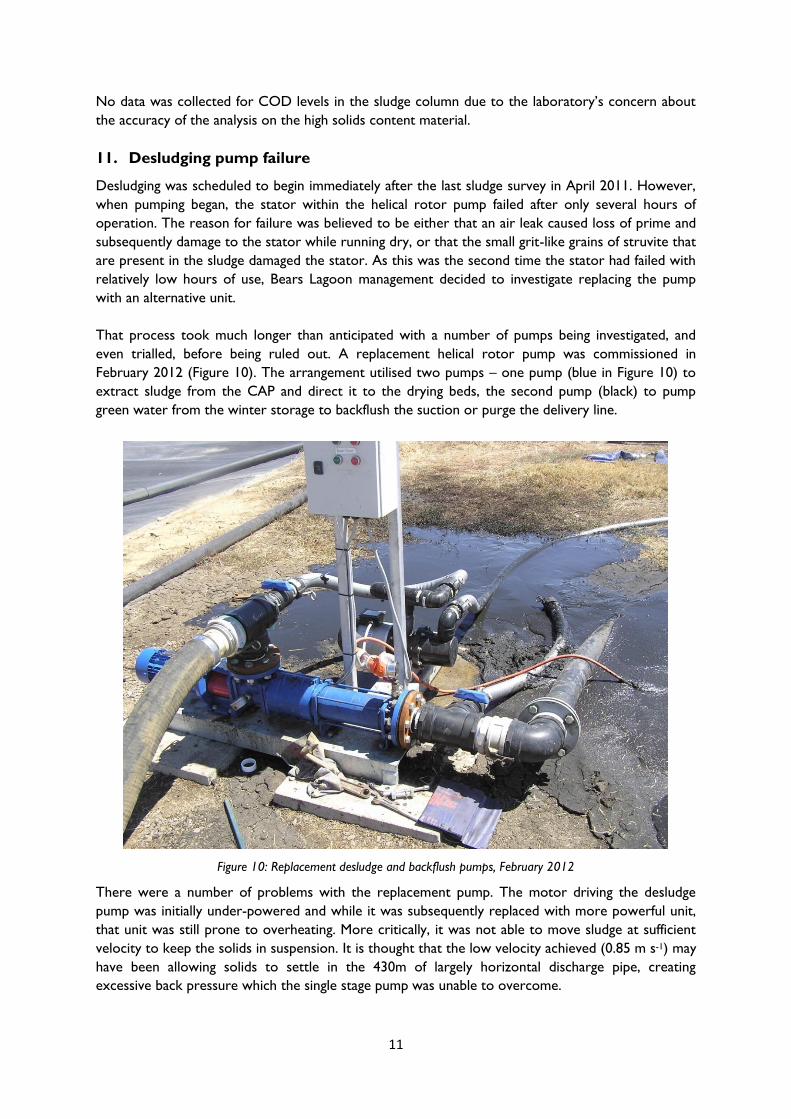
That process took much longer than anticipated with a number of pumps being investigated, and
even trialled, before being ruled out. A replacement helical rotor pump was commissioned in
February 2012 (Figure 10). The arrangement utilised two pumps – one pump (blue in Figure 10) to
extract sludge from the CAP and direct it to the drying beds, the second pump (black) to pump
green water from the winter storage to backflush the suction or purge the delivery line.
Figure 10: Replacement desludge and backflush pumps, February 2012
There were a number of problems with the replacement pump. The motor driving the desludge
pump was initially under-powered and while it was subsequently replaced with more powerful unit,
that unit was still prone to overheating. More critically, it was not able to move sludge at sufficient
velocity to keep the solids in suspension. It is thought that the low velocity achieved (0.85 m s-1) may
have been allowing solids to settle in the 430m of largely horizontal discharge pipe, creating
excessive back pressure which the single stage pump was unable to overcome.
12
There was some indication that the low flow may also have allowed methane gas to be released
accumulating in the pipework at the pump. A release of gas under pressure was evident when the
valve at the pump was opened.
In an effort to make some progress on reducing the volume of accumulated solids, a new 500mm
(nominal) inclined access sleeve was installed that allowed a 100mm suction line (separate to the
previously used manifold and in-situ inlet ports) to be progressively lowered down the internal
batter so avoiding the highest TS concentration solids found at the bottom. An additional delivery
line from the green water pump was attached to the desludge pump suction pipe so that cleaner
effluent from the winter storage could be used to agitate and dilute the settled solids. This
arrangement was an improvement and would have reduced the suction head but the helical rotor
pump was inherently not able to deliver the higher solids content material from the lower depths at
an adequate flowrate.
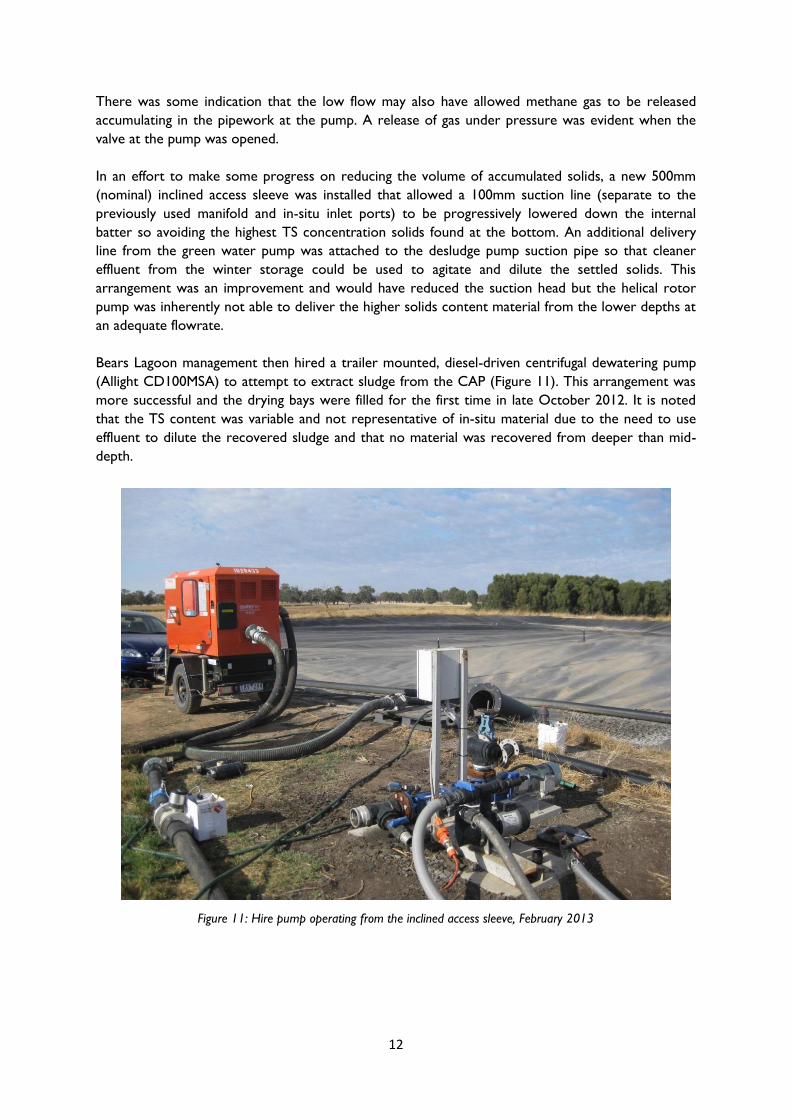
Bears Lagoon management then hired a trailer mounted, diesel-driven centrifugal dewatering pump
(Allight CD100MSA) to attempt to extract sludge from the CAP (Figure 11). This arrangement was
more successful and the drying bays were filled for the first time in late October 2012. It is noted
that the TS content was variable and not representative of in-situ material due to the need to use
effluent to dilute the recovered sludge and that no material was recovered from deeper than mid-
depth.
Figure 11: Hire pump operating from the inclined access sleeve, February 2013
13
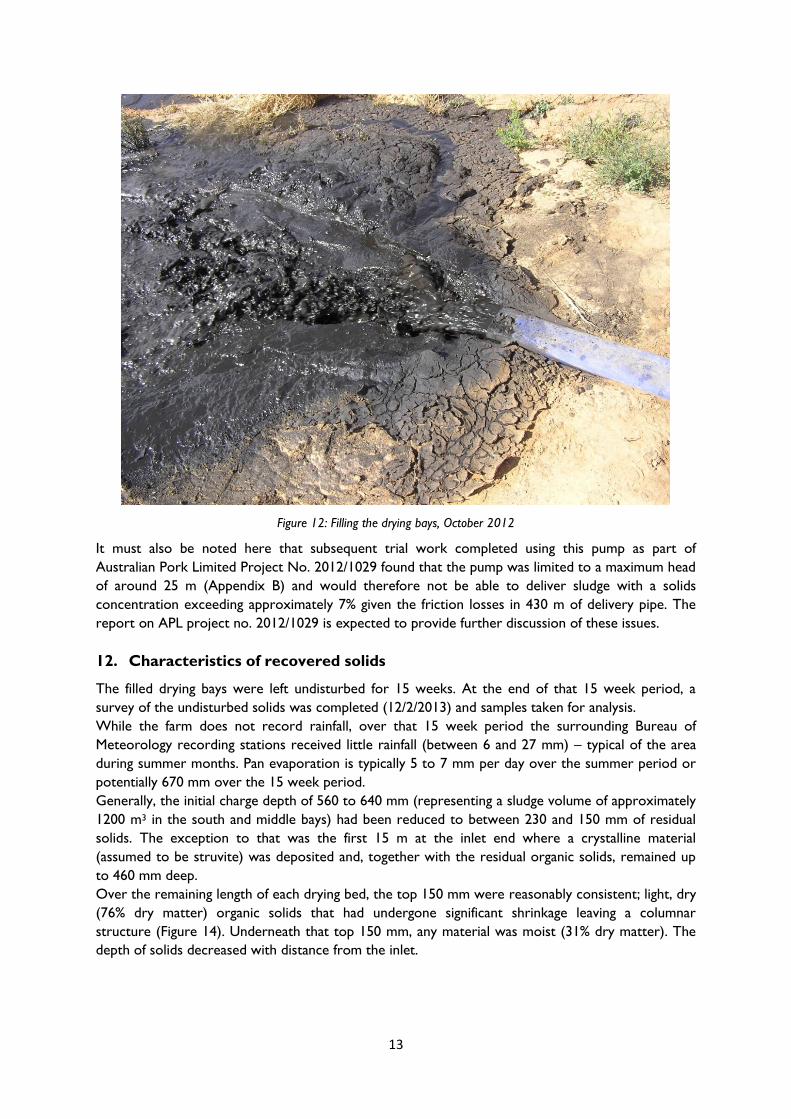
Figure 12: Filling the drying bays, October 2012
It must also be noted here that subsequent trial work completed using this pump as part of
Australian Pork Limited Project No. 2012/1029 found that the pump was limited to a maximum head
of around 25 m (Appendix B) and would therefore not be able to deliver sludge with a solids
concentration exceeding approximately 7% given the friction losses in 430 m of delivery pipe. The
report on APL project no. 2012/1029 is expected to provide further discussion of these issues.
12. Characteristics of recovered solids
The filled drying bays were left undisturbed for 15 weeks. At the end of that 15 week period, a
survey of the undisturbed solids was completed (12/2/2013) and samples taken for analysis.
While the farm does not record rainfall, over that 15 week period the surrounding Bureau of
Meteorology recording stations received little rainfall (between 6 and 27 mm) – typical of the area
during summer months. Pan evaporation is typically 5 to 7 mm per day over the summer period or
potentially 670 mm over the 15 week period.
Generally, the initial charge depth of 560 to 640 mm (representing a sludge volume of approximately
1200 m3 in the south and middle bays) had been reduced to between 230 and 150 mm of residual
solids. The exception to that was the first 15 m at the inlet end where a crystalline material
(assumed to be struvite) was deposited and, together with the residual organic solids, remained up
to 460 mm deep.
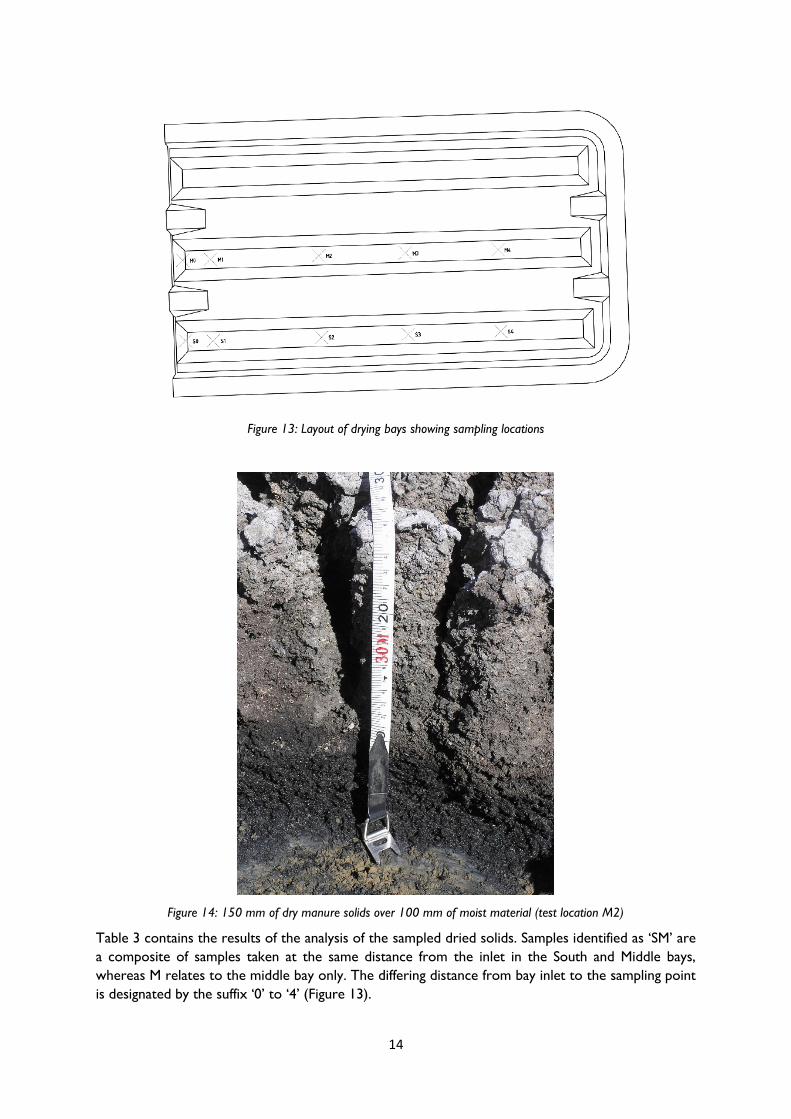
Over the remaining length of each drying bed, the top 150 mm were reasonably consistent; light, dry
(76% dry matter) organic solids that had undergone significant shrinkage leaving a columnar
structure (Figure 14). Underneath that top 150 mm, any material was moist (31% dry matter). The
depth of solids decreased with distance from the inlet.
14
Figure 13: Layout of drying bays showing sampling locations
Figure 14: 150 mm of dry manure solids over 100 mm of moist material (test location M2)
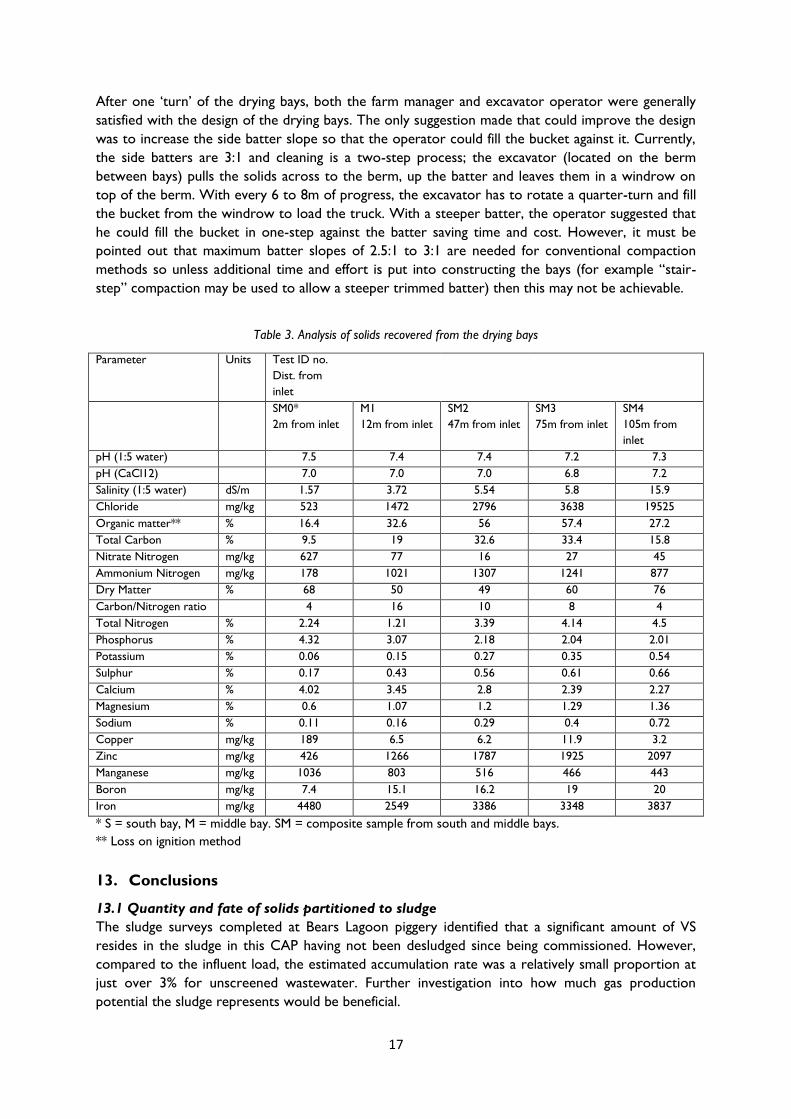
Table 3 contains the results of the analysis of the sampled dried solids. Samples identified as ‘SM’ are
a composite of samples taken at the same distance from the inlet in the South and Middle bays,
whereas M relates to the middle bay only. The differing distance from bay inlet to the sampling point
is designated by the suffix ‘0’ to ‘4’ (Figure 13).
15
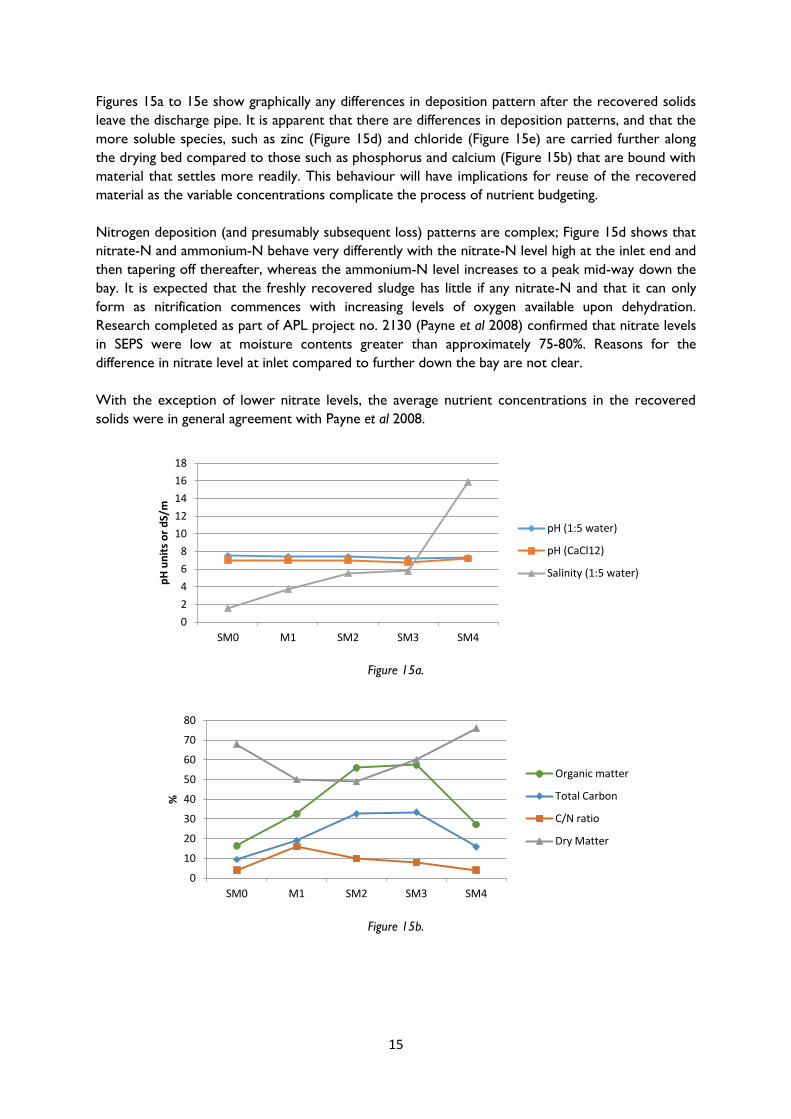
Figures 15a to 15e show graphically any differences in deposition pattern after the recovered solids
leave the discharge pipe. It is apparent that there are differences in deposition patterns, and that the
more soluble species, such as zinc (Figure 15d) and chloride (Figure 15e) are carried further along
the drying bed compared to those such as phosphorus and calcium (Figure 15b) that are bound with
material that settles more readily. This behaviour will have implications for reuse of the recovered
material as the variable concentrations complicate the process of nutrient budgeting.
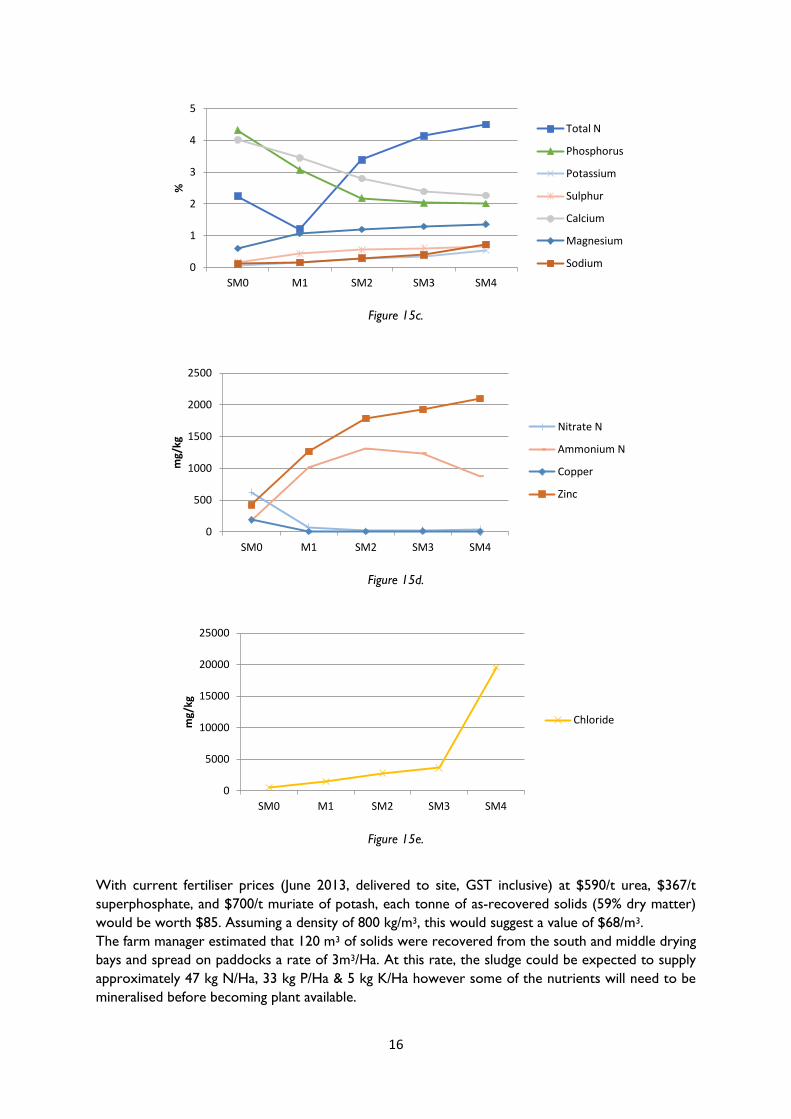
Nitrogen deposition (and presumably subsequent loss) patterns are complex; Figure 15d shows that
nitrate-N and ammonium-N behave very differently with the nitrate-N level high at the inlet end and
then tapering off thereafter, whereas the ammonium-N level increases to a peak mid-way down the
bay. It is expected that the freshly recovered sludge has little if any nitrate-N and that it can only
form as nitrification commences with increasing levels of oxygen available upon dehydration.
Research completed as part of APL project no. 2130 (Payne et al 2008) confirmed that nitrate levels
in SEPS were low at moisture contents greater than approximately 75-80%. Reasons for the
difference in nitrate level at inlet compared to further down the bay are not clear.
With the exception of lower nitrate levels, the average nutrient concentrations in the recovered
solids were in general agreement with Payne et al 2008.
Figure 15a.
Figure 15b.
0
2
4
6
8
10
12
14
16
18
SM0 M1 SM2 SM3 SM4
pH
un
its
or
dS/
m
pH (1:5 water)
pH (CaCl12)
Salinity (1:5 water)
0
10
20
30
40
50
60
70
80
SM0 M1 SM2 SM3 SM4
%
Organic matter
Total Carbon
C/N ratio
Dry Matter
16
Figure 15c.
Figure 15d.
Figure 15e.
With current fertiliser prices (June 2013, delivered to site, GST inclusive) at $590/t urea, $367/t
superphosphate, and $700/t muriate of potash, each tonne of as-recovered solids (59% dry matter)
would be worth $85. Assuming a density of 800 kg/m3, this would suggest a value of $68/m3.
The farm manager estimated that 120 m3 of solids were recovered from the south and middle drying
bays and spread on paddocks a rate of 3m3/Ha. At this rate, the sludge could be expected to supply
approximately 47 kg N/Ha, 33 kg P/Ha & 5 kg K/Ha however some of the nutrients will need to be
mineralised before becoming plant available.
0
1
2
3
4
5
SM0 M1 SM2 SM3 SM4
%
Total N
Phosphorus
Potassium
Sulphur
Calcium
Magnesium
Sodium
0
500
1000
1500
2000
2500
SM0 M1 SM2 SM3 SM4
mg/
kg
Nitrate N
Ammonium N
Copper
Zinc
0
5000
10000
15000
20000
25000
SM0 M1 SM2 SM3 SM4
mg/
kg
Chloride
17
After one ‘turn’ of the drying bays, both the farm manager and excavator operator were generally
satisfied with the design of the drying bays. The only suggestion made that could improve the design
was to increase the side batter slope so that the operator could fill the bucket against it. Currently,
the side batters are 3:1 and cleaning is a two-step process; the excavator (located on the berm
between bays) pulls the solids across to the berm, up the batter and leaves them in a windrow on
top of the berm. With every 6 to 8m of progress, the excavator has to rotate a quarter-turn and fill
the bucket from the windrow to load the truck. With a steeper batter, the operator suggested that
he could fill the bucket in one-step against the batter saving time and cost. However, it must be
pointed out that maximum batter slopes of 2.5:1 to 3:1 are needed for conventional compaction
methods so unless additional time and effort is put into constructing the bays (for example “stair-
step” compaction may be used to allow a steeper trimmed batter) then this may not be achievable.
Table 3. Analysis of solids recovered from the drying bays
Parameter Units Test ID no.
Dist. from
inlet
SM0*
2m from inlet
M1
12m from inlet
SM2
47m from inlet
SM3
75m from inlet
SM4
105m from
inlet
pH (1:5 water) 7.5 7.4 7.4 7.2 7.3
pH (CaCl12) 7.0 7.0 7.0 6.8 7.2
Salinity (1:5 water) dS/m 1.57 3.72 5.54 5.8 15.9
Chloride mg/kg 523 1472 2796 3638 19525
Organic matter** % 16.4 32.6 56 57.4 27.2
Total Carbon % 9.5 19 32.6 33.4 15.8
Nitrate Nitrogen mg/kg 627 77 16 27 45
Ammonium Nitrogen mg/kg 178 1021 1307 1241 877
Dry Matter % 68 50 49 60 76
Carbon/Nitrogen ratio 4 16 10 8 4
Total Nitrogen % 2.24 1.21 3.39 4.14 4.5
Phosphorus % 4.32 3.07 2.18 2.04 2.01
Potassium % 0.06 0.15 0.27 0.35 0.54
Sulphur % 0.17 0.43 0.56 0.61 0.66
Calcium % 4.02 3.45 2.8 2.39 2.27
Magnesium % 0.6 1.07 1.2 1.29 1.36
Sodium % 0.11 0.16 0.29 0.4 0.72
Copper mg/kg 189 6.5 6.2 11.9 3.2
Zinc mg/kg 426 1266 1787 1925 2097
Manganese mg/kg 1036 803 516 466 443
Boron mg/kg 7.4 15.1 16.2 19 20
Iron mg/kg 4480 2549 3386 3348 3837
* S = south bay, M = middle bay. SM = composite sample from south and middle bays.
** Loss on ignition method
13. Conclusions
13.1 Quantity and fate of solids partitioned to sludge
The sludge surveys completed at Bears Lagoon piggery identified that a significant amount of VS
resides in the sludge in this CAP having not been desludged since being commissioned. However,
compared to the influent load, the estimated accumulation rate was a relatively small proportion at
just over 3% for unscreened wastewater. Further investigation into how much gas production
potential the sludge represents would be beneficial.
18
13.2 Management of the sludge extraction system
The project’s stated objective to “document procedures for managing the in-situ sludge removal
system to optimise performance” was not achieved as a robust sludge extraction system was not
established during the life of the project. While more information has now been documented on
what doesn’t work, the challenges in handling potentially abrasive, high solids content material
remain to be overcome at this site and for the industry in general. Two conclusions that can be
drawn from the work performed are that:
Pump duties need to be clearly defined for selection of appropriate pumps. Better
information on the velocity required to keep solids in suspension and the resulting pipe
friction losses when pumping high solids content material are key pieces of information
when designing a sludge extraction system. Some preliminary information was collected
from this site under APL project no. 2012/1029.
Fixed suction pipes can become blocked with inactivity and are difficult to rehabilitate.
Small radius bends in the submerged pipework at this site prevented suction pipes from
being unblocked except by backflushing. Installing access sleeves for retractable suction
pipes through the embankment or cover allow more control over the depth of the
suction inlet and provide more flexibility for trouble shooting and pump choices. The
sleeve diameter should be large enough to accommodate the largest anticipated suction
pipe and a pipe providing a pressurised supply of water or effluent for agitation and/or
dilution.
With the difficulties encountered during desludging – particularly the stop/start nature and use of
diluting effluent, wet sludge samples were not considered representative of the in-situ material. Nor
was it possible to survey to identify the zone over which the extraction pump could recover sludge
as desludging efforts were interrupted and did not extend below mid-depth.
13.3 The design of the drying bays
After one ‘turn’ of the drying bays, both the farm manager and excavator operator were generally
satisfied with the design of the drying bays. The design criteria presented in the SEPS guidelines were
suitable for the task.
13.4 Sharing data with the University of Queensland AWMC
Analysis of the in-situ solids recovered during the sludge surveys was performed by Preethi Gopalan
(industry funded PhD student) at the Advanced Water Management Centre at the University of
Queensland.
14. References
Birchall, S. 2010. ‘Biogas production from covered lagoons; performance data from Bears Lagoon’,
RIRDC Research Publication No. 10/023, Canberra.
Kruger, I., H. Payne, K. Moore & J. Morgan 2008. ‘Sedimentation and evaporation pond systems’,
draft Primefact, NSW DPI.
Payne, H., K. Moore, J. Morgan & I. Kruger 2008. ‘Solids separation in sedimentation and evaporation
pond systems (SEPS)’, Final report to Australian Pork Ltd (APL), Project No. 2130, NSW
DPI.

19
15. Appendix
Appendix A – Drying bay tender drawings
Appendix B – Pump curve for hire pump