anaerobic digestion of pre-treated biological sludge from
TRANSCRIPT

Anaerobic digestion of pre-treatedbiological sludge from pulp and
paper industry usingheat, alkali and electroporation
Lina Cardell
2010-06-09
LiU-Tema V-Ex-25
Linköpings universitet, Inst. för Tema, Avd. för Vatten i natur och samhälle
581 83 Linköping
Tema vatten i natur och samhälle
Presentation Date
2010-06-09 Publishing Date (Electronic version)
2010-10-30
Department and Division
Department of Thematic Studies
– Water and Environmental
Studies
URL, Electronic Version
http://urn.kb.se/resolve?urn=urn:nbn:se:liu:diva- 57496
Publication Title
Anaerobic digestion of pre-treated biological sludge from pulp and paper industry using heat, alkali and
electroporation
Author
Lina Cardell
Abstract
The biological sludge formed in the pulp and paper wastewater treatment constitutes a costly problem to
dispose off due to poor dewaterability. It is often incinerated or used as soil conditioner improvement. By using anaerobic digestion of the biological sludge, the dewaterability can be increased. Thanks to the formation of biogas, the sludge volume is decreased and energy can be recovered as methane. By pre-treating the sludge, the biogas production can be increased, making the anaerobic digestion more economically feasible.
Eleven samples of biological sludge from six Swedish pulp and paper mills, chosen to represent different types and sizes of mills available in Sweden, were pre-treated with alkali (NaOH, pH12), heat (80˚C, 1 hr)
and electroporation (2000 pulses, 10 kV/cm). Initial methane production rate and methane potential of all sludges and pre-treatments were determined using batch experiment. A combination of two sludges (from the same mill) pre-treated with alkali and heat was further investigated in a semi-continuous digester experiment.
The batch experiments showed that alkali pre-treatment had the greatest positive effect on methane production. Heat treatment performed second best, whereas electroporation had no or little effect. Overall, pre-treatments increased the initial methane production rate, but with insignificant effects on the methane potential. Heat pre-treatment showed no difference in biogas production compared to the control in the
semi-continuous digester experiment. Alkali treatment was shown to inhibit biogas production and cause high accumulation of acetate. It could not be concluded whether it was an effect from hydroxide or sodium ion addition. Further analysis of the NaOH impact on floc structure, toxicity and bioavailability is suggested to determine the suitability of alkali-treated sludge for anaerobic digestion.
Keywords
Alkali, heat, electroporation, anaerobic digestion, biological sludge, pre-treatment, pulp and paper
industry
Language
X English Other (specify below)
Number of Pages 44
Type of Publication
Licentiate thesis Degree thesis Thesis C-level X Thesis D-level Report Other (specify below)
ISBN
ISRN: Tema/TBM-EX--10/0 --SE
Title of series (Licentiate thesis)
LiU-Tema V-Ex
Series number/ISSN (Licentiate thesis) 25


Anaerobic digestion of pre-treated biological sludge from pulp
and paper industry using heat, alkali and electroporation
Lina Cardell
June 2010
Supervisor: Xu-Bin Truong
Scandinavian Biogas Fuels AB
Department of Thematic Studies – Water and Environmental Studies
Linköping University
SE-581 83 Linköping
Examiner: Prof. Bo Svensson
Department of Thematic Studies – Water and Environmental Studies
Linköping University
SE-581 83 Linköping
ii
COPYRIGHT
The publishers will keep this document online on the Internet – or its possible replacement –
from the date of publication barring exceptional circumstances.
The online availability of the document implies permanent permission for anyone to read, to
download, or to print out single copies for his/hers own use and to use it unchanged for non-
commercial research and educational purpose. Subsequent transfers of copyright cannot
revoke this permission. All other uses of the document are conditional upon the consent of the
copyright owner. The publisher has taken technical and administrative measures to assure
authenticity, security and accessibility.
According to intellectual property law the author has the right to be mentioned when his/her
work is accessed as described above and to be protected against infringement.
For additional information about the Linköping University Electronic Press and its procedures
for publication and for assurance of document integrity, please refer to its www home page:
http://www.ep.liu.se/.
© Lina Cardell, 2010
iii
ABSTRACT The biological sludge formed in the pulp and paper wastewater treatment constitutes a costly
problem to dispose off due to poor dewaterability. It is often incinerated or used as soil
conditioner improvement. By using anaerobic digestion of the biological sludge, the
dewaterability can be increased. Thanks to the formation of biogas, the sludge volume is
decreased and energy can be recovered as methane. By pre-treating the sludge, the biogas
production can be increased, making the anaerobic digestion more economically feasible.
Eleven samples of biological sludges from six Swedish pulp and paper mills, chosen to
represent different types and sizes of mills available in Sweden, were pre-treated with alkali
(NaOH, pH12), heat (80˚C, 1 hr) and electroporation (2000 pulses, 10 kV/cm). Initial
methane production rate and methane potential of all sludges and pre-treatments were
determined using batch experiment. A combination of two sludges (from the same mill) pre-
treated with alkali and heat was further investigated in a semi-continuous digester experiment.
The batch experiments showed that alkali pre-treatment had the greatest positive effect on
methane production. Heat treatment performed second best, whereas electroporation had no or
little effect. Overall, pre-treatments increased the initial methane production rate, but with
insignificant effects on the methane potential. Heat pre-treatment showed no difference in
biogas production compared to the control in the semi-continuous digester experiment. Alkali
treatment was shown to inhibit biogas production and cause high accumulation of acetate. It
could not be concluded whether it was an effect from hydroxide or sodium ion addition.
Further analysis of the NaOH impact on floc structure, toxicity and bioavailability is
suggested to determine the suitability of alkali-treated sludge for anaerobic digestion.
Keywords: Alkali, heat, electroporation, anaerobic digestion, biological sludge, pre-
treatment, pulp and paper industry


v
SAMMANFATTNING Bioslam, som bildas vid vattenreningen på pappers- och massabruk, utgör en kostnad att
omhänderta på grund av avvattningssvårigheter. Kvittblivning sker oftast genom förbränning
eller användning som jordförbättringsmedel. Genom rötning kan slammet bli mer
lättavvattnat och tack vare att det bildas biogas minskar slamvolymen samtidigt som energi
kan utvinnas från metanet. Produktionen av biogas kan ökas genom att förbehandla slammet
innan rötning, vilket skulle innebära ekonomiska fördelar.
Denna studie har undersökt effekten av förbehandling för elva bioslam från sex svenska
pappers- och massabruk, valda att representera olika typer och storlekar på svenska bruk.
Behandlingen gjordes med alkali (NaOH, pH12), värme (80˚C, 1 h) och elektroporering
(2000 pulser, 10 kV/cm). Effekten av förbehandling på initial metanproduktionshastighet och
metanpotential undersöktes med hjälp av satsvis utrötning (batch) av alla slam. En
kombination av två slam från samma burk utvärderades i ett semi-kontinuerligt rötningsförsök
efter förbehandling med värme och alkali.
Resultatet från utrötningsförsöket visade att den alkaliska förbehandlingen hade störst positiv
inverkan på metanproduktionen. Värmebehandlingen presterade näst bäst, medan
elektroporeringen visade sig ha liten eller ingen effekt. Generellt sett ökade den initiala
metanproduktionshastigheten till följd av förbehandling, medan metanpotentialen förblev
oförändrad. Värmebehandling gav ingen effekt på biogasproduktionen i det semi-
kontinuerliga rötningsförsöket jämfört med kontroll, medan alkalisk förbehandling inhiberade
biogasproduktionen och orsakade höga koncentrationer av ackumulerat acetat. Det kunde inte
avgöras huruvida det var natrium- eller hydroxidjoner, som orsakade inhiberingen. För att
kunna utvärdera möjligheten att röta slam, som förbehandlats med NaOH, rekommenderas
vidare analys av dess påverkan på flockstruktur, toxicitet och biotillgänglighet.
Nyckelord: Alkali, elektroporering, anaerobisk rötning, bioslam, förbehandling, pappers- och
massaindustri


vii
PREFACE This thesis concludes my degree in Master of Science in Engineering Biology, with a profile
in Industrial Biotechnology and Production, at Linköping University. The work has been
carried out at Scandinavian Biogas Fuels AB during the spring term of 2010.
Lina Cardell, June 2010

ix
CONTENTS
1 Introduction ......................................................................................................................... 1
Abbreviations.......................................................................................................................... 1
2 Background ......................................................................................................................... 3
2.1 Paper mill wastewater treatment .................................................................................. 3
2.2 Biogas production from anaerobic digestion ............................................................... 4
2.3 Biology of anaerobic digestion .................................................................................... 4
2.3.1 Process parameters ............................................................................................... 4
2.4 Pre-treatment of substrate ............................................................................................ 5
2.4.1 Electroporation pre-treatment .............................................................................. 6
2.4.2 Heat pre-treatment ................................................................................................ 6
2.4.3 Alkali pre-treatment ............................................................................................. 7
3 Prospects and objectives ..................................................................................................... 9
3.1 Hypothesis ................................................................................................................... 9
3.2 Delimitations ............................................................................................................... 9
4 Methodology ..................................................................................................................... 10
4.1 Sludge collection ....................................................................................................... 10
4.2 Experimental set-up ................................................................................................... 10
4.2.1 Batch experiment ................................................................................................ 10
4.2.2 Semi-continuous digester experiment ................................................................ 12
4.3 Biological sludge pre-treatment ................................................................................. 12
4.3.1 Electroporation ................................................................................................... 12
4.3.2 Thermal pre-treatment ........................................................................................ 12
4.3.3 Chemical pre-treatment ...................................................................................... 13
4.4 Trial on polymer impact on methane potential .......................................................... 13
4.5 Analysis ..................................................................................................................... 13
4.5.1 Batch ................................................................................................................... 13
4.5.2 Semi-continuous digester ................................................................................... 14
4.6 Statistical analysis...................................................................................................... 15
5 Results and discussion ...................................................................................................... 17
5.1 General effects and observations from pre-treatment ................................................ 17
5.1.1 Electroporation pre-treatment ............................................................................ 17

x
5.1.2 Alkali pre-treatment ........................................................................................... 17
5.1.3 Heat pre-treatment .............................................................................................. 18
5.2 Batch results .............................................................................................................. 18
5.2.1 Electroporation pre-treatment ............................................................................ 18
5.2.2 Heat and alkali pre-treatment ............................................................................. 18
5.2.3 Methane potential of polymer ............................................................................ 22
5.3 Semi-continuous digester results ............................................................................... 24
5.3.1 Biogas production .............................................................................................. 24
5.3.2 VFA .................................................................................................................... 26
5.3.3 pH and gas methane content ............................................................................... 27
5.3.4 VS-reduction ...................................................................................................... 28
5.3.5 Viscosity analysis ............................................................................................... 29
5.4 Suggestions for improvements and continuation ....................................................... 30
6 Conclusions ....................................................................................................................... 31
Acknowledgements .................................................................................................................. 32
References ................................................................................................................................ 33
APPENDICES
Appendix A Batch raw data ............................................................................................ i
Appendix B Statistical analysis ..................................................................................... iv
Appendix C Viscosity analysis ...................................................................................... v
1
1 INTRODUCTION
The environmental impact arisen from the utilization of fossil fuels has probably escaped no
one and has led to an increased interest in developing new ways of obtaining renewable
energy. The process of converting biomass to energy through anaerobic digestion has
received particular attention and is gaining new grounds by the day. Different substrates are
constantly being investigated in order to find new suitable recourses, from which biogas
(methane) and fertilizer can be formed. Commonly used substrates are agricultural wastes,
manure and industrial wastewater (de Mes et al. 2003).
Biological sludge constitutes one of the by-products in pulp and paper wastewater treatment,
and has during recent years become more and more problematic to dispose off. An interesting
and promising approach to deal with biological sludge is anaerobic digestion, this way two
advantages can be gained; the decomposable organic fraction is transformed into methane,
thus, constituting a substrate for energy carrier generation, and the amount of sludge is
consequently significantly decreased and has an improved dewaterability (Truong et al.
2010). In order to make anaerobic digestion of biological sludge more economically feasible,
it is of great interest to find means of enhancing the production of methane from the substrate.
A very well practised way is pre-treatment.
ABBREVIATIONS
C-digester Control digester fed with untreated substrate
GC-FID Gas chromatograph with flame ionizing detector
HRT Hydraulic retention time
OLR Organic loading rate
PS-digester Digester fed with pre-treated substrate
TS Total solids (also called dry matter, DM)
VFA Volatile fatty acid
VS Volatile solids

3
2 BACKGROUND
2.1 PAPER MILL WASTEWATER TREATMENT
Large amounts of sludge are produced daily in the pulp and paper industry from the
wastewater treatment plant (WWTP). The sludge contains organic materials and, hence, is
prohibited from landfill disposal by law since 2005. The sludge is therefore either combusted
or transformed into some kind of product, e.g. for soil conditioner improvement. Two
principally different kinds of sludges are produced in the wastewater treatment process. The
primary sludge, i.e. fibre sludge, is produced in a first step of the process through mechanical
treatment. The remaining water is then treated biologically (aerobic conditions) in a second
step, in which microorganisms convert the organic material to carbon dioxide, water and new
cell mass, i.e. biological sludge (biological sludge is often referred to as waste activated
sludge – WAS, excess sludge, biosludge etc.). Sometimes a third step is applied, using
chemicals, which results in a chemical sludge. Due to low TS content, the sludges must be
dewatered or dried before disposal, which often implies high costs. (Höglund et al. 2001;
Truong et al. 2010)
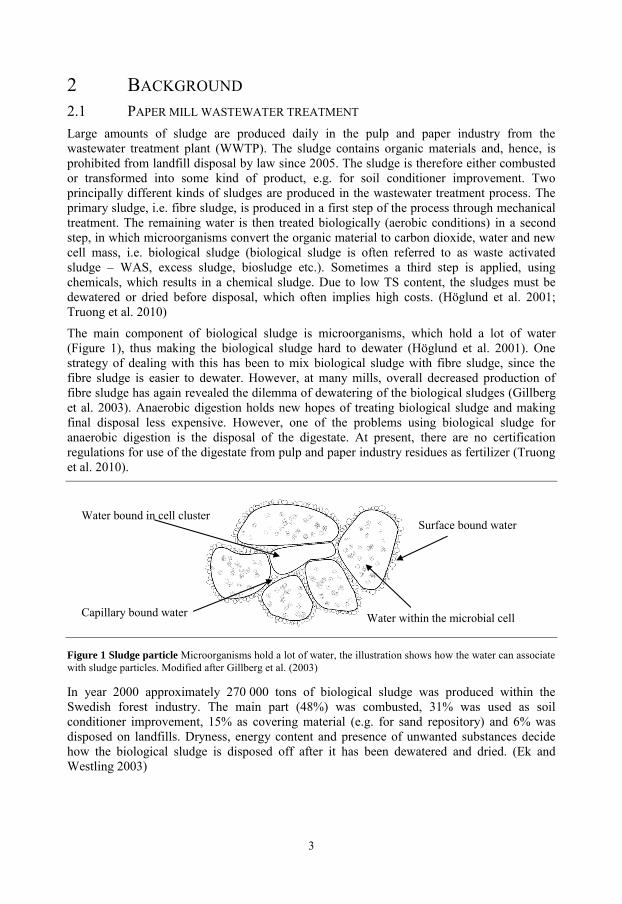
The main component of biological sludge is microorganisms, which hold a lot of water
(Figure 1), thus making the biological sludge hard to dewater (Höglund et al. 2001). One
strategy of dealing with this has been to mix biological sludge with fibre sludge, since the
fibre sludge is easier to dewater. However, at many mills, overall decreased production of
fibre sludge has again revealed the dilemma of dewatering of the biological sludges (Gillberg
et al. 2003). Anaerobic digestion holds new hopes of treating biological sludge and making
final disposal less expensive. However, one of the problems using biological sludge for
anaerobic digestion is the disposal of the digestate. At present, there are no certification
regulations for use of the digestate from pulp and paper industry residues as fertilizer (Truong
et al. 2010).
Figure 1 Sludge particle Microorganisms hold a lot of water, the illustration shows how the water can associate
with sludge particles. Modified after Gillberg et al. (2003)
In year 2000 approximately 270 000 tons of biological sludge was produced within the
Swedish forest industry. The main part (48%) was combusted, 31% was used as soil
conditioner improvement, 15% as covering material (e.g. for sand repository) and 6% was
disposed on landfills. Dryness, energy content and presence of unwanted substances decide
how the biological sludge is disposed off after it has been dewatered and dried. (Ek and
Westling 2003)
Surface bound water
Water within the microbial cell Capillary bound water
Water bound in cell cluster

4
2.2 BIOGAS PRODUCTION FROM ANAEROBIC DIGESTION
Anaerobic digestion is the biological conversion of organic matter into methane (CH4) and
carbon dioxide (CO2). Gas composition is 55-75 vol% CH4 and 25-45 vol% CO2. The biogas
can be upgraded to vehicle gas (96-97 vol% methane) or used for production of heat. A part
of the generated biogas can be used at the biogas plant itself in order to provide for the
internal energy requirement. Except for gas, a digestate is formed, which can be used as
fertilizer. (Appels et al. 2008; de Mes et al. 2003)
Anaerobic digestion might be part of the answer to the problem of disposing biological sludge
from pulp and paper industry. Anaerobic digestion is able to reduce the amount of sludge by
transforming the organic material into biogas. In the process, the dewaterability is improved
and a stabilisation, i.e. odour reduction, of the sludge is obtained. Today, dewatering of
biological sludge is often performed using sedimentation, filtration, polymer addition and
centrifugation (Gillberg et al. 2003; Truong et al. 2010). Anaerobic digestion posses several
advantages compared to aerobic digestion (presence of oxygen), such as lower nutrients
requirement, lower operation costs and lower sludge production. Aerobic digestion converts
about 50% of the carbon and energy from organic compounds into new bacterial cells or
sludge, corresponding percentage in anaerobic digestion is about 5%. Instead, much of the
organic material is converted into methane. However, in terms of biological wastewater
treatment, anaerobic digestion would not be able to replace the aerobic degradation of several
types of organic materials. Aerobic digestion also possesses lower concentrations of
suspended solids and nutrients in the supernatant compared to the anaerobic digestion
(Gerardi 2003).
2.3 BIOLOGY OF ANAEROBIC DIGESTION
The anaerobic digestion is fairly complex, and can only take place under strictly anaerobic
conditions. Four main steps, each one involving different groups of microorganisms, are
generally distinguished to make up the degradation pathway, where the final product form one
step constitutes the substrate for the next one as described in Appels et al. (2008):
Hydrolysis – conversion of insoluble organic materials into soluble organic substances
Acidogenisis – formation of volatile fatty acids and CO2
Acetogenisis – formation of acetate, CO2 and H2
Methanogenesis – formation of CH4 and CO2
The hydrolysis is considered to be the overall rate-limiting step in anaerobic digestion on
sludge (Climent et al. 2007; Gavala et al. 2003).
2.3.1 PROCESS PARAMETERS
A number of parameters and settings must be monitored to evaluate and ensure that the
process is stable (i.e. steady pH, gas production etc), but also to detect changes as early as
possible. The ones in focus in this thesis are described below.
pH and temperature
Anaerobic digestion can take place under psychrophilic (10-20ºC), mesophilic (20-40ºC), or
thermophilic (50-60ºC) conditions, but methane production has an optimum between 35 and
37˚C (de Mes et al. 2003). The pH optimum varies among the different groups of
5
microorganisms. The methanogenic bacteria constitute the group that is the most sensitive,
and has an optimum pH in the range of 6.5-7.2 (Appels et al. 2009).
Alkalinity
In order to keep pH neutral and stable it is necessary to retain a steady alkalinity, which is a
measure of the buffer capacity of the process. Bicarbonate in the liquid phase constitutes the
major source of alkalinity, and is in equilibrium with carbon dioxide in the gas phase. (Appels
et al. 2009)
Total solids (TS), volatile solids (VS) and organic loading rate (OLR)
The amount of organic material that enters the digester and becomes accessible to the
microorganisms is determined by the organic loading rate (OLR). Too low OLR results in a
stagnated process and too high OLR will cause overload, since the microorganisms cannot
keep up with the incoming substrate. The accessible organic material is usually stated as the
amount of volatile solids (VS). To determine VS, the amount of total solids (TS) (also called
dry matter –DM) must be known (Schnürer and Jarvis 2009). TS is defined as the mass
percentage of the substrate that is left after drying in 105˚C. VS is then calculated as the mass
percentage of TS that is combusted in 550˚C (Swedish standard (SIS), SS 02 81 13). The
OLR is often given as g VS/L/day.
Hydraulic retention time (HRT)
The average time for the liquid sludge to stay in the digester is called the hydraulic retention
time (HRT; Appels et al. 2008), and is determined as the ratio between the working volume
and the daily input.
Volatile fatty acids (VFA)
Volatile fatty acids (short fatty acids) are important to monitor on a regular basis, since a rise
in VFA concentration is an important indication on process disturbance. Propionic acid is
especially important to keep track of. VFA accumulation may depend on substrate overload,
or inhibition of the methanogenic bacteria. (Schnürer and Jarvis 2009)
Rheology and viscosity
Rheology is a useful tool in sludge handling, and “describes the deformation of a body under
the influence of stress”. A “body” in this case refers to a fluid, but could also be a solid or a
gas. Limit viscosity (ŋ ), shear rate (γ∙) and shear stress (τ) are a few of the many rheological
parameters that can be measured with a rheometer and used to characterize reactor liquids and
residual sludge (cf. Appendix C). (Schramm 1994; Tixier et al. 2003a)
Methane potential
The methane potential of a substrate can be decided by digesting it completely, i.e. until the
gas production has ceased. This is performed using batch digestion, since complete digestion
seldom occurs in continuous digestion. The methane potential is therefore not reached in
continuous digestion, and is instead used to determine the yield of the continuous digestion by
comparing its gas production to the complete digestion.
2.4 PRE-TREATMENT OF SUBSTRATE
The major part of the organic fraction of biological sludge is enclosed within the microbial
cell membranes. The rigid cell envelope make up an efficient defence against biodegradation,
and hydrolysis is therefore recognized as the rate-limiting stage in anaerobic digestion of
biological sludge (Kim et al. 2003; Lin et al. 2009; Weemaes and Verstraete 1998). By pre-
treating the sludge, floc structure is ruptured and both intracellular and extracellular materials
6
can be more easily released through destruction of the microorganisms. This results in a faster
and more efficient conversion of the organic materials leading to an increased biogas
production (Kopplow et al. 2004; Lin et al. 2009). Other advantages achieved by pre-
treatment are reduced foam formation in the digester, increased dewaterability and improved
pathogen reduction (Davidsson et al. 2008).
Several different approaches have been investigated to pre-treat sludge, including thermal
(Gavala et al. 2003; Wang et al. 1997), chemical (Kim et al. 2003; Lin et al. 1997),
thermochemical (Tanaka et al. 1997; Vlyssides and Karlis 2004), ultrasonic (Kim et al. 2003;
Truong et al. 2010) and mechanical (Barjenbruch and Kopplow 2003).
Full scale pre-treatment of sludge, mainly thermal (the Cambi-process; a combination of high
temperature and pressure) and ultrasonic treatments are utilised within the Nordic region
(Davidsson et al. 2008). According to Lin et al. (2009) there are no full scale biogas plants for
digestion of solid residues within the pulp and paper industry.
2.4.1 ELECTROPORATION PRE-TREATMENT
Electroporation (pulsed electric fields) is widely used in the field of genetic engineering as a
means of transferring genetic material into cells by temporally creating pores in the cell
membrane using electric pulses. By increasing the pulse intensity the pores can be made
permanent, which is commonly practiced on vegetables and fruits within the food industry
(Carlsson and Lagerkvist 2008). The experience of using electroporation in the context of pre-
treatment for anaerobic digestion, especially when conducted on sludge substrate is low.
Thus, Kopplow et al. (2004) report that the method is not yet competitive due to high energy
input levels. Carlson and Lagerkvist (2008) concluded that electroporation pre-treatment of
sewage sludge did not increase production of methane. Higher field intensity (>24 kV/cm)
was suggested for future experiments. A so called “discharge treatment” was advised by the
manufacturer due to the small size of sludge cells, making them hard to penetrate. Choi et al.
(2006) demonstrated that use of a pulse power technique for pre-treatment of waste activated
sludge could increase the biogas production 2.5 times.
2.4.2 HEAT PRE-TREATMENT
Literature mostly report studies where high temperature (150 - 200˚C) has been used (Appels
et al. 2008; Bougrier et al. 2008; Elliott and Mahmood 2007). Temperatures exceeding 200˚C
have been found to induce formation of refractory compounds (Climent et al. 2007). In
addition, high temperature pre-treatments are more difficult to operate and more energy
consuming, which makes low thermal, (<100˚C) more attractive (Gavala et al. 2003). Several
studies report successful outcomes when pre-treating sludge at 70˚C (Climent et al. 2007;
Ferrer et al. 2008; Skiadas et al. 2005) and a few also underlie the use of short pre-treatment
times (~1 hr; Davidsson and Jansen, 2006; Wang et al. 1997), thus, reducing energy
consumption even further.
Lüdtke (2010) found that 80˚C was the most optimal temperature (also evaluating 55˚C and
120˚C). He also found that duration time of heat pre-treatment, including the time to reach the
desired temperature, did not have as great effect on the methane production as was expected:
6 hrs (230 ml methane/g VS), >12 hrs (220 ml methane/g VS), >2 hrs (210 ml methane/g VS).
The common asset of 70-80˚C waste heat on paper mills constitutes another reason to
investigate the effect of pre-treatment at this temperature.
7
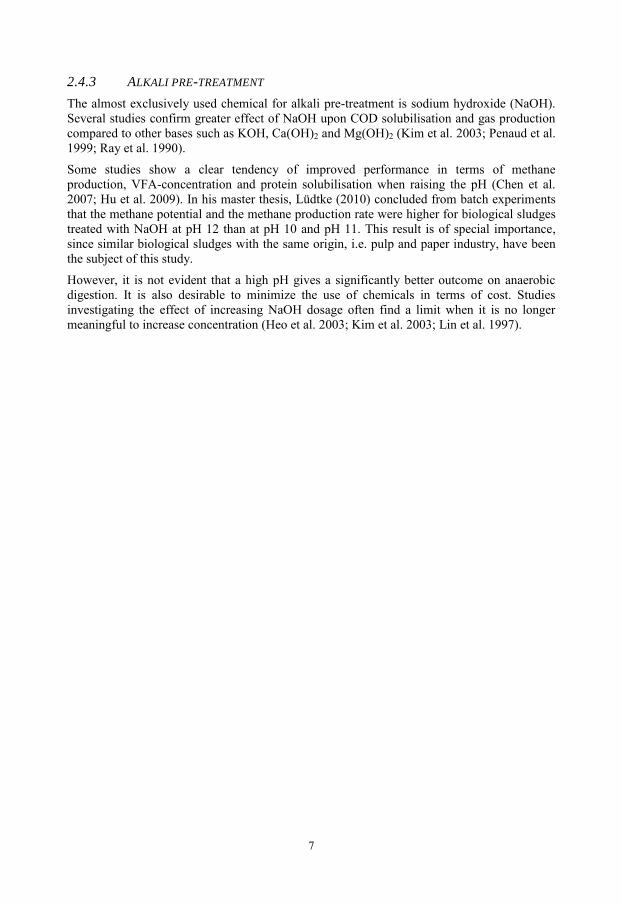
2.4.3 ALKALI PRE-TREATMENT
The almost exclusively used chemical for alkali pre-treatment is sodium hydroxide (NaOH).
Several studies confirm greater effect of NaOH upon COD solubilisation and gas production
compared to other bases such as KOH, Ca(OH)2 and Mg(OH)2 (Kim et al. 2003; Penaud et al.
1999; Ray et al. 1990).
Some studies show a clear tendency of improved performance in terms of methane
production, VFA-concentration and protein solubilisation when raising the pH (Chen et al.
2007; Hu et al. 2009). In his master thesis, Lüdtke (2010) concluded from batch experiments
that the methane potential and the methane production rate were higher for biological sludges
treated with NaOH at pH 12 than at pH 10 and pH 11. This result is of special importance,
since similar biological sludges with the same origin, i.e. pulp and paper industry, have been
the subject of this study.
However, it is not evident that a high pH gives a significantly better outcome on anaerobic
digestion. It is also desirable to minimize the use of chemicals in terms of cost. Studies
investigating the effect of increasing NaOH dosage often find a limit when it is no longer
meaningful to increase concentration (Heo et al. 2003; Kim et al. 2003; Lin et al. 1997).

9
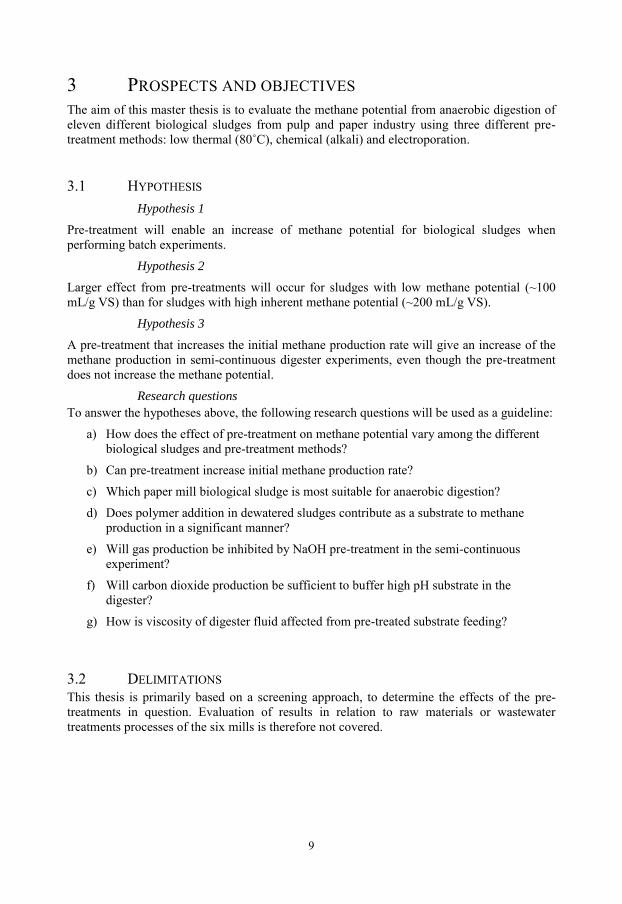
3 PROSPECTS AND OBJECTIVES
The aim of this master thesis is to evaluate the methane potential from anaerobic digestion of
eleven different biological sludges from pulp and paper industry using three different pre-
treatment methods: low thermal (80˚C), chemical (alkali) and electroporation.
3.1 HYPOTHESIS
Hypothesis 1
Pre-treatment will enable an increase of methane potential for biological sludges when
performing batch experiments.
Hypothesis 2
Larger effect from pre-treatments will occur for sludges with low methane potential (~100
mL/g VS) than for sludges with high inherent methane potential (~200 mL/g VS).
Hypothesis 3
A pre-treatment that increases the initial methane production rate will give an increase of the
methane production in semi-continuous digester experiments, even though the pre-treatment
does not increase the methane potential.
Research questions
To answer the hypotheses above, the following research questions will be used as a guideline:
a) How does the effect of pre-treatment on methane potential vary among the different
biological sludges and pre-treatment methods?
b) Can pre-treatment increase initial methane production rate?
c) Which paper mill biological sludge is most suitable for anaerobic digestion?
d) Does polymer addition in dewatered sludges contribute as a substrate to methane
production in a significant manner?
e) Will gas production be inhibited by NaOH pre-treatment in the semi-continuous
experiment?
f) Will carbon dioxide production be sufficient to buffer high pH substrate in the
digester?
g) How is viscosity of digester fluid affected from pre-treated substrate feeding?
3.2 DELIMITATIONS
This thesis is primarily based on a screening approach, to determine the effects of the pre-
treatments in question. Evaluation of results in relation to raw materials or wastewater
treatments processes of the six mills is therefore not covered.

10
4 METHODOLOGY
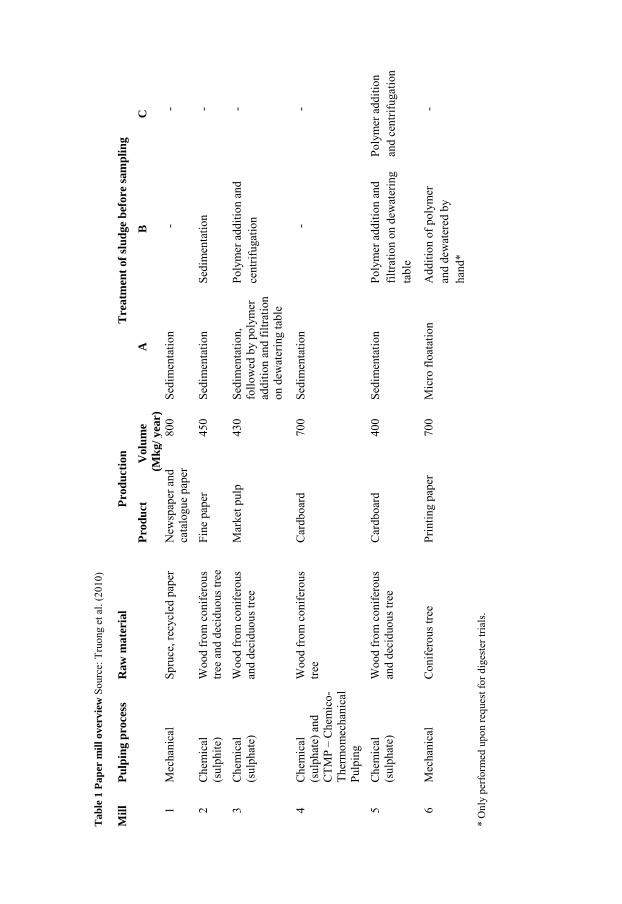
4.1 SLUDGE COLLECTION
The biological sludges used in this study were collected from six Swedish pulp and paper
mills (1-6), which were chosen to represent different types and sizes of mills available in
Sweden. From mill 2, 3, 5 and 6, samples were taken at two (or three) different locations in
the wastewater treatment process (Table 1), overall resulting in eleven sludge samples
henceforth referred to as 1, 2A, 2B, 3A, 3B, 4, 5A, 5B, 5C, 6A and 6B. B and C-samples are
withdrawn after dewatering of the biological sludge, thus, holding higher values of TS content
than corresponding A-sample. TS varied considerably among the different sludges most of
them ≤ 3%, but up to 16% was recorded (Table 2).
Table 2 Sludge TS.
Sludge 1 2A 2B 3A 3B 4 5A 5B 5C 6A 6B
TS (%) 1 1 3 4 13 1 0.6 5 16 2 8
4.2 EXPERIMENTAL SET-UP
Four laboratory-scale batch and one semi-continuous digester experiment were performed in
order to determine the effect of low thermal (80˚C), chemical (NaOH) and an electroporation
pre-treatment. Batch experiments are conducted to investigate the methane potential of a
substrate, by measuring the methane production in sealed bottles at 5-7 occasions during a
period of time (normally around 40 days). Batches are generally performed in order to screen
for suitable substrates, and precedes digester trials. Semi-continuous digester experiments are
then set to further investigate the substrate in a scale that is more similar to the full scale,
which includes daily feeding and outtake, analysis etc.
4.2.1 BATCH EXPERIMENT
Batch 1 and 2 included all sludges exposed to thermal, chemical or no pre-treatment and
Batch 3 and 4 all sludges pre-treated with electroporation and untreated samples. Batch
experiments were executed according to Scandinavian Biogas Fuels AB standard procedure
as presented below.
Inoculum
Inoculum for the batch experiments consisted of digester outtake (40-60%) from different
Scandinavian Biogas Fuels AB lab-scale continuously stirred reactors (CSTR) and sludge
from Nykvarn sewage treatment plant (Tekniska Verken, Linköping) (40-60%) to provide a
seeding material. Thus, digester material used was a combination of oat, rape, household
garbage, cow manure or on fibre and biological sludge from sewage plants or paper mill
wastewater treatment.
Batch start-up
All treatments were carried out in triplicates, using 320 mL glass flasks. Each sample bottle
contained 20 g inoculum, 2 mL nutrients solution (NH4Cl, NaCl, CaCl2 ∙ 2H2O and MgCl2 ∙
6H2O) and 0.3 mL of reducing Na2S-solution (added after change of gas phase). Due to
different TS content of the biological sludges, the amount of sludge added varied depending
on the desired OLR. This resulted in different additions of oxygen free MilliQ-water needed
to achieve a working volume of 100 mL. Inoculum, MilliQ-water and nutrients solution were
added, while flushing with N2 to ensure an anaerobic environment.
Ta
ble
1 P
ap
er m
ill
ov
erv
iew
So
urc
e: T
ruo
ng e
t al
. (2
01
0)
Mil
l P
ulp
ing
pro
cess
R
aw
ma
teri
al
P
rod
uct
ion
T
rea
tmen
t of
slu
dge
bef
ore
sam
pli
ng
P
rod
uct
Volu
me
(Mk
g/
yea
r)
A
B
C
1
Mec
han
ical
S
pru
ce,
recy
cled
pap
er
New
spap
er a
nd
cata
logu
e p
aper
80
0
Sed
imen
tati
on
- -
2
Ch
emic
al
(su
lph
ite)
Wo
od
fro
m c
on
ifer
ou
s
tree
an
d d
ecid
uo
us
tree
Fin
e pap
er
45
0
Sed
imen
tati
on
Sed
imen
tati
on
-
3
Ch
emic
al
(su
lph
ate)
Wo
od
fro
m c
on
ifer
ou
s
and
dec
iduo
us
tree
Mar
ket
pu
lp
43
0
Sed
imen
tati
on
,
foll
ow
ed b
y p
oly
mer
add
itio
n a
nd
fil
trat
ion
on
dew
ater
ing t
able
Po
lym
er a
dd
itio
n a
nd
cen
trif
ugat
ion
-
4
Ch
emic
al
(su
lph
ate)
an
d
CT
MP
– C
hem
ico
-
Th
erm
om
ech
anic
al
Pu
lpin
g
Wo
od
fro
m c
on
ifer
ou
s
tree
Car
db
oar
d
70
0
Sed
imen
tati
on
- -
5
Ch
emic
al
(su
lph
ate)
Wo
od
fro
m c
on
ifer
ou
s
and
dec
iduo
us
tree
Car
db
oar
d
40
0
Sed
imen
tati
on
Po
lym
er a
dd
itio
n a
nd
filt
rati
on
on
dew
ater
ing
table
Po
lym
er a
dd
itio
n
and
cen
trif
ugat
ion
6
Mec
han
ical
C
on
ifer
ous
tree
P
rinti
ng p
aper
7
00
M
icro
flo
atat
ion
Ad
dit
ion
of
poly
mer
and
dew
ater
ed b
y
han
d*
-
* O
nly
per
form
ed u
po
n r
eques
t fo
r d
iges
ter
tria
ls.
12
After sealing the bottles, using EPDM rubber stoppers and aluminium caps, a change of gas
phase to 20% CO2 and 80% N2 was performed.
Control flasks, also in triplicate, were prepared as follows:
Seed blank – determines the contribution to methane production from inoculum only
(Inoculum 20 g, MilliQ-water 78 mL and nutrients solution 2 mL)
Positive control – tests the state of the inoculum
(Whatman Filtration paper No.3 (Whatman Limited, England) 0.5 g, inoculum 20 g,
MilliQ-water 78 mL and nutrients solution 2 mL)
Incubated methane control – tests the reliability of the instruments by knowing the
amount and concentration of methane in the bottle (MilliQ-water 100 mL and methane
50 mL)
Bottles were placed in 37˚C and gas samples were withdrawn days 1, 3(4), 7, 14, 20, 40 and
60.
4.2.2 SEMI-CONTINUOUS DIGESTER EXPERIMENT
Two laboratory-scale semi-continuous digesters, one control (C) and one fed with pre-treated
substrate (PS), were carried out with a working volume of 4 L and a 20 day retention time
under mesophilic (37˚C) conditions. Each digester had a start inoculum of 4 L consisting of
1.8 L from a process running on biological sludge and 2.2 L digested sludge from Nykvarn
sewage treatment plant (Tekniska Verken, Linköping). The digesters were fed once a day
(200 mL substrate) and stirred 15 minutes every hour (400-500 rpm). Before feeding, 200 mL
of digester liquid was withdrawn and blended into the food portion to facilitate feeding.
During an 11 day start-up period both digesters were fed with untreated substrate with an
OLR at 2 g VS/L/day the two first days and at 3 g VS/L from day three. At day 11, heat-
treated substrate feeding of the PS-digester began and continued for 27 days. The heat-treated
substrate was replaced by alkali pre-treated substrate at day 38, which continued for 39 days
(two retention times). Food portions consisted of a mixture of sludge 5B and 5C in order to
achieve the OLR desired.
4.3 BIOLOGICAL SLUDGE PRE-TREATMENT
4.3.1 ELECTROPORATION
Electroporation was performed using equipment from KEA-TEC GmbH (Germany).
Substrate was poured into a 250 mL cylinder cuvette (length 20 cm, diameter 4 cm). Due to
the cuvette design, some biological sludges had to be diluted to enable handling and prevent
the formation of air bubbles in the cuvette. Parameter setting was U=36 kV and I=40 mA
giving rise to a frequency of ~10.5 Hz. Field strength was ~10kV/cm. Number of pulses used
was 2000 (2 x 1000, due to equipment limitation), each pulse corresponding to an energy
consumption of 54.4 J, i.e. each treatment consumed 0.11 MJ. Temperature and conductivity
were measured before and after electroporation.
4.3.2 THERMAL PRE-TREATMENT
Batch experiment
250-300 mL of sludge was incubated in a 105˚C oven using plastic tubes of 400 mL covered
with a lid. Every 20 min, samples were stirred to reduce temperature differences within the

13
samples and to avoid drying of the surface layers, which was a problem especially for samples
with a high TS content. During the last hour of heating, temperature was monitored after
stirring. After approximately 2 hrs of heating, sample temperature had reached 80˚C, at which
point they were transferred to an 80˚C oven and incubated for one hour. Samples were left to
cool (without lid) overnight in a fume cupboard.
Digester experiment
Heat-treated substrate sludge used during the ten first days of feeding was heated up using a
water bath (i.e. a big kettle) and a stainless bowl covered with a kettle lid. To reach 80˚C took
80 min under constant supervision, why the method was abandoned. Instead, food portions
were prepared before treatment and heated at 105˚C. The temperature increase was monitored
electronically. Both heating procedures suffered from water losses, which were compensated
(17 mL for water bath and 5 mL for 105˚C oven).
4.3.3 CHEMICAL PRE-TREATMENT
Batch experiment
Alkali treatment was performed using NaOH (1M or 2.5M) to adjust pH >12 and then
incubated in a fume cupboard (~17 hrs) before being neutralized to pH<8 using HCl (1M). pH
adjusting was carried out in a glass cup with a pH-meter monitoring pH, while adding acid or
alkali. Stirring was performed manually for sludges with high TS content using a spoon or by
a magnetic flea whenever possible (TS ≤ 2%). Three high TS content sludges had to be
diluted (3B 25%, 5C 40% and 6B 10%) before alkali treatment to enable an even distribution
of the chemicals. Alkali consumption and measurement data are shown in Figure 2 and
Appendix A.
Digester experiment
Alkali pre-treatment for digester trials was conducted similarly to the batch experiments. pH
was adjusted to ~12 after food portion preparation, without being neutralised. Food portions
for seven to ten days were prepared at a time. pH of food portions was measured days 1, 4 and
7 before feeding the first week of alkali pre-treatment.
4.4 TRIAL ON POLYMER IMPACT ON METHANE POTENTIAL
Since polymer addition is a common way of increasing the dewaterability of sludge, it is of
value to investigate its impact on the methane potential. Therefore, a polymer solution used at
mill 5, was used as a substrate in batch tests as described above. Due to low TS- and VS
content (0.3% resp. 50%) a loading rate of only 0.5 g VS/L/day could be achieved.
4.5 ANALYSIS
4.5.1 BATCH
Production of biogas was determined by measuring gas pressure using Testo digital pressure
meter (Testo AG, Germany). A sample of 1 mL of biogas was taken and injected to a 31.7 mL
glass vial from which 0.3 mL was analysed by gas chromatography to determine the methane
content of the biogas. A GC-FID HP 5880A (Hewlett Packard, USA) equipped with a
Poraplot T column and with nitrogen as the carrier gas (130 mL/min) and a mixture of air
(250 ml/min) and hydrogen (30 ml/min) in the flame ionizing detector (FID) was used with
oven at 80˚C, injector at 150˚C and at detector 250˚C.
Methane content was determined via a standard curve at start of every measurement occasion,
using methane gas standards of 0.07, 0.63 and 1.71%. Gas standards were renewed at least
14
once every 14 days. Mean area of gas standards was determined from five injections and from
three injections of sample, both times after rejecting the most deviating value.
Conductivity analysis at electroporation pre-treatment was carried out with an EC 300
conductivity instrument (WTW, Germany).
4.5.2 SEMI-CONTINUOUS DIGESTER
Analysis routine
VFA analysis was performed using a GC-FID HP 6890 (Hewlett Packard, USA), using
settings as follows; injector temperature 150°C, oven temperature starting at 80°C increasing
to 200°C according to temperature programme, and detector temperature 250°C. GC carrier
gas was helium (2 ml/min). FID-detector carrier gas was a mixture of air (250 ml/min) and
hydrogen (25 ml/min). Gas composition was determined with a gas Check Biogas instrument
(Geotech, United Kingdom). pH analysis was carried out using a Inolab 730 pH-meter
(WTW, Germany) equipped with a Polilyte Bridge Lab pH electrode (Hamilton, Switzerland).
Amount of produced gas was measured with Scandinavian Biogas Fuels AB‟s special
constructed gas meters based on the principal of water displacement. TS- and VS
concentrations were determined using an ATL-423 milligram scale (Acculab, Germany).
Analysis frequency is described in Table 3.
Table 3 Analysis routine
Analysis Method Frequency
Gas volume Water displacement Once/day
pH pH-electrode Twice/week
VFA GC-FID Once/week
Gas composition Gas analyser, GC-FID Once/week
TS- and VS percentages Milligram scale Once/week
Viscosity Rheometer Once/month
VS-reduction
VS-reduction measures the conversion of the organic material into biogas, and was calculated
using formula 1. A high VS-reduction indicates an efficient degradation in the digester.
(Formula 1)
Viscosity analysis
Viscosity measurements for both digesters were made before changing to a new substrate pre-
treatment of the PS-digester: at day 10 (untreated substrate), day 38 (heat-treated substrate)
and day 65 (alkali-treated substrate). Analysis was performed using a Dinamic/Rotation
Rheometer (DIN/ISO) (Anton Paar, Austria) and Rheoplus Software.
15
4.6 STATISTICAL ANALYSIS
Statistical analysis, using Minitab®
15 (Minitab Inc., USA 2007) was performed to compare
the pre-treatment methods in terms of methane production and methane potential.
Graphical presentation of batch results
Electroporation pre-treatment was performed in batches separate from alkali and heat pre-
treatments, thus, rendering its own set of controls i.e. untreated samples. An example of the
accumulated methane production for sludge 5B and 5C during batch experiments, when pre-
treated with alkali and heat, can be seen in Figure 3. In order to facilitate interpretation of all
pre-treatments of a specific biological sludge using the same graph, the result of pre-treatment
are presented after calculation using formula 2 (Figure 4).
(Formula 2)
F-tests and construction of Tukey confidence intervals
When comparing more than two methods (i.e. treatments), it is advisable and time saving to
start making a test in order to determine, if there is a significant difference among the
methods at all. If there is a significant difference, confidence intervals are constructed to find
and determine the difference/es. The normal distribution of the data allowed use of F-tests and
construction of Tukey confidence intervals (cf. Appendix B).

17
5 RESULTS AND DISCUSSION
This section is divided into three parts. The first (5.1) discusses the effect from the pre-
treatments themselves, i.e. before anaerobic digestion. The second (5.2) and third (5.3) parts
discuss the results from batch and semi-continuous digester, respectively.
5.1 GENERAL EFFECTS AND OBSERVATIONS FROM PRE-TREATMENT
5.1.1 ELECTROPORATION PRE-TREATMENT
All biological sludges gained an increase in temperature from the electroporation pre-
treatment to ~50˚C. This temporary heating had likely no hydrolytic effect, since treatment
only lasted for ~4 min. In five of eleven sludges the conductivity had increased 30-100 μS/cm
after treatment (data not shown). The remaining six sludges were too thick or sedimented too
fast to enable conductivity measurements.
5.1.2 ALKALI PRE-TREATMENT
Batch
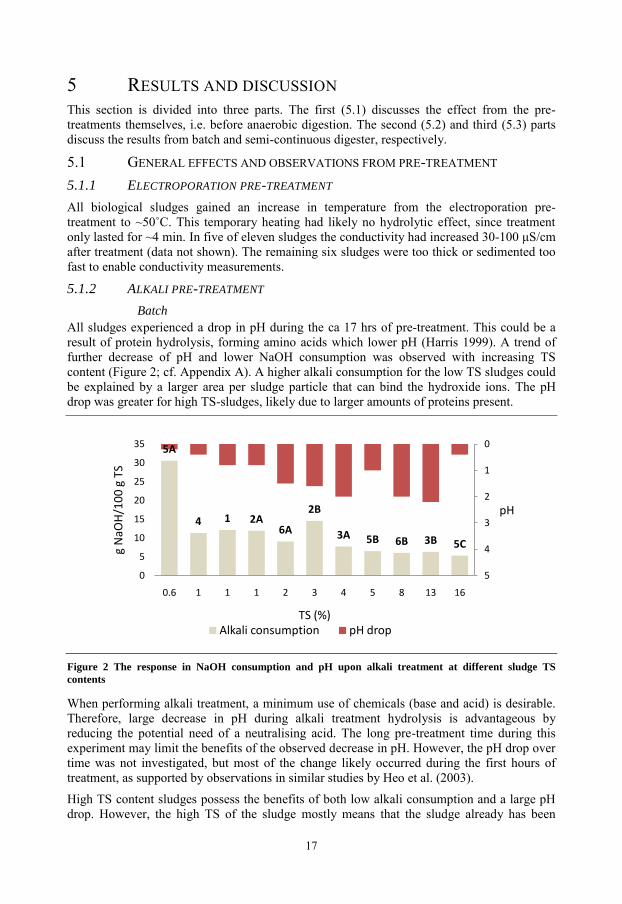
All sludges experienced a drop in pH during the ca 17 hrs of pre-treatment. This could be a
result of protein hydrolysis, forming amino acids which lower pH (Harris 1999). A trend of
further decrease of pH and lower NaOH consumption was observed with increasing TS
content (Figure 2; cf. Appendix A). A higher alkali consumption for the low TS sludges could
be explained by a larger area per sludge particle that can bind the hydroxide ions. The pH
drop was greater for high TS-sludges, likely due to larger amounts of proteins present.
Figure 2 The response in NaOH consumption and pH upon alkali treatment at different sludge TS
contents
When performing alkali treatment, a minimum use of chemicals (base and acid) is desirable.
Therefore, large decrease in pH during alkali treatment hydrolysis is advantageous by
reducing the potential need of a neutralising acid. The long pre-treatment time during this
experiment may limit the benefits of the observed decrease in pH. However, the pH drop over
time was not investigated, but most of the change likely occurred during the first hours of
treatment, as supported by observations in similar studies by Heo et al. (2003).
High TS content sludges possess the benefits of both low alkali consumption and a large pH
drop. However, the high TS of the sludge mostly means that the sludge already has been
5A
4 1 2A6A
2B
3A 5B 6B 3B 5C
0
1
2
3
4
50
5
10
15
20
25
30
35
0.6 1 1 1 2 3 4 5 8 13 16
pH
g N
aOH
/10
0 g
TS
TS (%)Alkali consumption pH drop
18
dewatered. When choosing between low consumption of alkali or a large drop in pH, the
former would probably be of advantage, since a high pH is more compatible with subsequent
anaerobic treatment (Ray et al. 1990; Weemaes and Verstraete 1998).
Adding alkali decreased the VS percentage for all sludges (cf. Appendix A). The reason is
that NaOH constitutes inorganic solids, which add up to the non combustible part of total
solids, hence, lowering the fraction of volatile solids. TS remained relatively unchanged
except for diluted sludges.
Digester
During the first week of feeding with alkali-treated sludge, the pH of the sludge prior to
feeding had decreased to 10.7 (day 1), 10.4 (day 4) and 10.3 (day 7). This indicates that most
hydrolysis took place during the first 24 hrs of treatment. The amount of NaOH required to
increase pH to ~12 varied between 5-9 g NaOH/100 g TS.
5.1.3 HEAT PRE-TREATMENT
After heat treatment, sludges showed signs of better phase separation, i.e. an increase of the
water phase, which was somewhat more pronounced for sludge at high TS contents.
5.2 BATCH RESULTS
As described in 4.6, treatments were performed on separate occasions, and results are
therefore presented using formula 2 (cf. Figure 3 and Figure 4).
5.2.1 ELECTROPORATION PRE-TREATMENT
Sludge 3B was the only one responding well to the electroporation pre-treatment. Instead,
electroporation treatment seemed to have a negative effect on methane production for several
sludges, which is difficult to explain (cf. Figure 4, Table 4 and Appendix A). To improve
electroporation performance, higher field strengths would be of interest (cf. Carlson and
Lagerkvist 2008).
5.2.2 HEAT AND ALKALI PRE-TREATMENT
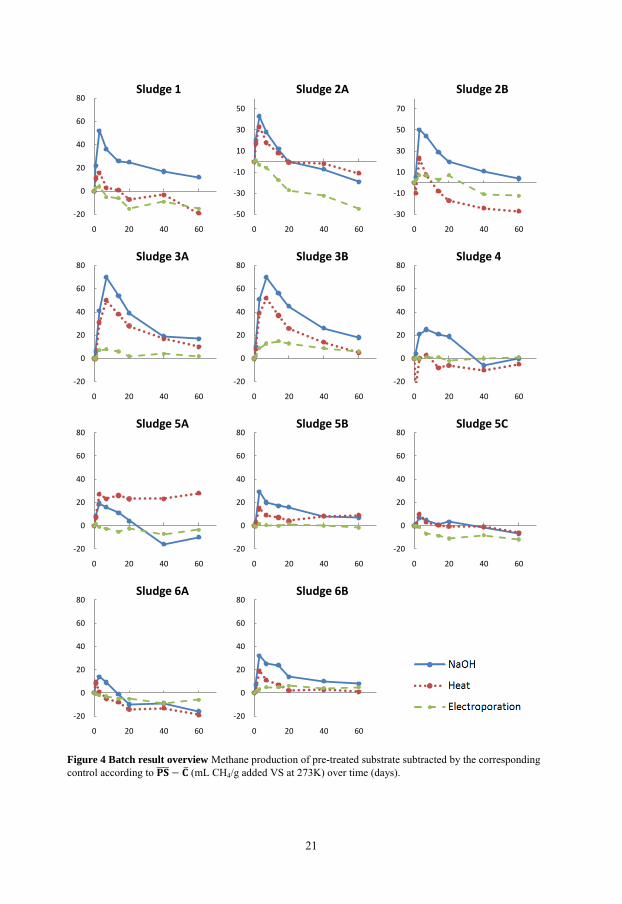
In general, both alkali and heat pre-treatment generated an increase in initial methane
production rate (Figure 4). Mostly, the alkali treatment exceeded heat treatment. The effect is
most visible for days 7-14, but fading around day 20. However, the methane potentials at day
60 were mainly at the same levels, thereby rejecting Hypothesis 1. Numeric values of methane
potential are given in Table 4. Twelve of all combinations of biological sludges and pre-
treatments ended up in a significant difference in methane potential compared to the control.
Remarkably, nine of these, involving sludges 1, 2A, 2B, 5C and 6A, generated methane
potentials under that of corresponding controls. Refractory compound formation might
explain the results derived from NaOH pre-treatment (Penaud et al. 1999), but not in the case
of heat pre-treatment, since substantial refractory compound formation in sludge is
19
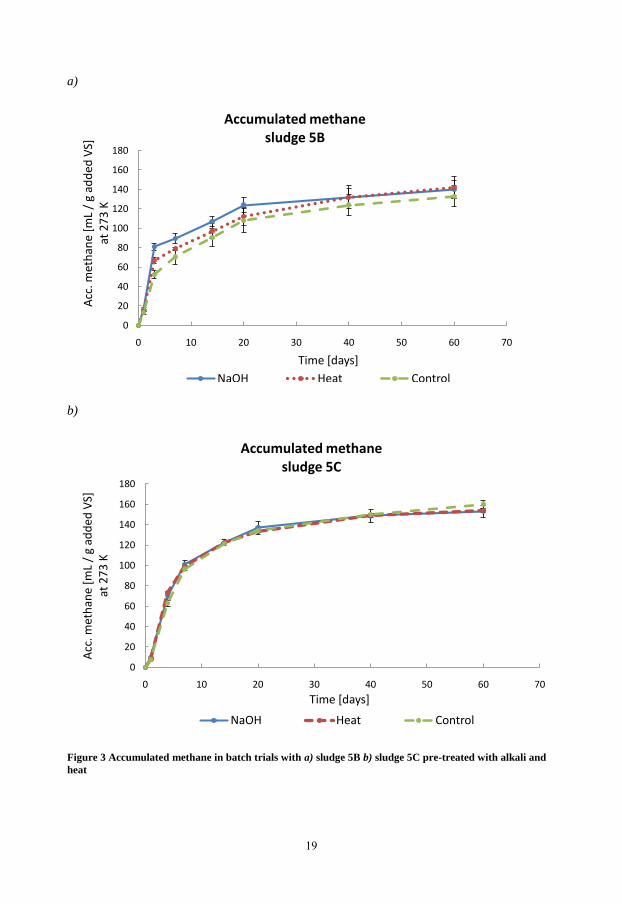
a)
b)
Figure 3 Accumulated methane in batch trials with a) sludge 5B b) sludge 5C pre-treated with alkali and
heat
0
20
40
60
80
100
120
140
160
180
0 10 20 30 40 50 60 70
Acc
. met
han
e [m
L /
g ad
ded
VS]
at
27
3 K
Time [days]
Accumulated methane sludge 5B
NaOH Heat Control
0
20
40
60
80
100
120
140
160
180
0 10 20 30 40 50 60 70
Acc
. met
han
e [m
L /
g ad
ded
VS]
at
27
3 K
Time [days]
Accumulated methane sludge 5C
NaOH Heat Control
20
observed to occur first at temperatures around 200˚C (Climent et al. 2007). The results with sludge 6B
are consistent with the findings by Lüdtke (2010), who found that the very same sludge to be difficult
to pre-treat. It was suggested that efficient removal of cellulose fibres resulted in a high degree of
digestion in the biological cleaning steps, thereby producing a sludge rich in biomass hard to degrade.
Sludge candidates for semi-continuous digestion experiment
Sludge 1, 2A, 2B, 3A, 3B and 5A showed the highest increase in initial methane production,
after pre-treatment with alkali and/or heat according to the statistical test (cf. Appendix A),
whilst sludge 4, 5B, 5C, 6A and 6B were less affected. Because of the low TS content, high
enough OLR could not be reached using sludge 1, 2A 2B or sludge 5A, and these sludges
were therefore not suitable for the semi-continuous experiment. However, the increase for
sludge 5A, when treated with heat should still be noted. Judging from the increase of initial
methane production rate and methane potential in batch trials (Figure 4 and Table 4), sludge
3A and 3B treated with alkali were the best candidates. However, because sludge from mill 3
already had been the subject to a similar digester study (Lüdtke 2010), sludges 5B and 5C
from mill 5 were chosen for the continued digester trial as it was the second most suitable (cf.
section 5.3).
Correlation between methane potential and pre-treatment effect
There were no indications that sludges with low methane potential respond better to pre-
treatment than sludges with high methane potential in terms of initial methane production rate
or methane potential. Together with the fact that two of the three sludges with increased
methane potential from pre-treatment can be considered to be high methane potential sludges,
Hypothesis 2 is rejected.
Further observations
Based on the averages in Table 4, the methane potentials were generally higher for high TS
content sludges than for low TS content sludges, when comparing untreated sludges from the
same paper mill. One reason might be that polymer addition during dewatering give rise to an
increase in methane production. It is also possible that the dewatering steps have a positive
influence on the hydrolysis, making high TS content sludges more easily biodegradable.
Four low TS-sludges (1, 2A, 4 and 5A) gave less methane production than the control at day
40 (data not shown) after treatment with alkali. The sludges in question belong to those
showing the highest alkali consumption (Figure 2). Penaud et al. (1999) found that
biodegradability decreased at high NaOH levels, and that it was an effect of the hydroxide
addition (not the sodium). Hydroxide ions were proposed to cause formation of refractory
compounds, which might explain the decrease in methane production.
21
Figure 4 Batch result overview Methane production of pre-treated substrate subtracted by the corresponding
control according to (mL CH4/g added VS at 273K) over time (days).
-20
0
20
40
60
80
0 20 40 60
Sludge 1
-50
-30
-10
10
30
50
0 20 40 60
Sludge 2A
-30
-10
10
30
50
70
0 20 40 60
Sludge 2B
-20
0
20
40
60
80
0 20 40 60
Sludge 3A
-20
0
20
40
60
80
0 20 40 60
Sludge 3B
-20
0
20
40
60
80
0 20 40 60
Sludge 4
-20
0
20
40
60
80
0 20 40 60
Sludge 5A
-20
0
20
40
60
80
0 20 40 60
Sludge 5B
-20
0
20
40
60
80
0 20 40 60
Sludge 5C
-20
0
20
40
60
80
0 20 40 60
Sludge 6A
-20
0
20
40
60
80
0 20 40 60
Sludge 6B

22
5.2.3 METHANE POTENTIAL OF POLYMER
No conclusions can be drawn from polymer batch experiments. Due to the low OLR, caused
by low TS- and VS content, methane production in the polymer amended treatments was
about the same as for the inoculum (data not shown). Thus, the possible effect of the polymer
in assays of the methane potential of sludge amended with polymer can be neglected.

Ta
ble
4 M
eth
an
e p
ote
nti
als
of
bio
log
ica
l sl
ud
ges
fro
m b
atc
h t
ria
ls (
da
y 6
0)
Aver
age
met
han
e p
rod
uct
ion v
alues
(m
L/g
ad
ded
VS
) ar
e giv
en f
or
trip
lica
tes
± s
tand
ard
dev
iati
on a
)-b
). E
lect
rop
ora
tion p
re-t
reat
men
t is
pre
sente
d s
ep
arat
ely f
rom
hea
t an
d N
aOH
tre
atm
ents
, si
nce
it
was
per
form
ed o
n d
iffe
rent
occ
asio
ns,
i.e
. hav
ing s
epar
ate
contr
ols
(b
). M
ethane
po
tenti
al
incr
ease
over
co
ntr
ol
(mL
/g a
dd
ed V
S)
(c)
has
bee
n d
eter
min
ed w
ith 9
5%
co
nfi
den
ce i
nte
rval
. T
he
sam
e st
ati
stic
al
pro
ced
ure
was
app
lied
to
accu
mula
ted
met
han
e p
rod
uct
ion a
t d
ays
7,
20
and
40
(A
pp
end
ix A
). Statistical tests resulting in not significant differences are denoted “n.s.”
Slu
dg
e 1
2
A
2B
3A
3B
*
4
5A
5
B
5C
**
6A
6
B**
*
TS
(%
) 1
1
3
4
1
3
1
0.6
5
1
6
2
8
Pre
-tre
atm
ent
Met
hane
pro
duct
ion (
mL
/g a
dd
ed V
S)
a)
Hea
t -
12
0(±
6)
11
0(±
1)
20
0(±
5)
20
0(±
2)
16
0(±
11
) 1
30
(±8
) 1
40
(±1
1)
- 1
10
(±3
) 1
30
(±8
)
Na
OH
1
60
(±9
) 1
10
(±5
) 1
40
(±1
0)
20
0(±
5)
21
0(±
2)
16
0(±
8)
90
(±2)
14
0(±
9)
- 1
10
(±1
) 1
40
(±1
4)
Un
trea
ted
1
50
(±5
) 1
30
(±8
) 1
30
(±2
) 1
90
(±7
) 2
00
(±7
) 1
60
(±4
) 1
00
(±1
3)
13
0(±
11
) -
13
0(±
3)
13
0(±
5)
M
ethane
pro
duct
ion (
mL
/g a
dd
ed V
S)
b)
Hea
t 1
30
(±5
) -
- -
- -
- -
15
0(±
2)
- -
Na
OH
-
- -
- -
- -
- 1
50
(±6
) -
-
Ele
ctro
po
rati
on
1
40
(±5
) 7
0(±
10
) 1
20
(±5
) 1
90
(±4
) 1
80
(±3
) 1
70
(±6
) 1
50
(±1
) 1
67
0(±
1)
15
0(±
9)
15
0(±
4)
16
0(±
3)
Un
trea
ted
1
50
(±1
0)
12
0(±
2)
14
0(±
5)
19
0(±
8)
17
0(±
4)
17
0(±
4)
16
0(±
6)
17
0(±
3)
16
0(±
4)
16
0(±
3)
16
0(±
5)
M
ethane
po
tenti
al i
ncr
ease
ov
er c
ontr
ol
(mL
/g a
dd
ed V
S)
c)
Hea
t [-
34
-5
] n.s
. [-
39
-1
5]
n.s
. n.s
. n.s
. [9
46
] n.s
. n.s
. [-
24
-1
4]
n.s
.
Na
OH
n.s
. [-
32
-
6]
n.s
. [4
28
] [9
2
6]
n.s
. n.s
. n.s
. n.s
. [-
21
-1
1]
n.s
.
Ele
ctro
po
rati
on
[-
30
-1
] [-
61
-2
9]
[-2
4
-1
] n.s
. n.s
. n.s
. n.s
. n.s
. [-
24
-0
.3]
n.s
. n.s
.
(*)
rep
rese
nt
dil
ute
d s
lud
ges
wit
h w
ater
co
nte
nt
of
*2
5%
, **4
0%
and
***1
0%
wh
en t
reat
ed w
ith a
lkal
i.
24
5.3 SEMI-CONTINUOUS DIGESTER RESULTS
Semi-continuous digesters were fed with biological sludge from mill 5. This mill was chosen
because a high TS content sludge was needed to achieve a sufficient OLR. The batch result of
5B gave rise to an interesting hypothesis (Hypothesis 3). As shown in Figure 3a), the final
methane potential is approximately the same for sludge 5B when treated with alkali, heat and
no treatment. However, the initial rate of methane production is higher for treated sludges,
and therefore might be able to generate a higher biogas production in a digester. The reason is
that each “sludge unit” only stays a certain period of time in the digester, and a treated sludge
that produce methane more quickly has a bigger chance to reach its methane potential before
leaving the digester. Unfortunately, this could not be observed in the PS-digester, for either
pre-treatment (alkali or heat), and Hypothesis 3 was therefore rejected. The differences in
methane production rate were probably not big enough to be shown in methane production in
this experiment. The following headings will present an evaluation of the digester
performance.
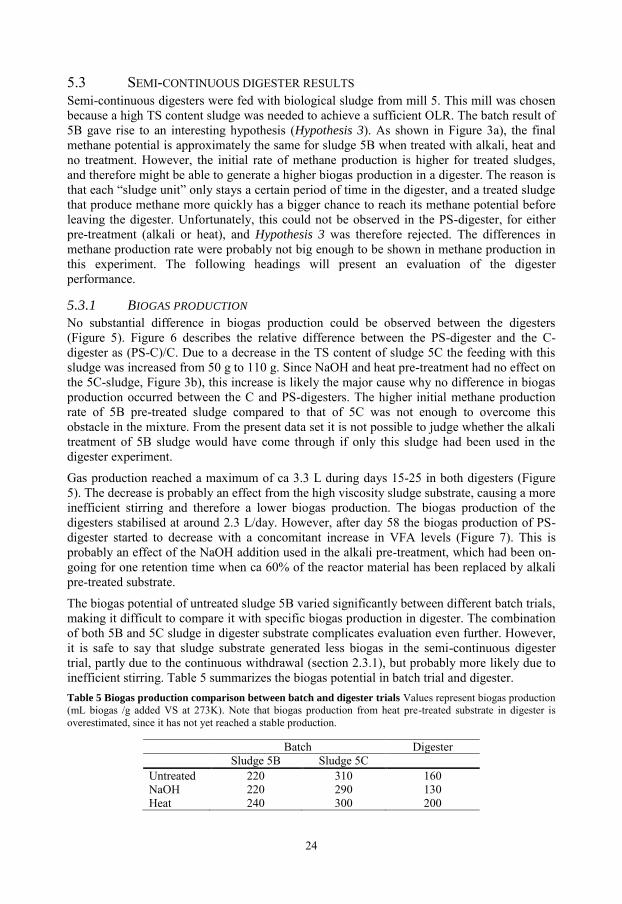
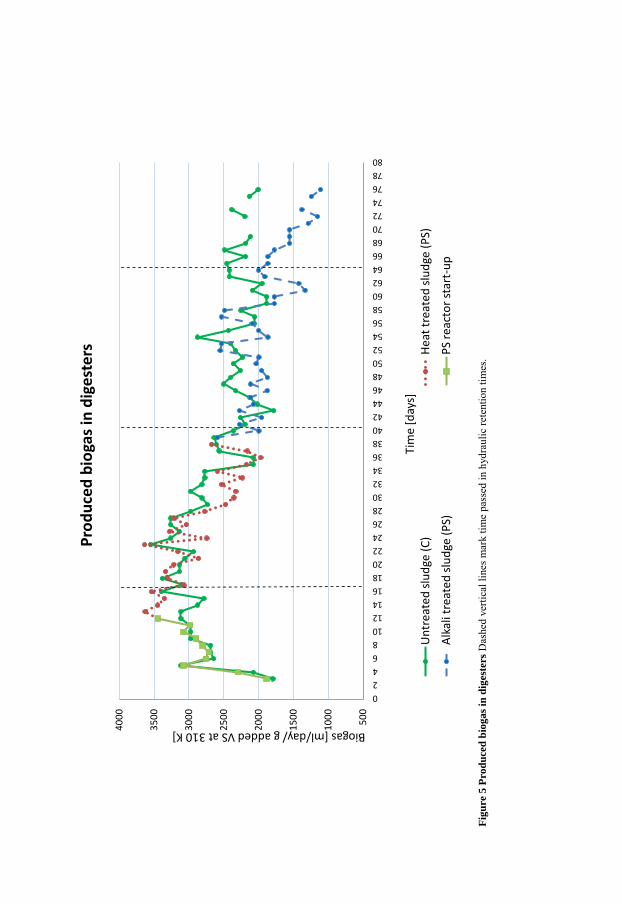
5.3.1 BIOGAS PRODUCTION
No substantial difference in biogas production could be observed between the digesters
(Figure 5). Figure 6 describes the relative difference between the PS-digester and the C-
digester as (PS-C)/C. Due to a decrease in the TS content of sludge 5C the feeding with this
sludge was increased from 50 g to 110 g. Since NaOH and heat pre-treatment had no effect on
the 5C-sludge, Figure 3b), this increase is likely the major cause why no difference in biogas
production occurred between the C and PS-digesters. The higher initial methane production
rate of 5B pre-treated sludge compared to that of 5C was not enough to overcome this
obstacle in the mixture. From the present data set it is not possible to judge whether the alkali
treatment of 5B sludge would have come through if only this sludge had been used in the
digester experiment.
Gas production reached a maximum of ca 3.3 L during days 15-25 in both digesters (Figure
5). The decrease is probably an effect from the high viscosity sludge substrate, causing a more
inefficient stirring and therefore a lower biogas production. The biogas production of the
digesters stabilised at around 2.3 L/day. However, after day 58 the biogas production of PS-
digester started to decrease with a concomitant increase in VFA levels (Figure 7). This is
probably an effect of the NaOH addition used in the alkali pre-treatment, which had been on-
going for one retention time when ca 60% of the reactor material has been replaced by alkali
pre-treated substrate.
The biogas potential of untreated sludge 5B varied significantly between different batch trials,
making it difficult to compare it with specific biogas production in digester. The combination
of both 5B and 5C sludge in digester substrate complicates evaluation even further. However,
it is safe to say that sludge substrate generated less biogas in the semi-continuous digester
trial, partly due to the continuous withdrawal (section 2.3.1), but probably more likely due to
inefficient stirring. Table 5 summarizes the biogas potential in batch trial and digester.
Table 5 Biogas production comparison between batch and digester trials Values represent biogas production
(mL biogas /g added VS at 273K). Note that biogas production from heat pre-treated substrate in digester is
overestimated, since it has not yet reached a stable production.
Batch Digester
Sludge 5B Sludge 5C
Untreated 220 310 160
NaOH 220 290 130
Heat 240 300 200
Fig
ure
5 P
rod
uce
d b
iog
as
in d
iges
ters
Das
hed
ver
tica
l li
nes
mar
k t
ime
pas
sed
in h
yd
rau
lic
rete
nti
on t
imes
.
50
0
10
00
15
00
20
00
25
00
30
00
35
00
40
00
0
2
4
6
8
10
12
14
16
18
20
22
24
26
28
30
32
34
36
38
40
42
44
46
48
50
52
54
56
58
60
62
64
66
68
70
72
74
76
78
80
Biogas [ml/day/ g added VS at 310 K]
Tim
e [d
ays]
Pro
du
ced
bio
gas
in d
ige
ste
rs
Un
trea
ted
slu
dge
(C
)H
eat
trea
ted
slu
dge
(P
S)
Alk
ali t
reat
ed s
lud
ge (
PS)
PS
reac
tor
star
t-u
p
26
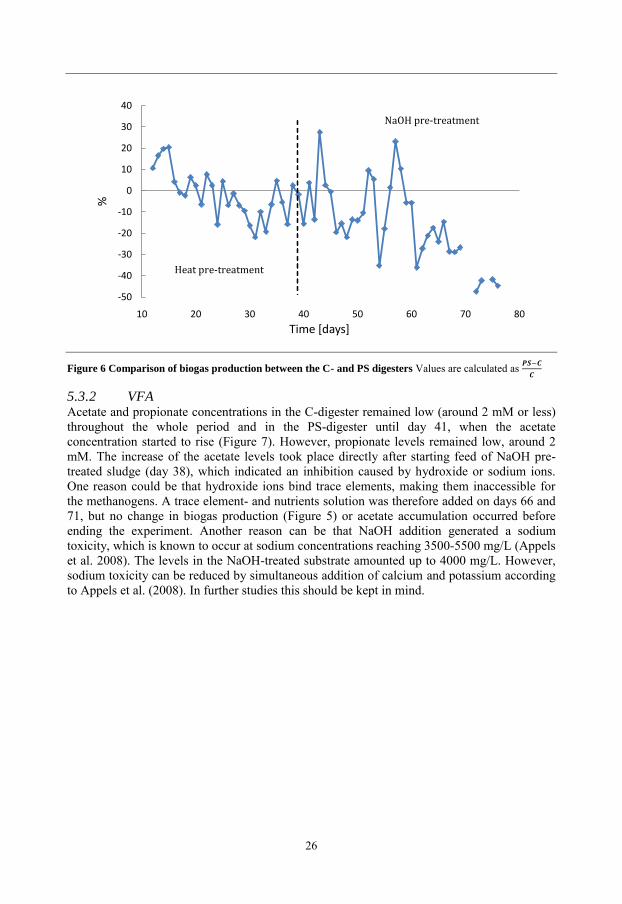
Figure 6 Comparison of biogas production between the C- and PS digesters Values are calculated as
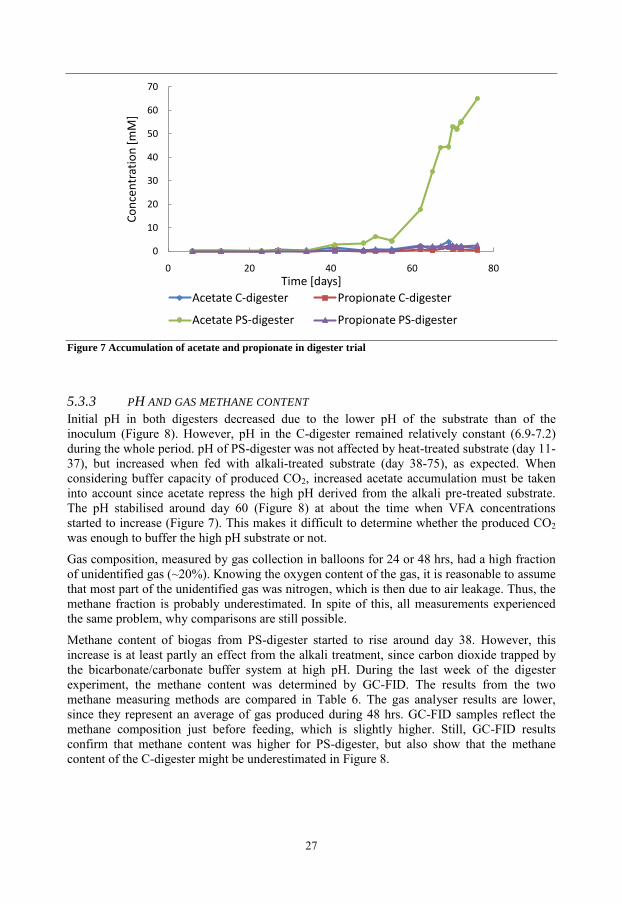
5.3.2 VFA
Acetate and propionate concentrations in the C-digester remained low (around 2 mM or less)
throughout the whole period and in the PS-digester until day 41, when the acetate
concentration started to rise (Figure 7). However, propionate levels remained low, around 2
mM. The increase of the acetate levels took place directly after starting feed of NaOH pre-
treated sludge (day 38), which indicated an inhibition caused by hydroxide or sodium ions.
One reason could be that hydroxide ions bind trace elements, making them inaccessible for
the methanogens. A trace element- and nutrients solution was therefore added on days 66 and
71, but no change in biogas production (Figure 5) or acetate accumulation occurred before
ending the experiment. Another reason can be that NaOH addition generated a sodium
toxicity, which is known to occur at sodium concentrations reaching 3500-5500 mg/L (Appels
et al. 2008). The levels in the NaOH-treated substrate amounted up to 4000 mg/L. However,
sodium toxicity can be reduced by simultaneous addition of calcium and potassium according
to Appels et al. (2008). In further studies this should be kept in mind.
-50
-40
-30
-20
-10
0
10
20
30
40
10 20 30 40 50 60 70 80
%
Time [days]
Heat pre-treatment
NaOH pre-treatment
27
Figure 7 Accumulation of acetate and propionate in digester trial
5.3.3 PH AND GAS METHANE CONTENT
Initial pH in both digesters decreased due to the lower pH of the substrate than of the
inoculum (Figure 8). However, pH in the C-digester remained relatively constant (6.9-7.2)
during the whole period. pH of PS-digester was not affected by heat-treated substrate (day 11-
37), but increased when fed with alkali-treated substrate (day 38-75), as expected. When
considering buffer capacity of produced CO2, increased acetate accumulation must be taken
into account since acetate repress the high pH derived from the alkali pre-treated substrate.
The pH stabilised around day 60 (Figure 8) at about the time when VFA concentrations
started to increase (Figure 7). This makes it difficult to determine whether the produced CO2
was enough to buffer the high pH substrate or not.
Gas composition, measured by gas collection in balloons for 24 or 48 hrs, had a high fraction
of unidentified gas (~20%). Knowing the oxygen content of the gas, it is reasonable to assume
that most part of the unidentified gas was nitrogen, which is then due to air leakage. Thus, the
methane fraction is probably underestimated. In spite of this, all measurements experienced
the same problem, why comparisons are still possible.
Methane content of biogas from PS-digester started to rise around day 38. However, this
increase is at least partly an effect from the alkali treatment, since carbon dioxide trapped by
the bicarbonate/carbonate buffer system at high pH. During the last week of the digester
experiment, the methane content was determined by GC-FID. The results from the two
methane measuring methods are compared in Table 6. The gas analyser results are lower,
since they represent an average of gas produced during 48 hrs. GC-FID samples reflect the
methane composition just before feeding, which is slightly higher. Still, GC-FID results
confirm that methane content was higher for PS-digester, but also show that the methane
content of the C-digester might be underestimated in Figure 8.
0
10
20
30
40
50
60
70
0 20 40 60 80
Co
nce
ntr
atio
n [m
M]
Time [days]
Acetate C-digester Propionate C-digester
Acetate PS-digester Propionate PS-digester
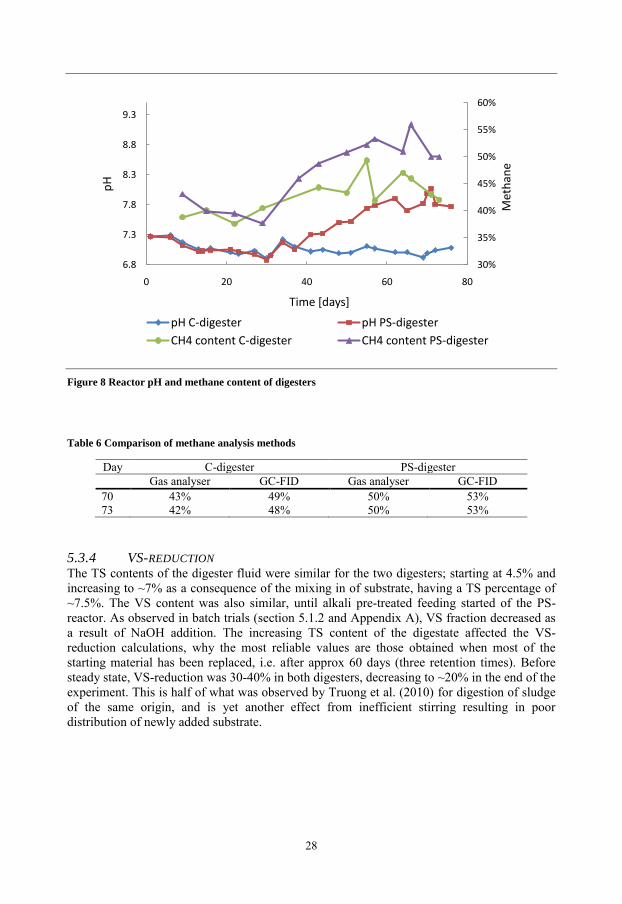
28
Figure 8 Reactor pH and methane content of digesters
Table 6 Comparison of methane analysis methods
Day C-digester PS-digester
Gas analyser GC-FID Gas analyser GC-FID
70 43% 49% 50% 53%
73 42% 48% 50% 53%
5.3.4 VS-REDUCTION
The TS contents of the digester fluid were similar for the two digesters; starting at 4.5% and
increasing to ~7% as a consequence of the mixing in of substrate, having a TS percentage of
~7.5%. The VS content was also similar, until alkali pre-treated feeding started of the PS-
reactor. As observed in batch trials (section 5.1.2 and Appendix A), VS fraction decreased as
a result of NaOH addition. The increasing TS content of the digestate affected the VS-
reduction calculations, why the most reliable values are those obtained when most of the
starting material has been replaced, i.e. after approx 60 days (three retention times). Before
steady state, VS-reduction was 30-40% in both digesters, decreasing to ~20% in the end of the
experiment. This is half of what was observed by Truong et al. (2010) for digestion of sludge
of the same origin, and is yet another effect from inefficient stirring resulting in poor
distribution of newly added substrate.
30%
35%
40%
45%
50%
55%
60%
6.8
7.3
7.8
8.3
8.8
9.3
0 20 40 60 80
Met
han
e
pH
Time [days]
pH C-digester pH PS-digester
CH4 content C-digester CH4 content PS-digester

29
5.3.5 VISCOSITY ANALYSIS
Effect from sludge substrate
The limit viscosity and yield stresses (cf. Appendix C) increased (Figure 9) as a consequence
of introduction of the sludge substrate, having higher viscosity than the starting material.
Limit viscosity
The first measurement showed a similar viscosity in the C- and PS-digesters (day 10) Table 7;
Figure 9). After 27 days of feeding with heat-treated sludge, the viscosity was slightly higher
in the PS-digester (day 38), which is an indication of a more stable flock structure (Paula
Segura de la Monja, pers. comm.). A pronounced difference in viscosity between the digesters
was observed after 27 days of feeding the PS-digester with alkali pre-treated sludge (day 65).
The lower viscosity in the PS-digester is likely a result of the NaOH addition, which probably
disturbed the floc structure. A similar result was observed by Tixier et al. (2003b), who found
that cation addition, using sodium chloride and calcium chloride, generated viscosity decrease
caused by decreased interparticle interactions. NaOH addition also resulted in a sticky and
slime-like consistency, but was still easier to handle at feeding compared to untreated sludge.
This is an important factor to consider in full scale applications.
Table 7 Yield stress and limit viscosity of digestate
Day Yield stress (Pa) Limit viscosity (Pa∙s)
C-digester PS-digester C-digester PS-digester
10 0 0 0.035 0.036
38 11 17 0.060 0.068
65 59 40 0.17 0.13
Figure 9 Limit viscosity comparison diagram
0
0.05
0.1
0.15
0.2
0 10 20 30 40 50 60 70
Lim
it v
isco
sity
[P
a∙s]
Time [days]C-digester PS-digester
30
5.4 SUGGESTIONS FOR IMPROVEMENTS AND CONTINUATION
Gas composition was the only parameter suffering from uncertain measurements. This was
probably an effect of the small amounts of gas that were produced during 24 hrs (and 48 hrs).
A better way to determine the methane content is to take gas samples directly from the
digester and analyse them using GC-FID, which was done during the last week. This method,
combined with Gas analyser, would give better knowledge about gas composition.
To be able to get more VS-reduction data, it would be optimal to start from digesters which
have reached steady state, i.e. after three retention times of sludge feeding. Further
improvements would be to use a more efficient stirrer, higher field strength at electroporation
pre-treatment and to also examine the dewaterability of the digestate e.g. by through
centrifugation.
An interesting continuation is to combine heat and alkali pre-treatment, i.e. pH increment
followed by heating. This is supported by the studies by Kim et al. 2003; Penaud et al. 1999;
Tanaka et al. 1997 revealing that thermo-chemical pre-treatment performs better than either
pre-treatment alone.
To be able to investigate the suitability of NaOH pre-treated sludge for anaerobic digestion,
further analysis of the impact of sodium and hydroxide ions on floc structure, toxicity and
bioavailability is needed. Effects of sodium addition on digestate disposal opportunities
should also be considered. Better performance of NaOH treatment compared to heat treatment
in batch experiments might therefore not be applicable in practice, as indicated by the semi-
continuous experiment, unless measures are taken to compensate for the negative impact
derived from the NaOH addition. Further, the cost of the potential measures must be
considered in relation to the profit of increased methane production. Considering this, heat
treatment might be a more suitable pre-treatment, especially when excess heat is available at
the paper mill, and since no inhibition occur from the treatment itself.
As reviewed by Appels et al. (2008) and Davidsson et al. (2008), and observed in this study,
pre-treatment results vary considerable depending on the quality and origin of the sludge.
Individual optimisation in combination with deeper knowledge of the raw material and
wastewater treatment processes of each sludge would therefore be of importance in order to
find the best conditions for anaerobic digestion of biological sludge.
31
6 CONCLUSIONS Batch
Pre-treatment of biological sludges showed an effect on the initial methane
production, but insignificantly on the methane potential for most of the sludges.
Alkali treatment (pH 12 using NaOH, ~17 hrs) was the best method among the ones
tested and had the highest impact on the initial methane production rate, but not on the
methane potential.
Heat treatment (80˚C, 1 hr) had significant impact on the initial methane production
from some of the biological sludges.
No or little effect on initial methane production rate or methane potential was
achieved from electroporation pre-treatment (2000 pulses at 10 kV/cm).
No correlation between methane potential of the sludge and effect from pre-treatment
could be found.
Sludge from mill 3 responded best to all pre-treatments. Due to project time
limitations the reason for this was not further investigated.
The effect on methane potential from polymer addition in dewatered sludges could not
be determined in batch experiments at the operational concentrations used in the tests.
Digester
Heat and NaOH pre-treatments did not increase the methane potential in the digester
experiment. Largely, this was due the choice of substrate mix, where the main sludge
component did not respond to pre-treatment in batch trials was used in order to obtain
the desired OLR level.
Higher limit viscosity in the reactor fed with pre-treated substrate compared to control
indicated a more stable floc structure when substrate had been heat pre-treated prior to
feeding. NaOH pre-treatment generated a significantly lower limit viscosity compared
to the control, which is suggested to be an effect from decreased interparticle
interaction caused by cation addition.
It could not be decided whether carbon dioxide in the produced biogas was able to
provide enough buffer capacity to handle the high pH of substrate, due to high levels
of acetate. Still, methane content of the gas in the reactor fed with pre-treated substrate
was higher compared to the control reactor indicating that carbon dioxide was
consumed as buffer.
NaOH pre-treated substrate generated high accumulation of acetate and decreased
biogas production. It could not be concluded whether it was an effect from hydroxide
or sodium ion addition.

32
ACKNOWLEDGEMENTS
This master thesis would not have been possible, or as much fun, if it was not for a number of
great people. I especially want to thank my supervisor, Xu-Bin Truong, for always having
time for my questions. Paula Segura de la Monja performed the viscosity analysis, which
added a valuable and interesting dimension to my results. Martin Ohlson, at Department of
Mathematics at Linköping University, helped me refresh my knowledge in statistics. Many
thanks to my opponent, Susanne Tumlin, and my examiner, professor Bo Svensson, for
commenting and improving my report. Last but not least, I want to thank the staff and master
thesis workers at Scandinavian Biogas Fuels AB and Department of Thematic Studies –
Water and Environmental Studies at Linköping University for all our fun discussions, and
Peter, for support and cooking dinner all the times I was stuck in the lab.
33
REFERENCES Appels, L., Baeyens, J., Degrève, J., Dewil, R. (2008) Principles and potential of the anaerobic
digestion of waste-activated sludge. Progress in Energy and Combustion Science 34:755-781
Barjenbruch, M., Kopplow, O. (2003) Enzymatic, mechanical and thermal pre-treatment of surplus
sludge. Advances in Environmental Research 7:715-720
Bougrier C., Delgenès J. P., Carrère H. (2008) Effects of thermal treatments on five different waste
activated sludge samples solubilisation, physical properties and anaerobic digestion. Chemical
Engineering Journal 139:236-244
Carlsson M., Lagerkvist A. (2008) Elektroporation för forcerad metanutvinning från förnybara
resurser. Svenskt Gastekniskt Center, Rapport SGC 190, 12 pp.
Chen, Y., Jiang, S., Yuan, H., Zhou, Q., Gu, G. (2007) Hydrolysis and acidification of waste activated
sludge at different pHs. Water Research 41:683-689
Choi H., Jeong S-W., Chung Y. (2006) Enhanced anaerobic gas production of waste activated sludge
pretreated by pulse power technique. Bioresource Technology 97:198-203
Climent, M., Ferrer, I., Baeza, M.d.M., Artola, A., Vázquez, F., Font, X. (2007) Effects of thermal
and mechanical pretreatments of secondary sludge on biogas production under thermophilic
conditions. Chemical Engineering Journal 133:335-342
Davidsson, Å., la Cour Jansen, J. (2006) Pre-treatment of wastewater sludge before anaerobic
digestion Hygienisation, Ultrasonic treatment and Enzyme dosing. VATTEN 62:335-340
Davidsson, Å., Jönsson, K., la Cour Jansen, Särner, E. (2008) Metoder för slamhydrolys. Svenskt
vatten utveckling, rapport nr 2008-09, 39 pp.
Ek, M., Westling, O. (2003) Dagsläget beträffande skogsindustrins avfall. IVL Svenska Miljöinstitutet
AB, rapport B1482, 54 pp.
Elliott, A., Mahmood, T. (2007) Pretreatment technologies for advancing anaerobic digestion of pulp
and paper biotreatment residues. Water Research 41:4273-4286
Ferrer, I., Pons , S., zquez, F., Font, X. (2008) Increasing biogas production by thermal (70˚C) sludge pre-treatment prior to thermophilic anaerobic digestion. Biochemical Engineering
Journal 42:186-192
Gavala, H.N., Yenal, U., Skiadas, I.V., Westermann, P., Ahring, B.K. (2003) Mesophilic and
thermophilic anaerobic digestion of primaryand secondarysludge. Effect of pre-treatment at
elevated temperature. Water Research 37:4561-4572
Gerardi, M.H. (2003) The Microbiology of Anaerobic Digesters. Wastewater Microbiology Series,
New Jersey: John Wiley & Sons Inc., 177 pp.
Gillberg L., Hansen B., Karlsson I., Nordström Enkel A., Pålsson A. (2003) Konsten att rena vatten.
Helsingborg: Kemira Kemwater, 220 pp.
Harris D.C. (1999) Quantitative Chemical Analysis 5th ed. New York: W.H. Freeman, 899 pp.
34
Heo, N.-H., Park, S.-C., Lee, J.-S., Kang, H. (2003) Solubilization of waste activated sludge by
alkaline pretreatment and biochemical methane potential (BMP) tests for anaerobic co-digestion of
municipal organic waste. Water Science and Technology 48:211-219
Hu, Y., Zhang, C., Zhang, C., Tan, X., Zhu, H., Zhou, Q. (2009) Effect of alkaline pre-treatment on
waste activated sludge solubilization and anaerobic digestion. 3rd International Conference on
Bioinformatics and Biomedical Engineering, ICBBE 2009, art. no. 5162683
Höglund, C., Lundborg, R., Myringer, Å. (2001) Tillförsel av skogsindustriellt slam till eldstäder –
etapp 1. Stockholm: Värmeforsk, Delprogram tillämpad förbränningsteknik, rapport nr 757, 155
pp.
Kim, J., Park, C., Kim, T.-H., Lee, M., Kim, S., Kim, S.-W., Lee, J. (2003) Effects of various
pretreatments for enhanced anaerobic digestion with waste activated sludge. Journal of Bioscience
and Bioengineering 95:271-275
Kopplow, O., Barjenbruch, M., Heinz, V. (2004) Sludge pre-treatment with pulsed electric fields.
Water Science and Technology 49:123-129
Lin, J. G., Chang, C. N., Chang S. C. (1997) Enhancement of anaerobic digestion of waste
activated sludge by alkaline solubilization. Bioresource Technology 62:85-90
Lin, Y., Wang, D., Wu, S., Wang, C. (2009) Alkali pretreatment enhances biogas production in the
anaerobic digestion of pulp and paper sludge. Journal of Hazardous Materials 170:366-373
de Mes T. Z. D., Stams A. J. M., Reith J. H., Zeeman G. (2003) Methane production by anaerobic
digestion of wastewater and solid wastes In: Reith J.H., Wijffels R.H. and H. Barten H. (eds) Bio-
methane & Bio-hydrogen - Status and Perspectives of Biological Methane and Hydrogen
Production, pp. 58-102. The Hague: Smiet offcet.
Penaud, V., Delgenès, J.P., Moletta, R. (1999) Thermo-chemical pretreatment of a microbial biomass:
influence of sodium hydroxide addition on solubilization and anaerobic biodegradability. Enzyme
and Microbial Technology 25:258-263
Pevere, A., Guibaud, G., Van Hullebusch, E., Lens, P., Baudu, M. (2006) Viscosity evolution of
anaerobic granular sludge. Biochemical Engineering Journal 27:315-322
Ray, B.T., Lin, J.-G., Rajan, R.V. (1990) Low-level alkaline solubilization for enhanced anaerobic
digestion. Research Journal of the Water Pollution Control Federation 62:81-87
Schnürer, A., Jarvis, Å. (2009) Mikrobiologisk handbok för biogas anläggningar. Svenskt gastekniskt
Center och Avfall Sverige. Rapport U2009:3, 118 pp.
Schramm, G. (1994) A practical Approach to Rheology and Rheometry. Karlsruhe: Gebreuder
Haake Gmbh, 291 pp.
SIS (1981) SS 02 81 13 Metod för analys av torrsubstans (TS) och glödförlust (VS)
Skiadas, I.V., Gavala, H.N., Lu, J., Ahring, B.K. (2005) Thermal pre-treatment of primary and
secondary sludge at 70˚C prior to anaerobic digestion. Water Science and Technology 52:161-166
Tanaka, S., Kobayashi, T., Kamiyama, K.-I., Signey Bildan, Ma.L.N. (1997) Effects of
thermochemical pretreatment on the anaerobic digestion of waste activated sludge. Water Science
and Technology 35:209-215
35
Tixier, N., Guibaud, G., Baudu, M. (2003a) Determination of some rheological parameters for the
characterization of activated sludge. Bioresource Technology 90:215-220
Tixier, N., Guibaud, G., Baudu, M. (2003b) Effect of pH and ionic environment changes on
interparticle interactions affecting activated sludge flocs: A rheological approach. Environmental
Technology 24:971-978
Truong, X-B., Karlsson, A., Ejlertsson, J., Nilsson, F. (2010) Optimering och teknisk/ekonomisk
utvärdering av biogasproduktion från bioslam från massa-/pappersbruk. Stockholm: Värmeforsk,
rapport nr 1130, 64 pp.
Wang, Q., Noguchi, C., Hara, Y., Sharon, C., Kakimoto, K., Kato, Y. (1997) Studies on anaerobic
digestion mechanism: Influence of pretreatment temperature on biodegradation of waste activated
sludge. Environmental Technology 18:999-1008
Weemaes, M.P.J., Verstraete, W.H. (1998) Evaluation of current wet sludge disintegration techniques.
Journal of Chemical Technology and Biotechnology 73:83-92
Vlyssides, A.G., Karlis, P.K. (2004) Thermal-alkaline solubilization of waste activated sludge as a
pre-treatment stage for anaerobic digestion. Bioresource Technology 91:201-206
PERSONAL COMMUNICATIONS:
Paula Segura de la Monja, master student at Energy and Environmental Engineering
UNPUBLISHED MASTER THESES:
Lüdtke, M. (2010) Anaerobic digestion of paper pulp plant secondary sludge using plant spill heat
and waste ash - Rötning av bioslam från pappersmassabruk med hjälp av spillvärme och aska.
Master thesis at Department of Water and Environmental Studies, Linköping University


AP
PE
ND
IX A
BA
TC
H R
AW
DA
TA
Ta
ble
8 T
S,
VS
an
d O
LR
at
ba
tch
tri
als
TS
and
VS
anal
ysi
s w
ere
mad
e in
dup
lica
tes.
TS
val
ues
var
ied
±0
.2 o
r le
ss a
nd
VS
val
ues
±2
.0 o
r le
ss.
Ital
ic a
nd
no
ne
ital
ic v
alues
der
ive
fro
m t
wo
sep
arat
e p
re-t
reat
men
t o
ccas
ions,
and
are
th
eref
ore
no
t co
mp
arab
le. T
S a
nd
VS
fo
r el
ectr
op
ora
ted
bio
logic
al s
lud
ge
wer
e as
sum
ed t
o b
e th
e sa
me
as t
he
untr
eate
d c
ontr
ol
slud
ge,
sin
ce p
re-t
reat
ment
too
k p
lace
in a
clo
sed
co
nta
iner
(cu
vet
te).
Org
anic
lo
adin
g r
ate
(OL
R)
is s
tate
d a
s m
ean
s o
f th
ree
bo
ttle
s. F
or
low
TS
-slu
dges
,
OL
R b
eco
mes
lim
ited
. V
aria
tio
n o
f O
LR
was
±0
.1 o
r le
ss.
Slu
dg
e 1
2
A
2B
3
A
3B
4
5
A
5B
5
C
6A
6
B
TS
(%
)
Un
trea
ted
1
1
3
4
13
1
0.6
5
8
2
8
Th
erm
al
1
1
3
5
14
1
0.7
5
9
2
9
Ch
em
ica
l 1
1
3
4
9
1
0.8
5
10
2
8
Ele
ctro
po
rati
on
0
.9
0.9
2
3
8
3
1
5
8
1
4
VS
(%
of
TS
)
Un
trea
ted
7
0
70
8
0
90
90
8
0
70
80
8
0
80
80
Th
erm
al
70
7
0
80
9
0
90
8
0
70
80
8
0
80
80
Ch
em
ica
l 6
0
60
7
0
80
80
7
0
50
80
8
0
70
80
Ele
ctro
po
rati
on
7
0
70
8
0
80
90
9
0
70
80
8
0
80
90
OL
R (
g V
S/L
)
Un
trea
ted
6
7
16
1
4
14
6
3
11
1
2
11
11
Th
erm
al
5
8
16
1
6
14
6
4
13
1
1
12
13
Ch
em
ica
l 5
6
13
1
3
13
5
3
12
1
1
11
10
Ele
ctro
po
rati
on
5
4
8
7
13
1
9
5
10
1
2
7
10
i

Ta
ble
9 A
lka
li p
re-t
rea
tmen
t d
ata
Init
ial
sub
stra
te p
H v
arie
d 6
.6-7
.6.
Pre
-tre
atm
ent
too
k p
lace
in r
oo
m t
em
per
ature
over
nig
ht,
in a
ver
age
17
hrs
. L
ow
TS
-slu
dges
tend
ed t
o
cause
sm
alle
r p
H d
rop
, an
d t
o s
om
e ex
tent
consu
me
mo
re a
lkal
i.
Slu
dg
e 1
2
A
2B
3A
3
B*
4
5A
5
B
5C
**
6A
6B
**
*
TS
(%
) 1
1
3
4
13
1
0.6
5
1
6
2
8
At
pre
-tre
atm
ent
Init
ial
pH
7.5
7
.6
6.9
6.8
7.2
6
.6
7.4
6
.8
6.8
7.6
7
.3
Fin
al
pH
1
2.2
1
2.1
1
2.1
1
2.1
12.1
12
.2
12
.5
12.2
12.3
12.1
12
.1
At
neu
tra
lisa
tio
n
Init
ial
pH
11
.4
11
.3
10
.5
10.1
9.9
11
.8
12
.3
11.2
11.9
10.6
10
.1
Fin
al
pH
7
.5
7.8
7.7
7.7
7.7
7
.6
7.5
7
.6
7.7
7.8
7
.8
Du
rati
on
tim
e
of
trea
tmen
t (h
)
16
1
7
17
1
7.5
17.5
16
.5
17
.5
16.5
17.5
17
19
pH
dro
p d
uri
ng
trea
tmen
t p
erio
d
0.8
0
.8
1.6
2.0
2.2
0
.4
0.2
1
.0
0.4
1.5
2
.0
Alk
ali
co
nsu
mp
tio
n
(g N
aO
H/1
00
g T
S)
12
1
2
15
8
6
11
3
1
7
5
9
6
(*)
rep
rese
nt
dil
ute
d s
lud
ges
wit
h w
ater
co
nte
nt
of
*2
5%
, **4
0%
and
***1
0%
ii

Ta
ble
10
Sta
tist
ica
l a
na
lysi
s o
f m
eth
an
e p
rod
uct
ion
usi
ng
F-t
ests
an
d T
uk
ey c
on
fid
ence
inte
rva
ls N
um
ber
s w
ith
in b
rack
ets
des
crib
e a
95
% c
onfi
dence
inte
rval
of
met
han
e p
rod
uct
ion (
ml/
g
add
ed V
S)
of
pre
-tre
atm
ent
(A-a
lkal
i; H
-hea
t; E
-ele
ctro
po
rati
on)
over
co
ntr
ol.
Neg
ativ
e val
ues
rep
rese
nt
hig
her
met
hane
pro
duct
ion o
f co
ntr
ol.
Non significant differences are denoted “n.s.”
iii
Mil
l 1
M
ill
2
Slu
dge
A
S
lud
ge
A
S
lud
ge
B
da
y A
H
E
A
H
E
A
H
E
7
[25
4
7]
n.s
. n.s
.
[21
3
6]
[10
2
5]
[-9
-
3]
[3
7 5
1]
n.s
. [6
8
]
20
[12
3
8]
n.s
. [-
27
-2
]
n.s
. n.s
. [-
40
-1
4]
[1
3 2
7]
[-2
3 -
10
] n.s
.
40
[1
3
3]
n.s
. n.s
.
n.s
. n.s
. [-
64
-0
.1]
[2
1
9]
[-3
3 -
16
] n.s
.
60
n.s
. [-
34
-5
] [-
30
-1
]
[-3
2
-6]
n.s
. [-
61
-2
9]
n.s
. [-
39
-1
5]
[-2
4
-1]
Mil
l 3
M
ill
4
Slu
dge
A
S
lud
ge
B
S
lud
ge
A
A
H
E
A
H
E
A
H
E
7
[64
7
6]
[44
5
7]
n.s
.
[65
7
5]
[47
5
7]
[10
1
7]
[1
4 3
5]
n.s
. n.s
.
20
[30
4
8]
[19
3
6]
n.s
.
[37
5
2]
[19
3
3]
[7
1
8]
[6
3
2]
n.s
. n.s
.
40
[8
3
0]
[6
2
7]
n.s
.
[15
3
8]
[3
2
5]
[2
1
5]
n.s
. n.s
. n.s
.
60
[4
2
8]
n.s
. n.s
.
[9
2
6]
n.s
. n.s
.
n.s
. n.s
. n.s
.
Mil
l 5
Slu
dge
A
S
lud
ge
B
S
lud
ge
C
A
H
E
A
H
E
A
H
E
7
[9
25
] [1
5 3
1]
n.s
.
[8
30
] n.s
. n.s
.
n.s
. n.s
. [-
12
-2
]
20
n.s
. [4
4
1]
n.s
.
n.s
. n.s
. n.s
.
n.s
. n.s
. [-
20
-2
]
40
n.s
. [3
4
3]
n.s
.
n.s
. n.s
. n.s
.
n.s
. n.s
. n.s
.
60
n.s
. [9
4
6]
n.s
.
n.s
. n.s
. n.s
.
n.s
. n.s
. [-
24
-0
.3]
Mil
l 6
Slu
dge
A
S
lud
ge
B
A
H
E
A
H
E
7
[5
14
] n.s
. n.s
.
[13
3
7]
n.s
. n.s
.
20
[-1
9 -
1]
[-2
2 -
4]
n.s
.
n.s
. n.s
. n.s
.
40
n.s
. [-
22
-4
] [-
12
-7
]
n.s
. n.s
. n.s
.
60
[-2
1 -
11
] [-
24
-1
4]
n.s
.
n.s
. n.s
. n.s
.
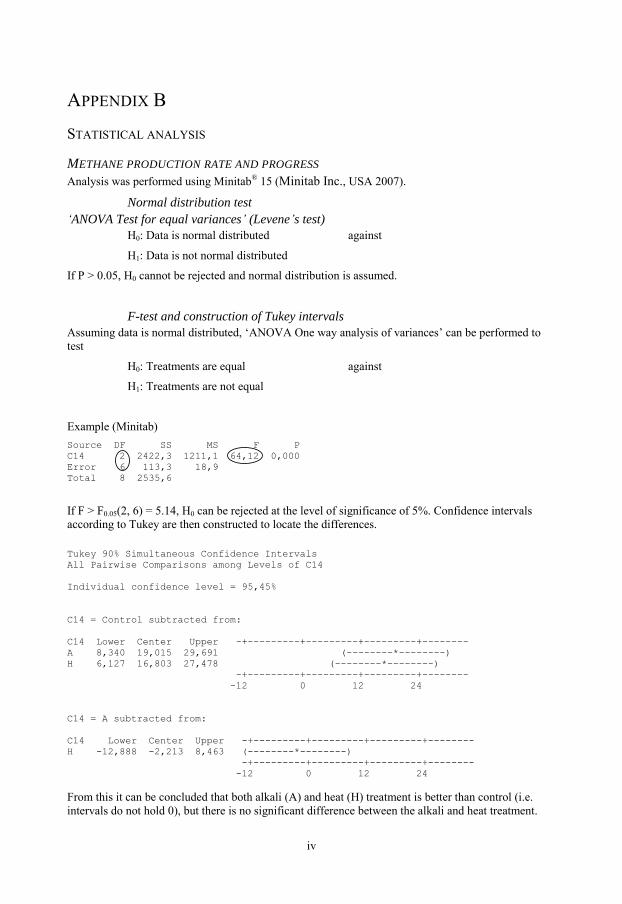
iv
APPENDIX B
STATISTICAL ANALYSIS
METHANE PRODUCTION RATE AND PROGRESS
Analysis was performed using Minitab® 15 (Minitab Inc., USA 2007).
Normal distribution test
‘ANOVA Test for equal variances’ (Levene’s test)
H0: Data is normal distributed against
H1: Data is not normal distributed
If P > 0.05, H0 cannot be rejected and normal distribution is assumed.
F-test and construction of Tukey intervals
Assuming data is normal distributed, „ANOVA One way analysis of variances‟ can be performed to
test
H0: Treatments are equal against
H1: Treatments are not equal
Example (Minitab)
Source DF SS MS F P
C14 2 2422,3 1211,1 64,12 0,000
Error 6 113,3 18,9
Total 8 2535,6
If F > F0.05(2, 6) = 5.14, H0 can be rejected at the level of significance of 5%. Confidence intervals
according to Tukey are then constructed to locate the differences.
Tukey 90% Simultaneous Confidence Intervals
All Pairwise Comparisons among Levels of C14
Individual confidence level = 95,45%
C14 = Control subtracted from:
C14 Lower Center Upper -+---------+---------+---------+--------
A 8,340 19,015 29,691 (--------*--------)
H 6,127 16,803 27,478 (--------*--------)
-+---------+---------+---------+--------
-12 0 12 24
C14 = A subtracted from:
C14 Lower Center Upper -+---------+---------+---------+--------
H -12,888 -2,213 8,463 (--------*--------)
-+---------+---------+---------+--------
-12 0 12 24
From this it can be concluded that both alkali (A) and heat (H) treatment is better than control (i.e.
intervals do not hold 0), but there is no significant difference between the alkali and heat treatment.
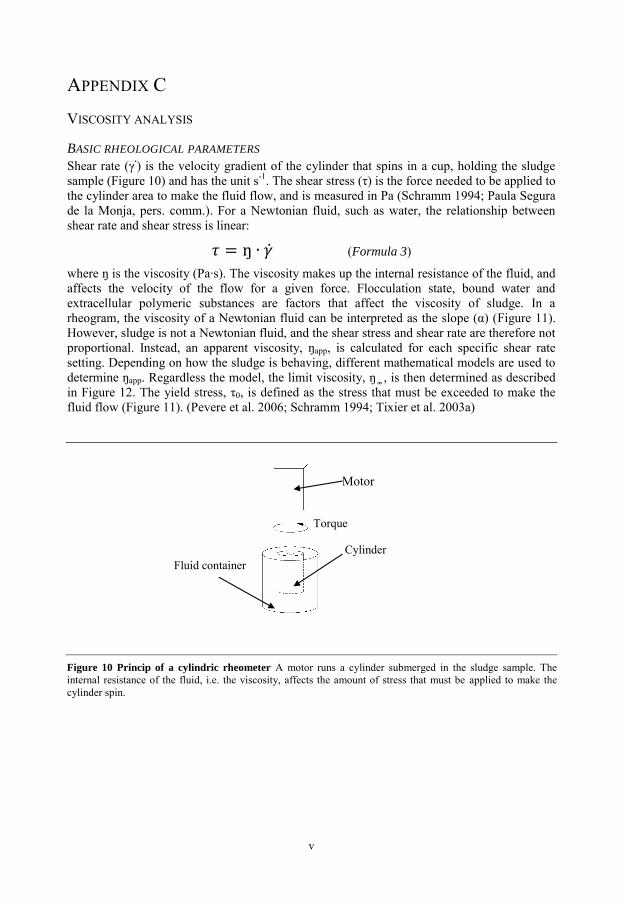
v
APPENDIX C
VISCOSITY ANALYSIS
BASIC RHEOLOGICAL PARAMETERS
Shear rate (γ∙) is the velocity gradient of the cylinder that spins in a cup, holding the sludge
sample (Figure 10) and has the unit s-1. The shear stress (τ) is the force needed to be applied to
the cylinder area to make the fluid flow, and is measured in Pa (Schramm 1994; Paula Segura
de la Monja, pers. comm.). For a Newtonian fluid, such as water, the relationship between
shear rate and shear stress is linear:
(Formula 3)
where ŋ is the viscosity (Pa∙s). The viscosity makes up the internal resistance of the fluid, and
affects the velocity of the flow for a given force. Flocculation state, bound water and
extracellular polymeric substances are factors that affect the viscosity of sludge. In a
rheogram, the viscosity of a Newtonian fluid can be interpreted as the slope (α) (Figure 11).
However, sludge is not a Newtonian fluid, and the shear stress and shear rate are therefore not
proportional. Instead, an apparent viscosity, ŋapp, is calculated for each specific shear rate
setting. Depending on how the sludge is behaving, different mathematical models are used to
determine ŋapp. Regardless the model, the limit viscosity, ŋ , is then determined as described
in Figure 12. The yield stress, τ0, is defined as the stress that must be exceeded to make the
fluid flow (Figure 11). (Pevere et al. 2006; Schramm 1994; Tixier et al. 2003a)
Motor
Torque
Cylinder
Fluid container
Figure 10 Princip of a cylindric rheometer A motor runs a cylinder submerged in the sludge sample. The
internal resistance of the fluid, i.e. the viscosity, affects the amount of stress that must be applied to make the
cylinder spin.
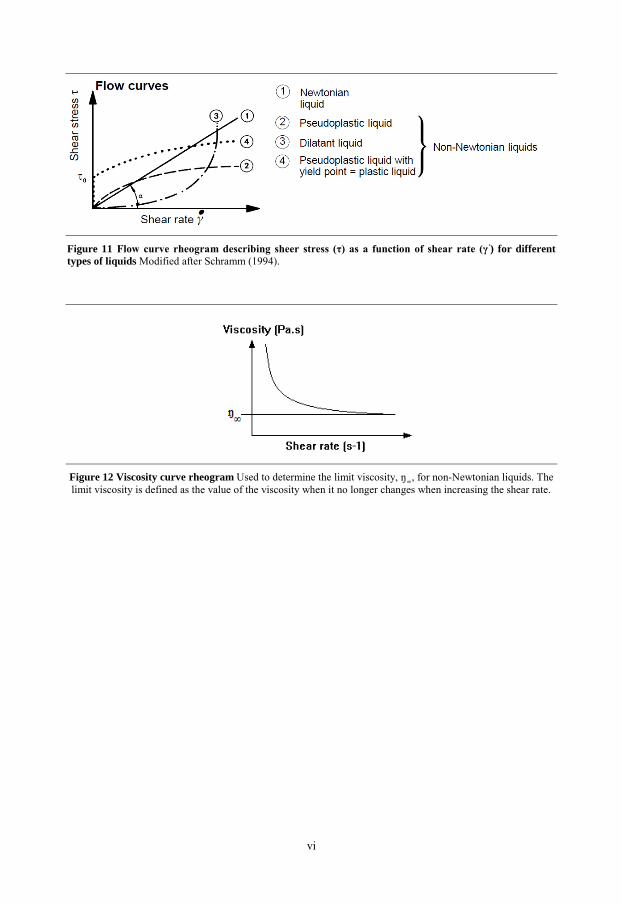
vi
Figure 11 Flow curve rheogram describing sheer stress (τ) as a function of shear rate (γ∙) for different
types of liquids Modified after Schramm (1994).
Figure 12 Viscosity curve rheogram Used to determine the limit viscosity, ŋ , for non-Newtonian liquids. The
limit viscosity is defined as the value of the viscosity when it no longer changes when increasing the shear rate.
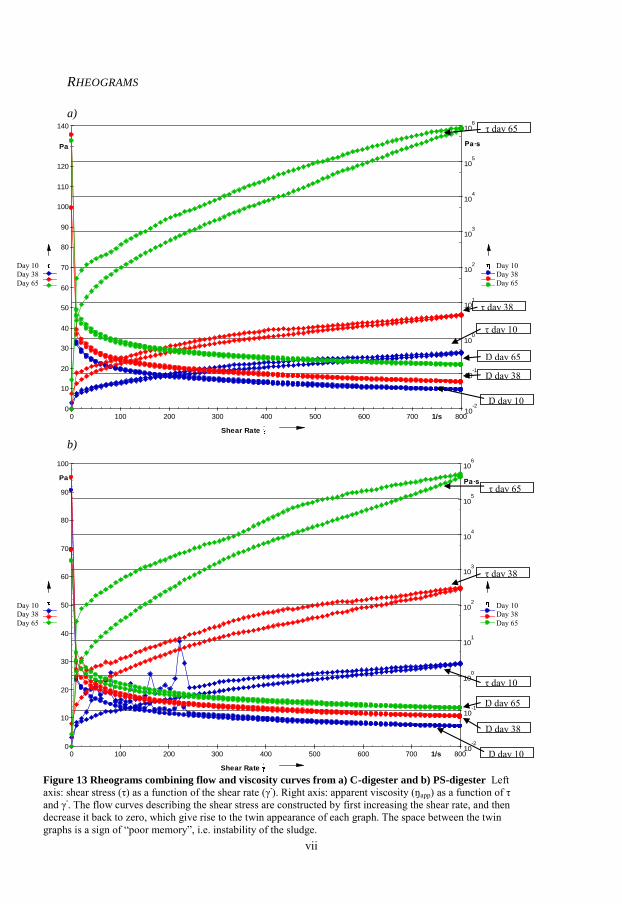
vii
0
10
20
30
40
50
60
70
80
90
100
110
120
140
Pa
10-2
10-1
100
101
102
103
104
105
106
Pa·s
0 100 200 300 400 500 600 700 8001/s
Shear Rate .
Rheoplus
Anton Paar GmbH
D1 March 26th 1
CC27-SN19237; d=0 mm
Shear Stress
Viscosity
D1 April 23rd 1
CC27-SN19237; d=0 mm
Shear Stress
Viscosity
D1 May 20th 1
CC27-SN19237; d=0 mm
Shear Stress
Viscosity
0
10
20
30
40
50
60
70
80
90
100
Pa
10-2
10-1
100
101
102
103
104
105
106
Pa·s
0 100 200 300 400 500 600 700 8001/s
Shear Rate .
Rheoplus
Anton Paar GmbH
D3 March 26th 1
CC27-SN19237; d=0 mm
Shear Stress
Viscosity
D3 April 23rd 1
CC27-SN19237; d=0 mm
Shear Stress
Viscosity
D3 May 20th 1
CC27-SN19237; d=0 mm
Shear Stress
Viscosity
RHEOGRAMS
a)
b)
Figure 13 Rheograms combining flow and viscosity curves from a) C-digester and b) PS-digester Left
axis: shear stress (τ) as a function of the shear rate (γ∙). Right axis: apparent viscosity (ŋapp) as a function of τ
and γ∙. The flow curves describing the shear stress are constructed by first increasing the shear rate, and then
decrease it back to zero, which give rise to the twin appearance of each graph. The space between the twin
graphs is a sign of “poor memory”, i.e. instability of the sludge.
Day 10
Day 38
Day 65
Ŋ day 10
Ŋ day 38
Ŋ day 65
τ day 65
τ day 38
τ day 10
Day 10
Day 38
Day 65
Day 10
Day 38
Day 65
Day 10
Day 38
Day 65
Ŋ day 10
Ŋ day 38
Ŋ day 65
τ day 65
τ day 38
τ day 10
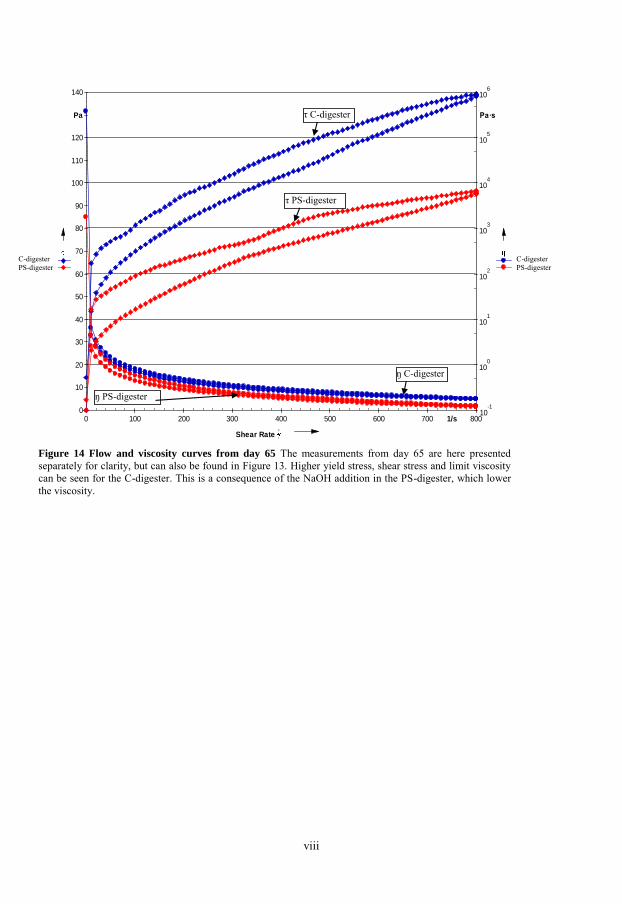
viii
0
10
20
30
40
50
60
70
80
90
100
110
120
140
Pa
10-1
100
101
102
103
104
105
106
Pa·s
0 100 200 300 400 500 600 700 8001/s
Shear Rate .
Rheoplus
Anton Paar GmbH
D1 May 20th 1
CC27-SN19237; d=0 mm
Shear Stress
Viscosity
D3 May 20th 1
CC27-SN19237; d=0 mm
Shear Stress
Viscosity
Figure 14 Flow and viscosity curves from day 65 The measurements from day 65 are here presented
separately for clarity, but can also be found in Figure 13. Higher yield stress, shear stress and limit viscosity
can be seen for the C-digester. This is a consequence of the NaOH addition in the PS-digester, which lower
the viscosity.
C-digester
PS-digester
P
C-digester
PS-digester
P
τ C-digester
P
ŋ C-digester
P
τ PS-digester
P
ŋ PS-digester
P