anaerobic co-digestion of microalgae with food … · iii committee membership title: anaerobic...
TRANSCRIPT
ANAEROBIC CO-DIGESTION OF MICROALGAE WITH FOOD WASTE AND
WASTEWATER SLUDGE
A Thesis
presented to
the Faculty of California Polytechnic State University,
San Luis Obispo
In Partial Fulfillment
of the Requirements for the Degree
Master of Science in Civil and Environmental Engineering
by
Ruth E. Spierling
June 2011
ii
© 2011
Ruth E. Spierling
ALL RIGHTS RESERVED
iii
COMMITTEE MEMBERSHIP
TITLE: ANAEROBIC CO-DIGESTION OF MICROALGAE
WITH FOOD WASTE AND WASTEWATER SLUDGE
AUTHOR: Ruth E. Spierling
DATE SUBMITTED: June 2011
COMMITTEE CHAIR: Dr. Tryg Lundquist
COMMITTEE MEMBER: Dr. Yarrow Nelson
COMMITTEE MEMBER: Dr. Raul Cano

iv
ABSTRACT
ANAEROBIC CO-DIGESTION OF MICROALGAE WITH FOOD WASTE AND
WASTEWATER SLUDGE
Ruth E. Spierling
This research sought to optimize anaerobic co-digestion of microalgae biomass harvested
from a wastewater treatment pond facility with locally-available wastes. The goal was to
produce high methane yields and stable digestion without the need for supplemental
alkalinity addition. A key research question was if algae digestion could be improved via
the synergistic effects of co-digestion. Cell disruption to increase digestibility was not
pursued due to its relatively high mechanical complexity and high energy use. For the
wastewater treatment ponds studied, the most practical co-substrates identified were
municipal wastewater sludge and food waste (sorted organic municipal waste). Although
wastewater sludge does not have a particularly high carbon:nitrogen (C:N) ratio, it
readily and stably digests and is available in large quantities at wastewater treatment
plants. This research investigated the methane productivity of algae co-digestion with
municipal wastewater sludge and food waste in semi-continuous bench-scale anaerobic
digesters at 37.5˚C. Digesters fed pure algae biomass loaded at a rate of 4 g Volatile
Solids (VS)/L-day with a 20-day residence time exhibited stable digestion and yielded an
average of 0.23 L CH4/g VS Introduced. For digesters that contained algae biomass in the
feed, the greatest methane yield of 0.40 mL CH4/g VSin was observed in a digester
containing 50% algae co-digested with both sorted organic municipal waste (40%), and
municipal wastewater sludge (10%) at a loading rate of 2 g VS/L-day with a 20-day
v
residence time. While adding co-substrates increased yields in all digesters, prevention
of ammonia toxicity did not appear to be the mechanism. Instead, the co-substrates
simply increased the concentration of readily-digestible organic carbon, leading to
increased methane yields and productivities. For algae biomass, total ammonia nitrogen
concentrations of 3370 mg/L did not appear to inhibit methane yield. Digesters with the
same feed contents and residence time loaded at 2 and 4 g VS/L-d had similar yields but
total ammonia nitrogen concentrations of 1740 and 3370 mg/L respectively. From the
data from these laboratory studies, descriptive models were developed for ammonia
nitrogen, alkalinity, volatile fatty acids, yield, biogas quality, and volatile solids
destruction. The variables from the descriptive models with p-values above 0.05 were
then used to create a compact model.
Keywords: Anaerobic Digestion, Microalgae, Biofuels, Co-digestion, Methane.
vi
ACKNOWLEDGMENTS
I would like to thank:
Dr. Tryg Lundquist for giving me the best guidance possible, challenging me, listening to
me, and especially for sometimes letting me be a mad scientist;
Dr. Yarrow Nelson, Dr. Raul Cano and Dr. David Brune for your input while creating
this project and thesis;
Craig Stubler for letting sludge and algae go where sludge and algae have never gone
before;
Dan Heimel for being my understanding research partner;
Sean Thompson for getting it done no matter what it was;
Research partners and other students for your support, understanding, and sense of
humor;
The California Energy Commission, Energy Innovation Small Grants Program, and the
Carbon Capture Corporation for their financial support;
The Sunnyvale Water Pollution Control Plant and the San Luis Obispo Water
Reclamation Facility for their assistance and generous donation of algae float and
municipal sewage sludge.
vii
TABLE OF CONTENTS
Page
LIST OF TABLES ............................................................................................................. ix
LIST OF FIGURES ........................................................................................................... xi
INTRODUCTION .............................................................................................................. 1
METHODS ......................................................................................................................... 9
OVERVIEW OF EXPERIMENTS ................................................................................. 9
COLLECTION AND STORAGE OF ALGAE ............................................................ 10
COLLECTION AND STORAGE OF SLUDGE AND ADAPTED INOCULUM ...... 10
COLLECTION AND STORAGE OF FOOD WASTE ................................................ 11
DIGESTER SET-UP ..................................................................................................... 13
DIGESTER OPERATION ............................................................................................ 15
ANALYTICAL PROCEDURES .................................................................................. 17
BIOGAS COMPOSITION ........................................................................................ 18
SOLIDS CONCENTRATION .................................................................................. 18
VOLATILE FATTY ACIDS, pH, ALKALINITY, AND AMMONIA NITROGEN
................................................................................................................................... 19
C:N RATIO ............................................................................................................... 20
MODEL DEVELOPMENT .......................................................................................... 20
viii
RESULTS ......................................................................................................................... 23
INFLUENCE OF FEED COMPOSITION, ORGANIC LOADING RATE AND
RESIDENCE TIME ...................................................................................................... 35
ALGAE CONTENT .................................................................................................. 36
FOOD WASTE CONTENT ...................................................................................... 39
SLUDGE CONTENT ................................................................................................ 41
ORGANIC LOADING RATE .................................................................................. 41
HYDRAULIC RESIDENCE TIME .......................................................................... 43
EXTENDED MODEL .................................................................................................. 47
ALKALINITY MODEL............................................................................................ 50
VOLATILE FATTY ACIDS MODEL ..................................................................... 53
AMMONIUM NITROGEN MODEL ....................................................................... 55
BIOGAS QUALITY MODEL .................................................................................. 57
YIELD MODEL ........................................................................................................ 60
VOLATILE SOLIDS DESTRUCTION MODEL .................................................... 62
COMPACT MODELS .................................................................................................. 64
CONCLUSIONS............................................................................................................... 67
REFERENCES ................................................................................................................. 70
ix
LIST OF TABLES
Table Page
Table 1: Experiment 1 Conditions .................................................................................... 16
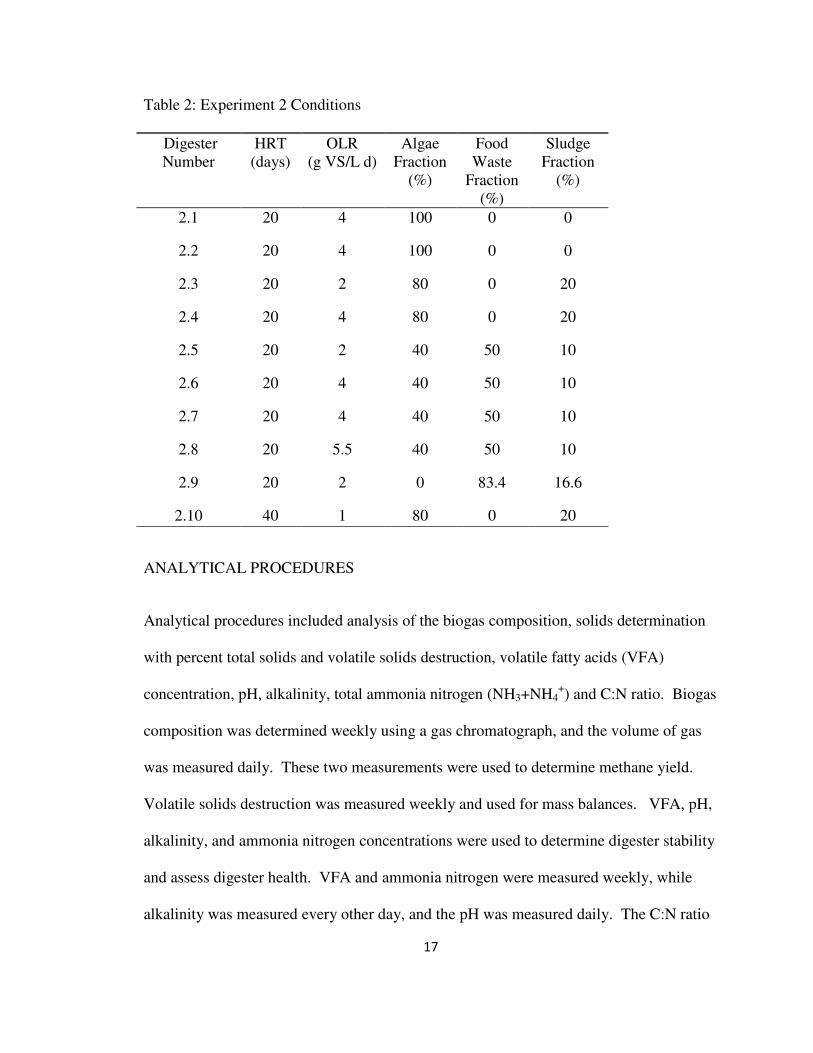
Table 2: Experiment 2 Conditions .................................................................................... 17
Table 3: Average steady state values calculated by determining the intersection of
steady state periods for gas production, volatile solids destruction (VSD), pH, and
alkalinity, ammonium, and volatile fatty acids concentrations. The line down the
middle of the graph separates independent variables on the left from dependent
variables on the right. ........................................................................................................ 46
Table 4: Model steady state periods and the number of values averaged for each value
used in the model. ............................................................................................................. 49
Table 5: Statistical analysis of the influence of residence time, organic loading rate,
and algae and food waste content in the feed on alkalinity concentrations in the
digester effluents. .............................................................................................................. 51
Table 6: Statistical analysis of the influence of residence time, organic loading rate,
and algae and food waste content in the feed on volatile fatty acid concentrations in
the digester effluents. ........................................................................................................ 53
Table 7: Statistical analysis of the influence of residence time, organic loading rate,
and algae and food waste content in the feed on ammonia nitrogen concentrations in
the digester effluents. ........................................................................................................ 56
x
Table 8: Statistical analysis of the influence of residence time, organic loading rate,
and algae and food waste content in the feed on the methane content in the biogas. ....... 58
Table 9: Statistical analysis of the influence of residence time, organic loading rate,
and algae and food waste content in the feed on the methane yield. ................................ 60
Table 10: Statistical analysis of the influence of residence time, organic loading rate,
and algae and food waste content in the feed on volatile solids destruction. ................... 63
Table 11: Compact model statistics showing the influence of organic loading rate and
food waste content in the feed on digester volatile fatty acid concentration. ................... 65
Table 12: Compact model statistics showing the influence of algae and food waste
content in the feed on volatile solids destruction. ............................................................. 66
xi
LIST OF FIGURES
Figure Page
Figure 1: The primary species present in the algae biomass was chodatella, shown in
the picture on the far right. Other algae species present in the algae biomass included
chlorella, anacystis, euglena, ulothrix, ankistrodesmus, pediastrum, zygnema,
scenedesmus, oocystis, schizothrix, closterium, cyclotella, fragilaria, micractinium,
oscillatoria, and spirogyra. .................................................................................................. 9
Figure 2: Food waste composition (January 2010) by wet mass. ..................................... 12
Figure 3: Digester set-up inside an incubator. Digesters 2.1-2.5 are on the top shelf
while their inverted gas collectors are on the bottom of the incubator. ............................ 14
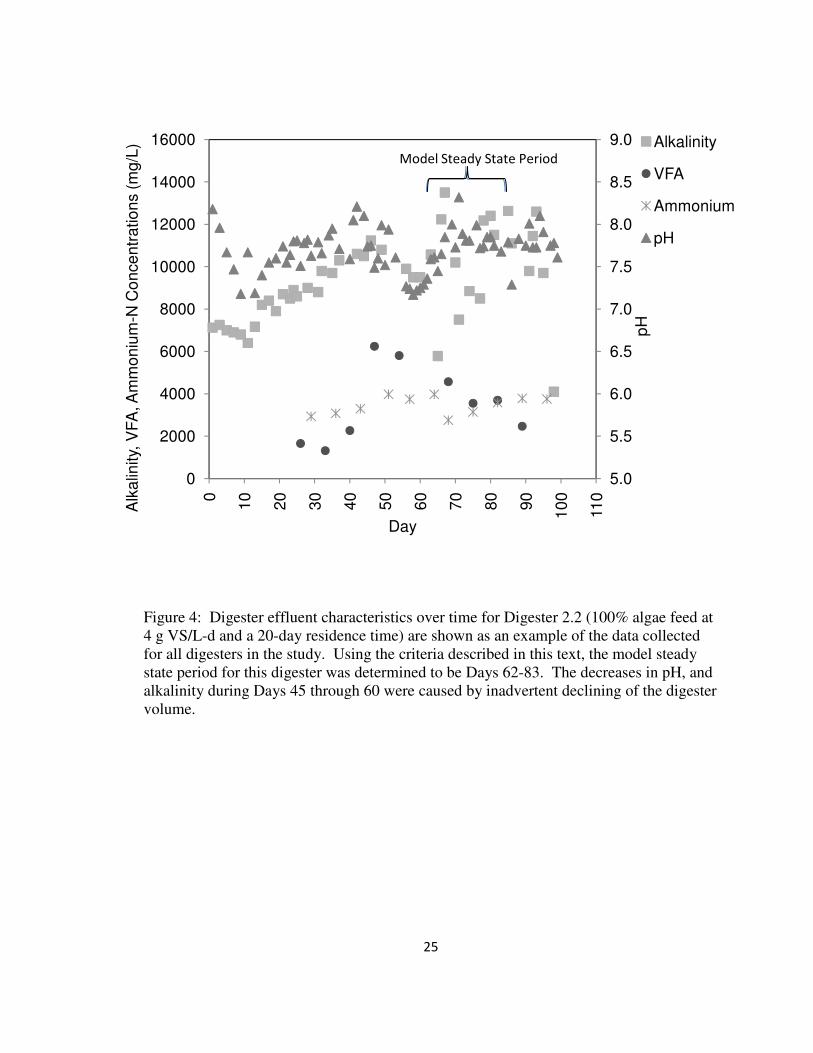
Figure 4: Digester effluent characteristics over time for Digester 2.2 (100% algae
feed at 4 g VS/L-d and a 20-day residence time) are shown as an example of the data
collected for all digesters in the study. Using the criteria described in this text, the
model steady state period for this digester was determined to be Days 62-83. The
decreases in pH, and alkalinity during Days 45 through 60 were caused by
inadvertent declining of the digester volume. ................................................................... 25
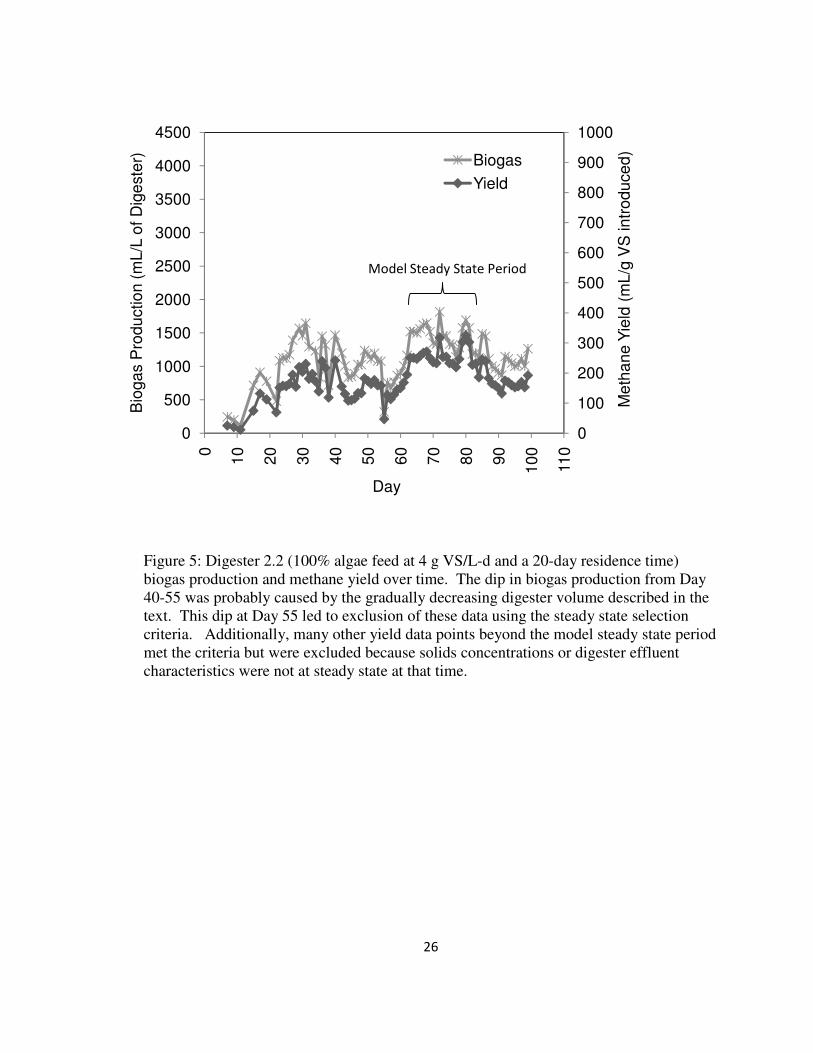
Figure 5: Digester 2.2 (100% algae feed at 4 g VS/L-d and a 20-day residence time)
biogas production and methane yield over time. The dip in biogas production from
Day 40-55 was probably caused by the gradually decreasing digester volume
described in the text. This dip at Day 55 led to exclusion of these data using the
steady state selection criteria. Additionally, many other yield data points beyond
xii
the model steady state period met the criteria but were excluded because solids
concentrations or digester effluent characteristics were not at steady state at that time. .. 26
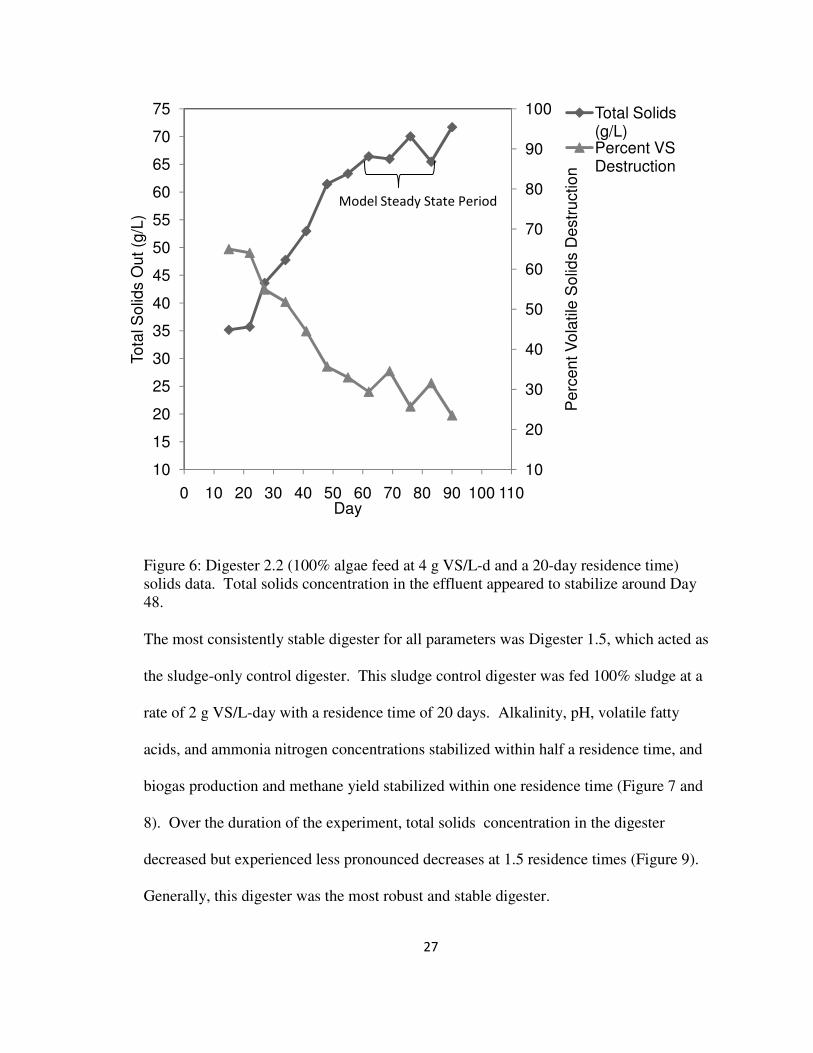
Figure 6: Digester 2.2 (100% algae feed at 4 g VS/L-d and a 20-day residence time)
solids data. Total solids concentration in the effluent appeared to stabilize around
Day 48. .............................................................................................................................. 27
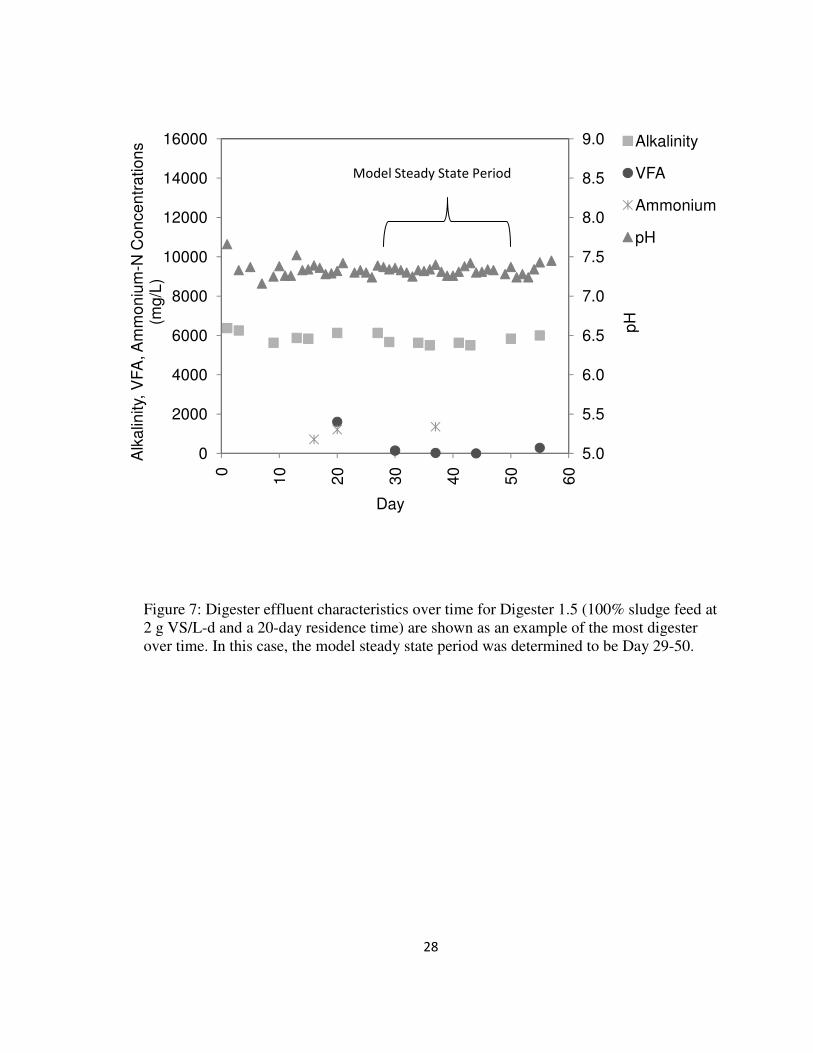
Figure 7: Digester effluent characteristics over time for Digester 1.5 (100% sludge
feed at 2 g VS/L-d and a 20-day residence time) are shown as an example of the most
digester over time. In this case, the model steady state period was determined to be
Day 29-50.......................................................................................................................... 28
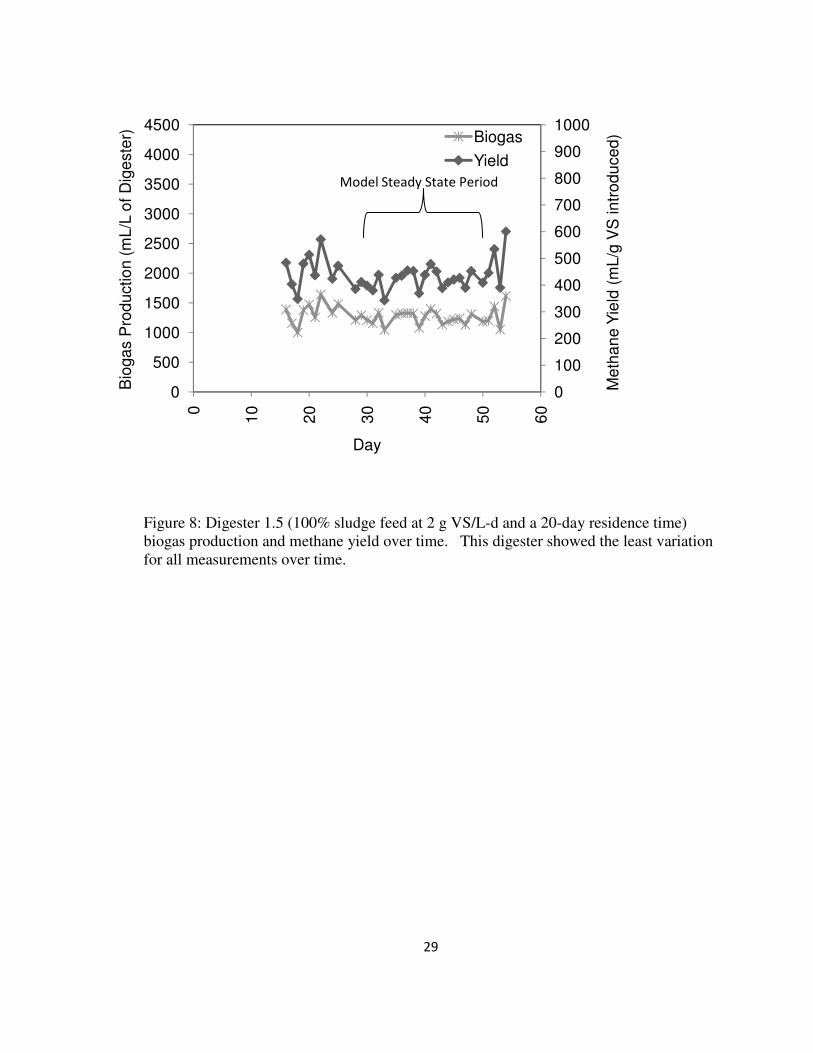
Figure 8: Digester 1.5 (100% sludge feed at 2 g VS/L-d and a 20-day residence time)
biogas production and methane yield over time. This digester showed the least
variation for all measurements over time. ......................................................................... 29
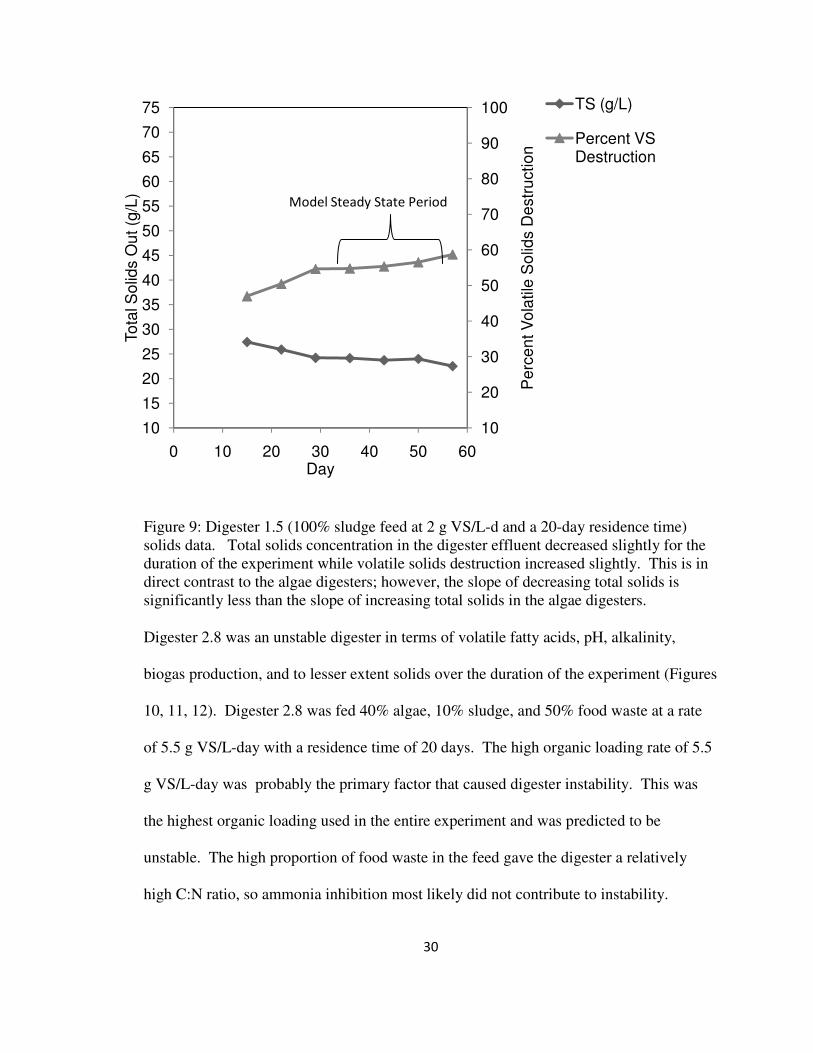
Figure 9: Digester 1.5 (100% sludge feed at 2 g VS/L-d and a 20-day residence time)
solids data. Total solids concentration in the digester effluent decreased slightly for
the duration of the experiment while volatile solids destruction increased slightly. This
is in direct contrast to the algae digesters; however, the slope of decreasing total solids
is significantly less than the slope of increasing total solids in the algae digesters. ......... 30
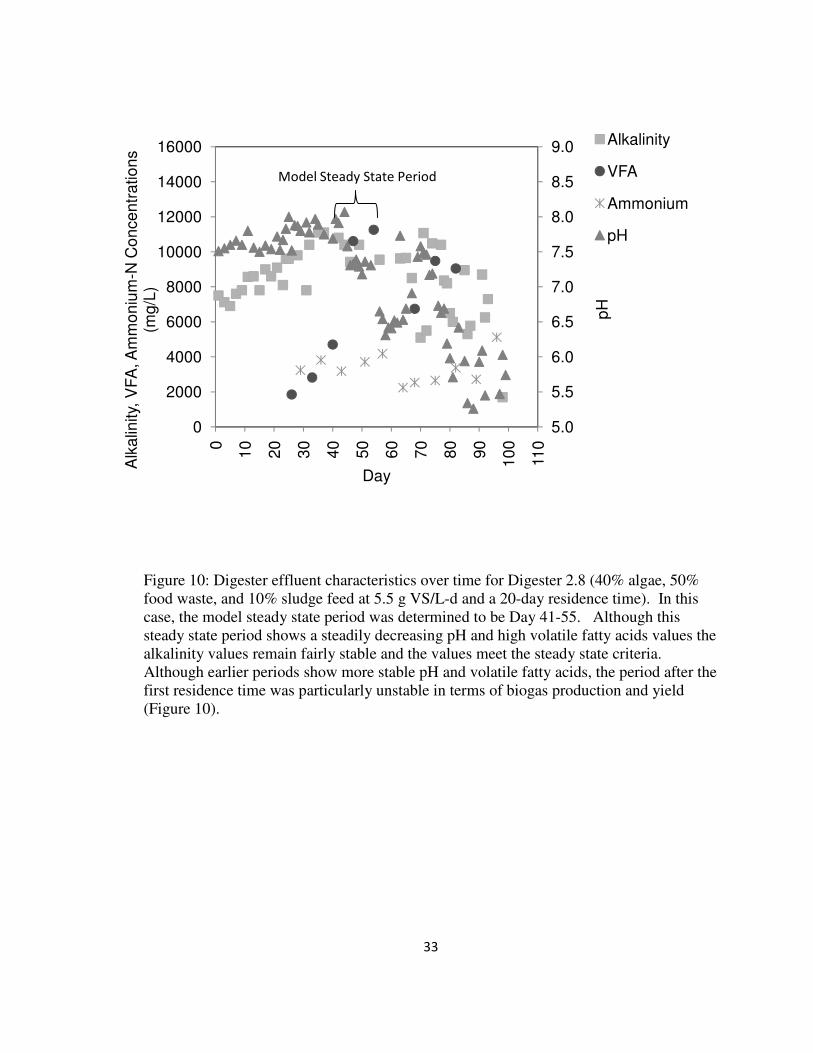
Figure 10: Digester effluent characteristics over time for Digester 2.8 (40% algae,
50% food waste, and 10% sludge feed at 5.5 g VS/L-d and a 20-day residence time).
In this case, the model steady state period was determined to be Day 41-55.
Although this steady state period shows a steadily decreasing pH and high volatile
fatty acids values the alkalinity values remain fairly stable and the values meet the
xiii
steady state criteria. Although earlier periods show more stable pH and volatile fatty
acids, the period after the first residence time was particularly unstable in terms of
biogas production and yield (Figure 10). .......................................................................... 33
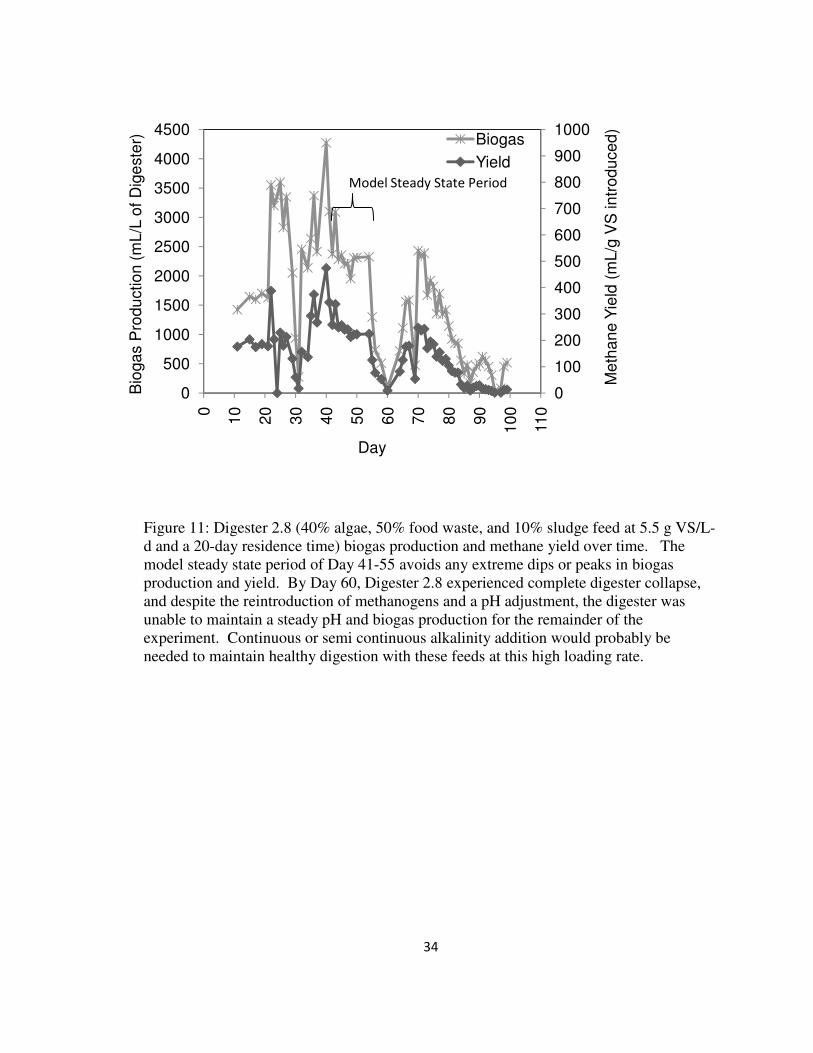
Figure 11: Digester 2.8 (40% algae, 50% food waste, and 10% sludge feed at 5.5
g VS/L-d and a 20-day residence time) biogas production and methane yield over
time. The model steady state period of Day 41-55 avoids any extreme dips or peaks
in biogas production and yield. By Day 60, Digester 2.8 experienced complete
digester collapse, and despite the reintroduction of methanogens and a pH adjustment,
the digester was unable to maintain a steady pH and biogas production for the
remainder of the experiment. Continuous or semi continuous alkalinity addition
would probably be needed to maintain healthy digestion with these feeds at this high
loading rate........................................................................................................................ 34
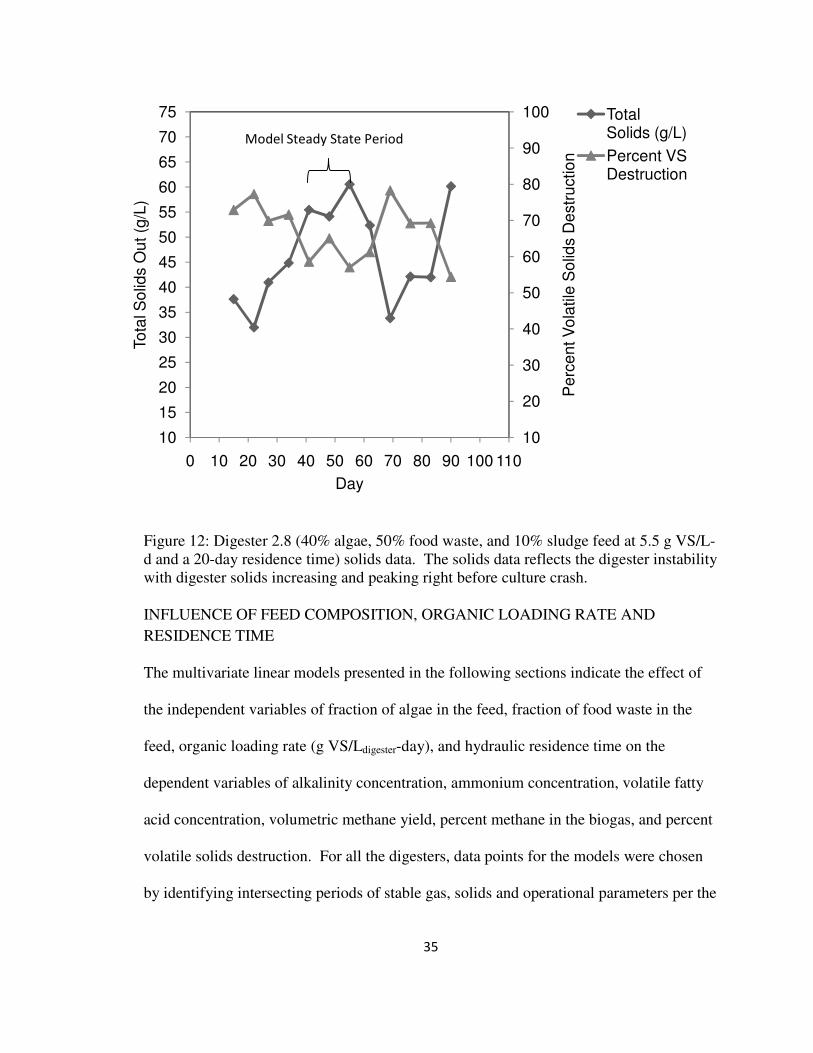
Figure 12: Digester 2.8 (40% algae, 50% food waste, and 10% sludge feed at 5.5
g VS/L-d and a 20-day residence time) solids data. The solids data reflects the
digester instability with digester solids increasing and peaking right before culture
crash. ................................................................................................................................. 35
Figure 13: Effect of algae content in the feed on methane yield, percent of volatile
solids destroyed and methane content in the biogas for digesters fed only algae and
sludge at a rate of 2 g VS/L-day and a 20-day residence time. Duplicate digesters are
not averaged. ..................................................................................................................... 38
Figure 14: The effect of algae content in the feed on methane yield, percent of
volatile solids destroyed and biogas quality when various residence times and loading
xiv
rates are included in the data set. Values for digesters with the same algae content
in the feed were averaged. Averaging the values diminishes the effect of some
influential variables such as food waste and allows the effect of algae feed to be seen
independently of the other variables. ................................................................................ 39
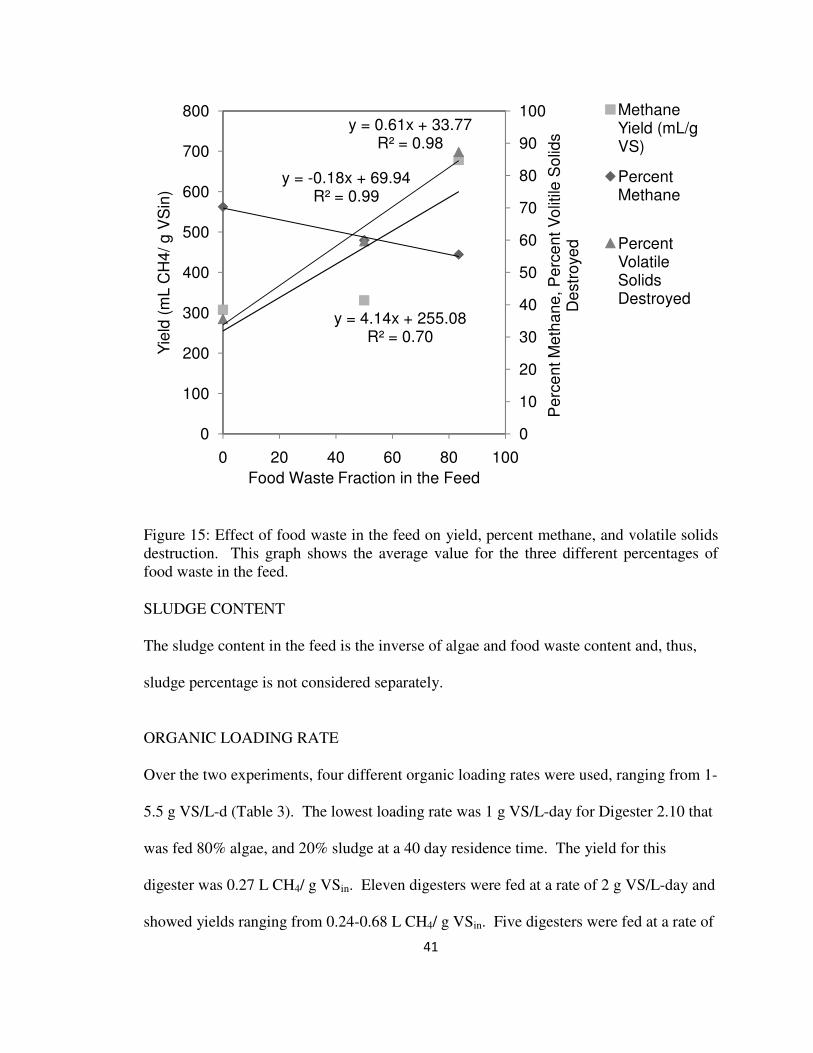
Figure 15: Effect of food waste in the feed on yield, percent methane, and volatile
solids destruction. This graph shows the average value for the three different
percentages of food waste in the feed. .............................................................................. 41
Figure 16: The effect of organic loading on methane yield, volatile solids destruction,
and percent methane in the biogas for pairs of digesters with the same residence time
and feed composition. ....................................................................................................... 43
Figure 17: Comparison of three digesters fed 80% algae and 20% sludge. Digester
1.10 and 2.3 were fed at a rate of 2 g VS/L-day and a 20-day residence time, and
Digester 2.10 was fed at a rate of 1 g VS/L-d and a 40-day residence time. .................... 45
Figure 18: Plot showing the predicted alkalinity concentration as determined from the
extended model equation compared to the actual measured average alkalinity
concentration for the steady state period. The dashed line indicates the one to one
line while the solid line indicates the line of best fit for the data points........................... 52
Figure 19: Plot showing the predicted volatile fatty acid concentration as determined
from the extended model equation compared to the actual measured average volatile
fatty acid concentration for the steady state period. The dashed line indicates the one
to one line while the solid line indicates the line of best fit for the data points. ............... 55
xv
Figure 20: Plot showing the predicted ammonia nitrogen concentration as determined
from the extended model equation compared to the actual measured average ammonia
nitrogen concentration for the steady state period. The dashed line indicates the one to
one line while the solid line indicates the line of best fit for the data points. ................... 57
Figure 21: Plot showing the predicted biogas quality as determined from the extended
model equation compared to the actual measured average biogas quality for the steady
state period. The dashed line indicates the one to one line while the solid line
indicates the line of best fit for the data points. ................................................................ 59
Figure 22: Plot showing the predicted yield as determined from the extended model
equation compared to the actual measured average yield for the steady state period.
The dashed line indicates the one to one line while the solid line indicates the line of
best fit for the data points.................................................................................................. 62
Figure 23: Plot showing the predicted volatile solids destruction as determined from
the extended model equation compared to the actual measured average volatile solids
destruction for the steady state period. The dashed line indicates the one to one line
while the solid line indicates the line of best fit for the data points.................................. 63
1
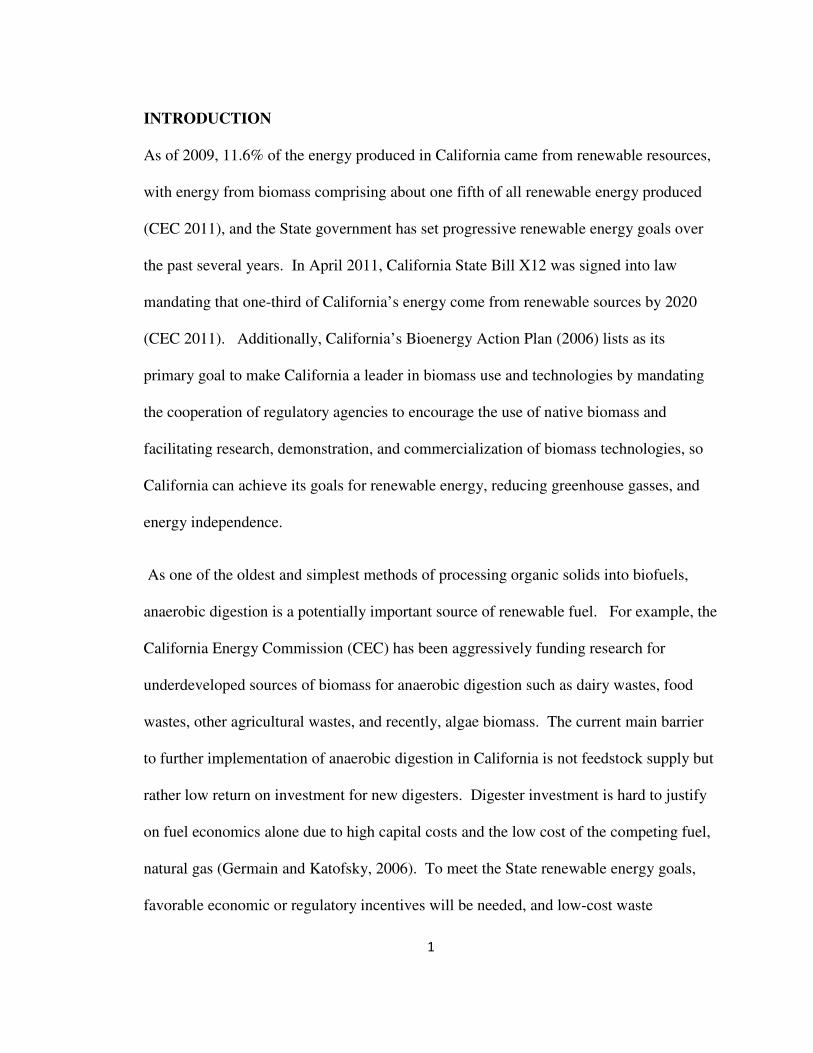
INTRODUCTION
As of 2009, 11.6% of the energy produced in California came from renewable resources,
with energy from biomass comprising about one fifth of all renewable energy produced
(CEC 2011), and the State government has set progressive renewable energy goals over
the past several years. In April 2011, California State Bill X12 was signed into law
mandating that one-third of California’s energy come from renewable sources by 2020
(CEC 2011). Additionally, California’s Bioenergy Action Plan (2006) lists as its
primary goal to make California a leader in biomass use and technologies by mandating
the cooperation of regulatory agencies to encourage the use of native biomass and
facilitating research, demonstration, and commercialization of biomass technologies, so
California can achieve its goals for renewable energy, reducing greenhouse gasses, and
energy independence.
As one of the oldest and simplest methods of processing organic solids into biofuels,
anaerobic digestion is a potentially important source of renewable fuel. For example, the
California Energy Commission (CEC) has been aggressively funding research for
underdeveloped sources of biomass for anaerobic digestion such as dairy wastes, food
wastes, other agricultural wastes, and recently, algae biomass. The current main barrier
to further implementation of anaerobic digestion in California is not feedstock supply but
rather low return on investment for new digesters. Digester investment is hard to justify
on fuel economics alone due to high capital costs and the low cost of the competing fuel,
natural gas (Germain and Katofsky, 2006). To meet the State renewable energy goals,
favorable economic or regulatory incentives will be needed, and low-cost waste
2
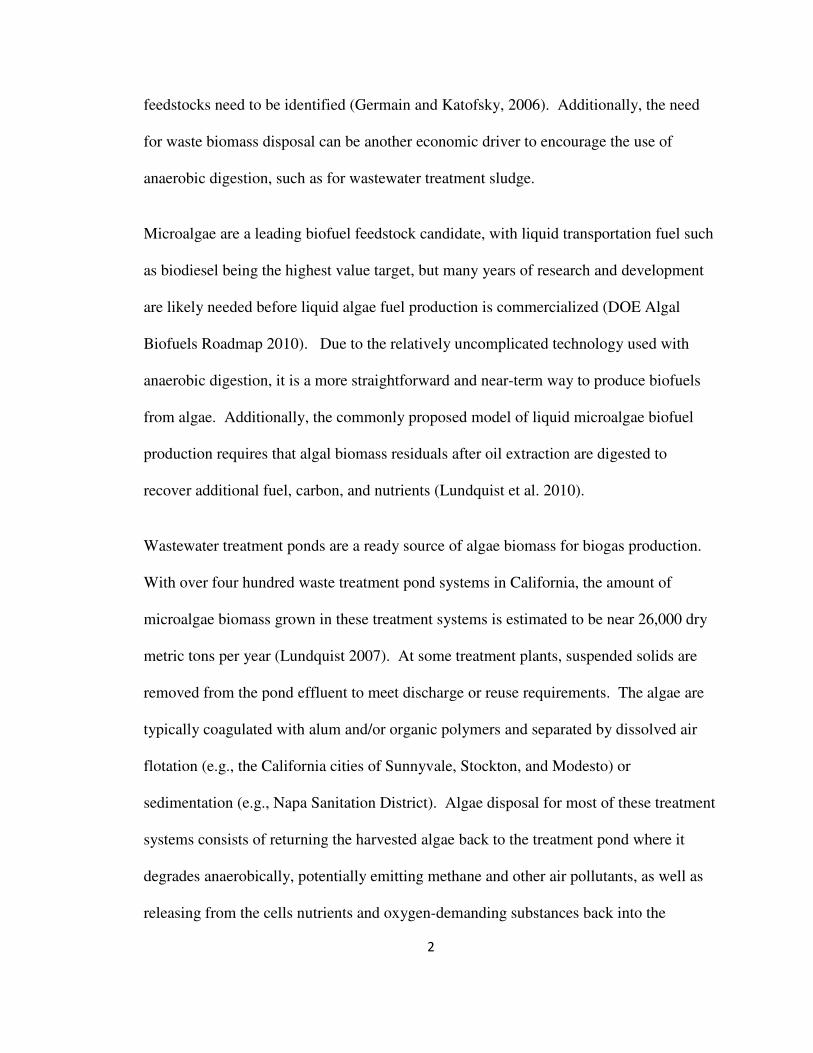
feedstocks need to be identified (Germain and Katofsky, 2006). Additionally, the need
for waste biomass disposal can be another economic driver to encourage the use of
anaerobic digestion, such as for wastewater treatment sludge.
Microalgae are a leading biofuel feedstock candidate, with liquid transportation fuel such
as biodiesel being the highest value target, but many years of research and development
are likely needed before liquid algae fuel production is commercialized (DOE Algal
Biofuels Roadmap 2010). Due to the relatively uncomplicated technology used with
anaerobic digestion, it is a more straightforward and near-term way to produce biofuels
from algae. Additionally, the commonly proposed model of liquid microalgae biofuel
production requires that algal biomass residuals after oil extraction are digested to
recover additional fuel, carbon, and nutrients (Lundquist et al. 2010).
Wastewater treatment ponds are a ready source of algae biomass for biogas production.
With over four hundred waste treatment pond systems in California, the amount of
microalgae biomass grown in these treatment systems is estimated to be near 26,000 dry
metric tons per year (Lundquist 2007). At some treatment plants, suspended solids are
removed from the pond effluent to meet discharge or reuse requirements. The algae are
typically coagulated with alum and/or organic polymers and separated by dissolved air
flotation (e.g., the California cities of Sunnyvale, Stockton, and Modesto) or
sedimentation (e.g., Napa Sanitation District). Algae disposal for most of these treatment
systems consists of returning the harvested algae back to the treatment pond where it
degrades anaerobically, potentially emitting methane and other air pollutants, as well as
releasing from the cells nutrients and oxygen-demanding substances back into the
3
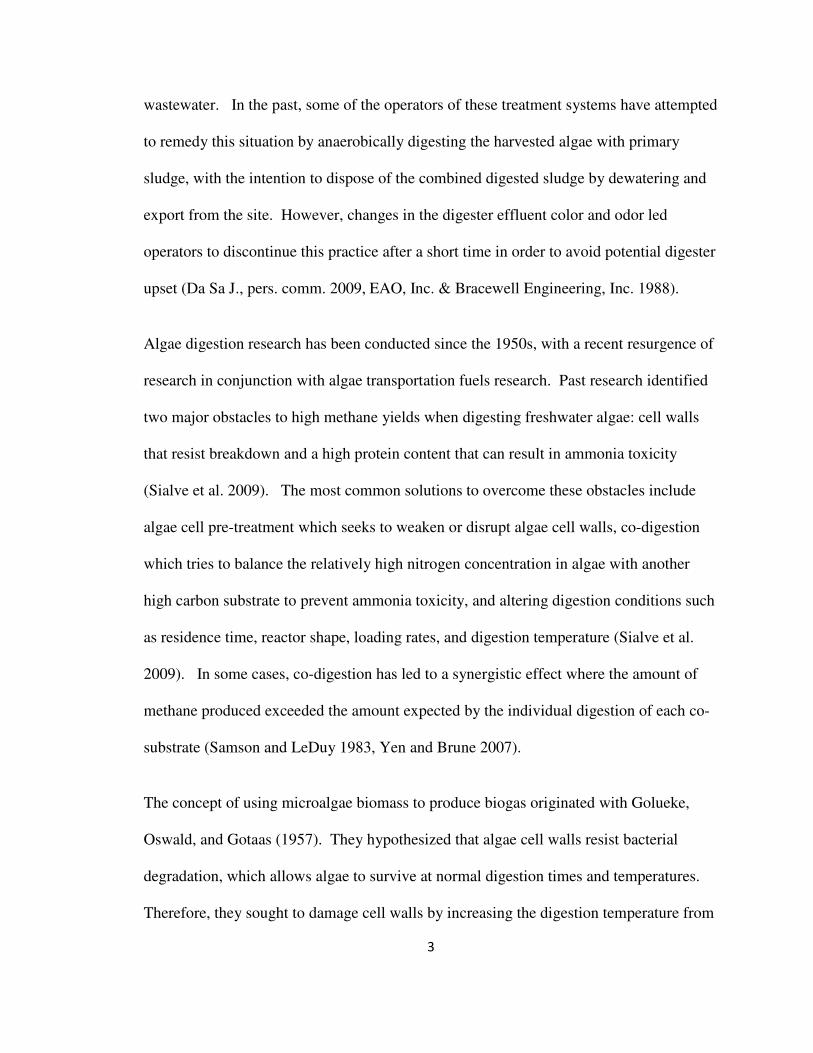
wastewater. In the past, some of the operators of these treatment systems have attempted
to remedy this situation by anaerobically digesting the harvested algae with primary
sludge, with the intention to dispose of the combined digested sludge by dewatering and
export from the site. However, changes in the digester effluent color and odor led
operators to discontinue this practice after a short time in order to avoid potential digester
upset (Da Sa J., pers. comm. 2009, EAO, Inc. & Bracewell Engineering, Inc. 1988).
Algae digestion research has been conducted since the 1950s, with a recent resurgence of
research in conjunction with algae transportation fuels research. Past research identified
two major obstacles to high methane yields when digesting freshwater algae: cell walls
that resist breakdown and a high protein content that can result in ammonia toxicity
(Sialve et al. 2009). The most common solutions to overcome these obstacles include
algae cell pre-treatment which seeks to weaken or disrupt algae cell walls, co-digestion
which tries to balance the relatively high nitrogen concentration in algae with another
high carbon substrate to prevent ammonia toxicity, and altering digestion conditions such
as residence time, reactor shape, loading rates, and digestion temperature (Sialve et al.
2009). In some cases, co-digestion has led to a synergistic effect where the amount of
methane produced exceeded the amount expected by the individual digestion of each co-
substrate (Samson and LeDuy 1983, Yen and Brune 2007).
The concept of using microalgae biomass to produce biogas originated with Golueke,
Oswald, and Gotaas (1957). They hypothesized that algae cell walls resist bacterial
degradation, which allows algae to survive at normal digestion times and temperatures.
Therefore, they sought to damage cell walls by increasing the digestion temperature from
4
35˚C to 50˚C, which increased methane yields 19% from an average of 0.25 L CH4 /g
volatile solids (VS) introduced to an average of 0.31 L CH4 /g VS introduced . Chen and
Oswald (1998) found lower biogas yield from algae biomass compared to raw municipal
wastewater sludge unless the algae biomass was pre-treated by heating algae cells at
100˚C for eight hours before digestion. Although this was found to increase methane
yield by up to 33%, pretreating was also found to be energy intensive with the energy
input for heat treating exceeding the energy gained through improved digestion. To date,
insufficient research on algae cell pretreatment has been performed to show that the extra
energy output can justify the energy input.
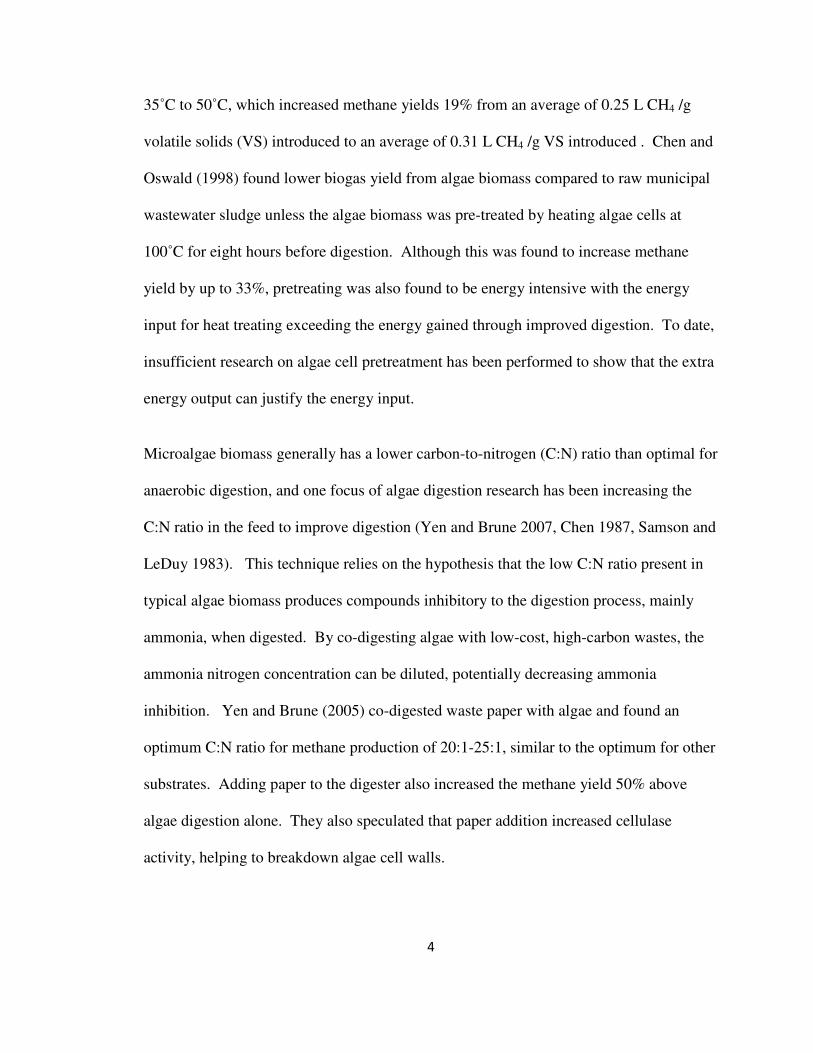
Microalgae biomass generally has a lower carbon-to-nitrogen (C:N) ratio than optimal for
anaerobic digestion, and one focus of algae digestion research has been increasing the
C:N ratio in the feed to improve digestion (Yen and Brune 2007, Chen 1987, Samson and
LeDuy 1983). This technique relies on the hypothesis that the low C:N ratio present in
typical algae biomass produces compounds inhibitory to the digestion process, mainly
ammonia, when digested. By co-digesting algae with low-cost, high-carbon wastes, the
ammonia nitrogen concentration can be diluted, potentially decreasing ammonia
inhibition. Yen and Brune (2005) co-digested waste paper with algae and found an
optimum C:N ratio for methane production of 20:1-25:1, similar to the optimum for other
substrates. Adding paper to the digester also increased the methane yield 50% above
algae digestion alone. They also speculated that paper addition increased cellulase
activity, helping to breakdown algae cell walls.
5
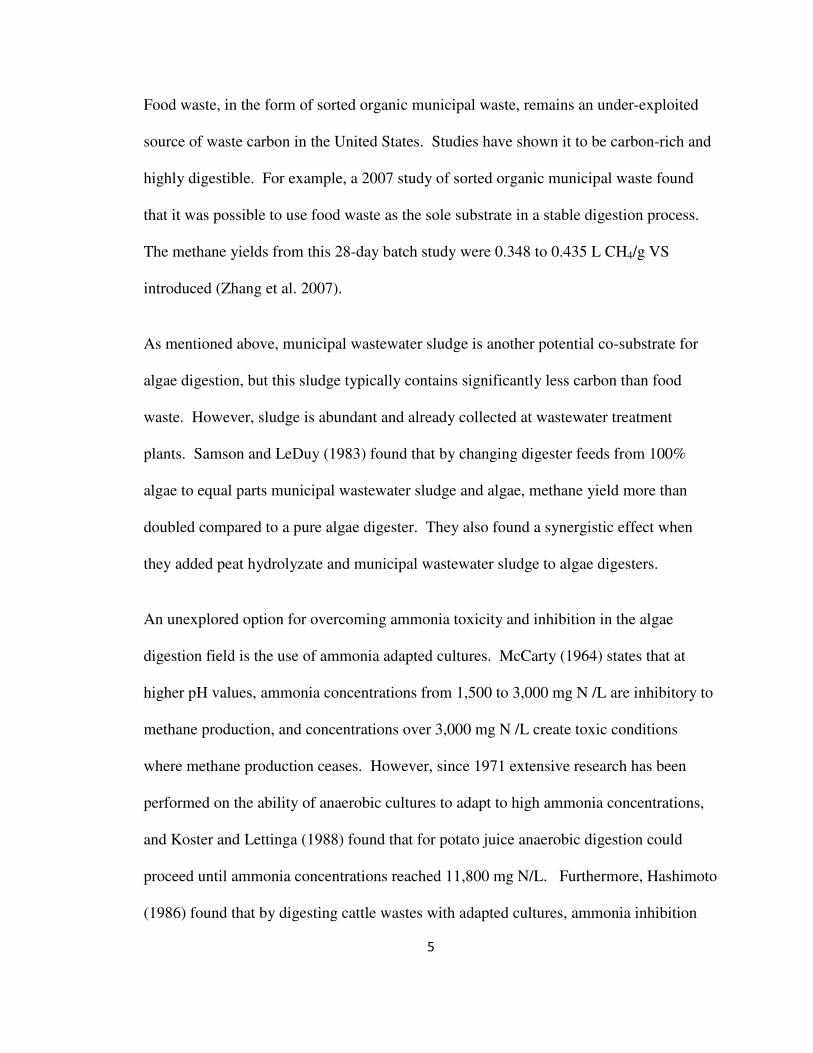
Food waste, in the form of sorted organic municipal waste, remains an under-exploited
source of waste carbon in the United States. Studies have shown it to be carbon-rich and
highly digestible. For example, a 2007 study of sorted organic municipal waste found
that it was possible to use food waste as the sole substrate in a stable digestion process.
The methane yields from this 28-day batch study were 0.348 to 0.435 L CH4/g VS
introduced (Zhang et al. 2007).
As mentioned above, municipal wastewater sludge is another potential co-substrate for
algae digestion, but this sludge typically contains significantly less carbon than food
waste. However, sludge is abundant and already collected at wastewater treatment
plants. Samson and LeDuy (1983) found that by changing digester feeds from 100%
algae to equal parts municipal wastewater sludge and algae, methane yield more than
doubled compared to a pure algae digester. They also found a synergistic effect when
they added peat hydrolyzate and municipal wastewater sludge to algae digesters.
An unexplored option for overcoming ammonia toxicity and inhibition in the algae
digestion field is the use of ammonia adapted cultures. McCarty (1964) states that at
higher pH values, ammonia concentrations from 1,500 to 3,000 mg N /L are inhibitory to
methane production, and concentrations over 3,000 mg N /L create toxic conditions
where methane production ceases. However, since 1971 extensive research has been
performed on the ability of anaerobic cultures to adapt to high ammonia concentrations,
and Koster and Lettinga (1988) found that for potato juice anaerobic digestion could
proceed until ammonia concentrations reached 11,800 mg N/L. Furthermore, Hashimoto
(1986) found that by digesting cattle wastes with adapted cultures, ammonia inhibition
6
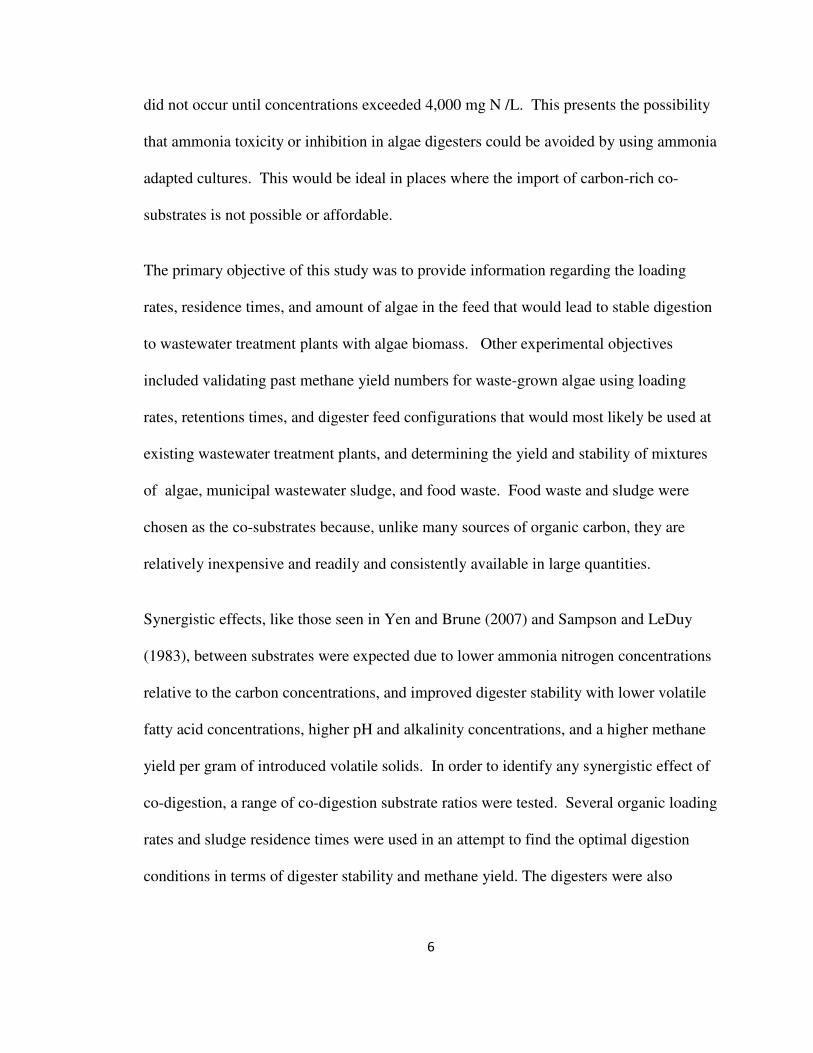
did not occur until concentrations exceeded 4,000 mg N /L. This presents the possibility
that ammonia toxicity or inhibition in algae digesters could be avoided by using ammonia
adapted cultures. This would be ideal in places where the import of carbon-rich co-
substrates is not possible or affordable.
The primary objective of this study was to provide information regarding the loading
rates, residence times, and amount of algae in the feed that would lead to stable digestion
to wastewater treatment plants with algae biomass. Other experimental objectives
included validating past methane yield numbers for waste-grown algae using loading
rates, retentions times, and digester feed configurations that would most likely be used at
existing wastewater treatment plants, and determining the yield and stability of mixtures
of algae, municipal wastewater sludge, and food waste. Food waste and sludge were
chosen as the co-substrates because, unlike many sources of organic carbon, they are
relatively inexpensive and readily and consistently available in large quantities.
Synergistic effects, like those seen in Yen and Brune (2007) and Sampson and LeDuy
(1983), between substrates were expected due to lower ammonia nitrogen concentrations
relative to the carbon concentrations, and improved digester stability with lower volatile
fatty acid concentrations, higher pH and alkalinity concentrations, and a higher methane
yield per gram of introduced volatile solids. In order to identify any synergistic effect of
co-digestion, a range of co-digestion substrate ratios were tested. Several organic loading
rates and sludge residence times were used in an attempt to find the optimal digestion
conditions in terms of digester stability and methane yield. The digesters were also
7
inoculated with ammonia adapted cultures from a wastewater treatment plant in order to
determine the effect of adapted cultures on ammonia inhibition and methane yield.
The purpose of this work was to determine the optimal mixture of algae, municipal
wastewater sludge, and food waste to improve the methane yield and process stability of
algae digestion. Additionally, four organic loading rates and two hydraulic residence
times were tested. The organic loading rates used in this experiment were low ranging
from 1-5.5 g VS/L-d. While stable digestion could possibly be maintained at higher
organic loading rates, it would most likely require frequent addition of alkalinity to
maintain pH levels in the optimum region and prevent digester upset. Adding frequent
doses of alkalinity may be unpractical and uneconomical in most algae digestion
situations, therefore, the organic loading rates and residence times investigated in this
study were only those that resulted in stable digestion.
From the data these experiments produced, two models were developed: an extended
model that describes the results of the experiment and a compact model using the
variables with the strongest p-values from the extended model. The compact model
might be used by wastewater treatment facilities that produce algae biomass to determine
the optimum digestion conditions for methane yield and digester stability. Information
on the potential to scale-up algae digestion at the facility level is described in a
companion thesis (Heimel 2010).
There are still many unanswered questions and technology gaps in the field of algae
digestion such as an economical and energy efficient ways to access carbon trapped
8
within and behind the algae cell walls. In addition, the demand for algae digestion
technologies is increasing and is important to potential future algae liquid biofuel
production, which is likely to depend on the effectiveness of digesting cell debris after
cell disruption for lipid extraction and the recycling of nutrients back to algae ponds
through the digestion process (Golueke et al. 1957, Lundquist et al. 2010).
9
METHODS
OVERVIEW OF EXPERIMENTS
Two primary experiments were performed in 1-L laboratory digester flasks. In the first
experiment, eight digesters were fed mixtures of algae and municipal wastewater sludge.
In the second experiment, ten digesters were fed mixtures of algae, sludge, and food
waste and several organic loading rates and residence times were tested. The first
experiment was called Experiment 1 and the Digesters 1.1-1.2, and 1.5-1.10 and the
second experiment was called Experiment 2 and the Digesters 2.1-2.10.
To provide consistent feed characteristics, the sludge and food waste were each collected
in a single batch, homogenized, and frozen. Biomass from wastewater treatment ponds
contains a mix of algae, bacteria, and organic detritus, but this mixture will be referred to
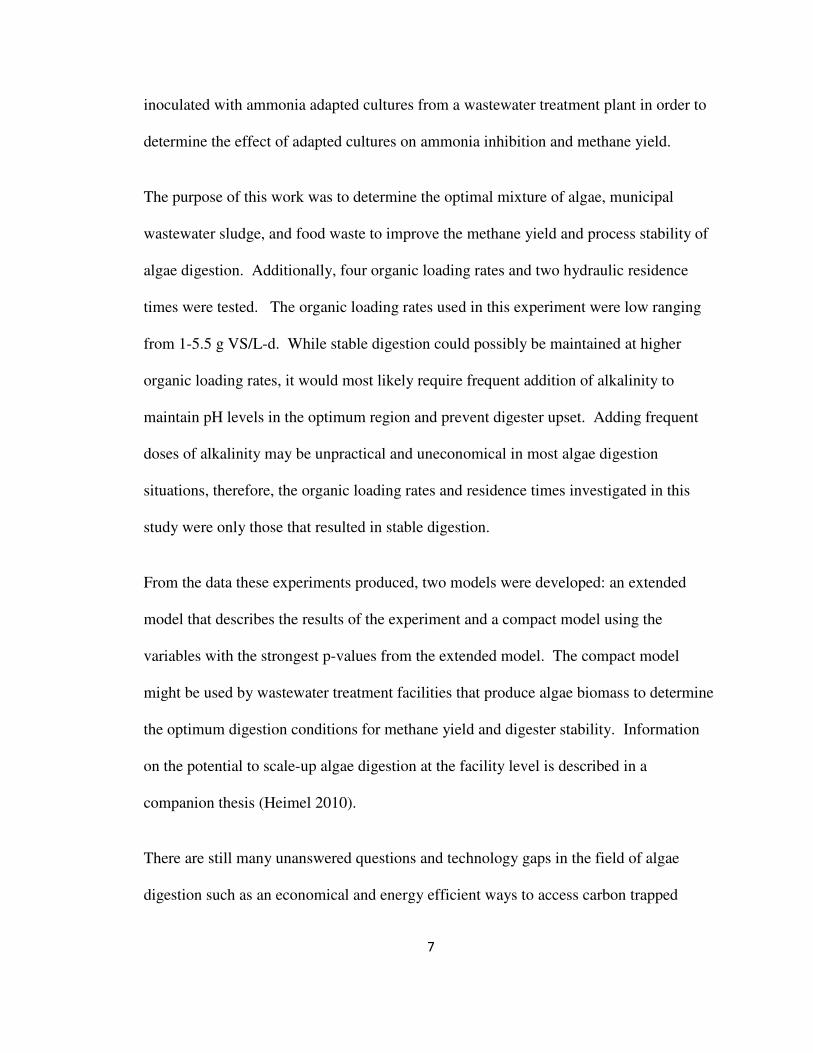
as algal biomass or algae in this paper. Microscopic examination indicated that the
biomass was predominantly algae cells (Figure 1).
Figure 1: The primary species present in the algae biomass was chodatella, shown in the picture on the far right. Other algae species present in the algae biomass included chlorella, anacystis, euglena, ulothrix, ankistrodesmus, pediastrum, zygnema, scenedesmus, oocystis, schizothrix, closterium, cyclotella, fragilaria, micractinium, oscillatoria, and spirogyra.

10
COLLECTION AND STORAGE OF ALGAE
The source of the algae biomass was the 29.5 MGD capacity City of Sunnyvale Water
Pollution Control Plant at the southern end of San Francisco Bay, California. The
Sunnyvale treatment process begins with primary settling followed by 440 acres of
oxidation ponds, which provide secondary wastewater treatment and a habitat for growth
of microalgae. From the oxidation ponds, the water travels to nitrifying biotowers with
plastic media and then to dissolved air flotation tanks. At the dissolved air flotation tanks
coagulating cationic polymer (Clarifloc WE-717 Polydyne Inc., RiceBoro Georgia) is
dosed into the wastewater at concentrations of 4-8 ppm with an average dose of 4.2 ppm,
and the algae biomass “float” is skimmed off the water surface in the tank (Da Sa J., pers.
comm. 2009). The float collected for the experiments was then gravity separated in 20-L
plastic pails for 12 hours during overnight transport. In the morning, the thickened float
was homogenized in a single batch in a plastic wheelbarrow using concrete mixing hoes.
The float was then distributed into 0.5-L plastic bags and frozen at -17˚C. The algae was
collected on July 14, 2009, and had a moisture content of 86%at the time of freezing.
COLLECTION AND STORAGE OF SLUDGE AND ADAPTED INOCULUM
The City of San Luis Obispo Water Reclamation Facility, in central California, was the
source of municipal wastewater sludge and digester inoculum. The facility uses primary
setting tanks, followed by trickling filters, secondary settling, nitrifying activated sludge,
tertiary settling, filtration, and disinfection. The sludge from primary, secondary, and
tertiary setting tanks is thickened, in a dissolved air floatation thickener (DAFT). The
primary sludge enters the DAFT at 2-3% (weight/weight) solids content, while the
11
secondary and tertiary sludges enter at 1% solids. Ferric chloride is added in the DAFT
tank, and the mixed sludge exits the DAFT tank at 4-6% solids. From the DAFT, the
float sludge drains into the first of a series of three anaerobic digesters operated around
32.2 oC and with an average total hydraulic residence time of 60 days. The feed sludge
used in the present experiments was collected from the float effluent pipe of DAFT, and
the inoculum for the experimental digesters was collected from the effluent of the second
digester.
The DAFT float sludge was frozen at -17˚C with a moisture content of 94% in 0.5-L
plastic bags. It contained a mixture of about 35% primary sludge mass, with the
remainder being a mixture of secondary and tertiary sludges originating from the trickling
filter and nitrifying activated sludge basins, respectively. The digesters of the first
experiment were inoculated with municipal digester sludge (36%) and digester contents
from previous algae digestion experiments (64%). Digesters of second experiment were
inoculated with sludge from the digesters of the first experiment (91%) and digester
sludge (9%). The inoculum was only used at the beginning of the experiment to provide
adapted anaerobic and methanogenic cultures to the digesters, so it was not stored or
frozen.
COLLECTION AND STORAGE OF FOOD WASTE
The food waste came from the food service operation of the California Polytechnic State
University, San Luis Obispo. The food waste consisted of equal parts by mass of post-
consumer wastes from a lunchroom, kitchen wastes, which consisted of unused and
uneaten food from the cafeteria and food preparation wastes, which consisted primarily
12
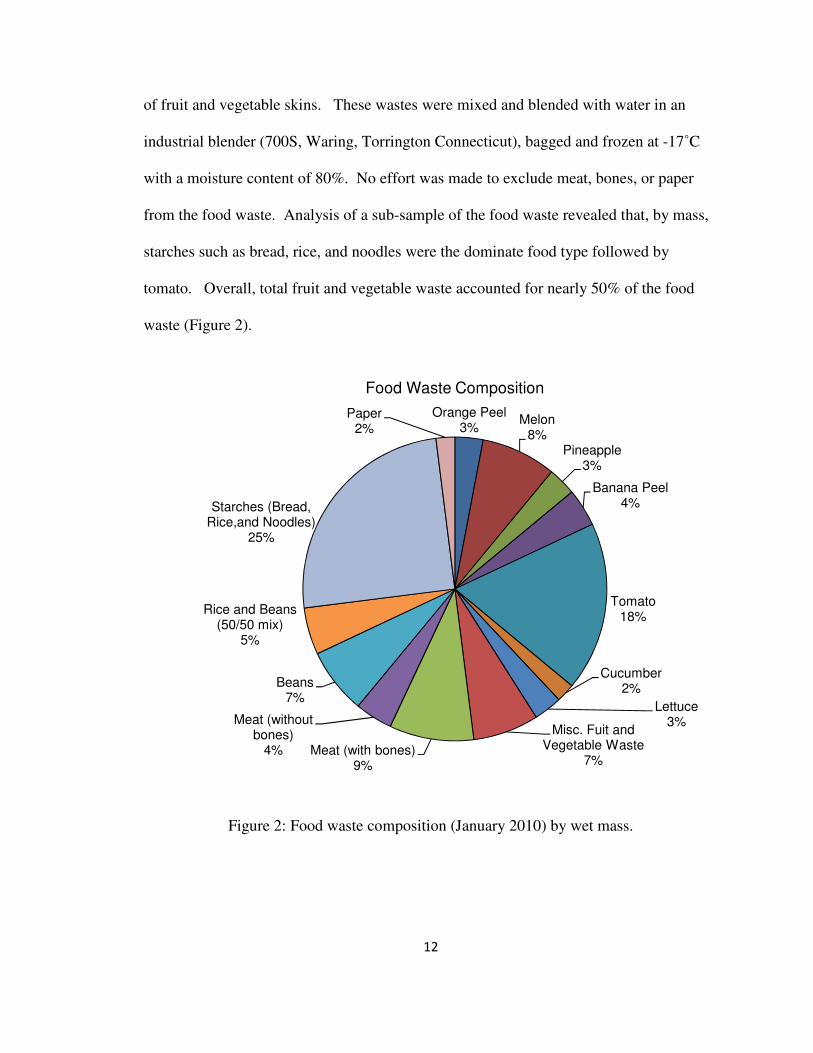
of fruit and vegetable skins. These wastes were mixed and blended with water in an
industrial blender (700S, Waring, Torrington Connecticut), bagged and frozen at -17˚C
with a moisture content of 80%. No effort was made to exclude meat, bones, or paper
from the food waste. Analysis of a sub-sample of the food waste revealed that, by mass,
starches such as bread, rice, and noodles were the dominate food type followed by
tomato. Overall, total fruit and vegetable waste accounted for nearly 50% of the food
waste (Figure 2).
Figure 2: Food waste composition (January 2010) by wet mass.
Orange Peel3%
Melon8%
Pineapple 3%
Banana Peel4%
Tomato18%
Cucumber 2%
Lettuce 3%
Misc. Fuit and Vegetable Waste
7%Meat (with bones)
9%
Meat (without bones)
4%
Beans7%
Rice and Beans (50/50 mix)
5%
Starches (Bread, Rice,and Noodles)
25%
Paper2%
Food Waste Composition

13
DIGESTER SET-UP
Each laboratory digester was a 2-L Erlenmeyer flask with a Size 13 butyl rubber stopper
with two holes—one for feeding and withdraw and one for biogas passage. Gas
collection for each digester was measured by inverting a 2-L plastic graduated cylinder
with graduation marks every 20-mL with a 7.2-cm inner diameter into a clear PVC,
liquid-filled tube with a 10-cm inner diameter (Figure 3). The liquid in the tube was 5%
H2SO4 saturated with NaCl to prevent dissolution of biogas constituents. This cylinder
was also outfitted with a sampling port with rubber septa allowing the biogas to be
sampled with a gas-tight syringe. Digester feeding was accomplished using a 60-mL
plastic syringe connected by tubing through the rubber stopper. Mixing was performed
by hand before and after feeding by shaking each digester for 30 sec by gripping the neck
of the flask and moving it in a circular motion. A 25-mm long TFE-coated stir bar in
each bottle ensured good agitation. Electric stirrers were not used.
14
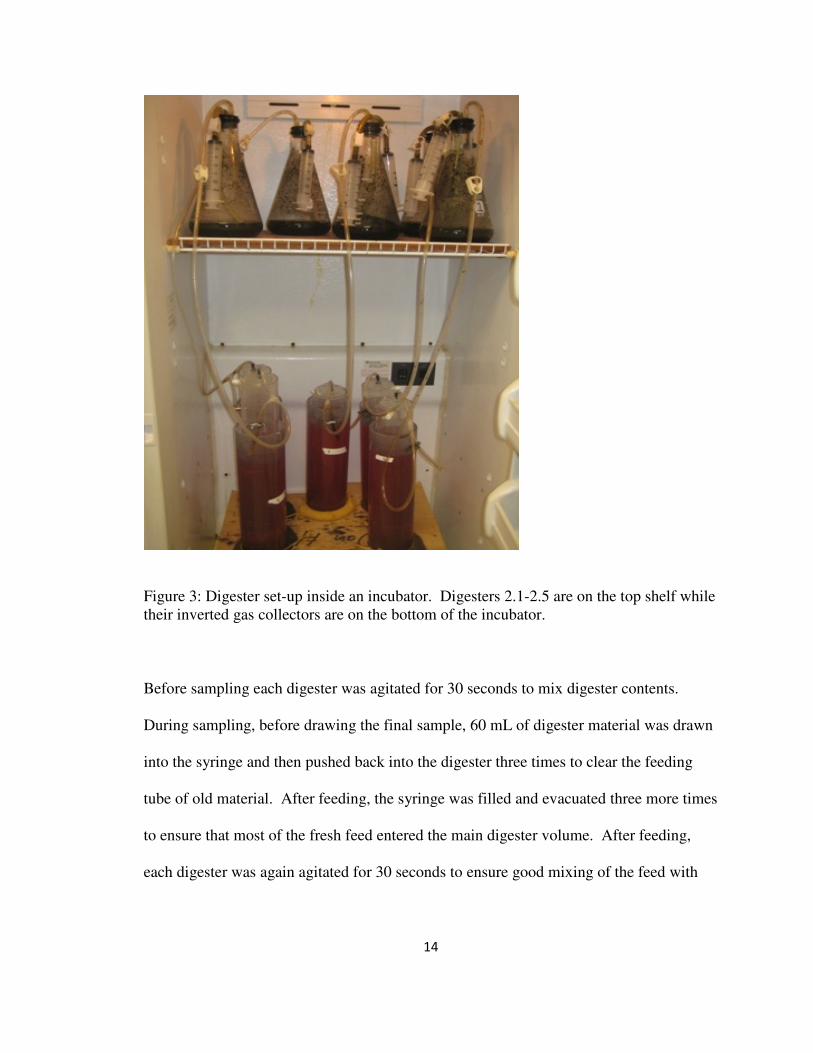
Figure 3: Digester set-up inside an incubator. Digesters 2.1-2.5 are on the top shelf while their inverted gas collectors are on the bottom of the incubator.
Before sampling each digester was agitated for 30 seconds to mix digester contents.
During sampling, before drawing the final sample, 60 mL of digester material was drawn
into the syringe and then pushed back into the digester three times to clear the feeding
tube of old material. After feeding, the syringe was filled and evacuated three more times
to ensure that most of the fresh feed entered the main digester volume. After feeding,
each digester was again agitated for 30 seconds to ensure good mixing of the feed with
15
the digester contents. The digesters were placed in incubators set at 37.5 oC, the same
temperature used at the full-scale Sunnyvale Water Pollution Control Plant digesters.
DIGESTER OPERATION
The different digestion variables that were explored in Experiments 1 and 2 included feed
content (ratios of algae, sludge and food), organic loading rate, and residence time. In
Experiment 1, the algae and sludge ratio in the feed was the only variable tested. The
organic loading rate and residence time were set at 2 g VS/L-d and 20 days for all eight
digesters (Table 1). In Experiment 2, organic loading rate, residence time, and percent
algae, sludge and food waste in the feed were the variables tested (Table 2). Digester 2.10
was set at a residence time of 40 days to test digestion stability and yield with a longer
residence time. Four digesters were given feed containing 40% algae, 50% food waste,
and 10% sludge at three different organic loading rates. An additional digester was given
feed with 83.4% food waste and 16.6% sludge to provide digestion data without algae at
a loading rate of 2 g VS/L-d. Four organic loading rates of 1, 2, 4, and 5.5 g VS/L-day
were used, and several algae, food waste, and sludge ratios in the feed were tested (Table
2).
16
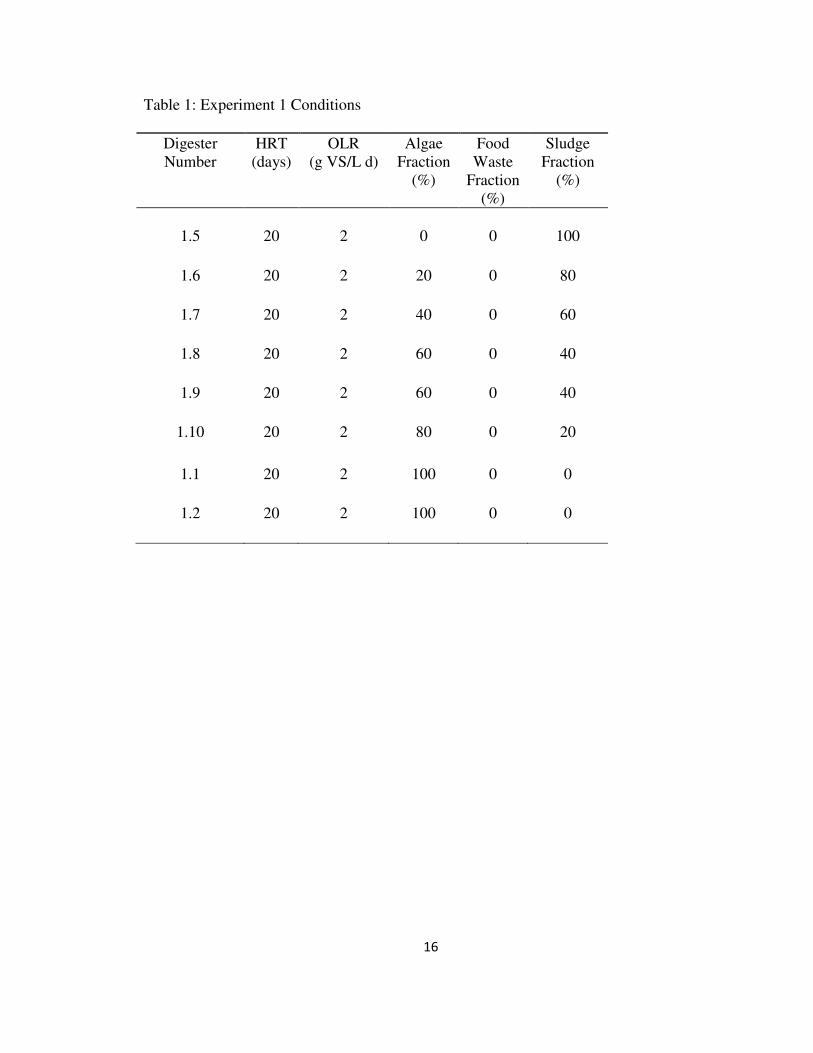
Table 1: Experiment 1 Conditions
Digester Number
HRT (days)
OLR (g VS/L d)
Algae Fraction
(%)
Food Waste
Fraction (%)
Sludge Fraction
(%)
1.5 20 2 0 0 100
1.6 20 2 20 0 80
1.7 20 2 40 0 60
1.8 20 2 60 0 40
1.9 20 2 60 0 40
1.10 20 2 80 0 20
1.1 20 2 100 0 0
1.2 20 2 100 0 0
17
Table 2: Experiment 2 Conditions
Digester Number
HRT (days)
OLR (g VS/L d)
Algae Fraction
(%)
Food Waste
Fraction (%)
Sludge Fraction
(%)
2.1 20 4 100 0 0
2.2 20 4 100 0 0
2.3 20 2 80 0 20
2.4 20 4 80 0 20
2.5 20 2 40 50 10
2.6 20 4 40 50 10
2.7 20 4 40 50 10
2.8 20 5.5 40 50 10
2.9 20 2 0 83.4 16.6
2.10 40 1 80 0 20
ANALYTICAL PROCEDURES
Analytical procedures included analysis of the biogas composition, solids determination
with percent total solids and volatile solids destruction, volatile fatty acids (VFA)
concentration, pH, alkalinity, total ammonia nitrogen (NH3+NH4+) and C:N ratio. Biogas
composition was determined weekly using a gas chromatograph, and the volume of gas
was measured daily. These two measurements were used to determine methane yield.
Volatile solids destruction was measured weekly and used for mass balances. VFA, pH,
alkalinity, and ammonia nitrogen concentrations were used to determine digester stability
and assess digester health. VFA and ammonia nitrogen were measured weekly, while
alkalinity was measured every other day, and the pH was measured daily. The C:N ratio
18
was measured weekly and was used in mass balance analysis. The daily volume of
digester effluent available determined the frequency of analytical tests.
BIOGAS COMPOSITION
The methane concentration in the biogas was determined using a gas chromatograph (SRI
8610, Torrance California) with a thermal conductivity detector and a six-foot concentric
packed column that contains an inner and outer column (Alltech CTR I, Deerfield
Illinois). The outer column consisted of a 6.35-mm diameter activated molecular sieve,
and the inner column consisted of an eighth of an inch diameter tube filled with a
proprietary porous polymer mixture. Ultra-high purity helium was used as the carrier gas
at a flow rate of 16 mL/min. The operating temperature was 45˚C, and each injected
sample contained a gas volume of 1 mL. The sample run time was 17 minutes. The gas
chromatograph was located in the same room as the digesters and sampling consisted of
removing a 1-mL sample from the septa on the gas collector and walking the sample 5
meters to the gas chromatograph where it was promptly injected.
SOLIDS CONCENTRATION
Solids concentrations were measured as mass per volume using a 3-mL syringe to take a
3-mL subsample of digester feed or effluent, in an altered form of Standard Method
2540B (APHA 2005). Samples were dried to a constant weight at 105 oC and then ashed
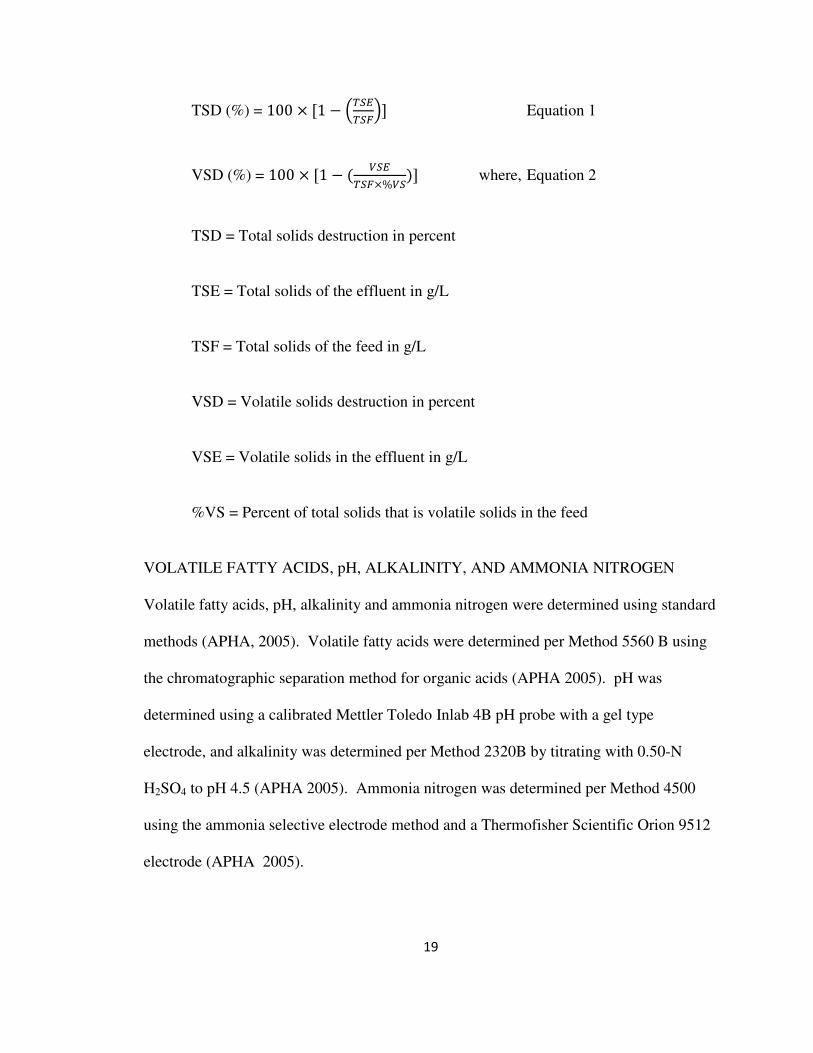
at 525 oC. Total solids and volatile solids destruction in the digesters was calculated
using the following equations:
19
TSD (%) = 100 � �1 � ������� Equation 1
VSD (%) = 100 � �1 � �����%���� where, Equation 2
TSD = Total solids destruction in percent
TSE = Total solids of the effluent in g/L
TSF = Total solids of the feed in g/L
VSD = Volatile solids destruction in percent
VSE = Volatile solids in the effluent in g/L
%VS = Percent of total solids that is volatile solids in the feed
VOLATILE FATTY ACIDS, pH, ALKALINITY, AND AMMONIA NITROGEN
Volatile fatty acids, pH, alkalinity and ammonia nitrogen were determined using standard
methods (APHA, 2005). Volatile fatty acids were determined per Method 5560 B using
the chromatographic separation method for organic acids (APHA 2005). pH was
determined using a calibrated Mettler Toledo Inlab 4B pH probe with a gel type
electrode, and alkalinity was determined per Method 2320B by titrating with 0.50-N
H2SO4 to pH 4.5 (APHA 2005). Ammonia nitrogen was determined per Method 4500
using the ammonia selective electrode method and a Thermofisher Scientific Orion 9512
electrode (APHA 2005).
20
C:N RATIO
The C:N ratio was determined using a Vario-Max Elementar Carbon and Nitrogen
Analyzer using NIST certified tomato leaves as the carbon standard and glutamic acid as
the nitrogen standard. These standards bracketed the C:N ratio of the digester feeds, with
a C:N ratio of 5:1 for glutamic acid and 12:1 for tomato leaves. On a weekly basis, 20-
mL samples of digester feed and effluent were prepared by adding concentrated sulfuric
acid to the sample until the pH dropped below 4.5, which ensured that ammonia did not
volatilize during drying of the samples. Each sample was then dried at 55oC for three
days and ground into a powder with a mortar and pestle. Each sample was then stored in
a desiccator until enough samples accumulated to fill the instrument auto sampler (i.e.,
sixty samples). Using catalytic tube combustion at 1200oC, the Variomax oxidized
carbon and nitrogen compounds. Specific absorption columns then separated C and N
prior to being analyzed in a thermal conductivity detector, which was used to quantify the
carbon and nitrogen in each sample.
MODEL DEVELOPMENT
The multiple regression models were developed using the linear least squares method
using Minitab 16 (Minitab, State College Pennsylvania). Descriptive models were
developed to explain, in graphical and equation form, the results of Experiments 1 and 2.
The models characterize digester results such as yield, volatile solids destruction, and
ammonia nitrogen, alkalinity, and volatile fatty acids concentrations for digestion of
algae, or algae and sludge, or algae sludge and food waste. Extended and a compact
descriptive models were developed. The extended models included all parameters
21
including those that were not statistically significant (p > 0.05), given the data available.
Using backwards elimination, the compact models only included parameters that were
statistically significant (p < 0.05). The model is not intended for characterizing digesters
fed food waste alone. The models describe only the limited conditions used in the present
study.
Different digesters had diverse ranges of variability so steady state had to be defined
using standard deviations. The data used in model development were from stable
digestion periods defined as the contiguous time period when the following conditions
were met: (1) solids concentrations varied less than one standard deviation from the mean
solids concentration, (2) ammonia nitrogen concentrations and volatile fatty acid
concentrations varied less than two standard deviations from their mean value, and (3) for
biogas production and yield, pH, and alkalinity, no more than one value fell outside two
standard deviations of their mean. The mean values for comparison were determined by
averaging all the data for each constituent after 22 days of operation, which was the
sample date collected nearest the end of the first residence time. For duplicate digesters
the steady state periods selected were those that overlapped in time, with the allowance of
one week before or after the overlapping period in order to increase the number of
included data points.
Periods outside the selected steady state periods used for the models usually exhibited
stable digestion with the pH remaining in the healthy range of 6.6-7.6 defined by
McCarty (1964), and continued production of biogas without significant dips that may
have indicated process upset. Generally, the stable digestion periods exceeded the
22
selected steady state period used in the model, and for most digesters encompassed the
entire digester operation period.
An unstable digester was a digester that required intervention to prevent culture crash
(i.e., a pH that dropped below 6.5 and/or a significant decrease in biogas production).
Other characteristics of impending instability or culture crash include decreasing pH and
alkalinity, an increase in volatile fatty acids, and a decrease in biogas production.
Methods of intervention included adding alkalinity in the form of NaOH and re-
inoculating the digester with San Luis Obispo water Reclamation Facility digester three
effluent. In order to record natural digestion variations, and observe culture crash
intervention was not performed until the digester stopped producing biogas. The periods
of operationally unstable operation were not included in the model data set.
23
RESULTS
In most of the digesters, stable digestion was reached at between 1.5 and 3 residence
times following the start of operation. In most digesters, solids concentration reached
steady state later than ammonia, volatile fatty acids, pH, alkalinity, and methane yield.
This delay in solids concentration steady state was pronounced in digesters with high
algae content in their feed and high organic loading rates. Although digesters fed 100%
algae did not crash, their output variables generally varied more from measurement to
measurement than digesters fed less or no algae. Higher organic loading rates also lead
to higher variability between measurements.
Figures 4 through 12 are provided as examples of digester response variable values.
Model steady state periods are shown for each digester. Digester 2.2 was chosen as an
example because it was fed 100% algae at a high loading rate of 4 g VS/ L-d. Digester
1.5 was fed 100% sludge at a rate of 2 g VS/L-d and was chosen to provide comparison
between sludge and algae digestion. Digester 2.8 was fed 50% food waste, 40% algae
and, 10% sludge at a rate of 5.5 g VS/L-d and was chosen to show a digester with a high
organic loading rate that caused process instability.
Returning to Digester 2.2 (Figure 4), it showed the characteristics of a stable digester,
with relatively stable values over the duration of the experiment for alkalinity, pH,
volatile fatty acids, and ammonia nitrogen, following a start-up period lasting two
residence times (40 days). Over the duration of the experiment Digester 2.2 exhibited the
characteristics of a healthy digester. For the same digester, after one residence time or 20
days, the biogas production and methane yield values appear to have stabilized (Figure
24
5). The dip in biogas production from about Day 45 to Day 60 (Figure 5) was likely
caused by a slow and steady decrease in volume caused by inadvertent drips and small
spills during feeding, which also occurred in Digesters 2.1, 2.1 2.4, and 2.6. This 10-15%
decrease in the total digester volume caused the organic loading rate to increase to the
point that it apparently caused a slight drop in pH, alkalinity, and biogas production.
Digester health parameters stabilized after the volume was increased with algae feed to
the intended 0.5 L. The problem was avoided for the remainder of the experiment by
more careful feeding and adding a few extra milliliters of feed each time digested
material was removed to make up for any drips.
For Digester 2.2 effluent, solids concentration reached relative stability after 2.4
residence times or 48 days (Figure 6). Interestingly, solids concentration for all digesters
being fed 100% algae continued to increase, and at the end of three hydraulic residence
times, still showed a slight increase in solids concentration from week to week (Figure 6).
This long term solids accumulation indicates the low extent of algal volatile solids
destruction.
25
Figure 4: Digester effluent characteristics over time for Digester 2.2 (100% algae feed at 4 g VS/L-d and a 20-day residence time) are shown as an example of the data collected for all digesters in the study. Using the criteria described in this text, the model steady state period for this digester was determined to be Days 62-83. The decreases in pH, and alkalinity during Days 45 through 60 were caused by inadvertent declining of the digester volume.
5.0
5.5
6.0
6.5
7.0
7.5
8.0
8.5
9.0
0
2000
4000
6000
8000
10000
12000
14000
16000
0
10
20
30
40
50
60
70
80
90
10
0
11
0
pH
Alk
alin
ity,
VF
A, A
mm
on
ium
-N C
on
ce
ntr
atio
ns (
mg/L
)
Day
Alkalinity
VFA
Ammonium
pH
Model Steady State Period
26
Figure 5: Digester 2.2 (100% algae feed at 4 g VS/L-d and a 20-day residence time) biogas production and methane yield over time. The dip in biogas production from Day 40-55 was probably caused by the gradually decreasing digester volume described in the text. This dip at Day 55 led to exclusion of these data using the steady state selection criteria. Additionally, many other yield data points beyond the model steady state period met the criteria but were excluded because solids concentrations or digester effluent characteristics were not at steady state at that time.
0
100
200
300
400
500
600
700
800
900
1000
0
500
1000
1500
2000
2500
3000
3500
4000
4500
0
10
20
30
40
50
60
70
80
90
10
0
11
0
Me
tha
ne
Yie
ld (
mL
/g V
S in
tro
du
ce
d)
Bio
ga
s P
rod
uctio
n (
mL
/L o
f D
ige
ste
r)
Day
Biogas
Yield
Model Steady State Period
27
Figure 6: Digester 2.2 (100% algae feed at 4 g VS/L-d and a 20-day residence time) solids data. Total solids concentration in the effluent appeared to stabilize around Day 48.
The most consistently stable digester for all parameters was Digester 1.5, which acted as
the sludge-only control digester. This sludge control digester was fed 100% sludge at a
rate of 2 g VS/L-day with a residence time of 20 days. Alkalinity, pH, volatile fatty
acids, and ammonia nitrogen concentrations stabilized within half a residence time, and
biogas production and methane yield stabilized within one residence time (Figure 7 and
8). Over the duration of the experiment, total solids concentration in the digester
decreased but experienced less pronounced decreases at 1.5 residence times (Figure 9).
Generally, this digester was the most robust and stable digester.
10
20
30
40
50
60
70
80
90
100
10
15
20
25
30
35
40
45
50
55
60
65
70
75
0 10 20 30 40 50 60 70 80 90 100 110
Pe
rce
nt V
ola
tile
So
lids D
estr
uctio
n
To
tal S
olid
s O
ut (g
/L)
Day
Total Solids (g/L)Percent VS Destruction
Model Steady State Period
28
Figure 7: Digester effluent characteristics over time for Digester 1.5 (100% sludge feed at 2 g VS/L-d and a 20-day residence time) are shown as an example of the most digester over time. In this case, the model steady state period was determined to be Day 29-50.
5.0
5.5
6.0
6.5
7.0
7.5
8.0
8.5
9.0
0
2000
4000
6000
8000
10000
12000
14000
16000
0
10
20
30
40
50
60
pH
Alk
alin
ity,
VF
A, A
mm
on
ium
-N C
on
ce
ntr
atio
ns
(mg/L
)
Day
Alkalinity
VFA
Ammonium
pH
Model Steady State Period
29
Figure 8: Digester 1.5 (100% sludge feed at 2 g VS/L-d and a 20-day residence time) biogas production and methane yield over time. This digester showed the least variation for all measurements over time.
0
100
200
300
400
500
600
700
800
900
1000
0
500
1000
1500
2000
2500
3000
3500
4000
4500
0
10
20
30
40
50
60
Me
tha
ne
Yie
ld (
mL
/g V
S in
tro
du
ce
d)
Bio
ga
s P
rod
uctio
n (
mL
/L o
f D
ige
ste
r)
Day
Biogas
Yield
Model Steady State Period
30
Figure 9: Digester 1.5 (100% sludge feed at 2 g VS/L-d and a 20-day residence time) solids data. Total solids concentration in the digester effluent decreased slightly for the duration of the experiment while volatile solids destruction increased slightly. This is in direct contrast to the algae digesters; however, the slope of decreasing total solids is significantly less than the slope of increasing total solids in the algae digesters.
Digester 2.8 was an unstable digester in terms of volatile fatty acids, pH, alkalinity,
biogas production, and to lesser extent solids over the duration of the experiment (Figures
10, 11, 12). Digester 2.8 was fed 40% algae, 10% sludge, and 50% food waste at a rate
of 5.5 g VS/L-day with a residence time of 20 days. The high organic loading rate of 5.5
g VS/L-day was probably the primary factor that caused digester instability. This was
the highest organic loading used in the entire experiment and was predicted to be
unstable. The high proportion of food waste in the feed gave the digester a relatively
high C:N ratio, so ammonia inhibition most likely did not contribute to instability.
10
20
30
40
50
60
70
80
90
100
10
15
20
25
30
35
40
45
50
55
60
65
70
75
0 10 20 30 40 50 60
Pe
rce
nt V
ola
tile
So
lids D
estr
uctio
n
To
tal S
olid
s O
ut (g
/L)
Day
TS (g/L)
Percent VS Destruction
Model Steady State Period
31
In Digester 2.8, pH, alkalinity, volatile fatty acids, and ammonia nitrogen concentrations
did not remain stable (Figure 10). After the first residence time until Day 47 the digester
exhibited generally stable characteristics; however, after this period the pH dropped and
the volatile fatty acid concentration increased to over 10,000 mg/L. When the digesters
stopped producing biogas around Day 60, the digester was re-inoculated with SLOWRF
Digester 3 effluent, and the pH was adjusted with sodium hydroxide to a pH of 7.0.
Despite a short period of recovery, the pH dropped to below 6.5 by the end of the
experiment, leading to poor methane production. The high but steady ammonia nitrogen
concentration was similar to the concentrations in other healthy digesters (Digesters 2.1,
2.2), which indicates that ammonia inhibition was probably not a major factor in the
instability. The high concentration of volatile fatty acids indicated that organic loading
was most likely the major cause of instability.
Despite the relatively instable operational parameters, several periods of prolonged stable
biogas production were observed for Digester 2.8 (Figure 11). From Day 41 to Day 55,
the biogas production and methane yield were relatively stable. Decreases in biogas
production corresponded well with decreases in pH, but only once the pH measured less
than 6.5. The digester performed fairly well in terms of biogas production and yield as
long as the pH remained above 6.5; therefore, this digester could be expected to perform
stably with a high yield with continual pH adjustment and alkalinity addition.
Additionally, the solids concentration varied much less over the duration of the
experiment when compared to pH, alkalinity, and methane yield (Figure 12).
32
Over the entire experiment, only Digester 2.8 required re-inoculation. Data from the
unstable period and from several weeks following the re-inoculation period were not used
in the model. Digester 2.8 was revived with re-inoculation and base addition in order to
confirm digester instability and failure, which was most likely caused by a loading rate
that lead to volatile fatty acid accumulation and toxicity. Revival also showed that the
digester might be maintained with regular doses of alkalinity; however, regular doses of
alkalinity were not added to this digester so yield numbers do not necessarily reflect
maximum digester yields. Despite long periods of instability, a steady state period was
identified as per the model steady state criteria.
33
Figure 10: Digester effluent characteristics over time for Digester 2.8 (40% algae, 50% food waste, and 10% sludge feed at 5.5 g VS/L-d and a 20-day residence time). In this case, the model steady state period was determined to be Day 41-55. Although this steady state period shows a steadily decreasing pH and high volatile fatty acids values the alkalinity values remain fairly stable and the values meet the steady state criteria. Although earlier periods show more stable pH and volatile fatty acids, the period after the first residence time was particularly unstable in terms of biogas production and yield (Figure 10).
5.0
5.5
6.0
6.5
7.0
7.5
8.0
8.5
9.0
0
2000
4000
6000
8000
10000
12000
14000
16000
0
10
20
30
40
50
60
70
80
90
10
0
11
0
pH
Alk
alin
ity,
VF
A, A
mm
on
ium
-N C
on
ce
ntr
atio
ns
(mg/L
)
Day
Alkalinity
VFA
Ammonium
pH
Model Steady State Period
34
Figure 11: Digester 2.8 (40% algae, 50% food waste, and 10% sludge feed at 5.5 g VS/L-d and a 20-day residence time) biogas production and methane yield over time. The model steady state period of Day 41-55 avoids any extreme dips or peaks in biogas production and yield. By Day 60, Digester 2.8 experienced complete digester collapse, and despite the reintroduction of methanogens and a pH adjustment, the digester was unable to maintain a steady pH and biogas production for the remainder of the experiment. Continuous or semi continuous alkalinity addition would probably be needed to maintain healthy digestion with these feeds at this high loading rate.
0
100
200
300
400
500
600
700
800
900
1000
0
500
1000
1500
2000
2500
3000
3500
4000
4500
0
10
20
30
40
50
60
70
80
90
10
0
11
0
Me
tha
ne
Yie
ld (
mL
/g V
S in
tro
du
ce
d)
Bio
ga
s P
rod
uctio
n (
mL
/L o
f D
ige
ste
r)
Day
Biogas
Yield
Model Steady State Period
35
Figure 12: Digester 2.8 (40% algae, 50% food waste, and 10% sludge feed at 5.5 g VS/L-d and a 20-day residence time) solids data. The solids data reflects the digester instability with digester solids increasing and peaking right before culture crash.
INFLUENCE OF FEED COMPOSITION, ORGANIC LOADING RATE AND
RESIDENCE TIME
The multivariate linear models presented in the following sections indicate the effect of
the independent variables of fraction of algae in the feed, fraction of food waste in the
feed, organic loading rate (g VS/Ldigester-day), and hydraulic residence time on the
dependent variables of alkalinity concentration, ammonium concentration, volatile fatty
acid concentration, volumetric methane yield, percent methane in the biogas, and percent
volatile solids destruction. For all the digesters, data points for the models were chosen
by identifying intersecting periods of stable gas, solids and operational parameters per the
10
20
30
40
50
60
70
80
90
100
10
15
20
25
30
35
40
45
50
55
60
65
70
75
0 10 20 30 40 50 60 70 80 90 100 110
Pe
rce
nt V
ola
tile
So
lids D
estr
uctio
n
To
tal S
olid
s O
ut (g
/L)
Day
Total Solids (g/L)
Percent VS Destruction
Model Steady State Period
36
criteria described in the methods section. For the periods of stable digestion, all the data
points were averaged to provide a single representative value for each dependent
variable. From these models and the p-value given for each variable, compact models
were developed from variables displaying a p-value greater than 0.05. In addition, single
equation models of variables related to culture stability such as total ammonia nitrogen,
volatile fatty acids, and total alkalinity concentrations were developed.
ALGAE CONTENT
For the four digesters fed 100% algae, the methane yield ranged from 0.21-0.26 L/g VS
(Table 3). Increasing the organic loading rate in the 100% algae digesters from 2 to 4 g
VS/L-day did not result in a significant change in methane yield. The four digesters fed
80% algae had yields ranging from 0.24-0.30 L/g VSin. Digesters containing 60% algae
in the feed gave yields ranging from 0.36-0.36 L/g VSin. Digesters containing 40% algae
in the feed gave yields ranging from 0.25-0.40 L/g VSin, and 20% algae in the feed gave a
yield of 0.40 L/g VSin. Finally, the yields for the two digesters fed no algae were 0.42
and 0.68 L/g VSin. The percent of algae in the feed decreased the methane yield in a
linear fashion independent of other variables such as residence time, remaining feed
composition, and organic loading rate (Figure 13). Algae sludge co-digestion showed no
synergistic effect, as was noted in the Samson and LeDuy study (1987). The highest
methane yield was observed when there was no algae biomass in the digester feed, and
the lowest methane yield was observed when the digester feed was completely composed
of algae.
37
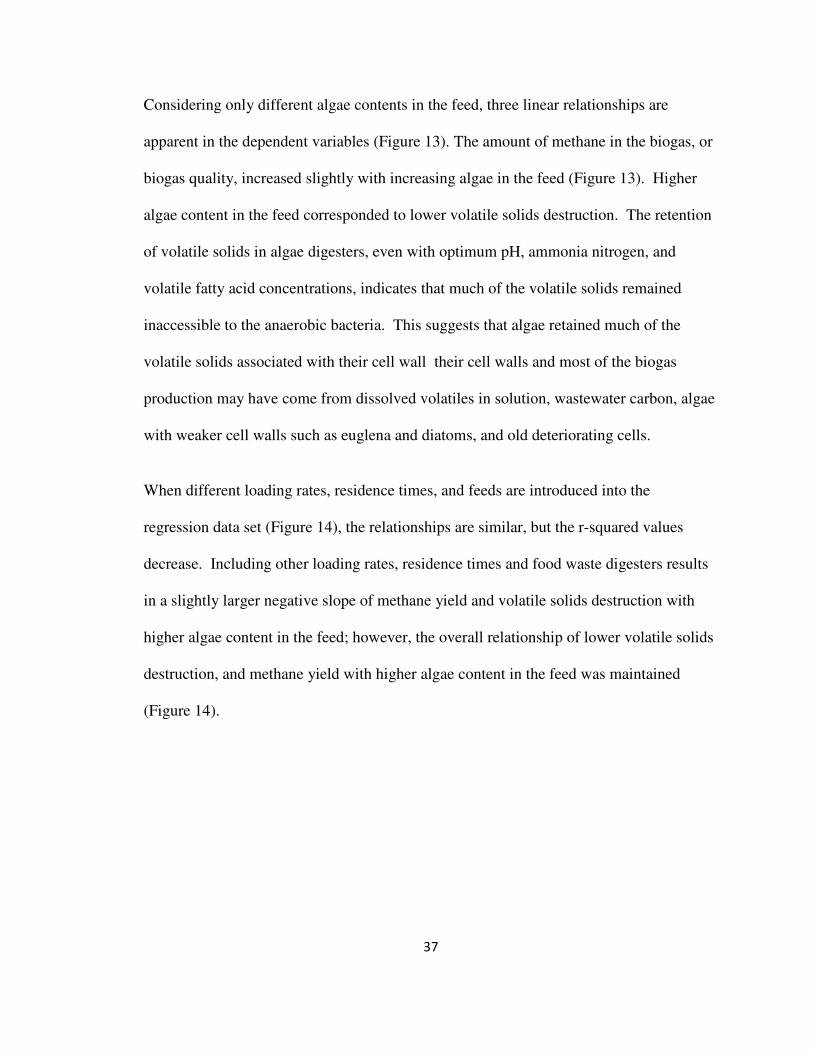
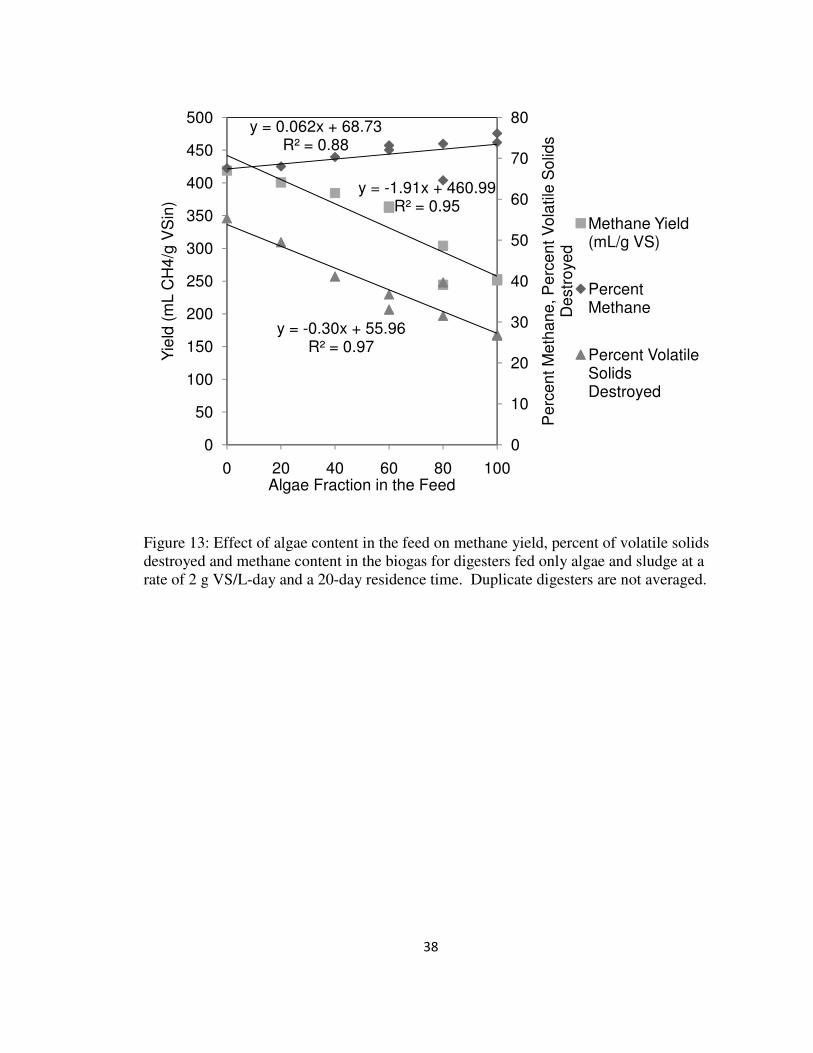
Considering only different algae contents in the feed, three linear relationships are
apparent in the dependent variables (Figure 13). The amount of methane in the biogas, or
biogas quality, increased slightly with increasing algae in the feed (Figure 13). Higher
algae content in the feed corresponded to lower volatile solids destruction. The retention
of volatile solids in algae digesters, even with optimum pH, ammonia nitrogen, and
volatile fatty acid concentrations, indicates that much of the volatile solids remained
inaccessible to the anaerobic bacteria. This suggests that algae retained much of the
volatile solids associated with their cell wall their cell walls and most of the biogas
production may have come from dissolved volatiles in solution, wastewater carbon, algae
with weaker cell walls such as euglena and diatoms, and old deteriorating cells.
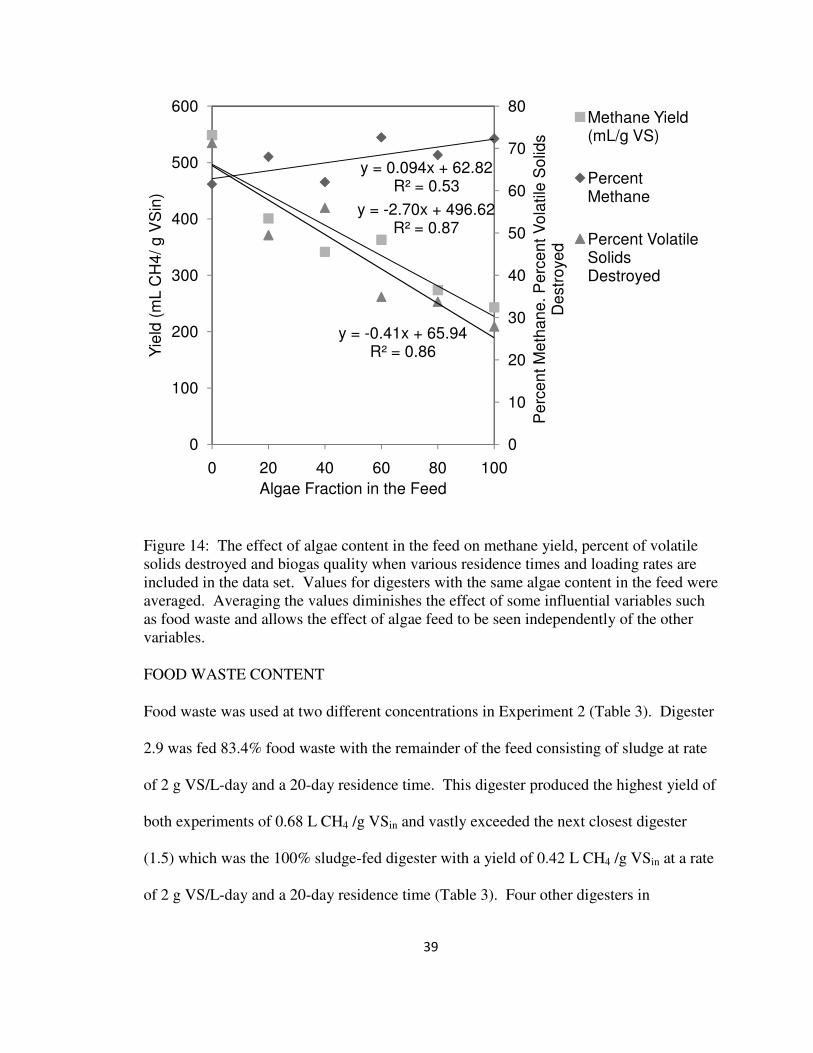
When different loading rates, residence times, and feeds are introduced into the
regression data set (Figure 14), the relationships are similar, but the r-squared values
decrease. Including other loading rates, residence times and food waste digesters results
in a slightly larger negative slope of methane yield and volatile solids destruction with
higher algae content in the feed; however, the overall relationship of lower volatile solids
destruction, and methane yield with higher algae content in the feed was maintained
(Figure 14).
38
Figure 13: Effect of algae content in the feed on methane yield, percent of volatile solids destroyed and methane content in the biogas for digesters fed only algae and sludge at a rate of 2 g VS/L-day and a 20-day residence time. Duplicate digesters are not averaged.
y = -1.91x + 460.99R² = 0.95
y = 0.062x + 68.73R² = 0.88
y = -0.30x + 55.96R² = 0.97
0
10
20
30
40
50
60
70
80
0
50
100
150
200
250
300
350
400
450
500
0 20 40 60 80 100
Pe
rce
nt M
eth
an
e, P
erc
en
t V
ola
tile
So
lids
De
str
oye
d
Yie
ld (
mL C
H4
/g V
Sin
)
Algae Fraction in the Feed
Methane Yield (mL/g VS)
Percent Methane
Percent Volatile Solids Destroyed
39
Figure 14: The effect of algae content in the feed on methane yield, percent of volatile solids destroyed and biogas quality when various residence times and loading rates are included in the data set. Values for digesters with the same algae content in the feed were averaged. Averaging the values diminishes the effect of some influential variables such as food waste and allows the effect of algae feed to be seen independently of the other variables.
FOOD WASTE CONTENT
Food waste was used at two different concentrations in Experiment 2 (Table 3). Digester
2.9 was fed 83.4% food waste with the remainder of the feed consisting of sludge at rate
of 2 g VS/L-day and a 20-day residence time. This digester produced the highest yield of
both experiments of 0.68 L CH4 /g VSin and vastly exceeded the next closest digester
(1.5) which was the 100% sludge-fed digester with a yield of 0.42 L CH4 /g VSin at a rate
of 2 g VS/L-day and a 20-day residence time (Table 3). Four other digesters in
y = -2.70x + 496.62R² = 0.87
y = 0.094x + 62.82R² = 0.53
y = -0.41x + 65.94R² = 0.86
0
10
20
30
40
50
60
70
80
0
100
200
300
400
500
600
0 20 40 60 80 100
Pe
rce
nt M
eth
an
e. P
erc
en
t V
ola
tile
So
lids
De
str
oye
d
Yie
ld (
mL C
H4
/ g V
Sin
)
Algae Fraction in the Feed
Methane Yield (mL/g VS)
Percent Methane
Percent Volatile Solids Destroyed
40
Experiment 2 were fed 50% food waste, 40% algae and 10% sludge. Digester 2.5 was
fed this mixture at a rate of 2 g VS/L-day and a 20-day residence time, while Digesters
2.6 and 2.7 were duplicates set at 4 g VS/L-day and a 20-day residence time. Finally,
Digester 2.8 was fed the same feed combination at a rate of 5.5 g VS/L-day and a 20-day
residence time. Due to the high organic loading, Digester 2.8 was largely unstable.
Methane yield at 50% food waste ranged from 0.25-0.40 L CH4 /g VSin.
Generally, higher food waste content in the feed improved digestion yields and volatile
solids destruction. Combining all results for 0% food waste in the feed, 50% food waste
in the feed, 83.4% food waste in the feed showed that higher food waste content led to
higher methane yields and greater volatile solids destruction (Figure 15). For the lower
organic loading rates, the higher the food waste content in the digester feed, the better the
digester performed. Removing Digester 2.8 from the average data set for 50% algae in
the feed increased the r-squared of the yield value to 0.76 and gave an equation of
Yield=4.18x +262.67. Removing all the digesters loaded at 4 g VS/L-d further improves
the r-squared value.
Not enough data were available to determine the presence or lack of a synergistic effect
caused by using food waste. The methane yield in the digester fed 83.4% food waste and
16.6% sludge (Digester 2.9) was 16% greater than the yield for the digester fed 100%
sludge (Digester 1.5); however, it is unlikely that these results show a synergistic effect
because the food waste used most likely had higher energy content than the sewage
sludge. The high yield at 83.4% food waste was most likely not due to synergy but due
to the abundance of an energy-rich substrate and a more favorable C:N ratio of 17:1.
41
Figure 15: Effect of food waste in the feed on yield, percent methane, and volatile solids destruction. This graph shows the average value for the three different percentages of food waste in the feed.
SLUDGE CONTENT
The sludge content in the feed is the inverse of algae and food waste content and, thus,
sludge percentage is not considered separately.
ORGANIC LOADING RATE
Over the two experiments, four different organic loading rates were used, ranging from 1-
5.5 g VS/L-d (Table 3). The lowest loading rate was 1 g VS/L-day for Digester 2.10 that
was fed 80% algae, and 20% sludge at a 40 day residence time. The yield for this
digester was 0.27 L CH4/ g VSin. Eleven digesters were fed at a rate of 2 g VS/L-day and
showed yields ranging from 0.24-0.68 L CH4/ g VSin. Five digesters were fed at a rate of
y = 4.14x + 255.08R² = 0.70
y = -0.18x + 69.94R² = 0.99
y = 0.61x + 33.77R² = 0.98
0
10
20
30
40
50
60
70
80
90
100
0
100
200
300
400
500
600
700
800
0 20 40 60 80 100
Pe
rce
nt M
eth
an
e, P
erc
en
t V
olit
ile S
olid
s
De
str
oye
d
Yie
ld (
mL C
H4
/ g V
Sin
)
Food Waste Fraction in the Feed
Methane Yield (mL/g VS)
Percent Methane
Percent Volatile Solids Destroyed
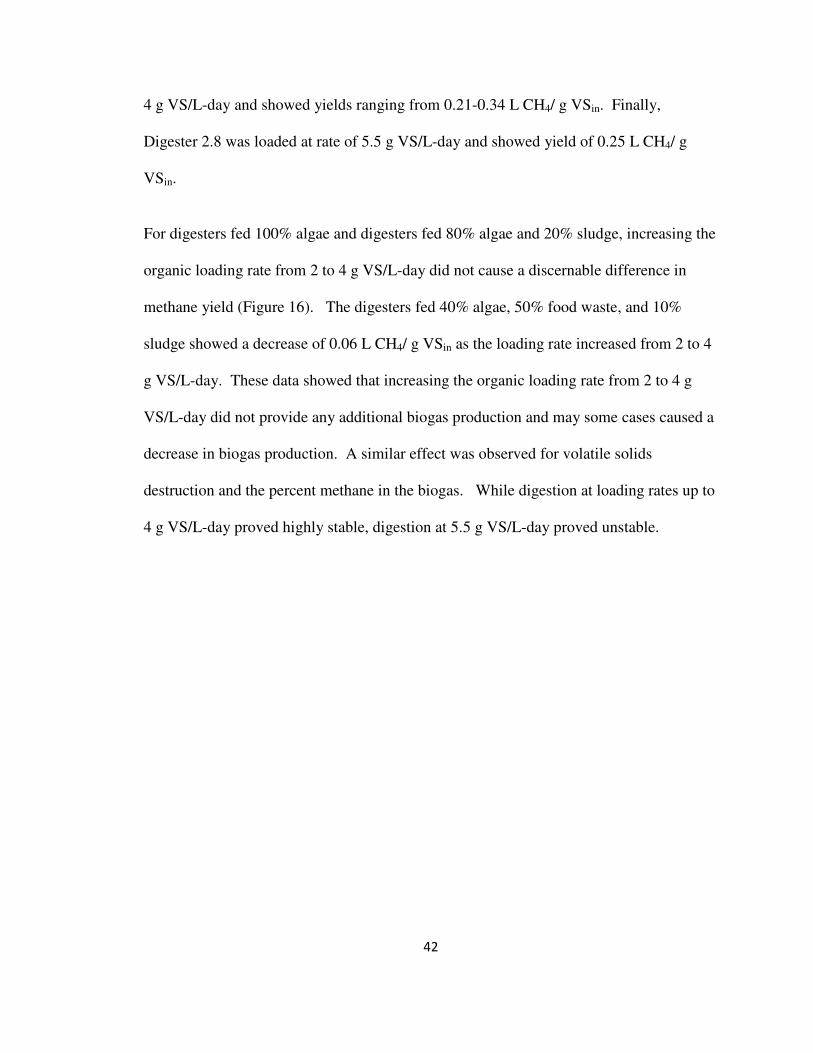
42
4 g VS/L-day and showed yields ranging from 0.21-0.34 L CH4/ g VSin. Finally,
Digester 2.8 was loaded at rate of 5.5 g VS/L-day and showed yield of 0.25 L CH4/ g
VSin.
For digesters fed 100% algae and digesters fed 80% algae and 20% sludge, increasing the
organic loading rate from 2 to 4 g VS/L-day did not cause a discernable difference in
methane yield (Figure 16). The digesters fed 40% algae, 50% food waste, and 10%
sludge showed a decrease of 0.06 L CH4/ g VSin as the loading rate increased from 2 to 4
g VS/L-day. These data showed that increasing the organic loading rate from 2 to 4 g
VS/L-day did not provide any additional biogas production and may some cases caused a
decrease in biogas production. A similar effect was observed for volatile solids
destruction and the percent methane in the biogas. While digestion at loading rates up to
4 g VS/L-day proved highly stable, digestion at 5.5 g VS/L-day proved unstable.
43
Figure 16: The effect of organic loading on methane yield, volatile solids destruction, and percent methane in the biogas for pairs of digesters with the same residence time and feed composition.
HYDRAULIC RESIDENCE TIME
Only one digester was tested with a hydraulic residence time of 40 days, while all others
were operated at 20 days. For comparison of the effect of hydraulic residence time on
methane yield, volatile solids destruction, and biogas quality digesters with the same feed
of 80% algae and 20% sludge were chosen. The two digesters were operated at an
organic loading rate of 2 g VS/L-day and a 20-day residence time, while the final digester
0
50
100
150
200
250
300
350
400
450
10
0%
Alg
ae
2 g
VS
/L-d
10
0%
Alg
ae
4 g
VS
/L-d
80
% A
lga
e 2
0%
Slu
dge
2
g V
S/L
-d
80
% A
lga
e,
20
%
Slu
dge
4 g
VS
/L-d
40
% A
lga
e,
50
% F
oo
d
Waste
, 1
0%
Slu
dge
2
g V
S/L
-d
40
% A
lga
e,
50
% F
oo
d
Waste
, 1
0%
Slu
dge
4
g V
S/L
-d
Percent Methane
Methane Yield (mL/g VS)
Percent VS Destruction
44
was operated at a loading rate of 1 g VS/L-day and a 40-day residence time. Despite a
lower loading rate, the digester operating at 40-day residence time showed remarkably
similar methane yields, operational parameters, and solids destruction compared to the
digesters operating at a higher residence time and higher loading rate (Figure 17).
Alkalinity was the only operational parameter that was higher for the longer residence
time of 40 days.
Although the effect of increasing organic loading rate on methane yield was difficult to
discern using the single variable of organic loading rate, low organic loading rates could
be expected to eventually decrease methane yield due to an unavailability of digestible
substrate. More research is needed to determine if the yield results of this experiment are
largely due to the low loading rate or the longer residence time or some combination of
the two factors. However, due to the recalcitrant nature of algae cells, longer residence
times will likely result in higher methane yields at the same loading rates and more stable
digesters.
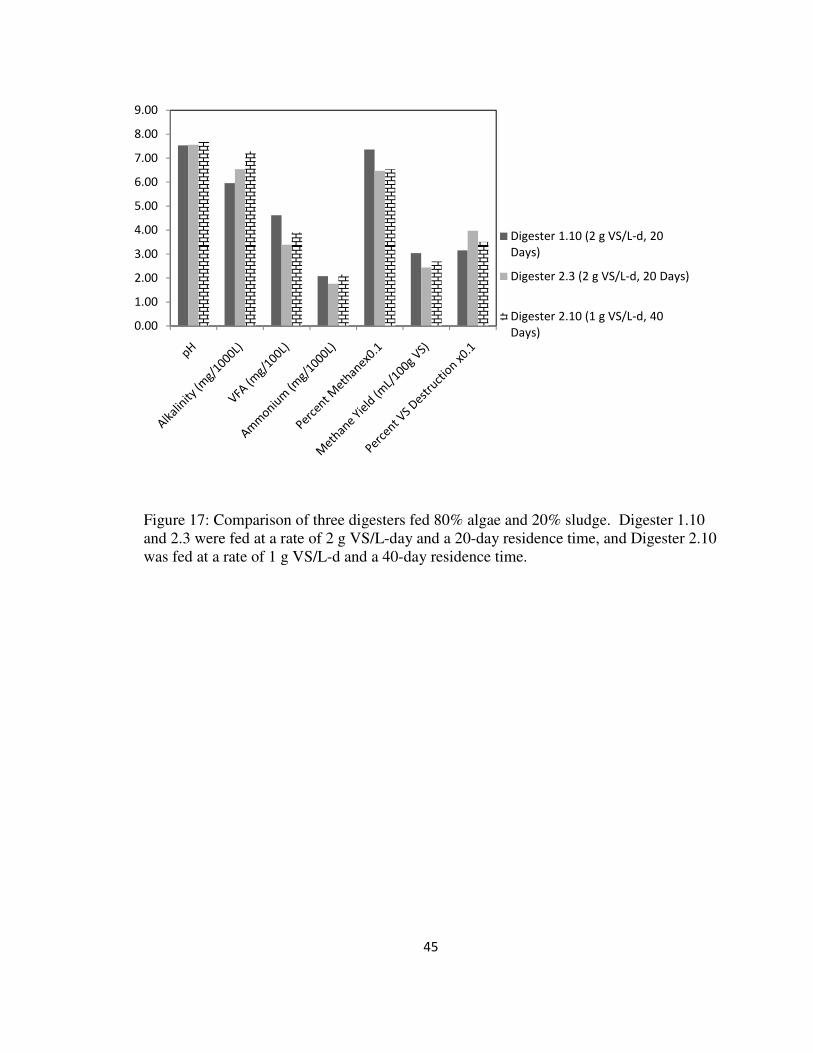
45
Figure 17: Comparison of three digesters fed 80% algae and 20% sludge. Digester 1.10 and 2.3 were fed at a rate of 2 g VS/L-day and a 20-day residence time, and Digester 2.10 was fed at a rate of 1 g VS/L-d and a 40-day residence time.
0.00
1.00
2.00
3.00
4.00
5.00
6.00
7.00
8.00
9.00
Digester 1.10 (2 g VS/L-d, 20
Days)
Digester 2.3 (2 g VS/L-d, 20 Days)
Digester 2.10 (1 g VS/L-d, 40
Days)
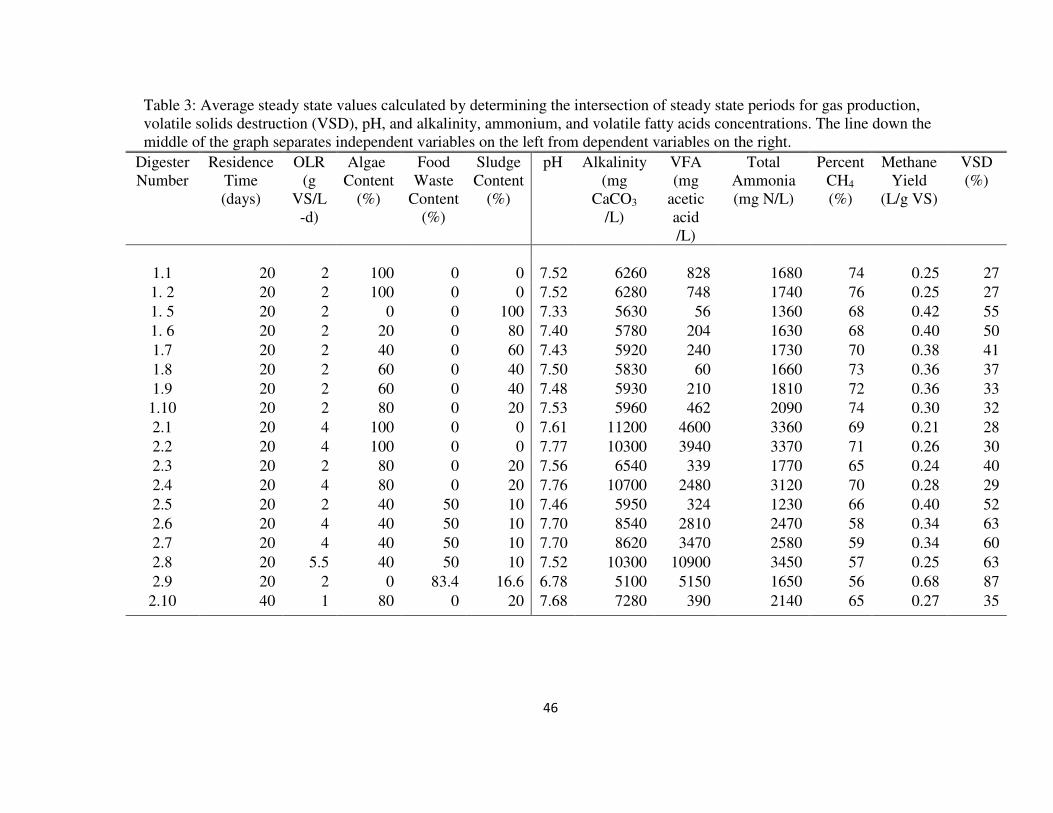
46
Table 3: Average steady state values calculated by determining the intersection of steady state periods for gas production, volatile solids destruction (VSD), pH, and alkalinity, ammonium, and volatile fatty acids concentrations. The line down the middle of the graph separates independent variables on the left from dependent variables on the right.
Digester Number
Residence Time (days)
OLR (g
VS/L-d)
Algae Content
(%)
Food Waste
Content (%)
Sludge Content
(%)
pH Alkalinity (mg
CaCO3 /L)
VFA (mg
acetic acid /L)
Total Ammonia (mg N/L)
Percent CH4
(%)
Methane Yield
(L/g VS)
VSD (%)
1.1 20 2 100 0 0 7.52 6260 828 1680 74 0.25 27
1. 2 20 2 100 0 0 7.52 6280 748 1740 76 0.25 27
1. 5 20 2 0 0 100 7.33 5630 56 1360 68 0.42 55
1. 6 20 2 20 0 80 7.40 5780 204 1630 68 0.40 50
1.7 20 2 40 0 60 7.43 5920 240 1730 70 0.38 41
1.8 20 2 60 0 40 7.50 5830 60 1660 73 0.36 37
1.9 20 2 60 0 40 7.48 5930 210 1810 72 0.36 33
1.10 20 2 80 0 20 7.53 5960 462 2090 74 0.30 32
2.1 20 4 100 0 0 7.61 11200 4600 3360 69 0.21 28
2.2 20 4 100 0 0 7.77 10300 3940 3370 71 0.26 30
2.3 20 2 80 0 20 7.56 6540 339 1770 65 0.24 40
2.4 20 4 80 0 20 7.76 10700 2480 3120 70 0.28 29
2.5 20 2 40 50 10 7.46 5950 324 1230 66 0.40 52
2.6 20 4 40 50 10 7.70 8540 2810 2470 58 0.34 63
2.7 20 4 40 50 10 7.70 8620 3470 2580 59 0.34 60
2.8 20 5.5 40 50 10 7.52 10300 10900 3450 57 0.25 63
2.9 20 2 0 83.4 16.6 6.78 5100 5150 1650 56 0.68 87
2.10 40 1 80 0 20 7.68 7280 390 2140 65 0.27 35
47
EXTENDED MODEL
Two types of descriptive models were developed: the extended models which
incorporated more parameters and the compact models which used only the significant
parameters with a p-value less than 0.05. The linear multivariate least squares method
was used to create these models using data identified in steady state periods. The
independent variables included the hydraulic residence time, the organic loading rate, and
the algae and food waste content in the feed. Sludge was a repetitive variable and shows
the inverse effect of algae content or food waste content in the feed. The independent
variables included methane yield, percent volatile solids destruction, and percent methane
in the biogas, total ammonia nitrogen, alkalinity and volatile fatty acids concentrations.
Before the data were entered into the model, each independent and dependent variable
was plotted against each other to test for a linear relationship between the variables and,
when possible, the values were tested to determine if they were part of a normal
distribution. Based on testing schedules, the availability of digester effluent, and the
volume of digester effluent needed for each test, the number of values used to determine
the model average values varied by constituent (Table 4).
The extended model was used to determine the strength of the relationship between the
respective x and y variables. P-values less than 0.05 indicate that there is a 5% chance or
less that the x-variable has no effect on the y-variable; therefore, for these models x-
coefficients with p-values less than 0.05 were defined as significant in determining the y-
value with a 95% confidence. Because some of the parameters in the extended model
were not found to be statistically significant, compact models were also developed by
48
eliminating parameters with p-values greater than 0.05. The less significant variables and
residence time variable were then eliminated in the compact models. Residence time was
eliminated because only two levels were tested, and only one digester was tested at the
higher 40-day residence time. The data discussed in the following modeling sections use
the average values from the steady state periods.

49
Table 4: Model steady state periods and the number of values averaged for each value used in the model.
Digester Number
Steady state period (days)
pH (n)
Alkalinity (n)
VFA (n)
Ammonium (n)
% Methane
(n)
CH4 Yield
(n)
%VS Destruction
(n)
1.1 29-50 20 6 3 1 4 20 4
1.2 29-50 20 6 3 1 4 21 4
1.5 29-50 20 6 3 1 4 19 4
1.6 29-43 14 5 2 1 3 14 3
1.7 22-43 21 7 2 1 4 19 4
1.8 29-50 20 6 3 1 4 21 4
1.9 29-50 20 6 2 1 4 20 4
1.10 36-50 13 4 2 1 3 14 3
2.1 62-90 22 14 4 5 5 28 5
2.2 62-83 18 11 3 4 4 21 4
2.3 27-55 19 9 4 4 5 28 5
2.4 62-83 18 11 3 4 4 21 4
2.5 34-62 22 9 2 4 5 28 5
2.6 34-55 15 6 3 3 4 21 4
2.7 34-55 15 6 3 3 4 21 4
2.8 41-55 11 4 2 2 3 12 3
2.9 69-90 16 11 3 3 4 21 4
2.10 34-55 15 6 2 3 4 21 4
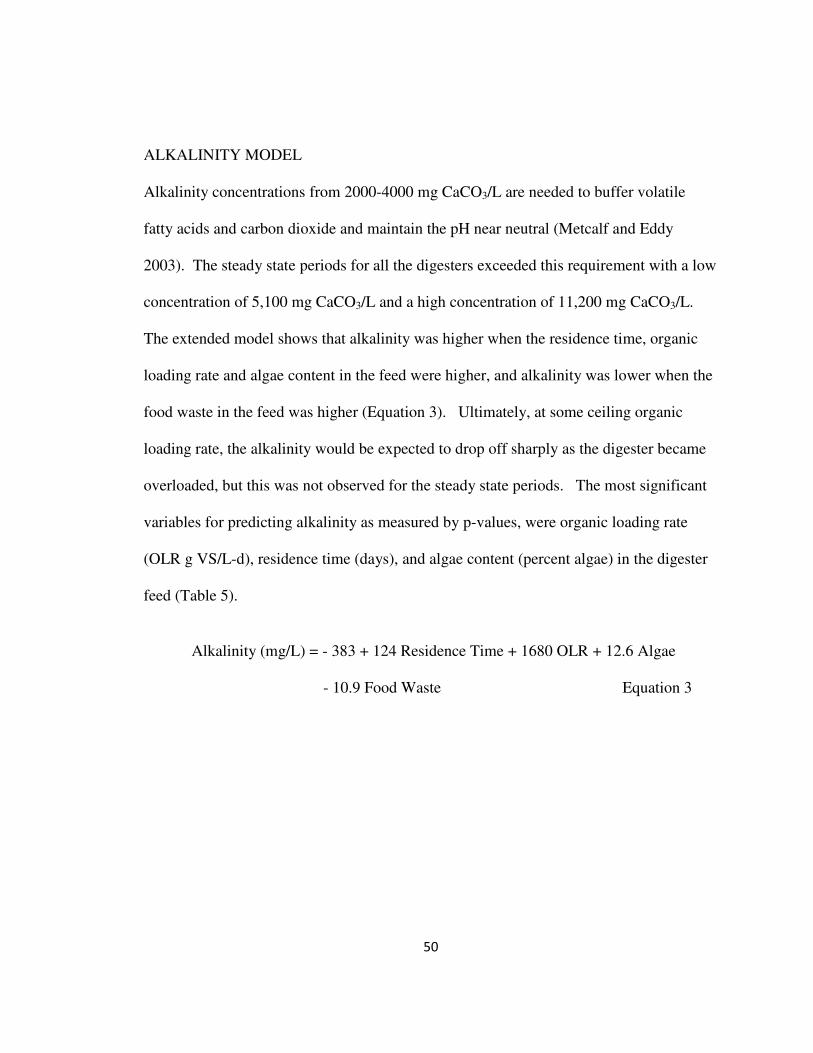
50
ALKALINITY MODEL
Alkalinity concentrations from 2000-4000 mg CaCO3/L are needed to buffer volatile
fatty acids and carbon dioxide and maintain the pH near neutral (Metcalf and Eddy
2003). The steady state periods for all the digesters exceeded this requirement with a low
concentration of 5,100 mg CaCO3/L and a high concentration of 11,200 mg CaCO3/L.
The extended model shows that alkalinity was higher when the residence time, organic
loading rate and algae content in the feed were higher, and alkalinity was lower when the
food waste in the feed was higher (Equation 3). Ultimately, at some ceiling organic
loading rate, the alkalinity would be expected to drop off sharply as the digester became
overloaded, but this was not observed for the steady state periods. The most significant
variables for predicting alkalinity as measured by p-values, were organic loading rate
(OLR g VS/L-d), residence time (days), and algae content (percent algae) in the digester
feed (Table 5).
Alkalinity (mg/L) = - 383 + 124 Residence Time + 1680 OLR + 12.6 Algae
- 10.9 Food Waste Equation 3
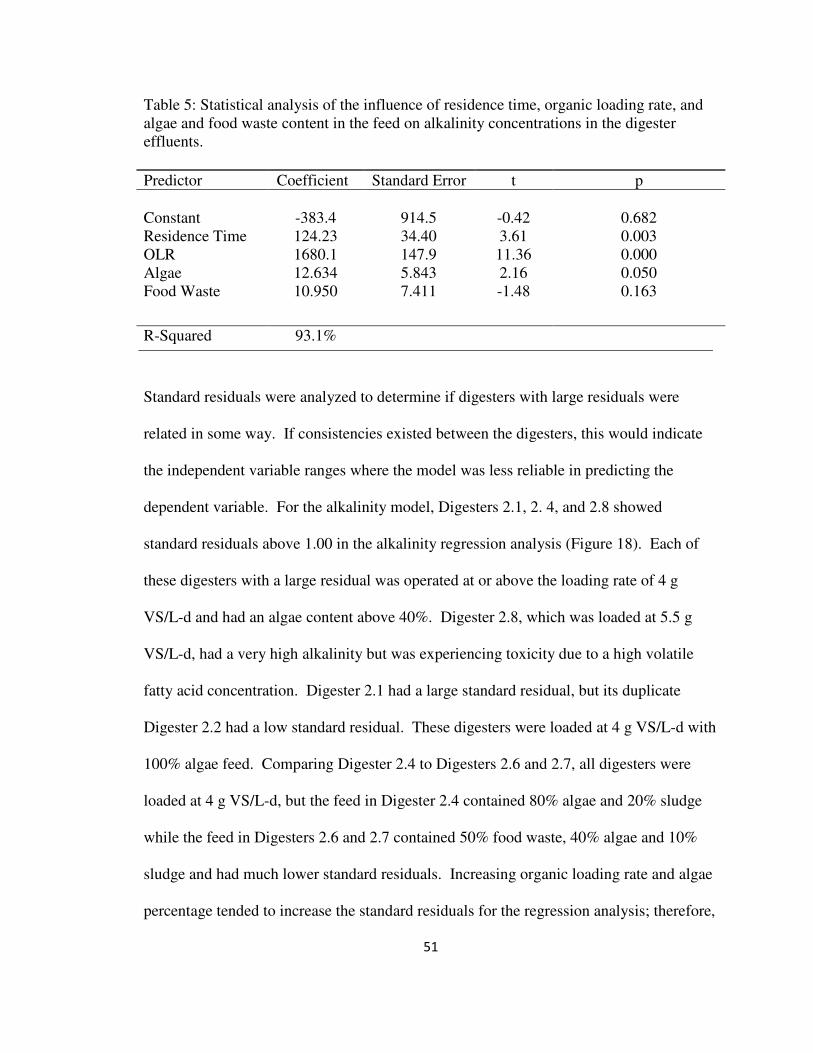
51
Table 5: Statistical analysis of the influence of residence time, organic loading rate, and algae and food waste content in the feed on alkalinity concentrations in the digester effluents.
Predictor Coefficient Standard Error t p
Constant -383.4 914.5 -0.42 0.682 Residence Time 124.23 34.40 3.61 0.003 OLR 1680.1 147.9 11.36 0.000 Algae Food Waste
12.634 5.843 2.16 0.050 10.950 7.411 -1.48 0.163
R-Squared 93.1%
Standard residuals were analyzed to determine if digesters with large residuals were
related in some way. If consistencies existed between the digesters, this would indicate
the independent variable ranges where the model was less reliable in predicting the
dependent variable. For the alkalinity model, Digesters 2.1, 2. 4, and 2.8 showed
standard residuals above 1.00 in the alkalinity regression analysis (Figure 18). Each of
these digesters with a large residual was operated at or above the loading rate of 4 g
VS/L-d and had an algae content above 40%. Digester 2.8, which was loaded at 5.5 g
VS/L-d, had a very high alkalinity but was experiencing toxicity due to a high volatile
fatty acid concentration. Digester 2.1 had a large standard residual, but its duplicate
Digester 2.2 had a low standard residual. These digesters were loaded at 4 g VS/L-d with
100% algae feed. Comparing Digester 2.4 to Digesters 2.6 and 2.7, all digesters were
loaded at 4 g VS/L-d, but the feed in Digester 2.4 contained 80% algae and 20% sludge
while the feed in Digesters 2.6 and 2.7 contained 50% food waste, 40% algae and 10%
sludge and had much lower standard residuals. Increasing organic loading rate and algae
percentage tended to increase the standard residuals for the regression analysis; therefore,
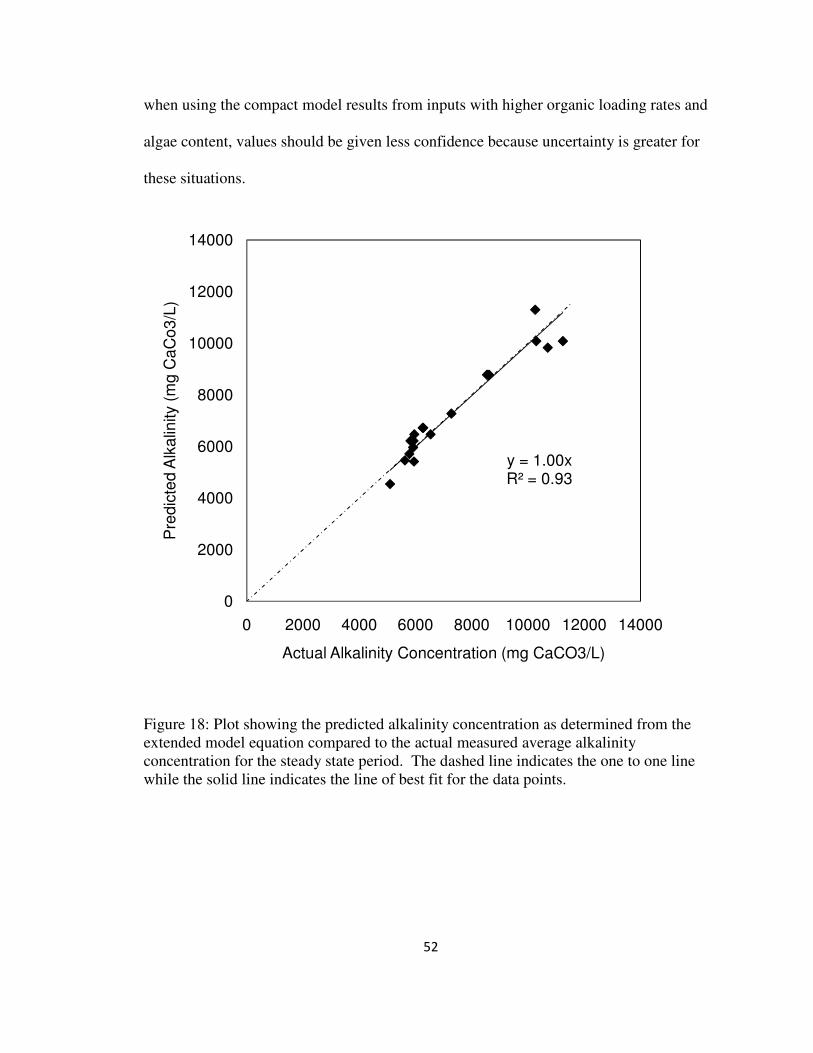
52
when using the compact model results from inputs with higher organic loading rates and
algae content, values should be given less confidence because uncertainty is greater for
these situations.
Figure 18: Plot showing the predicted alkalinity concentration as determined from the extended model equation compared to the actual measured average alkalinity concentration for the steady state period. The dashed line indicates the one to one line while the solid line indicates the line of best fit for the data points.
y = 1.00xR² = 0.93
0
2000
4000
6000
8000
10000
12000
14000
0 2000 4000 6000 8000 10000 12000 14000
Pre
dic
ted
Alk
alin
ity (
mg C
aC
o3
/L)
Actual Alkalinity Concentration (mg CaCO3/L)
53
VOLATILE FATTY ACIDS MODEL
An increase in volatile fatty acid concentration indicates that the methanogens are being
overloaded, or some other environmental factor is limiting their ability to convert volatile
fatty acids to methane. A build-up can lead to a drop in pH and a culture crash; therefore,
volatile fatty acids are an important indicator of process stability. Volatile fatty acid
concentrations used in the regression ranged from 56-10,900 mg acetic acid/L. The
model shows that volatile fatty acids were higher in digesters with higher residence times,
organic loadings, and algae and food waste content in the feed (Equation 4). The most
significant variables for predicting volatile fatty acids, as indicated by p-values, are
organic loading rate (OLR g VS/L-d) and food waste (%) in the feed (Table 6).
VFA (mg/L) = - 5436 + 97.1 Residence Time + 1762 OLR + 2.2 Algae
+ 36.5 Food Waste Equation 4
Table 6: Statistical analysis of the influence of residence time, organic loading rate, and algae and food waste content in the feed on volatile fatty acid concentrations in the digester effluents.
Predictor Coefficient Standard Error t p
Constant -5436 2235 -2.43 0.030 Residence Time 97.11 84.05 1.16 0.269 OLR 1762.3 361.5 4.87 0.000 Algae Food Waste
2.24 14.28 0.16 0.878 36.52 18.11 2.02 0.065
R-Squared 78.4%
The standard residuals for Digesters 2.5, 2.6, 2.7, 2.8 and 2.9, or all the food waste
digesters were above 1.00 in the alkalinity regression analysis (Figure 19). Digesters 2.8
and 2.9 had measured volatile fatty acid concentrations greater than the value predicted
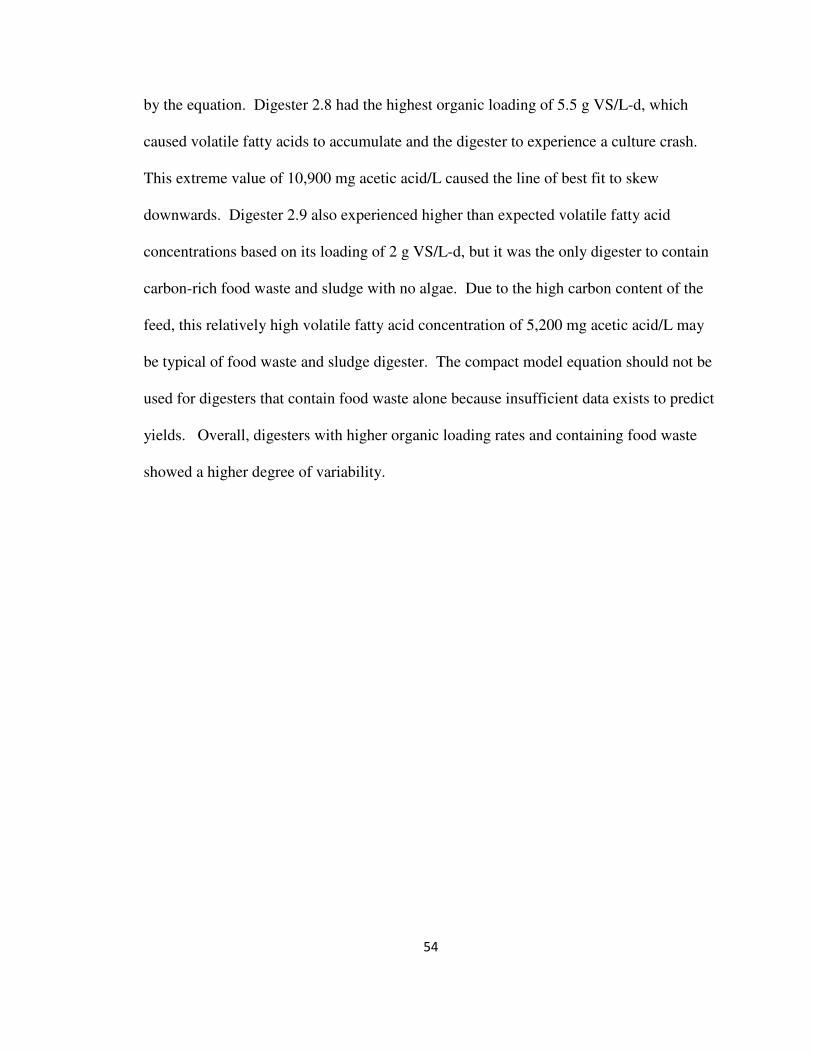
54
by the equation. Digester 2.8 had the highest organic loading of 5.5 g VS/L-d, which
caused volatile fatty acids to accumulate and the digester to experience a culture crash.
This extreme value of 10,900 mg acetic acid/L caused the line of best fit to skew
downwards. Digester 2.9 also experienced higher than expected volatile fatty acid
concentrations based on its loading of 2 g VS/L-d, but it was the only digester to contain
carbon-rich food waste and sludge with no algae. Due to the high carbon content of the
feed, this relatively high volatile fatty acid concentration of 5,200 mg acetic acid/L may
be typical of food waste and sludge digester. The compact model equation should not be
used for digesters that contain food waste alone because insufficient data exists to predict
yields. Overall, digesters with higher organic loading rates and containing food waste
showed a higher degree of variability.
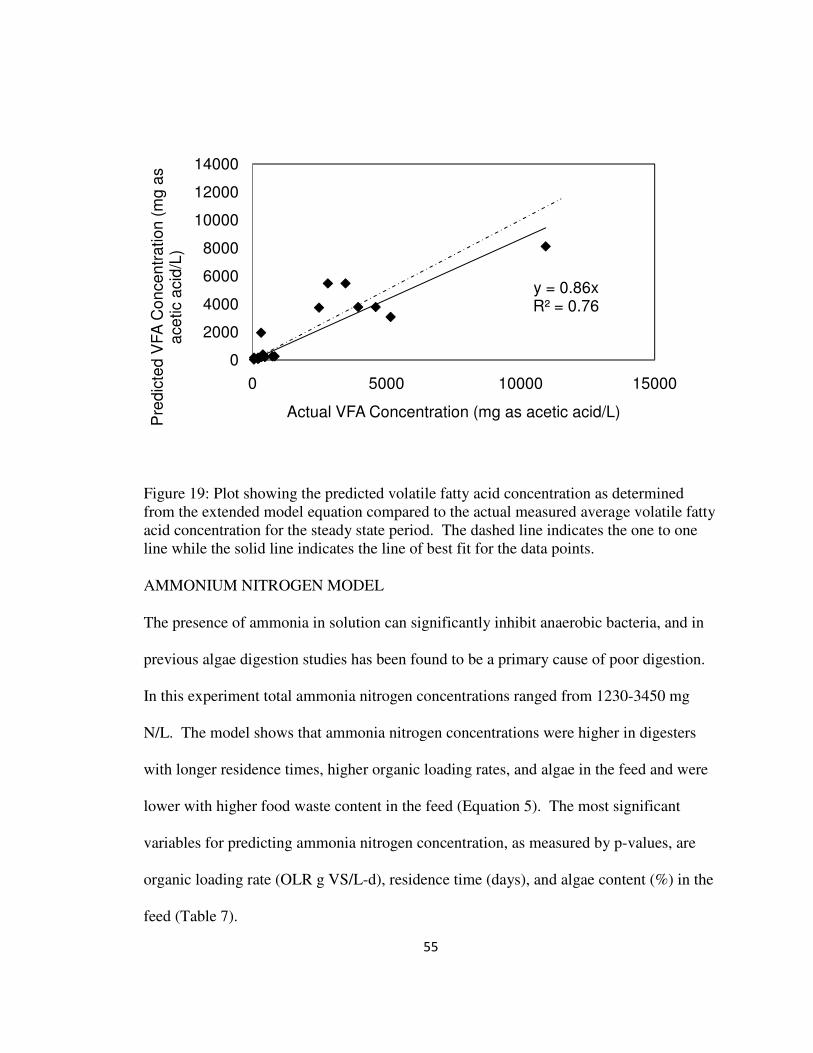
55
Figure 19: Plot showing the predicted volatile fatty acid concentration as determined from the extended model equation compared to the actual measured average volatile fatty acid concentration for the steady state period. The dashed line indicates the one to one line while the solid line indicates the line of best fit for the data points.
AMMONIUM NITROGEN MODEL
The presence of ammonia in solution can significantly inhibit anaerobic bacteria, and in
previous algae digestion studies has been found to be a primary cause of poor digestion.
In this experiment total ammonia nitrogen concentrations ranged from 1230-3450 mg
N/L. The model shows that ammonia nitrogen concentrations were higher in digesters
with longer residence times, higher organic loading rates, and algae in the feed and were
lower with higher food waste content in the feed (Equation 5). The most significant
variables for predicting ammonia nitrogen concentration, as measured by p-values, are
organic loading rate (OLR g VS/L-d), residence time (days), and algae content (%) in the
feed (Table 7).
y = 0.86xR² = 0.76
0
2000
4000
6000
8000
10000
12000
14000
0 5000 10000 15000
Pre
dic
ted
VF
A C
on
ce
ntr
atio
n (
mg a
s
ace
tic a
cid
/L)
Actual VFA Concentration (mg as acetic acid/L)
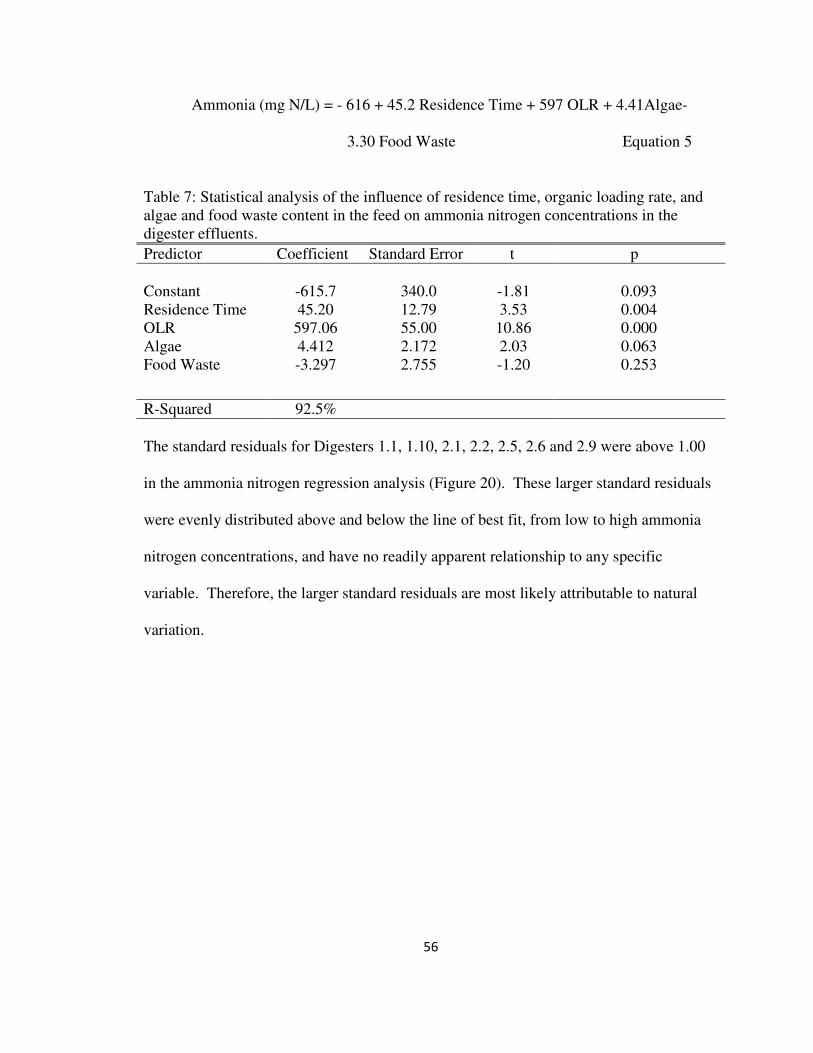
56
Ammonia (mg N/L) = - 616 + 45.2 Residence Time + 597 OLR + 4.41Algae-
3.30 Food Waste Equation 5
Table 7: Statistical analysis of the influence of residence time, organic loading rate, and algae and food waste content in the feed on ammonia nitrogen concentrations in the digester effluents.
Predictor Coefficient Standard Error t p
Constant -615.7 340.0 -1.81 0.093 Residence Time 45.20 12.79 3.53 0.004 OLR 597.06 55.00 10.86 0.000 Algae Food Waste
4.412 2.172 2.03 0.063 -3.297 2.755 -1.20 0.253
R-Squared 92.5%
The standard residuals for Digesters 1.1, 1.10, 2.1, 2.2, 2.5, 2.6 and 2.9 were above 1.00
in the ammonia nitrogen regression analysis (Figure 20). These larger standard residuals
were evenly distributed above and below the line of best fit, from low to high ammonia
nitrogen concentrations, and have no readily apparent relationship to any specific
variable. Therefore, the larger standard residuals are most likely attributable to natural
variation.
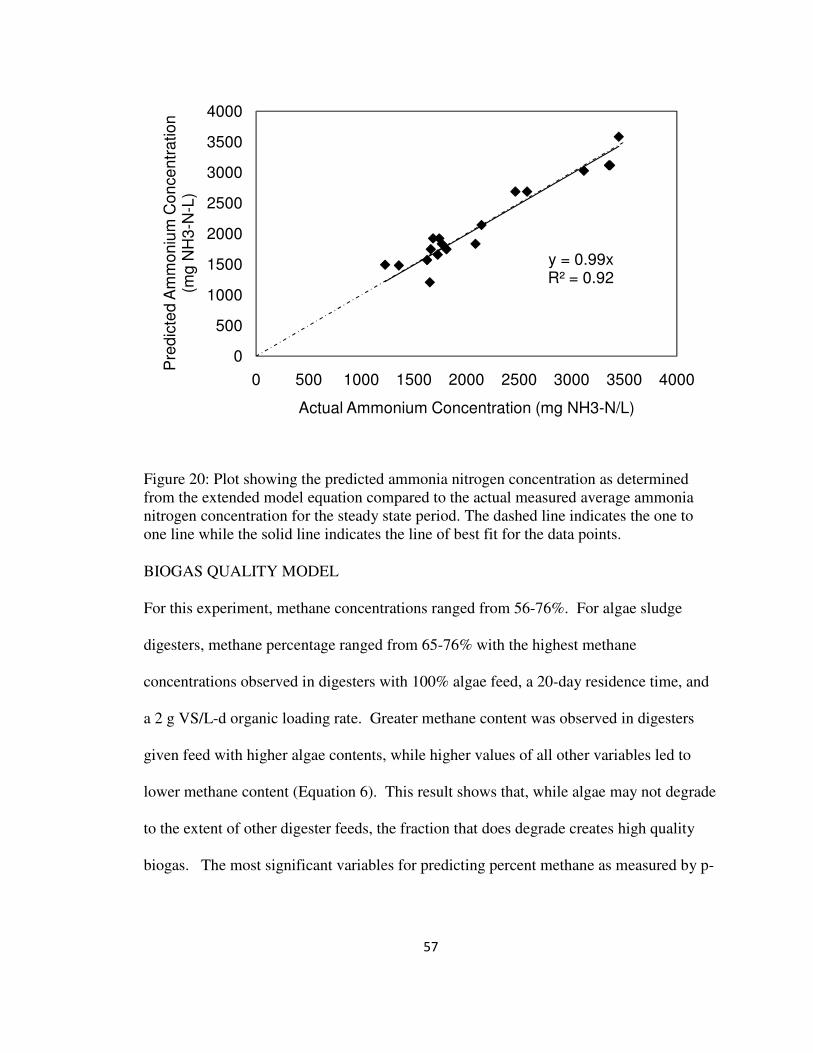
57
Figure 20: Plot showing the predicted ammonia nitrogen concentration as determined from the extended model equation compared to the actual measured average ammonia nitrogen concentration for the steady state period. The dashed line indicates the one to one line while the solid line indicates the line of best fit for the data points.
BIOGAS QUALITY MODEL
For this experiment, methane concentrations ranged from 56-76%. For algae sludge
digesters, methane percentage ranged from 65-76% with the highest methane
concentrations observed in digesters with 100% algae feed, a 20-day residence time, and
a 2 g VS/L-d organic loading rate. Greater methane content was observed in digesters
given feed with higher algae contents, while higher values of all other variables led to
lower methane content (Equation 6). This result shows that, while algae may not degrade
to the extent of other digester feeds, the fraction that does degrade creates high quality
biogas. The most significant variables for predicting percent methane as measured by p-
y = 0.99xR² = 0.92
0
500
1000
1500
2000
2500
3000
3500
4000
0 500 1000 1500 2000 2500 3000 3500 4000
Pre
dic
ted
Am
mo
niu
m C
on
ce
ntr
atio
n
(mg N
H3
-N-L
)
Actual Ammonium Concentration (mg NH3-N/L)
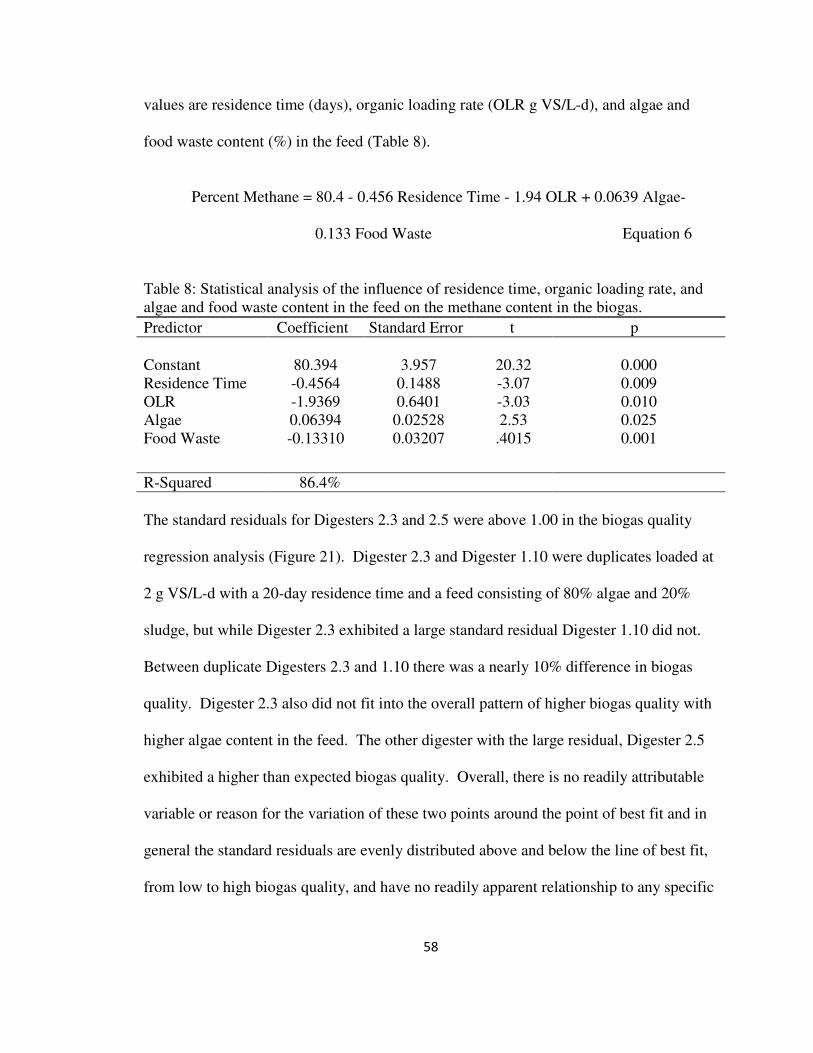
58
values are residence time (days), organic loading rate (OLR g VS/L-d), and algae and
food waste content (%) in the feed (Table 8).
Percent Methane = 80.4 - 0.456 Residence Time - 1.94 OLR + 0.0639 Algae-
0.133 Food Waste Equation 6
Table 8: Statistical analysis of the influence of residence time, organic loading rate, and algae and food waste content in the feed on the methane content in the biogas.
Predictor Coefficient Standard Error t p
Constant 80.394 3.957 20.32 0.000 Residence Time -0.4564 0.1488 -3.07 0.009 OLR -1.9369 0.6401 -3.03 0.010 Algae Food Waste
0.06394 0.02528 2.53 0.025 -0.13310 0.03207 .4015 0.001
R-Squared 86.4%
The standard residuals for Digesters 2.3 and 2.5 were above 1.00 in the biogas quality
regression analysis (Figure 21). Digester 2.3 and Digester 1.10 were duplicates loaded at
2 g VS/L-d with a 20-day residence time and a feed consisting of 80% algae and 20%
sludge, but while Digester 2.3 exhibited a large standard residual Digester 1.10 did not.
Between duplicate Digesters 2.3 and 1.10 there was a nearly 10% difference in biogas
quality. Digester 2.3 also did not fit into the overall pattern of higher biogas quality with
higher algae content in the feed. The other digester with the large residual, Digester 2.5
exhibited a higher than expected biogas quality. Overall, there is no readily attributable
variable or reason for the variation of these two points around the point of best fit and in
general the standard residuals are evenly distributed above and below the line of best fit,
from low to high biogas quality, and have no readily apparent relationship to any specific

59
variable. Therefore, the larger standard residuals may have been caused by natural
variation.
Figure 21: Plot showing the predicted biogas quality as determined from the extended model equation compared to the actual measured average biogas quality for the steady state period. The dashed line indicates the one to one line while the solid line indicates the line of best fit for the data points.
y = 1.00xR² = 0.84
40
50
60
70
80
90
100
40 50 60 70 80 90 100
Pre
dic
ted
Me
tha
ne
Pe
rce
nta
ge
in
th
e
Bio
ga
s
Actual Methane Percentage in the Biogas
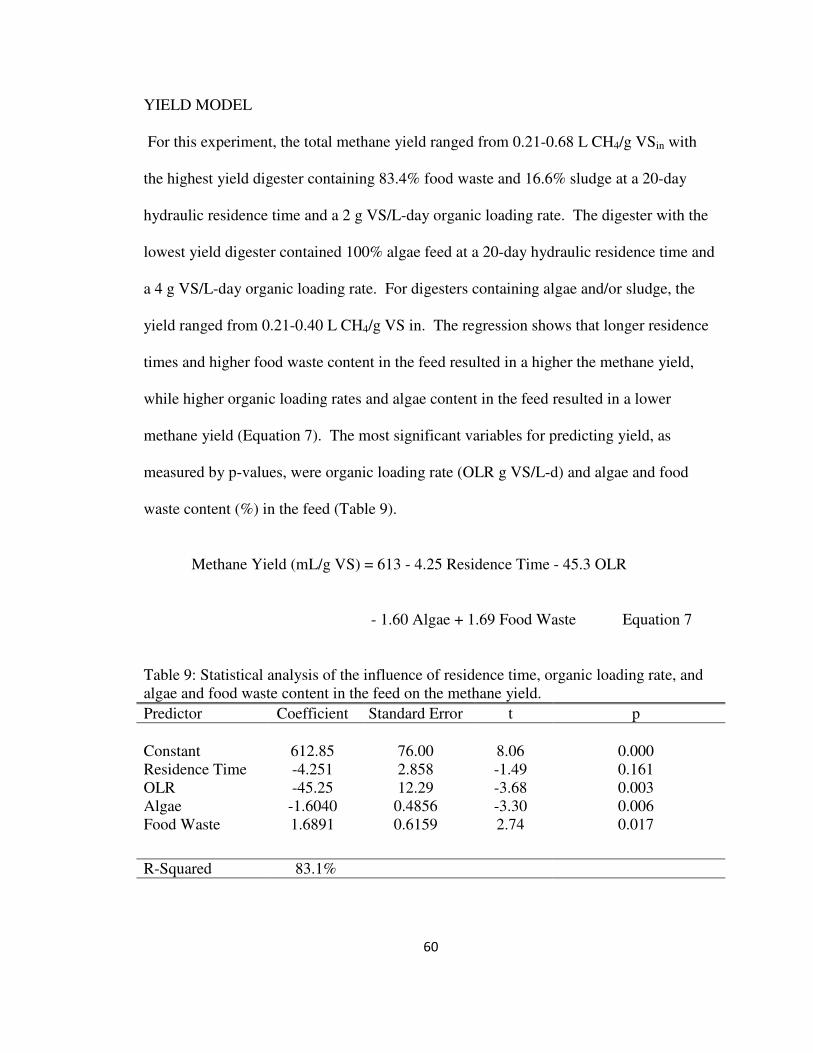
60
YIELD MODEL
For this experiment, the total methane yield ranged from 0.21-0.68 L CH4/g VSin with
the highest yield digester containing 83.4% food waste and 16.6% sludge at a 20-day
hydraulic residence time and a 2 g VS/L-day organic loading rate. The digester with the
lowest yield digester contained 100% algae feed at a 20-day hydraulic residence time and
a 4 g VS/L-day organic loading rate. For digesters containing algae and/or sludge, the
yield ranged from 0.21-0.40 L CH4/g VS in. The regression shows that longer residence
times and higher food waste content in the feed resulted in a higher the methane yield,
while higher organic loading rates and algae content in the feed resulted in a lower
methane yield (Equation 7). The most significant variables for predicting yield, as
measured by p-values, were organic loading rate (OLR g VS/L-d) and algae and food
waste content (%) in the feed (Table 9).
Methane Yield (mL/g VS) = 613 - 4.25 Residence Time - 45.3 OLR
- 1.60 Algae + 1.69 Food Waste Equation 7
Table 9: Statistical analysis of the influence of residence time, organic loading rate, and algae and food waste content in the feed on the methane yield.
Predictor Coefficient Standard Error t p
Constant 612.85 76.00 8.06 0.000 Residence Time -4.251 2.858 -1.49 0.161 OLR -45.25 12.29 -3.68 0.003 Algae Food Waste
-1.6040 0.4856 -3.30 0.006 1.6891 0.6159 2.74 0.017
R-Squared 83.1%
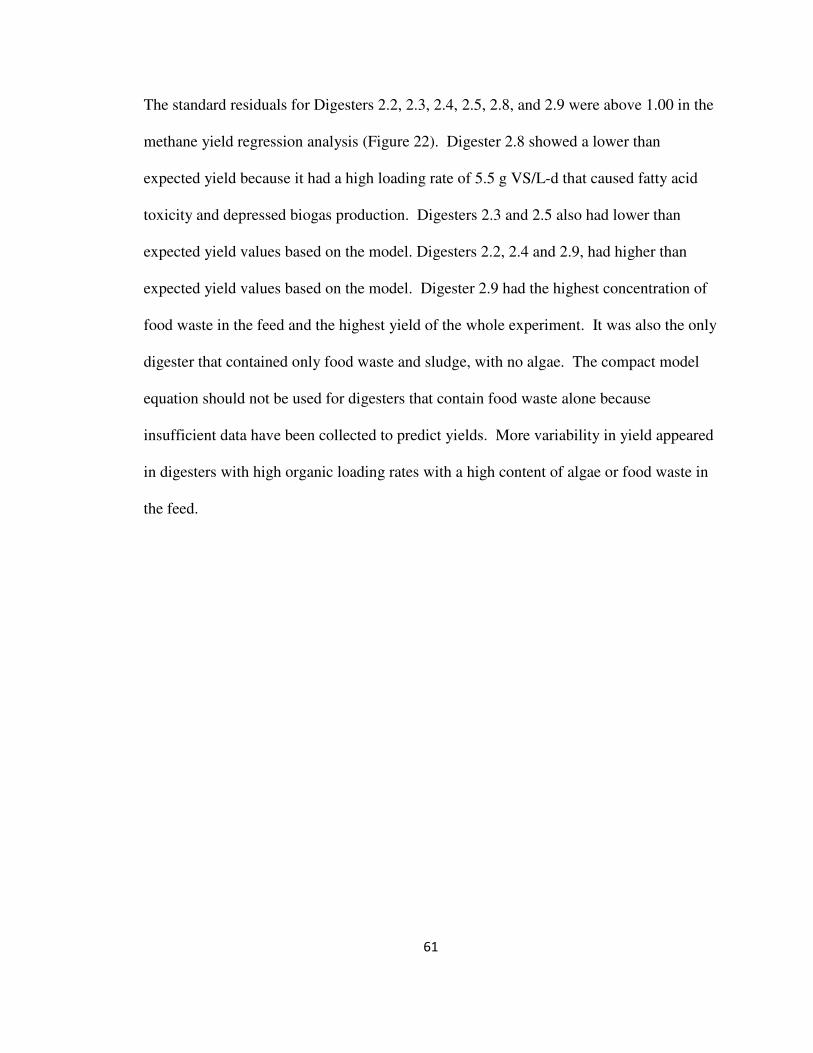
61
The standard residuals for Digesters 2.2, 2.3, 2.4, 2.5, 2.8, and 2.9 were above 1.00 in the
methane yield regression analysis (Figure 22). Digester 2.8 showed a lower than
expected yield because it had a high loading rate of 5.5 g VS/L-d that caused fatty acid
toxicity and depressed biogas production. Digesters 2.3 and 2.5 also had lower than
expected yield values based on the model. Digesters 2.2, 2.4 and 2.9, had higher than
expected yield values based on the model. Digester 2.9 had the highest concentration of
food waste in the feed and the highest yield of the whole experiment. It was also the only
digester that contained only food waste and sludge, with no algae. The compact model
equation should not be used for digesters that contain food waste alone because
insufficient data have been collected to predict yields. More variability in yield appeared
in digesters with high organic loading rates with a high content of algae or food waste in
the feed.
62
Figure 22: Plot showing the predicted yield as determined from the extended model equation compared to the actual measured average yield for the steady state period. The dashed line indicates the one to one line while the solid line indicates the line of best fit for the data points.
VOLATILE SOLIDS DESTRUCTION MODEL
For this experiment, the percent volatile solids destruction ranged from 27-87%. The
model shows that longer residence times, and higher organic loading rates, and food
waste content in the feed corresponds to higher volatile solids destruction while higher
algae content in the feed corresponds to lower volatile solids destruction (Equation 8).
The most significant variables for predicting volatile solids destruction, as measured by
p-values, are residence time (days), algae and food waste content (%) in the digester feed
(Table 10).
Percent VS Destruction = 48.9 + 0.188 Residence Time + 0.587 OLR
- 0.275Algae + 0.349 Food Waste Equation 8
y = 0.98xR² = 0.80
0
100
200
300
400
500
600
700
800
0 200 400 600 800
Pre
dic
ted
Yie
ld (
mL C
H4
/g V
S
intr
od
uce
d)
Actual Yield (mL CH4/g VS introduced)
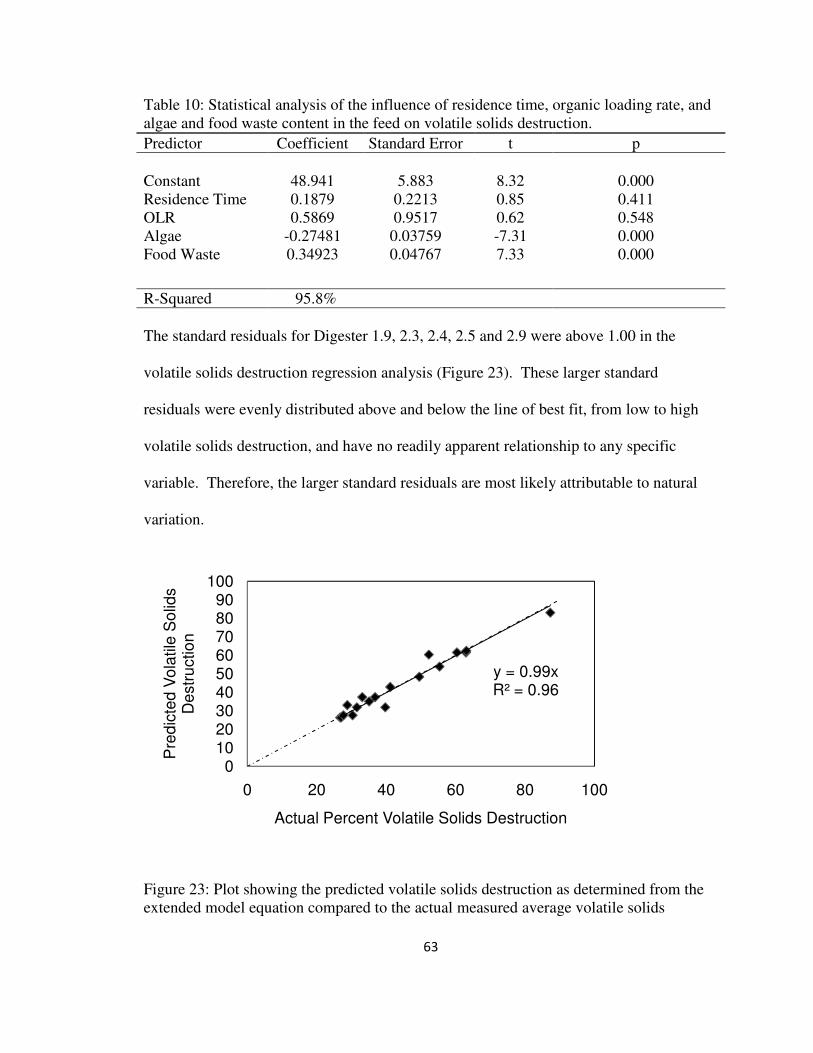
63
Table 10: Statistical analysis of the influence of residence time, organic loading rate, and algae and food waste content in the feed on volatile solids destruction.
Predictor Coefficient Standard Error t p
Constant 48.941 5.883 8.32 0.000 Residence Time 0.1879 0.2213 0.85 0.411 OLR 0.5869 0.9517 0.62 0.548 Algae Food Waste
-0.27481 0.03759 -7.31 0.000 0.34923 0.04767 7.33 0.000
R-Squared 95.8%
The standard residuals for Digester 1.9, 2.3, 2.4, 2.5 and 2.9 were above 1.00 in the
volatile solids destruction regression analysis (Figure 23). These larger standard
residuals were evenly distributed above and below the line of best fit, from low to high
volatile solids destruction, and have no readily apparent relationship to any specific
variable. Therefore, the larger standard residuals are most likely attributable to natural
variation.
Figure 23: Plot showing the predicted volatile solids destruction as determined from the extended model equation compared to the actual measured average volatile solids
y = 0.99xR² = 0.96
0102030405060708090
100
0 20 40 60 80 100
Pre
dic
ted
Vo
latile
So
lids
De
str
uctio
n
Actual Percent Volatile Solids Destruction

64
destruction for the steady state period. The dashed line indicates the one to one line while the solid line indicates the line of best fit for the data points.
COMPACT MODELS
Equations for the compact model were determined based on the p-values in the extended
models. P-values less than 0.05 were defined as to be statistically significant in this
work, and new models and equations were developed using only the variables that
yielded p-values less than 0.05. Residence time was eliminated as a variable in the
compact model due to only two residence times being tested with no duplicates for the
longer residence time. In some cases, such as the biogas composition equation,
eliminating residence time resulted in p-values for some variables that were now greater
than 0.05. These variables were also eliminated from the compact model, and the
equation was recalculated until all p-values were less than 0.05. Unusual values indicate
values with large standardized residuals. The final compact models are shown in
Equations 9-14.
Alkalinity (mg CaCO3/L) = 2284 + 1414 OLR (g VS/L-d) + 21.1 Algae(%);
R2=85.6% Equation 9
Table 11: Compact model statistics showing the influence of organic loading rate and algae content in the feed on digester alkalinity concentration.
Predictor Coefficient Standard Error t p
Constant 2284 585.5 3.90 0.001 OLR 1414.2 166.2 8.51 0.000 Algae 2.116 6.01 3.51 0.003
Unusual Observations: Digester 2.10
R-Squared 85.6%
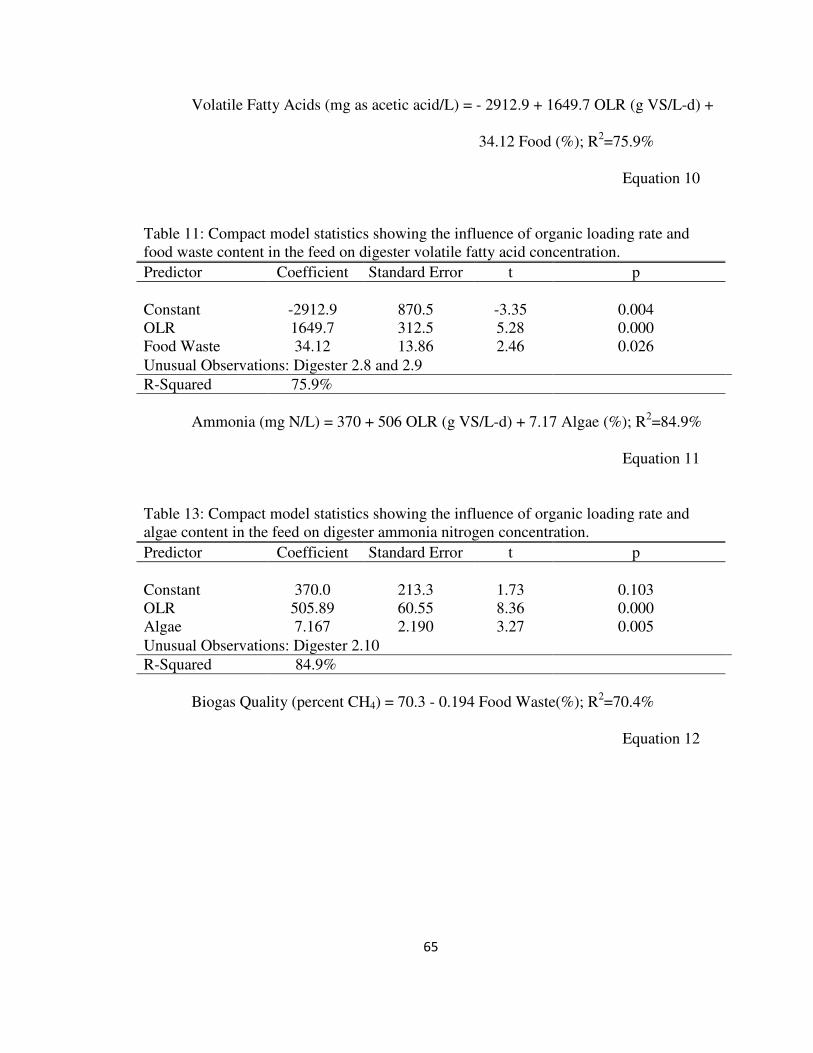
65
Volatile Fatty Acids (mg as acetic acid/L) = - 2912.9 + 1649.7 OLR (g VS/L-d) +
34.12 Food (%); R2=75.9%
Equation 10
Table 11: Compact model statistics showing the influence of organic loading rate and food waste content in the feed on digester volatile fatty acid concentration.
Predictor Coefficient Standard Error t p
Constant -2912.9 870.5 -3.35 0.004 OLR 1649.7 312.5 5.28 0.000 Food Waste 34.12 13.86 2.46 0.026
Unusual Observations: Digester 2.8 and 2.9
R-Squared 75.9%
Ammonia (mg N/L) = 370 + 506 OLR (g VS/L-d) + 7.17 Algae (%); R2=84.9%
Equation 11
Table 13: Compact model statistics showing the influence of organic loading rate and algae content in the feed on digester ammonia nitrogen concentration.
Predictor Coefficient Standard Error t p
Constant 370.0 213.3 1.73 0.103 OLR 505.89 60.55 8.36 0.000 Algae 7.167 2.190 3.27 0.005
Unusual Observations: Digester 2.10
R-Squared 84.9%
Biogas Quality (percent CH4) = 70.3 - 0.194 Food Waste(%); R2=70.4%
Equation 12
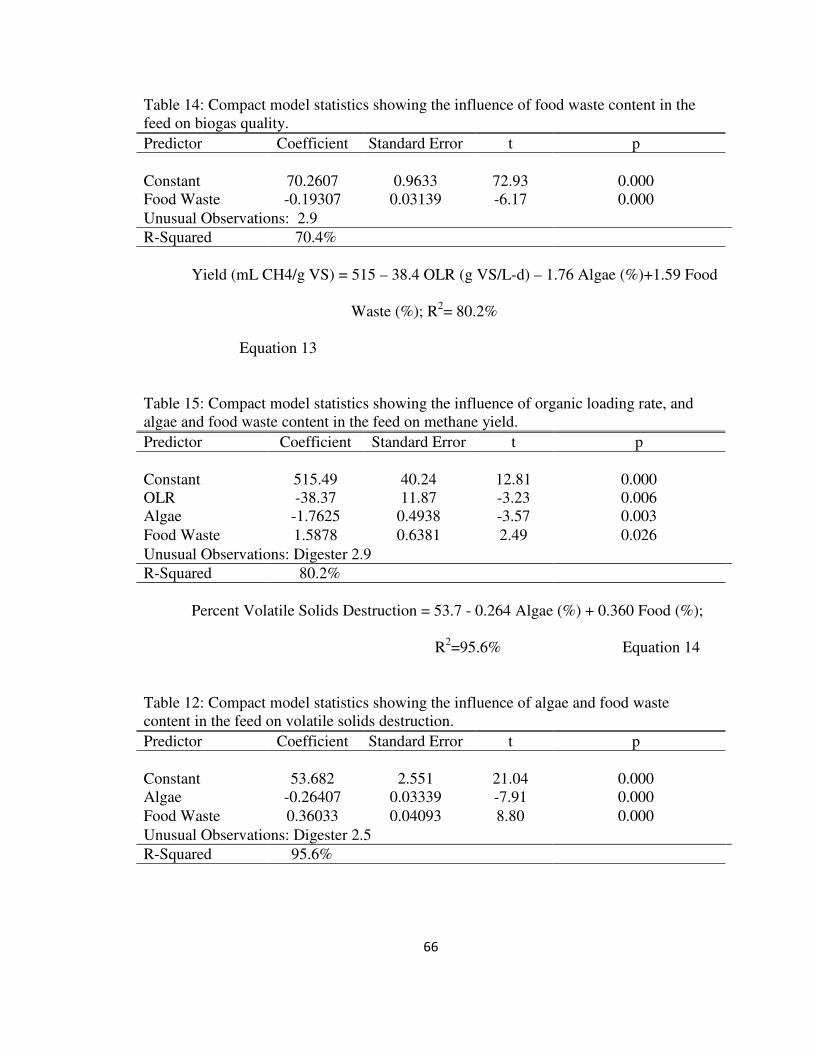
66
Table 14: Compact model statistics showing the influence of food waste content in the feed on biogas quality.
Predictor Coefficient Standard Error t p
Constant 70.2607 0.9633 72.93 0.000 Food Waste -0.19307 0.03139 -6.17 0.000
Unusual Observations: 2.9
R-Squared 70.4%
Yield (mL CH4/g VS) = 515 – 38.4 OLR (g VS/L-d) – 1.76 Algae (%)+1.59 Food
Waste (%); R2= 80.2%
Equation 13
Table 15: Compact model statistics showing the influence of organic loading rate, and algae and food waste content in the feed on methane yield.
Predictor Coefficient Standard Error t p
Constant 515.49 40.24 12.81 0.000 OLR -38.37 11.87 -3.23 0.006 Algae -1.7625 0.4938 -3.57 0.003
Food Waste 1.5878 0.6381 2.49 0.026
Unusual Observations: Digester 2.9
R-Squared 80.2%
Percent Volatile Solids Destruction = 53.7 - 0.264 Algae (%) + 0.360 Food (%);
R2=95.6% Equation 14
Table 12: Compact model statistics showing the influence of algae and food waste content in the feed on volatile solids destruction.
Predictor Coefficient Standard Error t p
Constant 53.682 2.551 21.04 0.000 Algae -0.26407 0.03339 -7.91 0.000
Food Waste 0.36033 0.04093 8.80 0.000
Unusual Observations: Digester 2.5
R-Squared 95.6%
67
CONCLUSIONS
The major goal of this research was to produce high methane yields from algae digestion
or co-digestion while maintaining digester stability and avoiding the need for alkalinity
addition. Stable digestion was achieved at organic loading rates from 1 to 4 g VS/L-d
and 20 and 40 day residence times for all feed combination. Stable digestion with a
methane yield of 0.23 to 0.25 L CH4/ g VSin was measured for digesters exclusively fed
algae biomass at loading rates of 2 to 4 g VS/L-day and a 20-day residence time. The
highest yield of 0.40 L CH4/ g VSin for algae co-digestion was observed with a feed
makeup of 50% food waste, 40% algae, and 10% wastewater sludge at a 20-day residence
time and a loading rate of 2 g VS/L-day. Additionally, these results were compiled into
multivariable extended and compact models in order to characterize the effect of organic
loading rate, residence time, and feed composition on methane yield, biogas quality,
volatile solids destruction, alkalinity, volatile fatty acids, and ammonia nitrogen
concentrations.
A synergistic effect for algae and sludge co-digestion was not observed. Increasing
sludge content in the feed linearly increased the methane yield. The yield for digesters
fed 100% algae loaded at 2 g VS/L-d and a 20-day residence time was 0.25 L CH4/ g
VSin, and the yield for digesters fed 100% sludge with the same loading rate and
residence time was 0.42 L CH4/ g VSin. The yield for digesters fed 40% algae and 60%
sludge loaded at 2 g VS/L-d and a 20-day residence time was 0.38 L CH4/ g VSin, and the
yield for digesters fed 40% algae, 50% food waste and 10% sludge with the same loading
68
rate and residence time was slightly higher at 0.40 L CH4/ g VSin. Adding food waste
likely improved methane yields by simply providing a more energy-rich substrate.
Total ammonia nitrogen concentrations did not appear to inhibit methane yield.
Digesters with the same feed content and residence time loaded at 2 and 4 g VS/L-d had
similar yields, despite greatly different total ammonia nitrogen concentrations of 1740
and 3370 mg/L, respectively. The methanogens used in this study were taken from a
municipal wastewater sludge digester where relatively high ammonia nitrogen
concentrations of 1700 mg N/L were present. This presents the possibility that ammonia-
adapted cultures can be used to avoid ammonia toxicity and inhibition problems despite
the high nitrogen content of the algal substrate. Additionally, serial inoculation from
previous algae digesters at the start of each experiment may have contributed to ammonia
adaptation. Ammonia-adapted methanogens may have obscured any potential synergistic
effect.
In the present study, the factor limiting methane yields appeared to be the resistance of
algae cell walls to digestion. As evidenced by the low volatile solids destruction (28%)
in digesters fed 100% algae compared to the digesters fed only sludge (55%) or only
sludge and food waste (87%). The presence of intact algae cell walls observed by
microscope after 20 and 40 days of digestion also points to the resistance of algae cell
walls to digestion.
In addition to the possible benefit of algae digestion to wastewater treatment pond
facilities, systems to produce liquid biofuel from algae might be able to recover nutrients
69
and carbon from residual algae biomass after oil extraction. Future research should focus
on the digestion of residual algae cell mass after lipid extraction. However, because the
removed lipids are high in carbon, ammonia inhibition could be expected to be even more
prevalent. In this case, co-digestion of residual algae cell mass with a high carbon
substrate such as food waste could improve process stability and yields. Additionally,
more research is needed to compare the effects of using ammonia adapted cultures to the
effects of co-digestion. Finally, more research is needed to determine what constituents
of wastewater grown algae biomass actually digest, and develop cost effective methods
for penetrating algae cell walls.
70
REFERENCES
APHA (2005). Standard Methods for the Examination of Water & Wastewater. American
Public Health Association, Water Environment Federation, and the American
Waterworks Association.
California Energy Commission. Bioenergy Action Plan for California, 2006. Web. 26
May 2011. < http://www.energy.ca.gov/2006publications/CEC-600-2006-010/CEC-
600-2006-010.PDF>.
California Energy Commission. California Renewable Energy Overview and Programs,
2011. Web. 26 May 2011. <http://www.energy.ca.gov/renewables/index.htmL>.
California Energy Commission. Renewable Energy Programs. 2011. Web. 26 May 2011.
< http://www.energy.ca.gov/renewables/renewable_links.htmL>.
Chen, P. H., & Oswald, W. J. (1998). Thermochemical treatment for algal fermentation.
Environment International, 24(8), 889-897. doi:10.1016/S0160-4120(98)00080-4
De Sa, J. (2009). Personnel communication. Operations Manager, Sunnyvale Water
Pollution Control Plant, Sunnyvale, Calif.
EAO, Inc., & Bracewell Engineering, Inc. (1988). Alage Digestion Study: City of
Sunnyvale, Sunnyvale, Calif.
Germain, R., & Katofsky, R. Bioenergy Interagency Working Group. Recommendations
for a Bioenergy Plan for California. 2006. Web. 30 May 2011.
71
<http://www.energy.ca.gov/2006publications/CEC-600-2006-004/CEC-600-2006-
004-F.PDF>.
Golueke, C. G., Oswald, W. J., & Gotaas, H. B. (1957). Anaerobic Digestion of Algae.
Applied and Environmental Microbiology, 5(1), 47.
Hashimoto, A. G. (1986). Ammonia Inhibition of Methanogenesis from Cattle Wastes.
Agricultural Wastes, 17(4), 241-261.
Heimel, D.E. (2010). Anaerobic Co-digestion of Wastewater Treatment Pond Algae with
Wastewater Sludge, Master’s Thesis, Civil and Environmental Engineering,
California Polytechnic State University, San Luis Obispo, p.56.
Koster, I. W., & Lettinga, G. Anaerobic Digestion at Extreme Ammonia Concentrations.
Biological Wastes, 25(1), 51-59.
Lundquist (2007). CEC Energy Innovation Small Grants (EISG) proposal.
Lundquist, T. J., Woertz, I. C., Quinn ,N. W. T., & Benemann, J. R. (2010). "A Realistic
Technology and Engineering Assessment of Algae Biofuel Production" Energy
Biosciences Institute. <http://works.bepress.com/tlundqui/5>
McCarty, P. L. (1964). Anaerobic Waste Treatment Fundamentals. Public Works, 123-
126.
72
Samson, R. & LeDuy, A. (1983). Improved performance of anaerobic digestion of
Spirulina maxima algal biomass by addition of carbon-rich wastes. Biotechnology
Letters, 5(10) 677-682.
Sialve, B., Bernet, N., & Bernard, O. (2009). Anaerobic digestion of microalgae as a
necessary step to make microalgal biodiesel sustainable. Biotechnology Advances,
27(4), 409–416.
Tchobanoglous, G., Burton, F. L., & Stensel, H. D. (2003). Wastewater Engineering:
Treatment and Reuse. New York: McGraw-Hill Science/Engineering/Math.
U.S. DOE 2010. National Algal Biofuels Technology Roadmap. U.S. Department of
Energy, Office of Energy Efficiency and Renewable Energy, Biomass Program.
<http://biomass.energy.gov>
Yen, H. W., & Brune, D. E. (2007). Anaerobic co-digestion of algal sludge and waste
paper to produce methane. Bioresource Technology, 98(1), 130–134.
Zhang, R., El-Mashad, H. M., Hartman, K., Wang, F., Liu, G., Choate, C., & Gamble, P.
(2007). Characterization of food waste as a feedstock for anaerobic digestion.
Bioresource Technology, 98(9), 929-935.