shopping independents - nationalgrocers.org · how independent shoppers spend their time in the...
TRANSCRIPT

A National Survey Defining Real Growth Opportunities
Shopping Independents
February 2018 1
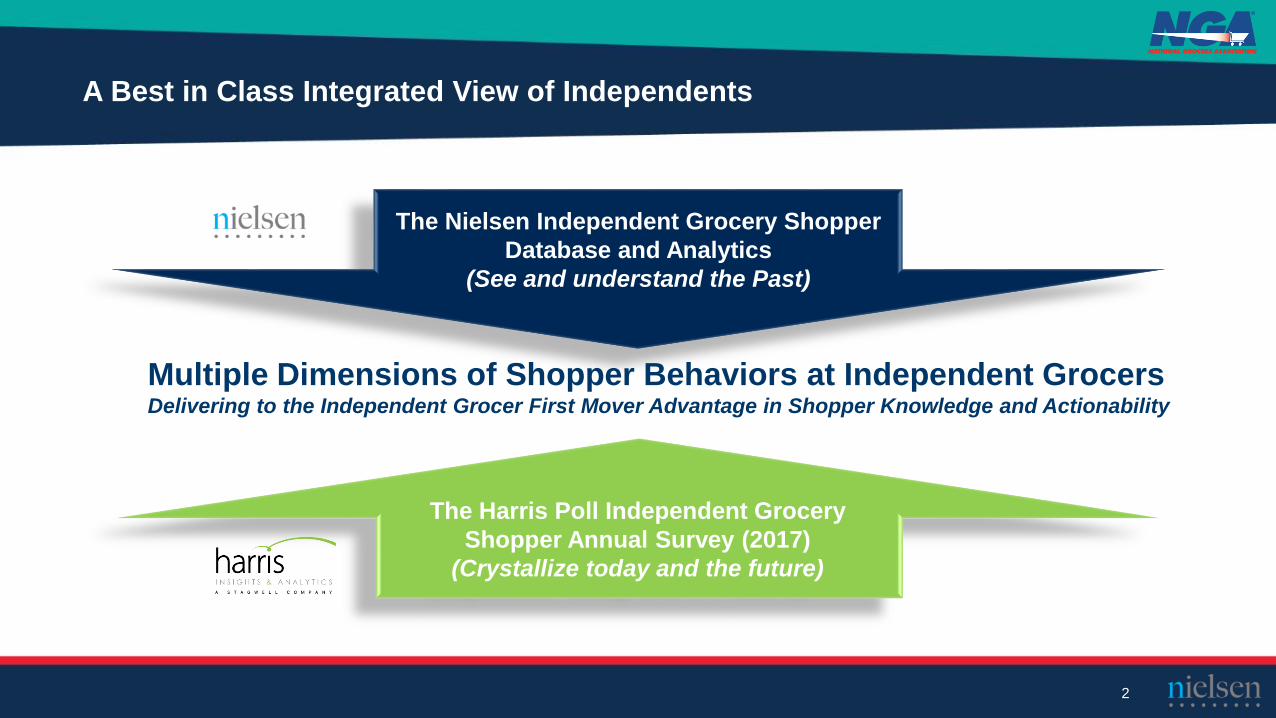
A Best in Class Integrated View of Independents
2
The Nielsen Independent Grocery Shopper
Database and Analytics
(See and understand the Past)
The Harris Poll Independent Grocery
Shopper Annual Survey (2017)
(Crystallize today and the future)
Multiple Dimensions of Shopper Behaviors at Independent GrocersDelivering to the Independent Grocer First Mover Advantage in Shopper Knowledge and Actionability
The Nielsen Independents
Database and Analytics
(See and understand the Past)
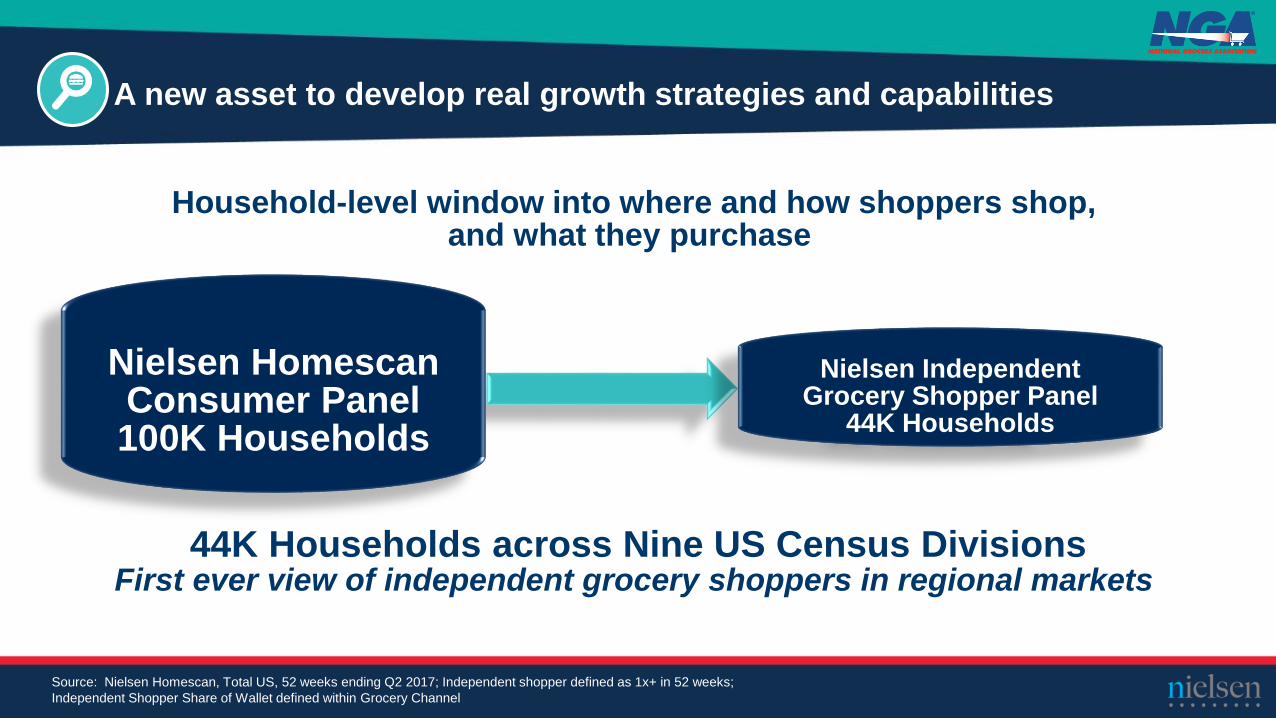
A new asset to develop real growth strategies and capabilities
Nielsen Homescan Consumer Panel100K Households
Nielsen Independent Grocery Shopper Panel
44K Households
Household-level window into where and how shoppers shop, and what they purchase
44K Households across Nine US Census DivisionsFirst ever view of independent grocery shoppers in regional markets
Source: Nielsen Homescan, Total US, 52 weeks ending Q2 2017; Independent shopper defined as 1x+ in 52 weeks;
Independent Shopper Share of Wallet defined within Grocery Channel

Windows into competing in your local trading regions
5,700
1,900
4,200
4,5002,800
7,400
6,800
3,1008,000
The power to benchmark in your region, multiple similar regions, and nationally
Source: Nielsen Homescan, Total US, 52 weeks ending Q2 2017; Independent shopper defined as 1x+ in 52 weeks;
Sample size by regions
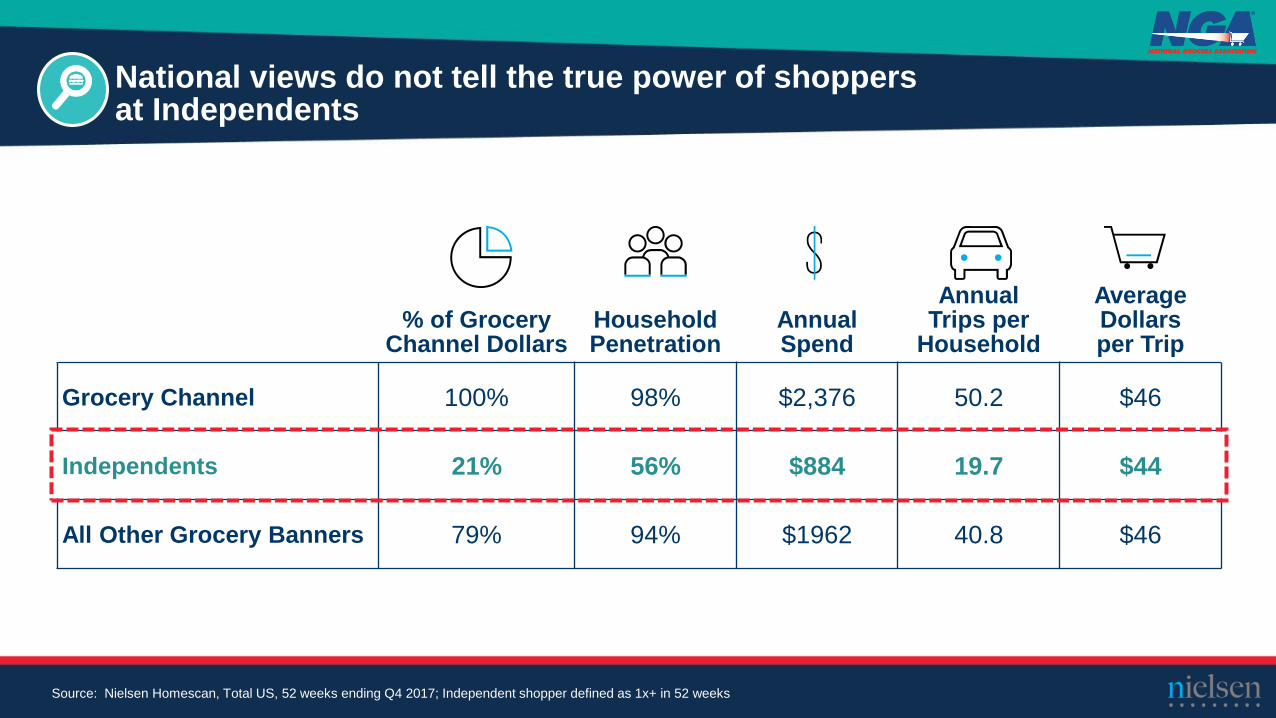
National views do not tell the true power of shoppers at Independents
• Source: Nielsen Homescan, 52 weeks ending 7/1/2017, All Shoppers, Total Store
% of Grocery Channel Dollars
Household Penetration
Annual Spend
AnnualTrips per
Household
Average Dollars per Trip
Grocery Channel 100% 98% $2,376 50.2 $46
Independents 21% 56% $884 19.7 $44
All Other Grocery Banners 79% 94% $1962 40.8 $46
Source: Nielsen Homescan, Total US, 52 weeks ending Q4 2017; Independent shopper defined as 1x+ in 52 weeks

Illustrating the buying power of shopper loyalty at Independents
Independent Shopper
(1x+ Shopper)
Independent Shopper w/ 50%+ SOW
Independent Shopper w/ <50% SOW
Share of Wallet of Total Market 13% 69% 11%
Percent of Independent Shoppers 100% 10% 90%
Annual Spend $884 $3,287 $641
Trips per Household 19.7 52.7 16.5
Dollars per Trip $44 $62 $38
Source: Nielsen Homescan, Total US, 52 weeks ending Q4 2017; Independent shopper defined as 1x+ in 52 weeks, Share of Wallet
defined in Total Outlet Universe
More Loyal Households Less Loyal Households
Total USAAnnual Spend: $3,287
Dollars per Trip: $62
Trips Per Year: 52.7
Share of Wallet: 69%
Household Penetration: 6%
Percent Sold on Deal: 35%
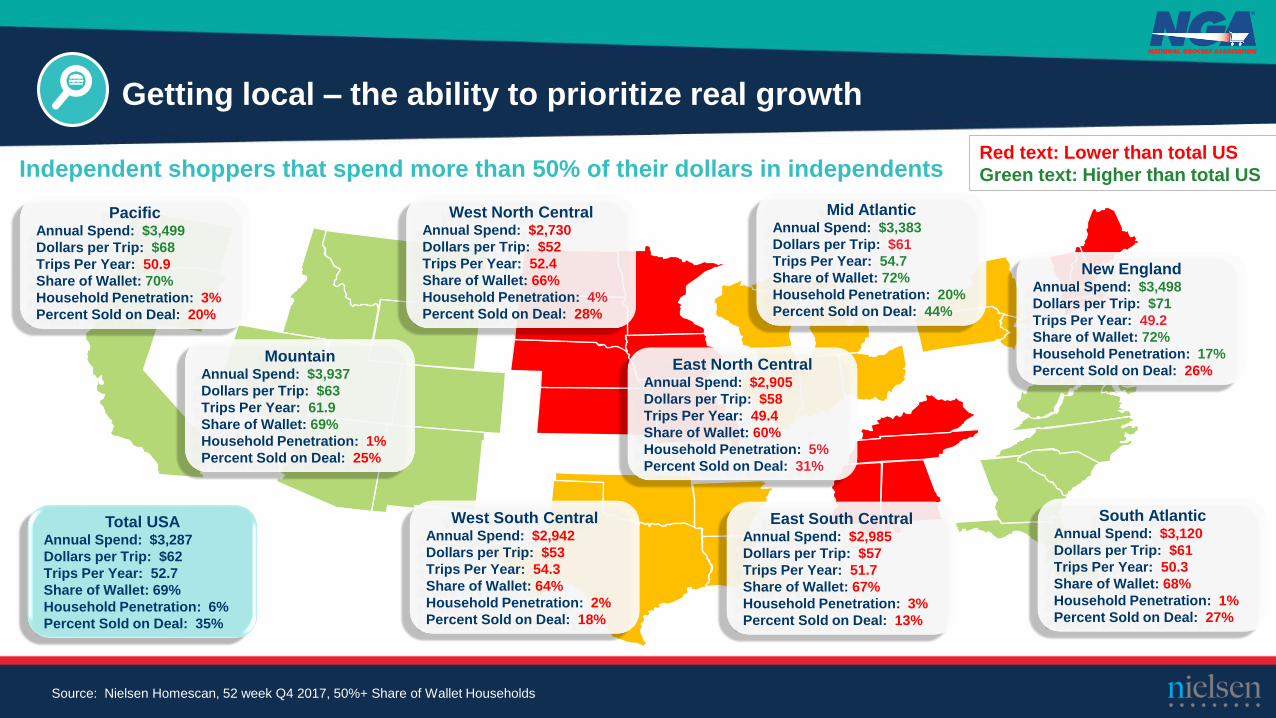
Getting local – the ability to prioritize real growth
Independent shoppers that spend more than 50% of their dollars in independents
Source: Nielsen Homescan, 52 week Q4 2017, 50%+ Share of Wallet Households
PacificAnnual Spend: $3,499
Dollars per Trip: $68
Trips Per Year: 50.9
Share of Wallet: 70%
Household Penetration: 3%
Percent Sold on Deal: 20%
MountainAnnual Spend: $3,937
Dollars per Trip: $63
Trips Per Year: 61.9
Share of Wallet: 69%
Household Penetration: 1%
Percent Sold on Deal: 25%
West North CentralAnnual Spend: $2,730
Dollars per Trip: $52
Trips Per Year: 52.4
Share of Wallet: 66%
Household Penetration: 4%
Percent Sold on Deal: 28%
West South CentralAnnual Spend: $2,942
Dollars per Trip: $53
Trips Per Year: 54.3
Share of Wallet: 64%
Household Penetration: 2%
Percent Sold on Deal: 18%
East North CentralAnnual Spend: $2,905
Dollars per Trip: $58
Trips Per Year: 49.4
Share of Wallet: 60%
Household Penetration: 5%
Percent Sold on Deal: 31%
East South CentralAnnual Spend: $2,985
Dollars per Trip: $57
Trips Per Year: 51.7
Share of Wallet: 67%
Household Penetration: 3%
Percent Sold on Deal: 13%
Mid AtlanticAnnual Spend: $3,383
Dollars per Trip: $61
Trips Per Year: 54.7
Share of Wallet: 72%
Household Penetration: 20%
Percent Sold on Deal: 44%
New EnglandAnnual Spend: $3,498
Dollars per Trip: $71
Trips Per Year: 49.2
Share of Wallet: 72%
Household Penetration: 17%
Percent Sold on Deal: 26%
South AtlanticAnnual Spend: $3,120
Dollars per Trip: $61
Trips Per Year: 50.3
Share of Wallet: 68%
Household Penetration: 1%
Percent Sold on Deal: 27%
Red text: Lower than total US
Green text: Higher than total US
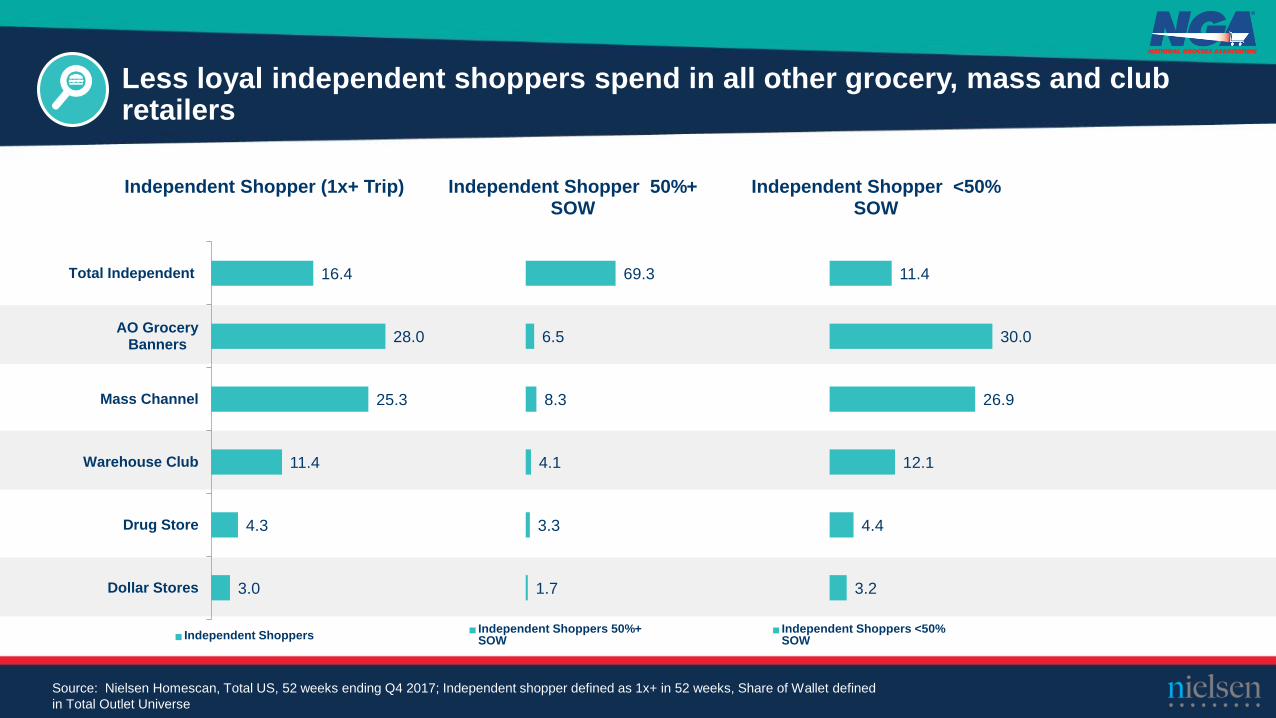
Less loyal independent shoppers spend in all other grocery, mass and club retailers
16.4
28.0
25.3
11.4
4.3
3.0
Total Independent
AO GroceryBanners
Mass Channel
Warehouse Club
Drug Store
Dollar Stores
Independent Shopper (1x+ Trip)
Independent Shoppers
69.3
6.5
8.3
4.1
3.3
1.7
Independent Shopper 50%+ SOW
Independent Shoppers 50%+ SOW
11.4
30.0
26.9
12.1
4.4
3.2
Independent Shopper <50% SOW
Independent Shoppers <50% SOW
Source: Nielsen Homescan, Total US, 52 weeks ending Q4 2017; Independent shopper defined as 1x+ in 52 weeks, Share of Wallet defined
in Total Outlet Universe

Independent households dynamics are clear
10
MIDDLE AGED &
OLDER (45+)
Independent Shopper Households versus Overall Grocery HouseholdsKey Demographic Attributes
Source: Nielsen Homescan, 52 weeks ending Q3 2017
HIGH SCHOOL EDUCATED
NO CHILDREN IN THE HOME
TWO PERSON
HOUSEHOLD
EAST & CENTRAL REGION
MULTI-CULTURAL
Source: Nielsen Homescan, Total US, 52 weeks ending Q4 2017; Independent shopper defined as 1x+ in 52 weeks
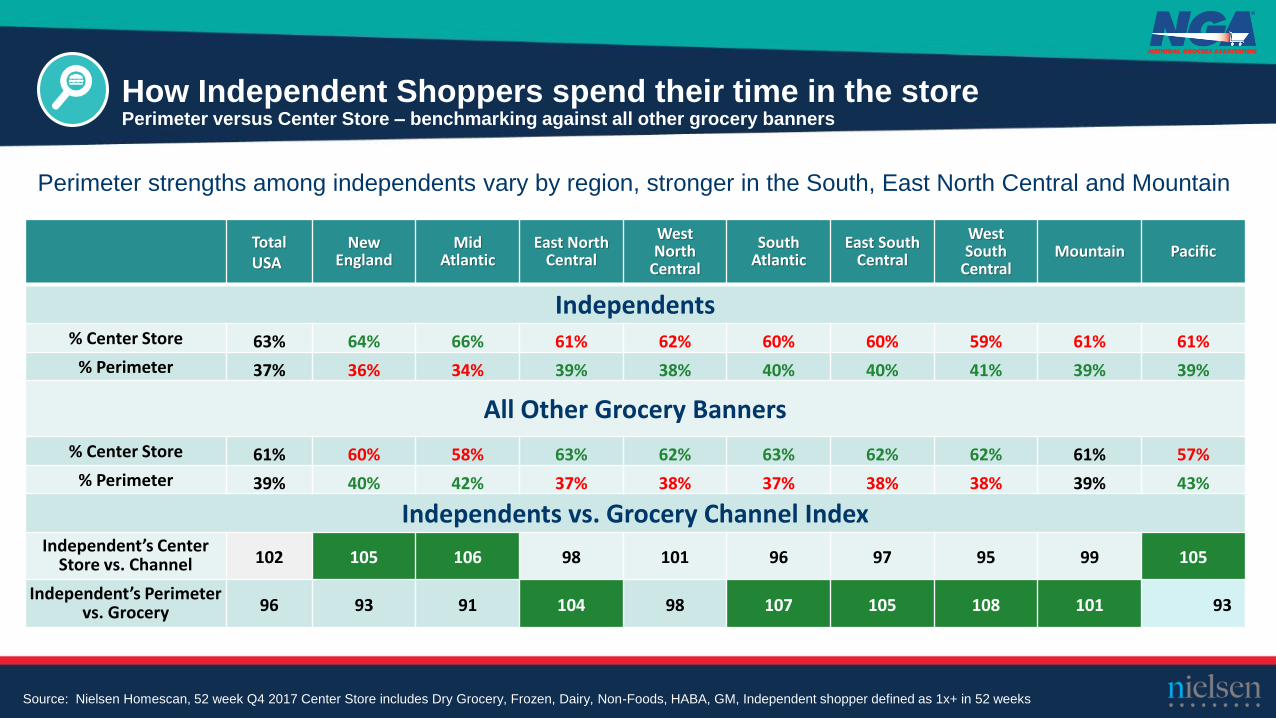
How Independent Shoppers spend their time in the store Perimeter versus Center Store – benchmarking against all other grocery banners
Source: Nielsen Homescan, 52 week Q4 2017 Center Store includes Dry Grocery, Frozen, Dairy, Non-Foods, HABA, GM, Independent shopper defined as 1x+ in 52 weeks
Total USA
NewEngland
Mid Atlantic
East North Central
West North
Central
South Atlantic
East SouthCentral
West South
CentralMountain Pacific
Independents% Center Store 63% 64% 66% 61% 62% 60% 60% 59% 61% 61%
% Perimeter 37% 36% 34% 39% 38% 40% 40% 41% 39% 39%
All Other Grocery Banners
% Center Store 61% 60% 58% 63% 62% 63% 62% 62% 61% 57%
% Perimeter 39% 40% 42% 37% 38% 37% 38% 38% 39% 43%
Independents vs. Grocery Channel IndexIndependent’s Center
Store vs. Channel 102 105 106 98 101 96 97 95 99 105
Independent’s Perimeter vs. Grocery 96 93 91 104 98 107 105 108 101 93
Perimeter strengths among independents vary by region, stronger in the South, East North Central and Mountain
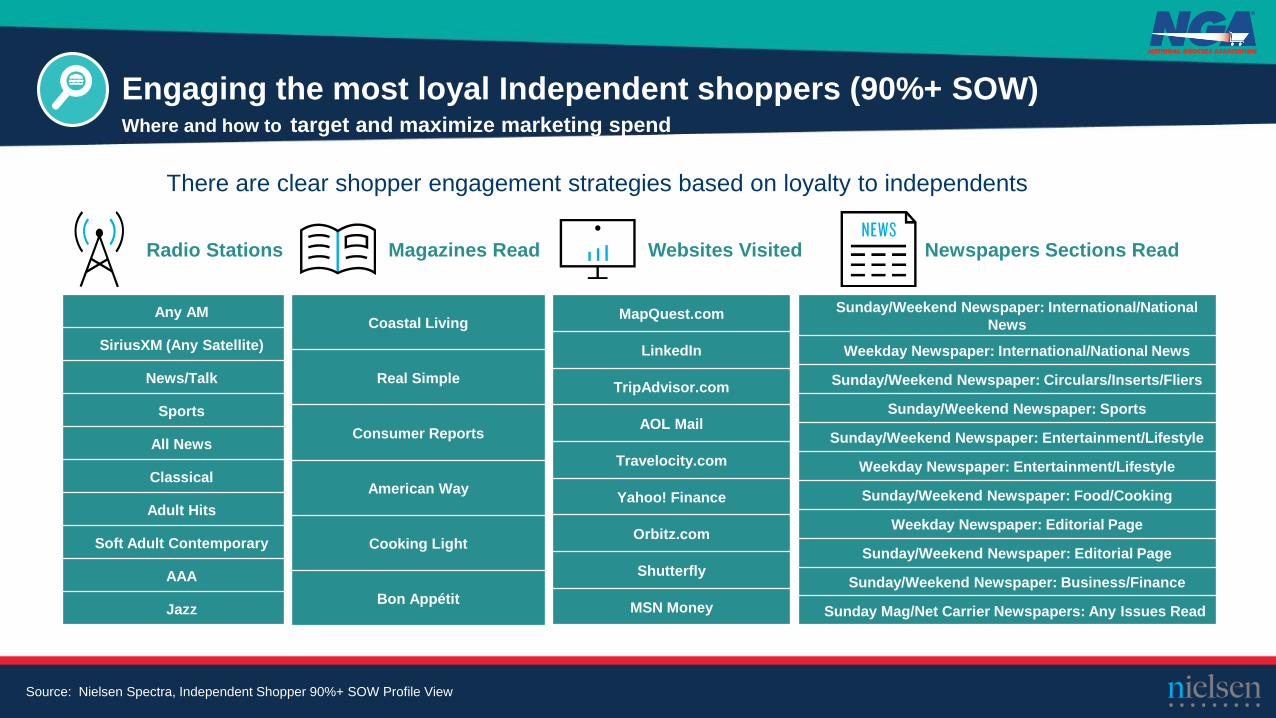
Engaging the most loyal Independent shoppers (90%+ SOW) Where and how to target and maximize marketing spend
Source: Nielsen Spectra, Independent Shopper 90%+ SOW Profile View
Coastal Living
Real Simple
Consumer Reports
American Way
Cooking Light
Bon Appétit
MapQuest.com
TripAdvisor.com
AOL Mail
Travelocity.com
Yahoo! Finance
Orbitz.com
Shutterfly
MSN Money
Sunday/Weekend Newspaper: International/National
News
Weekday Newspaper: International/National News
Sunday/Weekend Newspaper: Circulars/Inserts/Fliers
Sunday/Weekend Newspaper: Sports
Sunday/Weekend Newspaper: Entertainment/Lifestyle
Weekday Newspaper: Entertainment/Lifestyle
Sunday/Weekend Newspaper: Food/Cooking
Weekday Newspaper: Editorial Page
Sunday/Weekend Newspaper: Editorial Page
Sunday/Weekend Newspaper: Business/Finance
Sunday Mag/Net Carrier Newspapers: Any Issues Read
Any AM
SiriusXM (Any Satellite)
News/Talk
Sports
All News
Classical
Adult Hits
Soft Adult Contemporary
AAA
Jazz
Newspapers Sections ReadWebsites VisitedRadio Stations Magazines Read
There are clear shopper engagement strategies based on loyalty to independents

The Harris Poll Independents
Annual Survey (2017)
(Crystallize today and the future)
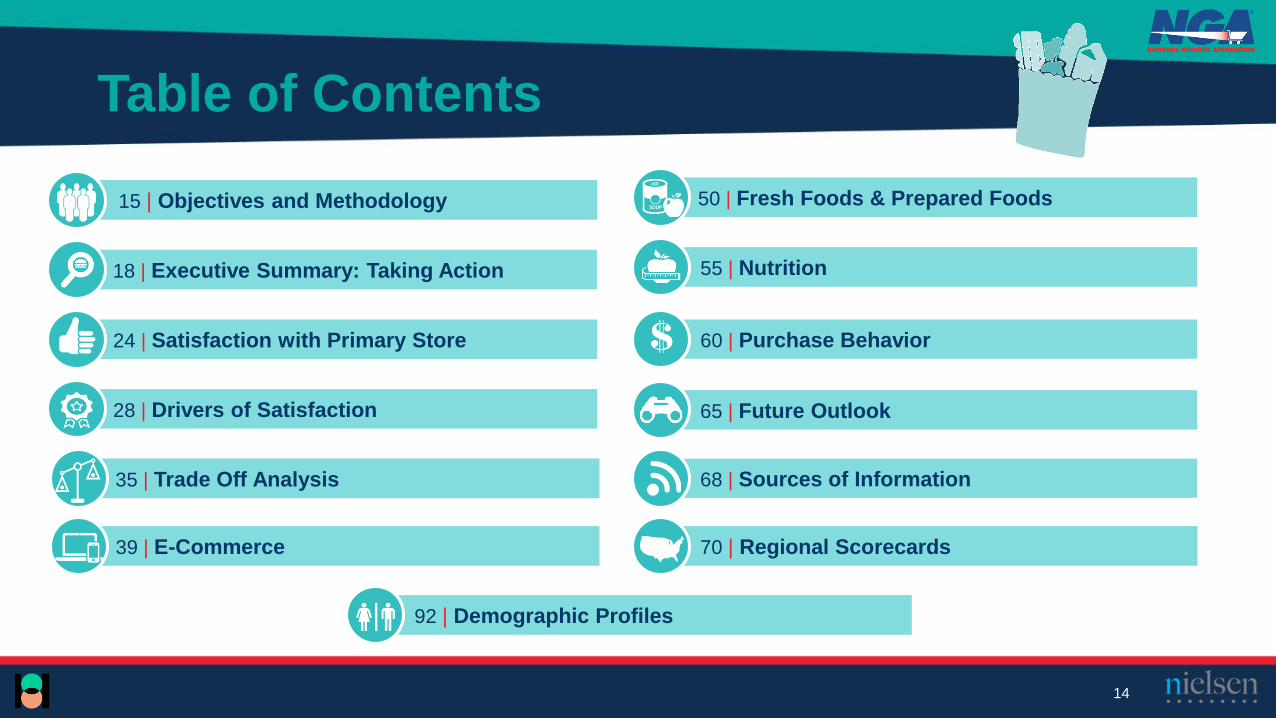
Table of Contents
14
39 | E-Commerce 70 | Regional Scorecards
15 | Objectives and Methodology 50 | Fresh Foods & Prepared Foods
18 | Executive Summary: Taking Action 55 | Nutrition
68 | Sources of Information
24 | Satisfaction with Primary Store
28 | Drivers of Satisfaction
35 | Trade Off Analysis
92 | Demographic Profiles
60 | Purchase Behavior
65 | Future Outlook

Objectives and Methodology

Objectives
The National Grocers Association has historically conducted a national survey of grocery shoppers and
presented the results to its members at The NGA Show.
Past research has been considered a definitive snap shot of the state of the Independent Grocery industry.
The focus of the survey include the following:
• Concentrating on actionable findings: We want to provide guidance to retailers about consumer
attitudes, communication channels and other concrete steps they can take to help their businesses
grow.
• Identify future trends: instead of using the survey as a snapshot of the current state of the industry,
we want to identify future trends that impact business operations for NGA members.
• Highlighting areas of differentiation across the nine US regions
• Identify changes from last year
• Present the data in exciting new ways
16
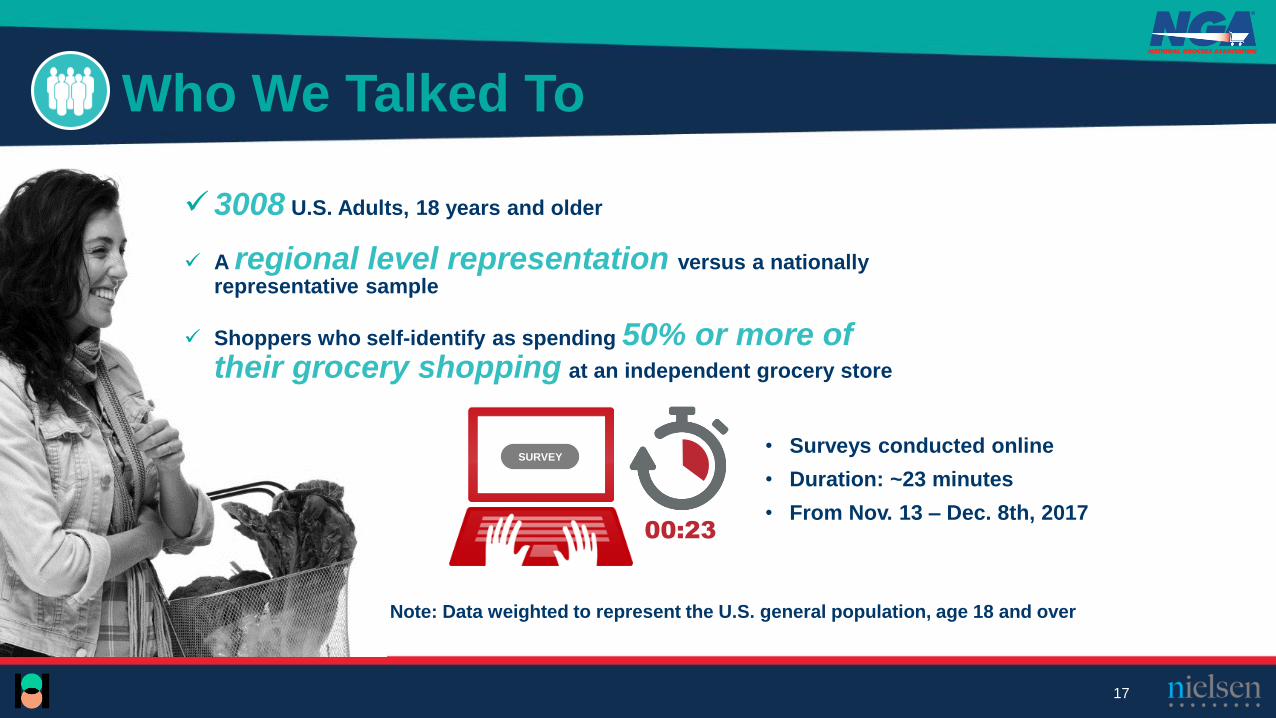
Who We Talked To
17
✓3008 U.S. Adults, 18 years and older
✓ A regional level representation versus a nationally representative sample
✓ Shoppers who self-identify as spending 50% or more of their grocery shopping at an independent grocery store
Note: Data weighted to represent the U.S. general population, age 18 and over
• Surveys conducted online
• Duration: ~23 minutes
• From Nov. 13 – Dec. 8th, 2017
SURVEY
00:23

Executive Summary
T O P I C F I N D I N G S A C T I O N S T E P S
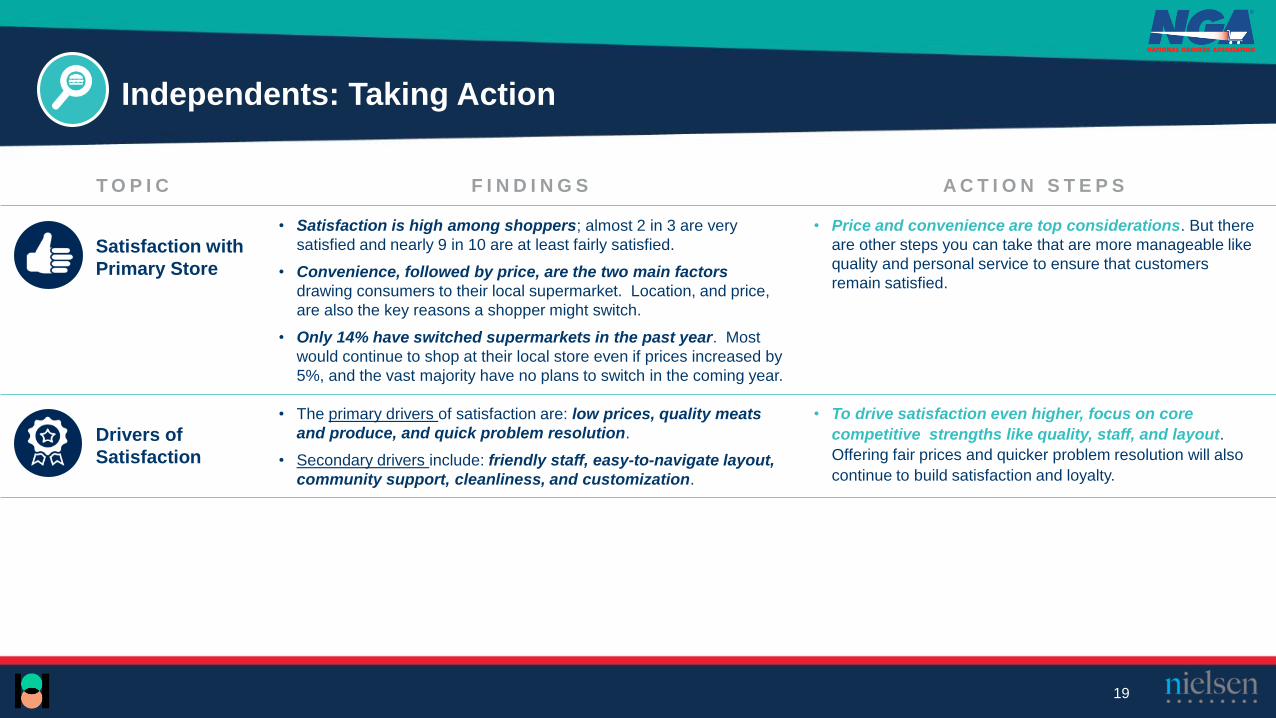
Satisfaction with
Primary Store
• Satisfaction is high among shoppers; almost 2 in 3 are very
satisfied and nearly 9 in 10 are at least fairly satisfied.
• Convenience, followed by price, are the two main factors
drawing consumers to their local supermarket. Location, and price,
are also the key reasons a shopper might switch.
• Only 14% have switched supermarkets in the past year. Most
would continue to shop at their local store even if prices increased by
5%, and the vast majority have no plans to switch in the coming year.
• Price and convenience are top considerations. But there
are other steps you can take that are more manageable like
quality and personal service to ensure that customers
remain satisfied.
Drivers of
Satisfaction
• The primary drivers of satisfaction are: low prices, quality meats
and produce, and quick problem resolution.
• Secondary drivers include: friendly staff, easy-to-navigate layout,
community support, cleanliness, and customization.
• To drive satisfaction even higher, focus on core
competitive strengths like quality, staff, and layout.
Offering fair prices and quicker problem resolution will also
continue to build satisfaction and loyalty.
Independents: Taking Action
19

T O P I C F I N D I N G S A C T I O N S T E P S
Trade Off Analysis• When considering where to shop for groceries Independents value:
low prices, quality meats and produce, friendly staff,
cleanliness, and offering locally grown produce and other
packaged goods.
• Focus on price and selling quality produce and meats,
these are the most important to Independent shoppers
across all of the 9 census regions.
• There are aspects of the shopping experience that are
of higher importance based on region. Take a
customized approach by tailoring your efforts to what is
most important to your region.
Business
Impact
• Local supermarkets perform well on most key drivers especially
quality, staff and layout, but do not fare nearly as well for price and
resolving problems.
• Over 8 in 10 shoppers prefer their local store to an online
alternative; and nearly three-quarters are willing to advocate and
recommend.
• Higher satisfaction leads to a greater likelihood your
customers will speak positively on your behalf, recommend
you, and continue to choose you over any online or offline
alternatives.
Independents: Taking Action
20

Independents: Taking Action
21
T O P I C F I N D I N G S A C T I O N S T E P S
E-Commerce
• Online grocery shopping has yet to catch on for Independents. (only 11% shop online today). For those who do, consumers use online grocery shopping more as a supplement to the store, not a replacement. In fact, they still make most of their purchases at the brick-and-mortar location.
• Convenience is the main rationale for shopping online for groceries, while the need for sight is the biggest barrier. And delivery is far more popular than “click and collect.”
• Not many rate their local store’s technology (website/app) very well, and don’t seem to find the same products or prices online as offline.
• Most would like fees in the $0-5 range (lower for click and collect than delivery), but even offering a reasonable fee does not appear likely to change behavior.
• That said, about 3 in 10 anticipate an uptick in their online grocery shopping over the next five years.
• Increase e-commerce investments in a targeted fashion, focusing on ‘target markets’ that make sense.
• Emphasize the benefit of convenience and keep fees low and consistent.
• Do research and make changes to improve the online modes (website/app) to become more user-friendly.
• Find a strategy to address concerns about sight and freshness. High quality, fresh food at no additional cost = table stakes for e-commerce.
Fresh Foods &
Prepared Foods
• Produce is the most important fresh food, while the top preferences for prepared foods are split between entrees, side dishes and salads.
• For both fresh and prepared foods, shoppers care most about freshness and appearance.
• Similar to last year Independent shoppers more than any other group say it’s very important for prepared food to be prepared fresh every day.
• Pay close attention to freshness and appearance. This is a clear place to differentiate from the competition. No traits matter more with fresh and prepared foods; freshness is one key reason consumers return to the store.
Independents: Taking Action
22
T O P I C F I N D I N G S A C T I O N S T E P S
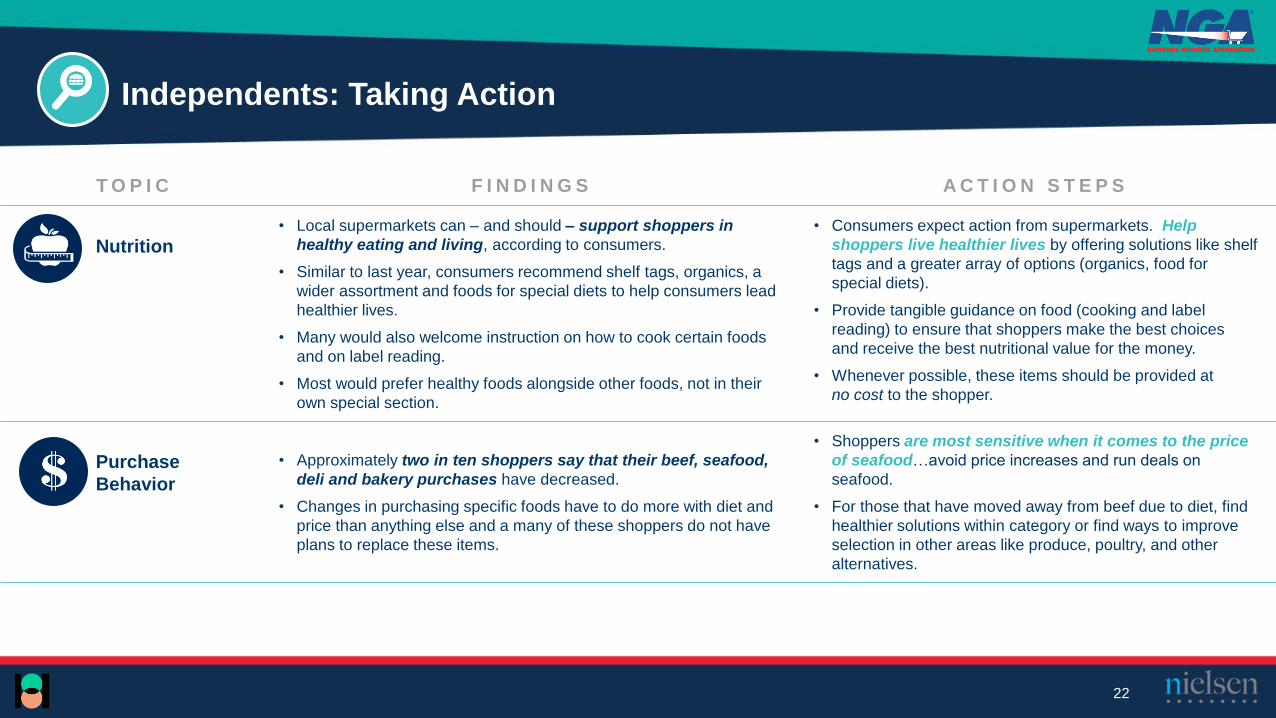
Nutrition• Local supermarkets can – and should – support shoppers in
healthy eating and living, according to consumers.
• Similar to last year, consumers recommend shelf tags, organics, a
wider assortment and foods for special diets to help consumers lead
healthier lives.
• Many would also welcome instruction on how to cook certain foods
and on label reading.
• Most would prefer healthy foods alongside other foods, not in their
own special section.
• Consumers expect action from supermarkets. Help
shoppers live healthier lives by offering solutions like shelf
tags and a greater array of options (organics, food for
special diets).
• Provide tangible guidance on food (cooking and label
reading) to ensure that shoppers make the best choices
and receive the best nutritional value for the money.
• Whenever possible, these items should be provided at
no cost to the shopper.
Purchase
Behavior
• Approximately two in ten shoppers say that their beef, seafood,
deli and bakery purchases have decreased.
• Changes in purchasing specific foods have to do more with diet and
price than anything else and a many of these shoppers do not have
plans to replace these items.
• Shoppers are most sensitive when it comes to the price
of seafood…avoid price increases and run deals on
seafood.
• For those that have moved away from beef due to diet, find
healthier solutions within category or find ways to improve
selection in other areas like produce, poultry, and other
alternatives.

Independents: Taking Action
23
T O P I C F I N D I N G S A C T I O N S T E P S
Future Outlook• A price increase of 5% to Independent shopper’s weekly shopping
basket, will cause nearly two in ten (19%) to leave their local
supermarket. A 10% price increase will have nearly six in ten (58%)
of shoppers looking for another place to do their grocery shopping.
• Carefully manage price increases, but if it has to be done
the realistic threshold is most likely in the 2-3% range.
Develop a prioritized category specific price increase
strategy.
Sources of
Information
• Half don’t use social networking tools to gain information on food.
• But for those who do, Facebook is the pre-eminent source.
• Given the importance (and growth) of social media to half
the population, you can’t afford not to be online. Develop
an affordable Omnichannel capability set where on-line
growth is fully integrated.

Satisfaction with Independents
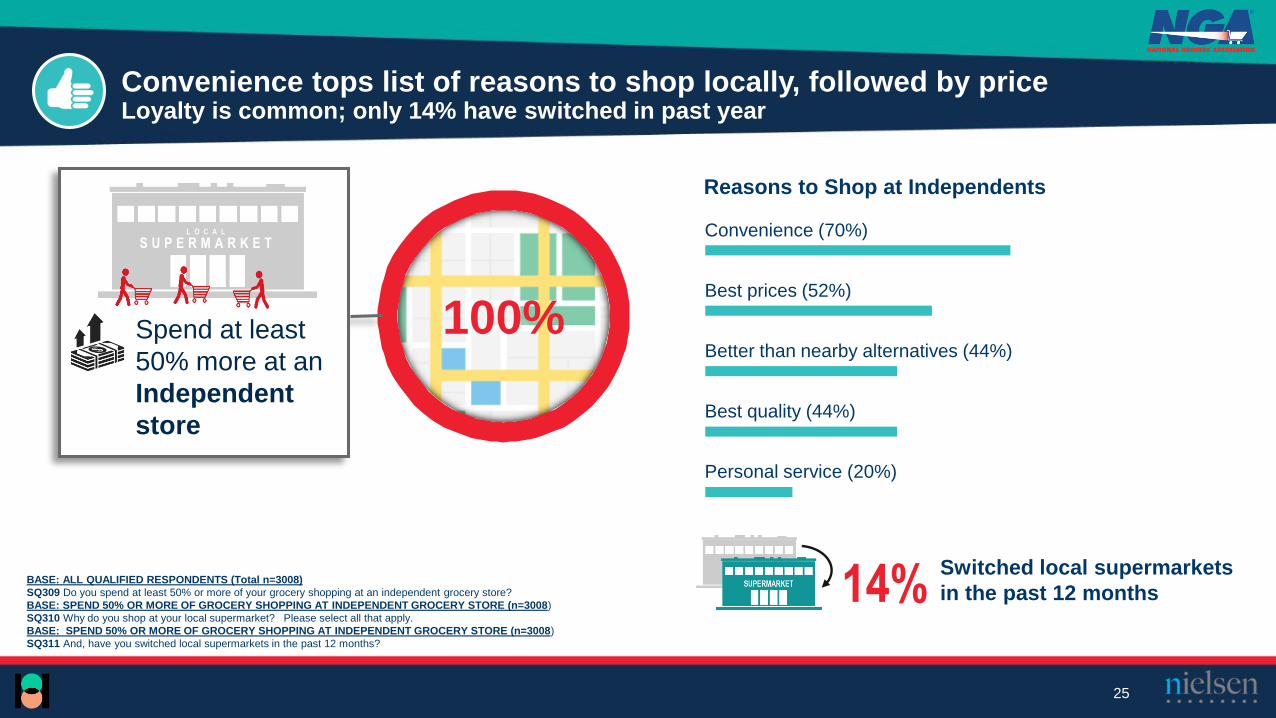
BASE: ALL QUALIFIED RESPONDENTS (Total n=3008)
SQ309 Do you spend at least 50% or more of your grocery shopping at an independent grocery store?
BASE: SPEND 50% OR MORE OF GROCERY SHOPPING AT INDEPENDENT GROCERY STORE (n=3008)
SQ310 Why do you shop at your local supermarket? Please select all that apply.
BASE: SPEND 50% OR MORE OF GROCERY SHOPPING AT INDEPENDENT GROCERY STORE (n=3008)
SQ311 And, have you switched local supermarkets in the past 12 months?
Convenience tops list of reasons to shop locally, followed by priceLoyalty is common; only 14% have switched in past year
25
Convenience (70%)
Best prices (52%)
Better than nearby alternatives (44%)
Best quality (44%)
Personal service (20%)
Reasons to Shop at Independents
S U P E R M A R K E TL O C A L
Spend at least
50% more at an
Independent
store
100%
Switched local supermarkets
in the past 12 months14%
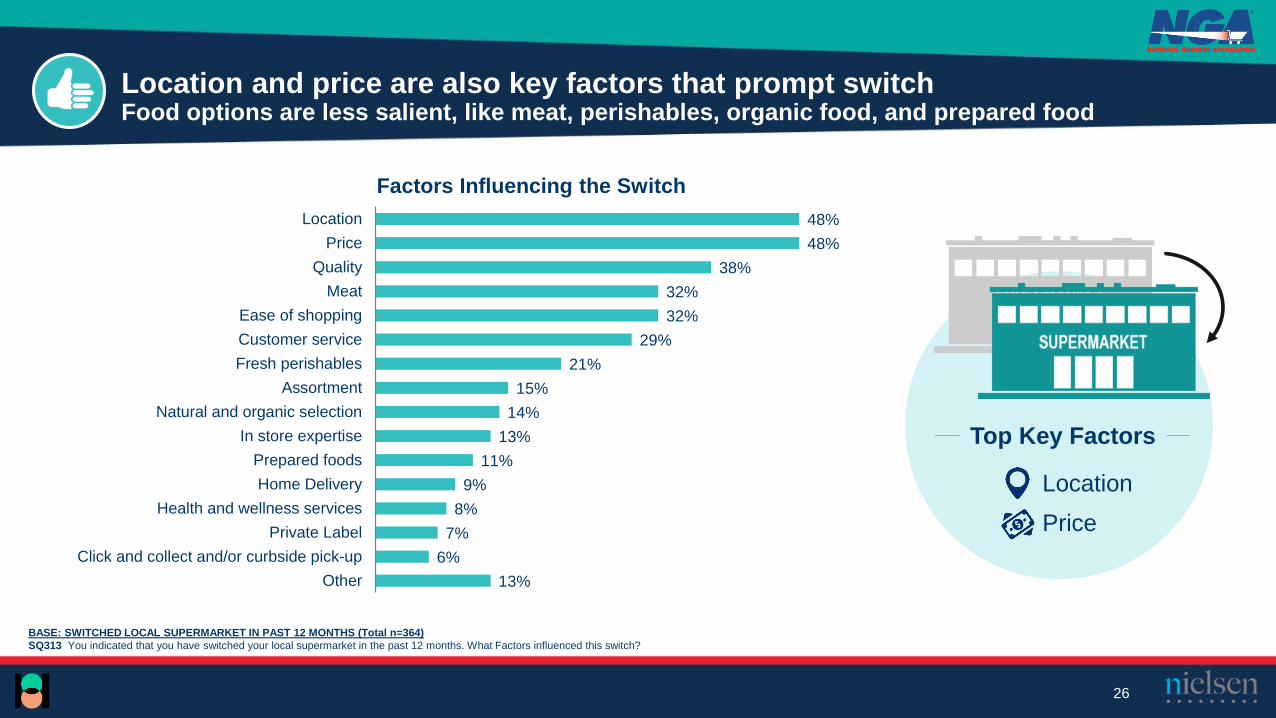
BASE: SWITCHED LOCAL SUPERMARKET IN PAST 12 MONTHS (Total n=364)
SQ313 You indicated that you have switched your local supermarket in the past 12 months. What Factors influenced this switch?
Location and price are also key factors that prompt switchFood options are less salient, like meat, perishables, organic food, and prepared food
26
13%
6%
7%
8%
9%
11%
13%
14%
15%
21%
29%
32%
32%
38%
48%
48%
Other
Click and collect and/or curbside pick-up
Private Label
Health and wellness services
Home Delivery
Prepared foods
In store expertise
Natural and organic selection
Assortment
Fresh perishables
Customer service
Ease of shopping
Meat
Quality
Price
Location
Factors Influencing the Switch
Price
Location
Top Key Factors
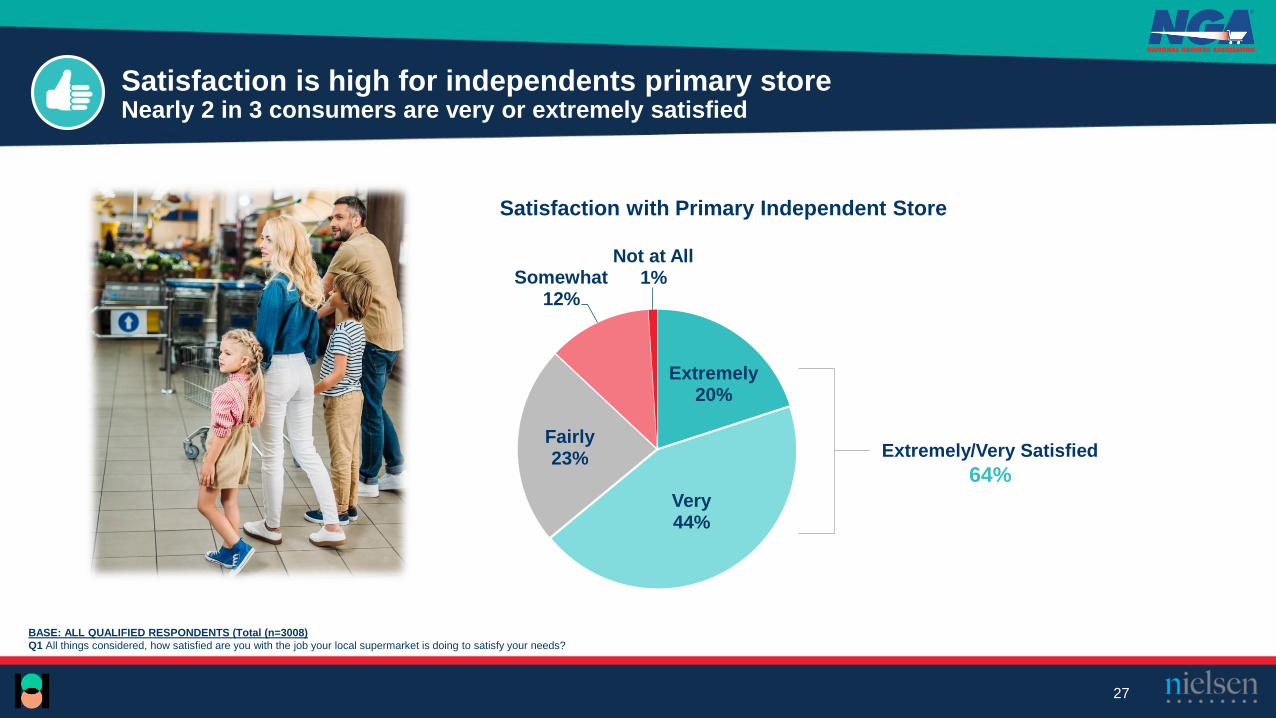
BASE: ALL QUALIFIED RESPONDENTS (Total (n=3008)
Q1 All things considered, how satisfied are you with the job your local supermarket is doing to satisfy your needs?
Extremely20%
Very44%
Fairly23%
Somewhat12%
Not at All1%
Extremely/Very Satisfied
64%
Satisfaction is high for independents primary storeNearly 2 in 3 consumers are very or extremely satisfied
27
Satisfaction with Primary Independent Store

Drivers of Shopping Satisfaction at Independents
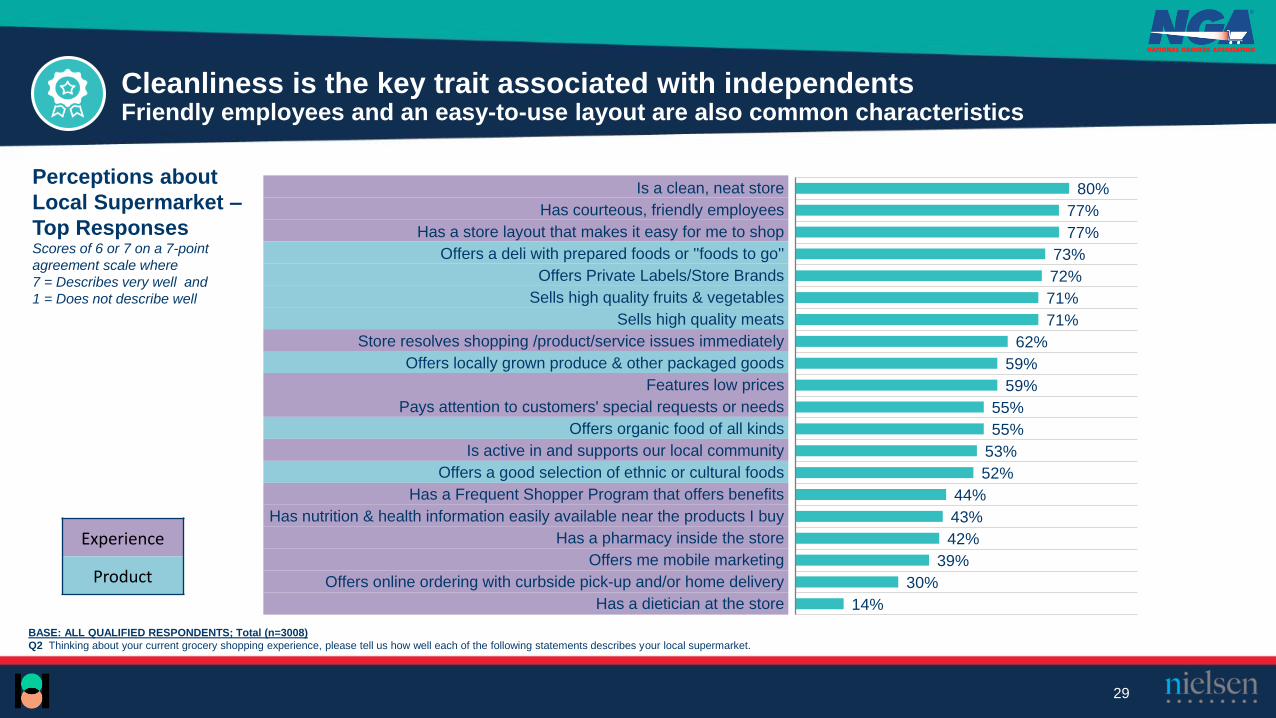
BASE: ALL QUALIFIED RESPONDENTS; Total (n=3008)
Q2 Thinking about your current grocery shopping experience, please tell us how well each of the following statements describes your local supermarket.
Cleanliness is the key trait associated with independents Friendly employees and an easy-to-use layout are also common characteristics
29
80%
77%
77%
73%
72%
71%
71%
62%
59%
59%
55%
55%
53%
52%
44%
43%
42%
39%
30%
14%
Is a clean, neat store
Has courteous, friendly employees
Has a store layout that makes it easy for me to shop
Offers a deli with prepared foods or ''foods to go''
Offers Private Labels/Store Brands
Sells high quality fruits & vegetables
Sells high quality meats
Store resolves shopping /product/service issues immediately
Offers locally grown produce & other packaged goods
Features low prices
Pays attention to customers' special requests or needs
Offers organic food of all kinds
Is active in and supports our local community
Offers a good selection of ethnic or cultural foods
Has a Frequent Shopper Program that offers benefits
Has nutrition & health information easily available near the products I buy
Has a pharmacy inside the store
Offers me mobile marketing
Offers online ordering with curbside pick-up and/or home delivery
Has a dietician at the store
Perceptions about
Local Supermarket –
Top ResponsesScores of 6 or 7 on a 7-point
agreement scale where
7 = Describes very well and
1 = Does not describe well
Experience
Product
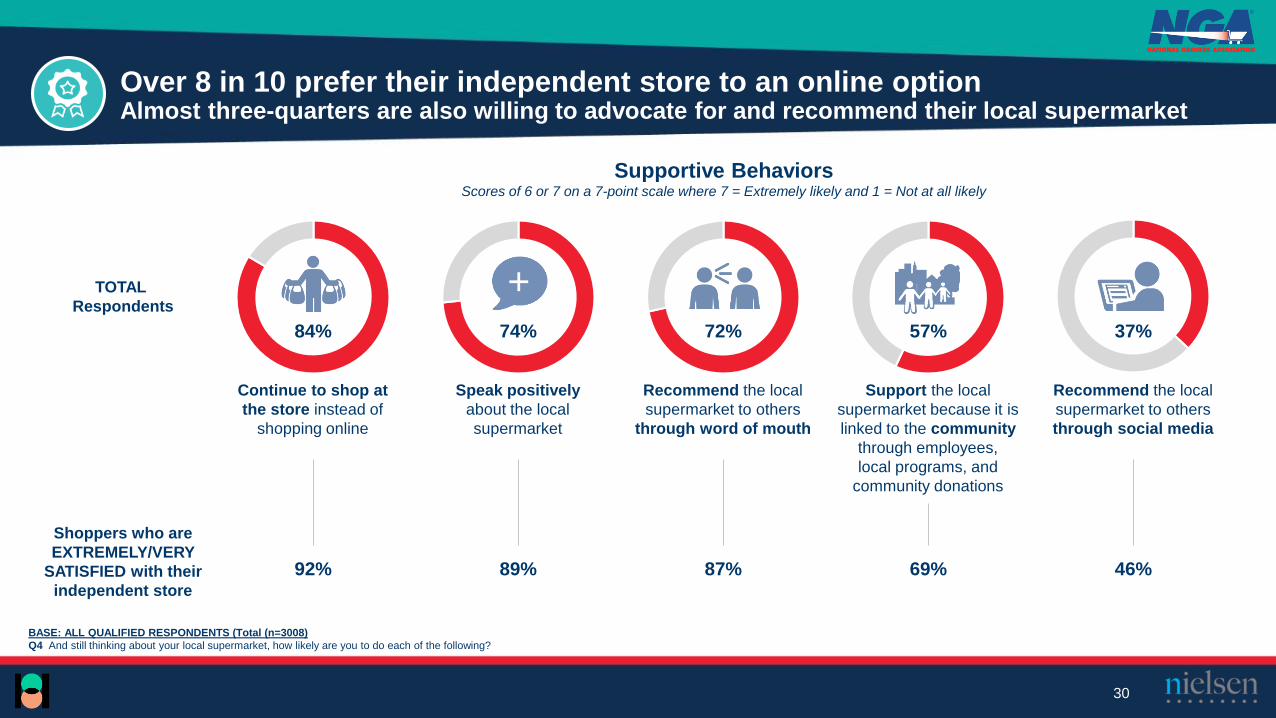
BASE: ALL QUALIFIED RESPONDENTS (Total (n=3008)
Q4 And still thinking about your local supermarket, how likely are you to do each of the following?
Over 8 in 10 prefer their independent store to an online optionAlmost three-quarters are also willing to advocate for and recommend their local supermarket
30
Supportive BehaviorsScores of 6 or 7 on a 7-point scale where 7 = Extremely likely and 1 = Not at all likely
TOTAL
Respondents
Shoppers who are
EXTREMELY/VERY
SATISFIED with their
independent store
84% 74% 72% 57% 37%
Continue to shop at
the store instead of
shopping online
Speak positively
about the local
supermarket
Recommend the local
supermarket to others
through word of mouth
Support the local
supermarket because it is
linked to the community
through employees,
local programs, and
community donations
Recommend the local
supermarket to others
through social media
92% 89% 87% 69% 46%
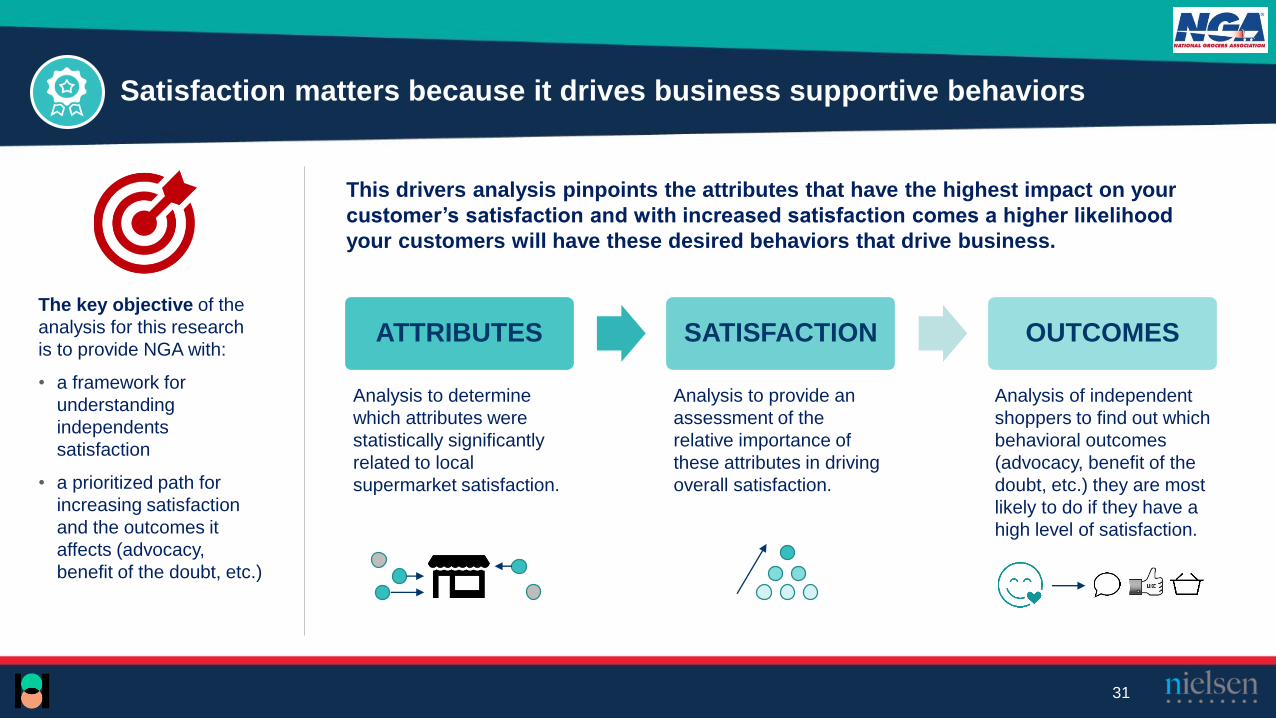
31
Satisfaction matters because it drives business supportive behaviors
ATTRIBUTES SATISFACTION OUTCOMES
This drivers analysis pinpoints the attributes that have the highest impact on your
customer’s satisfaction and with increased satisfaction comes a higher likelihood
your customers will have these desired behaviors that drive business.
The key objective of the
analysis for this research
is to provide NGA with:
• a framework for
understanding
independents
satisfaction
• a prioritized path for
increasing satisfaction
and the outcomes it
affects (advocacy,
benefit of the doubt, etc.)
Analysis to determine
which attributes were
statistically significantly
related to local
supermarket satisfaction.
Analysis to provide an
assessment of the
relative importance of
these attributes in driving
overall satisfaction.
Analysis of independent
shoppers to find out which
behavioral outcomes
(advocacy, benefit of the
doubt, etc.) they are most
likely to do if they have a
high level of satisfaction.
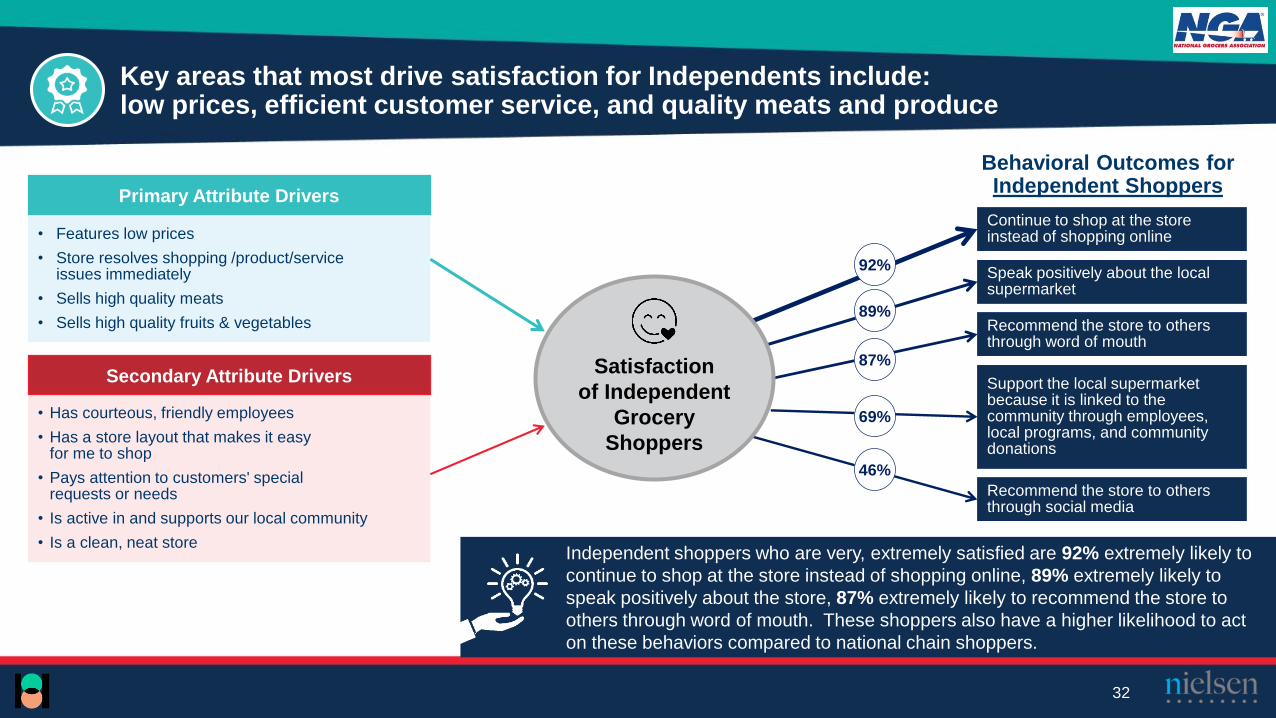
Independent shoppers who are very, extremely satisfied are 92% extremely likely to
continue to shop at the store instead of shopping online, 89% extremely likely to
speak positively about the store, 87% extremely likely to recommend the store to
others through word of mouth. These shoppers also have a higher likelihood to act
on these behaviors compared to national chain shoppers.
Key areas that most drive satisfaction for Independents include: low prices, efficient customer service, and quality meats and produce
Secondary Attribute Drivers
• Has courteous, friendly employees
• Has a store layout that makes it easy for me to shop
• Pays attention to customers' special requests or needs
• Is active in and supports our local community
• Is a clean, neat store
• Features low prices
• Store resolves shopping /product/service issues immediately
• Sells high quality meats
• Sells high quality fruits & vegetables
Primary Attribute Drivers
Satisfaction
of Independent
Grocery
Shoppers
Speak positively about the local supermarket
Recommend the store to others through word of mouth
Support the local supermarket because it is linked to the community through employees, local programs, and community donations
92%
89%
87%
46%
Behavioral Outcomes for Independent Shoppers
32
Continue to shop at the store instead of shopping online
Recommend the store to others through social media
69%

Importance vs. Performance
33
Low Importance
High Performance
High Importance
High Performance
Low Importance
Low Performance
High Importance
Low PerformanceMea
n Im
po
rtan
ce
Mean Performance
MAINTAIN LEVERAGE
MONITOR IMPROVE
Derived Importance (Impact of Attributes on Satisfaction)
Low High
Pe
rfo
rma
nc
e (
% A
gre
e (
6-7
))
Lo
wH
igh
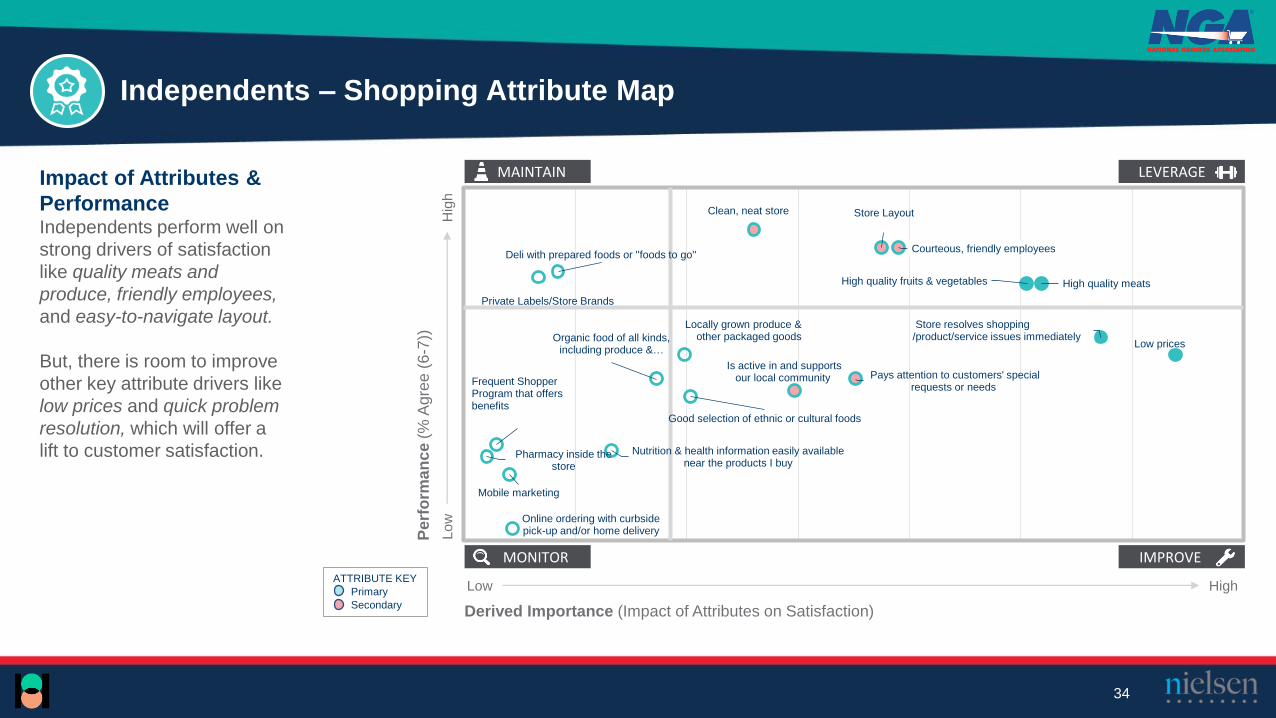
Impact of Attributes &
PerformanceIndependents perform well on
strong drivers of satisfaction
like quality meats and
produce, friendly employees,
and easy-to-navigate layout.
But, there is room to improve
other key attribute drivers like
low prices and quick problem
resolution, which will offer a
lift to customer satisfaction.
Derived Importance (Impact of Attributes on Satisfaction)
Low High
Pe
rfo
rma
nc
e (
% A
gre
e (
6-7
))
Lo
wH
igh
ATTRIBUTE KEY
Primary
Secondary
MAINTAIN LEVERAGE
MONITOR IMPROVE
Independents – Shopping Attribute Map
34
Low prices
Store resolves shopping /product/service issues immediately
High quality meatsHigh quality fruits & vegetables
Courteous, friendly employees
Store Layout
Pays attention to customers' special requests or needs
Is active in and supports our local community
Clean, neat store
Good selection of ethnic or cultural foods
Locally grown produce & other packaged goodsOrganic food of all kinds,
including produce & …
Nutrition & health information easily available near the products I buy
Deli with prepared foods or ''foods to go''
Private Labels/Store Brands
Online ordering with curbside pick-up and/or home delivery
Mobile marketing
Frequent Shopper Program that offers benefits
Pharmacy inside the store

Trade Off Analysis for Shopping Experience and Product Attributes
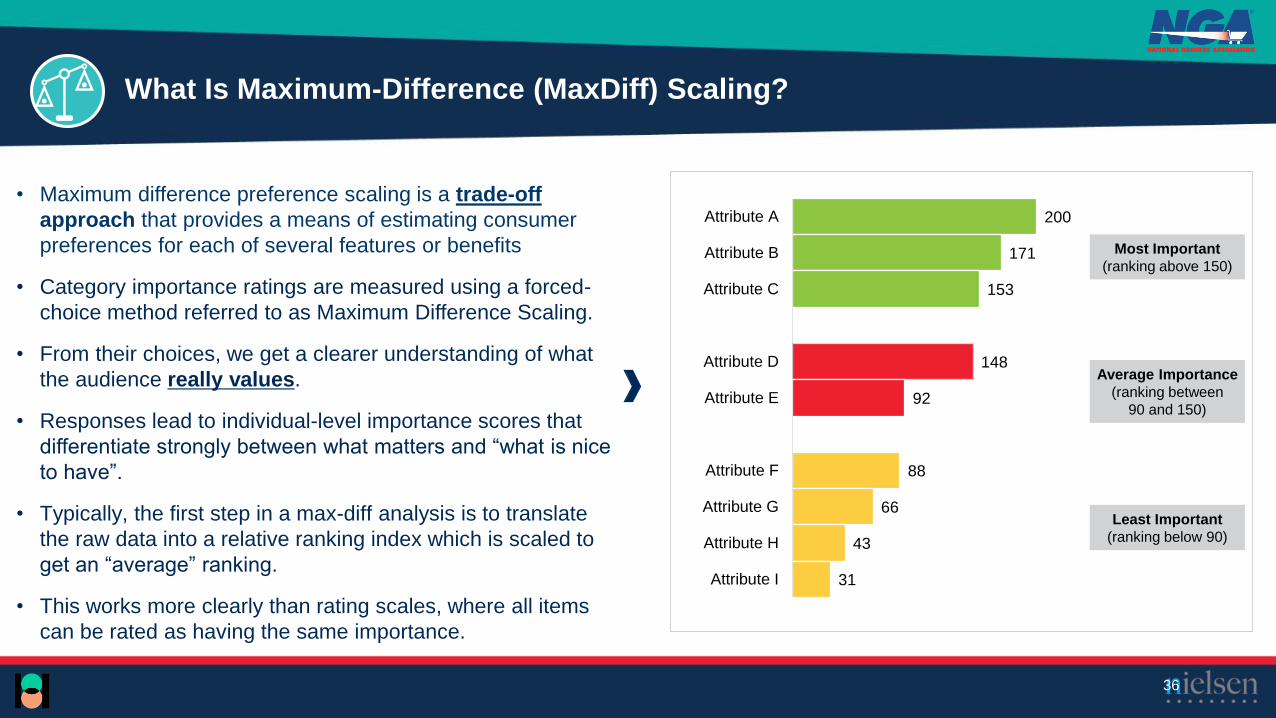
What Is Maximum-Difference (MaxDiff) Scaling?
• Maximum difference preference scaling is a trade-off
approach that provides a means of estimating consumer
preferences for each of several features or benefits
• Category importance ratings are measured using a forced-
choice method referred to as Maximum Difference Scaling.
• From their choices, we get a clearer understanding of what
the audience really values.
• Responses lead to individual-level importance scores that
differentiate strongly between what matters and “what is nice
to have”.
• Typically, the first step in a max-diff analysis is to translate
the raw data into a relative ranking index which is scaled to
get an “average” ranking.
• This works more clearly than rating scales, where all items
can be rated as having the same importance.
200
171
153
148
92
88
66
43
31
Attribute A
Attribute B
Attribute C
Attribute D
Attribute E
Attribute F
Attribute G
Attribute H
Attribute I
Most Important
(ranking above 150)
Least Important
(ranking below 90)
Average Importance
(ranking between
90 and 150)
36
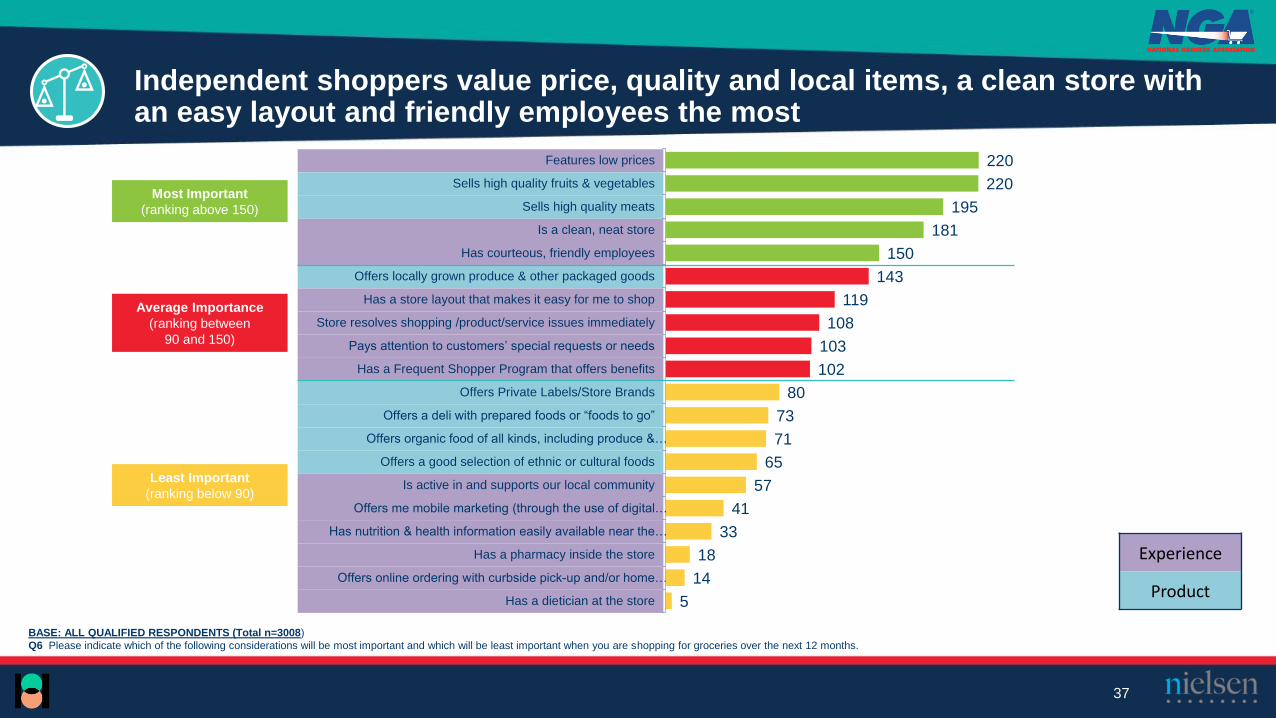
BASE: ALL QUALIFIED RESPONDENTS (Total n=3008)
Q6 Please indicate which of the following considerations will be most important and which will be least important when you are shopping for groceries over the next 12 months.
Independent shoppers value price, quality and local items, a clean store with an easy layout and friendly employees the most
37
220
220
195
181
150
143
119
108
103
102
80
73
71
65
57
41
33
18
14
5
Features low prices
Sells high quality fruits & vegetables
Sells high quality meats
Is a clean, neat store
Has courteous, friendly employees
Offers locally grown produce & other packaged goods
Has a store layout that makes it easy for me to shop
Store resolves shopping /product/service issues immediately
Pays attention to customers’ special requests or needs
Has a Frequent Shopper Program that offers benefits
Offers Private Labels/Store Brands
Offers a deli with prepared foods or “foods to go”
Offers organic food of all kinds, including produce &…
Offers a good selection of ethnic or cultural foods
Is active in and supports our local community
Offers me mobile marketing (through the use of digital…
Has nutrition & health information easily available near the…
Has a pharmacy inside the store
Offers online ordering with curbside pick-up and/or home…
Has a dietician at the store
Average Importance
(ranking between
90 and 150)
Least Important
(ranking below 90)
Most Important
(ranking above 150)
Experience
Product

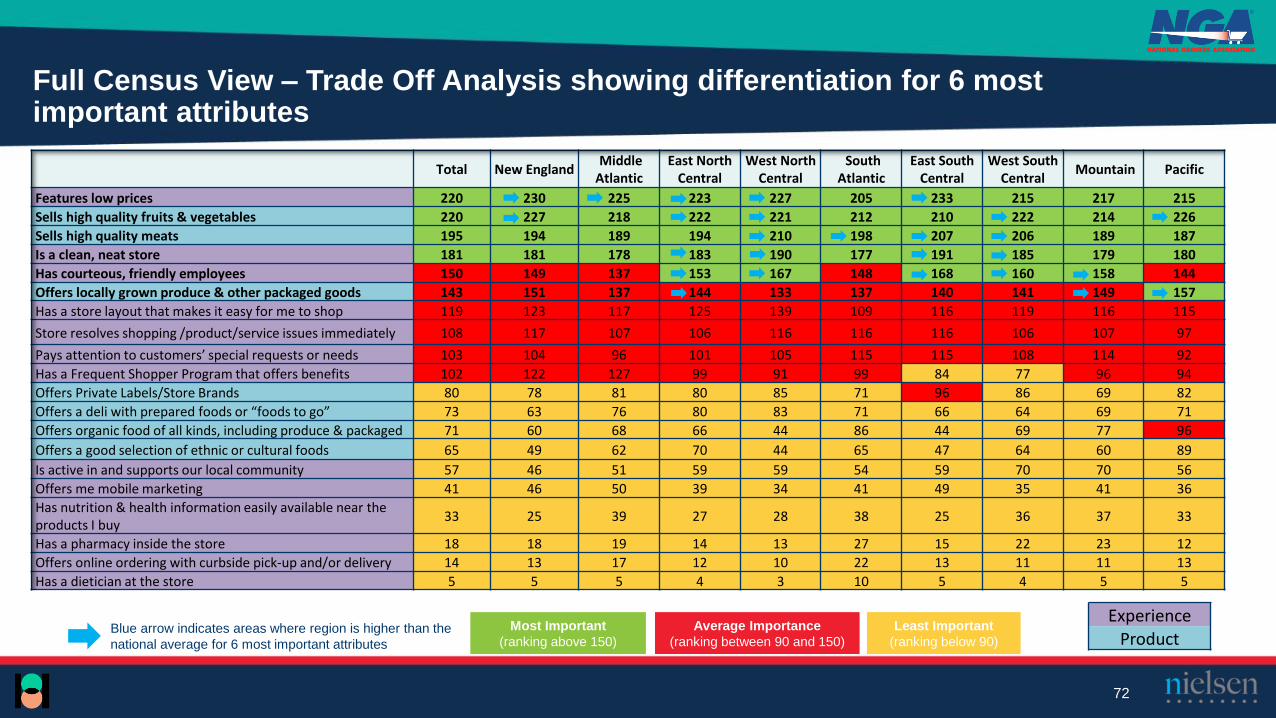
Full Census View – Trade Off Analysis showing differentiation for 6 most important attributes
Total New EnglandMiddle
AtlanticEast North
CentralWest North
CentralSouth
AtlanticEast South
CentralWest South
CentralMountain Pacific
Features low prices 220 230 225 223 227 205 233 215 217 215
Sells high quality fruits & vegetables 220 227 218 222 221 212 210 222 214 226
Sells high quality meats 195 194 189 194 210 198 207 206 189 187
Is a clean, neat store 181 181 178 183 190 177 191 185 179 180
Has courteous, friendly employees 150 149 137 153 167 148 168 160 158 144
Offers locally grown produce & other packaged goods 143 151 137 144 133 137 140 141 149 157
Has a store layout that makes it easy for me to shop 119 123 117 125 139 109 116 119 116 115
Store resolves shopping /product/service issues immediately 108 117 107 106 116 116 116 106 107 97
Pays attention to customers’ special requests or needs 103 104 96 101 105 115 115 108 114 92
Has a Frequent Shopper Program that offers benefits 102 122 127 99 91 99 84 77 96 94
Offers Private Labels/Store Brands 80 78 81 80 85 71 96 86 69 82
Offers a deli with prepared foods or “foods to go” 73 63 76 80 83 71 66 64 69 71
Offers organic food of all kinds, including produce & packaged 71 60 68 66 44 86 44 69 77 96
Offers a good selection of ethnic or cultural foods 65 49 62 70 44 65 47 64 60 89
Is active in and supports our local community 57 46 51 59 59 54 59 70 70 56
Offers me mobile marketing 41 46 50 39 34 41 49 35 41 36
Has nutrition & health information easily available near the products I buy
33 25 39 27 28 38 25 36 37 33
Has a pharmacy inside the store 18 18 19 14 13 27 15 22 23 12
Offers online ordering with curbside pick-up and/or delivery 14 13 17 12 10 22 13 11 11 13
Has a dietician at the store 5 5 5 4 3 10 5 4 5 5
38
Average Importance
(ranking between 90 and 150)
Least Important
(ranking below 90)
Most Important
(ranking above 150)Blue arrow indicates areas where region is higher than the
national average for 6 most important attributes
ExperienceProduct

E-Commerce

1%
1%
1%
5%
10%
10%
12%
13%
43%
Good/Better Prices
Something different to try
Inability to go shopping
Specialty items / Items unavailable local
I don’t enjoy going to the grocery store
It’s easier to find what I need online
It’s easier to purchase non-perishable items online
I don’t have enough time to go to the store
Convenience
BASE: ALL QUALIFIED RESPONDENTS (Total (n=3008)
Q8 When shopping for groceries, do you ever shop online?
BASE: SHOPS ONLINE (n=284)
Q10 Why do you shop for groceries online? .
40
11% Shop
for Groceries Online
Reasons for Shopping Online
Similar to last year, online shopping is uncommon in the United StatesOnly about 1 in 10 shop for groceries online, convenience being the main incentive
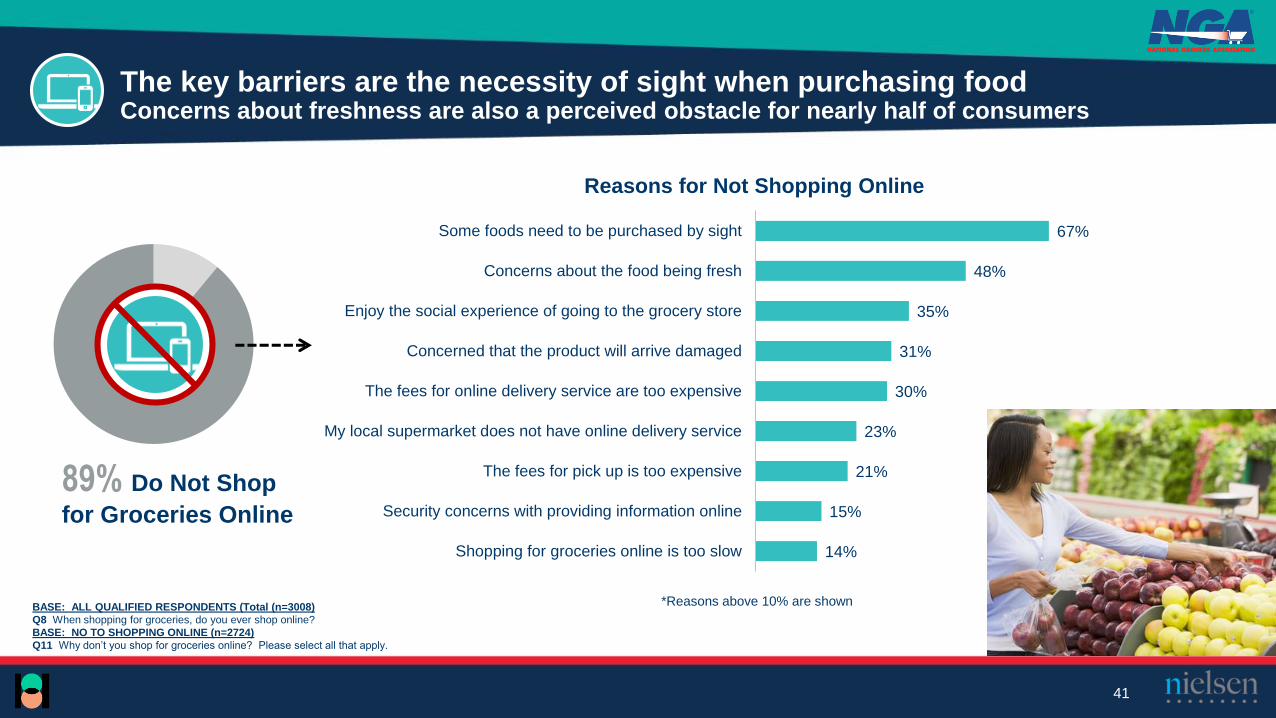
BASE: ALL QUALIFIED RESPONDENTS (Total (n=3008)
Q8 When shopping for groceries, do you ever shop online?
BASE: NO TO SHOPPING ONLINE (n=2724)
Q11 Why don’t you shop for groceries online? Please select all that apply.
The key barriers are the necessity of sight when purchasing foodConcerns about freshness are also a perceived obstacle for nearly half of consumers
41
89% Do Not Shop
for Groceries Online
Reasons for Not Shopping Online
14%
15%
21%
23%
30%
31%
35%
48%
67%
Shopping for groceries online is too slow
Security concerns with providing information online
The fees for pick up is too expensive
My local supermarket does not have online delivery service
The fees for online delivery service are too expensive
Concerned that the product will arrive damaged
Enjoy the social experience of going to the grocery store
Concerns about the food being fresh
Some foods need to be purchased by sight
*Reasons above 10% are shown
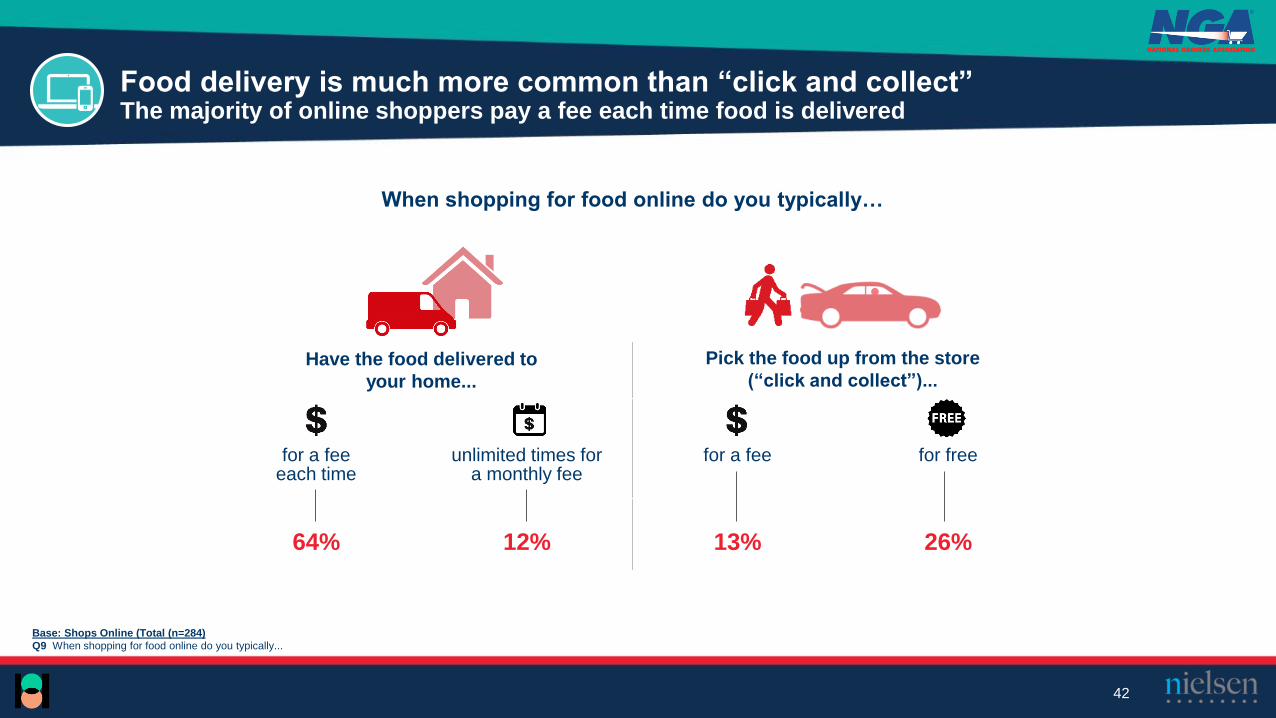
Base: Shops Online (Total (n=284)
Q9 When shopping for food online do you typically...
Food delivery is much more common than “click and collect”The majority of online shoppers pay a fee each time food is delivered
42
When shopping for food online do you typically…
Have the food delivered to
your home...
Pick the food up from the store
(“click and collect”)...
for a fee each time
unlimited times for a monthly fee
for a fee for free
64% 12% 13% 26%
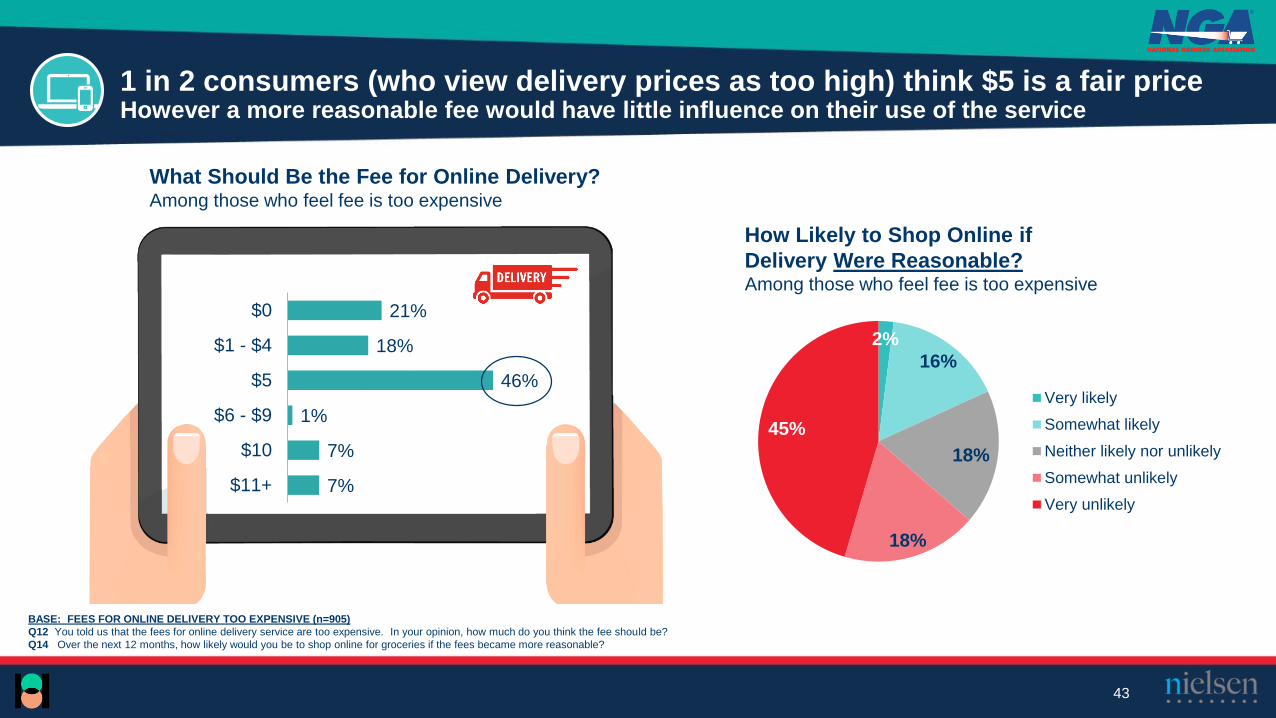
BASE: FEES FOR ONLINE DELIVERY TOO EXPENSIVE (n=905)
Q12 You told us that the fees for online delivery service are too expensive. In your opinion, how much do you think the fee should be?
Q14 Over the next 12 months, how likely would you be to shop online for groceries if the fees became more reasonable?
7%
7%
1%
46%
18%
21%
$11+
$10
$6 - $9
$5
$1 - $4
$0
2%
16%
18%
18%
45%
Very likely
Somewhat likely
Neither likely nor unlikely
Somewhat unlikely
Very unlikely
How Likely to Shop Online if
Delivery Were Reasonable?Among those who feel fee is too expensive
43
What Should Be the Fee for Online Delivery?Among those who feel fee is too expensive
1 in 2 consumers (who view delivery prices as too high) think $5 is a fair price However a more reasonable fee would have little influence on their use of the service

BASE: FEES FOR PICK UP SERVICE IS TOO EXPENSIVE (n=628)
Q13. You told us that the fees for pick up service are too expensive. In your opinion, how much do you think the fee should be?
Q15. Over the next 12 months, how likely would you be to shop online for groceries if the fees for pick up service became more reasonable?
44
4%
7%
1%
38%
24%
26%
$11+
$10
$6 - $9
$5
$1 - $4
$0
How Likely to Shop Online if Click
and Collect Were Reasonable?Among those who feel fee is too expensive
What Should Be the Fee for Click and Collect?Among those who feel fee is too expensive
3%
19%
17%
18%
44%
Very likely
Somewhat likely
Neither likely nor unlikely
Somewhat unlikely
Very unlikely
Most consumers (who view pick-up prices as too high) think $1-5 is a fair price But one-quarter believe the service should be free, and few would utilize it even if the fee changed
45
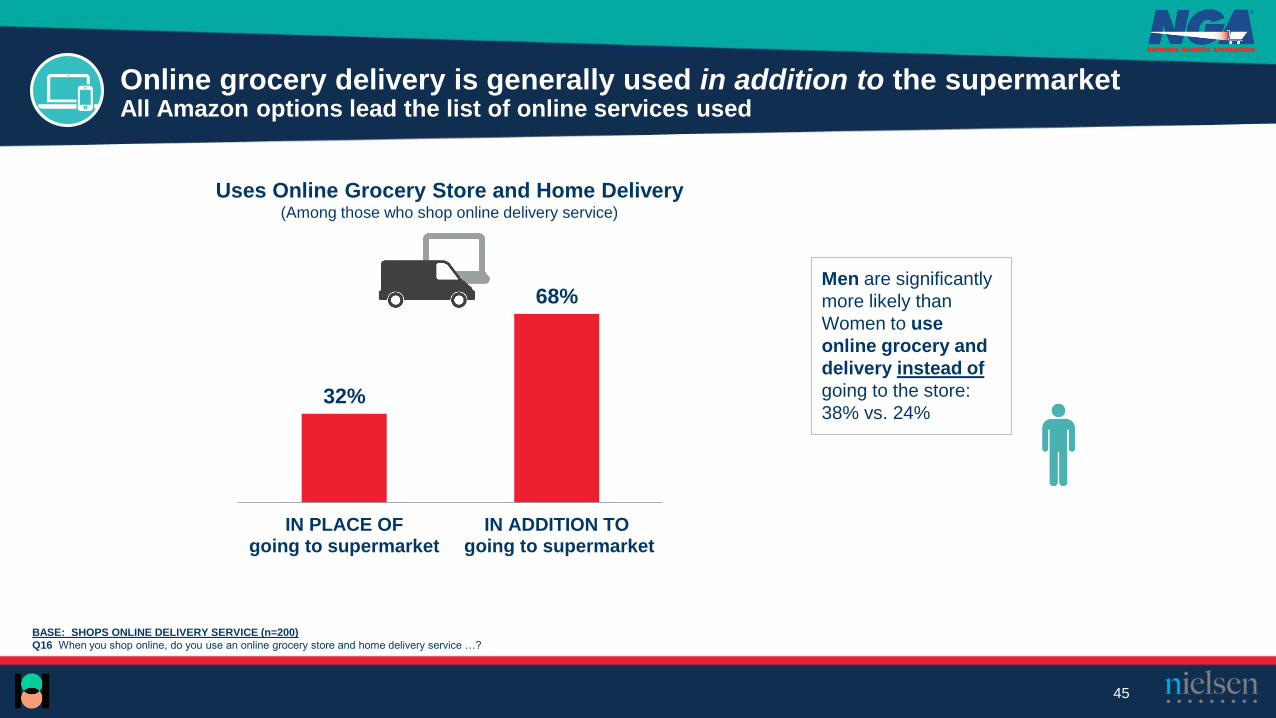
Online grocery delivery is generally used in addition to the supermarketAll Amazon options lead the list of online services used
BASE: SHOPS ONLINE DELIVERY SERVICE (n=200)
Q16 When you shop online, do you use an online grocery store and home delivery service …?
32%
68%
IN PLACE OFgoing to supermarket
IN ADDITION TO going to supermarket
Uses Online Grocery Store and Home Delivery(Among those who shop online delivery service)
Men are significantly
more likely than
Women to use
online grocery and
delivery instead of
going to the store:
38% vs. 24%
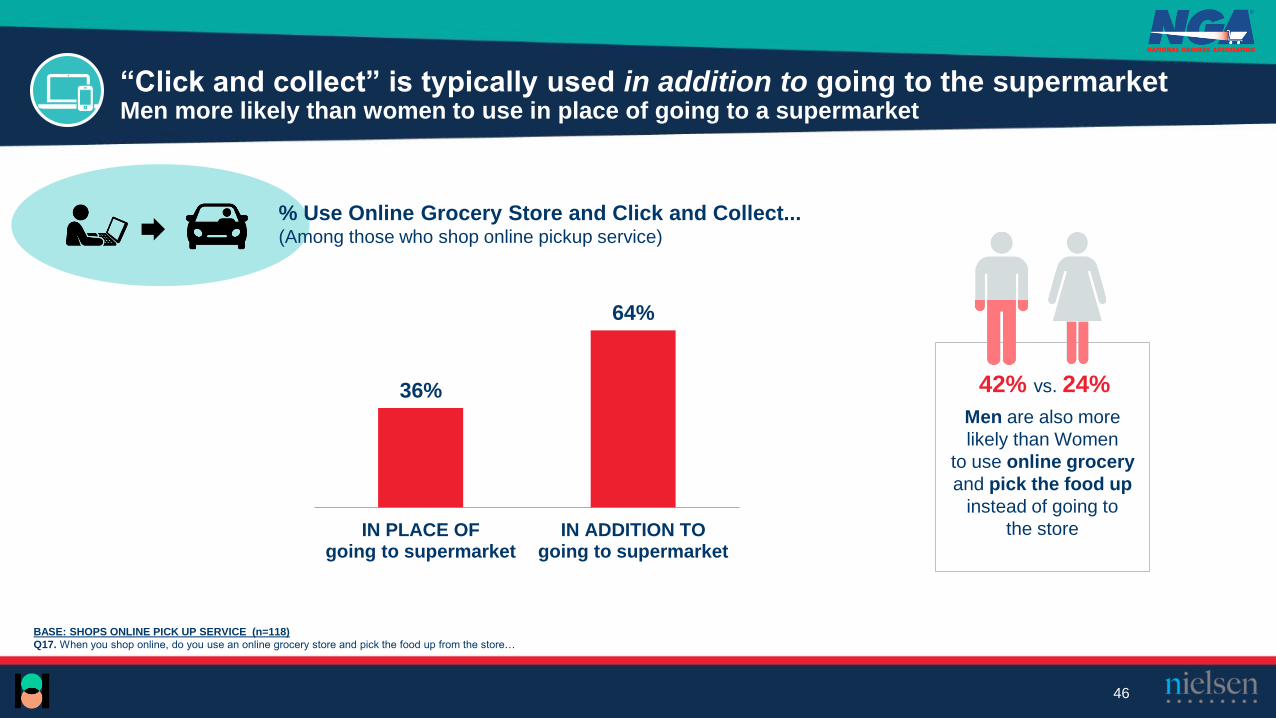
BASE: SHOPS ONLINE PICK UP SERVICE (n=118)
Q17. When you shop online, do you use an online grocery store and pick the food up from the store…
46
Men are also more
likely than Women
to use online grocery
and pick the food up
instead of going to
the store
42% vs. 24%
“Click and collect” is typically used in addition to going to the supermarketMen more likely than women to use in place of going to a supermarket
36%
64%
IN PLACE OFgoing to supermarket
IN ADDITION TOgoing to supermarket
% Use Online Grocery Store and Click and Collect...(Among those who shop online pickup service)
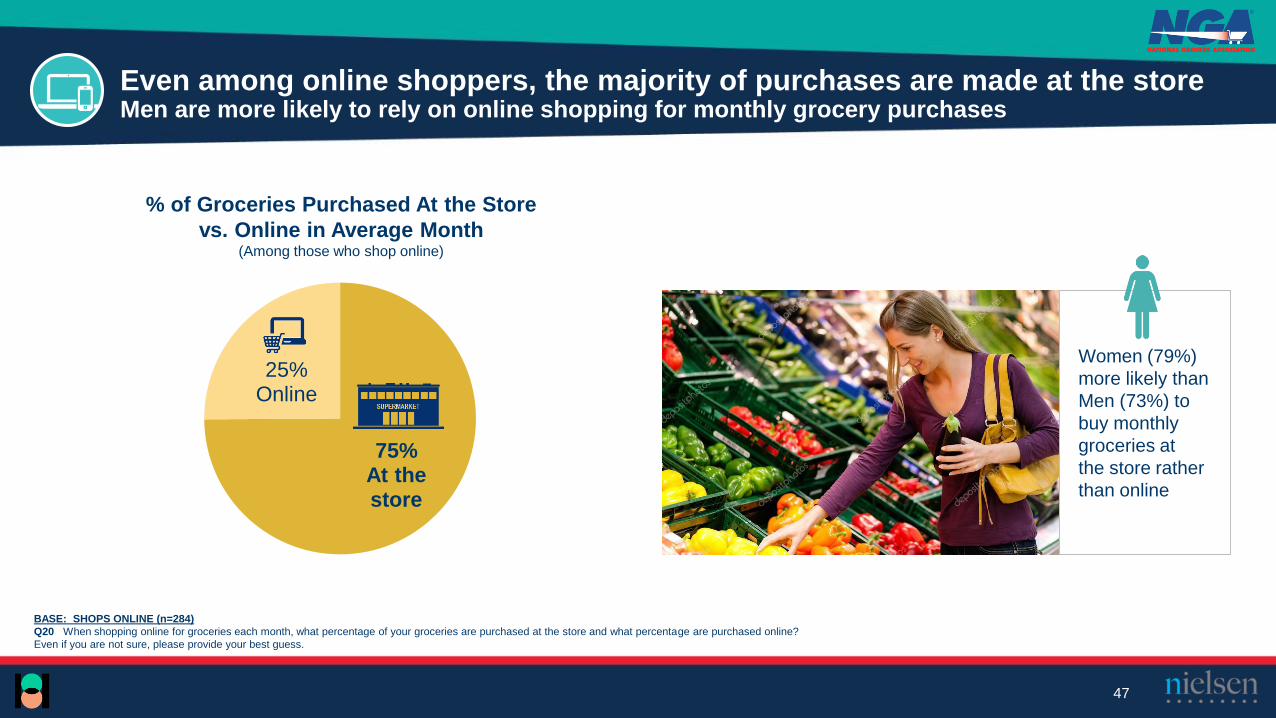
BASE: SHOPS ONLINE (n=284)
Q20 When shopping online for groceries each month, what percentage of your groceries are purchased at the store and what percentage are purchased online?
Even if you are not sure, please provide your best guess.
47
Women (79%)
more likely than
Men (73%) to
buy monthly
groceries at
the store rather
than online
% of Groceries Purchased At the Store
vs. Online in Average Month(Among those who shop online)
75%At the store
25%Online
Even among online shoppers, the majority of purchases are made at the storeMen are more likely to rely on online shopping for monthly grocery purchases
BASE: SHOPS ONLINE (n=284)
Q19 When shopping online, what percentage of the time do you buy each of the following?
48
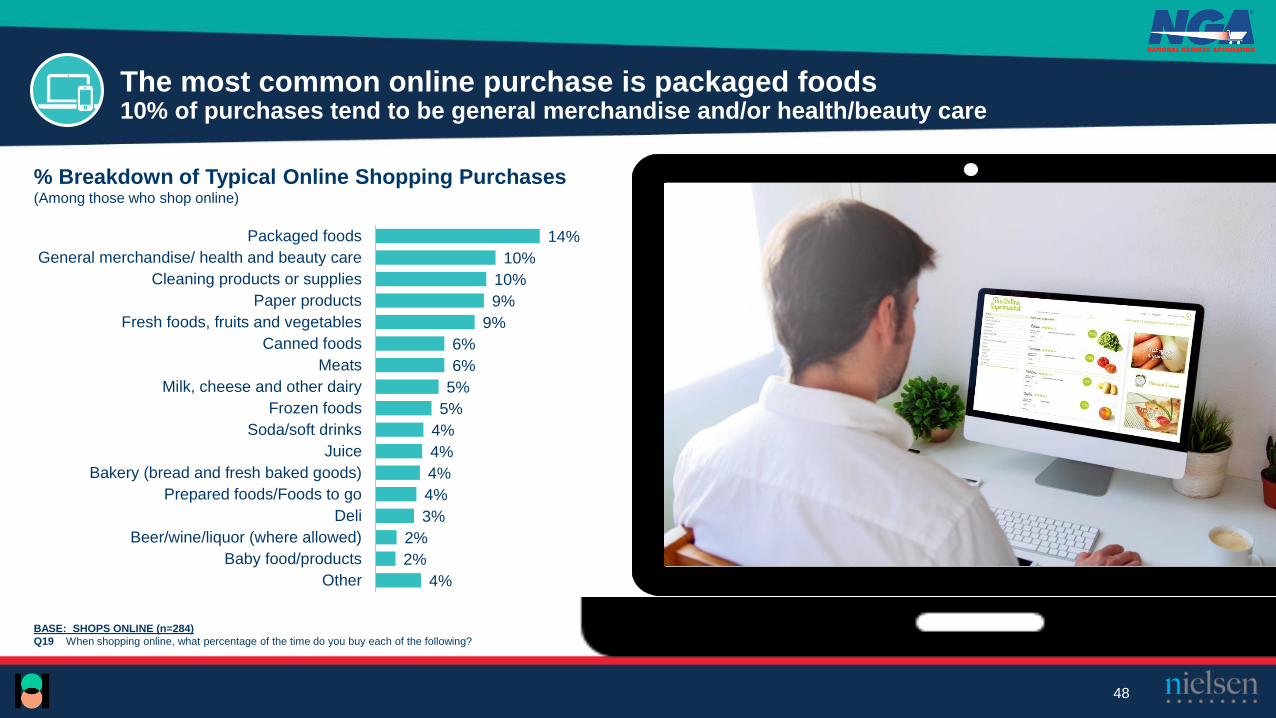
The most common online purchase is packaged foods 10% of purchases tend to be general merchandise and/or health/beauty care
% Breakdown of Typical Online Shopping Purchases(Among those who shop online)
14%
10%
10%
9%
9%
6%
6%
5%
5%
4%
4%
4%
4%
3%
2%
2%
4%
Packaged foods
General merchandise/ health and beauty care
Cleaning products or supplies
Paper products
Fresh foods, fruits and vegetables
Canned foods
Meats
Milk, cheese and other dairy
Frozen foods
Soda/soft drinks
Juice
Bakery (bread and fresh baked goods)
Prepared foods/Foods to go
Deli
Beer/wine/liquor (where allowed)
Baby food/products
Other
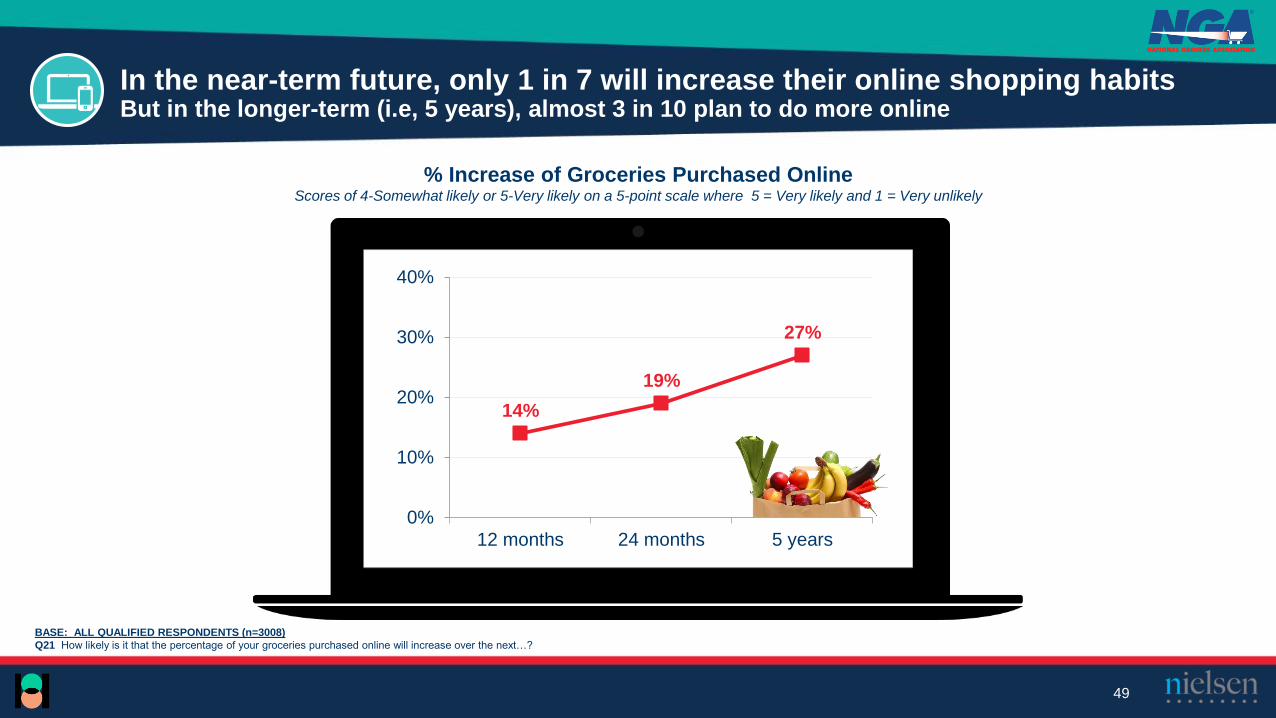
% Increase of Groceries Purchased Online Scores of 4-Somewhat likely or 5-Very likely on a 5-point scale where 5 = Very likely and 1 = Very unlikely
BASE: ALL QUALIFIED RESPONDENTS (n=3008)
Q21 How likely is it that the percentage of your groceries purchased online will increase over the next…?
49
14%
19%
27%
0%
10%
20%
30%
40%
12 months 24 months 5 years
In the near-term future, only 1 in 7 will increase their online shopping habitsBut in the longer-term (i.e, 5 years), almost 3 in 10 plan to do more online

Fresh Foods and Prepared Foods
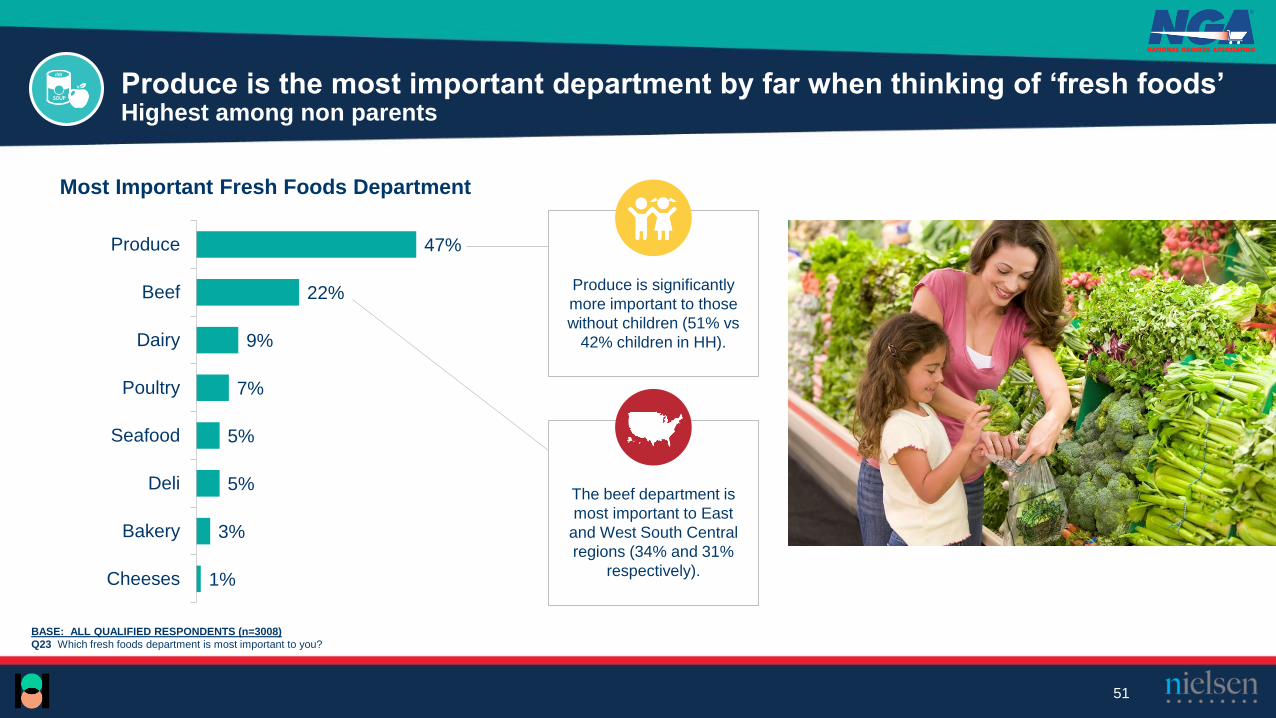
BASE: ALL QUALIFIED RESPONDENTS (n=3008)
Q23 Which fresh foods department is most important to you?
1%
3%
5%
5%
7%
9%
22%
47%
Cheeses
Bakery
Deli
Seafood
Poultry
Dairy
Beef
Produce
51
Produce is the most important department by far when thinking of ‘fresh foods’ Highest among non parents
Most Important Fresh Foods Department
The beef department is
most important to East
and West South Central
regions (34% and 31%
respectively).
Produce is significantly
more important to those
without children (51% vs
42% children in HH).

BASE: ALL QUALIFIED RESPONDENTS (n=3008)
Q24 What matters to you most about the presentation of fresh foods? You can select as many as three responses from the list below.
52
Not surprisingly, freshness matters most in the presentation of fresh foodsAppearance and cleanliness are tied in second place
What Matters Most in Presentation of Fresh Foods?
76%
35%
35%
32%
23%
21%
17%
10%
10%
9%
5%
5%
4%
2%
Products are fresh
Appealing appearance of food
Cleanliness of display
Packaging that gives me a clear view of product
Size appropriate to my needs
Packaging that preserves freshness
Locally grown
Organic
Sustainability
Packaging with nutritional information
Source traceability
Packaging with cooking instructions
Brand name
Recipes
BASE: ALL QUALIFIED RESPONDENTS (n=3008)
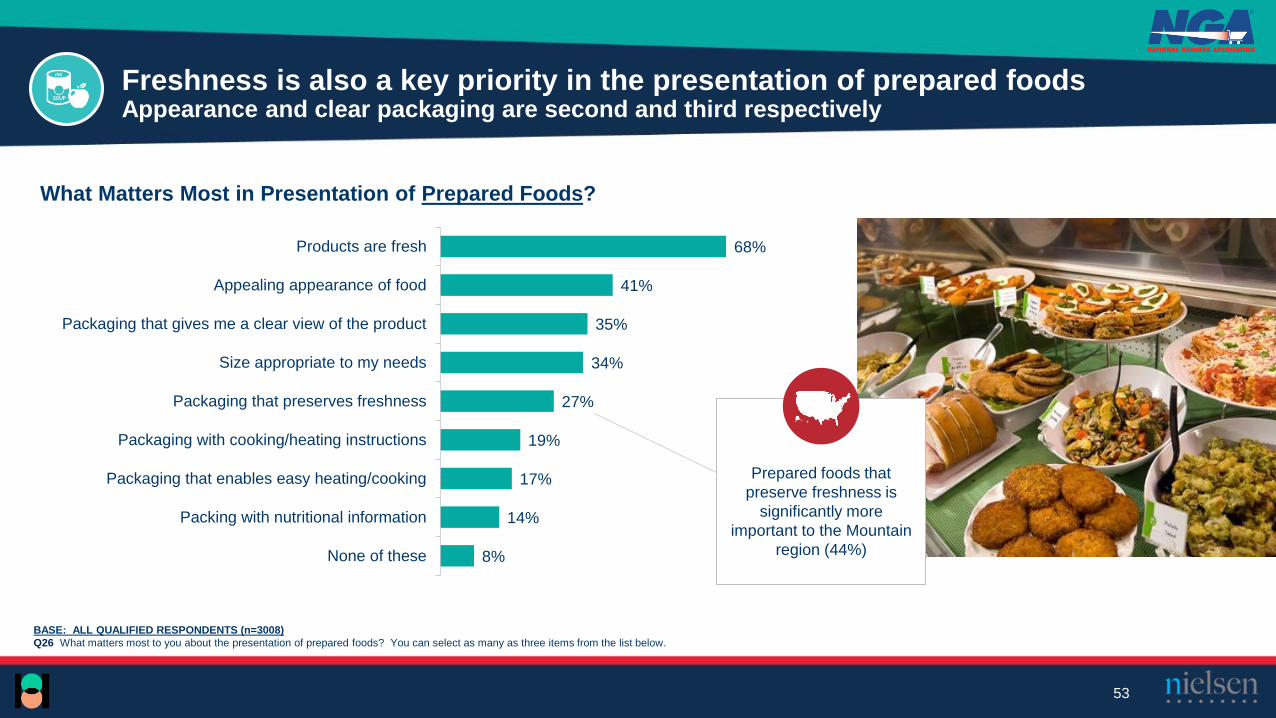
Q26 What matters most to you about the presentation of prepared foods? You can select as many as three items from the list below.
53
Freshness is also a key priority in the presentation of prepared foodsAppearance and clear packaging are second and third respectively
What Matters Most in Presentation of Prepared Foods?
68%
41%
35%
34%
27%
19%
17%
14%
8%
Products are fresh
Appealing appearance of food
Packaging that gives me a clear view of the product
Size appropriate to my needs
Packaging that preserves freshness
Packaging with cooking/heating instructions
Packaging that enables easy heating/cooking
Packing with nutritional information
None of these
Prepared foods that
preserve freshness is
significantly more
important to the Mountain
region (44%)
BASE: ALL QUALIFIED RESPONDENTS (n=3008)
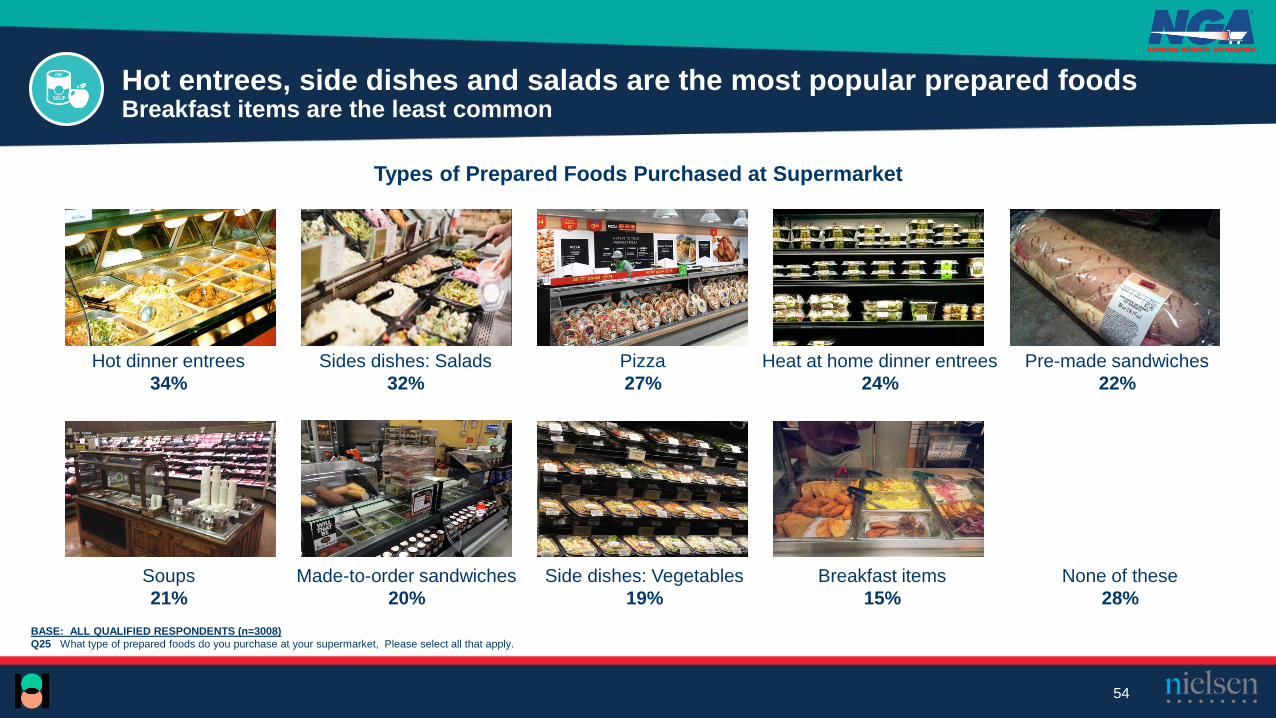
Q25 What type of prepared foods do you purchase at your supermarket, Please select all that apply.
54
Types of Prepared Foods Purchased at Supermarket
Hot entrees, side dishes and salads are the most popular prepared foodsBreakfast items are the least common
Soups Made-to-order sandwiches Side dishes: Vegetables Breakfast items None of these
21% 20% 19% 15% 28%
Hot dinner entrees Sides dishes: Salads Pizza Heat at home dinner entrees Pre-made sandwiches
34% 32% 27% 24% 22%

Nutrition
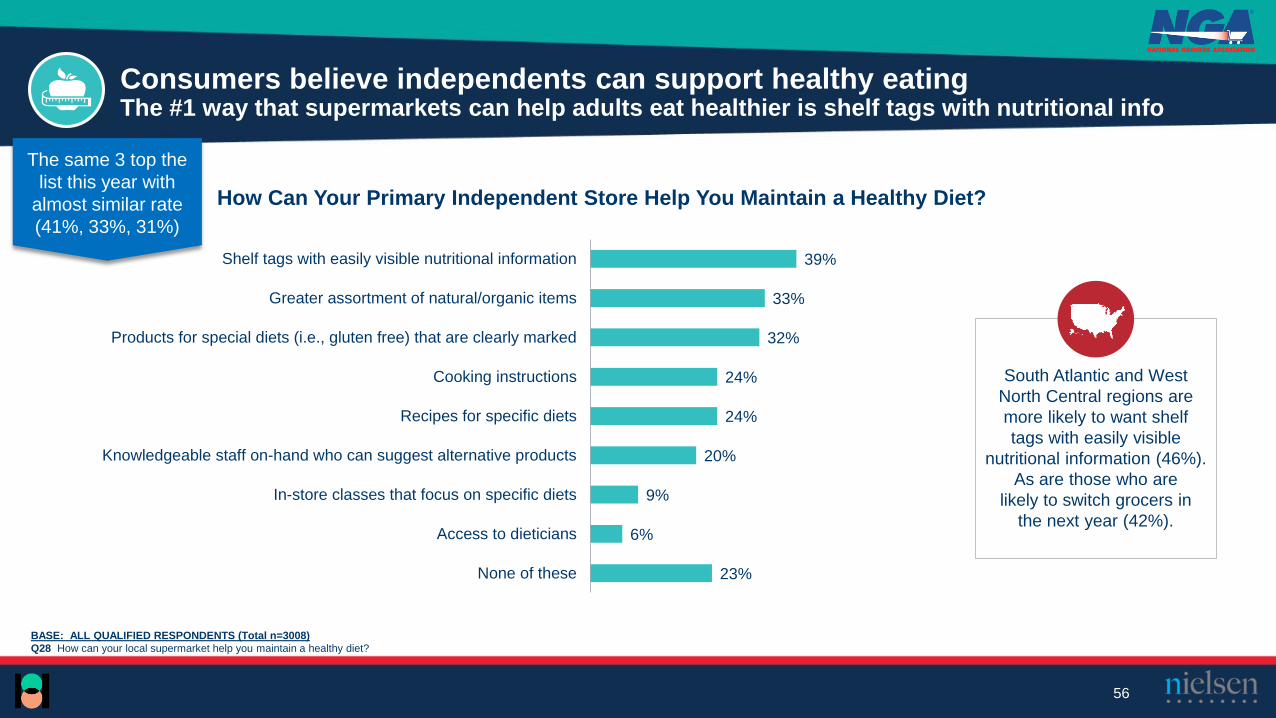
23%
6%
9%
20%
24%
24%
32%
33%
39%
None of these
Access to dieticians
In-store classes that focus on specific diets
Knowledgeable staff on-hand who can suggest alternative products
Recipes for specific diets
Cooking instructions
Products for special diets (i.e., gluten free) that are clearly marked
Greater assortment of natural/organic items
Shelf tags with easily visible nutritional information
BASE: ALL QUALIFIED RESPONDENTS (Total n=3008)
Q28 How can your local supermarket help you maintain a healthy diet?
56
The same 3 top the
list this year with
almost similar rate
(41%, 33%, 31%)
Consumers believe independents can support healthy eatingThe #1 way that supermarkets can help adults eat healthier is shelf tags with nutritional info
How Can Your Primary Independent Store Help You Maintain a Healthy Diet?
South Atlantic and West
North Central regions are
more likely to want shelf
tags with easily visible
nutritional information (46%).
As are those who are
likely to switch grocers in
the next year (42%).
BASE: ALL QUALIFIED RESPONDENTS (Total n=3008)
Q30 Which of the following would you like your local supermarket to offer you when helping you live a healthier lifestyle? Please select all that apply?
57
A/B/C indicates significant difference between segments at 95% confidence .
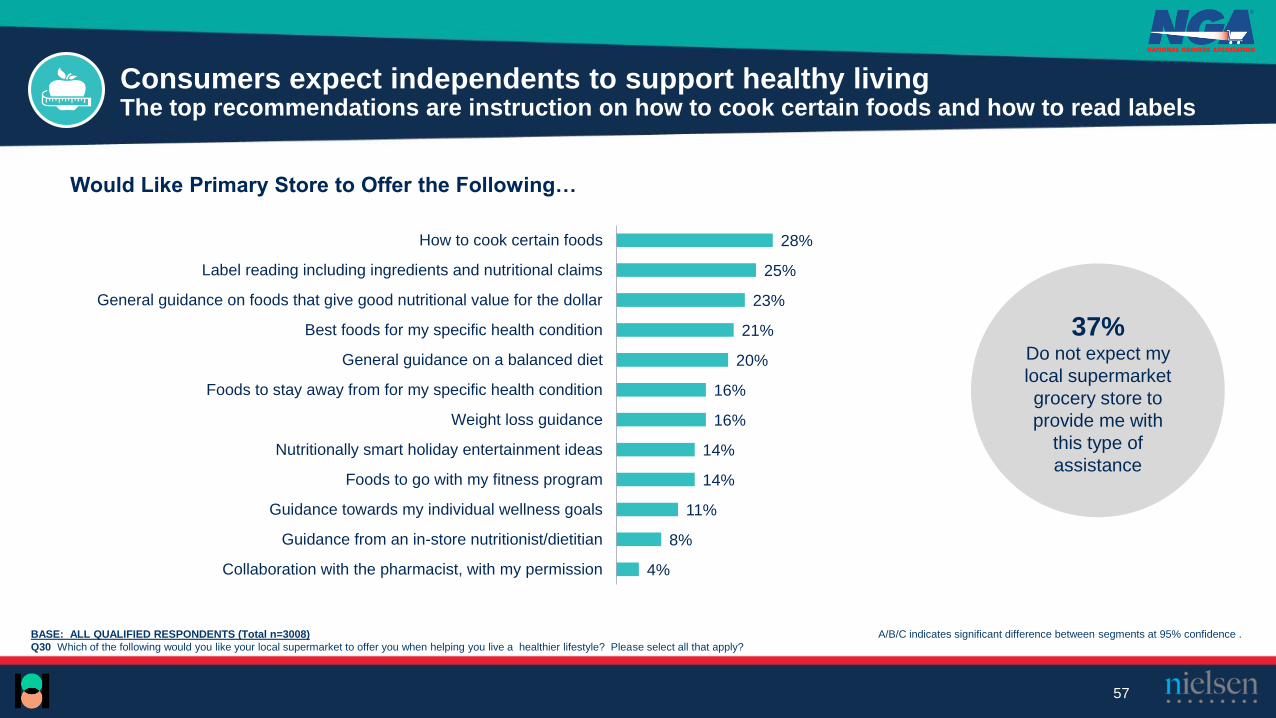
Consumers expect independents to support healthy livingThe top recommendations are instruction on how to cook certain foods and how to read labels
Would Like Primary Store to Offer the Following…
28%
25%
23%
21%
20%
16%
16%
14%
14%
11%
8%
4%
How to cook certain foods
Label reading including ingredients and nutritional claims
General guidance on foods that give good nutritional value for the dollar
Best foods for my specific health condition
General guidance on a balanced diet
Foods to stay away from for my specific health condition
Weight loss guidance
Nutritionally smart holiday entertainment ideas
Foods to go with my fitness program
Guidance towards my individual wellness goals
Guidance from an in-store nutritionist/dietitian
Collaboration with the pharmacist, with my permission
37% Do not expect my
local supermarket
grocery store to
provide me with
this type of
assistance
BASE: ALL QUALIFIED RESPONDENTS (Total n=3008)
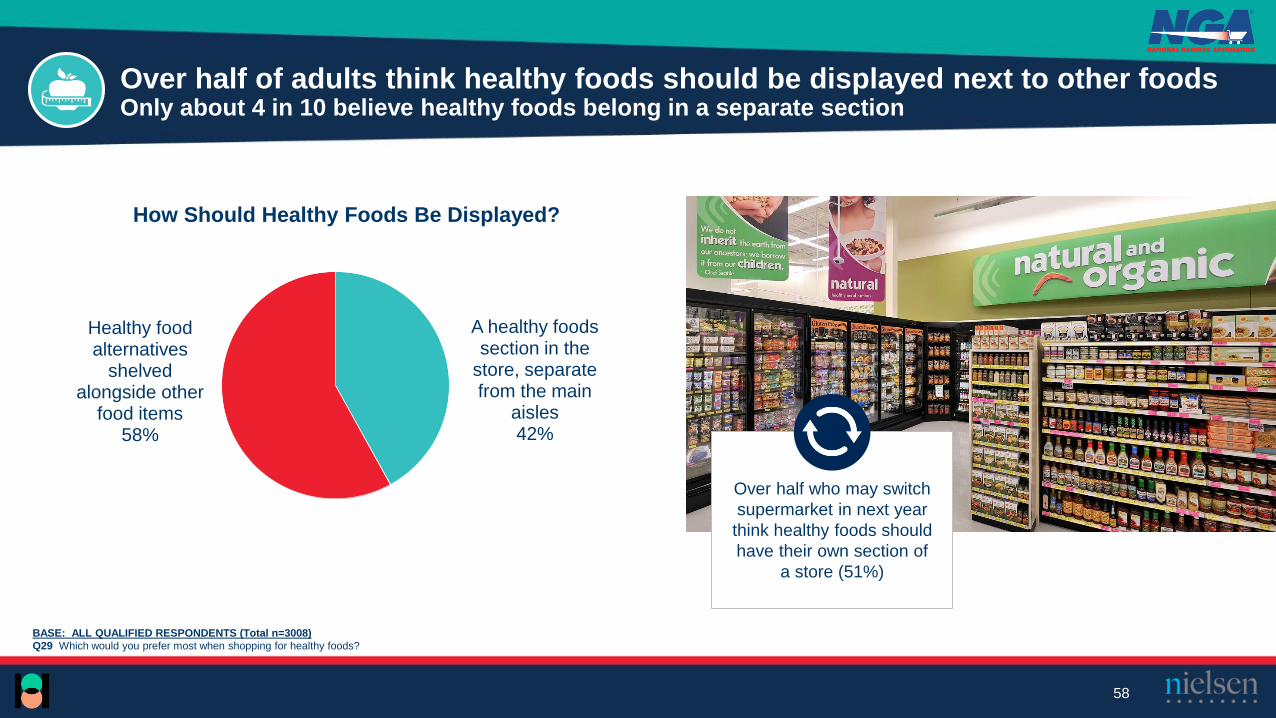
Q29 Which would you prefer most when shopping for healthy foods?
58
A healthy foods section in the
store, separate from the main
aisles42%
Healthy food alternatives
shelved alongside other
food items58%
How Should Healthy Foods Be Displayed?
Over half of adults think healthy foods should be displayed next to other foodsOnly about 4 in 10 believe healthy foods belong in a separate section
Over half who may switch
supermarket in next year
think healthy foods should
have their own section of
a store (51%)
BASE: ALL QUALIFIED RESPONDENTS (Total n=3008)
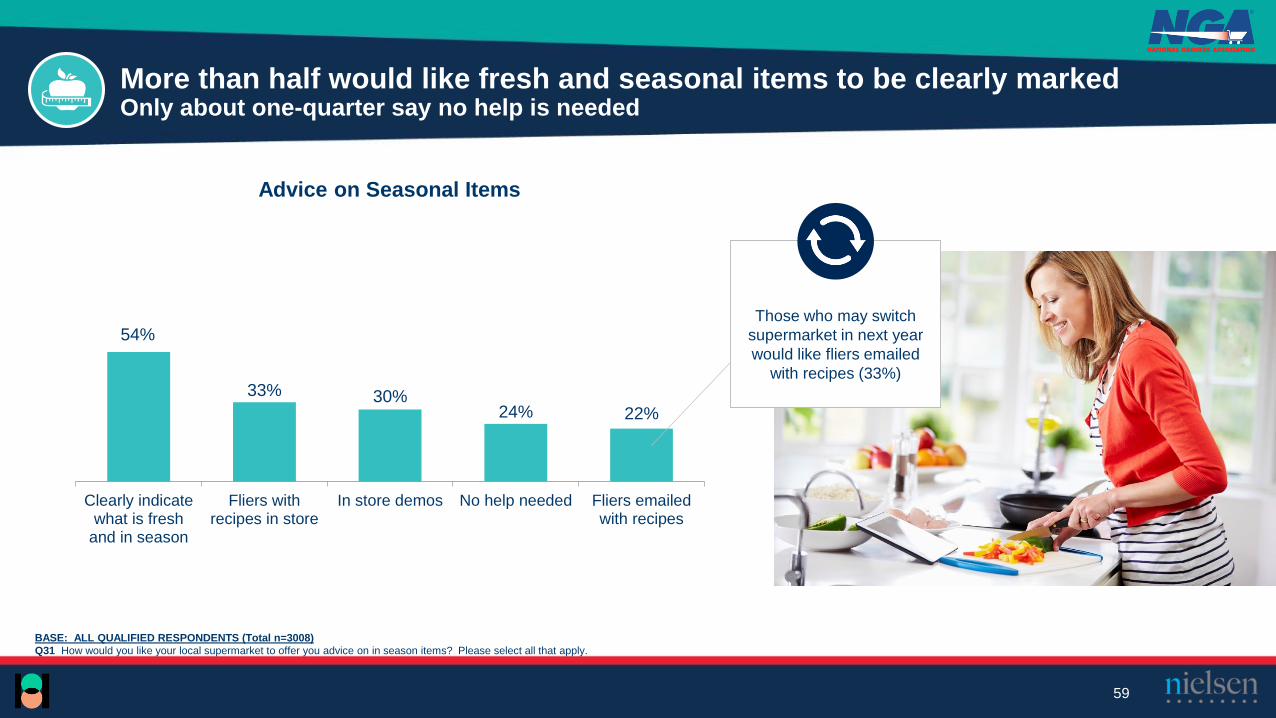
Q31 How would you like your local supermarket to offer you advice on in season items? Please select all that apply.
59
54%
33% 30%24% 22%
Clearly indicatewhat is fresh
and in season
Fliers withrecipes in store
In store demos No help needed Fliers emailedwith recipes
Advice on Seasonal Items
More than half would like fresh and seasonal items to be clearly markedOnly about one-quarter say no help is needed
Those who may switch
supermarket in next year
would like fliers emailed
with recipes (33%)

Purchase Behavior
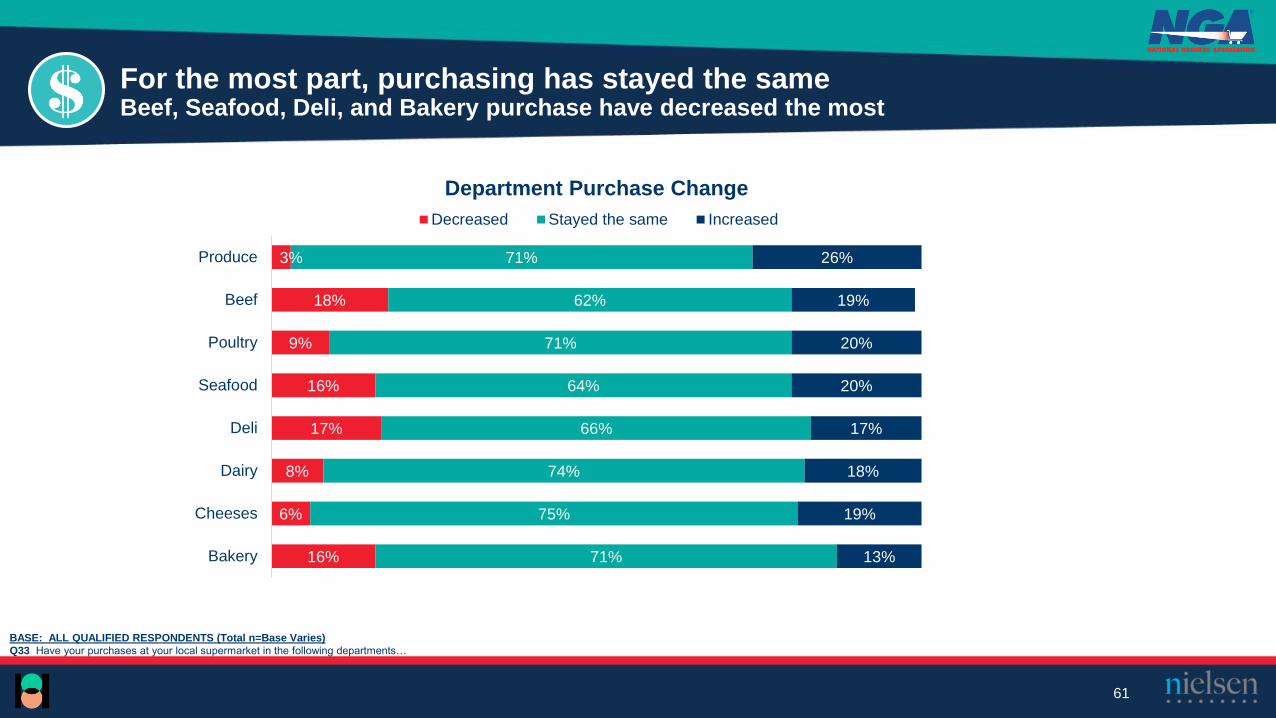
BASE: ALL QUALIFIED RESPONDENTS (Total n=Base Varies)
Q33 Have your purchases at your local supermarket in the following departments…
For the most part, purchasing has stayed the sameBeef, Seafood, Deli, and Bakery purchase have decreased the most
61
3%
18%
9%
16%
17%
8%
6%
16%
71%
62%
71%
64%
66%
74%
75%
71%
26%
19%
20%
20%
17%
18%
19%
13%
Produce
Beef
Poultry
Seafood
Deli
Dairy
Cheeses
Bakery
Decreased Stayed the same Increased
Department Purchase Change
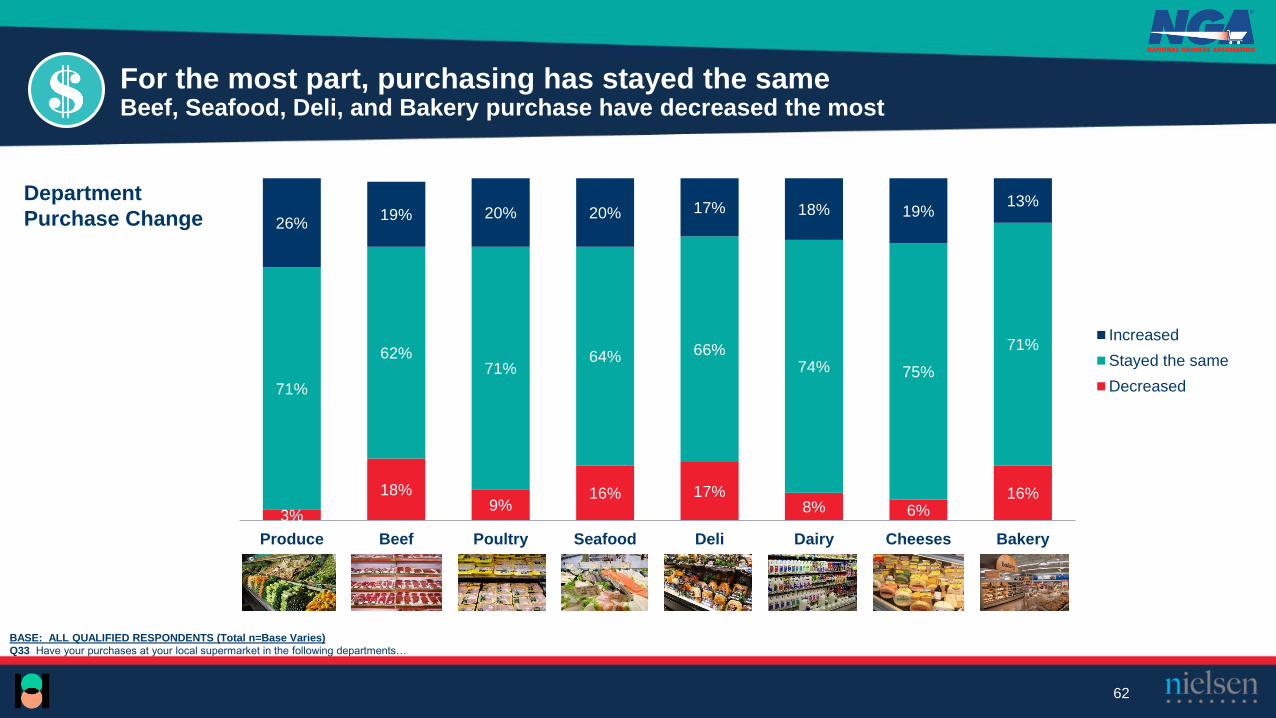
BASE: ALL QUALIFIED RESPONDENTS (Total n=Base Varies)
Q33 Have your purchases at your local supermarket in the following departments…
For the most part, purchasing has stayed the sameBeef, Seafood, Deli, and Bakery purchase have decreased the most
62
3%
18%9%
16% 17%8% 6%
16%
71%
62%71%
64% 66%74% 75%
71%
26%19% 20% 20% 17% 18% 19%
13%
Produce Beef Poultry Seafood Deli Dairy Cheeses Bakery
Increased
Stayed the same
Decreased
Department
Purchase Change
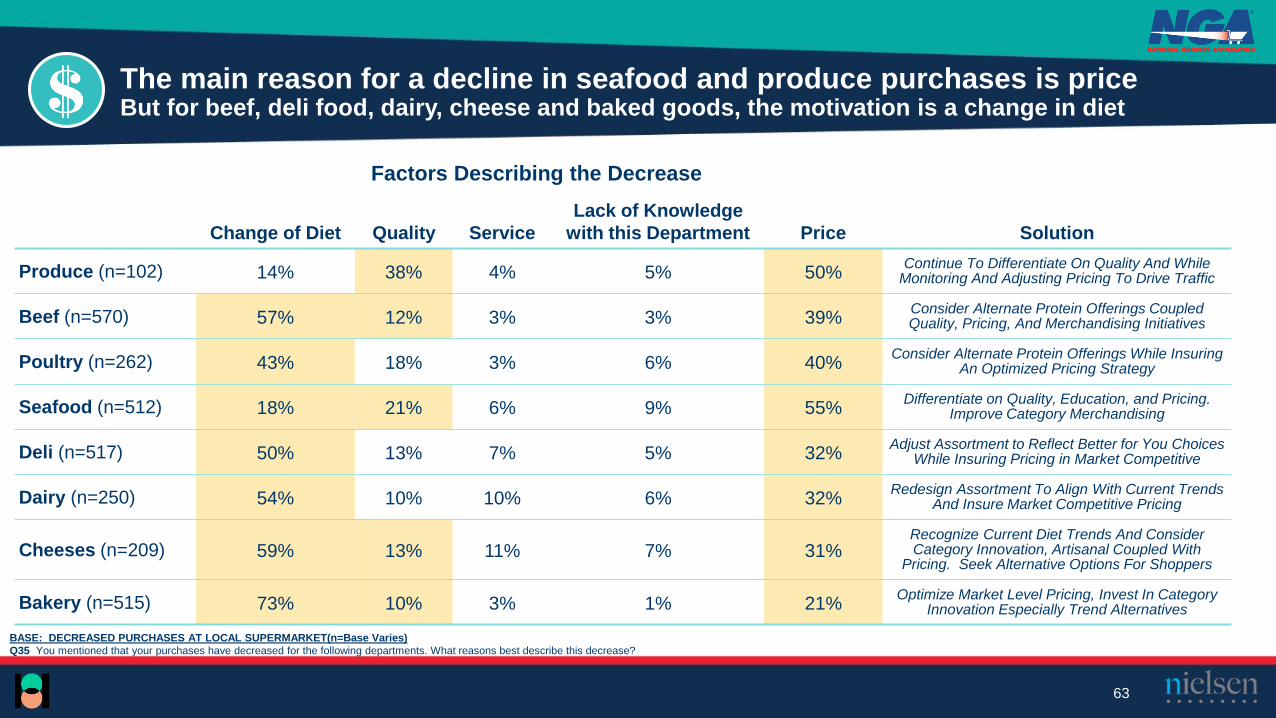
BASE: DECREASED PURCHASES AT LOCAL SUPERMARKET(n=Base Varies)
Q35 You mentioned that your purchases have decreased for the following departments. What reasons best describe this decrease?
The main reason for a decline in seafood and produce purchases is priceBut for beef, deli food, dairy, cheese and baked goods, the motivation is a change in diet
63
Change of Diet Quality Service
Lack of Knowledge
with this Department Price Solution
Produce (n=102) 14% 38% 4% 5% 50%Continue To Differentiate On Quality And While
Monitoring And Adjusting Pricing To Drive Traffic
Beef (n=570) 57% 12% 3% 3% 39%Consider Alternate Protein Offerings Coupled Quality, Pricing, And Merchandising Initiatives
Poultry (n=262) 43% 18% 3% 6% 40%Consider Alternate Protein Offerings While Insuring
An Optimized Pricing Strategy
Seafood (n=512) 18% 21% 6% 9% 55%Differentiate on Quality, Education, and Pricing.
Improve Category Merchandising
Deli (n=517) 50% 13% 7% 5% 32%Adjust Assortment to Reflect Better for You Choices
While Insuring Pricing in Market Competitive
Dairy (n=250) 54% 10% 10% 6% 32%Redesign Assortment To Align With Current Trends
And Insure Market Competitive Pricing
Cheeses (n=209) 59% 13% 11% 7% 31%Recognize Current Diet Trends And Consider Category Innovation, Artisanal Coupled With
Pricing. Seek Alternative Options For Shoppers
Bakery (n=515) 73% 10% 3% 1% 21%Optimize Market Level Pricing, Invest In Category
Innovation Especially Trend Alternatives
Factors Describing the Decrease

BASE: DECREASED PURCHASES AT LOCAL SUPERMARKET(n=Base Varies)
Q36 With the decrease in purchases for the following departments. How are you replacing items that would have previously been purchased from these departments?
Generally consumers don’t replace items that they no longer purchaseOnly in the case of produce do they typically switch to a different store
64
Ways of Replacing Items
Not Replacing
Them at All Different Store Going Out to Eat Online Other
Produce (n=102) 27% 59% 7% 3% 8%
Beef (n=570) 56% 21% 10% 3% 19%
Poultry (n=262) 45% 35% 10% 4% 18%
Seafood (n=512) 55% 26% 12% 2% 13%
Deli (n=517) 64% 16% 9% 2% 19%
Dairy (n=250) 52% 33% 3% 2% 15%
Cheeses (n=209) 51% 20% 8% 5% 21%
Bakery (n=515) 69% 14% 4% 2% 17%

Future Outlook
50%
Yes No
45%
Yes No
40%
Yes No
35%
Yes No
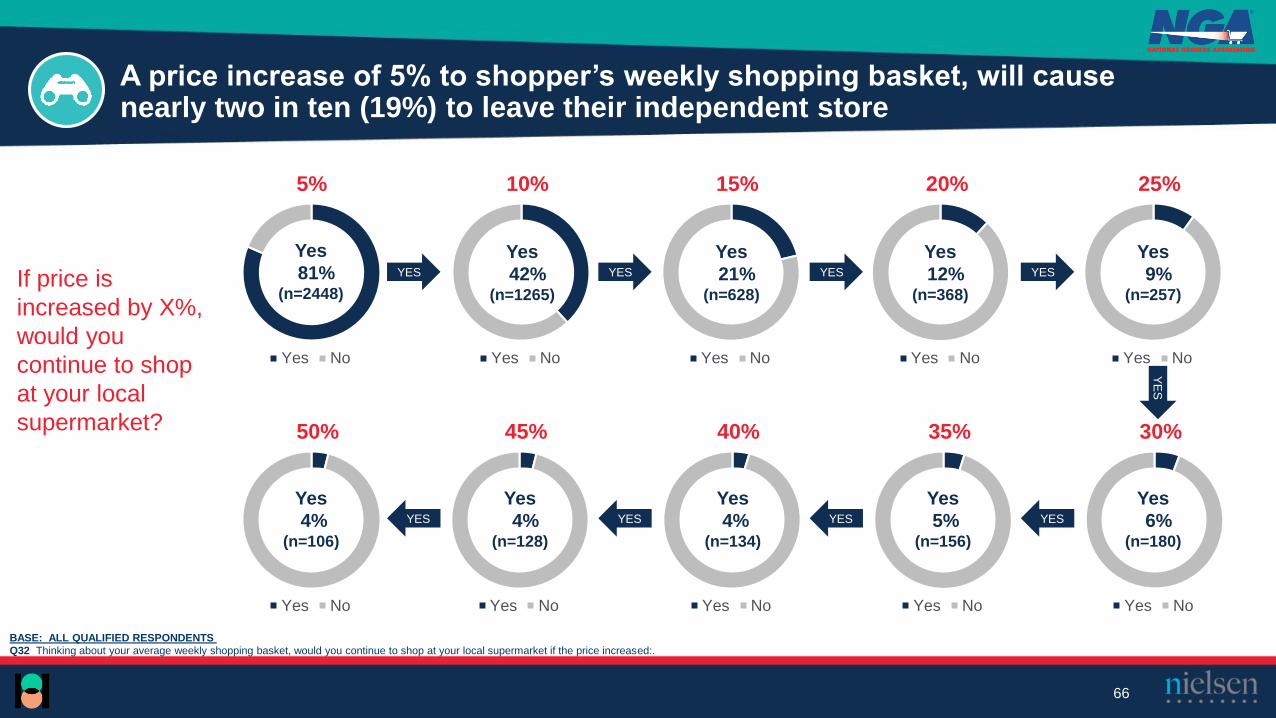
BASE: ALL QUALIFIED RESPONDENTS
Q32 Thinking about your average weekly shopping basket, would you continue to shop at your local supermarket if the price increased:.
A price increase of 5% to shopper’s weekly shopping basket, will cause nearly two in ten (19%) to leave their independent store
66
5%
Yes No
10%
Yes No
YES
15%
Yes No
20%
Yes No
25%
Yes No
30%
Yes No
Yes
42%(n=1265)
Yes
21%(n=628)
Yes
12%(n=368)
Yes
9%(n=257)
Yes
6%(n=180)
Yes
5%(n=156)
Yes
4%(n=134)
Yes
4%(n=128)
Yes
4%(n=106)
YES YES YES
YES YES YES YES
YE
S
Yes
81%(n=2448)
If price is
increased by X%,
would you
continue to shop
at your local
supermarket?
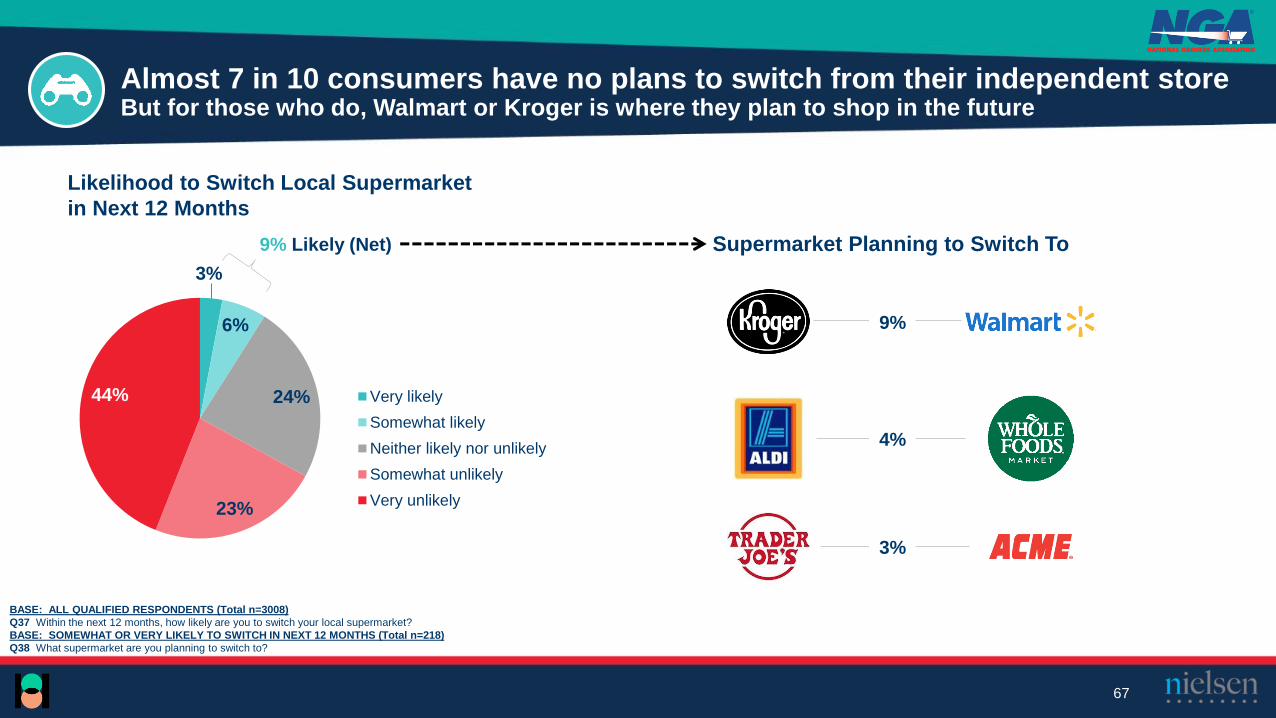
Almost 7 in 10 consumers have no plans to switch from their independent storeBut for those who do, Walmart or Kroger is where they plan to shop in the future
67
BASE: ALL QUALIFIED RESPONDENTS (Total n=3008)
Q37 Within the next 12 months, how likely are you to switch your local supermarket?
BASE: SOMEWHAT OR VERY LIKELY TO SWITCH IN NEXT 12 MONTHS (Total n=218)
Q38 What supermarket are you planning to switch to?
3%
6%
24%
23%
44% Very likely
Somewhat likely
Neither likely nor unlikely
Somewhat unlikely
Very unlikely
Likelihood to Switch Local Supermarket
in Next 12 Months
Supermarket Planning to Switch To 9% Likely (Net)
9%
4%
3%

Sources of Information
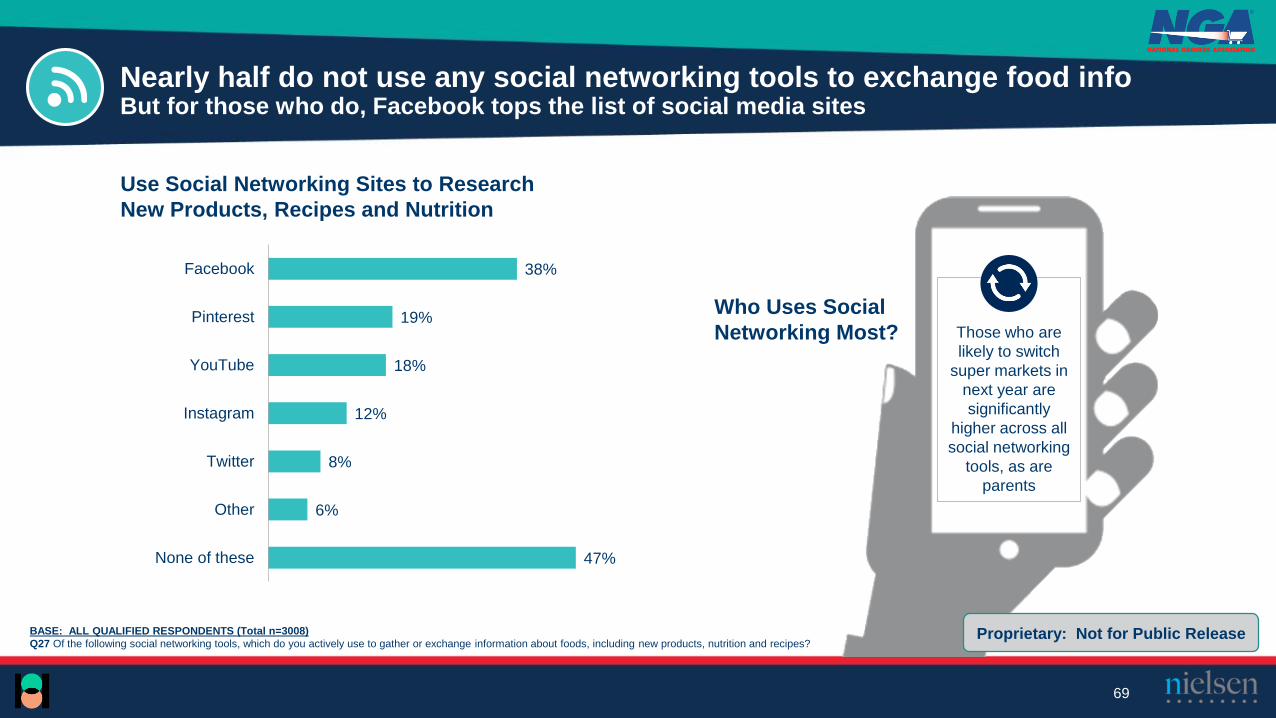
BASE: ALL QUALIFIED RESPONDENTS (Total n=3008)
Q27 Of the following social networking tools, which do you actively use to gather or exchange information about foods, including new products, nutrition and recipes?
69
93% Yes
47%
6%
8%
12%
18%
19%
38%
None of these
Other
YouTube
Proprietary: Not for Public Release
Nearly half do not use any social networking tools to exchange food infoBut for those who do, Facebook tops the list of social media sites
Use Social Networking Sites to Research
New Products, Recipes and Nutrition
Those who are
likely to switch
super markets in
next year are
significantly
higher across all
social networking
tools, as are
parents
Who Uses Social
Networking Most?

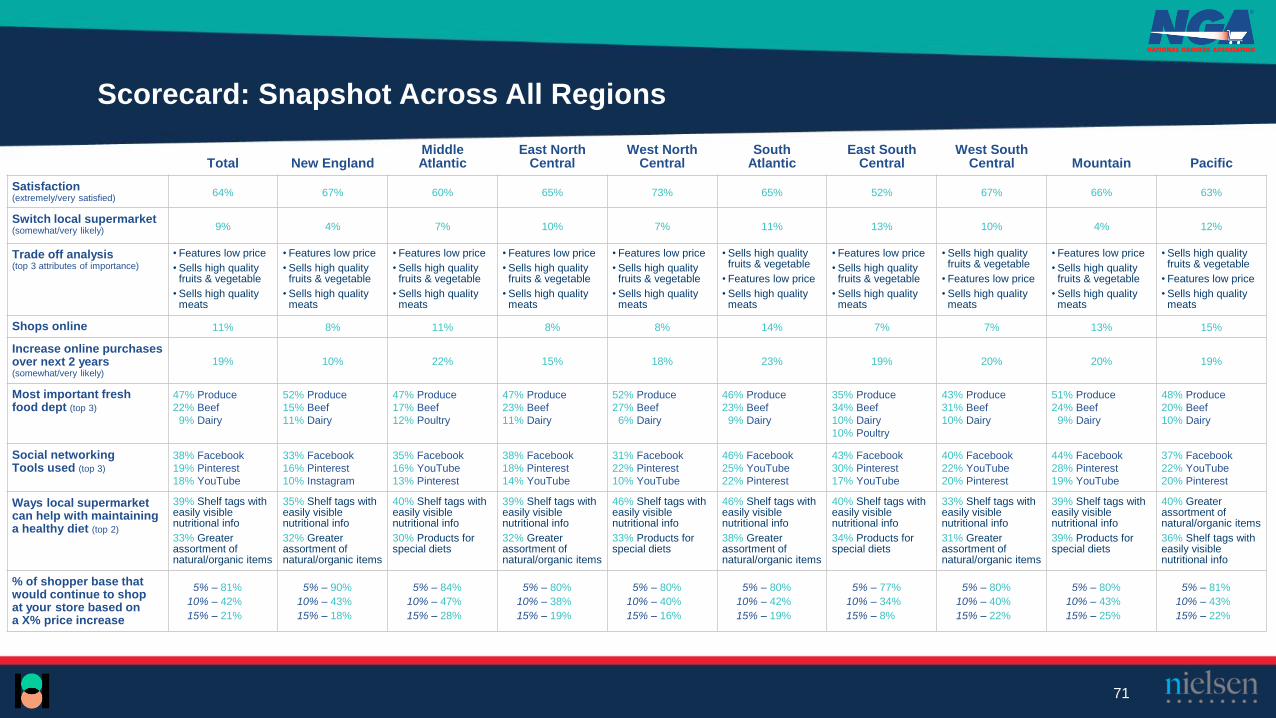
Regional Scorecards
Total New EnglandMiddle Atlantic
East North Central
West North Central
South Atlantic
East SouthCentral
West South Central Mountain Pacific
Satisfaction (extremely/very satisfied)
64% 67% 60% 65% 73% 65% 52% 67% 66% 63%
Switch local supermarket (somewhat/very likely) 9% 4% 7% 10% 7% 11% 13% 10% 4% 12%
Trade off analysis (top 3 attributes of importance)
• Features low price
• Sells high quality fruits & vegetable
• Sells high quality meats
• Features low price
• Sells high quality fruits & vegetable
• Sells high quality meats
• Features low price
• Sells high quality fruits & vegetable
• Sells high quality meats
• Features low price
• Sells high quality fruits & vegetable
• Sells high quality meats
• Features low price
• Sells high quality fruits & vegetable
• Sells high quality meats
• Sells high quality fruits & vegetable
• Features low price
• Sells high quality meats
• Features low price
• Sells high quality fruits & vegetable
• Sells high quality meats
• Sells high quality fruits & vegetable
• Features low price
• Sells high quality meats
• Features low price
• Sells high quality fruits & vegetable
• Sells high quality meats
• Sells high quality fruits & vegetable
• Features low price
• Sells high quality meats
Shops online 11% 8% 11% 8% 8% 14% 7% 7% 13% 15%
Increase online purchases over next 2 years (somewhat/very likely)
19% 10% 22% 15% 18% 23% 19% 20% 20% 19%
Most important fresh food dept (top 3)
47% Produce
22% Beef
9% Dairy
52% Produce
15% Beef
11% Dairy
47% Produce
17% Beef
12% Poultry
47% Produce
23% Beef
11% Dairy
52% Produce
27% Beef
6% Dairy
46% Produce
23% Beef
9% Dairy
35% Produce
34% Beef
10% Dairy
10% Poultry
43% Produce
31% Beef
10% Dairy
51% Produce
24% Beef
9% Dairy
48% Produce
20% Beef
10% Dairy
Social networkingTools used (top 3)
38% Facebook
19% Pinterest
18% YouTube
33% Facebook
16% Pinterest
10% Instagram
35% Facebook
16% YouTube
13% Pinterest
38% Facebook
18% Pinterest
14% YouTube
31% Facebook
22% Pinterest
10% YouTube
46% Facebook
25% YouTube
22% Pinterest
43% Facebook
30% Pinterest
17% YouTube
40% Facebook
22% YouTube
20% Pinterest
44% Facebook
28% Pinterest
19% YouTube
37% Facebook
22% YouTube
20% Pinterest
Ways local supermarket can help with maintaining a healthy diet (top 2)
39% Shelf tags with easily visible nutritional info
33% Greater assortment of natural/organic items
35% Shelf tags with easily visible nutritional info
32% Greater assortment of natural/organic items
40% Shelf tags with easily visible nutritional info
30% Products for special diets
39% Shelf tags with easily visible nutritional info
32% Greater assortment of natural/organic items
46% Shelf tags with easily visible nutritional info
33% Products for special diets
46% Shelf tags with easily visible nutritional info
38% Greater assortment of natural/organic items
40% Shelf tags with easily visible nutritional info
34% Products for special diets
33% Shelf tags with easily visible nutritional info
31% Greater assortment of natural/organic items
39% Shelf tags with easily visible nutritional info
39% Products for special diets
40% Greater assortment of natural/organic items
36% Shelf tags with easily visible nutritional info
% of shopper base that would continue to shop at your store based on a X% price increase
5% – 81%
10% – 42%
15% – 21%
5% – 90%
10% – 43%
15% – 18%
5% – 84%
10% – 47%
15% – 28%
5% – 80%
10% – 38%
15% – 19%
5% – 80%
10% – 40%
15% – 16%
5% – 80%
10% – 42%
15% – 19%
5% – 77%
10% – 34%
15% – 8%
5% – 80%
10% – 40%
15% – 22%
5% – 80%
10% – 43%
15% – 25%
5% – 81%
10% – 43%
15% – 22%
Scorecard: Snapshot Across All Regions
71
Full Census View – Trade Off Analysis showing differentiation for 6 most important attributes
Total New EnglandMiddle
AtlanticEast North
CentralWest North
CentralSouth
AtlanticEast South
CentralWest South
CentralMountain Pacific
Features low prices 220 230 225 223 227 205 233 215 217 215
Sells high quality fruits & vegetables 220 227 218 222 221 212 210 222 214 226
Sells high quality meats 195 194 189 194 210 198 207 206 189 187
Is a clean, neat store 181 181 178 183 190 177 191 185 179 180
Has courteous, friendly employees 150 149 137 153 167 148 168 160 158 144
Offers locally grown produce & other packaged goods 143 151 137 144 133 137 140 141 149 157
Has a store layout that makes it easy for me to shop 119 123 117 125 139 109 116 119 116 115
Store resolves shopping /product/service issues immediately 108 117 107 106 116 116 116 106 107 97
Pays attention to customers’ special requests or needs 103 104 96 101 105 115 115 108 114 92
Has a Frequent Shopper Program that offers benefits 102 122 127 99 91 99 84 77 96 94
Offers Private Labels/Store Brands 80 78 81 80 85 71 96 86 69 82
Offers a deli with prepared foods or “foods to go” 73 63 76 80 83 71 66 64 69 71
Offers organic food of all kinds, including produce & packaged 71 60 68 66 44 86 44 69 77 96
Offers a good selection of ethnic or cultural foods 65 49 62 70 44 65 47 64 60 89
Is active in and supports our local community 57 46 51 59 59 54 59 70 70 56
Offers me mobile marketing 41 46 50 39 34 41 49 35 41 36
Has nutrition & health information easily available near the products I buy
33 25 39 27 28 38 25 36 37 33
Has a pharmacy inside the store 18 18 19 14 13 27 15 22 23 12
Offers online ordering with curbside pick-up and/or delivery 14 13 17 12 10 22 13 11 11 13
Has a dietician at the store 5 5 5 4 3 10 5 4 5 5
72
Average Importance
(ranking between 90 and 150)
Least Important
(ranking below 90)
Most Important
(ranking above 150)Blue arrow indicates areas where region is higher than the
national average for 6 most important attributes
ExperienceProduct
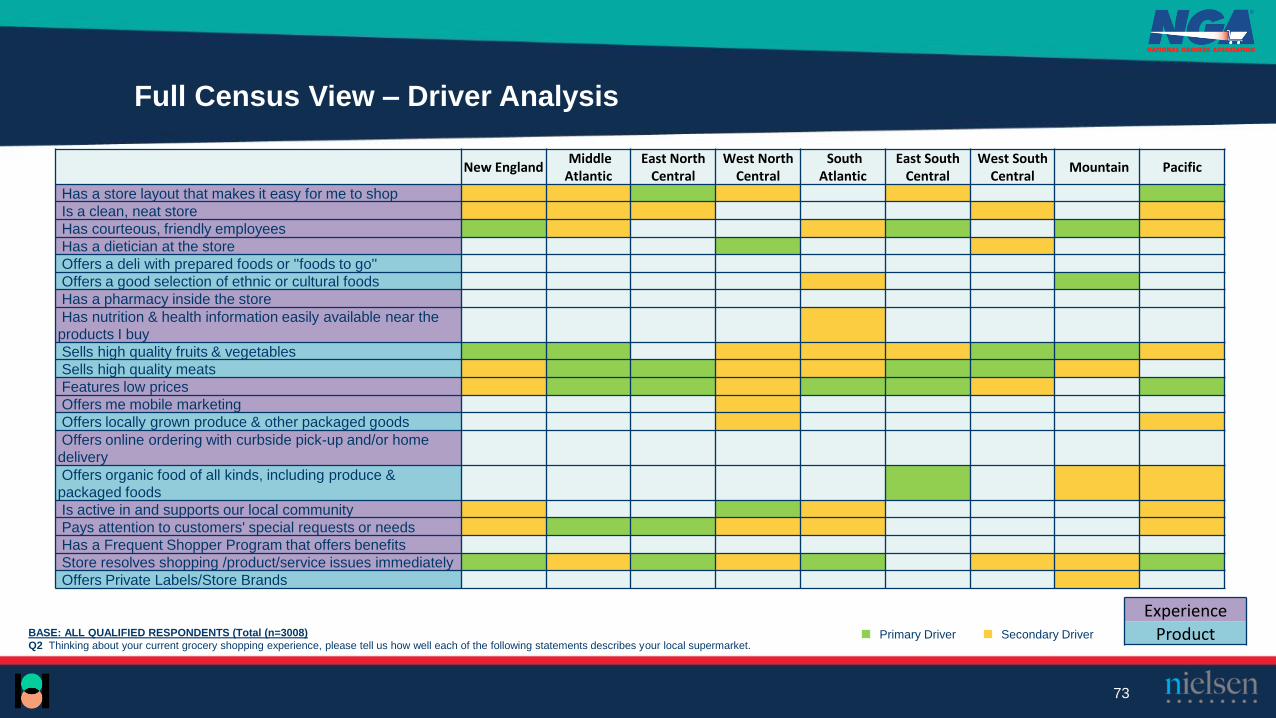
BASE: ALL QUALIFIED RESPONDENTS (Total (n=3008)
Q2 Thinking about your current grocery shopping experience, please tell us how well each of the following statements describes your local supermarket.
Full Census View – Driver Analysis
New EnglandMiddle
AtlanticEast North
CentralWest North
CentralSouth
AtlanticEast South
CentralWest South
CentralMountain Pacific
Has a store layout that makes it easy for me to shop
Is a clean, neat store
Has courteous, friendly employees
Has a dietician at the store
Offers a deli with prepared foods or ''foods to go''
Offers a good selection of ethnic or cultural foods
Has a pharmacy inside the store
Has nutrition & health information easily available near the
products I buy
Sells high quality fruits & vegetables
Sells high quality meats
Features low prices
Offers me mobile marketing
Offers locally grown produce & other packaged goods
Offers online ordering with curbside pick-up and/or home
delivery
Offers organic food of all kinds, including produce &
packaged foods
Is active in and supports our local community
Pays attention to customers' special requests or needs
Has a Frequent Shopper Program that offers benefits
Store resolves shopping /product/service issues immediately
Offers Private Labels/Store Brands
Primary Driver Secondary Driver
73
Experience
Product

% Increase of Groceries Purchased Online
230
227
194
181
151
Features low prices
Sells high quality fruits & vegetables
Sells high quality meats
Is a clean, neat store
Offers locally grown produce & otherpackaged goods
Scorecard: New England
Satisfaction(Extremely/Very Satisfied)
67%
Likelihood of Switching
Your Local Supermarket (Somewhat/Very Likely)
Avg Age
49
Trade Off Analysis
8% Shop for Groceries Online
Business Critical Shopper Behaviors
10% 10%
18%
0%
10%
20%
30%
40%
12 mo 24 mo 5 years
Most Important Fresh
Foods Department
Produce Beef Dairy
52% 15% 11%
Social Networking Tools used to gather or exchange
information about foods
Ways Local Supermarket Can Help to Maintain a Healthy Diet
Shelf tags with easily visible nutritional information
35%
Greater assortment of natural/organic items 32%
Products for special diets (i.e., gluten free) that are clearly marked
31%
% of Shopper Base that Would Continue to Shop at Your Store Based on a x% Price Increase
86% 73% 71% 52% 32%Continue to shop at the
store instead of shopping online
Speak positively
about the local supermarket
Recommend local super-
market to others through word
of mouth
Support local supermarket because it is linked to the community
Recommendlocal super-market to
others through social media
Gender Race
69% White
11% Black
5% Hispanic
14% Other
52% 48%
4%
Facebook Pinterest Instagram
33% 16% 10%
90%
43%
18%
0%
20%
40%
60%
80%
100%
+5% +10% +15%
New
England9%
74
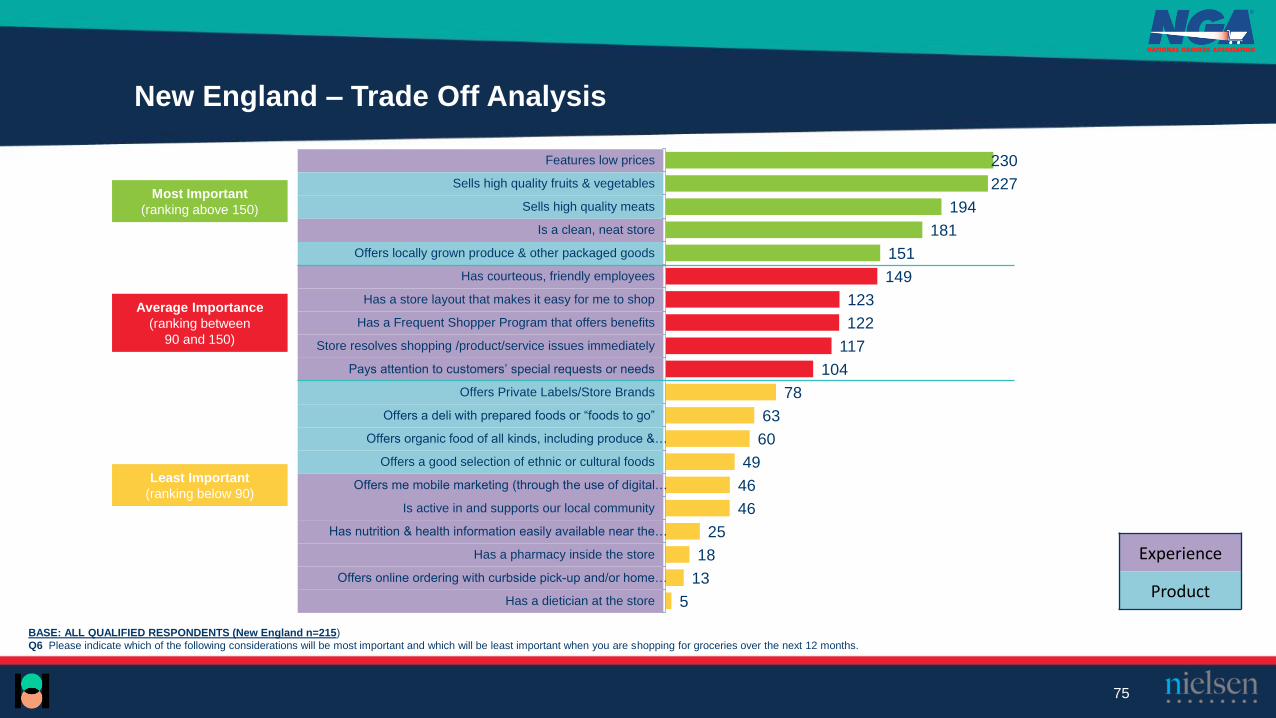
BASE: ALL QUALIFIED RESPONDENTS (New England n=215)
Q6 Please indicate which of the following considerations will be most important and which will be least important when you are shopping for groceries over the next 12 months.
New England – Trade Off Analysis
75
230
227
194
181
151
149
123
122
117
104
78
63
60
49
46
46
25
18
13
5
Features low prices
Sells high quality fruits & vegetables
Sells high quality meats
Is a clean, neat store
Offers locally grown produce & other packaged goods
Has courteous, friendly employees
Has a store layout that makes it easy for me to shop
Has a Frequent Shopper Program that offers benefits
Store resolves shopping /product/service issues immediately
Pays attention to customers’ special requests or needs
Offers Private Labels/Store Brands
Offers a deli with prepared foods or “foods to go”
Offers organic food of all kinds, including produce &…
Offers a good selection of ethnic or cultural foods
Offers me mobile marketing (through the use of digital…
Is active in and supports our local community
Has nutrition & health information easily available near the…
Has a pharmacy inside the store
Offers online ordering with curbside pick-up and/or home…
Has a dietician at the store
Average Importance
(ranking between
90 and 150)
Least Important
(ranking below 90)
Most Important
(ranking above 150)
Experience
Product

% Increase of Groceries Purchased Online
Scorecard: Middle Atlantic
Satisfaction(Extremely/Very Satisfied)
60%
Likelihood of Switching
Your Local Supermarket (Somewhat/Very Likely)
Avg Age
51
Trade Off Analysis
11% Shop for Groceries Online
Business Critical Shopper Behaviors
14%
22%
30%
0%
10%
20%
30%
40%
12 mo 24 mo 5 years
Most Important Fresh
Foods Department
Produce Beef Poultry
47% 17% 12%
Social Networking Tools used to gather or exchange
information about foods
Ways Local Supermarket Can Help to Maintain a Healthy Diet
Shelf tags with easily visible nutritional information
40%
Products for special diets (i.e., gluten free) that are clearly marked
30%
Greater assortment of natural/organic items 28%
% of Shopper Base that Would Continue to Shop at Your Store Based on a x% Price Increase
83% 69% 65% 50% 27%Continue to shop at the
store instead of shopping online
Speak positively
about the local supermarket
Recommend local super-
market to others through word
of mouth
Support local supermarket because it is linked to the community
Recommendlocal super-market to
others through social media
Gender Race
69% White
13% Black
12% Hispanic
5% Other
51% 49%
7%
Facebook YouTube Pinterest
35% 16% 13%
84%
47%28%
0%
20%
40%
60%
80%
100%
+5% +10% +15%
225
218
189
178
Features low prices
Sells high quality fruits & vegetables
Sells high quality meats
Is a clean, neat store
Middle
Atlantic20%
76

BASE: ALL QUALIFIED RESPONDENTS (Middle Atlantic n=611)
Q6 Please indicate which of the following considerations will be most important and which will be least important when you are shopping for groceries over the next 12 months.
Mid Atlantic - Trade Off Analysis
77
225
218
189
178
137
137
127
117
107
96
81
76
68
62
51
50
39
19
17
5
Features low prices
Sells high quality fruits & vegetables
Sells high quality meats
Is a clean, neat store
Has courteous, friendly employees
Offers locally grown produce & other packaged goods
Has a Frequent Shopper Program that offers benefits
Has a store layout that makes it easy for me to shop
Store resolves shopping /product/service issues immediately
Pays attention to customers’ special requests or needs
Offers Private Labels/Store Brands
Offers a deli with prepared foods or “foods to go”
Offers organic food of all kinds, including produce &…
Offers a good selection of ethnic or cultural foods
Is active in and supports our local community
Offers me mobile marketing (through the use of digital…
Has nutrition & health information easily available near the…
Has a pharmacy inside the store
Offers online ordering with curbside pick-up and/or home…
Has a dietician at the store
Most Important
(ranking above 150)
Average Importance
(ranking between
90 and 150)
Least Important
(ranking below 90)
Experience
Product
% Increase of Groceries Purchased Online
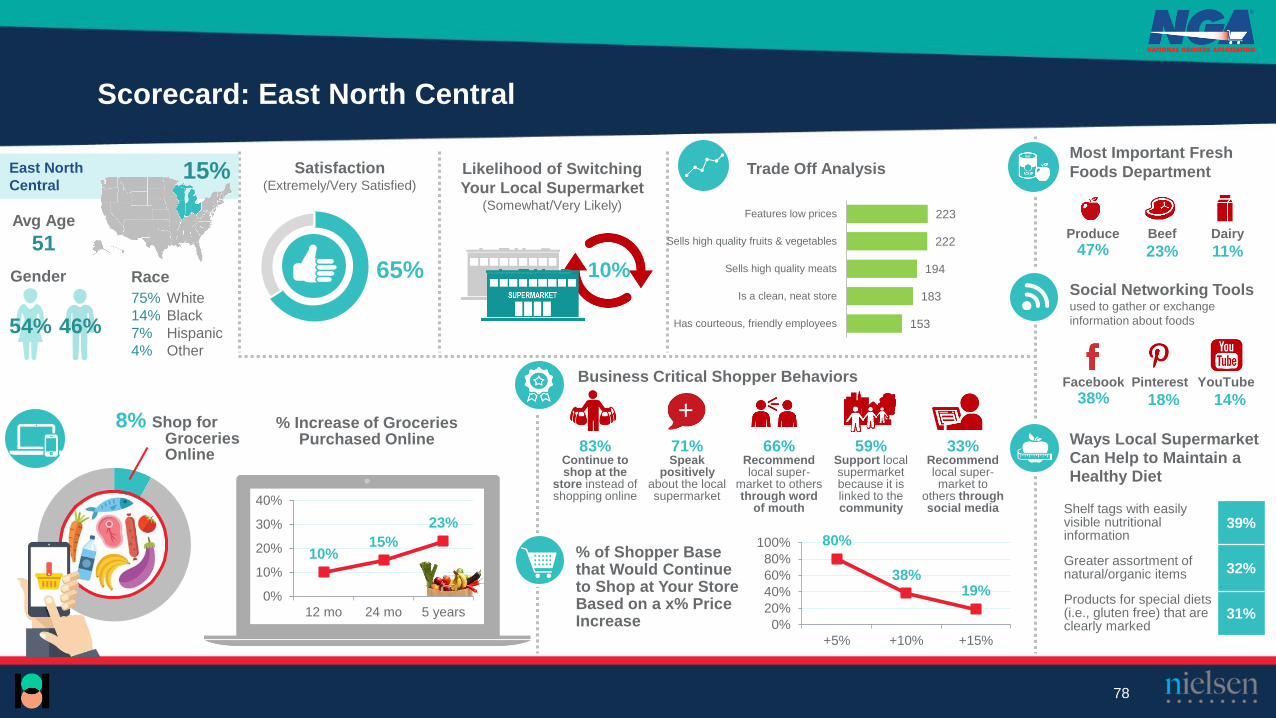
Scorecard: East North Central
Satisfaction(Extremely/Very Satisfied)
65%
Likelihood of Switching
Your Local Supermarket (Somewhat/Very Likely)
Avg Age
51
Trade Off Analysis
8% Shop for Groceries Online
Business Critical Shopper Behaviors
10%15%
23%
0%
10%
20%
30%
40%
12 mo 24 mo 5 years
Most Important Fresh
Foods Department
Produce Beef Dairy
47% 23% 11%
Social Networking Tools used to gather or exchange
information about foods
Ways Local Supermarket Can Help to Maintain a Healthy Diet
Shelf tags with easily visible nutritional information
39%
Greater assortment of natural/organic items 32%
Products for special diets (i.e., gluten free) that are clearly marked
31%
% of Shopper Base that Would Continue to Shop at Your Store Based on a x% Price Increase
83% 71% 66% 59% 33%Continue to shop at the
store instead of shopping online
Speak positively
about the local supermarket
Recommend local super-
market to others through word
of mouth
Support local supermarket because it is linked to the community
Recommendlocal super-market to
others through social media
Gender Race
75% White
14% Black
7% Hispanic
4% Other
54% 46%
10%
Facebook Pinterest YouTube
38% 18% 14%
80%
38%19%
0%
20%
40%
60%
80%
100%
+5% +10% +15%
223
222
194
183
153
Features low prices
Sells high quality fruits & vegetables
Sells high quality meats
Is a clean, neat store
Has courteous, friendly employees
East North
Central15%
78
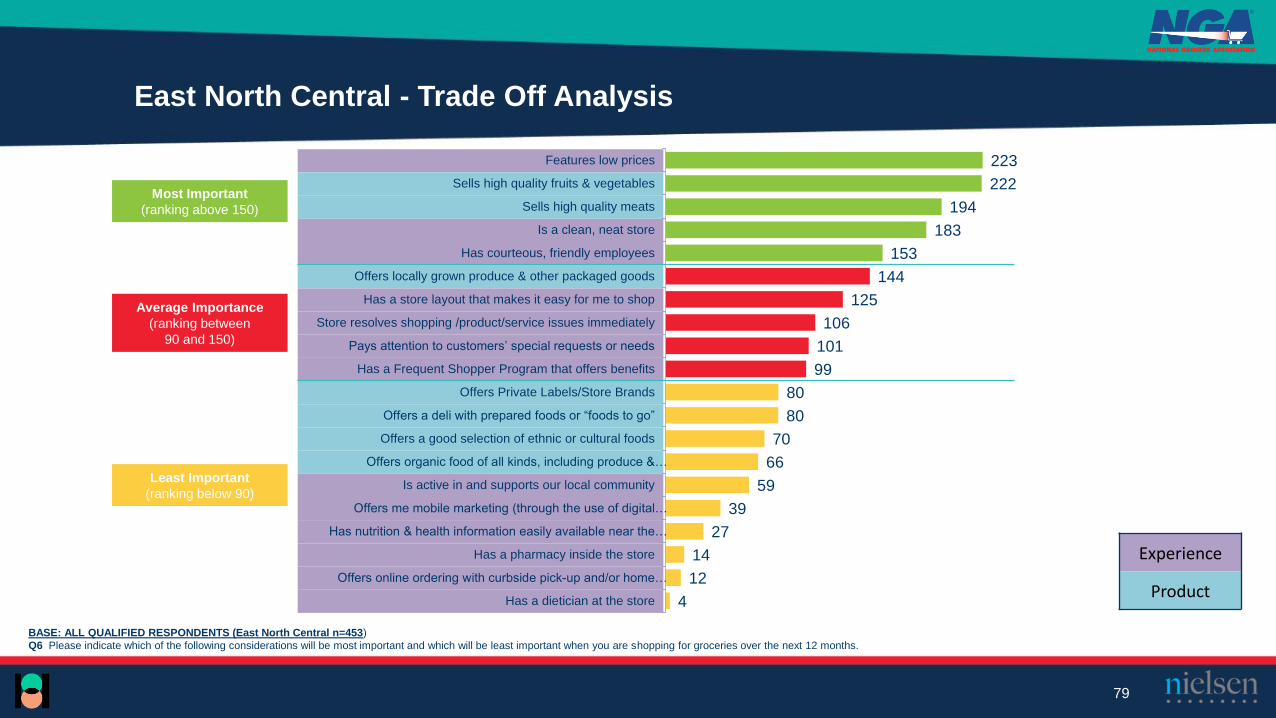
BASE: ALL QUALIFIED RESPONDENTS (East North Central n=453)
Q6 Please indicate which of the following considerations will be most important and which will be least important when you are shopping for groceries over the next 12 months.
East North Central - Trade Off Analysis
79
223
222
194
183
153
144
125
106
101
99
80
80
70
66
59
39
27
14
12
4
Features low prices
Sells high quality fruits & vegetables
Sells high quality meats
Is a clean, neat store
Has courteous, friendly employees
Offers locally grown produce & other packaged goods
Has a store layout that makes it easy for me to shop
Store resolves shopping /product/service issues immediately
Pays attention to customers’ special requests or needs
Has a Frequent Shopper Program that offers benefits
Offers Private Labels/Store Brands
Offers a deli with prepared foods or “foods to go”
Offers a good selection of ethnic or cultural foods
Offers organic food of all kinds, including produce &…
Is active in and supports our local community
Offers me mobile marketing (through the use of digital…
Has nutrition & health information easily available near the…
Has a pharmacy inside the store
Offers online ordering with curbside pick-up and/or home…
Has a dietician at the store
Most Important
(ranking above 150)
Average Importance
(ranking between
90 and 150)
Least Important
(ranking below 90)
Experience
Product

% Increase of Groceries Purchased Online
Scorecard: West North Central
Satisfaction(Extremely/Very Satisfied)
73%
Likelihood of Switching
Your Local Supermarket (Somewhat/Very Likely)
Avg Age
54
Trade Off Analysis
8% Shop for Groceries Online
Business Critical Shopper Behaviors
10%
18%23%
0%
10%
20%
30%
40%
12 mo 24 mo 5 years
Most Important Fresh
Foods Department
Produce Beef Dairy
52% 27% 6%
Social Networking Tools used to gather or exchange
information about foods
Ways Local Supermarket Can Help to Maintain a Healthy Diet
Shelf tags with easily visible nutritional information
46%
Products for special diets (i.e., gluten free) that are clearly marked
33%
Cooking instructions 28%
% of Shopper Base that Would Continue to Shop at Your Store Based on a x% Price Increase
89% 84% 80% 64% 35%Continue to shop at the
store instead of shopping online
Speak positively
about the local supermarket
Recommend local super-
market to others through word
of mouth
Support local supermarket because it is linked to the community
Recommendlocal super-market to
others through social media
Gender Race
83% White
5% Black
5% Hispanic
6% Other
61% 39%
7%
Facebook Pinterest YouTube
31% 22% 10%
80%
40%
16%
0%
20%
40%
60%
80%
100%
+5% +10% +15%
227
221
210
190
167
Features low prices
Sells high quality fruits & vegetables
Sells high quality meats
Is a clean, neat store
Has courteous, friendly employees
West North
Central9%
80

BASE: ALL QUALIFIED RESPONDENTS (West North Central n=265)
Q6 Please indicate which of the following considerations will be most important and which will be least important when you are shopping for groceries over the next 12 months.
West North Central - Trade Off Analysis
81
227
221
210
190
167
139
133
116
105
91
85
83
59
44
44
34
28
13
10
3
Features low prices
Sells high quality fruits & vegetables
Sells high quality meats
Is a clean, neat store
Has courteous, friendly employees
Has a store layout that makes it easy for me to shop
Offers locally grown produce & other packaged goods
Store resolves shopping /product/service issues immediately
Pays attention to customers’ special requests or needs
Has a Frequent Shopper Program that offers benefits
Offers Private Labels/Store Brands
Offers a deli with prepared foods or “foods to go”
Is active in and supports our local community
Offers organic food of all kinds, including produce &…
Offers a good selection of ethnic or cultural foods
Offers me mobile marketing (through the use of digital…
Has nutrition & health information easily available near the…
Has a pharmacy inside the store
Offers online ordering with curbside pick-up and/or home…
Has a dietician at the store
Most Important
(ranking above 150)
Average Importance
(ranking between
90 and 150)
Least Important
(ranking below 90)
Experience
Product
% Increase of Groceries Purchased Online
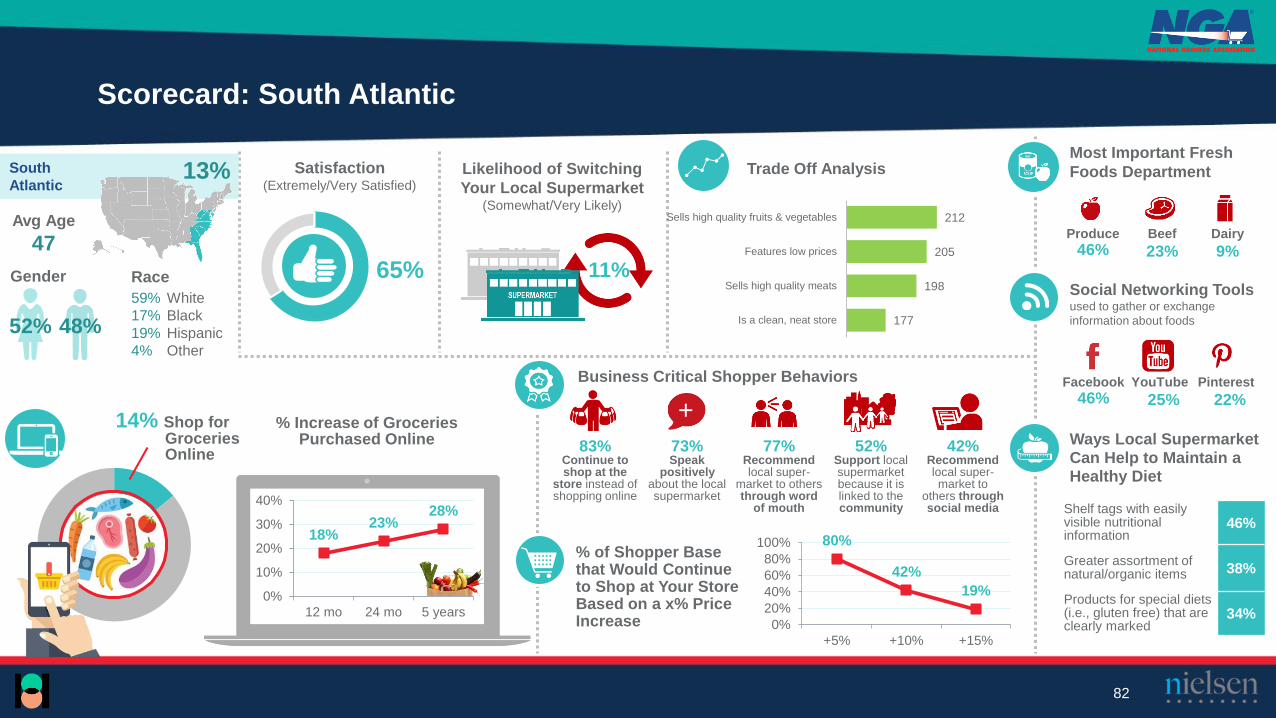
Scorecard: South Atlantic
Satisfaction(Extremely/Very Satisfied)
65%
Likelihood of Switching
Your Local Supermarket (Somewhat/Very Likely)
Avg Age
47
Trade Off Analysis
14% Shop for Groceries Online
Business Critical Shopper Behaviors
18%23%
28%
0%
10%
20%
30%
40%
12 mo 24 mo 5 years
Most Important Fresh
Foods Department
Produce Beef Dairy
46% 23% 9%
Social Networking Tools used to gather or exchange
information about foods
Ways Local Supermarket Can Help to Maintain a Healthy Diet
Shelf tags with easily visible nutritional information
46%
Greater assortment of natural/organic items 38%
Products for special diets (i.e., gluten free) that are clearly marked
34%
% of Shopper Base that Would Continue to Shop at Your Store Based on a x% Price Increase
83% 73% 77% 52% 42%Continue to shop at the
store instead of shopping online
Speak positively
about the local supermarket
Recommend local super-
market to others through word
of mouth
Support local supermarket because it is linked to the community
Recommendlocal super-market to
others through social media
Gender Race
59% White
17% Black
19% Hispanic
4% Other
52% 48%
11%
80%
42%
19%
0%
20%
40%
60%
80%
100%
+5% +10% +15%
Facebook YouTube Pinterest
46% 25% 22%
212
205
198
177
Sells high quality fruits & vegetables
Features low prices
Sells high quality meats
Is a clean, neat store
South
Atlantic13%
82

BASE: ALL QUALIFIED RESPONDENTS (South Atlantic n=383)
Q6 Please indicate which of the following considerations will be most important and which will be least important when you are shopping for groceries over the next 12 months.
South Atlantic - Trade Off Analysis
83
212
205
198
177
148
137
116
115
109
99
86
71
71
65
54
41
38
27
22
10
Sells high quality fruits & vegetables
Features low prices
Sells high quality meats
Is a clean, neat store
Has courteous, friendly employees
Offers locally grown produce & other packaged goods
Store resolves shopping /product/service issues immediately
Pays attention to customers’ special requests or needs
Has a store layout that makes it easy for me to shop
Has a Frequent Shopper Program that offers benefits
Offers organic food of all kinds, including produce &…
Offers Private Labels/Store Brands
Offers a deli with prepared foods or “foods to go”
Offers a good selection of ethnic or cultural foods
Is active in and supports our local community
Offers me mobile marketing (through the use of digital…
Has nutrition & health information easily available near the…
Has a pharmacy inside the store
Offers online ordering with curbside pick-up and/or home…
Has a dietician at the store
Most Important
(ranking above 150)
Average Importance
(ranking between
90 and 150)
Least Important
(ranking below 90)
Experience
Product
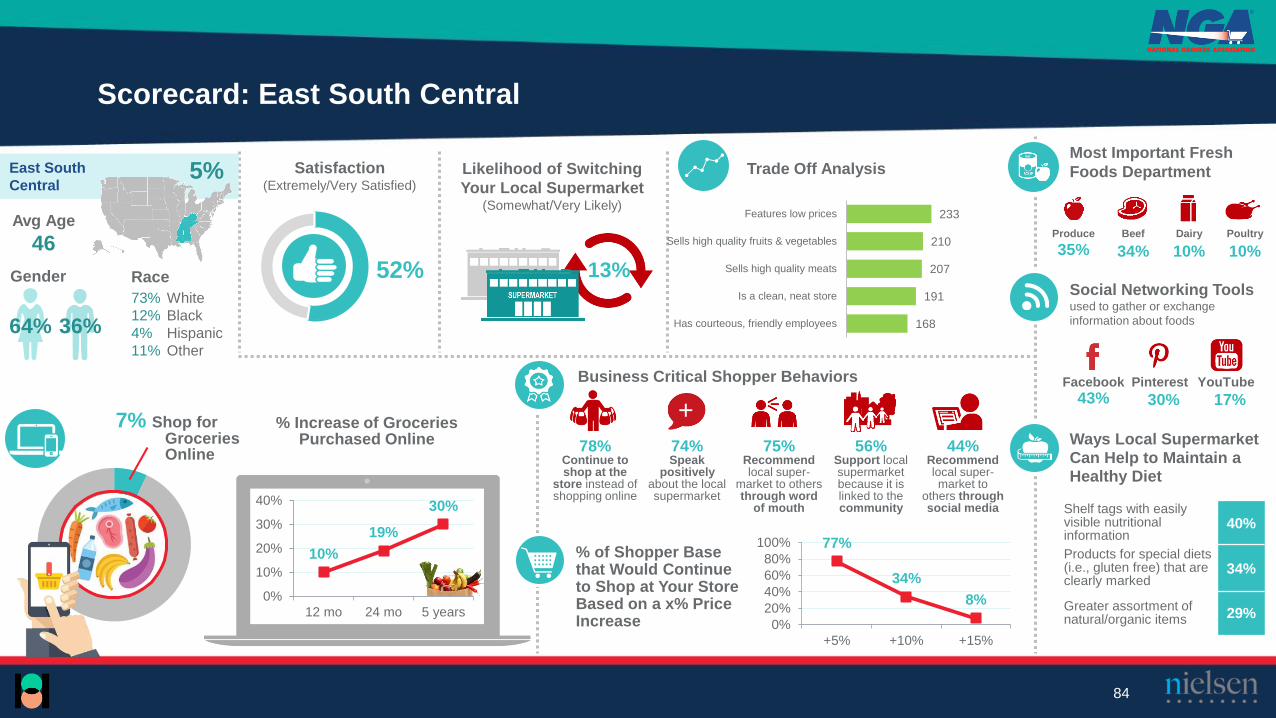
% Increase of Groceries Purchased Online
Scorecard: East South Central
Satisfaction(Extremely/Very Satisfied)
52%
Likelihood of Switching
Your Local Supermarket (Somewhat/Very Likely)
Avg Age
46
Trade Off Analysis
7% Shop for Groceries Online
Business Critical Shopper Behaviors
10%
19%
30%
0%
10%
20%
30%
40%
12 mo 24 mo 5 years
Most Important Fresh
Foods Department
Produce Beef Dairy Poultry
35% 34% 10% 10%
Social Networking Tools used to gather or exchange
information about foods
Ways Local Supermarket Can Help to Maintain a Healthy Diet
Shelf tags with easily visible nutritional information
40%
Products for special diets (i.e., gluten free) that are clearly marked
34%
Greater assortment of natural/organic items 29%
% of Shopper Base that Would Continue to Shop at Your Store Based on a x% Price Increase
78% 74% 75% 56% 44%Continue to shop at the
store instead of shopping online
Speak positively
about the local supermarket
Recommend local super-
market to others through word
of mouth
Support local supermarket because it is linked to the community
Recommendlocal super-market to
others through social media
Gender Race
73% White
12% Black
4% Hispanic
11% Other
64% 36%
13%
Facebook Pinterest YouTube
43% 30% 17%
77%
34%
8%
0%
20%
40%
60%
80%
100%
+5% +10% +15%
233
210
207
191
168
Features low prices
Sells high quality fruits & vegetables
Sells high quality meats
Is a clean, neat store
Has courteous, friendly employees
East South
Central5%
84
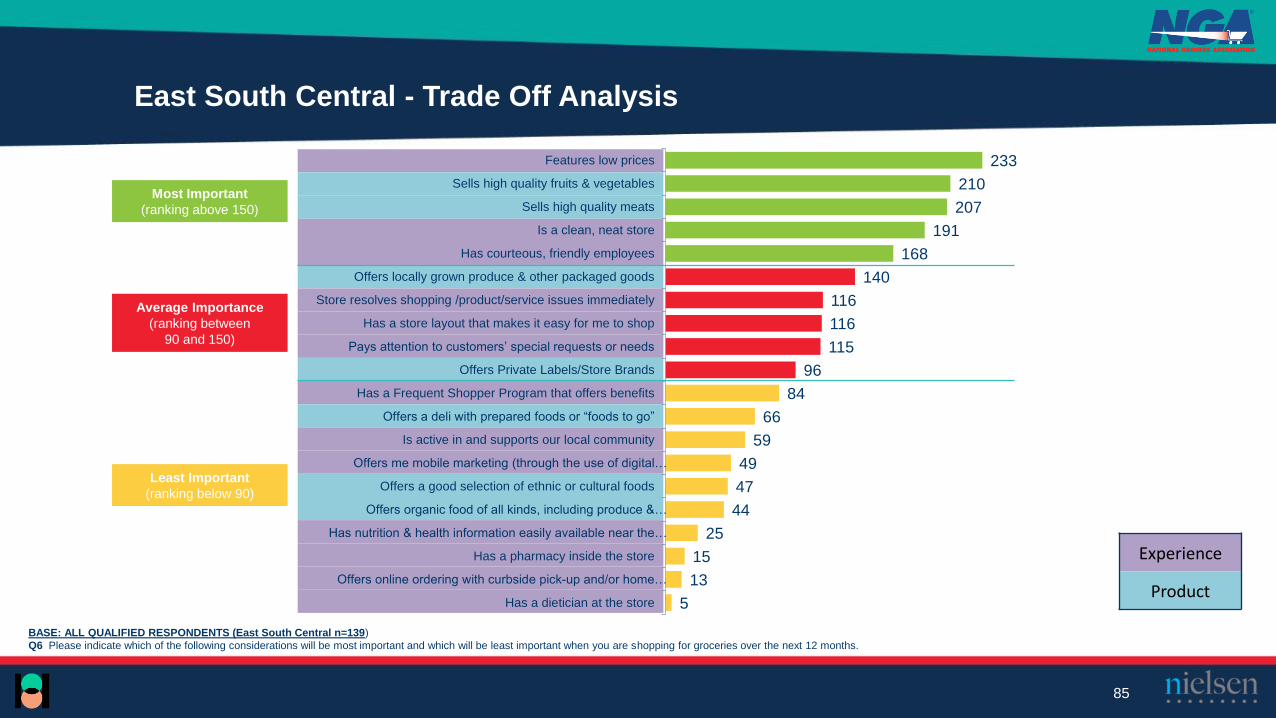
BASE: ALL QUALIFIED RESPONDENTS (East South Central n=139)
Q6 Please indicate which of the following considerations will be most important and which will be least important when you are shopping for groceries over the next 12 months.
East South Central - Trade Off Analysis
85
233
210
207
191
168
140
116
116
115
96
84
66
59
49
47
44
25
15
13
5
Features low prices
Sells high quality fruits & vegetables
Sells high quality meats
Is a clean, neat store
Has courteous, friendly employees
Offers locally grown produce & other packaged goods
Store resolves shopping /product/service issues immediately
Has a store layout that makes it easy for me to shop
Pays attention to customers’ special requests or needs
Offers Private Labels/Store Brands
Has a Frequent Shopper Program that offers benefits
Offers a deli with prepared foods or “foods to go”
Is active in and supports our local community
Offers me mobile marketing (through the use of digital…
Offers a good selection of ethnic or cultural foods
Offers organic food of all kinds, including produce &…
Has nutrition & health information easily available near the…
Has a pharmacy inside the store
Offers online ordering with curbside pick-up and/or home…
Has a dietician at the store
Most Important
(ranking above 150)
Average Importance
(ranking between
90 and 150)
Least Important
(ranking below 90)
Experience
Product
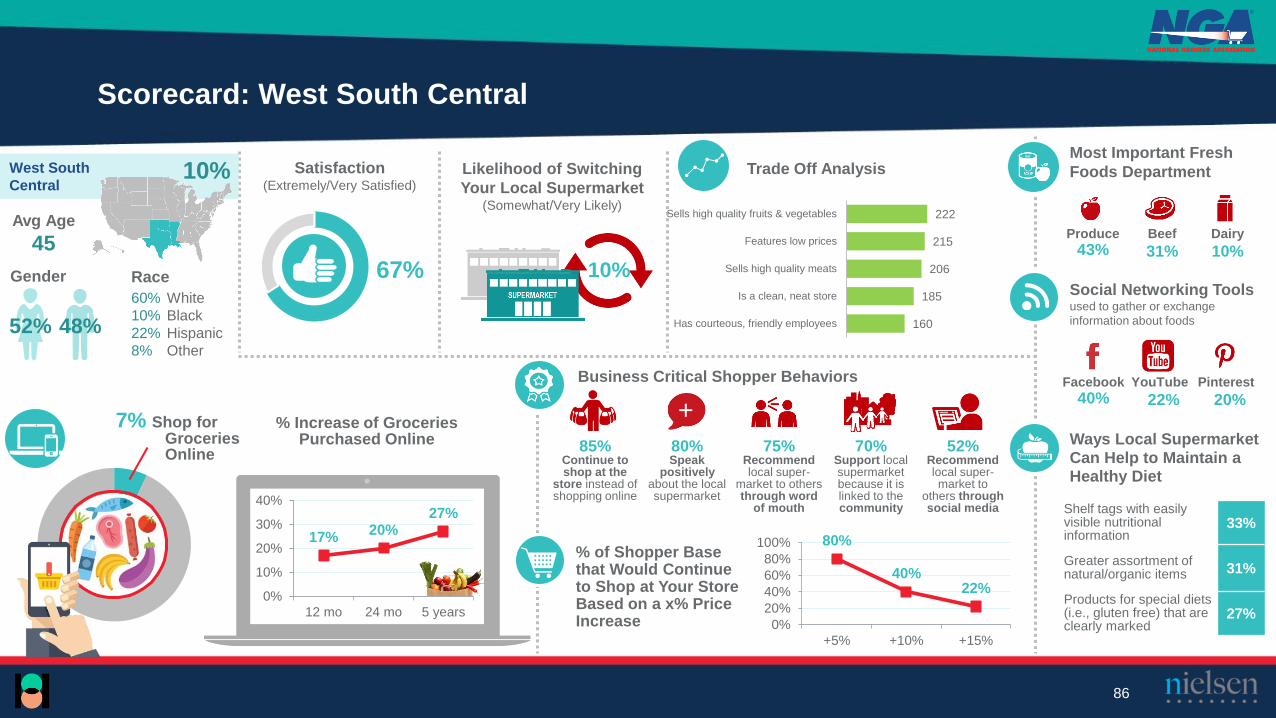
% Increase of Groceries Purchased Online
Scorecard: West South Central
Satisfaction(Extremely/Very Satisfied)
67%
Likelihood of Switching
Your Local Supermarket (Somewhat/Very Likely)
Avg Age
45
Trade Off Analysis
7% Shop for Groceries Online
Business Critical Shopper Behaviors
17%20%
27%
0%
10%
20%
30%
40%
12 mo 24 mo 5 years
Most Important Fresh
Foods Department
Produce Beef Dairy
43% 31% 10%
Social Networking Tools used to gather or exchange
information about foods
Ways Local Supermarket Can Help to Maintain a Healthy Diet
Shelf tags with easily visible nutritional information
33%
Greater assortment of natural/organic items 31%
Products for special diets (i.e., gluten free) that are clearly marked
27%
% of Shopper Base that Would Continue to Shop at Your Store Based on a x% Price Increase
85% 80% 75% 70% 52%Continue to shop at the
store instead of shopping online
Speak positively
about the local supermarket
Recommend local super-
market to others through word
of mouth
Support local supermarket because it is linked to the community
Recommendlocal super-market to
others through social media
Gender Race
60% White
10% Black
22% Hispanic
8% Other
52% 48%
10%
80%
40%22%
0%
20%
40%
60%
80%
100%
+5% +10% +15%
Facebook YouTube Pinterest
40% 22% 20%
222
215
206
185
160
Sells high quality fruits & vegetables
Features low prices
Sells high quality meats
Is a clean, neat store
Has courteous, friendly employees
West South
Central10%
86

BASE: ALL QUALIFIED RESPONDENTS (West South Central n=298)
Q6 Please indicate which of the following considerations will be most important and which will be least important when you are shopping for groceries over the next 12 months.
West South Central - Trade Off Analysis
87
222
215
206
185
160
141
119
108
106
86
77
70
69
64
64
36
35
22
11
4
Sells high quality fruits & vegetables
Features low prices
Sells high quality meats
Is a clean, neat store
Has courteous, friendly employees
Offers locally grown produce & other packaged goods
Has a store layout that makes it easy for me to shop
Pays attention to customers’ special requests or needs
Store resolves shopping /product/service issues immediately
Offers Private Labels/Store Brands
Has a Frequent Shopper Program that offers benefits
Is active in and supports our local community
Offers organic food of all kinds, including produce &…
Offers a deli with prepared foods or “foods to go”
Offers a good selection of ethnic or cultural foods
Has nutrition & health information easily available near the…
Offers me mobile marketing (through the use of digital…
Has a pharmacy inside the store
Offers online ordering with curbside pick-up and/or home…
Has a dietician at the store
Most Important
(ranking above 150)
Average Importance
(ranking between
90 and 150)
Least Important
(ranking below 90)
Experience
Product

% Increase of Groceries Purchased Online
Scorecard: Mountain
Satisfaction(Extremely/Very Satisfied)
66%
Likelihood of Switching
Your Local Supermarket (Somewhat/Very Likely)
Avg Age
48
Trade Off Analysis
13% Shop for Groceries Online
Business Critical Shopper Behaviors
15%20%
32%
0%
10%
20%
30%
40%
12 mo 24 mo 5 years
Most Important Fresh
Foods Department
Produce Beef Dairy
51% 24% 9%
Social Networking Tools used to gather or exchange
information about foods
Ways Local Supermarket Can Help to Maintain a Healthy Diet
Shelf tags with easily visible nutritional information
39%
Products for special diets (i.e., gluten free) that are clearly marked
39%
Greater assortment of natural/organic items 33%
% of Shopper Base that Would Continue to Shop at Your Store Based on a x% Price Increase
85% 82% 76% 62% 49%Continue to shop at the
store instead of shopping online
Speak positively
about the local supermarket
Recommend local super-
market to others through word
of mouth
Support local supermarket because it is linked to the community
Recommendlocal super-market to
others through social media
Gender Race
68% White
5% Black
19% Hispanic
7% Other
60% 40%
4%
Facebook Pinterest YouTube
44% 28% 19%
80%
43%25%
0%
20%
40%
60%
80%
100%
+5% +10% +15%
217
214
189
179
158
Features low prices
Sells high quality fruits & vegetables
Sells high quality meats
Is a clean, neat store
Has courteous, friendly employees
Mountain 6%
88
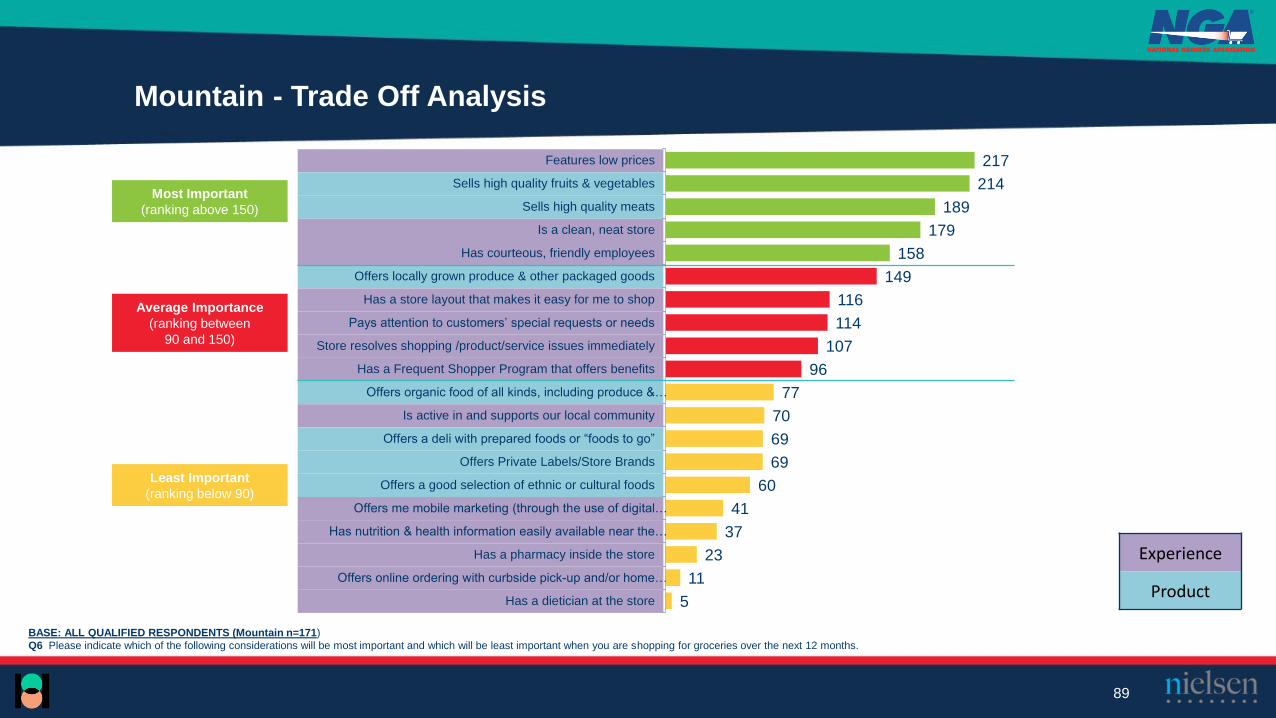
BASE: ALL QUALIFIED RESPONDENTS (Mountain n=171)
Q6 Please indicate which of the following considerations will be most important and which will be least important when you are shopping for groceries over the next 12 months.
Mountain - Trade Off Analysis
89
217
214
189
179
158
149
116
114
107
96
77
70
69
69
60
41
37
23
11
5
Features low prices
Sells high quality fruits & vegetables
Sells high quality meats
Is a clean, neat store
Has courteous, friendly employees
Offers locally grown produce & other packaged goods
Has a store layout that makes it easy for me to shop
Pays attention to customers’ special requests or needs
Store resolves shopping /product/service issues immediately
Has a Frequent Shopper Program that offers benefits
Offers organic food of all kinds, including produce &…
Is active in and supports our local community
Offers a deli with prepared foods or “foods to go”
Offers Private Labels/Store Brands
Offers a good selection of ethnic or cultural foods
Offers me mobile marketing (through the use of digital…
Has nutrition & health information easily available near the…
Has a pharmacy inside the store
Offers online ordering with curbside pick-up and/or home…
Has a dietician at the store
Most Important
(ranking above 150)
Average Importance
(ranking between
90 and 150)
Least Important
(ranking below 90)
Experience
Product
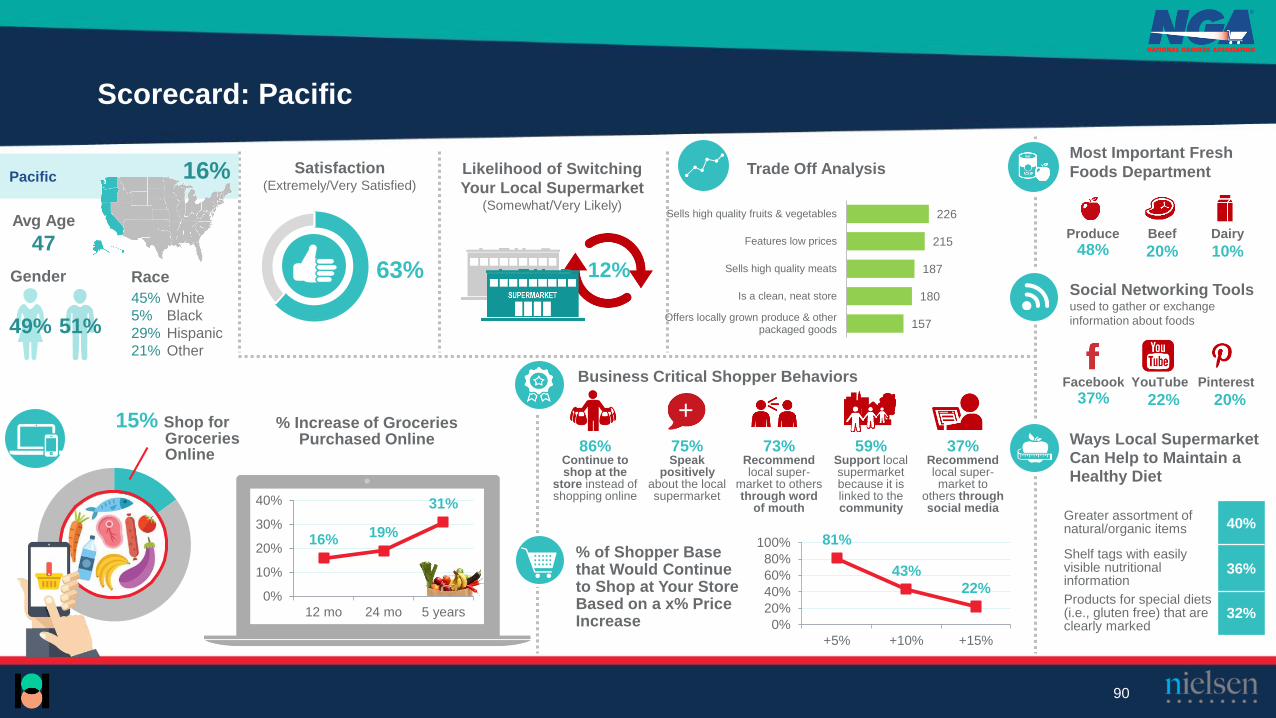
% Increase of Groceries Purchased Online
Scorecard: Pacific
Satisfaction(Extremely/Very Satisfied)
63%
Likelihood of Switching
Your Local Supermarket (Somewhat/Very Likely)
Avg Age
47
Trade Off Analysis
15% Shop for Groceries Online
Business Critical Shopper Behaviors
16%19%
31%
0%
10%
20%
30%
40%
12 mo 24 mo 5 years
Most Important Fresh
Foods Department
Produce Beef Dairy
48% 20% 10%
Social Networking Tools used to gather or exchange
information about foods
Ways Local Supermarket Can Help to Maintain a Healthy Diet
Greater assortment of natural/organic items 40%
Shelf tags with easily visible nutritional information
36%
Products for special diets (i.e., gluten free) that are clearly marked
32%
% of Shopper Base that Would Continue to Shop at Your Store Based on a x% Price Increase
86% 75% 73% 59% 37%Continue to shop at the
store instead of shopping online
Speak positively
about the local supermarket
Recommend local super-
market to others through word
of mouth
Support local supermarket because it is linked to the community
Recommendlocal super-market to
others through social media
Gender Race
45% White
5% Black
29% Hispanic
21% Other
49% 51%
12%
81%
43%
22%
0%
20%
40%
60%
80%
100%
+5% +10% +15%
Facebook YouTube Pinterest
37% 22% 20%
226
215
187
180
157
Sells high quality fruits & vegetables
Features low prices
Sells high quality meats
Is a clean, neat store
Offers locally grown produce & otherpackaged goods
Pacific 16%
90
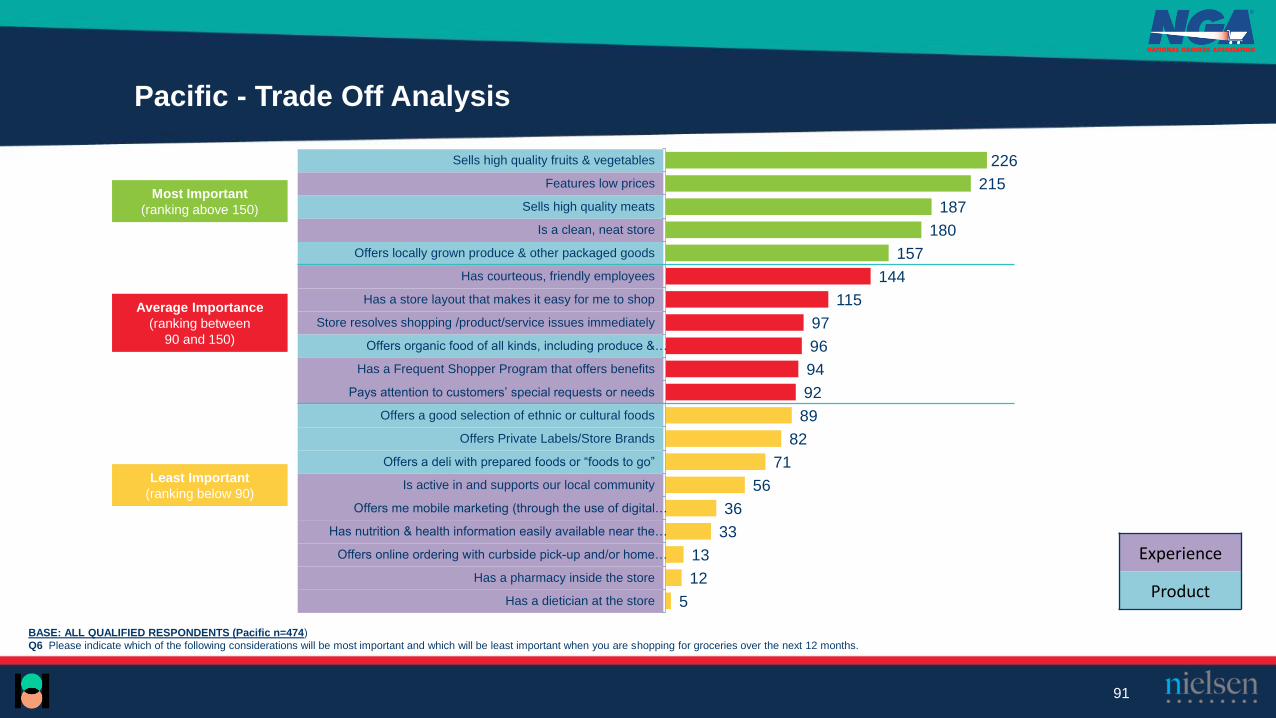
BASE: ALL QUALIFIED RESPONDENTS (Pacific n=474)
Q6 Please indicate which of the following considerations will be most important and which will be least important when you are shopping for groceries over the next 12 months.
Pacific - Trade Off Analysis
91
226
215
187
180
157
144
115
97
96
94
92
89
82
71
56
36
33
13
12
5
Sells high quality fruits & vegetables
Features low prices
Sells high quality meats
Is a clean, neat store
Offers locally grown produce & other packaged goods
Has courteous, friendly employees
Has a store layout that makes it easy for me to shop
Store resolves shopping /product/service issues immediately
Offers organic food of all kinds, including produce &…
Has a Frequent Shopper Program that offers benefits
Pays attention to customers’ special requests or needs
Offers a good selection of ethnic or cultural foods
Offers Private Labels/Store Brands
Offers a deli with prepared foods or “foods to go”
Is active in and supports our local community
Offers me mobile marketing (through the use of digital…
Has nutrition & health information easily available near the…
Offers online ordering with curbside pick-up and/or home…
Has a pharmacy inside the store
Has a dietician at the store
Most Important
(ranking above 150)
Average Importance
(ranking between
90 and 150)
Least Important
(ranking below 90)
Experience
Product

Independent Shopper Demographic Profile
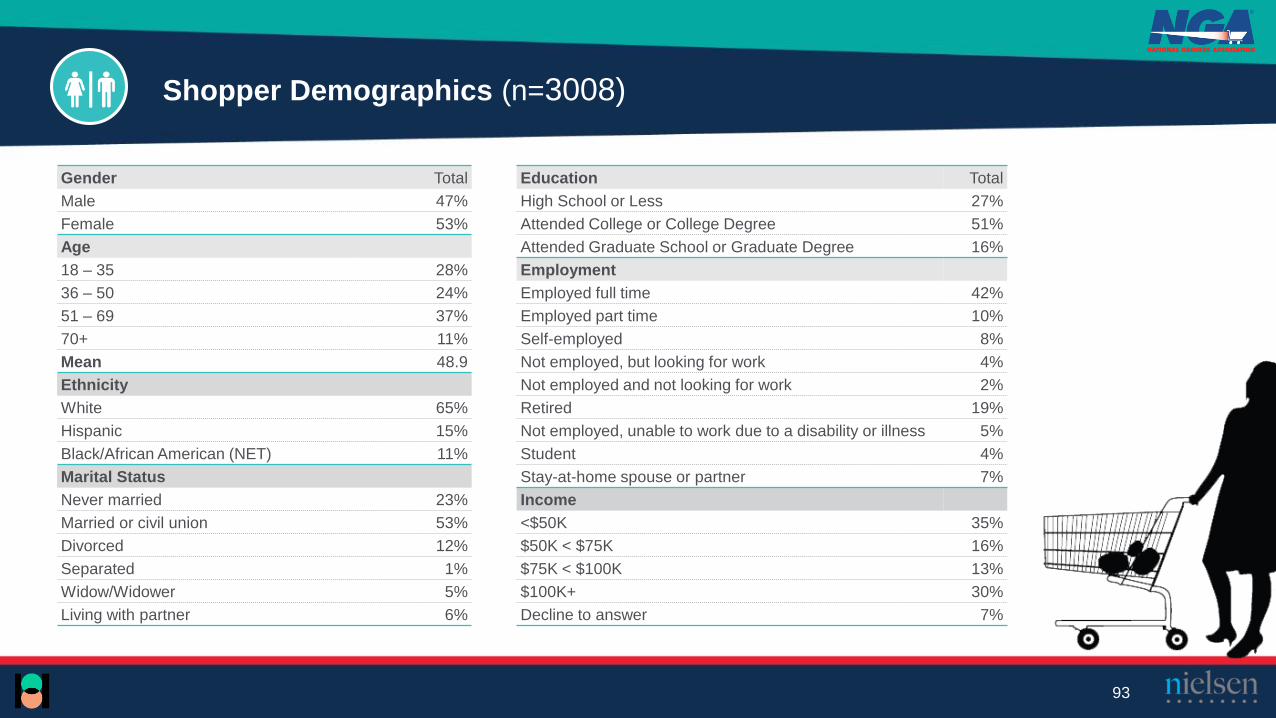
Gender Total
Male 47%
Female 53%
Age
18 – 35 28%
36 – 50 24%
51 – 69 37%
70+ 11%
Mean 48.9
Ethnicity
White 65%
Hispanic 15%
Black/African American (NET) 11%
Marital Status
Never married 23%
Married or civil union 53%
Divorced 12%
Separated 1%
Widow/Widower 5%
Living with partner 6%
Shopper Demographics (n=3008)
Education Total
High School or Less 27%
Attended College or College Degree 51%
Attended Graduate School or Graduate Degree 16%
Employment
Employed full time 42%
Employed part time 10%
Self-employed 8%
Not employed, but looking for work 4%
Not employed and not looking for work 2%
Retired 19%
Not employed, unable to work due to a disability or illness 5%
Student 4%
Stay-at-home spouse or partner 7%
Income
<$50K 35%
$50K < $75K 16%
$75K < $100K 13%
$100K+ 30%
Decline to answer 7%
93
For Further Understanding of the 44k Independent Shopper Panel
✓ Retailers contact:
✓ Andrea Scheuerman: [email protected]
✓ Bob Greenwood: [email protected]
✓ Manufacturers contact:
✓ Hin-Lo Lau: [email protected]
✓ Aurora Tice: [email protected]
94