rosario board of trade (bcr) market outlook october 2021
TRANSCRIPT

Rosario Board of Trade (BCR) Market Outlook – October 2021
1 / 13
Executive Summary
Grain Market
▪ Exports for US$ 76,064 million are forecast for 2021, and estimates for 2022 reach US$ 82,819 million, of which US$ 35,456 million correspond to the 6 main complexes of the agribusiness sector. That is to say, US$ 875 M below August estimation, due to the drop in prices.
▪ The corn trade of the current crop season amounts to 41.6 Mt, a record for this moment of the year. Also, Export Sworn Statements (DJVE, for its Spanish acronym) add up to 38.2 Mt.
▪ There have been modifications in the balance sheets of the three main crops for the current crop season, and adjustments for the new crop 2021/22.
Livestock Market
▪ ROSPORC: Hog/corn activity indexes, “5 kg of corn + 2 kg of soybean mix” and hog/steer, continue improving.
▪ Imports in the pork sector exceeded exports again, increasing the accumulated deficit in 2021 to date.
Report by the Department of Information and Economic Studies of Rosario Board of Trade (BCR)
Dr. Julio Calzada
Patricia Bergero
Lic. Emilce Terré
Lic. Federico Di Yenno
Lic. Desiré Sigaudo
Javier Treboux
Lic. Bruno Ferrari
Alberto Lugones
Lic. Tomás Rodríguez Zurro
Lic. Guido D’Angelo

Rosario Board of Trade (BCR) Market Outlook – October 2021
2 / 13
GRAIN MARKET
Exports
Total exports and main agribusiness product forecasts
According to new estimations, Argentina is to export US$ 76,064 million in 2021, US$ 21,180 million above last year. Also, this represents and improvement of U$ 1,210 million from the previous month. This is due, on the one hand, to an increase in the export forecasts of the main agribusiness products per tonnage, which overcompensates a slight cut in prices.
Also, Argentinian export forecasts for 2022 amount to US$ 82,819 million, virtually unchanged from last month’s forecast. The main complexes of the agribusiness sector might reach shippings for US$ 35,456 million, while the rest of the export complexes are forecast to total US$ 47,363 million. Therefore, the country’s exports are expected to exceed by US$ 6,755 million the estimations for 2021.
In the following chart, exports are detailed per selected product per year. It includes forecast export data from the report BCR Market Outlook – September 2021 and the new forecasts regarding export of grain and by-products per complex.
The export forecast of the main products from the agribusiness sector at current prices reaches US$ 36,650 million for 2021, US$ 507 million above last month’s forecast. This is mainly due to two factors: in the first place, an increase in the forecast export volume of soybean and corn; and secondly, and improvement in forecast export prices of wheat and soybean oil. These factors together overcompensate the drop of the export prices of soybean meal.
If we disaggregate per export complex, soybean complex is to reach exports for US$ 22,427 million, followed by the corn complex with US$ 8,509 million. In the third place, wheat complex will account for US$ 3,357 million, barley complex for US$ 1,271 million, and sunflower complex for US$ 1,086 million. Since temporary soybean

Rosario Board of Trade (BCR) Market Outlook – October 2021
3 / 13
imports are forecast in US$ 2,352 million, the main complexes of the agribusiness sector are to generate a net foreign currency income of US$ 34,298 million, US$ 12,295 million above 2020.
For 2022, the new export forecasts for the main products of the agribusiness sector reach US$ 35,456 million, US$ 875 million below last month’s forecasts. This drop is mainly explained by a cut in the export prices forecast for next year for most of the main export agribusiness products. It is particularly remarkable the drop in prices of soybean meal, which fell over US$ 20/t and result in a cut in the export value forecast of US$ 925 million. However, this drop is partially compensated by the improvement of export prices, mainly of soybean oil, which accounts for the increase of export forecasts for almost US$ 500 million. Also, the higher forecast exported tonnage of corn allows for the compensation of the cut in prices.
In this way, in the year-on-year comparison, the highest increase lies in the exports of wheat grain, due to an improvement both in prices as well as in amounts regarding 2021. Soybean and biodiesel might reach an increase in the value of exports of US$ 353 and US$ 315 million, respectively. On the contrary, the product that suffers the worst fall is soybean meal, which would lose US$ 2,363 million due to the drop in export prices
Thus, the soybean complex is to set itself as the main complex of the agribusiness complex, with a total of U$ 20,586 million. It is followed by the corn complex, with US$ 8,554 million in terms of exports for 2022. It would be the second year in a row when corn exceeds the barrier of US$ 8,000 million, consolidating as a key complex in Argentinian exports. In the third place comes the wheat complex, with exports for US$ 4,003 million between grain and meal. Last, barley and sunflower complexes sign up with foreign shippings for US$ 1,253 and US$ 1,060 million each, both exceeding US$ 1,000 million also for the second consecutive year.

Rosario Board of Trade (BCR) Market Outlook – October 2021
4 / 13
Productive and Trade Balance
Soybean, Corn and Wheat Trading Indicators - Current Crop Season
▪ Soybean: half-way into crop season 2020/21, the export sector has purchased 7.9 Mt of the oilseed, while it has declared exports for 5.2 Mt, below the volume committed by the same date both on the previous crop and the average of the last five years. Effective exports, on their part, totalized 5.1 Mt, considerably below the 6.5 Mt that had already been exported by the same date last year. As for the industry, the sector has already acquired 23.6 Mt of soybean, below the level of purchase of the previous crop and of the average of the last five years. Also, the sector has industrialized 20 Mt of soybean, exceeding the industrialization rate of the previous crop season and the average of the last five crop seasons. In this way, 31.5 Mt of soybean 2020/21 have already been traded. Considering that 7.5 Mt are forecast to be destined as seed and for animal consumption, there are still available for purchase 6 Mt of the 45 Mt obtained during the crop season, which equals to 13% of the production, a lower ratio to the one recorded by the same date last year, and to the average of the last five crop seasons. Therefore, it is evident that the lower production achieved in the current crop is the reason behind the lower volume traded to date, since the traded volume is higher than previous years when considered as a proportion of production.
▪ Corn: by October 6th, 42.3 Mt of corn have been traded, which is a record for this moment of the year. The export sector has acquired 38.9 Mt, exceeding the volume of purchases made by the same date not only in the previous crop season but the average of the last five years as well. Besides, it had declared 38.2 Mt to be exported (including varieties such as Flint and pop corn) when the new provisions to record export operations where disclosed, leaving a margin of approximately 0.4 Mt of “exportable balance” forecast by the ministry (for more information, please read the article published on the last Weekly Report, Changes in the recording of export sales of corn 2020/21). Actual exports to date totalize 30.4 Mt, below the volume shipped in the previous crop. As for the industry, this sector has acquired 3.4 Mt, of which 1.8 Mt have already been processed, exceeding the industrialization rate from the previous year.
▪ Wheat: of the 17 Mt obtained during the current crop season, 97% have already been traded, that is to say, 16.5 Mt. The export sector has acquired 12.5 Mt of bean, while exports have been declared for 10.6 Mt. Effective exports to date totalize 9.5 Mt, so there still need to be shipped abroad 1.1 Mt of the total declared. As for the milling sector, it shows a more lethargic purchase rate than in previous years: it has acquired 4 Mt, 500,000 t less than by the same date the previous year. The industrialized total since the beginning of the crop season to date rises to 4.4 Mt, below the figure reached by the same date last year.
Bearing in mind that 0.9 Mt of wheat would be destined for use as seed and for animal consumption, all the available grain of the current crop season has already been traded, so it can be expected that part of the grain in the hands of the export sector turns to the domestic market, while stocks by the end of the crop might drop from last year’s.

Rosario Board of Trade (BCR) Market Outlook – October 2021
5 / 13
Soybean, Corn and Wheat Trading Indicators - New Crop Season
▪ Soybean: the domestic trade of soybean 2021/22 shows a lower pace with regards to what happened in previous years. The export sector has bought 300,000 t of bean, both below the purchase volume of the previous crop season to this date and the average of the last five crop seasons. Industry purchases are also below the volume acquired not only in the previous season, but also below the average of the last five crops by the same moment of the year. As for exports, there are still no operations on record, just as last year. Considering that the forecast production for the new crop rises to 49 Mt and that the use destined to seed and animal consumption totals 7.5 Mt, 39.3 Mt are available for purchase, which equals to 80% of the forecast production.
▪ Corn: the export sector has acquired 7.8 Mt of the grain 2021/22.. The sector has slowed down purchases, since last month they were above last year’s record, but this month they are behind what happened by the same date in 2020. The industrial sector registers purchases for 100,000 t of new crop corn to date. As for exports, 5.1 Mt of corn have already been declared to be exported in the next crop, below the volume declared by the same date last year. Considering that the total production for the new crop is forecast in 56.3 Mt, and that the volume destined as seed and for animal consumption rises to 12.1 Mt, there are still available for purchase 36.4 Mt, which equals to 65% of the forecast production. Also, 41% of what has already been traded is still unquoted, above the volume of last year and of the last five years.
▪ Wheat: domestic trade of wheat 2021/22 shows an uneven outlook between the export and the milling sectors.

Rosario Board of Trade (BCR) Market Outlook – October 2021
6 / 13
Exports-wise, purchases of the sector reach 7.7 Mt, a record for this moment of the year. The milling sector, in the meantime, has made almost no purchases of new crop wheat, showing a more sluggish pace of purchases than in previous years. This is in line with what was observed for wheat in the current crop season since, as mentioned above, purchases made by mills are lower than the ones made in previous years. Last, the total of wheat declared for export reaches 6.9 Mt, that is to say, 75% more than the sales of new wheat by the same date during the previous crop.
▪ Last, considering that the production of the current crop is forecast at 20.7 Mt, and that 1 Mt will be destined as seed and for animal consumption, only 12 Mt are available for sale, equivalent to 58% of the production. Another aspect to highlight is that 34% of the production has already been set a price, exceeding the volume of last year and that of the last five years.
Supply and demand balance forecast of Soybean, Corn and Wheat.
▪ Soybean: the balance sheet of soybean 2020/21 shows modifications with regards to the use of the oilseed. Export of soybean increased by 500,000 t to reach 5.5 Mt in the face of a higher shipping rate and a higher level of export sales. Since no other modifications were made, final stocks of the crop season fall to 10.4 Mt. As for soybean 2021/22, the only modification comes from the mentioned drop in stocks at the beginning of the crop.
▪ Corn: the 2020/21 wheat balance sheet shows adjustments both on supply and in use of the cereal. As for supply, a 1 Mt increase in production is forecast, reaching 52 Mt, a record for the country. This is due to yields higher than expected in the late corn/second crop corn segment. On the side of demand, a 1.5 Mt increase in exports of the cereal is forecast due, on the one hand, to the higher local production and, on the other hand, to the high level of export sales and effective exports. Since the increase in the use of the cereal is higher than the increase in production, final stocks fall by 0.5 to 4.4 Mt, and the stock/use ratio is 8%. As for corn 2021/22, the only modification recorded is the mentioned drop in stocks at the beginning of the crop
Rosario Board of Trade (BCR) Market Outlook – October 2021
7 / 13
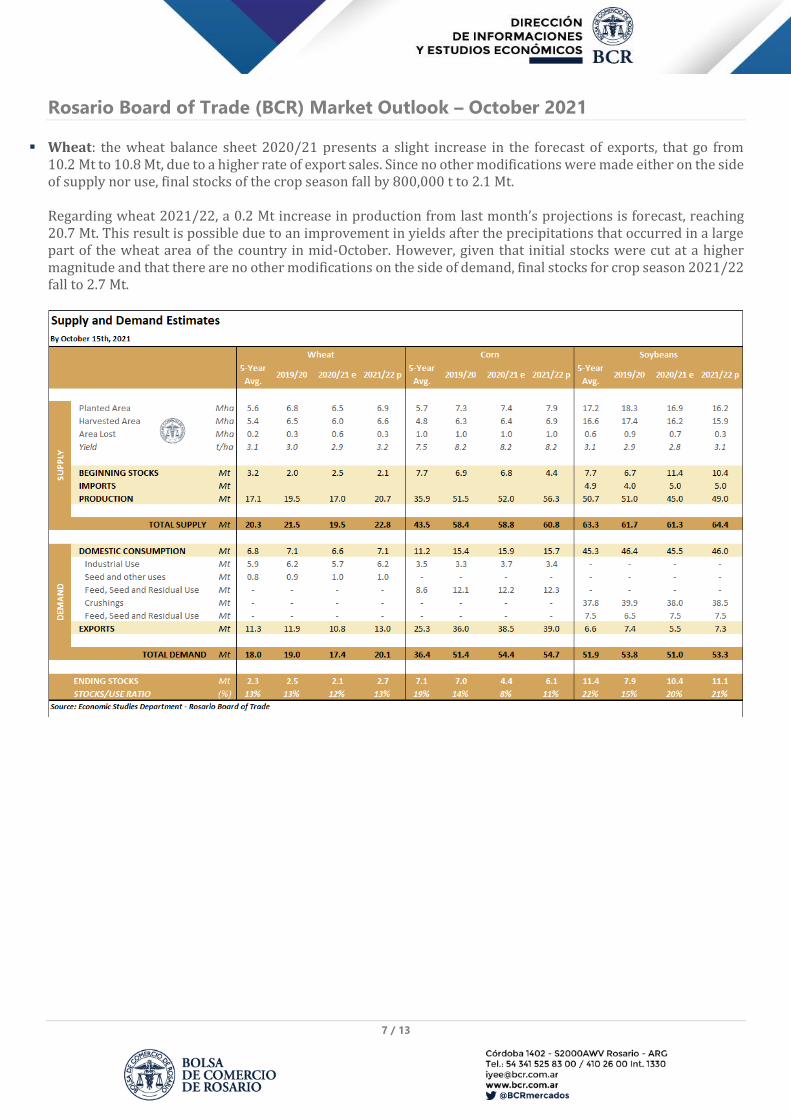
▪ Wheat: the wheat balance sheet 2020/21 presents a slight increase in the forecast of exports, that go from 10.2 Mt to 10.8 Mt, due to a higher rate of export sales. Since no other modifications were made either on the side of supply nor use, final stocks of the crop season fall by 800,000 t to 2.1 Mt. Regarding wheat 2021/22, a 0.2 Mt increase in production from last month’s projections is forecast, reaching 20.7 Mt. This result is possible due to an improvement in yields after the precipitations that occurred in a large part of the wheat area of the country in mid-October. However, given that initial stocks were cut at a higher magnitude and that there are no other modifications on the side of demand, final stocks for crop season 2021/22 fall to 2.7 Mt.

Rosario Board of Trade (BCR) Market Outlook – October 2021
8 / 13
LIVESTOCK MARKET
Pig Market
ROSPORC
For delivery on week 41 of 2021, that is, between October 3rd and 10th, the average quote of hog in ROSPORC reached a value of $ 160/kg, which results in an increase of 3.2% week-on-week. At the same time, there was a 6.6% rise from last month, since on week 37 the average quote was $ 150/kg. Additionally, versus the same week of 2020, there is a 45% increase, since at that time the value per kg of live hog was $ 110/kg.
The average quote of ROSPORC operations presents a high correlation to the hog maximum quote published by the Argentinian Ministry of Agriculture, Livestock and Fisheries (MAGyP, for its Spanish acronym). In that sense, the value published by MAGyP for week 41 (October 4th to 10th) for general maximum live hog was $ 160/kg, while on the ROSPORC platform the value for the same week was also $ 160/kg.

Rosario Board of Trade (BCR) Market Outlook – October 2021
9 / 13
Input/product index
▪ Bearing in mind that, according to different analysis and studies made on the pork market, swine feed represents between 60 and 70% of the production costs, the prices of those inputs and their evolution are variables of the utmost importance for pig breeding. With the knowledge that pigs’ diet is mainly based on corn and soybean by-products, we elaborated the following indexes commonly used within the sector:
o Hog/corn index: this indicator shows the relation between the relative price of corn and the prices of hog in the domestic market through time. It results from dividing the price of hog by the kilogram of corn, conveying in this way how many kilograms of corn can be bought with the proceedings per kilogram of the sale of live hogs at a certain point in time. After the high volatility between 2019 and mid-2020, a trend started where this ratio decreased until on week 19 of 2021 minimum values in at least 2 years were reached for the ratio general maximum live hog/corn, hitting a value of 5.77, and later regaining ground after the decrease in the quotes of the cereal, registering an index of 8.26 on week 41, which represents an increase of 43.2% in these 5 months and a half. In a similar way, the formulated index with the general average price live hog during week 20 of 2021 got the lowest record since 2019, getting to a value of 4.96. From that point onwards, there has been a remarkable recovery, hitting during week 37 a ratio value of 6.83, and resulting in a 38.5% increase.

Rosario Board of Trade (BCR) Market Outlook – October 2021
10 / 13
o “5 kg of corn + 2 kg of soybean mix”: in the sector, this indicator is frequently used under the idea that the value in pesos of a kilogram of live hog should equal the sum of the market value of 5 kg of corn and 2 kg of soybean. It is a market convention upon which we make no judgement, but simply calculate as an additional indicator for decision-making. It assumes a reference of which should be the theoretical price that hog should have regarding the price of these two essential grains for animal feed: corn and soybean. In the chart, three variables are compared:
a) Price in pesos of “5 kg of corn + 2 kg of soybean mix”. b) Maximum price in pesos of live hog. c) Average price in pesos of live hog.
By analysing the period 2019-2021, the historical development shows a gap in the theoretical price (maximum or average) in relation to the mentioned “Mix”, particularly from the last months of 2020. The maximum value of the “Mix” was on week 20 of 2021 ($ 175.6), and later it set on a value of $165.1. At present, the differential between the theoretical “Mix” and the value measured by MAGyP for general maximum live hog is only $5.1 for this last week, which shows a new approximation between both quotes, reducing the gap that was present between the prices per kilogram of live hogs and the evolution of the prices of soybean and corn. It should be remembered that the maximum gap was on week 20 ($ 47/kg), which is why (interpreting this reduction in the differential) it could be stated that the productive outlook has tended to improve in the last few months. Also, the ratio obtained from the general maximum live hog price and the 5+2 Mix is 0.97. That is to say, the maximum live hog typified has a price only 3% lower than what is marked by this indicator.

Rosario Board of Trade (BCR) Market Outlook – October 2021
11 / 13
o Hog/steer index: following a similar methodology to that of the hog/corn index, where the evolution of relative prices is reflected, in this case we analysed the performance of quotes of live kilogram of beef and pork since 2019, represented by their highest exponents regarding domestic trade. In this sense, hog prices surveyed by MAGyP are used again, while for the value of steer we used the monthly quotes surveyed by Mercado de Liniers S.A. cattle market. Again, the value of live hog is divided by the value of steer, taking into account the monthly average values in both cases, representing how many kilograms of live steer are needed to buy a kilogram of live hog in the markets.
This ratio usually ranges from 0.6 to 1. In the last few months, government measures that reduced the value of steer indirectly generated a rise in this ratio. In this sense, pork showed a relative increase in its prices, resulting in a general maximum live hog/steer ratio of 0.91, and of 0.75 for the general average live hog/steer ratio for the first days of October.

Rosario Board of Trade (BCR) Market Outlook – October 2021
12 / 13
Activity monitor of the pig market
Pig slaughter fell slightly in August versus the processing of pigs that occurred in July, while in year-on-year terms, there was a rise of 5.9%. Also, if comparing 2021 to 2020, between January and August, the rise in slaughter was of 7.8%. Following the processing dynamics, meat production in August fell versus July and, as a consequence, during the first 8 months of the year, the generation of pork had a 7.5% rise year-on-year. As for the foreign trade, since the beginning of 2021 to August, Argentina has accumulated a deficit of approximately 13.4 million dollars. This is the result of the strong increase in imports in 2021, since they rose above the 17.1% showed by exports in dollars. Also, the share of exports on production (export/production ratio) of pork in 2021 to date shows that, on average, a lower share of production was exported in comparison to what happened a year ago. The apparent consumption maintains an upward trend in August, with an absorption of 14.5%, higher than the same month of 2020. Likewise, the year-on-year accumulated increase is 10.4%, and the consumption per capita and their annual average exceeded the records from a year ago.

Rosario Board of Trade (BCR) Market Outlook – October 2021
13 / 13
Highlights of the pig sector
The external sector of the pig market, which was one of the main dynamizing factors of the activity, has come to a plateau in the last few months. The reduction of the Chinese demand on the global market after the recovery of their pig production after the African Swine Fever disease in 2019 has generated a decrease of the international trade. Argentina was mainly affected by the contraction in the exported volumes in the last few months. Anyway, the fact remains that the high levels of exports obtained during the first months of the year act as a compensation, reducing the impact of the lower external sales on the trade balance of our country. In order to chart this more clearly, we need to highlight that between January and August, exports have been for US$ 50 million, while in 2020, this figure equalled US$ 42 million. In other words, there has been a year-on-year rise slightly over 17% in FOB income up to August. However, between July and August, shipments have been made for barely US$ 4 million, this being the worst record for the mentioned two months since the same period in 2016. Still, imports grew considerably from 2020. Until August 2021, the equivalent to US$ 63.6 million have been purchased while in the previous year, goods from the pork sector have been imported for US$ 38.6 million, which implies a year-on-year growth of 64.7%. This can be understood as the return to pre-COVID-19 pandemics conditions. That is to say, the low level of imports in 2020 was to a large extent a consequence of the intrinsic restrictions of the pandemics and currently we are getting closer to the import levels of years like 2019. Finally, as a consequence of these situations, the trade balance has a negative result. However, the trade balance for July-August 2021 (US$ 10.1 million) is the worst since 2017 (US$ 14 million). On the other hand, although the gap between exports and imports for the segments January-August 2021 shows a deficit of US$ 13 million, this amount results considerably lower than the one of previous years.