ricardo jorge bou a)
TRANSCRIPT
I
MITOCHONDRIAL REGULATION OF EPIGENETICS AND ITS
ROLE IN HUMAN DISEASES
Ricardo Jorge Bouça-Nova Coelho
Dissertação de Mestrado em Oncologia
2013

II

III
Ricardo Jorge Bouça-Nova Coelho
MITOCHONDRIAL REGULATION OF EPIGENETICS AND ITS ROLE IN
HUMAN DISEASES
Molecular
Orientador
Professor Doutor Valdemar de Jesus Conde Máximo
Professor associado convidado
Faculdade de Medicina - Universidade do Porto
Investigador – Instituto de Patologia e Imunologia
Molecular
Dissertação de mestrado apresentada ao Instituto de
Ciências Biomédicas Abel Salazar da Universidade do
Porto em Oncologia – Especialização em Oncologia

IV

V
Acknowledgments
Devo o maior dos agradecimentos ao meu orientador, Prof. Doutor Valdemar Máximo, pela
oportunidade de realizar a minha tese de mestrado integrada num dos seus projectos, por todo
o apoio prestado, disponibilidade, dedicação e a confiança que sempre depositou nas minhas
competências e pela oportunidade de explorar sempre mais um pouco as questões que foram
surgindo durante a realização deste trabalho. Não posso também deixar de referir a
transmissão de conhecimento, o entusiasmo e a boa disposição.
Agradeço à Prof. Doutora Paula Soares por me ter aceite no grupo “Cancer Biology”, e por nos
proporcionar as melhores condições para realizar um trabalho com qualidade e incentivando-
nos a ser sempre melhores.
Um agradecimento ao Prof. Doutor Sobrinho Simões por ser o principal mentor do magnífico
ambiente que caracteriza o IPATIMUP, sendo acima de tudo um exemplo para todos nós.
Agradeço ao Prof. Doutor Jorge Lima pelo fornecimento dos “cibridos”, linhas sem as quais
não poderia realizar este trabalho.
Agradeço ainda ao Prof. Doutor Hugo Osório, pela transmissão de conhecimentos, na
elaboração de parte das técnicas realizadas durante este trabalho.
Não posso deixar de agradecer aos “jovens investigadores” e colegas de bancada que
proporcionam o ambiente excepcional que se vive, no grupo “Cancer Biology”. A todos tenho
que agradecer a disponibilidade, entreajuda e também amizade. Em especial agradeço à
Joana Nunes, Rui Baptista e Ana Almeida por me terem ensinado parte das técnicas que foram
a base deste trabalho e por estarem sempre disponíveis a esclarecer as dúvidas que foram
surgindo no decorrer da elaboração deste trabalho. À Ana Dias e à Catarina Tavares, agradeço
toda a disponibilidade e atenção. Ao Ricardo Celestino e ao João Vinagre agradeço por todos
os conhecimentos transmitidos, companheirismo e boa disposição.
Finalmente agradeço aos meus Pais, pela paciência e por sempre acreditarem em mim e me
fazer acreditar.
A todos um Muito Obrigado.

VI
VII
Abbreviations
2-D- Two dimensional
2-HG- 2-hydroxyglutarate
5-hmC- 5-hydroxymethylcytosine
5-mC- 5-methylcytosine
AceCS1/2- Acetyl coenzyme A synthetase 1 or 2
ACL- ATP citrate lyase
ACN- Acetonitrile
ACTB- Actin, cytoplasmic 1
AML- Acute myelogenous leukaemia
AMP- Adenosine monophosphate
AMPK- Adenosine monophosphate-activated protein kinase
ANOVA- Analysis of variance
ANXA2- Annexin A2
ATP- Adenosine triphosphate
CAPZA1- F-actin-capping protein subunit alpha-1
cDNA- Complementary DNA
CO2- Carbon dioxide
CoA- Coenzyme A
COX II - Cytochrome C oxidase subunit II
CpG- Cytosine-phosphate-Guanine
CR- Caloric restriction
Cyp D- Cyclophilin D
D-Loop- Displacement loop
DMEM- Dulbecco’s modified eagle medium
DNA- Deoxyribonucleic acid
DNMT1/3A/3B/3L- DNA methyltransferases 1; 3A; 3B or 3L
dNTP- Deoxyribonuceotide triphosphate
DTT- Dithiothreitol
ECL- Enhanced chemiluminescence
EDTA- Ethylenediaminetetraacetic acid
EEF2- Elongation factor 2
EGF- Epidermal Growth Factor

VIII
eIF3I- Eukaryotic translation initiation factor 3 subunit I
eIF4AI- Eukaryotic Initiation factor 4A1
ENOI- Alpha enolase
ETC- Electron transport chain
FAD+/FADH2- Flavin Adenine Dinucleotide
FBP- Fructose 2, 6 bisphosphate
FBS- Fetal bovine serum
FH- Fumarate hydratase
GAPDH- Glyceraldehyde 3 phosphate dehydrogenase
GDH- Glutamate dehydrogenase
GDI2- Isoform 2 of Rab GDP dissociation inhibitor beta
GLS- Glutaminase
GLUT1- Glucose transporter 1
GNMT- Glycine N-methyltransferase
H2B/3/4- Histone 2B; 3 or 4
H2O2- hydrogen peroxide
H3K9/14/18- Histone H3 acetylated at lysines 9; 14 or 18
H4K5/8/12/16- Histone H4 acetylated at lysines 5; 8; 12 or 16
HAT- Histone acetyltransferase
HDAC- Histone deactylase
Her-2- Human Epidermal growth factor Receptor 2
HIF-1- Hypoxia-inducible transcription factor 1
HIF-1α- Hypoxia-inducible transcription factor 1 α
HK- hexokinase
HPRT- Hypoxanthine phosphoribosyltranferase 1
HSV- Hepes Simplex Virus
IAA- Iodoacetamide
IDH1/2- Isocitrate dehydrogenase 1 or 2
IGF-1- Isulin like Growth Factor 1
IGF-BP3- IGF binding protein-3
JHDM- Jumonji-C-domain histone demethylases
K- Lysine
KAT- Lysine acetyltransferase
kb- kilobases

IX
kDa- Kilodaltons
KDAC- Lysine deacetylase
LDH-A/B- Lactate dehydrogenase A or B
MALDI- Matrix Assisted Laser Desorption Ionization
MAT- Methionine adenosyltransferase
MAT1A/2A/2B- Methionine adenosyltransferase 1 alpha; 2 alpha or 2 beta
MnSOD- Manganese superoxide dismutase
mPTP- Mitochondrial permeability transition pore
mRNA- Messenger RNA
mtDNA- Mitochondrial DNA
mTOR- Mammalian target of rapamycin
MW- Molecular weight
NA3VO4- Sodium orthovanadate
NAD+/NADH- Nicotinamide adenine dinucleotide
NADPH- Nicotinamide adenine dinucleotide phosphate
NAM- Nicotinamide
ND1- NADH: ubiquinone oxidoreductase subunit 1
nDNA- nuclear DNA
NDUFS3- NADH dehydrogenase (ubiquinone) Fe-S protein 3
NH4HCO3 - Ammonium bicarbonate
OAA- Oxaloacetate
ºC- Degrees centigrade
OGT- O GlcNAc transferase
ON- Overnight
OXPHOS- Oxidative phosphorylation
p53- protein 53
PAICS- Phosphoribosylaminoimidazole carboxylase
PBS- Phosphate buffered saline
PCR- Polymerase Chain Reaction
PDK- Pyruvate Dehydrogenase Kinase
PEP- Phosphoenolpyruvate
PFK- 6-phosphofructo-1-kinase
PGC-1α- Peroxisome proliferator-activated receptor gamma co-activator 1-alpha
PI3K- Phosphatidylinositol 3-kinase

X
PK- Pyruvate kinase
PKM1/2- Pyruvate Kinase isoform 1 or 2
PPP- Pentose Phosphate Pathway
PTEN- Phosphate and Tensin homolog
PTM- Post-translation modifications
R- Arginine
RNA- Ribonucleic acid
ROS- Reactive oxygen species
RPLP0- 60s acidic ribosomal protein
RPSA- 40S ribosomal protein SA
RQ- Relative quantification
rRNA- Ribosomal RNA
RT- Room temperature
RTK- Receptor tyrosine kinase
RT-PCR- Reverse Transcriptase – Polymerase Chain Reaction
s- Seconds
SAH- S-adenosylhomocysteine
SAM- S-adenosylmethionine
SCO1/2- Synthesis of cytochrome C oxidase 1 or 2
SDH- Succinate dehydrogenase
SDHA- Succinate dehydrogenase subunit A
SDS-PAGE- Sodium dodecyl sulphate polyacrylamide gel eletrophoresis
Ser454- Serine residue at position 454
SOD-2- Manganese-superoxide dismutase
TCA- Tricarboxylic acid cycle
TET- Ten Eleven Translocation family of enzymes
TFA- Trifluoroacetic acid
TIGAR- TP-53 inducible regulator of glycolysis and apoptosis protein
TKT- Transketolase
TRAP1- Heat shock protein 75kDa
tRNA Leu (UUR)- Transfer RNA for leucine UUR
tRNA- Transfer RNA
V- Volts
VDA- Voltage dependent anion channel protein

XI
VHL- Von Hippel-Lindau
Wt- Wild type
XRCC- X-ray repair cross-complementing protein
α-KG- Alpha ketoglutarate

XII

XIII
Table of contents
Abbreviations ....................................................................................................................... VII
Index of Figures ................................................................................................................. XVII
Index of Tables ................................................................................................................... XIX
Resumo .............................................................................................................................. XXI
Summary .......................................................................................................................... XXIII
Chapter 1 Introduction...................................................................................................... 1
1.1 Cellular metabolism .......................................................................................................... 3
1.2 Metabolic alterations in cancer .......................................................................................... 5
1.3 Mitochondrial genome and the role of mtDNA in the pathogenesis of mitochondrial
dysfunction in cancer .............................................................................................................. 8
1.4 Metabolism and epigenetics ............................................................................................ 10
1.5 Protein post-translational modifications and cell signal transduction ............................... 12
1.6 DNA methylation - 5-methylcytosines (5-mC) and 5-hydroxymethylcytosine (5-hmC) .... 13
1.7 Acetyl-CoA and metabolism ............................................................................................ 15
1.8 Lysine acetylation and mitochondria ............................................................................... 18
1.9 Protein acetylation and Sirtuins ....................................................................................... 19
1.10 Role of lysine acetylation in chromatin remodelling ....................................................... 20
1.11 Cybrids ......................................................................................................................... 22
Chapter 2 Hypothesis and Aims .................................................................................... 23
2.1 Hypothesis ...................................................................................................................... 25
2.2 Aim ................................................................................................................................. 25
Chapter 3 Materials and Methods ................................................................................... 27
3.1 Cell lines and cell culture conditions................................................................................ 29
3.2 Nucleic acids extraction from cell lines ............................................................................ 29
3.2.1 DNA extraction ......................................................................................................... 29
3.2.2 RNA extraction ......................................................................................................... 30

XIV
3.3 Polymerase Chain Reaction (PCR) ................................................................................. 30
3.4 Agarose gel Electrophoresis ........................................................................................... 31
3.5 Mitochondrial DNA (mtDNA) characterisation and haplogroup affiliation ......................... 32
3.5.1 MtDNA Sequencing .................................................................................................. 32
3.5.2 Complete mtDNA sequencing and mtDNA haplogroup affiliation .............................. 32
3.6 Total cell lysates ............................................................................................................. 34
3.7 Western Blot analysis ..................................................................................................... 34
3.8 Reserve Transcriptase – Polymerase Chain Reaction (RT-PCR) .................................... 36
3.9 Real time PCR/ qPCR ..................................................................................................... 36
3.10 Complex I Enzyme Activity ............................................................................................ 36
3.11 Luminescent ATP Detection Assay ............................................................................... 37
3.12 Quantification of global DNA methylation ...................................................................... 38
3.13 Genomic 5-hydroxymethylcytosine levels evaluation .................................................... 39
3.14 Immunoprecipitation protocol ........................................................................................ 40
3.14.1 Preparing Cell Lysates ........................................................................................... 40
3.14.2 Immunoprecipitation ............................................................................................... 40
3.15 Two-dimensional (2-D) gel electrophoresis ................................................................... 41
3.15.1 Protein Precipitation ............................................................................................... 41
3.15.2 Rehydration and sample application ....................................................................... 41
3.15.3 Coloration with Coomassie Blue ............................................................................. 42
3.16 Mass Spectrometry Methods for Studying differentially acetylated proteins .................. 42
3.17 Statistical Analysis ........................................................................................................ 44
Chapter 4 Results ........................................................................................................... 45
4.1 Cybrid Cell Lines ............................................................................................................. 47
4.2 Evaluation of mtDNA mutation status in the cybrid cells .................................................. 48
4.2.1 Mutations status of the cybrid cell lines (3571Cy 1 and 3571Cy 22) displaying a
mtDNA ND1 gene mutation – (3571InsC) .......................................................................... 48

XV
4.2.2 Mutation status of the cybrid cell line displaying a mtDNA tRNA Leu (UUR) gene mutation
- A3243T cybrid ................................................................................................................. 49
4.2.3 Sequencing of the 143B, 143B Rho0 and CMPBR3 cell lines ................................... 49
4.2.4 Mitochondrial DNA (mtDNA) haplogroup affiliation of the 143B, CMPBR3, 3243Cy 9.7
and 3571Cy 1 cell lines ..................................................................................................... 51
4.3 Complex I activity ............................................................................................................ 52
4.4 Analysis of ND1 protein expression level in cybrids with mtDNA ND1 gene mutation ..... 53
4.5 Analysis of global ATP levels .......................................................................................... 55
4.6 Global metabolic profile of the cell lines .......................................................................... 56
4.7 Analysis of DNA methylation status ................................................................................ 57
4.7.1 Evaluation of 5-methylcytosine ................................................................................. 57
4.7.2 Real time PCR for genes involved in the methylation cycle and DNA
methyltransferases. ........................................................................................................... 59
4.7.2.1 GNMT, MAT1A, MAT2A and MAT2B genes mRNA expression levels ............... 59
4.7.2.2 DNA methyltransferases: DNMT1 and DNMT3B genes mRNA expression levels
...................................................................................................................................... 65
4.7.3 Evaluation of 5-hydroxymethylcytosine ..................................................................... 67
4.8 Protein lysine acetylation and ACL protein expression .................................................... 69
4.9 Study of acetylated proteins ............................................................................................ 70
4.10 Sirt3 and SOD-2 protein expression, regulation of activation......................................... 75
Chapter 5 Discussion ....................................................................................................... 79
5.1 Mitochondrial energy metabolism and the epigenetics .................................................... 81
5.2 Cell lines ......................................................................................................................... 83
5.3 Complex I activity ............................................................................................................ 84
5.4 Global ATP levels ........................................................................................................... 86
5.5 Global metabolic profile of the cell lines .......................................................................... 88
5.6 DNA Methylation status of the cell lines .......................................................................... 89
5.7 Protein lysine acetylation and ACL protein expression .................................................... 92

XVI
5.8 Sirt 3 and SOD-2 protein expression, regulation of activation ......................................... 96
Chapter 6 Conclusion and future perspectives .............................................................. 99
6.1 Conclusion .................................................................................................................... 101
6.2 Future perspectives ...................................................................................................... 102
Chapter 7 References ................................................................................................... 105
7.1- References .................................................................................................................. 107
Chapter 8 Annexes ....................................................................................................... 119
8.1 Annexes ........................................................................................................................ 121

XVII
Index of Figures
Figure 1. An overview of Intermediary Metabolism ................................................................. 3
Figure 2. Signaling networks and their regulation of metabolism in proliferating cells ............. 8
Figure 3. Signalling and metabolic inputs into epigenetics ................................................... 11
Figure 4. Crosstalk between metabolism and epigenetics .................................................... 12
Figure 5. Schematic illustration of one-carbon metabolism................................................... 15
Figure 6. Role of acetyl-CoA in protein modification and growth........................................... 17
Figure 7. Schematic representation of the cybrid production method ................................... 22
Figure 8. Complex I Enzyme Activity Microplate Assay Kit (ab109721) (Abcam®) ............... 37
Figure 9. Illustration of CpGenome 5-hmC quantitation kit assay principle ........................... 39
Figure 10. Sequence analysis of the mtDNA ND1 gene ....................................................... 48
Figure 11. Sequence analysis of the mtDNA tRNA Leu (UUR) gene in the cybrid 3243Cy 9.7 ... 49
Figure 12. Sequence analysis of the mtDNA ND1 gene. ...................................................... 50
Figure 13. Sequence analysis of the mtDNA tRNA Leu (UUR) gene. ......................................... 50
Figure 14. Analysis of protein levels of COXII in all cell lines ................................................ 51
Figure 15. Mitochondrial DNA (mtDNA) haplogroup affiliation .............................................. 52
Figure 16. Analysis of complex I activity ............................................................................... 53
Figure 17. Western blot analysis for ND1 and NDUFS3 protein levels ................................. 54
Figure 18. Analysis of global ATP levels .............................................................................. 56
Figure 19. Analysis of DNA methylation status ..................................................................... 59
Figure 20. Real time PCR analysis for GNMT gene ............................................................. 60
Figure 21. Real time PCR analysis for MAT1A gene ............................................................ 61
Figure 22. Real time PCR analysis for MAT2A gene ............................................................ 63
Figure 23. Real time PCR analysis for MAT2B gene ............................................................ 64
Figure 24. Real time PCR analysis for DNMT1 gene. ........................................................... 66
Figure 25. Real time PCR analysis for DNMT3B gene ......................................................... 67
Figure 26. Analysis of global levels of 5-hydroxymethylcytosine .......................................... 68
Figure 27. Analysis of acetylated lysines .............................................................................. 69
Figure 28. Analysis of ACL protein expression ..................................................................... 70
Figure 29. Analysis of acetylated protein levels. A ............................................................... 71
Figure 30. Analysis of two dimensional gels stained with coomassie blue for the 143B and
143B Rho0 cell lines. ...................................................................................................... 72

XVIII
Figure 31. Identification of proteins in two dimensional gel stained with coomassie blue
corresponding to the 143B sample................................................................................. 72
Figure 32. Analysis for the eIF4AI, GAPDH and ENOI proteins ............................................ 74
Figure 33. Immunoprecitation for Glyceraldehyde-3-phosphate dehydrogenase .................. 74
Figure 34. Analysis of Sirt3 protein expression..................................................................... 76
Figure 35. Analysis of SOD-2 and SOD-2K68 protein expression ........................................ 78
Figure 36. Genotype: phenotype correlations in human mitochondrial disease .................... 83
Figure 37. The role of the mitochondrial genome in energy generation ................................ 88
Figure 38. Acetylation is involved in multiple cellular functions ............................................. 93
Figure 39. Link between acetylation, tumorigenesis and the Warburg effect ........................ 96
Figure 40. A model on SIRT3-mediated SOD2 activation ..................................................... 97

XIX
Index of Tables
Table 1. Primers sequences, amplicon sizes and optimal annealing temperature used for
real-time PCR ................................................................................................................ 31
Table 2. Primers used in the amplifications and sequencing of mtDNA genome ................... 33
Table 3. Primary antibodies and respective conditions in the procedure of western blot ....... 35
Table 4. Metabolite levels in the cell lines compared with 143B cell line ............................... 57
Table 5. List of proteins identified by mass spectrometry ...................................................... 73

XX

XXI
Resumo
A mitocôndria desempenha um papel central na regulação do metabolismo celular. Como
consequência, desempenha um papel importante numa grande variedade de condições
patológicas, tais como: doenças neurodegenerativas, cancro, diabetes e envelhecimento. A
actividade mitocondrial é em grande parte dependente da disponibilidade de nutrientes no
meio ambiente e da sua conversão em energia útil. A conversão de macronutrientes, como
por exemplo açúcares, lípidos e proteínas, em moléculas de elevado potencial energético tais
como: adenosina trifosfato (ATP), acetil-coenzima A (acetil-CoA), S-adenosil-metionina (SAM)
e nicotinamida adenina dinucleotídeo (NADH), ocorre através da mitocôndria e da glicólise. O
ATP, a acetil-CoA, a SAM e a NAD+/NADH, por sua vez, são substratos de alta energia
utilizados para reações de fosforilação de proteínas (incluindo histonas),
acetilação/desacetilação de proteínas e metilação de proteínas e ADN, contribuindo assim
para a regulação de várias vias celulares e para a remodelação epigenética da cromatina.
Deste modo, a inter-relação entre o ADN mitocondrial e o metabolismo celular, tem um papel
crucial na manutenção dos níveis de co-factores essenciais para o funcionamento de enzimas
responsáveis pela regulação da epigenética celular, nomeadamente, regulação da metilação
do ADN e acetilação de proteínas. As mutações no ADN mitocondrial, na sua maioria, induzem
defeitos na fosforilação oxidativa. A disfunção mitocondrial e especialmente, a disfunção
mitocondrial causada por mutações no ADN mitocondrial, têm sido implicadas numa grande
variedade de patologias relacionadas com a idade. Na verdade, os defeitos em genes
mitocondriais podem simular praticamente todos os sintomas associados com as doenças
complexas comuns, confirmando a importância da bioenergética mitocondrial na saúde.
O principal objectivo deste estudo foi revelar de que forma as mutações patogénicas no ADN
mitocondrial e/ou variantes mitocondriais podem levar a mudanças epigenéticas, quer no
padrão de metilação do ADN quer no padrão de acetilação de histonas e outras proteínas.
Os nossos resultados demonstraram que a disfunção mitocondrial, causada por mutações no
ADN mitocondrial, pela ausência de ADN mitocondrial, bem como pela presença de algumas
variantes mitocondriais (ADN mitocondrial pertencente a diferentes haplogrupos), induz
alterações no perfil metabólico da célula, na actividade do complexo I mitocondrial, na
metilação do ADN e na acetilação de proteínas. Além disso, observou-se que a disfunção
mitocondrial causada pela ausência de ADN mitocondrial, conduz ao reajustamento de vários
processos celulares, através de alterações no grau de acetilação de várias proteínas,
contribuindo para homeostasia celular e deste modo garantíndo a sobrevivência da célula.

XXII
Palavras chave: Mitocôndria; ADN mitocondrial; fosforilação oxidativa; metilação de ADN;
acetilação de proteínas;

XXIII
Summary
Mitochondria have a central role in energy uptake and energy production, and as consequence
they play a key role in a wide variety of pathological conditions, such as cancer
neurodegenerative diseases, diabetes and aging. The mitochondrial activity is largely
dependent on the environmental availability of nutrients and their conversion to usable energy
that takes place by the conversion, by mitochondrion and by glycolysis, of energy rich
compounds, such as carbohydrates and fats, into adenosine triphosphate (ATP), acetyl-
Coenzyme A (Acetyl-CoA), S-adenosylmethionine (SAM), and nicotinamide adenine
dinucleotide (NADH). ATP, acetyl-CoA, SAM, and NAD+/NADH, in turn, are the high-energy
substrates for protein (including histones) phosphorylation, acetylation and deacetylation
reactions, and DNA and protein methylation, thus contributing to regulation of several cell
pathways and epigenetic and chromatin remodelling. Thus, the interrelationship between
mtDNA and cell metabolism have an essential role in the maintenance of the levels of essential
co-factors for epigenetic mechanism such as DNA methylation and acetylation reactions.
Mutations in the mitochondrial DNA (mtDNA), most of the time induce defects in oxidative
phosphorylation (OXPHOS). Mitochondrial dysfunction, and especially mitochondrial
dysfunction caused by mutations in mtDNA have been implicated in a wide range of age related
pathologies. Indeed, mitochondrial gene defects can result in virtually all of the symptoms
associated with the common complex diseases, confirming the importance of mitochondrial
bioenergetics in health.
The main goal of this study was to unveil how pathogenic mutations in mtDNA and/or
mitochondrial variants may lead to epigenetic changes, namely alterations in the pattern of
nuclear DNA methylation and/or acetylation of histones and other proteins.
Our data, showed that mitochondrial dysfunction, caused either by mtDNA mutations or
absence of mtDNA, as well as the presence of some mitochondrial variants (different mtDNA
haplogroups) induce changes in cell metabolic profile, complex I activity, DNA methylation and
protein acetylation. Furthermore, we observed that mitochondrial dysfunction caused by
depletion of mtDNA, leads to the readjustment of several cellular processes through the
acetylation of several proteins, allowing the cell to survive and maintain its homeostasis.
Key words: Mitochondria; mtDNA; OXPHOS; DNA methylation; protein acetylation,

XXIV

1
Chapter 1 Introduction

2

3
1.1 Cellular metabolism
Metabolism is broadly defined as the sum of biochemical processes in living organisms that
either produce or consume energy. The metabolism can be simplified to those pathways
involving abundant nutrients such as carbohydrates, fatty acids and amino acids, essential for
energy and macromolecular synthesis in humans (Figure 1). The metabolic pathways could be
conveniently separated into three classes: anabolism - that synthesize simple molecules or
polymerize them into more complex macromolecules; catabolism - that degrades molecules to
generate/release energy; and the pathway that help to eliminate toxic waste produced by the
other two classes (DeBerardinis and Thompson, 2012).
Figure 1. An overview of Intermediary Metabolism A simplified view of the metabolic pathways, focusing on the major nutrients
(glucose, amino acids and fatty acids) to produce or store energy and to grow (DeBerardinis and Thompson, 2012).
Defining these pathways and understanding their physiological roles are among the most
successful searches in biological research. It was between the 1920s and 1960s, defined as
the “golden age of biochemistry”, that most of the metabolism network responsible for nutrient
utilization and energy production was defined in humans. These metabolic networks include
activities like glycolysis (Embden, Meyerhof and Parnas), respiration (Warburg), the
tricarboxylic acid (TCA) and urea cycles (Krebs), glycogen catabolism (Cori and Cori), oxidative
phosphorylation (OXPHOS) (Mitchell) and the importance of adenosine triphosphate (ATP) in
energy transfer reaction (Lipmann) (DeBerardinis and Thompson, 2012). At the end of this
period, it was possible to understand at the level of enzymatic control such complex matters as
the temporal organ-specific regulation of fuel preferences (Krebs, 1972).

4
Metabolic research has been driven by the realization that metabolic alterations accompany
common human diseases. The research on the genetic and molecular bases of human
diseases such as obesity, diabetes, neurodegeneration and cancer, triggered the attention in
order to understand the altered metabolism states in these diseases. Several studies have
come to reveal numerous regulatory mechanism that link cell signalling and the countless
metabolic pathways, or enable cells to sense fuel availability and transmit the information
through signalling networks (Bungard et al., 2010; Mathupala et al., 2006; Zaidi et al., 2012).
Extracellular ligands can promote growth in most mammalian cells. These growth factors
stimulate signal transduction pathways such as the phosphatidylinositol 3-kinase (PI3K)/Akt/
mammalian target of rapamycin (mTOR) pathway. The PI3K/Akt/mTOR stimulates both a rapid
increase in essential nutrient uptake and the proper allocation of the nutrients into anabolic and
catabolic pathways needed for macromolecules synthesis and energy production (Gibbons et
al., 2009). The balance between anabolism and catabolism is dynamically regulated by the
cellular energy status.
The PI3/Akt/mTOR pathway promotes anabolism and suppresses catabolism (Figure 2),
whereas the AMP-activated protein kinase (AMPK) does the reverse. This serine-threonine
kinase is a “fuel sensor” activated during compromised bioenergetic states such as hypoxia
and nutrient deprivation (Hardie, 2011). AMPK has also an important role in the regulation of
p53 dependent cell-cycle checkpoint activated by glucose deprivation in cultured cells, limiting
growth in energetically unfavourable states (Jones et al., 2005). AMPK also coordinates the
expression of stress response genes through chromatin binding and histone H2B
phosphorylation on serine 36, facilitating AMPKs effect on gene expression (Bungard et al.,
2010).
Metabolism also affects cell signalling by providing substrates for post-translational
modifications (PTMs) that can modulate protein localization, trafficking and enzyme activity
(Metallo and Heiden, 2010). ATP is the most obvious example, which provides the substrate
for phosphorylation. This PTM can signal states of nutrient abundance because, in order to
generate sufficient quantities of the required metabolite for protein modifications, requires
access to nutrients in excess of the levels needed to run basic bioenergetics programs. Glucose
and glutamine serve as the two primary carbon sources in proliferating cells, and uptake of
both nutrients is directed by growth factor signalling. These nutrients also collaborate in another
biochemical pathway to produce hexosamines, which modify nutrient transporters and growth
factor receptors enabling their expression on the cell membrane. Glucose metabolism through
5
the hexosamine biosynthetic pathway is required to sustain sufficient growth factor signalling
(Wellen et al., 2010).
1.2 Metabolic alterations in cancer
The metabolic proprieties of cancer cells are different from those of normal cells. Altered
metabolism is one of the hallmarks of cancer cells (Hanahan and Weinberg, 2011; Máximo et
al., 2009; Warburg, 1956). The chronic and often uncontrolled cell proliferation represents the
essence of cancer cells involving deregulated control of cell proliferation and changes in energy
metabolism in order to fuel cell growth and division. Under aerobic conditions, normal cells
process glucose, first to pyruvate via glycolysis in the cytosol and thereafter to carbon dioxide
(CO2) in the mitochondria; on the other hand, under anaerobic conditions, glycolysis is favoured
and relatively little pyruvate is dispatched to the oxygen-consuming mitochondria (Hanahan
and Weinberg, 2011).
Otto Warburg first observed an anomalous characteristic of cancer cell energy metabolism
(Warburg, 1956); even in the presence of oxygen, cancer cells can reprogram their glucose
metabolism and thus their energy production, by limiting their energy metabolism largely to
glycolysis, leading to a state that has been defined “aerobic glycolysis”. Also, Warburg
hypothesized that this altered metabolism arose from mitochondrial defects that inhibit their
ability to effectively oxidize glucose carbon to CO2. An extension of this hypothesis is that
dysfunctional mitochondria could cause cancer (Koppenol et al., 2011). Indeed, many of the
metabolism genes whose mutations can cause cancer are mitochondrial genes. Mutations in
succinate dehydrogenase (SDH), an oxidoreductase complex that functions in electron
transporter chain (ETC) and TCA cycle, were identified in dominantly inherited familial
paraganglioma (Baysal, 2008), but also commonly found in gastric stromal tumours and
childhood T-cell acute leukaemia (Baysal, 2007). Actually, loss-of function mutations in all the
four subunits of the SDH complex have been identified in cancer (Baysal, 2008; Burnichon et
al., 2010).
Mutations in the TCA cycle enzyme fumarate hydratase (FH), that catalyses the reaction from
fumarate to malate, have been identified in familial syndromes characterized by susceptibility
to renal cell cancer and leiomyomatosis (smooth muscle tumours of the uterus and skin)
(Tomlinson et al., 2002). Mutations in SDH and FH alter the complex II OXPHOS chain, which
generates reduced flavine adenine dinucleotide (FADH2). There is some evidence that these
mutations result in the inactivation of the prolpyl-hydroxylases (PHDs), leading to increases in

6
hypoxic induced factor-1 (HIF-1) and enhanced glycolysis. Based on these facts, both SDH
and FH have been regarded as tumour suppressors.
Other enzyme mutations may function as oncogenes, such as isocitrate dehydrogenase 1 and
2 (IDH1 and IDH2). These mutations have been identified in gliomas and acute myelogenous
leukaemia (AML) (Mardis et al., 2009; Parsons et al., 2008). These enzymes normally oxidize
isocitrate to α-ketoglutarate (α-KG), with NADP+ reduced to NADPH in the process. IDH1 and
IDH2 mutations result in a new ability of the enzyme to catalyse the NADH-dependent reduction
of α-KG to 2-hydroxyglutarate (2-HG), an oncometabolite that can be a correlative marker for
mutations occurring in isocitrate enzymes (Dang et al., 2010).
Over the last decade, evidence has accumulated that the oncogenes Myc, nuclear factor kB
(NF-kB), AKT, and the tyrosine kinase receptors (epidermal growth factor, EGF; insulin-like
growth factor 1, IGF-1; human epidermal growth factor receptor, Her-2 etc), which turn on Ras,
RAF-mitogen activated protein kinase (MAP- kinase), and the PI3K, mTOR and HIF pathways,
can stimulate the transcription of genes that encode proteins that mediate the glycolysis and
glutaminolysis pathways. High AKT and mTOR activities result in high HIF activity. The Myc
and HIF transcriptional factors increase the rate of some of the glucose transporters (GLUTs)
and hexokinase II, enhancing both glucose uptake and its retention in the cell (Christofk et al.,
2008; Levine and Puzio-Kuter, 2010). HIF increases the rate of transcription of several genes,
resulting in angiogenesis, cell migration, cell survival, and energy metabolism (Levine and
Puzio-Kuter, 2010).
Hypoxia stress is a common phenomenon in tumour tissues and the predominant regulatory
factor in the curse of hypoxia response is HIF. When cells have adequate access to oxygen,
HIF transcriptional activity is constrained through the constitutive degradation of HIFα by the
von Hipple-Lindau (VHL)-mediated ubiquitination pathway. For this reaction, the proline
residues of HIFα need to be hydroxylated before HIFα could be recognized by VHL. The
hydroxylation of HIFα is catalysed by PDHs, a family of α-KG-dependent enzymes (Chen and
Costa, 2009). HIF target genes, include genes encoding GLUTs and glycolysis enzymes such
as pyruvate dehydrogenase kinase (PDK), lactate dehydrogenase A (LDH-A) and Myc. The
loss of PTEN (phosphate and tensin homolog, a tumour suppressor gene) and concurrent
increase of AKT-1 and mTOR, lead to HIF activation and the Warburg effect.
The amplification of the oncogene Myc is universal in tumours arising from different tissues and
organs and promotes mitochondrial utilization of glutamine by enhancing the expression of
glutaminase (GLS) (Figure 2), which deaminates glutamine to glutamate (Dang, 1999;
DeBerardinis et al., 2007; Vousden and Ryan, 2009).

7
P53 is one of the most important tumour suppressor protein and plays significant roles in normal
cell functions. Either p53 mutations or depletion are associated with different types of cancer.
Loss of p53 function also leads to Warburg effect, due to the repression of GLUT1 and GLUT4
transcription (Dang, 1999; Vousden and Ryan, 2009).
The p53 protein induces the transcription of TP53-inducible regulator of glycolysis and
apoptosis (TIGAR) gene, which lowers the intracellular concentrations of fructose 2,6
bisphosphatase (FBP) and thus decreases glycolysis by diverting glucose to the pentose
phosphate pathway (PPP) (Figure 2) (Bensaad et al., 2006). The p53 protein enhance the
transcription of the gene for synthesis of cytochrome c oxidase 2 (SCO2) (Figure 2), which,
along with synthesis of cytochrome c oxidase 1 (SCO1), assembles into oxidative
phosphorylation complexes. Cells with mutant p53 have compromised oxidative
phosphorylation chain. P53 also promotes the synthesis of a number of proteins that reduce
the high reactive oxygen species (ROS) load in cells, and inhibits the activity of the PI3K/AKT
and mTOR pathways (Feng, 2010; Matoba et al., 2006).
Pyruvate kinase (PK) is a glycolic enzyme that converts phosphoenolpyruvate (PEP) to
pyruvate, with concomitant generation of ATP (Figure 2). There are four isoforms of PK, and
its distribution in tissues and organs in human have certain specificities. PK isoform 1 (PKM1)
is found in most adult tissues, the expression of PK isoform 2 (PKM2) is specifically related to
development, mainly detected in embryonic cells and rapid dividing cells. In transformed cells
PKM2 is de novo expressed and is thought to be associated with tumour growth. In recent
years, increasing number of evidence showed that PKM2 expression is tumorigenic (Christofk
et al., 2008). Nevertheless, this concept was challenged recently by a mass spectrometry
quantification of PKM1 and PKM2 isoforms in malignant and normal tissues. PKM2 was indeed
the prominent isoform in all cancer samples. However, it was also the predominant PK isoform
in matched control tissues, such as unaffected kidney, lung, liver and thyroid. Thus, an
exchange in PKM1 to PKM2 isoform expression during cancer formation may not be occurring
in all types of cancer (Bluemlein et al., 2011). The outcome of having predominant PKM2 in
cancer cells will directly restrain the production of pyruvate and lead to an increase of metabolic
intermediates produced in the stage of glycolysis.
The accumulation of the glycolytic products can be rescued for the biosynthesis of nucleotide,
cholesterol, fatty acids, and other components required for cell proliferation and division
through PPP and other synthetic pathway (Christofk et al., 2008).

8
Figure 2. Signalling networks and their regulation of metabolism in proliferating cells. The figure show aspects of
metabolism in proliferating cells including glycolysis; lactate production; TCA cycle; oxidative phosphorylation (OXPHOS); pentose
phosphate pathway (PPP); glutaminolysis; and the biosynthesis of nucleotides, lipids, and amino acids. PI3K/Akt signalling
downstream of the receptor tyrosine kinase (RTK) activation increases glucose uptake through the glucose transporter (GLUT1),
and increases flux through glycolysis. mTOR promotes protein synthesis and mitochondrial metabolism Glucose can be processed
through glycolysis for the production of ATP and pyruvate, pass through the PPP to generate ribose 5-phospate and NADPH, and
also enter the mitochondrial-localized TCA cycle. P53 induces TP53-inducible regulator of glycolysis and apoptosis protein
(TIGAR), and represses the glucose transporters GLUT1 and GLUT4. P53 enhaces the transcription of the gene for synthesis of
cytochrome C oxidase 2 (SCO2) enhances mitochondrial respiration. Myc increases glutamine uptake and the conversion of
glutamine into a mitochondrial carbon source by promoting the expression of the enzyme glutaminase (GLS); ACL indicates ATP
citrate lyase; IDH, isocitrate dehydrogenase; PKM, pyruvate kinase isoforms 1 and 2; PFK, 6-phosphofructo-1-kinase; FBP,
fructose 1,6bisphosphsate; α-KG, alpha ketoglutarate; NADPH, reduced nicotinamide adenine dinucleotide phosphate; PEP,
phosphoenolpyruvate (Adapted from Gerhäuser, 2012).
1.3 Mitochondrial genome and the role of mtDNA in the pathogenesis of mitochondrial
dysfunction in cancer
Mitochondria have a central role in energy uptake and energy production, and as consequence
plays a key role in a wide variety of both pathological conditions, such as cancer
neurodegenerative diseases, diabetes and aging and non-pathological (heat production, ROS
generation, apoptotic and cellular differentiation) conditions. Several studies have focused their

9
attention on the influence of variability of mitochondrial DNA (mtDNA) on the abovementioned
aspects (Wallace, 2010).
The mtDNA represents less than 1% of the total cellular DNA. However, its mitochondria gene
products are essential for normal cellular function. Mitochondrial DNA within a single cell
generally has identical sequences which are described as homoplastic. Heteroplasmy or
different mtDNA sequences within mitochondria of the same cell can occur in response to
somatic mutations. (Chatterjee et al., 2006; Minocherhomji et al., 2012).
The human mitochondrial genome is a 16.6kb circular DNA encoding for 13 proteins of the
OXPHOS and the displacement loop (D-Loop), as well as 22 tRNAs and 2 rRNAs necessary
for the translation of mitochondrial genes within mitochondrion. The D-Loop is a non-coding
region within mtDNA contains cis-acting regulatory elements that are required for replication
and transcription of mtDNA. All others mitochondrial proteins, including those involve in the
replication and transcription of mtDNA are nuclear-encoded. Nuclear encoded proteins are
imported by specialized complexes on the inner and outer mitochondrial membrane
(Minocherhomji et al., 2012; Wallace and Fan, 2010).
MtDNA variants define specific mtDNA haplotypes. Haplotypes with a common phylogenetic
origin are categorized into haplogroups which display a continent-specific distribution. The
mtDNA of the European population falls within nine different haplogroups (H, J, U, X, T, I, K, W
and V) as identified by (Torroni et al., 1996)
The mtDNA haplogroups were initially considered as being neutral and used only for phylogeny
analysis and population studies. However, several studies revealed the importance of mtDNA
variants in quality of aging and the susceptibility to late-onset pathologies, such as cancer,
diabetes, cardiovascular and neurodegenerative disease (Fang et al., 2010; Santoro et al.,
2006; Takasaki, 2009). It has been widely reported that mtDNA molecules belonging to different
haplogroups may differ in degree of OXPHOS activity, and in turn, results in different
percentages of oxygen consumption, ATP and mitochondrial ROS production or heat
generation (Marcuello et al., 2009; Pello et al., 2008). Nevertheless there is also evidence that
different mtDNA haplogroups may maintain similar efficiency in OXPHOS performance through
the fine-tuning of ROS production and mitochondrial biogenesis. It has also been proposed that
variants which alter OXPHOS coupling efficiency, thus less ATP and more heat production, are
more frequent in cold areas (Elson et al., 2007).
Depletion of mtDNA content as well as inherited mutations in mtDNA has been reported in a
variety of diseases including cancer. Somatic mutations in the D-Loop region have been
identified in several tumours. Since the D-Loop region contain regulatory elements involved in

10
mtDNA replication, it could affect the mtDNA copy number. Indeed tumour-specific changes in
the mtDNA copy number have been reported in human cancer (Kulawiec et al., 2009; Tseng
et al., 2006). Additionally, mtDNA dimers and mtDNA mutations have been found in patients
with leukaemia, hepatocellular carcinoma, renal cell carcinoma, lung cancer, breast cancer,
thyroid cancer, ovarian cancer, among others (Chandra and Singh, 2011; Máximo et al., 2002;
Modica-Napolitano and Singh, 2004). Most pathogenic mtDNA mutations induces defects in
OXPHOS.
More recently, cells devoid of functional mitochondrial (Rho0 cells) are been used in studies
aiming to gain insight into the possible role of mitochondria in regulating or being associated
with epigenetic alterations of the nuclear genome, either gene specific or genome wide
(Minocherhomji et al., 2012). Additionally, several studies have been reporting that
mitochondrial dysfunction induces changes in the expression of nuclear genes involved in
metabolism, cell signalling, growth, differentiation and apoptosis (Delsite et al., 2002).
1.4 Metabolism and epigenetics
A regulated cross-talk between metabolic pathways in the mitochondria and the epigenetic
mechanism in the nucleus allows cellular adaptations to new environmental conditions. The
term "epigenetics" originally defined by Waddington as "the causal interactions between genes
and their products, which bring the phenotype into being" involves the understanding of
chromatin structure and its impact on gene function (Waddington, 1942). Currently, epigenetic
might be defined as modifications of the DNA or associated proteins, other than DNA sequence
variation itself, that carry information content during cell division (Sharma et al., 2010). In
addition to primary DNA sequence information, much of the information, regarding when and
where to initiate transcription, is stored in covalent modifications of DNA and its associated
proteins. The pattern of various modifications along the chromatin, such as DNA cytosine
methylation and hydroxymethylation, acetylation, methylation, phosphorylation, ubiquitination,
and SUMOylation of the lysine (K) and/or arginine (R) resides of histones are thought to
determinate the genome accessibility to transcriptional machinery. An emerged concept is that
information about a cell’s metabolic state is also integrated into the regulation of epigenetics
and transcription (Figure 3) (Ward and Thompson, 2012).

11
Figure 3. Signalling and metabolic inputs into epigenetics Growth factors, hormones and cytokines activate the classic
signalling pathways and downstream transcriptional factors which recruit chromatin-modifying enzymes to local chromatin. The
nutrient levels and cell metabolism will affect levels of the metabolites which are required substrates of chromatin-modifying
enzymes that use these metabolites to post-translationally modify both histones and DNA (Lu and Thompson, 2012).
It is now appreciated that cells constantly adjust their metabolic state in response to
extracellular signalling and/or nutrient availability (Vander Heiden et al., 2009). Most of the
cellular signalling events are dictated by growth factors, cytokines or hormones, but metabolism
still plays a significant role in transcription. This also has a potentially fusing logic, as most
chromatin-modifying enzymes requires substrates or co-factors that are derived from various
metabolic pathways, including glycolysis, fatty acid oxidation TCA cycle and OXPHOS
(Teperino et al., 2010). The fluctuation of metabolite levels can modulate the activities of
chromatin dynamics (Figure 4). As many complex diseases such as cancer and type II diabetes
display abnormalities of cellular metabolism and epigenome, understanding the molecular
connections between these processes may have therapeutic implications.

12
Figure 4. Crosstalk between metabolism and epigenetics. As glucose enters the glycolytic pathway, minor portion is branched
to hexosamine biosynthetic pathway to produce GlcNAc which can be used as substrate for histone GlcNAcylation by GlcNAc
transferases (OGT), oxidative phosphorylation (OXPHOS) determines the NAD+/NADH ratio which is important for the activities of
Sirtuins. Several TCA cycle intermediates can be exported out of the mitochondria including citrate and alpha-ketoglutarate (α-
KG). Cytosolic citrate is converted to acetyl-CoA which is used as a donor for histoneacetyltransferases (HAT) – mediated histone
acetylation. α-KG is used as co-factor for histone and DNA demethylation reactions by Jumonji-C domain containing histone
demethylases (JHDM) and ten-eleven translocation protein (TET), respectively. The substrate for histone methyltransferases and
DNA methyltransferases (DNMT) is S-adenosylmethionine (SAM), which is synthesized from essential amino acid methionine. The
lower ATP/AMP ratio can activate AMP-activated protein kinase (AMPK), a kinase that phosphorylates histones (Adapted from Lu
and Thompson, 2012).
1.5 Protein post-translational modifications and cell signal transduction
Post-translational modification of proteins is a more efficient way to regulate cellular functions
than gene transcription for animals and humans to adapt to different physiological and
environmental conditions (Wang et al., 2013). In spite of the regulatory power garnered by
protein kinase, other reversible protein PTMs are increasingly becoming appreciated as having
important roles in cell signal transduction (Deribe et al., 2010). These modifications include
protein acetylation, methylation, O-linked glcNAcylation, ADPribosylation, and many others;
many of these modifications are conserved down to the level of prokaryotes (Figure 4)
(Locasale and Cantley, 2011; Walsh et al., 2005)
Current estimates from advances in mass spectrometry-based proteomics suggest that many
of these modifications may be as prevalent in mammalian systems as the more studied
phosphorylation. In contrast to reversible protein phosphorylation, each of these modifications

13
is carried out by a relatively small number of enzymes. The number of distinct
acetyltransferases, methytransferases, GlcNAc transferases, ADP-ribosyltransferases, etc., is
much smaller than the total number of unique protein kinases (Locasale and Cantley, 2011).
Also, in contrast to the case of protein kinases, where physiological concentrations of the
substrate ATP far exceed the Michaelis constant, the enzymes that carry out these
modifications typically have Michaelis constants for their metabolic substrates that are close to
the physiological concentrations. These substrates include acetyl-Coenzyme A (Acetyl-CoA),
S-adenosylmethionine (SAM), N-acetylglucosamine, and adenosine diphosphate -ribose
(ADP-ribose), and their levels are dynamically regulated by alterations in cellular metabolism.
Changes in these concentrations can result from variations in metabolic flux occurring from
countless mechanisms such as changes in nutrient uptake and/or mutations in metabolic
enzymes. These changes can affect their concentrations by several orders of magnitude and
in turn affect activity of their corresponding enzymes by shifting the substrate concentration to
levels well above or below the Michaelis constant of the enzymes. Therefore, the diversity of
signalling responses regulated through these modifications may have evolved from the ability
of metabolic networks to adapt metabolism to achieve differing levels of substrate availability.
These forms of signal transduction are more ancient than protein kinases and have evolved
from more primitive versions of signal transduction observed in lower organisms (Locasale and
Cantley, 2011).
1.6 DNA methylation - 5-methylcytosines (5-mC) and 5-hydroxymethylcytosine (5-hmC)
Methylation of DNA at the carbon 5 of cytosine residues that precede guanines (referred to as
CpG dinucleotides) is the most studied and best-known epigenetic modification. Alterations in
the pattern of nuclear DNA methylation, such as hypomethylation of the repetitive elements
associated with increased genomic instability, are frequently seen. The hypermethylation of
specific GpG island in the promoter regions of several tumour-suppressor genes is commonly
observed to be associated with transcriptional silencing of the gene (Sharma et al., 2010). DNA
methylation is established by a family of proteins called DNA methyltransferases (DNMTs).
Three active DNMTs have been described in mammals: DNMT1, DNMT3A and DNMT3B.
DNMT1 exhibit great preference for hemimethylated DNA and, therefore, is responsible for
maintaining methylation pattern after DNA replication. DNMT3A and DNMT3B are the de novo
methyltransferases, because they can establish the DNA methylation pattern, although they
show equal preference for unmethylated or hemimethylated DNA (Robertson, 2001). A third

14
homologue of this family, DNMT3L, lack the methyltransferase capacity but is known to assist
the other members of the family in methylation reactions by interacting with their catalytic
domains (Gowher et al., 2005). DNMTs transfer a methyl group from SAM to the substrate with
the formation of the by-product S-adenosylhomocysteine (SAH). The altered redox state of
cancer cells influence SAM levels through aberrant regulation of the methionine cycle. SAM is
derived from the essential amino acid methionine through methionine adenosyltransferase
(MAT) by combining methionine with ATP (Cai et al., 1996). SAM reactions included in one-
carbon metabolism are coupled to polyamine synthesis and to the folate cycle. SAM is also a
precursor of important metabolites like glutathione, through transsulfuration reactions
(Huidobro et al., 2013). The nomenclature used to describe MAT enzymes can be confusing.
There are three major multimeric MAT enzymes: MATI, MATII, and MATIII (Mato et al., 2002).
MATI is a tetramer and MATIII is a dimer of the protein encoded by methionine
adenosyltransferase I alpha (MAT1A), the “hepatic form” of the enzyme (Lu and Mato, 2005).
In contrast, MATII is a dimer of the protein encoded by methionine adenosyltransferase II alpha
(MAT2A) and is expressed in most extra hepatic tissues. A third gene, methionine
adenosyltransferase II beta (MAT2B), unrelated in amino acid sequence to MAT1A or MAT2A,
encodes a regulatory subunit that physically associates with the MAT2A dimer, forming a
heterotetramer (Martínez-Chantar et al., 2003).
The enzyme glycine N-methyltransferase (GNMT) catalyses the SAM-dependent methylation
of glycine to form sarcosine. Kerr suggested a role for GNMT in regulating the relative levels of
SAM and SAH (Kerr, 1972). It is important to realize that SAM is the methyl donor for almost
all cellular methylation reactions and therefore GNMT is likely to regulate cellular methylation
capacity. In addition, GNMT has been proposed to link the de novo synthesis of methyl groups
to the ratio of SAM to SAH, which in turn serves as a bridge between methionine and one-
carbon metabolism (Figure 5) (Luka et al., 2009).

15
Figure 5. Schematic illustration of one-carbon metabolism. MAT indicates methionine adenosyltransferase; SAM, S-adenosyl-
methionine; SAH S-adenosyl-homocysteine; DNMT, DNA methyltransferases; R methyl group acceptors; MS methionine
synthase; GNMT glycine N-methyltransferase (Adapted from Huidobro et al., 2013).
A covalent methyl group is chemically stable. Therefore DNA methylation was considered as a
relative static epigenetic mark. However during embryonic development there is extensive
remodelling of the cellular methylome, suggesting the existence of enzymes that actively
remove methylation marks. The ten-eleven translocation protein (TET) family members- TET1,
TET2 and TET3 – are an α-KG and Fe (II)-dependent dioxygenase that hydroxylate the 5-mC
of DNA to 5-hmC, utilizes α-KG, oxygen and Fe (II) as co-factors and releases succinate as
by-product. Succinate and fumarate are inhibitors of TET enzymes. The function of 5-hmC is
the topic of intense investigation and thought to serve as an intermediate for subsequent active
(TET-dependent) or passive (replication-dependent) demethylation. From the metabolic
perspective the demethylation mechanism by TET is interesting as it involves α-KG and
succinate, key metabolites of the TCA cycle. Because of the dependency in key metabolites
the rate of demethylation could be regulated at both levels of co-factor availability and feedback
inhibition.
1.7 Acetyl-CoA and metabolism
The ancient energy precursor of metazoan metabolism is acetate. The main sources of cellular
acetate are the mitochondrial processes of glucose-derived pyruvate oxidation, the oxidation
of fatty acids and the amino acid catabolism (Wagner and Payne, 2011). These distinct
metabolic pathways are all capable of yielding the activated form of cellular acetate, or acetyl-

16
CoA. How mitochondrial acetyl-CoA is used throughout the cell is heavily dependent on the cell
type and the metabolic state of the organism. However, the primary function of acetyl-CoA
throughout all cell types is to serve as a carbon donor in the TCA cycle. In general, during a
state of nutrient excess, a proportion of the excess acetyl-CoA generated within the
mitochondria is exported to the cytosol in the form of citrate, where it is reconverted into acetyl-
CoA by ATP-citrate lyase (ACL) (Figure 6).
In normal cells, it is possible that ACL becomes phosphorylated in response to growth factor
dependent AKT activation, transiently stimulating acetyl-CoA production. However, in cancer
cells, in which the PI3K/AKT pathway is constitutively active, ACL might become continuously
active, allowing high levels of acetyl-CoA production even if the nutrient availability becomes
limited (Biology and Mazurek, 2011). This would provide continuous acetyl-CoA and modulates
metabolism in a growth promoting manner (for example by stimulating PKM2 degradation,
which increases the availability of glycolytic intermediates for use in biosynthetic pathways)
(Wellen and Thompson, 2012). Free cytoplasmic and mitochondrial acetate can also be
converted into acetyl-CoA via an ATP-dependent mechanism by acetyl-CoA synthetase 1
(AceCS1) and 2 (AceCS2), respectively. The cytosolic acetyl-CoA is essential for the
production of fatty acids and sterol, which are vitally important for the formation and
maintenance of lipid membrane and protein acetylation, including histone acetylation in the
nucleus (Wagner and Payne, 2011; Wallace and Fan, 2010; Wellen et al., 2009). The acetyl-
CoA groups used to modify histones are predominantly produced by ACL (Figure 6). Loss of
function of this enzyme reduces histone acetylation, with global consequences on gene
expression (Wellen et al., 2009).
In cancer cells aerobic glycolysis is elevated and this improved glucose catabolism results in
an excess of the glycolytic end product-pyruvate, and although most of the pyruvate is
converted into lactate and secreted out of the cells, part of the pyruvate enters in the
mitochondria, where it is decarboxylated into acetyl-CoA by pyruvate dehydrogenase (PDH)
(Zaidi et al., 2012). The mitochondrial acetyl-CoA combines with oxaloacetate (OAA) by the
citrate synthase 2 generating citrate that enters the TCA cycle (Macdonald et al., 2011). In this
step mitochondrial citrate can also be exported to the cytosol to be used as biosynthetic
precursor for lipogenic pathways to support the highly demanding proliferating cells. The
withdrawal of citrate exported to the cytoplasm may stop the TCA cycle unless additional
pathways are engaged to supply OAA to keep the cycle going. Henceforth, a constant supply
of OAA is crucial for cancer cells. Although many cancer cells use glutamine metabolism for
anaplerotic supply of OAA, some cancer cells use a compensatory anaplerotic mechanism in

17
which pyruvate is carboxylated to form OAA in a reaction catalysed by pyruvate carboxylase
(Cheng et al., 2011).
Figure 6. Role of acetyl-CoA in protein modification and growth. Acetylation serve as indicator of nutrient sufficiency to the
cell to signal that conditions are optimal for growth. Nutrient-sensitive acetylation of histones (and other transcriptional regulators)
can regulate the expression of genes involved in cell growth. ACL indicates ATP citrate lyase; GF growth factor; GFR growth factor
receptor; PEP phosphoenolpyruvate; F6P fructose 6 phosphate (Adapted from Wellen and Thompson, 2012).
For a long time it was thought that glucose metabolism was the main source of citrate for the
downstream pathways. However recent studies report that, in tumour cells with mitochondrial
dysfunction or in proliferating cells under hypoxic conditions, reductive carboxylation of
glutamine-derived α-KG is responsible for supplying citrate for de novo lipogenesis (Cheng et
al., 2011). This pathway uses IDH1 and IDH2, cytosolic and mitochondria IDH isoforms,
respectively (Zaidi et al., 2012).
The acetylation process is regulated in a complex manner through several mechanisms partly
including metabolism. The acetyl-CoA production itself probably represents an integration of
nutrient and signalling cues. As mentioned above, citrate availability regulates the production
acetyl-CoA by ACL, but ACL activity itself can be regulated by phosphorylation of ACL at
Ser454, a target of both AKT and cAMP-dependent protein kinase (PKA), that increases its
activity even at lower levels of citrate (Berwick et al., 2002; Sale et al., 2006; Wellen et al.,
2009).

18
1.8 Lysine acetylation and mitochondria
All over the time, the eukaryotic organism developed fine adapted metabolic mechanism for
coordinating the conversion of diverse carbon substrate into cellular energy. These
mechanisms include changes in gene transcription, allosteric regulation of metabolic enzymes
by the flux of intermediary metabolites and direct regulation by PTMs.
Protein lysine acetylation was first discovered almost 50 years ago on nuclear histones, but the
broad involvement of this reversible covalent modification in cell regulation has only been
appreciated during the last decade. Diverse proteins functions are generated by means of their
PTMs. These PTMs are used to generate and transmit chemical signals across diverse cellular
pathways. As well as protein phosphorylation, acetylation of specific lysine residues can have
numerous functional consequences including enzyme activation/inactivation, changes in
protein–DNA interaction, protein stability, subcellular localization and specific functional
complex formation (e.g. protein–protein interaction). Several studies have shown that the
dynamic acetylation at the epsilon-amino group (ε-amino group) of a lysine residue can target
key enzymes, modulate the activity of mitochondria-localized fatty acid β-oxidation, the TCA
cycle, urea cycle, and OXPHOS in a nutrient responsive manner. The enzymes that catalyse
the reversible acetylation of proteins are the protein lysine acetyltransferases (KATs, formerly
termed histone acetyltransferases, HATs) and deacetylases (KDAC) (commonly known as
histone deacetylases, or HDACs). There are three major families of HATs: general control non-
derepressible 5 (Gcn5)-related N-acetyltransferases (GNATs), p300/CBP and MYST proteins
(Sterner and Berger, 2000; Yang and Seto, 2007). p300 (adenoviral E1A-associated protein of
300 kDa) and CBP (CREB-binding protein) form a pair of paralogous transcriptional co-
activators (Goodman and Smolik, 2000). The KDACs are divided into classes I,II and IV and
the Sirtuin family (also known as class III KDACs) (Patel et al., 2011).
The reversible and nutrient-sensitive manner of many of these acetyl modifications has strongly
implicated the mitochondrial-localized members of the NAD+-dependent deacetylases
(Sirtuins) as regulatory mediators of these fundamental metabolic processes. Alterations in
Sirtuins activity are also associated with the development of age-related conditions such as
neurodegenerative disease, heart disease, and cancer.

19
1.9 Protein acetylation and Sirtuins
Conserved from bacteria to mammals, the Sirtuins are a protein family involved in the
regulating of many biological processes, including metabolism of fat and glucose related to
physiological changes in the energy or ROS levels, development and longevity (Haigis and
Sinclair, 2010; Houtkooper et al., 2012). Sirtuins modify proteins through lysine deacetylation
and ADP-ribosyltransferase activity, both requiring NAD+ as an obligate co-factor. Since the
NAD+ levels ride in response to reduced energy status and/or altered redox, Sirtuins provide a
mean by sense and response to the environment (Guan and Xiong, 2011). Sirtuins activity can
be repressed by NADH and by the product of the Sirtuin deacetylase reaction, nicotinamide
(NAM) (Bitterman et al., 2002; Lin et al., 2004).
There are seven Sirtuins (Sirt1-Sirt7) in mammals that are different in their tissue specificity,
sub-cellular localization, enzymatic activity and targets. Sirt1 has been related to contribute to
the anti-aging effect of caloric restriction (CR) through the modulation of mitochondrial function.
Several targets have been described for Sirt1 in the regulation of mitochondria function, Sirt1
can promote the biogenesis of mitochondria by activation of peroxisome proliferator-activated
receptor gamma co-activator 1-alpha (PGC-1α), increase the oxidative metabolism via
repression of HIF-1α-dependent transcription of several genes, and decrease of ROS
production through Foxo-dependent increase of the expression of antioxidant enzymes. A
decrease in mitochondria-elicited ROS production and increase in the efficiency of
mitochondrial OXPHOS contribute to the extension of lifespan in laboratory animals (Salminen
et al., 2013).
As mentioned above a large proportion of mitochondrial proteins are reversible regulated by
acetylation and deacetylation, and the acetylation levels are sensitive to metabolic states and
dietary conditions. There are three Sirtuins (Sirt3, Sirt4 and Sirt5) located in the mitochondria.
Sirt3 is the major one that regulates the global acetylation of proteins in mitochondria. Sirt3-
dependent deacetylation regulates the activity of AceCS2 which catalyzes the conversion of
acetate to acetyl-CoA. Sirt3 play an essential role in regulation of enzymes that are involved
in antioxidant defence such as IDH2, an enzyme of TCA cycle, responsible for the replenish
NADPH pool in mitochondria (Someya et al., 2010), and regulates the deacetylation and
activation of manganese superoxide dismutase (MnSOD) (MnSOD can be acetylated at least
in four lysine’s residues k53, k68, k89, k122). The MnSOD is one of the primary mitochondrial
antioxidant in a network of detoxification enzymes that neutralizes the highly reactive
superoxide ions (O2•¯ ) to less reactive hydrogen peroxide (H2O2) followed by its immediate
conversion to H2O by catalase and other peroxidases in the mitochondrial matrix (Oberley and

20
Oberley, 1988). Some authors have been shown lysines 53, 68, 89 and 122 as acetylation
targets that are directly related with enzymatic function (Chen et al., 2011; Qiu et al., 2010; Tao
et al., 2012). MnSOD and IDH2 represent Sirt3 targets that directly regulate mitochondrial ROS.
Moreover, Sirt3 has been shown to regulate mitochondrial OXPHOS by activation of Complex
I (Ahn et al., 2008), II (Wallace et al., 2011) and V (Wu et al., 2013) in response to greater
energy demand and prevent the opening of mitochondrial permeability transition pore (mPTP)
by deacetylation of Cyclophilin D (Cyp D) on Lys166. Glutamate dehydrogenase (GDH) which
can regulate glutamate oxidative stress and NADPH is also deacetylated by Sirt3. Several
studies have emphasized a pivotal role for Sirt3 in cancer, even going far as referring to it as a
tumour suppressor. However, the ability of Sirt3 to act as a tumour suppressor is directly related
to its role in regulating ROS levels (Webster et al., 2012).
Sirt3 appears to play a role in preventing the switch to the metabolic profile characteristic of
cancer cells. The sirtuin-3-dependent deacetylation of Cyp D causes a detachment of
hexokinase II from the mitochondria that is necessary for stimulation of OXPHOS, and also
prevents hexokinase II from binding to voltage-dependent anion channel protein (VDA) and the
mPTP, limiting its ability to use ATP and augment glycolysis (Mathupala et al., 2006; Shulga et
al., 2010).
1.10 Role of lysine acetylation in chromatin remodelling
A simple model for the function of histone acetylation suggests that acetylation neutralizes the
positive charge on lysine side chains and thereby reduces interaction with the negatively
charged DNA backbone, allowing transcription factors to better access to the DNA (Dion et al.,
2005). The histone acetylation and its role in the regulation of transcription has long been a
topic of research in cell and molecular biology. However several studies have revealed the role
of histone acetylation in other important processes regulating the structure and function of
chromatin, and hence, the eukaryotic genome (Dang et al., 2009; Donohoe et al., 2012;
Rodríguez-Paredes and Esteller, 2011).
The process of organizing the base pairs of genetic material in the eukaryotic nucleus has
profound effects on DNA-dependent events, such as transcription, recombination, replication
and repair. DNA is organized by its incorporation into chromatin, the basic subunit of chromatin
being the nucleosome. The nucleosome is composed of 147 base pairs of DNA wound around
an octamer containing two copies of each histones H2A, H2B, H3, and H4. Histone proteins

21
have N-terminal tails that can be modified in various ways, histones H3 and H4 being the best
characterized (Böhm et al., 2011).
The most widely studied histone modification is acetylation. Histones are covalently modified
at the ε-amino group of conserved lysines by the HATs. The nuclear HATs acetylate histones
in a manner associated with transcription and other DNA-dependent processes. Allfrey et al.,
(Allfrey et al., 1964) made the earliest observations linking histone acetylation to transcription.
It is well recognized that there is a positive correlation between the degree of histone acetylation
and transcriptional activity throughout the genome. On the other hand, the chromatin on
transcriptionally inactive genes is mostly hypoacetylated (Offermann et al., 2008). The N-
terminal tail of histone H3 is primarily acetylated at lysines 9 (H3K9), 14 (H3K14), and 18
(H3K18), while that of H4 is acetylated at lysines 5 (H4K5), 8 (H4K8), 12 (H4K12), and 16
(H4K16). There are additional acetylation sites on both histones, but their significance and
function are mostly unknown (Kurdistani et al., 2004; Zhang et al., 2007). Additionally, specific
triggers might store information on genes in the form of histone modification patterns that are
read out by transcription factors and/or the transcription machinery. Dependent on the crosstalk
between individual modifications and the complexity of modification patterns, this signature is
often referred to as a “histone code”(Jenuwein and Allis, 2001) or a “histone language” (Berger,
2007).
Considering the number of potential acetylation sites in each histone, the acetyl-CoA levels
could be limiting, suggesting that changes in histone acetylation may influence acetyl-CoA
metabolism. In this context, histone acetylation is a highly dynamic process, maintained by the
alternate action of histone acetyltransferases and deacetylases, which activities are
coordinated in a highly regulated fashion. Some studies report that alteration in the expression
of HDACs, namely Sirt6, in cells, result in a high glycolysis rate and low TCA cycle activity.
Part of the mechanism is clearly transcription-dependent: Sirt6 deacetylation of H3K9 at the
promoters of glycolytic genes is required to slow down the expression of these genes. However,
it is emblematic how the absence of an HDAC has such a profound impact on the TCA cycle,
a pathway that relies directly on acetyl-CoA availability (Cantó et al., 2013; Martinez-Pastor et
al., 2013).
Under conditions of nutrient limitations, in which cells are forced to recycle citrate to replenish
the acetyl-CoA pool, a decrease in citrate metabolism might result in reduced acetate/acetyl-
CoA availability. In this context, the changes in glycolytic gene transcription programs observed
in Sirt6 deficient cells may not only be a response to nutrient stress but may also represent an
important adaptive mechanism against a limiting acetyl-CoA pool. Mitochondrial dysfunction,

22
by itself, might alter the acetyl-CoA levels, and the NAD+/NADH ratio through alterations in TCA
cycle and OXPHOS have impact in the normal function of HAT and Sirtuins (Martinez-Pastor
et al., 2013).
1.11 Cybrids
In 1989 for the first time, King and Attardi showed that Rho0 (mtDNA devoid) human cells can
be repopulated with exogenous human mitochondria (King and Attardi, 1989). Cybrids are
cytoplasmatic trans-mitochondrial hybrids that can be used to study the influence of mtDNA
variations in nuclear epigenetics. The means to assess the phenotypic effects of mtDNA
mutations are not the standard cloning/transfection methods used to study nuclear DNA genes,
because the mitochondrial genome has its own genetic code and because it is not possible to
make stable transfections directed to mtDNA. One way to circumscribe this problem is by using
cybrids. These cybrid cell lines are obtained from the fusion of a recipient Rho0 cell line that is
devoid of mitochondrial DNA and a donor cell line (that has to be removed of the nucleus but
maintains mitochondria and mtDNA) that contains the mtDNA of interest (Figure 7).
These technology allows the differentiation of the effects caused by mtDNA mutations from
those caused by nDNA, since the cybrids cell lines have the same nuclear background
(Swerdlow, 2007).
Figure 7. Schematic representation of the cybrid production method. Starting from a cell line without mtDNA (but with
mitochondria) and enucleated cell that contain the mtDNA of interest, it is possible to perform cell fusion resulting in cybrid line that
harbours the mtDNA mutation in a varying degree of heteroplasmy. After culturing the cybrid cell line it is possible to obtain a
homoplasmic wt or homoplasmic mutant mtDNA cell line and heteroplasmic cell line ( Adapted from Máximo et al., 2009).

23
Chapter 2 Hypothesis and Aims

24

25
2.1 Hypothesis
"Mitochondrial dysfunction" due to mutations in mtDNA genes and mitochondrial variants,
mediate epigenetic cellular changes and may play key roles in phenotypic variation related to
mitochondrial diseases and cancer.
2.2 Aim
Having in mind the aforementioned observation and our hypothesis, we have developed a
project with the following aim:
To unveil how pathogenic mutations in mtDNA and/or mitochondrial variants may lead to
epigenetic changes, namely alterations in the pattern of nuclear DNA methylation and/or
acetylation of histones and other proteins.

26

27
Chapter 3 Materials and Methods

28

29
3.1 Cell lines and cell culture conditions
The 143B and 143B Rho0 are osteosarcoma-derived cell lines and were a kind gift from Dr.
Keshav Singh (Roswell Park Cancer Institute, Buffalo USA). The 143B Rho0 is derived from
the 143B cell line, after depletion of mtDNA, hence they share the same nuclear background.
The 143B Rho0 cells were generated using herpes simplex virus (HSV), atransient expression
of UL12.5, a protein encoded by the HSV UL12 gene with mitochondrial localization, leads to
the degradation of mtDNA, through nuclease activity, leaving nuclear DNA intact. Mitochondrial
mRNAs are also depleted as rapidly as the mtDNA, after HSV infection (Saffran et al., 2007).
The cybrid cell lines, 3571Cy 1, 3571Cy 22, Cy 24, 3243Cy 9.7 and the CMPBR3 were
previously established in our laboratory. Cybrid clones were constructed using three types of
mitochondria donors: the cell line XTC.UC1, which harbours a mtDNA ND1 gene mutation (C
insertion at 3571 position) and a mutation in the cytochrome b gene (missense substitution,
E271K, 15557 G>A), resulting in three clones, two of them with a mtDNA ND1 gene mutation
(3571Cy1 and 3571Cy 22) and a third clone with wild type mtDNA (Cy 24) (Bonora et al., 2006);
platelets of a patient with the A3243T mutation in the mtDNA tRNALeu (UUR) gene (3243Cy 9.7);
and platelets from a healthy individual (wild type mtDNA) (CMPBR3). The 143B Rho0 cell line
was used, as mitochondria acceptor. All the cell lines were cultured in Dulbecco’s modified
Eagle’s medium (DMEM) high-glucose supplemented with 10% (v/v) inactivated and filtered
fetal bovine serum (FBS), 1% (v/v) penicillin/streptomycin (PenStrep), 0.5% fungizone and
50µg/ml uridine. The cells were maintained at 37ºC, 5% CO2 in a humidified incubator and
cultured as a monolayer.
The media and FBS, used in the experiments, were purchased from PAA as part GE Healthcare
(UK); Trypsin-EDTA, PenStrep and fungizone were purchased from GIBCO, as part of
Invitrogen Life Technologies (Carlsbad, California).
3.2 Nucleic acids extraction from cell lines
3.2.1 DNA extraction
Plated cells (70-80% confluence), were washed in PBS 1X (phosphate buffered saline),
trypsinized (0.05% trypsin-EDTA), and pelleted (1200rpm, 5minutes). This procedure was
performed using Invisorb Spin Tissue Mini Kit. The process was done according to the
manufacturer’s instructions (Invisorb Spin Tissue Mini Kit, Invitek, Berlin, Germany) for DNA
isolation from 10-106 eukaryotic cells/cell pellets.

30
DNA was quantified using NanoDrop ND-1000 Spectrophometer (Nanodrop Technologies,
Inc., Delaware, USA) and DNase/RNase (GIBCO, Invitrogen, Carlsbad, CA, USA) free distilled
water as blank.
3.2.2 RNA extraction
For RNA extraction, 1ml of TRIZOL reagent (Life Technologies TM, California, USA), was added
directly to the cell pellets previously washed twice in PBS 1X buffer. The remaining protocol
was performed according to manufacturer’s instructions (TRIZOL Reagent, Life
TechnologiesTM ,California, USA). RNA concentrations were determined using the NanoDrop
ND-1000 Spectrophometer (Nanodrop Technologies, Inc., Delaware, USA) and DNase/RNase
(GIBCO, Invitrogen, Carlsbad, CA, USA) free distilled water as blank.
3.3 Polymerase Chain Reaction (PCR)
Since the primers available for ND1 gene amplification, include the region where the mutation
A3243T of the mtDNA tRNA Leu (UUR) gene is located, they were used to monitor both mutations.
Additionally in order to confirm the sequences of the cell lines, PCR and DNA sequence were
performed to confirm the absence of mutations in the 143B, CMPBR3, Cy 24 and 143B Rho0
cell lines using the following conditions:
PCR reactions were performed using ~100ng of genomic DNA extracted from cell lines, 0.1µM
of each forward and reverse primers (Invitrogen, UK), 1x PCR Buffer (5x GoTaq Flexi Buffer,
Promega, WI, USA), 1.5mM of Magnesium Chloride solution (Promega WI, USA) 40mM
deoxyribonucleotide triphosphate (dNTPs) mix (Bioron GmbH, Germany) and 0.5 U of GoTAq
DNA polymerase (Promega, WI, USA) and DNase/RNase distilled water (GIBCO, Invitrogen,
Carlsbad, CA, USA) to fulfil the total reaction volume of 25µl. The sequences of the primer pair
for ND1 and tRNA Leu (UUR) amplification, designed according to the Cambridge Reference
Sequence, were: forward (5’-ACACCCACCCAAGAACAGGGTTT-3’) and reverse (5’-
GTAGAATGATGGCTAGGGTACT-3’). PCR reactions were performed in BIO RAD MyCycelTM
termal cycle (BIO RAD, CA, USA). PCR conditions were: 1 cycle of 5 minutes at 94ºC for initial
denaturation, followed by 35 cycles of 30 seconds at 94ºC for denaturation, 30 seconds at 58
ºC for the appropriated annealing and extension of 30 seconds at 72ºC; the final extension
was performed in 1 cycle of 5 minutes at 72ºC.
All primer pairs used for Real-Time PCR with the exception of GNMT which was purchased to
SABiosciences (Catalog Number PPH12533A) were design based in MAT1A; MAT2A; MAT2B;
DNMT1 and DNMT3B sequence available on ENSEMBL human database. To rich the optimal

31
conditions, all primer pairs, were tested using a titration of template and primer, and a “Touch-
down PCR” were performed (1 cycle of 10 minutes at 95ºC for initial denaturation, followed by
40 cycles of 1 minute at 58ºC - 62ºC for the annealing/extension). In Table 1, the primer
sequences and the optimal annealing temperatures selected, after PCR optimization are
describe.
Table 1. Primers sequences, amplicon sizes and optimal annealing temperature used for real-time PCR
R-Reverse; F- Forward
3.4 Agarose gel Electrophoresis
In order to confirm de right amplification, after de PCR reaction, all products including a
negative control to check for possible contaminations were separated by electrophoresis on a
2% w/v agarose (Lonza) gel in 1X SGTB (prepared from stock solution 20x) (Grisp, Porto,
Portugal). Once polymerized, the gel was place on an electrophoresis apparatus, previously
filled with running buffer – 1X SGTB. The samples were mixed with Gel Red (Biotium Inc,) plus
loading buffer. One kb Plus DNA Ladder (Invitrogen, UK), was used as control for the fragment
length that is being analysed.
The fluorescent of the separated PCR products was visualized and photographed in the
Quantity One – version 4.6.9 in the ChemiDocTM XRS Imaging system (BIO RAD, CA, USA).
Gene Primer sequence Amplicon size (bp) Annealing
Temperature (ºC)
MAT1A
F: 5’-CAGCAATCCCCAGATATTGCCC-3’ 108 60
R: 5’-CTCTGTCTCGTCGGTAGCATAG-3’
MAT2A
F: 5’-TGGCAGAACTACGCCGTAATGG-3’ 103 60
R:5’-ATGGGAAGCACAGCACCTCGAT-3’
MAT2B F: 5’-GGCTGTCCTGGAGAACAATCTAG-3’
93 60 R:5’-ACAGTCACAGCACTTTCTTCGAGC-3’
DNMT1 F: 5’-CCAGGCAAACCACCATCACATCT-3’
77 60 R: 5’-GGCTCTTTCAGACTCTTCCTGAG-3’
DNMT3B F: 5’-CAATCCTGGAGGCTATCCGCA-3’
88 60 R: 5’-CTTAGCAGACTGGACACCTCC-3’
HPRT F: 5’- GCAGACTTTGCTTTCCTTGGTCAG-3’
103 60 R: 5’- GTCTGGTTATATCCAACACTTCGTG-3’

32
3.5 Mitochondrial DNA (mtDNA) characterisation and haplogroup affiliation
3.5.1 MtDNA Sequencing
PCR products were subjected to a purifying treatment using 1U/µl exonuclease I and 0.05U/µl
shrimp alkaline phosphatase (both from Fermantas Lisbon, Portugal) at 37ºC for 20 minutes,
followed by heat inactivation for 15 minutes at 80ºC. For sequencing reaction of the PCR
products, a mix reaction of 0.5µ of BigDye® Terminator (Perking-Elmer, California, USA), 3.4µl
of sequencing buffer (Perking-Elmer, California, USA), 0.3µl of primer (forward for ND1 analysis
and reverse for tRNA Leu(UUR) analysis), 2 µl of purified PCR product and DNase/RNase-free
distilled water (GIBCO, Invitrogen, Carlsbad, CA, USA) were added to a final volume of 10µl
were placed in a PCR reaction tube. The sequencing reaction was performed in a BIO RAD
MyCyclerTM thermal cycle (BIO RAD, CA, USA) with the following conditions: an initial
denaturation step at 94ºC for 10 seconds, followed by 35 cycles of 10 seconds at 94ºC, 30
seconds at 56 ºC for the appropriated annealing and elongation of 2 minutes at 60ºC; the final
elongation was performed in 1 cycle of 10 minutes at 60ºC.
In order to submit each sample to the ABI prism 3130XL Automatic sequencer Perkin-Elmer,
Foster City, California, USA), the reaction product had to be purified and precipitated. The
columns of Sephadex (SephadexTM G-50 Fine, GE Healthcare Bioscience AB, Uppsala,
Sweden) were prepared adding 750 µl of Sephadex (6.66g/100ml) to each eppendorf and
further centrifuged at 3200 rpm for 4 minutes at 4ºC. The columns were transferred from the
collecting tubes to a clean and previously identified tube, and the 10 µl of sequencing product
was added to the centre of the column. A centrifugation was performed at 3200 rpm, for 4
minutes at 4ºC. At the final, 15µl of formamide (Applied Biosystem, Norwalk, USA) was added
to each pellet in order to maintain the single stranded DNA. All the samples were then submitted
to the ABI prism 3130XL Automatic sequencer (Perkin.Elmer, Foster City, California, USA), for
further automated sequencing analysis.
3.5.2 Complete mtDNA sequencing and mtDNA haplogroup affiliation
The complete mtDNA of the cell lines, 143B, CMPBR3, 3243Cy 9.7, and 3571Cy 1, was
amplified in 32 overlapping fragment with primers and PCR conditions described in Table 2.
The same primers were used to directly sequence both strands of the fragments using the
Promegafmol® DNA Cycle sequencing System and the Usb Thermo Sequence Radiolabelled
Terminator Cycle Sequencing Kits.

33
Sequences were aligned and compared with the revised Cambridge Reference Sequence
(rCRS; Andrews et al., 1999), by using the software BioEdit (Hall, 1999). The diversity observed
in each cell line was automatically classified by using the software mtDNA-GeneSyn (Pereira
et al., 2009). Haplotypes were also assigned to haplogroups by using the software Haplogrep
(Kloss-Brandstatter et al., 2011), which also indicates the polymorphisms that are potentially
private and the ones shared by ancestry.
Table 2. Primers used in the amplifications and sequencing of mtDNA genome
Name CRS reference Sequence (5’- 3’) Fragment size
(bp) Annealing (ºC)
L16340 (16318–16340) AGCCATTTACCGTACATAGCACA 681 52
H408 (429–408) TGTTAAAAGTGCATACCGCCA L382 (362–382) CAAAGAACCCTAACACCAGCC
603 56 H945 (964–945) GGGAGGGGGTGATCTAAAAC L923 (902–923) GTCACACGATTAACCCAAGTCA
607 56 H1487 (1508–1487) GTATACTTGAGGAGGGTGACGG L1466 (1445–1466) GAGTGCTTAGTTGAACAGGGCC
629 58 H2053 (2073–2053) TTAGAGGGTTCTGTGGGCAAA L2025 (2004–2025) GCCTGGTGATAGCTGGTTGTCC
609 52 H2591 (2612–2591) GGAACAAGTGATTATGCTACCT L2559 (2538–2559) CACCGCCTGCCCAGTGACACAT
591 56 H3108 (3128–3108) TCGTACAGGGAGGAATTTGAA L3073 (3051–3073) AAAGTCCTACGTGATCTGAGTTC
640 52 H3670 (3690–3670) GGCGTAGTTTGAGTTTGATGC L3644 (3625–3644) GCCACCTCTAGCCTAGCCGT
623 58 H4227 (4247–4227) ATGCTGGAGATTGTAATGGGT L4210 (4189–4210) CCACTCACCCTAGCATTACTTA
625 55 H4792 (4813–4792) ACTCAGAAGTGAAAGGGGGCTA L4750 (4729–4750) CCAATACTACCAATCAATACTC
599 52 H5306 (5327–5306) GGTGATGGTGGCTATGATGGTG L5278 (5259–5278) TGGGCCATTATCGAAGAATT
593 58 H5832 (5851–5832 ) GACAGGGGTTAGGCCTCTTT L5781 (5762–5781) AGCCCCGGCAGGTTTGAAGC
626 58 H6367 (6387–6367) TGGCCCCTAAGATAGAGGAGA L6337 (6318–6337) CCTGGAGCCTCCGTAGACCT
601 58 H6989 (6918–6899) GCACTGCAGCAGATCATTTC L6869 (6850–6869) CCGGCGTCAAAGTATTTAGC
578 58 H7406 (7427–7406) GGGTTCTTCGAATGTGTGGTAG L7379 (7358–7379) AGAAGAACCCTCCATAAACCTG
580 56 H7918 (7937–7918) AGATTAGTCCGCCGTAGTCG L7882 (7861–7882) TCCCTCCCTTACCATCAAATCA
506 56 H8345 (8366–8345) TTTCACTGTAAAGAGGTGTTGG L8299 (8280–8299) ACCCCCTCTAGAGCCCACTG
603 56 H8861 (8882–8861) GAGCGAAAGCCTATAATCACTG L8799 (8779–8799) CTCGGACTCCTGCCTCACTCA
638 58 H9397 (9416–9397) GTGGCCTTGGTATGTGCTTT L9362 (9342–9362) GGCCTACTAACCAACACACTA
609 56 H9928 (9950–9928) AACCACATCTACAAAATGCCAGT L9886 (9865–9886) TCCGCCAACTAATATTTCACTT
617 56 H10462 (10481–10462) AATGAGGGGCATTTGGTAAA L10403 10383–10403) (AAAGGATTAGACTGAACCGAA
612 56 H10975 (10994–10975) CCATGATTGTGAGGGGTAGG L10949 (10930–10949) CTCCGACCCCCTAACAACCC
617 58 H11527 (11546–11527 CAAGGAAGGGGTAGGCTATG L11486 (11467–11486 AAAACTAGGCGGCTATGGTA
629 56 H12076 (12095–12076 GGAGAATGGGGGATAGGTGT

34
L12028 (12008–12028 GGCTCACTCACCCACCACATT 615 58
H12603 (12623–12603 ACGAACAATGCTACAGGGATG L12572 (12553–12572 ACAACCCAGCTCTCCCTAAG
591 56 H13124 (13143–13124 ATTTTCTGCTAGGGGGTGGA L13088 (13068–13088 AGCCCTACTCCACTCAAGCAC
618 58 H13666 (13685–13666 AGGGTGGGGTTATTTTCGTT L13612 (13593–13612 AAGCGCCTATAGCACTCGAA
614 56 H14186 (14206–14186 TGGTTGAACATTGTTTGTTGG L14125 (14104–14125 TCTTTCTTCTTCCCACTCATCC
602 58 H14685 (14705–14685 CATTGGTCGTGGTTGTAGTCC L14650 (14629–14650 CCCCATTACTAAACCCACACTC
604 58 H15211 (15232–15211 TTGAACTAGGTCTGTCCCAATG L15162 (15143–15162 CTCCCGTGAGGCCAAATATC
597 58 H15720 (15739–15720 GTCTGCGGCTAGGAGTCAAT L15676 (15657–15676 TCCCCATCCTCCATATATCC
524 56 H16157 (16180–16157 TGATGTGGATTGGGTTTTTATGTA L15996 (15975–15996 CTCCACCATTAGCACCCAAAGC
446 58 H16401 (16420–16401 TGATTTCACGGAGGATGGTG
3.6 Total cell lysates
Cells lines were seed until reach 70-80% confluence. Cells were washed three times in PBS
1X and subsequently using RIPA buffer (50mM Tris-HCl, 1% NP-40, 150mM NaCl and 2mM
EDTA, pH 7,5), containing phosphatase (Sigma-Aldrich, Saint Louis, Missouri, USA) and
protease (Roche Applied Science) inhibitors, incubated on ice for 15 minutes. The cells were
scraped off the plates, transferred to micro centrifuge tubes and centrifuged at 14000 rpm for
15 minutes at 4ºC, the supernatant was collected and the lysates were stored at -20ºC.
3.7 Western Blot analysis
Total cell lysates were quantified using a DCTM Protein Assay (BIO-RAD Laboratories, Inc.)
(BSA standards: 250, 500, 750, 1000, 1500 and 3000µg/mL). (BSA (AppliChem, Darmstadt,
Germany). The absorbance was read in at 655 nm in microplate reader (BIO RAD, CA, USA).
Standard curves were accepted for an r2 >0.97. Protein from the cell extracts, were denatured
with 4X loading buffer (5 minutes at 95ºC), resolved by sodium dodecyl sulphate (SDS)-PAGE
in a gel 40% bisacrylamide 29:1 (BIO RAD, CA,USA) concentration of 16-10% (v/v) at 100V for
2.5- 3 hours. Loaded volumes of each input were determined, so the applied protein mass was
the same for each lane (40 µg). Proteins were, then, electrotransferred onto a Hybond ECL
nitrocellulose membrane (GE, Healthcare, UK) for 2 hours at 365 mA or 120Volts.
After staining the membrane with Ponceau S dye (Sigma-Aldrich) to check the uniformity and
overall effectiveness of protein transfer from the gel to the membrane, membranes were
blocked for 45 minutes at room temperature (RT) in PBS1X containing 0.1% (v/v) Tween-20
(Sigma-Aldrich, Saint Louis, Missouri, USA), PBS-T, and 5% (w/v) low-fat dry milk or BSA

35
depending the dilution agent for the primary antibody with gently agitation. The incubation with
the primary antibodies, diluted in PBS-T containing 5% (w/v) low fat milk or BSA, was carried
out according to the manufacturer’s instructions (see Table 3) with gently agitation. Membranes
were then washed with PBS-T 0.1% and subsequent incubation with suitable horseradish
peroxidase conjugated secondary antibody diluted 1:2000 in the PBS-T 0.1% containing 5%
(w/v) low fat milk for 1 hour RT. After the incubation with secondary antibody the membrane
was washed again and the ECL Plus detection system (Perkin- Elmer, California, USA) was
added for chemiluminescence detection using Amersham Hyperfilm ECL (GE Healthcare, UK).
The protein expression levels were quantified using the BIO- RAD quantity One 1-D Analysis
software (BIO-RAD Laboratories, Inc.) and normalized by the β-Actin or α-tubulin protein levels.
Table 3. Primary antibodies and respective conditions in the procedure of western blot
Protein Dilution Incubation conditions
Animal origin
Molecular weight (kDa)
Commercialized by
Acetylated-Lysine
1:1000 (BSA 5%) ON at 4ºC Rabbit - Cell Signaling
Technologies, Inc.
ACL 1:500
(Low fat milk 5%) 1h at RT Rabbit 120 Sigma Aldrich
SOD-2 1:2500
(Low fat milk 5%) ON at 4ºC Rabbit 24.7 Sigma Aldrich
SOD-2 k68 1:1000
(Low fat milk 5%) ON at 4ºC plus 1h
at RT Rabbit 25 Abcam®
SIRT3 1:1000
(BSA 5%) ON at 4ºC Rabbit 28 Cell Signaling
Technologies, Inc.
ND1 1:1000
(Low fat milk) ON at 4ºC Mouse 36 Santa Cruz
Biotechnology
NDFUS3 1:500
(Low fat milk) ON at 4ºC Mouse 30 Abcam®
SDHA 1:10000
(Low fat milk) ON at 4ºC Mouse 70 Abcam®
ENOI 1:8000
(Low fat milk) ON at 4ºC Rabbit 47 Abcam®
eIF4AI 1:1000
(Low fat milk) ON at 4ºC Rabbit 47 Abcam®
GAPDH 1:8000
(Low fat milk) ON at 4ºC Mouse 36 Santa Cruz
Biotechnology
β-Actin 1:2000
(Low fat milk 5%) 1H; RT Goat 42 Santa Cruz
Biotechnology
α-Tubulin 1:8000
(Low fat milk) 1H; RT Mouse 50 Sigma Aldrich
ON- Overnight; RT- Room temperature; H- Hour; ACL- ATP citate lyase; SOD-2- Superoxide dismutase Mn; SOD-2K68-
Superoxide dismutase Mn, acetylated at lysine 68; SIRT3- NAD-dependent protein deacetylase sirtuin-3; ND1- NADH
dehydrogenase subunit 1; NDFUS3- NADH dehydrogenase (ubiquinone) Fe-S protein 3; SDHA- succinate dehydrogenase
complex, subunit A; ENOI- α-Enolase; eF4AI- eukaryotic initiation factor 4AI; GAPDH- Glyceraldehyde-3-phosphate
dehydrogenase.

36
3.8 Reserve Transcriptase – Polymerase Chain Reaction (RT-PCR)
The cDNA synthesis was performed using 100ng of RNA, 100µM Random hexamer primer
(Fermentas, Lisbon, Portugal), 220U RevertAidTM Reverse Transcriptase, 5X reaction buffer,
20U RiboLockTM RNase Inhibitor (all from Fermentas, Lisbon, Portugal) and 40mM dNTPs mix
(Bioron GmbH, Germany) to a final volume of 20µl. The thermal cycling conditions were 10
minutes at 25ºC followed by 60 minutes at 42ºC and finally 10 minutes at 70ºC. The reaction
was performed on Bio-Rad MyCycleTM Thermal Cycle (BIO RAD, CA, USA). A negative control
was included to check possible RT-PCR contamination.
3.9 Real time PCR/ qPCR
Real-time PCR was performed to quantify GNMT; MAT1A; MAT2A; MAT2B; DNMT1; DNMT3B
mRNA levels in the different cells lines. The reaction was performed according to
manufacturer’s instructions using the RT2 Real-TimeTM SYBR Green/ROX PCR master mix
(Qiagen, Hilden, Germany) which contains a high-performance HotStart DNA Taq polymerase,
nucleotides and ROX. The housekeeping gene used as control was HPRT (primers already
available in our lab). Each sample was efficiently corrected against a standard curve for each
target. Afterwards, samples were normalized to an endogenous control (HPRT) to ensure that
expression levels were correctly compared among each other. Those two parameters ensure
that samples are standardized compared and correctly analysed.
3.10 Complex I Enzyme Activity
The activity of the mitochondrial complex I (NADH:ubiquinone oxidoreductase) was evaluated
enzymatically by using the Complex I Enzyme Activity Microplate Assay Kit (ab109721)
(Abcam®), according to the manufacturer’s instructions. Briefly, mitochondrial activity is
determined by following the oxidation of nicotinamide adenine dinucleotide (NADH) to NAD+
and the simultaneous reduction of a dye leading to increased absorbance at 450 nm. The
complex I activity is expressed as milli-units of optical density (mOD) (Figure 8).

37
Figure 8. Complex I Enzyme Activity Microplate Assay Kit (ab109721) (Abcam®); Substrate was NADH and the product was
NAD+ .
The cells were seeded until reach 70-80% confluence, washed in PBS 1X, trypsinized (0.05%
trypsin-EDTA) and pelleted (1200rpm, 5 minutes). After, 350-500 µl of PBS 1X (depending of
the pellet) was added to each pellet, and 1/10 of the volume of a detergent was added and
incubated on ice for 30 minutes to perform protein extraction. After, the samples were
centrifuged at 12,000 x g for 20 minutes and the supernatant collected. The protein samples
were quantified using DCTM Protein Assay based on the well documented Lowery assay (BIO-
RAD Laboratories, Inc.) and 200µg of protein sample was added in each well, including a
control buffer as null reference and incubated for 3 hours at RT. After the incubation the wells
were washed three times with buffer and 200µl of assay solution (containing buffer, NADH
40mM and Dye) was added to each well. The absorbance was measure at 450 nm at
approximately 30 second’s intervals for 30 minutes and auto shake between readings.
3.11 Luminescent ATP Detection Assay
The global cellular adenosine 5’-triphosphate (ATP) levels were quantified using Luminescent
ATP Detection Assay Kit (ab113849, Abcam®) according to the manufacturer’s instructions.
These ATP assay is based on the production of light caused by the reaction of ATP with added
luciferase and D-luciferin; the emitted light is proportional to the ATP concentration inside the
cell and is expressed in Luminescent count/cell. The luminescence was measure in the
SynergyTM 4 Multi-Mode Microplate Reader – (BioTeck® - Instruments Inc. Vermont USA). The
reaction can be summarized as follows:

38
Briefly, 15000 cells/well were seeded into a 96-well plate, in 100µl of complete culture medium,
24 hours before the ATP assay. After the 24 hours, 100μL of complete culture medium was
added into the empty wells of the plate allocated for the standard dilutions of ATP and the
negative control; 50µl of detergent was added to each well and incubated for 5 minutes in an
orbital shaker at 700rpm. To perform the standard curve, 10µl of ATP standard was added in
a 1:4 dilution series from 10μM to 610pM final concentration and incubated for 5 minutes in an
orbital shaker at 700 rpm. In order to measure the luminescence 50μL of the reconstituted
substrate solution was added to each well and shake the microplate for five minutes in an orbital
shaker at 700rpm and incubated for 10 minutes in the dark the microplate. The luminescence
was measure in the SynergyTM 4 Multi-Mode Microplate Reader – (BioTeck® - Instruments Inc.
Vermont USA).
3.12 Quantification of global DNA methylation
The global DNA methylation level was determined using the EpiSeeker methylation DNA
quantification Kit (Fluorometric) (ab117129 Abcam®). In this assay, DNA was bound to strip
wells that were specifically treated to have a high DNA affinity. The methylated fraction of DNA
was detected using capture and detection antibody and then quantified fluorometrically by
reading the relative fluorescence units (RFU). The amount of methylated DNA is proportional
to the fluorescence intensity measured.
To perform this evaluation, DNA was extracted from cell lines and quantified using NanoDrop
ND-1000 Spectrophometer (Nanodrop Technologies, Inc., Delaware, USA). DNA
concentration was adjusted to 100ng/µl. The DNA samples (100ng) and the diluted standards
(0.5-10.0ng/µl) was further added to 80µl of binding solution for each well and incubated for 90
minutes at 37ºC. The wells were washed three times, followed by incubation with the capture
antibody for methylated DNA (1:1000) and incubated at RT for 60 minutes. After the incubation
time the wells were washed three times, and the detection antibody (1:2000) was added and
incubated at RT for 30 minutes. Each well were washed four times followed by the addition of
the enhancer solution (1:5000) and incubated for 30 minutes at RT. The enhancer solution was
removed from each well and each well was washed five times followed by the addition of the
Fluoro-development solution to each well, and incubated for 4 minutes in dark. The RFU was

39
measure using the SynergyTM 4 Multi-Mode Microplate Reader – (BioTeck® - Instruments Inc.
Vermont USA) at Ex/Em= 530/590 nm.
3.13 Genomic 5-hydroxymethylcytosine levels evaluation
The global levels of 5-hydroxymethylcytosine (5-hmC) was evaluated using the GpGenomeTM
5-hmC quantification kit (EMD Millipore Corporation, Billerica, MA, USA) which provides a rapid,
efficient automation-compatible ELISA-based protocol for sensitive quantification of 5-hmC in
a wide range of DNA.
This assay is designed to determine the levels of 5-hmC DNA in a sample relative to a standard
curve. This solid-phase assay is possible because antibodies can be attached to plastic (see
Figure 9), requires two antibodies that bind to epitopes that do not overlap on the antigen.
Figure 9. Illustration of CpGenome 5-hmC quantitation kit assay principle.
To perform this evaluation, DNA was extracted from cell lines with different passages and
quantified using NanoDrop ND-1000 Spectrophometer (Nanodrop Technologies, Inc.,
Delaware, USA). The DNA concentration was adjusted to 100ng/µl.
In order to bind the 5-hmC antibody to the surface of the well, the antibody was prepared in the
assay buffer to the final concentration of 1ng/µl and 100µl of the 1ng/µl 5-hmC antibody solution
was added to each well and incubated at 37ºC for 1 hour. After the incubation time the wells
were washed three times with the assay solution.
DNA samples were placed in a thermo cycle and incubated at 98ºC for 5 minutes to denature
the DNA and after 5 minutes the samples were immediately placed on ice for 10 minutes to
ensure that DNA remain in a single strand. The single strand DNA samples and 5-hmC
standards were prepared to a final concentration of 1ng/µl, and 100µl of the diluted samples
and 5-hmC standards were added to each well and incubate at 37ºC for 1 hour. After the

40
incubation time the wells were washed three times and 100µl of diluted HRP detection antibody
(1:100) were added to each well and incubated for 30 minutes at 37ºC.
For colorimetric detection, the wells were washed three times with assay buffer and 100µl of
HRP detection reagent was added. The absorbance in each well was measure at 405 nm using
the SynergyTM 4 Multi-Mode Microplate Reader – (BioTeck® - Instruments Inc. Vermont USA).
3.14 Immunoprecipitation protocol
3.14.1 Preparing Cell Lysates
The cells were plated until reach 70-80% of confluence. The culture medium was aspirated and
the cells were washed three times with PBS1X, and 350µl of 1X Cell Lysis Buffer (20Mm Tris
(pH7.5), 150 nM EDTA, 1% Triton x-100, 2.5mM Sodium pyrophosphate, 1 mM β-
glycerophosphate, 1mM Na3VO4,1µg/ml leupetin) (Cell Signaling Techonology ®) was added to
each plate (75 cm2) and incubated on ice for 10 minutes. The cells were scraped off the plates
and transferred to microcentrifuge tube followed by centrifugation for 10 minutes at 14,000 x g,
4ºC. The supernatant was transferred to a new tube and the lysates were stored at -20ºC.
3.14.2 Immunoprecipitation
Total cell lysates were quantified using a DCTM Protein Assay (BIO-RAD Laboratories, Inc.). In
order to perform a cell lysate pre-clearing 750µg of protein was added to 35 µl of Protein A
agarose beads (50% bead slurry) (Cell Signaling Techonology ®) and incubate at 4ºC for 1
hour. After, the protein samples were centrifuged at 4ºC for 10 minutes and the supernatant
was collected into a new microcentrifuge tube.
To perform a pull down of the acetylated lysines proteins the antibody against acetylated lysine
(1:100) (polyclonal rabbit) (Cell Signaling Technologies, Inc.) was added to each sample, the
same concentration of antibody was added in the negative control. As a negative control an
antibody against TOM-20 (polyclonal rabbit) (Santa Cruz Biotechnology, Inc.) was used. The
samples and the negative control, after the addition of the respective antibody, were incubated
with gentle rocking overnight at 4ºC. After the incubation time, 35µl of Protein A beads (50 %
beads slurry) was added and the samples incubated with gently rocking for 2 hours at 4ºC
followed by a microcentrifuge for 30 seconds at 4ºC. The pellet was washed four times with
500µl of 1X cell lysis buffer.
The pellet was resuspended with 30µl of 3x SDS sample buffer followed by heating at 95ºC for
5 minutes and centrifuged for 1 minute at 14,000 x g. The samples, controls and total cell

41
lysates of each cell line were load on SDS-PAGE gel 40% bisacrylamide 29:1 (BIO-RAD
Laboratories, Inc.) concentration of 12% (v/v).
3.15 Two-dimensional (2-D) gel electrophoresis
3.15.1 Protein Precipitation
To perform the 2-D gels, the protein samples were quantified using a DCTM Protein Assay (BIO-
RAD Laboratories, Inc.). For the 7cm strip and the 11cm strip, 150 µg and 300 µg of protein,
respectively, was used.
Protein precipitation was performed using the ProteoExtract® Protein precipitation Kit
(Calbiochem®). Protein samples analysis is often hampered by the presence of non-protein
impurities such as buffer, salts and detergents that interfere with electrophoretic separations or
enzymatic digestion. The ProteoExtract® Protein precipitation Kit (Calbiochem®) provides a fast
and efficient method for concentrating and cleaning up proteins.
After the quantification of the protein samples the volume was adjusted to 200µl with RIPA
buffer, and 800µl of cold precipitation agent (-20ºC) was added to each sample. The samples
were incubated for 1 hour at -20ºC followed by centrifugation at RT at 10,000 x g to pellet the
proteins. The supernatant was carefully aspirated without disturbing the pellet. The pellet was
washed twice by adding 500µl of cold wash solution (-20ºC) and vortex briefly followed by
centrifugation for 2 minutes at RT at 10,000 x g to pellet the proteins. To dry the pellet, the
tubes were left open for 45 minutes on the lab bench.
3.15.2 Rehydration and sample application
The protein samples was resuspended/rehydrated in 125µl, for 7cm strip, or 200µl, for 11cm
strip, in IEF buffer [8M urea, 2% CHAPS and 50nM dithiothreitol (DTT)] to the IEF buffer was
added Bio-Lyte ampholytes (BIO-RAD Laboratories, Inc.), and the samples were incubated for
1 hour at RT with gently agitation. After the incubation time the indicated volume of each sample
(125µl for 7cm strip or 200µl for 11cm strip) was added as a line along the edge of each cannel
in a clean dry disposable rehydration/equilibration tray. When all protein samples have been
loaded into the rehydration/equilibration tray, the IPG strips (BIO-RAD Laboratories, Inc.) were
placed with the gel facing down, onto the sample and incubated for 30 minutes at RT. After the
30 minutes, each of the IPG strips was overlaid with 2.5ml of mineral oil and the
rehydration/equilibration tray was cover with the plastic lid and left overnight to rehydrate the
IPG strips and load the protein samples.

42
Isoelectric focusing was performed in a Preotean IEF cell (BIO-RAD Laboratories, Inc.) under
the following conditions: (i) 250 V, 15 minutes; (ii) voltage gradient up to 4000 V; and (iii) 4000
V until reach 14000 V-hour. The temperature was maintained at 20ºC and the current was kept
at 50 microA per strip. At the end of this step the IPG strips were stored at -20ºC.
Upon completion, strips were equilibrated in buffer containing 6M urea, 0.375 M Tris-HCl, pH
8.8, 2% SDS, 20% glycerol and 2% w/v DTT for 10 minutes, followed by a second equilibration
using the same buffer containing 6M urea, 0.375 M Tris-HCl, pH 8.8, 2% SDS, 20% glycerol,
2.5% w/v iodoacetamide instead of DTT for another 10 minutes, this incubation was performed
in the dark.
After the incubation time, the IPG strip was placed into a SDS-PAGE gel containing an IPG
well filled with melted overlay agarose. The electrophoresis was performed at 150-200V for 45
minutes. When the electrophoresis was concluded, the SDS-PAGE gel was washed with
distilled water three times for 10 minutes. The protein samples were electrotransferred onto a
Hybond ECL nitrocellulose (GE, Healthcare, UK) membrane for 2 hours at 365 mA or 120Volts
followed by blocking the nitrocellulose membrane for 45 minutes in PBS-T 0.1% containing 5%
(v/w) BSA (Sigma-Aldrich, Saint Louis, Missouri, USA) and the membrane was incubated with
the antibody against acetylated lysines (1:2500) (Cell Signaling Technologies, Inc.) overnight
at 4ºC.
3.15.3 Coloration with Coomassie Blue
Coomassie dyes are a family of dyes commonly used to stain proteins in sodium dodecyl
sulphate and blue native polyacrylamide gel electrophoresis. This treatment allows the
visualization of protein spots.
After completed electrophoresis, the gel was washed three times with distilled water for 10
minutes followed by the addiction of Coomassie Blue (Thermo Scientific) and incubated for 12-
14 hours at RT with gently rocking.
3.16 Mass Spectrometry Methods for Studying differentially acetylated proteins
Differentially acetylated proteins (based on the differences in the intensity spots), between the
two cell lines (143B and 143B Rho0), were identified by Mass Spectrometry. For protein
excision from the gel, was used a gel spot picker (OneTouch 2D gel spot picker, 1.5 mm
diameter, Gel Company, USA), and the gel spots were transferred into a 0.25 mL
microcentrifuge tube.

43
To each of the protein gel spots 200µl of a solution containing 50 % methanol in 50mM
NH4HCO3 (1:1 v/v) was added and mixed for 1min at the top speed of microcentrifuge tube
mixer. The supernatant was discarded and this step was repeated once. For samples
dehydration, 200µl of the dehydration solution at 50 % of Acetonitrile (ACN) in 50mM NH4HCO3
(1:1 v/v) (recently prepared) was added and mixed for 5 min at the maximum speed of the
microcentrifuge tube mixer and the supernatant was rejected followed by the addition of 200μL
of ACN and incubate 30s.
The protein gel spots samples were dried in a vacuum centrifuge concentrator until complete
drying of the sample. (5–10 min). After, 100µl of the solution of 25mM DTT in 50mM NH4HCO3
was added to each sample, and incubated for 20 minutes at 56ºC. After the incubation time
100μL of the alkylation solution freshly prepared 55mM IAA (iodoacetamide) in 50mM
NH4HCO3 was added, and incubated in the dark for 20 min at room temperature. The
supernatant was discarded and each sample was washed with 200µl of ultrapure water by
briefly vortex mixing, this step was preformed twice.
In order to perform the second dehydration of the samples 200µl of the dehydration solution at
50 % of ACN in 50mM NH4HCO3 (1:1 v/v) was added and mixed for 5 min at the maximum
speed of the microcentrifuge tube mixer and the supernatant was rejected followed by the
addition of 200μL of ACN and incubate 30 s. The protein gel spot samples were dried in a
vacuum centrifuge concentrator until complete drying of the sample (5–10 min).
To perform the tryptic digestion each gel sample was rehydrated with 20µl of 2ng/µl trypsin
(Trypsin Gold, Mass Spectrometry Grade- Promega, WI, USA) in 0.01% surfactant
(ProteaseMAX™ Surfactant,Trypsin Enhancer Promega, WI, USA), 50mM NH4HCO3 for 10
minutes. After the 10 minutes, the samples were overlaid with 30µl of 0.01% surfactant in 50mM
NH4HCO3 and gently mix followed by incubation at 37ºC for 3hours. The content was pipetted
and resuspended twice and transferred into a new tube, 20µl of 2.5% trifluoroacetic acid (TFA)
was added to the gel pieces and mixed in a microcentrifuge tube shaker at the maximum speed
for 15 minutes.
The extract and the trypic digest were combined and the gel pieces were discarded. The
combined solution was centrifuged for 10 minutes at 14.000 rpm and the supernatant was
transferred into a new tube. In this step, if the trypic digest is not going to be analysed within a
few hours, the samples can be stored at -20ºC.
Using Ziptip C18 (EMD Millipore Corporation, Billerica, MA, USA), 10µl of wetting solution
(100% ACN) was aspirated and dispensed to wash, this step was performed twice followed by

44
pipetting 10µl of equilibration solution (0.1% TFA in Mili-Q grade water) and dispensed, this
step was performed twice.
In order to bind the peptides, the samples was aspirated and dispensed in ten cycles (it is
important to aspirate the digest into a maximum capacity of the tip) followed by aspiration of
wash solution (0.1% TFA in Mili-Q grade water) into the tip and dispensed to waste.
To perform the elution of the peptides with Matrix Assisted Laser Desorption Ionization (MALDI)
matrix [1.2 µl of elution buffer (0.1% TFA/ 50% ACN) with NALDI matrix was previously
pipetted], the samples was aspirated with the MADI matrix, and dispense in ten cycles and
plated into a MALDI sample plate.
3.17 Statistical Analysis
Whenever adequate, the results are presented as mean ± standard deviation. Statistical
analysis was performed using One-Way ANOVA and posterior Bennett and Tukey tests, with
p< 0.05 as the level of significance, in Graph Pad Prism software version 6.

45
Chapter 4 Results

46

47
4.1 Cybrid Cell Lines
In order to evaluate the possible role of mitochondrial dysfunction, caused either by
mutations/variants in mtDNA or mtDNA depletion, in the epigenetic landscape of the cell, we
decided to take advantage of a suitable cell model. Thus, we choose a model, already
established in our lab characterized by a genetic impairment of OXPHOS proteins; it should be
noted that OXPHOS has both mtDNA and nDNA encoded proteins. To study specifically the
functional effect of mtDNA mutations/variants, nuclear effects must be excluded and, so,
cybrids cell lines were used.
The cybrid cell lines displaying the mtDNA ND1 gene mutation (3571InsC), were already
available in our lab. These cybrid cell lines were constructed using the cell line 143B Rho0,
used as recipient cell line, whereas the cell line XTC.UC1 (harbouring the mtDNA ND1 gene
mutation) was used as donor cell line. Three cybrid cell lines resulted from this construction,
two of them had different percentage of heteroplasmy, for the mtDNA ND1 gene mutation
(3571Cy 1 and 3571Cy 22), and one cybrid cell line with wt homoplasmy for the mtDNA ND1
gene (Cy 24).
Taking into consideration that our purpose was to inactivate OXPHOS, we decided to take
advantage of a known pathogenic mitochondrial mutation – an A-to-T transition at mtDNA
nucleotide position 3243 in the tRNA Leu (UUR) gene – that will presumably affect all complexes
with mtDNA encoded proteins (I, III, IV and V). This cybrid cell line was already established in
our lab. To build the A3243T cybrid, platelets were extracted from a patient with mitochondrial
myopathy due to a germ line A3243T mutation. Platelets were then fused 143B Rho0 cell line.
This cybrid was called 3243Cy 9.7.
In addition, to the aforementioned cybrid cell lines used, we had already available a cybrid cell
line resulting from the fusion of 143B Rho0 cell line and platelets from a healthy individual -
CMPBR3 cybrid cell line, and the parental cell line of the 143B Rho0 – 143B. These two cell
lines were used because we wanted to test if the mtDNA belonging to different haplogroups,
with the same nuclear background (nDNA), have some influence the cellular epigenetic
landscape.
Additionally, we also used a cell line without mtDNA (143B Rho0) in order to understand the
putative role of mtDNA in the regulation of the cellular epigenetic landscape. The 143B Rho0
cell line has already been used in other studies using cybrid cell lines, with the aim of studying
the possible effect of mitochondrial dysfunction in various aspects of cellular physiology (Singh
et al., 2005).

48
4.2 Evaluation of mtDNA mutation status in the cybrid cells
4.2.1 Mutations status of the cybrid cell lines (3571Cy 1 and 3571Cy 22) displaying
a mtDNA ND1 gene mutation – (3571InsC)
Figure 10. Sequence analysis of the mtDNA ND1 gene. A. Electropherogram of 3571Cy 1 showing the level of the C insertion
at bp3571, according to the Cambridge Reference Sequence and, by an analysis of the electropherogram, presented
approximately 60% of the mutation. B. An analysis of the electropherogram of 3571 Cy 22, presented approximately 80% of the
mutation. C. Electropherogram of Cy 24 showing the normal sequence of the mtDNA ND1 gene.
We confirmed the presence of the mtDNA ND1 gene mutation in the cybrid cell lines, 3571Cy
1 and 3571Cy 22. An analysis of the electropherograms of the 3571Cy 1 and 3571Cy 22 cybrid
cell lines, presented approximately 60% and 80% of the mtDNA ND1 gene mutation,
respectively. (Figure 10 A and B). Furthermore, we also confirmed the absence of mtDNA ND1
gene mutation in the Cy 24 cell line (Figure 10 C).

49
4.2.2 Mutation status of the cybrid cell line displaying a mtDNA tRNA Leu (UUR)
gene mutation - A3243T cybrid
Figure 11. Sequence analysis of the mtDNA tRNA Leu (UUR) gene in the cybrid 3243Cy 9.7. Electropherogram showing the level
of A-to-T transition at mtDNA nucleotide position 3243, according to the Cambridge Reference Sequence (superimposed peaks
suggest 60% mutated mtDNA).
We confirmed the presence of the mtDNA tRNA Leu (UUR) gene mutation in the 3243Cy 9.7 cybrid
cell line. An analysis of the electropherogram suggest the presence of approximately 60% of
the mtDNA tRNA Leu (UUR) gene mutation, in the 3243Cy 9.7 cybrid cell line (Figure 11).
4.2.3 Sequencing of the 143B, 143B Rho0 and CMPBR3 cell lines
In order to be sure the mtDNA mutations under study were specific of the 3571Cy 1, 3571Cy
22 and 3243Cy 9.7, we confirmed its absence in CMPBR3, 143B and 143B Rho0. As seen in
Figure 12, no other cell lines than 3571Cy 1 and 3571Cy 22 have the 3571InsC mutation, and
only the 3243Cy 9.7 presents the A3243T mutation at the mtDNA tRNA Leu (UUR) gene (Figure
13). It should be stated that we could obtain a PCR product from 143B Rho0; however, after
sequencing, it displayed numerous point mutations which can be due to fragmentation of
mtDNA or to amplification of nuclear pseudogenes of mtDNA (Parr et al., 2006).

50
Figure 12. Sequence analysis of the mtDNA ND1 gene. A. Electropherogram of 143B cell line showing the normal sequence of
the mtDNA ND1 gene. B. An analysis of the electropherogram of CMPBR3 cell line, showing the absence of mutation in mtDNA
ND1 gene. C. Electropherogram of 143B Rho0 cell line, showing mutations all over the sequence.
Figure 13. Sequence analysis of the mtDNA tRNA Leu (UUR) gene. A. Electropherogram of 143B cell line, showing the absence
of the A-to-T transition at mtDNA nucleotide position 3243. B. Electropherogram of CMPBR3 cell line, showing the absence of
mutation in mtDNA tRNA Leu (UUR) gene at mtDNA nucleotide position 3243. C. Electropherogram of 143B Rho0 cell line, showing
mutations all over the sequence. The arrow points the theoretical substitution place.
To ensure the absence of mtDNA in 143B Rho0 cells, the expression of mtDNA-encoded
cytochrome oxidase subunit II (COX II) protein was assessed. Figure 14 shows that 143B Rho0
cell line does not express this enzyme, comparing with all other cell line used, confirming the
mtDNA depletion in 143B Rho0 whereas cybrids cell lines showed expression of this enzyme.

51
Figure 14. Analysis of protein levels of COXII in all cell lines. COX II indicates cytochrome oxidase subunit II.
4.2.4 Mitochondrial DNA (mtDNA) haplogroup affiliation of the 143B, CMPBR3,
3243Cy 9.7 and 3571Cy 1 cell lines
For the mtDNA haplogroup affiliation of the 143B, CMPBR3, 3243Cy 9.7 and 3571Cy 1 cell
lines, the complete mtDNA sequencing was performed. The data was analysed using the
Haplogrep software (http://haplogrep.uibk.ac.at/) that is associated with the Phylotree data
base (http://www.phylotree.org/).
After the analysis of the sequence data the haplogroups of each cell line were determined. The
mtDNA of the 143B cell line haplotype can be affiliated to the haplogroup X2e1, the mtDNA of
the CMPBR3 cell line to the haplogroup J1ba1, the mtDNA of the 3243Cy 9.7 cell line to the
haplogroup H1aW and the mtDNA of the 3571Cy 1 cell line to the haplogroup H1b1+16362.
The mtDNA of the 143B, CMPBR3 and the 3243Cy 9.7 cell lines belongs to different
haplogroups, and on the other hand, the mtDNA of the cybrids 3571Cy 1 and 3243Cy 9.7
belongs to the same haplogroup, although exhibiting differences regarding the subgroup
(Figure 15).

52
Figure 15. Mitochondrial DNA (mtDNA) haplogroup affiliation. A. Haplogroup affiliation of the mtDNA of the 143B cell line. B.
Haplogroup affiliation of the mtDNA of the CMPBR3 cell line. C. Haplogroup affiliation of the mtDNA of the 3243Cy 9.7 cell line. D.
Haplogroup affiliation of the mtDNA of the 3571Cy 1cell line.
4.3 Complex I activity
To test the effect of mtDNA mutations/variants (143B, CMPBR3, 3243Cy 9.7, 3571Cy 1 3571Cy
22 and Cy 24) as well as the absence of mtDNA (143B Rho0) in mitochondrial function, the
activity of mitochondrial complex I in these cell lines was accessed.
Comparing with the parental cell line (143B), a statistically significant increase in complex I
activity was observed in Cy 24 cybrid cell line (Figure 16 A).
Differences in Complex I activity were also observed between cell lines with mtDNA belonging
to different haplogroups (Figure 16 B). The haplogroup H (Cy 24 cell line) showed the highest
complex I activity, being statistically significant higher (p<0.05) than that of haplogroup X (143B
cell line). Additionally, we also observed an increase in complex I activity in the haplogroup J
(CMPBR3 cell line) compared with the haplogroup X (143B cell line), although this increase
was not statistically significant. The 143B Rho0 cell line (with no mtDNA) showed the lowest
complex I activity, comparing with all cell lines [Cy 24 cell line (haplogroup H) (p<0.01),
CMPBR3 cell line (haplogroup J) (p<0.05)] (Figure 16 B).
Concerning the cell lines with mtDNA belonging to the same haplogroup (Cy 24, 3571Cy 1,
3571 Cy22 and 3243 Cy9.7) (Figure 16 C), all cybrid cell lines harbouring mtDNA mutations
revealed a statistically significant decrease in complex I activity when compared and
normalized to the Cy 24 (wt mtDNA) cell line [Cy 24 vs 3571Cy 1 (p<0.01); Cy 24 vs 3571 Cy
22 (p<0.05) and Cy 24 vs 3243Cy 9.7 cell line (p<0.05)] (Figure 16 C).

53
Figure 16. Analysis of complex I activity. A. Overview of complex I activity in all cell lines compared with the 143B cell line. B.
Analysis of complex I activity in cell lines harbouring mtDNA belonging to different haplogroups (143B- haplogroup X; CMPBR3-
haplogroup J; Cy 24-haplogroup H and 143B Rho0), normalized to 143B cell line. C. Analysis of complex I activity in cell lines
belonging to the same haplogroup without (Cy 24) and with mtDNA mutations (3571Cy 1, 3571Cy 22 and 3243Cy 9.7), normalized
to Cy 24 cell line. The activity of Complex I is proportional to the increase in absorbance at 450 nm. Activity mOD indicates that
activity was measure at 450 nm; RQ - relative quantification. Data correspond to two biological replicas done in duplicates. Bars,
standard deviation; columns, mean. The asterisks indicates the level of statistical significance (*p<0.05; ** p<0.01). Data were
subjected to one-way ANOVA and a posterior Bennett and Tukey test.
4.4 Analysis of ND1 protein expression level in cybrids with mtDNA ND1 gene mutation
The mtDNA ND1 gene mutation (3571InC) present in 3571Cy 1 and 3571Cy22 cybrid cell lines
give rise to a ND1 truncated protein (Bonora et al., 2006), and the percentage of heteroplasmy
in the two cell lines is different. For that reason, we performed a western blot analysis for ND1
protein expression level in these cybrids, in cybrid Cy 24 that was used as control, as well as
in the parental cell line (143B). This experiment was done only once, making, the statistical
analysis not feasible.

54
The two cybrid cell lines (3571Cy 1 and 3571Cy 22) harbouring mtDNA ND1 gene mutation
had a decreased ND1 protein expression level, comparing with the Cy 24 cell line.
Additional, the 143B cell line presented a decrease in the ND1 protein levels compared with
the Cy 24 cell line (Figure 17 A and B). Concerning NDUFS3 protein expression level, a nDNA
encoded mitochondrial protein used as a control, no differences between the cell lines analysed
were observed, either if the protein levels (NDUFS3) were normalized for β-actin (cytoplasmic
protein) or SDHA (mitochondrial protein ) (Figure 17 C and D).
Figure 17. Western blot analysis for ND1 and NDUFS3 protein levels. A. western blot analysis for ND1 and NDUFS3 proteins,
and β-Actin protein as an endogenous control and SDHA protein as a control of mitochondrial loading. One immunoblot of two
experiments is shown. B. Quantification of ND1 protein levels normalized to SDHA protein expression levels. C. Quantification of
NDUFS3 protein levels normalized to SDHA protein expression level; D. Quantification of NDUFS3 protein levels normalized to β-
Actin protein expression level.

55
4.5 Analysis of global ATP levels
After the analysis of complex I activity, and once we have seen differences in its activity in
some of the cell lines analysed, we assessed the global production of ATP level in different cell
lines in study, aiming to verify if the differences in mitochondrial complex I activity is reflected
in the global levels of ATP production.
No statistically significant differences, in the global ATP levels, were observed between the cell
lines (CMPBR3, 3243Cy 9.7, 3571Cy 1, 3571Cy 22, Cy 24 and 143B Rho0) compared with the
parental cell line (143B) (Figure 18 A).
No statistically significant differences, in global ATP levels, were also observed in the cell lines
with mtDNA belonging to different haplogroups (Figure 18 B), however the haplogroup J
(CMPBR3) together with the 143B Rho0 (without mtDNA) cell lines showed a lower global ATP
level, compared to cell lines with mtDNA belonging to haplogroup X (143B) and haplogroup H
(Cy 24) (Figure 18 B). The data were normalized to 143B cell line.
In the cell lines with mtDNA belonging to the same haplogroup (Cy 24, 3571Cy 1, 3571 Cy 22
and 3243Cy 9.7), no statistically significant differences were observed (Figure 18 C), however
the 3243Cy 9.7 cybrid cell line presented the lowest global ATP level (Figure 18 D). The data
were normalized to Cy 24 cell line.

56
Figure 18. Analysis of global ATP levels. A. Overview of the global ATP levels in all cell lines compared with 143B cell line. B.
Analysis of the global ATP levels in cell lines harbouring mtDNA belonging to different haplogroups (143B- haplogroup X; CMPBR3-
haplogroup J; Cy 24-haplogroup H and 143B Rho0), normalized to143B cell line. C. Analysis of the global ATP levels in cell lines
belonging to the same haplogroup without (Cy 24) and with mtDNA mutations (3571Cy 1, 3571Cy 22 and 3243Cy 9.7), normalized
to Cy 24 cell line. RQ indicates relative quantification. Data correspond to three biological experiments done in triplicates. Bars,
standard deviation; columns, mean. Data were subjected to one-way ANOVA and a posterior Bennett and Tukey test.
4.6 Global metabolic profile of the cell lines
The global metabolic profile was achieved from an engaged service to the Metabolon®
Company.
Changes in metabolic pathways, namely changes in the metabolite levels, were observed in
mtDNA cells depleted (143B Rho0) or bearing mutations/variants in mtDNA (143B, CMPBR3
3243Cy 9.7 and 3571Cy 1) (see Table 4). The depletion of mtDNA leads to a blockage of TCA
cycle that can be seen by the alterations in the metabolite levels of this pathway. Furthermore,
all cell lines presented alterations in the levels of some of the metabolites involved in PTMs and
epigenetic landscape modifications, namely in the acetylation (acetyl-CoA) and methylation
(methionine and s-adenosylhomocysteine) compared with the parental cell line (143B).
The 143B Rho0, CMPBR3 and 3243Cy 9.7 cell lines showed alterations in the metabolite levels
involved in the methylation reactions. These cell lines presented a statistically significant
increase (p<0.05) in the levels of methionine and cysteine compared with the parental cell line
(143B) (Table 4).
Concerning the coenzyme A metabolism the 143B Rho0 cell line showed a statistically
significant increase (p<0.05) in the metabolites evaluated for this pathway, specifically the
coenzyme A and acetyl-CoA compared with the 143B cell line. Additionally the cell lines bearing
mtDNA mutations (3571Cy 1 and 3243Cy 9.7) also presented an increase levels in these
metabolites compared with the parental cell line (143B).

57
Regarding the redox states, all cell lines evaluated showed an increase in the metabolites
involved in the glutathione pathway, such as glutathione reductase (GSH), glutathione oxidase
(GSSG) and cysteine-glutathione disulfide, compared with the 143B cell line (Table 4).
This data, together with data on mitochondrial complex I activity, suggest that mtDNA
mutations/variants induces changes in global cell metabolism.
Table 4. Metabolite levels in the cell lines compared with 143B cell line.
Red and green shaded cells indicate p≤0.05 (red indicates that the mean values are significantly higher for that comparison; green
values significantly lower). Light red and light green shaded cells indicate 0.05<p<0.10 (light red indicates that the mean values
trend higher for that comparison; light green values trend lower). All data are normalized to Bradford protein assay values.
4.7 Analysis of DNA methylation status
4.7.1 Evaluation of 5-methylcytosine
The global levels of 5-methylcytosine (5-mC) of all cell lines were evaluated using an easy and
fast approach, a kit that allows the calculation of the percentage of global DNA methylation (5-
mC) in DNA isolated from all cell lines.

58
According to the results, either the presence of mtDNA mutations/variants as well as the
depletion of mtDNA are able to cause alterations in the global DNA methylation status of the
cell lines (Figure 19 A).
In the haplogroup analysis (when we compare the global 5-mC levels between the cell lines
with mtDNA belonging to different haplogroup) (Figure 19 B) and normalizing the data to
haplogroup X (143B), the haplogroup J (CMPBR3) showed the highest DNA methylation level.
The increase in the global 5-mC levels in the haplogroup J (CMPBR3) was statistically
significant (p<0.01) comparing to the haplogroup X (143B). Additionally, the 143B Rho0 cell
line, showed the lowest DNA methylation level, being the global 5-mC levels statistically
significant lower than those in the haplogroup X (143B) (p<0.001); J (CMPBR3) (p<0.001) and
H (Cy 24) (p<0.01) (Figure 19 B).
The cybrid lines harbouring the mutation in the mtDNA ND1 gene showed no differences in the
percentage of 5-mC compared and normalized to the Cy 24 (wt mtDNA) cell line. In the other
hand, the cybrid line with mtDNA tRNA Leu (UUR gene mutation) (3243Cy 9.7) presented a
statistically significant increase in the DNA methylation level, compared with the 3571Cy 1
(p<0.001), 3571Cy 22 (p<0.001) and the Cy 24 (p<0.001) cell lines (Figure 19 C). Data were
normalized for Cy 24 cell line.

59
Figure 19. Analysis of DNA methylation status. A. Overview of global percentage of 5-mC in all cell lines compared with 143B
cell line. B. Analysis of percentage of 5-mC in cell lines harbouring mtDNA belonging to different haplogroups (143B- haplogroup
X; CMPBR3- haplogroup J; Cy 24-haplogroup H and 143B Rho0). C. Analysis of percentage of 5-mC in cell lines harbouring mtDNA
belonging to the same haplogroup without (Cy 24) and with mtDNA mutations (3571Cy 1, 3571Cy 22 and 3243Cy 9.7). 5-mC
indicates 5-methylcytosine. Data correspond to three biological experiments done in triplicates. Bars, standard deviation; columns,
mean. The asterisks indicates the level of statistical significance (** p<0.01 and ***p<0.001). Data were subjected to one-way
ANOVA and a posterior Bennett and Tukey test.
4.7.2 Real time PCR for genes involved in the methylation cycle and DNA
methyltransferases.
4.7.2.1 GNMT, MAT1A, MAT2A and MAT2B genes mRNA expression
levels
Trying to unveil the possible causes for the differences in the methylation pattern between the
cell lines, we accomplished an evaluation of the mRNA levels, by real time PCR, for four of the
genes involved in the methylation cycle (GNMT, MAT1A, MAT2A and MAT2B) as well as two
DNA methyltransferases (DNMT1 and DNMT3B).
Concerning GNMT gene expression, a statistically significant decrease were observed in the
cell lines, harbouring mtDNA belonging to different haplogroups and/or different mtDNA
mutations, compared with the parental cell line (143B) (Figure 20 A).
When the mRNA levels were normalized for haplogroup X (143B), the haplogroups J
(CMPBR3), H (Cy 24) and the 143B Rho0 cell line showed a statistically significant decrease in
the GNMT gene expression compared with the haplogroup X (143B) [X (143B) vs J (CMPBR3)
p<0.001; X (143B) vs H (Cy 24) p<0.01 and X (143B) vs 143B Rho0 p<0.01) (Figure 29 B).
In the cell lines harbouring mutations in mtDNA, no statistically significant differences were
observed concerning the cybrid cell lines displaying the mtDNA ND1 gene mutation, compared
and normalized for Cy 24 (wt mtDNA) cell line. However the 3243Cy 9.7 cell line presented a

60
statistically significant increase (p<0.05) in the GNMT gene mRNA expression level compared
with 3571Cy 1 cell line that presented the lowest GNMT gene expression (Figure 20 C).
Figure 20. Real time PCR analysis for GNMT gene. A. Overview of GNMT gene mRNA levels in all the cell lines compared with
143B cell line. B. Analysis of GNMT gene mRNA levels in cell lines harbouring mtDNA belonging to different haplogroups, (143B-
haplogroup X; CMPBR3- haplogroup J; Cy 24-haplogroup H and 143B Rho0), normalized to 143B cell line. C. Analysis of GNMT
gene mRNA levels in cell lines belonging to the same haplogroup without (Cy 24) and with mtDNA mutations (3571Cy 1, 3571Cy
22 and 3243Cy 9.7), normalized to Cy 24 cell line. RQ indicates relative quantification. Data is normalized for HPRT gene
expression and correspond to 3 experimental replicas. Bars, standard deviation; columns, mean. The asterisks indicates the level
of statistical significance (*p<0.05; ** p<0.01 and ***p<0.001). Data were subjected to one-way ANOVA and a posterior Bennett
and Tukey test.
When the MAT1A mRNA levels were evaluated, an extremely low MAT1A gene expression
level was observed in all cell lines. However, a statistically significant decrease in the mRNA
levels of this gene was observed in all cell lines compared with the parental cell line (143B).
(Figure 21 A).

61
Concerning the haplogroups analysis, the haplogroup J (CMPBR3), H (Cy 24) and the143B
Rho0 cell line presented a statistically significant decrease in the MAT1A gene mRNA level,
when compared and normalized to haplogroup X (143B) [X (143B) vs J (CMPRB3) p<0.05; X
(143B) vs H (Cy 24) p<0.01 and X (143B) vs 143B Rho0 p<0.001] (Figure 21 B).
When the MAT1A mRNA levels were normalized for the Cy 24 (wt mtDNA) cell line, all cell
lines with mtDNA mutations showed a statistically significant reduction in the MAT1A gene
expression, compared with Cy 24 cell line (Cy 24 vs 3571Cy 1 p<0.001; Cy 24 vs 3571Cy 22
p<0.001 and Cy 24 vs 3242Cy 9.7 p<0.001) (Figure 30 C).
Figure 21. Real time PCR analysis for MAT1A gene. A. Overview of MAT1A gene mRNA levels in all cell lines compared with
143B cell line. B. Analysis of MAT1A gene mRNA levels in cell lines harbouring mtDNA belonging to different haplogroups, (143B-
haplogroup X; CMPBR3- haplogroup J; Cy 24-haplogroup H and 143B Rho0), normalized to 143B cell line. C. Analysis of MAT1A
gene mRNA levels in cell lines belonging to the same haplogroup without (Cy 24) and with mtDNA mutations (3571Cy 1, 3571Cy
22 and 3243Cy 9.7), normalized to Cy 24 cell line. RQ indicates relative quantification. Data is normalized for HPRT gene
expression and correspond to 3 experimental replicas. Bars, standard deviation; columns, mean. The asterisks indicates the level
of statistical significance (*p<0.05; ** p<0.01 and ***p<0.001). Data were subjected to one-way ANOVA and a posterior Bennett
and Tukey test.

62
MAT2A mRNA levels were evaluated in all the cell lines and no statistically significant
alterations in the MAT2A gene expression were observed compared with the parental cell line
(143B) (Figure 22 A). However the same cell lines, 3571Cy 22 and 143B Rho0, that presented
a statistically significant reduction in the MAT1A gene expression, presented an increased,
although not statistically significant, in the MAT2A mRNA levels. The 3571Cy 22 and the 143B
Rho0 cell lines had the tendency to show an inverse relationship between the expression of the
MAT1A and MAT2A genes (Figure 22 B and C).
Concerning the haplogroup analysis, no statistically significant differences were also observed
between the cell lines harbouring mtDNA belonging to different haplogroups (Figure 22 B).
In the analysis of the cell lines with mutations in mtDNA, the 3571Cy 22 cell line showed a
statistically significant higher MAT2A gene expression compared with the Cy 24 (p<0.05),
3571Cy 1 (p<0.01) and 3243Cy 9.7 (p<0.05) cell lines (Figure 22 C).

63
Figure 22. Real time PCR analysis for MAT2A gene. A. Overview of MAT2A gene mRNA levels in all cell lines compared with
143B cell line. B. Analysis of MAT2A gene mRNA levels in cell lines harbouring mtDNA belonging to different haplogroups, (143B-
haplogroup X; CMPBR3- haplogroup J; Cy 24-haplogroup H and 143B Rho0), normalized to 143B cell line. C. Analysis of MAT2A
gene mRNA levels in cell lines belonging to the same haplogroup without (Cy 24) and with mtDNA mutations (3571Cy 1, 3571Cy
22 and 3243Cy 9.7), normalized to Cy 24 cell line. RQ indicates relative quantification. Data is normalized for HPRT gene
expression and correspond to 3 experimental replicas. Bars, standard deviation; columns, mean. The asterisks indicates the level
of statistical significance (*p<0.05 and ** p<0.01). Data were subjected to one-way ANOVA and a posterior Bennett and Tukey
test.
Statistically significant variations in the MAT2B gene expression were observed between the
cell lines harbouring mtDNA belonging to different haplogroups and/or different mtDNA
mutations when compared with the 143B cell line (Figure 23 A).
When the MAT2B gene mRNA levels were normalized for haplogroup X (143B), the haplogroup
J (CMPBR3) presented the highest MAT2B gene expression and this difference was
statistically significant from haplogroup X (143B) (p<0.05), and the haplogroup H (Cy24)
(p<0.001). The haplogroup H (Cy 24) presented the lowest MAT2B gene expression level and
this difference was statistically significant comparing with the haplogroup X (143B) (p<0.01)
and with the 143B Rho0 (p<0.001) cell line. No differences in MAT2B gene mRNA expression
level were observed between the 143B and 143B Rho0 cell lines (Figure 23 B).
In the analysis of the cybrid lines with mtDNA mutations, all the cell lines showed a statistically
significant alterations in the MAT2B gene mRNA levels compared to Cy 24 cell line. The
3571Cy 22 and 3243Cy 9.7 cell lines presented a statistically significant increase in the MAT2B
gene expression when compared and normalized to Cy 24 cell line (Cy 24 vs 3571Cy 22
p<0.001; Cy 24 vs 3243Cy 9.7 p<0.001). The cell line displaying an mtDNA tRNA Leu (UUR) gene
mutation (3243Cy 9.7) revealed the highest MAT2B gene mRNA expression level and this

64
difference was statistically significant comparing with the 3571Cy 1 (p<0.001) and 3571Cy 22
(p<0.001) cell lines. Additionally the 3571Cy 1 cell line showed the lowest MAT2B gene
expression level , being this difference statistically significant comparing with 3571Cy 22 cell
line (p<0.001) (Figure 23 C).
Figure 23. Real time PCR analysis for MAT2B gene. A. Overview of MAT2B gene mRNA levels in all cell lines compared with
143B cell line. B. Analysis of MAT2B gene mRNA levels in cell lines harbouring mtDNA belonging to different haplogroups, (143B-
haplogroup X; CMPBR3- haplogroup J; Cy 24-haplogroup H and 143B Rho0), normalized to 143B cell line. C. Analysis of MAT2B
gene mRNA levels in cell lines belonging to the same haplogroup without (Cy 24) and with mtDNA mutations (3571Cy 1, 3571Cy
22 and 3243Cy 9.7), normalized to Cy 24 cell line. RQ indicates relative quantification. Data is normalized for HPRT gene
expression and correspond to 3 experimental replicas. Bars, standard deviation; columns, mean. The asterisks indicates the level
of statistical significance (*p<0.05; ** p<0.01 and ***p<0.001). Data were subjected to one-way ANOVA and a posterior Bennett
and Tukey test.

65
4.7.2.2 DNA methyltransferases: DNMT1 and DNMT3B genes mRNA
expression levels
In order to verify if the presence of mtDNA mutations/variants as well as absence of mtDNA
have some effect on the expression of DNA methyltransferases (DNMTs) we performed an
evaluation of the mRNA levels of two DNMTs: DNMT1 “maintenance methyltransferase” and
DNMT3B “de novo methyltransferase”.
Concerning the DNMT1 mRNA expression levels, statistically significant alterations were
observed, either in cell lines harbouring mtDNA belonging to different haplogroup and in cell
lines harbouring different mtDNA mutations, compared with the parental cell line (143B) (Figure
24 A).
When normalized for the mRNA levels of the haplogroup X (143B), the haplogroup J (CMPBR3)
showed the lowest DNMT1 gene expression and presented a statistically significant differences
from the haplogroup H (Cy 24) (p<0.05), X (143B) (p<0.001) and the 143B Rho0 cell line
(p<0.001). Additionally the haplogroup H (Cy 24) showed a statistically significant decrease
(p<0.05) in the DNMT1 gene expression compared to haplogroup X (143B) (Figure 24 B).
Regarding the cell lines harbouring mtDNA mutations, all of them showed a statistically
significant reduction in the DNMT1 gene mRNA levels when compared and normalized to Cy
24 cell line [Cy 24 vs 3571Cy 1 (p<0.01); Cy 24 vs 3571Cy 22 (p<0.05) and Cy 24 vs 3243Cy
9.7 (p<0.01)] (Figure 24 C).

66
Figure 24. Real time PCR analysis for DNMT1 gene. A. Overview of DNMT1 gene mRNA levels in all cell lines compared with
143B cell line. B. Analysis of DNMT1 gene mRNA levels in cell lines harbouring mtDNA belonging to different haplogroups, (143B-
haplogroup X; CMPBR3- haplogroup J; Cy 24-haplogroup H and 143B Rho0), normalized to 143B cell line. C. Analysis of DNMT1
gene mRNA levels in cell lines belonging to the same haplogroup without (Cy 24) and with mtDNA mutations (3571Cy 1, 3571Cy
22 and 3243Cy 9.7), normalized to Cy 24 cell line. RQ indicates relative quantification. Data is normalized for HPRT gene
expression and correspond to 3 experimental replicas. Bars, standard deviation; columns, mean. The asterisks indicates the level
of statistical significance (*p<0.05; ** p<0.01 and ***p<0.001). Data were subjected to one-way ANOVA and a posterior Bennett or
Tukey test.
With the purpose to understand if the cell lines in study display some alteration in the
expression of the DNMTs with activity of “de novo methyltransferase” we decided to study the
DNMT3B gene mRNA expression levels, by real time PCR.
Regarding the DNMT3B gene expression, the cell lines displaying different mtDNA mutations
(3243Cy 9.7, 3571Cy 1 and 3571Cy 22) revealed a statistically significant differences
compared with the parental cell line (143B) (Figure 25 A).
The haplogroup H (Cy 24) showed the highest DNMT3B gene expression level and this
difference was statistically significant comparing with the haplogroup J (CMPBR3) (p<0.05).
The data were normalized for to haplogroup X (143B) (Figure 25 B).
Concerning the cell lines with mtDNA mutations, all of them revealed a statistically significant
decrease in the expression of DNMT3B gene when compared and normalized to Cy 24 cell line
[Cy 24 vs 3571Cy 1 (p<0.001); Cy 24 3571Cy 22 (p<0.001) and Cy 24 vs 3243Cy 9.7
(p<0.001)] (Figure 25 C).

67
Figure 25. Real time PCR analysis for DNMT3B gene. A. Overview of DNMT3B gene mRNA levels in all cell lines compared
with 143B cell line. B. Analysis of DNMT3B gene mRNA levels in cell lines harbouring mtDNA belonging to different haplogroups,
(143B- haplogroup X; CMPBR3- haplogroup J; Cy 24-haplogroup H and 143B Rho0), normalized to 143B cell line. C. Analysis of
DNMT3B gene mRNA levels in cell lines belonging to the same haplogroup without (Cy 24) and with mtDNA mutations (3571Cy
1, 3571Cy 22 and 3243Cy 9.7), normalized to Cy 24 cell line. RQ indicates relative quantification. Data is normalized for HPRT
gene expression and correspond to 3 experimental replicas. Bars, standard deviation; columns, mean. The asterisks indicates the
level of statistical significance (** p<0.01 and ***p<0.001). Data were subjected to one-way ANOVA and a posterior Bennett and
Tukey test.
4.7.3 Evaluation of 5-hydroxymethylcytosine
With the purpose to evaluated if the global levels of 5-hydroxymethylcytosine (5-hmC), also
change in consequence of mtDNA mutations/variants (143B, CMPBR3, 3243Cy 9.7, 3571Cy
1, 3571Cy 22 and Cy 24) as well as absence of mtDNA (143B Rho0), we assessed the global
percentage of 5-hmC in the different cell lines in study.
Regarding the global levels of 5-hmC no statistical differences were observed between all the
cell lines compared with the parental cell line (143B) (Figure 26 A).

68
However, when normalized to haplogroup X (143B), the haplogroup J (CMPBR3) showed a
reduction, although not statistically significant in the percentage of 5-hmC compared with the
haplogroup X (143B) (Figure 26 B).
The cell lines harbouring the mtDNA ND1 gene mutation (3571Cy 1 and 3571Cy 22), showed
no alteration in the levels of 5-hmC, in contrast, the 3243Cy 9.7 cybrid cell line presented a
reduction, although not statistically significant, in the percentage of 5-hmC, when compared
and normalized for the Cy 24 cell line (Figure 26 C).
Figure 26. Analysis of global levels of 5-hydroxymethylcytosine. A. Overview of 5-hmC in all cell lines. B. Analysis of 5-hmC
in cell lines harbouring mtDNA belonging to different haplogroups (143B- haplogroup X; CMPBR3- haplogroup J; Cy 24-haplogroup
H and 143B Rho0). C. Analysis of 5-hmC in cell lines belonging to the same haplogroup without (Cy 24) and with mtDNA mutations
(3571Cy 1, 3571Cy 22 and 3243Cy 9.7). 5-hmC indicates 5-hydroxymethylcytosine. Data correspond one experiment done in
duplicates. Bars, standard deviation; columns, mean. Data were subjected to one-way ANOVA and a posterior Bennett and Tukey
test.
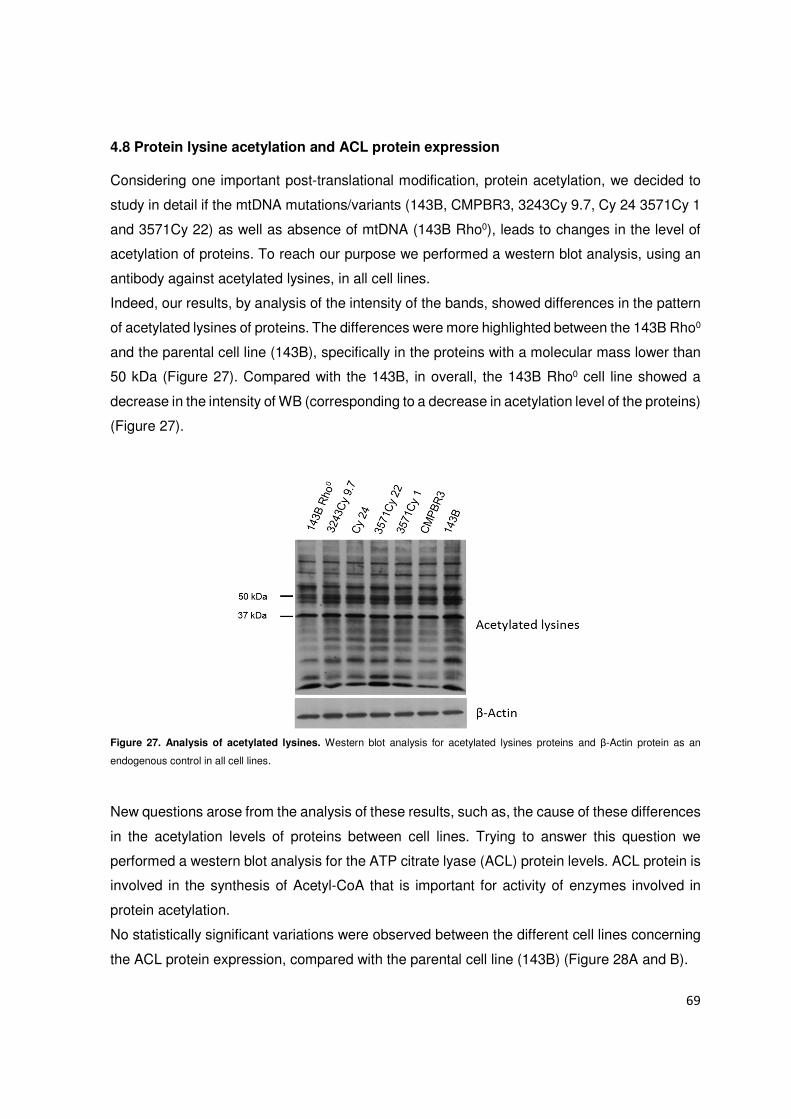
69
4.8 Protein lysine acetylation and ACL protein expression
Considering one important post-translational modification, protein acetylation, we decided to
study in detail if the mtDNA mutations/variants (143B, CMPBR3, 3243Cy 9.7, Cy 24 3571Cy 1
and 3571Cy 22) as well as absence of mtDNA (143B Rho0), leads to changes in the level of
acetylation of proteins. To reach our purpose we performed a western blot analysis, using an
antibody against acetylated lysines, in all cell lines.
Indeed, our results, by analysis of the intensity of the bands, showed differences in the pattern
of acetylated lysines of proteins. The differences were more highlighted between the 143B Rho0
and the parental cell line (143B), specifically in the proteins with a molecular mass lower than
50 kDa (Figure 27). Compared with the 143B, in overall, the 143B Rho0 cell line showed a
decrease in the intensity of WB (corresponding to a decrease in acetylation level of the proteins)
(Figure 27).
Figure 27. Analysis of acetylated lysines. Western blot analysis for acetylated lysines proteins and β-Actin protein as an
endogenous control in all cell lines.
New questions arose from the analysis of these results, such as, the cause of these differences
in the acetylation levels of proteins between cell lines. Trying to answer this question we
performed a western blot analysis for the ATP citrate lyase (ACL) protein levels. ACL protein is
involved in the synthesis of Acetyl-CoA that is important for activity of enzymes involved in
protein acetylation.
No statistically significant variations were observed between the different cell lines concerning
the ACL protein expression, compared with the parental cell line (143B) (Figure 28A and B).

70
In the haplogroup analysis once again no statistically significant variations were observed.
Although the haplogroup J (CMPBR3), H (Cy 24) and the 143B Rho0 cell lines tend to present
an increase in ACL protein expression levels when compared and normalized to the haplogroup
X (143B) (Figure 28C). The results obtained for the cybrids with mtDNA mutations revealed no
differences in ACL protein expression levels, when compared and normalized to Cy 24 cell line
(Figure 28D).
Figure 28. Analysis of ACL protein expression. A. western blot analysis for the ACL protein and β-Actin protein as an
endogenous control. B. Overview of ACL protein expression levels in all cell lines, normalized to 143B cell line. C. Quantification
of ACL protein levels in cell lines harbouring mtDNA belonging to different haplogroups, (143B- haplogroup X; CMPBR3-
haplogroup J; Cy 24-haplogroup H and 143B Rho0), normalized to 143B cell line. D. Quantification of ACL protein expression
levels in cell lines belonging to the same haplogroup without (Cy 24) and with mtDNA mutations (3571Cy 1, 3571Cy 22 and 3243Cy
9.7), normalized to Cy 24 cell line. A representative immunoblot of three experiments is shown. Data are expressed as density of
ACL band per the density of the β-actin. Bars, standard deviation; columns, mean. Data were subjected to one-way ANOVA and
a posterior Bennett and Tukey test.
4.9 Study of acetylated proteins
So far, the results of this work demonstrate the presence of differences in the level of acetylated
lysines proteins between the cell lines. Since the most pronounced differences were observed

71
between the parental cell line (143B) and the143B Rho0 cell line we decided to perform a more
detailed analysis in order to reveal these differences and also to identify which proteins were
differentially acetylated between these two cell lines. In order to accomplish this aim we decided
to perform a two dimensional gels (2-D gels) analysis in the two cell lines and a posterior
analysis for acetylated proteins and coloration of the 2-D gels with coomassie blue.
We started by the evaluation of the differences between the intensity of the spots in the 2-D
gels of the two cell lines and we were able to identify twenty one spots with differences in the
intensity or presence/absence between the two cell lines. The 143B Rho0 cell line showed a
global decrease in spots intensity with some exceptions, namely in the spot identified as 13.
Each spot with different intensity or presence/absence between the two cell lines were
confirmed in at least two experiments (Figure 29 A and B).
Figure 29. Analysis of acetylated protein levels. A. Two dimensional analysis for the acetylated proteins in 143B cell line. B.
Two dimensional analysis of acetylated proteins levels in 143B Rho0 cell line. A representative immunoblot of three experiments
is shown.
With the purpose to identify which protein(s) corresponding to each spot, we performed a
coloration of the 2-D gels with coomassie blue (Figure 30) and we were able to identify all the
twenty one spots observed in three immunoblots performed for each cell line in the gel stained
with coomassie blue (Figure 31). Additionally, comparing the 21 selected 2-D gels spots with
the spots from coomassie blue gels, no relevant differences were observed concerning the
protein expression between the two cell lines. These results indicate that the differences
observed in 2-D gels were related with differences in the acetylation levels and not with
alteration in the expression of these proteins (Figure 30).

72
After the identification of the spots we performed a mass spectrometry analysis to identify each
protein from behind each spot. It was possible to identify proteins in all samples with statistical
confidence, except in sample 6. In the samples 3, 14, 15 it was possible to identify two proteins
and in the sample 19 it was possible to identify three proteins in the same spot (see table 3).
Figure 30. Analysis of two dimensional gels stained with coomassie blue for the 143B and 143B Rho0 cell lines. A. Two
dimensional analysis for the total cell lysates of the 143B cell line. B. Two dimensional analysis for the total cell lysates of the 143B
Rho0 cell line. A representative immunoblot of two experiments is shown.
Figure 31. Identification of proteins in two dimensional gel stained with coomassie blue corresponding to the 143B
sample. 1- 40S ribosomal protein SA (RPSA); 2- L-lactate dehydrogenase B (LDHB); 3- Lupus La protein (SSB) and alpha enolase
(ENOI); 4, 5, 6- Transketolase (TKT); 7,8- Pyruvate kinase (PKM); 9, 11- Phosphoribosylaminoimidazole carboxylase (PAICS);
10- Alpha-enolase (ENOI); 12- Annexin A2 (ANXA2); 13-Glyceraldehyde-3-phosphate dehydrogenase (GAPDH); 14- X-ray repair
complementing defective repair in Chinese hamster cells 6 (ku autoantigen 70kDa) and Heat shock protein 75 kDa (TRAP1); 15-
X-ray repair cross-complementing protein (XRCC) and Heat shock protein 75kDa (TRAP1); 16- Isoform 2 of Rab GDP dissociation
inhibitor beta (GDI2); 17- Actin, cytoplasmic 1 (ACTB); 18- Elongation factor 2 (EEF2); 19- F-actin-capping protein subunit alpha-
1(CAPZA1), isoform 2 of Pyruvate dehydrogenase E1 (PDHB) and 60s acidic ribosomal protein (RPLP0); 20- Eukaryotic translation
initiation factor 3 subunit I (eIF3I); 21- Eukaryotic initiation factor 4A-I(eIF4AI).

73
Table 5. List of proteins identified by mass spectrometry
kDa indicates kilo Daltons
In order to confirm that the differences observed are due to differences in acetylation and not
in the protein levels, we performed a western blot analysis for some of the proteins identified in
the mass spectrometry analysis. The protein levels of Glyceraldehyde-3-phosphate

74
dehydrogenase (GAPDH), alpha enolase (ENOI) and eukaryotic initiation factor 4A I (eIF4AI)
were quantified (data not shown) and no differences were found in the protein levels between
the 143B and 143B Rho0 or all other cell line (Figure 32).
Regarding the differences observed in the acetylation levels of the identified proteins, we
decided to confirm some of these data with another technique and an immunoprecipitation for
acetylated lysines was performed. After the immunoprecipitation of acetylated proteins, using
the antibody against acetylated lysines, an immunoblot with an antibody against GAPDH
protein, previous identified as the spot number 13, was performed in the two cell line.
Indeed, we were able to confirm the increase level in acetylation of GAPDH protein presented
in the 143B Rho0 cell line (Figure 33).
Figure 32. Analysis for the eIF4AI, GAPDH and ENOI proteins. Western blot analysis for the eukaryotic initiation factor 4AI
(eIF4AI), glyceraldehyde-3-phosphate dehydrogenase (GAPDH) and alpha enolase (ENOI) and α-tubulin as an endogenous
control in all cell lines.
Figure 33. Immunoprecitation for Glyceraldehyde-3-phosphate dehydrogenase. IP indicates immunoprecipitates; Ctrl.
Control; Lys.-Total cell lysates; The control was performed using an polyclonal antibody against TOM-20.

75
4.10 Sirt3 and SOD-2 protein expression, regulation of activation
Since the levels of acetylated lysines can be regulated by the activity of protein deacetylases,
we decided to study the expression levels of one of the cell deacetylases, and we decided to
choose Sirt3, since a Sirt3 acts on mitochondrial proteins.
With the purpose to verify if mtDNA mutations/variants as well as absence of mtDNA, affects
the Sirt3 protein expression and if Sirt3 protein levels leads to changes in SOD-2 protein
expression (SOD-2 is a Sirt3 target protein) and activity (SOD-2K68), whose deacetylation its
related with activation, we evaluated by western blot, the protein levels of Sirt3, SOD-2 and
SOD-2k68.
No statistically significant differences in the Sirt3 protein expression levels, were observed
between the cell lines compared with parental cell line (143B) (Figure 34 A and B).
When normalized for Cy 24 (wt mtDNA) cell line, the cybrid lines with mtDNA ND1 gene
mutation, showed no statistically significant differences in Sirt3 protein expression, by contrast
the 3243Cy 9.7 cell line exhibited an increased in Sirt3 protein expression level, being this
difference statistically significant when compared with 3571Cy 1 (p<0.05) and 3571Cy 22
(p<0.01) cell lines.

76
Figure 34. Analysis of Sirt3 protein expression. A. Western blot analysis for Sirt3 protein, and β-Actin protein as an endogenous
control. B. Overview of Sirt3 protein expression levels in all cell lines normalized to 143B cell line. C. Quantification of Sirt3 protein
expression levels in cell lines harbouring mtDNA belonging to different haplogroups, (143B- haplogroup X; CMPBR3- haplogroup
J; Cy 24-haplogroup H and 143B Rho0), normalized to 143B cell line. D. Quantification of Sirt3 protein expression levels in cell
lines belonging to the same haplogroup without (Cy 24) and with mtDNA mutations (3571Cy 1, 3571Cy 22 and 3243Cy 9.7),
normalized to Cy 24 cell line. A representative immunoblot of three experiments is shown. Data are expressed as density of Sirt3
band per the density of the β-actin. Bars, standard deviation; columns, mean. The asterisks indicates the level of statistical
significance (*p<0.05; ** p<0.01). Data were subjected to one-way ANOVA and a posterior Bennett and Tukey test.
Concerning SOD-2 (a Sirt3 target) protein expression, although the 143B Rho0 cell line showed
a slight increase in Sirt3 protein expression level, a statistically significant increased (p<0.05)
in SOD-2 protein expression and a statistically significant decrease (p<0.01) in SOD-2k68
protein level were observed, when compared with the parental cell line (143B) (Figure 35 C).
Additionally, all cell lines showed an increase, not statistically significant, in SOD-2 protein
expression compared with the 143B cell line (Figure 35 A and B).
When normalized for Cy 24 (wt mtDNA) cell line, the cybrid lines with mtDNA mutations showed
no statistically significant alterations in SOD-2 protein expression (Figure 35 D).

77
Concerning the activity of SOD-2 (SOD-2k68) all cell lines, with the exception of CMPBR3 and
the 3243Cy 9.7 cell lines, exhibited a statistically significant decrease in the acetylation level of
SOD-2k68 compared with parental cell line (143B) (Figure 20 A and B).
Moreover, in the haplogroups analysis we observed a statistically significant decrease in the
acetylation level of k68 at SOD-2 in the haplogroup H (Cy 24) (p<0.001) and 143B Rho0 cell
line (p<0.001) compared to the haplogroup X (143B) and J (CMPBR3) when normalized for the
haplogroup X (143B) (Figure 34 C).
In the analysis of cybrid lines harbouring mtDNA mutation, all cybrid cell lines showed a
statistically significant increase in acetylation of k68 at SOD-2 when compared and normalized
to Cy 24 cell line [Cy 24 vs 3571Cy 1 (p<0.001); Cy 24 vs 3571Cy 22 (p<0.05) and Cy 24 vs
3243Cy 9.7 (p<0.001)] (Figure 35D). Moreover, the 3243Cy 9.7 exhibited the highest
acetylation levels of SOD-2k68, and exhibited a statistically significant difference when
compared with the 3571Cy 1 (p<0.001) and the 3571Cy 22 (p<0.001) cell lines. The cell lines
presenting mtDNA ND1 gene mutation revealed statistically significant differences between the
level of acetylation of SOD-2k68, being the 3571Cy1 the cell line the one that exhibit a
statistically significant increase in the acetylation of SOD-2k68 compared to the 3571Cy 22
(p<0.001) cell line (Figure 35 D).

78
Figure 35. Analysis of SOD-2 and SOD-2K68 protein expression. A. western blot analysis for proteins SOD-2, SOD-2K68 and
β-Actin protein as an endogenous control. B. Overview of SOD-2 and SOD-2K68 protein expression levels in all cell lines
normalized to 143B cell line. C. Quantification of SOD-2 and SOD-2K68 protein expression levels in cell lines harbouring mtDNA
belonging to different haplogroups, (143B- haplogroup X; CMPBR3- haplogroup J; Cy 24-haplogroup H and 143B Rho0),
normalized to 143B cell line. D. Quantification of SOD-2 and SOD-3K68 protein expression levels in cell lines belonging to the
same haplogroup without (Cy 24) and with mtDNA mutations (3571Cy 1, 3571Cy 22 and 3243Cy 9.7), normalized to Cy 24 cell
line. A representative immunoblot of three experiments is shown. Data are expressed as density of SOD-2 or SOD-2k68 band per
the density of the β-actin. Bars, standard deviation; columns, mean. The asterisks indicates the level of statistical significance
(*p<0.05; ** p<0.01 and ***p<0.001). Data were subjected to one-way ANOVA and a posterior Bennett and Tukey test.

79
Chapter 5 Discussion

80

81
5.1 Mitochondrial energy metabolism and the epigenetics
Many vital cellular parameters are controlled by mitochondria, namely, the regulation of energy
production (ATP), β-oxidation of fatty acids, metabolism of amino acids and lipids, SAM
production, modulation of oxidation-reduction (redox) states, regulation of the NAD+/NADH and
FAD+ /FADH2 ratios, generation of ROS and contribution to cytosolic biosynthetic precursors
such as cytosolic acetyl-CoA. Changes in these parameters can impinge on biosynthetic
pathways, cellular signal transduction pathways, transcription factors and chromatin structure
to shift the cell from a quiescent, differentiated state to an actively proliferating one (Desler and
Marcker, 2011; Wallace, 2012; Wallace and Fan, 2010). The circular mtDNA is more
susceptible to DNA damages in comparison to nDNA. Importantly, mtDNA molecules are not
protected by histones, they are supported with only “rudimentary” DNA repair and are localized
in close proximity to the ETC which continuous generates ROS. Thus, the mutation rate of
mtDNA has been reported being up to 10-15 folds higher than that observed in nDNA in
response to DNA damaging agents (Desler and Marcker, 2011). The mitochondrial activity is
largely dependent on environmental availability of nutrients and their conversion to usable
energy that takes place by the conversion, by mitochondrion and glycolysis, of energy rich
compounds, such as carbohydrates and fats, into ATP, acetyl-CoA, SAM, and NADH. ATP,
acetyl-CoA, SAM, and NAD+/NADH ratio, in turn, are the high-energy substrates for protein
(including histones) phosphorylation, acetylation and deacetylation reactions, and DNA and
protein methylation, thus contributing to regulation of several pathways and epigenetic process
of chromatin remodelling (Wallace and Fan, 2010).
Mutations in the mtDNA, most of the time induce defects in OXPHOS. Mitochondrial
dysfunction, and especially mitochondrial dysfunction caused by mutations in mtDNA have
been implicated in a wide range of age related pathologies, including cancer, diabetes and
degenerative disorders (Figure 36A and B) (Tuppen et al., 2010). Indeed, mitochondrial gene
defects can result in virtually all of the symptoms associated with the common complex
diseases, confirming the importance of mitochondrial bioenergetics in health. In addition, it was
reported that mtDNA variants, are able to regulate several intracellular functions and to
influence global methylation levels and nuclear gene expression, having a role in human aging
and longevity. (D’Aquila et al., 2013). Either way, OXPHOS efficiency and/or the activation of
signalling pathways, regulates the substrate levels needed for PTMs and epigenetic regulation
and thus the epigenetic landscape of the cell (DeBerardinis and Thompson, 2012; Lu and
Thompson, 2012).

82
The epigenome has been hypothesized to provide the interface between the environment and
the regulation of nDNA gene expression. Indeed, epigenetic mechanisms are essential for the
normal development and maintenance of tissue-specific gene expression patterns in mammals.
Disruption of epigenetic processes can lead to altered gene expression seen in a variety of
human disorders including aging, cancer and neurodegenerative diseases among others
(Hanahan and Weinberg, 2011). In fact, global changes in the epigenetic landscape of the cell
are a hallmark of cancer (Hanahan and Weinberg, 2011). Additionally, the similarity in
symptoms between mitochondrial and epigenomic diseases suggest that they possible have a
common pathophysiology (Hanahan and Weinberg, 2011; Wallace, 2009).
A

83
Figure 36. Genotype: phenotype correlations in human mitochondrial disease. A .The circular, double-stranded human
mitochondrial genome is depicted with sites of common mtDNA mutations highlighted. Associated clinical presentations are also
highlighted. CPEO, chronic progressive external ophthalmoplegia; LHON, Leber hereditary optic neuropathy; LS, Leigh syndrome;
MELAS, mitochondrial myopathy, encephalopathy, lactic acidosis, and stroke-like episodes; MERRF, myoclonic epilepsy and
ragged red fibres; MILS, maternally inherited Leigh syndrome; NARP, neurogenic weakness, ataxia, and retinitis pigmentosa; PS,
Pearson syndrome (Tuppen et al., 2010). B. Human mitochondrial genome showing several mutations described in different
malignancies (adapted from Chatterjee et al., 2006).
5.2 Cell lines
Several studies have demonstrated a relationship of defective complex I and OXPHOS, with
the mtDNA ND1 gene mutations; however, an epigenetic analysis has never been done, to our
knowledge. Inactivation of complex I, the most studied OXPHOS complex and one of the most
commonly affected in human tumours, would allow us to understand the relation between
complex I deficiency and PTMs including epigenetics changes.
On the other hand, it would be interesting to compare the effect of an OXPHOS dysfunction
due to defect in a specific mitochondrial complex with that of a defect in all the complex.
By using cybrid cell lines with different mtDNA mutations/variants, wt mtDNA, as well as a cell
line without mtDNA, we were able disclose a putative role of mtDNA mutations in cell
metabolism, in OXPHOS dysfunction as well as in cell epigenetics landscape regulation.
B

84
With our cell line models, cell lines harbouring wt mtDNA belonging to different haplogroups
(143B, CMPBR3 and Cy24), cell lines with different mtDNA mutations (3243Cy 9.7, 3571Cy 1
and 3571Cy 22) and a cell line without mtDNA (143B Rho0), we were able to study the effect
of mitochondrial dysfunction, in a specific mitochondrial complex and as well as in all
mitochondrial complex, on cell metabolism, on PTMs an epigenetic landscape changes and in
gene expression changes.
5.3 Complex I activity
Complex I is the gatekeeper of the respiratory chain and catalyses the first step of NADH
oxidation. Complex I activity elevates the NAD+/NADH ratio and translocates protons across
the inner mitochondrial membrane, which ultimately leads to energy production. MtDNA
mutations in genes encoding complex I subunits, including the mtDNA ND1 gene, are
frequently found in a variety of malignancies (Chatterjee et al., 2006; Máximo et al., 2009).
The NAD+/NADH redox balance are important for the activity of Sirtuins that use the NAD+ as
a co-factor to deacetylate substrates ranging from histones to transcriptional regulators, and
ultimately alters the acetylation status of the cell. Through this activity, several studies have
been demonstrating that Sirtuins regulate important biological processes, such as apoptosis,
cell differentiation, energy transduction or glucose homeostasis (Li and Kazgan, 2011).
Furthermore, the mitochondrial complex I activity and NAD+/NADH balance, have been
associated with cancer progression (Santidrian et al., 2013). However, it is largely unknown
how alterations in complex I and in the cellular NAD+/NADH redox balance affect
tumourigenesis and cancer progression. Recently, it was demonstrated that complementation
of a truncated mutation in the gene encoding mitochondrial ND1, showed that a functional
enzyme was required to perform the glycolytic shift during the hypoxia response and to induce
a Warburg effect in vitro and in vivo, fostering cancer progression (Calabrese et al., 2013).
In this study, we found that mtDNA mutations, absence of mtDNA or even mtDNA belonging to
different haplogroups are able to affect mitochondrial complex I activity and induce
mitochondrial dysfunctions. Actually, we found that cybrid cell lines with mutations in mtDNA
ND1 gene (3571Cy 1 and 3571Cy 22) as well as in mtDNA tRNA Leu (UUR ) gene (3243Cy 9.7)
exhibit a lower mitochondrial activity that of a cybrid cell line with wt mtDNA belonging to
haplogroup H (Cy 24). Furthermore, we observed statistically significant differences, in complex
I activity, between cell lines with wt mtDNA belonging to different haplogroups, suggesting that
differences in OXPHOS activity exist between several mitochondrial variants. Nevertheless,

85
several studies, report contradictory results concerning the effect of mtDNA variants in
OXPHOS efficiency. Actually, it has been reported that mtDNA molecules belonging to different
haplogroups may differ in the degree of OXPHOS activity (Gómez-Durán et al., 2010; Hinttala
et al., 2010; Pello et al., 2008), and in other hand there is also evidence that different mtDNA
haplogroups may maintain similar efficiency in OXPHOS performance, through the fine-tuning
of ROS production and mitochondrial biogenesis (Carelli et al., 2002).
Cells depleted of mtDNA (143B Rho0) retain functional mitochondria, except lacking OXPHOS,
because of the absence of all the mitochondrial encoded proteins. Indeed, by the analysis of
our results, the 143B Rho0 cell line showed the lowest level of complex I activity. Interesting,
143B Rho0 cell line showed similar complex I activity (lower, but not statistically significant)
compared with the haplogroup X (143B), although lower than those of cell line lines from
haplogroup H (Cy 24) and J (CMPBR3). These data suggest that haplogroup X is less efficient
in complex I activity than haplogroups H and J.
The 143B cell line, presented a decrease in the expression of mitochondria encoded proteins
such as, COXII and ND1, analysed be western blot. This reduction in the protein levels may be
responsible for the decrease in OXPHOS as well as in complex I activity.
The complex I activity have been also proposed to have a central role in the regulation of
longevity (Calabrese et al., 2013; Kayser et al., 2004). Additionally, different haplogroups have
been related with regulation of lifespan (De Benedictis et al., 1999). The possible role played
by mtDNA variants in longevity may be related with the complex I activity. From our results,
the haplogroup J (CMPBR3) and H (Cy 24) showed the higher complex I activity. Indeed
mtDNA haplogroup J has been reported to increase the individual chance to attain longevity.
To the best of our knowledge, the increase in complex I activity observed in different
haplogroups and the link to longevity may be due to the increase the levels of NAD+. Actually,
the NAD+ acts as co-factor of Sirtuins whose activity have been also related with the longevity
(Brown et al., 2013; Domínguez-Garrido et al., 2009; Fontana et al., 2010; Kanfi et al., 2012).
It is possible that these four matters, haplogroups, complex I activity, Sirtuins activity and
longevity, are related, but at our knowledge there is no studies trying to relate this four matters.
Regarding the cell lines with mutations in the mtDNA (3243Cy 9.7, 3571Cy 1 and 3571Cy 22),
they showed a reduction in complex I activity, evidencing that the mutations in mtDNA ND1
gene and mtDNA tRNA Leu (UUR) gene, commits the complex I activity.
The ND1 3571InsC mutation, generates a premature stop codon at amino acid 101 of ND1
protein, which, as consequence, will be truncated. The truncated protein is not assembled in
complex I, thus the decrease in complex I activity observed in the cell lines displaying 3571InsC

86
mutation (3571Cy 1 and 3571Cy 22), results from a decrease in the incorporation of normal
ND1 protein in complex I. In fact, we observed a reduction of ND1 protein expression levels in
the cell lines harbouring the ND1 3571InsC mutation. This decreased in the incorporation of
ND1 proteins result in complex I enzymatic deficiencies, that can be reflected in the decrease
in complex I activity. Moreover some studies, reported that cell lines harbouring the mtDNA
ND1 frame-shift mutation (3571InsC), exhibit complex I enzymatic deficiencies and reduced
assembly of complex I (Porcelli et al., 2009). With the purpose to study if our cell lines
harbouring the mtDNA ND1 frame-shift mutation (3571InsC) revealed differences in complex I
assembly capacity, we performed the analysis of NDUFS3 (another complex I protein, encoded
by nDNA) protein expression, and no differences were observed, between the cell lines with
and without mtDNA ND1 gene mutation. This datum suggest that the mtDNA ND1 frame-shift
mutations (3571InsC), does not change complex I assembly. Indeed, other studies used the
complex I subunit NDUFS3 to monitor the progression of this subunit (ND1) into the mature
holo-enzyme (Vogel et al., 2007). The absence of differences, between cell lines displaying
and not displaying the mtDNA ND1 3571InsC mutation, in complex I assembly, may be due to
the fact that our cell line have a maximum of 80% of heteroplasmic mtDNA ND1 frame-shift
mutations (3571InsC).
The decrease, in the complex I activity, observed in the 3243Cy 9.7 cell line, is due to a mtDNA
tRNA Leu (UUR) gene mutation which result in globally impairment of mitochondrial protein
synthesis and affects all OXPHOS complexes containing mtDNA-encoded subunits (i.e.,
complexes I, III, IV, and V) (King et al., 1992).
5.4 Global ATP levels
Mitochondria are the principal generators of cellular ATP through OXPHOS, incorporating the
electron-transferring respiratory chain (complexes I–IV) and the ATP synthase (complex V).
Since mtDNA encodes for several key respiratory chain components, cells displaying different
mtDNA may be present changes in their ATP levels (Figure 37). Indeed, we observed that
mitochondria variants and mitochondria dysfunction caused either by mutations in mtDNA or
absence of mtDNA exhibited alteration in OXPHOS activity, namely in the complex I activity.
Differences, concerning ATP production capacity, have been reported in mitochondrial
diseases cause by mtDNA mutations, as well as in individuals with mtDNA belonging to
different haplogroups (presence of mitochondrial variants) (Bellizzi. et al., 2012; Kenney et al.,
2013; Naini and Sue, 2006). The differences in the ATP production reported in mitochondrial

87
diseases have been associated with mutations in nDNA and in mtDNA that cause respiratory
chain dysfunction (Taylor and Turnbull, 2005).
The haplogroup J has been reported as showing lower ATP production capacity compared with
other haplogroups (Martínez-Redondo et al., 2010). This means that each haplogroup can have
a unique bioenergetic signature. In fact, in our results, the haplogroup J presented a decrease,
although not statistically significant, in the ATP levels. Interesting, this lower ATP production
capacity does not correlate with complex I activity, since we observed an increase, although
not statistically significant, in complex I activity. Since we performed an analysis of global ATP
levels we cannot establish a link between the global ATP levels and the complex I activity. The
mitochondrial ATP levels should be assessed in order to better clarify this findings.
Nevertheless, some studies have found an association of the haplogroup J and alterations in
the expression of uncoupling proteins. These proteins are responsible for the leak of protons
generated in ETC and subsequent leads to a decrease of ATP and ROS production and to an
increase in heat production (Martínez-Redondo et al., 2010; Wallace, 2005). It would be
interesting to study the expression levels of some of these proteins, namely uncoupling protein
2 (UCP2) (the best studied), in our cell lines, in order to verify if the absence of correlation
between complex I activity and ATP production is related with changes in the expression of
uncoupling proteins.
Since mtDNA encodes for several key respiratory chain components, cells in which mtDNA has
been depleted (143B Rho0 cells) are completely deficient in mitochondrial respiratory activity
and thus in mitochondrial ATP synthesis. Indeed, 143B Rho0 cell line presented a decrease,
although not statistically significant, in the ATP levels. Nevertheless, it has been reported that,
the cells devoid of mtDNA, readjust their metabolism in order to improve ATP synthesis. These
readjustments, involve, for instance, increased to glycolysis to function efficiently as an
important source of cellular ATP, in the absence of OXPHOS in Rho0 cells (Martinus et al.,
1993).
The cell line with the mtDNA tRNA Leu (UUR) gene mutation (3243Cy 9.7) also presented a
decrease, although not statistically significant, in the ATP levels. This cell line has a pronounced
defect in the mitochondrial respiratory activity, due to the global impairment of the mitochondrial
proteins that lead to alterations in all mitochondrial encoded OXPHOS complexes. Indeed, a
number of studies, have been reporting a significant correlation between the reduction in ATP
synthesis and the mutational load, in cells containing a mtDNA tRNA Leu (UUR) gene mutation,
related to the MELAS (mitochondrial myopathy, encephalopathy, lactic acidosis, and stroke-
like episodes) having the 3243A>G mutation (Cotán et al., 2011; Naini and Sue, 2006).

88
Figure 37. The role of the mitochondrial genome in energy generation. This highlights the importance of the mitochondrial
genome in contributing polypeptide subunits to the five enzyme complexes that comprise the oxidative phosphorylation (OXPHOS)
system within the inner mitochondrial membrane the site of ATP synthesis (Adapted from Taylor and Turnbull, 2005).
5.5 Global metabolic profile of the cell lines
The mitochondrial function is fundamental to metabolic homeostasis. In addition to converting
the nutrient flux, through the OXPHOS, into the energy molecule ATP, the mitochondria
generate intermediates for biosynthesis and ROS that serve as a secondary messenger to
mediate signal transduction and metabolism. Alterations of mitochondrial function have been
observed in various metabolic disorders, including aging and cancer, among other (Cheng and
Ristow, 2013). However, the mechanisms responsible for mitochondrial changes and the
pathways leading to metabolic disorders remain to be defined.
So far, our results showed that mtDNA variants and mtDNA mutations presented alterations in
the OXPHOS complex I activity and ATP production. In fact in cancer cells, the metabolic shift
may be due to defects in OXPHOS that force cancer cells towards glycolysis (Máximo et al.,
2009). Conceptually, any alteration that disrupts the OXPHOS system will have a direct effect
on the cell’s metabolism affecting the cell metabolic profile.
The last 10 years have revealed a host of functions for metabolites and metabolic pathways
that could not have been predicted from a conventional understanding of biochemistry. As a
result it is no longer possible to view metabolism merely as a self-regulating network operating
independent of other biological systems. Metabolism also affects cell signalling by providing
substrates for PTMs that modulate protein trafficking, localization, and enzyme activity
(DeBerardinis and Thompson, 2012).

89
In order to better understand the effect of mitochondrial variants and mitochondrial mutations
in the metabolic alterations, we performed the global metabolic profile of the different cell lines
in study. In fact, the cell lines analysed, presented changes in the levels of the metabolites
involved in the PTMs, namely in acetylation (acetyl-CoA and CoA) in methylation (methionine
and s-adenosylhomocysteine) compared with the parental cell line. Indeed, some studies have
been reporting that mitochondrial diseases, as a results of mitochondrial dysfunction, can alter
the function of several proteins via reversible or irreversible PTMs (Karve and Cheema, 2011;
Ryan et al., 2012; Wu et al., 2010). Interestingly, the cell devoid of mtDNA (143B Rho0) does
not showed a decrease in the levels of NAD+, although the absence of OXPHOS to regulates
the NAD+/NADH ratio. Rho0 cells require the addition of pyruvate and other oxidants to growth
media that are reduced by the plasma membrane electron transport contributing to maintain
both growth and cytosolic NAD+ availability (Larm et al., 1994). Actually, NAD+ homeostasis, in
Rho0 cells is required for Sirtuins activation because these cells maintain Sirtuin levels as wild
type cells (Broadley et al., 2011; Crane et al., 2013).
Regarding the redox sates, all cell lines evaluated showed an increase in the metabolites
involved in the glutathione pathways, compared with the parental cell line. Since, the reduced
glutathione (GSH) protects against oxidative damage, but is transformed in the process to its
oxidized form (GSSG) (Schafer and Buettner, 2001) it is likely that mitochondria dysfunction
caused, either by mutations in mtDNA (ND1 and tRNA Leu (UUR) mutations) or absence of mtDNA
(143B Rho0), generate an increased amount of ROS and the GSH system in such instances is
stressed to a higher degree than in normal mitochondrial function.
5.6 DNA Methylation status of the cell lines
The importance of the interaction between mitochondrial and nuclear genomes has also
emerged from studies on epigenetic changes and, more specifically, on DNA methylation of
cytosines. DNA methylation functions as a switch that turns relevant genes on and off, a
mechanism that is crucial in development, differentiation and homeostasis (Deaton and Bird,
2011). There is currently extensive ongoing research aiming the identification of specific
changes in DNA methylation. Actually, DNA methylation has been confirmed as an important
player in human disease, mediating genomic instability, silencing of tumour-suppressor genes
and hyper-methylation of CpG island shores that may lead to the inception and progression of
cancer (Baylin and Jones, 2011; Kriaucionis and Bird, 2003).

90
In fact, the efficiency of mitochondrial energy producing machinery and the mitochondrial
metabolism can modulate the activity of MAT, the enzyme responsible for SAM synthesis from
L-methionine and ATP (Pajares et al., 1992; Wallace, 2009; Wallace and Fan, 2010). Lastly,
mitochondria contribute to epigenetics modification through the folate metabolism and the
regulation of the metabolic switch between SAM and nucleotide synthesis through the one
carbon Cycle. Besides, the dysfunction in mitochondrial activity may have direct effects on
epigenetic markers and consequently, disrupt gene expression patterns and thus leading to
changes in cellular functions.
By the methylation analysis of the cell lines, we observed that mitochondrial variants and
mitochondria dysfunction caused either by mutations in mtDNA or absence of mtDNA,
presented alterations in the DNA methylation pattern, and also in the expression of genes
involved in the one carbon metabolism. The cells devoid of mtDNA (143B Rho0) presented a
reduction in the methylation levels and a decrease in the expression of the GNMT and MAT1A
genes, but do not showed alterations in the levels of 5-hmC. The depletion of mtDNA leads to
a blockage of TCA cycle, leading to the accumulation of succinate. 5-Hydroxymethylcytosine
is an oxidative product of 5-mC, catalysed by the TET family of enzymes and their activity can
be inhibited by the succinate. The accumulation of succinate observed in the 143B Rho0, may
leads to the inhibition of TET proteins, leading to the hydroxylation of 5-mC to 5-hmC by a TET-
independent mechanism. However, oxidation of DNA has traditionally been considered a DNA
damage event (Poulsen, 2005). Furthermore, oxidation of 5-mC appears to be a step in several
active DNA demethylation pathways, which may be important for normal processes, as well as
global hypomethylation during cancer development and progression (Kraus et al., 2012).
In fact, the depletion of mtDNA in cancer cells with chemical or genetic treatments has been
found to induce alterations in the DNA methylation pattern in 2-9% of the CpG islands surveyed.
In most of the studies, with cells devoid of mtDNA, DNA hypomethylation is frequent finding.
When mtDNA is reintroduced to the mtDNA-deficient cancer cell, 30% of the hypomethylated
sitres become remethylated. This results indicated that there is a direct relationship between
mitochondrial functional and epigenomic DNA methylation in cancer cells (Smiraglia et al.,
2008), however, we do not know the exactly mitochondria signal that triggers epigenetic
changes in the nucleus. Turk et al., reported that the presence of 8-hydroxyl-2-deoxyguanosine
(8-OH-dG) in CpG nucleotide, the most studied DNA base lesion induced by oxidative stress
in aging, diminishes the ability of DNA methyltransferase to methylate the adjacent cytosine
(Wei et al., 2001). In addition, Valinluck et al. demonstrated that the oxidation of guanosine in
8-OH-dG and/or 5-mC in 5-hmC in a CpG dinucleotide significantly reduces the binding affinity
91
of methyl-CpG binding domain proteins (MBDs) to their recognition sequences, thus leading
alterations in transcription (Turk et al., 1995). In addition, the intracellular redox state is also
able to modulate the activity of MATs (Pajares et al., 1992; Valinluck et al., 2004).
In other hand, we observed an increase in the 5-mC levels in the cell lines, harbouring the
mtDNA tRNA Leu (UUR) gene mutation and in the haplogroup J (CMPBR3). The haplogroup J
presented a decrease in the expression of GNMT, MAT1A and DNMT1, compared with other
haplogroups, the only increase in the mRNA levels observed for the haplogroup J was the
MAT2B gene. Bellizzi et al reported the increase in the methylation levels of haplogroup J
compared with other haplogroups, but the reason for this increase in the level of 5-mC is not
yet well understood (Bellizzi et al., 2012). Additionally, the haplogroup J have been extensively
ascribed to low OXPHOS efficiency, given that the variants clustered in the J haplogroup mainly
fall within mitochondrial complex I and complex III. Curiously, the cell line harbouring the
mtDNA tRNA Leu (UUR) gene mutation, presented similar results for the expression on the
evaluated genes, with exception of MAT1A gene, that was less expressed in the 3243Cy 9.7
cell line, compared with the haplogroup J (CMPBR3). It is possible that the mechanism that
allows the haplogroup J to increase the methylation levels were the same presented in the
3243Cy 9.7 cell line. Indeed, we cannot establish a link between the changes in the pattern of
DNA methylation and the expression of the evaluated genes, in spite of the two cell lines show
an increase in the expression of the MAT2B gene.
There are some possible explanations for the increase in the methylation levels observed in
these cell lines, one of them is changes in the demethylation pathway. The 3243Cy 9.7 and the
haplogroup J (CMPBR3) were the only cell lines that showed a reduction in the levels of 5-
hmC.
For a better understanding of the reasons that leads to the increase in the DNA methylation
levels of these two cell line, an evaluation of the activity of the enzymes involved in the one
carbon metabolism should be performed and also an evaluation of the expression and activity
of the TET enzymes.
Alterations in the expression of genes involved in one carbon metabolism, were also observed
in the cell lines displaying the mtDNA ND1 gene mutation (3571Cy 1 and 3571Cy 22), although
these cell lines do not exhibited alterations in the 5-mC and 5-hmC levels. These observations
reinforce the hypothesis that the alterations in the methylation pattern, due to alterations in
mtDNA, may be related, not only with alterations in the gene expression, but also with other
mechanisms.

92
Our data suggest that the mitochondrial dysfunctional can induce aberrant DNA methylation
patterns, and in this way contrite to the aetiology of several diseases, such as cancer, aging
and neurodegenerative disorders.
5.7 Protein lysine acetylation and ACL protein expression
The importance of acetylation is strengthened by studies showing that deregulated acetylation
is tightly linked to major diseases, such as cancer. In addition, it is well accepted that cancer
cells shows a metabolic profile different from that of normal cells (Xu et al., 2013). The
mitochondrial alterations in cancer cell leads to unique metabolic signatures.
To coordinate the metabolic network, a general coordinator should be associated with all or
most of the metabolic enzymes, and it should sense metabolic signals. Such general
coordinator of metabolism is so far not identified (Xu et al., 2013). Acetylation has the potential
to meet both criteria, and thus to be a general coordinator of metabolism. All KATs use acetyl-
CoA as an acetyl group donor. Acetyl-CoA can be produced from glucose by the enzyme ACL,
which generates acetyl-CoA from mitochondria-derived citrate. ACL dependent production of
acetyl-CoA for lipogenesis is important for the proliferation of glycolytically converted tumour
cells. Additionally, several studies, have been reporting that ACL is the major source of acetyl-
CoA for histone acetylation (Wellen et al., 2009; Zaidi et al., 2012).
In fact, we observed differences between the cell lines in the pattern of acetylated lysines,
which may be related with the differences in the mtDNA which assigned unique metabolic
signatures, confirmed through the results from the global metabolic analysis. However, we do
not observe differences in ACL protein expression levels between the cell lines. Indeed, the
cell line devoid of mtDNA (143B Rho0), does not presented a decrease in ACL protein
expression, although it showed a general reduction in the protein acetylation levels. These
results may be related with the fact that the depletion of mtDNA results in oxidative stress
causing increase in the lipid peroxidation, and to keep on balance the synthesis and
degradation of fatty acids, they must maintain the levels of acetyl-CoA through ACL expression
regulation. Actually, Delsite et al, reported the increase in peroxidation of lipids in cells depleted
of mtDNA (Delsite et al., 2002). Additionally, to support this hypothesis, the activity of ACL
enzyme should be determined, as well as the levels and activity of other proteins responsible
for the synthesis of acetyl-CoA, namely the AceCS1 and AceCS2.
Through mass spectrometry analysis, we were able to identified nineteen proteins showing
differences in acetylation levels between the two cell lines analysed (143B and 143B Rho0).

93
We identified differences in acetylation levels in proteins involved in a number of cellular
processes, including metabolism, protein synthesis, cellullar architecture and DNA repair.
As mentioned above, protein acetylation can have numerous functional consequences
including changes in: enzyme activation/inactivation; protein DNA interaction; protein stability;
protein subcellular localization; and in specific functional complex formation (Figure 38). The
143B Rho0 cell line has a unique metabolic signature due to the absence of mtDNA, leading to
alterations in metabolism and other cellular processes. Several studies have been reporting
that mtDNA depletion, results in altered expression of nuclear genes involved in signalling,
cellular architecture, metabolism, cell growth and differentiation, and apoptosis (Delsite et al.,
2002; Jahangir Tafrechi et al., 2005). Changes in the pattern of protein acetylation, due to
changes in cell metabolism, signalling and other mechanisms, represent a more versatile and
fast mechanism for cell adapted to various stimuli, than changes in protein expression.
Figure 38. Acetylation is involved in multiple cellular functions (Xu and Zhao, 2011).
From the analysis of the nineteen proteins identified, we were able to confirm the absence of
changes in protein expression for three of them, eIF4AI, ENOI and GAPDH, between the 143B
and 143B Rho0 cell lines. This datum implies that the changes observed in the 2-D gels, were
due to changes in the degree of protein acetylating and not changes in the expression of the
core protein.

94
eIF4AI protein is an ATP-dependent helicase that are required for efficient ribosome binding,
and delivery of the mRNA template, process involved in the protein synthesis. Protein synthesis
is a complex, tightly regulated process in eukaryotic cells and its deregulation is a hallmark of
many cancers. Translational control occurs primarily at the rate-limiting initiation step, where
ribosomal subunits are recruited to template mRNAs through the concerted action of several
eukaryotic initiation factors (eIFs). Protein synthesis, appears to play an important role in
tumour initiation and progression, since its overexpression can cooperate with oncogenes to
accelerate cell transformation in cell lines and in animal models, and its levels are elevated in
many human cancers (Lee and Pelletier, 2012; Nasr et al., 2013). However, the exact role of
eIF4I acetylation in not well understood. Nevertheless, we observed a decrease of eIF4I
acetylation in 143B Rho0 cell line, and this change in acetylation may represent an important
role in the disruption of normal protein synthesis in consequence of mitochondrial dysfunction.
ENOI is a key glycolytic enzyme in the cytoplasm of eukaryotic cells and is considered a
multifunctional protein. ENOI catalyses the dehydration of 2-phosphoglycerate to
phosphoenolpyruvate, in the last steps of the catabolic glycolytic pathway, and is also
expressed on the surface of several cell types, where it acts as a plasminogen receptor,
concentrating proteolytic plasmin activity on the cell surface (Pancholi, 2001). In addition, to
this function as a glycolytic enzyme and plasminogen receptor, ENOI appears to have other
cellular functions and subcellular localizations, distinct from its well-established function in
glycolysis. Alterations in ENOI has been identified in diverse human pathologies, suggesting
that it could be part of a group of universal sensors that response to multiple different stimuli
(Díaz-Ramos et al., 2012). One of these stimuli may be the mitochondrial alterations that have
been reported in a variety of human disorders. Thus, ENOI could be considered as a marker
of pathological stress in a high number of diseases.
Some of the more interesting and challenging issues regarding ENOI multifunction, that need
to be addressed, are the role of ENOI as an inductor of intracellular signalling pathways, and
the role of PTMs of ENOI and the implications on its subcellular distribution and function, and
at this subject, the acetylation could provide an important clue to better understanding its
multifunctional properties.
In the past two decades, the glycolic enzyme GAPDH that was once considered
“housekeeping” protein has been shown as being involved in many cellular processes in
addition to the role it as in glycolysis, including: DNA repair, tRNA export, membrane fusion
and transport, cytoskeletal dynamics and cell dead. Additionally, it has been reported that
GAPDH is translocated to the nucleus, upon exposure to stressors, where participates in cell

95
death/dysfunction, and this translocation, to the nucleus, is mediated by acetylation at lysine
160 of GAPDH (Tristan et al., 2011). In fact, we observed an increase in the acetylation level
of GAPDH in 143B Rho0 cells. This cell line present a high oxidative stress due to the absence
of mtDNA, and the increase in the acetylation levels of GAPDH could be a response to the cell
to these high levels of stress.
Furthermore, acetylation of the glycolytic/gluconeogenic enzyme GAPDH controls glucose flux
in S.enterica, in which GAPDH acetylation favours glucose consumption through the induction
of glycolysis, and GAPDH deacetylation, favours glucose production through gluconeogenesis.
Despite a number of acetylated lysine residues in GAPDH were identified, their role in the
control of glucose metabolism in mammalians is unknown. Understand if the acetylation of
GAPDH also control glucose flux, may provide important clues to unveil some of the metabolic
alterations reported in cancer in consequence of mitochondria dysfunction (Guan and Xiong,
2011).
Regarding the role of GAPDH as a “housekeeping” protein, and taking in account our data,
GAPDH protein expression represented a good "housekeeping", once no differences were
observed in the protein expression between the cell lines with different alterations in mtDNA
although, the same is not true regarding the levels of protein acetylation.
Despite the large number acetylated proteins identified in mammalian cells, the number of
KATs and KDACs is surprisingly small. The discrepancy between the number of acetylated
proteins and the number of acetylation regulators suggests a highly interconnected acetylation
regulation network and highlights the importance of the acetylation in cell physiology (Xu et al.,
2013).
Mitochondrial dysfunction, due to mutations in mtDNA can lead to changes in the levels of
some co-factors, namely NAD+ and acetyl-CoA of deacetylases, such as, Sirtuins, and thereby
affecting protein acetylation. The acetylation is likely to be a coordinator of both cell signalling
and cell metabolism, because of its versatile role in transcriptional and metabolic regulation
(Figure 39). A better understanding of the role of acetylation, in metabolic coordination as well
as the molecular understanding of the mechanisms by which it act, may provide new ways for
the prevention and control of human tumours.

96
Figure 39. Link between acetylation, tumorigenesis and the Warburg effect. The interconnections between gene transcription,
metabolism and metabolites are all coordinated by acetylation, deregulated coordination may alter both gene transcription and cell
metabolism, two of the causal factors of the Warburg effect and tumorigenesis (Xu et al., 2013).
5.8 Sirt 3 and SOD-2 protein expression, regulation of activation
At this point, we found that mitochondrial dysfunction, caused either by mtDNA mutations or
absence of mtDNA, as well as the presence of some mitochondrial variants (different mtDNA
haplogroups) induces changes in cell metabolic profile, complex I activity, DNA methylation
and protein acetylation. To test if mitochondrial variants and mitochondrial dysfunction
influence the cellular stress response by modulating Sirt3 protein expression, we evaluated the
expression of the Sirt3 in our cell lines. Sirt3 is a sensor of the energetic and redox, dependent
on NAD+, this analysis make sense.
We did not found differences in the cells with mtDNA belonging to different haplogroups, as
well as in 143B Rho0 cell line, concerning Sirt3 protein expression. The difference found
between the cell line displaying the mtDNA tRNA Leu (UUR) gene mutation (3243Cy 9.7) and the
cell lines harbouring the mtDNA ND1 gene mutation (3571Cy 1 and 3571Cy 22), suggest that
these mutations induces different cellular stress in the mitochondria. In fact, the 3243Cy 9.7
cell line presented a higher level of ROS production (data not shown) and it is known that the
increase of ROS levels stimulates Sirt3 transcription (Chen et al., 2011).
Considering the results observed in 143B Rho0 cells, which are intrinsically exposed to very
stressful conditions due to the absence of mtDNA, and consequently to mitochondrial
dysfunctions, it may seem inconsistent that these cells keeps the Sirt3 protein levels. One

97
possible explanation, already proposed by D’Aquila et al, is that Rho0 cells adopt a series of
mechanisms to compensate their intrinsic oxidative stress status.
Mitochondrial manganese superoxide dismutase (SOD-2) is an important antioxidant enzyme,
and SOD-2 deficiency is associated with several human diseases (Miao and Clair, 2009). SOD-
2 is acetylated at Lys 68 and this acetylation decreases its activity. Sirt3 binds to SOD-2,
deacetylating and activating it (Figure 40). 143B Rho0 cell line was the only cell line, in study,
that presented a significant increase in the SOD-2 protein expression level. This observation
may be related with the oxidative stress induced SOD-2 expression, and is believed to be an
important cellular defence mechanism against oxidative stress.
The increase in SOD-2 protein expression levels and activity observed in 143B Rho0 cell line,
enforces the hypothesis that these cells have an intrinsic mechanism to deal with oxidative
stress. In fact, several studies have been reporting the resistance of mtDNA-depleted cells to
apoptosis induced by oxidative stress (Ferraresi et al., 2008; Park et al., 2004; Quinzii et al.,
2010).
The cell lines displaying mutations in mtDNA presented a lower activity of SOD-2, these data
may be explained by the absence of an intrinsic mechanism to handle with oxidative stress in
these cells. Mitochondria dysfunction, due to mtDNA mutations may cause damage in SOD-2
protein and thus inhibiting their activity. What we observe in 143B Rho0 cells may be a well-
balanced mechanism between the overproduction of ROS and the SOD2 activity.
Figure 40. A model on SIRT3-mediated SOD2 activation (Adapted from Qiu et al., 2010).

98

99
Chapter 6 Conclusion and future perspectives

100

101
6.1 Conclusion
In summary, there is a strong motivation to explore the epigenetic changes that occur as
consequence of alterations in mtDNA, given the extensive number of mitochondrial diseases.
These epigenetic changes may serve to explain the observed phenotypic heterogeneity,
variable penetrance and environmental triggers in this group of disorders. Indeed, the
interrelationship between mtDNA and cell metabolism have an essential role in the
maintenance of the levels of essential co-factors for epigenetic mechanisms, such as DNA
methylation and protein acetylation.
In this work, we showed that mtDNA variants and mitochondrial dysfunction, caused either by
mtDNA mutations or absence of mtDNA, leads to changes in OXPHOS efficiency, in ATP
production and in the levels of several metabolites from several metabolic pathways.
Furthermore, we showed that changes in the levels of metabolites, namely changes in the level
of those that serve as co-factor of several enzymes involved in epigenetic regulation and PTMs,
disturb the epigenetic landscape of the cell. Thus, the data presented suggest that
mitochondrial dysfunction lead cells to reset their cellular programme in order to maintain cell
homeostasis and viability.
We have demonstrated that nDNA methylation pattern can be modified as a consequence of
mtDNA variants and mitochondria dysfunction caused either by mutations in mtDNA or
absence of mtDNA. These data suggest the presence of direct communication routes, between
the mitochondrial and the nuclear genomes, since we observed changes in the expression of
nuclear encoded genes in cell lines with mtDNA mutations.
Mitochondrial dysfunction caused by depletion of mtDNA leads the cells to readjust several
cellular processes in order to survive and maintain cell homeostasis. Actually, these cells
presented changes concerning acetylation of proteins involved in several cellular processes,
such as metabolism, protein synthesis, cellular architecture and DNA repair. The acetylation of
proteins can act as a coordinator of both cell signalling and metabolism, because of it versatile
role in transcriptional and metabolic regulation.
Actually, we found differences concerning DNA methylation and proteins PTMs, as well as
changes in the expression of nuclear genes in cell lines with mtDNA mutations/variants and
DNA depletion, suggesting that mitochondrial dysfunction may have a huge impact in cell
physiology.

102
Thus, it matters now realize to what extent these changes in the programme of the cell can be
used to deal with diseases in which mitochondrial dysfunction is common, namely cancer
diabetes and degenerative diseases.
6.2 Future perspectives
While performing the work presented in this thesis, several questions were raised concerning
validations, and complementary work should be performed in order to clarify some issues. In
order to confirm the changes in complex I activity, especially in the cell lines harbouring the
mutations in mtDNA and the cell line devoid of mtDNA, more suitable analysis should be
performed, namely to perform, in particular, to study the complex I activity using mitochondrial
extracts, and even to study the activity of all the OXPHOS complexes. The use mitochondrial
extracts, allow to overcoming some putative differences in the loading of mitochondrial proteins
between the cell line samples, and the same is true for ATP production levels analysis.
Actually, concerning ATP production and in order to establish an accurate relationship between
complex I activity and ATP production, we should measure, not only the global ATP levels, but,
also the production of mitochondrial ATP, as well the complex V activity.
Although we observed differences concerning the DNA methylation status in different cell lines,
a whole genome methylation analysis would be a better hypothesis to confirm the differences
observed, since we have access to the list of genes differentially methylated between cell lines.
This information can be crucial to better understand the link between mutation/variants in
mtDNA and changes in the DNA methylation pattern.
It would be interesting to analyse if the different cell lines harbouring mtDNA variants and
mitochondrial dysfunction, caused either by mtDNA mutations or absence of mtDNA, would
have some alteration in the activity of the enzymes involved in the one carbon metabolism.
These results may provide new clues for the differences observed in the methylation status of
different cell lines.
Histone lysine methylation is an integral part of the PTMs of histone tails, and is important for
chromatin organization and gene transcription regulation. In order to clarify the reason behind
the differences between the expression of the genes related with the one carbon metabolism,
the study of the repressive marks of histone should be performed. Additionally, because histone
repressive marks can promote DNA methylation and vice versa, it should be interesting to study
the temporal relationship of histone and DNA methylation.
The lack of biological replicates in the 5-hmC analysis should also be filled. It will be very
important confirm if the cell lines that showed the highest methylation levels are the same that

103
present a reduction of the 5-hmC levels. Moreover, the activity and protein expression levels
of the enzymes involved in the hydroxylation of 5-mC to 5-hmC, the TET enzymes, should be
accessed. This information could be important to understand the relationship between the
balance of methylation and demethylation pathways as well the final outcome.
Concerning the rate of protein acetylation, it will be important to confirm the differences found
between the cell lines, namely for those in which absence of differences in the protein
expression levels were confirmed: ENOI and eIF4AI.
Furthermore, in the analysis of the acetylated proteins, we did not found differences in the
acetylation of histones. A more sensitive and directed study should be performed in order to
access the putative role of mitochondrial dysfunction in this process.
In addition, to provide more evidences to support the hypothesis, that acetylation is likely a
coordinator of both cell signalling and metabolism, the same analysis that was performed, in
the 143B and 143B Rho0 cell lines, concerning protein acetylation, should be carried out for the
other cell lines.
In order to confirm the presence, in the 143B Rho0 cell line, of an intrinsic mechanism to deal
with their intrinsic stress status, the activity of Sirt3 should also be carried out.

104

105
Chapter 7 References

106

107
7.1- References
Ahn, B., Kim, H., Song, S., Lee, I.H., Liu, J., Vassilopoulos, A., Deng, C., and Finkel, T. (2008). A role for the mitochondrial deacetylase Sirt3 in regulating energy homeostasis. Proceedings of the National Academy of Sciences of the United States of America 105, 14447–14452.
Allfrey, G., Faulkner, R., and Mirsky, A.E. (1964). Acetylation and methylation of histones and their possible role in the regulation of RNA synthesis. Proceedings of the National Academy of Sciences 51, 786–794.
Andrews, R.M., Kubacka, I., Chinnery, P.F., Lightowlers, R.N., Howell, D.M., and Neil, T.& (1999). Reanalysis and revision of the Cambridge reference sequence for human mitochondrial DNA. Nature Genetics 23, 3965.
Baylin, S., and Jones, P. (2011). A decade of exploring the cancer epigenome—biological and translational implications. Nature Reviews Cancer 11, 726–734.
Baysal, B.E. (2007). A recurrent stop-codon mutation in succinate dehydrogenase subunit B gene in normal peripheral blood and childhood T-cell acute leukemia. PloS One 2, e436.
Baysal, B.E. (2008). Clinical and molecular progress in hereditary paraganglioma. Journal of Medical Genetics 45, 689–694.
Bellizzi., D., D’Aquila., P., Giordano, M., and Passarino, A.M.& G. (2012). Global DNA methylation levels are modulated by mitochondrial DNA variants. Epigenomics 4, 17–27.
De Benedictis, G., Rose, G., Carrieri, G., De Luca, M., Falcone, E., Passarino, G., Bonafe, M., Monti, D., Baggio, G., Bertolini, S., et al. (1999). Mitochondrial DNA inherited variants are associated with successful aging and longevity in humans. FASEB Journal : Official Publication of the Federation of American Societies for Experimental Biology 13, 1532–1536.
Bensaad, K., Tsuruta, A., Selak, M. a, Vidal, M.N.C., Nakano, K., Bartrons, R., Gottlieb, E., and Vousden, K.H. (2006). TIGAR, a p53-inducible regulator of glycolysis and apoptosis. Cell 126, 107–120.
Berger, S.L. (2007). The complex language of chromatin regulation during transcription. Nature 447, 407–412.
Berwick, D., Hers, I., and Heesom, K. (2002). The identification of ATP-citrate lyase as a protein kinase B (Akt) substrate in primary adipocytes. Journal of Biological Chemistry 277, 33895–33900.
Biology, C., and Mazurek, S. (2011). Pyruvate kinase type M2 : A key regulator of the metabolic budget system in tumor cells. The International Journal of Biochemistry & Cell Biology 43, 969–980.
Bitterman, K.J., Anderson, R.M., Cohen, H.Y., Latorre-Esteves, M., and Sinclair, D. a (2002). Inhibition of silencing and accelerated aging by nicotinamide, a putative negative regulator of yeast sir2 and human SIRT1. The Journal of Biological Chemistry 277, 45099–45107.
Bluemlein, K., Grüning, N., and Feichtinger, R. (2011). No evidence for a shift in pyruvate kinase PKM1 to PKM2 expression during tumorigenesis. Oncotarget 2, 393–400.
Böhm, V., Hieb, A.R., Andrews, A.J., Gansen, A., Rocker, A., Tóth, K., Luger, K., and Langowski, J. (2011). Nucleosome accessibility governed by the dimer/tetramer interface. Nucleic Acids Research 39, 3093–3102.

108
Bonora, E., Porcelli, A.M., Gasparre, G., Biondi, A., Ghelli, A., Carelli, V., Baracca, A., Tallini, G., Martinuzzi, A., Lenaz, G., et al. (2006). Defective oxidative phosphorylation in thyroid oncocytic carcinoma is associated with pathogenic mitochondrial DNA mutations affecting complexes I and III. Cancer Research 66, 6087–6096.
Broadley, K., Larsen, L., Herst, P.M., Smith, R. a J., Berridge, M. V, and McConnell, M.J. (2011). The novel phloroglucinol PMT7 kills glycolytic cancer cells by blocking autophagy and sensitizing to nutrient stress. Journal of Cellular Biochemistry 112, 1869–1879.
Brown, K., Xie, S., Qiu, X., Mohrin, M., Shin, J., Liu, Y., Zhang, D., Scadden, D.T., and Chen, D. (2013). Report SIRT3 Reverses Aging-Associated Degeneration. Cell Reports 3, 319–327.
Bungard, D., Fuerth, B.J., Zeng, P.-Y., Faubert, B., Maas, N.L., Viollet, B., Carling, D., Thompson, C.B., Jones, R.G., and Berger, S.L. (2010). Signaling kinase AMPK activates stress-promoted transcription via histone H2B phosphorylation. Science 329, 1201–1205.
Burnichon, N., Brière, J.-J., Libé, R., Vescovo, L., Rivière, J., Tissier, F., Jouanno, E., Jeunemaitre, X., Bénit, P., Tzagoloff, A., et al. (2010). SDHA is a tumor suppressor gene causing paraganglioma. Human Molecular Genetics 19, 3011–3020.
Cai, J., Sun, W.M., Hwang, J.J., Stain, S.C., and Lu, S.C. (1996). Changes in S-adenosylmethionine synthetase in human liver cancer: molecular characterization and significance. Hepatology 24, 1090–1097.
Calabrese, C., Iommarini, L., Kurelac, I., Calvaruso, M.A., Capristo, M., Lollini, P.-L., Nanni, P., Bergamini, C., Nicoletti, G., Giovanni, C. De, et al. (2013). Respiratory complex I is essential to induce a Warburg profile in mitochondria-defective tumor cells. Cancer & Metabolism 1, 11.
Cantó, C., Sauve, A. a, and Bai, P. (2013). Crosstalk between poly(ADP-ribose) polymerase and sirtuin enzymes. Molecular Aspects of Medicine.
Carelli, V., Vergani, L., Bernazzi, B., Zampieron, C., Bucchi, L., Valentino, M.L., Rengo, C., Torroni, A., and Martinuzzi, A. (2002). Respiratory function in cybrid cell lines carrying European mtDNA haplogroups: implications for Leber’s hereditary optic neuropathy. Biochimica Biophysica Acta 1588, 7–14.
Chandra, D., and Singh, K.K. (2011). Genetic insights into OXPHOS defect and its role in cancer. Biochimica et Biophysica Acta 1807, 620–625.
Chatterjee, a, Mambo, E., and Sidransky, D. (2006). Mitochondrial DNA mutations in human cancer. Oncogene 25, 4663–4674.
Chen, H., and Costa, M. (2009). Iron-and 2-oxoglutarate-dependent dioxygenases: an emerging group of molecular targets for nickel toxicity and carcinogenicity. Biometals 22, 191–196.
Chen, Y., Zhang, J., Lin, Y., Lei, Q., Guan, K.-L., Zhao, S., and Xiong, Y. (2011). Tumour suppressor SIRT3 deacetylates and activates manganese superoxide dismutase to scavenge ROS. EMBO Reports 12, 534–541.
Cheng, Z., and Ristow, M. (2013). Mitochondria and metabolic homeostasis. Antioxidants & Redox Signaling 19, 240–242.

109
Cheng, T., Sudderth, J., Yang, C., Mullen, A.R., Jin, E.S., and Matés, J.M. (2011). Pyruvate carboxylase is required for glutamine-independent growth of tumor cells. Proceedings of the National Academy of Sciences 208, 8674–8679.
Christofk, H.R., Vander Heiden, M.G., Wu, N., Asara, J.M., and Cantley, L.C. (2008). Pyruvate kinase M2 is a phosphotyrosine-binding protein. Nature 452, 181–186.
Cotán, D., Cordero, M.D., Garrido-Maraver, J., Oropesa-Ávila, M., Rodríguez-Hernández, A., Gómez Izquierdo, L., De la Mata, M., De Miguel, M., Lorite, J.B., Infante, E.R., et al. (2011). Secondary coenzyme Q10 deficiency triggers mitochondria degradation by mitophagy in MELAS fibroblasts. FASEB Journal : Official Publication of the Federation of American Societies for Experimental Biology 25, 2669–2687.
Crane, F.L., Navas, P., Low, H., Sun, I.L., and de Cabo, R. (2013). Sirtuin activation: a role for plasma membrane in the cell growth puzzle. The Journals of Gerontology. Biological Sciences 68, 368–370.
D’Aquila, P., Rose, G., Bellizzi, D., and Passarino, G. (2013). Epigenetics and aging. Maturitas 74, 130–136.
Dang, C. V (1999). c-Myc Target Genes Involved in Cell Growth , Apoptosis , and Metabolism. Molecular and Cellular Biology 19.
Dang, L., White, D.W., Gross, S., Bennett, B.D., Bittinger, M. a, Driggers, E.M., Fantin, V.R., Jang, H.G., Jin, S., Keenan, M.C., et al. (2010). Cancer-associated IDH1 mutations produce 2-hydroxyglutarate. Nature 465, 966.
Dang, W., Steffen, K.K., Perry, R., Dorsey, J. a, Johnson, F.B., Shilatifard, A., Kaeberlein, M., Kennedy, B.K., and Berger, S.L. (2009). Histone H4 lysine 16 acetylation regulates cellular lifespan. Nature 459, 802–807.
Deaton, A., and Bird, A. (2011). CpG islands and the regulation of transcription. Genes & Development 25, 1010–1022.
DeBerardinis, R.J., and Thompson, C.B. (2012). Cellular metabolism and disease: what do metabolic outliers teach us? Cell 148, 1132–1144.
DeBerardinis, R.J., Mancuso, A., Daikhin, E., Nissim, I., Yudkoff, M., Wehrli, S., and Thompson, C.B. (2007). Beyond aerobic glycolysis: transformed cells can engage in glutamine metabolism that exceeds the requirement for protein and nucleotide synthesis. Proceedings of the National Academy of Sciences of the United States of America 104, 19345–19350.
Delsite, R., Kachhap, S., Anbazhagan, R., Gabrielson, E., and Singh, K.K. (2002). Nuclear genes involved in mitochondria-to-nucleus communication in breast cancer cells. Molecular Cancer 1, 6.
Deribe, Y.L., Pawson, T., and Dikic, I. (2010). Post-translational modifications in signal integration. Nature Structural & Molecular Biology 17, 666–672.
Desler, C., and Marcker, M. (2011). The importance of mitochondrial DNA in aging and cancer. Journal of Aging Research 2011.
Díaz-Ramos, A., Roig-Borrellas, A., García-Melero, A., and López-Alemany, R. (2012). α-Enolase, a multifunctional protein: its role on pathophysiological situations. Journal of Biomedicine & Biotechnology 2012, 156795.

110
Dion, M.F., Altschuler, S.J., Wu, L.F., and Rando, O.J. (2005). Genomic characterization reveals a simple histone H4 acetylation code. Proceedings of the National Academy of Sciences 102, 5501–5506.
Domínguez-Garrido, E., Martínez-Redondo, D., Martín-Ruiz, C., Gómez-Durán, A., Ruiz-Pesini, E., Madero, P., Tamparillas, M., Montoya, J., von Zglinicki, T., Díez-Sánchez, C., et al. (2009). Association of mitochondrial haplogroup J and mtDNA oxidative damage in two different North Spain elderly populations. Biogerontology 10, 435–442.
Donohoe, D.R., Collins, L.B., Wali, A., Bigler, R., Sun, W., and Bultman, S.J. (2012). The Warburg effect dictates the mechanism of butyrate-mediated histone acetylation and cell proliferation. Molecular Cell 48, 612–626.
Elson, J.L., Turnbull, D.M., and Taylor, R.W. (2007). Testing the adaptive selection of human mtDNA haplogroups: an experimental bioenergetics approach. The Biochemical Journal 404, e3–5.
Fang, H., Shen, L., Chen, T., He, J., Ding, Z., Wei, J., Qu, J., Chen, G., Lu, J., and Bai, Y. (2010). Cancer type-specific modulation of mitochondrial haplogroups in breast, colorectal and thyroid cancer. BMC Cancer 10, 421.
Feng, Z. (2010). p53 regulation of the IGF-1/AKT/mTOR pathways and the endosomal compartment. Cold Spring Harbor Perspectives in Biology 2, a001057.
Ferraresi, R., Troiano, L., Pinti, M., Roat, E., Lugli, E., Quaglino, D., Taverna, D., Bellizzi, D., Passarino, G., and Cossarizza, A. (2008). Resistance of mtDNA-depleted cells to apoptosis. Cytometry. Part A : the Journal of the International Society for Analytical Cytology 73, 528–537.
Fontana, L., Partridge, L., and Longo, V.D. (2010). Extending healthy life span--from yeast to humans. Science (New York, N.Y.) 328, 321–326.
Gerhäuser, C. (2012). Cancer cell metabolism , epigenetics and the potential influence of dietary components. Biomedical Reseach 23.
Gibbons, J.J., Abraham, R.T., and Yu, K. (2009). Mammalian target of rapamycin: discovery of rapamycin reveals a signaling pathway important for normal and cancer cell growth. Seminars in Oncology 36 Suppl 3, S3–S17.
Gómez-Durán, A., Pacheu-Grau, D., López-Gallardo, E., Díez-Sánchez, C., Montoya, J., López-Pérez, M.J., and Ruiz-Pesini, E. (2010). Unmasking the causes of multifactorial disorders: OXPHOS differences between mitochondrial haplogroups. Human Molecular Genetics 19, 3343–3353.
Goodman, R.H., and Smolik, S. (2000). CBP / p300 in cell growth , transformation , and development. Genes & Development 14, 1553–1577.
Gowher, H., Liebert, K., Hermann, A., Xu, G., and Jeltsch, A. (2005). Mechanism of stimulation of catalytic activity of Dnmt3A and Dnmt3B DNA-(cytosine-C5)-methyltransferases by Dnmt3L. The Journal of Biological Chemistry 280, 13341–13348.
Guan, K.-L., and Xiong, Y. (2011). Regulation of intermediary metabolism by protein acetylation. Trends in Biochemical Sciences 36, 108–116.
Haigis, M., and Sinclair, D. (2010). Mammalian sirtuins: biological insights and disease relevance. Annual Review of Pathology 253–295.

111
Hall, T.A. (1999). BioEdit: a user-friendly biological sequence alignment editor and analysis program for windows 95/98/Nt. Nucleic Acids Symposium 41, 95–98.
Hanahan, D., and Weinberg, R. a (2011). Hallmarks of cancer: the next generation. Cell 144, 646–674.
Hardie, D.G. (2011). AMP-activated protein kinase: an energy sensor that regulates all aspects of cell function. Genes & Development 25, 1895–1908.
Vander Heiden, M.G., Cantley, L.C., and Thompson, C.B. (2009). Understanding the Warburg effect: the metabolic requirements of cell proliferation. Science 324, 1029–1033.
Hinttala, R., Kervinen, M., Uusimaa, J., Maliniemi, P., and Finnilä, S. (2010). Mitochondrion Analysis of functional consequences of haplogroup J polymorphisms m . 4216T > C and m . 3866T > C in human MT-ND1 : Mutagenesis of homologous positions in Escherichia coli. Mitochondrion 10, 358–361.
Houtkooper, R.H., Pirinen, E., and Auwerx, J. (2012). Sirtuins as regulators of metabolism and healthspan. Nature Reviews Molecular Cell Biology 13, 225–238.
Huidobro, C., Fernandez, A.F., and Fraga, M.F. (2013). The role of genetics in the establishment and maintenance of the epigenome. Cellular and Molecular Life Sciences. 70, 1543–1573.
Jahangir Tafrechi, R.S., Svensson, P.J., Janssen, G.M.C., Szuhai, K., Maassen, J.A., and Raap, A.K. (2005). Distinct nuclear gene expression profiles in cells with mtDNA depletion and homoplasmic A3243G mutation. Mutation Research 578, 43–52.
Jenuwein, T., and Allis, C.D. (2001). Translating the histone code. Epigenetics 293, 1074–1080.
Jones, R.G., Plas, D.R., Kubek, S., Buzzai, M., Mu, J., Xu, Y., Birnbaum, M.J., and Thompson, C.B. (2005). AMP-activated protein kinase induces a p53-dependent metabolic checkpoint. Molecular Cell 18, 283–293.
Kanfi, Y., Naiman, S., Amir, G., Peshti, V., Zinman, G., Nahum, L., Bar-Joseph, Z., and Cohen, H.Y. (2012). The sirtuin SIRT6 regulates lifespan in male mice. Nature 483, 218–221.
Karve, T.M., and Cheema, A.K. (2011). Small changes huge impact: the role of protein posttranslational modifications in cellular homeostasis and disease. Journal of Amino Acids 2011, 207691.
Kayser, E.-B., Sedensky, M.M., and Morgan, P.G. (2004). The effects of complex I function and oxidative damage on lifespan and anesthetic sensitivity in Caenorhabditis elegans. Mechanisms of Ageing and Development 125, 455–464.
Kenney, M.C., Hertzog, D., Chak, G., Atilano, S.R., Khatibi, N., Soe, K., Nobe, A., Yang, E., Chwa, M., Zhu, F., et al. (2013). Mitochondrial DNA haplogroups confer differences in risk for age-related macular degeneration : a case control study. BMC Medical Genetics 14, 1.
Kerr, S.J. (1972). Competing Methyltransferase Systems Competing Methyltransferase Systems. The Journal of Biological Chemistry 247, 4248–4252.
King, M.P., and Attardi, G. (1989). Human cells lacking mtDNA: repopulation with exogenous mitochondria by complementation. Science 246, 500–503.
King, M.P., Koga, Y., Davidson, M., and Schon, E.A. (1992). Defects in mitochondrial protein synthesis and respiratory chain activity segregate with the tRNA(Leu(UUR)) mutation associated with

112
mitochondrial myopathy, encephalopathy, lactic acidosis, and strokelike episodes. Molecular and Cellular Biology 12, 480–490.
Kloss-Brandstatter, A., Pacher, D., Schonherr, S., Weissensteiner, H., Binna, R., Specht, G., and Kronenberg, F. (2011). HaploGrep : A Fast and Reliable Algorithm for Automatic Classification of Mitochondrial DNA Haplogroups. Human Mutation 32, 25–32.
Koppenol, W.H., Bounds, P.L., and Dang, C. V (2011). Otto Warburg’s contributions to current concepts of cancer metabolism. Nature Reviews. Cancer 11, 325–337.
Kraus, T.F.J., Globisch, D., Wagner, M., Eigenbrod, S., Widmann, D., Münzel, M., Müller, M., Pfaffeneder, T., Hackner, B., Feiden, W., et al. (2012). Low values of 5-hydroxymethylcytosine (5hmC), the “sixth base,” are associated with anaplasia in human brain tumors. International Journal of Cancer 131, 1577–1590.
Krebs, H. a (1972). Some aspects of the regulation of fuel supply in omnivorous animals. Advances in Enzyme Regulation 10, 397–420.
Kriaucionis, S., and Bird, A. (2003). DNA methylation and Rett syndrome. Human Molecular Genetics 12, R221–7.
Kulawiec, M., Owens, K.M., and Singh, K.K. (2009). mtDNA G10398A variant in African-American women with breast cancer provides resistance to apoptosis and promotes metastasis in mice. Journal of Human Genetics 54, 647–654.
Kurdistani, S.K., Tavazoie, S., and Grunstein, M. (2004). Mapping global histone acetylation patterns to gene expression. Cell 117, 721–733.
Larm, J., Vaillant, F., Linnane, A., and Lawen, A. (1994). Up-regulation of the plasma membrane oxidoreductase as a prerequisite for the viability of human Namalwa rho 0 cells. Journal of Biological Chemistry 269, 30097–30100.
Lee, T., and Pelletier, J. (2012). Eukaryotic initiation factor 4F: a vulnerability of tumor cells. Future Medicinal Chemistry 4, 19–31.
Levine, A.J., and Puzio-Kuter, A.M. (2010). The control of the metabolic switch in cancers by oncogenes and tumor suppressor genes. Science 330, 1340–1344.
Li, X., and Kazgan, N. (2011). Mammalian sirtuins and energy metabolism. International Journal of Biological Sciences 7, 575–587.
Lin, S.-J., Ford, E., Haigis, M., Liszt, G., and Guarente, L. (2004). Calorie restriction extends yeast life span by lowering the level of NADH. Genes & Development 18, 12–16.
Locasale, J.W., and Cantley, L.C. (2011). Metabolic flux and the regulation of mammalian cell growth. Cell Metabolism 14, 443–451.
Lu, C., and Thompson, C.B. (2012). Metabolic regulation of epigenetics. Cell Metabolism 16, 9–17.
Lu, S.C., and Mato, J.M. (2005). Role of methionine adenosyltransferase and S-adenosylmethionine in alcohol-associated liver cancer. Alcohol 35, 227–234.

113
Luka, Z., Mudd, S.H., and Wagner, C. (2009). Glycine N-methyltransferase and regulation of S-adenosylmethionine levels. The Journal of Biological Chemistry 284, 22507–22511.
Macdonald, M.J., Longacre, M.J., Stoker, S.W., Kendrick, M., Brown, L.J., Hasan, N.M., Jitrapakdee, S., Fukao, T., Hanson, M.S., Fernandez, L.A., et al. (2011). Differences between Human and Rodent Pancreatic Islets. The Journal of Biological Chemistry 286, 18383–18396.
Marcuello, A., Martínez-Redondo, D., Dahmani, Y., Casajús, J. a, Ruiz-Pesini, E., Montoya, J., López-Pérez, M.J., and Díez-Sánchez, C. (2009). Human mitochondrial variants influence on oxygen consumption. Mitochondrion 9, 27–30.
Mardis, E.R., Ding, L., Dooling, D.J., Larson, D.E., McLellan, M.D., Chen, K., Koboldt, D.C., Fulton, R.S., Delehaunty, K.D., McGrath, S.D., et al. (2009). Recurring mutations found by sequencing an acute myeloid leukemia genome. The New England Journal of Medicine 361, 1058–1066.
Martínez-Chantar, M.L., García-Trevijano, E.R., Latasa, M.U., Martín-Duce, A., Fortes, P., Caballería, J., Avila, M. a, and Mato, J.M. (2003). Methionine adenosyltransferase II beta subunit gene expression provides a proliferative advantage in human hepatoma. Gastroenterology 124, 940–948.
Martinez-Pastor, B., Cosentino, C., and Mostoslavsky, R. (2013). A tale of metabolites: the cross-talk between chromatin and energy metabolism. Cancer Discovery 3, 497–501.
Martínez-Redondo, D., Marcuello, A., Casajús, J. a, Ara, I., Dahmani, Y., Montoya, J., Ruiz-Pesini, E., López-Pérez, M.J., and Díez-Sánchez, C. (2010). Human mitochondrial haplogroup H: the highest VO2max consumer--is it a paradox? Mitochondrion 10, 102–107.
Martinus, R.D., Linnane, A.W., and Nagley, P. (1993). Growth of rho 0 human Namalwa cells lacking oxidative phosphorylation can be sustained by redox compounds potassium ferricyanide or coenzyme Q10 putatively acting through the plasma membrane oxidase. Biochemistry and Molecular Biology International 31, 997–1005.
Mathupala, S.P., Ko, Y.H., and Pedersen, P.L. (2006). Hexokinase II : Cancer ’ s double-edged sword acting as both facilitator and gatekeeper of malignancy when bound to mitochondria. Oncogene 4777–4786.
Mato, J.M., Corrales, F.J., Lu, S.C., and Avila, M. a (2002). S-Adenosylmethionine: a control switch that regulates liver function. FASEB Journal : Official Publication of the Federation of American Societies for Experimental Biology 16, 15–26.
Matoba, S., Kang, J.-G., Patino, W.D., Wragg, A., Boehm, M., Gavrilova, O., Hurley, P.J., Bunz, F., and Hwang, P.M. (2006). P53 Regulates Mitochondrial Respiration. Science 312, 1650–1653.
Máximo, V., Soares, P., Lima, J., Cameselle-Teijeiro, J., and Sobrinho-Simões, M. (2002). Mitochondrial DNA somatic mutations (point mutations and large deletions) and mitochondrial DNA variants in human thyroid pathology: a study with emphasis on Hürthle cell tumors. The American Journal of Pathology 160, 1857–1865.
Máximo, V., Lima, J., Soares, P., and Sobrinho-Simões, M. (2009). Mitochondria and cancer. Virchows Archiv : an International Journal of Pathology 454, 481–495.
Metallo, C.M., and Heiden, M.G. Vander (2010). Metabolism strikes back : metabolic flux regulates cell signaling. Genes & Development 24, 2717–2722.

114
Miao, L., and Clair, D.S. (2009). Regulation of superoxide dismutase genes: implications in disease. Free Radical Biology and Medicine 47, 344–356.
Minocherhomji, S., Tollefsbol, T., and Singh, K. (2012). Mitochondrial regulation of epigenetics and its role in human diseases. Epigenetics 7, 326–334.
Modica-Napolitano, J.S., and Singh, K.K. (2004). Mitochondrial dysfunction in cancer. Mitochondrion 4, 755–762.
Naini, R.K.S.N.C.A., and Sue, D.C.D.V.S.D.C.M. (2006). Measurement of ATP production in mitochondrial disorders. Journal of Inherited Metabolic Disease 29, 86–91.
Nasr, Z., Robert, F., Porco, J. a, Muller, W.J., and Pelletier, J. (2013). eIF4F suppression in breast cancer affects maintenance and progression. Oncogene 32, 861–871.
Oberley, L., and Oberley, T. (1988). Role of antioxidant enzymes in cell immortalization and transformation. Molecular and Cellular Biochemistry 153, 147–153.
Offermann, S., Dreesen, B., Horst, I., Danker, T., Jaskiewicz, M., and Peterhansel, C. (2008). Developmental and environmental signals induce distinct histone acetylation profiles on distal and proximal promoter elements of the C4-Pepc gene in maize. Genetics 179, 1891–1901.
Pajares, M. a, Durán, C., Corrales, F., Pliego, M.M., and Mato, J.M. (1992). Modulation of rat liver S-adenosylmethionine synthetase activity by glutathione. The Journal of Biological Chemistry 267, 17598–17605.
Pancholi, V. (2001). Cellular and Molecular Life Sciences Multifunctional a -enolase : its role in diseases. Cellular and Molecular Life Sciences 58, 902–920.
Park, S.Y., Chang, I., Kim, J.-Y., Kang, S.W., Park, S.-H., Singh, K., and Lee, M.-S. (2004). Resistance of mitochondrial DNA-depleted cells against cell death: role of mitochondrial superoxide dismutase. The Journal of Biological Chemistry 279, 7512–7520.
Parr, R.L., Maki, J., Reguly, B., Dakubo, G.D., Aguirre, A., Wittock, R., Robinson, K., Jakupciak, J.P., and Thayer, R.E. (2006). The pseudo-mitochondrial genome influences mistakes in heteroplasmy interpretation. BMC Genomics 7, 185.
Parsons, D.W., Jones, S., Zhang, X., Lin, J.C.-H., Leary, R.J., Angenendt, P., Mankoo, P., Carter, H., Siu, I.-M., Gallia, G.L., et al. (2008). An integrated genomic analysis of human glioblastoma multiforme. Science 321, 1807–1812.
Patel, J., Pathak, R.R., and Mujtaba, S. (2011). The biology of lysine acetylation integrates transcriptional programming and metabolism. Nutrition & Metabolism 8, 12.
Pello, R., Martín, M. a, Carelli, V., Nijtmans, L.G., Achilli, A., Pala, M., Torroni, A., Gómez-Durán, A., Ruiz-Pesini, E., Martinuzzi, A., et al. (2008). Mitochondrial DNA background modulates the assembly kinetics of OXPHOS complexes in a cellular model of mitochondrial disease. Human Molecular Genetics 17, 4001–4011.
Pereira, R., Phillips, C., Alves, C., Amorim, A., Carracedo, Á., and Gusmão, L. (2009). A new multiplex for human identification using insertion / deletion polymorphisms. Electrophoresis 30, 3682–3690.

115
Porcelli, A.M., Angelin, A., Ghelli, A., Mariani, E., Martinuzzi, A., Carelli, V., Petronilli, V., Bernardi, P., and Rugolo, M. (2009). Respiratory complex I dysfunction due to mitochondrial DNA mutations shifts the voltage threshold for opening of the permeability transition pore toward resting levels. The Journal of Biological Chemistry 284, 2045–2052.
Poulsen, H.E. (2005). Oxidative DNA modifications. Experimental and Toxicologic Pathology 57, 161–169.
Qiu, X., Brown, K., Hirschey, M.D., Verdin, E., and Chen, D. (2010). Calorie Restriction Reduces Oxidative Stress by SIRT3-Mediated SOD2 Activation. Cell Metabolism 12, 662–667.
Quinzii, C.M., López, L.C., Gilkerson, R.W., Dorado, B., Coku, J., Naini, A.B., Lagier-Tourenne, C., Schuelke, M., Salviati, L., Carrozzo, R., et al. (2010). Reactive oxygen species, oxidative stress, and cell death correlate with level of CoQ10 deficiency. FASEB Journal : Official Publication of the Federation of American Societies for Experimental Biology 24, 3733–3743.
Robertson, K.D. (2001). DNA methylation, methyltransferases, and cancer. Oncogene 20, 3139–3155.
Rodríguez-Paredes, M., and Esteller, M. (2011). Cancer epigenetics reaches mainstream oncology. Nature Medicine 17, 330–339.
Ryan, K., Backos, D.S., Reigan, P., and Patel, M. (2012). Post-translational oxidative modification and inactivation of mitochondrial complex I in epileptogenesis. The Journal of Neuroscience : the Official Journal of the Society for Neuroscience 32, 11250–11258.
Saffran, H. a, Pare, J.M., Corcoran, J. a, Weller, S.K., and Smiley, J.R. (2007). Herpes simplex virus eliminates host mitochondrial DNA. EMBO Reports 8, 188–193.
Sale, E.M., Hodgkinson, C.P., Jones, N.P., and Sale, G.J. (2006). A New Strategy for Studying Protein Kinase B and Its Three Isoforms . Role of Protein Kinase B in Phosphorylating Glycogen Synthase Kinase-3 , Tuberin , WNK1 ,. Biochemistry 213–223.
Salminen, A., Kaarniranta, K., and Kauppinen, A. (2013). Crosstalk between Oxidative Stress and SIRT1: Impact on the Aging Process. International Journal of Molecular Sciences 14, 3834–3859.
Santidrian, A.F., Matsuno-yagi, A., Ritland, M., Seo, B.B., Leboeuf, S.E., Gay, L.J., Yagi, T., and Felding-habermann, B. (2013). Mitochondrial complex I activity and NAD + / NADH balance regulate breast cancer progression. Journal of Clinical Investigation 123, 1068–1081.
Santoro, A., Salvioli, S., Raule, N., Capri, M., Sevini, F., Valensin, S., Monti, D., Bellizzi, D., Passarino, G., Rose, G., et al. (2006). Mitochondrial DNA involvement in human longevity. Biochimica et Biophysica Acta 1757, 1388–1399.
Schafer, F., and Buettner, G. (2001). Redox environment of the cell as viewed through the redox state of the glutathione disulfide/glutathione couple. Free Radical Biology and Medicine 30, 1191–1212.
Sharma, S., Kelly, T.K., and Jones, P. a (2010). Epigenetics in cancer. Carcinogenesis 31, 27–36.
Shulga, N., Wilson-Smith, R., and Pastorino, J. (2010). Sirtuin-3 deacetylation of cyclophilin D induces dissociation of hexokinase II from the mitochondria. Journal of Cell Science 123, 894–902.

116
Singh, K.K., Kulawiec, M., Still, I., Desouki, M.M., Geradts, J., and Matsui, S.-I. (2005). Inter-genomic cross talk between mitochondria and the nucleus plays an important role in tumorigenesis. Gene 354, 140–146.
Smiraglia, D.J., Kulawiec, M., Bistulfi, G.L., Gupta, S.G., and Singh, K.K. (2008). A novel role for mitochondria in regulating epigenetic modification in the nucleus. Cancer Biology Therapy 7, 1182–1190.
Someya, S., Yu, W., Hallows, W.C., Xu, J., Vann, J.M., Leeuwenburgh, C., Tanokura, M., Denu, J.M., and Prolla, T.A. (2010). Sirt3 Mediates Reduction of Oxidative Damage and Prevention of Age-Related Hearing Loss under Caloric Restriction. Cell 143, 802–812.
Sterner, D.E., and Berger, S.L. (2000). Acetylation of Histones and Transcription-Related Factors. Microbiology and Molecular Biology 64, 435–459.
Swerdlow, R.H. (2007). Review Mitochondria in Cybrids Containing mtDNA From Persons With Mitochondriopathies. Journal of Neuroscience Research 3428, 3416–3428.
Takasaki, S. (2009). Mitochondrial haplogroups associated with Japanese centenarians, Alzheimer’s patients, Parkinson's patients, type 2 diabetic patients and healthy non-obese young males. Journal of Genetics and Genomics 36, 425–434.
Tao, R., Coleman, M.C., Pennington, D., Ozden, O., Jiang, H., Kim, H., Flynn, C.R., Hill, S., Hayes, W., Olivier, A.K., et al. (2012). Sirt3-Mediated Deacetylation of Evolutionarily Conserved Lysine 122 Regulates MnSOD Activity in Response to Stress. Molecular Cell 40, 893–904.
Taylor, R.W., and Turnbull, D.M. (2005). Mitochondrial DNA mutations in human disease. Nature Genetics 6, 389–402.
Teperino, R., Schoonjans, K., and Auwerx, J. (2010). Histone methyl transferases and demethylases; can they link metabolism and transcription? Cell Metabolism 12, 321–327.
Tomlinson, I.P.M., Alam, N.A., Rowan, A.J., Barclay, E., Jaeger, E.E.M., Kelsell, D., Leigh, I., Gorman, P., Lamlum, H., Rahman, S., et al. (2002). Germline mutations in FH predispose to dominantly inherited uterine fibroids, skin leiomyomata and papillary renal cell cancer. Nature Genetics 30, 406–410.
Torroni, A., Kirsi Huoponen, Paolo Francalacci, Maurizio Petrozzi, t L.M., Scozzari, R., and Domenica Obinu, M.-L.S. and D.C.W. (1996). European mtDNAs From an Analysis of Three European Populations. Genetics 144, 1835–1850.
Tristan, C., Shahani, N., Sedlak, T.W., and Sawa, A. (2011). The diverse functions of GAPDH: views from different subcellular compartments. Cellular Signalling 23, 317–323.
Tseng, L., Yin, P., and Chi, C. (2006). Mitochondrial DNA mutations and mitochondrial DNA depletion in breast cancer. Genes Chromosomes and Cancer 638, 629–638.
Tuppen, H.A.L., Blakely, E.L., Turnbull, D.M., and Taylor, R.W. (2010). Mitochondrial DNA mutations and human disease. Biochimica et Biophysica Acta 1797, 113–128.
Turk, P.W., Laayoun, A.H., S-smith, S., and Weitzman, S.A. (1995). DNA adduct 8-hydroxyl-2’-deoxyguanosine (8-hydroxyguanine) affects function of human DNA methyltransferase. Carcinogenesis 16, 1253–1255.

117
Valinluck, V., Tsai, H.-H., Rogstad, D.K., Burdzy, A., Bird, A., and Sowers, L.C. (2004). Oxidative damage to methyl-CpG sequences inhibits the binding of the methyl-CpG binding domain (MBD) of methyl-CpG binding protein 2 (MeCP2). Nucleic Acids Research 32, 4100–4108.
Vogel, R.O., Dieteren, C.E.J., van den Heuvel, L.P.W.J., Willems, P.H.G.M., Smeitink, J. a M., Koopman, W.J.H., and Nijtmans, L.G.J. (2007). Identification of mitochondrial complex I assembly intermediates by tracing tagged NDUFS3 demonstrates the entry point of mitochondrial subunits. The Journal of Biological Chemistry 282, 7582–7590.
Vousden, K.H., and Ryan, K.M. (2009). P53 and Metabolism. Nature Reviews. Cancer 9, 691–700.
Waddington, C.H. (1942). The epigenotype. Endeavour 1, 18–20.
Wagner, G.R., and Payne, R.M. (2011). Mitochondrial acetylation and diseases of aging. Journal of Aging Research 2011, 234875.
Wallace, D.C. (2005). A mitochondrial paradigm of metabolic and degenerative diseases, aging, and cancer: a dawn for evolutionary medicine. Annual Review of Genetics 39.
Wallace, D.C. (2009). Mitochondria, bioenergetics, and the epigenome in eukaryotic and human evolution. Cold Spring Harbor Symposia on Quantitative Biology 74, 383–393.
Wallace, D.C. (2010). Review Article Mitochondrial DNA Mutations in Disease and Aging. Environmental and Molecular Mutagenesis 450, 440–450.
Wallace, D.C. (2012). Mitochondria and cancer. Nature Reviews. Cancer 12, 685–698.
Wallace, D., and Fan, W. (2010). Energetics, epigenetics, mitochondrial genetics. Mitochondrion 10, 12–31.
Wallace, D.C., Procaccio, V., Finley, L.W.S., Haas, W., Gygi, S.P., and Haigis, M.C. (2011). Succinate Dehydrogenase Is a Direct Target of Sirtuin 3 Deacetylase Activity. 6, 4–9.
Walsh, C.T., Garneau-Tsodikova, S., and Gatto, G.J. (2005). Protein posttranslational modifications: the chemistry of proteome diversifications. Angewandte Chemie International 44, 7342–7372.
Wang, C., Wu, S., Wu, Y., and Wei, Y. (2013). Oxidative stress response elicited by mitochondrial dysfunctio: Implication in the pathophysiology of aging. Experimental Biology and Medicine 238, 450–460.
Warburg, O. (1956). On the origin of cancer cells. Science 123, 309–314.
Ward, P.S., and Thompson, C.B. (2012). Metabolic reprogramming: a cancer hallmark even warburg did not anticipate. Cancer Cell 21, 297–308.
Webster, B., Lu, Z., Sack, M., and Scott, I. (2012). The role of sirtuins in modulating redox stressors. Free Radical Biology and Medicine 52, 281–290.
Wei, Y.H., Ma, Y.S., Lee, H.C., Lee, C.F., and Lu, C.Y. (2001). Mitochondrial theory of aging matures--roles of mtDNA mutation and oxidative stress in human aging. Zhonghua Yi Xue Za Zhi Chinese Medical Journal Free China Ed 64, 259–270.

118
Wellen, K.E., and Thompson, C.B. (2012). A two-way street: reciprocal regulation of metabolism and signalling. Nature Publishing Group 13, 270–276.
Wellen, K.E., Hatzivassiliou, G., Sachdeva, U.M., Bui, T. V, Justin, R., and Thompson, C.B. (2009). ATP-citrate lyase links cellular metabolism to histone acetylation. Science 324, 1076–1080.
Wellen, K.E., Lu, C., Mancuso, A., Lemons, J.M.S., Ryczko, M., Dennis, J.W., Rabinowitz, J.D., Coller, H.A., and Thompson, C.B. (2010). The hexosamine biosynthetic pathway couples growth factor-induced glutamine uptake to glucose metabolism. Genes & Development 24, 2784–2799.
Wu, Y., Lee, H., Liao, C., and Wei, Y. (2013). Regulation of mitochondrial F o F 1 ATPase activity by Sirt3-catalyzed deacetylation and its de fi ciency in human cells harboring 4977 bp deletion of mitochondrial DNA. Biochimica et Biophysica Acta 1832, 216–227.
Wu, Y.-T., Wu, S.-B., Lee, W.-Y., and Wei, Y.-H. (2010). Mitochondrial respiratory dysfunction-elicited oxidative stress and posttranslational protein modification in mitochondrial diseases. Annals of the New York Academy of Sciences 1201, 147–156.
Xu, W., and Zhao, S. (2011). Metabolism is regulated by protein acetylation. Frontiers in Biology 6, 213–218.
Xu, W., Li, Y., Liu, C., and Zhao, S. (2013). Protein lysine acetylation guards metabolic homeostasis to fight against cancer. Oncogene 1–7.
Yang, X., and Seto, E. (2007). HATs and HDACs : from structure , function and regulation to novel strategies for therapy and prevention. Oncogene 26, 5310–5318.
Zaidi, N., Swinnen, J. V, and Smans, K. (2012). ATP-citrate lyase: a key player in cancer metabolism. Cancer Research 72, 3709–3714.
Zhang, K., Sridhar, V. V, Zhu, J., Kapoor, A., and Zhu, J.-K. (2007). Distinctive core histone post-translational modification patterns in Arabidopsis thaliana. PloS One 2, e1210.
Zhong, L., and Mostoslavsky, R. (2010). SIRT6: a master epigenetic gatekeeper of glucose metabolism. Transcription 1, 17–21.

119
Chapter 8 Annexes

120

121
8.1 Annexes
While performing the work presented in this thesis, emerged the opportunity to participate in
other works carried out in the group of Cancer Biology.
Nelma Pértega-Gomes, José R. Vizcaíno, Susana Sousa, Ricardo Coelho,, Jjan Attig, Sarah
Jurmeister, Elsa Oliveira, Céline Pinheiro, Carmen Jerónimo, Rui M. Henrique, Luísa Pereira ,
Alexandre Lobo da Cunha, Valdemar Maximo, Carlos Lopes and Fátima Baltazar. Metabolic
switch in PCa progression (Submitted)
Vinagre, J., Almeida, A., Populo, H., Batista, R., Lyra, J., Pinto, V., Coelho, R., Celestino, R.,
Prazeres, H., Lima, L., Melo, M., Rocha, A., Preto, A., Castro, L., Pardal, F., Lopes, J.M.,
Santos, L.L., Reis, R., Sobrinho-Simões, M., Lima, J., Máximo, V., Soares, P., (2013).
Frequency of TERT promoter mutations in human cancers. Nature Communications 4, 2185.