report to congress: wastes from the extraction and ... · report to congress on wastes from the...
TRANSCRIPT

United States Office of Solid Waste EPA/530-SW-85-033Environmental and Emergency Response December 1985ProtectionAgency
Report To Congress
Wastes from the Extraction and Beneficiation of Metallic Ores, Phosphate Rock, Asbestos,
Overburden from Uranium Mining,and Oil Shale

EPA/530-SW-85-033
Report To Congress
Wastes from the Extraction andBeneficiation
of Metallic Ores, Phosphate Rock,Asbestos,
Overburden from UraniumMining,
and Oil Shale
December 31, 1985U.S. Environmental Protection Agency
Office of Solid Waste
For sale by the Superintendent of Documents, U.S. Government Printing Office, Washington, D.C. 20402
UNITED STATES ENVIRONMENTAL PROTECTION AGENCYWASHINGTON D.C. 20460
DEC 31, 1985
THE ADMINISTRATOR
Honorable George BushPresident of the SenateWashington, D.C. 20510
Dear Mr. President:
I am pleased to transmit the Report to Congress on "Wastes from theExtraction and Beneficiation of Metallic Ores, Phosphate Rock, Asbestos,Overburden from Uranium Mining, and Oil Shale" presenting the results ofstudies carried out pursuant to Sections 8002 (f) and (p) of the ResourceConservation and Recovery Act of 1976, as amended, (42 U.S.C. SS6982 (f) and(p)).
The Report provides a comprehensive assessment of possible adverse effectson human health and the environment from the disposal and utilization of solidwaste from the extraction and beneficiation of ores and minerals. All metal,phosphate, and asbestos mining segments of the United States mining industryare included in the assessment. Waste categories covered include mine waste,mill tailings, and waste from heap and dump leaching operations.
The Report and appendices are transmitted in one volume.
Sincerely yours,
Lee M. Thomas
Enclosures
UNITED STATES ENVIRONMENTAL PROTECTION AGENCYWASHINGTON D.C. 20460
DEC 31, 1985
THE ADMINISTRATOR
Honorable Thomas P. O'NeillSpeaker of the House of RepresentativesWashington, D.C. 20515
Dear Mr. Speaker:
I am pleased to transmit the Report to Congress on "Wastes from the Extractionand Beneficiation of Metallic Ores, Phosphate Rock, Asbestos, Overburden fromUranium Mining, and Oil Shale" presenting the results of studies carried outpursuant to Sections 8002 (f) and (p) of the Resource Conservation andRecovery Act of 1976, as amended, (42 U.S.C. SS6982 (f) and (p)).
The Report provides a comprehensive assessment of possible adverse effects onhuman health and the environment from the disposal and utilization of solidwaste from the extraction and beneficiation of ores and minerals. All metal,phosphate, and asbestos mining segments of the United States mining industryare included in the assessment. Waste categories covered include mine waste,mill tailings, and waste from heap and dump leaching operations.
The Report and appendices are transmitted in one volume.
Sincerely yours,
Lee M. Thomas
Enclosures

TABLE OF CONTENTS
Page
EXECUTIVE SUMMARY ES-1
SECTION 1. INTRODUCTION 1-1
1.1 Scope 1-81.2 Contents 1-10
SECTION 2. OVERVIEW OF THE NONFUEL MININGINDUSTRY 2-1
2.1 Non fuel Mining Segments 2-12.2 Geographic Distribution 2-62.3 Mining and Beneficiation Wastes 2-102.4 Waste Quantities 2-182.5 Summary 2-23
SECTION 3. MANAGEMENT PRACTICES FOR MINING WASTES 3-1
3.1 Overview of the Mining Waste Management Process 3-13.2 Waste Management Practices 3-53.3 Waste Siting and Disposal Methods 3-133.4 Mitigative Measures for Land Disposal Sites 3-203.5 Summary 3-52
SECTION 4. POTENTIAL DANGER TO HUMAN HEALTH AND THEENVIRONMENT 4-1
4.1 Waste Characteristics Considered 4-24.2 Estimated Amounts of Potentially Hazardous Mining Waste 4-424.3 Effectiveness of Waste Containment at Mining Waste Sites 4-504.4 Structural Instability of Impoundments 4-614.5 Damage Cases 4-634.6 Risk Analysis 4-684.7 Summary 4-71
SECTION 5. THE ECONOMIC COST OF POTENTIAL 5-1HAZARDOUS WASTE MANAGEMENT
5.1 Cost Methodology 5-25.2 Potential Costs of RCRA Subtitle C Waste Management 5-14

CONTENTS (Continued)
Page
SECTION 6. CONCLUSIONS AND RECOMMENDATIONS 6-1
6.1 Scope 6-16.2 Summary of Conclusions 6-16.3 Recommendations 6-12
SECTION 7. SELECTED BIBLIOGRAPHY 7-1
APPENDIX A. SUMMARY OF MAJOR WASTES FROM THE MINING A-1 AND PROCESSING OF OIL SHALES
APPENDIX B. METHODOLOGY B-1
C. SELECTED CRITERIA ANALYZED FOR TOXIC
EFFECTS C-1
APPENDIX D. GLOSSARY D-1

EXECUTIVE SUMMARY
This is the executive summary for the Environmental Protection Agency's
Report to Congress on Wastes from the Extraction and Beneficiation of Metallic
Ores, Phosphate Rock, Asbestos, Overburden from Uranium Mining, and Oil Shale.
EPA has prepared this report in response to the requirements of Sections
8002(f) and (p) of the Resource Conservation and Recovery Act (RCRA). Section
8002(f), a part of RCRA when it was originally enacted in 1976, directed EPA
to perform a
detailed and comprehensive study on the adverse effects of solid wastesfrom active and abandoned surface and underground mines on theenvironment, including, but not limited to, the effects of such wasteson humans, water, air, health, welfare, and natural resources ....
Section 8002(p), which Congress added to RCRA when it amended the Act in 1980,
required EPA to conduct a
detailed and comprehensive study on the adverse effects on human healthand the environment, if any, of the disposal and utilization of solidwastes from the extraction, beneficiation, and processing of ores andminerals .... Such study shall be conducted in conjunction with thestudy of mining wastes required by subsection (f) ....
Under the 1980 amendments, EPA is prohibited from regulating solid waste
from the "extraction, beneficiation, and processing of ores and minerals"
under Subtitle C of RCRA until at least 6 months after the Agency completes
these studies and submits them to Congress. The purpose of this prohibition is
to exempt these wastes temporarily from the requirements of the RCRA hazardous
waste management system. After submitting the required studies, holding
public hearings, and providing the public with an opportunity to
ES-1

comment, the Administrator must "determine to promulgate regulations" or
"determine such regulations are unwarranted" for these mining wastes.
If EPA decides to regulate mining wastes as hazardous under RCRA Section
3004(x), which Congress added to the Act as part of the Hazardous and Solid
Waste Amendments of 1984, EPA may modify provisions of these regulations
pertaining to liquids in landfills, land disposal restrictions, and minimum
technology requirements, as they apply to mining wastes. In doing so, EPA may
take into account the special characteristics of such wastes, thepractical difficulties associated with implementation of suchrequirements, and site-specific characteristics, including, but notlimited to, the climate, geology, hydrology and soil chemistry at thesite, so long as such modified requirements assure protection of humanhealth and the environment.
This report addresses wastes from the extraction and beneficiation of
metallic ores (with special emphasis on copper, gold, iron, lead, silver, and
zinc), uranium overburden, and the nonmetals asbestos and phosphate rock. The
Environmental Protection Agency's findings on oil shales are summarized in
Appendix A of this report. EPA selected these mining industry segments
because they generate large quantities of wastes that are potentially
hazardous and because the Agency is solely responsible for regulating the
waste from extraction and beneficiation of these ores and minerals. Likewise,
the Agency excluded from the study wastes generated by the clay, sand and
gravel, and stone mining segments, since it judged wastes from these sources
less likely to pose hazards than wastes from the industries included. EPA
also excluded uranium mill tailings wastes, because the Agency has already
submitted a report to Congress on uranium mill tailings. The Agency excluded
wastes from coal mining and beneficiation, because both EPA and the Department
ES-2

of the Interior play a role in their regulation, and it is not clear whether
Congress intended coal mining to be included within the scope of the studies
conducted in response to Sections 8002(f) and (p) of RCRA. Finally, EPA
excluded large-volume processing wastes. On October 2, 1985, EPA proposed to
reinterpret the scope of the mining waste exclusion as it applies to
processing wastes, leaving only large volume processing wastes excluded (FR
401292). Other wastes from processing ores and minerals that are hazardous
would be brought under full Subtitle C regulation after promulgation of the
reinterpretation, and would therefore not be included in the scope of a
subsequent Report to Congress on processing wastes. The large-volume
processing wastes that remain within the exclusion would be studied and a
Report to Congress prepared to complete EPA's response to the RCRA Section
8002 (p) mandate.
The remainder of this Executive Summary consists of five sections. First,
we provide an overview of the industry segments covered in this report. Next,
we describe management practices for mining wastes. Then we discuss the
potential danger to human health and the environment that mining wastes pose.
Following this, we estimate the costs that regulating mining wastes could
impose under several scenarios and briefly outline the effects of these costs
on product prices. Finally, we present the Agency's conclusions and
recommendations.
OVERVIEW OF THE NONFUEL MINING INDUSTRY
1The nonfuel mining industry is an integral part of our economy,
providing a wide range of important products. The value of raw nonfuel
1 For the purposes of this report, the nonfuel mining industry is defined to
include uranium, although processed uranium may be used as a fuel.
ES-3

minerals is about 1 percent of the Gross National Product (GNP), and
productsmade from these raw materials account for about 9 percent of the GNP.
The number of active mines varies from year to year, depending on economic
factors; in 1980 (the most recent year for which complete data are available
from the U.S. Bureau of Mines), there were about 600 metal mines and about
12,000 nonmetal mines. Most of the nonmetal mines were clay, sand and gravel,
and stone mines, and thus fall outside the scope of this report. In the
industry segments that this report covers, a few large mines generally produce
most of the ore and generate most of the waste.
Ores occur only in certain geologic formations, so much of the mining
within an industry segment is concentrated in a few locations. Because the
raw ore must be extracted from the earth, and only a small percentage of the
mined rock is valuable, vast quantities of material must be handled for each
unit of marketable product. Much of this material is waste.
Mine waste is the soil or rock that is generated during the process of
gaining access to the ore or mineral body. Tailings are the wastes generated
by several physical and chemical beneficiation processes that may be used to
separate the valuable metal or mineral from the interbedded rock; the choice
of process depends on the composition and properties of the ore and of the
gangue, the rock in which the ore occurs. Some low-grade ore, waste rock, and
tailings are used in dump or heap leaching, a process that the mining industry
considers a form of beneficiation and one that involves spraying the material
with acid or cyanide to leach out metals. This process is most widely
practiced in the copper, silver, and gold mining segments, and the associated
wastes are termed dump/heap leaching wastes. The final waste type is mine
ES-4

water, water that infiltrates the mine during the extraction process. Table
ES-1 lists the types and quantities of mining wastes generated by each mining
segment of concern.
Extraction and beneficiation produce large quantities of waste. The
segments covered in this report generate 1 to 2 billion tons of waste each
year and have so far produced over 50 billion tons of waste. Copper, iron ore,
uranium, and phosphate mining operations are responsible for more than 85
percent of this total volume of waste and continue to account for most of the
waste presently generated. As lower and lower grades of ore are mined, more
waste per unit of product is generated.
Approximately one-half of the waste generated by the segments of concern
is mine waste, and one-third is tailings. Most of the mine waste is from
phosphate, copper, iron ore, and uranium mining; the majority of tailings are
from the copper, phosphate, and iron ore segments. Only the copper, gold, and
silver mining industries presently generate dump or heap leach waste. The
following section discusses how industry currently manages these wastes.
WASTE MANAGEMENT PRACTICES
Mine waste, tailings, heap and dump leach wastes, and mine water can be
managed in a variety of ways. Figure ES-1 provides an overview of waste
management practices. Waste management practices include recovery operations,
volume reduction, treatment, onsite and offsite use, and waste siting and
disposal. For mine waste and tailings, disposal constitutes the major
practice; about 56 percent of mine wastes are currently managed by disposal in
piles, and about 61 percent of tailings are managed in tailings ponds. About
30 percent of mine waste and tailings are used on site in leaching operations,
ES-5

Table ES-1 Waste Generation(Millions of Metric Tons in 1982)
Miningindustry Mine Leachingsegment waste Tailings wastes Total
Metals:
Copper 124 178 200(dump) 502Gold 39 24 11(heap) 74Iron 102 75 - 177Lead 2 9 - 11Molybdenum 24 6 - 30Silver 20 6 <1(heap) 26Uranium 73 NA - 73Zinc 1 6 - 7Other metals 23 3 - 26
Subtotal 408 307 211 926
Nonmetals:
Asbestos 4 2 - 6Phosphate 294 109 - 403
Subtotal 298 111 - 409
TOTAL 706 418 211 1,335
Source: Estimated by Charles River Associates 1985 based on BOM 1983.
ES-6


construction of tailings impoundments, and road construction. Present disposal
and utilization practices for all metal and nonmetal industry segments are
presented in Table ES-2. A discussion of waste management practices follows.
Several methods are available to treat, change, or reduce wastes before
disposing of them. In operations using cyanide, it may be possible to
oxidize the cyanide before disposal. It may also be possible to remove
pyrites from tailings, thus reducing, although not eliminating, their
potential for forming acid. Finally, water can be removed from tailings,
creating a thickened discharge.
Extraction and milling wastes can also be used off site; the most common
use of these wastes is in road construction. Researchers are investigating
other uses for both mine wastes and tailings, such as use in soil
supplements, in wallboard and brick/block products, and in ceramic products.
However, it is unlikely that use of mining wastes will increase greatly in
the future, because in most cases their commercial potential is not
sufficient to overcome the economic disadvantages, such as high
transportation costs, associated with their use.
Mine water can also be used on site in the milling process as makeup
water or for dust control, cooling, or drilling fluids. In most cases,
however, the amount of mine water exceeds the quantity that can be used.
The majority of the solid waste generated in mining is not reduced by any
of the methods described above and must be disposed of. Siting disposal
facilities in appropriate locations is fundamental to environmental
protection, and other management methods are available for ameliorating waste
disposal problems.
ES-8

Table ES-2 Present Mining Waste Disposal and Utilization Practices (Millionsof Metric Tons/Year)
Practice Waste type and volume
Mine waste Mill tailings
Pile 569 -Backfill 86 21Onsite utilization 313 141Impoundments - 267Offsite utilization 43 8
TOTAL 1,011 437
ES-9

During active site life, during closure, and in the post-closure period,
facilities could employ engineering controls to prevent erosion, to keep
leachate out of the ground water, or to remove contaminants introduced into
ground water. However, EPA data on management methods at mining facilities
indicate that only a small percentage of mines currently monitor their ground
water, use run-on/runoff controls or liners, or employ leachate collection,
detection, and removal systems. EPA has not determined the circumstances
under which these waste measures would be appropriate at mine waste and mill
tailing disposal sites.
POTENTIAL DANGER TO HUMAN HEALTH AND THE ENVIRONMENT
The potential dangers posed by wastes from nonfuel mining and
beneficiation vary greatly and depend on the industry segment; the
beneficiation process; and site-specific geologic, hydrologic, and climatic
factors. Some rock is naturally high in metals or radionuclides. Some
beneficiation processes use acids and cyanides. Mine waste, tailings, and mine
water can contain these materials and also be acidic or alkaline. Hazardous
substances could leak into the environment, polluting the soil and surface and
ground water and endangering receptor populations.
The Agency has not yet performed a quantitative risk assessment. Risk
analysis can provide a quantitative estimate and allow EPA to distinguish
between the risk posed by current, past, and alternative management practices.
Additionally, it will enable the Agency to evaluate how site-specific factors
such as hydrology, proximity to surface water, climate, distance from human
populations, type and sensitivity of aquatic populations, closeness to
drinking water supplies, and the chemical and physical composition of the
waste itself affect risk.
ES-10

EPA evaluated the potential dangers posed by mining wastes by testing for
the RCRA characteristics of corrosivity and EP toxicity and by assessing the
level of several other substances in these wastes. A substance was considered
corrosive if the pH was equal to or less than 2 (acidic) or equal to or
greater than 12.5 (alkaline). A substance was determined to be EP toxic if,
using a specified leaching procedure, it exceeded the National Interim Primary
Drinking Water Standards (NIPDWS) for an EP toxic metal by a factor of 100.
Only samples from copper dump leach met the RCRA characteristic for
corrosivity because of low pH, but pH values were quite low (more than 2 and
less than or equal to 4) for many samples from the copper and other metals
industry segments and for one sample from the molybdenum segment. Only one
sample, from the "other" metals industry segment, met the RCRA characteristic
for corrosivity because of high pH. In addition, one sample each from the gold
and silver industry segments, three from the copper industry segment, and four
from the other metals segment had relatively high (more than 10 and less than
or equal to 12.5) pH values. EP toxic results were obtained for at least one
sample from copper dump/heap leachate, gold tailings and mine waste, lead mine
waste and tailings, silver tailings and mine waste, and zinc tailings. EPA's
water quality criteria for the protection of aquatic life are generally set at
levels at lower concentrations than those established by the NIPDWS.
Another potential threat to organisms and the environment is acid
formation. Wastes with the highest acid formation potential are in the copper,
gold, and silver industry segments, although the degree of potential harm
varies with the mineral content of wastes and soils (some wastes and soils
have neutralizing chemicals), amount of precipitation (more increases the
potential for acid drainage), and other factors not evaluated.
ES-11

Of the other potentially hazardous constituents considered, cyanide was
detected in copper and gold tailings ponds and gold heap leachate. Radioactive
material was found in uranium and phosphate mine waste samples and in
phosphate tailings. Although only asbestos mining wastes were tested in this
study for asbestos content, effluent guideline data suggest that asbestos may
be present in wastes generated by some metal mining industry segments. EPA has
insufficient data to evaluate the hazard, if any, posed by asbestos contained
in metal mining wastes.
Based on these sampling results, EPA estimates that the copper mining
segment generates 50 million metric tons of RCRA corrosive waste annually. The
gold, lead, silver, and zinc industry segments generate a total of 11.2
million metric tons of RCRA EP toxic waste annually. EPA estimates that 182
million metric tons of copper dump leach are generated annually, and that the
gold and silver segments generate a total of 9.3 million metric tons of
tailings and 14 million metric tons of heap leach annually. High acid
formation potential waste is estimated at 95 million metric tons a year. The
phosphate and uranium mining industries generate approximately 443 million
metric tons of radioactive waste (with a radioactivity level of more than 5
picocuries/gram, the level established as a "cleanup" standard under the 1983
standards for Protection Against Uranium Mill Tailings). There are also 5
million metric tons of asbestos-containing waste (asbestos content greater
than 1 percent by weight) generated each year. Estimated amounts of
potentially hazardous wastes are reported in Table ES-3.
Of the estimated 1,340 million metric tons of waste generated annually by
metal, asbestos, and phosphate mining, 61 million tons are estimated to be
hazardous under current RCRA Subtitle C characteristics. Adding wastes with
ES-12

Table ES-3 Estimated Amounts of Wastes with RCRA Hazardous Characteristics andOther Wastes Potentially Subject to Regulation as Hazardous Wastes Under RCRA
Annual amount (millions ofCategory metric tons) Source Potential danger
RCRA CharacteristicsCorrosive 50 Copper 1 each Ground-water dump liquor acidification
EP toxic 11 Gold, silver, lead, Toxic metal zinc wastes ground-water
contamination
Other CategoriesPrecious metal 9 Gold, silver Cyanide contamination recovery wastes of surface and ground water
Heap leaching 14a Gold, silver Cyanide contaminationwastes of surface and ground water
Dump leaching 182a Copper dump leach Massive release ofwaste wastes toxic metals and
low pH liquids
Radioactive 352 Phosphate, Radonwastes (5 pCi/g) 91 uranium emissions
Acid 95 Copper mill Release of low pH formation tailings liquids after closure
Asbestos 5 Asbestos mines Cancer and mills
755a
a The total annual amount of waste is not equal to the sum of hazardous wastein each category because some wastes are in more than one category. Forexample, 50 million metric tons of copper dump leach waste are also corrosive,and 4 million metric tons of gold tailings are both EP toxic and contaminatedwith cyanide.
ES-13

high acid formation potential, those that contain asbestos, those that are
potential candidates for listing because they commonly have high levels of
cyanide (greater than or equal to 10 mg/1), and radioactive wastes (radium-226
greater than or equal to 5 picocuries/gram) would increase this total to 755
million metric tons of potentially hazardous waste generated by these mining
industry segments each year.
EPA conducted a study to determine whether mining waste management
facilities leak and, if they do, whether they release constituents that are of
concern. Surface water and/or ground water was monitored at eight
representative active mine sites. Results indicate that constituents from
impoundments do enter ground water at most sites, but significant increases in
the concentrations of hazardous constituents were rarely demonstrated.
Damage cases, however, show that mine runoff and seepage have adversely
affected surface and ground water in several mining districts. Sudden and
chronic releases of cyanides, acids, and metals have reduced fish populations
and the number of other freshwater organisms. However, some of these incidents
were caused by waste management practices that are no longer in use.
THE ECONOMIC COST OF POTENTIAL RCRA WASTE MANAGEMENT
EPA examined the wide range of potential costs that regulating mining
wastes as hazardous under RCRA could impose on facilities and segments of the
mining industry. To examine this range, EPA estimated the incremental costs,
those over and above the costs the industry already incurs to manage wastes,
for eight regulatory scenarios of varying stringency. EPA constructed these
eight scenarios by taking all combinations of four different sets of manage-
ment standards and two criteria for determining whether wastes are hazardous.
ES-14
The estimation procedure applied specific information from 47 mines to develop
costs at these mines and then extrapolated these results to the universe
covered in this report.
The management standards that EPA examined ranged from imposing the full
set of RCRA Subtitle C regulations (the most expensive set of management
standards, Scenario l) to requiring only a limited set of requirements:
permits, a leachate collection system, a ground-water monitoring system, a
run-on/runoff system, and post-closure maintenance (Scenario 4). Under the
first criterion for determining whether wastes were hazardous, waste streams
failing the Subtitle C characteristics tests for EP toxicity and corrosivity
and cyanide wastes from gold metal recovery operations were included as
hazardous (Scenario A). Under the second criterion, all wastes captured under
the first set were included, as well as (1) wastes from gold and silver heap
leach operations, (2) wastes with high acid formation potential, and (3)
copper dump leach wastes (Scenario B) . Both hazardous waste criteria captured
only wastes from the copper, gold, silver, lead, and zinc mining segments.
Estimated costs could be very substantial, depending on the management
standards and criteria for defining hazardous waste. Under the most costly
combination (the unlikely scenario imposing the full set of RCRA regulations
and the most restrictive criterion for determining whether waste is hazardous,
Scenario 1B), the annualized costs for the mining segments covered by the
assessment were $850 million per year, while for the least costly combination
(maintenance and monitoring), the annualized cost was $7 million per year.
(Annualized costs resemble mortgage payments, in that they spread the present
value of total costs into equal payments over the time period EPA estimates
the affected mines will be productive.)
ES-15

As the previous paragraph demonstrates, costs vary substantially across
the different cost scenarios. Generally, the highest cost scenarios are
several times more expensive than the intermediate cost scenarios; these, in
turn, are several times more expensive than the least expensive. The
additional waste management costs incurred by adding Scenario B wastes to the
wastes to be regulated are also substantial; the costs of managing all
Scenario B wastes would be two to four times higher than the costs of managing
only the Scenario A wastes, for any given management standard.
The potential costs of regulation also vary widely for the five individual
metal mining segments, both across segments and scenarios. Under all
scenarios, the copper industry would incur the largest cost, while the gold
industry would bear the second highest lifetime cost.
The additional effects of regulation on some segments of the mining
industry could be substantial. For a low-cost scenario, average affected
facilities in the zinc segment (the segment most affected by regulatory costs
as a percent of direct product cost) would incur costs as high as 5 percent of
direct product costs, while under a high-cost scenario a zinc facility could
incur costs of 10 percent. Under a high-cost scenario, RCRA compliance costs
as a percent of direct product cost for the average affected facility were 21
percent in the lead industry and ranged upward of 120 percent in the copper
industry.
CONCLUSIONS
Structure and Location of Mines
EPA focused on segments producing and concentrating metallic ores,
phosphate rock, and asbestos, totalling fewer than 500 active sites during
1985. These sites are predominantly in sparsely populated areas west of the
ES-16

Mississippi but have great diversity in size, product value, and volumes of
material handled. Several segments are concentrated primarily in one state:
the iron segment is mainly concentrated in Minnesota, lead in Missouri, copper
in Arizona, asbestos in California, and phosphate in Florida.
Waste Quantities
Aggregate waste quantities generated were 1.3 and 2 billion metric tons
per year in 1982 and 1980, respectively. The accumulated waste (for segments
other than coal) is estimated to be approximately 50 billion metric tons.
Waste-to-product ratios are generally higher in mining industry segments than
in other industrial segments. Some individual mines and mills handle more
materials than many entire industries, but 25 percent of the mines studied
handled less than 1,000 metric tons per year.
Potential Hazard Characteristics
Of the 1.3 billion metric tons of wastes that EPA estimates will be
generated by extraction and beneficiation in 1985, about 61 million metric
tons (5 percent) exhibit the characteristics of corrosivity and EP (extraction
procedure) toxicity. Another 23 million metric tons (2 percent) are
beneficiation wastes contaminated with cyanide. Also, there are 182 million
metric tons (14 percent) of copper leach dump material and 95 million metric
tons (7 percent) of copper mill tailings with the potential for release of
acidic and toxic liquids. If waste with radioactivity content greater than 5
picocuries per gram is considered hazardous, the hazardous volume is 443
million metric tons (34 percent) from the phosphate and uranium segments; if
waste with radioactivity greater than 20 picocuries per gram is considered
hazardous, the total is 93 million metric tons (7 percent). Four asbestos
mines generated about 5 million metric tons (less than 1 percent) of waste
with a chrysotile content greater than 5 percent.
ES-17

Evidence of Environmental Transport
At mine sites, ground-water monitoring is difficult and expensive, and
generally is not conducted on a large scale. From short-term monitoring
studies at eight sites, EPA detected seepage from tailings impoundments, a
copper leach dump, and a uranium mine water pond. However, EP toxic metals of
concern did not appear to have migrated during the 6- to 9-month monitoring
period. Other ground-water monitoring studies have detected sulfates,
cyanides, and other contaminants from mine runoff, tailings pond seepage, and
leaching operations.
Evidence of Damages
Incidents of damage (contamination of drinking water aquifers, degradation
of aquatic ecosystems, fish kills, and related reductions of environmental
quality) have been documented in the phosphate, gold, silver, copper, lead,
and uranium segments. There are 13 mining sites on the National Priorities
List (Superfund), including five gold/silver, three copper, three asbestos,
and two lead/zinc mines. The asbestos Superfund sites differ from other sites
in that these wastes pose a hazard via airborne exposure. It is not clear,
from the analysis of damage cases and Superfund sites, whether or not current
waste management practices can prevent damage from seepage or sudden releases.
However, it is clear that some of the problems at abandoned or Superfund sites
are attributable to waste disposal practices not currently used by the mining
industry.
Waste Management Practices
Site selection for the mine, as well as its associated beneficiation and
waste disposal facilities, is the single most important aspect of
environmental protection in the mining industry. Most mine waste is disposed
of in piles, and most tailings in impoundments. Mine water is often recycled
ES-18

through the mill and used for other purposes on site. Offsite utilization of
mine waste and mill tailings is limited (2 to 4 percent). Some management
measures (e.g., source separation, treatment of acids or cyanides, and waste
stabilization) now used at some facilities within a segment of the mining
industry could be more widely used. Other measures applied to hazardous waste
in nonmining industries may not be appropriate. Soil cover borrowed from
surrounding terrain may create additional reclamation problems in arid
regions.
Potential Costs of Regulation
For five metal mining segments, total annualized costs range from $7
million per year (for a scenario that emphasizes primarily basic maintenance
and monitoring, for wastes that are hazardous by RCRA characteristics) to over
$800 million per year (for an unlikely scenario that approximates a full RCRA
Subtitle C regulatory approach, emphasizing cap and liner containment for all
wastes considered hazardous under the current criteria, plus cyanide and acid
formation wastes). About 60 percent of the total projected annualized cost at
active facilities can be attributed to the management of waste accumulated
from past production. Those segments with no hazardous wastes (e.g., iron)
would incur no costs. Within a segment, incremental costs would vary greatly
from facility to facility, depending on current requirements of state laws,
ore grade, geography, past waste accumulation, percentage of waste with
hazardous characteristics, and other factors.
RECOMMENDATIONS
Section 8002(f) of RCRA requires EPA to conduct a study of the adverse
effects of mining waste and to provide "recommendations for Federal...actions
concerning such effects." Based on our findings from this study, we make
ES-19

several preliminary recommendations for those wastes and industry segments
included in the scope of the study. The recommendations are subject to change
based on continuing consultations with the Department of the Interior (DOI)
and new information submitted through the public hearings and comments on this
report. Pursuant to the process outlined in RCRA ~3001(b)(3)(C), we will
announce our specific regulatory determination within 6 months after
submitting this report to Congress.
First, EPA is concerned with those wastes that have the hazardous
characteristics of corrosivity or EP toxicity under current RCRA regulations.
EPA intends to investigate those waste streams. During the course of this
investigation, EPA will assess more rigorously the need for and nature of
regulatory controls. This will require further evaluation of the human health
and environmental exposures mining wastes could present. EPA will assess the
risks posed by mining waste sites and alternative control options. The Agency
will perform additional waste sampling and analysis, additional ground-water
or surface water monitoring and analysis, and additional analysis of the
feasibility and cost-effectiveness of various control technologies.
If the Agency determines through the public comments, consultation with
DOI and other interested parties, and its own analysis, that a regulatory
strategy is necessary, a broad range of management control options consistent
with protecting human health and the environment will be considered and
evaluated. Moreover, in accordance with Section 3004(x), EPA will take into
account "the special characteristics of such waste, the practical difficulties
associated with implementation of such requirements and site specific
characteristics...," and will comply with the requirements of Executive Orders
12291 and 12498 and the Regulatory Flexibility Act.
ES-20

Second, EPA will continue gathering information on those waste streams
that our study indicates may meet EPA's criteria for listing as hazardous
wastes requiring regulation--dump leach waste, because of its high metal
concentrations and low pH, and wastes containing cyanides. Although these
waste streams are potential candidates for listing as hazardous wastes, we
need to gather additional information similar to the information gathered for
the rulemaking for corrosive and EP toxic wastes. When we have gathered
sufficient information, we will announce our decision as to whether to
initiate a formal rulemaking. If the Agency finds it necessary to list any of
these wastes, we will also develop appropriate management standards in the
same manner as we did those developed for corrosive and EP toxic wastes.
Finally, EPA will continue to study radioactive waste and waste with the
potential to form sulfuric acid. The Agency is concerned that radioactive
wastes and wastes with the potential for forming acid may pose a threat to
human health and the environment, but we do not have enough information to
conclude that they do. We will continue to gather information to determine
whether these wastes should be regulated. If EPA finds that it is necessary to
regulate these wastes, the Agency will develop the appropriate measures of
hazard and the appropriate waste management standards.
ES-21

SECTION 1 INTRODUCTION
This report is required by Sections 8002(f) and (p) of the Resource
Conservation and Recovery Act (RCRA), which directs the Environmental
Protection Agency (EPA) to perform studies of wastes generated in the mining,
beneficiation, and processing of ores and minerals and to report the results
of these studies to Congress. This report is based on literature reviews and
contractor studies, including numerous analytical testing results on the
wastes. EPA's RCRA Docket contains copies of the source materials that the
Agency used in preparing this report.
Because Congress has amended the Act several times in ways that changed
the requirements for mining wastes, and because EPA regulations continue to
evolve both in response to legislation and as EPA collects additional
information, a brief legislative and regulatory history provides a useful
context for this Report to Congress.
When first enacted in 1976 (P.L. 94-580), RCRA contained a broad
definition of solid waste that included "solid, liquid, semi-solid, or
contained gaseous material resulting from...mining...operations." [emphasis
added] (Section 1004(27)).
Section 8002(f) of the original Act directed EPA to conduct a
detailed and comprehensive study on the adverse effects of solid wastes from active and abandoned surface and underground mines on the environment, including, but not limited to, the effects of such wastes on humans, water, air, health, welfare, and natural resources, and on the adequacy of means and measures currently employed by the mining industry, Government agencies, and others to dispose of and utilize such solid wastes to prevent or substantially mitigate such adverse effects.
1-1
The study was to include an analysis of:
1. The sources and volume of discarded material generated per year from mining;
2. Present disposal practices;
3. Potential danger to human health and the environment from surface runoff of leachate and air pollution by dust;
4. Alternatives to current disposal methods;
5. The cost of those alternatives in terms of the impact on mine product costs; and
6. Potential for use of discarded material as a secondary source of the mine product.
The Act did not specify a date for the completion of this study.
On December 18, 1978, EPA proposed regulations to implement Subtitle C of
RCRA, including rules for identifying and listing hazardous wastes and for
managing these wastes. Based on the language in the House Committee Report
accompanying the House Bill, which was the predecessor to the Act, EPA
specifically excluded as a hazardous waste "overburden resulting from mining
operations and intended for return to the mine site" unless the overburden was
specifically listed. The Agency proposed to list waste rock and overburden
from uranium mining and overburden and slimes from phosphate surface mining
because of concern about their radioactivity. The proposal also considered any
other mining wastes that were ignitable, corrosive, reactive, or EP toxic as
hazardous waste.
In addition, the proposal included distinct management standards for
"special wastes," which "occur in very large volumes" and for which "the
potential hazards...are relatively low" (43 FR 58992, December 18, 1978). The
Agency proposed less stringent standards for these wastes than for other
1-2
hazardous wastes, pending the development of additional information and a
subsequent planned rulemaking. Certain mining wastes were among the special
wastes. They included phosphate mining, beneficiation, and processing wastes;
uranium mining waste; and other mining waste that was ignitable, corrosive,
reactive, or EP toxic.
On May 19, 1980, EPA promulgated interim final regulations implementing
Subtitle C of RCRA. The Agency retained the exclusion for overburden that was
returned to the mine site; however, the Agency dropped the two proposed
listings, because the regulations "eliminated the part of the proposed
exemption that would. allow exempted overburden to be brought within RCRA
jurisdiction through specific listing as a hazardous waste" (45 FR 33100, May
19, 1980). EPA also promulgated interim final listings for three specific
mining waste streams: (1) flotation tailings from selective flotation from
mineral metals recovery operations, (2) cyanidation wastewater treatment
tailings pond sediment from mineral metals recovery operations, and (3) spent
cyanide bath solutions from mineral metals recovery operations. Before the
first of these listings became effective, however, EPA withdrew this listing
based on technical comments from the regulated community.
These promulgated standards did not have distinct and less stringent
management standards for mining wastes. Between the time of the proposal and
the promulgation of the interim final rule, EPA modified the EP toxic and
corrosivity criteria for hazardous wastes, and the Agency therefore
anticipated that a smaller quantity of mining wastes would be classified as
hazardous based on results of tests for these two characteristics. However,
EPA judged that wastes so classified would clearly exhibit sufficient toxicity
to be of concern. "Thus the concern over the inapplicability of the proposed
1-3

regulations to hazardous special wastes, due to the potentially large volume and
low level of hazard of these wastes, is not a valid concern in the final
regulations" (45 FR 33174, May 19, 1980). The preamble also noted that there was
no current provision that would permit deferring the regulation of mining wastes
until the results of the Section 8002(f) study were available. EPA did point out,
however, that Congress was considering legislation that would amend RCRA to
require deferral until the study was complete.
Congress then amended RCRA in the Solid Waste Disposal Act of 1980 (P.L.
96-482), enacted on October 21, 1980. Among other things, the amendments
prohibited EPA from regulating solid waste from the "extraction,
beneficiation, and processing of ores and minerals, including phosphate rock
and overburden from the mining of uranium ore" as hazardous wastes under
Subtitle C of RCRA until at least 6 months after the Agency completed and
submitted to Congress the studies required by Section 8002(f) and by a new
section, 8002(p).
Section 8002(p) requires EPA to perform a comprehensive study on the
disposal, and utilization of solid waste from the extraction, beneficiation,
and processing of ores and minerals, including phosphate rock and overburden
from uranium mining. This new study, to be conducted in conjunction with the
study of mining wastes required by Section 8002(f), mandated an analysis of:
1. The source and volumes of such materials generated per year;
2. Present disposal and utilization practices;
3. Potential danger, if any, to human health and the environment from the disposal and reuse of such materials;
4. Documented cases in which danger to human health or the environment has been proven;
1-4

5. Alternatives to current disposal methods;
6. The costs of such alternatives;
7. The impact of these alternatives on the use of phosphate rock and uranium ore, and other natural resources; and
8. The current and potential utilization of such materials.
The amendments also required the Administrator, "after public hearings and
opportunity for comment, either to determine to promulgate regulations" for
mining wastes or "to determine that such regulations are unwarranted." These
determinations must be published in the Federal Register.
Finally, the amendments specified that EPA could control radiation
exposures caused by mining wastes under RCRA. Section 3001(b)(3)(B)(iii)
authorized the Administrator to
prescribe regulations. ..to prevent radiation exposure which presents an unreasonable risk to human health from the use in construction or land reclamation (with or without revegetation) of (I) solid waste from the extraction, beneficiation, and processing of phosphate rock or (II) overburden from the mining of uranium ore.
On November 19, 1980, EPA published an interim final rule to implement the
1980 RCRA Amendments. Specifically, EPA excluded from regulation under
Subtitle C of the Resource Conservation and Recovery Act "... solid waste from
the extraction, beneficiation and processing of ores and minerals (including
coal), including phosphate rock and overburden from the mining of uranium ore"
(45 Fed. Reg. 76618, codified at 40 CFR 261.4(b)(7)). The Agency interpreted
the scope of the exclusion very broadly:
Until the Agency takes further rulemaking action on this matter, it will interpret the language of today's amendments, with respect to the mining and mineral processing waste exclusion, to include solid waste from the exploration, mining, milling, smelting and refining of ores and
1-5

minerals. This exclusion does not, however, apply to solid wastes, such as spent solvents, pesticide wastes, and discarded commercial chemical products, that are not uniquely associated with these mining and allied processing operations (45 FR 76619, November 19, 1980).
EPA solicited public comment on its interpretation to assist in determin-
ing the appropriate scope of the statutory exclusions.
In particular, EPA questions whether Congress intended to exclude (1) wastes generated in the smelting, refining and other processing of ores and minerals that are further removed from the mining and beneficiation of such ores and minerals, (2) wastes generated during exploration for mineral deposits, and (3) wastewater treatment and air emission control sludges generated by the mining and mineral processing industry. EPA specifically seeks comment on whether such wastes should be part of the exclusion. EPA also seeks comment on how it might distinguish between excluded and non-excluded solid wastes (45 FR 76619, November 19, 1980).
The Hazardous and Solid Waste Amendments of 1984, enacted in November of
that year as P.L. 98-616, represent the culmination of the House and Senate
reauthorization hearings begun in early 1983. Of chief concern to the mining
industry are amendments that provide EPA flexibility in applying bans on land
disposal and certain requirements for obtaining permits under Subtitle C of
RCRA to the mining industry.
The amended statute provides, under Section 3004(x), that if mining wastes
become subject to regulation as hazardous wastes under Subtitle C, the
Administrator of EPA, in promulgating regulations, is authorized to modify the
requirements of subsections (c), (d), (e), (f), (g), (o), and (u) of Section
3004 and subsection 3005(j), which relate to:
1. Liquids in landfills,
2. Prohibitions on land disposal,
3. Solvents and dioxins,
4. Disposal into deep injection wells,
1-6

5. Additional land disposal prohibition determinations,
6. Minimum technological requirements,
7. Continuing releases at permitted facilities, and
8. Interim status surface impoundments.
The Administrator is authorized to take into account the special
characteristics of mining and beneficiation wastes, "the practical
difficulties associated with implementation of such requirements, and site-
specific characteristics, including, but not limited to, the climate, geology,
hydrology, and soil chemistry at the site, so long as such modified
requirements assure protection of human health and the environment."
The Conference Report accompanying H.R. 2867 (which in its final amended
form was passed by both Houses of Congress as P.L. 98-616) provides
clarification:
This Amendment recognizes that even if some of the special study wastes [which include mining wastes as specified in Sections 8002 (f) and (p)] are determined to be hazardous it may not be necessary or appropriate because of their special characteristics and other factors, to subject such wastes to the same requirements that are applicable to other hazardous wastes, and that protection of human health and the environment does not necessarily imply the uniform application of requirements developed for disposal of other hazardous wastes. The authority delegated to the Administrator under this section is both waste-specific and requirement-specific. The Administrator could also exercise the authority to modify requirements for different classes of wastes. Should these wastes become subject to the requirements of Section 3005 (j), relating to the retrofit of surface impoundments, the Administrator could modify such requirements so that they are not identical to the requirements that are applied to new surface impoundments containing such wastes. It is expected that before any of these wastes become subject to regulations under subtitle C, the Administrator will determine whether the requirements of Section 3004 (c), (d), (e), (f), (g), (o), and (u), and Section 3005(3) should be modified [H.R. Report 98-1133, pp. 93-94, October 3, 1984].
On October 2, 1985, EPA proposed (50 Fed. Reg. 401292) to reinterpret the
scope of the mining waste exclusion as it applies to processing wastes,
1-7

leaving within it only large-volume processing wastes, such as slag from
primary metal smelters and elemental phosphorus plants, red and brown muds
from bauxite refineries, and phosphogypsum from phosphoric acid plants. Those
other wastes from processing ores and minerals that are hazardous would be
brought under full Subtitle C regulation after the promulgation of the
reinterpretation, and would therefore not be included in the scope of a
subsequent Report to Congress on processing wastes. The large-volume
processing wastes that remain within the exclusion would be studied and a
Report to Congress prepared to complete EPA's response to the RCRA Section
8002(p) mandate.
Thus, EPA must submit a Report to Congress under RCRA Sections 8002(f) and
(p) and then publish its findings in the Federal Register before any waste
covered by the mining exclusion can be regulated under Subtitle C of RCRA. No
such restrictions, however, apply to wastes not included within the scope of
the exclusion.
1.1 SCOPE
This report addresses waste from the mining and beneficiation of metallic
ores, with special emphasis on copper, gold, iron, lead, molybdenum, silver,
and zinc; uranium overburden; and the nonmetals asbestos, phosphate rock, and
oil shales. (Appendix A to this report addresses wastes from the mining and
beneficiation of oil shales.) EPA selected the mining industry segments to be
covered in this report on the following basis. First, the Agency excluded
wastes that are the primary responsibility of other regulatory agencies. Thus,
this report does not address uranium mill tailings or the mining and
beneficiation of coal. The Uranium Mill Tailings Radiation Control Act of 1978
(UMTRCA) (P.L. 95-604) requires proper disposal of "residual radioactive
1-8

material," including mill tailings and residual stocks of unprocessed ores or
low-grade materials. UMTRCA directed EPA to prepare a Report to Congress on
uranium mill tailings, and the Agency has done so.1 Under UMTRCA, EPA
determines "standards of general application," and the Nuclear Regulatory
Commission writes the implementing regulations and enforces them for active
mills. Uranium mill tailings are defined as "byproduct material" by the Atomic
Energy Act and, as such, do not constitute a "solid waste" as defined by RCRA
Section 1004(27). Therefore, they are not subject to RCRA requirements.
The Surface Mining Control and Reclamation Act of 1977 (SMCRA) (P.L. 95-
87) applies to surface coal mining reclamation activities. Under RCRA, the
Administrator of EPA must review any regulations under SMCRA that are
applicable to coal mining wastes and overburden. However, the Secretary of the
Interior, with concurrence from the Administrator of EPA, is responsible for
promulgating regulations that effectuate the purposes of Subtitle C of RCRA
with respect to "coal mining wastes or overburden for which a surface coal
mining and reclamation permit is issued or approved under the Surface Mining
Control and Reclamation Act of 1977."
The Agency also excluded from the scope of this report wastes generated in
the processing of ores or minerals. EPA will address large-volume wastes (such
as slag and phosphogypsum) generated by these processes in a subsequent
report. EPA will also evaluate other nonmetal mining wastes (in addition to
asbestos and phosphate) and wastes from inactive or abandoned mines at a later
time.
1-9

1.2 CONTENTS
This report consists of seven sections and four appendices. The following
paragraphs briefly discuss each of the remaining sections of the report.
Section 2, OVERVIEW OF THE NONFUEL MINING INDUSTRY,2 presents a summary
of the mining and beneficiation of ores and minerals and provides information
on the number of mines, their geographic distribution, and the quantity of
waste generated in mining and beneficiation.
Section 3, MANAGEMENT PRACTICES FOR MINING WASTES, provides an overview of
the mining waste management process and discusses specific waste management
practices and mitigative measures for the land disposal of mining waste. For
some segments of the industry, the section provides information on the
proportion of mine facilities that currently practice these mitigative
measures.
Section 4, POTENTIAL DANGER TO HUMAN HEALTH AND THE ENVIRONMENT, presents
information on the characteristics of the wastes that pose a potential threat
to human health and the environment. It estimates how much mining industry
waste would fail current RCRA hazardous waste characteristics, and how much
would be hazardous under an augmented set of characteristics. It then provides
the results of EPA's monitoring of ground water at selected sites. It also
discusses the structural stability of impoundments used to manage mining
waste. Next, it presents damage cases. Finally, it describes how risk analysis
could be used to quantify the effects that current and alternative practices
have on human health and the environment.
Section 5, THE ECONOMIC COST OF POTENTIAL RCRA WASTE MANAGEMENT, first
presents the methodology EPA used to determine the potential cost of
regulating mining wastes under RCRA, using four different regulatory scenarios
1-10

and two different sets of hazard criteria. The section then presents the
results of the analysis in terms of total potential costs, the potential costs
to various mining sectors, and the potential costs to the affected mines.
Section 6, CONCLUSIONS AND RECOMMENDATIONS, summarizes the conclusions
reached in the other sections of the report and presents EPA's
recommendations.
Section 7, SELECTED BIBLIOGRAPHY, lists the sources that were used in this
report as well as some references that contain valuable information related to
mining waste.
This report also contains four appendices:
* Appendix A, SUMMARY OF MAJOR WASTES FROM THE MINING AND PROCESSING
OF OIL SHALES, summarizes a report on high-volume wastes generated
by the mining and processing of oil shales. This information was
not included in this Report to Congress because the United States
oil shale industry is not yet operating on a commercial scale. The
entire oil shale report is available in the EPA docket.
* Appendix B, METHODOLOGY, describes the methodology used by EPA to
assess current industry waste management practices and to estimate
the amount of hazardous mining waste generated annually.
* Appendix C, SELECTED CRITERIA ANALYZED FOR TOXIC EFFECTS, contains
tables comparing levels of metals measured by the EP toxicity test
allowed by various EPA standards and criteria; tables on arsenic,
cadmium, chromium, lead, mercury, selenium, and cyanide toxicity to
aquatic biota are also included. In addition, this appendix
summarizes radiation effects and effects of asbestos exposure on
various biological species, and the effects of decreasing pH on
fish.
1-11

* Appendix D, GLOSSARY, provides definitions of mining-
related and other technical terms referred to in the text.
1-12

SECTION 1 FOOTNOTES
1 US EPA 1983a.
2 For the purposes of this report, the nonfuel mining industry is defined as including uranium although processed uranium may be used as fuel.
1-13

SECTION 2
OVERVIEW OF THE NONFUEL MINING INDUSTRY
The nonfuel mining industry is an integral part of our economy. It
provides a diversity of products, including the lead used in storage
batteries, ammunition, and pigments; copper for electrical equipment and
supplies; iron for the construction and transportation industries; zinc for
galvanizing and other uses; silver for photographic materials; gold for
electronic equipment, jewelry, and medicinal use; and the uranium used by
electric utilities. This sector also produces nonmetallic minerals such as
asbestos for use in insulating materials and phosphates used to produce
industrial chemicals and fertilizers.1 The total metal ore production in
the United States was worth more than $5.8 billion, and the total value of raw
nonfuel minerals was more than $21 billion in 1983.2 This value accounted for
1 percent of the Gross National Product (GNP), while products made from
these raw materials account for approximately 9 percent of the GNP annually. 3
2.1 NONFUEL MINING SEGMENTS There were 580 metal mines and
12,117 nonmetal mines active in 1980 (the most recent year for which complete
data are available from the U.S. Bureau of
Mines).4 The number of active mines varies from year to year, depending on
factors such as the level of U.S. economic activity, the costs of production
in the mining industry, the demand for products derived from nonfuel minerals,
and prices in international markets. In general, the number of mines in
operation has decreased over the past several years; however, a reasonable
estimate for 1983 indicates that between 400 and 500 metal mines operated in
2-1

the segments covered here. Table 2-1 lists the number of active nonfuel mines
in 1980, 1981, and 1982 for the mining industry segments covered in this
report: all metal mines, except gold placer operations, appear in the metals
category, and all asbestos and phosphate mines appear in the nonmetals
category. The metal mining segments include copper, gold, iron ore, lead,
molybdenum, silver, uranium, zinc, and a group of "other" metals. The metals
in the "other" category have been grouped in order to avoid disclosing
confidential business information; they include antimony, bauxite, beryllium,
mercury, nickel, the rare earth metals, titanium, and vanadium. Because
domestic tin and manganiferous ore mines have been minor sources of ore since
1982, these segments are not covered in this report. Platinum also is not
covered in this report because no platinum mines have been active since 1982.
Although mines are classified on the basis of their predominant product,
they may also produce large quantities of other materials as coproducts. For
example, in 1978, U.S. zinc mines produced 72 percent of all zinc; 100 percent
of all cadmium, germanium, indium, and thallium; and 3.1, 4.1, and 6.1 percent
of all gold, silver, and lead mined in the United States, respectively. In the
same year, copper mines produced over 30 percent of the silver, 35 percent of
the gold, and 100 percent of the rhenium, selenium, palladium, tellurium,
and platinum mined in this country.5 Thus, a copper mine may also produce
gold and silver as coproducts. Table 2-2 summarizes the products and
coproducts for selected metal mining segments.
In most mining segments, a few large mines produce most of the product.
Table 2-3 shows the number of mines in each segment, categorized by volume of
material handled. This volume includes the amount of earth and rock that must
be removed to reach the ore. About half of all U.S. metal mines active in 1982
were small, handling less than 10,000 tons of material each. These 213
2-2

Table 2-1 Number of Active Mines in the Industry Segments Covered in This Report in 1980, 1981, and 1982a
Mining Number of Number of Number ofindustry mines mines minessegment 1980 1981 1982
Metals:
Bauxite (alum) 10 10 8Copper 39 44 32Goldb 44 107 101Iron ore 35 31 26Lead 33 29 17Silver 43 75 63Titanium 5 5 5Tungsten 29 29 23Uranium 265 95 128Zinc 20 17 14Other metalsc 21 18 21
Subtotal 544 560 438
Nonmetals:
Asbestos 4 4 3Phosphate rock 44 43 33
Subtotal 48 47 36
TOTAL 592 607 474
a Excludes wells, ponds, and pumping operations.b Excludes placer operations.c Includes antimony, beryllium, mercury, molybdenum, nickel, platinum, rare-earth metals, and vanadium.
Source: Adapted from BOM 1981a, BOM 1982, and BOM 1983.
2-3

Table 2-2 Product As a Percentage of Total Output for Selected U.S. Metal Mines in 1978
Product or CoproductPrimarymine Copper Gold Lead Silver Zincproduct
Copper 98.8 36.7 __b 31.7 1.3
Gold __b 55.6 __b 1.7 __b
Lead 0.8 O.1 90.3 8.7 25
Silver 0.3 4.1 3.4 53.7 0.9
Zinc O.1 3.1 6.1 4.1 72
Totala 100.0 99.6 99.8 99.9 99.2
a Totals may not equal 100 percent due to rounding.
b Indicates less than 0.5 percent.
Source: Adapted from BOM 1981a.
2-4

Table 2-3 Mines in the Industry Segments Covered in this Report in 1982,by Volume of Material Handleda,b
Total Less 1,000 1O,000 l00,000 1,000,000 MoreMining number than to to to to thanindustry of 1,000 l0,000 100,000 1,000,000 10,000,000 10,000,000segment mines tons tons tons tons tons tons
Metals:
Bauxite (aluminum) 8 -- 1 5 2 -- --Copper 32 3 1 5 1 15 7Goldc 101 41 28 11 14 6 1Iron ore 26 -- 2 4 6 8 6Lead 17 7 1 -- 2 7 --Silver 63 32 14 6 10 1 --Titanium 5 -- -- -- 1 4 --Tungsten 23 18 2 2 1 -- --Uranium 128 16 34 52 24 2 --Zinc 14 -- 1 2 9 2 --Other metalsd 21 5 7 2 2 5 --
Subtotal 438 122 91 89 72 50 14
Nonmetals:
Asbestos 3 -- -- 3 -- -- --Phosphate rock 33 -- 1 -- 4 23 5
Subtotal 36 -- 1 3 4 23 5
TOTAL 474 122 92 92 76 73 19
a Includes product and waste, but excludes wells, ponds, and pumping operations.b These data are reported in short tons; one short ton equals 1.1 metric tons.c Excludes placer operations.d Includes antimony, beryllium, mercury, molybdenum, nickel, rare-earth metals, and vanadium
Source: BOM 1981a.

small mines handled only 10 percent of the material handled by the 14 largest
mines.
2.2 GEOGRAPHIC DISTRIBUTION OF MINES
Because ores occur only in certain geologic formations, most of the mining
in each industry segment is concentrated in a few locations. Copper mining is
centered in three states: Arizona, Utah, and New Mexico. Other states where
copper is mined as a coproduct of silver, zinc, and lead production are
Montana, Tennessee, and Missouri, respectively. Some copper mines and mills
are close to large cities (Tucson and Salt Lake City), but most active
operations are in sparsely populated (four people per square kilometer,
compared with a national average of 25 people per square kilometer) parts of
Arizona.
Nevada, South Dakota, and Montana were responsible for 85 percent of the
primary gold production in 1983 (excluding gold produced by Alaskan placer
operations). Other primary gold-producing states are California, Colorado,
Idaho, New Mexico, and Utah. Gold is also produced as a coproduct of silver
and copper mining in Utah, Nevada, and Arizona. Placer mines in Alaska and
gold heap leaching operations in Nevada are located in areas far removed from
population centers.
Almost all iron ore is mined in Minnesota and Michigan, although Texas,
Missouri, Utah, Wyoming, and California combined are responsible for
approximately 5 percent of all iron ore production. Primary lead production in
the United States is confined to Missouri, where lead mining is concentrated
in the Mark Twain National Forest (the average population density in the
southeastern part of the state is five people per square kilometer). Lead is
also recovered as a coproduct from some western mining operations. Colorado is
the primary molybdenum-producing state. Although silver is mined
2-6

in many states, its production as a primary metal is concentrated in sparsely
populated areas of Idaho, Montana, Nevada, and Utah. Primary silver production
accounted for 70 percent of U.S. silver output in 1983, an increase of 54
percent since 1978 (see Table 2-2). The remainder was produced as a coproduct
of copper, gold, lead, and other metals mining activities.
Uranium mining is concentrated in sparsely populated parts of New Mexico,
Wyoming, Colorado, and Utah. Zinc is produced in Tennessee, New York,
Missouri, New Jersey, Idaho, and Colorado; Missouri produces 21 percent of all
U.S. zinc as a coproduct of lead production. Zinc is also a coproduct of
silver production. Zinc mining in Tennessee and New York is located in
moderately populated areas (45 people per square kilometer in Tennessee and 16
people per square kilometer in New York). The largest Tennessee zinc mining
district is 50 kilometers from Knoxville.
The mining of metals in the other metals category is generally restricted
to the metal ore-producing states mentioned above. Additionally, California
produces tungsten and rare earth metals, and Arkansas produces bauxite for
metallurgical uses.
Asbestos mining is restricted to California and Vermont. The asbestos mine
in Vermont and one of the mines in California are in areas of moderate
population density. Phosphate mining is concentrated in Florida, North
Carolina, and Idaho. In Idaho, phosphate mining occurs in a sparsely populated
area; but in Florida, most phosphate operations are about 65 kilometers east
of Tampa, in an area with a population density of 68 people per square
kilometer. Table 2-4 summarizes the number of operating mines and percentage
of 1983 production in each state, arranged by EPA region, for the nonfuel
mining segments covered in this report. Note that for some products, a few
mines are responsible for the majority of all primary production. For
2-7

Table 2-4 Active Mines and Percentage of Production by State a in 1983.
States arranged Copper Goldb Iron ore Lead Molybdenum Silver Uranium Zinc Asbestos Phosphateby EPA region
IVermont -- -- -- -- -- -- -- -- 1(25) --
IINew Jersey -- -- -- -- -- -- -- 1(8) -- --New York -- -- -- -- -- -- -- 2(27) -- --
IIIPennsylvania -- -- -- -- -- -- -- 1(8) -- --
IVFlorida -- -- -- -- -- -- -- -- -- 20(74)N. Carolina -- -- -- -- -- -- -- -- -- 1(11)Tennessee 1(1) -- -- -- -- -- -- 7(51) -- 4(3)
VMichigan -- -- 2(25) -- -- -- -- -- -- --Minnesota -- -- 9(70) -- -- -- -- -- -- --
VIN, Mexico 2(11) 6(3) -- -- -- 5(1) 20(25) -- -- --Texas -- -- 2(1) -- -- -- 6(5) -- -- --
VIIMissouri -- -- 1(2) 7(100) -- -- -- -- -- --
VIIIColorado -- 20(4) -- -- 2(100) 5(6) 28(15) 1(6) -- -- Montana 1(3) 16(10) -- -- -- 9(17) -- -- -- 1(1) S.Dakota -- 1(19) -- -- -- -- -- -- -- Utah 1(17) 1(2) 3(1) -- -- 3(8) 23(13) -- -- 1(1)Wyoming -- -- 2(1) -- -- -- 22(40) -- -- --
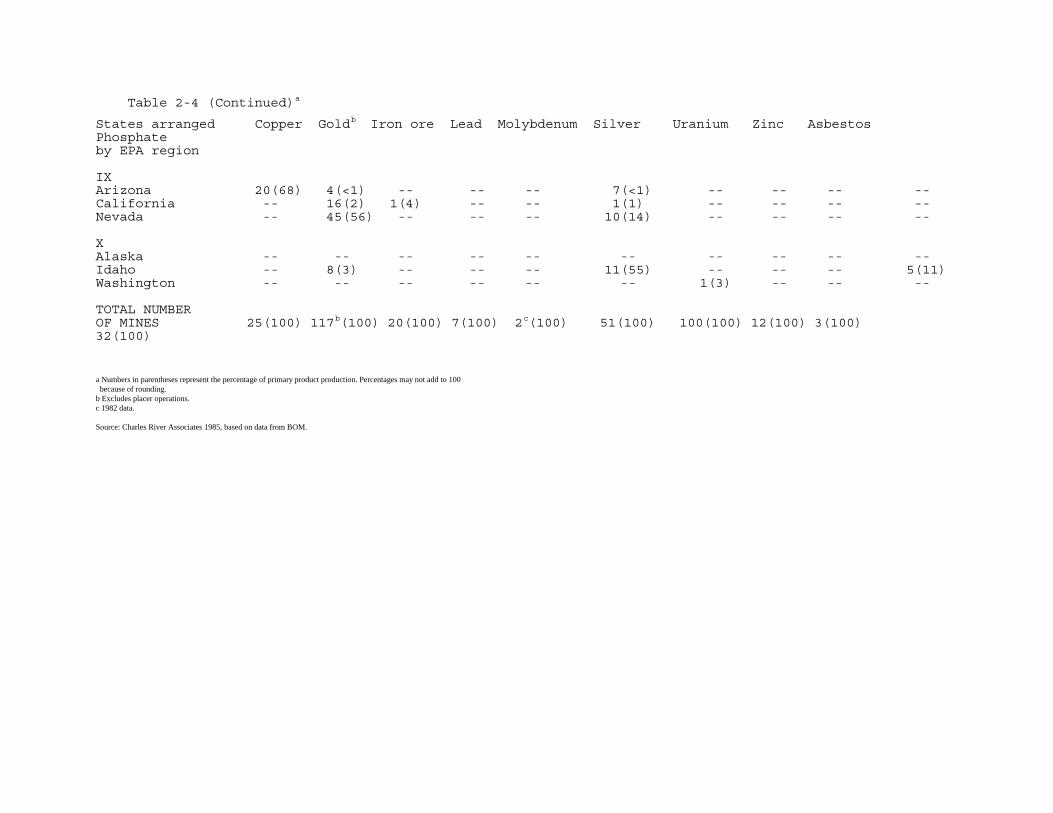
Table 2-4 (Continued)a
States arranged Copper Goldb Iron ore Lead Molybdenum Silver Uranium Zinc Asbestos Phosphateby EPA region
IXArizona 20(68) 4(<1) -- -- -- 7(<1) -- -- -- --California -- 16(2) 1(4) -- -- 1(1) -- -- -- --Nevada -- 45(56) -- -- -- 10(14) -- -- -- --
XAlaska -- -- -- -- -- -- -- -- -- --Idaho -- 8(3) -- -- -- 11(55) -- -- -- 5(11)Washington -- -- -- -- -- -- 1(3) -- -- --
TOTAL NUMBEROF MINES 25(100) 117b(100) 20(100) 7(100) 2c(100) 51(100) 100(100) 12(100) 3(100) 32(100)
a Numbers in parentheses represent the percentage of primary product production. Percentages may not add to 100 because of rounding. b Excludes placer operations. c 1982 data.
Source: Charles River Associates 1985, based on data from BOM.

example, two mines produce 75 percent of all U.S. asbestos, nine mines produce
70 percent of all iron ore, and seven mines are responsible for all lead ore
production.
2.3 MINING AND BENEFICIATION WASTES
In the nonfuel mining industry, the valuable portion of the crude ore is a
small fraction of the total volume of material that must be handled to obtain
it (Table 2-5). For example, over 6,900 units of material must be handled to
obtain one marketable unit of uranium. The high ratio of "material handled" to
"marketable product" is due primarily to the low percentage of metal in the
ore and to the mining methods and processes that must be employed. As shown in
Table 2-5, no metal exceeds 5 percent of the crude ore in which it is
embedded, except iron. Aluminum in metallurgical bauxite presents a similar
picture. As high-grade ore reserves continue to dwindle, these percentages are
likely to become even smaller. The fact that the materials handled consist
largely of waste or unusable materials distinguishes these mining industry
segments from many other process industries where waste materials make up a
relatively small portion of the materials processed to produce a final
product.
Several stages in the production of valuable products from minerals and
ores require the handling of large volumes of material, much of which is
waste. Overburden and waste rock must be removed to expose the ore. The ores
are then extracted (mined) and then transported to a nearby mill, where they
are beneficiated (concentrated or dressed). Mining and beneficiation processes
generate four categories of large-volume waste: mine waste, tailings, dump and
heap leach waste, and mine water.
Mining includes a variety of surface and underground procedures. Surface
2-10

Table 2-5 Ratio of Material Handled to Units of Marketable Metal and EstimatedPercentage of Metals in Ore
Mining Ratio of material Typicalindustry handled to units of percentage ofsegment marketable metal a,b metal in orec
Copper 420: 1 O. 6Gold 350,000: 1 O. 0004Iron ore 6:1 33.0Lead 19:1 5.0Mercury NA O.5Molybdenum NA O.2Silver 7,500: 1 0.03Tungsten NA 0.5Uranium 6900: 1 O.15Zinc 27:1 3.7
NA indicates not avail able. a Excludes material from development and exploration activities.
Source: bBOM 1983, and c estimated by Charles River Associates 1985.
2-11

mining methods include quarrying, and open-pit, open-cut, open-cast, dredging,
and strip mining. Underground mining creates adits (horizontal passages) or
shafts by room-and-pillar, block caving, timbered stope, open stope, and other
methods. Hydrometallurgical processes include heap, dump, vat, and in situ
leach methods. (See Appendix D, Glossary, for a description of mining methods.
) The vast majority of nonfuel ores are mined on the surface. Only antimony,
lead, and zinc mining are solely underground operations. As shown in Table 2-
6, the industry segments that employ both methods handled more ore in surface
mines than in below-ground mines (with the exception of silver) in 1982.
6 Surface mining generates more waste than underground mining. Table 2-7
compares the waste and crude ore handled by the industry segments that mine
both above and below ground. (Reliable data were not available for iron ore.)
As shown, the volume of waste as a percentage of the total amount of crude ore
ranges from 9 to 27 percent for underground mines. In surface mining, the
amount of waste ranges from 2 to 10 times the total volume of crude ore. Gold
surface mining creates nearly 12 times as much waste per unit of ore as
underground gold mining; silver generates 59 times as much. All mining methods
used by the industry segments covered in this report generate mine waste. It
should be emphasized, though, that the typical percentage of metal in an ore
(excluding overburden and waste rock) is usually very low (from a few percent
to a fraction of a percent).
Mine waste is the soil or rock that mining operations generate during the
process of gaining access to an ore or mineral body, and includes the
overburden consolidated or unconsolidated material overlying the mined area)
from surface mines, underground mine development rock (rock removed while
sinking shafts, accessing, or exploiting the ore body), and other waste rock,
2-12

Table 2-6 Percentage of Crude Ore Handled at Surface and Underground Mines in1982, by Commodity
Mining industry segment Surface mines Underground mines
Metal s:
Antimony -- 100.0Bauxite (aluminum)100.0 --Beryllium 100.0 --Copper 87.6 12.4Golda 92.0 8.0Iron ore 98.9 1.1Lead -- 100.0Mercury 100.0 --Molybdenum 100.0b WNickel 100.0 --Rare earth metals 100.0 --Silver 36.0 64.0Titanium 100.0 --Tungsten W 100. Oc
Uranium 68.8 31.2Vanadium 100.0 --Zinc -- 100.O
Average percent mined 69.7 30.4
Nonmetal s:
Asbestos 100.0 --Phosphate rock 100.0b --
Average percent mined 100.0 0
Average percent mined,metals and nonmetals 72.8 27.2
W indicates information withheld by Bureau of Mines to protect confidential business information. a Excludes placer operations. b Includes underground operations; the Bureau of Mines does not publish these data separately.c Includes surface operations; the Bureau of Mines does not publish these
data separately.
Source: Adapted from BOM 1983.
2-13

Table 2-7 Material Handled at Surface and Underground Mines in 1982, forSelected Industry Segments (in thousands of metric tons)
Surface Underground
Mining Waste/ Waste/industry Crude crude ore Crude crude oresegment ore Waste ratio ore Waste ratio
Copper 156,004 321,985 2.06 22,040 1,968 0.09
Gold 21,768 48,797 2.24 1,896 369 0.19
Silver 2,186 19,319 8.84 3,891 584 0.15
Uranium 6,848 72,197 10.54 3,111 848 0.27
Source: Adapted from BOM 1983.
2-14
including the rock interbedded with the ore or mineral body. The particle size
of mine waste ranges from small clay particles (0.002 mm diameter) to boulders
(0.3 m diameter). Mine waste piles cover areas ranging from 2 to 240 hectares,
with a mean area of 51 hectares (1 hectare equals 2.471 acres), according to a
U.S. Bureau of Mines (BOM) survey of 456 waste piles in the copper, lead,
zinc, gold, silver, and phosphate industry segments.7
After the ore is mined, the first step in beneficiation is generally
grinding and crushing. The crushed ores are then concentrated to free the
valuable mineral and metal particles (termed values) from the matrix of less
valuable rock (called gangue). Beneficiation processes include physical/
chemical separation techniques such as gravity concentration, magnetic
separation, electrostatic separation, flotation, ion exchange, solvent
extraction, electrowinning, precipitation, and amalgamation.8 The choice of
beneficiation process depends on properties of the metal or mineral ore and the
gangue, the properties of other minerals or metals in the same ore, and the
relative costs of alternative methods. All processes generate tailings, another
type of waste.
Tailings are the waste materials remaining after physical or chemical
beneficiation operations remove the valuable constituents from the ore.
Tailings generally leave the mill as a slurry, consisting of 50 to 70 percent (by
weight) liquid mill effluent and 30 to 50 percent solids (clay, silt, and sand-
sized particles).
More than half of all mine tailings are disposed of in tailings ponds. Use
of tailings ponds is the primary method by which wastewater is treated in the
metals ore mining segment. Also, settling ponds are typically used at mineral
mining and processing operations. Pond size and design vary by industry
segment and mine location. Some copper tailings ponds in the
2-15

southwest cover 240 to 400 hectares (one exceeds 2,000 hectares), while some
small lead/zinc tailings ponds cover less than 1 hectare. Based on a BOM
survey of 145 tailings ponds in the copper, lead, zinc, gold, silver, and
phosphate industries, the average size of these ponds is approximately 200
hectares.9 Many facilities use several ponds in series, which improves
treatment efficiency. Multiple-pond systems offer other advantages as well, as
the tailings themselves are often used to construct dams and dikes.
Technological advances since the turn of the century have made it
economically feasible to beneficiate ore taken from lower-grade ore deposits
(i.e., those with a much lower material-to-waste ratio)10 For example, froth
flotation beneficiation processes have had a tremendous effect on mine
production and on the amount and type of mine waste generated. Not only have
these advances increased mining production, but the volume of waste generated
also has risen dramatically. The tailings from froth flotation operations are
generally alkaline, because the froth flotation process is most efficient at a
higher pH. The metals in the alkaline tailing solids are therefore often
immobile, unless the conditions in the solids change over time.
Dump leaching, heap leaching and in situ leaching are other processes used
to extract metals from low-grade ore. In dump leaching, the material to be
leached is placed directly on the ground. Acid is applied, generally by
spraying, although many sulfide ores will generate acid during wetting. As the
liquid percolates through the ore, it leaches out metals, a process that may
take years or decades. The leachate, "pregnant" with the valuable metals, is
collected at the base of the pile and subjected to further processing to
recover the metal. Dump leach piles often cover hundreds of hectares, rise to
60 meters or more, and contain tens of millions of metric tons of low-grade
ore (overburden), which becomes waste after leaching. The dump leach site is
2-16

often selected to take advantage of impermeable surfaces and to utilize the
natural slope of ridges and valleys for the collection of pregnant leach
solutions. Loss of leach solution is kept to a minimum in order to maximize
metal recovery.
Heap leaching operations are much smaller than dump leach operations,
generally employ a relatively impermeable pad under the leach material to
maximize recovery of the leachate, and usually take place over a period of
months rather than years. Heap leaching is generally used for ores of higher
grade or value. For gold ore, a cyanide solution is used as a leaching
solution, rather than acid. When leaching no longer produces economically
attractive quantities of valuable metals, and the sites are no longer in use,
the spent ore is often left in place or nearby without further treatment.
In situ leaching is employed in shattered or broken ore bodies on the
surface or in old underground workings. Leach solution is applied either by
piping or by percolation through overburden. Leach solution is then pumped
from collection sums to a metal recovery or precipitation facility. In situ
leaching is most economical when the ore body is surrounded by an impervious
layer, which minimizes loss of leach solutions. However, when water is
sufficient as a leach solution, in situ leaching is economical even in
pervious strata.
Leaching processes are used most often in gold (cyanide leach), uranium
(water leach in situ), and copper operations (sulfuric acid).
The final waste type, mine water, is water that infiltrates a mine and
must be removed to facilitate mining. The quantity and quality of the mine
water handled varies from mine to mine; quantities may range from zero to
thousands of liters per ton of ore mined. The number of mine water ponds at
mine sites in the industry segments covered in this report is usually between
one and six.11
2-17

2.4 WASTE QUANTITIES
Table 2-8 presents an estimate of the cumulative amount of tailings and
mine waste generated by the mining and beneficiation of metallic ores,
phosphate rock, and asbestos from 1910 through 1981. As shown, nearly 49
billion metric tons of waste have been generated by the mining and
beneficiation of eight metals and two nonmetals. Copper, iron ore, and
phosphate rock have produced over 85 percent of the total volume of waste.
Mining and beneficiating nonfuel ores and minerals generated approximately
2,000 million metric tons of waste in 1980.12 The waste handled in the U.S.
mining industry declined to 1,300 million metric tons for the industry as a
whole in 1982.13 The industry segments covered in this report are
responsible for more than 90 percent of this nonfuel mining waste. The 1980
and 1982 estimated waste volumes for each segment are shown in Table 2-9. The
copper mining segment alone generates approximately half of the waste produced
by the metal mining segments, and one-third of the total waste. The phosphate
mining industry is responsible for almost all waste from the nonmetal mining
segments, and more than 25 percent of all mining waste discussed. Iron ore and
uranium mining also generate large volumes of waste.
The waste for each mining segment is broken out by waste type for 1980 and
1982 in Tables 2-10 and 2-11, respectively. (Mine water quantities are
variable and difficult to estimate accurately, and are not shown on these
tables.) The waste tonnages shown in Tables 2-10 and 2-11 are estimates based
on primary production data. Over half of all mining waste generated in these
years was mine waste, and tailings accounted for slightly less than one-third
of the total amount of waste.
The phosphate rock, uranium, copper, and iron ore mining segments were, in
that order, the largest generators of mine waste in 1980, accounting for over
2-18

Table 2-8 Estimated Cumulative Mine Waste and Tailings Generated by the Miningand Beneficiation of Metallic Ores, Phosphate Rock and Asbestos, 1910 Through
1981 (millions of metric tons)
Miningindustrysegment Tailings Mine waste Total waste
Metals:
Copper 6,900 17,000 23,900Gold 350 400 750Iron ore 3,000 8,500 11,500Lead 480 50 530Molybdenum 500 370 870Silver 50 30 80Uranium 180 2,000 2,180Zinc 730 70 800
Nonmetals:
Phosphate rock 2,200 5,500 7,700Asbestos 40 30 70
TOTAL 14,430 33,950 48,380
Source: Estimated by Charles River Associates 1985, based on Coppa 1984, BOMvarious years, and BOM 1980a.
2-19

Table 2-9 Estimated Volume of Waste Generated by the Mining and Beneficiationof Metallic Ores, Asbestos,
Phosphate Rock, and Overburden From Uranium Mininga (millions of metrictons/year)
Mining industry segment 1980 1982
Metal s:
Copper 723 502Goldb 38 74Iron ore 350 177Lead 11 11Molybdenum 46 30Silver 13 26Uranium (mine waste only ) 298 73Zincc 6 7Other metalsd 29 26
Subtotal 1,514 926
Nonmetal s:
Asbestos 7 6Phosphate rock 500 403
Subtotal 507 409
TOTAL 2,021 1,335
a Excludes mine water.b Excludes placer operations.c About 4 million metric tons of saleable products are extracted before
tailings disposal.d Includes antimony, bauxite, beryllium, manganiferous ore, mercury, platinum,rare earth metals, tin, tungsten, and vanadium.
Source: Estimated by Charles River Associates 1985 based on BOM 1981a and1983.
2-20

Table 2-10 Estimated Volume of Waste Generated by the Mining andBeneficiation of Metallic Ores, Phosphate Rock, Asbestos, andOverburden from Uranium Mining in 1980a (millions of metric tons)
Waste production
Mining Dump andindustry heap leachsegment Mine waste Tailings wastes Total
Metal s:
Copper 282 241 200 (Dump) 723Goldb 25 10 3 ( Heap ) 38Iron ore 200 150 -- 350Lead 1 10 -- 11Molybdenum 16 31 -- 46Silver 10 3 <l (Heap) 13Uranium 298 NA -- 298Zinc 1 5c -- 6Other metal sd 24 5 -- 29
Subtotal 856 455 203 1,514
Nonmetal s:
Asbestos 5 2 -- 7Phosphate rock 348 152 -- 500
Subtotal 353 154 -- 507
TOTAL 1,209 609 203 2,021
NA indicates not applicable to this report.a Excludes mine water.b Excludes placer operations.c About 4 million metric tons of saleable products are extracted beforetailings disposal.d Includes antimony, bauxite, beryllium, manganiferous ore, mercury, platinum,rare-earth metal s, tin, tungsten, and vanadium.
Source: Estimated by Charles River Associates 1985 based on BOM 1981a.
2-21

Table 2-11 Estimated Volume of Waste Generated by the Mining andBeneficiation of Metallic Ores, Phosphate Rock, Asbestos, andOverburden from Uranium Mining in 1982a (millions of metric tons)
Waste production
Mining Dump andindustry heap leachsegment Mine waste Tailings wastes Total
Metals:
Copper 124 178 200 (Dump) 502Goldb 39 24 11 (Heap) 74Iron ore 102 75 -- 177Lead 2 9 -- 11Molybdenum 24 6 -- 30Silver 20 6 <l(Heap) 26Uranium 73 NA -- 73Zinc 1 6c -- 7Other metalsd 23 3 -- 26
Subtotal 408 307 211 926
Nonmetals:
Asbestos 4 2 -- 6Phosphate rock 294 109 -- 403
Subtotal 298 111 -- 409
TOTAL 706 418 211 1,335
NA indicates not applicable to this report.a Excludes mine water.b Excludes placer operations.c About 4 million metric tons of saleable products are extracted beforetailings disposal.d Includes antimony, bauxite, beryllium, mercury, rare earth metals, tungsten,and vanadium.
Source: Estimated by Charles River Associates 1985 based on BOM 1983.
2-22
93 percent of the total in that category. These four segments were also the
largest generators of mine waste in 1982, generating nearly 84 percent of the
total.
More than 89 percent of tailings wastes were generated by copper, iron
ore, and phosphate rock production in 1980; this percentage was almost 87
percent in 1982. Dump and heap leaching are confined to the copper, silver,
and gold segments. The gold segment generated less than 2 percent of all
leaching waste in 1980, but this increased to more than 5 percent in 1982.
This twofold rise in the volume of gold leaching waste was caused by an
increase in the use of the heap leaching method in this segment, a trend that
is likely to continue because of the increased value of the gold and the
decline in prices of many other metal commodities.
The wastes generated by the nonfuel mining industry are generally disposed
of on site, and thus the geographic distribution of active mining waste
management sites corresponds closely to the distribution of mine sites.
Transportation or treatment of these wastes beyond that practiced in
connection with wastewater treatment and disposal is not commonly practiced in
most segments. Accordingly, the principal mining states, i.e., Arizona
(copper), Minnesota (iron ore), New Mexico and Wyoming (uranium), and Florida
(phosphate rock), are the states that produce the majority of all mining
waste.14
2.5 SUMMARY
The major categories of waste are mine waste and mine water from mining
operations, dump and heap leach wastes from leaching operations, and mill
tailings from the beneficiation (concentration) of ores. In situ leaching of
rock or in mines is performed in place. Annual waste generation totaled 2
2-23

billion metric tons in 1980 and 1.0 billion metric tons in 1982 for the metal
mining segments and the phosphate and asbestos mining industries. Several
mining segments are geographically restricted: lead (100 percent in Missouri);
molybdenum (100 percent in Colorado); asbestos (75 percent in California);
phosphate (74 percent in Florida); iron {70 percent in Minnesota); and copper
(68 percent in Arizona). In both 1980 and 1982, the three segments generating
the largest amounts of waste were copper, phosphate, and iron.
2-24

SECTION 2 FOOTNOTES
1 BOM 1983.
2 BOM 1983.
3 U.S. Department of Commerce 1985.
4 All mines are not censused every year. Other mines in the nonmetalsindustry segments include abrasives, asphalt, barite, boron minerals,diatomite, feldspar, fluorspar, graphite, greensand marl, gypsum, kyanite,lime, mica (scrap), perlite, potassium salts, pumice, salt, sodium carbonate,stone, sulfur, talc, vermiculite, and wollastonite. Clay and sand and gravelmines accounted for approximately 95 percent of all nonmetal mines in 1982.
5 BOM 1981a.
6 See also US EPA 1982a.
7 Mountain States Research and Development, Inc. 1981.
8 Mining and beneficiation methods are discussed in detail in EPA's finalDevelopment Document for Effluent Limitations Guidelines and Standards for theOre Mining and Dressing Point Source Category.
9 BOM 1981b.
10 Martin and Mills 1976.
11 PEDCo Environmental, Inc. 1984.
12 Charles River Associates 1984a, based on BOM 1981a.
13 BOM 1984.
14 Charles River Associates 1985a.
2-25

SECTION 3
MANAGEMENT PRACTICES FOR MINING WASTES
3.1 OVERVIEW OF THE MINING WASTE MANAGEMENT PROCESS
Mine waste, tailings, heap and dump leach waste, and mine water can be managed
in a variety of ways. Figure 3-1 provides an overview of the mining waste
management process. As shown in the figure, mine waste may be used on or off
site, disposed of in mine waste piles, or used in leach operations to recover
additional valuable constituents from the ore. Similarly, tailings may be used
on or off site, disposed of in tailings ponds1, or used in leach operations to
recover valuable constituents in the tailings that are still present after
milling processes have been completed. Tailings also may contain residues of
the reagents used in flotation processes. These reagents include forms of
cyanide (used in the leaching of gold and silver and in the separation of
sulfide minerals), sulfuric acid used and formed in copper dump leaching, and
various organic and inorganic compounds used in copper, lead and zinc
flotation.2
Mine water may be discharged to surface streams (often after treatment)
via National Pollutant Discharge Elimination System (NPDES) permitted
outfalls, used as milling process makeup water (recycled), or used on site for
other purposes (e.g., dust control, drilling fluids, sluicing solids back to
the mine as backfill, etc.).
The recovery of valuable constituents from mine water (e.g., Ix treatment
for uranium), from mill process solids, or from extraction from dump leach
liquors could possibly be considered to be waste treatment processes, in that
3-1


such recovery extracts metals or constituents that would otherwise be
potentially hazardous or constituents of waste prior to disposal. However, the
mining industry considers these processes to be extraction or beneficiation
processes because they recover valuable products from materials that have
metal concentrations below those in ore of a grade suitable or economical for
milling and smelting.
Table 3-1 presents the volumes and percentages of mine waste and tailings
that are currently managed according to the various practices shown in Figure
3-1 and mentioned above. The table shows that more than half of all mine waste
and tailings is disposed of in poles and ponds, respectively. 3
Most onsite utilization of mine waste and tailings involves the dump leaching
of copper mine waste and the use of sand tailings to build tailings
impoundment dams in all industry segments.
The remainder of this section is divided into three parts. Section 3.2
describes waste management practices other than actual disposal. The section
includes a discussion of recovery operations, process changes for waste volume
reduction, waste treatment methods, onsite utilization of mine water, and
offsite use of mine waste and mill tailings. It shows that although several
alternatives to onsite land disposal of mining industry wastes are available,
their effectiveness in reducing the amount of mining industry wastes is
limited.
Section 3.3 describes some general considerations for locating waste disposal
sites and specific aspects of waste disposal for tailings, mine waste, leached
material, and mine water.
Section 3.4 examines the measures that can be used to limit or mitigate
the hazards posed by mining industry wastes that are disposed of on site.
3-3

Table 3-1 Current Waste Management Practices
Volume(in millions Percent
Management of metric tons of wasteWaste type practice per year) generated
Mine waste Pile 569 56Onsite utilization 313a 31Backfill 86 9Offsite utilization 43 4
Total 1,011 100
Tailings Ponds 267 61Onsite utilization 141b 32Backfill 21 5Offsite utilization 8c 2
Total 437 100
a Includes dump 1 each operations and starter dams for tailings impoundments.
b Includes the sand fraction used in building tailings impoundment dams.
c Includes 4 million metric tons of Tennessee zinc tailings sold asconstruction materials or soil supplements.
Source: Charles River Associates 1984a, based on U.S. Bureau of Mines data.
3-4

These measures are particularly important because most of the large volume of
mining industry wastes will ultimately remain on or near the site. The
mitigative measures considered are broadly categorized under inspection and
detection measures, liquid control systems, and corrective action measures.
3.2 WASTE MANAGEMENT PRACTICES
Waste management practices include process modifications for waste or
potential hazard minimization, recovery operations, treatment prior to land
disposal, onsite use of mine water, and offsite use of mine waste and mill
tailings. Each of these practices is discussed below.
3.2.1 Process Modifications for Waste Minimization
Although there are no practical means of reducing the volume of solid
waste produced by mining and beneficiation operations, some changes in
beneficiation processes can lead to changes in the chemical composition of the
tailings released into tailings impoundments. For example, pilot studies have
been conducted in which nontoxic reagents were substituted for cyanide
compounds in the beneficiation of copper ores. Sodium sulfide and sodium
bisulfide may be used as alternatives to sodium cyanide (see 47 FR 25693, June
14, 1982). Similarly, alkalinity in the beneficiation circuits can be
maintained by reagents less toxic than ammonia. Lime is the reagent of choice
in most instances, although some scaling has been reported.
Two copper mills have circuits separating pyritic material from sulfide
ores to improve subsequent copper recovery. The pyrites are currently
discharged to the tailings impoundments, but they could be segregated. If
pyrites were not codisposed of with other gangue material, there would be a
reduction in the potential for acid formation after closure of the tailings
impoundment. However, the alkaline tailings and pond water may act to reduce
this potential.
3-5

The thickened discharge method of tailings management involves partially
dewatering the tailings slurry and discharging it from a single point. This
results in a gently sloping, cone-shaped deposit. The water removed from the
tailings can be treated and discharged or returned to the milling circuit. The
dewatering costs associated with this method are offset by reduced earthwork
costs. A disadvantage of the thickened discharge technique in some
circumstances is that no water is stored with the tailings, which may mean
that the dewatered slurry piles become sources of fugitive dust. The particle
size distribution of the waste and the drying characteristics of the disposal
area are important factors in determining the potential for fugitive dust
emissions. Earthquake activity may also affect the stability of the dewatered
slurry piles, depending on the location. The thickened discharge method is
currently used to dispose of sand tailings in the Florida phosphate industry
segment, and could be applied to other sectors.4,5
Biological acid leaching, a new process under development in Canada, may
be a feasible substitute for current dump leaching practices. Unlike dump
leaching operations, the new process does not convert the sulfur in the ore to
sulfuric acid; instead, it converts it to elemental sulfur, which is both less
hazardous to the environment and potentially saleable. The process is still in
the pilot development stage; the economic and technical feasibility of large-
scale operations of this type have not yet been demonstrated. 6
3.2.2 Recovery Operations
Leaching is a process used to recover metal values from low-grade ore or
tailings, and is a colon practice in some mining segments (i.e., copper, gold,
silver, and uranium). There are several types of leaching operations
practiced, including in situ, dump, heap, and vat leaching. Acid solutions are
commonly used for leaching in the copper segment of the mining industry.
3-6

Cyanide solutions are used to leach both gold and silver wastes as well as
ores. The precious metals in cyanide leach solutions are removed in the
process, and the partially spent cyanide solution is recycled back to the
process for reuse. Leaching of phosphate rock and uranium wastes are also
practiced.7 In situ leaching in the uranium segment is practiced with
water as the leach solution.
The purpose of using leaching techniques is to recover valuable metals
from ores that would otherwise be uneconomical to mine. In situ and dump
leaching techniques may cause environmental problems, in that an impermeable
layer is not always placed or located between the low-grade ore and the
surrounding soil, especially at older operations. However, it is in the
miner's best interest to capture as much of the leachate in order to recover
the metal values. The benefits of leaching are improved natural resource
utilization and increased production of valuable metals such as gold, silver,
and copper. The drawbacks of leaching, especially dump and in situ leaching,
are that potentially corrosive (low-pH) or toxic (cyanide and/or toxic metals)
products may seep into the ground below these operations. In ores that would
naturally form acid drainage, leaching operations allow recovery of metals
from ores that would naturally release these metals over a period of time.
In the copper, gold, and silver industries, technical efficiency and
economic factors have made the recovery of mineral values by leaching
processes economically feasible. Overburden, tailings, and other wastes will
continue to be "remined" in the future, if extraction efficiencies continue to
improve and if product prices exceed extraction costs.
3-7

Techniques other than leaching have been developed to recover valuable
constituents from mine and mill wastes. Flotation can be used with copper
mine waste, taconite (iron) tailings, and zinc mine waste.8
Pilot-scale research projects have also shown that it is technically
feasible to use a high gradient magnetic separation process to produce an
anorthosite concentrate, assaying at more than 28 percent alumina (Al 2O3),
from copper tailings. However, this has not proved economically competitive
with alumina produced from bauxite by the Bayer process.9
3.2.3 Waste Treatment
Various oxidation systems have been developed to destroy cyanide compounds
prior to discharge; however, most of the cyanide in cyanide leach processes is
recycled back to the process for reuse. One system uses sodium hypochlorite
and sodium hydroxide; another uses chlorine and sodium hydroxide. 10 Other
processes have been used, including hydrogen peroxide oxidation, potassium
permanganate, and chlorine dioxide. Destroying the cyanide used to leach
metals may be feasible, using the new peroxide-thiosulfate process currently
being developed by the Bureau of Mines IBOM).11 In this method, hydrogen
peroxide and sodium thiosulfate convert free and weakly complexed cyanide to
thiocyanate. After the remaining complexed cyanide is precipitated and
flocculated, the solution is filtered. Copper, iron, and other base metals
associated with the gold and silver ore are removed along with the cyanide.
However, thiocyanates have been shown to have latent toxic effects on fish;
thiocyanate apparently accumulates in fish, only to be released in lethal form
when the fish are stressed.12
Cyanide levels in froth flotation wastewater are generally low, and are
the result of using cyanide to depress pyrites in the circuit. Ultraviolet
radiation (from the sun) and simple aeration are often adequate to reduce the
cyanide levels to detection levels.
3-8

Neutralization is a technically feasible method of treating corrosive
acidic wastes. Chemical agents commonly used for this purpose include
quicklime, limestone, hydrated or slaked lime, caustic soda, soda ash, and
hydrated ammonia.13
The Effluent Limitations Guidelines and New Source Performance Standards
for the ore mining and dressing point source category endorse the use of lime
to maintain discharges within the 6.0 to 9.0 pH range. In fact, the permit
issuer may allow the pH level in the final effluent to exceed 9.0 slightly, if
that is required to meet discharge limitations for copper, lead, zinc,
mercury, and cadmium.
Treatment of acidified mine waste or tailings is often a necessary
prerequisite for revegetation. Hydrated lime or quicklime is used to increase
the pH to 9.0 rapidly. For a slower but longer-lasting response, agricultural
lime (limestone) is used. The lime is added in quantities great enough to
neutralize the sulfuric acid that will be released by the future oxidation of
pyritic material in the mine or mill waste. 14
3.2.4 Onsite Use of Mine Water
Water generated by mine dewatering may be used in the milling process as
makeup water (treatment may or may not be required), or used on site for dust
control, sluicing solids to the mine as backfill or in cooling or drilling
fluids. Depending on the water balance at a facility, managing the mine water
may involve a combination of these uses. A large number of mining and
beneficiation operations use mine water in the mill. In some cases, all of
the water required by the mill operation is obtained from mine drainage, which
eliminates the need for wells and a mine water treatment system, or greatly
reduces the volume of mine water discharged. Using mine water containing
3-9

relatively high concentrations of soluble metals for beneficiation makeup
water is an effective treatment practice, because flotation circuits, which
are typically alkaline, reduce the solubility of metals and thereby facilitate
their recovery. In most cases, however, not all of the mine water is used in
the beneficiating operations, because operators have little or no control over
the quantity of water that infiltrates the mine. The unused portion of the
mine water is generally stored in impoundments and discharged after treatment,
in accordance with the provisions of an NPDES permit.15
3.2.5 Offsite Use of Mine Waste and Mill Tailings
Waste utilization practices include agricultural lime replacement, road
and building construction, and the production of bricks, ceramics, and
wallboard. These methods are discussed below and summarized in Table 3-2.
The most widespread use for these wastes is in the production of concrete
and bituminous aggregates for road construction. Other applications in road
construction include the use of these wastes in road bases, as embankments,
and to make antiskid surfaces. Approximately 50 percent of the zinc tailings
in Tennessee are sold for aggregate production.
Tennessee zinc tailings also may be used as a substitute for mortar or
agricultural limestone; nearly 40 percent of these tailings are sold for these
purposes. Tailings from mills processing zinc ores in New York and the Rocky
Mountain states are not suitable as soil supplements, because these tailings
have lower concentrations of calcium carbonate and higher concentrations of
lead and cadmium. Similar concerns constrain the use of lead tailings in
Missouri. 16
Tailings from asbestos and molybdenum mining operations have been used in
asphalt mixes for roads and parking lots. Phosphate, gold, and silver
3-10

Table 3-2 Uses of Mine Waste and Tailings
Gold & Iron ore/Use Asbestos Copper silver taconite Lead Molybdenum Phosphate Uranium Zinc
Material UseSoil Supplement 1Wall Board Production 3Brick/Block Production 1 1 1 1Ceramic Products 1Anti-Skid Aggregate 3 1Embankments 3 3 3 3General Aggregate 3 3 3Fill or Pavement Base 3 3 3 3Asphalt Aggregate 2 3 3 3 1 3Concrete Aggregate 3 3 3 1 3
Development Stage
1. Bench-scale research project2. Full-scale demonstration project3. Full-scale, sporadically practiced
Source: Based on Seitter and Hunt 1982.

tailings of sand and gravel size have been mixed with cement to form concrete
for use in road construction. Lead, zinc, and iron ore tailings have been
used for both concrete and bituminous aggregates. Mixtures of crushed waste
rock, including waste material from copper, iron ore, lead, gold, and silver
mines, have become embankments, fills, or pavement bases for many highways.
Topsoil must be deposited over fills and embankments made with these materials
to control erosion and permit the growth of vegetation. Taconite tailings have
proved valuable as thin (less than 25 mm) road surface overlays, because they
greatly enhance skid resistance.
The use of tailings to produce bricks, blocks, and ceramic products has
not yet passed the bench-scale research stage. Copper mill tailings can be
used in brick production if pyrites are first removed. Lightweight blocks made
from taconite tailings have good structural characteristics but have not been
marketed.
The most important constraints on the use of mining wastes are imposed by
energy, economic, and logistic considerations. Material/metal recovery from
mining wastes is economically attractive only when the price of the material
recovered exceeds the costs of extraction. In recent years, mine product
prices have been generally depressed, and extraction costs, especially energy-
related costs, have risen. Similarly, using mining wastes to produce bricks
or to construct roads is affected by such market constraints as
transportation costs and competition with other sources located nearer to
potential users.17 Mining wastes, therefore, are competitive only when they
can be marketed or used in the geographical area close to the originating
mine.
Uses of mining wastes do not and will not keep pace with the approximately
1 to 2 billion metric tons of these wastes that may be generated each year.
Long-term management of mining waste disposal sites will continue to be
3-12

necessary for the foreseeable future. However, research on the cost-effective
utilization of mining wastes is justified, because any new use that becomes
widely practiced will help reduce the magnitude of the mining waste disposal
problem.
3.3 WASTE SITING AND DISPOSAL METHODS
For technical and economic reasons, most mining waste is finally disposed
of on the land. The primary considerations for locating a waste disposal area
are discussed below. Specific waste disposal methods for mining wastes are
also described.
3.3.1 Location and Siting
The topography, geography, and hydrogeology and, in some cases,
meteorology, as well as population density of the geographical area in which a
mine is located, affect the siting of the waste disposal area, the extent to
which mitigative practices are required, and the types of mitigative systems
that can be selected. The extent of the ore body, the quantity of waste to be
generated, and the method of mining are also considered when siting a disposal
area.
Owners and operators of mines built before 1970 generally located waste
sites at the shortest and most easily traversed distance from the mine or
mill, usually in a ravine or gully. Owners and operators of mines constructed
since 1970 (when Federal and state environmental regulation greatly increased)
have also considered the potential pollution problems associated with
particular sites, such as siltation of surface waters, production of fugitive
dust emissions, and contamination of ground water. Disposal locations chosen
based on these considerations may have small upgradient drainage areas to
3-13

reduce erosion potential, or may be underlain by impermeable strata to
minimize percolation into ground water.
3.3.2 Waste Disposal Methods for Tailings
Waste disposal methods for tailings include: tailings ponds, stope 18
backfilling, below-grade disposal, and offshore disposal. As was shown in
Table 3-1, more than half of the tailings are disposed of in tailings ponds.
The size and design of the ponds vary widely by industry segment and location.
Tailings disposal methods are discussed below.
(1) Tailings Impoundments. Tailings impoundments have been used at ore
mills in the United States since the early 1900s. In recent years, they have
become increasingly important and may account for as much as 20 percent of the
construction cost of a mine/mill project.l9 Some ore bodies may not be
exploited, because suitable sites for tailings disposal are not available
within a practical distance.
Tailings impoundments may serve several purposes. They retain water,
making it available for recycling to the mill flotation circuits and other
processes requiring water. They act as equalization basins, which assist in
wastewater treatment process control and reagent addition control. They also
protect the quality of surface waterways by preventing the release of
suspended solids and dissolved chemicals. In fact, tailings impoundments in
arid regions may permit a mill to achieve "zero discharge," eliminating the
need for a point source discharge permit.
The design and construction of a tailings impoundment reflect the
characteristics of the ore, the mine/mill, and the environment, especially the
local topography. Three methods of dam building are commonly used: downstream,
upstream, and centerline. Figure 3-2 depicts these methods.
3-14


A common element in all three types is that they are usually raised
sequentially as the level of tailings and/or effluent in the impoundment
rises, in order to distribute construction costs more evenly over the life of
the facility.20
With the downstream construction method, the embankment building material is
added successively to the downstream side of the previously placed embankment,
and the crest thus moves downstream. This system is costly but is compatible
with any type of tailings and can be used for water storage. The upstream
method is less costly but is not well suited to large inflows and water
storage. The centerline method involves raising the dam in steps, with the
centerline of the crest remaining above the starter dam.21
The starter dam or dike is typically built with natural soils, but mine
waste can also be used. Subsequent increments are added from the coarse, sandy
fraction of the tailings. This use of tailings constitutes the largest
component of the 141 million metric tons of onsite utilization of tailings
shown in Table 3-1. Installation of internal filters and drains lowers the
water level within the sand dam and reduces the danger of overtopping,
instability, or breaks induced by seismic (earthquake) activity. 22 Other
protective measures include reduction of the catchment area by maintaining
diversion ditches around the impoundment and careful control of water inflow
and outflow to allow for seasonal and mill operation variations. 23 In
summary, many tailings ponds and impoundments require some degree of seepage
to maintain their structural integrity.
Upstream embankments are widely used by the copper industry in the
southwest. Earthquake activity and high precipitation along the West Coast
have fostered use of downstream and centerline dams. Downstream dams are also
favored by the lead industry in Missouri and the phosphate industry in
Florida.
3-16

(2) Stope Backfilling. This method, also referred to as sandfilling,
involves converting a portion of the coarse fraction of tailings into a slurry
and then injecting the slurry into the mined-out portions of stopes. Stope
backfilling is currently practiced or is being considered as a method of
disposing of such diverse materials as copper tailings, spent shale from oil
shale retorts, and tailings from Wyoming trona (sodium carbonate) mines. 24
The major disadvantages of stope backfilling are the introduction of
additional water into the mine, which results in occasional spills of
tailings, and the importation of supplemental waste material to make tailings
embankments when too much coarse fraction has been removed from the tailings.
The primary drawback to backfilling with fines (materials with small particle
sizes) is the risk of poor drainage of the backfill material. In addition,
although no supporting monitoring data are available, backfilling of tailings
into underground mines may have an adverse impact on ground-water quality. For
example, metals or other constituents may leach from the coarse tailings
and reach the ground water when seepage from the backfilled stopes occurs. 25
This possibility increases when the coarse tailings contain pyrites, which
generate sulfuric acid that decreases pH and increases the solubility of most
toxic metals.
Stope backfilling as a tailings management alternative is not used on a
national scale, because most of the industry segments covered in this report
excavate their ores using surface mining techniques.
(3) Below-Grade Disposal. This method of tailings disposal consists of
placing tailings in an excavated pit (in lieu of above-grade impoundments) so
that at closure, the entire deposit is below the level of the original land
surface. This method currently is unique to the uranium industry, which uses
3-17

it to reduce the likelihood of erosion. The embankments of conventional above-
grade surface impoundments are subject to erosion and failure that could
result in the release of tailings to the downgradient area. Below-grade
disposal avoids both of these potential problems. This disposal method is
costly unless mined-out pits can be used.26,27 This method could be used for
operations involving open-pit mining if a series of mined-out pits is
available to receive mill tailings (or retorted shale).
(4) Offshore Disposal. In the past, offshore disposal has been a euphemism
for dumping tailings into a large lake or the ocean without regard for
environmental consequences. Recently, more responsible proposals have shown
that if the tailings are chemically innocuous, are sufficiently coarse to
settle rapidly with a minimum amount of turbidity, and are piped to deep-water
areas to avoid the most biologically productive nearshore zones, offshore
disposal may have reasonably small environmental impacts in certain specific
cases. Even so, offshore disposal is not a widely accepted alternative within
regulatory agencies in the United States and Canada, and few mines have been
located near the ocean in the past. Technical arguments notwithstanding,
recent experience indicates that most developed countries will not approve
offshore disposal of tailings.28
3.3.3 Waste Disposal Methods for Mine Waste
As was shown in Table 3-1, an estimated 56 percent of the mine waste
removed to gain access to an ore body is disposed of in mine waste piles near
or adjacent to the mine. The overburden from open pit mines is usually
discarded on the outside slopes of the pit. Approximately 9 percent of the
mine waste is disposed of as part of the normal mining practice of immediately
backfilling previously excavated areas; the trend in the mining industry is
3-18
toward increasing this percentage. In surface mining, however, backfilling is
only used when the overburden can be placed into adjacent areas that have been
excavated. With some underground mining methods, waste rock is backfilled
into previously mined sections as it is excavated, which eliminates the time
and expense of hauling the material to the surface for stockpiling. These
mining methods include cut-and-fill stoping and square-set stoping. These
methods provide structural stability to the mined areas, in addition to
serving as a means of waste disposal. 29
3.3.4 Waste Disposal Methods for Dump Leach/Heap Leach Material
Whether or not active dump leach and heap leach operations are considered
to be process operations rather than solid waste disposal practices, solid
waste material remains after the completion of these operations. The current
practice is to transport overburden and low-grade copper ore for dump leach
processes (or waste and low-grade precious metal ore for heap leach
operations) to leaching beds, where the dumped material is spread by
bulldozers. Equipment travel on the leach dump compacts the top layer of the
material; this layer is then scarified to facilitate infiltration of the leach
solution. This process of layering and subsequent scarifying of the leach dump
may continue for 50 years or more.30 The leached waste material is not
removed from the site of the operation, due to the immense size of these piles.
3.3.5 Waste Disposal Methods for Mine Water
Water produced from mine dewatering may be discharged directly or
indirectly (after treatment such as settling) to a surface stream, used in the
milling process as makeup water (treatment may or may not be required), pumped
to a tailings pond, or used on site for dust control, cooling, or as drilling
fluids, etc. (see Section 3.2.4). Depending on the water balance of the
3-19

particular mine facility, mine water management may involve one or a
combination of these methods.
Treatment of mine water in onsite impoundments is the management practice
used when discharge or total recycling are not possible. Such treatments
include simple settling, precipitation, the addition of coagulants and
flocculants, or the removal of certain species (e.g., radium-226 removal by
coprecipitation with barium chloride in mine water ponds in the uranium
industry). Most mine water ponds are relatively small, shallow, excavated,
unlined impoundments. The number of impoundments and their size depends on the
volume of mine water handled and the treatment methods used. Larger
impoundments or several impoundments in series are used to provide sufficient
retention time for effective treatment. Discharge from mine water treatment
ponds is usually to a surface stream via an NPDES-permitted outfall. 31
3.4 MITIGATIVE MEASURES FOR LAND DISPOSAL SITES
Even if greater use is made of waste utilization and alternative waste
disposal methods, the greatest portion of mining wastes will still be disposed
of in land disposal facilities such as waste piles, tailings ponds, and
settling impoundments. However, various measures are available to detect or
mitigate the problems associated with the land disposal of mining wastes.
These measures may be classified into four general types:
1. Detection and inspection measures determine whether problems are
developing. These activities include ground-water monitoring and
visual inspection of other systems, erosion control, dam stability,
and runoff control.
3-20
2. Liquid control measures control the potential for liquid to come
into contact with mining waste, and thus minimize surface
water pollution and the amount of liquid available for leachate
formation.
3. Containment systems prevent leachate from entering the ground water
and posing a threat to human health and the environment. Two types
of containment systems are considered here: containment systems
designed to prevent leachate from entering the ground water (such
as liners and systems designed to control plumes of contaminated
ground water) and corrective action measures.
4 4. Security systems prevent entry to the waste management area by animals
or by unauthorized persons. These systems protect the general public
and prevent activities that might damage onsite control systems.
The waste management measures that are most relevant to individual waste
management sites depend, in part, on the operational phase of the waste
management site. Three operational phases are distinguished here:
1. Active site life is the period during which waste is being added to
the disposal site. A disposal site may be closed even though the
mine itself remains active.
2. Closure is the period immediately following active site life, in
which various activities are undertaken to ensure adequate
protection of human health and the environment during the post-
closure phase, and to minimize maintenance activities in the
post-closure phase.
3. Post-closure is the period following closure during which there
are no further additions of waste to the site. The main post-
closure activities are the monitoring of the site for leaks and
the
3-21

maintenance of liquid control, containment, and security systems
established during site life or at the time of closure.
Corrective action occurs after a plume of contaminated ground water or another
environmental hazard is discovered. This may occur during active site life, at
the time of closure, or during the post-closure phase.
The remainder of this section describes various mitigative measures appro-
priate to the management of mining waste during the active life of the site,
the closure period, and the post-closure phase, and discusses appropriate
corrective measures. Some of the measures described can be substituted for
each other. In most cases, the ability of these measures, or combinations of
measures, to limit threats to human health and the environment depends on
specific site conditions; in addition, many of these measures have yet to be
applied in the mining waste context. The discussion below describes the
purposes and limitations of various management techniques, but data are not
available to allow the efficacy of these techniques to be quantified. Table 3-
3 shows the various measures discussed in this section, classified by
operational phase of the site.
Where possible, EPA has estimated the percentage of mines in some industry
segments where the following mitigative measures are currently used: ground-
water monitoring, run-on/runoff controls for storm water, liners for tailings
ponds, secondary leachate collection and removal, and closure procedures. EPA
produced these estimates using the methodology described in Appendix B.
3.4.1 Mitigative Measures During Active Site Life
During the active life of a waste disposal facility, waste is continually
being added to the waste material already at the site. The ongoing nature of the
disposal process at active sites makes certain mitigative measures
3-22

Table 3-3 Mitigative Measures by Stage of Site Life
Stage ofsite life
Mitigative measure Purpose
Activesite life
Hydrogeologic evaluation andground-water monitoring Detection of contaminantsRun-on/runoff control Liquid controlLiners ContainmentCutoff walls ContainmentLeachate collection, removal,and treatment systems Liquid controlSecurity systems Security of control systems
and protection of public
health
Closure
Continue measures initiate All purposes mentionedduring active site life aboveWastewater treatment Liquid controlPond sediment removal Waste removalDike stabilization Liquid controlWaste stabilization Liquid controlInstallation of leachatecollection, removal andtreatment systems at surfaceimpoundments Liquid controlFinal cover Liquid control
Post-closure
Ground-water monitoring Detection of contaminants
Inspect/maintain all existing system All purposes mentioned above
Corrective action
Interceptor wells ContainmentHydraulic barriers ContainmentGrouting ContainmentCutoff walls ContainmentCollection Treatment
Source: Meridian Research, Inc. 1985.
3-23

inappropriate for use at such sites. For example, methods such as caps or
covers that are designed to control the volume of liquids percolating into the
site cannot be used. Similarly, liners and containment systems that underlie
the waste area can most easily be put in place at new facilities. However,
other mitigative measures, such as those discussed below, can be used at
existing active waste disposal sites.
3.4.1.1 Ground-Water Monitoring and Hydrogeological Evaluation
The objectives of hydrogeological evaluation and ground-water monitoring
at a waste disposal or tailings pond facility are (1) to identify potential
pathways of leakage and contaminant transport by ground water; (2) to
determine whether contamination of the ground water has occurred and, if so,
the extent of contamination; and (3) if necessary, to generate the data needed
to select and implement a mitigative strategy. At new facilities, the first
step in this process is to evaluate the pollution potential of effluents from
the site. 32 A thorough hydrogeological evaluation and ground-water
monitoring program are then conducted to characterize background or natural
conditions at the site. In some cases, it may be necessary, prior to siting
the monitoring wells, to simulate baseline and potential ground-water pathways
by means of hydraulic or solute transport models.33 Particularly in areas close
to dams or dikes, hydrogeological evaluations are necessary to determine
probable seepage paths and to establish flow rates to be used in the design of
dikes, cutoff walls, and liners. Ground-water monitoring is also an important
means of evaluating the initial and long-term effectiveness of the engineering
and site preparation measures used at a particular site.
Depending on the specific characteristics and requirements of a given
site, monitoring programs range in complexity from a simple determination of
3-24

the presence or absence of a particular waste constituent in a few wells to an
extensive analysis of many constituents in many wells, using well clusters
open at different depths, aquifer tests, and geophysical measurements. 34,35 The
complexity of an effective ground-water monitoring program is directly related
to the size of the waste management project, the nature of the waste
materials, and the characteristics of the local hydrogeology.
Using ground-water monitoring to assess conditions at a site has some
limitations. Because a monitoring well characterizes only one point in an
aquifer, results obtained at the well may not be representative of site
conditions, especially in geologically complex areas. Another limitation of
ground-water monitoring is that some knowledge of site conditions, such as
ground-water flow rate and direction, is necessary before the monitoring wells
can be placed properly. In addition, because ground-water flow is extremely
slow, long-term monitoring over several months or years may be required to
characterize the situation accurately. In some circumstances, the flow
patterns of ground water through fractures may be sufficiently complex to
frustrate even the most intensive monitoring effort. 36,37
Waste disposal facilities in the mining industry are so large that
horizontal and vertical distances between hydraulically upgradient, and
therefore unimpacted, areas and areas that are downgradient, and therefore
likely to be impacted, can be very great. The variation in natural conditions
over such large distances (thousands of meters) can greatly complicate
hydrogeological studies. In some cases, the presence of several active,
inactive, or abandoned waste disposal sites or mines in the area also
complicates ground-water quality and flow patterns, making ground-water
monitoring and hydrogeologic evaluation more difficult. 38,39
3-25

Nevertheless, hydrogeologic evaluation and ground-water monitoring remain
the only methods for determining whether there is a danger of offsite movement
of contamination from mining wastes. Because of the size and complexity of
many mining waste sites, the need for detailed hydrogeologic evaluation and
careful interpretation of ground-water monitoring results may be greater than
for other types of hazardous waste management facilities.
Tables 3-4 and 3-5 show the extent to which ground-water monitoring,
practiced voluntarily or in compliance with State regulations and adequate to
satisfy current RCRA requirements, is performed at heap/dump leach operations
and tailings ponds in the various mining industry segments. (Ground-water
monitoring is not normally performed at mine waste disposal sites.) Ground-
water monitoring of gold and silver heap leach operations adequate to satisfy
current RCRA requirements is currently practiced at all of the gold and silver
mine sites studied by EPA where there are heap leach operations. Ground-water
monitoring adequate to satisfy RCRA requirements is currently practiced at two
of the nine copper dump leach operations studied by EPA.
Monitoring of ground water is also practiced at all of the gold and silver
tailings ponds and at 2 of the 12 copper tailings ponds studied by EPA. It is
not performed at any of the lead or zinc tailings ponds studied by EPA.
3.4.1.2 Run-on/Runoff Controls
Run-on/runoff controls can be divided into three categories: diversion
methods, containment systems, and runoff acceleration practices. Diversion
systems prevent offsite water from entering the site and causing erosion and
flooding. Containment involves the collection of onsite stormwater or dike
seepage in holding or evaporation ponds for the treatment necessary for final
disposal or to prepare the waste for recycling.
3-26

Table 3-4 Extent of Ground-Water Monitoring of Heap/DumpLeach Waste, by Industry Segment
States requiring Number of mine Number of mine ground-water monitoring sites in data base sites that monitor or having mine sitesMining that generate ground water at that monitor ground waterindustry heap/dump heap/dump leach at heap/dump leach wastesegment leach waste waste operationsa operationsb,c
Copper 9 2 (22%) Arizona, New Mexico
Gold 5 5 (100%) Montana, Nevada, Colorado, New Mexico, South Dakota
Silver 1 1 (100%) Nevada
a Sites are identified as having ground-water monitoring only when suchmonitoring is adequate to satisfy current RCRA requirements.
b This column includes only those states where ground-water monitoringrequirements are at least as stringent as required by RCRA.
c This column includes only the states generating large amounts of miningindustry waste in the affected industry sectors.
Source: Charles River Associates 1984 and 1985c.
3-27

Table 3-5 Extent of Ground-Water Monitoring of Tailings Ponds, by IndustrySegment
Number of Number of States requiring mine sites mine sites ground-water monitoringMining in data that monitor or having mine sitesindustry that generate ground water at that monitor ground watersegment tailings tailings pondsa at tailings pondsb,c
Copper 12 2 (17%) New Mexico, Colorado, California, Arizona
Gold 7 7 (100%) Arizona, South Dakota, Nevada
Lead 6 0
Phosphate 8 1 (13%) Florida, North Carolina
Silver 8 8 (100%) Montana, Idaho, Colorado, Utah
Zinc 6 0
a Sites are identified as having ground-water monitoring only when suchmonitoring is adequate to satisfy current RCRA requirements.
b This column includes only those states where ground-water monitoringrequirements are at least as stringent as required by RCRA.
c This column includes only the states generating large amounts of miningindustry waste in the affected industry segments.
Source: Charles River Associates 1984 and 1985c.
3-28

Surface water diversion ditches consist of canals, channels, or pipes that
totally or partially surround waste piles, tailings embankments, pits, or
ponds to divert the surface water around them and back into the natural stream
channel downgradient to the waste area. The most important functions of ditch
systems are to minimize downstream environmental damage, relieve dike stresses
to reduce the chance of failure, diminish erosion of the waste embankment, and
reduce the volume of water requiring environmental monitoring. 40,41 Perimeter
ditches also help to recover supernatant for recycling, collect and drain dike
seepage, and collect onsite storm runoff for transport to a containment
treatment system. When wastewater requires treatment before release, a
suitable ditch network is constructed to prevent uncontaminated offsite or
onsite runoff from mixing with onsite wastewater streams.
Table 3-6 shows the extent for which mine waste piles studied by EPA have
run-on/runoff controls for storm water adequate to satisfy current RCRA
requirements. Run-on controls for mine waste that are adequate to satisfy
RCRA exist only at three mines studied by EPA in the gold industry sector.
Runoff controls exist at these same three mines and at one silver mine in
Colorado.
3.4.1.3 Liners
Lining the entire waste area and the upstream slope of the embankment may
prevent seepage. Liners can be formed from natural earthen (clay) materials,
synthetic materials, or a combination of these. Commercial bentonite can be
added to fine-textured soils to reduce their permeability to very low levels.
Synthetic liner materials include soil cements, treated bentonite, petroleum
derivatives, plastics, elastomers, and rubber. These liners are generally more
expensive than liners made of earthen materials, and careful earthwork is
3-29

Table 3-6 Extent of Run-on/Runoff Controls for Stormwaterfor Mine Waste, by Industry Segment
States requiring run-on/No. mines No. mine No. mine runoff controls or
Mining in data base sites with sites with having mine sites withindustry that generate run-on runoff Run-onc Runoffc
segment mine waste controlsa controlsb controls controls
Copper 13 0 0
Gold 11 3 (27%) 3 (27%) Montana, Montana, California California Lead 7 0 0
Phosphate 18 0 1 N. Carolina
Silver 9 0 1 (11%) Colorado
Uranium 9 0 0
Zinc 7 0 0
a Sites are identified as having run-on controls only when these controls are
adequate to satisfy current RCRA requirements.
b Sites are identified as having runoff controls only when these controls are
adequate to satisfy current RCRA requirements.
c These columns include only the states generating large amounts of mining
industry waste in the affected industry segments.
Source: Charles River Associates 1984 and 1985c.
3-30

required to prepare the ground surface even when these synthetic materials are
used. If appropriate earthen liner materials are not readily available,
synthetic liners may be more economical. Liner materials must be resistant to
the potential corrosive effects of the waste and to damage from sunlight (if
the liner is not covered immediately after placement). 42
Although both synthetic and natural liners can be used cost-effectively in
relatively small disposal areas, they have not been used in the very large
waste facilities that are typical of mining industry waste sites (some of
which cover a square kilometer or more); and they may in fact not be feasible
at such sites. 43 Experience is inadequate to evaluate the performance of
liners at large-area, large-volume sites. Lining large areas with synthetic
(membrane-type) liners would require many liners to be fastened together to
form a single large liner; each seam represents a point of potential failure.
If a liner underlying such a large waste area failed, it would be impossible
to repair. 44
Installing liners at existing disposal areas in this industry would
require moving billions of tons (approximately 50 billion tons) of material
that has been deposited over the years. Many active disposal sites have been
used for many years, and the areas are continually built up. Movement of these
materials to new lined sites severely affects the cost of operations at these
sites.
Table 3-7 shows the extent of the current use of tailings pond liners
adequate to satisfy current RCRA requirements, for mines studied by EPA. Mine
waste piles are not normally lined. According to Table 3-7, the majority of
tailings ponds at mine sites studied by EPA in the silver and zinc industry
segments are currently lined. Tailings ponds at mines studied by EPA in the
3-31

Table 3-7 Extent of Tailings Pond Liner Use, by Industry Segment
Number of mines in Number of
Mining data base that mine sites States requiring linersindustry use tailings having lined or having mine sites withsegment pond liners tailings pondsa lined tailings pondsb,c
Copper 12 0
Gold 6 1 (17%) Nevada
Lead 6 0
Phosphate 18 0
Silver 8 6 (75%) Idaho, Utah
Zinc 6 4 (67%) Tennessee
a Sites are identified as having lined tailings ponds only when theliner is adequate to satisfy current RCRA requirements.
b This column includes only those states where liner requirements are atleast as stringent as those required by RCRA.
c This column includes only the states generating large amounts of miningindustry waste in the affected industry segments.
Source: Charles River Associates 1984 and 1985c.
3-32

copper, lead, and phosphate industry segments are not lined. One of the six
tailings ponds at mines studied by EPA in the gold industry segment is
currently lined.
Regulations promulgated in 40 CFR Part 192 required that new uranium mill
tailings impoundments be lined. Synthetic liners have been installed at three
uranium mill tailings impoundments and natural liners exist at other uranium
tailings impoundments.
Many mines studied by EPA have impermeable pads under heap leach piles.
Figure 3-3 shows an impermeable pad under a gold heap leach pile. These pads
aid in the collection of valuable leachate and reduce the pollution potential
at these sites.
3.4.1.4 Cutoff Walls
Seepage outflow can be minimized by placing impermeable blankets or zones
in the embankment or foundations, as illustrated in Figure 3-4A. A cutoff wall
of the type shown in Figure 3-4B can be used in cases where a relatively
impervious layer underlies a pervious layer at a shallow depth. The impervious
core below the embankment will cut off the flow through the shallow, pervious
portion of the foundation. A cutoff wall is usually placed toward the upstream
portion of the embankment section to allow drained conditions under as much of
the embankment section as practicable.45 However, if total cutoff of seepage
is desired (illustrated in Figure 3-4C), the cutoff wall can be installed far
downstream, and the seepage can be removed from the drainage trench, pumped
back to the impoundment, and then returned to the mill, or it can be pumped to
a treatment plant and then released into a natural channel. A small amount of
seepage will percolate downward, even through nearly impervious natural
materials, from any unlined portion of the waste disposal
3-33

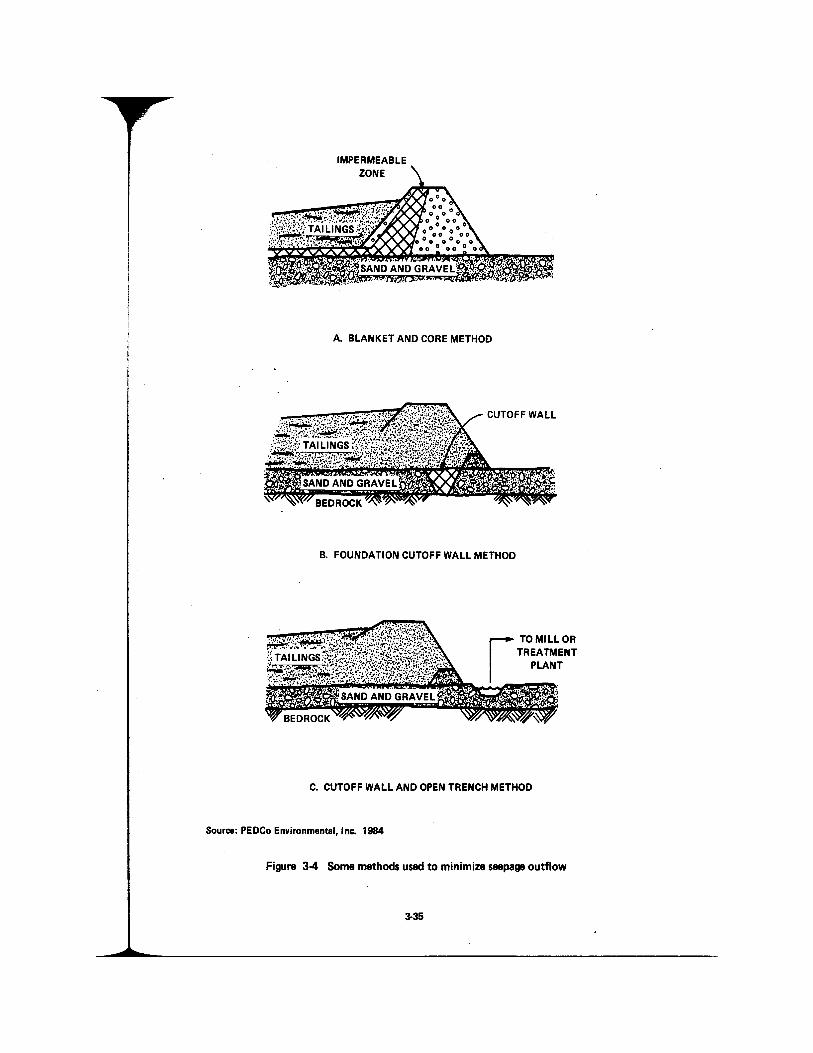

area; additional monitoring wells may be required in such cases. When the
foundation consists of a thick pervious layer or several pervious layers
separated by strata or impervious materials, a drainage trench can be used to
remove some of the seepage.
3.4.1.5 Leachate Collection, Removal, and Treatment
During active site life, it is necessary to collect, remove, and treat
leachate from lined waste piles to prevent the leachate from building up above
the liner. Leachate collection prevents high moisture content at the base of
the pile from deforming the structure of the pile. For small lined areas of
facilities, an adequate leachate collection system may consist of a sump with
a pump to collect the waste and pipe it to a lined impoundment for treatment.
In larger facilities, a zone of sand, gravel, or coarse rock may be placed
below the waste and drained. Such a system may be augmented by perforated pipe
to increase capacity, and may also include collector trenches in cases in
which the system emerges onto a broad, level area. Collector trenches may be
useful even when no liners are used. Collected leachate must be treated and
disposed of by such treatment methods as neutralization and precipitation, as
discussed above.
At heap or dump leach operations, secondary leachate collection systems,
consisting of leachate collection sumps and ditches, serve to interrupt
liquids escaping the primary recirculating leaching system. The extent of
adequate secondary leachate collection and removal from heap/dump leach waste
and from tailings ponds is shown in Tables 3-8 and 3-9, respectively. Of the
gold mines studied by EPA, only one had a secondary leachate collection and
removal system in place that was adequate to satisfy current RCRA requirements
for such systems. Secondary collection and removal of leachate from tailings
3-36

Table 3-8 Extent of Secondary Leachate Collection and Removalfrom Heap/Dump Leach Waste, by Industry Segment
Number Number of States requiring of mines mine sites secondary leachatein data base that collect and collection and removal or
Mining that generate remove leachate having mine sites thatindustry heap/dump from heap/dump collect and remove leachatesegment leach waste leach wastea from heap/dump leach wasteb,c
Copper 9 0
Gold 5 1 (20%) New Mexico, Nevada
Silver 2 0
a Sites are identified as having secondary leachate collection and removalsystems only when the system is adequate to satisfy current RCRA requirements.
b This column includes only those states where leachate collection and removalrequirements are at least as stringent as those required by RCRA.
c This column includes only the states generating large amounts of miningindustry waste in the affected industry segments.
Source: Charles River Associates 1984 and 1985c.
3-37

Table 3-9 Extent of Secondary Leachate Collection and Removalfrom Tailings Ponds, by Industry Segment
States requiring Number Number of mines secondary leachate
of mines in sites that collect collection and removal orMining data base and remove having mine sites thatindustry that generate leachate from collect and remove leachatesegment tailings tailings pondsa from tailings pondsb,c
Copper 12 0
Gold 7 2 (29%) California, South Dakota,
Nevada
Lead 6 0
Phosphate 18 0
Silver 8 2 (25%) Montana, Colorado, Idaho,
Utah
Zinc 6 0
a Sites are identified as having secondary leachate collection and removalsystems only when the system is adequate to satisfy current RCRA requirements.
b This column includes only those states where leachate collection and removalrequirements are at least as stringent as those required by RCRA.
c This column includes only the states generating large amounts of miningindustry waste in the affected industry segments.
Source: Charles River Associates 1984 and 1985c.
3 -38

ponds are practiced only at two gold mine sites studied by EPA, as shown in
Table 3-9.
3.4.1.6 Security Measures
During the active site life phase of operations, the mining industry
implements security measures that range from posting "No Trespassing" signs to
installing comprehensive systems of locked gates and fencing and using
security guards. Fencing material ranges from chain link to barbed wire. The
extent of the security measures employed depends on the severity of the
hazards existing at the mine site, the value of the material being mined or
milled, and the proximity of the mine site to populated areas. Posting
security guards has an additional benefit, because these employees can also be
assigned facility inspection duties, such as checking runoff dikes. At active
and inactive asbestos waste disposal sites, existing EPA regulations (40 CFR
Part 61) require security measures.
3.4.2 Mitigative Measures at Closure
The mitigative methods described above for the active site life phase
remain applicable during the closure phase. In addition, other activities may
be necessary or desirable. For example, tailings impoundments may be dewatered
and stabilized; these are essential steps if a cap and cover are to be added.
A cap and cover can be placed over the site to minimize contact of the waste
with the environment and to protect the waste from rainfall, which increases
the volume of leachate formed.
3.4.2.1 Wastewater Treatment
The wastewater that remains onsite after active mining and milling
operations have ceased may be treated and then discharged or be transported to
a licensed disposal site.
3-39

3.4.2.2 Wastewater Pond Sediment Removal
The sediment that is collected in wastewater treatment and retention ponds
often contains settled solids created during the mining or milling processes,
precipitated metals, and process chemicals such as flotation reagents.
Assessment of the potential hazards must be made during the active life of the
mine and at closure, in order to properly dispose of and manage these wastes.
The quality of these sediments varies widely, and some sediments may require
removal at closure to reduce potential hazards, while other sediments may pose
little or no risk to humans or the environment.
3.4.2.3 Dike Stabilization
A major consideration in the closure of a waste disposal site or area is
the structural integrity of the dike(s) constructed to confine the waste. 46,47
Various methods of slope stabilization, such as slope modification and/or
placement of waste rock (rip-rap), topsoil, vegetation, and chemical
stabilizers, may be used during the active or final closure phases of the life
of the impoundment to minimize erosion and siltation.48 Closure of a diked
impoundment may require an assessment of the ability of the dike system to
withstand additional loads, which may include the weight of several layers of
a capping system (clay, drainage layer, and topsoil cover) and of the
construction equipment used to place and compact the final cover. 49 The long-
term control of water behind the dike is a major factor in the stability of
dikes and prevention of catastrophic failure.
3.4.2.4 Waste Stabilization
Since wastes remain in place after closure of the waste piles and ponds,
proper consolidation and stabilization of the wastes are necessary to ensure
long-term support for the final cover when it is emplaced. The initial step
3-40

in stabilizing tailings is dewatering the wastes. At some sites (e.g., copper
tailings ponds located in the arid Southwest), passive dewatering using
natural evaporation and drainage mechanisms may be sufficient to remove free-
standing water and to dewater the tailings. At other sites, active dewatering
using pumps to remove liquids within the impoundment or from ponds on the
impoundment surface may also be required in conjunction with passive
dewatering mechanisms. The liquids collected during dewatering operations may
require treatment before they are discharged or disposed of.
The wastes within the impoundment must also be capable of bearing the
loadings imposed by the final cover system and the construction equipment used
to apply this system. Tests can be used to estimate the anticipated amount of
waste settlement and any differential settling across the waste site likely to
be caused by increased loads.50 The results of these tests may indicate the
need for further dewatering, for redistribution of the wastes or compaction of
the material (e.g., mechanical compaction such as with a sheepfoot roller), or
for implementing methods of minimizing differential settlement.
3.4.2.5 Installation of Leachate Collection, Treatment, and Removal
Systems for Lined Surface Impoundments
In order for these systems to be effective in collecting leachate, the post-
closure needs of the system must be integrated into the initial design of the
impoundment.
3.4.2.6 Final Cover System
The proper installation of a final cover system over the exposed surfaces
of the waste impoundment, mine waste pile, leach dumps, etc., helps ensure
control of erosion, fugitive dust, and surface water infiltration; promotes
proper drainage; and creates an area that is aesthetically pleasing and
3-41

amenable to alternative land uses. This cover system typically consists of the
following components:
• A low-permeability clay layer or synthetic membrane overlying thewaste material;
. A middle drainage layer of moderate to high permeability;
• A top cover of topsoil and vegetation, except in the arid regions the Western United States, where a rock cover is more effective preventing erosion and breaching. 51,52
The function of the low permeability material overlying the waste is to
prevent the infiltration of precipitation, minimize leachate generation, and
prevent the migration of potentially hazardous waste constituents from the waste
into the ground water.53 To prevent excessive leachate buildup, the
low permeability layer should be at least as impermeable as the liner, if
present.
If the final cover system is to be vegetated, a drainage layer of sand or
gravel having low hydraulic conductivity is laid over the impermeable cap. This
layer is graded (at least 2 percent) to allow the precipitation infiltrating the
vegetative cover to drain rapidly, thus minimizing the hydraulic head on the clay
cap or synthetic liner. Then, depending on the gradation, this layer is overlaid
by a filter to prevent clogging.
Except in arid regions, the top layer of the cover system consists of topsoil
capable of sustaining vegetation. Two feet of soil are considered adequate to
accommodate the root systems of most nonwoody vegetative covers and to provide
a degree of protection from root damage to the underlying clay or synthetic
liner.54 Wide variance in climatological factors and soil conditions, and
therefore in subsequent growing conditions, affects the level of effort required
to revegetate mined land successfully. For example, much
3-42
less work is required at a Florida phosphate mine, where conditions are
favorable (fertile soils, adequate water, and long growing seasons) than at a
southwestern copper facility, where a combination of poor soils (e.g., high in
salts and sulfides, low in nutrients) and an arid climate may require managers
to introduce nonnative plant species, install irrigation systems, and provide
constant maintenance to develop and sustain the vegetative cover. Revegetation
also requires extra effort at sites in mountainous terrain where erosion rates
are often high, growing seasons are short, and winters are long and severe.
Tables 3-10 through 3-12 show the number of mine sites studied by EPA
where some types of closure activity are performed. Mines in many of the
industry segments stabilize their wastes, install some kind of cap, and
revegetate during the closure phase. For example, mine waste piles generated
by the gold industry in California are contoured for stability and
revegetated. For tailings generated by the phosphate industry in North
Carolina, reclamation consists of covering the tailings with sand to increase
stability, adding topsoil, and revegetating. Similarly, closure of tailings
piles at sites in the gold and silver industries in Montana consists of
compacting, grading, capping the tailings with rock and topsoil, and
revegetating. Although waste stabilization, capping, reclamation, and
revegetation appear to be common waste management practices in many industry
segments, installing a final cover, consisting of a low-permeability clay
layer or a synthetic membrane overlying the waste material, is not a
mitigative practice used in the mining industry. 55 However, asbestos waste
piles must be covered daily, as required by EPA regulations in 40 CFR Part 61,
if there are visible emissions to the outside air.
3-43

Table 3-10 Closure Activities for Mine Waste, by Industry Segment
Number Number of mines States requiring some of mines in performing types of closure activityMining data base some types of or having mine sites thatindustry that generate closure perform some types ofsegment mine waste activity closure activity a
Gold 6 2 (33%) California, Colorado
Phosphate 11 ll (100%) Florida, Idaho
Silver 5 4 (80%) Idaho, Colorado, Utah
Uranium 6 6 (100%) Colorado, Wyoming
a This column includes only the states generating large amounts of mining
industry waste in the affected industry segments.
Source: Charles Rivers Associates 1984 and 1985c.
3 -44

Table 3-11 Extent of Closure Activities for Heap/DumpLeach Waste, by Industry Segment
Number Number of mines of mines States requiring some in data base performing types of closure activity
Mining that generate some types of or having mine sites thatindustry heap/dump closure perform some types ofsegment leach waste activity closure activity a
Copper 8 1 (13%) Utah
Gold 5 0
Silver 1 0
a This column includes only the states generating large amounts of miningindustry waste in the affected industry segments.
Source: Charles River Associates 1984 and 1985c.
3-45

Table 3-12 Closure Activities for Tailings Impoundments,by Industry Segment
Number Number of mines States requiring some of mines performing types of closure activityMining in data base some types of or having mine sites thatindustry that generate closure perform some types ofsegment tailings activity closure activity a
Copper 4 1 (25%) Utah, New Mexico
Gold 7 3 (43%) South Dakota, California, Arizona, Montana, Nevada
Lead 4 0
Phosphate 12 12 (100%) Florida, Idaho, North Carolina
Silver 4 4 (100%) Idaho, Colorado, Utah Nevada, Montana
Zinc 3 1 (33%)
a This column includes only the states generating large amounts of miningindustry waste in the affected industry sectors.
Source: Charles River Associates 1984 and 1985c.
3-46

3.4.3 Mitigative Measures During Post-Closure
At certain sites during the post-closure phase, it is necessary to
continue to support the waste management methods applied during the active and
closure phases of site life. Many post-closure activities, such as
inspection, are routine during active site life but require special effort to
maintain once the site has been closed. For example, inspection activities
after site closure should be part of a program of regularly scheduled visits.
Inspection and detection activities during the post-closure period may
consist of the following:
• Assessment of the density, cover, and composition of vegetationspecies to evaluate revegetation success;
. Visual or photographic inspection to detect rill and gully erosion;
• Analysis of data on ground-water quality to define contaminantmigration and dilution and to determine the effectiveness of
liners, cutoff walls, or other containment systems;
• Evaluation of data on ground-water level to define ground-waterrecovery rates and levels;
. Visual or photographic inspection of stream and drainage channels to determine migration rates and patterns;
. Monitoring of subsidence; and
. Visual and photographic inspection after severe meteorological events (severe precipitation or drought) or other natural phenomena (e.g., earthquakes ). 56,57
Maintenance conducted during the post-closure period may consist of the
following:
. Reseeding areas that have not been successfully revegetated;
• Repairing or replacing security fences, gates, locks, and warning signs;
. Maintaining collection and treatment systems;
• Maintaining monitoring wells and replacing them as necessary;
3-47

. Replacing rip-rap to control the migration of stream and drainage channels and the effects of flooding;
. Replacing top soil and rock covers to control rill and gully erosion; and . Eliminating trees and other deep-rooted vegetation that may damage covers and liners. 58,59
3.4.4 Corrective Action Measures
The corrective action measures described below may be necessary if a plume
of contaminated ground water above some threshold limits has been detected.
In this phase, the two major activities are additional hydrogeologic
evaluation and controlling the plume. These processes are described below.
Corrective action measures have not normally been performed at mining
facilities in the past.
3.4.4.1 Hydrogeological Evaluation
Once ground-water contamination has been detected by the ground-water
monitoring system, an extensive hydrogeological evaluation is usually needed
to determine the size, depth, and rate of flow of the contaminated plume. The
methods and limitations of hydrogeological evaluations in the corrective
action stage are similar to those that apply to these evaluations during
active site life.
3.4.4.2 Interceptor Wells
Seepage losses through the deep pervious foundation of a waste disposal
facility can be reduced by installing interceptor wells at points that
intersect the plumes of contaminated seepage in the saturated zone. 60
Comprehensive hydrogeological explorations and evaluations are required to
site these wells properly. The intercepted seepage may be pumped directly to
a mill or pond if water balances permit, or it may be treated before being
returned to the mill or discharged.
3-48

3.4.4.3 Hydraulic Barriers
Interceptor wells may be used in combination with a hydraulic barrier
system established downgradient to the embankment, as shown in Figure 3-5. A
hydraulic barrier system is usually made by installing a line of pumping wells
downgradient to the leaking embankment, and a line of injection wells
downgradient to the pumping wells. The injection wells supply fresh water,
while the pumping wells extract ground water. Pump effluent is typically a
mixture of native ground water, plume water, and injected fresh water. The use
of hydraulic barriers is effective at sites where the subsurface is generally
homogeneous. The use of hydraulic barriers is not a common practice in these
segments, and their effectiveness must be demonstrated.
3.4.4.4 Grouting
If a waste presents a serious pollution hazard to ground water, grouting
the foundation rock may be warranted. The grouting process consists of
pumping a fluid grout mixture (usually a water-cement compound) through drill
holes into crevices and joints in rock to tighten the embankment foundation.
Chemical grout is used to seal porous materials and cracks that are too small
to accept a water-cement grout. Grouting must be thorough, because even a few
ungrouted joints in permeable rock formations can render the grouting effort
ineffective. 61
Figure 3-6 illustrates a grout curtain being used in conjunction with
extraction wells. This grouting process is often not very reliable, because
it is difficult to ensure a completely impermeable grout curtain. Generally,
grout curtains cannot be used to control deep vertical seepage within the
curtain's boundaries. In some cases, grout curtains can reach depths of 60
meters; however, both the cost and unreliability of these
systems increase rapidly at depths greater than 30 meters. 62
3-49

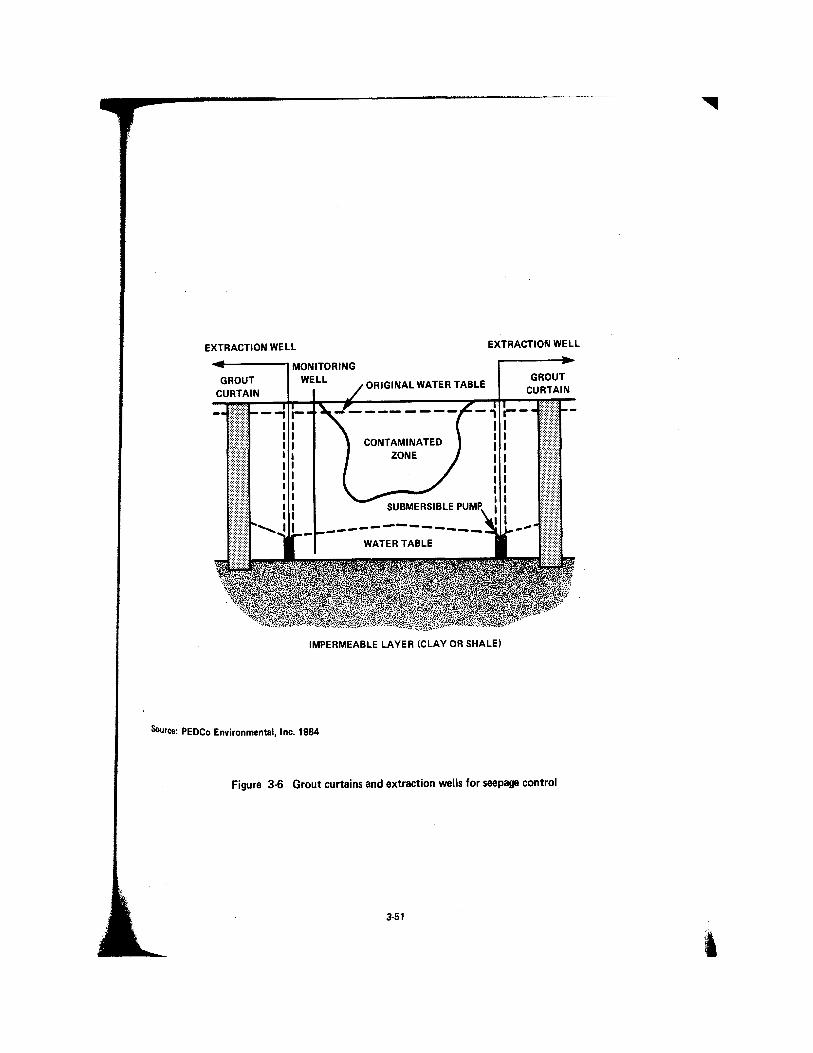
3.4.4.5 Cutoff Walls
Cutoff walls are often used as seepage or ground-water pollution control
systems because they are effective and relatively inexpensive. Sheet piling
cutoff walls can extend 24-30 meters in depth, but they have a relatively
short effective life (less than 20 years) and are difficult to construct to
achieve a low permeability barrier. More effective cutoff walls can be
constructed by digging narrow trenches to a depth of 9-15 meters and
backfilling them, either with a soil-bentonite or a soil-cement-bentonite
mixture that hardens into a homogeneous and very low-permeability barrier. The
effective use of cutoff walls is highly dependent on the site's hydrogeologic
properties, in that a naturally impermeable rock and/or soil must underlie the
waste within the cost-effective trenching depth. If an impermeable layer does
not exist, cutoff walls will be ineffective in stopping migration of
pollutants. This technology is not applicable to all mines, and is not a
common practice in this industry.
3.5 SUMMARY
Of the waste currently generated by the mining industry segments of
concern, 56 percent is disposed of on site, 9 percent is backfilled, 31
percent may be considered to be utilized on site (principally in the leaching
of copper dump wastes and in starter dams for tailings impoundments); and 4
percent is utilized off site (as fill and aggregate for road construction).
Most tailings are disposed of in impoundments; but 5 percent are backfilled,
and 2 percent are used off site (in construction, as soil supplements, etc.).
Most mine water is recycled through the mill and used on site for other
purposes (e.g., dust control) or treated and discharged. Few3-52

methods are available to reduce the amount of solid waste generated by mining
and milling, but process modifications can reduce the water content and
potential toxicity of these wastes. Many methods are available to design,
site, maintain, and close disposal facilities in an environmentally acceptable
manner. Commonly used mitigative measures include ground-water monitoring at
leach operations only; and, for many types of operations, stabilization of
waste, installation of some kind of cap, and revegetation during the closure
phase. Available corrective action methods, not widely used in the mining
industry, include interceptor wells, underground barriers to prevent the
spread of contaminated ground water, and liners to contain the leachate.
3-53

SECTION 3 FOOTNOTES
1 Tailings are often disposed of in ponds because, as described inSection 2, they leave the mill as a slurry.
2.Greber et al. 1979.
3Charles River Associates 1985a.
4Vick 1981.
5Goodson and Associates 1982.
6Curtin 1983.
7Seitter and Hunt 1982.
8Seitter and Hunt 1982.
9Seitter and Hunt 1982.
10Charles River Associates 1985b.
11Schiller 1983.
12Heming 1984.
13PEDCo Environmental, Inc. 1984.
14USDA Forest Service 1979.
15PEDCo Environmental, Inc. 1984.
16Wixson et al. 1983.
17Seitter and Hunt 1982.
18 A stope is an excavation from which ore has been mined in a series ofsteps.
19Vick 1981.
20Vick 1981.
21Goodson and Associates 1982.
22 Klohn 1981.
3-54

SECTION 3 FOOTNOTES (Continued)23
Portfors 1981.24
Vick 1981.
25US EPA 1982a.
26Vick 1981.
27EPA 1982a.
28 Vick 1981.
29PEDCo Environmental, Inc. 1984.
30Goodson and Associates 1982.
31PEDCo Environmental, Inc. 1984.
32TFI 1984.
33 U.S. Nuclear Regulatory Commission 1983
34 BOM 1985.
35 Geological Society of America 1971.
36 U.S. Nuclear Regulatory Commission 1983.
37 New Mexico Energy and Mining Department 1979.
38 New Mexico Energy and Mining Department 1979.
39 Pacific Northwest Laboratories 1983.
40BOM 1980b.
41Lucia 1982.
42Edwards et al. 1983.
43 DOE 1985.
44DOE 1985.
45BOM 1980.
46U.S. Nuclear Regulatory Commission 1983. 3-55

SECTION 3 FOOTNOTES (Continued)
47Lucia 1982.
48DOE 1985.
49DOE 1985.
50DOE 1985.
51DOE 1985.
52U.S. Nuclear Regulatory Commission 1983.
53DOE 1985.
54DOE 1985.
55Charles River Associates 1984.
56DOE 1985.
57U.S. Nuclear Regulatory Commission 1983.
58DOE 1985.
59U.S. Nuclear Regulatory Commission 1983.
6OBOM 1985.
61BOM 1980b.
62 Greber et al. 1979.
3-56
SECTION 4
POTENTIAL DANGER TO HUMAN HEALTH AND THE ENVIRONMENT
This section assesses the potential danger to human health and the
environment associated with wastes generated by the mining industry. It
identifies the hazardous chemical and physical characteristics of these
wastes, estimates the amount and type of mining waste possessing these
characteristics, describes mining waste damage case studies compiled by EPA,
and discusses the effectiveness of mining waste management systems.
In this section, EPA is responding to the requirements of Sections 8002(f)
and (p) of RCRA for analyses of the "potential dangers to human health and the
environment from surface runoff of leachate," the "potential danger, if any, to
human health and the environment from the disposal and reuse" of mining waste,
and "documented cases in which danger to human health or the environment has been
proved." Over a period of years, EPA has conducted these analyses with the
support of consulting firms and individual experts.
The studies sponsored by EPA involved waste sampling at 86 mines in 22
states; chemical analyses of solid and liquid samples (and leachates from the
solid samples); and monitoring of ground water at seven of eight
representative sites (and surface water of five of the sites).
Reports on mining industry damage cases were obtained from state files and
from information in EPA's files on sites on the National Priorities List for
Superfund cleanup. The damage case analysis focused on the range and severity
of contamination problems associated with mine and mill waste disposal at
active, inactive, abandoned, and Superfund sites.
4-1

EPA is currently analyzing the amounts and rates of toxic releases from
mine and mill wastes. This is an essential prerequisite to studies on
exposures and effects, and is required for any quantification of risks to
human health and the environment posed by these wastes.
4.1 WASTE CHARACTERISTICS CONSIDERED
Mining wastes may contain constituents, such as heavy metals, other toxic
elements, radionuclides, cyanide compounds, and asbestos, that may be
dangerous to human health and the environment. In addition, some mine wastes
are corrosive (acidic) and others have a high potential for forming acid.
Table 4-1 presents the waste characteristics evaluated for this report,
the criteria used to determine whether or not mining wastes have these
characteristics, and the rationale for choosing these criteria. As the table
indicates, EPA evaluated two general categories of waste characteristics for
this report: RCRA Subtitle C Hazardous Waste Characteristics and Other
Potentially Hazardous Characteristics. The following sections discuss the
waste characteristics evaluated, the sampling methodology, and the sampling
results obtained by EPA at selected mine sites.
To evaluate the hazardous characteristics of mining waste for this report,
EPA's Office of Solid Waste (OSW) subdivided mining industry segments into the
following mining region-commodity categories:
• New Mexico Uranium;
* Wyoming Uranium;
• Other Uranium;
*Florida Phosphate;
• Idaho Phosphate;
• Other Phosphate;
4-2
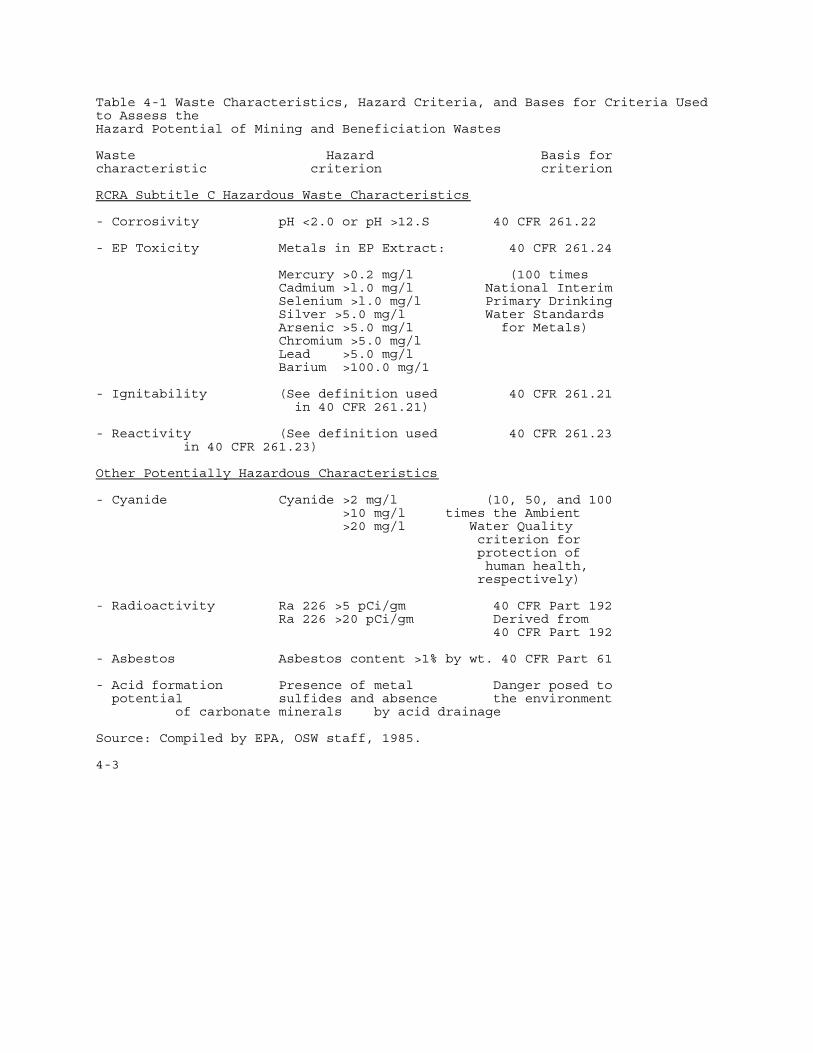
Table 4-1 Waste Characteristics, Hazard Criteria, and Bases for Criteria Usedto Assess theHazard Potential of Mining and Beneficiation Wastes
Waste Hazard Basis forcharacteristic criterion criterion
RCRA Subtitle C Hazardous Waste Characteristics
- Corrosivity pH <2.0 or pH >12.S 40 CFR 261.22
- EP Toxicity Metals in EP Extract: 40 CFR 261.24
Mercury >0.2 mg/l (100 times Cadmium >l.0 mg/l National Interim Selenium >l.0 mg/l Primary Drinking Silver >5.0 mg/l Water Standards Arsenic >5.0 mg/l for Metals) Chromium >5.0 mg/l Lead >5.0 mg/l Barium >100.0 mg/1
- Ignitability (See definition used 40 CFR 261.21 in 40 CFR 261.21)
- Reactivity (See definition used 40 CFR 261.23 in 40 CFR 261.23)
Other Potentially Hazardous Characteristics
- Cyanide Cyanide >2 mg/l (10, 50, and 100 >10 mg/l times the Ambient >20 mg/l Water Quality criterion for protection of human health, respectively)
- Radioactivity Ra 226 >5 pCi/gm 40 CFR Part 192 Ra 226 >20 pCi/gm Derived from 40 CFR Part 192
- Asbestos Asbestos content >1% by wt. 40 CFR Part 61
- Acid formation Presence of metal Danger posed to potential sulfides and absence the environment of carbonate minerals by acid drainage
Source: Compiled by EPA, OSW staff, 1985.
4-3

Southwestern Copper;
Other Copper;
Western Lead/Zinc;
Eastern Lead/Zinc;
Missouri Lead/Zinc;
Molybdenum;
•Nevada Gold/Silver;
Other Gold/Silver;
Taconite/Iron; and
•Tungsten.
EPA sampled at least one mine and mill in each of these categories for
this study.1 EPA then augmented this sample set by taking samples from
operations (e.g., heap and dump leach operations) and industries (e.g.,
beryllium and rare earth metals) either not covered at all, or not
sufficiently covered in the first sample set.2 These results were then
supplemented with data from a study performed for EPA's Effluent Guidelines
Division (now the Industrial Technology Division) on the following mining
industry segments: antimony, bauxite (aluminum), mercury, nickel, titanlure,
tungsten, and vanadium.3 EPA's Industrial Environmental Research Laboratory
performed the analyses of waste samples from mines in the asbestos mining
industry. Generally, EPA sampled the full range of waste types (e.g., fresh
tailings, mine water pond liquid and settled solids, tailings liquid and
settled solids, pregnant and spent leach liquor (process liquors that may be
characteristic of seepage from leach operations), and tailings dike material)
produced by mining and beneficiation operations in these segments. The Agency
also took additional samples of those wastes believed to be most likely to
present a hazard to human health and the environment (e.g., heap and dump
4-4

leach wastes). For this reason, the percentage of samples having hazardous or
potentially hazardous characteristics is probably greater than would have been
the case if a completely random sampling strategy had been used. However, the
Agency excluded all results from samples that were believed to be either
invalid or duplicative.
EPA's Office of Solid Waste planned the original sampling and analysis
effort in 1979-1980 and, with the cooperation of the Office of Research and
Development, took samples between 1979 and 1984. To show the scope of EPA's
mining waste sampling and analysis effort, Table 4-2 presents 1980 figures for
the number of active mines, the number of mines sampled, and the percent of
mines sampled. Data are presented for 1980, because this was the year in which
the sampling effort was planned and initiated. This table shows that EPA
sampled 13 percent of all metal mines and 31 percent of all asbestos and
phosphate mines active in 1980. Figure 4-1 is a map showing the locations of
the mines EPA sampled.
4.1.1 RCRA Subtitle C Hazardous Waste Characteristics
Solid wastes are defined as hazardous under regulations implementing
Subtitle C of RCRA if they exhibit any of four general characteristics:
ignitability, corrosivity, reactivity, or EP toxicity. They are also
considered hazardous if they are listed as hazardous in 40 CFR 261.31-261.33.
Wastes may be listed under RCRA if the Administrator of EPA determines that
the wastes meet one of the criteria in 40 CFR 261.11. The Administrator must
indicate whether the wastes are ignitable, corrosive, reactive, EP toxic,
acutely hazardous, or toxic (40 CFR 261.30). Since Congress has, at least
temporarily, excluded mining wastes from regulation under Subtitle C of RCRA,
EPA's current lists of hazardous wastes do not include wastes from mining and
beneficiation processes.
4-5

Table 4-2 Scope of EPA's Mine Waste Samplingand Analysis Effort
Number ofMining active mines Number of Percent ofindustry in sector, active mines active minessegment 1980a sampled sampled
Metals:Antimony 1 1 100 Bauxite (Aluminum)b 2 1 50Beryllium 1 1 100Copper 39 13 33Goldc 44 6 14Iron 35 5 14Lead 33 4 12Mercury 4 1 25Molybdenum ll 3 27Nickel 1 1 100
Rare earth 2 1 50metals
Silver 43 6 14
Titanium 5 2 40
Tungsten 29 1 3
4-6

Table 4-2 (continued)
Number ofMining active mines Number of Percent ofindustry in sector, active mines active minessegment 1980a sampled sampled
Uranium 265 17 6Vanadium 1 1 100 Zinc 20 7 35Subtotal 536 71 13Nonmetal s:Asbestos 4 2 50Phosphate 44 13 30Subtotal 48 15 31TOTAL 584 86 15
a Estimated by Bureau of Mines 1981 (BOM 1982).
b Although the BOM lists 10 active mines, there were only twooperations supplying bauxite for aluminum reduction. Theother mines are supplying bauxite for other uses.
c Excludes placer mines.
4-7


Mining wastes are far more likely to be corrosive or EP toxic than
ignitable or reactive. Therefore, EPA did not evaluate ignitability, which
measures the ability of wastes to cause or exacerbate fires, or reactivity,
which measures explosivity and the ability of sulfide or cyanide containing
wastes to generate toxic gases, vapors, or fumes, although some mining wastes
containing cyanide or sulfide may be reactive. However, the toxic properties
of cyanide-containing mining wastes were examined separately in this report.
The RCRA Subtitle C characteristics of corrosivity and EP toxicity are
discussed below as they relate to mining and beneficiation wastes. In
addition, copper dump leach, which may be a potential candidate for listing
under 40 CFR 261.31 because of its potential EP toxicity and corrosivity, also
is described.
4.1.1.1 Corrosivity
A waste is considered corrosive and therefore hazardous if it is a liquid
and has a pH less than or equal to 2 or greater than or equal to 12.5, as
determined by a pH meter.4 EPA chose pH as a "barometer of corrosivity,
because wastes exhibiting low or high pH can cause harm to human tissue,
promote the migration of toxic contaminants from other wastes, and harm
aquatic life" (45 FR 33109, May 19, 1980). The lower pH limit of 2.0 was
chosen so that "a number of substances generally thought to be innocuous and
many industrial wastewaters prior to neutralization" would not fall within the
corrosive classification. The upper pH limit of 12.5 was chosen to exclude
lime-stabilized wastes and sludges from corrosive classification (45 FR 33109,
May 19, 1980). For this study, EPA also evaluated whether samples had a high
pH (greater than 10 but less than 12.5) or low pH (greater than 2 but less
than 4), to aid in deciding which wastes could be potential candidates
4-9

for listing and which might cause damage to human health and the environment.
These pH levels, and associated contamination by toxic metals, can degrade
aquatic ecosystems.
Table 4-3 shows the results of the corrosivity analyses performed by EPA
for this report. Of the 159 liquid waste samples taken by EPA, only 5 were
corrosive. An additional 28 samples had low (more than 2 and less than 4) or
high (more than 10 and less than 12.5) pH's. Some of the liquid samples, such
as pregnant leach liquors or wastewater prior to treatment and discharge, are
considered by industry to be process streams. The characteristics of some of
these liquids would be likely to alter (improve) after the active life of the
mine.
Table 4-4 identifies all of the industry segments that had at least one
sample with a low or high pH. All copper dump leach operations had at least
one sample with a pH less than or equal to 4 and 11 of the 23 liquid samples
with pH's less than or equal to 4 were from the copper industry segment. Of
the nine waste management operations having samples with pH's greater than 10,
more than half were from tailings processed with caustic solutions. However,
tailings such as these may later be treated to lower their pH, which reduces
their hazard potential.
4.1.1.2 EP Toxicity
A solid waste is defined as EP toxic (and thus hazardous) if, using the
test methods described in 40 CFR Part 261 (Appendix II), an extract from a
representative sample of waste contains certain metals5 at a concentration
greater than or equal to 100 times the maximum contaminant levels for these
metals as established by EPA's National Interim Primary Drinking Water
4-10
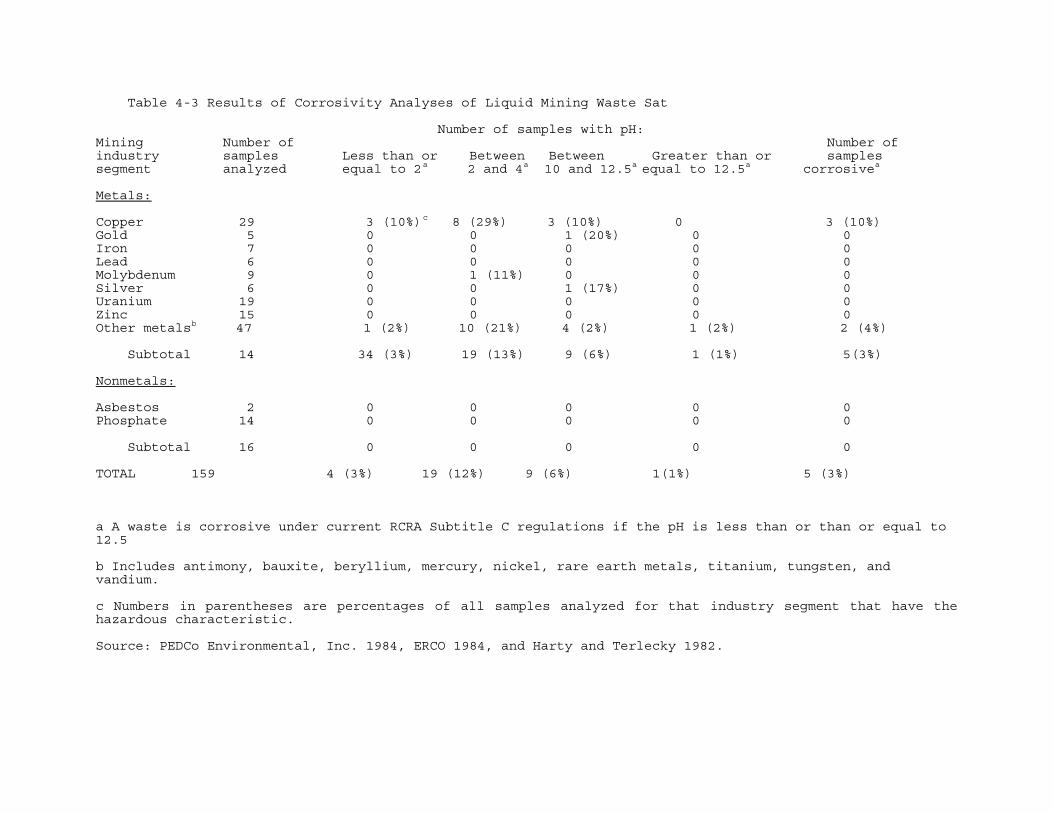
Table 4-3 Results of Corrosivity Analyses of Liquid Mining Waste Sat
Number of samples with pH:Mining Number of Number ofindustry samples Less than or Between Between Greater than or samplessegment analyzed equal to 2a 2 and 4a 10 and 12.5a equal to 12.5a corrosivea
Metals:
Copper 29 3 (10%)c 8 (29%) 3 (10%) 0 3 (10%)Gold 5 0 0 1 (20%) 0 0Iron 7 0 0 0 0 0Lead 6 0 0 0 0 0Molybdenum 9 0 1 (11%) 0 0 0Silver 6 0 0 1 (17%) 0 0Uranium 19 0 0 0 0 0Zinc 15 0 0 0 0 0Other metalsb 47 1 (2%) 10 (21%) 4 (2%) 1 (2%) 2 (4%)
Subtotal 14 34 (3%) 19 (13%) 9 (6%) 1 (1%) 5(3%)
Nonmetals:
Asbestos 2 0 0 0 0 0Phosphate 14 0 0 0 0 0
Subtotal 16 0 0 0 0 0
TOTAL 159 4 (3%) 19 (12%) 9 (6%) 1(1%) 5 (3%)
a A waste is corrosive under current RCRA Subtitle C regulations if the pH is less than or than or equal to12.5
b Includes antimony, bauxite, beryllium, mercury, nickel, rare earth metals, titanium, tungsten, andvandium.
c Numbers in parentheses are percentages of all samples analyzed for that industry segment that have thehazardous characteristic.
Source: PEDCo Environmental, Inc. 1984, ERCO 1984, and Harty and Terlecky 1982.

Table 4-4 Number of Mines, Wastes, and Operations with Samples Showing Low or High pH Levels
Number of waste management operations with at least one sample:
Number Number Type of of waste Having pH Having pH of opera-Mining waste management less than Having pH Having pH greater than tions withindustry management operations or equal between between or equal corrosivesegment operation analyzed to 2 2 and 4 10 and 12.5 to 12.5 waste a
Copper No. mines involvedb 13 3 5 1 0 3Mine wastec 7 0 3 0 0 0Dump leach 6 3 3 0 0 3Tailings 12 0 1 2 0 0
Gold No. mines involved 5 0 0 1 0 0Mine waste 1 0 0 0 0 0Heap leach 2 0 0 1 0 0Tailings 2 0 0 1 0 0
Molybdenum No. mines involved 3 0 1 0 0 0Mine waste 2 0 1 0 0 0Tailings 3 0 0 0 0 0
Silver No. mines involved 5 0 0 1 0 0Mine waste 0 0 0 0 0 0Heap leach 0 0 0 0 0 0Tailings 5 0 0 1 0 0
Other metalsd No. mines involved 10 1 4 3 1 2Mine waste 5 0 2 0 0 0Dump/heap leach 1 0 0 1 0 0Tailings 7 1 2 2 1 2

Table 4-4 (continued)
Number of waste management operations with
Number Type of of waste Having pH Having pH of opera-Mining waste management less than Having pH Having pH greater than tions withindustry management operations or equal between between or equal corrosivesegment operation analyzed to 2 2 and 4 10 and 12.5 to 12.5 waste a
Total No. mines involved 78 4 lO 8 1 5(All segments) Mine waste 43 0 6 0 0 0 Dump/Heap leach 10 3 3 1 0 3 Tailings 52 1 3 7 1 2
a A waste is corrosive only if its pH is less than or equal to 2 or greater than or equal to 12.
b The number of mines involved may be less than the sum of sampled operations if one mine has mo for example,the same mine site might have both mine waste and one or more leach operations.
c Mine waste includes mine water.
d Includes antimony, bauxite, beryllium, mercury, nickel, rare earth metals, titanium, tungsten, Source: PEDCo
Environmental, Inc. 1984, ERCO 1984, and Harty and Terlecky 1982.

Standards (NIPDWS) (40 CFR Part 141). EP toxic levels are:
• Mercury (Hg) >0.2 mg/l; . Cadmium (Cd) or selenium (Se) >1.0 mg/l;
. Silver (Ag), arsenic (As), total chromium (Cr), or lead (Pb) >5.0
mg/l; and,
. Barium (Ba) >100 mg/l.
EPA designed the EP toxicity test to simulate the leaching of hazardous
constituents from a sanitary land fill into ground water. It approximates the
conditions prevalent within a landfill where weak organic acids may come in
contact with toxic metals. In recognition of the fact that contaminant
concentration levels would decrease between the point at which the leachate
migrates from the waste and the point of human or environmental exposure, EPA
set EP toxicity levels for contaminants in leachate at 100 times the levels
acceptable in drinking water. An attenuation factor of 100 was used rather
than a lower level (e.g., 10 times the drinking water limit) because of the
lack of empirical data on which to base an attenuation factor, the absence of
a variance procedure (i.e., delisting) for wastes that fail the EP test, and
because "EPA believes the...[extraction procedure] to be a somewhat less
precise instrument than the listing mechanism for determining hazard, inasmuch
as the EP fails to take into account factors such as the concentration of
toxicants in the waste itself and the quantity of waste generated which would
have a bearing on the hazardousness of the waste" (45 FR 33111, May 19, 1980).
EPA preferred therefore to "entrust determinations of marginal hazard to the
listing mechanism rather than to the EP" (45 FR 33111, May 19, 1980). In
4-14

adopting the 100-fold attenuation factor, the Agency explained that "anything
which fails the EP at this factor has the potential to present a substantial
hazard regardless of the attenuation mechanisms at play" (45 FR 33111, May 19,
1980).
The metals measured by RCRA's EP toxicity test can, however, cause some
types of environmental damage at levels much lower than those that fail RCRA's
EP toxicity test or even EPA's National Interim Primary Drinking Water
Standards, especially if these metals are contained in wastes that contaminate
surface water rather than ground water. Accordingly, the 24-hour average level
of EP metals set by EPA's Ambient Water Quality Criteria for the Protection of
Aquatic Life are, in all cases, lower than those permitted by EPA's drinking
water standards, and therefore are much lower than the levels allowed by
RCRA's EP toxicity test. This does not mean that all mining wastes meeting the
EP toxicity test pose a threat to aquatic life, because the EP leaching
procedure was designed to evaluate the potential of a given waste for
unacceptable degradation of ground water and assumed that the wastes would be
disposed of above an aquifer supplying drinking water (a conservative
assumption). Table C-1 in Appendix C of this report provides a comparison of
EP toxicity levels, drinking water levels, and ambient water quality levels
for the metals measured by the EP toxicity test. Research findings on the
levels of metals measured by the EP toxicity test (i.e., arsenic, cadmium,
chromium, lead, mercury, and selenium) that are toxic to aquatic biota are
summarized in Tables C-2 to C-7 of Appendix C.
EPA's sampling results indicate that a small percentage of the mining
waste samples were EP toxic. Of the 332 samples from the metals mining
4-15

industry segments, 21 (6 percent) exhibited the characteristic of EP toxicity.
These 21 samples were from the copper, gold, lead, silver, zinc, and other
metals industry segments. An additional 39 samples had elevated levels (i.e.,
between 20 and 100 times the levels permitted by the drinking water standards)
of the metals measured by the EP toxicity test; these additional samples came
from these same industry segments and from the uranium and phosphate mining
segments. These results are summarized in Table 4-5.
Tables 4-6 and 4-7 differentiate EP toxicity test results for solid
samples and liquid samples, respectively. Twenty of the 21 EP toxic samples
were solid samples and 31 of the 39 samples with elevated levels (i.e.,
between 20 and 100 times the levels permitted in the drinking water standards)
of the metals measured by the EP toxicity test were solid samples. One liquid
sample was EP toxic, and it was from the copper industry segment.
Table 4-8 identifies all industry segments that had at least one EP toxic
sample or one sample with an elevated level of one of the metals measured by
the EP toxicity test. Samples from 86 mines were tested for EP toxicity. At
least one sample from 10 of these mines was EP toxic, and 29 mines had at
least one sample with an elevated level (i.e. greater than 20 times the
NIPDWS) of an EP toxic metal. A particularly high percentage of samples from
gold heap leach and tailings, lead mine waste and tailings, zinc tailings, and
copper dump leach operations had EP toxic or elevated levels of one of the
metals measured by the EP toxicity test. Four of the eight copper dump leach
operations, three of the seven zinc tailings operations, four of the six gold
tailings operations, two of the three gold heap leach operations, and five of
the six lead operations had at least one sample with a level of one of the
metals measured by the EP toxicity test greater than or equal to 20 times the
NIPDWS.
4-16

Table 4-5 Results of EP Toxicity Analyses for All Samples
Number of sampleswith at least oneEP toxic metal at
Mining Number of level between Number ofindustry samples 20 and 100X samplessegment analyzed the NIPDWSa EP toxica
Metals:
Copper 83 4 (15%) 1 (1%)Gold 26 7 (27%) 3 (12%)Iron 31 0 0Lead 15 4 (27%) 6 (40%)Molybdenum 15 0 0Silver 25 3 (12%) 4 (16%)Uranium 67 5 (7%) 0Zinc 25 5 (20%) 4 (16%)Other metalsb 45 8 (18%) 3 (7%)
Subtotal 332 36 (11%) 21 (6%)
Nonmetals:
Asbestos 7 0 0Phosphate 70 3 (4%) 0
Subtotal 77 3 0
TOTAL 409 39 (10%) 21 (5%)
a Numbers in parentheses are percentages of all samples analyzed for thatindustry segment that had the hazardous characteristic.
b Includes antimony, bauxite, beryllium, mercury, nickel, rare earth metals,titanium, tungsten, and vanadium.
Source:PEDCo Environmental, Inc. 1984, ERCO 1984, and Harty and Terlecky 1982.
4-17

Table 4-6 Results of EP Toxicity Analyses for Solid Samples
Number of sampleswith at 1 east oneEP toxic metal at
Mining Number of level between Number ofindustry samples 20 and 100X samplessegment analyzed the NIPDWSa EP toxica
Metals:
Copper 72 1 (1%) 0Gold 22 4 (18%) 3 (14%)Iron 30 0 0Lead 14 4 (29%) 6 (43%)Molybdenum 14 0 0Silver 22 3 (14%) 4 (18%)Uranium 63 5 (8%) 0Zinc 22 5 (23%) 4 (18%)Other metalsb 39 6 (15%) 3 (8%)
Subtotal 298 28 (9%) 20 (7%)
Nonmetals:
Asbestos 5 0 0Phosphate 68 3 (4%) 0
Subtotal 73 3 (4%) 0
TOTAL 371 31 (8%) 20 (5%)
a Numbers in parentheses are percentages of all samples analyzedfor that industry segment that had the hazardouscharacteristic.
b Includes antimony, bauxite, beryllium, mercury, nickel, rareearth metals, titanium, tungsten, and vanadium.
Source: PEDCo Environmental, Inc. 1984, ERCO 1984, and Harty andTerlecky 1982.
4-18

Table 4-7 Results of EP Toxicity Analyses for Liquid Samples
Number of sampleswith at least oneEP toxic metal at
Mining Number of level between Number ofindustry samples 20 and 100X samplessegment analyzed the NIPDWSa EP toxica
Metals:
Copper 11 3 (27%) 1 (9%)Gold 4 3 (75%) 0Iron 1 0 0Lead 1 0 0Molybdenum 1 0 0Silver 3 0 0Uranium 4 0 0Zinc 3 0 0Other metalsa 6 2 (33%) 0
Subtotal 34 8 (24%) 1 (3%)
Nonmetals:
Asbestos 2 0 0Phosphate 2 0 0
Subtotal 4 0 0
TOTAL 38 8 (21%) 1 (3%)
a Numbers in parentheses are percentages of all samples analyzedfor that industry segment that had the hazardouscharacteristic.
b Includes antimony, bauxite, beryllium, mercury, nickel, rareearth metals, titanium, tungsten, and vanadium.
Source: ERCO 1984 and Harry and Terlecky 1982.
4-19

Table 4-8 Number of Mines and Waste Management Operations with EP Toxic Sample or Samples Having Elevated Levels of Metals, as Measured by the EP Toxicity Test
Number of Number of Number of operations operations operations Type of with at least with at least with at leastMining waste Number of one EP toxic one sample one sampleindustry management operations sample between 20 and greater than 20xsegment operation analyzed (100X NIPDWS) 100X NIPDWSa the NIPDWSb
Copper No. mines involved 13 1 3 4 Mine waste 11 0 0 0 Dump leach 8 1 3 4 Tailings 13 0 0 0
Gold No. mines involved 6 2 5 5 Mine waste 6 1 0 1 Heap leach 3 0 2 2 Tailings 6 2 3 4
Lead No. mines involved 4 3 2 3 Mine waste 2 1 1 2 Tailings 4 2 2 3
Phosphate No. mines involved 13 0 3 3 Mine waste 13 0 1 1 Tailings 10 0 2 2
Silver No. mines involved 6 1 2 2 Mine waste 4 1 1 1 Heap leach 0 0 0 0 Tailings 6 1 1 2

Table 4-8 (continued)
Number of Number of Number of operations operations operations Type of with at least with at least with at leastMining waste Number of one EP toxic one sample one sampleindustry management operations sample between 20 and greater than 20Xsegment operation analyzed (l00X NIPDWS) l00X NIPDWSa the NIPDWSb
Uranium No. mines involved 17 0 5 5 Mine waste 17 0 5 5 Tailings NA NA NA NA
Zinc No. mines involved 7 2 3 3 Mine waste 5 0 1 1 Tailings 7 2 3 3
Other Metalsc No. mines involved10 1 5 5 Mine waste 7 1 2 2 Tailings 9 1 3 4
TOTAL No. mines involved 86 10 28 29(All segments) Mine waste 75 4 11 13 Dump/Heap leach 11 1 5 6 Tailings 65 8 14 18NA indicates not applicable to this report.
a Samples were not EP toxic but had elevated levels of EP toxic metals.
b Samples were EP toxic or had elevated levels of EP toxic metals; results in thiscolumn may not equal the sum of results in the previous two columns because samples weoften tested for more than one EP toxic metal.
c Includes antimony, bauxite, beryllium, mercury, nickel, rare earth metals, titanium, ttungsten and vanadium.
Source: PEDCo Environmental, Inc. 1984, ERCO 1984, and Harty and Terlecky 1982.

Table 4-9 shows the number and percentage of EP toxic samples and the
number of samples having elevated levels of the metals measured by the EP
toxicity test, by type of metal. Nineteen of the 21 samples failing the
standard EP toxicity test failed because they had EP toxic levels of lead; in
addition, 15 of the 39 samples with elevated levels of metals measured by the
EP toxicity test had elevated levels of lead.
For purposes of comparison with these EP toxicity test results, most mine
waste samples, most settled solid samples, and some low-grade ore samples were
subjected to a modified EP toxicity test in which deionized water, rather than
acetic acid, was used as the extracting medium. None of the 214 samples
subjected to this test produced leachates containing metal concentrations at
the EP toxic level, including the samples from the lead industry. These
modified EP test results show that in at least some mining waste situations,
lead and other toxic metal constituents may not be mobilized. Actual leachate
samples were usually not obtained, and therefore actual leachate
concentrations are unknown.
Since sulfuric acid simulates the situation in which waste leaches into an
acidic environment more closely than does acetic acid, sulfuric acid might be
an appropriate test leaching medium for modeling such an environment. For
example, when lead combines with sulfuric acid, the lead sulfate that is
formed precipitates out of the solution, which renders the lead less soluble
than it would be if it were combined with acetic acid. The results from EPA's
modified EP toxicity test using deionized water, and information on the fate
of some waste constituents in acidic environments, suggest that additional
toxicity tests may be necessary to simulate the potential hazard posed by some
mining wastes in some environments.
4-22

Table 4-9 Number and Percentage of EP Toxic Samples and Samples Having Elevated Levels of Metals Measured bytheEP Toxicity Test, by Type of Metal
Number of Percentage of samples with all samples elevated levels of with elevated Number of EP toxic metals levels of metals samples Percentage of (greater than 20 (greater than 20EP toxic EP toxic all EP toxic and less than 100X and less than 100Xmetals (100X NIPDWS)a samplesa NIPDWS)b NIPDWS)b Arsenic 1 5 3 8
Barium 0 0 2 5
Cadmium 1 5 6 15
Chromium 0 0 3 8
Lead 19 86 15 38
Mercury 1 5 8 21
Silver 0 0 0 0
Selenium 0 0 6 15
a Twenty-one samples were EP toxic. However, one of these samples had EP toxic levels of two of the metalsmeasured by the EP toxicity test.
b Thirty-nine samples contained metals measured by the EP toxicity test at levels between 20 and 100times the NIPDWS. Many of these samples contained these levels for more than one of the metal
Source: PEDCo Environmental Inc. 1984, ERCO 1984, Harty and Terlecky 1982.

4.1.1.3 EP Toxicity and Corrosivity (Copper Dump Leach Liquor)
In the case of dump leach liquor from copper dump leach operations, EPA
believes that the results of the sampling and analyses performed on these
samples and presented in Table 4-10 indicate that this waste may be a
potential candidate for listing because of its acidity and relatively high
concentrations of toxic metals. Partial results for samples of this waste were
presented in Tables 4-3 and 4-4 (Results of Corrosivity Analyses) and Tables
4-5, 4-7, and 4-8 (Results of EP Toxicity Tests).
As shown in Table 4-10, the sample from leach operation no. 1 was EP
toxic, with an arsenic level of 7.8 mg/l (156 times the NIPDWS) and a cadmium
level of 1.8 mg/l (180 times the NIPDWS). Samples from all three leach
operations had arsenic and cadmium levels at least 50 times their respective
NIPDWS limits. Samples from two of the three operations had levels of chromium
and selenium greater than 20 times the NIPDWS. Two of the three copper dump
leach samples were corrosive, with pH's of less than 2, and the sample from
the third site had a very low pH (2.49).
4.1.2 Other Characteristics
The other criteria used in this report to assess the potential hazard of
mining waste include properties such as radioactivity and acid formation
potential, and the presence at certain levels of hazardous constituents such
as cyanide or asbestos. These constituents and properties are considered to be
potentially hazardous because they are believed to pose a threat to human
health and the environment if they are present in waste, including mining
waste, at the levels specified below.
4.1.2.1 Cyanide
For the purpose of this report, EPA assessed liquid mining waste samples
in relation to various cyanide levels: greater than or equal to 2 mg/l,
4-24

Table 4-10 Results of Corrosivity and EP Toxicity Analysesof Copper Dump Leach Liquor Samples
Sample from Sample from Sample fromTested leach leach leachcharacteristic operation operation operation no. 1 (rag/l) no. 2 (rag/l) no. 3 (mg/1)
pH 1.82 1.95 2.49
Arsenicmg/l 7.8 3.5 2.5
(156 X NIPDWSa) (70 X NIPDWS) (50 X NIPDWS)
Bariummg/l _ _b -- --
Cadmiummg/l 1.8 0.82 0.55
(180 X NIPDWS) (82 X NIPDWS) (55 X NIPDWS)
Chromiummg/l 3.4 1.2 0.81
(68 X NIPDWS) (24 X NIPDWS) (16 X NIPDWS)
Lead mg/l -- -- --
Mercury mg/l -- -- --
Seleniummg/l 0.57 0.35 --
157 X NIPDWS) (35 X NIPDWS) --
Silver -- -- 0.13mg/l -- -- (3 X NIPDWS)
a National Interim Primary Drinking Water Standards.
b Dash (--) indicates level of this metal was less than the NIPDWS limit.
Source: ERCO 1984.
4-25

greater than or equal to 10 mg/l, and greater than or equal to 20 mg/l. These
levels are 10, 50, and 100 times, respectively, the ambient water quality
(AWQ) criterion for cyanide for the protection of human health (assuming daily
ingestion of 2 liters of contaminated drinking water and 6.5 grams of tissue
from organisms living in the same contaminated water). In the cost analysis
section of this report, EPA used a cyanide level of greater than or equal to
10 mg/l to define the threshold of hazard. (No samples from the iron, uranium,
other metals, asbestos, or phosphate industry segments were analyzed for
cyanide, because cyanide is not introduced into mining and beneficiation
processes in these industries.)
Because of the difficulty of analyzing waste samples for cyanide, EPA had
several laboratories test several of the cyanide samples. Table 4-11 shows the
results of cyanide analyses of liquid waste samples. Of 27 liquid samples
analyzed for cyanide, 8 samples (30 percent) had at least one test result
showing cyanide concentrations greater than or equal to 2.0 mg/l: seven of the
samples were from the gold industry segment, and one sample was from the
copper segment.
All of the cyanide sample test results for which at least one test showed
a cyanide level greater than or equal to 2.0 mg/l are presented in
Table 4-12. As shown on this table, the copper tailings pond sample had a
cyanide level between 2 and 10 mg/l, and three of the five gold tailings pond
samples had a cyanide level of at least 10 mg/l (and one of these three gold
tailings samples had a cyanide level of at least 20 mg/l). Both samples from
gold heap leach operations had cyanide levels greater than 10 mg/l.
EPA believes that wastes from gold and silver metal recovery and heap
leach operations may be potential candidates for listing, because of their
tendency to contain high levels of cyanide. Although EPA did not take any
4-26

Table 4-11 Results of Cyanide Analyses of Liquid Waste Samples
Number of samples with at least one test resultMining Number of showing CN greaterindustry samples than 2 mg/l asegment analyzed (10X AWQ)
Metals:
Copper 13 1 (8)Gold 7 7 (100)Lead 3 0Molybdenum 3 0Zinc 1 0
TOTAL 27 8 (30)
a Numbers in parentheses are percentage of samples taken in that industry segment having the potentially hazardous characteristic.
Source: Personal Communication from PEDCo Environmental, Inc. 1984; ERCO 1984.
4-27

Table 4-12 Summary of Cyanide Sampling Results for Liquid Samples with atLeast One Test Result Greater than 2 mg/l
Number Number Number Number of testsType of mine, of tests of tests of tests with CN valuesoperation, with CN values with CN values with CN values greater thanand sample Number less than between 2 between 10 or equal toidentification of tests 2 mg/l and 10 mg/l and 20 mg/l 20 mg/l
Copper mineTailings pondSample A 1 1
Gold mine 1Tailings pondSample A 3 1 2Sample B 4 3 1
Gold mine 2Tailings pondSample A 4 3 1Sample B 5 5
Gold mine 3Tailings pondSample A 1 1
Gold mine 4Barren leach pondSample A 1 1
Gold mine 5Pregnant heap leachSample A 1 1
Source: Personal communication from PEDCo Environmental, Inc. 1984; ERCO 1984.

samples of silver heap leach operations specifically, the similarity of gold
and silver heap leach operations makes it likely that silver heap leach wastes
also have high levels of cyanide. With few exceptions, gold and silver values
that are leached are extracted from finely crushed ores, concentrates,
tailings, and low-grade mine rock by dilute and weakly alkaline solutions of
potassium cyanide or sodium cyanide.6
In analyses performed to support the promulgation of effluent limitations
guidelines and standards for the ore mining and dressing point source category
(i.e., metals mining and beneficiation), EPA's Effluent Guidelines Division
(now the Industrial Technology Division) found that 2 of 68 mill wastewater
samples tested for cyanide from the copper/lead/zinc/gold/silver/platinum/
molybdenum industrial subcategory had cyanide levels greater than 2 mg/l but
less than 10 mg/l7 But these were influent samples (to treatment) and would be
treated prior to discharge. The highest discharge level, even without adequate
treatment, was 0.4 mg of total cyanide per liter. Free cyanide was not
measured.
Cyanide is an environmental hazard at levels significantly lower than 2
mg/l (EPA's Cyanide Ambient Water Quality Criteria for the protection of human
health). The 24-hour average level of cyanide allowed by EPA's Ambient Water
Quality Criteria for the protection of freshwater aquatic life is 0.0035 mg/l,
with the concentration not to exceed 0.052 mg/l at any time (45 FR 79331;
November 20, 1980). Table C-8 in Appendix C summarizes research findings on
the toxicity of cyanide to aquatic biota.
4.1.2.2 Radioactivity
Naturally occurring radionuclides in mining waste and ore may pose aradiation hazard to human health if the waste is used in construction or land
4-29

reclamation or if concentrations of radionuclides (e.g., radium-226) are high
enough to produce significant concentrations of hazardous decay products
(e.g., radon-222).
Two criteria have been used in this report to assess potentially hazardous
levels of radioactivity in mining waste. These criteria are both based on
EPA's Standards for Protection Against Uranium Mill Tailings (40 CFR Part
192). These regulations contain a "cleanup" standard for uranium mill tailings
that is set at a limit of 5 pCi of radium-226 per gram for the first 15
centimeters of soil below the surface. (The 5 pCi/g radioactivity criterion
was also chosen by EPA in an Advance Notice of Proposed Rulemaking published
in 1978 (43 FR 59022) that solicited comments on expanding the list of RCRA
hazardous waste characteristics to include a "radioactivity characteristic".)
The second radioactivity criterion used in this report, 20 pCi or more of
radium-226, is based on the "disposal design" portion of the same standard,
which requires that the average release rate of radon-222 not exceed 20 pCi
per square meter per second. In this report, EPA made the conservative
assumption that each picocurie of radium-226 per gram of waste produces an
average release rate of 1 pCi of radon-222 per square meter per second. As a
result, a radioactivity criterion of 20 pCi or more of radium-226 per gram of
waste can be assumed to include all wastes that would fail to meet the radon-
222 criterion set forth in 40 CFR Part 192.
EPA analyzed selected mining wastes to determine their radium-226
concentrations. Of 187 solid waste samples, 69 (37 percent) had radium-226
concentrations greater than or equal to 5 pCi/g. These samples were from the
uranium, "other" metals, and phosphate mining segments. Of the same 187
samples, 34 (18 percent) had radium-226 concentrations greater than or equal
4-30

to 20 pCi/g; these samples were also from the uranium, other metals group, and
phosphate mining industry segments. Results of the radium-226 analyses are
presented in Table 4-13. (Asbestos samples were not tested for radioactivity,
because EPA believed that wastes from this industry segment were unlikely to
be radioactive.)
The number of mines and waste management operations having radioactive
samples is presented in Table 4-14. All 17 uranium mines sampled by EPA had at
least one mine waste sample with a level of radium-226 greater than or equal
to 5 pCi/g. Fourteen of the 17 mines had at least one mine waste sample of
radium-226 greater than or equal to 20 pCi/g. Ten of the 13 phosphate mines
sampled by EPA had at least one sample with a level of radium-226 greater than
or equal to 5 pCi/g. Only 2 of these mines, however, had samples with levels
of radium-226 greater than or equal to 20 pCi/g. Two of the three other metals
mines sampled had at least one sample with a level of radium-226 greater than
or equal to 5 pCi/g. Only one of these mines, however, had a sample with a
radium-226 level greater than or equal to 20 pCi/g.
Much of the available scientific literature concerned with radiation
effects on organisms focuses on human health; information on these radiation
effects is summarized in Table C-9 of Appendix C.
4.1.2.3 Asbestos
EPA chose to evaluate asbestos as a potentially hazardous mining waste
constituent because of the well-documented inhalation danger that asbestos
fibers, even in very small quantities, pose to human health. The health
effects of asbestos exposure and the rationale for the level of asbestos
considered in this report to be potentially hazardous are described below.
4-31

Table 4-13 Results of Radioactivity Analyses of Solid Waste Samples
Number of samples Number of samples Mining Number of with Ra-226 level with Ra-226 levelsindustry samples greater than greater thansegment analyzed or equal to 5 pCi/gb or equal to 20 pCi/gb
Metals:
Copper 17 0 0Gold 4 0 0Iron 8 0 0Lead 4 0 0Molybdenum 6 0 0Silver 6 0 0Uranium 58 40 (69%) 29 (50%)Zinc 10 0 0Other metalsa 7 5 (71%) 2 (29%)
Subtotal 120 45 (38%) 31 (26%)
Nonmetals:
Phosphate 67 24 (36%) 3 (4%)
TOTAL 187 69 (37%) 34 (18%)
a Includes antimony, bauxite, beryllium, mercury, nickel, rare earth metals, titanium, tungsten, andvanadium.
b Numbers in parentheses show percentage of samples taken in that industry segment having the potentiallyhazardous characteristic.
Sources: PEDCo Environmental, Inc. 1984, ERCO 1984, and Harty and Terlecky 1982.
4-32

Table 4-14 Number of Waste Management OperationsHaving Radioactive Samples
Number of Number of operations operations with at least with at least one sample one sample
with level of with level ofMining Type of waste Number of Ra-226 greater Ra-226 greaterindustry management operations than or equal than or equalsegment operation sampled to 5 pCi/g to 20 pCi/g
Uranium No. mines involved 17 17 14 Mine waste 17 17 14
Phosphate No. mines involved 13 10 2 Mine waste 13 8 0 Tailings 10 6 2
Other metalsa No. mines involved 3 2 1 Mine waste 2 2 1 Tailings 3 2 1
Total No. mines involved 62 29 17 Mine waste 55 27 15 Heap/dump leach 2 0 0 Tailings 41 8 3
a Includes antimony, bauxite, beryllium, mercury, nickel, rare earth metals, titanium, tungsten, andvanadium.
Source: PEDCo Environmental, Inc. 1984 and ERCO 1984.

According to the 1982 EPA Support Document for the Final Rule on Friable
Asbestos-Containing Materials in School Buildings, "the hazards of asbestos
exposure identified by epidemiologic research are cancers of the lung, pleura,
peritoneum, larynx, pharynx and oral cavity, esophagus, stomach, colon and
rectum, and kidney. Inhalation of asbestos fibers also produces a non-
cancerous lung disease, asbestosis." Pleural and peritoneal mesotheliomas
(cancers) are considered "signature" diseases for asbestos exposure; that is,
these diseases are almost always caused by asbestos exposure. There are well-
documented cases of mesotheliomas occurring in persons residing within a mile
of an asbestos mine who had no other known asbestos exposure. 8
EPA has promulgated a National Emission Standard for asbestos 140 CFR Part
61, Subpart M) under Section 112 of the Clean Air Act, establishing asbestos
disposal requirements for active and inactive disposal sites. The regulation
requires owners and operators of demolition and renovation projects to follow
specific procedures to prevent asbestos emissions to the outside air, and
further requires that demolition and renovation material be controlled if the
material contains more than 1 percent asbestos by weight in a form that "hand
pressure can crumble, pulverize, or reduce to powder when dry." In this
report, the Agency used this 1 percent criterion to determine when mining
wastes should be considered potentially hazardous on the basis of their
asbestos content.
Only five waste samples obtained from asbestos mining and milling sites
were analyzed for asbestos. The results of these analyses, shown in
Table 4-15, indicate that the asbestos content of all of these samples greatly
exceeded 1 percent.
4-34

Table 4-15 Results of Asbestos Analyses
Estimated percentageSample Type of asbestosnumber asbestos by weight
1 Chrysotile 20-40
2 Chrysotile 5-20
3 Chrysotile 70-85
4 Chrysotile 30-50
5 Chrysotile 70-90
Source: Based on analyses performed by the IndustrialEnvironmental Research Laboratory, U.S. EnvironmentalProtection Agency, Cincinnati, Ohio.
4-35

Regulations in Subpart M of 40 CFR Part 61 also contain standards for
emissions from asbestos mills and active and inactive asbestos waste disposal
sites. According to these regulations, owners and operators of asbestos mills
must ensure that their facilities either discharge no visible emissions to the
outside air, or use air cleaning devices to clean emissions as specified in 40
CFR 61.154. Owners and operators of active asbestos waste disposal sites must
ensure that no visible asbestos emissions are discharged to the outside air,
cover asbestos-containing waste material at least once a day, or receive
approval from the Administrator of EPA to use alternate control measures. The
regulation also requires security measures for active and inactive asbestos
waste disposal sites.
There is evidence that asbestos is present in many of the wastes generated
by the metals mining industry segments covered in this report. Asbestiform
amphibole fibers from taconite mill tailings were detected at high
concentrations (14-644 million fibers per liter) in Lake Superior. 9 Sampling
performed by EPA's Effluent Guidelines Division to develop effluent
limitations guidelines and standards for the ore mining and dressing point
source category showed that asbestos fibers were present in mine or mill water
from almost all metals mining industry segments.10 Based on these results and
on a statistical comparison with the suspended solids data, EPA found that by
controlling the suspended solids in the discharge, the asbestiform fiber
concentrations were effectively controlled in this industry.
Some effects of asbestos exposure, such as toxicity, bioaccumulation,
cytotoxicity, asbestosis, and carcinogenicity on humans, bacteria, aquatic
biota, and rats are summarized in Table C-lO in Appendix C.
4-36

4.1.2.4 Acid Formation Potential
The exposure and subsequent oxidation of naturally occurring metal
sulfides (especially iron pyrite) in ores and mining waste can produce acid,
which may increase the leaching and mobility of toxic waste constituents,
including the heavy metals. Wastes that contain significant amounts of iron
pyrites (FeS2) or other base metal sulfides may release acids and metals for
many decades. The hazard is initiated by the chemical reaction of air, water,
pyrite, and pyrrhotite or other iron-bearing sulfides to produce sulfuric
acid:
4FeS2 + 15 O2 + 14H2O--->4Fe(OH)3(precip)+ 8H2SO4
For example, the oxidation of the pyrite in 1 ton of waste having a 1 percent
pyritic sulfur content would produce 15 kilograms of sulfuric acid. Unless the
acid is neutralized (by the alkalinity of the water or by reaction with
carbonate material in the waste), the acid will reduce the pH of the water and
increase the concentration of the potentially toxic waste constituents,
especially metals, that are leached and transported.
The potential effect of acid drainage on the concentration of metals in
leachate is illustrated in Figure 4-2. For example, at a pH of 5.5, the free
metal ion concentration in equilibrium with solid oxides or hydroxides of
mercury (Hg) is approximately 0.0002 mg/l. If enough acid is added to the
water to reduce the pH from 5.5 to 4.5, the concentration of mercury increases
to more than 0.02 mg/l, an increase of more than two orders of magnitude.
Although the diagram is an oversimplification and does not reflect the
complexities of the real world, it does demonstrate that acid may greatly
increase the concentration of metals in leachate and exacerbate environmental
hazards.
4-37


For this report, EPA estimated the quantity of metal mining waste that
poses an acid drainage problem, using information on the mineral content of
metal ores from 115 mines producing more than half of all the tailings
generated by the metals mining industry segments represented in the U.S.
Bureau of Mines Minerals Availability System data base.
To estimate whether the tailings from these mines have high, uncertain, or
no acid formation potential, EPA made the following assumptions:
•If the data base reports that the minerals content of the ore in aparticular mine includes pyrites and/or other metal sulfides but does not
include carbonates, the tailings from that mine have a high potential for
forming acid.
•If the data base reports that the minerals content of the ore in a
particular mine includes pyrites and/or other metal sulfides and
carbonates, the tailings from that mine have an uncertain
potential for forming acid.
If the data base reports that the minerals content of the ore in a
particular mine does not include pyrites and/or other metal
sulfides,
the tailings from that mine have no potential for forming acid. The
number of mines that generate tailings with high, uncertain, and no acid
formation potential are presented, by industry segment, in Table 4-16.
According to Table 4-16, mines having the highest acid formation potential are
found in the copper, gold, and silver industry segments.
The limitations of these data are:
• The data base does not report the mineral composition of the soil or
rock that is removed at mines to gain access to an ore body. It was assumed
that ore constituents were similar to waste (gangue)
4-39

Table 4-16 Estimated Acid Formation Potential of Tailings at Active Metal Mines by Industry Segment
NumberMining of active Number of Number of mines Number of mineindustry mines for mines with high with uncertain with no acidsegment which minerals acid formation acid formation formation data exists potential a,d potential b,d potential c,d
Copper 24 9 (38) 13 (54) 2 (8)
Gold 15 6 (40) 3 (20) 6 (40)
Iron 25 0 9 (36) 16 (64)
Lead 15 1 (7) 14 (93) 0
Silver 19 6 (31) 10 (53) 3 (16)
Zinc 18 0 17 (94) 1 (6)
a High Acid Formation Potential - Tailings derived from ores containing pyritesand/or other metal sulfides but no carbonate minerals (which would tend to neutralize produced acids).
b Uncertain Acid Formation Potential - Tailings derived from ores containing pyritesand/or other metal sulfides and carbonate minerals. (Such wastes may or may not produce acid, depending onthe relative ratio of acid-forming to acid-neutralizing minerals.)
cNo Acid Formation Potential - Tailings from ores containing no pyrites or other metal sulfides.
d Numbers in parentheses are percentage of all mines in an industry segment.
Source:Derived from ore minerals information in U.S. Bureau of Mines Mineral Availability System data base.For this analysis, only mines active in 1982 were considered.
constituents, but it is not clear that this extrapolation could be extended from tailings to overburden. For
example, the overburden may be completely different from the ore and have no acid formation potential.
• The reason that EPA categorized the acid formation potential of tailings from mines having both
acid-forming minerals (i.e., sulfides) and acid-neutralizing minerals (i.e., carbonates) as uncertain is
that the actual acid formation potential of these tailings may range from high to none, depending on the

relative concentrations of acid-forming and acid-neutralizing minerals in the
tailings. The concentration processes at some mills require the addition of
alkaline materials, which are mixed with the tailings and would reduce the
acid formation potential of these high-sulfide, low-carbonate ores.
• The presence or absence of water, which is necessary for pyrite
oxidation products to form acid, was not considered when
categorizing the acid formation potential of these tailings,
although many mines are located in arid regions of the country,
where the lack of water reduces the potential for acid drainage.
EPA has not considered whether chemical, mineralogical, biological,
climatological, or physical factors might also influence the ability
of tailings from particular mines to form acid.
Acid drainage can lower the pH of streams and other surface water. Table C-
11 in Appendix C of this report provides a summary of the effects of decreased
pH levels on fish.
4-41

4.2 ESTIMATED AMOUNTS OF POTENTIALLY HAZARDOUS MINING WASTE
EPA's methodology for estimating the amount of potentially hazardous
mining waste is presented in Appendix B to this document. EPA's estimate of
annual generation of hazardous waste and of the costs of treating and
disposing of hazardous waste are based on projections of the number of mines,
the amount of waste generated annually, and the amount of waste existing on
site during 1985. EPA felt that a projection to 1985 was preferable to using
historical data because of the rapid changes occurring in the mining industry
in recent years (i.e., declining production in many segments).
Table 4-17 shows these estimates for eight mining industry segments:
asbestos, copper, gold, lead, phosphate, silver, uranium, and zinc. Since
there were no data on asbestos mines in EPA's data base, results for asbestos
are based on historical data rather than projections; these data probably
overestimate the number of active asbestos mines and the amount of waste
generated at these mines annually, since EPA is aware that fewer than four
asbestos mines are now in operation. EPA did not project results for the iron
and molybdenum industry segments, because the wastes generated by these
segments do not exhibit any of the hazard characteristics for which EPA
tested. In addition, the other metals industry segments are not included in
this analysis because of the small number of mines in these industry segments
and the small amount of potentially hazardous waste generated at these mines
annually.
As shown in Table 4-17, the copper industry segment generates the largest
amount of waste annually: 632 million tons per year. The phosphate industry
segment, generating 518 million tons of waste per year, has the second highest
rate of annual waste generation. In many industry segments, the amount of
waste existing on site is very large, exceeding the annual amount of waste
generated by a factor of 20 to 40.
4-42
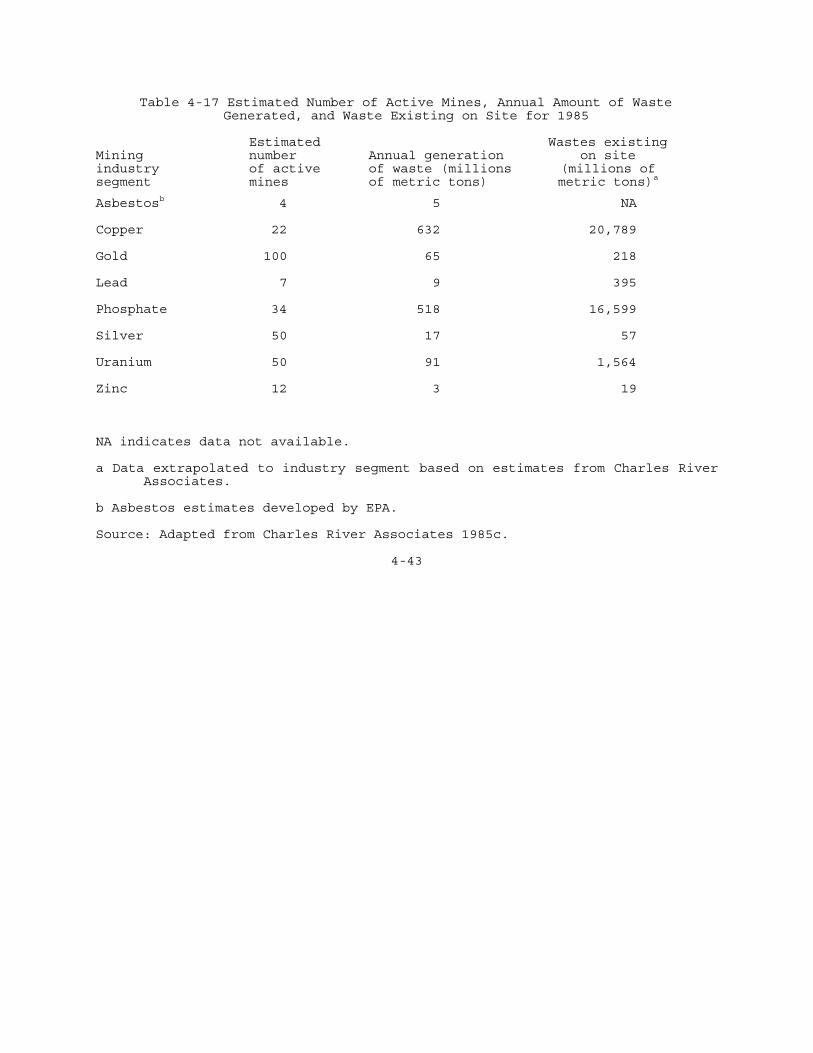
Table 4-17 Estimated Number of Active Mines, Annual Amount of WasteGenerated, and Waste Existing on Site for 1985
Estimated Wastes existingMining number Annual generation on siteindustry of active of waste (millions (millions ofsegment mines of metric tons) metric tons)a
Asbestosb 4 5 NA
Copper 22 632 20,789
Gold 100 65 218
Lead 7 9 395
Phosphate 34 518 16,599
Silver 50 17 57
Uranium 50 91 1,564
Zinc 12 3 19
NA indicates data not available.
a Data extrapolated to industry segment based on estimates from Charles RiverAssociates.
b Asbestos estimates developed by EPA.
Source: Adapted from Charles River Associates 1985c.
4-43

Table 4-18 presents EPA's estimates of the amount of mining wastes
generated annually that exhibit the RCRA hazardous waste characteristics and
mining wastes that may be potential candidates for listing, by industry
segment. The estimated amount of corrosive waste generated annually is 50
million metric tons a year. All of this corrosive waste is generated by the
copper industry segment. The estimated amount of EP toxic wastes generated
annually is 11.2 million metric tons per year, and 63 percent of this EP toxic
waste is generated by the gold industry segment. EP toxic waste is also
generated by the lead, silver, and zinc industry segments.
Table 4-18 also shows the amount of wastes generated annually of the types
that may be potential candidates for listing. The amount of copper dump leach
waste (a potential candidate for listing because of low pH and elevated EP
toxicity) generated annually is 182 million metric tons. Wastes from gold and
silver metal recovery and heap leach operations may be potential candidates
for listing because of their high levels of cyanide. The gold and silver
industry segments generate 9.3 million metric tons of metal recovery wastes
and 14 million metric tons of heap leach wastes annually that may be potential
listing candidates. The gold industry generates larger amounts of these wastes
annually than the silver industry.
Table 4-19 presents estimated annual generation amounts for wastes with
hazardous characteristics that are particularly relevant to mining industry
wastes: acid formation potential, radioactivity, and friable asbestos content.
EPA estimates that 95 million metric tons of waste have a high potential for
forming acid; all of this waste is generated in the copper industry segment.
This estimate of waste having high acid formation potential is probably low,
because EPA could only estimate the acid formation potential
4-44
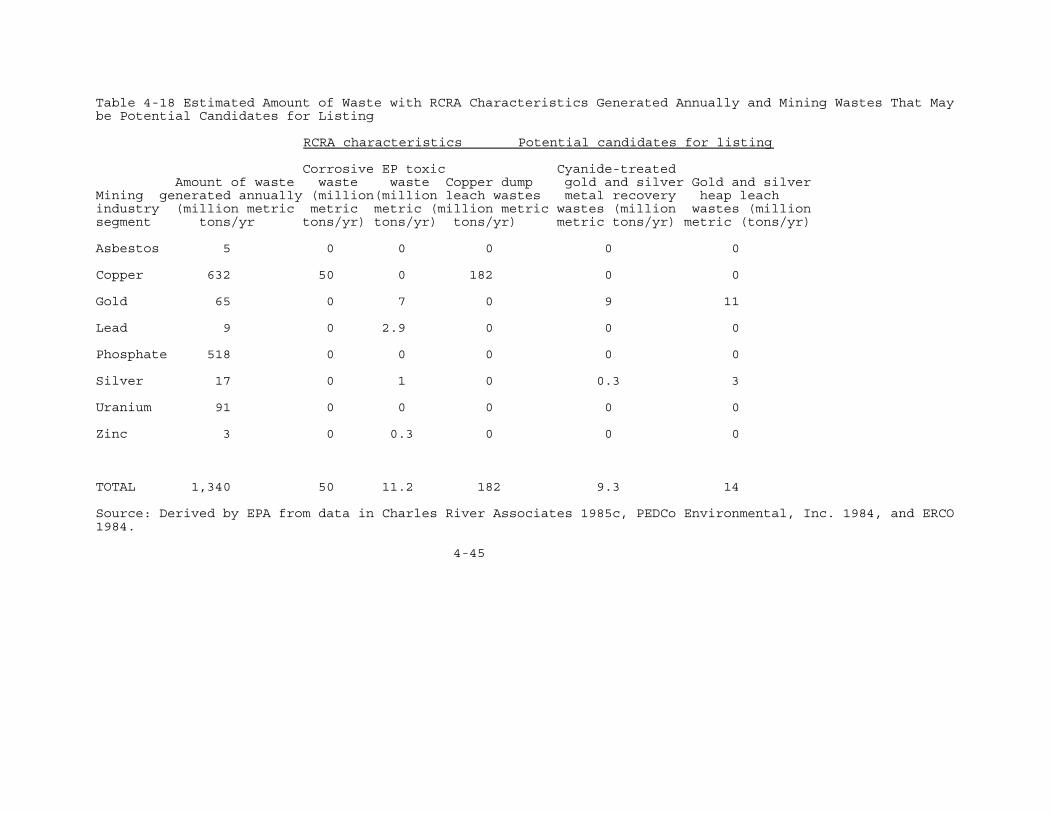
Table 4-18 Estimated Amount of Waste with RCRA Characteristics Generated Annually and Mining Wastes That Maybe Potential Candidates for Listing
RCRA characteristics Potential candidates for listing
Corrosive EP toxic Cyanide-treated Amount of waste waste waste Copper dump gold and silver Gold and silver Mining generated annually (million(million leach wastes metal recovery heap leachindustry (million metric metric metric (million metric wastes (million wastes (millionsegment tons/yr tons/yr) tons/yr) tons/yr) metric tons/yr) metric (tons/yr)
Asbestos 5 0 0 0 0 0
Copper 632 50 0 182 0 0
Gold 65 0 7 0 9 11
Lead 9 0 2.9 0 0 0
Phosphate 518 0 0 0 0 0
Silver 17 0 1 0 0.3 3
Uranium 91 0 0 0 0 0
Zinc 3 0 0.3 0 0 0
TOTAL 1,340 50 11.2 182 9.3 14
Source: Derived by EPA from data in Charles River Associates 1985c, PEDCo Environmental, Inc. 1984, and ERCO1984.
4-45

Table4-19 Estimated Annual Amount of Waste Generated Exhibiting Other Potentially Hazardous Characteristics,By Industry Segment Friable Annual High acid Radium-226 Radium-226 asbestos content production formation greater than or greater than or greater thanMining of waste potential equal to 5 pCi/g equal to 20 pCi/g 1% by weightindustry (million metric (million metric (million metric (million metric (million metricsegment tons/year) tons/year) tons/year) tons/year) tons/year)
Asbestos 5 0 0 0 5
Copper 632 95 0 0 NA
Gold 65 0 0 0 NA
Lead 9 0 0 0 NA
Phosphate 518 0 352 13 NA
Silver 17 0 0 0 NA
Uranium 91 0 91 80 NA
Zinc 3 0 0 0 NA
TOTAL 1,340 95 443 93 5
NA indicates data not available.
Source: Derived by EPA from data in Charles River Associates 1985c, PEDCo Environmental, INc. 1984, and ERCO1984.
4-46

of tailings (see Section 4.1.2.4). In addition, EPA classified the acid
formation potential of many tailings piles as uncertain because of lack of
data on the relative proportion of acid-forming to acid-neutralizing minerals
in these tailings, even though some of them probably have a high potential for
forming acid.
Table 4-19 presents estimates of radioactive waste at two radioactivity
levels--radium-225 equal to or exceeding 5 pCi/g, and radium-226 equal to or
exceeding 20 pCi/g. At the 5-pCi/g level, there are 443 million metric tons of
radioactive waste generated annually, 352 million metric tons in the phosphate
industry segment, and 91 million metric tons in the uranium industry segment.
If the 5-pCi/g level is used as the hazard criterion, radioactive waste is the
largest single contributor to the total amount of potentially hazardous waste
generated by the industry segments of concern. At the 20-pCi/g level, 93
million metric tons of hazardous radioactive waste are generated annually: 13
million metric tons in the phosphate industry segment, and 80 million metric
tons in the uranium industry segment.
The total amount of waste generated annually with a friable asbestos
content of more than 1 percent by weight is 5 million metric tons per year.
This amount may be an underestimate, because EPA did not sample wastes from
industry segments other than the asbestos industry for their friable asbestos
content.
Table 4-20 shows the estimated amount of potentially hazardous mining
waste generated annually, by industry segment. If the radioactivity criterion
used is 5 pCi or more of radium-226 per gram, 755.2 million metric tons of
potentially hazardous mining waste are generated by these segments annually.
If the radioactivity criterion chosen is 20 pCi or more of radium-226 per
gram, 405.2 million metric tons of potentially hazardous mining waste are
4-47
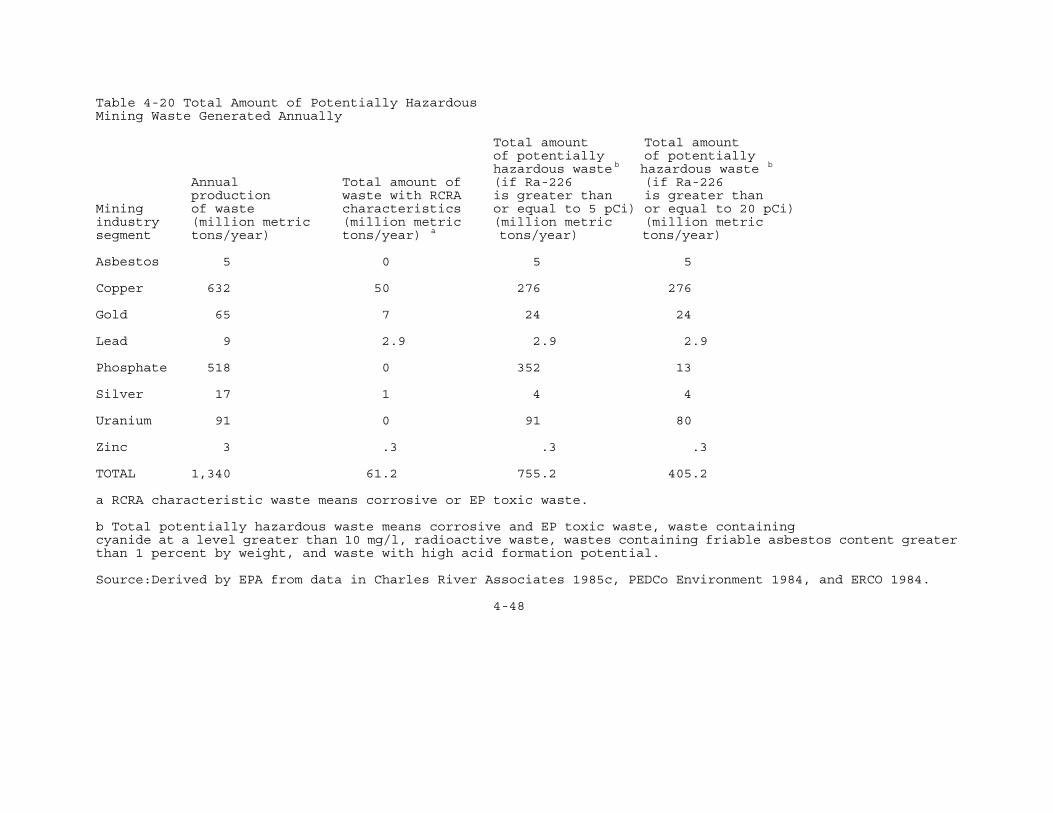
Table 4-20 Total Amount of Potentially HazardousMining Waste Generated Annually
Total amount Total amount of potentially of potentially hazardous waste b hazardous waste b
Annual Total amount of (if Ra-226 (if Ra-226 production waste with RCRA is greater than is greater thanMining of waste characteristics or equal to 5 pCi) or equal to 20 pCi)industry (million metric (million metric (million metric (million metricsegment tons/year) tons/year) a tons/year) tons/year)
Asbestos 5 0 5 5
Copper 632 50 276 276
Gold 65 7 24 24
Lead 9 2.9 2.9 2.9
Phosphate 518 0 352 13
Silver 17 1 4 4
Uranium 91 0 91 80
Zinc 3 .3 .3 .3
TOTAL 1,340 61.2 755.2 405.2
a RCRA characteristic waste means corrosive or EP toxic waste.
b Total potentially hazardous waste means corrosive and EP toxic waste, waste containingcyanide at a level greater than 10 mg/l, radioactive waste, wastes containing friable asbestos content greaterthan 1 percent by weight, and waste with high acid formation potential.
Source:Derived by EPA from data in Charles River Associates 1985c, PEDCo Environment 1984, and ERCO 1984.
4-48

generated annually. These total estimates do not equal the sum of the amounts
of waste considered hazardous based on individual hazard characteristics,
because waste from a single operation may be classified as potentially
hazardous for several different reasons. For example, 50 million metric tons
of copper dump leach are corrosive; however, this waste is also included in
the estimate of 182 million metric tons of copper dump leach waste that may be
a potential candidate for listing.
Sixty-one million metric tons of mining industry waste are hazardous,
according to the RCRA hazardous waste characteristics of corrosivity and EP
toxicity; for comparison, the total amount of hazardous waste generated
annually by all nonmining industry segments combined is 64 million metric
tons. The portion of mining industry waste that is hazardous because it is EP
toxic or corrosive is less than 5 percent of the total amount of waste
generated by these industry segments. Of mining industry wastes that may be
classified as hazardous because they are EP toxic or corrosive, 82 percent are
from copper dump leach operations that generate corrosive wastes, and an
additional 11 percent are EP toxic waste generated by the gold industry
segment.
Wastes that are hazardous according to the RCRA hazardous waste
characteristics of corrosivity and EP toxicity constitute 8 percent of the
total amount of potentially hazardous mining waste generated annually, if the
radioactivity hazard level chosen for radium-226 is equal to or more than 5
pCi/g. If the radioactivity hazard level for radium-226 is equal to or greater
than 20 pCi/g, mining wastes that are hazardous according to the RCRA
characteristics of corrosivity and EP toxicity comprise 15 percent of the
total amount of potentially hazardous waste generated annually.
4-49

4.3 EFFECTIVENESS OF WASTE CONTAINMENT AT MINING WASTE SITES
Because a large amount of mining and beneficiation waste is potentially
hazardous, human health and the environment could be adversely affected if these
wastes escape containment. EPA commissioned a contractor studyll to determine
whether mining waste management facilities leak and, if they do, whether they
release constituents of concern into surface or ground water.
The Agency also reviewed the results of other monitoring and mining studies to
corroborate its findings.
4.3.1 EPA Study
EPA selected eight mining sites at which to monitor ground and surface
water. The study focused on four types of waste (mine waste, tailings, dump
leach waste, and mine water) and five mining industry segments (copper, gold,
lead, uranium, and phosphate). Seven specific region-commodity categories of
waste were monitored: Arizona copper tailings ponds, New Mexico copper dump
leach wastes, gold tailings ponds from Nevada and South Dakota, Missouri lead
tailings, New Mexico uranium mine water ponds, Idaho phosphate mine waste
piles, and Florida phosphate tailings.
Ground water and surface water were monitored at four sites, ground water
only at three sites, and surface water alone at one site. At each site, four
or five samples were taken over a 6- to 9-month period. Samples were analyzed
for selected indicators, properties, or compounds that might be evidence of
leakage: antimony, arsenic, barium, beryllium, cadmium, calcium, chloride,
chromium, copper, cyanide, fluoride, iron, lead, magnesium, manganese,
mercury, molybdenum, nickel, nitrate, phosphate, potassium, selenium, silver,
sodium, sulfate, thallium, vanadium, zinc, acidity, alkalinity, conductivity,
pH, radionuclides, settleable solids, suspended solids, total dissolved
solids, total organic carbon, and turbidity.
4-50

Table 4-21 shows the Agency's interpretation of the monitoring results.
These results indicate, with a reasonably high degree of confidence, that most
of the facilities sampled do leak. However, the data do not demonstrate
conclusively that constituents reach concentrations of concern at all sites or
that they migrate over long distances.
At the copper mine sites, only ground water was monitored, because
southwestern streams, in general, flow only after storms. The site at which
copper tailings were monitored has surface runoff diversions for such events.
This site also uses thickened discharge, recovers about 50 percent of its pond
water, caps filled tailings ponds with alluvium, and then revegetates.
Monitoring results showed chloride concentration gradients and an increase in
total dissolved solids and sulfate over time in all wells, indicating seepage
from the copper tailings pond. Concentrations of sulfate (four to six times
higher than natural, local unimpacted levels) and total dissolved solids (two
to four times higher than natural but within range for the aquifer) exceeded
national drinking water standards in all wells and were even higher for the
tailings pond. (Drinking water standards include the National Interim Primary
Drinking Water Standards (NIPDWS) and National Secondary Drinking Water
Standards. These standards are used as a basis for comparison.) Although the
well farthest from the water table mound formed from pond seepage had the best
water quality, concentrations of metals were very low (near detection limits)
in all wells.
Copper dump leach liquor at the operation studied was very acidic,
contained high levels of total dissolved solids, and exceeded nearly all
primary and secondary drinking water standards. The pregnant leach liquor is
collected in a leachate collection pond and pumped back to the precipitation
4-51

Table 4-21 Results of the Monitoring Program
Industry Impact onsegment andmanagement Surface Groundpractice water water Seepage indicators Comments
Copper tailings NMa yes Sulfate, TDS, chloride Low concentration of metalspond
Copper dump leach NM yes Sulfate, TDS Seepage is recharging the aquifer
Gold tailings pond no yes Cyanide, chloride, sulfate, TDS, sulfate, and zinc nickel, and ammonia concentrations in downgradient wells equivalent to concentrations in tailings pond water
Gold tailings pond yes yes Cyanide, chloride, TDS, Surface water degradation after storms and pH Cyanide not detected in surface water. Metals did not exceed drinking water standards, although several other
indicators did
Lead tailings no no Sulfate, TDS, chloride Monitoring continues at this site; tailings may be having an effect on
shallow ground water
Uranium mine NM yes Sulfate, chloride, TDS, Barium, a precipitating agent, alsowater pond and radionuclides found downgradient to pond
Phosphate no NM No observable impactoverburden pile
Phosphate sand no no TDS, fluoride, chloride, Seepage greater in shallower aquiferand clay tailings total phosphorus, and
total organic carbon
a NM indicates not monitored.
Source: PEDCo Environmental, Inc. 1984
4-52

plant. At this site, ground-water degradation was evidenced by increased
concentrations of calcium, sulfate, and total dissolved solids. The leach pile
area is in an unlined natural drainage basin, and seepage from it apparently
is recharging the aquifer. (Although a hydrogeologic study was not conducted
to confirm that the mine pit acts as a ground-water sink, the bottom of the
mine pit is 700 feet lower than the water level in the background well.)
Gold tailings ponds receive cyanidation process wastes, have high
concentrations of cyanide, arsenic, cadmium, lead, mercury, and selenium, and
are typically alkaline. Cyanide was not detected in surface water near either
of the gold tailings ponds, although low but detectable cyanide levels in
wells at both sites indicate seepage to ground water. At the first site, an
underground mine, ore is crushed and then leached with a sodium cyanide
solution. Significant downstream increases were found for fluoride, specific
conductance, potassium, magnesium, sodium, and sulfate. These increases were
thought to be caused largely by natural weathering processes, and the
concentrations never exceeded South Dakota cold-water fish propagation stream
standards. Alkalinity decreased downstream, and surface water was not
considered to be impacted by the tailings pond. The strongest indicators of
tailings pond water seepage into ground water are the presence of constituents
added during the beneficiation process: chloride and cyanide. Cyanide was
detected in three (of six) downgradient monitoring wells; chloride in two.
Additionally, sulfate, sodium, nickel, and ammonia concentrations indicated
seepage. Cadmium, manganese, iron, sulfate, and total dissolved solids were at
or exceeded levels permitted by the drinking water standards. An independent
analysis of these data concluded that concentrations of zinc, total dissolved
solids, and sulfate in downgradient wells were essentially the
same as concentrations in the tailings pond water,12 supporting the conclusion
that contaminants had migrated.
4-53
The second mine site in the gold mining industry also employs cyanide
leaching. Spent leach liquors and leached ore are disposed of in tailings
ponds; decant water is recycled to the mill. In surface water, concentrations
of arsenic, manganese, total dissolved solids, and fluoride were significantly
higher downstream than upstream, but cyanide was not detected. Tailings pond
releases during storms and snowmelt were likely to be responsible for
downstream water contamination. Ground-water monitoring revealed
concentrations that exceeded drinking water standards for arsenic, manganese,
pH, chloride, fluoride, nitrate, lead, manganese, and total dissolved solids.
Seepage from abandoned underground mines may have contributed to these
elevated levels, particularly for arsenic and manganese. Cyanide was detected
at low levels in two of four wells, but metal concentrations did not exceed
levels permitted in drinking water standards. The presence of cyanide and the
increasing concentrations of total dissolved solids and chloride indicate
tailings pond leakage.
The underground lead mine selected for the EPA study is in Missouri, where
approximately 80 percent of all lead production occurs. The crushed ore goes
through a froth flotation circuit, and tailings are pumped to a pond. This is
a zero-discharge facility; a seepage and collection system recycles water to
the milling system. Surface water monitoring indicated significant increases
in calcium, magnesium, total dissolved solids, sulfate, nitrate, and chloride
downstream. These increases were attributed to natural weathering processes,
as all levels were within the range reported for streams that do not receive
lead mining waste. Although small amounts of cyanide are used to process these
ores, cyanide was not detected in surface water. The copper level exceeded the
level specified in Missouri standard for the protection of
4-54

aquatic life both upstream and downstream from the tailings pond. Ground-water
monitoring revealed high concentrations of sodium, fluoride, chloride,
sulfate, and total dissolved solids; the latter three were considered evidence
of seepage. In one sample, total dissolved solids exceeded permissible
drinking water standard levels. Groundwater continues to be monitored at this
site, which has a set of shallow and deep wells. Preliminary analysis
indicates that tailings are having a greater impact on the water quality of
the water in the shallower wells.
Only ground water was monitored near uranium mine water ponds in New
Mexico. Uranium is recovered from surface and underground mining at this site.
Waste management practices include overburden and waste piles, as well as
unlined settling ponds. Permissible levels specified in drinking water
standards were exceeded in several wells for selenium, nitrate, sulfate,
manganese, and total dissolved solids. Elevated concentrations of magnesium,
calcium, and sodium reflected the poor quality of the water in the aquifer.
High levels of nitrate, magnesium, and total organic carbon may have resulted
from leakage from a pond formerly used for sewage disposal. Gross beta and
gross alpha concentrations were elevated, and measurable levels of radium-226
were also found. High concentrations of sulfate, chloride, total dissolved
solids, and radionuclides in downgradient wells are considered indicators of
pond seepage. Elevated downgradient levels of barium are another indication,
because barium chloride is added to precipitate radium before water is
discharged to the pond.
The impact of phosphate mine waste (overburden) was evaluated at a mine in
eastern Idaho. This is an open-pit mining operation in which the overburden is
generally backfilled to inactive mine sites. Waste rock is usually graded
4-55

and revegetated. Surface runoff is collected in basins to remove suspended
solids before the water is discharged. EPA concluded, based on monitoring
results, that current mining operations have little impact on surface water.
Ground water was not monitored, because there were no suitable well sites.
In Florida, surface water and ground water were monitored near phosphate
sand and clay tailings. Several waste management practices are used: the clay
fractions are slurried to settling ponds and overflow is reused; sand tailings
are used as backfill; overburden is piled or used in dike construction.
Although levels of fluoride and sulfate were elevated in surface water,
quality did not appear to be affected by the tailings. No monitored
constituent exceeded its Florida Water Quality Standard. Two ground-water
aquifers were monitored: a shallow water table aquifer and a deeper Floridian
Aquifer. Elevated levels of several constituents in tailings serve as good
indicators of seepage: sodium, sulfate, fluoride, total organic carbon, total
phosphorus, radium-226, gross alpha, and gross beta. Of these, sodium, total
organic carbon, fluoride, and total phosphorus were statistically higher in
one or more wells downgradient to both aquifers than in respective background
wells. Although the fluoride level exceeded that of the drinking water
standards, all levels were within the range of ambient conditions. Chloride
and total dissolved solids, however, were higher than ambient conditions,
indicating that sand tailings constituents enter ground water. In conclusion,
data indicate that neither clay slime ponds nor sand tailings have seriously
affected the quality of shallow ground water. To date, neither practice has
had an impact on the deeper Floridian Aquifer, but this aquifer may be
recharged by the upper aquifer.
4-56

Table 4-22 compares selected concentrations of indicators in ground-water
monitoring wells near the mine site with drinking water standards and water
quality criteria, where these values are available. Ground-water degradation
may be attributable to current and/or past mining practices, although
naturally poor background water quality exists in some areas. Further
degradation may occur if additional waste constituents (notably metals that
have not thus far appeared in high concentrations in the monitoring wells)
migrate in the future. Factors governing leaching rates, fate, and transport
of constituents are complex, highly site specific, and dependent on
physicochemical properties of both the waste and the local subsurface
environment. For example, pH, reduction-oxidation potential, adsorption,
coprecipitation processes, and complex chemical and hydrologic interactions
are unique to each site. Seasonal factors that could not be assessed because
of the time constraints of this study are other localized influences on
constituent migration and transport. For these reasons, the results of this
study cannot be directly extrapolated to industry segments employing similar
waste management practices. Other studies may help place this monitoring study
in perspective.
4.3.2 Other Studies
This review is not comprehensive, but provides conclusions from earlier
EPA studies and studies conducted by state and local governments and the
academic community.
Mines can contaminate ground water through waste disposal practices, but
the nature of the contamination is highly variable and site specific. 13
Copper waste management practices leak constituents into both surface and
ground water. Factors that affect the migration of this leakage include ion
4-57

Table 4-22 Concentrationsa of Seepage Indicators in Ground Water at Selected Monitoring Sites b
Permissible level in Water quality Gold Uranium drinking water criteria for tailings Lead mine water PhosphateConstituent standardsc aquatic lifed pond tailings ponds tailings
Chloride 250 1.94 - 58.4 22.8 - 44.8 26 - 210 55.3-63.2
Cyanide 0.02 - 0.2 0.0035 0.02 - 1.76
Fluoride 1.4 - 2.4e 1.85-6.58
Nickel 0.056f 0.10 - 0.31
Radium-226 5 pCi/l 0.25-.33 pCi/l
Sulfate 250 800 - 1,200 38 - 108 770 - 1,810
Total dissolved 500 269-556 1,650- 5,800 169-205solids
a Concentrations are in milligrams per liter except as otherwise indicated.
b Values are from one or more wells downgradient or upgradient (or both) from the site.
c National Interim Primary Drinking Water Standards (NIPDWS) or Secondary Drinking Water Standards, exceptfor cyanide, where the "detection" limit is given.
d Values are for chronic freshwater animal toxicity.
e Temperature dependent.
f At a hardness of 50 mg/l CaCO3.
Source: PEDCo Environmental, Inc. 1984

exchange capacity, hydraulic conductivity, and carbonate content. 14
Carbonate neutralizes acids, and metals will precipitate when the pH is
neutral or alkaline. A study of the Tucson mining district found that leakage
from a copper tailings pond, indicated by hardness of and sulfate in the
water, degraded ground water downgradient from the pond.15
The Globe-Miami area east of Phoenix was also the focus of a study. 16
Copper mine runoff degraded surface water, and leaching practices degraded
ground water by lowering the pH and increasing total dissolved solids,
sulfate, copper, and other trace metal concentrations. Because of liquids
leaching through the soil, alluvia in area washes are contaminated with
sulfate, iron, and copper; the plume is advancing downgradient. Abandoned
mines have the same potential; but because of the arid climate, significant
degradation near these mines has not occurred.
The cyanidation process used in gold mining creates the potential for
cyanide migration. Cyanide can be free, part of other compounds, or strongly
complexed with metals. An EPA laboratory study17 showed that some forms are
mobile, while others are less so. Movement depends on the type of cyanide and
the media through which it travels. Potassium cyanide in leachate is less
mobile than water containing cyanide ions in soils. High pH and low clay
content increase cyanide mobility. In the soil, cyanide salts are biologically
converted to nitrates or become complexed with metals. Without oxygen,
cyanides become gaseous nitrogen compounds. These chemical changes take place
when cyanide concentrations are low. Former mining practices that did not
include wastewater treatment before release can be the source of persistent
cyanide concentrations. One company, reopening a mine closed for nearly
40 years, found levels of cyanide far above detection limits (0.14-0.58 mg/l)
4-59

while drilling test wells before activities began.18 Before mitigative
measures were implemented in 1982, one Nevada gold mine had ground-water
levels as high as 5,509 mg/l.19
Before proper environmental treatment systems were in place, the Missouri
Department of Conservation found a reduction in species diversity in the
aquatic habitat in the lead mining district that was directly attributable to
mining waste or milling effluent.20 In another study, surface water in the
area had low levels of dissolved metals, indicating potential transport out of
the system. A downstream lake was thought to act as a sink, and some sediments
had lead and zinc concentrations of 10 mg/l (Missouri Clean Water Commission
effluent guidelines are 0.05 and 0.2 mg/l, respectively, for these metals).
Releases from the sediments could create concentrations that exceed guideline
levels, although little is known about the conditions under which these
constituents may be released from the sediment.21
Radionuclide concentrations in uranium mine water are high, but a U.S.
Department of the Interior study showed that these concentrations are reduced
downstream as a result of adsorption or deposition in the soil. 22 An
earlier EPA study of the Grants Mineral Belt (New Mexico) estimated tailings
pond seepage at 48.3 million gallons a year.23
Idaho phosphate mining has been studied extensively. An earlier study at
the EPA site (before current management practices were in place) indicated
that mining practices had increased sediment and nutrients, added oils, and
reduced the aquatic habitat.24 Another study concluded that the potential
existed for surface and subsurface flow patterns to be altered and for water
quality to be degraded by several constituents: arsenic, cadmium, chromium,
copper, lead, molybdenum, selenium, vanadium, zinc, uranium, radium-226,
4-60

nitrogen, and phosphorus. However, the high carbonate content reduces the 25
solubility, and thus the potential impact, of these elements. 25 Finally, a
recent USGS survey of the phosphate mining industry indicated that neither
sand tailings nor clay slime ponds had a significant effect on ground-water
quality.26
4.4 STRUCTURAL INSTABILITY OF IMPOUNDMENTS
Impoundments may also pose threats to human health and the environment if
they are not structurally stable. The structural failure of impoundments can
release large volumes of waste. The causal factors in the failure of unstable
waste structures and the subsequent flooding range from cloudbursts or minor
earth tremors to extended periods of heavy rainfall, snow, or ice, or the27
dumping of more wastes than a saturated bank can contain.
Today there are thousands of tailings impoundments across the country that
have varying degrees of structural stability. Many of these facilities are
located in remote areas, but others are built within flood range of homes and
well-traveled roads. If these structures fail, extensive surface water
contamination, property damage, and life-threatening situations may occur.
Although dam and impoundment failures in the mining industry segments
covered in this report have not yet caused human deaths in the United States,
they have been responsible for significant environmental degradation. In
Florida, for instance, the collapse of a phosphate railings dike in 1971
resulted in a massive fish kill and pollution of the Peace River over a
distance of about 120 kilometers.28 Other dam failures at metal mining sites
have caused water quality degradation, crop failure, reductions in land
values, and fish kills.29
4-61
Stability problems are becoming more acute as the grade of the ore that is
mined decreases (resulting in larger quantities of mine waste and tailings),
as dam heights increase, and as the areas near mining facilities become more
highly populated.30 In addition, the recent promulgation of Effluent
Limitations Guidelines and Standards for discharges to surface water may have
aggravated these stability problems, because mine owners or operators may
elect to comply with NPDES permits by impounding larger quantities of water
than in the past. The potential danger posed by these impoundments is
increased by the fact that many new, large mines are situated in mountainous
areas where it is necessary to store large volumes of waste in valleys
upstream of inhabited areas.31
The Mine Safety and Health Administration 's (MSHA's) recent "Report of
Progress to Implement Federal Guidelines for Dam Safety" states that
"experience has shown that the unregulated disposal of mine and mineral
processing waste has the potential for disastrous consequences." 32
According to the U.S. Department of Agriculture, an estimated 10-20 percent of
the mine waste disposal embankments in the U.S. and Canada have experienced
significant slope stability problems.33
Technical personnel from MSHA recently completed field evaluations of 22
metal/nonmetal mine tailings dams located in areas under Bureau of Land
Management leases. They determined that no dams were imminent hazards, but
they did find technical deficiencies at many of the sites. 34 Investigations
of mine tailings impounding structures (tailings dams) in the past 2 years,
including five emergency calls requested by metal and nonmetal mine health and
safety district managers, have revealed hazardous conditions. Most of the
impounding structures inspected show some or most of these serious
deficiencies: extremely steep downstream slopes; no emergency outlet
4-62
structures such as spillways or decant systems; high water, often up to the crest
of the dams; cracks and sloughs in the structures themselves; narrow, uneven
crests; the absence of trash racks to keep drainage pipes unclogged;
and the absence of diverting ditches to keep surface runoff from entering impoundments.35
4.5 DAMAGE CASES
EPA has compiled, reviewed, and analyzed data on National Priorities List
(Superfund) mine and mill sites, data on damage at other mine and mill sites
contained in state files,36 and information in technical reports documenting
cases of mine waste-related environmental contamination.37'38
Although this analysis has separated the damage cases into four separate
categories (damage at active, inactive, abandoned, and Superfund sites), it is
important to note that active sites frequently become inactive, and inactive
sites are sometimes abandoned. Therefore, some of the special environmental
problems caused by conditions at inactive or abandoned sites (e.g., the
erosion of tailings and their discharge into surface water, or the collection 39
and discharge of frequently acidic and mineralized mine water) can only be
avoided if active sites undergo some type of closure procedures before they
become inactive or are abandoned.
4.5.1 Active Sites
Problems at active mine and mill sites have been documented in Arizona,
Colorado, Florida, Missouri, Montana, and New Mexico; these sites represent
phosphate, gold, silver, copper, uranium, and molybdenum operations. Releases
ranged from catastrophic (loss of pond liner integrity, pond overflow, dam
failure,40 tailings pipeline break) to chronic (pond seepage). Contaminants
included cyanides, sulfuric acid, and metals (copper, cadmium, chromium, lead,
4-63

mercury, and zinc). Both surface water41 and ground-water42 quality degradation
have been observed, with impairment of aquatic ecosystems most commonly caused
by massive releases. Remedial actions included relocating and improving
pipelines, replacing liners, installing of leachate recovery systems, and
stabilizing dams.
4.5.2 Inactive Sites
EPA has identified inactive mine and mill sites with environmental
contamination in Arizona, California, Idaho, Missouri, Montana, and Utah.
Mining industry segments represented include gold, silver, copper, mercury,
lead, and zinc. Catastrophic releases, often associated with heavy rains, have
resulted from dam failures, flood erosion of tailings, or dike washout.
Several sites had intermittent or seasonal problems caused by snow melt or
spring floods. Other sites, including old mine waste dumps and old tailings
impoundments, had chronic seepage or runoff problems. Contaminants measured in
surface water at concentrations greater than permissible levels in primary
drinking water standards include arsenic, cadmium, and lead. Reductions in
populations of fish and other freshwater organisms were observed near at least
12 inactive mine/mill sites that had had catastrophic or chronic releases.
Mitigation measures included dam repair, pond lining, development of diversion
ditches or secondary ponds, and lime treatment of tailings.43
4.5.3 Abandoned Sites
Many of the waste disposal practices that have resulted in major incidents
of environmental contamination at abandoned mine sites are no longer used
(i.e., the dumping of tailings into streams or onto uncontained piles). EPA
identified abandoned sites where environmental contamination resulted from
such practices in Arizona, California, Idaho, Montana, and Vermont. Gold
(placer and lode), silver, copper, lead, zinc, and unidentified hard rock
4-64

mining segments were represented. Various combinations of runoff, erosion, and
seepage resulted in the release of arsenic, cadmium, cobalt, iron, manganese,
lead, and zinc into surface waters, with resultant stress on stream ecosystems
over stretches ranging from 2 to 80 kilometers.44,45 At some sites, diversion
ditches and trenches to lower the water table have been used to mitigate these
effects, but no mitigation has been attempted at most abandoned sites.
4.5.4 National Priorities List Sites
Environmental contamination problems at the 13 abandoned mine/mill sites
on the Superfund National Priorities List (NPL) were generally caused by mine
waste disposal practices that are no longer used. These sites are located in
Arizona, California, Colorado, Idaho, Kansas, Oklahoma, and South Dakota.
Mining industry segments represented are gold/silver (five sites), asbestos
(three sites), lead/zinc (two sites), and copper (three sites). The three
asbestos sites differ from the other sites in posing an airborne hazard to
human health. The other 10 sites have chronic runoff and/or seepage, often
with acidic mobilization and transport of arsenic, cadmium, copper, iron,
lead, and/or zinc. Ground-water contamination, jeopardized water supplies, or
potentially contaminated food chains are the effects common to most of these
sites. Degradation of aquatic ecosystems also has been observed at nonasbestos
NPL sites. Mitigative measures applied to date include pond sealing,
installation of dams, berms, and diversion ditches, and use of the waste in
construction. Additional measures will be taken following completion of the
remedial plans for each site.
Brief descriptions of environmental contamination problems and threats to
human health posed by five NPL sites follow.
4-65

1 ) Mountain View Mobile Home Estates is a 45-unit, 17-acre subdivision
near the city of Globe in east-central Arizona. Before 1973, three mills, the
Metate Asbestos Corporation, the Jaquays Asbestos Corporation, and the Globe
town mill, processed chrysotile asbestos from nearby mines. In 1973 the Metate
mill was found to be in violation of EPA air quality standards, and the Gila
County Superior Court issued a temporary injunction to cease operations. The
injunction was made permanent in May 1974. Before terminating operations, the
owner of the Metate Corporation obtained a rezoning of this property into
residential subdivisions. Approximately 115,000 cubic meters of asbestos mill
tailings were used as the primary fill to level the site, which was then
covered with topsoil. The mill buildings, housing, and equipment remained
standing on the site. Lots were sold and occupied before the Superior Court
injunction was made permanent.
In October, 1979, asbestos contamination of the soil and air was detected
at the subdivision. Soil samples contained 5 to 50 percent asbestos fibers,
and air samples had as many as 78 fibers/cm3. The asbestos in the soil and the
airborne asbestos had contaminated all the households that were tested.
In December 1979, the Arizona Department of Health Services ordered the
responsible asbestos companies to submit site cleanup plans to be implemented
during the spring of 1980. In February 1980, the Arizona Division of Emergency
Services, with the authorization of the governor, provided temporary housing
for the residents (population approximately 130) while their properties were
being decontaminated. The Metate mill was demolished, and open ground was
capped with 6 inches of soil. The residents returned to their homes, but wind
and water erosion exposed some of the asbestos landfill material on the
surface of the soil, in the earth around the homes, and in two washes draining
the site.
4-66

In April 1983, the Centers for Disease Control in Atlanta issued a health
advisory for the site, noting continuing health hazards. The Remedial
Investigation and Feasibility Study funded by EPA proposed three solutions to
the problem.
The site abandonment option was chosen because it was the least costly of
the three and eliminated the need for continued site monitoring and selection
of an offsite disposal area. In addition to relocating the individuals in this
community, it was necessary to demolish existing structures. In this
particular case, mining waste contamination made the housing structures unfit
for habitation and ruined the community.
2) Acid drainage discharging from numerous mines and dumps at the Iron
Mountain site in California flows into Boulder Creek and Slickrock Creek, both
tributaries of Spring Creek. Concentrations of cadmium, copper, iron, and zinc
in the waters of these creeks exceed their respective permissible levels in
Federal drinking water standards by factors of 2 to 5. Spring Creek, with its
load of toxic metals, enters into the Sacramento River. The water supply
intake for the city of Redding (population approximately 50,000) is 2 miles
below the confluence of Spring Creek and the Sacramento River; and the water
intake for Bella Vista Water District, which serves approximately 15,000
people, is located 1 mile farther downstream. Water samples taken at the
Redding intake show elevated levels of cadmium, copper, iron, and zinc.
Samples of fish tissue from resident trout collected in the Sacramento River
showed high levels of cadmium, copper, and zinc.
3) At California Gulch, an NPL site in Colorado, approximately 30 private
wells have been abandoned because water from these wells is unfit for human
consumption. The surface water in California Gulch has been polluted so
4-67

extensively by acid mine drainage and the erosion of mining wastes into the
stream from the nearby mine site that the stream is devoid of any aquatic
life.
4) In 1962, the Celtor Chemical Works in Hoopa County, California, was
abandoned by its owners/operators after they received numerous citations for
contributing to pollution and fish kills in the Trinity River. Tailings ponds
and piles located on the flood plain were the sources of contaminants. In
1964, 2 years after closure of the operation, a flood obliterated the
structures and washed the tailings into the stream bed. As late as 1982, soil
and sediment samples collected both on site and off site showed elevated and
potentially health-threatening levels of cadmium (1.4 to 94.0 ppm), copper
(140 to 2700 ppm), lead (6 to 1900 ppm), and arsenic (4.7 to 40 ppm).
5) The Anaconda complex of mining, milling, and smelting facilities in
Montana disposed of approximately 5 billion tons of mining wastes in the
Silver Bow Creek/Clark Fork River. For a stretch of approximately
180 kilometers, the river system was heavily damaged by tailings materials
that were deposited in the river bed and in stream meanders. The river has
recently begun to recover, and the beginning of a renewal in aquatic life can
be seen in small plants and microinvertebrates that have become reestablished
there. Although the waste disposal practices of the early to mid-1900s that
caused this destruction are now prohibited by state and Federal laws; e.g.,
the Clean Water Act, the results of the waste practices of 40 years ago may
take another 40 years, and a considerable amount of resources, to undo.
4.6 RISK ANALYSIS
As shown in the previous portions of this section, some wastes from mining
and beneficiation do have the potential for being hazardous to human health
and the environment. EPA's waste sampling and analysis indicate that some
4-68

mine waste and mill tailings are EP toxic, generally for lead. The sampling
and analysis also showed that some leachates from copper leach dump operations
have the characteristic of corrosivity, with a pH less than 2.0; and even
those that are slightly less acidic can seriously jeopardize the quality of
ground water. Other waste streams, although not hazardous under current RCRA
characteristics, contain potentially hazardous concentrations of asbestos,
cyanide, or radioactive isotopes. Some tailings have the potential for acid
formation, and tailings impoundments may be subject to catastrophic breaks.
Ground-water monitoring studies by EPA and other organizations have
demonstrated that seepage from tailings impoundments into ground water is
common. Finally, various degrees of damage have been caused by chronic or
sudden releases from active, inactive, or abandoned mine and mill sites.
The previous portions of this section do not, however, provide
quantitative estimates of releases, exposures, or risks associated with
various mine and mill waste disposal practices. Without this information, the
efficacy of current and alternative management practices cannot be compared.
Therefore, EPA is now studying the use and release of cyanides and acids at
typical mining and beneficiation operations. Specifically, cyanide releases
from metal recovery circuits and heap leaching operations are being examined.
Sulfuric acid releases being examined include those from active, inactive, and
abandoned copper leach dumps and copper mill tailings impoundments.
EPA also has begun general studies relating the respective locations of
drinking water supply systems and human population centers to mines and mills.
A preliminary analysis, based on the Federal Reporting Data System, indicates
that for 58 mine/mill sites, 20 have public ground-water systems within 5
kilometers of the site. These public water systems serve populations ranging
from 42 to 47,494. Another EPA data base, the Graphic Exposure
4-69
Modeling System, uses Census Department data for population distributions and
shows that people live within 5 kilometers of the mines at 30 of the 58 sites,
with total populations between 5 and 11,736. Only ll of the 58 sites have both
resident populations and public ground-water systems within 5 kilometers.
If EPA identifies significant mining waste releases of cyanides, acids, or
other constituents of concern, further analyses will focus on actual or
potential risks to human populations or aquatic ecosystems. These studies will
take into consideration the properties of various kinds of mine overburden,
mill tailings, and heap/dump materials. Constituents other than EP toxic
metals will be examined to determine whether their release can jeopardize
aquatic organisms. Degradation, attenuation, precipitation, and other
processes affecting the transport of released materials will be examined. To
assess the potential for ground-water contamination, site-specific estimates
will be made for such factors as porosity, permeability, and moisture content
in the unsaturated zone, and for hydraulic conductivity in the saturated zone.
The risk analyses will be used to quantify threats that releases from mine
and mill wastes pose to human health and the environment. These analyses will
permit EPA to consider the wide variation in mining practices and settings,
and to determine how changes in management practices can be implemented to
improve and protect human health and the environment. EPA would conduct risk
analysis as part of the development process for any major regulation of
hazardous waste from the mining and beneficiation of ores and minerals.
4-70

4.7 SUMMARY
To identify mining and beneficiation wastes with the potential to endanger
human health and the environment, EPA conducted an extensive program of
sampling and analyzing mine waste, mill tailings, and wastes from heap and
dump leach operations to determine their chemical properties. These-studies
were supplemented by data from ground-water monitoring, estimates of acid
formation potential, a survey of state files to obtain documented cases of
damage to human health and environment, and a review of the pertinent
literature. In the sampling and analysis studies, corrosivity and EP toxicity
were measured, because they are the RCRA Subtitle C characteristics most
likely to be exhibited by wastes from mines, mills, and leach operations. The
radioactive content of many solid and liquid samples also was measured. When
appropriate, measurements were taken of asbestos or cyanide content. Most mine
waste samples, most settled solid samples, and some low-grade ore samples were
also subjected to a modified EP toxicity test, in which deionized water,
rather than acetic acid, was used as the extracting medium. It should be noted
that EPA has not yet performed quantitative assessments of the risks posed by
mining wastes. These will require measurement or estimation of waste
constituent transport, as well as receptor population exposure, dose, and
response.
Extrapolating from the sampling and other analytic results, EPA estimated
the amounts of potentially hazardous waste generated by the mining industry
segments of concern annually. Estimated amounts are: 50 million metric tons a
year (MMTY) of corrosive wastes; ll MMTY of EP toxic wastes; 23 MMTY of
cyanide-containing wastes; 95 MMTY of wastes with high acid formation
potential; and 182 MMTY of copper leach dump wastes with the potential for
releasing toxic metals and acidic (but not corrosive) liquids. If a
4-71

radioactivity level of 5 pCi per gram of waste is chosen as the radioactivity
hazard criterion, 352 MMTY of phosphate mine waste and mill tailings and 91
MMTY of uranium overburden and low-grade ore would be considered hazardous.
The total amount of potentially hazardous waste generated annually, 755 MMT,
is not equal to the sum of the wastes in these categories because some of the
wastes are in more than one category.
Analyses of ground water monitoring results and damage cases showed that a
number of constituents leak from tailings impoundments and copper leach dump
operations. However, it is not clear that this seepage constitutes a danger to
human health, although it could degrade the quality of water in aquifers. The
instability of impoundment dams was identified as a possible threat to human
health and the environment, with damage at active, inactive, and abandoned
sites attributed to catastrophic releases of impounded slimes, sands, and
water.
In assessing the 13 mine/mill sites on the National Priorities List (NPL),
prepared under the Comprehensive Environmental Response, Compensation, and
Liability Act (CERCLA), EPA determined that the contamination problems
associated with these sites were generally caused by disposal practices no
longer used. Natural recovery and decontamination processes at these sites
have been slow, and additional time and resources will be needed before
recovery is complete.
To determine the degree of risk from wastes at existing mine, mill, and
leaching operations, identified as hazardous or potentially hazardous, EPA is
conducting studies on release rates, exposure pathways, and possible effects
on human health and the environment. These risk assessments will permit EPA to
consider the wide variability in mining wastes and environments and to
determine which changes in management practices would be most beneficial.
4-72

SECTION 4 FOOTNOTES
1PEDCo Environmental, Inc. 1984.
2ERCO 1984.
3Harty and Terlecky 1982.
4 Liquid wastes are also considered corrosive and therefore hazardous ifthey corrode steel at a rate greater than 6.35 mm per year at a testtemperature of 55°C, as determined by the test method specified inNational Association of Corrosion Engineers Standard TM-01-69,standardized in "Test Methods for the Evaluation of Solid Waste,Physical/Chemical Methods" or an equivalent test method approved by theAdministrator (40 CFR 261.22). "EPA chose metal corrosion rate as itsother barometer of corrosivity because wastes capable of corroding metalcan escape from the containers in which they are segregated and liberateother wastes" (45 FR 33109, May 19,1980). Because of the preliminarynature of the findings of this report, and because mining wastes are notlikely to be stored in metal containers, EPA's corrosivity analyses forthis report are based solely on the pH measure.
5 Wastes are also considered EP toxic (and thus hazardous) if the extractof a representative sample of waste contains any of the followingpesticides or herbicides at levels specified in 40 CFR 261.24 (b), Tablel: Endrin; Lindane; Methoxychlor; Toxaphene; 2,4-D; 2,4,5-TP Silvex. EPAdid not use the EP toxicity test to analyze mining wastes for thesecontaminants.
6US EPA 1982a.
7US EPA 1982a.
8US EPA 1982b.
9Cook et al. 1976.
10US EPA 1982a.
11PEDCo Environmental, Inc. 1984.
12Williams and Steinhorst 1984.
13US EPA 1977.
14PEDCo Environmental, Inc. 1984.
15 Pima Association of Governments 1983.
4-73

16Gordon 1984.
17US EPA 1976.
18 Letter to Nevada Division of Environmental Protection fromMargaret Hills, Inc. 1981.
19File memo from Cortez Gold Mines, Cortez, NV, 1983.
20Ryck and Whitely 1974.
21Jennett and Foil 1979.
22U.S. Department of the Interior 1980.
23US EPA 1977.
24Platts and Hopson 1970.
25Ralston et al. 1977.
26 U.S. Geological Survey, U.S. Bureau of Land Management, andU.S. Forest Service, 1977.
27Carroll 1983.
28BOM 1981a.
29SCS Engineers 1985.
30Soderberg and Busch 1977.
31Klohn 1981.
32MSHA 1983.
33USDA Forest Service 1979a.
34MSHA 1983.
35MSHA 1983.
36 The data from the state files and the National Priorities Listwere not analyzed in depth, nor were any of the sites visited,but enough documented cases were obtained to demonstrate therange and severity of contamination problems that may beassociated with mine and mill waste disposal.37 SCS Engineers 1985. 4-74

38Unites et al. 1985.
39Martin and Mills 1976.
40Schlick and Wahler 1976.
41Missouri Geological Survey 1979.
42Gordon 1984.
43SCS Engineers 1984.
44Schrader and Furbish 1978.
45 Jennett and Foil 1979.
4-75

SECTION 5
THE ECONOMIC COST
OF POTENTIAL HAZARDOUS WASTE MANAGEMENT
This section examines the potential cost to facilities and selected
segments of the mining industry if EPA were to regulate mining and
beneficiation wastes under the hazardous waste controls of Subtitle C of RCRA.
The cost study on which these estimates are based was restricted to five major
metal mining segments (copper, lead, zinc, silver, and gold), and covered
mines currently active in 1984.1 The estimates do not cover mining
segments in which there are potential hazards from radioactivity or asbestos,
although studies assessing the cost of reducing exposure to radioactivity are
underway.
To examine potential costs that might be imposed on the selected metal
mining segments, the Agency constructed eight hypothetical regulatory
scenarios differing in degree of impact. These scenarios utilized combinations
of four different sets of management standards, varying in stringency, and two
different sets of hazardous waste criteria for determining which waste streams
would be regulated. The estimated incremental costs reflect the added
expenditures that facilities and industry segments would incur above and
beyond the cost of current waste management practices.
The results are tentative, since they are based on only a sampling of
sites, very general engineering cost evaluations, and various hypothetical
regulatory scenarios. Nevertheless, the estimates do provide a first
approximation of the potential level and variation of cost under the specified
assumptions. They do not evaluate broader economic effects such as implied
5-1
mine or mill closings, employment losses, price changes, or international
trade effects.
The subsections below describe the methods and summarize the results.
5.1 COST METHODOLOGY
To estimate the costs of potential regulation, EPA (1) established criteria
for determining whether waste is potentially hazardous; (2) developed
hypothetical alternative regulatory standards for waste management practices
with different degrees of stringency; (3) estimated the incremental cost of
imposing those standards at a large sample of mining facilities; and (4)
extrapolated these results to the universe of applicable mining facilities in
the segments covered by the study.
The cost study focused only on currently active (1984) "major" mines--
i.e., mines generating greater than 10,000 short tons of ore per year, except
for gold and silver operations where a lower production cutoff was used. For
the five metal segments studied (copper, lead, zinc, gold, and silver), the
study results cover approximately 190 active mine sites representing an
estimated 95 percent of the total active mines and 99 percent of the total
amount of waste currently generated in these five segments.
EPA established two levels of criteria, referred to here as Scenarios A
and B, for determining whether waste is hazardous. EPA also defined four
levels of regulation, varying from imposing full Subtitle C regulations (most
stringent) to imposing only a basic maintenance and monitoring function (least
stringent). Combining the two hazardous waste scenarios and the four
regulatory standards resulted in eight different scenarios.
To estimate the additional cost of each of these eight scenarios at
specific sites, EPA (1) identified the capital and operation and maintenance
5-2
needs for each scenario; (2) developed engineering cost functions reflecting
these requirements; (3) established a data base with all the necessary
information (e.g., waste volumes, acreage, perimeter distance, current waste
management practice) for estimating costs from the cost functions; and (4)
applied information from 47 specific mines to the cost functions to develop
the incremental costs at those sites.
Finally, EPA extrapolated the site-specific results to the universe of
mining waste to develop industry totals. It did so by projecting from the
site-specific cost by industry segment (copper, gold, silver, lead, zinc), by
waste operation (mine waste, leach operation, tailings), and by scenario. The
distinguishing feature of this approach is that the costs reflect real-world,
site-specific data.
5.1.1 Hazardous Waste Criteria
Regulated waste volumes depend on the criteria selected for determining
whether wastes should be regulated, and EPA used the basic waste character-
istics described in Section 4 to specify which waste streams should be
considered as potentially hazardous for costing purposes, creating two sets of
waste: "A" and "B." (Estimates of the volume of potentially hazardous wastes
are discussed in Section 4.2.)
"A-Scenario" Wastes include waste streams meeting the Subtitle C tests for
EP toxicity and corrosivity. In addition, they include gold mine tailings
wastes from cyanide-process metal recovery operations (originally promulgated
as interim final Subtitle C listed hazardous wastes prior to the Section 3001
exemption).
"B-Scenario" Wastes include all wastes under the "A" list, as well as:
• Gold and silver heap leach operations (because of cyanide content);

•Wastes with high acid formation potential--i.e., those found to contain high
sulfides (mainly pyrites) and low carbonate or other buffering mineral content
(as defined in Section 4); and
• Copper dump leach liquids (because of acidity). The "B" list of wastes
represents a range of mine waste characteristics of concern over and above the
hazard characteristics already contained in existing EPA hazardous waste
regulations as expressed by the "A" list. The Agency examined the "B Scenario"
list to be able to explore, quantitatively and systematically, the waste
quantity and management cost implications of regulating these additional
wastes of concern.
5.1.2 Regulatory Standards
EPA structured four regulatory alternatives for different levels of waste
management practice. The regulatory alternatives covered a range of variations
on Subtitle C management standards, ranging from the full set of standards at
one extreme to a much more modest program of basic preventive maintenance and
ground-water monitoring at the other end of the spectrum.
The Full Subtitle C Regulatory Scenario (Scenario 1) provides for a full
application of current EPA hazardous waste regulation to potentially hazardous
"A" or "B" mine waste, leach piles, and mill tailings. For present costing
purposes, it represents a maximum cost strategy, including: a security fence
around the perimeter, capping of both existing and new waste sites at closure,
corrective action via interceptor wells for existing waste amounts (assuming
10 percent of the sites need them), and liners for all new waste piles,
leaching areas, and tailings ponds. It also requires activities common to all
of the alternative management strategies:
• Permitting;
• Surface water run-on and runoff diversion/collectionditches (mine waste only);
5-4

* Ground-water monitoring wells and testing;
* Leachate collection ditches; and
• Post-closure inspection, drainage maintenance, andground-water monitoring.
The Tailored Standard Scenario (Scenario 2) represents an intermediate
cost alternative. This scenario includes the five common activities listed
above. However, the waste management technique here is distinguished by
substitution of waste treatment processes where considered feasible--namely,
the removal of cyanide from gold and silver tailings and removal of sulfides
(pyrites) from copper mill tailings. The scenario assumes that all sites would
require interceptor wells because it assumes a 100 percent failure rate for
all waste sites, except for treated wastes at gold and copper sites (treatment
is the alternative to interceptor wells).
The Corrective Action Scenario (Scenario 3) also represents an
intermediate alternative with to regulatory standards that are less stringent
than those embodied in Scenario 1. The applicable activities are identical to
those listed under Scenario 2 (including the 100 percent failure assumption),
with the exception that cyanide is not removed from gold and silver tailings,
and sulfides are not removed from copper mill tailings.
The Basic Maintenance and Monitoring Scenario (Scenario 4) includes only
the five activities common to the other scenarios. By design, this represents
a least-cost scenario consistent with providing a measure of protection
against surface water contamination and a first warning of any offsite
movement of contaminated leachate. It can also be regarded as the first stage
of a corrective action strategy.
Combining the four regulatory standard alternatives with the two
alternative sets of potential hazard criteria yields eight possible levels of
5-5

cost. Table 5-1 summarizes the definitions of costing scenarios in terms of
their alphanumeric designations: the numbers 1 through 4 represent the
alternative regulatory standards, and the letters A and B represent the
applicable potential hazard criteria.
5.1.3 Estimating Incremental Costs at Specific Sites
EPA identified the cost elements required for each scenario. Cost elements
are the individual capital requirements, and individual operation and
maintenance requirements. EPA also developed engineering cost functions for
each cost element for performing the activities that the management standards
require. EPA then created a data base for 47 mining facilities that
incorporated the information necessary to calculate costs from the engineering
cost functions. This included identifying the current waste management
practice (baseline practice) at each of the 47 sites. This information was
necessary to develop incremental costs that reflect the costs of practices
required under each of the four regulatory standards above and beyond the
baseline practice. In addition, the data base incorporated information
relative to site-specific geography, product production, total waste
quantities, waste quantities that would meet the hazardous waste criteria,
type of industry, and type of waste operations. Finally, EPA computed the
incremental cost for each scenario at each site by applying the data base
information to the engineering cost functions.
5.1.3.1 Cost Elements
As discussed previously, imposing various degrees of regulation requires a
different mix of outlays for capital, operation, and maintenance. The mix of
cost elements varies by the stringency of the regulatory standard. For
convenience, Table 5-2 summarizes the cost elements included in each of the
four regulatory standard scenarios. A discussion of each element follows.
5-6

Table 5-1 Definition of Costing Scenario
Variations by type ofVariations by specified hazards regulatory approach
1. Full Subtitle C Regulations
"A" SCENARIOS: Subtitle C Definitions: 2. Tailored Standards (varying by type of hazard)
• EP Toxicity Characteristic• Corrosivity Characteristic• Cyanide Gold-Mine Tailing. Liquid Waste 3. Corrective Action
100% failure bracket
"B"SCENARIOS: Subtitle C Above, Plus:
• Cyanide Toxicity Characteristic 4. Basic Maintenance and• High Acid Generation Potential Monitoring Characteristic Zero failure bracket• Copper Dump Leach Listing
5-7

Table 5-2 Summary of Cost Elements Included for Each Scenario
Regulatory scenario
Cost element 1 2 3 4
1. Permitting X X X X2. Leachate system X X X X3. Monitoring system X X X X4. Run-on/runoff system X X X X
5. Post-closure maintenance X X X X and operation
6. Site security X
7. Liners (new waste only) X
8. Closure cap X
9. Tailings treatment X (for copper and gold)
10. Corrective action via interceptor wells Xa Xb X
Note:Explanations as to variations between and within scenarios arecontained in the text.
a Only for existing accumulated waste sites (that were closed at time of RCRAimplementation).
b Exceptions: gold and copper tailings (subject to treatment instead).
5-8

Permitting. Mining operations with hazardous wastes would require RCRA
permits. Permits would be based on geological and engineering studies
describing the plan for managing wastes and containing or treating
contamination. Incremental costs in this study vary among states with more
advanced permitting requirements and those with less.
Site Security. RCRA regulations require that security be provided to
prevent the general public and livestock from coming into contact with
hazardous waste. For this study, EPA assumed that operators of facilities
would install and maintain cyclone fences around all hazardous waste areas
during their active lifetime and a 30-year post-closure period.
Caps and Liners. RCRA Subtitle C rules require caps when disposal sites
are closed and that new waste landfills and impoundments be lined. The cap
assumed for this study consists of vegetation, topsoil, clay or sand,
polyethylene cover, and clay. We assumed that liners were composed of a
combination of clay and synthetic liner materials.
Monitoring Wells. RCRA rules require ground-water monitoring of hazardous
waste disposal sites. The study assumes that wells will be located around the
general perimeter of each waste disposal operation (500 feet between each
well), and that four replicate samples will be taken and analyzed twice a year
for appropriate contaminants.
Run-On and Runoff Systems. Regulations provide that precipitation be
directed around hazardous waste piles to avoid leaching of contaminants.
Runoff from surfaces of piles must also be controlled. The costs here reflect
primarily ditching and flow control systems.
Leachate Collection Systems. RCRA rules require a system to collect and
treat contaminated seepage from hazardous waste piles. A full system includes:
(1) ditches or trenches on the downgradient sides of the waste pile;
5-9

(2) an intermediate liquid storage system; and (3) a chemical treatment plant.
Corrective Action via Interceptor Wells. At some sites, contamination
migrates into ground water, forming a plume that can migrate from the site.
When this happens, RCRA Subtitle C rules require corrective action. For this
study, EPA assumed that interceptor wells would be installed in the plume, or
at the downgradient edge of the plume, to pump the contaminated water to the
surface. EPA assumed that all contaminated water would be sent to a treatment
plant. In Scenario A, interceptor wells are installed at closure only for
existing waste.
Tailings Treatment. This applies only to Scenario 2 where treatment of new
waste is employed when feasible rather than interceptor wells. Specifically,
EPA assumes that future gold and copper ore tailings would be treated to
separate out pyrite concentrates for disposal as a hazardous waste, using a
flotation circuit, and that a treatment plant would be installed to destroy
cyanide in gold beneficiation operations.
Closure. When the useful life of a waste pile or tailings pond is over,
the study assumed the site would be capped with impervious cover material. The
design and cost of the cap depends on whether the waste site is from past
operations or future operations.
Post-Closure. Operation and maintenance (O&M) costs are assumed to be
incurred for 30 years after closure. The annual O&M costs would consist of
several elements: (1) maintenance of the cap and fencing; (2) inspection; (3)
detection or compliance monitoring; (4) maintenance of the run-on and runoff
systems; (5) operation of the leachate collection; and (6) operation of the
interceptor well/treatment system.
Financial Assurance. RCRA Subtitle C rules require firms to demonstrate that
they can meet closure and post-closure costs. They may do so by posting
5-10

surety bonds, by purchasing a letter of credit, by establishing a trust fund,
by purchasing an insurance policy, or by passing a financial test.
5.1.3.2 Cost Functions
Engineering cost functions were developed for each of the waste management
practice cost elements listed in Table 5-2. The functions generally take the
form: C = aVb, where C = cost, a = a constant, V: the volume of waste, and
b = the elasticity of cost with respect to volume (which shows how cost
changes as a result of small volume changes). Many of the functions use the
number of acres or perimeter distance as the independent variable rather than
waste volume. Permitting costs are based on type and size of mine, as well as
current State agency permitting requirements.
5.1.3.3 Sample Facility Data Sources
The Agency's cost study utilized and built upon a mine facility data base
providing site-specific data for 47 metal mining properties, with information on
geophysical characteristics, mine/mill technologies and efficiencies, historical
production levels, and other salient factors.2 Additional site-specific data were
assembled on the type and size of current waste management areas and practices,
as well as life expectancy of ore bodies and current production cost factors. The
data were supplemented by survey information on current State mining waste
regulations. These data provide the primary inputs for estimating historical and
current mine, tailings, and leach pile waste generation rates as well as
simulating baseline management practices at each of the 47 properties.
EPA waste characteristics sampling data were available for one or more waste
streams at 41 of the 47 facilities; and the combination of these two data sources
then formed the basis for calculating potentially hazardous waste quantities and
incremental hazardous waste management compliance costs for
5-11

each database facility under the various hypothetical regulatory scenarios,
using the cost functions previously described.
Appendix B provides a fuller discussion of the facilities data base, the
methods used in estimating waste generation rates, and the techniques employed
to extrapolate waste quantities and compliance costs from the sample sites to
the segment totals for the mining segments in the study.
5.1.4 Total Number of Facilities and Waste Quantities Regulated
EPA aggregated the site-specific regulated waste quantities, capital
costs, and O&M costs for each facility in the data base by industry, by
scenario, and by waste operation. The resulting industry totals for numbers of
facilities affected and regulated waste quantities are summarized for the
specific segments in Table 5-3.
As indicated in Table 5-3, 99 out of 191 metal mining facilities (52
percent) and 67 million metric tons out of a total annual generation of 725
million metric tons (9 percent) of metal mining waste would be subject to
potential Subtitle C regulation under Scenario A. However, except for gold,
less than half of the facilities in any given segment would be affected.
Furthermore, not all of a given affected facility's waste sources would
necessarily be subject to regulation. For example, copper mine and tailings
wastes were not found by our sampling to be potentially hazardous under our
Scenario A definition, but some copper dump leach piles are potentially
hazardous in Scenario A. This accounts in part for the relatively low
percentage of waste meeting the hazard criteria, in contrast to the higher
percentage of facilities. In addition, the (listed) cyanide process tends to
dominate the gold milling/processing operation, but a relatively smaller
fraction of total waste.
5-12

Table 5-3 Numbers of Potential RCRA Mine Facilities and Quantities ofHazardous Waste in EPA Cost Study,Scenario A and B, by Mining Sector
Number of facilities Annual waste generation (millions of metric tons/year)
Regulated/ Percent Regulated/ Percent total regulated total regulated
Scenario A
Copper 6/22 27 50/632 7.9Gold 75/100 75 13/65 19.6Silver 12/50 24 1/17 5.7Lead 3/7 43 3/9 33.3Zinc 3/12 25 0.3/2.4 11.5
Totals 99/191 52 67/725 9.3
Scenario B
Copper 21/22 96 276/632 43.7Gold 100/100 100 24/65 36.6Silver 25/50 50 4/17 22.3Lead 3/7 43 3/9 33.3Zinc 3/12 25 0.3/2.4 11.5
Totals 152/191 80 307/725 42.3
Source: Estimated by Charles River Associates 1985a.
5-13

In Scenario B, the fraction of firms under regulation increases to about
80 percent overall, and the fraction of regulated waste increases to about 40
percent. Almost all copper sites (although still less than half of the total
waste volume) would face regulation under this scenario, as well as all gold
mines (due to cyanide heap leach and metal recovery). For silver, lead, and
zinc, the fraction of facilities affected ranges from 25 to 50 percent and the
fractions of waste regulated from 11 to 33 percent under Scenario B.
This methodology relies on the use of real-world sites with site-specific
information concerning prevailing regulations and current waste management
practices, geography, and mine operations. It requires a high level of detail
in building up the cost estimates for each EPA data base site. The results
presented below are based on the application of this methodology to a large
sample (47) of real-world sites and the extension of those results to the
remaining sites.
5.2 POTENTIAL COSTS OF RCRA SUBTITLE C WASTE MANAGEMENT
This section discusses potential costs for the metal mining industry in
the aggregate, for individual segments, and for individual mine facilities if
certain wastes were managed as hazardous wastes under various regulatory
scenarios. The discussion also provides some insights as to the relationship
of compliance costs to mine production costs.
5.2.1 Potential Total Cost for the Metal Mining Industry
EPA's cost analysis leads to three principal findings with respect to
total potential cost. The first is that the waste management costs of RCRA
could be quite substantial under the types of regulatory scenarios that this
report considers, as Table 5-4 illustrates. In annualized cost terms, costs
for the five metal mining segments would be measurable in the millions of
5-14

Table 5-4 Potential Total Cost For Metal Mining Industrya
Under Various RCRA Regulatory Scenarios
Regulatory Lifetimec DPVLd Annualescenariosb ($ millions) ($ millions) ($ million)
1A $2,421 $1,279 $1852A 937 305 473A 1,036 332 464A 128 60 7
1B 9,985 5,746 8542B 3,577 1,139 2103B 2,809 800 1184B 330 137 17
a Industry segments include: copper, lead, zinc, gold, and silver.
b See Subsection 5.1.1 and Table 5-1.
c Lifetime cost (1985 dollars), not discounted, including: closure and 30years post-closure costs for existing wastes; opening and managing a newwaste management facility for 15-year future operations; closure at endof 15th year; post-closure management for 30 years.
d Discounted Present Value of Lifetime Costs, as listed in note (c). Realdiscount rate of 9.0 percent.
e Lifetime Costs Annualized over 15-year future mine production periodusing a real discount rate of 9.0 percent.
Source: Estimated by Charles River Associates 1985a.
5-15
dollars per year up to several hundred million dollars per year over a 15-year
mine production cycle. Lifetime costs (undiscounted) for operating the mines
in five metals segments would be measurable in the hundreds of million
dollars, possibly up to several billion dollars over the next 15 years of mine
production.
The second major conclusion is that costs vary substantially among the
RCRA management scenarios chosen for analysis. Generally speaking, the highest
cost scenarios (1A and 1B) are several times more costly than the intermediate
cost counterparts (2A and 3A, 2B and 3B). Similarly, the minimum maintenance
and monitoring scenarios (4A and 4B) cost only a fraction as much as the
intermediate cases.
The third finding is that the additional waste management cost incurred by
adding additional B-Scenario wastes is also very substantial: Scenario B is
typically two to four times more costly than Scenario A for given regulatory
standards or strategies.
The figures presented in Table 5-4 assume that the potentially hazardous
portions of both existing waste (accumulated at these sites from past
operations} as well as new (future) waste generated at these sites would be
managed as RCRA Subtitle C hazardous waste. If only new wastes generated in
the future were to be regulated, the costs would be 40 to 70 percent of those
shown in Table 5-4, depending on the scenario considered.
5.2.2 Potential Costs for Individual Segments
Potential total costs for the five individual metal mining segments vary
widely among the segments analyzed and across alternative regulatory
scenarios, as Table 5-5 illustrates. By far, the largest aggregate lifetime
cost for each alternative falls on copper mining, because of the extremely
large quantities of waste and the relatively high proportion of total waste
5-16

Table 5-5 Potential Total Costs For Selected Metal Mining SectorsUnder Various RCRA Regulatory Scenarios
Subtitle C Tailored standards
Sector 1A 1B 2A 2B
Lifetime costs ($ million)a
Copper $1,400 $8,300 $400 $2,400Gold 670 1,200 250 770Silver 46 180 60 180Lead 260 260 180 180Zinc 45 45 47 47
Totals $2,421 $9,985 $937 $3,577
Discounted present value ($ million)b
Copper $ 710 $5,000 $ 96 $ 770Gold 370 490 110 230Silver 28 90 23 63Lead 140 140 68 58Zinc 26 26 18 18
Totals $1,279 $5,746 $305 $1,139
Annualized costs ($ million/Year)c
Copper $ 110 $ 740 $ 14 $ 1 50Gold 48 75 17 37Silver 4 16 4 11Lead 19 19 9 9Zinc 4 4 3 3
Totals $ 185 $ 854 $ 47 $ 210
a Lifetime cost (1985 dollars), not discounted, including: closure and30 years post-closure costs for existing wastes; opening and managing anew waste management facility for 15-year future operations; closure atend of 15th year; post-closure management for 30 years.
b Discounted Present Value of Lifetime Costs, as listed in note (a). Realdiscount rate of 9.0%.
c Lifetime costs annualized over 15-year future mine production period, usinga real discount rate of 9.0%.
Source: Estimated by Charles River Associates 1985a.
5-17

that is of potential concern, particularly in the dump leaching and milling
operations. The gold segment bears the second highest lifetime total cost
since most gold production uses cyanide processes either in leaching or
milling operations.
5.2.3 Potential Costs for Individual Mine Facilities
As noted previously, the number of mine facilities that might be subjected
to hazardous waste regulations is highly uncertain, depending on various
possible definitions of hazardous waste constituents, variations in natural
mineral deposits, and differences in ore processing methods. EPA waste
sampling suggests wide variations among different segments as to percentage of
mines with potentially hazardous waste, as well as wide variations within
individual segments regarding possible quantities and characteristics of such
waste materials. This section examines potential cost implications for
individual facilities among and within the five segments analyzed.
Table 5-6 provides a comparative summary of individual mine facility cost
estimates for two illustrative scenarios--Scenario 1B (the highest cost
scenario estimated) and Scenario 4B (the lowest cost scenario for the B-waste
group). Potential costs are presented on both a lifetime and an annualized
basis. For the high-cost scenario (1B) , average lifetime costs for affected
facilities would range from $7 million for silver mines up to almost $400
million for individual copper mines. Annualized and discounted over a 15-year
mine production cycle, these would translate into new annual average cost
burdens for individual mines, ranging from $600,000 per year (silver mines) up
to $35 million per year (copper mines) per facility.
The facilities with the highest costs--those with the greatest volumes of
potentially hazardous wastes or especially difficult management conditions--
would experience additional management costs that would be significantly
5-18

Table 5-6 Potential Incremental Compliance Costs For Individual RCRA MineFacilities
For High- and Low-Cost Scenarios
Scenario 1B Scenario 4B
Maximum MaximumAverage cost Average costfacility facilitya facility facilitya
............. Lifetime costs ($ millions)b ................
Copper 390 1,300 10. 0 33.0Gold 12 170 0.6 16.0Silver 7 120 0.5 10.0Lead 85 170 11.0 17.0Zinc 15 27 3.0 6.0
Discounted present value ($ million/year)c
Copper 240 1,100 3.8 16Gold 5 63 0.3 8Silver 4 50 0.3 5Lead 46 110 4.4 7Zinc 9 16 1.1 3
Annualized costs ($ million/year)d
Copper 35.1 190 0.50 2.4Gold 0.8 9 0.04 0.9Silver 0.6 10 0.04 0.6Lead 6.5 14 0.57 1.2Zinc 1.4 4 0.20 0.5
a Maximum means the maximum cost for a facility in the EPA data base.
b Lifetime cost (1985 dollars), not discounted, including: closure and30 years post-closure costs for existing wastes; opening and managing anew waste management facility for 15-year future operations; closure atend of 15th year; post-closure management for 30 years.
c Discounted present value of lifetime costs, as listed in note (a). Realdiscount rate of 9.0%.
d Lifetime costs annualized over 15-year future mine production period usinga real discount rate of 9.0%.
Source: Estimated by Charles River Associates 1985a.
5-19

higher than the average. For example, in the zinc and copper segments, a high-
cost facility would face costs about three times higher than the average. For
silver and gold, the costs of meeting the Scenario 1B RCRA regulation would be
on the order of 15 times the industry average.
Differences between the two scenarios are equally striking. Facilities
employing RCRA cap and liner controls (Scenario 1B) would have 5 to 40 times
more RCRA-related waste management costs over their lifetime than if they
employed only the maintenance and monitoring functions estimated for Scenario
4B.
5.2.4 Potential RCRA Costs Relative to Mine Production Costs
Comparing potential facility compliance costs to total mine production
costs provides insight on the possible effect of RCRA Subtitle C regulations
on individual mine economics. Table 5-7 shows potential incremental compliance
costs per unit of mine product (typically, concentrated ore) and potential
incremental RCRA costs as a percentage of the segment's average current total
direct production cost. Potential cost impacts of hazardous waste regulation
for an average mine for the low-cost Scenario 4B range from about 1 to 5
percent of total production costs for the five metal segments. By contrast,
for the high-cost Scenario 1B, potential incremental RCRA regulation costs
would range from about 20 to 120 percent of current total direct product
costs, on the average, for individual facilities in the five segments.
The high-cost mines again would experience impacts significantly greater
than the average. In Scenario 1B, EPA estimates that the high-cost facilities
in all five segments would face potential RCRA compliance costs in excess of
5-20

Table 5-7 Potential Incremental RCRA Compliance Costs Relative to FacilityProduction Costs
Cost per unit of producta Percent of direct product costa
(Dollars per metric ton)
Average for Average foraffected High-cost affected High-cost
facilities facility facilities facility
. . . . . . . . Low-cost scenario (4B) ....
Copper $ 17.6 $ 44.1 1.7% 4%Gold 5,625.5 29,466.9 1.1% 6%Silver 267.9 1,071.5 2.5% 10%Lead 5.4 15.4 1.9% 5%Zinc 28.7 57.3 5.2% 10%
. . . . . . . High-cost scenario (1B) -
Copper $ 1,212.5 $ 3,417.1 120% 340%Gold 117,867.6 267,881.0 23% 54%Silver 4,286.1 16,608.6 40% 160%Lead 60.6 253.5 21% 88%Zinc 209.4 31 9.7 39% 58%
a Direct costs of mine product are based on sector averages of current cashoperating costs for facilities, as estimated byCharles River Associates for EPA. Costs do not include facility-levelcapital investment, depreciation, interest expense, or corporateoverhead.
Source: Estimated by Charles River Associates, 1985a.
5-21

50 percent of their total direct production costs. Even under the low-cost
Scenario 4B, estimates for the most-affected facilities in each of the five
segments range between 5 and 10 percent of total mine production costs.
5-22

SECTION 5 FOOTNOTES
1Charles River Associates 1985a.
2This data base was originally developed by Charles River Associates.
5-23

SECTION 6
CONCLUSIONS AND RECOMMENDATIONS
6.1 SCOPE
As detailed in Section 1, this report covers the waste generated from the
extraction and beneficiation (concentration) of metallic ores, phosphates, and
asbestos and the mining of uranium. Although these selected mining segments
include only about five percent of the 13,000 active mining operations in the
U.S. noncoal mining industry, the facilities covered in this report generate
over 90 percent of the total waste material produced by all noncoal mines.
6.2 SUMMARY OF CONCLUSIONS
The Agency's conclusions from the studies presented in this report are
summarized under major groupings paralleling the organization of the report,
namely: (1) Structure and Location of Mines, (2) Waste Quantities, (3)
Potential Hazard Characteristics, (4) Evidence of Environmental Transport, (5)
Evidence of Damage, (6) Management Practices, and (7) Potential Costs of
Regulation.
6.2.1 Structure and Location of Mines
Because of the wide availability of detailed and comprehensive information
published by the U.S. Bureau of Mines and supplemented by data from industry
trade associations, EPA's conclusions on the numbers, sizes, and locations of
U.S. mines are based solely on these standard sources.
1. There is a relatively small number of mines in the segments under
consideration in this study. Fewer than 500 mine sites (1985)
6-1
extract and concentrate metals, phosphates, and asbestos in the U.S.
(excluding gold placer mines). Of these, about 290 (62 percent) are accounted
for by the precious metals (gold, silver) and uranium segments alone.
2. There is a great diversity in the size of mining facilities. This is
true whether one measures size in terms of property area, product
tonnage, total volume of material handled, or waste generated. The
largest mine sites (e.g., in the iron ore, copper, and phosphate
segments) are measured in terms of square kilometers, and each one
handles more than 10 million tons of material per year. By contrast,
about 25 percent of the mines included in this study handle less than
1,000 tons per year.
3. There is also great diversity in the unit value of product mined. In the
segments studied, this value varies from $20 per ton for crude phosphate
to over $10 million per ton for gold.
4. With few exceptions (notably in the precious metals) the trend has been
toward a reduction in the number of active mines in most segments and an
increase in the number of inactive mines, closed or abandoned mines.
5. Metals, phosphate, and asbestos mining are very heavily concentrated in
a few States and EPA Regions. Over 90 percent of the mine sites in the
industry segments are west of the Mississippi River, and over 60 percent
are concentrated in just 10 States with 20 or more mines each. Eight of
these 10 States are in the Rocky Mountain and Great Basin regions (EPA
Regions 6,8,9, and 10), where almost 65 percent of U.S. metal mines are
located.
6-2
6. These mines are generally located in areas of low population density.
They are often, although not always, located several kilometers from
population centers and the sources of public water supplies (reduced
human exposure impact).
6.2.2 Waste Quantities
The conclusions summarized in this section are derived primarily from EPA
studies. Waste quantity estimates are based largely on primary data from the
U.S. Bureau of Mines on ore concentration and productivity for individual mine
properties or producing regions, supplemented by EPA-sponsored engineering
studies and extrapolations. These studies and extrapolations are described in
detail in Section 4.1 and Appendix B to this report. Waste types and
quantities reported here include all mine overburden and waste rock (mine
waste), material subject to dump (copper) or heap (gold and silver) leach
operations, and tailings from beneficiation processes.
1.Annual aggregate waste quantities for these segments are large by any
standard. Mines in the metal, phosphate, and asbestos segments
produce about 1.0 to 1.3 billion metric tons per year of various
types of mining waste. By contrast, total municipal "post-consumer"
solid waste totals 150 million tons and total industrial hazardous
waste for all industries other than mining totals about 250 million
tons per year.
2. Total waste accumulated by all active, inactive, and abandoned
mines since 1910 is estimated at 50 billion metric tons.
3. Ratios of waste to product in mining vary considerably, but are
generally substantially higher than for any other industries. The
percentage of marketable ore obtained from mining operations
ranges from 60 percent of the material excavated at iron ore mines
to
6-3

30 percent at surface copper mines and 7 percent at surface uranium mines.
By contrast, 50 percent or more of all the harvested wood in the forest
products industry becomes marketed wood or paper products, and only a very
small percentage of crude oil remains as waste in the production of fuels
and petrochemicals.
4. Total waste quantities vary greatly among facilities in mining. As noted
earlier, 25 percent of the mines in this study are rated at less than
1,000 tons per year of total material handled (well within the waste
generation range of facilities in, say, the pulp and paper or
petrochemicals industries.) On the other hand, the larger facilities in
the copper, iron, and phosphate mining segments handle more than 10
million tons per year each. Any one of these larger individual
facilities will generate more total waste in the normal course of its
activities than all firms together in almost any other industry.
5. Aggregate waste in mining is concentrated in a few segments and a few
states. Seventy percent of the 1.3 billion tons of total mining waste
(1982) was generated in two segments, copper (39 percent) and phosphates
(31 percent). This suggests that almost 23 percent of all mining waste
is generated in Arizona (68 percent of copper production), and that
almost 23 percent of this waste is generated in Florida (74 percent of
U.S. phosphate production). An additional 14 percent of all mining waste
was contributed by iron mining (largely in Minnesota), and 6 percent by
uranium (Colorado, New Mexico, Utah, and Wyoming). All remaining nonfuel
mining segments together generated the remaining 10 percent of total
mining industry waste.
6-4

6.2.3 Potential Hazard Characteristics
Data on waste hazard characteristics are the result of extensive EPA
sampling and analysis studies, as described in Section 4, and are based on
samples from 86 extraction and beneficiation sites.
1. Of the 1.3 billion metric tons of waste produced each year, only
61 million metric tons (5 percent) of copper, gold, silver, lead, or
zinc wastes exhibited RCRA hazardous characteristics. These include
50 million metric tons of corrosive (pH less than 2.0) copper leach
dump waste and 11 million metric tons of gold, silver, lead, or zinc
overburden or tailings that were EP toxic (generally for lead). EP
toxicity test leachates from gold, silver, lead, zinc, uranium, and
other metal wastes had toxic metal concentrations between 20 and 100
times the levels set by the National Interim Primary Drinking Water
Standards; however, these were below the threshold of being a
hazardous waste.
2.Twenty-three million metric tons per year of gold and silver wastes
are potentially hazardous because they have been leached using a
cyanide solution. These cyanide wastes include those metal
recovery wastes previously listed as hazardous, as well as heap
leaching wastes, but do not include copper mill tailings or other
mill tailings with low (less than 10 mg/liter) concentrations of
cyanide from flotation circuits.
3. Copper leach dump material (182 MMT) and copper mill tailings
(95 MMT) may be hazardous. In addition to the 50 MMT/year of copper leach
dump waste estimated to be corrosive, the remaining 132 MMT of this waste
may also pose potential hazards because of its low pH and relatively high
concentrations of toxic metals. Copper leach dump
6-5

wastes are potentially hazardous even when the pH level of their
leachate is not below 2.0, because their leachate is still quite acidic
and contains toxic metals. However, toxic constituents in and hazardous
characteristics of these wastes do not exceed EPA's established
criteria. Similarly, copper, gold, silver, and lead mill tailings
containing high (greater than 1 percent) concentrations of pyritic
material and low (less than 1 percent) concentrations of carbonate
buffers have a high potential for forming and releasing sulfuric acid.
4. Naturally occurring radioactivity (radium-226) levels in excess of five
picocuries per gram (pCi/g) has been estimated for 443 million metric
tons/year of wastes from sites generating uranium mine waste and
phosphate wastes. Use of an alternative radioactivity measure of 20
pCi/g yields an aggregate estimate of about 93 million metric tons/year
of radioactive waste, most of which is uranium mine waste.
5. Four asbestos mines generate about 5 million metric tons per year of
waste containing high (greater than 1 percent) asbestos fiber content.
Only asbestos mines were tested in the current study for asbestos
fibers.
6. EPA's solid waste sampling thus far has not found any hazardous
characteristic in waste from the iron ore, molybdenum, or certain minor
metals segments. The Agency tested wastes from virtually all metal
mining segments but did not test wastes from all mineral mining
segments, on the assumption that these wastes are unlikely to be
hazardous.
7. Based on the above, the Agency concludes that as many as 80 percent of
the metal mining facilities and perhaps 56 percent of the waste
6-6

generated could be considered potentially hazardous to human health
or the environment under some circumstances. Generally, a given mine
site will exhibit only one primary problem: EP toxicity, cyanide
contamination, corrosivity/acidity, radioactivity, or asbestos,
according to the Agency's sampling results.
6.2.4 Evidence of Environmental Transport of Potentially Hazardous
Constituents
The potentially hazardous constituents and characteristics of various
mining wastes can be transported from the location of storage or disposal to
possible receptors by various combinations of surface water flow, seepage into
ground water and ground-water flow, and wind currents. The Agency's studies in
this area focused primarily on efforts to evaluate environmental transfer to
and through surface and ground water. Study methods included both a literature
search and a limited field monitoring study at eight selected mine sites (one
only for surface water) over a 6- to 9-month monitoring period.
1. Ground-water monitoring is difficult, expensive, and has seldom
been conducted at mine sites on a comprehensive basis. Because of
complex geologic strata (presence of an ore body) and the
extensive size of many mine properties, proper ground-water
monitoring is technically difficult and costly. Historical
practice in the mining industry has not required such monitoring.
As a result, there is very little available information in the
literature, and almost none on a complete or comprehensive basis.
Most mines have no historical or contemporary ground-water
monitoring information.
2. EPA's limited field monitoring shows environmental transfer of mine
waste constituents to ground water, but not necessarily transfer of
the EP toxic constituents of concern. Mine waste constituents--both
indicator sulfates, chlorides, and some elements that could be
6-7
considered environmentally harmful--were shown to migrate from waste
management areas to local aquifers. Short-term monitoring detected
seepage from tailings impoundments (a copper, lead, phosphate sand,
and two gold impoundments), a copper leach dump, and a uranium mine
water pond. However, the EP toxic constituents of concern did not
appear to have migrated at these sites during the short period of
this study.
3. EPA's limited field monitoring generally did not show contamination
of surface waters, but this may be the result of local circumstances
of management, climate, and parameters monitored. Surface water
contamination would not be expected downstream from an intact
tailings impoundment. However, abnormally heavy precipitation could
lead to releases or bypasses to protect the integrity of the
impoundment dam.
4. Other scattered monitoring study data suggest mixed or
inconclusive results regarding ground water and surface water
contamination by constituents of concern. In Arizona, copper mine
runoff has degraded surface water, and uncontained leachate from
copper leach dump operations has degraded ground water by lowering
pH and increasing concentrations of sulfates, copper, and total
dissolved solids. Abandoned gold recovery operations that did not
treat wastes before release can be the source of persistent
cyanide contamination. Generally, contaminant plumes from tailings
impoundments (other than uranium mill tailings impoundments) have
not been studied.
6.2.5 Evidence of Damage
The Agency's conclusions on observed damage to the environment and health
are based on an extensive survey of State government natural resource and
6-8

health agency files through 1984 to obtain evidence of environmental
incidents, followed by review and evaluation of the evidence obtained. All 50
States were surveyed by telephone, and 10 were visited. The mining sites
reported on were not visited to observe or verify data obtained in the survey.
Several hundred initially reported incidents were evaluated and eventually
narrowed down to 20 verifiable cases of damages having substantial
documentation. The damage survey was supplemented by reviews of published
reports and National Priorities List (Superfund) data.
1. Damage cases are about equally distributed between catastrophic
(sudden releases, spills) and chronic (seepage, periodic runoff)
incidents.
2. Documented damage typically involves physical or chemical
degradation of surface water ecosystems, often including fish
kills or reduction in biota, but seldom involves direct effects on
human health.
3. A number of incidents of damage caused by mining wastes at
currently active sites in the phosphate, gold, silver, copper, and
uranium industries have been well documented in several States,
including Arizona, Colorado, Florida, Missouri, Montana, and New
Mexico. Similar results have been documented at inactive sites,
but abandoned and Superfund sites may have additional problems.
4. Damage to surface waters has often been reducible or reversible by
use of modified waste management practices or other physical
controls.
6.2.6 Waste Management Practices
The Agency's conclusions on waste management practices are based on
literature reviews, site visits in conjunction with waste sampling,
engineering design studies, and consultation with State regulatory agencies
and mine company engineers.
6-9

1. Site selection, including both the mine property itself and the specific
location of waste storage, treatment, and disposal activities, is
perhaps the single most important aspect of environmental protection in
the mining industry. The selection of the mine property is based
primarily on the ability of the operation to produce a commodity (e.g.,
copper, gold, etc. ) at a competitive price and a reasonable profit. The
cost of transporting waste via pipeline, conveyor, or truck to the
disposal site is an important variable in determining the profitability
of the mine, because of the large volume of material moved at most
mines.
2. The potential for waste utilization as a solution, or even as a
significant contributor, to waste management in most mining segments is
extremely limited.
3. There are few major innovations under development that would lead to
major changes in mine production processes or waste management
practices.
4. The difference between "best practice" and typical practice is often
significant among mines in many major segments. These differences are
related to both voluntary management practices and variations in State
regulations.
5. Within known technological options, there appear to be major
opportunities for process modifications, some source separation of
wastes, treatment of acids and cyanides, and, possibly, controlled
release of certain effluents that could significantly reduce damage
potentials in certain contexts.
6. Many waste management practices being applied to hazardous waste in
6-10

other industries--most notably caps and liners--have not been
attempted for mining wastes.
6.2.7 Potential Costs of Regulation
The Agency conducted engineering cost analyses, using several different
hypothetical regulatory scenarios, for a sample of 47 actual sites, and then
extrapolated these costs to the universe of facilities in the copper, lead,
zinc, silver, and gold mining segments. EPA's approach, methods, and
assumptions are discussed briefly in Section 5 and in Appendix B.
1. For five metal mining segments, total annualized costs could be
substantial, but vary considerably across different hypothetical
regulatory scenarios. Annualized costs range from $7 million per
year (for a scenario that emphasizes primarily basic maintenance
and monitoring of RCRA hazardous wastes) to over $800 million per
year (for a highly unlikely scenario that approximates a full
Subtitle C regulatory approach emphasizing cap and liner
containment for an expanded range of potentially hazardous
wastes).
2. Almost 60 percent of total projected annualized costs at operating
facilities can be attributed to the management of waste
accumulated from past production.
3. Costs would vary greatly among segments. Some segments may not be
affected at all (iron, molybdenum), because their waste streams
apparently do not contain hazardous constituents. Total lifetime
costs for affected segments could range from $45 million for zinc
up to $8.3 billion for copper (for the highest cost scenario).
4. Costs would vary greatly among mines within segments. Incremental
compliance costs, as a percentage of direct product cost, could
vary as much as 25:1 among facilities within a given segment.
Factors
6-11

affecting these differences include geography, ore grade, past
waste accumulation, percentage of waste with hazardous
characteristics, and process and waste management practice
efficiencies.
6.3 RECOMMENDATIONS
Section 8002(f) of RCRA requires EPA to conduct a study of the adverse
effects of mining waste and to provide "recommendations for Federal ...actions
concerning such effects." Based on our findings from this study, we make
several preliminary recommendations for those wastes and industry segments
included in the scope of the study. The recommendations are subject to change
based on continuing consultations with the Department of the Interior (DOI)
and new information submitted through the public hearings and comments on this
report. Pursuant to the process outlined in RCRA 3001(b)(3)(C), we will
announce our specific regulatory determination within six months after
submitting this report to Congress.
First, EPA is concerned with those wastes that have the hazardous
characteristics of corrosivity or EP toxicity under current RCRA regulations.
EPA intends to investigate those waste streams. During the course of this
investigation EPA will assess more rigorously the need for and nature of
regulatory controls. This will require further evaluation of the human health
and environmental exposures mining wastes could present. EPA will assess the
risks posed by various types of mining waste sites and alternative control
options. The Agency will perform additional waste sampling and analysis,
additional ground-water or surface water monitoring analysis, and additional
analysis of the feasibility and cost-effectiveness of various control
technologies.
6-12
If the Agency determines through the public comments, consultation with
DOI and other interested parties, and its own analysis, that a regulatory
strategy is necessary, a broad range of management control options consistent
with protecting human health and the environment will be considered and
evaluated. Moreover, in accordance with Section 3004(x), EPA will take into
account the "special characteristics of such waste, the practical difficulties
associated with implementation of such requirements, and site-specific
characteristics...," and will comply with the requirements of Executive Orders
12291 and 12498 and the Regulatory Flexibility Act.
Second, EPA will continue gathering information on those waste streams
that our study indicates may meet EPA's criteria for listing--dump leach
waste, because of its high metal concentrations and low pH, and wastes
containing cyanides. Although these waste streams are potential candidates for
listing as hazardous wastes, we need to gather additional information similar
to the information gathered for the rulemaking for corrosive and EP toxic
wastes. When we have gathered sufficient information, we will announce our
decision as to whether to initiate a formal rulemaking. If the Agency finds it
necessary to list any of these wastes, we will also develop appropriate
management standards in the same manner as those for corrosive and EP toxic
wastes.
Finally, EPA will continue to study radioactive waste and waste with the
potential to form sulfuric acid. The Agency is concerned that radioactive
wastes and wastes with the potential for forming acid may pose a threat to
human health and the environment, but we do not have enough information to be
able to conclude that they do. We will continue to gather information to
determine whether these wastes should be regulated. If EPA finds that it is
necessary to regulate these wastes, the Agency will develop the appropriate
measures of hazard and the appropriate waste management standards.
6-13

SECTION 7
SELECTED BIBLIOGRAPHY
Alper, Joseph. 1984. Bioengineers are off to the mines in high technology.High Technology (April ):32-35.
American Mining Congress. 1982. Reclamation Plan for the Jackpile-PaguateUranium Mine. New Mexico: Anaconda Minerals Company Grants.
ASCE. 1977. Waste clay dewatering and disposal, in Bromwell, L.G., and Oxford,T.P.: Proceedings of the Conference on Geotechnical Practice forDisposal of Solid Waste Materials, June 1977. American Society of CivilEngineers, pp 541-58.
Bates, Robert L., and Jackson, Julia A. (eds.). 1984. Dictionary of GeologicalTerms, Third Edition. Prepared under the direction of the AmericanGeological Institute. Garden City, NY: Anchor Press/Doubleday.
Bell, Alan V. 1976. Waste controls at base metal mines. Environmental Scienceand Technology 10(2): 130-35.
BOM. 1985. Open File Report 185-84, Groundwater Monitoring in the TucsonCopper Mining District. Washington, DC: U.S. Department of the Interior,U.S. Bureau of Mines.
BOM. 1984. Minerals Yearbook. Washington, DC: U.S. Bureau of Mines, U.S.Department of the Interior.
BOM. 1983. Minerals Yearbook. Washington, DC: U. S. Department of theInterior, U.S. Bureau of Mines.
BOM. 1982. Minerals Yearbook. Washington, DC: U.S. Bureau of Mines, U.S.Department of the Interior.
BOM. 1981a. Minerals Yearbook. Washington, DC: U. S. Department of theInterior, U.S. Bureau of Mines.
BOM. 1981b. Mine Waste Disposal Technology. Proceedings: Bureau of MinesTechnology Transfer Workshop, Denver, Colorado, July 16, 1981.Information Circular 8857. Washington, DC: U.S. Department of theInterior, U.S. Bureau of Mines.
BOM. 1980a. Mineral Facts and Problems. Washington, DC: U.S. Department of theInterior, U.S. Bureau of Mines.
BOM. 1980b. Open File Report 94-80, Containment Pond Technology--State of theArt. Washington, DC: U.S. Department of the Interior, U.S. Bureau ofMines.
7-1

BOM. 1979. Minerals Yearbook. Washington, DC: U.S. Department of the Interior,U.S. Bureau of Mines.
BOM. 1975. Mineral Facts and Problems. Bulletin 667. Washington, DC: U.S.Department of the Interior, U.S. Bureau of Mines.
Bruynesteyn, A., and Hackl, R.P. 1982. Evaluation of acid production potential of mining waste materials. Minerals and the Environment4:5-12.
Carroll, Walter. 1983. Mine waste hazards. MESA--The Magazine of Mining Healthand Safety (Feb.- Mar.).
Central Arizona Association of Governments. 1983. National Prototype Copper Mining Management Plan. Prepared for the U.S. Bureau ofMines.
Chafer, Arthur B. 1974. Guidelines for the Design, Construction and Operationof Tailing Ponds and Dams. Denver, CO: Arthur B. Chafer and Associates.
Charles River Associates. 1985a. Estimated Costs to the U.S. Mining Industryfor Management of Hazardous Solid Wastes. Final Report. Prepared for theU.S. Environmental Protection Agency, Division of Solid WasteManagement.
Charles River Associates. 1985b. Estimates of Investment and Operating Costsfor the Destruction of Cyanides in Aqueous Waste Streams from MiningOperations. Boston, MA: Charles River Associates.
Charles River Associates. 1985c. Proprietary Data Base. Boston, MA: CharlesRiver Associates.
Charles River Associates. 1984. State Regulations and Management Practices inthe U.S. Mining Industry. Interim report prepared for the U.S.Environmental Protection Agency, Division of Solid Waste Management.
Collins, R.J., and Miller, R.H. 1977. Availability of Mining Wastes and theirPotential for Use as Highway Material--Executive Summary. Prepared forthe Federal Highway Administration, U.S. Department of Transportation.Report No. FHWA-RD-78-28. Washington, DC: Federal HighwayAdministration, U.S. Department of Transportation.
Cook, Philip M., Rubin, Ivan B., Maggiore, Carl J., and Nicholson, William J.1976. X-ray diffraction and electron beam analysis of asbestiformminerals in Lake Superior waters. Proceedings of the InternationalConference on Environmental Sensing and Assessment, Las Vegas, Sept. 14-19, 1975. Vol. 2, p. 34-1. EPA/600/J-76/014. New York: New YorkInstitute of Electrical and Electronics Engineers.
Coppa, L.V. 1984. Copper, Lead, Zinc, Gold, and Silver Waste DisposalActivities and Practices in the United States. Washington, DC: U.S.Department of the Interior, U.S. Bureau of Mines.
7-2

Curtin, Mary Ellen. 1983. Microbial mining and metal recovery. Bio/Technology(May) :229-35.
Dames & Moore. 1985. EPA/PEDCo Mine Waste Management Study: Overview. Report prepared for American Mining Congress. Golden, CO: Dames &Moore.
DOE. 1985. Technical Summary of the UMTRA Project Technology DevelopmentProgram (1980 to 1984). Albuquerque, NM: U.S. Department of Energy,UMTRA Project Office.
Edwards, R.E., N.A. Speed and D.E. Vernoert. 1983. Cleanup of chemicallycontaminated sites. Chemical Engineering 90(4):73-81.
ERCO/A Division of ENSECO. 1984. Mining Waste Study: Draft Data Report Preparedfor the Office of Solid Waste, U.S. Environmental Protection Agency underContract No. 68-01-6467. Cambridge, MA: ERCO/A Division of ENSECO.
Geological Society of America. 1971. Thermal Monitoring of Leakage ThroughDams, Geological Society of America Bulletins, Vol. 82. J.N. Berman etal, Washington, DC: Geological Society of America.
Goodson & Associates. 1982. Development of Systematic Waste Disposal Plans forMetal and Nonmetal Mines. Bureau of Mines Open File Report 183-82.Washington, DC: U.S. Department of the Interior, U.S. Bureau of Mines.
Gordon, A.J. 1984. Mining Impacts on Groundwater Quality in the State ofArizona U.S.A. Phoenix, AZ: Arizona Department of Health Services.
Greber, J.S., Patel, V.P., Pfetzing, E.A., Amick, R.S., and Toftner, R.O.1979. Assessment of Environmental Impact of the Mineral Mining Industry.EPA-600/2-79-107. Cincinnati, OH: U.S. Environmental Protection Agency,Office of Research and Development, Industrial Environmental ResearchLaboratory.
Harding-Lawson Associates. 1981. Development of Methods for ReclaimingAbandoned Tailings Ponds and Dams: Volume I. Bureau of Mines Open FileReport 40(1)-82. Report prepared for the Bureau of Mines under ContractNo. J0199117. Washington, DC: U.S. Department of the Interior, U.S.Bureau of Mines.
Harty, David M., and Terlecky, Michael P. 1982. Characterization of Wastewaterand Solid Wastes Generated in Selected Ore Mining Subcategories (Sb, Hg,Al, V, W, Ni, Ti). Report prepared for the Effluent Guidelines Division,U.S. Environmental Protection Agency, by Frontier Technical AssociatesInc. Contract No. 68-01-5163. Buffalo, NY: Frontier TechnicalAssociates, Inc.
Heming, T.A. 1985. Physiological and Toxic Effects of Cyanides to Fishes: AReview and Recent Advances. Conference proceedings: Cyanide and theEnvironment, Fort Collins, Colorado, Dec. 11-14, 1984, Fort Collins, CO:Colorado State University.
7-3

Jennett, J.C., and Foil, J.L. 1979. Trace metal transport from mining,milling, and smelting watersheds. Journal of the Water Pollution ControlFederation 51 (2):378-404.
Klohn, Earle J. 1981. Current tailings dam design and construction methods.Mining Engineering (July):798-808.
Lucia, P.C. 1982. Review of Experience with Flow Failures of Tailings, Damsand Waste Impoundments. Berkeley, California: University of California.
Martin, Harry W., and Mills, William R. Jr. 1976. Water Pollution Caused byInactive Ore and Mineral Mines. Report prepared for the IndustrialEnvironmental Research Laboratory, Office of Research and Development,U.S. Environmental Protection Agency, by Toups Corporation. Contract No.68-03-2212. Cincinnati, OH: Industrial Environmental ResearchLaboratory.
Missouri Geological Survey. 1979. Effects of Abandoned Lead and Zinc Mines andTailings Piles on Water Quality in the Joplin Area, Missouri. OzarkGateway Council of Governments, Joplin, Missouri. Report No. USGS-WRD-WRI-77/079; USGS/WRI-77-75.
Mountain States Research and Development, Inc. 1981. Inventory of WasteEnbankments of Surface and Underground Openings: Metal and NonmetalActive Mines. Bureau of Mines Open File Report 110-82. Report preparedfor the U.S. Bureau of Mines under Contract No. J0199054. Washington,DC: U.S. Department of the Interior, U.S. Bureau of Mines.
MSHA. 1984. Design Guidelines for Mine Waste Piles and Tailings Dams (draft). Washington, D.C.: Mine Safety and Health Administration.
MSHA. 1983. Report of Progress to Implement Federal Guidelines for Dam Safety.Washington, DC: Mine Safety and Health Administration.
New Mexico Energy and Mining Department. 1979. An Overview of the New MexicoUranium Industry. Santa Fe, NM: New Mexico Energy and Minerals Department.
Pacific Northwest Laboratories. 1983. Geochemical Modelling of Uranium MillTailings, A Case Study. Annual Geochemistry Review, Proceedings of aConference, Washington, DC.
PEDCo Environmental, Inc. 1984. Evaluation of Management Practices for MineSolid Waste Storage, Disposal, and Treatment. 3 Vols. Prepared for theIndustrial Environmental Research Laboratory, U.S. EnvironmentalProtection Agency. Contract No. 68-03-2900. Cincinnati, OH: PEDCoEnvironmental, Inc.
Pima Association of Governments. 1983. Ground-Water Monitoring in the TucsonCopper Mining District. Pima, AZ: Pima Association of Governments.
Platts, W.S., and Hopson, G. 1970. Aquatic Habitat Studies in the Angus CreekDrainage (Stauffer Mine Pollution), Caribou National Forest. ProgressReport No. 1. Boise, ID: U.S. Forest Service.
7-4

Portfors, Ernest A. 1981. Environmental aspects and surface water control, inWilson, D., (ed.): Design and Construction of Tailings Dam (ed. DavidWilson), July 1981, 99-117.
Ralston, D. Ro, Mohammad, 0., Robinette, M., and Edwards, T. 1977. Solutionsto Water Resources Problems Associated with Open Pit Mining in thePhosphate Area of Southeastern Idaho. Moscow, ID: College of Mines,University of Idaho.
Ryck, F.M., and Whitely, J.R. 1974. Pollution Abatement in the Lead-MiningDistrict of Missouri. Proceedings of the 29th Purdue Ind. WasteConference.
Schiller, Joseph E. 1983. Removal of Cyanide and Metals from MineralProcessing Waste Waters. Bureau of Mines Report of Investigations 88836.Washington, DC: U.S. Bureau of Mines, U.S. Department of the Interior.
Schlick, D.P., and Wahler, W.A. 1976. Mine refuse impoundments in the UnitedStates. Mining Enforcement and Safety Administration. MESA InformationalReport No. 1028. Washington, DC: U.S. Department of the Interior.
Schrader, Ed L., and Furbish, William J. 1978. An aqueous and sedimentalogicalmodel for heavy metal contamination of stream systems affected bysulfide mining in the Eastern United States. Bulletin of EnvironmentalContamination and Toxicology 20: 159-166.
SCS Engineers. 1984. Summary of Damage Cases from the Disposal of MiningWastes (draft). Prepared for the Office of Solid Waste, U.S.Environmental Protection Agency Contract No. 68-02-3179. Reston, VA: SCSEngineers.
SCS Engineers. 1985. Summary of Environmental Incidents from the Disposal ofMining Wastes. Prepared for the Office of Solid Waste, U.S. EnvironmentalProtection Agency. Contract No. 68-01-7053. Reston, VA: SCS Engineers.
Seitter, L.E., and Hunt, R.G. 1982. Industrial Resource Recovery Practices:Mining Industries (SIC Division B). Prepared for the Office of SolidWaste, U.S. Environmental Protection Agency by Franklin Associates, Ltd.Contract No. 68-01-6000. Prairie Village, KA. Franklin Associates, Ltd.
Shepherd, T.A. 1981. Geochemical retardation processes. Presented at ShortCourse on Contaminant Migration from Uranium Tailings Impoundments,Colorado State University, May 1981.
Shepherd, T.A., and Brown, S.E. 1984. A generic model of contaminant migrationfrom uranium tailings impoundments. Presented at Short Course onGeotechnical Aspects and Reclamation of Tailings Impoundments, theUniversity of Arizona, Tucson, AZ. January 13, 1984.
Soderberg, Roy L., and Busch, Richard A. 1977. Design Guide for Metal andNonmetal Tailings Disposal. Bureau of Mines Information Circular 8755.Washington, DC: U.S. Department of the Interior, U.S. Bureau of Mines.
7-5

TFI. 1984. Water Quality of Phosphate Mine Effluents in Florida, Garlanger,J.E. and Stansland, H.G. Proceedings of the Fertilizer InstituteEnvironmental Symposium, Oct. 1984, pp. 441-71.
Thrush, Paul W., (comp.). 1968. A Dictionary of Mining, Mineral, and RelatedTerms. Washington, DC: U.S. Department of the Interior. Compiled andedited with U.S. Bureau of Mines Staff.
Unites, Dennis F., Kebe, Jayne 0., and Hankins, John B. 1985. Review of theSCS Damage Case Study. TRC Project No. 2896-N11-00. East Hartford, CT:TRC Environmental Consultants, Inc.
U.S.D.A. Forest Service. 1979a. User Guide to Engineering, Mining andReclamation in the West. General Technical Report INT-70. Ogden, UT:U.S. Department of Agriculture, Forest Service.
U.S.D.A. Forest Service. 1979b. User Guide to Soils, Mining and Reclamation inthe West. General Technical Report INT-68. Ogden, UT. U.S. Department ofAgriculture, Forest Service, Intermountain Forest and Range ExperimentStation.
U.S. Department of Commerce. 1985. 1985 U.S. Industrial Outlook. Washington,DC: U.S. Department of Commerce.
U.S. Department of the Interior. 1980. Uranium Development in the San JuanBasin Region. San Juan Basin Regional Uranium Study. Washington, DC:U.S. Department of the Interior.
US EPA. 1977. Waste Disposal Effects on Ground Water. Washington, DC: U.S.Environmental Protection Agency, Office of Water Supply and the Office ofSolid Waste Management.
US EPA. 1976. Water Pollution Caused by Inactive Ore and Mineral Mines. US EPA-600/2-76-298. Washington, DC: U.S. Environmental Protection Agency.
US EPA. 1982a. Development Document for Final Effluent Limitations Guidelinesand New Source Performance Standards for the Ore Mining and DressingPoint Source Category. 440/1-82/061. Washington, DC: U.S. EnvironmentalProtection Agency.
US EPA. 1982b. Support Document for Final Rule on Friable Asbestos-ContainingMaterials in School Buildings--Health Effects and Magnitude of Exposure.Washington, DC: U.S. Environmental Protection Agency, Office ofPesticides and Toxic Substances.
US EPA. 1983a. Potential Health and Environmental Hazards of Uranium MineWastes. Washington, D.C.: U.S. Environmental Protection Agency, Officeof Radiation Programs and Eastern Environmental Radiation Facility.
US EPA. 1983b. Surface Impoundment Assessment National Report. Washington, DC:U.S. Environmental Protection Agency.
7-6

US EPA. 1984. Report to Congress: Nonpoint Source Pollution in the U.S.Washington, DC: U.S. Environmental Protection Agency, Office of WaterProgram Operations, Water Planning Division.
U.S. Geological Survey, U.S. Bureau of Land Management, and U.S ForestService. 1977. Final Environmental Impact Statement - Development ofPhosphate Resources in Southeastern Idaho. Vols. I, II, and III. Reston,VA: U.S. Geological Survey, U.S. Bureau of Land Management, and U.S.Forest Service.
U.S. Nuclear Regulatory Commission. 1980. Study of Chemical Toxicity of Low-Level Wastes, NUREG/CR-1793, Vol. 1. Prepared for the U.S. NuclearRegulatory Commission by General Research Corporation.
U.S. Nuclear Regulatory Commission. 1983. Design Considerations for Long-TermStabilization of Uranium Mill Tailings Impoundments, NUREG/CR-3397.Prepared for the U.S. Nuclear Regulatory Commission, Office of NuclearSafety and Safeguards, Washington, DC.
Vick, Stephen G. 1981. Siting and design of tailings impoundments. MiningEngineering (June) :653-57.
W.A. Wahler and Associates. 1974. Evaluation of Mill Tailings DisposalPractices and Potential Dam Stability Problems in Southwestern UnitedStates. Bureau of Mines Open File Report. 50-(5)-75. Report prepared forthe Bureau of Mines under USBM Contract No. SO110520. Washington, DC:U.S. Department of the Interior, U.S. Bureau of Mines.
Whiting, Duane L. 1981. Surface and Groundwater Pollution Potential from Non-Impounding Mine Waste Dumps. Presented at the 1981 SME Fall MeetingWorkshop, Design of Non-Impounding Mine Waste Dumps, Denver, Colorado,November 16 -17, 1981.
Williams, Roy E., and Steinhorst, R. Kirk. 1984. Analysis of Ground WaterQuality Data from Ground Water Monitoring Program, Evaluation of Manage-ment Practices for Mine Solid Waste Storage, Disposal and TreatmentProject, PEDCo Environmental Inc. Viola, ID: Williams and Associates,Inc.
Wilson, David (ed.). 1981. Design and Construction of Tailings Dams.Proceedings of a Seminar, November 6-7, 1980. Cosponsored by theColorado School of Mines and Klohn Leonoff, Inc. Golden, CO: ColoradoSchool of Mines Press.
Wixson, Bobby G., Gale, Nord L., and Davies, Brian E. 1983. A Study on thePossible Use of Chat and Tailings from the Old Lead Belt of Missouri forAgricultural Limestone. A Research Report Submitted to the MissouriDepartment of Natural Resources. Rolla, MO: The University of Missouri.
7-7

APPENDIX A
SUMMARY OF MAJOR WASTES FROM THE MINING AND
PROCESSING OF OIL SHALES

APPENDIX A
SUMMARY OF MAJOR WASTES FROM THE MINING AND PROCESSING OF OIL SHALES
A.1 INTRODUCTION
It is projected that the first U.S. commercial oil shale plant (Union
Oil's 10,000 bbl/day Long Ridge facility) will come on line in 1985 1 Other
larger plants are scheduled to start production between 1987 and 1994, and
many of these may be supported by the Federal Government through the U.S.
Synthetic Fuels Corporation. It has been estimated that in the western United
States alone, mining and processing volumes could eventually reach 1 million
metric tons per day.
The mining methods that will be used include room-and-pillar, lane-and-
pillar, open pit, and vertical-modified-in-situ (VMIS); production rates are
expected to range from about 12,000 to approximately 150,000 metric tons per
day. Downstream, or auxiliary, operations will include oil upgrading, gas
cleanup, and raw and wastewater treatment, but the processes that will be used
in these operations are more diverse and less well defined than mining and
retorting operations.
Although the types and quantities of solid wastes that will be produced by
oil shale plants are not well defined at this time, it is estimated that
production of the volume of oil shale anticipated (1 million metric tons per
day) will require the disposal of 810,000 metric tons of retorted shale per
1 The information in this Appendix has been summarized from "High VolumeWastes from the Mining and Processing of Oil Shales," written by E.R.Bates, U.S. Environmental Protection Agency, 1985, but not yetpublished.
A-1

day, 66,000 metric tons of raw shale fines per day, and over 3,000 metric tons
per day of spent catalysts, treatment chemicals and sludges, and byproduct
wastes. This would result in 300 million metric tons per year of wastes that
must be disposed of in an environmentally acceptable and cost-effective
manner.
Table A-1 shows the estimated quantities of solid waste that are projected
to be produced by a commercial oil shale industry mining 1 million metric tons
per day of raw oil shale. Some of these wastes, such as spent arsenic guard
bed catalysts and API separator bottoms, will most certainly be hazardous. For
the most part, these wastes will be produced in the large-scale solids-
handling operations associated with most oil shale facilities. They include
spent shale from retorting operations, dusts recovered from air pollution
controls, and unused raw shale (sub-ore, fines, dust). Non-marketable
byproducts, oily solids, scrap, and garbage are also considered major solid
wastes.
A number of other solid wastes that may contain materials that are
classified as hazardous will also be generated by commercial oil shale
facilities. These include spent catalysts, used chemicals and sludges from gas
cleanup operations, and water treatment sludges and slurries. Hydrogen plants,
which produce hydrogen for hydrotreating the crude shale, will be the major
source of a variety of spent catalysts. As listed in Table A-1, these
catalysts may include Co-Mo and ZnO catalysts from the hydro-desulfurizer
(HDS) unit; Ni-base, Fe-Cr, and Cu-Zu catalysts from the reformer; Ni-base
catalysts from the methanator; and arsenic guard bed and hydrodenitrification
(HDN) catalysts from the hydrotreater. However, as can be seen from the
individual quantities and totals listed, discrepancies exist in the estimates
of quantities that may be produced.
A-2

Table A-1 Relative Quantities of Solid Wastes PotentiallyGenerated by the Oil Shale Industry Mean Quantity of Waste Produced Standard Deviation (metric tons/ (metric tons/ million metric million metric Percent DataType of tons of shale tons of shale Uncertainty a
Pointswaste mined) mined) (%) (N)
Major Solid Wastes:Spent Shale 810,000 24,000 3.0 8
Raw Shale 66,100 12,200 18.5 8Rejects
Off-Spec 1,180 170 14.4 4Byproducts
Oily Solids 340 180 52.9 5
Scrap and 40 20 50.0 4Garbage
TOTALb 880,000 40,000 5.0 -
Spent Catalyst Generation:
Hydrogen Plantc 3.50 0.25 7.1 5HDS Unit 0.96 0.18 18.8 4Co-Mo 0.41 0.20 48.8 3ZnO 0.65 0.17 26.2 4
Reformerc 3.01 - - 2Ni-base 0.81 - - 2Fe-Cr 1.23 0.24 19.5 4Cu-Zn 1.64 - - 2
Methanator 0.34Ni-base 0.34 0.02 5.9 4
Hydrotreaterc 20.5 2.8 13.7 4Guard Bed 15.6 2.0 12.8 4HDN 1.45 - - 2
TOTAL c 26.9 5.1 19.0 7
A-3
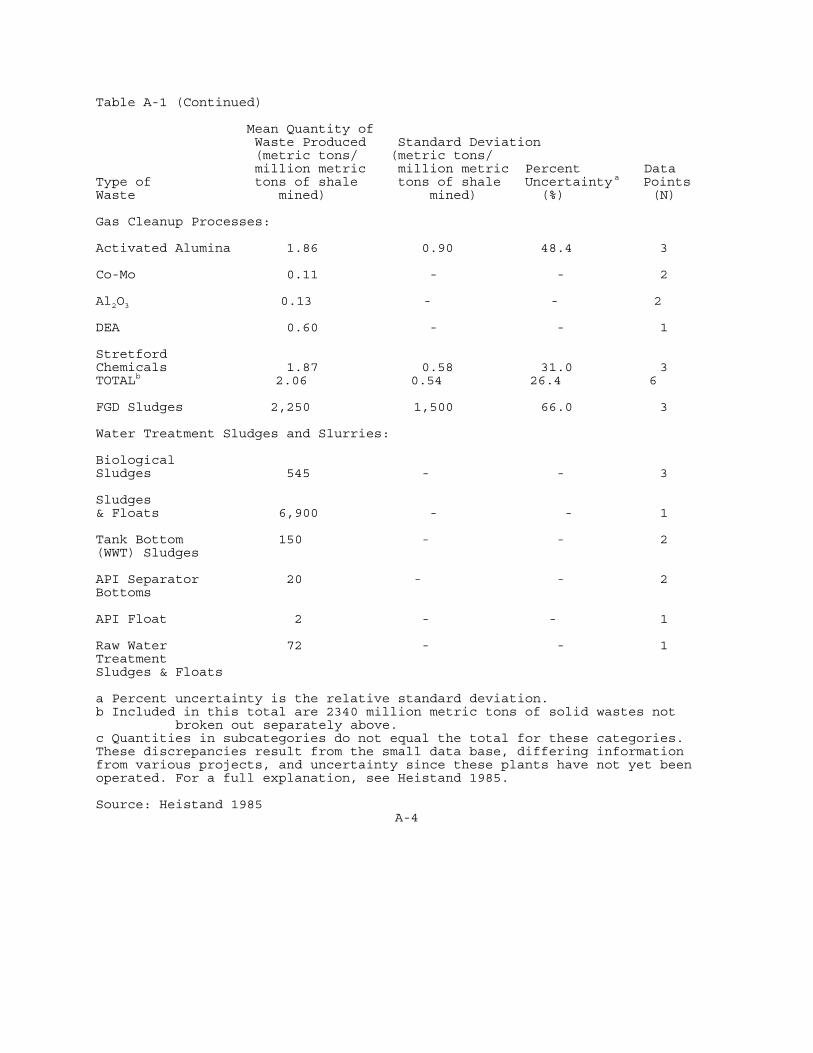
Table A-1 (Continued)
Mean Quantity of Waste Produced Standard Deviation (metric tons/ (metric tons/ million metric million metric Percent DataType of tons of shale tons of shale Uncertainty a PointsWaste mined) mined) (%) (N)
Gas Cleanup Processes:
Activated Alumina 1.86 0.90 48.4 3
Co-Mo 0.11 - - 2
Al2O3 0.13 - - 2
DEA 0.60 - - 1
StretfordChemicals 1.87 0.58 31.0 3TOTALb 2.06 0.54 26.4 6
FGD Sludges 2,250 1,500 66.0 3
Water Treatment Sludges and Slurries:
BiologicalSludges 545 - - 3
Sludges& Floats 6,900 - - 1
Tank Bottom 150 - - 2(WWT) Sludges
API Separator 20 - - 2Bottoms
API Float 2 - - 1
Raw Water 72 - - 1TreatmentSludges & Floats
a Percent uncertainty is the relative standard deviation. b Included in this total are 2340 million metric tons of solid wastes not
broken out separately above.c Quantities in subcategories do not equal the total for these categories.These discrepancies result from the small data base, differing informationfrom various projects, and uncertainty since these plants have not yet beenoperated. For a full explanation, see Heistand 1985.
Source: Heistand 1985A-4
Because planned gas cleanup operations are more diverse and less well
defined than oil upgrading, the amounts of chemicals used (activated alumina,
Co-Mo, Al2O3, DEA, and Stretford chemicals) and flue gas desulfurization
(FGD) sludges from gas cleanup processes are more difficult to estimate, and a
solid statistical analysis of the mean factors listed in Table A-1 is not
feasible. Information on chemicals other than activated alumina and the
Stretford chemicals is incomplete, and several projects plan to use more than
one of the gas cleanup chemicals listed. The estimated total of used chemicals
generated from fuel gas cleanup is about 2.1 metric tons per million metric
tons of oil shale mined. While FGD has been suggested as an alternative to
fuel gas cleanup processes, the amounts of FGD chemicals such as calcium
sulfate or gypsum are quite high, with mean quantities projected to be 2,250
metric tons per million metric tons of shale (Heistand 1985).
Sludges and slurries will be generated in raw and wastewater treatment in
commercial oil shale facilities. Because the exact composition and amounts of
the wastewaters requiring treatment are not well defined and many of the
resulting materials may be used on site, only limited information is available
for estimating the volume of water treatment sludges and slurries (Heistand
1985). The dry weights of these wastes are listed in Table A-1.
A.2 POTENTIAL DANGERS TO HUMAN HEALTH AND THE ENVIRONMENT
Oil shale facilities will produce large volumes of solid wastes that have
only a limited reuse potential. In some cases, spent catalysts may be
reclaimed and recycled back into the process. Elemental sulfur, which can be
removed by some air pollution control technologies, has some market potential
A-5

although the presence of trace impurities may constrain its use. Hazardous
wastes such as some spent catalysts and sludges will be disposed of in
licensed hazardous waste facilities.
The catalyst that is of particular concern in oil shale upgrading is the
arsenic guard bed catalyst. Raw shale oil contains significant amounts of
arsenic (15 ppm range) that must be removed prior to upgrading and refining.
Arsenic is removed by the arsenic guard bed catalyst, which must be replaced
periodically and reclaimed or disposed. However, no facilities currently exist
to reclaim the catalyst, and environmentally safe disposal of this spent
catalyst, which may contain 20 percent arsenic as well as other contaminants,
and be pyrophoric (tend to autoignite), may be difficult. As noted in Table A-
l, approximately 15 metric tons of spent arsenic guard bed catalyst will be
produced for each million metric tons of shale mined.
Other dangers to human health and the environment posed by oil shale
mining and processing may result from the long-term effects of the onsite
disposal of millions of tons of retorted oil shale, raw oil shale waste, and
other process wastes. These hazards include the following:
• Auto-oxidation/autoignition Leaching Mass failure.
* Leaching
* Mass failure
A.2.1 Auto-oxidation/Autoignition
Auto-oxidation resulting in autoignition may be a serious problem if raw
shale fines and/or carbonaceous spent shales are not disposed of in a manner
that minimizes this hazard. If oil shale disposal sites are not properly
designed they could autoignite, releasing large quantities of pollutants such
SO2, NOx, H2S, CO2, trace elements, and hydrocarbons. Combustion
A-6

could also impair pile stability, resulting in disposal pile failure and/or
acceleration of the leaching process. EPA has recently conducted tests to
assess the potential for autoignition of waste raw oil shale fines and
retorted oil shales (EPA 1984). The results of these tests indicate that raw
shale fines have an autoignition potential similar to that of bituminous
coals, while retorted shales appear to be less reactive.
A.2.2 Leaching
High inorganic salt loading and possible organics in leachates from raw
shale fines or spent shale could have potentially significant impacts on
ground-water supplies and on surface waters that supply the water needs of
millions of people. Because the composition of retorted oil shales varies
based on the properties of the raw shale feed and the retorting process used,
the composition of any leachates from retorted shale disposal sites will vary
depending on the properties of the retorted shale and on other wastes disposed
of with the retorted shale, such as wastewaters for cooling/wetting and
treatment sludges.
The available data indicate that even if raw and retorted shale wastes are
not defined as hazardous under RCRA, the leachates from these wastes are high
in dissolved salts as well as other contaminants and could have a serious
impact on surface and ground water if significant amounts of leachate are
produced. The amount of leachate produced will depend to a large extent on
site-specific characteristics and the disposal controls employed. Because
billions of tons of retorted oil shale may eventually be produced, the
cumulative impact on water quality could be very great.
A.2.3 Mass Failure
Retorted oil shale disposal sites will be the largest solid waste disposal
sites ever constructed. A typical 50,000 bbl/day surface retorting plant will
A-7

produce about 450 million cubic feet/year of solid waste, which would cover an
area of about 3.5 square miles to a depth of 150 feet over an operating plant
life of 30 years (US EPA 1980). Mass failure of one of these fills could cause
extensive property damage and threaten lives. Failure of even one of the
several disposal piles proposed could destroy downstream reservoirs; threaten
shale oil upgrading, storage, and loading facilities; and deposit millions of
tons of leachable retorted shale in the Colorado River and/or its tributaries.
The most likely cause of a disposal site failure is saturation of the
waste pile and/or liquefaction of the pile bottom leading to slippage.
Moisture that could contribute to this problem might result from wastewaters,
precipitation and infiltration, ground-water intrusion into the pile, or
surface streams routed over or through the disposal site.
A.3 DISPOSAL ALTERNATIVES
A.3.1 Alternatives for Minimizing Environmental Impacts
Oil shale operations will result in significant land disturbances on and
near the development site. Use of the land required for access to the site for
mining, processing facilities, and waste disposal will permanently modify the
terrain and influence the ecosystem by causing changes in the vegetation and
habitat. Local aesthetics will also be affected.
The most significant impacts on the environment will probably result from
the disposal of solid shale wastes, which will remain long after a mine has
been depleted and the processing facility has closed down. A major factor to
consider in solid waste disposal is the surface- and ground-water regime of
the site. While a waste landfill should blend in cosmetically with the
surroundings, it must also be sufficiently isolated from the surrounding
A-8
strata to protect the hydrologic environment. Other factors that influence
waste disposal and may contribute to the extent of environmental impacts are
the size and duration of the oil shale operation and the mining and retorting
technologies used. Because a substantial amount of raw shale will need to be
mined and processed to produce oil, the processed shale will be the major
waste produced by oil shale processing and its disposal will be the primary
environmental issue.
The physical and chemical properties of the processed shale as well as the
geology and hydrology of the site will be the determining factors in selecting
disposal and reclamation approaches. Every retorting method produces shale
that is unique and every development site has features not found elsewhere,
and therefore their combination should be analyzed on an individual basis. The
physical and chemical characteristics of the processed shale will be
determined by the source of the raw shale, its particle size after crushing
and retorting, and the temperature of the retorting.
There are primarily two types of processed shale--carbonaceous and burned
(decarbonized). Carbonaceous processed shales are produced by indirect
retorting in which residual coke on the retorted material is not incinerated.
Examples of this type of retorting are the TOSCO II and Union B processes.
Burned shales originate either from direct-heat processes, such as Paraho and
Modified in Situ (MIS), in which the air is introduced in the retort to cause
combustion of the residual carbon or from combination-mode processes, such as
Lurgi, Superior, and Union C, in which the retorting primarily occurs in the
indirect mode, but the residual coke on the processed shale is incinerated in
a separate stage.
A-9

The mining and processing of oil shale actually result in an increase in
the volume of shale. In-place density of the raw shale is approximately 2.16
g/cm3, but it is only practical to compact the processed shale to about 1.5 to
1.6 g/cm3. Even after losing about 20 percent of its original weight, the
shale after retorting will occupy about 10 to 15 percent more volume than it
originally occupied. This will be an important factor when considering
different approaches for the disposal of processed shale.
Processed shale moisturizing will be essential in disposing of the
processed shale and will serve several functions. The processed shale will
emerge from most retorts at elevated temperatures, requiring cooling and/or
moisturizing prior to handling and disposal. Transporting the processed shale
to the disposal area will involve extensive materials handling and transfer
that will be potential sources of airborne particulates, and these particulate
emissions can be minimized by moisturizing and using covered transport.
Perhaps the most significant advantage to moisturizing is that it facilitates
proper compaction and cementing of the processed shale, which will allow the
disposal of the maximum quantity of material in a given space and will provide
greater stability to a waste landfill.
Several alternatives are available for the disposal of shale processing
wastes. The disposal approaches available are surface disposal (canyon or
valley fill, surface pile), open pit backfill, underground mine backfill, in
situ retort abandonment, and, the least likely, commercial utilization of
wastes. The approaches or combinations of approaches used will depend largely
on site-specific features, the mining and retorting methods used, the surface
and subsurface hydrology of the area, and the properties of the processed
shale resulting from the retorting methods used. These disposal alternatives
are discussed in the following paragraphs.
A-10

A.3.2 Surface Landfills
The disposal of wastes in a valley or canyon near the plant site may be
the approach preferred by many oil shale developers. This selection is
influenced by the terrain of oil shale areas where large valleys and/or
canyons are available on development sites to accommodate the wastes
generated. Proper reclamation can allow for the landfill to be blended into
the surrounding terrain.
The advantages of this type of landfill are that the surface area needing
to be reclaimed or revegetated would be reduced and the bulk of the material
would be protected from the weather. However, water contamination resulting
from run-on and runoff and mechanical failure resulting from mass movement and
slippage are two disadvantages of this method that must be considered. If the
disposal area is flat, the landfill will need to be built above the surface as
a pile, in which case it will not blend into the surrounding environment and
will be visible from a distance. Although surface waste piles may limit run-on
and runoff problems, pile-up operations are more difficult and involve more
skill than valley fill operations, and exposure of landfills to wind and water
may result in excessive erosion.
The disadvantages of surface landfills as a disposal alternative can be
summarized as follows:
• Exposure to rain, snow, and wind may result in erosion of the waste
pile and mechanical failure.
• Waste particles disturbed by weather may become airborne or be
carried into surface- or ground-water supplies in runoff from the
waste pile.
Surface landfills may not blend into the surrounding terrain.
A-11

A.3.3 Open Pit Backfilling
Open pit backfilling is a type of surface landfill that may be an
alternative for open pit mining operations. Backfilling requires that the
overburden, sub-ore, and processing wastes generated during the first 20-30
years be temporarily stored or permanently disposed of in another location so
that they do not inhibit mining operations. Once the mine pit has been
sufficiently developed, the waste can be disposed of in the non-active pit
areas while mining continues on the active faces. After the project is shut
down, some of the initial waste stored outside the pit can be returned to the
mine, but approximately 20-30 percent of the total mined-out volume would
still need to be permanently disposed of outside the pit.
The advantages of open pit mining and backfilling are that they allow for
greater resource recovery than underground methods and the erosion potential
is greatly reduced because the bulk of the material will not be exposed to the
weather. In addition, if backfilling is complete, the land can be brought back
to its original contour. The disadvantages of open pit backfilling include the
following:
• Additional disposal is required outside the open pit.
A depression in the land surface may result from compaction and
settling of materials back filled into the pit, allowing water
collection and possible waste pile infiltration.
• Ground water may be contaminated, particularly if the pit
intersects an existing aquifer.
A.3.4 Underground Mine Backfilling
Returning the processed shale to the underground mine is an attractive
disposal approach and several underground backfilling methods are available,
A-12
although none has been tested on a large scale. Slurry backfilling via
pipelines is practical for processed shale disposal but requires large amounts
of water. Transportation by conveyors or trucks and subsequent compaction
using standard machinery is another method. Pneumatic transport is also a
possibility.
The advantages of using underground mine backfilling are that the waste
would be protected from the weather, erosion potential would be diminished,
and the need for surface reclamation and revegetation would be reduced. Also,
the danger of mine subsidence would be significantly reduced.
The disadvantages inherent in this disposal alternative include the
following:
• The logistics of simultaneous mining and backfilling operations may
be complex, requiring substantial above-ground disposal capacity
before backfilling can commence.
• Because of the difficulties in backfilling, coupled with the
expansion volume caused by mining, crushing, and retorting and
difficulty in achieving a high degree of compaction in underground
mines, perhaps only 60 percent of all processed shale can be
accommodated.
• Release of volatiles from retorted and backfilled shales may create a
fire hazard or otherwise endanger workers.
A.3.5 In-Situ Retort Abandonment
Although in-situ retorting processes do not involve surface handling and
disposal of processed shale, the retorted mass underground is waste that must
be managed. Although spent retorts may appear in some ways to be equivalent to
backfilled wastes in underground mines, there are important differences.
A-13

With in-situ retorts, it is not possible to control the amount and placement
of material, and the extent of ground-water seepage into the retort cannot be
determined or managed until after the retort field is abandoned and ground-
water levels are no longer depressed.
The primary concerns associated with the abandonment of in-situ retorts
are ground-water infiltration, the retention of heat in the retorted mass, and
the creation of a combustion hazard caused by air leaking into the retort.
A.3.6 Potential Utilization of Wastes
Retorted oil shale, particularly decarbonized shales, raw shale fines,
spent catalysts, elemental sulfur, and biological treatment sludges may have a
limited potential for use on site. Decarbonized western oil shales have
cementing properties similar to those of low-grade commercial cement and may
be used as a cement substitute. Raw shale rejects and fines from mining and
raw shale preparation could be processed by some types of retorts or formed
into briquettes for processing by other retort facilities. Some spent
catalysts could be reclaimed and reused in the upgrading process, although no
facilities presently exist to reclaim them. Some air pollution control
technologies remove elemental sulfur, which may have a limited market value if
it is not contaminated by impurities. Biological treatment sludges may be
useful on site as soil conditioners for revegetation if they do not contain
significant quantities of harmful contaminants.
Unfortunately, even if each of these wastes is used to the maximum extent
possible, it will not have a significant impact on the total amount of solid
oilshale waste requiring disposal.
A-14

A.4 CONTROL TECHNOLOGIES
The following discussion of the control technologies applicable for oil
shale waste disposal is derived from EPA's Pollution Control Technical Manual
(1983) for TOSCO II oil shale retorting and summarizes the major control
technologies for preventing contamination of surface- and ground-water
supplies by runoff or leachate, for preventing the generation of dusts, and
for preventing mass failure of a surface landfill. Selecting and applying the
appropriate control technologies must be based on site- and plant-specific
features, and controls must be integrated into the overall disposal design.
The following sections specify control technologies and practices in the
following areas:
• Surface hydrology
• Subsurface hydrology
• Surface stabilization. (Control technologies for oil shale wastes are
similar to those mitigative measures specified in Section 3 of this report.)
A.4.1 Surface Hydrology Control Technologies
Solid waste management practices in the area of surface hydrology entail
the handling of surface waters on and around the disposal facility to prevent
surface streams and precipitation from running onto the waste pile and to keep
contaminated waters (runoff, leachate) from infiltrating natural waters.
Surface hydrology control technologies that are applicable to surface
landfills include run-on diversion systems, runoff collection systems, and
runoff/leachate collection ponds.
A.4.2 Subsurface Hydrology Control Technologies
The technologies and practices in the area of subsurface hydrology involve
handling ground-water seepage under landfills to prevent infiltration of the
A-15

pile. These technologies also prevent leachate from the pile from
contaminating ground water. These include liners and covers, leachate
collection systems, and ground-water collection systems.
A.4.3 Surface Stabilization Technologies
Control technologies in the area of surface stabilization address the
disturbed land surface and the problems associated with the disposal and
reclamation of waste material. They include dust controls, such as the use of
water and binders and the paving of haul roads, and erosion controls, such as
mulching, revegetation, and designs that provide slope stability.
A.5 CONCLUSIONS
The oil shale industry will produce unprecedented volumes of solid waste
consisting primarily of retorted oil shales, raw oil shale fines, overburden
and subgrade ore, wastewater, and smaller quantities of known hazardous
wastes. Although most known hazardous wastes will be disposed of in licensed
disposal or recycling facilities, a majority of the solid wastes produced will
be disposed of on or close to the plant site. If this large volume of wastes
is not properly managed, it may produce leachates that could contaminate the
water supplies of millions of people, pose an autoignition hazard, and, if a
mass failure occurred, do extensive property damage and threaten lives.
Control technologies to prevent serious adverse impacts resulting from the
disposal of billions of tons of oil shale wastes have been proposed, but their
application to oil shale wastes on the scale required has not been
demonstrated. Further, for these technologies to be effective they must be
incorporated into highly technical and well-integrated disposal designs that
A-16

are both site- and process-specific. Finally, there has been no experience in
disposing of wastes having the characteristics and volume of those that will
be generated by the oil shale industry.
A-17

REFERENCES FOR APPENDIX A
Heistand, R.N. 1985. "Estimating Solid Wastes from Oil Shale Facilities,"Proceedings of the 18th Oil Shale Symposium. Golden, Colorado: ColoradoSchool of Mines Press.
USEPA. 1984. Auto-oxidation Potential of Raw and Retorted Oil Shale. EPA-600/2-84-153. A.D. Green, Editor, Research Triangle Institute.Cincinnati, OH: U.S. Environmental Protection Agency.
USEPA. 1983. Pollution Control Technical Manual: TOSCO II Oil Shale Retortingwith Underground Mining. EPA-600/8-83-003. Cincinnati, OH: U.S.Environmental Protection Agency.
USEPA. 1980. Environmental Perspective on the Emerging Oil Shale Industry.EPA-600/2-8-205a. EPA Oil Shale Research group. E.R. Bates and T.L.Thoem, Editors. Cincinnati, OH: U.S. Environmental Protection Agency.
A-18

APPENDIX B
METHODOLOGY

APPENDIX B
METHODOLOGY
The most important empirical input for this study was derived from
analyses of sampling results and information about active mines in the
industry segments of concern. EPA's sampling methodology (described more fully
in Section 4.1) involved sampling waste from at least one mine and mill in
various mining region-commodity categories. These results were supplemented by
sampling results from other studies so that EPA's waste samples would
represent the full range of wastes and industries covered by this study. EPA's
data base containing information about active mines in the industry segments
of concern is described below. The Agency's methodology relied on contractor
studies, EPA staff analyses, field and laboratory results, engineering
estimates, and economic projections and trends. This appendix first describes
EPA's data base, and then discusses how the Agency determined current industry
control practices, estimated the amounts of waste involved, and extrapolated
from waste volumes at individual mines to totals for all mining industry
segments.
B.1 EPA'S DATA BASE
EPA compiled a data base of mines in the following industry segments as
follows:
• Copper--13 mines;
* Gold--11 mines;
• Lead--7 mines;
B-l

• Silver--9 mines;
Uranium--9 mines;
Zinc--7 mines; and
Phosphate--18 mines.
EPA had the following information about these mines:
Name and location;
Amount of product produced annually;
® Amounts and types of wastes existing on site and the amountsgenerated annually;
~ Expected operating life of the mine; and
Dimensions of waste management areas (e.g., area and perimeter ofmine waste piles; depths, surface areas, height and width of bermsof tailings impoundments; area and perimeter of heap/dump leachoperations, etc.).
B.2 CURRENT INDUSTRY BASELINE PRACTICES FOR THE USE OF MITIGATIVE MEASURES
EPA assessed current industry baseline practices for the use of various
mitigative measures as follows. The Agency assumed that mines located in
states having regulations as stringent as RCRA requiring mines to have
mitigative measures (e.g., ground-water monitoring, run-on/runoff controls,
liners for tailings ponds, leachate collection and removal, pads for heap
leach operations) currently used the required mitigative measures. In the case
of closure, EPA assessed whether mine sites perform some or all of the
procedures currently required by RCRA. Mines in states that do not have
regulations requiring a certain mitigative measure, or requiring measures that
are not as stringent as current RCRA requirements, were assumed not to be
using a measure unless the Agency had specific knowledge that a measure was
voluntarily being used at a specific mine in that state.
B-2

These assumptions were used to estimate the percentage of mines in various
industry segments where sufficiently stringent mitigative measures are
currently being used (see Section 3 of this report), and to determine baseline
industry practices for the analysis of the economic costs of various
regulatory scenarios (presented in Section 5 of this report).
B.3 ESTIMATED AMOUNTS OF POTENTIALLY HAZARDOUS MINING WASTE
EPA estimated the amount of potentially hazardous mining waste by type of
hazard, industry segment, and type of waste (mine waste, tailings, leach
waste) using EPA's waste sampling results (presented in Section 4.1), site-by-
site estimates of the amount of mining waste at operations at sites
represented in the data base described above, and estimates of the total
amount of waste generated by each mining industry segment.
EPA's first step in estimating the annual generation of potentially
hazardous mining waste was to project the number of mines active in 1985, the
amount of waste generated annually, and the amount of waste existing at these
mine sites in 1985. Because of the variability in the number of active mines
in recent years, EPA projected past trends to arrive at 1985 estimates instead
of using historical data from the most recent year for which such data were
available. These projections are based on an extrapolation of mineral produc-
tion levels and a review of the current operating status of mines, amounts of
waste generated, and the amount of existing waste at the mines represented in
the EPA data base. (These' projections are presented in Table 4-17 of the
report.)
B-3

EPA developed estimates of the amounts of specific mining wastes that may
be potential candidates for listing (copper dump leach wastes, silver and gold
heap leach wastes, silver and gold metal recovery wastes) based on annual
generation data for each of these wastes. EPA estimated the amounts of waste
that are hazardous because of their characteristics (i.e., corrosivity, EP
toxicity, cyanide content, radioactivity, asbestos content, acid formation
potential) based on the waste sampling and acid formation potential data for
waste management operations represented in EPA's data base.
For sampled mines represented in the EPA data base, Table B-1 shows the
percentage of all U.S. mining waste management operations and of all wastes
generated by these operations in 1985, by industry segment. As this table
shows, the data base used by EPA as the basis for this report on hazardous
mining waste represents a considerable portion of the total number of mining
waste operations and of all mining waste generated by these industry segments:
• For mine waste operations, the data base represents between 5 (gold
industry) and 43 (lead industry) percent of all mine waste
operations in each of the respective segments.
• For heap/dump leach operations, the data base represents between 17
percent (gold and silver industry segments), and 32 percent (copper
industry) of all such operations in each of the respective segments.
• For tailings operations, the data base represents between 6 percent
(gold industry) and 67 percent (copper industry) of all tailings
operations.
In all cases, the percentage of waste represented in the data base is
larger than the percentage of operations. For example, in the copper industry
segment, 93 percent of all copper tailings waste but 67 percent of all copper

Table B-1 Percentage of Mines and Annual Amount of Waste Generated bySampled Mines Represented in EPA's Data Base
Percentage of Percentage of all mining waste annual mining wasteMining Type of waste management operations generated byindustry management in industry segment industry segment insegment operation (1985) 1985
Copper Mine waste 32 73 Dump leach 32 38 Tailings 67 93
Gold Mine waste 5 35 Heap leach 17 53 Tailings 6 34
Lead Mine waste 43 56 Tailings 50 60
Phosphate Mine waste 21 45 Tailings 21 34
Silver Mine waste 10 57 Heap leach 17 53 Tailings 11 73
Uranium Mine waste 14 26
Zinc Mine waste 33 69 Tailings 33 70
Source: Charles River Associates 1985c.
B-5

tailings operations are represented in the data base. Although only 26 percent
of all of the mine waste generated annually by the uranium segment is
reflected in the data base, the data base generally reflects at least half of
the total amount of waste generated by the waste management operations of each
of the respective industry segments.
To provide estimates of the maximum amount of potentially hazardous waste
generated by the mining industry segments of concern, EPA assumed that if any
waste sample from a waste management operation failed a particular hazard
criterion, all of the waste from that operation failed that hazard criterion.
For example, if one of five samples from a tailings pond was EP toxic, EPA
assumed that all waste from that tailings operation was EP toxic. Similarly,
if a sample of pregnant leachate from a dump leach pile had a pH of less than
or equal to 2, waste from the entire dump leach operation was considered
Corrosive.
Table B-2 shows the number of sampled waste management operations
represented in the EPA data base that had at least one sample that was
classified as hazardous. It also shows how many of these waste management
operations had at least one sample classified as hazardous because it was EP
toxic, corrosive, radioactive, or had high acid formation potential.
To estimate the total amount of potentially hazardous waste generated
annually, EPA extrapolated results from the sampled wastes represented in the
EPA data base to wastes generated by mines included in the data base and to
wastes generated by mines included in the data base but not sampled by EPA.
For mines not sampled by EPA but represented in the EPA data base, EPA
estimated the amount of potentially hazardous waste generated annually as
follows. The annual amount of waste generated at operations at these mines,
B-6

Table B-2 Number of Sampled Waste Management Operations Represented in EPA'sData Base with at Least One Sample Classified as Hazardous
Number of hazardous Radium-226 Radium-226Mining waste High acid greater than greater thanindustry management formation or equal to or equal tosegment operations EP toxic Corrosive potential 5 pCi/g 20 pCi/g
CopperMine waste 7 0 0 0 0 0Dump leach waste 3 0 1 0 0 0Tailings 12 0 0 4 0 0
GoldMine waste 6 1 0 0 0 0Heap leach waste 5 0 0 0 0 0Tailings 4 2 0 0 0 0
LeadMine waste 3 1 0 0 0 0Tailings 3 1 0 0 0 0
PhosphateMine waste 7 0 0 0 5 0Tailings 7 0 0 0 4 1
SilverMine waste 5 1 0 0 0 0Heap leach waste 1 0 0 0 0 0Tailings 5 1 0 1 0 0
UraniumMine waste 6 0 0 0 6 5
ZincMine waste 4 0 0 0 0 0Tailings 4 1 0 0 0 0
Source: EPA sampling results and EPA data base.

as reported in the data base, was multiplied by the percentage of sampled
operations reported in the data base as having potentially hazardous waste. To
estimate the amount of potentially hazardous waste generated annually by those
mining operations not represented in the data base, EPA multiplied the
percentage of waste found to be potentially hazardous at mines represented in
the data base by the estimated amount of waste generated by the mines that
were not represented in the data base. Table B-3 illustrates EPA's methodology
for estimating the total amount of potentially hazardous mining waste
generated annually.
One limitation of this approach is that not all of EPA's sampling data
could be used in the projections of the total amount of potentially hazardous
waste, i.e., only data for waste operations represented in the EPA data base
were used to estimate projected amounts of waste. EPA recognizes that use of
this methodology may overlook some data. For example, if EPA had sampling
results showing that a sample taken from an operation that was not represented
in the data base had a hazardous level of one of the properties considered
hazardous in this report, no waste from such an operation in that industry
segment was classified as having that property. To illustrate, one sample
taken by EPA at a copper waste operation was EP toxic, but because this
particular operation was not represented in the EPA data base, no waste from
this industry segment is reported here to be EP toxic. A similar problem
occurs with respect to the acid formation potential of wastes in the gold and
silver industry segments; the analysis of minerals for these industry segments
shows that a significant percentage of these tailings have high acid formation
potential. However, since none of these tailings operations were located at
mines represented in the EPA data base, no tailings from these segments are
B-8

Table B-3 Methodology for Estimating the Total Amountof Potentially Hazardous Mining Waste Generated Annually
Method for determiningMethod for determining percentage of potentially
Source of data amount of waste hazardous waste
Sampled sites Site-by-site estimates Sampling resultsrepresented in for sites representedEPA's data base in EPA's data base
Non-sampled sites Site-by-site estimates Percentage of all sitesrepresented in for sites represented found to have hazardousEPA's data base in EPA's data base waste
Sites not Total amount of mining Extrapolation based onsampled and not waste based on Bureau relative amount of wasterepresented in of Mines estimates found to be hazardous inEPA's data base minus amount of mining mines represented in
waste represented in EPA's data baseEPA's data base
B-9

considered potentially hazardous because of their high acid formation
potential. Despite these anomalies, EPA decided to base its estimates on data
from the sampled operations represented in EPA's data base because complete
sampling data and estimates of the amount of waste generated annually were
available only for these operations. In addition, EPA's data base only
included information on mines that were active in 1985.
B-10

APPENDIX C
SELECTED CRITERIA
ANALYZED FOR TOXIC EFFECTS

TABLE C-1
A COMPARISON OF LEVELS OF EP TOXIC METALS ALLOWED BY VARIOUS EPA STANDARDS ANDCRITERIA
Metals Measured Levels Specified Maximum Contaminant Levels Specified byby RCRA's EP by 40 CFR 261.24, Levels Specified 45 FR 79318, Nov. 20,Toxicity Test Characteristic of by 40 CFR 141.11, 1980 Ambient Water EP Toxicity, mg/l National Interim Quality Criteria for Primary Drinking the Protection of Water Standards, Aquatic Life, mg/l
mg/l (24-hour average)
Arsenic 5.0 0.05 NABarium 100.0 1.0 NACadmium 1.0 0.01 0.000025Chromium (VI) 5.0 0.05 0.00029Lead 5.0 0.05 0.0038 Mercury 0.2 0.002 0.0002Selenium 1.0 0.01 0.035Silver 5.0 0.05 NA
NA - Not Applicable
C-1

TABLE C-2
ARSENIC TOXICITY TO AQUATIC BIOTA
Toxic Most Sensitive ToxicEffect Organism Tested Concentration, Source mg/l
Acute toxicity(LC50/EC50)
a
Cladocera 0.812 As +3 US EPA (1980a) Simocephalus serrulatus
Daphnia magna 7.4 As+5 US EPA (1980a)
Minnows 27-45 As+3 McKee and Wolf (1963)
Chronic toxicity Algaeb 2.32 As+3 US EPA (1980a)
Daphnia magna 0.91 As+3 US EPA (1980a) 0.52 Total As NRCC (1980)
Bass 7.6 McKee and Wolf (1963)
a The terms LC50 and EC50 refer to contaminant concentrations lethal (LC50) or causing significant toxiceffects (EC50) to 50 percent of a test population within a selected test duration.
b 100% kill in 2 weeks.
C-2TABLE C-3

CADMIUM TOXICITY TO AQUATIC BIOTA
Toxic Most Sensitive ToxicEffect Organism Tested Concentration Source (mg/l x 10-3)
Acute toxicity(LC50/EC50)
a Cladoceran 3.5-35 US EPA (1980b)
Simocephalus serrulatus
Striped bass 1.0 US EPA (1980b) larvae
Chronic toxicity Diatoms 2.0 US EPA (1980b) Asterionella
formosa Daphnia pulex 1.0 US EPA (1980b)
Rainbow trout 0.7-130 US EPA (1980b) Brook trout 1.0 NRCC (1979a)
a The terms LC50 and EC50 refer to contaminant concentrations lethal (LC50)or causing significant toxic effects (EC50) to 50 percent of a test population within a selected test
C-3

TABLE C - 4
CHROMIUM TOXICITY TO AQUATIC BIOTA
Toxic Most Sensitive ToxicEffect Organism Tested Concentration Level Source (freshwater) (mg/l)
Cr VI Cr III
Acute toxicity Algae 0.01-0.50 US EPA (1980c)(LC50/EC50)
a Watermil foil 9.9 US EPA (1980c) Scud 0.067 3.1 US EPA (1980c) Daphnia magna 6.4 2.0-59 US EPA (1980c)
0.016-0.7 0.33 NRCC (1980)
Fathead minnow 17.6-66 5.0-67 US EPA (1980c)
Benthic organisms 3.0-60 NRCC (1980)
Chronic toxicity Daphnia magna 0.066 US EPA (1980c)
Rainbow trout 0.073-0.265 US EPA (1980c)
Fathead minnow 1.02 US EPA (1980c)
a The terms LC50 and EC50 refer to contaminant concentrations lethal (LC50) orcausing significant toxic effects (EC50) to 50 percent of a test populationwithin a selected test duration.
C-4
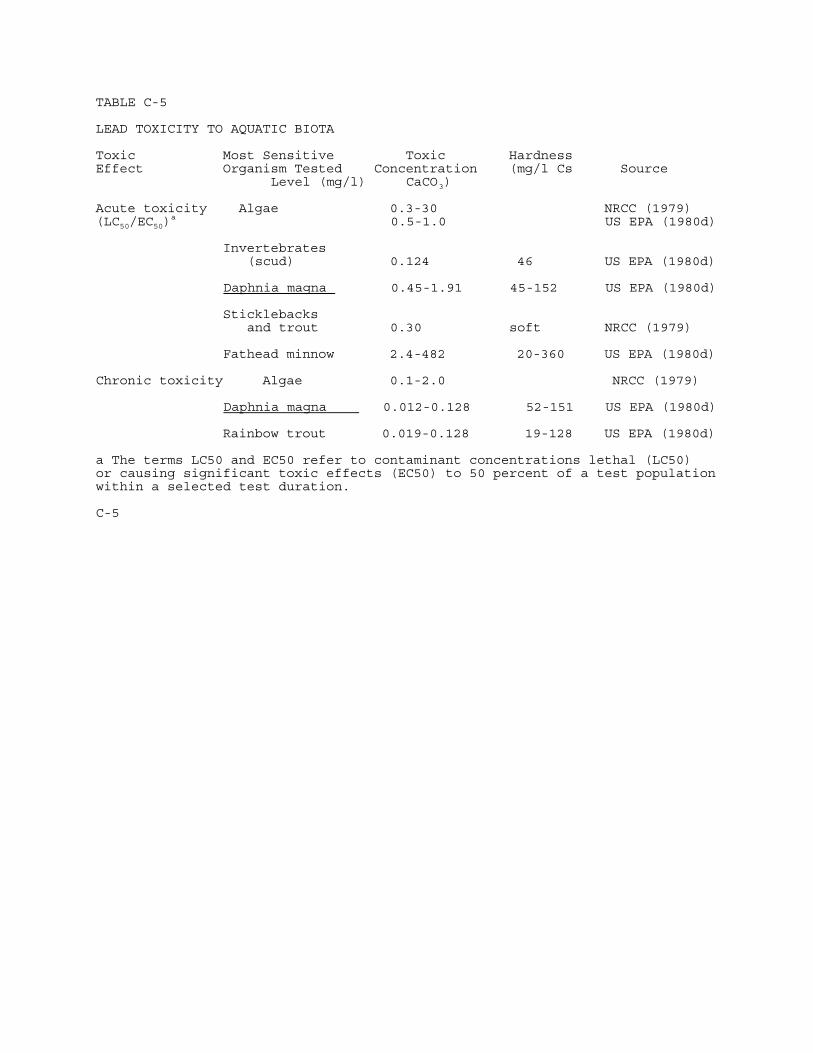
TABLE C-5
LEAD TOXICITY TO AQUATIC BIOTA
Toxic Most Sensitive Toxic HardnessEffect Organism Tested Concentration (mg/l Cs Source
Level (mg/l) CaCO3)
Acute toxicity Algae 0.3-30 NRCC (1979)(LC50/EC50)
a 0.5-1.0 US EPA (1980d)
Invertebrates (scud) 0.124 46 US EPA (1980d)
Daphnia magna 0.45-1.91 45-152 US EPA (1980d)
Sticklebacks and trout 0.30 soft NRCC (1979)
Fathead minnow 2.4-482 20-360 US EPA (1980d)
Chronic toxicity Algae 0.1-2.0 NRCC (1979)
Daphnia magna 0.012-0.128 52-151 US EPA (1980d)
Rainbow trout 0.019-0.128 19-128 US EPA (1980d)
a The terms LC50 and EC50 refer to contaminant concentrations lethal (LC50)or causing significant toxic effects (EC50) to 50 percent of a test populationwithin a selected test duration.
C-5

TABLE C-6
MERCURY TOXICITY TO AQUATIC BIOTA
Toxic Most Sensitive ToxicEffect Organism Tested Concentration Compound Source mg/la
Acute toxicity Phytoplankton 0.9-60 Mercury McKee and Wolf(LC50/EC50)
b salts (1963)
Crayfish 0.02 HgCl2 US EPA (1980e)
Rainbow trout 155-400 HgCl2 US EPA (1980e) 29 CH3HgCl
Chronic toxicity Daphnia magna 1.27-1.87 HgCl2 US EPA (1980e) 0.52-1.00 CH3HgCl US EPA (1980e)
Minnow 0.01 H55O4 McKee and Wolf HgNO3 (1963)
Algae 1,030* HgCl2 US EPA (1980e)
a Expressed as mercury, not the compound.
b The terms LC50 and EC50 refer to contaminant concentrations lethal (LC50)or causing significant toxic effects (EC50) to 50 percent of a test populationwithin a selected test duration.
C-6

TABLE C-7
SELENIUM TOXICITY TO AQUATIC BIOTA
Toxic Most Sensitive ToxicEffect Organism Tested Concentration mg/l Selenite (+4) Selenate (+6)
Acute toxicity Blue-green algae 15-30 17-40(LC50/EC50)
a
Scud 0.34 0.76
Fathead minnow 0.62-11.3 11.8-12.5
Chronic toxicity Daphnia sp. 0.092-0.69
Rainbow trout 0.088
Source: US EPA (1980f)
a The terms LC50 and EC50 refer to contaminant concentrations lethal (LC50) orcausing significant toxic effects (EC50) to 50 percent of a test populationwithin a selected test duration.
C-7

TABLE C-8
CYANIDE TOXICITY TO AQUATIC BIOTA
Toxic Organism ToxicEffects Tested Concentration mg/l
Acute toxicity Daphnia pulex 0.083(LC50/EC50)
a
Brook trout 0.052-0.507
Chronic toxicity Scud 0.018
Brook trout 0.008
Source: US EPA (1980g)
a The terms LC50 and EC50 refer to contaminant concentrations lethal (LC50) orcausing significant toxic effects (EC50) to 50 percent of a test populationwithin a selected test duration.
C-8

TABLE C-9
SUMMARY OF RADIATION EFFECTS
• Radiation has been demonstrated to be carcinogenic, mutagenic, andteratogenic (US EPA 1984).
Radium poses a danger to human health because of its property as an alphaemitter, and because it is concentrated in bone tissue following absorptioninto the body (US EPA 1984).
Chromosome aberrations in human lymphocytes following radiation exposure byingestion of Ra-226 or by inhalation of Rn-222 have been demonstrated (US EPA1984).
An increased incidence of leukemia and osteosarcoma has been observed in patientswho received injections of Ra-224 for medical purposes
( US EPA 1984 ).
•US EPA (1984) estimated the radionuclide emissions from a referenceunderground uranium mine of assumed typical dimensions to be 11,500Ci/yr as ration-222, 0.02 Ci/yr as uranium-238, and 3 x 10⁻⁴ Ci/yras thorium-232. The most important emission was expected to beradon-222. The lifetime human mortality risk factor for personsresiding within 2000 meters of the sources of these emissions wasestimated to be on the order of 10-2.
•In general, organisms of lower phyla are more resistant to ionizing radiationthan are higher vertebrates (McKee and Wolf 1963).
•Radon, a decay product of radium, poses a danger to human healthbecause it is an inert (noble) gas that diffuses into buildings whereit builds up (concentrates) in the indoor air. The decay products ofradon may be inhaled and retained in the lung, greatly increasing therisk of lung cancer.
C-9

TABLE C-10
EFFECTS OF ASBESTOS EXPOSURE
•Chrysotile and amphibole fibers are toxic to the bacteria E. coli andS. aureus (NRCC 1980).
•Mussels and freshwater fish have been shown to take up asbestosfibers from water and store these in muscle tissue, but the effect onmortality rates was not determined (NRCC 1980, US EPA 1980h).
•The ambient water quality criteria for the protection of human healthdeveloped by US EPA (1980h), assuming the ingestion of 2 liters perday of contaminated water, are 300,000 fibers per liter (f/1) 30,000f/1 and 3,000 f/1 for a projected cancer incidence rate of 10 -5,10-G, and 10-7, respectively.
Cytotoxicity of intestinal tissue has been observed following ingestion ofasbestos fibers by rats (US EPA 1980h).
Asbestosis, the noncancerous disease resulting from inhalation of asbestosfibers, is a chronic, progressive pneumoconiosis (US EPA 1980). The lowestcumulative asbestos respiratory exposure level at which severe forms ofasbestosis have been detected is 25 fibers year/cm3 ( US EPA 1980i ).
•The risk of asbestosis rises with increasing asbestos exposure; thedose-response curve for asbestosis mortality can be qualitativelydescribed as linear (US EPA 1980i).
Several studies of worker exposure to asbestos have linked asbestosrespiratory exposure to increased rates of pleural and peritonealmesothelioma; cancer of the lung, stomach, esophagus, pharynx, colon-rectum,skin, and kidney; leukemia; and neoplasms of the digestive organs andperitoneum (US EPA 1980h).
~ Several dose-response relationships have been established for asbestosexposure and human mortality from various diseases. Over 50% of the deathsamong a group of 17,800 asbestos insulation workers exposed at levels of 10 to20 f/cm3 and studied over a 10-year period could be attributed to asbestos-related diseases. Chronic exposure at this level was shown to result in deathrates from mesotheliomas from 1.3 to 4 times those of the general U.S.population of the same age and sex (US EPA 1980h).
Among male asbestos plant workers, respiratory exposure for less than 2 yearsat asbestos levels of 20 or more f/cm3 resulted in significantly increasedrates of cancer deaths. Females exposed for the same duration but at the lowerlevels of 5 to 10 f/cm3 exhibited significant increases in the rates of deathfrom cancers of the lung and pleura (US EPA 1980h ).
C-10

•Excess malignant respiratory disease has been reported among asbestosmine workers exposed to an average air concentration of 0.25 f/cm 3
( US EPA 1980h ).
Estimates of human exposure to asbestos for persons living within 30 km ofasbestos mines or mills are 0.4 f/cm3 compared with the average ambient urbanexposure of 5 x 10⁻³ f/cm3 (electron microscope visible fibers) (Suta and Levine1979, as cited by Colgley et al. 1981 ).
C-11

TABLE C-11
THE SUMMARY OF EFFECTS OF DECREASING pH ON FISH
PH Range Effects
9.0 - 6.5 Harmless to most fish; toxicity of other poisons maybe affected by changes within this range.
6.5 - 6.0 Unlikely to be harmful to fish unless free carbondioxide is present in excess of 100 mg/l; egghatchability and growth of alevins of brook troutsignificantly lower at all pH levels below 6.5.
6.0 - 5.5 Egg production and hatchability of fathead minnowreduced; reduced egg production and larval survivalof flagfish; roach reproduction may be affected;unlikely to be harmful to fish unless free carbondioxide is present in excess of 20 mg/l.
5.5 - 5.0 Increased hatching time of Atlantic salmon eggs;mortality of brown trout eggs is high; threshold oftissue damage for fingerling brown trout; growth offlagfish larvae may be reduced; roach reproductionreduced at least 50 percent; may be harmful tonon-acclimated salmonids if the calcium, sodium, andchloride concentrations or the temperature is low.
5.0 - 4.5 Harmful to eggs and alevins or larvae of mostsalmonids and white sucker, and to adultsparticularly in soft water containing lowconcentrations of calcium, sodium, and chloride; maybe harmful to carp; roach recruitment impaired; fishmortalities can be expected.
4.5 - 4.0 Expected to be harmful to salmonids at all stages;likely to be harmful to tench, bream, roach,goldfish, carp, fathead minnow, bluegill;acclimation may increase resistance to these levels.
4.0 - 3.5 Lethal to most fish over extended periods.
3.5 and below Acutely lethal to fish.
Source: Potter et al. 1982
C-12

TABLE C - 12
SUMMARY OF DAMAGES TO AQUATIC ECOSYSTEMS WITH DECREASING pH
pH Range Effects
8.0 - 6.0 Long-term changes of less than 0.5 pH units arelikely to alter the biotic composition offreshwaters to some degree. The significance ofthese slight changes is, however, not great.
A decrease of 0.5 to 1.0 pH units in the rangeof 8.0 to 6.0 may cause detectable alterationsin comnunity composition. Productivity ofcompeting organisms will vary. Some species willbe eliminated.
6.0 - 5.5 Decreasing pH will cause a reduction in speciesnumbers and, among remaining species,
significantalterations in ability to withstand stress.Reproduction of some salamander species isimpaired.
5.5 - 5.0 Many species will be eliminated, and speciesnumbers and diversity will be reduced.Crustacean zooplankton, phytoplankton,mamphipeds, most mayfly species, and somestonefly species will begin to drop out. Incontrast, several pH-tolerant invertebrates willbecome abundant, especially the air-breathingforms (e.g., Gyrinidae, Notonectidae,
Corixidae),those with tough cuticles that prevent ion
losses(e.g., Sialis lutaris), and some forms that livewithin sediments (Oligochaeta, Chromomidae,and Tubificidae). Overall, invertebrate biomasswill be greatly reduced.
5.0 - 4.5 Decomposition of organic detritus will beseverely impaired. Autochthonous andallochthonous debris will accumulate rapidly.Most fish species are eliminated.
4.5 All of the above changes will be greatlyexacerbated, and most fish will be eliminated.
Source: Potter et al. 1982
C-13
REFERENCES FOR APPENDIX C
Colgley, D., Krusell, N., McInnes, R., Bell, 1981. GCA Corporation. Lifecycleof asbestos in commercial and industrial use including estimates ofreleases to air, water and land. Draft Report. Washington, DC: U.S.Environmental Protection Agency. Contract 68-02-2607/68-02-3169.
McKee, J.E., Wolf, H.W. 1963. Water Quality Criteria. Sacramento, CA: TheResources Agency of California, State Water Quality Control Board.Publication No. 3-A.
NRCC. National Research Council Canada. 1979a. Effects of Cadmium in theCanadian Environment. Ottawa, Canada: NRCC No. 16743.
NRCC. National Research Council Canada. 1979.b. Effects of Lead in theEnvironment-1978. Ottawa, Canada: NRCC No. 16736.
NRCC. National Research Council Canada. 1980. Executive reports. Effects ofChromium, Alkali Halides, Arsenic, Asbestos, Mercury, Cadmium in theCanadian Environment. Ottawa, Canada: NRCC No. 17585.
Potter, W., Chang Ben K-Y, Adler, D. 1982. The Effects of Air Pollution andAcid Rain on Fish, Wildlife, and Their Habitats. Rivers and Streams.Fish and Wildlife Service, U.S. Department of Interior, FWS 14-16-0009-80-085.
USEPA. 1984. Radionuclides; Background Information; Document for Final Rules,Vol. 1. Washington, DC: EPA-560/12-80-003.
USEPA. 1980.a. Ambient Water Quality Criteria for Arsenic. U.S. EnvironmentalProtection Agency. Washington, D.C. EPA-440/5-80-021.
USEPA. 1980.b. Ambient Water Quality Criteria for Cadmium. U.S. EnvironmentalProtection Agency. Washington, D.C. EPA-440/5-80-025.
USEPA. 1980.c. Ambient Water Quality Criteria for Chromium. U.S. EnvironmentalProtection Agency. Washington, D.C. EPA-440/5-80-035.
USEPA. 1980.d. Ambient Water Quality Criteria for Lead. U.S. EnvironmentalProtection Agency. Washington, D.C. EPA-440/5-80-057.
USEPA. 1980.e. Ambient Water Quality Criteria for Mercury. U.S. EnvironmentalProtection Agency. Washington, D.C. EPA-440/5-80-058.
C-14

USEPA. 1980.f. Ambient Water Quality Criteria for Selenium. U.S. EnvironmentalProtection Agency. Washington, D.C. EPA-440/5-80-070.
USEPA. 1980.g. Ambient Water Quality Criteria for Cyanides. U.S. EnvironmentalProtection Agency. Washington, D.C. EPA-440/5-80-037.
USEPA. 1980h. Ambient Water quality criteria for asbestos. U.S. EnvironmentalProtection Agency. Washington, D.C.: EPA-440/5-80-022.
USEPA. 1980i. Support document for proposed rule on friable asbestos-containing materials in school buildings; health effects and magnitudeof exposure. Washington, DC: EPA-560/12-80-003.
C-15

APPENDIX D
GLOSSARY

GLOSSARY
ACID DRAINAGE - drainage from mines and mining wastes that has a pH rangingfrom below 2.0 to 4.5; the acidity is caused by the oxidation ofsulfides exposed during mining, which produces sulfuric acid and sulfatesalts.The acid dissolves minerals in the rocks, further degrading the quality ofthe drainage water.
ACID FORMATION POTENTIAL - the propensity of exposure and subsequent oxidationof naturally occurring metal sulfides (especially iron pyrite) in oresand mining waste to produce acid. An acid environment greatly increasesthe leaching and mobility of toxic waste constituents, including heavymetals.
AMALGAMATION - a method of extracting a precious metal from its ore byalloying it with mercury.
AQUIFER - a water-bearing bed or structure of permeable rock, sand, or gravelcapable of yielding quantities of water to wells or springs.
BACKFILLING - a waste management practice for mining waste in which the wastematerial is immediately used for refilling previously excavated areas.
BELOW-GRADE DISPOSAL - a disposal method for tailings in which the tailingsare placed in an excavated pit so that at closure the entire deposit is belowthe level of the original land surface.
BENEFICIATION - the treatment of ore to concentrate its valuable constituents.
BERM - a ledge or shoulder, as along the edge of a paved road.
BIOLOGICAL ACID LEACHING - a waste pretreatment method that may be a feasiblesubstitute for certain current dump leaching practices. The biologicalacid leaching process converts sulfur in the ore to elemental sulfur,which is potentially saleable and is less hazardous to the environmentthan sulfuric acid, the usual dump leach waste constituent.
BLOCK-CAVING - a large production low-cost method of mining, in which thegreater part of the bottom area of a block of ore is undercut, thesupporting pillars are blasted away, and the ore caves downward and isremoved. As the block caves and settles, the cover follows.
COLLECTION TRENCH - a mitigative system used to prevent seepage from reachingground waters or surface waters. Also effective in protecting theintegrity of a tailings pond dam.
COLLOID - an extremely fine-grained material of particles having diameters ofless than 0.00024 mm that can be easily suspended in solution.
D-1

CONTAINMENT SYSTEMS - a. mitigative measures that prevent leachate fromentering the ground water and posing a threat to human health and theenvironment. These measures include: liners, cutoff walls, interceptorwells, hydraulic barriers, and grouting; b. a type of run-on/runoffcontrol that collects onsite stormwater or dike seepage in holding orevaporation ponds for the treatment necessary for final disposal or toprepare the waste for recycling.
CUT-AND-FILL UNDERGROUND MINING (cut-and-fill stoping) - a mining method inwhich the ore is excavated by making successive flat or inclined slices,working upward from the level. After each slice is blasted down, allbroken ore is removed and the stope is filled with waste to within a fewfeet of the back before the next slice is taken out. During the process,there is just enough room between the top of the waste pile and the backof the stope to provide working space.
CUTOFF WALLS - a mitigative measure employed as a containment system toprevent seepage from contaminating ground water. Walls, collars, orother structures reduce percolation of water along smooth surfaces orthrough porous strata.
DEWATERING - removing water from a mine by pumping or drainage. Water producedfrom mine dewatering may be discharged directly or indirectly to a surfacestream, used in the milling process in make-up water, pumped to a tailingspond, or used on site for dust control, cooling, or drilling fluid.
DIKE STABILIZATION - a mitigative measure that controls liquids. Thestructural integrity of the dike or dikes constructed to confine thewastes is considered, an assessment is made of the ability of the dikesystem to withstand additional loads, including the weight of severallayers of a capping system, and construction equipment is used to placeand compact the final cover.
DIVERSION METHODS - a type of run-on/runoff control that prevents offsitewater from entering a waste management site and causing erosion andflooding.
DREDGING - the various processes by which large floating machines (dredges)scoop up earth material at the bottom of a body of water, raise it tothe surface, and discharge it into a pipeline or barge, return it into apipeline or barge, or return it to the water body after the removal ofore minerals.
DUMP LEACHING - a beneficiation process in which sub-ore-grade material isleached by acid to recover copper. The material to be leached is placeddirectly on the ground and the leaching may continue for years ordecades.
DUMP LEACH WASTE - a large-volume waste that results from the dump leachingprocess.
D-2

ELECTROSTATIC SEPARATION - a process of ore concentration used to separateminerals on the basis of their conductivity. The ore is charged withhigh voltages and the charged particles are dropped onto a conductiverotating drum. The conductive particles discharge rapidly, are thrownoff, and are then collected. The nonconductive particles keep theircharge, adhere to the drum by electrostatic attraction, and are removedseparately.
ELECTROWINNING - recovery of a metal from an ore by means of electrochemicalprocesses.
FINAL COVER - a mitigative measure which, when properly installed over theexposed surfaces of a waste impoundment, ensures control of erosion,fugitive dust, and surface water infiltration; promotes proper drainage;and creates an area that is esthetically pleasing and amenable toalternative level uses.
FRESHWATER INJECTION WELLS (freshwater input wells) - a mitigative measurethat contains seepage, in which freshwater (water with less than 0.2percent salinity) is pumped into wells for pressure maintenance. Used inthe formation of a hydraulic barrier, and most effective underconditions of subsurface homogeneity.
FROTH FLOTATION - often referred to simply as flotation, this process is theseparation of finely crushed minerals from one another by causing some tofloat in a froth and others to sink. Oils and various chemicals are usedto activate, make flotable, or depress the minerals.
GANGUE - the valueless rock or mineral aggregates in an ore, that part of anore that is not economically desirable but cannot be avoided in mining.It is separated from the ore minerals during concentration and isgenerated as tailings.
GEOCHEMICAL PROCESSES - processes that control the rate of movement ofcontaminants from the soluble liquid phase (seepage) to the solid phase(soil, geologic material) of the system.
GRAVITY CONCENTRATION - the separation of minerals by a concentration methodoperating by virtue of the differences in density of various minerals;the greater the difference in density between two minerals, the moreeasily they can be separated by gravity methods.
GROUND WATER - water found underground in porous rock strata and soils.
GROUT CURTAIN - a mitigative system used to prevent ground-watercontamination. Seepage losses are controlled by grouting the foundationrock of a waste disposal facility. Used when waste presents a seriouspollution hazard to groundwater.
HALF-LIFE - the time required for a radioactive substance to lose 50 percentof its activity by decay. Each radionuclide has a unique half-life.
D-3

HAZARDOUS WASTE - a solid waste, or combination of solid wastes, which,because of its quantity, concentration, or physical, chemical, orinfectious characteristics, may (1) cause, or significantly contributeto, an increase in mortality or an increase in serious irreversible, orincapacitating reversible illness; or (2) pose a substantial present orpotential hazard to human health or the environment when improperlytreated, stored, transported, disposed of, or otherwise managed.
HEAP LEACHING - an extraction process in which ore is leached by cyanide torecover gold and silver, or by other reagents to recover uranium. Thematerial to be leached is placed on a pad; the volume of materialleached is smaller than in the dump leaching process. Leaching continuesfor months.
HEAP LEACH WASTE - a large-volume waste generated by the heap leachingprocess.
HYDRAULIC BARRIERS - a mitigative measure used to prevent ground-watercontamination. A barrier used in conjunction with interceptor walls isestablished downgradient of an embankment to prevent seepage lossesthrough the foundation of a waste disposal facility.
HYDRAULIC HEAD - the height of a free surface of a body of water above a givensubsurface point.
HYDROGEOLOGIC EVALUATION - a detection and inspection measure used in combi-nation with ground-water monitoring at a waste disposal or tailings pondfacility to identify potential pathways of leakage and contamination byground water; determine whether contamination of ground-water hasoccurred and, if so, the extent of contamination. If contamination hasoccurred, this evaluation is used to generate data about factors such asthe size, depth, and rate of flow of a contaminated plume to facilitateimplementation of a mitigative strategy.
HYDROLOGIC PROCESSES - geologic phenomena that determine the critical flowpaths and velocities that control the leachate seepage from a wastedisposal area.
INTERCEPTOR WALLS - a mitigative measure used to prevent ground-watercontamination. Interceptor walls installed at points that intersect theplumes of contaminated seepage control seepage losses through thefoundation of a waste disposal facility.
ISOTOPE (nuclide) - any of two or more species of atoms of a chemical elementwith the same atomic number and position in the periodic table and nearlyidentical chemical behavior, but with differing atomic mass or mass numberand different physical properties.
LEACHATE - 1) the beneficiation solution (pregnant liquor)obtained from heap leach and dump leach processes; 2) theliquid resulting from water percolating through, anddissolving materials in, waste.
D-4
LEACHATE COLLECTION, REMOVAL, AND TREATMENT SYSTEMS - mitigative measures usedon lined waste piles to prevent the leachate from building up above theliner. Leachate collection prevents the buildup of water over the linerand thus prevents deformation of piles and overflow of the containmentsystem. Collected waste is treated and disposed of by treatment methodssuch as neutralization, precipitation, and flotation.
LINERS - a mitigative measure used to prevent ground-water contamination inwhich synthetic natural clay, or bentonite materials that are compatiblewith the wastes are used to seal the bottom of tailings ponds and wastepiles.
MAGNETIC SCAVENGING (MAGNETIC SEPARATION) - the separation of magneticmaterials from nonmagnetic materials, using a magnet. Magneticscavenging is an important process in the beneficiation of iron ores inwhich the magnetic mineral is separated from nonmagnetic material; forexample, roasted pyrite from sphalenite.
MILL TAILINGS - the waste rock (gangue) discarded after ore milling. Seetailings.
MINE WASTE - a large-volume waste consisting of the soil or rock generated bymining operations during the process of gaining access to an ore ormineral body. The waste includes the overburden from surface mines,underground mine development rock, and other waste rock.
MINE WASTE PILES - a waste management practice used for mine waste or the areawhere mine waste or spoil materials are disposed of or piled.
MINE WATER - a large-volume waste consisting of the water that infiltrates amine and is subsequently removed to facilitate mining.
MINE WATER PONDS - impoundments used to hold mine water prior to evaporation,recycling, or discharge.
NPDES - National Pollutant Discharge Elimination System, EPA's system of permitsfor controlling the discharge of water pollutants to surface waters.
OPEN-CAST MINING - a surface mining method in which the overburden is removedand minerals are extracted in a series of regular slices called cuts andthe overburden of each subsequent cut is replaced into the void of thepreceding cut. This method is primarily used in the mining of coal.
OPEN-CUT MINING (OPEN-PIT MINING) - a surface mining method involving theremoval of the overburden, and breaking and loading the mineral, ashappens in a stone quarry. This method is primarily used formetalliferous ores such as iron and copper.
D-5

OPEN-STOPE MINING - a method of stoping in which no regular artificial methodof support is employed, although occasional props or cribs may be usedto hold local patches of insecure ground. The walls and roof are self-supporting, and open stopes can be used only where the ore and wallrocks are firm. This method is usually confined to small ore bodiesbecause the length of unsupported span that will stand without breakingis limited.
PLACER MINING - a form of mining in which a gravel deposit containing gold iswashed to extract the gold.
POND-SEDIMENT REMOVAL - a mitigative measure used to remove the sediment thatbuilds up in wastewater retention ponds.
OVERBURDEN - consolidated or unconsolidated material overlying the mined area.
PICOCURIE - a unit of radioactivity defined as 0.037 disintegrations persecond, and abbreviated as pCi.
POTENTIALLY HAZARDOUS WASTES - wastes that have characteristics that may posea threat to human health or the environment.
PRECIPITATION - l) a process of separating mineral constituents from a solutionby means of a reagent; 2) rain, snow, or hail.
QUARRYING - a method of surface mining used for stone or mineral deposits.This method is primarily used for non-metallic materials such aslimestone and building stone.
RCRA - Resource Conservation and Recovery Act, the legislation under which EPAregulates hazardous waste.
RCRA SUBTITLE C CHARACTERISTICS - criteria used to determine if an unlistedwaste is a hazardous waste under Subtitle C of RCRA:
- corrosivity - a solid waste is considered corrosive if it isaqueous and has a pH less than or equal to 2 or greater than or equal to 12.5 orif it is a liquid and corrodes steel at a rate greater than 6.35 mm per year ata test temperature of 66°C
- EP toxicity - a solid waste exhibits the characteristic of EP (extractionprocedure) toxicity if, after extraction by a prescribed EPA method, ityields a metal concentration 100 times the acceptable concentrationlimits set forth in EPA's Primary Drinking Water Standards.
- ignitability - a solid waste exhibits the characteristic of ignitability ifit is a liquid with a flashpoint below 60 degrees C or a non-liquid capable ofcausing fires at standard temperature and pressure.D-6

- reactivity - a waste is considered reactive if it reacts violently, formspotentially explosive mixtures, or generates toxic fumes when mixed withwater, or if it is normally unstable and undergoes violent change withoutdeteriorating.
RADIONUCLIDE (radioisotope) - an unstable isotope of an element that decays ordisintegrates spontaneously, emitting radiation.
RADIUM-226 - a radioactive daughter product of the decay of uranium-238.Radium is present in all uranium-bearing ores; it has a half-life of 1620years.
RETORTING OF OIL SHALE - the heat-dependent distillation process in which oilis extracted from the raw shale.
REVEGETATION - the third step in the final cover procedure of a reclamationand closure system, revegetation is used during the active operation ofthe tailings pond and at closure. Regrading, contouring, andrevegetation of tailings areas prevent erosion, stream turbidity andsedimentation, and provide dust control.
RIP-RAP - a foundation or sustaining wall of stones thrown togetherirregularly.
ROOM-AND-PILLAR MINING - a method of mining used to mine coal and metal, inwhich the roof is supported by pillars left at regular intervals.
RUN-ON/RUNOFF CONTROL - a mitigative measure used to control liquids andinvolving diversion methods and runoff acceleration practices.
RUNOFF ACCELERATION PRACTICES - a type of run-on/runoff control that reducesground-water pollution by preventing the ponding or percolation ofrainfall on wastepiles.
SECURITY SYSTEMS - a mitigative measure used for the security of controlsystems and protection of the public that may include the posting of "NoTrespassing" signs, locked gates, security guards, and fencing.
SEEPAGE COLLECTION SYSTEMS - mitigative measures that control seepage by (1)restricting seepage outflow, or (2) using drainage methods to dischargethe seepage without the danger of piping of material or buildup of ahigh ground-water elevation within the embankment.
SHEEPFOOT ROLLER - an earth compaction machine with a roller of "feet" used tocompact by striking the earth repeatedly.
SLIMES - a material of extremely fine particles encountered in the treatmentof ore. Primary slimes are extremely fine particles derived from ore,associated rock, or clay. They are usually found in old dumps and in oredeposits that have been exposed to climatic action; they include clay,alumina, hydrated iron, near-colloidal common earths, and weatheredfeldspars. Secondary slimes are very finely ground minerals from thetrue ore.
D-7

SLURRY WALLS - a seepage collection/blockage mitigative system. Seepage lossesare controlled by grouting the walls of a waste disposal facility with aslurry compound of cement and water. This system is used when wastepresents a serious pollution hazard to ground water.
SMCRA - Surface Mining Control and Reclamation Act.
SMELTER SLAG - the rough vesicular lavalike waste remaining after theprocessing of ore and minerals.
SOLVENT EXTRACTION - a method of separating one or more substances from amixture, by treating a solution of the mixture with a solvent that willdissolve the required substance or substances, leaving the others.
SQUARE-SET STOPING - a method of stoping in which the walls and back of theexcavation are supported by regular framed timbers forming a skeletonthat encloses a series of connected, hollow, rectangular prisms in thespace formerly occupied by the excavated ore and providing continuouslines of support in three directions. The ore is excavated in small,rectangular blocks just large enough to provide room for standing a setof timber. This method is most applicable in mining deposits in whichthe ore is structurally weak. The primary function of the square sets isto furnish temporary support only for loose fragments of rock and tooffer a passageway to the working face. Permanent support for the stopewalls is supplied by filling the sets with broken waste rock.
STOPE - an excavation where the ore is drilled, blasted, and removed bygravity through chutes to ore cars on the haulage level below. Stopesrequire timbered openings (manways) to provide access for men andmaterials. Raises connect a stope to the level above and are used forventilation, convenience in getting men and materials into the stope,and admitting backfill.
STRIP MINING - mines from which minerals that lie near the surface areextracted using a cutting technique by which long, shallow cuts are made inthe ground after the removal of overburden. These mines are primarily used inthe mining of coal.
SURFACE WATER - water that rests on the surface of the rocky crust of theearth.
SURFACE WATER DIVERSION - this control system consists of canals, channels, orpipes that totally or partially surround a waste management site orleaching operation and divert surface water flow around it and back intothe natural system channel downgradient of the waste area. The mostimportant functions of diversion ditches are to reduce the volume ofwater contacting the waste (run-on) and to minimize downstreamenvironmental damage (runoff).
D-8
TAILINGS - a large-volume waste consisting of the materials remaining afterthe valuable constituents (also termed values) of the ore have beenremoved by physical or chemical beneficiation, including crushing,grinding, sorting, and concentration by a variety of methods.
TAILINGS PONDS - a waste management practice for tailings consisting ofan area closed at the lower end by a constraining wall or dam to whichmill tailings are run. The size and design of the ponds vary widely byindustry segment and location.
TAILINGS SLURRY - the method used to transport tailings from the mill. Theslurry consists of 50 to 70 percent (by weight) liquid mill effluent and30 to 50 percent solids (clay, silt, and sand-sized particles).
THICKENED DISCHARGE - a disposal method for tailings in which the tailingsslurry is partially dewatered and discharged from a single point. Theresult is a gently sloping, cone-shaped deposit.
UMTRCA - Uranium Mill Tailings Radiation Control Act.
UNDERGROUND MINE DEVELOPMENT ROCK - rock removed while sinking shafts oraccessing or exploiting the ore body.
VALUE - the valuable constituents of an ore.
WASTE ROCK - rock that must be broken and disposed of to gain access to andexcavate the ore; valueless rock that must be removed or set asidebefore the milling process.
WASTE STABILIZATION - a mitigative measure used to control liquids; properconsolidation and stabilization of the waste are necessary to ensurelong-term support for the final cover. The first step in stabilizationof tailings is dewatering the wastes. The wastes are then tested todetermine the amount of settlement of the wastes due to compression fromthe final cover system and the construction used in applying the coversystem components.
WASTE UTILIZATION - a current mining waste disposal practice that involves:(1) the extraction of economically valuable amounts of metals orminerals in the waste, and (2) the use of this waste material forproductive purposes.
WASTEWATER TREATMENT - a mitigative measure used to control liquids. Thewastewater that remains onsite after active mining and milling processesis treated and then either discharged or transported to a licenseddisposal site.
U.S. GOVERNMENT PRINTING OFFICE: 1986 618-851/40390
D-9