renewable energy consumption and growth in eurasia
TRANSCRIPT

Energy Economics 32 (2010) 1392–1397
Contents lists available at ScienceDirect
Energy Economics
j ourna l homepage: www.e lsev ie r.com/ locate /eneco
Renewable energy consumption and growth in Eurasia
Nicholas Apergis a, James E. Payne b,⁎a Department of Banking and Financial Management, University of Piraeus, Karaoli and Dimitriou 80, Piraeus, ATTIKI 18534, Greeceb Department of Economics, Illinois State University, Normal, IL 61790-4200, USA
⁎ Corresponding author. Tel.: +1 309 438 5669.E-mail addresses: [email protected] (N. Apergis), je
1 Using data envelopment analysis, Chien and Hu (renewable energy on the technical efficiency of OECD athat increasing the use of renewable energy improefficiency.
2 In this study Eurasia, as defined by the Energy Inform15 countries: Armenia, Azerbaijan, Belarus, Estonia, GeLatvia, Lithuania, Moldova, Russia, Tajikistan, Turkmeni
0140-9883/$ – see front matter © 2010 Elsevier B.V. Adoi:10.1016/j.eneco.2010.06.001
a b s t r a c t
a r t i c l e i n f oArticle history:Received 7 February 2010Received in revised form 2 June 2010Accepted 4 June 2010Available online 10 June 2010
Keywords:Renewable energy consumptionGrowthPanel unit root and cointegration testsGranger-causality
This study examines the causal relationship between renewable energy consumption and economic growthfor 13 countries within Eurasia over the period 1992–2007 within a multivariate panel data framework. Theheterogeneous panel cointegration test reveals a long-run equilibrium relationship exists between real GDP,renewable energy consumption, real gross fixed capital formation, and labor force. The results from the errorcorrection models indicate bidirectional causality between renewable energy consumption and economicgrowth in both the short-run and long-run. Thus, the empirical findings lend support for the feedbackhypothesis of the interdependent relationship between renewable energy consumption and economicgrowth.
3 Country Energy B
[email protected] (J.E. Payne).2007) examine the effects ofnd non-OECD countries to findves an economy's technical
ation Administration, includesorgia, Kazakhstan, Kyrgyzstan,stan, Ukraine, and Uzbekistan.
ll rights reserved.
© 2010 Elsevier B.V. All rights reserved.
1. Introduction
The dependence on fossil fuel consumption has generateddiscussions on the sustainability of the current energy consumptionmix for many countries. An aspect of the current dialogue onsustainability has been the use of alternative energy sources as ameans to mitigate the environmental impact of carbon emissionswhile satisfying the energy needs for economic growth. As a resultresearch on the relationship between renewable energy consumptionand economic growth has emerged in the literature. Studies by Sariand Soytas (2004), Ewing et al. (2007), Sari et al. (2008), Sadorsky(2009), Payne (2009, 2010c), Apergis and Payne (2010b,c), andBowden and Payne (2010), have investigated the causal dynamicsbetween renewable energy consumption and growth for countrieswith varied levels of development.1 However, the results of thesestudies have been mixed.
The task of this study is to extend the research on the causalrelationship between renewable energy consumption and economicgrowth to the case of Eurasia.2 The Eurasia region plays aninstrumental role in world energy markets in regards to oil andnatural gas production and as a transit center for the distribution ofthese energy resources to international markets. A perusal of Table 1
reveals the dominance of Russia in terms of energy consumption inthe region, which is not surprising given that Russia is the world'sthird largest energy consumer.3 In light of the country's sizable oil andnatural gas reserves and production of these energy resources inEurasia, it is also not surprising that close to 90% of Russia's energyconsumption comes from fossil fuels. With the exception of Georgia,Kyrgyzstan, and Tajikistan, approximately 75% or more of theremaining Eurasian countries' energy consumption originates fromfossil fuels. In the case of Georgia, Kyrgyzstan, and Tajikistan,renewable energy consumption (primarily hydroelectric power)serves as the largest energy consumption source. While the currentuse of renewable energy as a percentage of total primary energyconsumption is rather low, an examination of the renewable energy-growth nexus will contribute to the ongoing discussion of the viabilityof renewable energy in the design and implementation of asustainable energy consumption mix for this region.
Specifically, this study parallels Apergis and Payne (2009a, 2010b,c)in the use of a production model to examine the causal relationshipbetween renewable energy consumption and economic growth withthe inclusion ofmeasures for capital and labor as ameans to circumventthe possibility of omitted variable bias (Lütkepohl, 1982). Moreover, inorder to address the reduction in the power and size properties ofconventional unit root and cointegration tests for datawith a short timehorizon, the panel unit root and cointegration approach will provideadditional power in combining the cross−section and time series datawhile allowing for heterogeneity across countries (Pedroni, 1999,2004). In addition, the empirical analysis will be conducted using two
riefs, Energy Information Administration, http://www.eia.doe.gov.

5 Lithuania and Turkmenistan were excluded from the analysis given theunavailability of data on the variables included in the panel data sets for estimation.
6 Real gross fixed capital formation is used as a proxy for capital (see Soytas et al.(2007) and citations therein).
7 Tests of dynamic heterogeneity proposed by Holtz-Eakin et al. (1985) and Holtz-Eakin (1986) were performed. The results, available upon request from the authors,indicate heterogeneity in both the dynamics and error variances across countries.
8 Choi (2001) and Levin et al. (2002) panel unit root tests as well as Hadri (2000)
1393N. Apergis, J.E. Payne / Energy Economics 32 (2010) 1392–1397
panel data sets (with and without Russia included) to determine thesensitivity of the results.
Section 2 briefly discusses the various hypotheses associated withthe energy consumption-growth nexus along with the existingliterature for the countries of Eurasia. Section 3 describes the dataand methodology along with the empirical findings. Section 4provides concluding remarks.
2. Energy consumption-growth hypotheses and theempirical literature
The relationship between energy consumption and economicgrowth can be categorized into four testable hypotheses: growth,conservation, feedback, and neutrality. First, the growth hypothesisasserts that energy consumption affects the growth process bothdirectly and indirectly as a complement to labor and capital inputs.The growth hypothesis is supported if there is unidirectional causalityfrom energy consumption to economic growth. Under the growthhypothesis, energy conservation policies that reduce energy con-sumption may have an adverse impact on economic growth. Second,the conservation hypothesis postulates that energy conservationpolicies designed to reduce energy consumption and waste may nothave an adverse impact on economic growth. The conservationhypothesis is confirmed if there is unidirectional causality fromeconomic growth to energy consumption. Third, the feedbackhypothesis emphasizes the interdependent relationship betweenenergy consumption and economic growth and their complementar-ity. The presence of bidirectional causality between energy consump-tion and economic growth lends support for the feedback hypothesis.Finally, the neutrality hypothesis considers energy consumption to bea small component of an economy's overall output and thus may havelittle or no impact on economic growth. Similar to the conservationhypothesis, energy conservation policies may not have an adverseimpact on economic growth under the neutrality hypothesis. Theneutrality hypothesis is supported by the absence of a causalrelationship between energy consumption and economic growth.4
To date, the empirical literature on the energy consumption-growth nexus with respect to countries of Eurasia has been quitelimited. Reynolds and Kolodzieji (2008) examine the relationshipbetween oil, coal, and natural gas production and GDP in the formerSoviet Union. Using Granger-causality tests within a bivariateframework, Reynolds and Kolodzieji (2008) find unidirectionalcausality from oil production to GDP and unidirectional causalityfrom GDP to coal production and natural gas production, respectively.In an examination of the relationship between energy consumptionand economic growth for 11 Commonwealth of Independent States(CIS) countries using a panel error correction model, Apergis andPayne (2009b) reveal unidirectional causality from energy consump-tion to economic growth in the short-run and bidirectional causalityin the long-run. In a panel study of 15 transition economies (includingBelarus, Estonia, Latvia, Lithuania, Moldova, Russia, and the Ukraine),Acaravci and Ozturk (2010) fail to find a cointegrating relationshipbetween electricity consumption per capita and real GDP per capita. Ina panel study of the relationship between emissions, energyconsumption, and growth for 11 CIS countries, Apergis and Payne(2010a) provide evidence of bidirectional causality between energyconsumption and real output.
3. Data, methodology, and results
Annual data from 1992 to 2007 were obtained from the WorldBank Development Indicators for Armenia, Azerbaijan, Belarus, Estonia,Georgia, Kazakhstan, Kyrgyzstan, Latvia, Moldova, Russia, Tajikistan,
4 Ozturk (2010) and Payne (2010a,b) provide surveys of the energy consumption-growth causality literature.
Ukraine, and Uzbekistan.5 The multivariate panel data frameworkincludes the natural logarithm of real GDP (Y) and real gross fixedcapital formation (K) both in constant 2000 U.S. dollars, the laborforce (L), and renewable energy consumption (RE) defined as totalrenewable electricity net consumption in million of kilowatt hours.6
The analysis begins with panel unit root tests of the respectivevariables. Given the presence of parameter heterogeneity, the Im et al.(IPS, 2003) panel unit root test is employed.7 The Im et al. (2003) panelunit root test allows for heterogeneous autoregressive coefficients andaverages the augmented Dickey-Fuller (ADF) unit root tests whileallowing for different orders of serial correlation, εit=Σj=1
Pi φij εit–j+uit,rendering the following expression8
yit = ρiyit−1 + ∑pij = 1φijεit−j + δiXit + uit ð1Þ
where i=1, ...,N for each country in the panel; t=1, ...,T refers to thetime period; Xit represents the fixed effects or individual time trend; ρiare the autoregressive coefficients; pi represents the number of lags inthe ADF regression; and εit are the stationary error terms. If ρib1, yit isconsidered weakly trend stationary whereas if ρi=1, then yit containsa unit root. The null hypothesis is that each series in the panel containsa unit root. The alternative hypothesis is that at least one of theindividual series in the panel is stationary. Im et al. (2003) specify a t-bar statistics as the average of the individual ADF statistics which isnormally distributed under the null hypothesis with the critical valuesprovided by Im et al. (2003). Table 2 displays the results of the IPSpanel unit root tests for both panel data sets. The panel unit root testsreveal that each variable is integrated of order one.
Given the variables are integrated of order one, the next step is totests for panel cointegration among the variables. The Pedroni (1999,2004) heterogeneous panel cointegration test, which allows for cross-section interdependence with different individual effects, is specifiedas follows:
Yit = αi + δit + β1iREit + β2iKit + β3iLit + εit ð2Þ
where i=1, ...,N for each country in the panel and t=1, ...,T refers tothe time period. The parameters αi and δi allow for the possibility ofcountry-specific fixed effects and deterministic trends, respectively.εit are the estimated residuals representing deviations from the long-run relationship. Since all variables are expressed in naturallogarithms, the β parameters of the model can be interpreted aselasticity estimates.
To test the null hypothesis of no cointegration, ρi=1, the followingunit root test is conducted on the residuals as follows:
εit = ρiεit−1 + wit ð3Þ
Two sets of tests for cointegration are undertaken: panel andgroup mean (Pedroni, 1999, 2004). The panel tests are based on thewithin dimension approach which includes four statistics: panel v,panel ρ, panel PP, and panel ADF-statistics. These statistics pool theautoregressive coefficients across different countries for the unit roottests on the estimated residuals, taking into account common timefactors and heterogeneity across countries. The group tests are basedon the between dimension approach which includes three statistics:
and Carrion-i-Silvestre et al. (2005) panel stationarity tests indicated that therespective variables contain a unit root. Results are available upon request from theauthors.
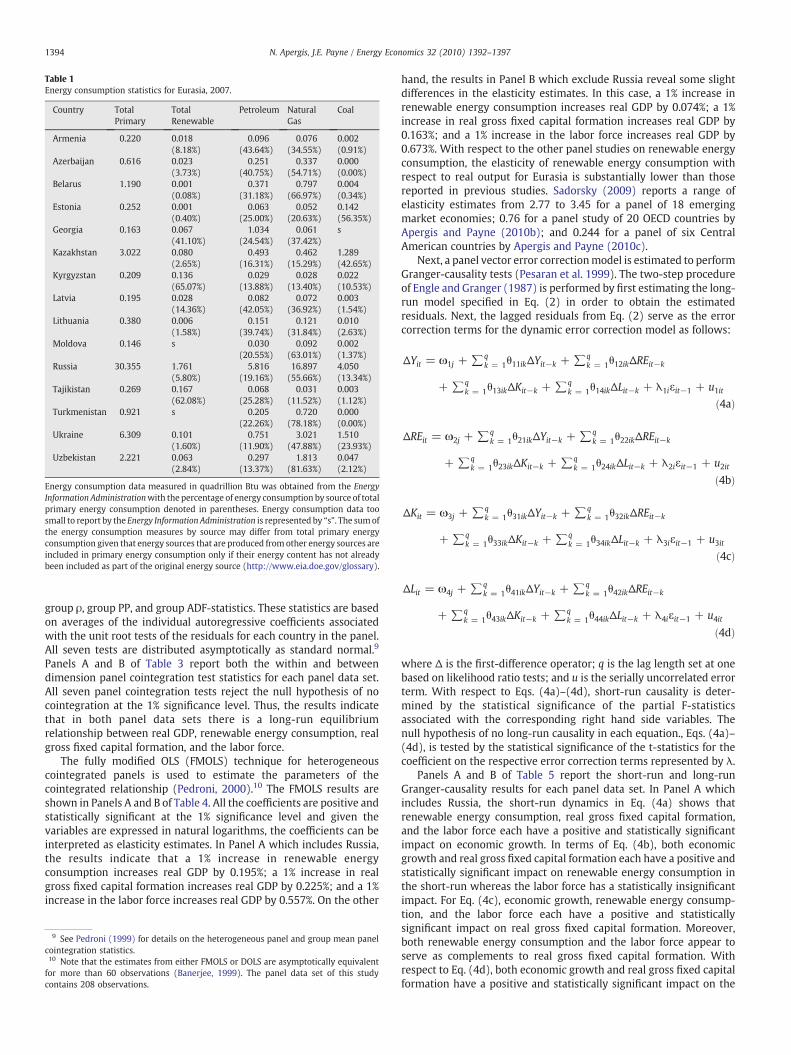
Table 1Energy consumption statistics for Eurasia, 2007.
Country TotalPrimary
TotalRenewable
Petroleum NaturalGas
Coal
Armenia 0.220 0.018 0.096 0.076 0.002(8.18%) (43.64%) (34.55%) (0.91%)
Azerbaijan 0.616 0.023 0.251 0.337 0.000(3.73%) (40.75%) (54.71%) (0.00%)
Belarus 1.190 0.001 0.371 0.797 0.004(0.08%) (31.18%) (66.97%) (0.34%)
Estonia 0.252 0.001 0.063 0.052 0.142(0.40%) (25.00%) (20.63%) (56.35%)
Georgia 0.163 0.067 1.034 0.061 s(41.10%) (24.54%) (37.42%)
Kazakhstan 3.022 0.080 0.493 0.462 1.289(2.65%) (16.31%) (15.29%) (42.65%)
Kyrgyzstan 0.209 0.136 0.029 0.028 0.022(65.07%) (13.88%) (13.40%) (10.53%)
Latvia 0.195 0.028 0.082 0.072 0.003(14.36%) (42.05%) (36.92%) (1.54%)
Lithuania 0.380 0.006 0.151 0.121 0.010(1.58%) (39.74%) (31.84%) (2.63%)
Moldova 0.146 s 0.030 0.092 0.002(20.55%) (63.01%) (1.37%)
Russia 30.355 1.761 5.816 16.897 4.050(5.80%) (19.16%) (55.66%) (13.34%)
Tajikistan 0.269 0.167 0.068 0.031 0.003(62.08%) (25.28%) (11.52%) (1.12%)
Turkmenistan 0.921 s 0.205 0.720 0.000(22.26%) (78.18%) (0.00%)
Ukraine 6.309 0.101 0.751 3.021 1.510(1.60%) (11.90%) (47.88%) (23.93%)
Uzbekistan 2.221 0.063 0.297 1.813 0.047(2.84%) (13.37%) (81.63%) (2.12%)
Energy consumption data measured in quadrillion Btu was obtained from the EnergyInformation Administrationwith the percentage of energy consumption by source of totalprimary energy consumption denoted in parentheses. Energy consumption data toosmall to report by the Energy Information Administration is represented by “s”. The sumofthe energy consumption measures by source may differ from total primary energyconsumption given that energy sources that are produced from other energy sources areincluded in primary energy consumption only if their energy content has not alreadybeen included as part of the original energy source (http://www.eia.doe.gov/glossary).
1394 N. Apergis, J.E. Payne / Energy Economics 32 (2010) 1392–1397
group ρ, group PP, and group ADF-statistics. These statistics are basedon averages of the individual autoregressive coefficients associatedwith the unit root tests of the residuals for each country in the panel.All seven tests are distributed asymptotically as standard normal.9
Panels A and B of Table 3 report both the within and betweendimension panel cointegration test statistics for each panel data set.All seven panel cointegration tests reject the null hypothesis of nocointegration at the 1% significance level. Thus, the results indicatethat in both panel data sets there is a long-run equilibriumrelationship between real GDP, renewable energy consumption, realgross fixed capital formation, and the labor force.
The fully modified OLS (FMOLS) technique for heterogeneouscointegrated panels is used to estimate the parameters of thecointegrated relationship (Pedroni, 2000).10 The FMOLS results areshown in Panels A and B of Table 4. All the coefficients are positive andstatistically significant at the 1% significance level and given thevariables are expressed in natural logarithms, the coefficients can beinterpreted as elasticity estimates. In Panel A which includes Russia,the results indicate that a 1% increase in renewable energyconsumption increases real GDP by 0.195%; a 1% increase in realgross fixed capital formation increases real GDP by 0.225%; and a 1%increase in the labor force increases real GDP by 0.557%. On the other
9 See Pedroni (1999) for details on the heterogeneous panel and group mean panelcointegration statistics.10 Note that the estimates from either FMOLS or DOLS are asymptotically equivalentfor more than 60 observations (Banerjee, 1999). The panel data set of this studycontains 208 observations.
hand, the results in Panel B which exclude Russia reveal some slightdifferences in the elasticity estimates. In this case, a 1% increase inrenewable energy consumption increases real GDP by 0.074%; a 1%increase in real gross fixed capital formation increases real GDP by0.163%; and a 1% increase in the labor force increases real GDP by0.673%. With respect to the other panel studies on renewable energyconsumption, the elasticity of renewable energy consumption withrespect to real output for Eurasia is substantially lower than thosereported in previous studies. Sadorsky (2009) reports a range ofelasticity estimates from 2.77 to 3.45 for a panel of 18 emergingmarket economies; 0.76 for a panel study of 20 OECD countries byApergis and Payne (2010b); and 0.244 for a panel of six CentralAmerican countries by Apergis and Payne (2010c).
Next, a panel vector error correctionmodel is estimated to performGranger-causality tests (Pesaran et al. 1999). The two-step procedureof Engle and Granger (1987) is performed by first estimating the long-run model specified in Eq. (2) in order to obtain the estimatedresiduals. Next, the lagged residuals from Eq. (2) serve as the errorcorrection terms for the dynamic error correction model as follows:
ΔYit = ω1j + ∑qk = 1θ11ikΔYit−k + ∑q
k = 1θ12ikΔREit−k
+ ∑qk = 1θ13ikΔKit−k + ∑q
k = 1θ14ikΔLit−k + λ1iεit−1 + u1it
ð4aÞ
ΔREit = ω2j + ∑qk = 1θ21ikΔYit−k + ∑q
k = 1θ22ikΔREit−k
+ ∑qk = 1θ23ikΔKit−k + ∑q
k = 1θ24ikΔLit−k + λ2iεit−1 + u2it
ð4bÞ
ΔKit = ω3j + ∑qk = 1θ31ikΔYit−k + ∑q
k = 1θ32ikΔREit−k
+ ∑qk = 1θ33ikΔKit−k + ∑q
k = 1θ34ikΔLit−k + λ3iεit−1 + u3it
ð4cÞ
ΔLit = ω4j + ∑qk = 1θ41ikΔYit−k + ∑q
k = 1θ42ikΔREit−k
+ ∑qk = 1θ43ikΔKit−k + ∑q
k = 1θ44ikΔLit−k + λ4iεit−1 + u4it
ð4dÞ
where Δ is the first-difference operator; q is the lag length set at onebased on likelihood ratio tests; and u is the serially uncorrelated errorterm. With respect to Eqs. (4a)–(4d), short-run causality is deter-mined by the statistical significance of the partial F-statisticsassociated with the corresponding right hand side variables. Thenull hypothesis of no long-run causality in each equation., Eqs. (4a)–(4d), is tested by the statistical significance of the t-statistics for thecoefficient on the respective error correction terms represented by λ.
Panels A and B of Table 5 report the short-run and long-runGranger-causality results for each panel data set. In Panel A whichincludes Russia, the short-run dynamics in Eq. (4a) shows thatrenewable energy consumption, real gross fixed capital formation,and the labor force each have a positive and statistically significantimpact on economic growth. In terms of Eq. (4b), both economicgrowth and real gross fixed capital formation each have a positive andstatistically significant impact on renewable energy consumption inthe short-run whereas the labor force has a statistically insignificantimpact. For Eq. (4c), economic growth, renewable energy consump-tion, and the labor force each have a positive and statisticallysignificant impact on real gross fixed capital formation. Moreover,both renewable energy consumption and the labor force appear toserve as complements to real gross fixed capital formation. Withrespect to Eq. (4d), both economic growth and real gross fixed capitalformation have a positive and statistically significant impact on the

Table 3Panel cointegration tests Eurasia, 1992–2007.
Within Dimension Test Statistics Between Dimension Test Statistics
Panel A: Panel Cointegration Test (Russia Included)Panel v-statistics 47.38955a Group ρ-statistics −40.49973a
Panel ρ-statistics −41.67337a Group PP-statistics −44.10184a
Panel PP-statistics −44.84114a Group ADF-statistics −6.84031a
Panel ADF-statistics −6.08092a
Panel B: Panel Cointegration Test (Russia Excluded)Panel v-statistics 40.25547a Group ρ-statistics −38.36558a
Panel ρ-statistics −35.28871a Group PP-statistics −36.26592a
Panel PP-statistics −34.55692a Group ADF-statistics −5.00634a
Panel ADF-statistics −5.30933a
Of the seven tests, the panel v-statistics is a one-sided test where large positive values reject the null hypothesis of no cointegration whereas large negative values for the remainingtest statistics reject the null hypothesis of no cointegration. Critical values at the 1% significance level denoted by “a”: panel v (24.56), panel ρ (−17.60), panel PP (−25.59), panelADF (−2.97), group ρ (−21.12), group PP (−25.59), and group ADF (−3.18).
Table 2IPS panel unit root tests Eurasia, 1992–2007.
Variables Russia Included Russia Excluded
Y −1.18(3) −1.09(3)ΔY −5.53(1)a −5.13(1)a
RE −1.15(3) −0.94(3)ΔRE −6.88(1)a −5.47(2)a
K −1.58(3) −1.22(3)ΔK −6.27(1)a −5.17(1)a
L −1.14(3) −1.02(3)ΔL −5.95(1)a −5.11(2)a
The 1% significance level denoted by “a” (Im et al., 2003): −2.99. Linear trend term included. Numbers in parentheses are the augmented lags included in the unit root test.
1395N. Apergis, J.E. Payne / Energy Economics 32 (2010) 1392–1397
labor force in the short-run while renewable energy consumption isstatistically insignificant.
In Panel B of Table 5, the exclusion of Russia from the panel did notalter the findings reported in Panel A which includes Russia. Thus, theresults reported in both Panels A and B indicate short-run bidirec-tional causality between renewable energy consumption and eco-nomic growth. With respect to the long-run dynamics, the errorcorrection terms shown in Panels A and B reflect the speed ofadjustment towards long-run equilibrium. The error correction termsfor the respective equations in both Panels A and B are statisticallysignificant at the 1% level. Furthermore, the coefficient estimatesreveal similar speeds of adjustment, ranging from 11% to 14% per year.Regardless of whether Russia is included or excluded in the modelestimation, the long-run dynamics suggest there is long-run bidirec-tional causality between renewable energy consumption and eco-nomic growth. Therefore, in both the short-run and long-run thepanel error correction models suggest there is bidirectional causalitywhich provides support for the feedback hypothesis.
Table 4Panel FMOLS long-run estimates Eurasia, 1992–2007.
FMOLS Estimates
Panel A: FMOLS Estimates (Russia Included)Y=0.652
(5.68)a+ 0.195RE(5.92)a
+ 0.225 K(12.47)a
+ 0.557 L(6.07)a
Adj.R2=0.53 LM=1.02[0.56]
Panel B: FMOLS Estimates (Russia Excluded)Y=0.411
(5.21)a+ 0.074RE(5.32)a
+ 0.163 K(8.63)a
+ 0.673 L(6.68)a
Adj.R2=0.44 LM=1.24[0.59]
t-statistics are reported in parentheses and probability values in brackets. LM is the LaGrangheteroskedasticity test. Critical value of the t-distribution is 4.60 at the 1% significance leve
Indeed, the finding of bidirectional causality between renewableenergy consumption and economic growth parallels previous re-search by Sadorsky (2009) for 18 emerging market economies;Apergis and Payne (2010b) for 20 OECD countries; and Apergis andPayne (2010c) for six Central American countries. Given these results,the countries of Eurasia need to continue with both the research anddevelopment of renewable energy technologies as well as facilitatethe adoption of renewable energy in the marketplace in order toenhance the viability of the renewable energy sector. Likewise, theexpansion of the renewable energy sector hinges on economic growthto provide the additional resources for its development.
4. Concluding remarks
The study investigates the causal relationship between renewableenergy consumption and economic growth using panel data for 13Eurasian countries over the period 1992 to 2007. In light of Eurasia'sdependency on fossil fuels and the associated environmental impact,
RESET=1.27 HE=1.37[0.36] [0.39]
RESET=1.61 HE=1.58[0.45] [0.43]
e multiplier test for serial correlation. RESET is the misspecification test. HE is White'sl denoted by “a”.
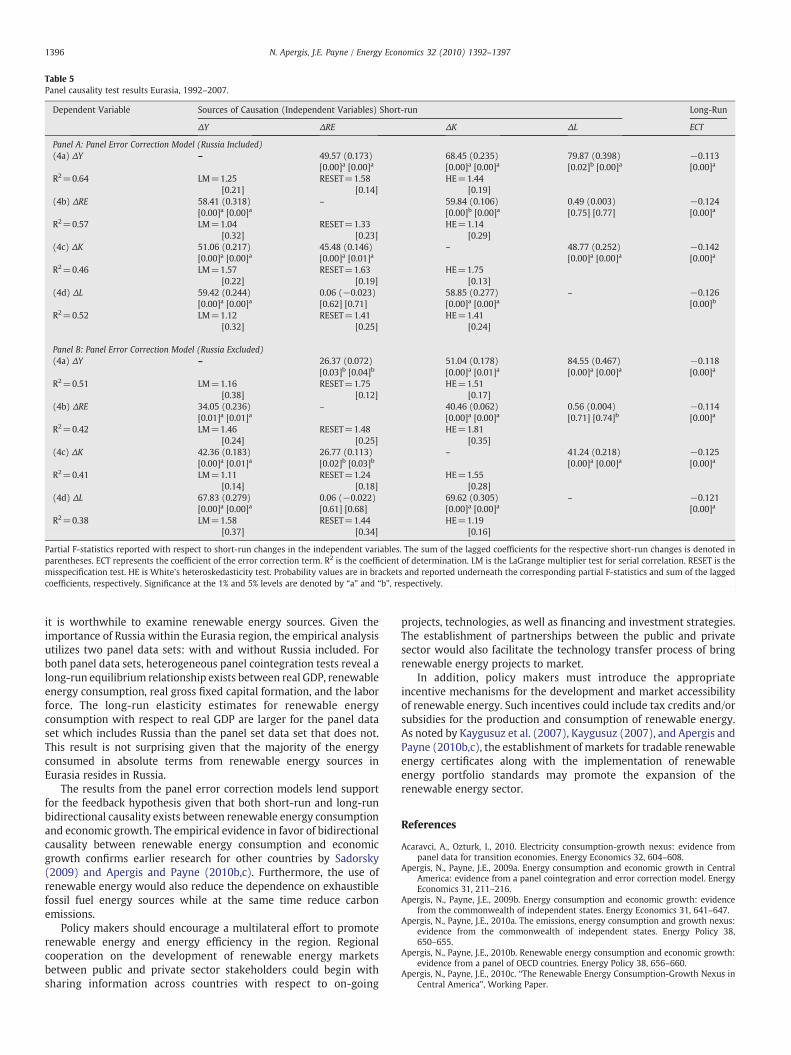
Table 5Panel causality test results Eurasia, 1992–2007.
Dependent Variable Sources of Causation (Independent Variables) Short-run Long-Run
ΔY ΔRE ΔK ΔL ECT
Panel A: Panel Error Correction Model (Russia Included)(4a) ΔY – 49.57 (0.173) 68.45 (0.235) 79.87 (0.398) −0.113
[0.00]a [0.00]a [0.00]a [0.00]a [0.02]b [0.00]a [0.00]a
R2=0.64 LM=1.25 RESET=1.58 HE=1.44[0.21] [0.14] [0.19]
(4b) ΔRE 58.41 (0.318) – 59.84 (0.106) 0.49 (0.003) −0.124[0.00]a [0.00]a [0.00]b [0.00]a [0.75] [0.77] [0.00]a
R2=0.57 LM=1.04 RESET=1.33 HE=1.14[0.32] [0.23] [0.29]
(4c) ΔK 51.06 (0.217) 45.48 (0.146) – 48.77 (0.252) −0.142[0.00]a [0.00]a [0.00]a [0.01]a [0.00]a [0.00]a [0.00]a
R2=0.46 LM=1.57 RESET=1.63 HE=1.75[0.22] [0.19] [0.13]
(4d) ΔL 59.42 (0.244) 0.06 (−0.023) 58.85 (0.277) – −0.126[0.00]a [0.00]a [0.62] [0.71] [0.00]a [0.00]a [0.00]b
R2=0.52 LM=1.12 RESET=1.41 HE=1.41[0.32] [0.25] [0.24]
Panel B: Panel Error Correction Model (Russia Excluded)(4a) ΔY – 26.37 (0.072) 51.04 (0.178) 84.55 (0.467) −0.118
[0.03]b [0.04]b [0.00]a [0.01]a [0.00]a [0.00]a [0.00]a
R2=0.51 LM=1.16 RESET=1.75 HE=1.51[0.38] [0.12] [0.17]
(4b) ΔRE 34.05 (0.236) – 40.46 (0.062) 0.56 (0.004) −0.114[0.01]a [0.01]a [0.00]a [0.00]a [0.71] [0.74]b [0.00]a
R2=0.42 LM=1.46 RESET=1.48 HE=1.81[0.24] [0.25] [0.35]
(4c) ΔK 42.36 (0.183) 26.77 (0.113) – 41.24 (0.218) −0.125[0.00]a [0.01]a [0.02]b [0.03]b [0.00]a [0.00]a [0.00]a
R2=0.41 LM=1.11 RESET=1.24 HE=1.55[0.14] [0.18] [0.28]
(4d) ΔL 67.83 (0.279) 0.06 (−0.022) 69.62 (0.305) – −0.121[0.00]a [0.00]a [0.61] [0.68] [0.00]a [0.00]a [0.00]a
R2=0.38 LM=1.58 RESET=1.44 HE=1.19[0.37] [0.34] [0.16]
Partial F-statistics reported with respect to short-run changes in the independent variables. The sum of the lagged coefficients for the respective short-run changes is denoted inparentheses. ECT represents the coefficient of the error correction term. R2 is the coefficient of determination. LM is the LaGrange multiplier test for serial correlation. RESET is themisspecification test. HE is White's heteroskedasticity test. Probability values are in brackets and reported underneath the corresponding partial F-statistics and sum of the laggedcoefficients, respectively. Significance at the 1% and 5% levels are denoted by “a” and “b”, respectively.
1396 N. Apergis, J.E. Payne / Energy Economics 32 (2010) 1392–1397
it is worthwhile to examine renewable energy sources. Given theimportance of Russia within the Eurasia region, the empirical analysisutilizes two panel data sets: with and without Russia included. Forboth panel data sets, heterogeneous panel cointegration tests reveal along-run equilibrium relationship exists between real GDP, renewableenergy consumption, real gross fixed capital formation, and the laborforce. The long-run elasticity estimates for renewable energyconsumption with respect to real GDP are larger for the panel dataset which includes Russia than the panel set data set that does not.This result is not surprising given that the majority of the energyconsumed in absolute terms from renewable energy sources inEurasia resides in Russia.
The results from the panel error correction models lend supportfor the feedback hypothesis given that both short-run and long-runbidirectional causality exists between renewable energy consumptionand economic growth. The empirical evidence in favor of bidirectionalcausality between renewable energy consumption and economicgrowth confirms earlier research for other countries by Sadorsky(2009) and Apergis and Payne (2010b,c). Furthermore, the use ofrenewable energy would also reduce the dependence on exhaustiblefossil fuel energy sources while at the same time reduce carbonemissions.
Policy makers should encourage a multilateral effort to promoterenewable energy and energy efficiency in the region. Regionalcooperation on the development of renewable energy marketsbetween public and private sector stakeholders could begin withsharing information across countries with respect to on-going
projects, technologies, as well as financing and investment strategies.The establishment of partnerships between the public and privatesector would also facilitate the technology transfer process of bringrenewable energy projects to market.
In addition, policy makers must introduce the appropriateincentive mechanisms for the development and market accessibilityof renewable energy. Such incentives could include tax credits and/orsubsidies for the production and consumption of renewable energy.As noted by Kaygusuz et al. (2007), Kaygusuz (2007), and Apergis andPayne (2010b,c), the establishment of markets for tradable renewableenergy certificates along with the implementation of renewableenergy portfolio standards may promote the expansion of therenewable energy sector.
References
Acaravci, A., Ozturk, I., 2010. Electricity consumption-growth nexus: evidence frompanel data for transition economies. Energy Economics 32, 604–608.
Apergis, N., Payne, J.E., 2009a. Energy consumption and economic growth in CentralAmerica: evidence from a panel cointegration and error correction model. EnergyEconomics 31, 211–216.
Apergis, N., Payne, J.E., 2009b. Energy consumption and economic growth: evidencefrom the commonwealth of independent states. Energy Economics 31, 641–647.
Apergis, N., Payne, J.E., 2010a. The emissions, energy consumption and growth nexus:evidence from the commonwealth of independent states. Energy Policy 38,650–655.
Apergis, N., Payne, J.E., 2010b. Renewable energy consumption and economic growth:evidence from a panel of OECD countries. Energy Policy 38, 656–660.
Apergis, N., Payne, J.E., 2010c. “The Renewable Energy Consumption-Growth Nexus inCentral America”, Working Paper.

1397N. Apergis, J.E. Payne / Energy Economics 32 (2010) 1392–1397
Banerjee, A., 1999. Panel data unit roots and cointegration: an overview. Oxford Bulletinof Economics and Statistics S1 (61), 607–629.
Bowden, N., Payne, J.E., 2010. “Sectoral Analysis of the Causal Relationship betweenRenewable and Non-Renewable Energy Consumption and Real Output in the U.S.”,Energy Sources, Part B: Economics, Planning, and Policy 5 (4), 400–408.
Carrion-i-Silvestre, J.L., del Barrio-Castro, T., Lopez-Bazo, E., 2005. Breaking the panels:an application to GDP per capita. Econometrics Journal 8, 159–175.
Chien, T., Hu, J.-L., 2007. Renewable energy and macroeconomic efficiency of OECD andnon-OECD economies. Energy Policy 35, 3606–3615.
Choi, I., 2001. Unit root tests for panel data. Journal of International Money and Finance20, 249–272.
Engle, R.F., Granger, C.W.J., 1987. Cointegration and error correction: representation,estimation, and testing. Econometrica 55, 251–276.
Ewing, B.T., Sari, R., Soytas, U., 2007. Disaggregate energy consumption and industrialoutput in the United States. Energy Policy 35, 1274–1281.
Hadri, K., 2000. Testing for stationarity in heterogeneous panel data. EconometricJournal 3, 148–161.
Holtz-Eakin, D., 1986. “Testing for Individual Effects in Dynamic Models Using PanelData”, NBER Technical Paper Series, No. 57.
Holtz-Eakin, D., Newey, W., Rosen, H., 1985. “Implementing Causality Tests with PanelData with an Example from Local Public Finance”, NBER Technical Working Paper,No. 48.
Im, K.S., Pesaran, M.H., Shin, Y., 2003. Testing for unit roots in heterogeneous panels.Journal of Econometrics 115, 53–74.
Kaygusuz, K., 2007. Energy for sustainable development: key issues and challenges.Energy Sources, Part B: Economics, Planning, and Policy 2, 73–83.
Kaygusuz, K., Yuksek, O., Sari, A., 2007. Renewable energy sources in the Europeanunion: markets and capacity. Energy Sources, Part B: Economics, Planning, andPolicy 2, 19–29.
Levin, A., Lin, C.F., Chu, C., 2002. Unit root tests in panel data: asymptotic and finite-sample properties. Journal of Econometrics 108, 1–24.
Lütkepohl, H., 1982. Non-causality due to omitted variables. Journal of Econometrics 19,267–378.
Ozturk, I., 2010. A literature survey on energy-growth nexus. Energy Policy 38,340–349.
Payne, J.E., 2009. On the dynamics of energy consumption and output in the U.S.Applied Energy 86, 575–577.
Payne, J.E., 2010a. Survey of the international evidence on the causal relationshipbetween energy consumption and growth. Journal of Economic Studies 37, 53–95.
Payne, J.E., 2010b. A survey of the electricity consumption-growth literature. AppliedEnergy 87, 723–731.
Payne, J.E. (2010c), “On Biomass Energy Consumption and Real Output in the U.S.”,Energy Sources, Part B: Economics, Planning, and Policy, forthcoming.
Pedroni, P., 1999. Critical values for cointegration tests in heterogeneous panels withmultiple regressors. Oxford Bulletin of Economics and Statistics 61, 653–670.
Pedroni, P., 2000. Fully modified OLS for heterogeneous cointegrated panels. Advancedin Econometrics 15, 93–130.
Pedroni, P., 2004. Panel cointegration: asymptotic and finite sample properties ofpooled time series tests with an application to the ppp hypothesis: new results.Econometric Theory 20, 597–627.
Pesaran, H.M., Shin, Y., Smith, R.P., 1999. Pooled mean group estimation of dynamicheterogeneous panels. Journal of the American Statistical Association 94, 621–634.
Reynolds, D.B., Kolodzieji, M., 2008. Former soviet union oil production and GDPdecline: Granger causality and the multi-cycle Hubbert curve. Energy Economics30, 271–289.
Sadorsky, P., 2009. Renewable energy consumption and income in emergingeconomies. Energy Policy 37, 4021–4028.
Sari, R., Soytas, U., 2004. Disaggregate energy consumption, employment, and incomein Turkey. Energy Economics 26, 335–344.
Sari, R., Ewing, B.T., Soytas, U., 2008. The relationship between disaggregate energyconsumption and industrial production in the United States: an ARDL approach.Energy Economics 30, 2302–2313.
Soytas, U., Sari, R., Ewing, B.T., 2007. Energy consumption, income, and carbonemissions in the United States. Ecological Economics 62, 482–489.