energy consumption and renewable energy development ... · sr/cneaf/2000-01 energy consumption and...
TRANSCRIPT
SR/CNEAF/2000-01
Energy Consumption and Renewable EnergyDevelopment Potential on Indian Lands
April 2000
Energy Information AdministrationOffice of Coal, Nuclear, Electric and Alternate Fuels
U.S. Department of EnergyWashington, DC 20585
This report including online maps is available on the Web at:http://www.eia.doe.gov/cneaf/solar.renewables/page/pubs.html
This report was prepared by the Energy Information Administration, the independent statistical andanalytical agency within the U.S. Department of Energy. The information contained herein should beattributed to the Energy Information Administration and should not be construed as advocating or reflectingany policy of the Department of Energy or any other organization.
Energy Information Administration/ Energy Consumption and Renewable Energy Development Potential on Indian Landsii
Contacts
This report was prepared by the staff of the RenewableInformation Team, Coal, Nuclear, and RenewablesDivision, Office of Coal, Nuclear, Electric and AlternateFuels; and the Energy Consumption Division, Office ofEnergy Markets and End Use. General informationregarding this publication may be obtained from FredMayes, Team Leader. (202/426-1166, [email protected]. gov).
Questions regarding specific information in the reportshould be directed as follows:
1. Energy Consumption, Dwight French, 202/586-1126, [email protected]
2. Renewable Energy, Louise Guey-Lee, 202/426-1143,[email protected]
Energy Information Administration/ Energy Consumption and Renewable Energy Development Potential on Indian Lands iii
Preface
In June 1999, the Secretary of the Department of Energy,Bill Richardson, launched the Department’s broad basedIndian Initiative. As part of this initiative, he asked theEnergy Information Administration (EIA) to prepare astudy of energy on Indian lands to include:
� “the electricity use and needs of Indian householdsand tribes,”
� “the comparative electricity rates that Indianhouseholds are paying, and”
� “the potential for renewable resources developmentof Indian lands.”
The EIA prepared this report in response to theSecretary’s request. The report is organized into thefour chapters and four appendices that follow.
Energy Information Administration/ Energy Consumption and Renewable Energy Development Potential on Indian Lands v
ContentsPage
Executive Summary . . . . . . . . . . . . . . . . . . . . . . . . . . . . . . . . . . . . . . . . . . . . . . . . . . . . . . . . . . . . . . . . . . . . . . . . . . . . . ix
1. Introduction . . . . . . . . . . . . . . . . . . . . . . . . . . . . . . . . . . . . . . . . . . . . . . . . . . . . . . . . . . . . . . . . . . . . . . . . . . . . . . . . . . 1
2. Energy Consumption on Indian Lands . . . . . . . . . . . . . . . . . . . . . . . . . . . . . . . . . . . . . . . . . . . . . . . . . . . . . . . . . . 3Retail Electricity Rates Paid by Indians Living on Indian Reservations and TJSAs . . . . . . . . . . . . . . . . . . . . . . 6
3. Potential for Renewable Energy . . . . . . . . . . . . . . . . . . . . . . . . . . . . . . . . . . . . . . . . . . . . . . . . . . . . . . . . . . . . . . . . 11Introduction . . . . . . . . . . . . . . . . . . . . . . . . . . . . . . . . . . . . . . . . . . . . . . . . . . . . . . . . . . . . . . . . . . . . . . . . . . . . . . . 11Renewable Resources on Indian Lands . . . . . . . . . . . . . . . . . . . . . . . . . . . . . . . . . . . . . . . . . . . . . . . . . . . . . . . . . 11Federal and Oklahoma Indian Lands . . . . . . . . . . . . . . . . . . . . . . . . . . . . . . . . . . . . . . . . . . . . . . . . . . . . . . . . . . 11Solar Resources for Flat Plate Collectors . . . . . . . . . . . . . . . . . . . . . . . . . . . . . . . . . . . . . . . . . . . . . . . . . . . . . . . . 11Solar Resources for Concentrating Systems . . . . . . . . . . . . . . . . . . . . . . . . . . . . . . . . . . . . . . . . . . . . . . . . . . . . . 19Wind Resources . . . . . . . . . . . . . . . . . . . . . . . . . . . . . . . . . . . . . . . . . . . . . . . . . . . . . . . . . . . . . . . . . . . . . . . . . . . 20Biomass Resources . . . . . . . . . . . . . . . . . . . . . . . . . . . . . . . . . . . . . . . . . . . . . . . . . . . . . . . . . . . . . . . . . . . . . . . . . 21Geothermal Resources . . . . . . . . . . . . . . . . . . . . . . . . . . . . . . . . . . . . . . . . . . . . . . . . . . . . . . . . . . . . . . . . . . . . . . 21Transmission Lines with Federal and Oklahoma Indian Lands . . . . . . . . . . . . . . . . . . . . . . . . . . . . . . . . . . . . . 22Hydropower . . . . . . . . . . . . . . . . . . . . . . . . . . . . . . . . . . . . . . . . . . . . . . . . . . . . . . . . . . . . . . . . . . . . . . . . . . . . . . 22Renewable Resources and Development Costs for Indian Lands . . . . . . . . . . . . . . . . . . . . . . . . . . . . . . . . . . . . 22Project Criteria . . . . . . . . . . . . . . . . . . . . . . . . . . . . . . . . . . . . . . . . . . . . . . . . . . . . . . . . . . . . . . . . . . . . . . . . . . . . . 33Limitations on Use of Renewable Energy . . . . . . . . . . . . . . . . . . . . . . . . . . . . . . . . . . . . . . . . . . . . . . . . . . . . . . . 37
4. Conclusions . . . . . . . . . . . . . . . . . . . . . . . . . . . . . . . . . . . . . . . . . . . . . . . . . . . . . . . . . . . . . . . . . . . . . . . . . . . . . . . . . 39
Appendices
A. DOE Funded Indian Energy Projects, Fiscal Years 1994 Through 1999 . . . . . . . . . . . . . . . . . . . . . . . . . . . . . 41B. Energy Consumption Detailed Tables . . . . . . . . . . . . . . . . . . . . . . . . . . . . . . . . . . . . . . . . . . . . . . . . . . . . . . . . 45C. Dynamic Maps of Renewable Resource Potential of Indian Lands . . . . . . . . . . . . . . . . . . . . . . . . . . . . . . . . 51D. Map of North American Electric Reliability Council Regions . . . . . . . . . . . . . . . . . . . . . . . . . . . . . . . . . . . . 53
Glossary . . . . . . . . . . . . . . . . . . . . . . . . . . . . . . . . . . . . . . . . . . . . . . . . . . . . . . . . . . . . . . . . . . . . . . . . . . . . . . . . . . . . . . 55
Energy Information Administration/ Energy Consumption and Renewable Energy Development Potential on Indian Landsvi
Tables Page
1. 1998 Residential Average Revenue per Kilowatthour . . . . . . . . . . . . . . . . . . . . . . . . . . . . . . . . . . . . . . . . . . . . . . 9 2. Reservations with the Highest Residential Electricity Prices . . . . . . . . . . . . . . . . . . . . . . . . . . . . . . . . . . . . . . . 10 3. Classes of Wind Power Density at 10 m and 50 m . . . . . . . . . . . . . . . . . . . . . . . . . . . . . . . . . . . . . . . . . . . . . . . . 20 4. Indian Lands with Highest Potential for Central Station Development . . . . . . . . . . . . . . . . . . . . . . . . . . . . . . . 24 5. Renewable Options for Indian Lands with High Incidences of Indian Households without Electricity . . . . . 27 6. Distribution of Indian Lands by Wind Class . . . . . . . . . . . . . . . . . . . . . . . . . . . . . . . . . . . . . . . . . . . . . . . . . . . . 28 7. Distribution of Indian Lands by Biomass Category . . . . . . . . . . . . . . . . . . . . . . . . . . . . . . . . . . . . . . . . . . . . . . . 29 8. States with Indian Lands and State RPS or Public Benefits Funds . . . . . . . . . . . . . . . . . . . . . . . . . . . . . . . . . . . 31 9. Wholesale Electricity Prices, 1998 . . . . . . . . . . . . . . . . . . . . . . . . . . . . . . . . . . . . . . . . . . . . . . . . . . . . . . . . . . . . . 32
B1a. Number and Percent Distribution of Energy Costs of Households for Electricity . . . . . . . . . . . . . . . . . . . . . . 45B1b. Number and Percent Distribution of Energy Costs of Oklahoma TJSA Households for Electricity . . . . . . . . 46B2a. Number and Percent Distribution of Energy Costs of Households for Natural Gas . . . . . . . . . . . . . . . . . . . . 47B2b. Number and Percent Distribution of Energy Costs of Oklahoma TJSA Households for Natural Gas . . . . . . 48B3a. Number and Percent Distribution of Energy Costs of Households for Other Fuels . . . . . . . . . . . . . . . . . . . . . 48B3b. Number and Percent Distribution of Energy Costs of Oklahoma TJSA Households for Other Fuels . . . . . . . 50
Energy Information Administration/ Energy Consumption and Renewable Energy Development Potential on Indian Lands vii
Figures Page
1. Percent Distribution of U.S. and Indian Households by Electricity Access/Payment Status, 1990 . . . . . . . . . . 3 2. Percentiles of Electricity Costs Relative to Total Household Income, for Households That Pay
for Electricity, 1990 . . . . . . . . . . . . . . . . . . . . . . . . . . . . . . . . . . . . . . . . . . . . . . . . . . . . . . . . . . . . . . . . . . . . . . . . . . 4 3. 90th Percentile of Energy Costs Relative to Total Household Income for Households Paying
for the Energy, 1990 . . . . . . . . . . . . . . . . . . . . . . . . . . . . . . . . . . . . . . . . . . . . . . . . . . . . . . . . . . . . . . . . . . . . . . . . . 54. Energy Consumption and Expenditures for Major Energy Sources in All Indian Households, 1997 . . . . . . . . 6
5. Consumption in 1997 Per Household Using Energy Source: All U.S. Households and All Indian Households . . . . . . . . . . . . . . . . . . . . . . . . . . . . . . . . . . . . . . . . . . . . . . . . . . . . . . . . . . . . . . . . . . . . . . 7
6. Expenditures in 1997 Per Household Using Energy Source: All U.S. Households and All Indian Households . . . . . . . . . . . . . . . . . . . . . . . . . . . . . . . . . . . . . . . . . . . . . . . . . . . . . . . . . . . . . . . . . . . . . . 7
7. Electricity and Natural Gas Prices: All U.S. Households and All Indian Households . . . . . . . . . . . . . . . . . . . . 8 8. Distribution of Residential Electricity Rates on Indian Lands . . . . . . . . . . . . . . . . . . . . . . . . . . . . . . . . . . . . . . . 8 9. Number of Non-Municipal Utilities Serving Counties with Indian Lands . . . . . . . . . . . . . . . . . . . . . . . . . . . . 10
10. Federal and Oklahoma Indian Lands . . . . . . . . . . . . . . . . . . . . . . . . . . . . . . . . . . . . . . . . . . . . . . . . . . . . . . . . . . 12 11. Solar Photovoltaic (PV) Resource Potential . . . . . . . . . . . . . . . . . . . . . . . . . . . . . . . . . . . . . . . . . . . . . . . . . . . . . 13 12. Concentrated Solar Power (CSP) Resource Potential . . . . . . . . . . . . . . . . . . . . . . . . . . . . . . . . . . . . . . . . . . . . . . 14 13. Wind Resource Potential . . . . . . . . . . . . . . . . . . . . . . . . . . . . . . . . . . . . . . . . . . . . . . . . . . . . . . . . . . . . . . . . . . . . 15 14. Biomass and Biofuels Resource Potential . . . . . . . . . . . . . . . . . . . . . . . . . . . . . . . . . . . . . . . . . . . . . . . . . . . . . . . 16 15. Geothermal Resource Potential . . . . . . . . . . . . . . . . . . . . . . . . . . . . . . . . . . . . . . . . . . . . . . . . . . . . . . . . . . . . . . . 17 16. Transmission Lines with Federal and Oklahoma Indian Lands . . . . . . . . . . . . . . . . . . . . . . . . . . . . . . . . . . . . . 18 17. Distribution of Wind Development Costs Excluding Transmission Costs . . . . . . . . . . . . . . . . . . . . . . . . . . . . 28 18. Example of Wind Levelized Costs Including Transmission for Northwest Power Region . . . . . . . . . . . . . . . 29 19. Distribution of Biomass Development Costs Excluding Transmission Costs . . . . . . . . . . . . . . . . . . . . . . . . . . 29 20. Distribution of Resources for Concentrated Solar Applications . . . . . . . . . . . . . . . . . . . . . . . . . . . . . . . . . . . . . 30 21. Distribution of Resources for Photovoltaics . . . . . . . . . . . . . . . . . . . . . . . . . . . . . . . . . . . . . . . . . . . . . . . . . . . . . 30 22. Capital Costs of Electric Generating Technologies . . . . . . . . . . . . . . . . . . . . . . . . . . . . . . . . . . . . . . . . . . . . . . . . 37D1. North American Electric Reliability Council Regions for the Contiguous United States,
Alaska and Hawaii . . . . . . . . . . . . . . . . . . . . . . . . . . . . . . . . . . . . . . . . . . . . . . . . . . . . . . . . . . . . . . . . . . . . . . . . . 53
Energy Information Administration/ Energy Consumption and Renewable Energy Development Potential on Indian Lands ix
1 See website http://www.doe.gov/news/releases99/febpr/pr99022.htm for a discussion of the revised Indian energy policy andAppendix A.
2 The Department of Energy (DOE) first developed a policy governing its work with American Indians in 1992. Among other things,the policy stated that, “The Department will identify and seek to remove impediments to working directly and effectively with tribalgovernments on DOE programs.” Further, the policy committed DOE to consider Indian cultural issues in all of its programs.
3 The term “Indian lands” is used to denote Federally Recognized Indian Reservations and TJSAs together.4 Although the 1990 Decennial Census source data allows for the possibility that households incurred no electricity cost simply because
electricity was provided by some other payer, subsequent contacts with Indian affairs experts demonstrated this is not the case.5 The cost premiums also assume there is an existing transmission and distribution system infrastructure for these reservations to use
the power themselves. Otherwise marketing power to off-reservation customers is likely to be the only feasible option, as costs for newdistribution systems to sparsely arrayed reservation households would be quite high.
Executive Summary
Renewable energy projects are considered particularlyappropriate on Indian lands because they are generallyenvironmentally benign and harmonize well withnature, consistent with Indian culture. Accordingly, theDepartment of Energy (DOE) has provided financialsupport each year since 1992 for developing renewableenergy projects on these lands.1 In February 1999,Secretary of Energy Bill Richardson revised andextended DOE’s original 1992 Indian lands policy2
through a $1.8 million solicitation for renewable projects.
A major focus of the current policy is to improve thequality of life on Native American lands throughincreased access to energy. To this end, the Secretary ofEnergy directed the Energy Information Administration(EIA) to undertake a study of the cost and availability ofelectricity to Indian households on Indian lands, as wellas the feasibility of using renewable energy there.Because most tribal lands are remote and sparselypopulated, they are also considered to be good sites fortesting the market potential of dispersed energy sourceslike renewables.
This report examines electricity use, prices, and renew-able energy potential for both Federally RecognizedIndian Reservations, and Tribal Jurisdictional StatisticalAreas (TJSAs) in Oklahoma.3 The principal results are:
� Indian households on reservations are dis-proportionately without electricity. The analysisdetermined that 14.2 percent of Indian householdson reservations had no access to electricity, ascompared to only 1.4 percent of all U.S. house-holds.4
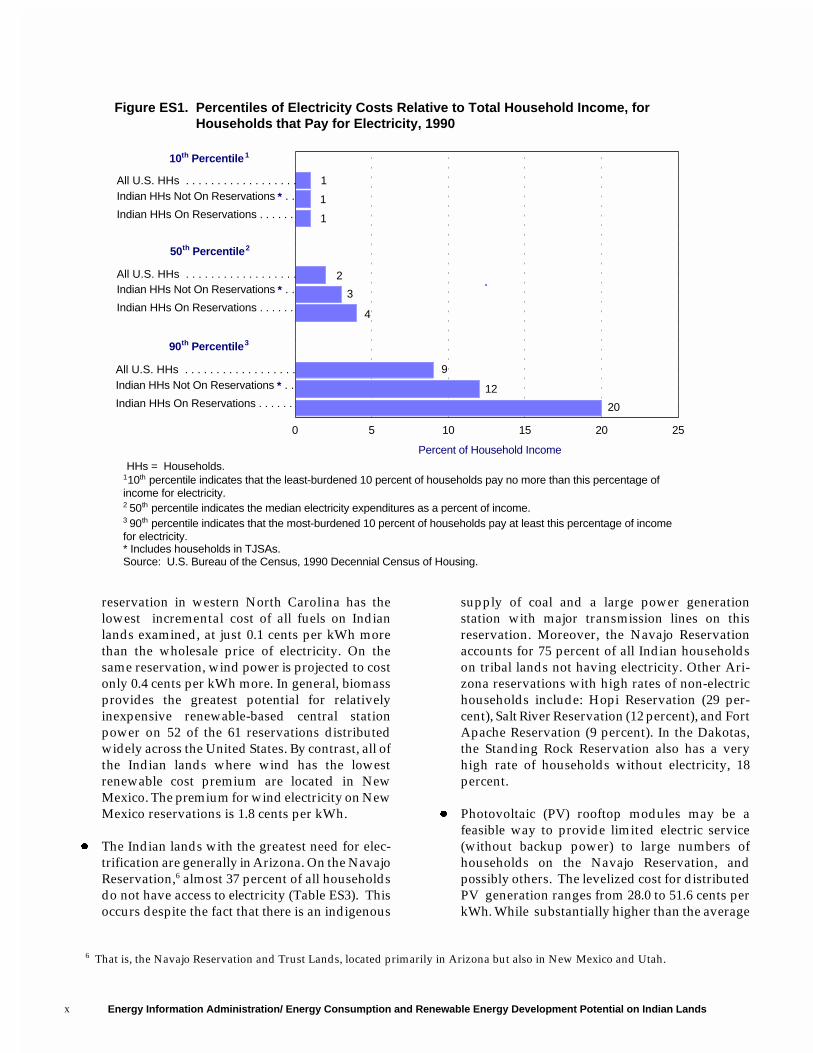
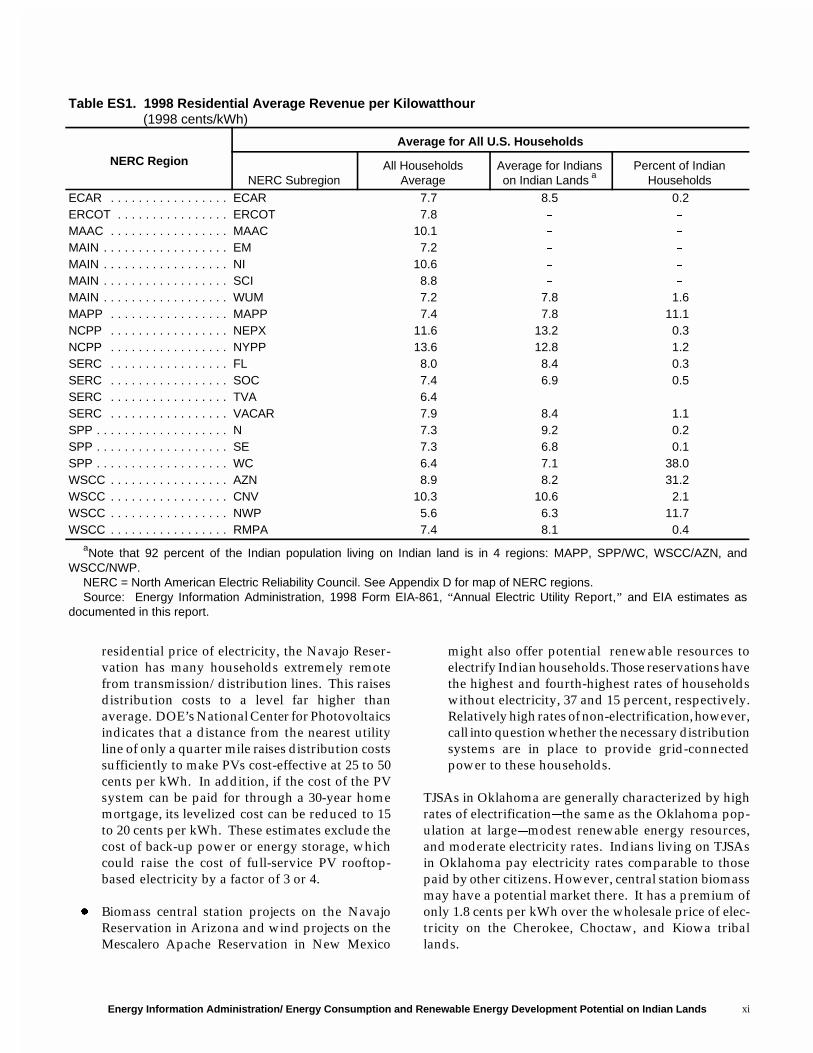
� According to EIA’s Residential Energy Consump-tion Survey (RECS), electricity prices paid byIndian households in 1997 (8.7 cents per kWh)were not statistically different from prices paid byU.S. households as a whole (8.1 cents per kilo-watthour (kWh)). However, Indians living onIndian lands generally pay a greater portion oftheir income for electricity (Figure ES1). Regionaldata on electricity prices for Indian households in1998 were also estimated from an EIA survey ofU.S. electric utilities (Table ES1). Ninety-two per-cent of the 175,000 Indian households on Indianlands are located in just four of the NorthAmerican Electric Reliability Council subregions.Electric utilities servicing counties containingIndian lands in three of those four subregionshave higher rates than all utilities with residentialcustomers in the subregion. From these data, it isimpossible to determine whether the higher costsare due to the cost of service for sparselypopulated rural areas, including Indian lands orother factors.
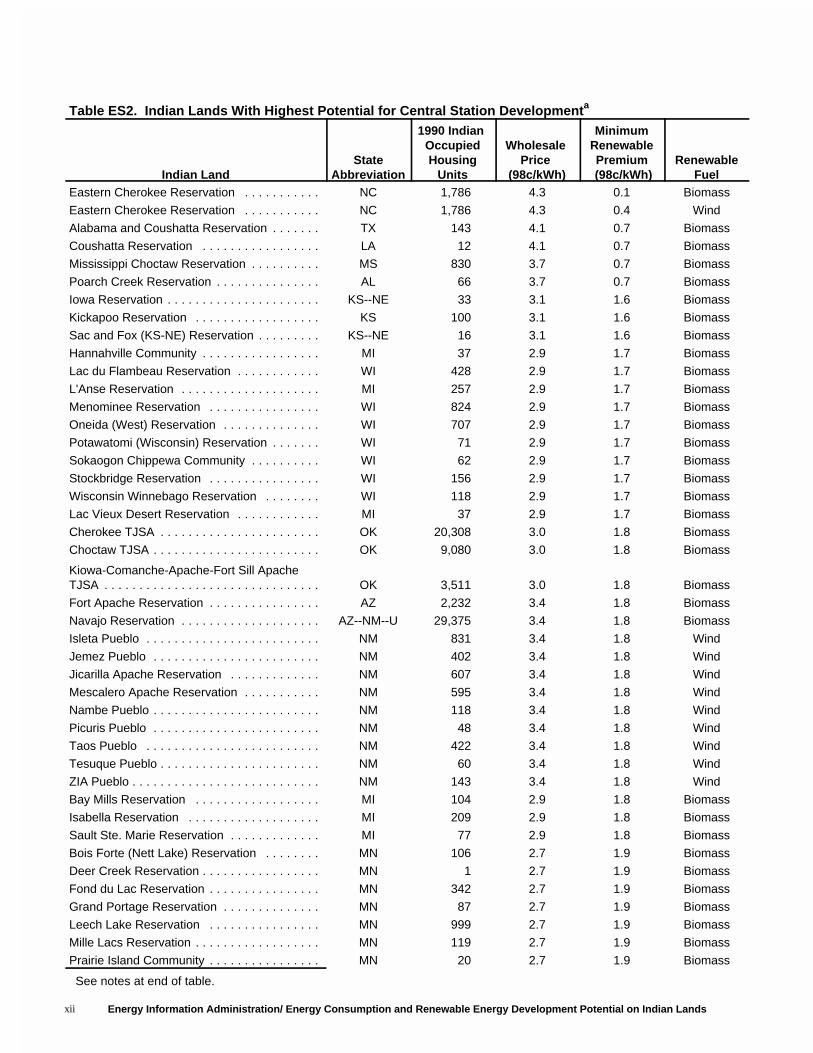
� Some Indian lands appear to have potential forrenewable energy development. Sixty-one reser-vations/TJSAs, having 50 percent of the Indianpopulation on Indian lands, appear to haverenewable resources that might be developed forcentral station generation for a levelized cost ofless than 2 cents per kilowatthour (kWh) aboveregional wholesale prices (Table ES2). These pre-miums exclude any transmission costs required toconnect the plant to the regional transmissiongrid.5 Biomass energy on the Eastern Cherokee
Energy Information Administration/ Energy Consumption and Renewable Energy Development Potential on Indian Landsx
6 That is, the Navajo Reservation and Trust Lands, located primarily in Arizona but also in New Mexico and Utah.
0 5 10 15 20 25
All U.S. HHs . . . . . . . . . . . . . . . . . .
Indian HHs On Reservations . . . . . .
Indian HHs Not On Reservations * . .
10th Percentile1
50th Percentile2
90th Percentile3
All U.S. HHs . . . . . . . . . . . . . . . . . .
Indian HHs On Reservations . . . . . .
Indian HHs Not On Reservations * . .
All U.S. HHs . . . . . . . . . . . . . . . . . .
Indian HHs On Reservations . . . . . .
Indian HHs Not On Reservations * . .
Percent of Household Income
1
1
1
2
3
4
9
12
20
110th percentile indicates that the least-burdened 10 percent of households pay no more than this percentage of income for electricity.2 50th percentile indicates the median electricity expenditures as a percent of income.3 90th percentile indicates that the most-burdened 10 percent of households pay at least this percentage of income for electricity.* Includes households in TJSAs.Source: U.S. Bureau of the Census, 1990 Decennial Census of Housing.
HHs = Households.
Figure ES1. Percentiles of Electricity Costs Relative to Total Household Income, forHouseholds that Pay for Electricity, 1990
reservation in western North Carolina has thelowest incremental cost of all fuels on Indianlands examined, at just 0.1 cents per kWh morethan the wholesale price of electricity. On thesame reservation, wind power is projected to costonly 0.4 cents per kWh more. In general, biomassprovides the greatest potential for relativelyinexpensive renewable-based central stationpower on 52 of the 61 reservations distributedwidely across the United States. By contrast, all ofthe Indian lands where wind has the lowestrenewable cost premium are located in NewMexico. The premium for wind electricity on NewMexico reservations is 1.8 cents per kWh.
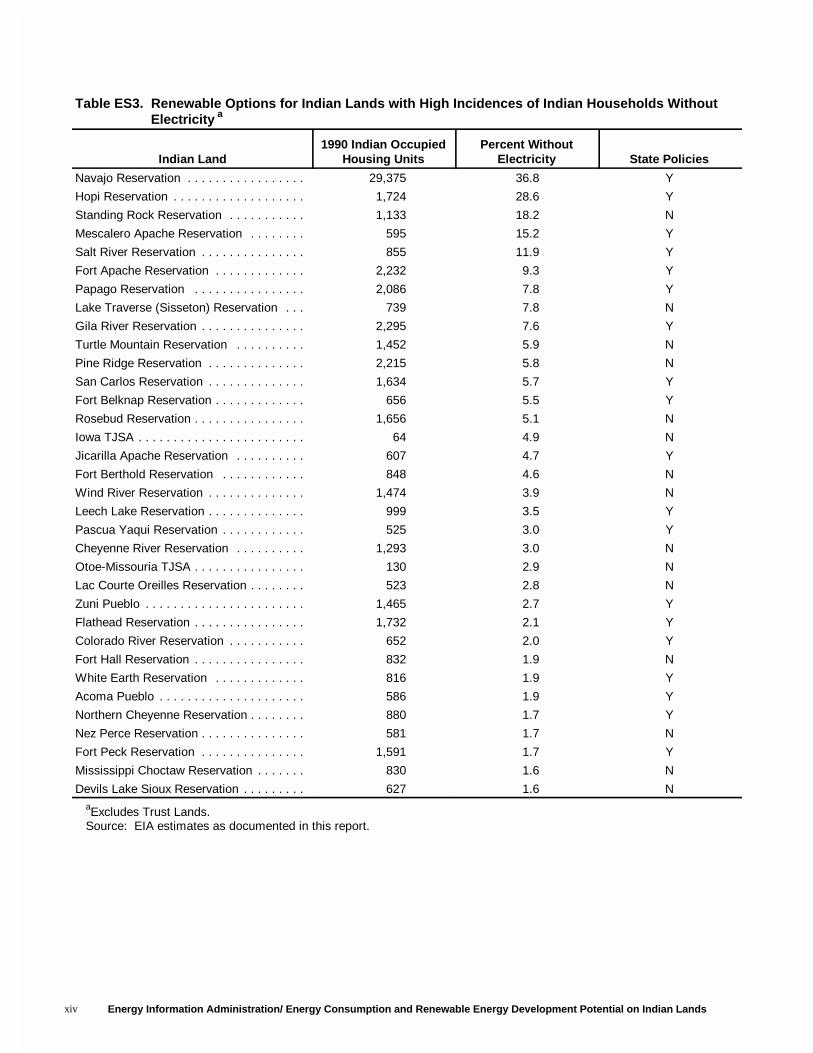
� The Indian lands with the greatest need for elec-trification are generally in Arizona. On the NavajoReservation,6 almost 37 percent of all householdsdo not have access to electricity (Table ES3). Thisoccurs despite the fact that there is an indigenous
supply of coal and a large power generationstation with major transmission lines on thisreservation. Moreover, the Navajo Reservationaccounts for 75 percent of all Indian householdson tribal lands not having electricity. Other Ari-zona reservations with high rates of non-electrichouseholds include: Hopi Reservation (29 per-cent), Salt River Reservation (12 percent), and FortApache Reservation (9 percent). In the Dakotas,the Standing Rock Reservation also has a veryhigh rate of households without electricity, 18percent.
� Photovoltaic (PV) rooftop modules may be afeasible way to provide limited electric service(without backup power) to large numbers ofhouseholds on the Navajo Reservation, andpossibly others. The levelized cost for distributedPV generation ranges from 28.0 to 51.6 cents perkWh. While substantially higher than the average
Energy Information Administration/ Energy Consumption and Renewable Energy Development Potential on Indian Lands xi
Table ES1. 1998 Residential Average Revenue per Kilowatthour(1998 cents/kWh)
NERC Region
Average for All U.S. Households
NERC SubregionAll Households
AverageAverage for Indianson Indian Lands a
Percent of IndianHouseholds
ECAR . . . . . . . . . . . . . . . . . ECAR 7.7 8.5 0.2ERCOT . . . . . . . . . . . . . . . . ERCOT 7.8 % %
MAAC . . . . . . . . . . . . . . . . . MAAC 10.1 % %
MAIN . . . . . . . . . . . . . . . . . . EM 7.2 % %
MAIN . . . . . . . . . . . . . . . . . . NI 10.6 % %
MAIN . . . . . . . . . . . . . . . . . . SCI 8.8 % %
MAIN . . . . . . . . . . . . . . . . . . WUM 7.2 7.8 1.6MAPP . . . . . . . . . . . . . . . . . MAPP 7.4 7.8 11.1NCPP . . . . . . . . . . . . . . . . . NEPX 11.6 13.2 0.3NCPP . . . . . . . . . . . . . . . . . NYPP 13.6 12.8 1.2SERC . . . . . . . . . . . . . . . . . FL 8.0 8.4 0.3SERC . . . . . . . . . . . . . . . . . SOC 7.4 6.9 0.5SERC . . . . . . . . . . . . . . . . . TVA 6.4SERC . . . . . . . . . . . . . . . . . VACAR 7.9 8.4 1.1SPP . . . . . . . . . . . . . . . . . . . N 7.3 9.2 0.2SPP . . . . . . . . . . . . . . . . . . . SE 7.3 6.8 0.1SPP . . . . . . . . . . . . . . . . . . . WC 6.4 7.1 38.0WSCC . . . . . . . . . . . . . . . . . AZN 8.9 8.2 31.2WSCC . . . . . . . . . . . . . . . . . CNV 10.3 10.6 2.1WSCC . . . . . . . . . . . . . . . . . NWP 5.6 6.3 11.7WSCC . . . . . . . . . . . . . . . . . RMPA 7.4 8.1 0.4
aNote that 92 percent of the Indian population living on Indian land is in 4 regions: MAPP, SPP/WC, WSCC/AZN, andWSCC/NWP.
NERC = North American Electric Reliability Council. See Appendix D for map of NERC regions.Source: Energy Information Administration, 1998 Form EIA-861, “Annual Electric Utility Report,” and EIA estimates as
documented in this report.
residential price of electricity, the Navajo Reser-vation has many households extremely remotefrom transmission/distribution lines. This raisesdistribution costs to a level far higher thanaverage. DOE’s National Center for Photovoltaicsindicates that a distance from the nearest utilityline of only a quarter mile raises distribution costssufficiently to make PVs cost-effective at 25 to 50cents per kWh. In addition, if the cost of the PVsystem can be paid for through a 30-year homemortgage, its levelized cost can be reduced to 15to 20 cents per kWh. These estimates exclude thecost of back-up power or energy storage, whichcould raise the cost of full-service PV rooftop-based electricity by a factor of 3 or 4.
� Biomass central station projects on the NavajoReservation in Arizona and wind projects on theMescalero Apache Reservation in New Mexico
might also offer potential renewable resources toelectrify Indian households. Those reservations havethe highest and fourth-highest rates of householdswithout electricity, 37 and 15 percent, respectively.Relatively high rates of non-electrification, however,call into question whether the necessary distributionsystems are in place to provide grid-connectedpower to these households.
TJSAs in Oklahoma are generally characterized by highrates of electrification&the same as the Oklahoma pop-ulation at large&modest renewable energy resources,and moderate electricity rates. Indians living on TJSAsin Oklahoma pay electricity rates comparable to thosepaid by other citizens. However, central station biomassmay have a potential market there. It has a premium ofonly 1.8 cents per kWh over the wholesale price of elec-tricity on the Cherokee, Choctaw, and Kiowa triballands.
Energy Information Administration/ Energy Consumption and Renewable Energy Development Potential on Indian Landsxii
Table ES2. Indian Lands With Highest Potential for Central Station Developmenta
Indian LandState
Abbreviation
1990 Indian OccupiedHousing
Units
Wholesale Price
(98c/kWh)
MinimumRenewablePremium
(98c/kWh)Renewable
FuelEastern Cherokee Reservation . . . . . . . . . . . NC 1,786 4.3 0.1 Biomass
Eastern Cherokee Reservation . . . . . . . . . . . NC 1,786 4.3 0.4 Wind
Alabama and Coushatta Reservation . . . . . . . TX 143 4.1 0.7 Biomass
Coushatta Reservation . . . . . . . . . . . . . . . . . LA 12 4.1 0.7 Biomass
Mississippi Choctaw Reservation . . . . . . . . . . MS 830 3.7 0.7 Biomass
Poarch Creek Reservation . . . . . . . . . . . . . . . AL 66 3.7 0.7 Biomass
Iowa Reservation . . . . . . . . . . . . . . . . . . . . . . KS--NE 33 3.1 1.6 Biomass
Kickapoo Reservation . . . . . . . . . . . . . . . . . . KS 100 3.1 1.6 Biomass
Sac and Fox (KS-NE) Reservation . . . . . . . . . KS--NE 16 3.1 1.6 Biomass
Hannahville Community . . . . . . . . . . . . . . . . . MI 37 2.9 1.7 Biomass
Lac du Flambeau Reservation . . . . . . . . . . . . WI 428 2.9 1.7 Biomass
L'Anse Reservation . . . . . . . . . . . . . . . . . . . . MI 257 2.9 1.7 Biomass
Menominee Reservation . . . . . . . . . . . . . . . . WI 824 2.9 1.7 Biomass
Oneida (West) Reservation . . . . . . . . . . . . . . WI 707 2.9 1.7 Biomass
Potawatomi (Wisconsin) Reservation . . . . . . . WI 71 2.9 1.7 Biomass
Sokaogon Chippewa Community . . . . . . . . . . WI 62 2.9 1.7 Biomass
Stockbridge Reservation . . . . . . . . . . . . . . . . WI 156 2.9 1.7 Biomass
Wisconsin Winnebago Reservation . . . . . . . . WI 118 2.9 1.7 Biomass
Lac Vieux Desert Reservation . . . . . . . . . . . . MI 37 2.9 1.7 Biomass
Cherokee TJSA . . . . . . . . . . . . . . . . . . . . . . . OK 20,308 3.0 1.8 Biomass
Choctaw TJSA . . . . . . . . . . . . . . . . . . . . . . . . OK 9,080 3.0 1.8 Biomass
Kiowa-Comanche-Apache-Fort Sill ApacheTJSA . . . . . . . . . . . . . . . . . . . . . . . . . . . . . . . OK 3,511 3.0 1.8 Biomass
Fort Apache Reservation . . . . . . . . . . . . . . . . AZ 2,232 3.4 1.8 Biomass
Navajo Reservation . . . . . . . . . . . . . . . . . . . . AZ--NM--U 29,375 3.4 1.8 Biomass
Isleta Pueblo . . . . . . . . . . . . . . . . . . . . . . . . . NM 831 3.4 1.8 Wind
Jemez Pueblo . . . . . . . . . . . . . . . . . . . . . . . . NM 402 3.4 1.8 Wind
Jicarilla Apache Reservation . . . . . . . . . . . . . NM 607 3.4 1.8 Wind
Mescalero Apache Reservation . . . . . . . . . . . NM 595 3.4 1.8 Wind
Nambe Pueblo . . . . . . . . . . . . . . . . . . . . . . . . NM 118 3.4 1.8 Wind
Picuris Pueblo . . . . . . . . . . . . . . . . . . . . . . . . NM 48 3.4 1.8 Wind
Taos Pueblo . . . . . . . . . . . . . . . . . . . . . . . . . NM 422 3.4 1.8 Wind
Tesuque Pueblo . . . . . . . . . . . . . . . . . . . . . . . NM 60 3.4 1.8 Wind
ZIA Pueblo . . . . . . . . . . . . . . . . . . . . . . . . . . . NM 143 3.4 1.8 Wind
Bay Mills Reservation . . . . . . . . . . . . . . . . . . MI 104 2.9 1.8 Biomass
Isabella Reservation . . . . . . . . . . . . . . . . . . . MI 209 2.9 1.8 Biomass
Sault Ste. Marie Reservation . . . . . . . . . . . . . MI 77 2.9 1.8 Biomass
Bois Forte (Nett Lake) Reservation . . . . . . . . MN 106 2.7 1.9 Biomass
Deer Creek Reservation . . . . . . . . . . . . . . . . . MN 1 2.7 1.9 Biomass
Fond du Lac Reservation . . . . . . . . . . . . . . . . MN 342 2.7 1.9 Biomass
Grand Portage Reservation . . . . . . . . . . . . . . MN 87 2.7 1.9 Biomass
Leech Lake Reservation . . . . . . . . . . . . . . . . MN 999 2.7 1.9 Biomass
Mille Lacs Reservation . . . . . . . . . . . . . . . . . . MN 119 2.7 1.9 Biomass
Prairie Island Community . . . . . . . . . . . . . . . . MN 20 2.7 1.9 Biomass
See notes at end of table.
Energy Information Administration/ Energy Consumption and Renewable Energy Development Potential on Indian Lands xiii
7 This is a levelized cost. The actual REPI incentive is 1.5 cents per kWh.8 The Administration’s “Comprehensive Electricity Competition Plan” proposal, submitted September 17, 1999, is available on the
internet at: http://home.doe.gov/policy/ceca.htm.
Table ES2. Indian Lands With Highest Potential for Central Station Development a (Continued)
Indian LandState
Abbreviation
1990 Indian
Occupied Housing
Units
Wholesale Price
(98c/kWh)
MinimumRenewablePremium
(98c/kWh)Renewable
FuelRed Lake Reservation . . . . . . . . . . . . . . . . . . MN 928 2.7 1.9 Biomass
Vermillion Lake Reservation . . . . . . . . . . . . . . MN 27 2.7 1.9 Biomass
White Earth Reservation . . . . . . . . . . . . . . . . MN 816 2.7 1.9 Biomass
Omaha Reservation . . . . . . . . . . . . . . . . . . . . IA--NE 429 2.7 1.9 Biomass
Sac and Fox (Iowa) Reservation . . . . . . . . . . IA 135 2.7 1.9 Biomass
Bad River Reservation . . . . . . . . . . . . . . . . . . WI 285 2.7 1.9 Biomass
Crow Creek Reservation . . . . . . . . . . . . . . . . SD 352 2.7 1.9 Biomass
Devils Lake Sioux Reservation . . . . . . . . . . . . ND 627 2.7 1.9 Biomass
Flandreau Reservation . . . . . . . . . . . . . . . . . . SD 78 2.7 1.9 Biomass
Fort Berthold Reservation . . . . . . . . . . . . . . . ND 848 2.7 1.9 Biomass
Lac Courte Oreilles Reservation . . . . . . . . . . . WI 523 2.7 1.9 Biomass
Lake Traverse (Sisseton) Reservation . . . . . . ND--SD 739 2.7 1.9 Biomass
Lower Brule Reservation . . . . . . . . . . . . . . . . SD 237 2.7 1.9 Biomass
Biomass Red Cliff Reservation . . . . . . . . . . . . WI 216 2.7 1.9 Biomass
St. Croix Reservation . . . . . . . . . . . . . . . . . . . WI 138 2.7 1.9 Biomass
Santee Reservation . . . . . . . . . . . . . . . . . . . . NE 140 2.7 1.9 Biomass
Turtle Mountain Reservation . . . . . . . . . . . . . ND--SD 1,452 2.7 1.9 Biomass
Winnebago Reservation . . . . . . . . . . . . . . . . . NE 311 2.7 1.9 Biomass
Yankton Reservation . . . . . . . . . . . . . . . . . . . SD 490 2.7 1.9 Biomass
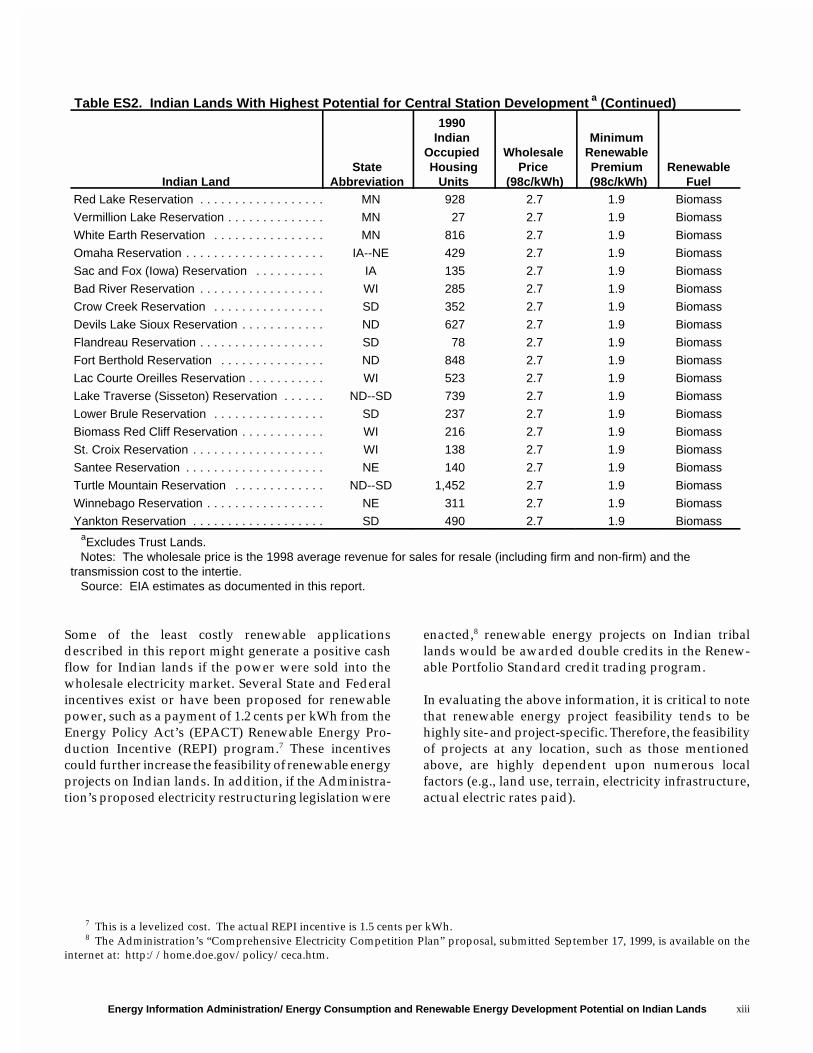
aExcludes Trust Lands. Notes: The wholesale price is the 1998 average revenue for sales for resale (including firm and non-firm) and thetransmission cost to the intertie. Source: EIA estimates as documented in this report.
Some of the least costly renewable applicationsdescribed in this report might generate a positive cashflow for Indian lands if the power were sold into thewholesale electricity market. Several State and Federalincentives exist or have been proposed for renewablepower, such as a payment of 1.2 cents per kWh from theEnergy Policy Act’s (EPACT) Renewable Energy Pro-duction Incentive (REPI) program.7 These incentivescould further increase the feasibility of renewable energyprojects on Indian lands. In addition, if the Administra-tion’s proposed electricity restructuring legislation were
enacted,8 renewable energy projects on Indian triballands would be awarded double credits in the Renew-able Portfolio Standard credit trading program.
In evaluating the above information, it is critical to notethat renewable energy project feasibility tends to behighly site- and project-specific. Therefore, the feasibilityof projects at any location, such as those mentionedabove, are highly dependent upon numerous localfactors (e.g., land use, terrain, electricity infrastructure,actual electric rates paid).
Energy Information Administration/ Energy Consumption and Renewable Energy Development Potential on Indian Landsxiv
Table ES3. Renewable Options for Indian Lands with High Incidences of Indian Households WithoutElectricity a
Indian Land1990 Indian Occupied
Housing UnitsPercent Without
Electricity State Policies
Navajo Reservation . . . . . . . . . . . . . . . . . 29,375 36.8 Y
Hopi Reservation . . . . . . . . . . . . . . . . . . . 1,724 28.6 Y
Standing Rock Reservation . . . . . . . . . . . 1,133 18.2 N
Mescalero Apache Reservation . . . . . . . . 595 15.2 Y
Salt River Reservation . . . . . . . . . . . . . . . 855 11.9 Y
Fort Apache Reservation . . . . . . . . . . . . . 2,232 9.3 Y
Papago Reservation . . . . . . . . . . . . . . . . 2,086 7.8 Y
Lake Traverse (Sisseton) Reservation . . . 739 7.8 N
Gila River Reservation . . . . . . . . . . . . . . . 2,295 7.6 Y
Turtle Mountain Reservation . . . . . . . . . . 1,452 5.9 N
Pine Ridge Reservation . . . . . . . . . . . . . . 2,215 5.8 N
San Carlos Reservation . . . . . . . . . . . . . . 1,634 5.7 Y
Fort Belknap Reservation . . . . . . . . . . . . . 656 5.5 Y
Rosebud Reservation . . . . . . . . . . . . . . . . 1,656 5.1 N
Iowa TJSA . . . . . . . . . . . . . . . . . . . . . . . . 64 4.9 N
Jicarilla Apache Reservation . . . . . . . . . . 607 4.7 Y
Fort Berthold Reservation . . . . . . . . . . . . 848 4.6 N
Wind River Reservation . . . . . . . . . . . . . . 1,474 3.9 N
Leech Lake Reservation . . . . . . . . . . . . . . 999 3.5 Y
Pascua Yaqui Reservation . . . . . . . . . . . . 525 3.0 Y
Cheyenne River Reservation . . . . . . . . . . 1,293 3.0 N
Otoe-Missouria TJSA . . . . . . . . . . . . . . . . 130 2.9 N
Lac Courte Oreilles Reservation . . . . . . . . 523 2.8 N
Zuni Pueblo . . . . . . . . . . . . . . . . . . . . . . . 1,465 2.7 Y
Flathead Reservation . . . . . . . . . . . . . . . . 1,732 2.1 Y
Colorado River Reservation . . . . . . . . . . . 652 2.0 Y
Fort Hall Reservation . . . . . . . . . . . . . . . . 832 1.9 N
White Earth Reservation . . . . . . . . . . . . . 816 1.9 Y
Acoma Pueblo . . . . . . . . . . . . . . . . . . . . . 586 1.9 Y
Northern Cheyenne Reservation . . . . . . . . 880 1.7 Y
Nez Perce Reservation . . . . . . . . . . . . . . . 581 1.7 N
Fort Peck Reservation . . . . . . . . . . . . . . . 1,591 1.7 Y
Mississippi Choctaw Reservation . . . . . . . 830 1.6 N
Devils Lake Sioux Reservation . . . . . . . . . 627 1.6 N
aExcludes Trust Lands. Source: EIA estimates as documented in this report.
Energy Information Administration/ Energy Consumption and Renewable Energy Development Potential on Indian Lands 1
1 The terms “Indian lands” and “Indian tribal lands” in this report refer to Federally Recognized Indian Reservations in the 48contiguous States and Tribal Jurisdictional Statistical Areas in Oklahoma. Thus, Federal reservations in Alaska and Hawaii, as well as StateIndian lands, are excluded.
2 The historical wholesale price includes the cost of transmission to the intertie.
1. Introduction
Household energy availability and use on Indian lands1
is significantly below that of non-Indian households. Infact, sizable Indian populations have no access toelectricity at all. This perpetuates a low standard ofliving, as energy supply and economic well-being areclosely linked. Consequently, the Secretary of Energyrequested this report to quantify the electricity andrenewable energy situations on Indian lands and discussthe potential for using renewable energy there. One goalof the study is to provide a sound basis for Congress todecide how best to appropriate funds to provide Indianhouseholds with electricity in an environmentally benignand economically efficient fashion, so that they canadvance and enjoy the same prosperity that otherAmericans do.
The biggest challenge in conducting this study wasobtaining the necessary data. While EIA collects exten-sive data on U.S. energy supply and consumptionpatterns, only a small amount of information is relatedto ethnic groups. Since current EIA data have proveninadequate, EIA has turned to older studies (e.g., energyconsumption), or has approximated the necessaryinformation (e.g., energy prices).
Chapter 2 discusses Indian household electrification,prices Indians paid for energy compared to the U.S.population as a whole, and other related issues. Here,EIA used the 1990 Decennial Census of Population andHousing and EIA’s 1997 Residential Energy Consump-tion Survey. While these data are slightly dated andbased on only representative samples of the population,they recognize ethnicity and thus provide insightunavailable elsewhere. EIA was able to approximatecurrent information on electricity rates for Indian landhouseholds from its electric power data surveys.
Renewable resources are an excellent source of clean,sustainable energy. Chapter 3 analyzes the potential fordeveloping these resources to solve the Indians’problems of electrification and self sufficiency (in energy
supply), as well as addresses the possible marketing ofpower on and off Indian lands. Renewable resourcesfor this study include solar, wind, biomass, geothermal,and hydropower.
In order to assess which Indian lands have what renew-able resources, a series of composite maps is presentedin Chapter 3&one for each energy source except hydro-electric power and an additional one for the electricpower transmission grid. Some forms of renewableenergy, such as solar/photovoltaic, small wind, geo-thermal heat pumps, and wood seem to be candidatesfor use in dispersed applications. Large-scale wind andsolar, high-heat geothermal, and biomass are more likelyfor central station applications. An economic assess-ment of renewable-based electricity is presented forselected tribal lands having a high incidence of house-holds without electricity and, alternatively, for selectedlands with comparatively favorable opportunities fordeveloping central station power to be marketed on andoff Indian lands.
To conduct this assessment, certain estimates or datawere required for each Indian land:
� The average residential price for electricity in thearea, including and surrounding each Indian land.For households off the grid and without elec-tricity, this gives an indication of the price theywould pay if connected, in addition to thepotential cost of extending the transmission anddistribution system.
� The wholesale price of electricity for the areasurrounding each Indian land.2 This is used toapproximate the revenue the Indians mightreceive for electricity produced by them andmarketed off Indian lands.
� The cost of developing renewable electricitybased on historical costs used in the EIA’s

Energy Information Administration/ Energy Consumption and Renewable Energy Development Potential on Indian Lands2
3 A considerable amount of the electricity sold into Indian lands comes from hydroelectric power sold by the Western Area PowerAdministration and the Bonneville Power Administration.
Energy Modeling System. The lower the costs com-pared to wholesale prices, the better the prospectsare for renewable resource development. Unfor-tunately, this combination rarely occurs in practice.In the West, where most Indian lands with goodrenewable resources are located, the wholesale priceof electricity is lower than in the rest of the UnitedStates,3 thus leading to poor comparative economicsfor renewable energy.
Chapter 3 also presents an analysis of factors (e.g.project criteria) that influence the economic and tech-nical feasibility of renewable projects. Areas to beassessed include revenue flows, demand planning,
indirect costs/benefits, infrastructure, financial con-dition, and project assessment. The chapter concludeswith a discussion of limitations on renewable energydevelopment.
Finally, Chapter 4 presents the results of the study.Appendix A lists DOE-funded Indian Energy Projectsfrom FY1994 through FY1999. The tables in Appendix Bdetail energy consumption. Appendix C contains infor-mation about accessing dynamic maps of renewableresource potential on Indian lands. Appendix D presentsa map of North American Electric Reliability Council(NERC) regions. A Glossary is also included.
Energy Information Administration/ Energy Consumption and Renewable Energy Development Potential on Indian Lands 3
Source: U.S. Bureau of the Census, 1990 Decennial Census of Housing.
0% 20% 40% 60% 80% 100%
All U.S. Households
Indian Households not on Indian Lands
Indian Households in TJSAs
Indian Households on Reservations
Paying for Electricity
Electricity Costs Included in Rent
No Cost/No Access to Electricity
94.1
90.9
96.6
82.6
3.0
3.3
6.3
4.4 1.4
2.7
1.0
14.2
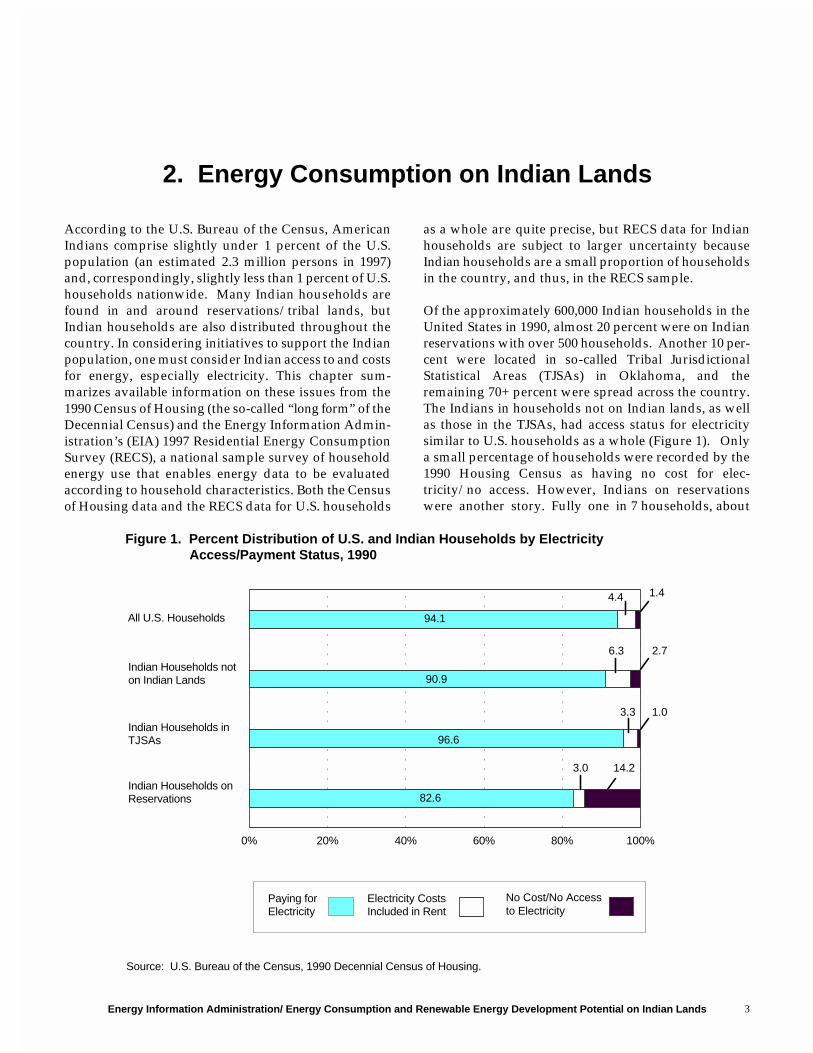
Figure 1. Percent Distribution of U.S. and Indian Households by ElectricityAccess/Payment Status, 1990
2. Energy Consumption on Indian Lands
According to the U.S. Bureau of the Census, AmericanIndians comprise slightly under 1 percent of the U.S.population (an estimated 2.3 million persons in 1997)and, correspondingly, slightly less than 1 percent of U.S.households nationwide. Many Indian households arefound in and around reservations/tribal lands, butIndian households are also distributed throughout thecountry. In considering initiatives to support the Indianpopulation, one must consider Indian access to and costsfor energy, especially electricity. This chapter sum-marizes available information on these issues from the1990 Census of Housing (the so-called “long form” of theDecennial Census) and the Energy Information Admin-istration’s (EIA) 1997 Residential Energy ConsumptionSurvey (RECS), a national sample survey of householdenergy use that enables energy data to be evaluatedaccording to household characteristics. Both the Censusof Housing data and the RECS data for U.S. households
as a whole are quite precise, but RECS data for Indianhouseholds are subject to larger uncertainty becauseIndian households are a small proportion of householdsin the country, and thus, in the RECS sample.
Of the approximately 600,000 Indian households in theUnited States in 1990, almost 20 percent were on Indianreservations with over 500 households. Another 10 per-cent were located in so-called Tribal JurisdictionalStatistical Areas (TJSAs) in Oklahoma, and theremaining 70+ percent were spread across the country.The Indians in households not on Indian lands, as wellas those in the TJSAs, had access status for electricitysimilar to U.S. households as a whole (Figure 1). Onlya small percentage of households were recorded by the1990 Housing Census as having no cost for elec-tricity/no access. However, Indians on reservationswere another story. Fully one in 7 households, about
Energy Information Administration/ Energy Consumption and Renewable Energy Development Potential on Indian Lands4
4 Based on conversations with Richard Wilson of the Bureau of Indian Affairs on February 17, 2000 and David Lester of the Councilof Energy Resource Tribes on February 25, 2000.
0 5 10 15 20 25
All U.S. HHs . . . . . . . . . . . . . . . . . .
Indian HHs On Reservations . . . . . .
Indian HHs Not On Reservations * . .
10th Percentile1
50th Percentile2
90th Percentile3
All U.S. HHs . . . . . . . . . . . . . . . . . .
Indian HHs On Reservations . . . . . .
Indian HHs Not On Reservations * . .
All U.S. HHs . . . . . . . . . . . . . . . . . .
Indian HHs On Reservations . . . . . .
Indian HHs Not On Reservations * . .
Percent of Household Income
1
1
1
2
3
4
9
12
20
110th percentile indicates that the least-burdened 10 percent of households pay no more than this percentage of income for electricity.2 50th percentile indicates the median electricity expenditures as a percent of income.3 90th percentile indicates that the most-burdened 10 percent of households pay at least this percentage of income for electricity.* Includes households in TJSAs.Source: U.S. Bureau of the Census, 1990 Decennial Census of Housing.
HHs = Households.
Figure 2. Percentiles of Electricity Costs Relative to Total Household Income, forHouseholds That Pay for Electricity, 1990
16,000 total, were in the no cost/no access category, andauthoritative sources state that the reason is the lack ofaccess to electricity, not central purchasing organizationsor other arrangements that might provide Indian house-holds with access at no cost.4 Over three-quarters ofthese 16,000 households were located on the Navajoreservation of Arizona/New Mexico, where over one-third of the 34,000 households did not have access, eventhough generation and transmission facilities are locatedwithin the boundaries of the reservation. Detailedinformation from the 1990 Census of Housing, whichinclude data for individual TJSAs and reservations ofover 500 Indian households, is given in Appendix B.
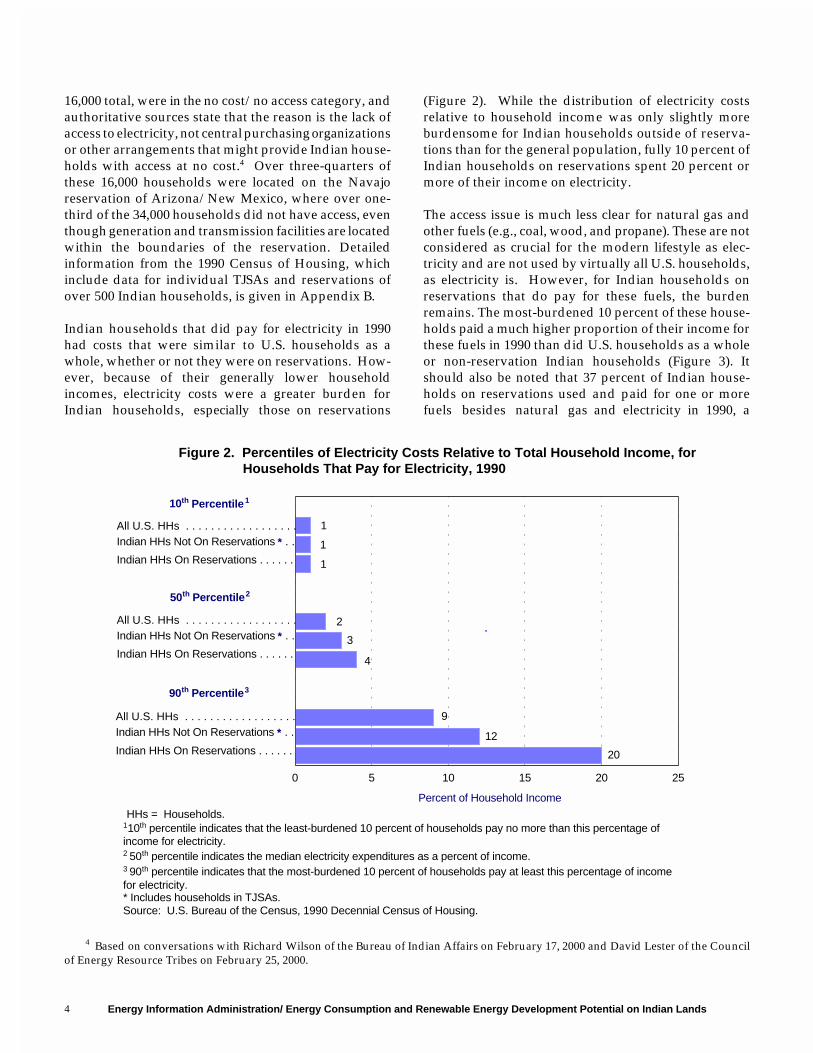
Indian households that did pay for electricity in 1990had costs that were similar to U.S. households as awhole, whether or not they were on reservations. How-ever, because of their generally lower householdincomes, electricity costs were a greater burden forIndian households, especially those on reservations
(Figure 2). While the distribution of electricity costsrelative to household income was only slightly moreburdensome for Indian households outside of reserva-tions than for the general population, fully 10 percent ofIndian households on reservations spent 20 percent ormore of their income on electricity.
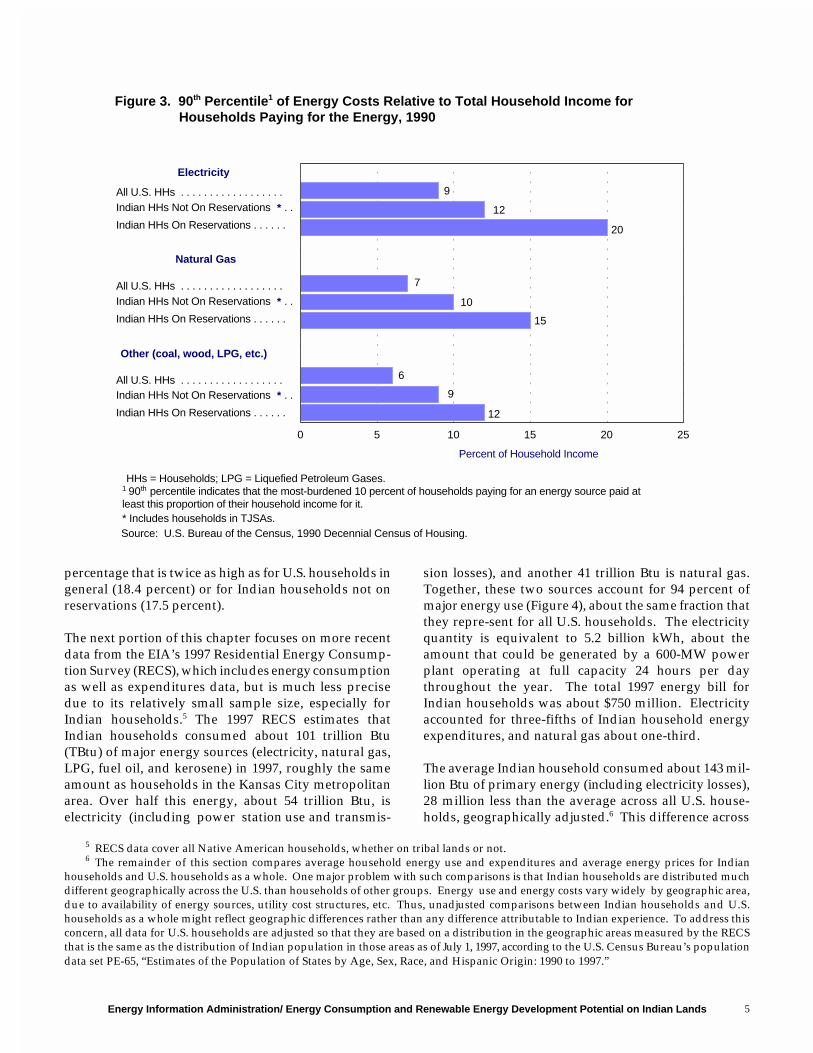
The access issue is much less clear for natural gas andother fuels (e.g., coal, wood, and propane). These are notconsidered as crucial for the modern lifestyle as elec-tricity and are not used by virtually all U.S. households,as electricity is. However, for Indian households onreservations that do pay for these fuels, the burdenremains. The most-burdened 10 percent of these house-holds paid a much higher proportion of their income forthese fuels in 1990 than did U.S. households as a wholeor non-reservation Indian households (Figure 3). Itshould also be noted that 37 percent of Indian house-holds on reservations used and paid for one or morefuels besides natural gas and electricity in 1990, a
Energy Information Administration/ Energy Consumption and Renewable Energy Development Potential on Indian Lands 5
5 RECS data cover all Native American households, whether on tribal lands or not.6 The remainder of this section compares average household energy use and expenditures and average energy prices for Indian
households and U.S. households as a whole. One major problem with such comparisons is that Indian households are distributed muchdifferent geographically across the U.S. than households of other groups. Energy use and energy costs vary widely by geographic area,due to availability of energy sources, utility cost structures, etc. Thus, unadjusted comparisons between Indian households and U.S.households as a whole might reflect geographic differences rather than any difference attributable to Indian experience. To address thisconcern, all data for U.S. households are adjusted so that they are based on a distribution in the geographic areas measured by the RECSthat is the same as the distribution of Indian population in those areas as of July 1, 1997, according to the U.S. Census Bureau’s populationdata set PE-65, “Estimates of the Population of States by Age, Sex, Race, and Hispanic Origin: 1990 to 1997.”
0 5 10 15 20 25
All U.S. HHs . . . . . . . . . . . . . . . . . .
Indian HHs On Reservations . . . . . .
Indian HHs Not On Reservations * . .
Electricity
Natural Gas
Other (coal, wood, LPG, etc.)
1 90th percentile indicates that the most-burdened 10 percent of households paying for an energy source paid at least this proportion of their household income for it.* Includes households in TJSAs.Source: U.S. Bureau of the Census, 1990 Decennial Census of Housing.
Percent of Household Income
9
20
12
10
7
15
6
9
12
HHs = Households; LPG = Liquefied Petroleum Gases.
All U.S. HHs . . . . . . . . . . . . . . . . . .
Indian HHs On Reservations . . . . . .
Indian HHs Not On Reservations * . .
All U.S. HHs . . . . . . . . . . . . . . . . . .
Indian HHs On Reservations . . . . . .
Indian HHs Not On Reservations * . .
Figure 3. 90th Percentile1 of Energy Costs Relative to Total Household Income forHouseholds Paying for the Energy, 1990
percentage that is twice as high as for U.S. households ingeneral (18.4 percent) or for Indian households not onreservations (17.5 percent).
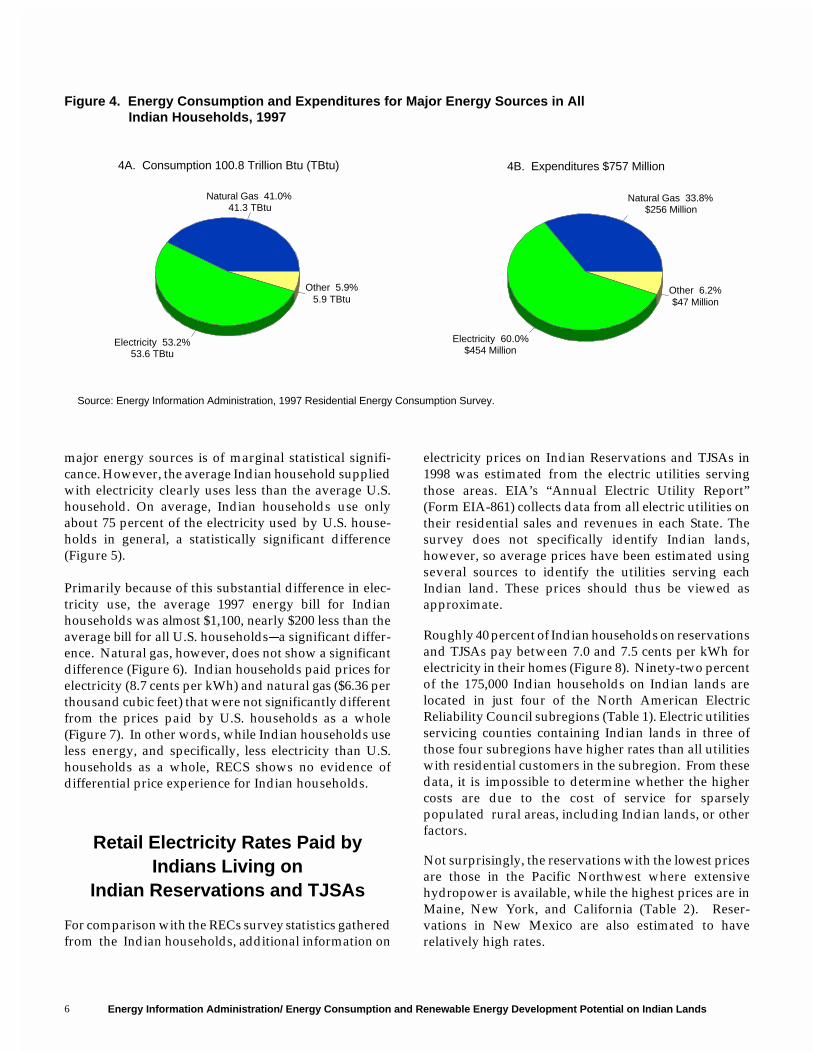
The next portion of this chapter focuses on more recentdata from the EIA’s 1997 Residential Energy Consump-tion Survey (RECS), which includes energy consumptionas well as expenditures data, but is much less precisedue to its relatively small sample size, especially forIndian households.5 The 1997 RECS estimates thatIndian households consumed about 101 trillion Btu(TBtu) of major energy sources (electricity, natural gas,LPG, fuel oil, and kerosene) in 1997, roughly the sameamount as households in the Kansas City metropolitanarea. Over half this energy, about 54 trillion Btu, iselectricity (including power station use and transmis-
sion losses), and another 41 trillion Btu is natural gas.Together, these two sources account for 94 percent ofmajor energy use (Figure 4), about the same fraction thatthey repre-sent for all U.S. households. The electricityquantity is equivalent to 5.2 billion kWh, about theamount that could be generated by a 600-MW powerplant operating at full capacity 24 hours per daythroughout the year. The total 1997 energy bill forIndian households was about $750 million. Electricityaccounted for three-fifths of Indian household energyexpenditures, and natural gas about one-third.
The average Indian household consumed about 143 mil-lion Btu of primary energy (including electricity losses),28 million less than the average across all U.S. house-holds, geographically adjusted.6 This difference across
Energy Information Administration/ Energy Consumption and Renewable Energy Development Potential on Indian Lands6
4A. Consumption 100.8 Trillion Btu (TBtu)
Natural Gas 41.0%41.3 TBtu
Electricity 53.2%53.6 TBtu
Other 5.9%5.9 TBtu
4B. Expenditures $757 Million
Natural Gas 33.8%$256 Million
Electricity 60.0%$454 Million
Other 6.2%$47 Million
Figure 4. Energy Consumption and Expenditures for Major Energy Sources in AllIndian Households, 1997
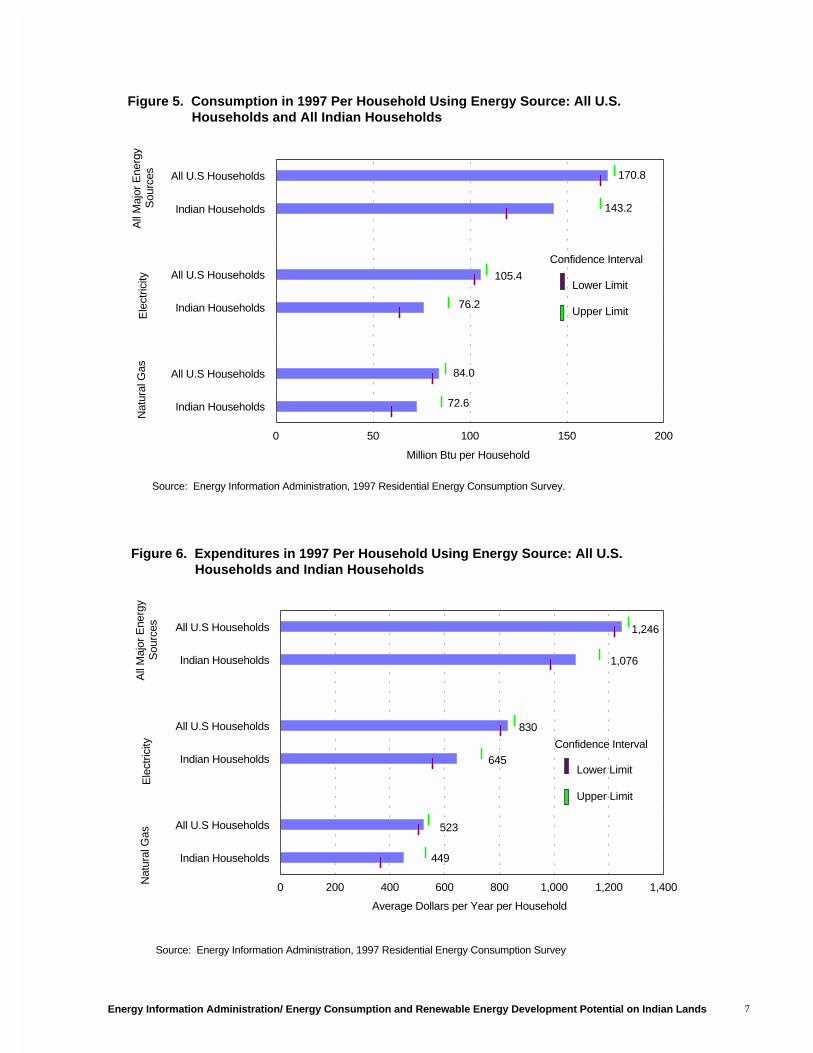
major energy sources is of marginal statistical signifi-cance. However, the average Indian household suppliedwith electricity clearly uses less than the average U.S.household. On average, Indian households use onlyabout 75 percent of the electricity used by U.S. house-holds in general, a statistically significant difference(Figure 5).
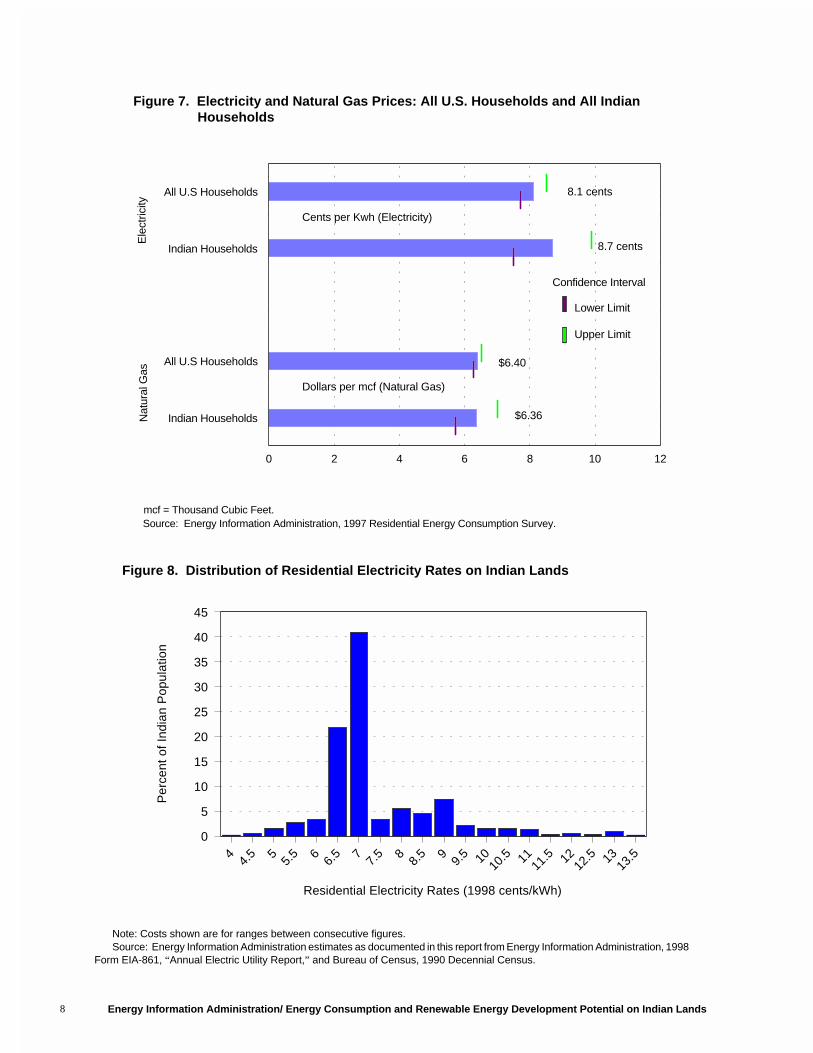
Primarily because of this substantial difference in elec-tricity use, the average 1997 energy bill for Indianhouseholds was almost $1,100, nearly $200 less than theaverage bill for all U.S. households&a significant differ-ence. Natural gas, however, does not show a significantdifference (Figure 6). Indian households paid prices forelectricity (8.7 cents per kWh) and natural gas ($6.36 perthousand cubic feet) that were not significantly differentfrom the prices paid by U.S. households as a whole(Figure 7). In other words, while Indian households useless energy, and specifically, less electricity than U.S.households as a whole, RECS shows no evidence ofdifferential price experience for Indian households.
Retail Electricity Rates Paid byIndians Living on
Indian Reservations and TJSAs
For comparison with the RECs survey statistics gatheredfrom the Indian households, additional information on
electricity prices on Indian Reservations and TJSAs in1998 was estimated from the electric utilities servingthose areas. EIA’s “Annual Electric Utility Report”(Form EIA-861) collects data from all electric utilities ontheir residential sales and revenues in each State. Thesurvey does not specifically identify Indian lands,however, so average prices have been estimated usingseveral sources to identify the utilities serving eachIndian land. These prices should thus be viewed asapproximate.
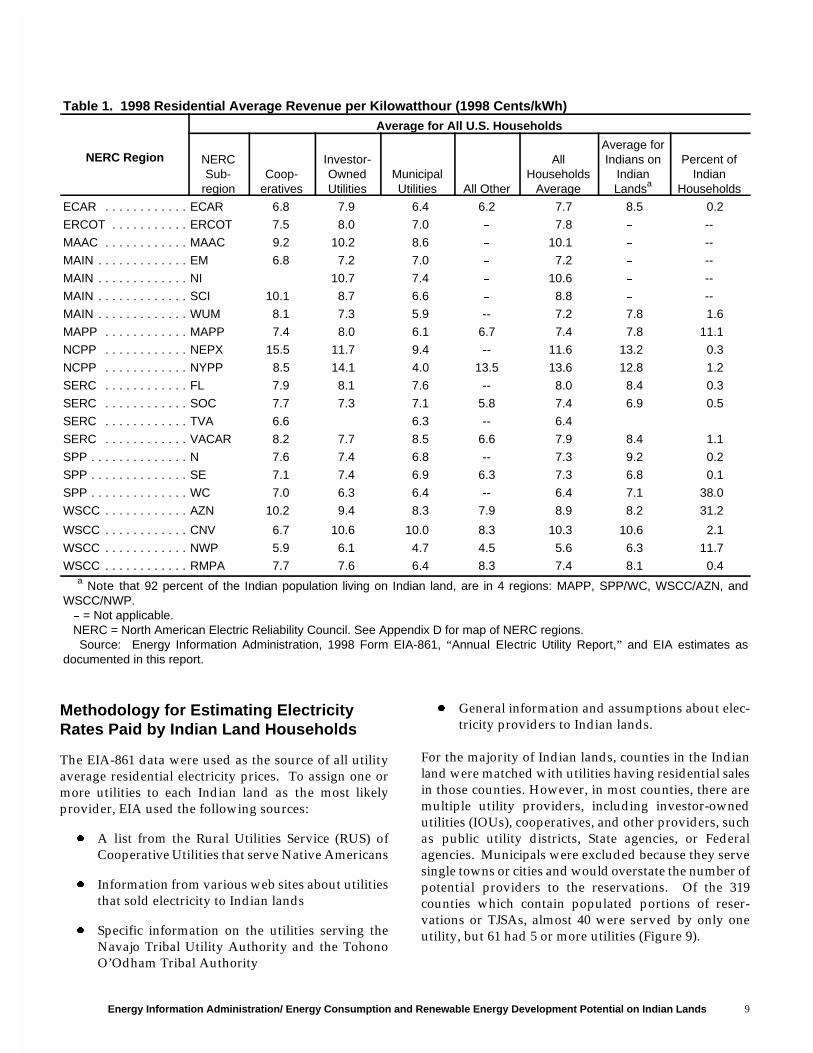
Roughly 40 percent of Indian households on reservationsand TJSAs pay between 7.0 and 7.5 cents per kWh forelectricity in their homes (Figure 8). Ninety-two percentof the 175,000 Indian households on Indian lands arelocated in just four of the North American ElectricReliability Council subregions (Table 1). Electric utilitiesservicing counties containing Indian lands in three ofthose four subregions have higher rates than all utilitieswith residential customers in the subregion. From thesedata, it is impossible to determine whether the highercosts are due to the cost of service for sparselypopulated rural areas, including Indian lands, or otherfactors.
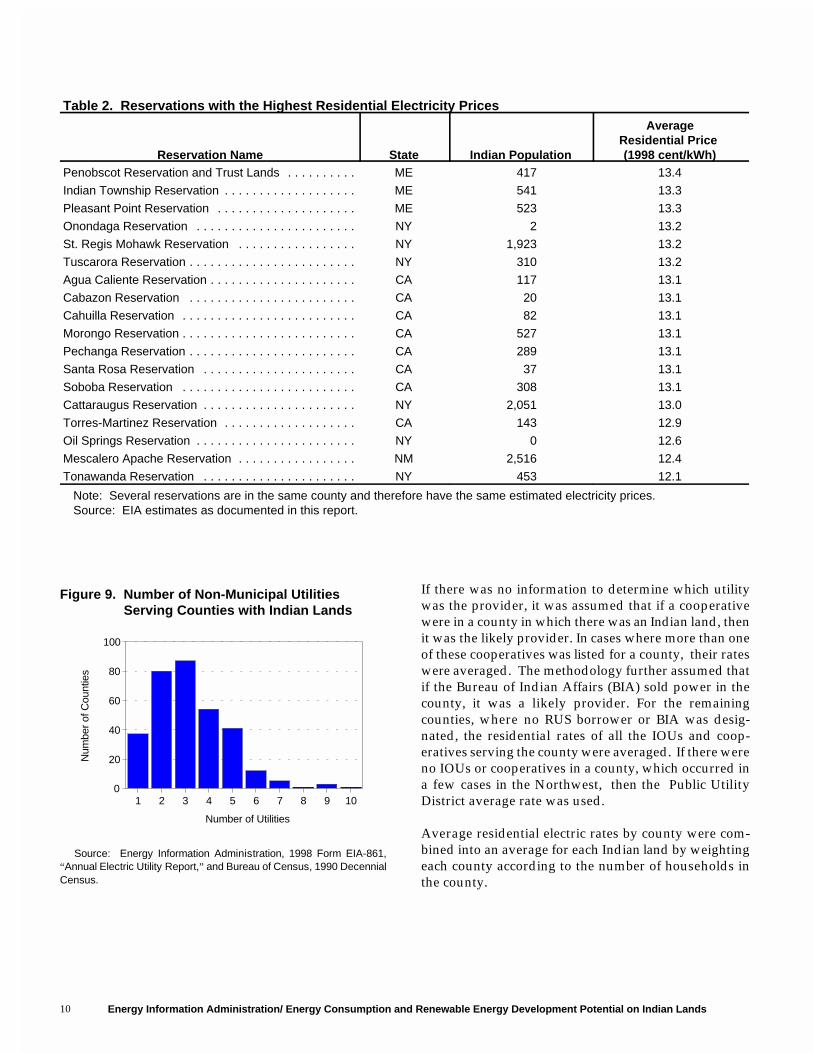
Not surprisingly, the reservations with the lowest pricesare those in the Pacific Northwest where extensivehydropower is available, while the highest prices are inMaine, New York, and California (Table 2). Reser-vations in New Mexico are also estimated to haverelatively high rates.
Source: Energy Information Administration, 1997 Residential Energy Consumption Survey.
Energy Information Administration/ Energy Consumption and Renewable Energy Development Potential on Indian Lands 7
Source: Energy Information Administration, 1997 Residential Energy Consumption Survey
All U.S Households
Indian Households
All U.S Households
Indian Households
All U.S Households
Indian Households
0 200 400 600 800 1,000 1,200 1,400
Average Dollars per Year per Household
All
Maj
or E
nerg
y S
ourc
esE
lect
ricity
Nat
ural
Gas
Lower Limit
Upper Limit
Confidence Interval
1,246
1,076
830
645
523
449
Figure 6. Expenditures in 1997 Per Household Using Energy Source: All U.S.Households and Indian Households
Source: Energy Information Administration, 1997 Residential Energy Consumption Survey.
All U.S Households
Indian Households
All U.S Households
Indian Households
All U.S Households
Indian Households
0 50 100 150 200
Million Btu per Household
All
Maj
or E
nerg
y S
ourc
esE
lect
ricity
Nat
ural
Gas
Lower Limit
Upper Limit
Confidence Interval
170.8
143.2
105.4
76.2
84.0
72.6
Figure 5. Consumption in 1997 Per Household Using Energy Source: All U.S.Households and All Indian Households
Energy Information Administration/ Energy Consumption and Renewable Energy Development Potential on Indian Lands8
Source: Energy Information Administration, 1997 Residential Energy Consumption Survey.
All U.S Households
Indian Households
All U.S Households
Indian Households
0 2 4 6 8 10 12
Ele
ctric
ityN
atur
al G
as
Lower Limit
Upper Limit
Confidence Interval
Cents per Kwh (Electricity)
Dollars per mcf (Natural Gas)
8.1 cents
8.7 cents
$6.40
$6.36
mcf = Thousand Cubic Feet.
Figure 7. Electricity and Natural Gas Prices: All U.S. Households and All IndianHouseholds
44.
5 55.
5 66.
5 77.
5 88.
5 99.
5 1010
.5 1111
.5 1212
.5 1313
.5
Residential Electricity Rates (1998 cents/kWh)
0
5
10
15
20
25
30
35
40
45
Per
cent
of I
ndia
n P
opul
atio
n
Figure 8. Distribution of Residential Electricity Rates on Indian Lands
Note: Costs shown are for ranges between consecutive figures.Source: Energy Information Administration estimates as documented in this report from Energy Information Administration, 1998
Form EIA-861, “Annual Electric Utility Report,” and Bureau of Census, 1990 Decennial Census.
Energy Information Administration/ Energy Consumption and Renewable Energy Development Potential on Indian Lands 9
Table 1. 1998 Residential Average Revenue per Kilowatthour (1998 Cents/kWh)
NERC Region
Average for All U.S. Households
NERCSub-
regionCoop-
eratives
Investor-OwnedUtilities
MunicipalUtilities All Other
AllHouseholds
Average
Average forIndians on
IndianLandsa
Percent ofIndian
Households
ECAR . . . . . . . . . . . . ECAR 6.8 7.9 6.4 6.2 7.7 8.5 0.2
ERCOT . . . . . . . . . . . ERCOT 7.5 8.0 7.0 % 7.8 % --
MAAC . . . . . . . . . . . . MAAC 9.2 10.2 8.6 % 10.1 % --
MAIN . . . . . . . . . . . . . EM 6.8 7.2 7.0 % 7.2 % --
MAIN . . . . . . . . . . . . . NI 10.7 7.4 % 10.6 % --
MAIN . . . . . . . . . . . . . SCI 10.1 8.7 6.6 % 8.8 % --
MAIN . . . . . . . . . . . . . WUM 8.1 7.3 5.9 -- 7.2 7.8 1.6
MAPP . . . . . . . . . . . . MAPP 7.4 8.0 6.1 6.7 7.4 7.8 11.1
NCPP . . . . . . . . . . . . NEPX 15.5 11.7 9.4 -- 11.6 13.2 0.3
NCPP . . . . . . . . . . . . NYPP 8.5 14.1 4.0 13.5 13.6 12.8 1.2
SERC . . . . . . . . . . . . FL 7.9 8.1 7.6 -- 8.0 8.4 0.3
SERC . . . . . . . . . . . . SOC 7.7 7.3 7.1 5.8 7.4 6.9 0.5
SERC . . . . . . . . . . . . TVA 6.6 6.3 -- 6.4
SERC . . . . . . . . . . . . VACAR 8.2 7.7 8.5 6.6 7.9 8.4 1.1
SPP . . . . . . . . . . . . . . N 7.6 7.4 6.8 -- 7.3 9.2 0.2
SPP . . . . . . . . . . . . . . SE 7.1 7.4 6.9 6.3 7.3 6.8 0.1
SPP . . . . . . . . . . . . . . WC 7.0 6.3 6.4 -- 6.4 7.1 38.0
WSCC . . . . . . . . . . . . AZN 10.2 9.4 8.3 7.9 8.9 8.2 31.2
WSCC . . . . . . . . . . . . CNV 6.7 10.6 10.0 8.3 10.3 10.6 2.1
WSCC . . . . . . . . . . . . NWP 5.9 6.1 4.7 4.5 5.6 6.3 11.7
WSCC . . . . . . . . . . . . RMPA 7.7 7.6 6.4 8.3 7.4 8.1 0.4
a Note that 92 percent of the Indian population living on Indian land, are in 4 regions: MAPP, SPP/WC, WSCC/AZN, andWSCC/NWP. % = Not applicable. NERC = North American Electric Reliability Council. See Appendix D for map of NERC regions. Source: Energy Information Administration, 1998 Form EIA-861, “Annual Electric Utility Report,” and EIA estimates asdocumented in this report.
Methodology for Estimating ElectricityRates Paid by Indian Land Households
The EIA-861 data were used as the source of all utilityaverage residential electricity prices. To assign one ormore utilities to each Indian land as the most likelyprovider, EIA used the following sources:
� A list from the Rural Utilities Service (RUS) ofCooperative Utilities that serve Native Americans
� Information from various web sites about utilitiesthat sold electricity to Indian lands
� Specific information on the utilities serving theNavajo Tribal Utility Authority and the TohonoO’Odham Tribal Authority
� General information and assumptions about elec-tricity providers to Indian lands.
For the majority of Indian lands, counties in the Indianland were matched with utilities having residential salesin those counties. However, in most counties, there aremultiple utility providers, including investor-ownedutilities (IOUs), cooperatives, and other providers, suchas public utility districts, State agencies, or Federalagencies. Municipals were excluded because they servesingle towns or cities and would overstate the number ofpotential providers to the reservations. Of the 319counties which contain populated portions of reser-vations or TJSAs, almost 40 were served by only oneutility, but 61 had 5 or more utilities (Figure 9).
Energy Information Administration/ Energy Consumption and Renewable Energy Development Potential on Indian Lands10
Table 2. Reservations with the Highest Residential Electricity Prices
Reservation Name State Indian Population
AverageResidential Price (1998 cent/kWh)
Penobscot Reservation and Trust Lands . . . . . . . . . . ME 417 13.4
Indian Township Reservation . . . . . . . . . . . . . . . . . . . ME 541 13.3
Pleasant Point Reservation . . . . . . . . . . . . . . . . . . . . ME 523 13.3
Onondaga Reservation . . . . . . . . . . . . . . . . . . . . . . . NY 2 13.2
St. Regis Mohawk Reservation . . . . . . . . . . . . . . . . . NY 1,923 13.2
Tuscarora Reservation . . . . . . . . . . . . . . . . . . . . . . . . NY 310 13.2
Agua Caliente Reservation . . . . . . . . . . . . . . . . . . . . . CA 117 13.1
Cabazon Reservation . . . . . . . . . . . . . . . . . . . . . . . . CA 20 13.1
Cahuilla Reservation . . . . . . . . . . . . . . . . . . . . . . . . . CA 82 13.1
Morongo Reservation . . . . . . . . . . . . . . . . . . . . . . . . . CA 527 13.1
Pechanga Reservation . . . . . . . . . . . . . . . . . . . . . . . . CA 289 13.1
Santa Rosa Reservation . . . . . . . . . . . . . . . . . . . . . . CA 37 13.1
Soboba Reservation . . . . . . . . . . . . . . . . . . . . . . . . . CA 308 13.1
Cattaraugus Reservation . . . . . . . . . . . . . . . . . . . . . . NY 2,051 13.0
Torres-Martinez Reservation . . . . . . . . . . . . . . . . . . . CA 143 12.9
Oil Springs Reservation . . . . . . . . . . . . . . . . . . . . . . . NY 0 12.6
Mescalero Apache Reservation . . . . . . . . . . . . . . . . . NM 2,516 12.4
Tonawanda Reservation . . . . . . . . . . . . . . . . . . . . . . NY 453 12.1
Note: Several reservations are in the same county and therefore have the same estimated electricity prices. Source: EIA estimates as documented in this report.
1 2 3 4 5 6 7 8 9 10
Number of Utilities
0
20
40
60
80
100
Num
ber
of C
ount
ies
Figure 9. Number of Non-Municipal UtilitiesServing Counties with Indian Lands
If there was no information to determine which utilitywas the provider, it was assumed that if a cooperativewere in a county in which there was an Indian land, thenit was the likely provider. In cases where more than oneof these cooperatives was listed for a county, their rateswere averaged. The methodology further assumed thatif the Bureau of Indian Affairs (BIA) sold power in thecounty, it was a likely provider. For the remainingcounties, where no RUS borrower or BIA was desig-nated, the residential rates of all the IOUs and coop-eratives serving the county were averaged. If there wereno IOUs or cooperatives in a county, which occurred ina few cases in the Northwest, then the Public UtilityDistrict average rate was used.
Average residential electric rates by county were com-bined into an average for each Indian land by weightingeach county according to the number of households inthe county.
Source: Energy Information Administration, 1998 Form EIA-861,“Annual Electric Utility Report,” and Bureau of Census, 1990 DecennialCensus.
Energy Information Administration/ Energy Consumption and Renewable Energy Development Potential on Indian Lands 11
3. Potential for Renewable Energy
Introduction
This chapter provides information needed to determinegood renewable energy prospects on Indian tribal lands.It begins with a series of maps showing U.S. renewableenergy resources and the Nation’s electricity grid withan overlay of Indian tribal land boundaries. Followingthe maps is an assessment by individual tribal land ofthe premium for each renewable electricity resourceover the cost of purchased electricity. The results includetwo lists of sites for further investigation. One showsIndian lands where the marginal cost of renewableenergy over current wholesale electricity cost was least;the other shows the highest percentage of tribalmembers without electricity.
Because renewable energy availability tends to be highlysite-specific and because there are often restrictions andother considerations on land use for renewable energyprojects, it is essential to conduct individual project andsite analyses before beginning any project. This chapterprovides an outline for this process following the dataon renewable electricity costs and concludes with adiscussion of limitations in developing renewableresources.
Renewable Resources onIndian Lands
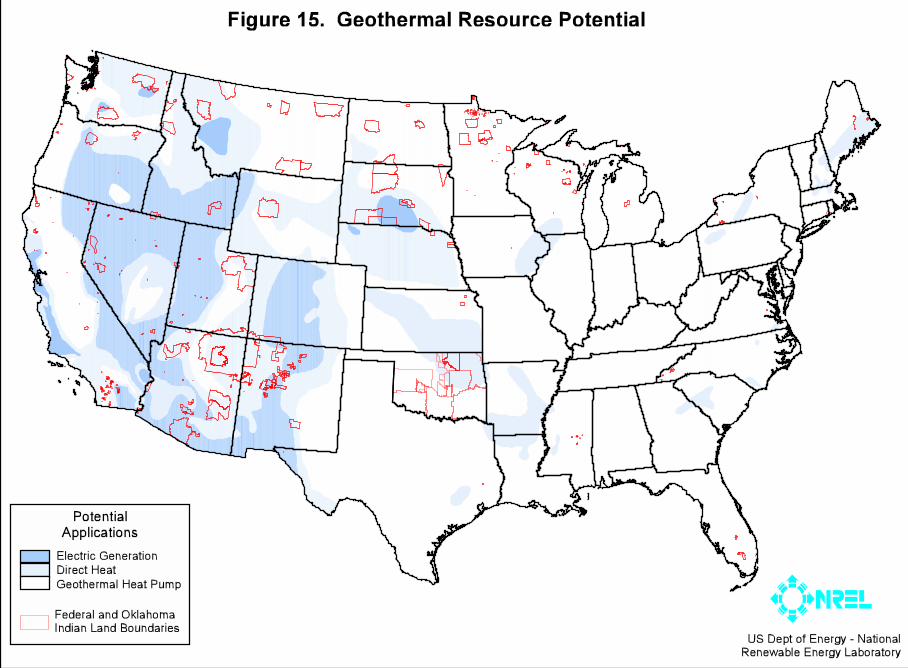
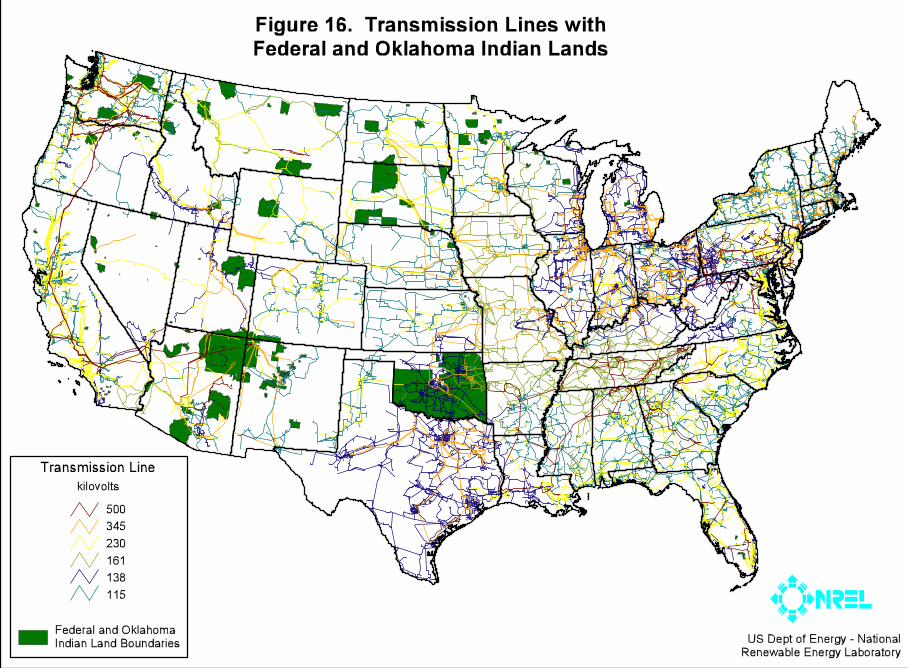
Federal and Oklahoma Indian tribal lands are locatedprimarily in the western United States (Figure 10). Thisalso tends to be where renewable resources are located.Maps of solar/photovoltaic, concentrated solar power,wind, biomass, and geothermal resources are shownoverlaying tribal land boundaries (Figures 11-15). Forhydropower, no map-friendly source of resourcepotentials was readily available. Therefore, EIA devel-oped a generic assessment of new hydroelectric plantcosts, based on studies conducted by the Department ofEnergy’s Idaho National Engineering and EnvironmentalLaboratory (INEEL). Finally, the potential for renewableresources&particularly for selling renewable power intothe grid&is strongly influenced by access to trans-
mission lines, transmission line capability, and transmis-sion line load (Figure 16). Figure 16 shows transmissionand location information. Unfortunately, no com-prehensive source of data on transmission line loadexists.
A major caveat exists in applying resource estimates tosmall land area reservations. Resources are estimatedeither at the county level or some other small grid level(e.g., 25 by 25 miles for solar). However, some reser-vations are much smaller than this grid size. In thosecases, it is quite possible that either the resources listedare not actually on the reservation (e.g., biomass) orthere are small-area considerations that make theresource not viable on the reservation.
Federal and Oklahoma Indian Lands
The map showing the boundaries of Federally Recog-nized American Indian Reservations and Tribal Juris-dictional Statistical Areas (in Oklahoma) indicates theareas that are the subject of this report. It is derivedfrom a similar one available from the U.S. Departmentof the Interior, Bureau of Indian Affairs, GeographicData Service Center (GDSC). A series of Indian mapsa r e a v a i l a b l e o n t h e G D S C w e b s i t e :http://www.gdsc.bia.gov/maps.htm#epa1. Underlyingdata is based on the U.S. Department of Commerce,Bureau of Census, 1992 Tiger Line Files.
Solar Resources forFlat Plate Collectors
Figure 11 provides monthly average daily total solarresource information on grid cells of approximately 40km by 40 km in size. The insolation values represent theresource available to a flat plate collector, such as aphotovoltaic panel, oriented due south at an angle fromhorizontal equal to the latitude of the collector location.This is common practice for PV system installation,although other orientations are also used.
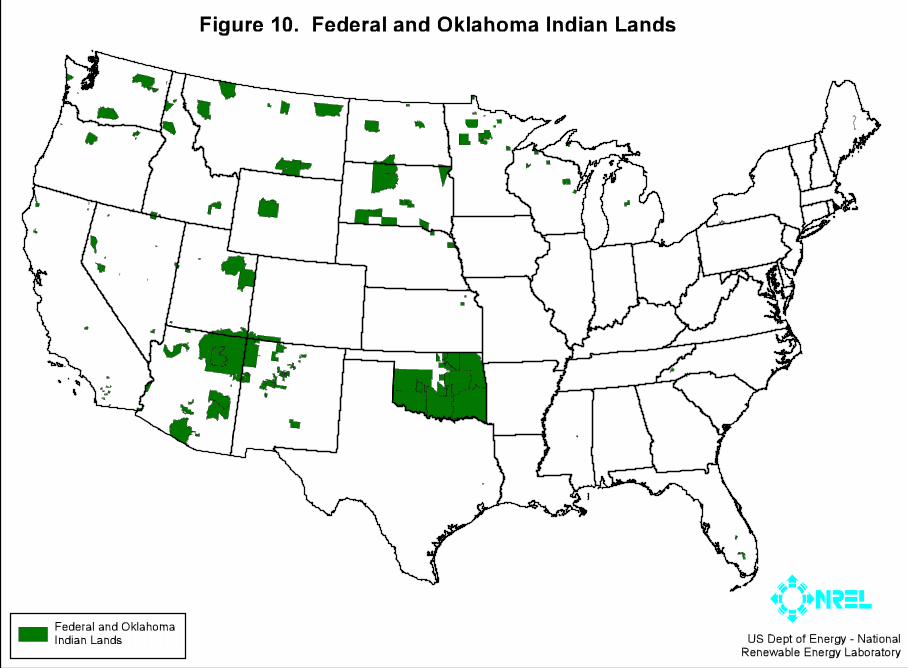
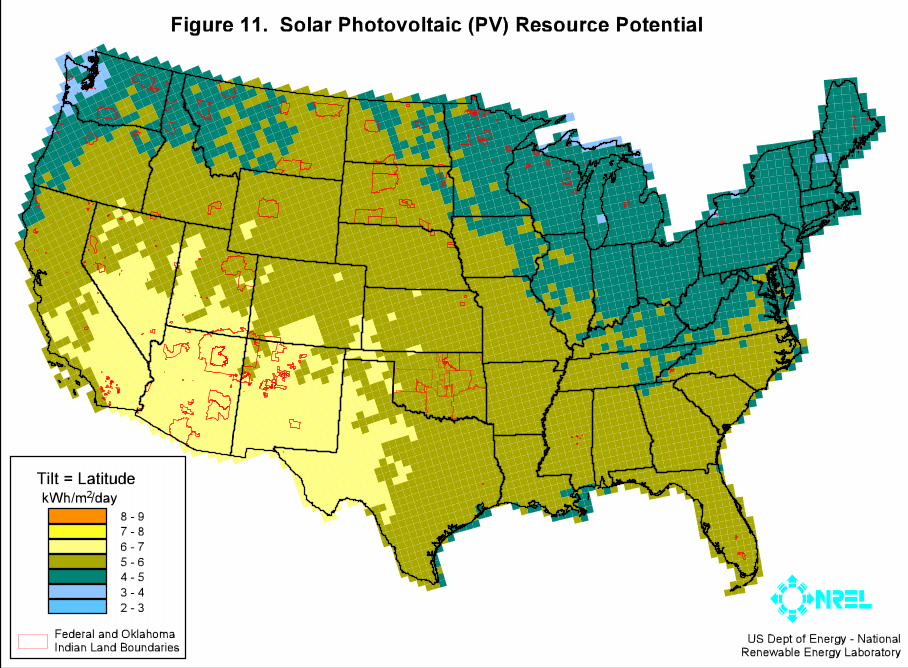
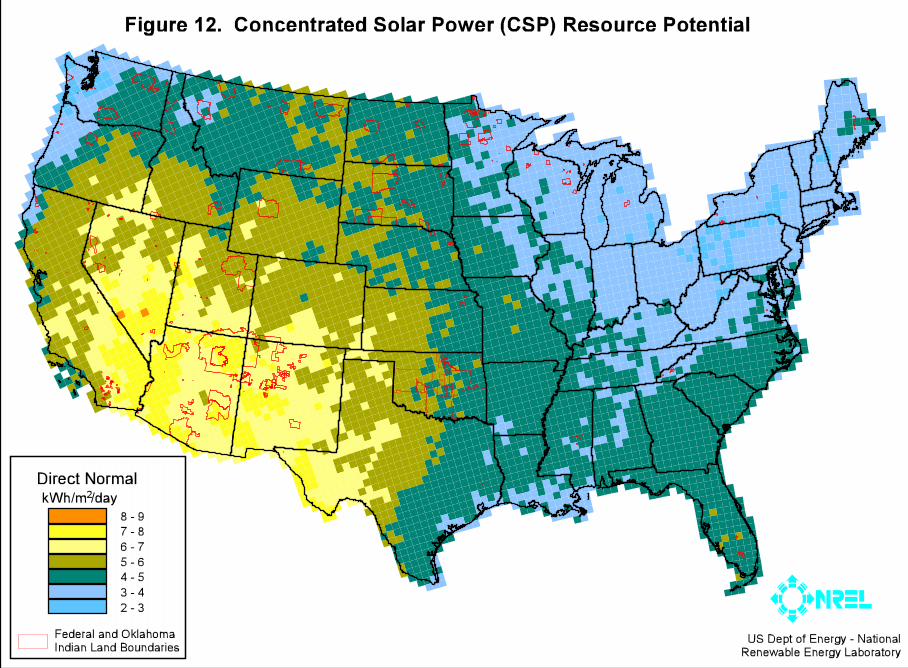
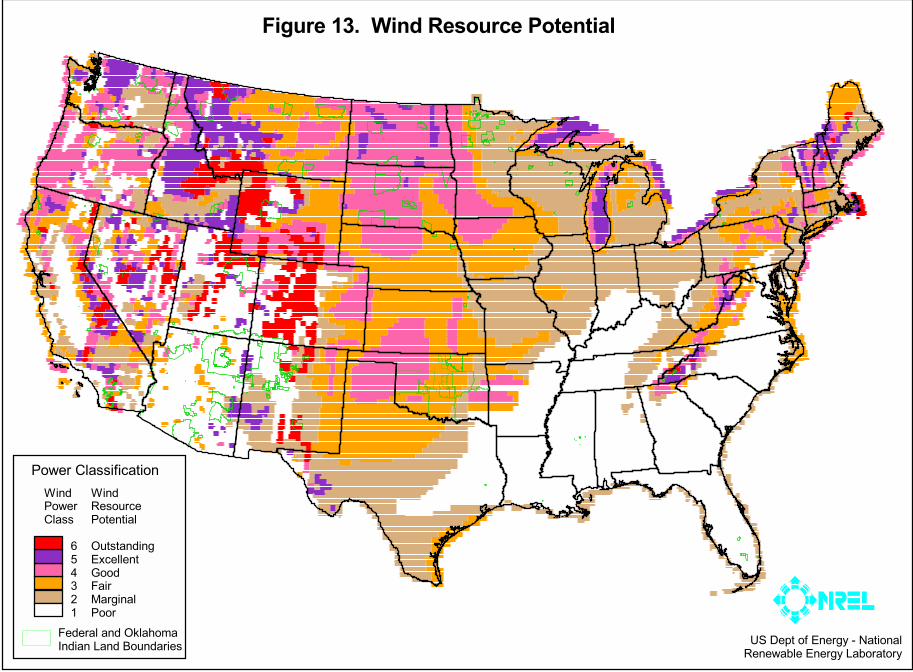
Figure 13. Wind Resource Potential
WindPowerClass
6 5 4 3 2 1
WindResourcePotential
OutstandingExcellentGoodFairMarginalPoor
Power Classification
Federal and OklahomaIndian Land Boundaries US Dept of Energy - National
Renewable Energy Laboratory
Energy Information Administration/ Energy Consumption and Renewable Energy Development Potential on Indian Lands 19
7 Maxwell, E, R. George and S. Wilcox, “A Climatological Solar Radiation Model,” in Proceedings of the 1998 Annual Conference, AmericanSolar Energy Society (Albuquerque NM).
8 George, R, and E. Maxwell, 1999: “High-Resolution Maps of Solar Collector Performance Using A Climatological Solar RadiationModel,” in Proceedings of the 1999 Annual Conference, American Solar Energy Society (Portland, ME).
9 Marion, W. and S. Wilcox, 1994: “Solar Radiation Data Manual for Flat-plate and Concentrating Collectors,” NREL/TP-463-5607,National Renewable Energy Laboratory (1617 Cole Boulevard, Golden, CO, 80401).
10 Maxwell, E, R. George and S. Wilcox, “A Climatological Solar Radiation Model,” in Proceedings of the 1998 Annual Conference, AmericanSolar Energy Society (Albuquerque NM).
11 George, R, and E. Maxwell, 1999: “High-Resolution Maps of Solar Collector Performance Using A Climatological Solar RadiationModel,” in Proceedings of the 1999 Annual Conference, American Solar Energy Society (Portland, ME).
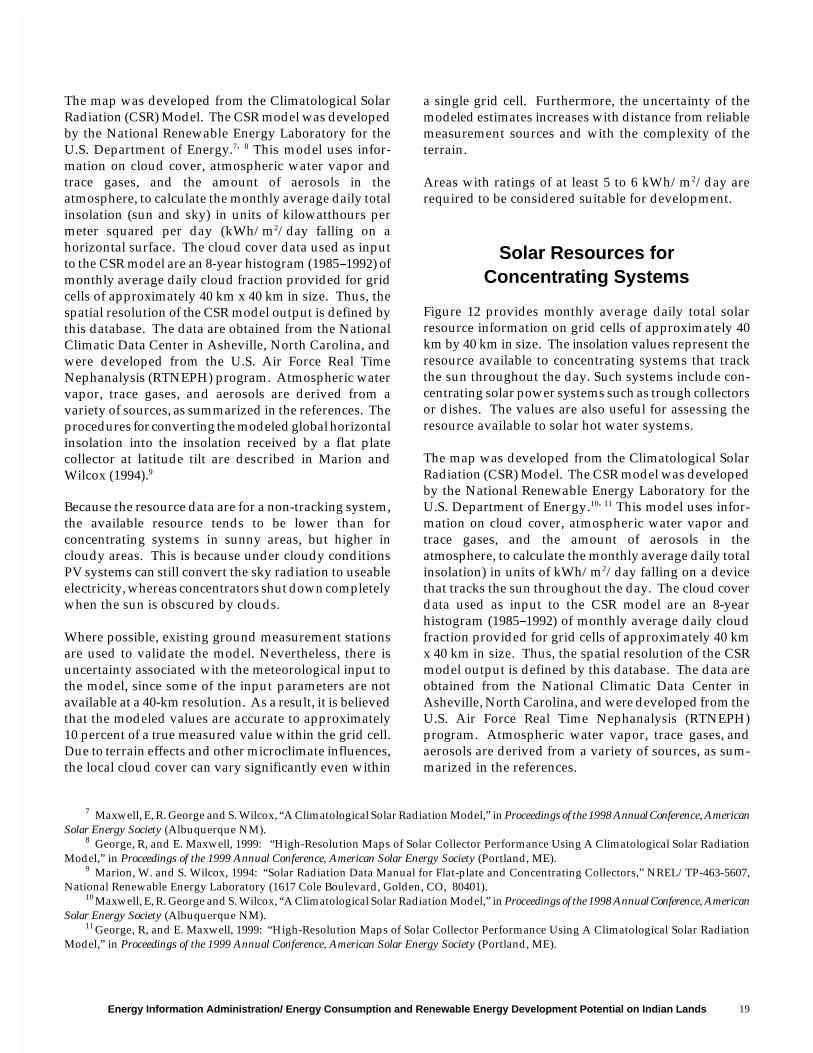
The map was developed from the Climatological SolarRadiation (CSR) Model. The CSR model was developedby the National Renewable Energy Laboratory for theU.S. Department of Energy.7, 8 This model uses infor-mation on cloud cover, atmospheric water vapor andtrace gases, and the amount of aerosols in theatmosphere, to calculate the monthly average daily totalinsolation (sun and sky) in units of kilowatthours permeter squared per day (kWh/m2/day falling on ahorizontal surface. The cloud cover data used as inputto the CSR model are an 8-year histogram (1985%1992) ofmonthly average daily cloud fraction provided for gridcells of approximately 40 km x 40 km in size. Thus, thespatial resolution of the CSR model output is defined bythis database. The data are obtained from the NationalClimatic Data Center in Asheville, North Carolina, andwere developed from the U.S. Air Force Real TimeNephanalysis (RTNEPH) program. Atmospheric watervapor, trace gases, and aerosols are derived from avariety of sources, as summarized in the references. Theprocedures for converting the modeled global horizontalinsolation into the insolation received by a flat platecollector at latitude tilt are described in Marion andWilcox (1994).9
Because the resource data are for a non-tracking system,the available resource tends to be lower than forconcentrating systems in sunny areas, but higher incloudy areas. This is because under cloudy conditionsPV systems can still convert the sky radiation to useableelectricity, whereas concentrators shut down completelywhen the sun is obscured by clouds.
Where possible, existing ground measurement stationsare used to validate the model. Nevertheless, there isuncertainty associated with the meteorological input tothe model, since some of the input parameters are notavailable at a 40-km resolution. As a result, it is believedthat the modeled values are accurate to approximately10 percent of a true measured value within the grid cell.Due to terrain effects and other microclimate influences,the local cloud cover can vary significantly even within
a single grid cell. Furthermore, the uncertainty of themodeled estimates increases with distance from reliablemeasurement sources and with the complexity of theterrain.
Areas with ratings of at least 5 to 6 kWh/m2/day arerequired to be considered suitable for development.
Solar Resources forConcentrating Systems
Figure 12 provides monthly average daily total solarresource information on grid cells of approximately 40km by 40 km in size. The insolation values represent theresource available to concentrating systems that trackthe sun throughout the day. Such systems include con-centrating solar power systems such as trough collectorsor dishes. The values are also useful for assessing theresource available to solar hot water systems.
The map was developed from the Climatological SolarRadiation (CSR) Model. The CSR model was developedby the National Renewable Energy Laboratory for theU.S. Department of Energy.10, 11 This model uses infor-mation on cloud cover, atmospheric water vapor andtrace gases, and the amount of aerosols in theatmosphere, to calculate the monthly average daily totalinsolation) in units of kWh/m2/day falling on a devicethat tracks the sun throughout the day. The cloud coverdata used as input to the CSR model are an 8-yearhistogram (1985%1992) of monthly average daily cloudfraction provided for grid cells of approximately 40 kmx 40 km in size. Thus, the spatial resolution of the CSRmodel output is defined by this database. The data areobtained from the National Climatic Data Center inAsheville, North Carolina, and were developed from theU.S. Air Force Real Time Nephanalysis (RTNEPH)program. Atmospheric water vapor, trace gases, andaerosols are derived from a variety of sources, as sum-marized in the references.
Energy Information Administration/ Energy Consumption and Renewable Energy Development Potential on Indian Lands20
Because the resource data are for a tracking system, theavailable resource tends to be higher than for non-tracking systems in sunny areas, but lower in cloudyareas. This is because under cloudy conditions trackingsystems are unable to use any of the solar resource,which is obscured, while flat plate collectors can stillmake use of the sky radiation that is still available.
Where possible, existing ground measurement stationsare used to validate the model. Nevertheless, there isuncertainty associated with the meteorological input tothe model, since some of the input parameters are notavailable at a 40-km resolution. As a result, it is believedthat the modeled values are accurate to approximately10 percent of a true measured value within the grid cell.Due to terrain effects and other microclimate influences,the local cloud cover can vary significantly even withina single grid cell. Furthermore, the uncertainty of themodeled estimates increases with distance from reliablemeasurement sources and with the complexity of theterrain. Concentrating solar collectors are much moresensitive to solar resource characteristics than flat platecollectors, so that these sources of uncertainty are moreimportant to concentrator applications.
Areas with ratings of at least 5 to 6 kWh/m2/day arerequired to be considered suitable for development.
Wind Resources
The national wind resource assessment of the UnitedStates was created for the U.S. Department of Energy in
1986 by the Pacific Northwest Laboratory and isdocumented in the Wind Energy Resource Atlas of theUnited States, October 1986. The atlas can be viewed onthe Internet at http://rredc.nrel.gov/wind/pubs/atlas.
The wind resource assessment was based on surfacewind data, coastal marine area data and upper-air data,where applicable. In data-sparse areas, three qualitativeindicators of wind speed or power were used whenapplicable: topographic/meteorological indicators (e.g.gorges, mountain summits, sheltered valleys); winddeformed vegetation; and eolian landforms (e.g. playas,sand dunes). The data were evaluated at a regional levelto produce 12 regional wind resource assessments, theregional assessments were then incorporated into thenational wind resource assessment.
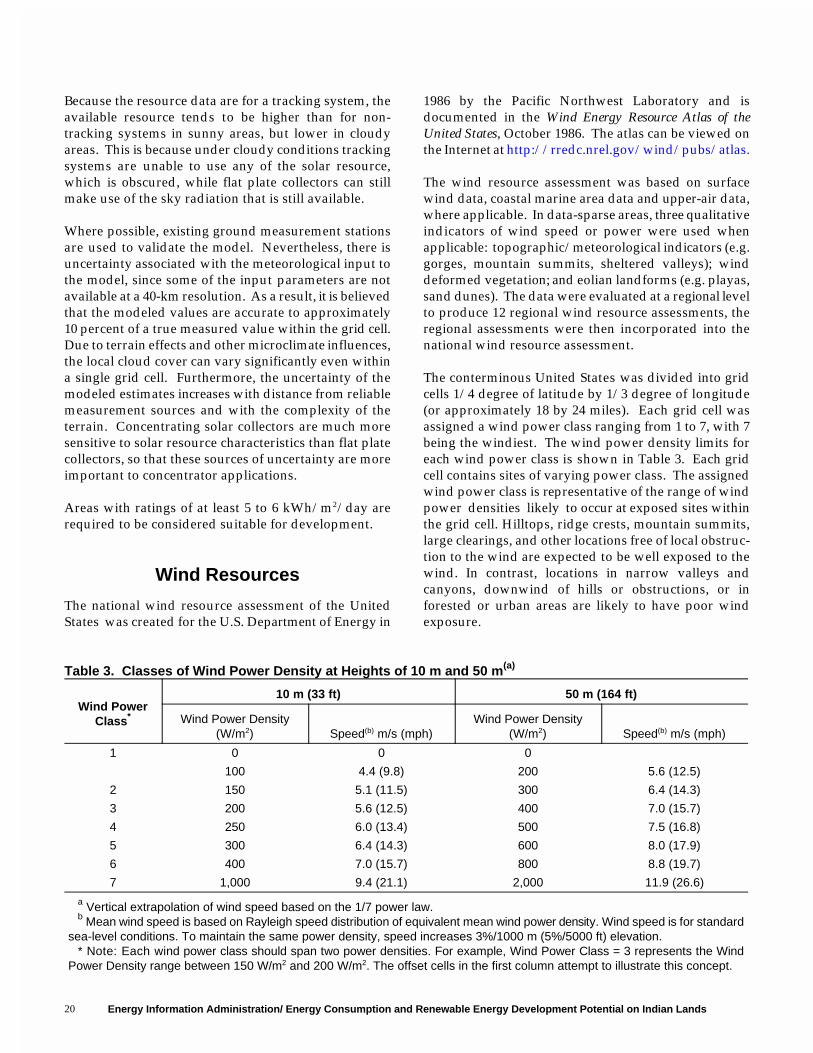
The conterminous United States was divided into gridcells 1/4 degree of latitude by 1/3 degree of longitude(or approximately 18 by 24 miles). Each grid cell wasassigned a wind power class ranging from 1 to 7, with 7being the windiest. The wind power density limits foreach wind power class is shown in Table 3. Each gridcell contains sites of varying power class. The assignedwind power class is representative of the range of windpower densities likely to occur at exposed sites withinthe grid cell. Hilltops, ridge crests, mountain summits,large clearings, and other locations free of local obstruc-tion to the wind are expected to be well exposed to thewind. In contrast, locations in narrow valleys andcanyons, downwind of hills or obstructions, or inforested or urban areas are likely to have poor windexposure.
Table 3. Classes of Wind Power Density at Heights of 10 m and 50 m(a)
Wind PowerClass*
10 m (33 ft) 50 m (164 ft)
Wind Power Density(W/m2) Speed(b) m/s (mph)
Wind Power Density(W/m2) Speed(b) m/s (mph)
1 0 0 0
100 4.4 (9.8) 200 5.6 (12.5)
2 150 5.1 (11.5) 300 6.4 (14.3)
3 200 5.6 (12.5) 400 7.0 (15.7)
4 250 6.0 (13.4) 500 7.5 (16.8)
5 300 6.4 (14.3) 600 8.0 (17.9)
6 400 7.0 (15.7) 800 8.8 (19.7)
7 1,000 9.4 (21.1) 2,000 11.9 (26.6)
a Vertical extrapolation of wind speed based on the 1/7 power law. b Mean wind speed is based on Rayleigh speed distribution of equivalent mean wind power density. Wind speed is for standard
sea-level conditions. To maintain the same power density, speed increases 3%/1000 m (5%/5000 ft) elevation. * Note: Each wind power class should span two power densities. For example, Wind Power Class = 3 represents the Wind
Power Density range between 150 W/m2 and 200 W/m2. The offset cells in the first column attempt to illustrate this concept.
Energy Information Administration/ Energy Consumption and Renewable Energy Development Potential on Indian Lands 21
12 Geothermal Lab, Department of Geological Sciences, Southern Methodist University. Website athttp://www.smu.edu/~geothermal.
13 Blackwell, D.D., K.W. Wisian, and J.L. Steele, Geothermal Resource/Reservoir Investigations Based On Heat Flow And Thermal GradientData For The United States. Website at http://id.inel.gov/geothermal/fy97/explore/exp-16.html.
Areas designated class 4 or greater are suitable for mostutility-scale wind turbine applications, whereas class 2and 3 areas are marginal for utility-scale applications butmay be suitable for rural applications. Class 1 areas aregenerally not suitable, although a few locations (e.g.,exposed hilltops not shown on the maps) with adequatewind resource for wind turbine applications may exist insome class 1 areas. The degree of certainty with whichthe wind power class can be specified depends on threefactors: the abundance and quality of wind data; thecomplexity of the terrain; and the geographical varia-bility of the resource. A certainty rating was assigned toeach grid cell based on these three factors, and isincluded in the Wind Energy Resource Atlas of the UnitedStates.
Biomass Resources
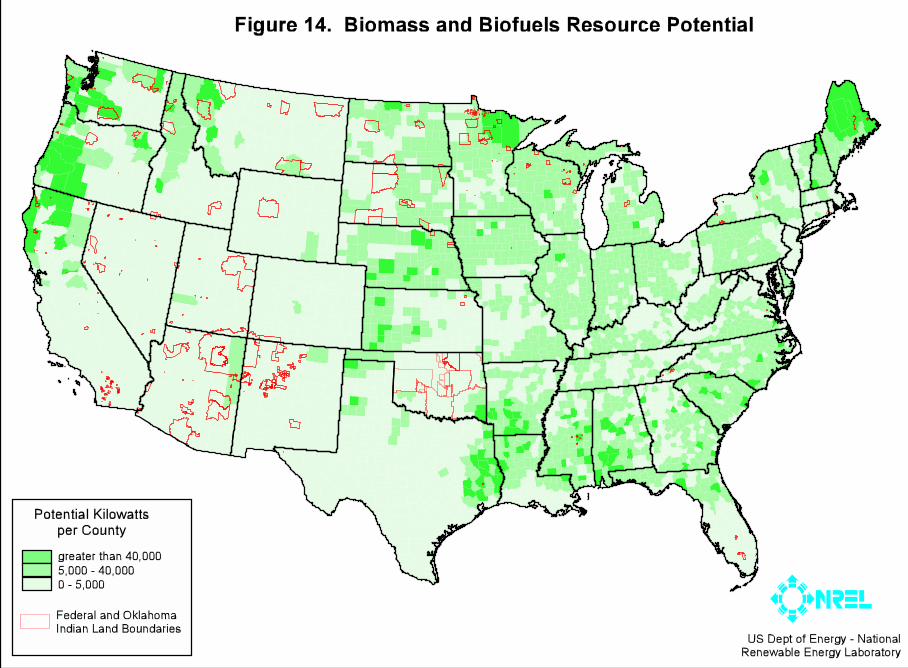
Figure 14 provides county-level estimates of biomassresources available for biofuels production or biomasspower stations. The map includes only those resourcesavailable from crop and forest residues. It does notinclude managed crop or forest resources, urbanresidues, municipal solid waste (MSW) or landfill gas(LFG).
The biomass resource data were derived from severalsources. One of the sources was an NREL contractedstudy of crop residue for 36 eastern States. The data arebased on a 3-year average of corn and wheat residueavailable for energy, taking into account tillage practicesand rainfall erosion deterrence. The units for the originaldata were in dry tons per county. These were convertedto total kilowatts per county by assuming that one dryton is equivalent to 1,100 kW-hr/yr at a 65-percent plantcapacity factor and a 35-percent plant conversionefficiency. This study only included the eastern 36 Stateswhere data were available. For a few of these 36 States,county level data were missing for a few counties. Thereport is in draft form, titled “Corn Stover and WheatStraw Removal Analysis” by Richard G. Nelson.
The forest residue data were derived from the forestinventory and analysis unit of the USDA Forest ServiceTimber Product Output database retrieval system (seehttp://srsfia.usfs.msstate.edu/rpa) web site. The data
used from this site were county level data for the con-terminous United States. The 1996 data included werelogging and mill residues, and other removals (pre-commercial thinnings, land clearing, timber standimprovements, etc.). The logging residue and otherremovals data were converted into potential kilowattsper county from thousand cubic feet. This was done byassuming that one thousand cubic feet of residue isequivalent to 14 dry tons, and a dry ton is equivalent to1,100 kW-hr/yr at a 65-percent plant capacity factor anda 35-percent plant conversion efficiency. The mill residuewas converted directly from thousand dry tons intopotential kilowatts per county.
A resource potential greater than 5,000 kilowatts percounty would be required to be a candidate for develop-ment.
Geothermal Resources
The map for geothermal resource potential was derivedfrom data obtained from the Southern Methodist Uni-versity Geothermal Laboratory, Dallas, TX.12 Theresource estimates are based on heat flow rates, whichare determined by multiplying the thermal gradient indegrees Kelvin per kilometer (0K/km) and the thermalconductivity in watts per meter degrees Kelvin (W/m-0K).13
Geo-referenced data of heat flow in units of mW/m2
(milliwatts per meter squared), provided by the SMUGeothermal Laboratory at a 5-km resolution, wereimported into the Geographic Information System (GIS).Contours were then interpolated for intervals of 10milliwatts/m2. Designations for electric generation,direct use, and ground-source heat pump applicationswere determined to approximate the maps shown on theState Energy Alternatives web site (http://www.eren.doe.gov/state_energy/index.cfm) as follows: (1) Areasdesignated as having electric generation potential showheat flow rates ranging from 80 to 151 mW/m2; (2)Areas designated with having direct use potential showheat flow rates ranging from 60 to 80 mW/m2; and (3)Areas with heat flow rates less than 60 mW/m2 areconsidered appropriate only for ground-source heatpump applications.
Energy Information Administration/ Energy Consumption and Renewable Energy Development Potential on Indian Lands22
14 For more information, see the INEL web site: http://www.inel.gov/national/hydropower/state/stateres.htm. The study began in1989 to assess the amount of undeveloped conventional hydropower potential in each State. The undeveloped hydropower potentialconsidered includes development three types of sites: new sites with no current development, addition of power generation to a currentlydeveloped site without generation, and an increase of capacity at existing generation sites.
Transmission Lines with Federal andOklahoma Indian Lands
Figure 16 data were received from the Federal EnergyManagement Administration (FEMA) around 1993 andrepresent a schematic of transmission line connectivity.As such, it can be used appropriately to show whetherthere is or is not a transmission line of a stated voltage insome given area. But it cannot be used for analysis thatwould require actual knowledge of easement locations.
Hydropower
While hydropower currently contributes the greatestshare of renewable electricity generation in the UnitedStates, there are several limitations to its expansion.Rivers provide multiple functions that must be balanced,including electricity production, recreation, fisheries andecological environments. The characteristics of eachlocation are unique and must be thoroughly evaluated ina public manner before licensing can be achieved. Thisis particularly true when considering new hydroelectricfacilities on Indian lands.
The Department of Energy, through its Idaho NationalEngineering and Environmental Laboratory (INEEL), inconjunction with the ORNL, developed a computermodel to perform a State-by-State assessment of un-developed hydropower potential, based upon theFederal Energy Regulatory Commission’s (FERC)Hydroelectric Power Resources Assessment databaseand other sources.14 The model takes into considerationvarious, cultural, fishery, geologic, historic, recreational,scenic and other environmental attributes. Based on theattributes of each site, a suitablility factor for develop-ment is assessed. For the purposes of this study, it iscritical to note that the model was developed to createregional totals and is not intended to provide definitiveestimates for specific sites.
The DOE hydropower program has estimated thefollowing generic information on hydroelectric develop-ments costs, based on 21 projects completed in 1993:
Average unit size: 31 MWCapital cost: $1,700 to $2,300 per kW Operation and maintenance costs: 0.7 cents/kWh
Operating life: 50 or more yearsCapacity factor: 40 to 50 percentTotal cost: 2.4 cents per kWh
If these characteristics are used to create a levelized costusing the cost of capital and a 20-year life consistentwith the other technologies considered in this report, thetotal cost ranges from 5.2 to 8.4 cents per kWh. Incontrast, DOE estimated that levelized total costs were2.4 cents per kWh. Part of the reason for their lowerlevelized cost compared to estimate is likely due to theconsideration of an economic recovery period of 50years rather than 20 years. This alone cannot account forthe entire difference, however, so a much lower cost ofcapital, such as 3 percent real annualized cost, musthave been used to achieve its levelized total costestimate of 2.4 cents per kWh.
As another point of comparison, FERC assumes a 30-year life in its hydropower licensing process. Makingthis assumption along with EIA assumptions on the realcost of capital, the total levelized cost ranges from 4.8 to7.7 cents per kWh.
Renewable Resources andDevelopment Costs for Indian Lands
General
This section of the report provides an economic assess-ment of the potential for renewable electricity projectson Indian tribal lands. Results are categorized separatelyfor central station and dispersed applications. Theseresults will be provided after a general description of themethods and data used to arrive at these conclusions.Following the major results is a section providingsupporting details, followed by a discussion of Federaland State renewable support programs which couldinfluence the bottom-line economic feasibility of Indiantribal land renewable energy projects. Since the bench-mark for central station renewable electricity prices iswholesale electricity prices, the final part of the sectioncontains a discussion of those prices.
General Approach
The renewable resource information provided by thepreviously shown maps along with cost information is
Energy Information Administration/ Energy Consumption and Renewable Energy Development Potential on Indian Lands 23
15 Energy Information Administration, Annual Energy Outlook 2000, DOE/EIA-0383(2000) (Washington, DC, December 1999). Theseprojections are produced using the National Energy Modeling System (NEMS).
16 U.S. Department of Energy and the Electric Power Research Institute, Renewable Technology Characteristics Characterizations, TR-109496(Palo Alto, California, December 1997).
17 The levelized cost equals (capital cost * discount rate/(1-(1/(1+discount rate)^years))) + annual fixed operating costs)/(8760 * capacityfactor) + variable operating cost.
used to determine the best resource by reservation.However, as discussed in the section on Project Criteriathat follows, a much more thorough and local evaluationof a resource would need to be conducted before anydevelopment decisions could be made.
An estimate of the levelized cost for electricity pro-duction from each resource was developed based onrenewable technology characteristics assumed by EIA inthe Annual Energy Outlook 2000.15 For each technologytype, a capital cost, fixed O&M cost, and variable O&Mcost were extracted for the year 2000. The capital costsare assumed to vary regionally based on labor andmaterial cost differentials, while O&M costs areassumed to be the same for all plants of the same type.Additional sources, such as the DOE Office of EnergyEfficiency and Renewable Energy/Electric PowerResearch Institute (EE/EPRI) Renewable TechnologyCharacteristics Characterizations,16 were consulted as well.In particular, data for geothermal was augmented, aswill be described below, because of the site-specifictreatment in the AEO2000 modeling framework.
A simple real levelized cost17 in 1998 cents per kWh wascomputed for each region and resource class based on a10- percent real discount rate and a 20-year economic lifeof equipment, except for hydropower, where equipmentlife was assumed to be 30 years. No adjustment wasmade for tax deductions associated with debt interestpayments, because these would not be available if thetribes make the investments. Further, since region-specific transmission costs were not known, they werenot included. As discussed in the Project Criteria Sec-tion, alternative cost of capital and financing assump-tions might apply. Any specific project evaluation wouldalso involve a much more sophisticated financial analy-sis taking into consideration the matching of generationoutput, demand levels, alternative prices, and thenecessary transmission, intertie, and distribution costs.
Highest Potential Renewable EnergyProjects
Central Station Generation
Some of the reservations have multiple renewableresource options, whereas others are not well situated
for any renewable resource development. Table 4 liststhe Indian lands with the greatest potential based on thefollowing:
� Reservation/renewable resource combinationshaving the lowest renewable development costpremium (excluding transmission costs), ex-cluding hydropower. These are generally basedon either wind or biomass; and
� The regional wholesale electricity price (whichincludes transmission costs)
Sixty-one reservations or TJSAs, which have 50 percentof the Indian population on Indian lands, appear to haveresources that could be developed for less than 2 centsper kWh above their regional wholesale prices. Withrenewable incentives at the State or Federal level(discussed below), these projects might be cost-effectivedepending on the cost of transmission required toconnect the new capacity to the grid.
Four reservations could generate central station renew-able-based electricity cheaper than the wholesale cost ofpower sold to those reservations, assuming EPACTproduction incentive payments were available. Thesereservations are: the Eastern Cherokee Reservation(NC), the Alabama and Coushatta Reservation (TX), theCoushatta Reservation (LA), and the Mississippi Choc-taw Reservation and Trust (MS). Biomass is therenewable resource of choice on all these lands. Therenewable electricity cost premium ranges from 0.1 centsper kWh to 0.7 cents per kWh.
For the 13 areas that have both wind and biomassresources, the biomass development cost is projected tobe lower than the wind development cost. However, ifa Production Tax Credit (PTC) or Renewable EnergyProduction Incentive (REPI) credit were available, thewind costs would be lower in a few cases. This isbecause biomass resources on Indian lands are notexpected to be “closed loop,” and therefore not eligiblefor these tax credits. In addition, some type of Staterenewable portfolio standard or public benefits fundsare available for 24 of the reservations.
A major assumption regarding the above cost premiumsis that transmission and distribution systems (T&D) are
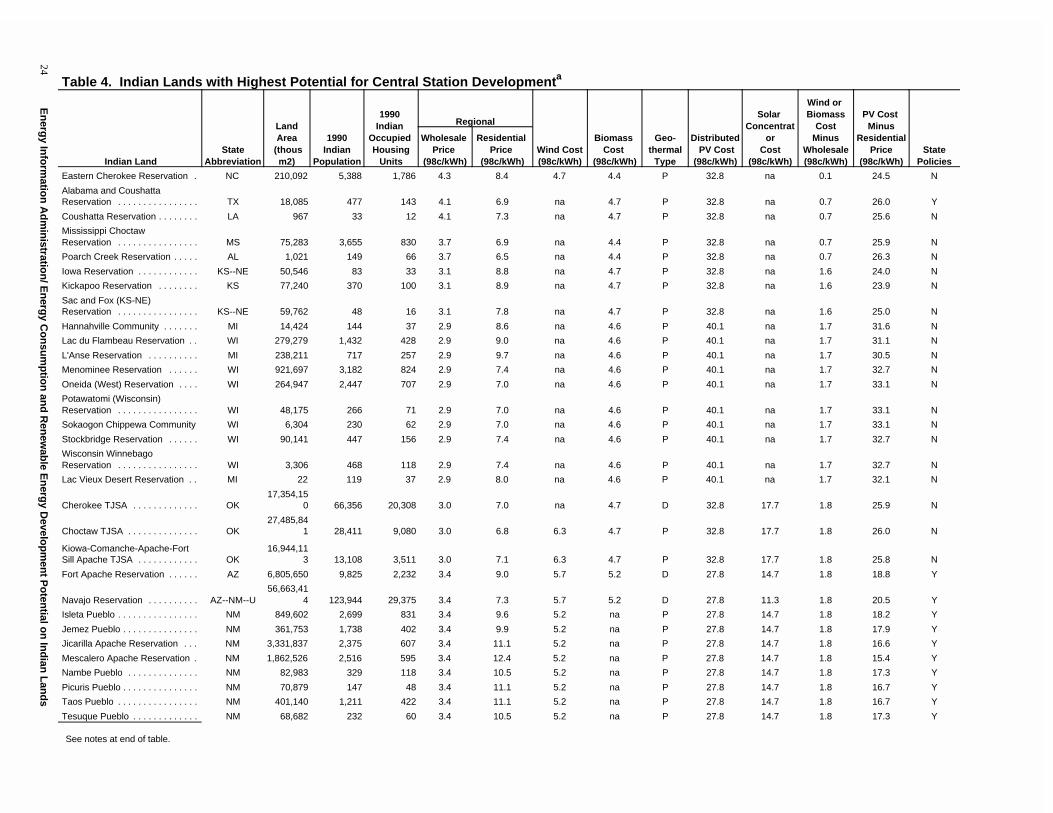
En
ergy In
form
ation
Ad
min
istration
/ En
ergy C
on
sum
ptio
n an
d R
enew
able E
nerg
y Develo
pm
ent P
oten
tial on
Ind
ian L
and
s24
Table 4. Indian Lands with Highest Potential for Central Station Developmenta
Indian LandState
Abbreviation
LandArea
(thousm2)
1990Indian
Population
1990 Indian
Occupied Housing
Units
Regional
Wind Cost(98c/kWh)
Biomass Cost
(98c/kWh)
Geo-thermal
Type
Distributed PV Cost
(98c/kWh)
Solar Concentrat
orCost
(98c/kWh)
Wind or Biomass
Cost Minus
Wholesale(98c/kWh)
PV Cost Minus
ResidentialPrice
(98c/kWh)State
Policies
Wholesale Price
(98c/kWh)
Residential Price
(98c/kWh)
Eastern Cherokee Reservation . NC 210,092 5,388 1,786 4.3 8.4 4.7 4.4 P 32.8 na 0.1 24.5 N
Alabama and CoushattaReservation . . . . . . . . . . . . . . . . TX 18,085 477 143 4.1 6.9 na 4.7 P 32.8 na 0.7 26.0 Y
Coushatta Reservation . . . . . . . . LA 967 33 12 4.1 7.3 na 4.7 P 32.8 na 0.7 25.6 N
Mississippi Choctaw Reservation . . . . . . . . . . . . . . . . MS 75,283 3,655 830 3.7 6.9 na 4.4 P 32.8 na 0.7 25.9 N
Poarch Creek Reservation . . . . . AL 1,021 149 66 3.7 6.5 na 4.4 P 32.8 na 0.7 26.3 N
Iowa Reservation . . . . . . . . . . . . KS--NE 50,546 83 33 3.1 8.8 na 4.7 P 32.8 na 1.6 24.0 N
Kickapoo Reservation . . . . . . . . KS 77,240 370 100 3.1 8.9 na 4.7 P 32.8 na 1.6 23.9 N
Sac and Fox (KS-NE) Reservation . . . . . . . . . . . . . . . . KS--NE 59,762 48 16 3.1 7.8 na 4.7 P 32.8 na 1.6 25.0 N
Hannahville Community . . . . . . . MI 14,424 144 37 2.9 8.6 na 4.6 P 40.1 na 1.7 31.6 N
Lac du Flambeau Reservation . . WI 279,279 1,432 428 2.9 9.0 na 4.6 P 40.1 na 1.7 31.1 N
L'Anse Reservation . . . . . . . . . . MI 238,211 717 257 2.9 9.7 na 4.6 P 40.1 na 1.7 30.5 N
Menominee Reservation . . . . . . WI 921,697 3,182 824 2.9 7.4 na 4.6 P 40.1 na 1.7 32.7 N
Oneida (West) Reservation . . . . WI 264,947 2,447 707 2.9 7.0 na 4.6 P 40.1 na 1.7 33.1 N
Potawatomi (Wisconsin)Reservation . . . . . . . . . . . . . . . . WI 48,175 266 71 2.9 7.0 na 4.6 P 40.1 na 1.7 33.1 N
Sokaogon Chippewa Community WI 6,304 230 62 2.9 7.0 na 4.6 P 40.1 na 1.7 33.1 N
Stockbridge Reservation . . . . . . WI 90,141 447 156 2.9 7.4 na 4.6 P 40.1 na 1.7 32.7 N
Wisconsin WinnebagoReservation . . . . . . . . . . . . . . . . WI 3,306 468 118 2.9 7.4 na 4.6 P 40.1 na 1.7 32.7 N
Lac Vieux Desert Reservation . . MI 22 119 37 2.9 8.0 na 4.6 P 40.1 na 1.7 32.1 N
Cherokee TJSA . . . . . . . . . . . . . OK17,354,15
0 66,356 20,308 3.0 7.0 na 4.7 D 32.8 17.7 1.8 25.9 N
Choctaw TJSA . . . . . . . . . . . . . . OK27,485,84
1 28,411 9,080 3.0 6.8 6.3 4.7 P 32.8 17.7 1.8 26.0 N
Kiowa-Comanche-Apache-FortSill Apache TJSA . . . . . . . . . . . . OK
16,944,113 13,108 3,511 3.0 7.1 6.3 4.7 P 32.8 17.7 1.8 25.8 N
Fort Apache Reservation . . . . . . AZ 6,805,650 9,825 2,232 3.4 9.0 5.7 5.2 D 27.8 14.7 1.8 18.8 Y
Navajo Reservation . . . . . . . . . . AZ--NM--U56,663,41
4 123,944 29,375 3.4 7.3 5.7 5.2 D 27.8 11.3 1.8 20.5 Y
Isleta Pueblo . . . . . . . . . . . . . . . . NM 849,602 2,699 831 3.4 9.6 5.2 na P 27.8 14.7 1.8 18.2 Y
Jemez Pueblo . . . . . . . . . . . . . . . NM 361,753 1,738 402 3.4 9.9 5.2 na P 27.8 14.7 1.8 17.9 Y
Jicarilla Apache Reservation . . . NM 3,331,837 2,375 607 3.4 11.1 5.2 na P 27.8 14.7 1.8 16.6 Y
Mescalero Apache Reservation . NM 1,862,526 2,516 595 3.4 12.4 5.2 na P 27.8 14.7 1.8 15.4 Y
Nambe Pueblo . . . . . . . . . . . . . . NM 82,983 329 118 3.4 10.5 5.2 na P 27.8 14.7 1.8 17.3 Y
Picuris Pueblo . . . . . . . . . . . . . . . NM 70,879 147 48 3.4 11.1 5.2 na P 27.8 14.7 1.8 16.7 Y
Taos Pueblo . . . . . . . . . . . . . . . . NM 401,140 1,211 422 3.4 11.1 5.2 na P 27.8 14.7 1.8 16.7 Y
Tesuque Pueblo . . . . . . . . . . . . . NM 68,682 232 60 3.4 10.5 5.2 na P 27.8 14.7 1.8 17.3 Y
See notes at end of table.
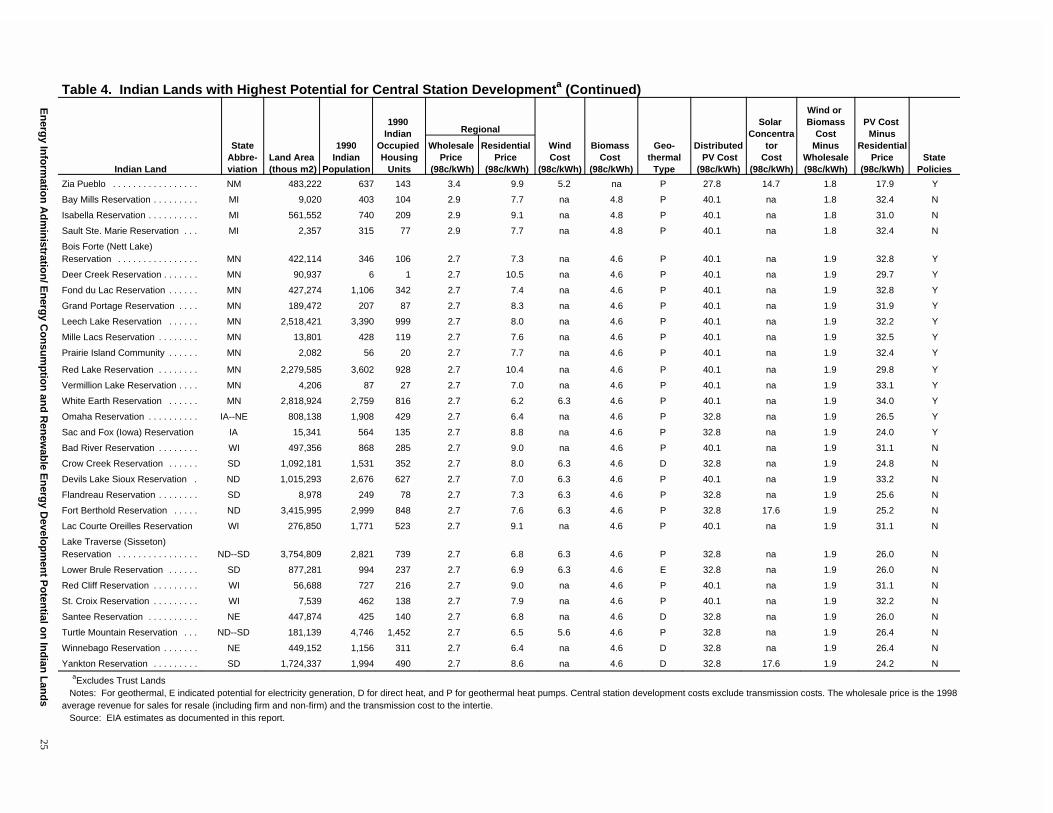
En
ergy In
form
ation
Ad
min
istration
/ En
ergy C
on
sum
ptio
n an
d R
enew
able E
nerg
y Develo
pm
ent P
oten
tial on
Ind
ian L
and
s25
Table 4. Indian Lands with Highest Potential for Central Station Developmenta (Continued)
Indian Land
StateAbbre-viation
Land Area (thous m2)
1990Indian
Population
1990 Indian
Occupied Housing
Units
Regional
WindCost
(98c/kWh)
Biomass Cost
(98c/kWh)
Geo-thermal
Type
Distributed PV Cost
(98c/kWh)
Solar Concentra
torCost
(98c/kWh)
Wind or Biomass
Cost Minus
Wholesale(98c/kWh)
PV Cost Minus
ResidentialPrice
(98c/kWh)State
Policies
Wholesale Price
(98c/kWh)
Residential Price
(98c/kWh)
Zia Pueblo . . . . . . . . . . . . . . . . . NM 483,222 637 143 3.4 9.9 5.2 na P 27.8 14.7 1.8 17.9 Y
Bay Mills Reservation . . . . . . . . . MI 9,020 403 104 2.9 7.7 na 4.8 P 40.1 na 1.8 32.4 N
Isabella Reservation . . . . . . . . . . MI 561,552 740 209 2.9 9.1 na 4.8 P 40.1 na 1.8 31.0 N
Sault Ste. Marie Reservation . . . MI 2,357 315 77 2.9 7.7 na 4.8 P 40.1 na 1.8 32.4 N
Bois Forte (Nett Lake) Reservation . . . . . . . . . . . . . . . . MN 422,114 346 106 2.7 7.3 na 4.6 P 40.1 na 1.9 32.8 Y
Deer Creek Reservation . . . . . . . MN 90,937 6 1 2.7 10.5 na 4.6 P 40.1 na 1.9 29.7 Y
Fond du Lac Reservation . . . . . . MN 427,274 1,106 342 2.7 7.4 na 4.6 P 40.1 na 1.9 32.8 Y
Grand Portage Reservation . . . . MN 189,472 207 87 2.7 8.3 na 4.6 P 40.1 na 1.9 31.9 Y
Leech Lake Reservation . . . . . . MN 2,518,421 3,390 999 2.7 8.0 na 4.6 P 40.1 na 1.9 32.2 Y
Mille Lacs Reservation . . . . . . . . MN 13,801 428 119 2.7 7.6 na 4.6 P 40.1 na 1.9 32.5 Y
Prairie Island Community . . . . . . MN 2,082 56 20 2.7 7.7 na 4.6 P 40.1 na 1.9 32.4 Y
Red Lake Reservation . . . . . . . . MN 2,279,585 3,602 928 2.7 10.4 na 4.6 P 40.1 na 1.9 29.8 Y
Vermillion Lake Reservation . . . . MN 4,206 87 27 2.7 7.0 na 4.6 P 40.1 na 1.9 33.1 Y
White Earth Reservation . . . . . . MN 2,818,924 2,759 816 2.7 6.2 6.3 4.6 P 40.1 na 1.9 34.0 Y
Omaha Reservation . . . . . . . . . . IA--NE 808,138 1,908 429 2.7 6.4 na 4.6 P 32.8 na 1.9 26.5 Y
Sac and Fox (Iowa) Reservation IA 15,341 564 135 2.7 8.8 na 4.6 P 32.8 na 1.9 24.0 Y
Bad River Reservation . . . . . . . . WI 497,356 868 285 2.7 9.0 na 4.6 P 40.1 na 1.9 31.1 N
Crow Creek Reservation . . . . . . SD 1,092,181 1,531 352 2.7 8.0 6.3 4.6 D 32.8 na 1.9 24.8 N
Devils Lake Sioux Reservation . ND 1,015,293 2,676 627 2.7 7.0 6.3 4.6 P 40.1 na 1.9 33.2 N
Flandreau Reservation . . . . . . . . SD 8,978 249 78 2.7 7.3 6.3 4.6 P 32.8 na 1.9 25.6 N
Fort Berthold Reservation . . . . . ND 3,415,995 2,999 848 2.7 7.6 6.3 4.6 P 32.8 17.6 1.9 25.2 N
Lac Courte Oreilles Reservation WI 276,850 1,771 523 2.7 9.1 na 4.6 P 40.1 na 1.9 31.1 N
Lake Traverse (Sisseton)Reservation . . . . . . . . . . . . . . . . ND--SD 3,754,809 2,821 739 2.7 6.8 6.3 4.6 P 32.8 na 1.9 26.0 N
Lower Brule Reservation . . . . . . SD 877,281 994 237 2.7 6.9 6.3 4.6 E 32.8 na 1.9 26.0 N
Red Cliff Reservation . . . . . . . . . WI 56,688 727 216 2.7 9.0 na 4.6 P 40.1 na 1.9 31.1 N
St. Croix Reservation . . . . . . . . . WI 7,539 462 138 2.7 7.9 na 4.6 P 40.1 na 1.9 32.2 N
Santee Reservation . . . . . . . . . . NE 447,874 425 140 2.7 6.8 na 4.6 D 32.8 na 1.9 26.0 N
Turtle Mountain Reservation . . . ND--SD 181,139 4,746 1,452 2.7 6.5 5.6 4.6 P 32.8 na 1.9 26.4 N
Winnebago Reservation . . . . . . . NE 449,152 1,156 311 2.7 6.4 na 4.6 D 32.8 na 1.9 26.4 N
Yankton Reservation . . . . . . . . . SD 1,724,337 1,994 490 2.7 8.6 na 4.6 D 32.8 17.6 1.9 24.2 N
aExcludes Trust Lands Notes: For geothermal, E indicated potential for electricity generation, D for direct heat, and P for geothermal heat pumps. Central station development costs exclude transmission costs. The wholesale price is the 1998average revenue for sales for resale (including firm and non-firm) and the transmission cost to the intertie. Source: EIA estimates as documented in this report.
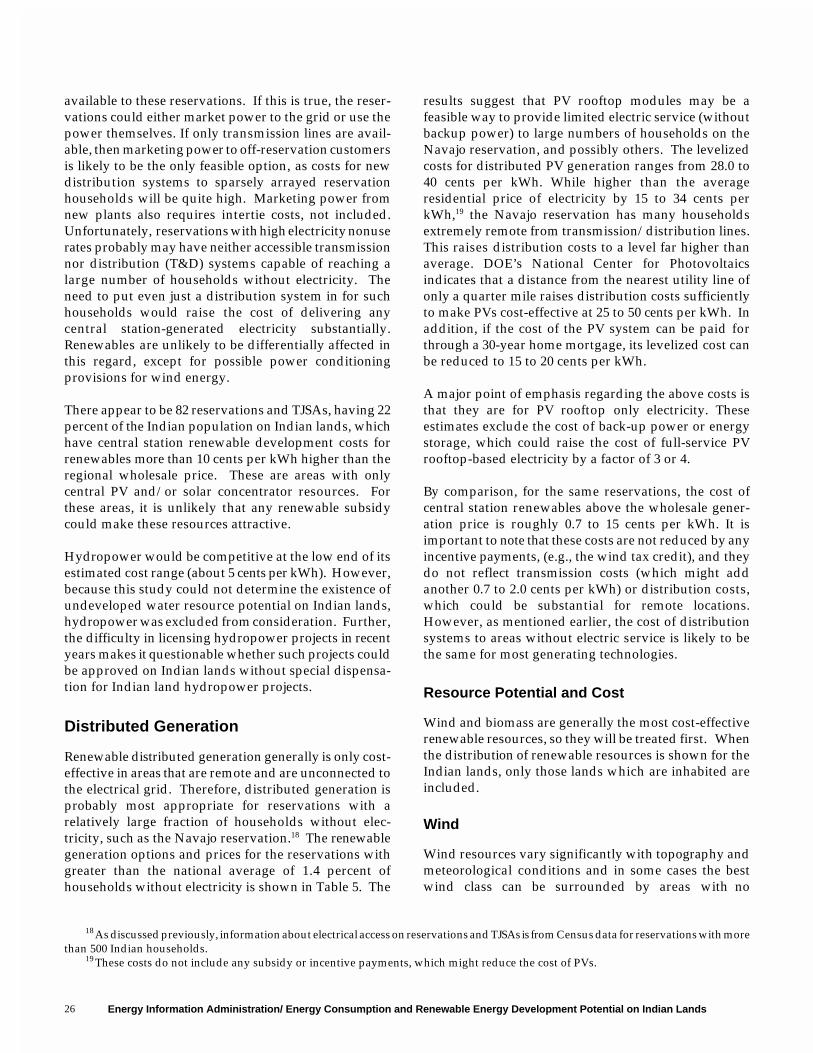
Energy Information Administration/ Energy Consumption and Renewable Energy Development Potential on Indian Lands26
18 As discussed previously, information about electrical access on reservations and TJSAs is from Census data for reservations with morethan 500 Indian households.
19 These costs do not include any subsidy or incentive payments, which might reduce the cost of PVs.
available to these reservations. If this is true, the reser-vations could either market power to the grid or use thepower themselves. If only transmission lines are avail-able, then marketing power to off-reservation customersis likely to be the only feasible option, as costs for newdistribution systems to sparsely arrayed reservationhouseholds will be quite high. Marketing power fromnew plants also requires intertie costs, not included.Unfortunately, reservations with high electricity nonuserates probably may have neither accessible transmissionnor distribution (T&D) systems capable of reaching alarge number of households without electricity. Theneed to put even just a distribution system in for suchhouseholds would raise the cost of delivering anycentral station-generated electricity substantially.Renewables are unlikely to be differentially affected inthis regard, except for possible power conditioningprovisions for wind energy.
There appear to be 82 reservations and TJSAs, having 22percent of the Indian population on Indian lands, whichhave central station renewable development costs forrenewables more than 10 cents per kWh higher than theregional wholesale price. These are areas with onlycentral PV and/or solar concentrator resources. Forthese areas, it is unlikely that any renewable subsidycould make these resources attractive.
Hydropower would be competitive at the low end of itsestimated cost range (about 5 cents per kWh). However,because this study could not determine the existence ofundeveloped water resource potential on Indian lands,hydropower was excluded from consideration. Further,the difficulty in licensing hydropower projects in recentyears makes it questionable whether such projects couldbe approved on Indian lands without special dispensa-tion for Indian land hydropower projects.
Distributed Generation
Renewable distributed generation generally is only cost-effective in areas that are remote and are unconnected tothe electrical grid. Therefore, distributed generation isprobably most appropriate for reservations with arelatively large fraction of households without elec-tricity, such as the Navajo reservation.18 The renewablegeneration options and prices for the reservations withgreater than the national average of 1.4 percent ofhouseholds without electricity is shown in Table 5. The
results suggest that PV rooftop modules may be afeasible way to provide limited electric service (withoutbackup power) to large numbers of households on theNavajo reservation, and possibly others. The levelizedcosts for distributed PV generation ranges from 28.0 to40 cents per kWh. While higher than the averageresidential price of electricity by 15 to 34 cents perkWh,19 the Navajo reservation has many householdsextremely remote from transmission/distribution lines.This raises distribution costs to a level far higher thanaverage. DOE’s National Center for Photovoltaicsindicates that a distance from the nearest utility line ofonly a quarter mile raises distribution costs sufficientlyto make PVs cost-effective at 25 to 50 cents per kWh. Inaddition, if the cost of the PV system can be paid forthrough a 30-year home mortgage, its levelized cost canbe reduced to 15 to 20 cents per kWh.
A major point of emphasis regarding the above costs isthat they are for PV rooftop only electricity. Theseestimates exclude the cost of back-up power or energystorage, which could raise the cost of full-service PVrooftop-based electricity by a factor of 3 or 4.
By comparison, for the same reservations, the cost ofcentral station renewables above the wholesale gener-ation price is roughly 0.7 to 15 cents per kWh. It isimportant to note that these costs are not reduced by anyincentive payments, (e.g., the wind tax credit), and theydo not reflect transmission costs (which might addanother 0.7 to 2.0 cents per kWh) or distribution costs,which could be substantial for remote locations.However, as mentioned earlier, the cost of distributionsystems to areas without electric service is likely to bethe same for most generating technologies.
Resource Potential and Cost
Wind and biomass are generally the most cost-effectiverenewable resources, so they will be treated first. Whenthe distribution of renewable resources is shown for theIndian lands, only those lands which are inhabited areincluded.
Wind
Wind resources vary significantly with topography andmeteorological conditions and in some cases the bestwind class can be surrounded by areas with no
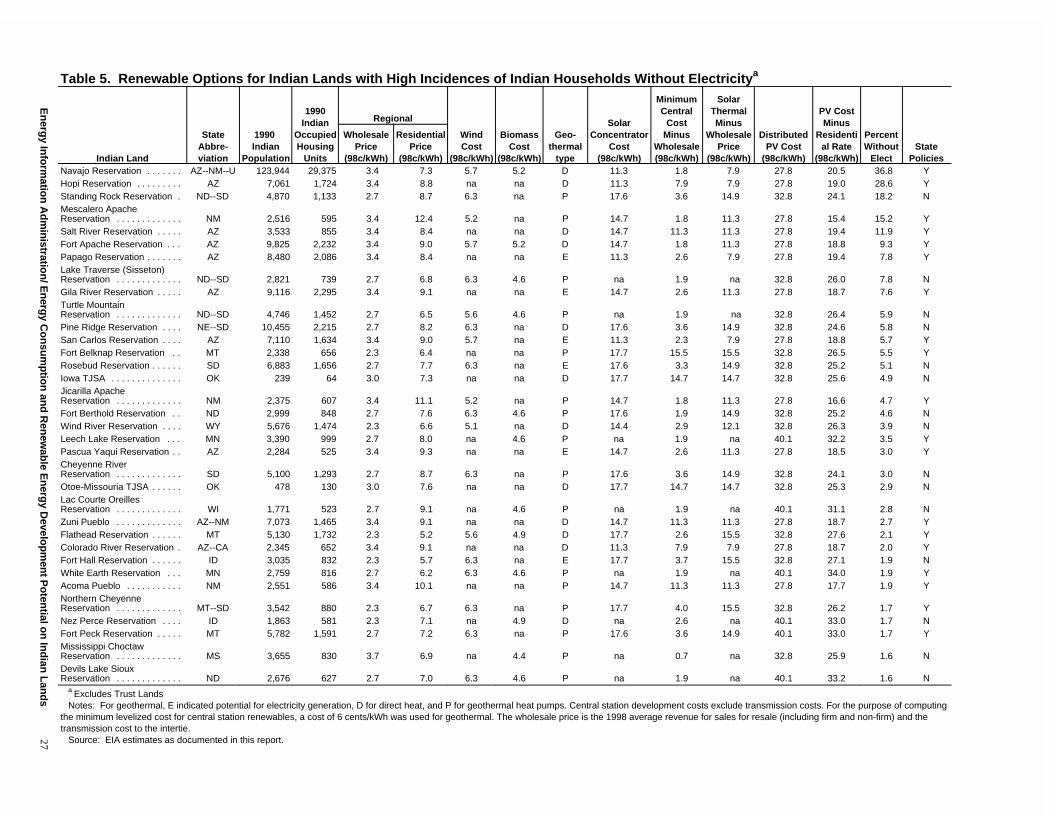
En
ergy In
form
ation
Ad
min
istration
/ En
ergy C
on
sum
ptio
n an
d R
enew
able E
nerg
y Develo
pm
ent P
oten
tial on
Ind
ian L
and
s27
Table 5. Renewable Options for Indian Lands with High Incidences of Indian Households Without Electricitya
Indian Land
StateAbbre-viation
1990 Indian
Population
1990Indian
OccupiedHousing
Units
Regional
WindCost
(98c/kWh)
BiomassCost
(98c/kWh)
Geo-thermal
type
SolarConcentrator
Cost(98c/kWh)
MinimumCentral
CostMinus
Wholesale(98c/kWh)
SolarThermalMinus
WholesalePrice
(98c/kWh)
DistributedPV Cost
(98c/kWh)
PV CostMinus
Residential Rate
(98c/kWh)
PercentWithout
ElectState
Policies
WholesalePrice
(98c/kWh)
ResidentialPrice
(98c/kWh)Navajo Reservation . . . . . . . AZ--NM--U 123,944 29,375 3.4 7.3 5.7 5.2 D 11.3 1.8 7.9 27.8 20.5 36.8 YHopi Reservation . . . . . . . . . AZ 7,061 1,724 3.4 8.8 na na D 11.3 7.9 7.9 27.8 19.0 28.6 YStanding Rock Reservation . ND--SD 4,870 1,133 2.7 8.7 6.3 na P 17.6 3.6 14.9 32.8 24.1 18.2 NMescalero ApacheReservation . . . . . . . . . . . . . NM 2,516 595 3.4 12.4 5.2 na P 14.7 1.8 11.3 27.8 15.4 15.2 YSalt River Reservation . . . . . AZ 3,533 855 3.4 8.4 na na D 14.7 11.3 11.3 27.8 19.4 11.9 YFort Apache Reservation . . . AZ 9,825 2,232 3.4 9.0 5.7 5.2 D 14.7 1.8 11.3 27.8 18.8 9.3 YPapago Reservation . . . . . . . AZ 8,480 2,086 3.4 8.4 na na E 11.3 2.6 7.9 27.8 19.4 7.8 YLake Traverse (Sisseton)Reservation . . . . . . . . . . . . . ND--SD 2,821 739 2.7 6.8 6.3 4.6 P na 1.9 na 32.8 26.0 7.8 NGila River Reservation . . . . . AZ 9,116 2,295 3.4 9.1 na na E 14.7 2.6 11.3 27.8 18.7 7.6 YTurtle Mountain Reservation . . . . . . . . . . . . . ND--SD 4,746 1,452 2.7 6.5 5.6 4.6 P na 1.9 na 32.8 26.4 5.9 NPine Ridge Reservation . . . . NE--SD 10,455 2,215 2.7 8.2 6.3 na D 17.6 3.6 14.9 32.8 24.6 5.8 NSan Carlos Reservation . . . . AZ 7,110 1,634 3.4 9.0 5.7 na E 11.3 2.3 7.9 27.8 18.8 5.7 YFort Belknap Reservation . . MT 2,338 656 2.3 6.4 na na P 17.7 15.5 15.5 32.8 26.5 5.5 YRosebud Reservation . . . . . . SD 6,883 1,656 2.7 7.7 6.3 na E 17.6 3.3 14.9 32.8 25.2 5.1 NIowa TJSA . . . . . . . . . . . . . . OK 239 64 3.0 7.3 na na D 17.7 14.7 14.7 32.8 25.6 4.9 NJicarilla Apache Reservation . . . . . . . . . . . . . NM 2,375 607 3.4 11.1 5.2 na P 14.7 1.8 11.3 27.8 16.6 4.7 YFort Berthold Reservation . . ND 2,999 848 2.7 7.6 6.3 4.6 P 17.6 1.9 14.9 32.8 25.2 4.6 NWind River Reservation . . . . WY 5,676 1,474 2.3 6.6 5.1 na D 14.4 2.9 12.1 32.8 26.3 3.9 NLeech Lake Reservation . . . MN 3,390 999 2.7 8.0 na 4.6 P na 1.9 na 40.1 32.2 3.5 YPascua Yaqui Reservation . . AZ 2,284 525 3.4 9.3 na na E 14.7 2.6 11.3 27.8 18.5 3.0 YCheyenne River Reservation . . . . . . . . . . . . . SD 5,100 1,293 2.7 8.7 6.3 na P 17.6 3.6 14.9 32.8 24.1 3.0 NOtoe-Missouria TJSA . . . . . . OK 478 130 3.0 7.6 na na D 17.7 14.7 14.7 32.8 25.3 2.9 NLac Courte OreillesReservation . . . . . . . . . . . . . WI 1,771 523 2.7 9.1 na 4.6 P na 1.9 na 40.1 31.1 2.8 NZuni Pueblo . . . . . . . . . . . . . AZ--NM 7,073 1,465 3.4 9.1 na na D 14.7 11.3 11.3 27.8 18.7 2.7 YFlathead Reservation . . . . . . MT 5,130 1,732 2.3 5.2 5.6 4.9 D 17.7 2.6 15.5 32.8 27.6 2.1 YColorado River Reservation . AZ--CA 2,345 652 3.4 9.1 na na D 11.3 7.9 7.9 27.8 18.7 2.0 YFort Hall Reservation . . . . . . ID 3,035 832 2.3 5.7 6.3 na E 17.7 3.7 15.5 32.8 27.1 1.9 NWhite Earth Reservation . . . MN 2,759 816 2.7 6.2 6.3 4.6 P na 1.9 na 40.1 34.0 1.9 YAcoma Pueblo . . . . . . . . . . . NM 2,551 586 3.4 10.1 na na P 14.7 11.3 11.3 27.8 17.7 1.9 YNorthern CheyenneReservation . . . . . . . . . . . . . MT--SD 3,542 880 2.3 6.7 6.3 na P 17.7 4.0 15.5 32.8 26.2 1.7 YNez Perce Reservation . . . . ID 1,863 581 2.3 7.1 na 4.9 D na 2.6 na 40.1 33.0 1.7 NFort Peck Reservation . . . . . MT 5,782 1,591 2.7 7.2 6.3 na P 17.6 3.6 14.9 40.1 33.0 1.7 YMississippi ChoctawReservation . . . . . . . . . . . . . MS 3,655 830 3.7 6.9 na 4.4 P na 0.7 na 32.8 25.9 1.6 NDevils Lake SiouxReservation . . . . . . . . . . . . . ND 2,676 627 2.7 7.0 6.3 4.6 P na 1.9 na 40.1 33.2 1.6 N
a Excludes Trust Lands Notes: For geothermal, E indicated potential for electricity generation, D for direct heat, and P for geothermal heat pumps. Central station development costs exclude transmission costs. For the purpose of computingthe minimum levelized cost for central station renewables, a cost of 6 cents/kWh was used for geothermal. The wholesale price is the 1998 average revenue for sales for resale (including firm and non-firm) and thetransmission cost to the intertie. Source: EIA estimates as documented in this report.
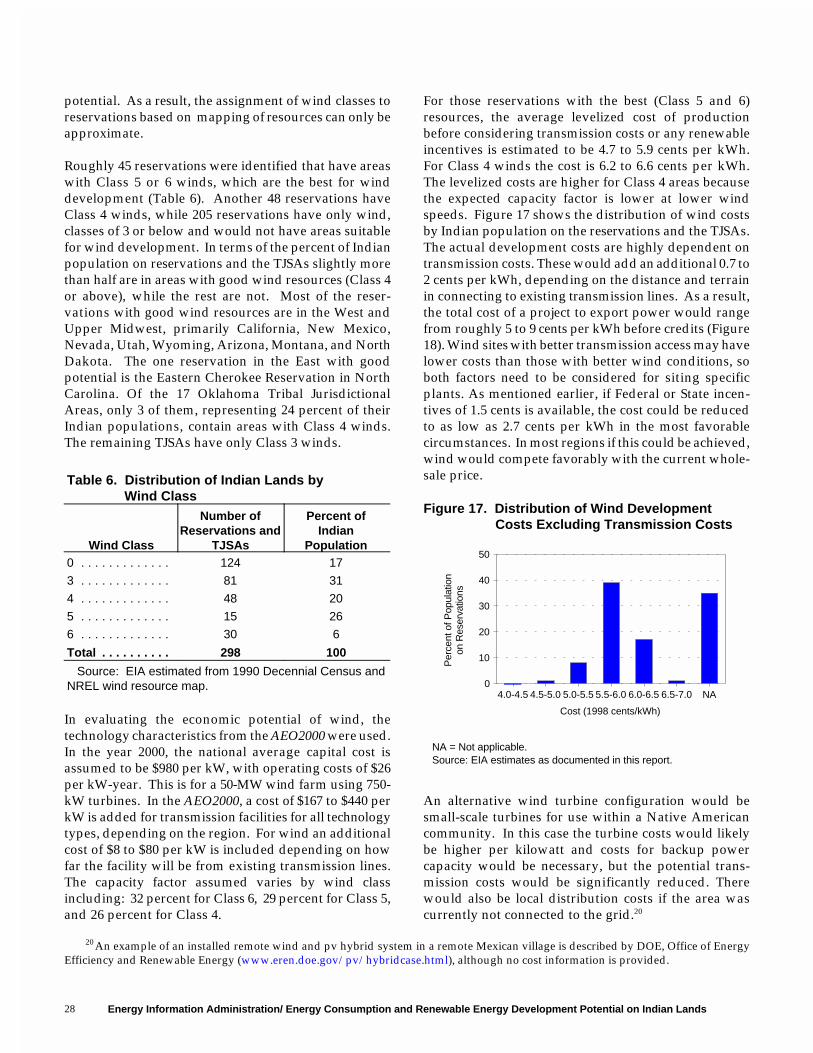
Energy Information Administration/ Energy Consumption and Renewable Energy Development Potential on Indian Lands28
20 An example of an installed remote wind and pv hybrid system in a remote Mexican village is described by DOE, Office of EnergyEfficiency and Renewable Energy (www.eren.doe.gov/pv/hybridcase.html), although no cost information is provided.
4.0-4.5 4.5-5.0 5.0-5.5 5.5-6.0 6.0-6.5 6.5-7.0 NA
Cost (1998 cents/kWh)
0
10
20
30
40
50
Per
cent
of P
opul
atio
non
Res
erva
tions
Figure 17. Distribution of Wind Development Costs Excluding Transmission Costs
NA = Not applicable. Source: EIA estimates as documented in this report.
potential. As a result, the assignment of wind classes toreservations based on mapping of resources can only beapproximate.
Roughly 45 reservations were identified that have areaswith Class 5 or 6 winds, which are the best for winddevelopment (Table 6). Another 48 reservations haveClass 4 winds, while 205 reservations have only wind,classes of 3 or below and would not have areas suitablefor wind development. In terms of the percent of Indianpopulation on reservations and the TJSAs slightly morethan half are in areas with good wind resources (Class 4or above), while the rest are not. Most of the reser-vations with good wind resources are in the West andUpper Midwest, primarily California, New Mexico,Nevada, Utah, Wyoming, Arizona, Montana, and NorthDakota. The one reservation in the East with goodpotential is the Eastern Cherokee Reservation in NorthCarolina. Of the 17 Oklahoma Tribal JurisdictionalAreas, only 3 of them, representing 24 percent of theirIndian populations, contain areas with Class 4 winds.The remaining TJSAs have only Class 3 winds.
In evaluating the economic potential of wind, thetechnology characteristics from the AEO2000 were used.In the year 2000, the national average capital cost isassumed to be $980 per kW, with operating costs of $26per kW-year. This is for a 50-MW wind farm using 750-kW turbines. In the AEO2000, a cost of $167 to $440 perkW is added for transmission facilities for all technologytypes, depending on the region. For wind an additionalcost of $8 to $80 per kW is included depending on howfar the facility will be from existing transmission lines.The capacity factor assumed varies by wind classincluding: 32 percent for Class 6, 29 percent for Class 5,and 26 percent for Class 4.
For those reservations with the best (Class 5 and 6)resources, the average levelized cost of productionbefore considering transmission costs or any renewableincentives is estimated to be 4.7 to 5.9 cents per kWh.For Class 4 winds the cost is 6.2 to 6.6 cents per kWh.The levelized costs are higher for Class 4 areas becausethe expected capacity factor is lower at lower windspeeds. Figure 17 shows the distribution of wind costsby Indian population on the reservations and the TJSAs.The actual development costs are highly dependent ontransmission costs. These would add an additional 0.7 to2 cents per kWh, depending on the distance and terrainin connecting to existing transmission lines. As a result,the total cost of a project to export power would rangefrom roughly 5 to 9 cents per kWh before credits (Figure18). Wind sites with better transmission access may havelower costs than those with better wind conditions, soboth factors need to be considered for siting specificplants. As mentioned earlier, if Federal or State incen-tives of 1.5 cents is available, the cost could be reducedto as low as 2.7 cents per kWh in the most favorablecircumstances. In most regions if this could be achieved,wind would compete favorably with the current whole-sale price.
An alternative wind turbine configuration would besmall-scale turbines for use within a Native Americancommunity. In this case the turbine costs would likelybe higher per kilowatt and costs for backup powercapacity would be necessary, but the potential trans-mission costs would be significantly reduced. Therewould also be local distribution costs if the area wascurrently not connected to the grid.20
Table 6. Distribution of Indian Lands byWind Class
Wind Class
Number ofReservations and
TJSAs
Percent ofIndian
Population0 . . . . . . . . . . . . . 124 17
3 . . . . . . . . . . . . . 81 31
4 . . . . . . . . . . . . . 48 20
5 . . . . . . . . . . . . . 15 26
6 . . . . . . . . . . . . . 30 6
Total . . . . . . . . . . 298 100
Source: EIA estimated from 1990 Decennial Census andNREL wind resource map.
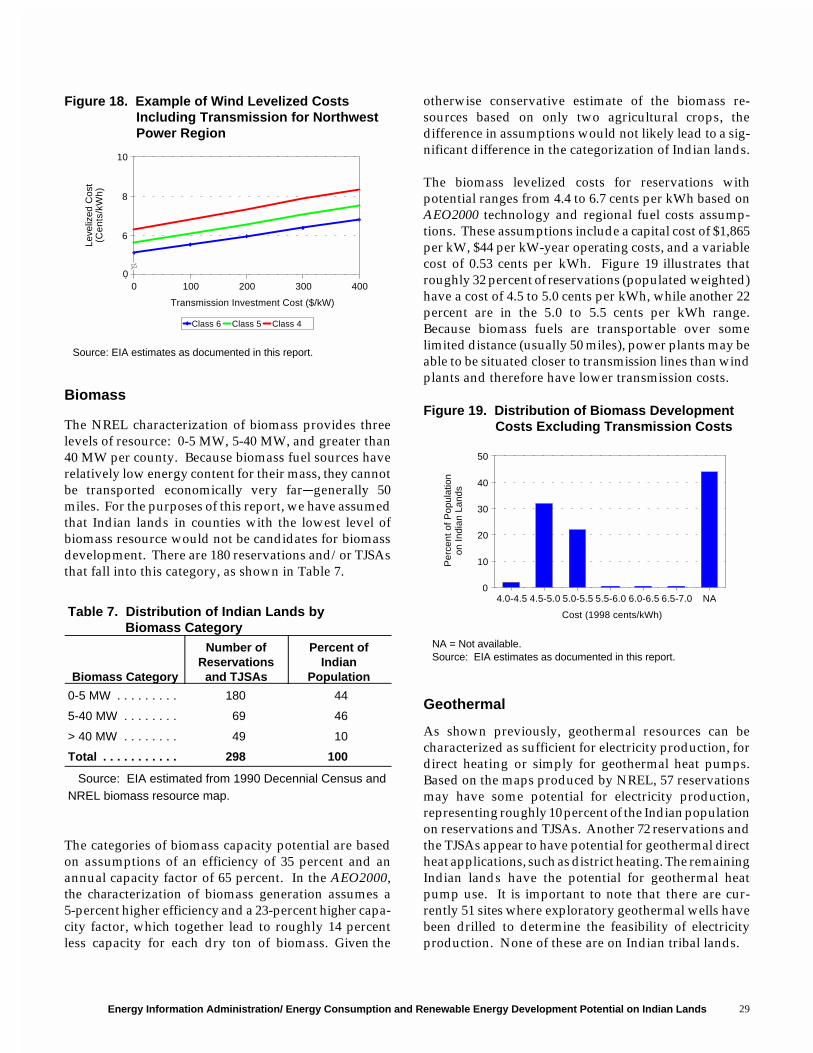
Energy Information Administration/ Energy Consumption and Renewable Energy Development Potential on Indian Lands 29
4.0-4.5 4.5-5.0 5.0-5.5 5.5-6.0 6.0-6.5 6.5-7.0 NA
Cost (1998 cents/kWh)
0
10
20
30
40
50P
erce
nt o
f Pop
ulat
ion
on In
dian
Lan
ds
Figure 19. Distribution of Biomass DevelopmentCosts Excluding Transmission Costs
Table 7. Distribution of Indian Lands byBiomass Category
Biomass Category
Number ofReservations
and TJSAs
Percent ofIndian
Population
0-5 MW . . . . . . . . . 180 44
5-40 MW . . . . . . . . 69 46
> 40 MW . . . . . . . . 49 10
Total . . . . . . . . . . . 298 100
Source: EIA estimated from 1990 Decennial Census andNREL biomass resource map.
Biomass
The NREL characterization of biomass provides threelevels of resource: 0-5 MW, 5-40 MW, and greater than40 MW per county. Because biomass fuel sources haverelatively low energy content for their mass, they cannotbe transported economically very far&generally 50miles. For the purposes of this report, we have assumedthat Indian lands in counties with the lowest level ofbiomass resource would not be candidates for biomassdevelopment. There are 180 reservations and/or TJSAsthat fall into this category, as shown in Table 7.
The categories of biomass capacity potential are basedon assumptions of an efficiency of 35 percent and anannual capacity factor of 65 percent. In the AEO2000,the characterization of biomass generation assumes a5-percent higher efficiency and a 23-percent higher capa-city factor, which together lead to roughly 14 percentless capacity for each dry ton of biomass. Given the
otherwise conservative estimate of the biomass re-sources based on only two agricultural crops, thedifference in assumptions would not likely lead to a sig-nificant difference in the categorization of Indian lands.
The biomass levelized costs for reservations withpotential ranges from 4.4 to 6.7 cents per kWh based onAEO2000 technology and regional fuel costs assump-tions. These assumptions include a capital cost of $1,865per kW, $44 per kW-year operating costs, and a variablecost of 0.53 cents per kWh. Figure 19 illustrates thatroughly 32 percent of reservations (populated weighted)have a cost of 4.5 to 5.0 cents per kWh, while another 22percent are in the 5.0 to 5.5 cents per kWh range.Because biomass fuels are transportable over somelimited distance (usually 50 miles), power plants may beable to be situated closer to transmission lines than windplants and therefore have lower transmission costs.
Geothermal
As shown previously, geothermal resources can becharacterized as sufficient for electricity production, fordirect heating or simply for geothermal heat pumps.Based on the maps produced by NREL, 57 reservationsmay have some potential for electricity production,representing roughly 10 percent of the Indian populationon reservations and TJSAs. Another 72 reservations andthe TJSAs appear to have potential for geothermal directheat applications, such as district heating. The remainingIndian lands have the potential for geothermal heatpump use. It is important to note that there are cur-rently 51 sites where exploratory geothermal wells havebeen drilled to determine the feasibility of electricityproduction. None of these are on Indian tribal lands.
NA = Not available. Source: EIA estimates as documented in this report.
0 100 200 300 400
Transmission Investment Cost ($/kW)
4
6
8
10
Leve
lized
Cos
t(C
ents
/kW
h)
Class 6 Class 5 Class 4
0
Figure 18. Example of Wind Levelized Costs Including Transmission for NorthwestPower Region
Source: EIA estimates as documented in this report.
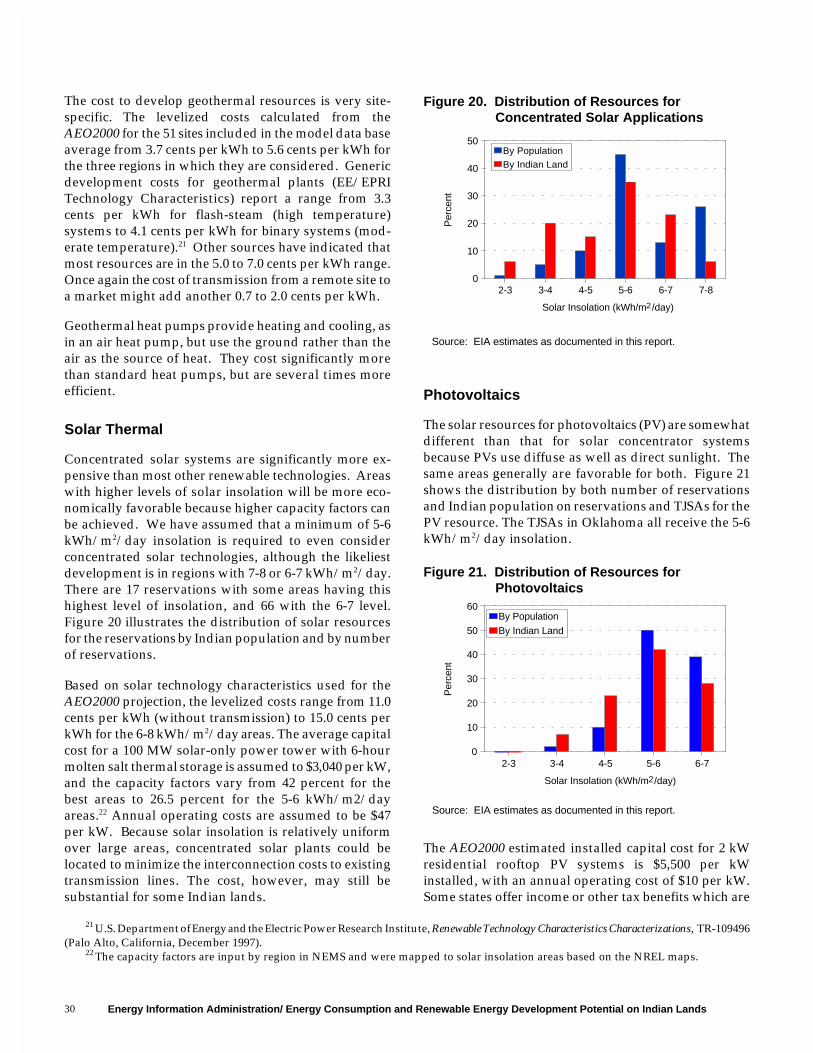
Energy Information Administration/ Energy Consumption and Renewable Energy Development Potential on Indian Lands30
21 U.S. Department of Energy and the Electric Power Research Institute, Renewable Technology Characteristics Characterizations, TR-109496(Palo Alto, California, December 1997).
22 The capacity factors are input by region in NEMS and were mapped to solar insolation areas based on the NREL maps.
2-3 3-4 4-5 5-6 6-7
Solar Insolation (kWh/m /day)
0
10
20
30
40
50
60
Per
cent
By Population
By Indian Land
2
Figure 21. Distribution of Resources for Photovoltaics
The cost to develop geothermal resources is very site-specific. The levelized costs calculated from theAEO2000 for the 51 sites included in the model data baseaverage from 3.7 cents per kWh to 5.6 cents per kWh forthe three regions in which they are considered. Genericdevelopment costs for geothermal plants (EE/EPRITechnology Characteristics) report a range from 3.3cents per kWh for flash-steam (high temperature)systems to 4.1 cents per kWh for binary systems (mod-erate temperature).21 Other sources have indicated thatmost resources are in the 5.0 to 7.0 cents per kWh range.Once again the cost of transmission from a remote site toa market might add another 0.7 to 2.0 cents per kWh.
Geothermal heat pumps provide heating and cooling, asin an air heat pump, but use the ground rather than theair as the source of heat. They cost significantly morethan standard heat pumps, but are several times moreefficient.
Solar Thermal
Concentrated solar systems are significantly more ex-pensive than most other renewable technologies. Areaswith higher levels of solar insolation will be more eco-nomically favorable because higher capacity factors canbe achieved. We have assumed that a minimum of 5-6kWh/m2/day insolation is required to even considerconcentrated solar technologies, although the likeliestdevelopment is in regions with 7-8 or 6-7 kWh/m2/day.There are 17 reservations with some areas having thishighest level of insolation, and 66 with the 6-7 level.Figure 20 illustrates the distribution of solar resourcesfor the reservations by Indian population and by numberof reservations.
Based on solar technology characteristics used for theAEO2000 projection, the levelized costs range from 11.0cents per kWh (without transmission) to 15.0 cents perkWh for the 6-8 kWh/m2/day areas. The average capitalcost for a 100 MW solar-only power tower with 6-hourmolten salt thermal storage is assumed to $3,040 per kW,and the capacity factors vary from 42 percent for thebest areas to 26.5 percent for the 5-6 kWh/m2/dayareas.22 Annual operating costs are assumed to be $47per kW. Because solar insolation is relatively uniformover large areas, concentrated solar plants could belocated to minimize the interconnection costs to existingtransmission lines. The cost, however, may still besubstantial for some Indian lands.
Photovoltaics
The solar resources for photovoltaics (PV) are somewhatdifferent than that for solar concentrator systemsbecause PVs use diffuse as well as direct sunlight. Thesame areas generally are favorable for both. Figure 21shows the distribution by both number of reservationsand Indian population on reservations and TJSAs for thePV resource. The TJSAs in Oklahoma all receive the 5-6kWh/m2/day insolation.
The AEO2000 estimated installed capital cost for 2 kWresidential rooftop PV systems is $5,500 per kWinstalled, with an annual operating cost of $10 per kW.Some states offer income or other tax benefits which are
2-3 3-4 4-5 5-6 6-7 7-8
Solar Insolation (kWh/m /day)
0
10
20
30
40
50
Per
cent
By PopulationBy Indian Land
2
Figure 20. Distribution of Resources for Concentrated Solar Applications
Source: EIA estimates as documented in this report.
Source: EIA estimates as documented in this report.
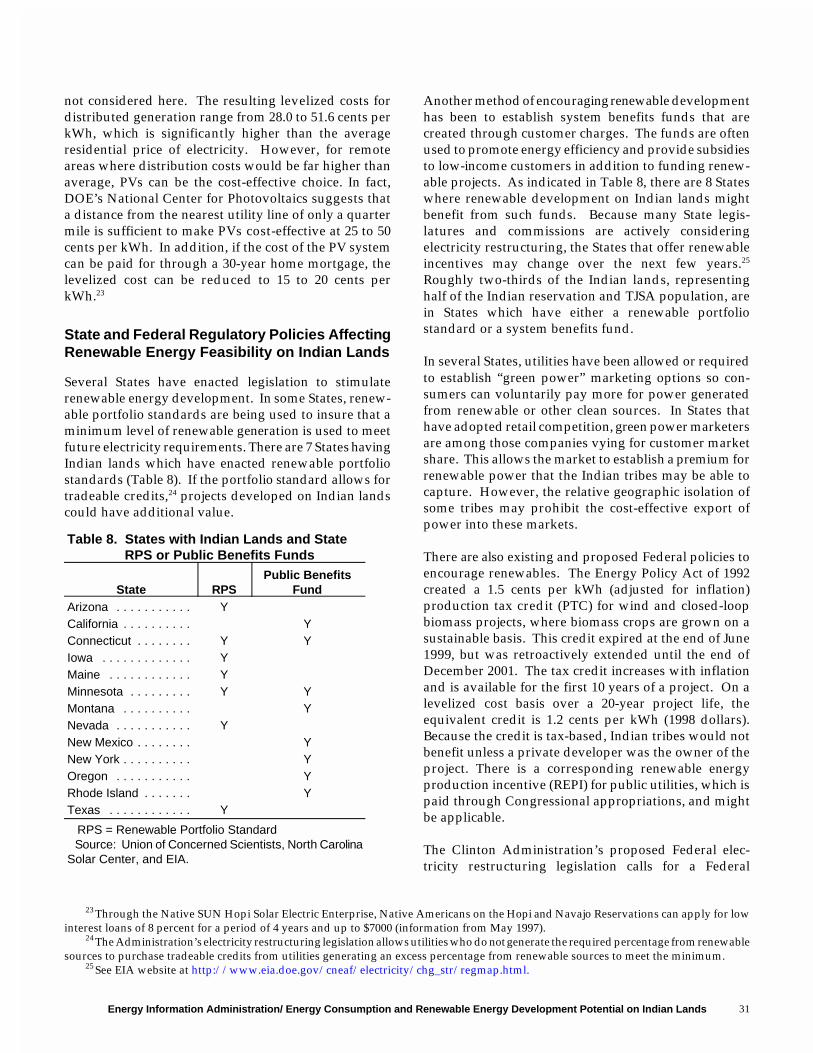
Energy Information Administration/ Energy Consumption and Renewable Energy Development Potential on Indian Lands 31
23 Through the Native SUN Hopi Solar Electric Enterprise, Native Americans on the Hopi and Navajo Reservations can apply for lowinterest loans of 8 percent for a period of 4 years and up to $7000 (information from May 1997).
24 The Administration’s electricity restructuring legislation allows utilities who do not generate the required percentage from renewablesources to purchase tradeable credits from utilities generating an excess percentage from renewable sources to meet the minimum.
25 See EIA website at http://www.eia.doe.gov/cneaf/electricity/chg_str/regmap.html.
not considered here. The resulting levelized costs fordistributed generation range from 28.0 to 51.6 cents perkWh, which is significantly higher than the averageresidential price of electricity. However, for remoteareas where distribution costs would be far higher thanaverage, PVs can be the cost-effective choice. In fact,DOE’s National Center for Photovoltaics suggests thata distance from the nearest utility line of only a quartermile is sufficient to make PVs cost-effective at 25 to 50cents per kWh. In addition, if the cost of the PV systemcan be paid for through a 30-year home mortgage, thelevelized cost can be reduced to 15 to 20 cents perkWh.23
State and Federal Regulatory Policies AffectingRenewable Energy Feasibility on Indian Lands
Several States have enacted legislation to stimulaterenewable energy development. In some States, renew-able portfolio standards are being used to insure that aminimum level of renewable generation is used to meetfuture electricity requirements. There are 7 States havingIndian lands which have enacted renewable portfoliostandards (Table 8). If the portfolio standard allows fortradeable credits,24 projects developed on Indian landscould have additional value.
Another method of encouraging renewable developmenthas been to establish system benefits funds that arecreated through customer charges. The funds are oftenused to promote energy efficiency and provide subsidiesto low-income customers in addition to funding renew-able projects. As indicated in Table 8, there are 8 Stateswhere renewable development on Indian lands mightbenefit from such funds. Because many State legis-latures and commissions are actively consideringelectricity restructuring, the States that offer renewableincentives may change over the next few years.25
Roughly two-thirds of the Indian lands, representinghalf of the Indian reservation and TJSA population, arein States which have either a renewable portfoliostandard or a system benefits fund.
In several States, utilities have been allowed or requiredto establish “green power” marketing options so con-sumers can voluntarily pay more for power generatedfrom renewable or other clean sources. In States thathave adopted retail competition, green power marketersare among those companies vying for customer marketshare. This allows the market to establish a premium forrenewable power that the Indian tribes may be able tocapture. However, the relative geographic isolation ofsome tribes may prohibit the cost-effective export ofpower into these markets.
There are also existing and proposed Federal policies toencourage renewables. The Energy Policy Act of 1992created a 1.5 cents per kWh (adjusted for inflation)production tax credit (PTC) for wind and closed-loopbiomass projects, where biomass crops are grown on asustainable basis. This credit expired at the end of June1999, but was retroactively extended until the end ofDecember 2001. The tax credit increases with inflationand is available for the first 10 years of a project. On alevelized cost basis over a 20-year project life, theequivalent credit is 1.2 cents per kWh (1998 dollars).Because the credit is tax-based, Indian tribes would notbenefit unless a private developer was the owner of theproject. There is a corresponding renewable energyproduction incentive (REPI) for public utilities, which ispaid through Congressional appropriations, and mightbe applicable.
The Clinton Administration’s proposed Federal elec-tricity restructuring legislation calls for a Federal
Table 8. States with Indian Lands and StateRPS or Public Benefits Funds
State RPSPublic Benefits
FundArizona . . . . . . . . . . . YCalifornia . . . . . . . . . . YConnecticut . . . . . . . . Y YIowa . . . . . . . . . . . . . YMaine . . . . . . . . . . . . YMinnesota . . . . . . . . . Y YMontana . . . . . . . . . . YNevada . . . . . . . . . . . YNew Mexico . . . . . . . . YNew York . . . . . . . . . . YOregon . . . . . . . . . . . YRhode Island . . . . . . . YTexas . . . . . . . . . . . . Y
RPS = Renewable Portfolio Standard Source: Union of Concerned Scientists, North CarolinaSolar Center, and EIA.
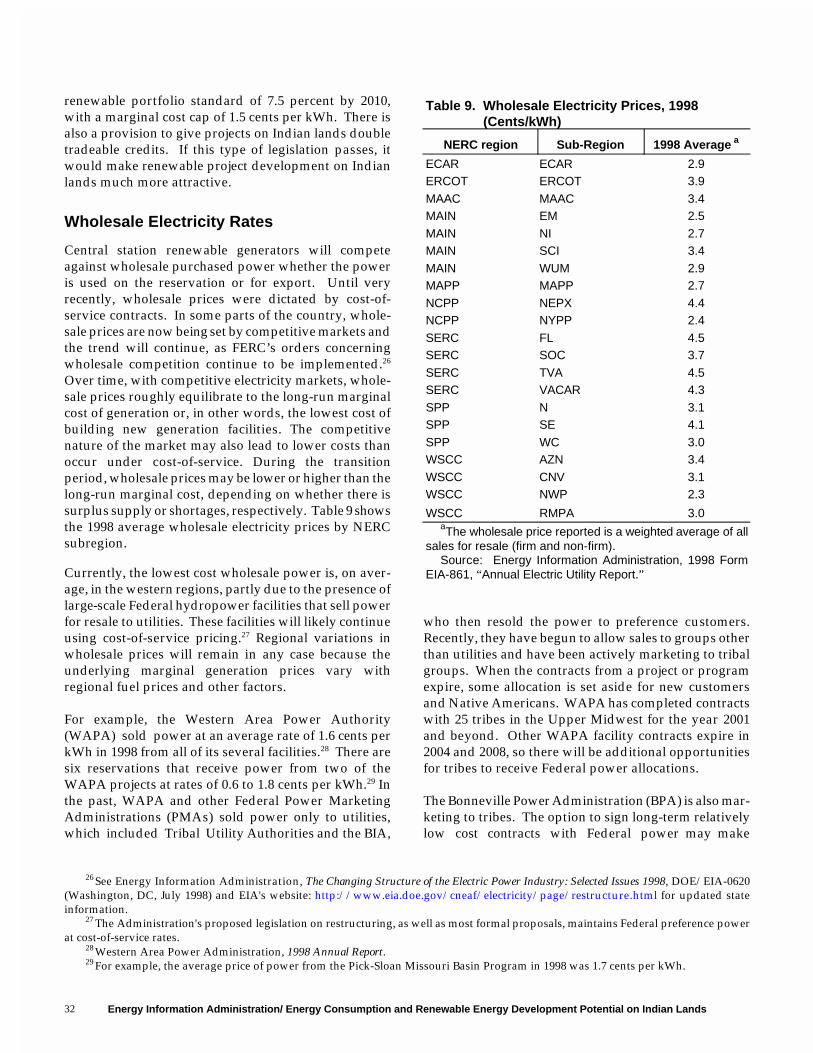
Energy Information Administration/ Energy Consumption and Renewable Energy Development Potential on Indian Lands32
26 See Energy Information Administration, The Changing Structure of the Electric Power Industry: Selected Issues 1998, DOE/EIA-0620(Washington, DC, July 1998) and EIA's website: http://www.eia.doe.gov/cneaf/electricity/page/restructure.html for updated stateinformation.
27 The Administration's proposed legislation on restructuring, as well as most formal proposals, maintains Federal preference powerat cost-of-service rates.
28 Western Area Power Administration, 1998 Annual Report.29 For example, the average price of power from the Pick-Sloan Missouri Basin Program in 1998 was 1.7 cents per kWh.
Table 9. Wholesale Electricity Prices, 1998(Cents/kWh)
NERC region Sub-Region 1998 Average a
ECAR ECAR 2.9ERCOT ERCOT 3.9
MAAC MAAC 3.4MAIN EM 2.5
MAIN NI 2.7MAIN SCI 3.4
MAIN WUM 2.9MAPP MAPP 2.7
NCPP NEPX 4.4NCPP NYPP 2.4
SERC FL 4.5SERC SOC 3.7
SERC TVA 4.5SERC VACAR 4.3
SPP N 3.1SPP SE 4.1
SPP WC 3.0WSCC AZN 3.4
WSCC CNV 3.1WSCC NWP 2.3
WSCC RMPA 3.0aThe wholesale price reported is a weighted average of all
sales for resale (firm and non-firm).Source: Energy Information Administration, 1998 Form
EIA-861, “Annual Electric Utility Report.”
renewable portfolio standard of 7.5 percent by 2010,with a marginal cost cap of 1.5 cents per kWh. There isalso a provision to give projects on Indian lands doubletradeable credits. If this type of legislation passes, itwould make renewable project development on Indianlands much more attractive.
Wholesale Electricity Rates
Central station renewable generators will competeagainst wholesale purchased power whether the poweris used on the reservation or for export. Until veryrecently, wholesale prices were dictated by cost-of-service contracts. In some parts of the country, whole-sale prices are now being set by competitive markets andthe trend will continue, as FERC’s orders concerningwholesale competition continue to be implemented.26
Over time, with competitive electricity markets, whole-sale prices roughly equilibrate to the long-run marginalcost of generation or, in other words, the lowest cost ofbuilding new generation facilities. The competitivenature of the market may also lead to lower costs thanoccur under cost-of-service. During the transitionperiod, wholesale prices may be lower or higher than thelong-run marginal cost, depending on whether there issurplus supply or shortages, respectively. Table 9 showsthe 1998 average wholesale electricity prices by NERCsubregion.
Currently, the lowest cost wholesale power is, on aver-age, in the western regions, partly due to the presence oflarge-scale Federal hydropower facilities that sell powerfor resale to utilities. These facilities will likely continueusing cost-of-service pricing.27 Regional variations inwholesale prices will remain in any case because theunderlying marginal generation prices vary withregional fuel prices and other factors.
For example, the Western Area Power Authority(WAPA) sold power at an average rate of 1.6 cents perkWh in 1998 from all of its several facilities.28 There aresix reservations that receive power from two of theWAPA projects at rates of 0.6 to 1.8 cents per kWh.29 Inthe past, WAPA and other Federal Power MarketingAdministrations (PMAs) sold power only to utilities,which included Tribal Utility Authorities and the BIA,
who then resold the power to preference customers.Recently, they have begun to allow sales to groups otherthan utilities and have been actively marketing to tribalgroups. When the contracts from a project or programexpire, some allocation is set aside for new customersand Native Americans. WAPA has completed contractswith 25 tribes in the Upper Midwest for the year 2001and beyond. Other WAPA facility contracts expire in2004 and 2008, so there will be additional opportunitiesfor tribes to receive Federal power allocations.
The Bonneville Power Administration (BPA) is also mar-keting to tribes. The option to sign long-term relativelylow cost contracts with Federal power may make
Energy Information Administration/ Energy Consumption and Renewable Energy Development Potential on Indian Lands 33
development of central station renewables less attractivefor many reservations, but also could be used to back upintermittent power from renewables.
Project Criteria
This section presents an analysis of factors that influencethe economic and technical feasibility of two types ofprojects: distributed generation and central stationplants. While the scope and risks of central stationpower plants are fundamentally greater than that ofdistributed generation, the basic evaluation processshould address the same factors. In the case of thecentral station plant, the studies and assessments shouldbe of greater detail, employing more sophisticatedforecasting techniques. Assessments of distributed gen-eration (in this instance assumed to be associated withindividual dwellings or clusters of dwellings), mustnecessarily consider the alternative of taking power froma central station power plant. In the evaluation of aproject to bring or expand electricity use on Tribal lands,both distributed generation applications and centralstation power plants require careful consideration.Further, substantial overlap exists in the factors thatneed to be considered.
As will be discussed in greater detail below, a first stepin any project evaluation is a clear statement of theobjectives of the project. The assessment should avoidthe narrow definition of the specific electricity needs onthe reservation and recognize the broader considerationsof Tribal cultures and infrastructure development needs.
Because of the scale of typical central station powerfacilities and the potential disruption to the reservationbrought about by these types of large projects, a holisticapproach may offer the only chance to completelysucceed with a project’s broader objectives. Most likely,employing this type of approach will enhance theacceptance and adoption of distributed generation.
Evaluating alternative approaches for electricity use onIndian lands should consider all the conventional alter-natives. However, the use of renewable energy resourcesmay be more consistent with historical Tribal cultures.The consideration of the use of a more environmentallybenign renewable resource will require a fuller con-sideration of “externalities” than may otherwise enterthe evaluation process. The project criteria discussedbelow are intended to provide a broad checklist toensure the wider consideration of these “externalities.”
A summary guide has been prepared to facilitate theevaluation of expanded electrification through the use ofrenewable technologies. “A Guide to Project Criteria forRenewable Project Planning Assessments,” provides alist of major activities and products, major tasksinvolved in the various assessments, and the areas ofinvestigation and information requirements. The Guideis subdivided into six basic areas for discussion and liststhe typical information requirements and approach toassessing project feasibility.
A detailed and complete discussion of all the factors andareas of investigation identified in the Guide are beyondthe limited scope of this paper. This paper will discusseach of the major activities and highlight some of thefactors more directly tied to the application of renewabletechnologies. While the Guide lists each activity in aspecific order, the activities are interrelated, inter-dependent, and would typically proceed in parallel.
Revenue Assessment
We list the revenue assessment first because it has thegreatest number of considerations unique to the appli-cation of renewable technologies. Revenue assessment isdefined here to include all sources of funding that can beidentified to support the project. Once a project and itsobjectives have been defined, the revenue assessmentshould begin.
There are a wide variety of potential funding vehiclesand sources that should be investigated. As identifiedin the column of areas of investigation, the spectrum offunding sources ranges from grants to customer reve-nues. The National and State interest in providing incen-tives for the development of renewable technologies,energy efficiency, and conservation offers project de-velopers a number of places to seek funding at variousstages of the project. For example, DOE grants may beavailable to fund specific feasibility studies. State levelinitiatives may provide revenue support for renewableprojects. The Guide footnotes a good source forreviewing lending sources available for select renewabletechnologies. Finally, the Federal and State level initia-tives for restructuring the electric power industry havefundamentally altered the available opportunities andmake it necessary to carefully consider these initiativeswhen seeking revenue sources and assessing marketopportunities. In particular, one should consider thepotential impact of “green power” and “renewableportfolio standards” that may be included in these Statelevel initiatives.
Energy Information Administration/ Energy Consumption and Renewable Energy Development Potential on Indian Lands34
30 Load factor is defined as the total energy consumption divided by the peak consumption multiplied by the number of hours in theperiod.
Demand Planning
Again, with an eye to the application of renewabletechnologies, understanding energy use and more spe-cifically the opportunities for electricity use are critical.The intermittent nature of many renewable technologiessuggests the need for storage or backup supplies.However, consumer awareness of these limitations mayallow for changes in typical consumer behavior that mayfacilitate the use of these technologies. Further, ifelectricity is being introduced for the first time, thenthese behavioral patterns may yet to be formed allowingfor an easier adoption of the technology.
The introduction or expansion of electricity use requirescareful consideration of the spatial distribution of load.Scattered and low densities (consumers per mile) makethe distribution of electricity relatively costly. Alter-native applications of distributed generation technologysuch as solar thermal space and water heating or PVelectrical applications, may be able to avoid muchinvestment in the transmission, distribution and centralstation generation facilities.
Finally, the daily and seasonal cycle in electricity usetends to translate into low load factors.30 A lower loadfactor requires a greater investment in capacity per unitof energy used. Since renewable technologies tend tohave higher investment costs, low load factor applica-tions tend to be less attractive. Marginal cost pricing ofelectricity should lead to shifting patterns of electricityuse to increase load factors, thereby creating greateropportunities for economical application of renewabletechnologies.
Indirect Impacts
Expanding the availability of electricity on Tribal landscan have a dramatic impact on the lives of all theresidents. Careful consideration of the economic devel-opment needs, cultural factors, and environmentalimpacts of alternative technologies will allow theapplication of the holistic approach mentioned above.Given the changing nature of the electricity industry andthe increased volatility in market prices, these factorsshould be a key project criteria and play an importantpart in the overall project assessment.
Infrastructure Assessment
The introduction of expanded electricity use on Triballands requires a review of the associated infrastructure
needs of the alternatives. A holistic approach would askabout the opportunities for employment, the associatededucational and training needs associated therewith,and other factors. The project(s) can bring economicdevelopment to the reservations but careful planningand coordination are required to fulfill the potential ofthese projects.
Financial Condition Assessment
The costs and impact of electrification of Tribal landswill require the commitment of Tribal resources. Theimpact of the project on the economic vitality of thereservation and the drain or expansion of its financialresources should be an important project criterion.Structured appropriately, the financial exposure andrisks to the reservation should be balanced with theanticipated returns.
Specific Project Assessment
Absent a holistic approach, this might be the only majoractivity contributing to the evaluation of alternativeelectricity production and use alternatives. However, asdiscussed above, there can and should be a muchbroader approach taken to the question of expanded useof electricity on Tribal lands. The major tasks identifiedin this section of the Guide represent the typical projectassessment considerations of any project whether itemploys renewable technologies or not. It is importantthat the alternatives are identified and the factors thatmake the selected project the best choice should behighlighted in the financial plan.
While there can be many formats or methods of docu-menting the evaluation and selection of projects forexpanded electrification and central station power pro-duction on Tribal lands, we have chosen to recommendthat all the considerations be brought together in asummary document we are calling the “Financial Plan.”This document could be used to present findings topotential financial sponsors, community groups, and keyTribal organizations to gain acceptance and approval.The effort to prepare a financial plan and present it tokey players will be critical to successfully marketing theproject to the various funding sources (identified in therevenue assessment activity) and to the Tribal com-munity.
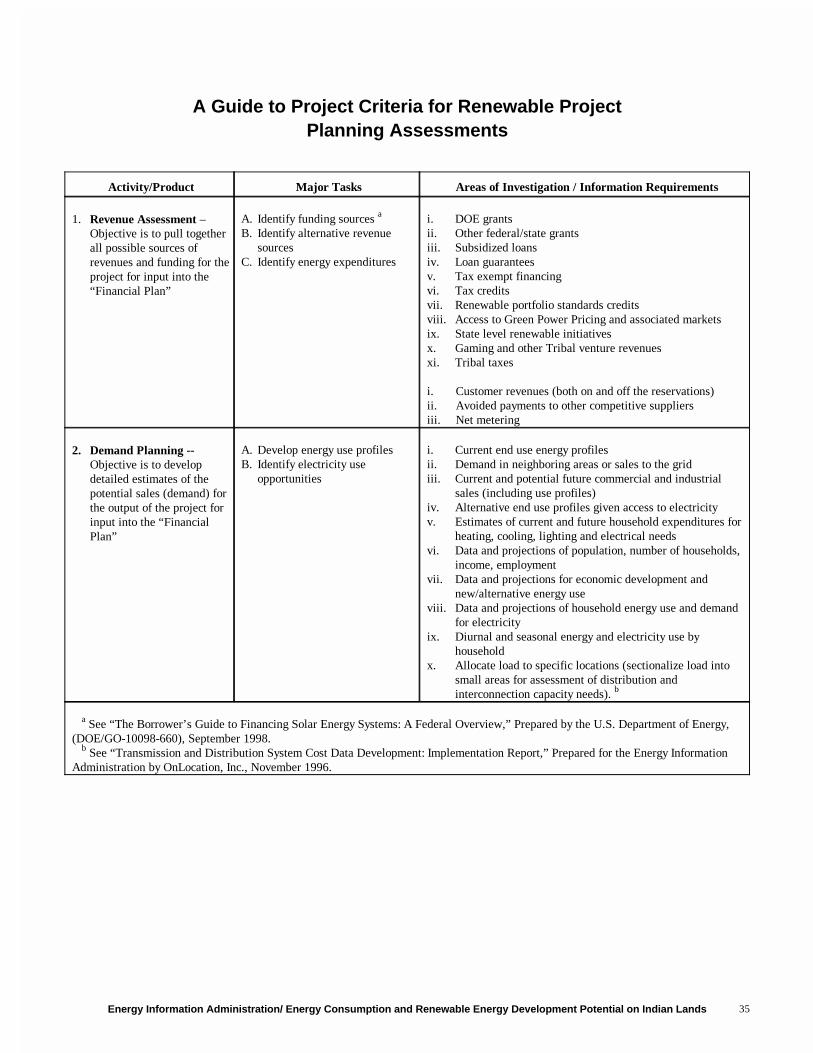
Energy Information Administration/ Energy Consumption and Renewable Energy Development Potential on Indian Lands 35
A Guide to Project Criteria for Renewable ProjectPlanning Assessments
Activity/Product Major Tasks Areas of Investigation / Information Requirements
1. Revenue Assessment –Objective is to pull togetherall possible sources ofrevenues and funding for theproject for input into the“Financial Plan”
A. Identify funding sources a
B. Identify alternative revenuesources
C. Identify energy expenditures
i. DOE grantsii. Other federal/state grantsiii. Subsidized loans iv. Loan guarantees v. Tax exempt financingvi. Tax creditsvii. Renewable portfolio standards creditsviii. Access to Green Power Pricing and associated marketsix. State level renewable initiativesx. Gaming and other Tribal venture revenuesxi. Tribal taxes
i. Customer revenues (both on and off the reservations)ii. Avoided payments to other competitive suppliersiii. Net metering
2. Demand Planning --Objective is to developdetailed estimates of thepotential sales (demand) forthe output of the project forinput into the “FinancialPlan”
A. Develop energy use profilesB. Identify electricity use
opportunities
i. Current end use energy profilesii. Demand in neighboring areas or sales to the gridiii. Current and potential future commercial and industrial
sales (including use profiles)iv. Alternative end use profiles given access to electricityv. Estimates of current and future household expenditures for
heating, cooling, lighting and electrical needsvi. Data and projections of population, number of households,
income, employmentvii. Data and projections for economic development and
new/alternative energy useviii. Data and projections of household energy use and demand
for electricityix. Diurnal and seasonal energy and electricity use by
household x. Allocate load to specific locations (sectionalize load into
small areas for assessment of distribution andinterconnection capacity needs). b
a See “The Borrower’s Guide to Financing Solar Energy Systems: A Federal Overview,” Prepared by the U.S. Department of Energy,(DOE/GO-10098-660), September 1998. b See “Transmission and Distribution System Cost Data Development: Implementation Report,” Prepared for the Energy InformationAdministration by OnLocation, Inc., November 1996.
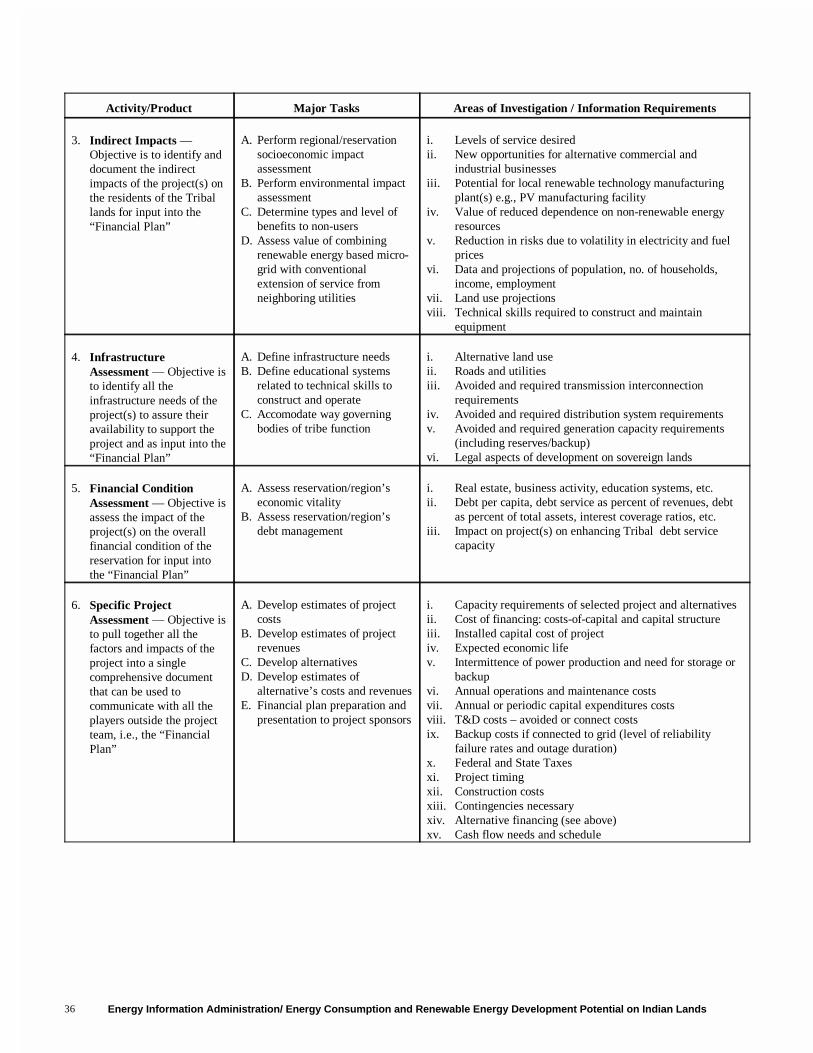
Energy Information Administration/ Energy Consumption and Renewable Energy Development Potential on Indian Lands36
Activity/Product Major Tasks Areas of Investigation / Information Requirements
3. Indirect Impacts —Objective is to identify anddocument the indirectimpacts of the project(s) onthe residents of the Triballands for input into the“Financial Plan”
A. Perform regional/reservationsocioeconomic impactassessment
B. Perform environmental impactassessment
C. Determine types and level ofbenefits to non-users
D. Assess value of combiningrenewable energy based micro-grid with conventionalextension of service fromneighboring utilities
i. Levels of service desiredii. New opportunities for alternative commercial and
industrial businessesiii. Potential for local renewable technology manufacturing
plant(s) e.g., PV manufacturing facilityiv. Value of reduced dependence on non-renewable energy
resourcesv. Reduction in risks due to volatility in electricity and fuel
pricesvi. Data and projections of population, no. of households,
income, employmentvii. Land use projectionsviii. Technical skills required to construct and maintain
equipment
4. InfrastructureAssessment — Objective isto identify all theinfrastructure needs of theproject(s) to assure theiravailability to support theproject and as input into the“Financial Plan”
A. Define infrastructure needsB. Define educational systems
related to technical skills toconstruct and operate
C. Accomodate way governingbodies of tribe function
i. Alternative land useii. Roads and utilitiesiii. Avoided and required transmission interconnection
requirementsiv. Avoided and required distribution system requirementsv. Avoided and required generation capacity requirements
(including reserves/backup)vi. Legal aspects of development on sovereign lands
5. Financial ConditionAssessment — Objective isassess the impact of theproject(s) on the overallfinancial condition of thereservation for input intothe “Financial Plan”
A. Assess reservation/region’seconomic vitality
B. Assess reservation/region’sdebt management
i. Real estate, business activity, education systems, etc.ii. Debt per capita, debt service as percent of revenues, debt
as percent of total assets, interest coverage ratios, etc.iii. Impact on project(s) on enhancing Tribal debt service
capacity
6. Specific ProjectAssessment — Objective isto pull together all thefactors and impacts of theproject into a singlecomprehensive documentthat can be used tocommunicate with all theplayers outside the projectteam, i.e., the “FinancialPlan”
A. Develop estimates of projectcosts
B. Develop estimates of projectrevenues
C. Develop alternativesD. Develop estimates of
alternative’s costs and revenuesE. Financial plan preparation and
presentation to project sponsors
i. Capacity requirements of selected project and alternativesii. Cost of financing: costs-of-capital and capital structureiii. Installed capital cost of projectiv. Expected economic lifev. Intermittence of power production and need for storage or
backupvi. Annual operations and maintenance costsvii. Annual or periodic capital expenditures costsviii. T&D costs – avoided or connect costsix. Backup costs if connected to grid (level of reliability
failure rates and outage duration)x. Federal and State Taxesxi. Project timing xii. Construction costsxiii. Contingencies necessaryxiv. Alternative financing (see above)xv. Cash flow needs and schedule
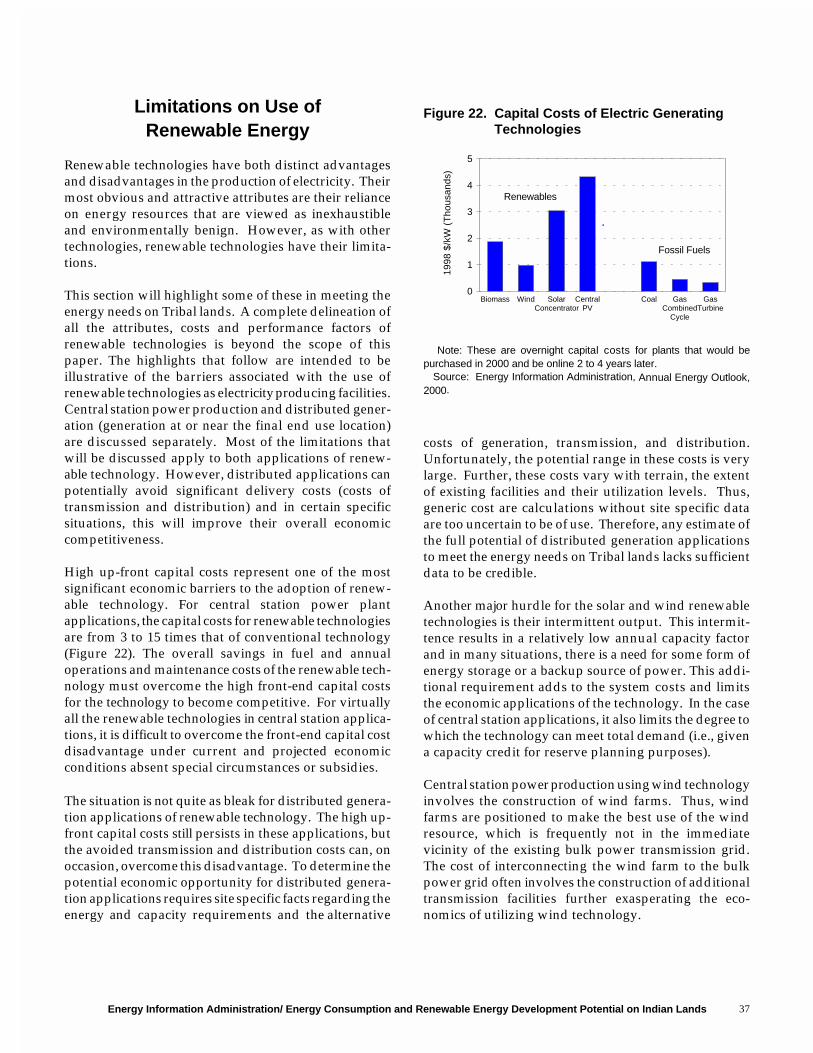
Energy Information Administration/ Energy Consumption and Renewable Energy Development Potential on Indian Lands 37
Biomass Wind SolarConcentrator
CentralPV
Coal GasCombined
Cycle
GasTurbine
0
1
2
3
4
5
1998
$/k
W (
Tho
usan
ds)
Fossil Fuels
Renewables
Figure 22. Capital Costs of Electric Generating Technologies
Limitations on Use ofRenewable Energy
Renewable technologies have both distinct advantagesand disadvantages in the production of electricity. Theirmost obvious and attractive attributes are their relianceon energy resources that are viewed as inexhaustibleand environmentally benign. However, as with othertechnologies, renewable technologies have their limita-tions.
This section will highlight some of these in meeting theenergy needs on Tribal lands. A complete delineation ofall the attributes, costs and performance factors ofrenewable technologies is beyond the scope of thispaper. The highlights that follow are intended to beillustrative of the barriers associated with the use ofrenewable technologies as electricity producing facilities.Central station power production and distributed gener-ation (generation at or near the final end use location)are discussed separately. Most of the limitations thatwill be discussed apply to both applications of renew-able technology. However, distributed applications canpotentially avoid significant delivery costs (costs oftransmission and distribution) and in certain specificsituations, this will improve their overall economiccompetitiveness.
High up-front capital costs represent one of the mostsignificant economic barriers to the adoption of renew-able technology. For central station power plantapplications, the capital costs for renewable technologiesare from 3 to 15 times that of conventional technology(Figure 22). The overall savings in fuel and annualoperations and maintenance costs of the renewable tech-nology must overcome the high front-end capital costsfor the technology to become competitive. For virtuallyall the renewable technologies in central station applica-tions, it is difficult to overcome the front-end capital costdisadvantage under current and projected economicconditions absent special circumstances or subsidies.
The situation is not quite as bleak for distributed genera-tion applications of renewable technology. The high up-front capital costs still persists in these applications, butthe avoided transmission and distribution costs can, onoccasion, overcome this disadvantage. To determine thepotential economic opportunity for distributed genera-tion applications requires site specific facts regarding theenergy and capacity requirements and the alternative
costs of generation, transmission, and distribution.Unfortunately, the potential range in these costs is verylarge. Further, these costs vary with terrain, the extentof existing facilities and their utilization levels. Thus,generic cost are calculations without site specific dataare too uncertain to be of use. Therefore, any estimate ofthe full potential of distributed generation applicationsto meet the energy needs on Tribal lands lacks sufficientdata to be credible.
Another major hurdle for the solar and wind renewabletechnologies is their intermittent output. This intermit-tence results in a relatively low annual capacity factorand in many situations, there is a need for some form ofenergy storage or a backup source of power. This addi-tional requirement adds to the system costs and limitsthe economic applications of the technology. In the caseof central station applications, it also limits the degree towhich the technology can meet total demand (i.e., givena capacity credit for reserve planning purposes).
Central station power production using wind technologyinvolves the construction of wind farms. Thus, windfarms are positioned to make the best use of the windresource, which is frequently not in the immediatevicinity of the existing bulk power transmission grid.The cost of interconnecting the wind farm to the bulkpower grid often involves the construction of additionaltransmission facilities further exasperating the eco-nomics of utilizing wind technology.
Note: These are overnight capital costs for plants that would bepurchased in 2000 and be online 2 to 4 years later. Source: Energy Information Administration, Annual Energy Outlook,2000.
Energy Information Administration/ Energy Consumption and Renewable Energy Development Potential on Indian Lands38
An added concern regarding wind farms is the potentialresistance to such land use of Tribal property. Again,further specific investigation regarding the existence ofa suitable site for a wind farm on Tribal lands is requiredbefore any assessment can be made. In addition, theTribal community’s acceptance of this use would berequired before an assessment of the potential for windtechnology to satisfy a significant portion of the energyneeds on Tribal lands can be made.
Also, Tribal lands in many instances are remote and faraway from load centers. Similarly, there is a great dis-tance between the better wind resources and the centersof electricity demand. Much of the wind resource is
found in the states of the Great Plains and the easternslope of the Rocky Mountains while the major loadcenters tend to be on the east and west coast of theUnited States. To take full advantage of the windresource on Tribal lands, significant investment in addi-tional transmission capacity is likely required. Most ofthe cost associated with added transmission capacity isfixed in terms of a return on investment. Transmissionfacilities have relatively low annual operations andmaintenance costs associated with them. However, theeconomic returns associated with the incrementaltransmission investment are hampered by the inter-mittent nature of the wind resource and resultantrelatively low capacity factors.
Energy Information Administration/ Energy Consumption and Renewable Energy Development Potential on Indian Lands 39
4. Conclusions
Four reservations have been identified which mightgenerate central station renewable-based electricity at alower cost (excluding transmission cost) than the whole-sale cost of power sold to those reservations, assumingfavorable transmission costs. These reservations are theEastern Cherokee Reservation (NC), the Alabama andCoushatta Reservation (TX), the Coushatta Reservation(LA), and the Mississippi Choctaw Reservation andTrust (MS). Biomass is the renewable resource of choiceon all these lands. The renewable electricity costpremium, excluding transmission charges, ranges from0.1 cents per kWh to 0.7 cents per kWh.
Biomass is the least costly renewable resource on 52 ofthe 61 reservations having the lowest renewable centralstation electricity cost premium. The remaining 9 reser-vations (all in New Mexico) have wind as the least costlyrenewable resource. Biomass has a major advantageover wind because it does not require back-up power.Furthermore, connecting wind power facilities to theelectricity grid requires a number of special consider-ations. Wind power, however is eligible for EPACTproduction incentive payments, while biomass facilitiesare eligible only if they are closed loop.
Despite its high absolute cost, rooftop photovoltaicinstallations may be feasible to provide limited electric
service to a high number of Indian households withoutaccess to electricity on tribal lands, because no distri-bution or transmission facilities are required. This, ofcourse, means that electricity will be unavailable at nightunless some form of back-up power (e.g., diesel gener-ators) or storage batteries is used&both high-costoptions.
Compared with the Nation as a whole, Indian house-holds on tribal lands overall pay essentially comparablerates (on a per kilowatthour basis) to those paid by non-Indian households with similar demographics. How-ever, Indian households spend a greater share of incomeon electricity than do non-Indian households.
Electrification is a sizable problem for only a smallnumber of Indian reservations. However, the reserva-tion with the highest percentage of households withoutelectricity, the Navajo reservation in Arizona, is also byfar the largest reservation in the U.S. That one reser-vation accounts for about 75 percent of all Indianreservation households without electricity, and the non-electrified Navajo households represent about 10 percentof all Indian reservation households.
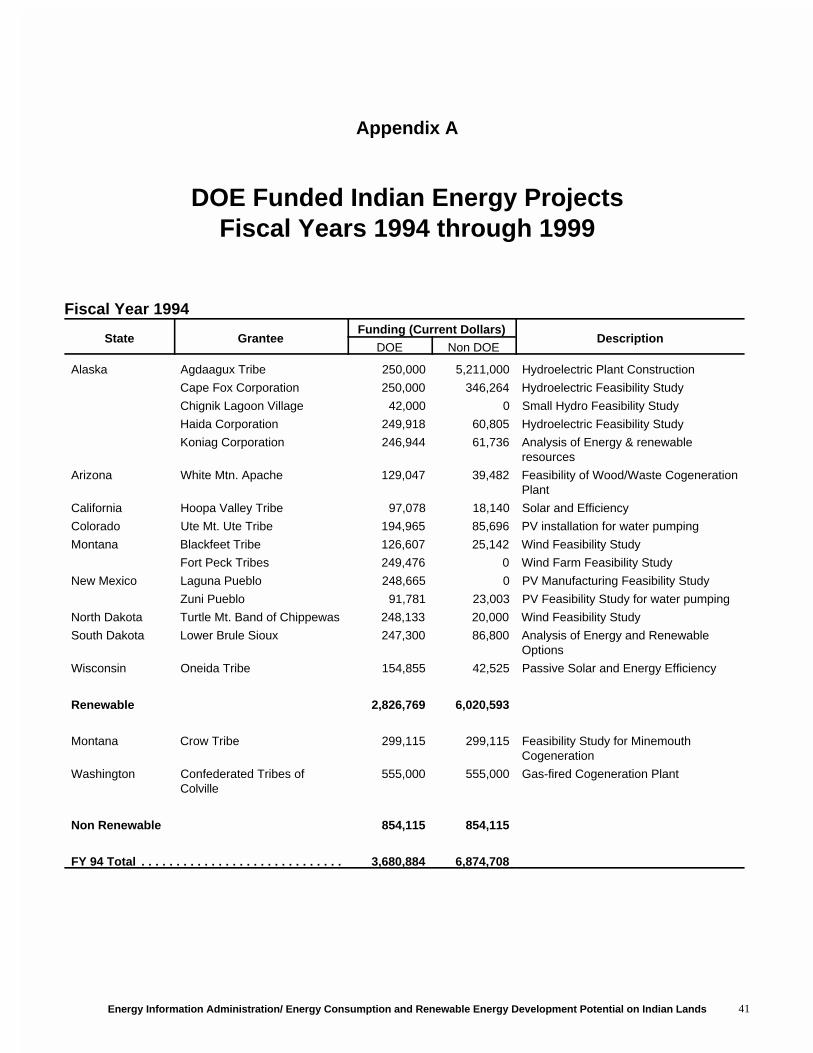
Energy Information Administration/ Energy Consumption and Renewable Energy Development Potential on Indian Lands 41
Appendix A
DOE Funded Indian Energy ProjectsFiscal Years 1994 through 1999
Fiscal Year 1994
State GranteeFunding (Current Dollars)
DescriptionDOE Non DOE
Alaska Agdaagux Tribe 250,000 5,211,000 Hydroelectric Plant Construction
Cape Fox Corporation 250,000 346,264 Hydroelectric Feasibility Study
Chignik Lagoon Village 42,000 0 Small Hydro Feasibility Study
Haida Corporation 249,918 60,805 Hydroelectric Feasibility Study
Koniag Corporation 246,944 61,736 Analysis of Energy & renewableresources
Arizona White Mtn. Apache 129,047 39,482 Feasibility of Wood/Waste CogenerationPlant
California Hoopa Valley Tribe 97,078 18,140 Solar and Efficiency
Colorado Ute Mt. Ute Tribe 194,965 85,696 PV installation for water pumping
Montana Blackfeet Tribe 126,607 25,142 Wind Feasibility Study
Fort Peck Tribes 249,476 0 Wind Farm Feasibility Study
New Mexico Laguna Pueblo 248,665 0 PV Manufacturing Feasibility Study
Zuni Pueblo 91,781 23,003 PV Feasibility Study for water pumping
North Dakota Turtle Mt. Band of Chippewas 248,133 20,000 Wind Feasibility Study
South Dakota Lower Brule Sioux 247,300 86,800 Analysis of Energy and RenewableOptions
Wisconsin Oneida Tribe 154,855 42,525 Passive Solar and Energy Efficiency
Renewable 2,826,769 6,020,593
Montana Crow Tribe 299,115 299,115 Feasibility Study for MinemouthCogeneration
Washington Confederated Tribes ofColville
555,000 555,000 Gas-fired Cogeneration Plant
Non Renewable 854,115 854,115
FY 94 Total . . . . . . . . . . . . . . . . . . . . . . . . . . . . . 3,680,884 6,874,708
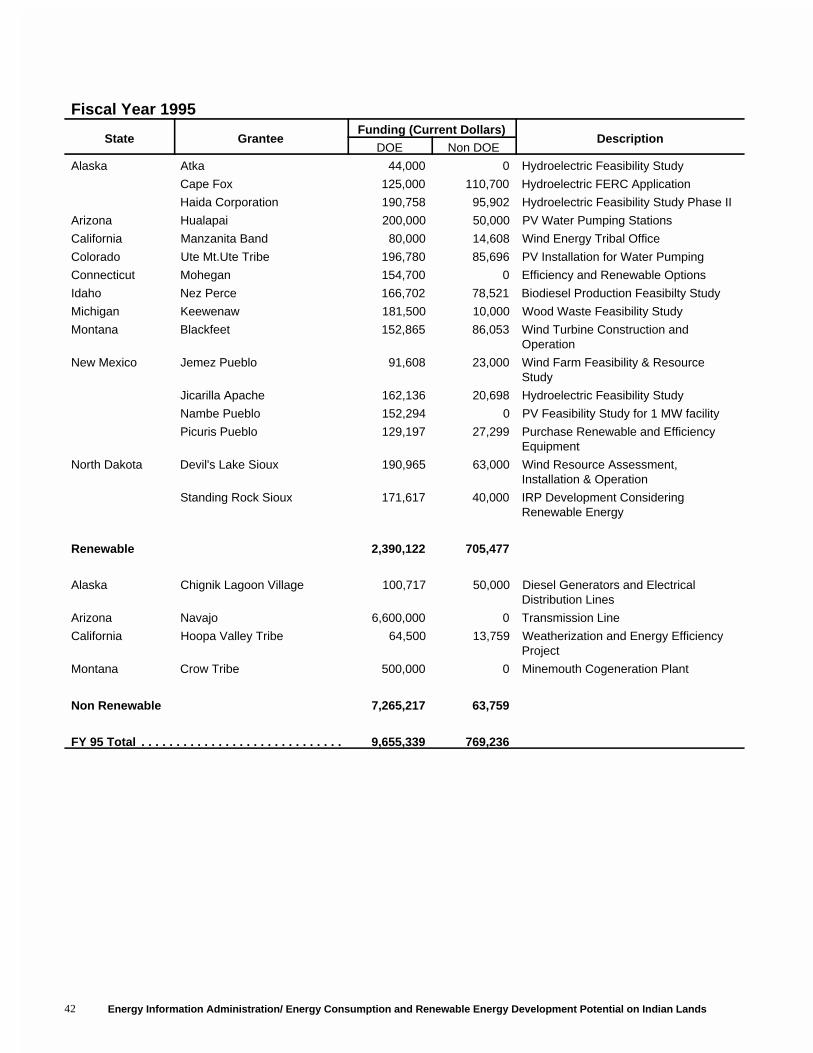
Energy Information Administration/ Energy Consumption and Renewable Energy Development Potential on Indian Lands42
Fiscal Year 1995
State GranteeFunding (Current Dollars)
DescriptionDOE Non DOE
Alaska Atka 44,000 0 Hydroelectric Feasibility Study
Cape Fox 125,000 110,700 Hydroelectric FERC Application
Haida Corporation 190,758 95,902 Hydroelectric Feasibility Study Phase II
Arizona Hualapai 200,000 50,000 PV Water Pumping Stations
California Manzanita Band 80,000 14,608 Wind Energy Tribal Office
Colorado Ute Mt.Ute Tribe 196,780 85,696 PV Installation for Water Pumping
Connecticut Mohegan 154,700 0 Efficiency and Renewable Options
Idaho Nez Perce 166,702 78,521 Biodiesel Production Feasibilty Study
Michigan Keewenaw 181,500 10,000 Wood Waste Feasibility Study
Montana Blackfeet 152,865 86,053 Wind Turbine Construction andOperation
New Mexico Jemez Pueblo 91,608 23,000 Wind Farm Feasibility & ResourceStudy
Jicarilla Apache 162,136 20,698 Hydroelectric Feasibility Study
Nambe Pueblo 152,294 0 PV Feasibility Study for 1 MW facility
Picuris Pueblo 129,197 27,299 Purchase Renewable and EfficiencyEquipment
North Dakota Devil's Lake Sioux 190,965 63,000 Wind Resource Assessment,Installation & Operation
Standing Rock Sioux 171,617 40,000 IRP Development ConsideringRenewable Energy
Renewable 2,390,122 705,477
Alaska Chignik Lagoon Village 100,717 50,000 Diesel Generators and ElectricalDistribution Lines
Arizona Navajo 6,600,000 0 Transmission Line
California Hoopa Valley Tribe 64,500 13,759 Weatherization and Energy EfficiencyProject
Montana Crow Tribe 500,000 0 Minemouth Cogeneration Plant
Non Renewable 7,265,217 63,759
FY 95 Total . . . . . . . . . . . . . . . . . . . . . . . . . . . . . 9,655,339 769,236
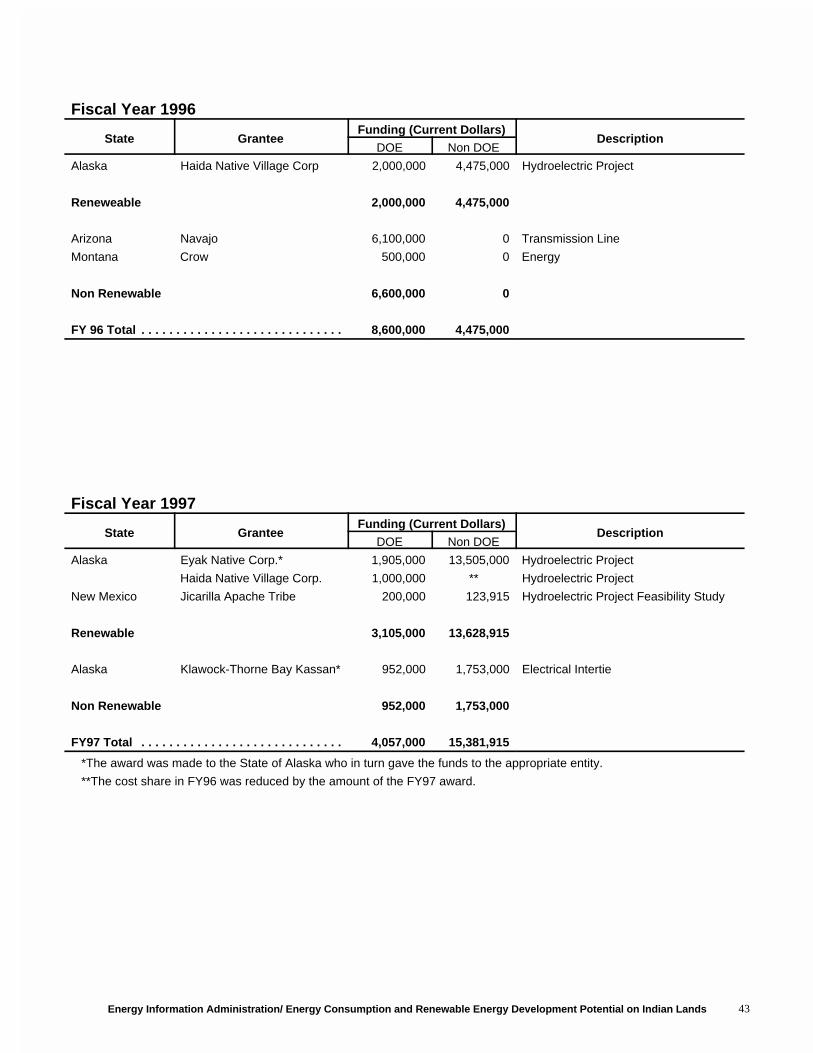
Energy Information Administration/ Energy Consumption and Renewable Energy Development Potential on Indian Lands 43
Fiscal Year 1996
State GranteeFunding (Current Dollars)
DescriptionDOE Non DOE
Alaska Haida Native Village Corp 2,000,000 4,475,000 Hydroelectric Project
Reneweable 2,000,000 4,475,000
Arizona Navajo 6,100,000 0 Transmission Line
Montana Crow 500,000 0 Energy
Non Renewable 6,600,000 0
FY 96 Total . . . . . . . . . . . . . . . . . . . . . . . . . . . . . 8,600,000 4,475,000
Fiscal Year 1997
State GranteeFunding (Current Dollars)
DescriptionDOE Non DOE
Alaska Eyak Native Corp.* 1,905,000 13,505,000 Hydroelectric Project
Haida Native Village Corp. 1,000,000 ** Hydroelectric Project
New Mexico Jicarilla Apache Tribe 200,000 123,915 Hydroelectric Project Feasibility Study
Renewable 3,105,000 13,628,915
Alaska Klawock-Thorne Bay Kassan* 952,000 1,753,000 Electrical Intertie
Non Renewable 952,000 1,753,000
FY97 Total . . . . . . . . . . . . . . . . . . . . . . . . . . . . . 4,057,000 15,381,915
*The award was made to the State of Alaska who in turn gave the funds to the appropriate entity.
**The cost share in FY96 was reduced by the amount of the FY97 award.
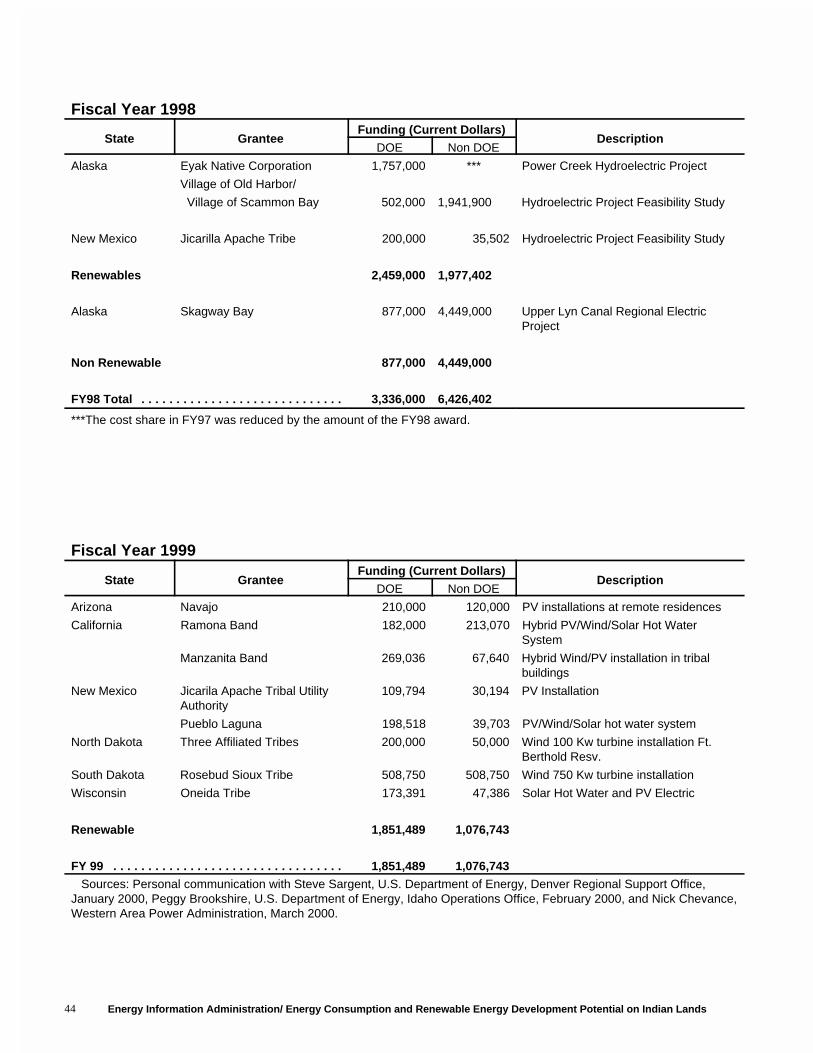
Energy Information Administration/ Energy Consumption and Renewable Energy Development Potential on Indian Lands44
Fiscal Year 1998
State GranteeFunding (Current Dollars)
DescriptionDOE Non DOE
Alaska Eyak Native Corporation 1,757,000 *** Power Creek Hydroelectric Project
Village of Old Harbor/
Village of Scammon Bay 502,000 1,941,900 Hydroelectric Project Feasibility Study
New Mexico Jicarilla Apache Tribe 200,000 35,502 Hydroelectric Project Feasibility Study
Renewables 2,459,000 1,977,402
Alaska Skagway Bay 877,000 4,449,000 Upper Lyn Canal Regional ElectricProject
Non Renewable 877,000 4,449,000
FY98 Total . . . . . . . . . . . . . . . . . . . . . . . . . . . . . 3,336,000 6,426,402
***The cost share in FY97 was reduced by the amount of the FY98 award.
Fiscal Year 1999
State GranteeFunding (Current Dollars)
DescriptionDOE Non DOE
Arizona Navajo 210,000 120,000 PV installations at remote residences
California Ramona Band 182,000 213,070 Hybrid PV/Wind/Solar Hot WaterSystem
Manzanita Band 269,036 67,640 Hybrid Wind/PV installation in tribalbuildings
New Mexico Jicarila Apache Tribal UtilityAuthority
109,794 30,194 PV Installation
Pueblo Laguna 198,518 39,703 PV/Wind/Solar hot water system
North Dakota Three Affiliated Tribes 200,000 50,000 Wind 100 Kw turbine installation Ft.Berthold Resv.
South Dakota Rosebud Sioux Tribe 508,750 508,750 Wind 750 Kw turbine installation
Wisconsin Oneida Tribe 173,391 47,386 Solar Hot Water and PV Electric
Renewable 1,851,489 1,076,743
FY 99 . . . . . . . . . . . . . . . . . . . . . . . . . . . . . . . . . 1,851,489 1,076,743 Sources: Personal communication with Steve Sargent, U.S. Department of Energy, Denver Regional Support Office,January 2000, Peggy Brookshire, U.S. Department of Energy, Idaho Operations Office, February 2000, and Nick Chevance,Western Area Power Administration, March 2000.
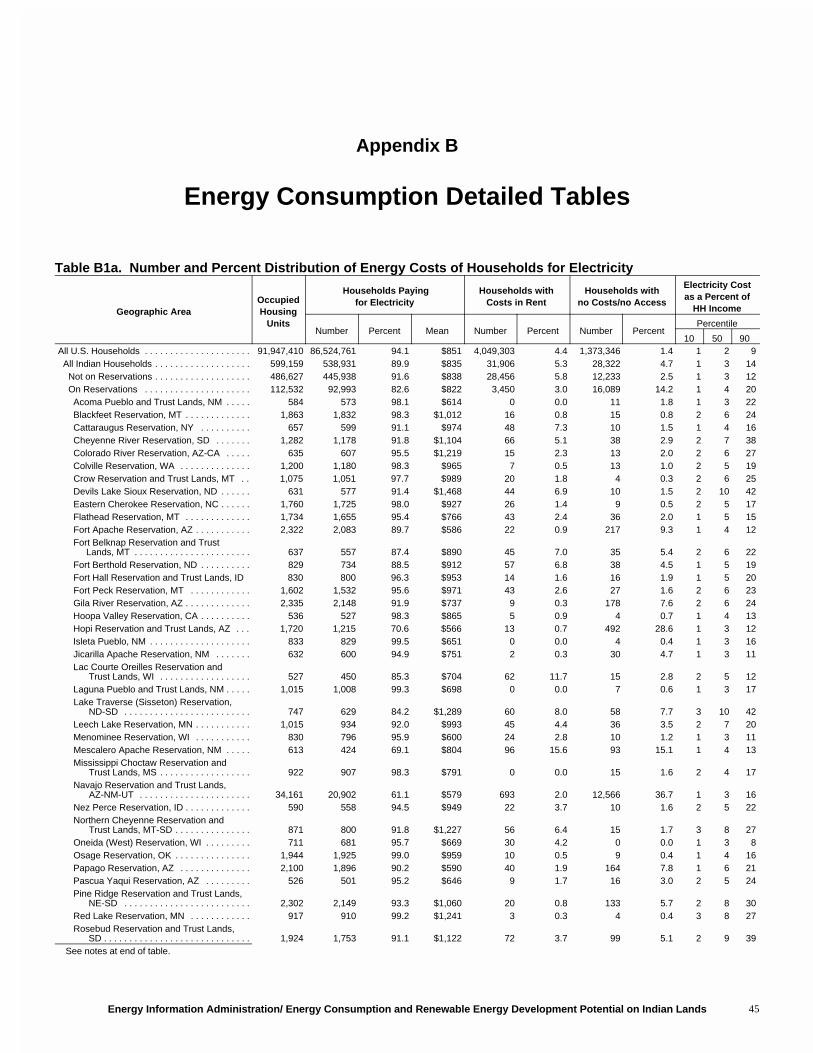
Energy Information Administration/ Energy Consumption and Renewable Energy Development Potential on Indian Lands 45
Appendix B
Energy Consumption Detailed Tables
Table B1a. Number and Percent Distribution of Energy Costs of Households for Electricity
Geographic AreaOccupiedHousing
Units
Households Payingfor Electricity
Households withCosts in Rent
Households withno Costs/no Access
Electricity Costas a Percent of
HH Income
Number Percent Mean Number Percent Number PercentPercentile
10 50 90All U.S. Households . . . . . . . . . . . . . . . . . . . . . 91,947,410 86,524,761 94.1 $851 4,049,303 4.4 1,373,346 1.4 1 2 9 All Indian Households . . . . . . . . . . . . . . . . . . . 599,159 538,931 89.9 $835 31,906 5.3 28,322 4.7 1 3 14 Not on Reservations . . . . . . . . . . . . . . . . . . . 486,627 445,938 91.6 $838 28,456 5.8 12,233 2.5 1 3 12 On Reservations . . . . . . . . . . . . . . . . . . . . . 112,532 92,993 82.6 $822 3,450 3.0 16,089 14.2 1 4 20 Acoma Pueblo and Trust Lands, NM . . . . . 584 573 98.1 $614 0 0.0 11 1.8 1 3 22 Blackfeet Reservation, MT . . . . . . . . . . . . . 1,863 1,832 98.3 $1,012 16 0.8 15 0.8 2 6 24 Cattaraugus Reservation, NY . . . . . . . . . . 657 599 91.1 $974 48 7.3 10 1.5 1 4 16 Cheyenne River Reservation, SD . . . . . . . 1,282 1,178 91.8 $1,104 66 5.1 38 2.9 2 7 38 Colorado River Reservation, AZ-CA . . . . . 635 607 95.5 $1,219 15 2.3 13 2.0 2 6 27 Colville Reservation, WA . . . . . . . . . . . . . . 1,200 1,180 98.3 $965 7 0.5 13 1.0 2 5 19 Crow Reservation and Trust Lands, MT . . 1,075 1,051 97.7 $989 20 1.8 4 0.3 2 6 25 Devils Lake Sioux Reservation, ND . . . . . . 631 577 91.4 $1,468 44 6.9 10 1.5 2 10 42 Eastern Cherokee Reservation, NC . . . . . . 1,760 1,725 98.0 $927 26 1.4 9 0.5 2 5 17 Flathead Reservation, MT . . . . . . . . . . . . . 1,734 1,655 95.4 $766 43 2.4 36 2.0 1 5 15 Fort Apache Reservation, AZ . . . . . . . . . . . 2,322 2,083 89.7 $586 22 0.9 217 9.3 1 4 12 Fort Belknap Reservation and Trust Lands, MT . . . . . . . . . . . . . . . . . . . . . . . 637 557 87.4 $890 45 7.0 35 5.4 2 6 22 Fort Berthold Reservation, ND . . . . . . . . . . 829 734 88.5 $912 57 6.8 38 4.5 1 5 19 Fort Hall Reservation and Trust Lands, ID 830 800 96.3 $953 14 1.6 16 1.9 1 5 20 Fort Peck Reservation, MT . . . . . . . . . . . . 1,602 1,532 95.6 $971 43 2.6 27 1.6 2 6 23 Gila River Reservation, AZ . . . . . . . . . . . . . 2,335 2,148 91.9 $737 9 0.3 178 7.6 2 6 24 Hoopa Valley Reservation, CA . . . . . . . . . . 536 527 98.3 $865 5 0.9 4 0.7 1 4 13 Hopi Reservation and Trust Lands, AZ . . . 1,720 1,215 70.6 $566 13 0.7 492 28.6 1 3 12 Isleta Pueblo, NM . . . . . . . . . . . . . . . . . . . . 833 829 99.5 $651 0 0.0 4 0.4 1 3 16 Jicarilla Apache Reservation, NM . . . . . . . 632 600 94.9 $751 2 0.3 30 4.7 1 3 11 Lac Courte Oreilles Reservation and Trust Lands, WI . . . . . . . . . . . . . . . . . . 527 450 85.3 $704 62 11.7 15 2.8 2 5 12 Laguna Pueblo and Trust Lands, NM . . . . . 1,015 1,008 99.3 $698 0 0.0 7 0.6 1 3 17 Lake Traverse (Sisseton) Reservation, ND-SD . . . . . . . . . . . . . . . . . . . . . . . . . 747 629 84.2 $1,289 60 8.0 58 7.7 3 10 42 Leech Lake Reservation, MN . . . . . . . . . . . 1,015 934 92.0 $993 45 4.4 36 3.5 2 7 20 Menominee Reservation, WI . . . . . . . . . . . 830 796 95.9 $600 24 2.8 10 1.2 1 3 11 Mescalero Apache Reservation, NM . . . . . 613 424 69.1 $804 96 15.6 93 15.1 1 4 13 Mississippi Choctaw Reservation and Trust Lands, MS . . . . . . . . . . . . . . . . . . 922 907 98.3 $791 0 0.0 15 1.6 2 4 17 Navajo Reservation and Trust Lands, AZ-NM-UT . . . . . . . . . . . . . . . . . . . . . . 34,161 20,902 61.1 $579 693 2.0 12,566 36.7 1 3 16 Nez Perce Reservation, ID . . . . . . . . . . . . . 590 558 94.5 $949 22 3.7 10 1.6 2 5 22 Northern Cheyenne Reservation and Trust Lands, MT-SD . . . . . . . . . . . . . . . 871 800 91.8 $1,227 56 6.4 15 1.7 3 8 27 Oneida (West) Reservation, WI . . . . . . . . . 711 681 95.7 $669 30 4.2 0 0.0 1 3 8 Osage Reservation, OK . . . . . . . . . . . . . . . 1,944 1,925 99.0 $959 10 0.5 9 0.4 1 4 16 Papago Reservation, AZ . . . . . . . . . . . . . . 2,100 1,896 90.2 $590 40 1.9 164 7.8 1 6 21 Pascua Yaqui Reservation, AZ . . . . . . . . . 526 501 95.2 $646 9 1.7 16 3.0 2 5 24 Pine Ridge Reservation and Trust Lands, NE-SD . . . . . . . . . . . . . . . . . . . . . . . . . 2,302 2,149 93.3 $1,060 20 0.8 133 5.7 2 8 30 Red Lake Reservation, MN . . . . . . . . . . . . 917 910 99.2 $1,241 3 0.3 4 0.4 3 8 27 Rosebud Reservation and Trust Lands, SD . . . . . . . . . . . . . . . . . . . . . . . . . . . . . 1,924 1,753 91.1 $1,122 72 3.7 99 5.1 2 9 39 See notes at end of table.
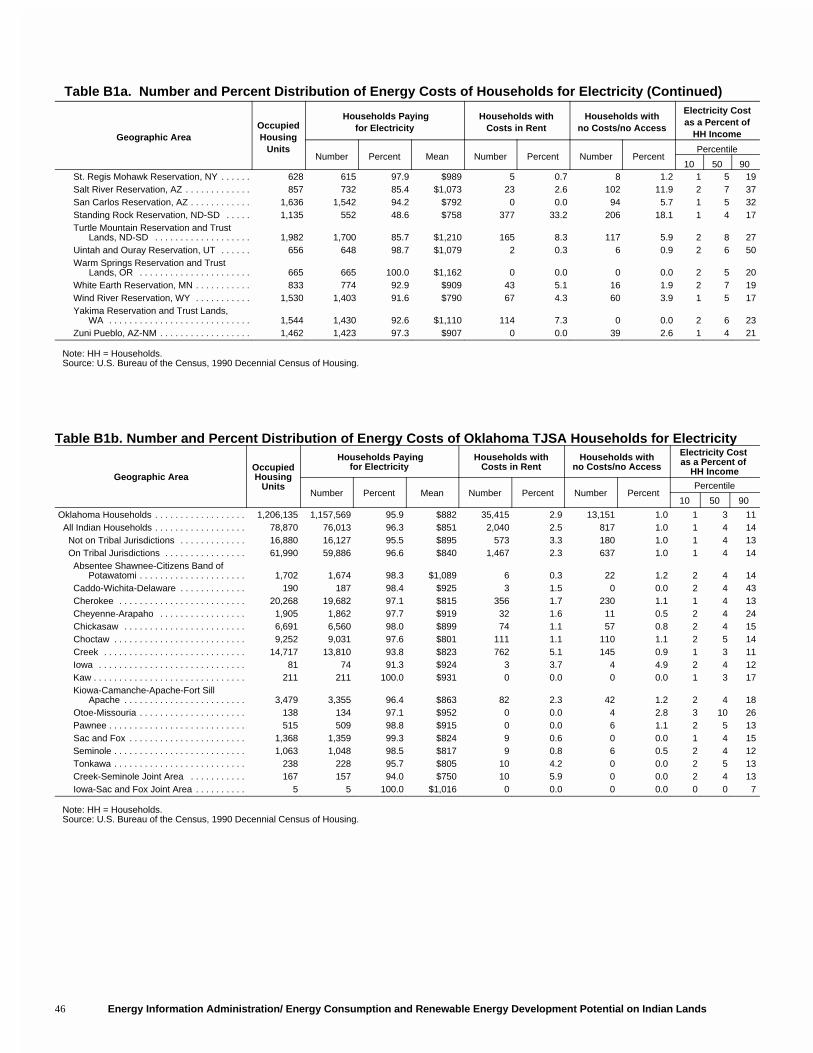
Table B1a. Number and Percent Distribution of Energy Costs of Households for Electricity (Continued)
Geographic AreaOccupiedHousing
Units
Households Payingfor Electricity
Households withCosts in Rent
Households withno Costs/no Access
Electricity Costas a Percent of
HH Income
Number Percent Mean Number Percent Number PercentPercentile
10 50 90
Energy Information Administration/ Energy Consumption and Renewable Energy Development Potential on Indian Lands46
St. Regis Mohawk Reservation, NY . . . . . . 628 615 97.9 $989 5 0.7 8 1.2 1 5 19 Salt River Reservation, AZ . . . . . . . . . . . . . 857 732 85.4 $1,073 23 2.6 102 11.9 2 7 37 San Carlos Reservation, AZ . . . . . . . . . . . . 1,636 1,542 94.2 $792 0 0.0 94 5.7 1 5 32 Standing Rock Reservation, ND-SD . . . . . 1,135 552 48.6 $758 377 33.2 206 18.1 1 4 17 Turtle Mountain Reservation and Trust Lands, ND-SD . . . . . . . . . . . . . . . . . . . 1,982 1,700 85.7 $1,210 165 8.3 117 5.9 2 8 27 Uintah and Ouray Reservation, UT . . . . . . 656 648 98.7 $1,079 2 0.3 6 0.9 2 6 50 Warm Springs Reservation and Trust Lands, OR . . . . . . . . . . . . . . . . . . . . . . 665 665 100.0 $1,162 0 0.0 0 0.0 2 5 20 White Earth Reservation, MN . . . . . . . . . . . 833 774 92.9 $909 43 5.1 16 1.9 2 7 19 Wind River Reservation, WY . . . . . . . . . . . 1,530 1,403 91.6 $790 67 4.3 60 3.9 1 5 17 Yakima Reservation and Trust Lands, WA . . . . . . . . . . . . . . . . . . . . . . . . . . . . 1,544 1,430 92.6 $1,110 114 7.3 0 0.0 2 6 23 Zuni Pueblo, AZ-NM . . . . . . . . . . . . . . . . . . 1,462 1,423 97.3 $907 0 0.0 39 2.6 1 4 21
Note: HH = Households. Source: U.S. Bureau of the Census, 1990 Decennial Census of Housing.
Table B1b. Number and Percent Distribution of Energy Costs of Oklahoma TJSA Households for Electricity
Geographic AreaOccupiedHousing
Units
Households Payingfor Electricity
Households withCosts in Rent
Households withno Costs/no Access
Electricity Cost as a Percent of
HH Income
Number Percent Mean Number Percent Number PercentPercentile
10 50 90
Oklahoma Households . . . . . . . . . . . . . . . . . . 1,206,135 1,157,569 95.9 $882 35,415 2.9 13,151 1.0 1 3 11 All Indian Households . . . . . . . . . . . . . . . . . . 78,870 76,013 96.3 $851 2,040 2.5 817 1.0 1 4 14 Not on Tribal Jurisdictions . . . . . . . . . . . . . 16,880 16,127 95.5 $895 573 3.3 180 1.0 1 4 13 On Tribal Jurisdictions . . . . . . . . . . . . . . . . 61,990 59,886 96.6 $840 1,467 2.3 637 1.0 1 4 14 Absentee Shawnee-Citizens Band of Potawatomi . . . . . . . . . . . . . . . . . . . . . 1,702 1,674 98.3 $1,089 6 0.3 22 1.2 2 4 14 Caddo-Wichita-Delaware . . . . . . . . . . . . . 190 187 98.4 $925 3 1.5 0 0.0 2 4 43 Cherokee . . . . . . . . . . . . . . . . . . . . . . . . . 20,268 19,682 97.1 $815 356 1.7 230 1.1 1 4 13 Cheyenne-Arapaho . . . . . . . . . . . . . . . . . 1,905 1,862 97.7 $919 32 1.6 11 0.5 2 4 24 Chickasaw . . . . . . . . . . . . . . . . . . . . . . . . 6,691 6,560 98.0 $899 74 1.1 57 0.8 2 4 15 Choctaw . . . . . . . . . . . . . . . . . . . . . . . . . . 9,252 9,031 97.6 $801 111 1.1 110 1.1 2 5 14 Creek . . . . . . . . . . . . . . . . . . . . . . . . . . . . 14,717 13,810 93.8 $823 762 5.1 145 0.9 1 3 11 Iowa . . . . . . . . . . . . . . . . . . . . . . . . . . . . . 81 74 91.3 $924 3 3.7 4 4.9 2 4 12 Kaw . . . . . . . . . . . . . . . . . . . . . . . . . . . . . . 211 211 100.0 $931 0 0.0 0 0.0 1 3 17 Kiowa-Camanche-Apache-Fort Sill Apache . . . . . . . . . . . . . . . . . . . . . . . . 3,479 3,355 96.4 $863 82 2.3 42 1.2 2 4 18 Otoe-Missouria . . . . . . . . . . . . . . . . . . . . . 138 134 97.1 $952 0 0.0 4 2.8 3 10 26 Pawnee . . . . . . . . . . . . . . . . . . . . . . . . . . . 515 509 98.8 $915 0 0.0 6 1.1 2 5 13 Sac and Fox . . . . . . . . . . . . . . . . . . . . . . . 1,368 1,359 99.3 $824 9 0.6 0 0.0 1 4 15 Seminole . . . . . . . . . . . . . . . . . . . . . . . . . . 1,063 1,048 98.5 $817 9 0.8 6 0.5 2 4 12 Tonkawa . . . . . . . . . . . . . . . . . . . . . . . . . . 238 228 95.7 $805 10 4.2 0 0.0 2 5 13 Creek-Seminole Joint Area . . . . . . . . . . . 167 157 94.0 $750 10 5.9 0 0.0 2 4 13 Iowa-Sac and Fox Joint Area . . . . . . . . . . 5 5 100.0 $1,016 0 0.0 0 0.0 0 0 7
Note: HH = Households. Source: U.S. Bureau of the Census, 1990 Decennial Census of Housing.
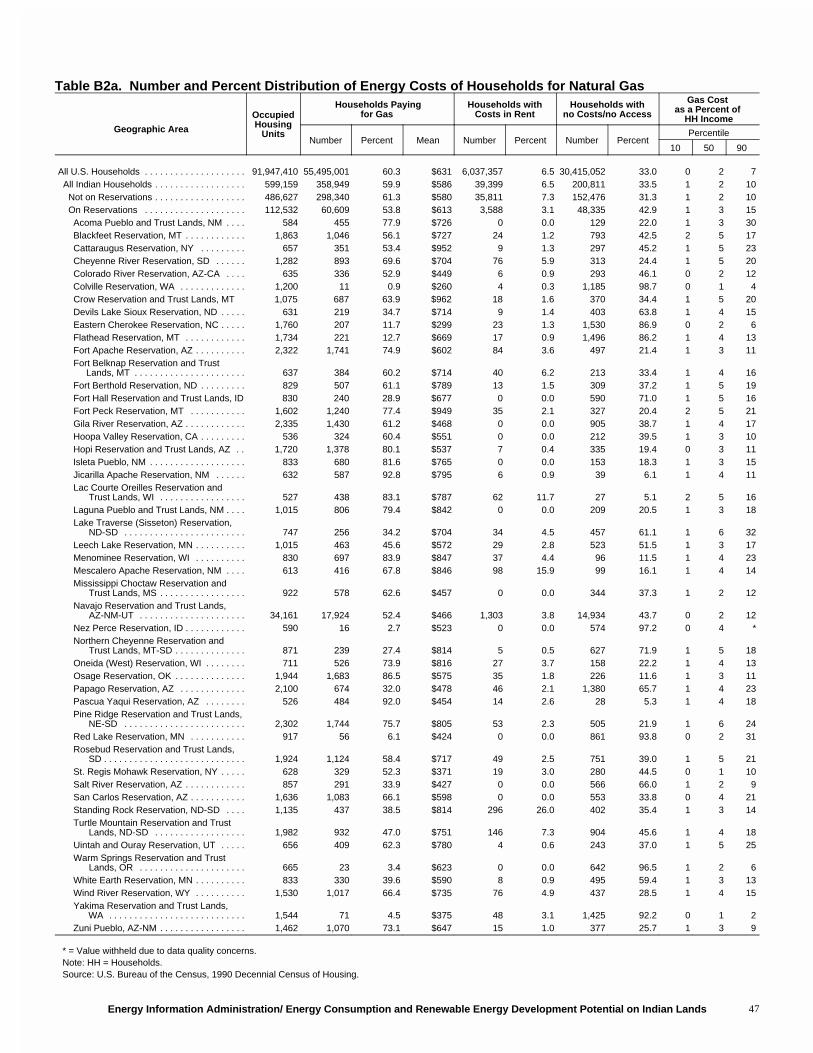
Energy Information Administration/ Energy Consumption and Renewable Energy Development Potential on Indian Lands 47
Table B2a. Number and Percent Distribution of Energy Costs of Households for Natural Gas
Geographic Area
OccupiedHousing
Units
Households Payingfor Gas
Households withCosts in Rent
Households withno Costs/no Access
Gas Cost as a Percent of
HH Income
Number Percent Mean Number Percent Number PercentPercentile
10 50 90
All U.S. Households . . . . . . . . . . . . . . . . . . . . 91,947,410 55,495,001 60.3 $631 6,037,357 6.5 30,415,052 33.0 0 2 7 All Indian Households . . . . . . . . . . . . . . . . . . 599,159 358,949 59.9 $586 39,399 6.5 200,811 33.5 1 2 10 Not on Reservations . . . . . . . . . . . . . . . . . . 486,627 298,340 61.3 $580 35,811 7.3 152,476 31.3 1 2 10 On Reservations . . . . . . . . . . . . . . . . . . . . 112,532 60,609 53.8 $613 3,588 3.1 48,335 42.9 1 3 15 Acoma Pueblo and Trust Lands, NM . . . . 584 455 77.9 $726 0 0.0 129 22.0 1 3 30 Blackfeet Reservation, MT . . . . . . . . . . . . 1,863 1,046 56.1 $727 24 1.2 793 42.5 2 5 17 Cattaraugus Reservation, NY . . . . . . . . . 657 351 53.4 $952 9 1.3 297 45.2 1 5 23 Cheyenne River Reservation, SD . . . . . . 1,282 893 69.6 $704 76 5.9 313 24.4 1 5 20 Colorado River Reservation, AZ-CA . . . . 635 336 52.9 $449 6 0.9 293 46.1 0 2 12 Colville Reservation, WA . . . . . . . . . . . . . 1,200 11 0.9 $260 4 0.3 1,185 98.7 0 1 4 Crow Reservation and Trust Lands, MT 1,075 687 63.9 $962 18 1.6 370 34.4 1 5 20 Devils Lake Sioux Reservation, ND . . . . . 631 219 34.7 $714 9 1.4 403 63.8 1 4 15 Eastern Cherokee Reservation, NC . . . . . 1,760 207 11.7 $299 23 1.3 1,530 86.9 0 2 6 Flathead Reservation, MT . . . . . . . . . . . . 1,734 221 12.7 $669 17 0.9 1,496 86.2 1 4 13 Fort Apache Reservation, AZ . . . . . . . . . . 2,322 1,741 74.9 $602 84 3.6 497 21.4 1 3 11 Fort Belknap Reservation and Trust Lands, MT . . . . . . . . . . . . . . . . . . . . . . 637 384 60.2 $714 40 6.2 213 33.4 1 4 16 Fort Berthold Reservation, ND . . . . . . . . . 829 507 61.1 $789 13 1.5 309 37.2 1 5 19 Fort Hall Reservation and Trust Lands, ID 830 240 28.9 $677 0 0.0 590 71.0 1 5 16 Fort Peck Reservation, MT . . . . . . . . . . . 1,602 1,240 77.4 $949 35 2.1 327 20.4 2 5 21 Gila River Reservation, AZ . . . . . . . . . . . . 2,335 1,430 61.2 $468 0 0.0 905 38.7 1 4 17 Hoopa Valley Reservation, CA . . . . . . . . . 536 324 60.4 $551 0 0.0 212 39.5 1 3 10 Hopi Reservation and Trust Lands, AZ . . 1,720 1,378 80.1 $537 7 0.4 335 19.4 0 3 11 Isleta Pueblo, NM . . . . . . . . . . . . . . . . . . . 833 680 81.6 $765 0 0.0 153 18.3 1 3 15 Jicarilla Apache Reservation, NM . . . . . . 632 587 92.8 $795 6 0.9 39 6.1 1 4 11 Lac Courte Oreilles Reservation and Trust Lands, WI . . . . . . . . . . . . . . . . . 527 438 83.1 $787 62 11.7 27 5.1 2 5 16 Laguna Pueblo and Trust Lands, NM . . . . 1,015 806 79.4 $842 0 0.0 209 20.5 1 3 18 Lake Traverse (Sisseton) Reservation, ND-SD . . . . . . . . . . . . . . . . . . . . . . . . 747 256 34.2 $704 34 4.5 457 61.1 1 6 32 Leech Lake Reservation, MN . . . . . . . . . . 1,015 463 45.6 $572 29 2.8 523 51.5 1 3 17 Menominee Reservation, WI . . . . . . . . . . 830 697 83.9 $847 37 4.4 96 11.5 1 4 23 Mescalero Apache Reservation, NM . . . . 613 416 67.8 $846 98 15.9 99 16.1 1 4 14 Mississippi Choctaw Reservation and Trust Lands, MS . . . . . . . . . . . . . . . . . 922 578 62.6 $457 0 0.0 344 37.3 1 2 12 Navajo Reservation and Trust Lands, AZ-NM-UT . . . . . . . . . . . . . . . . . . . . . 34,161 17,924 52.4 $466 1,303 3.8 14,934 43.7 0 2 12 Nez Perce Reservation, ID . . . . . . . . . . . . 590 16 2.7 $523 0 0.0 574 97.2 0 4 * Northern Cheyenne Reservation and Trust Lands, MT-SD . . . . . . . . . . . . . . 871 239 27.4 $814 5 0.5 627 71.9 1 5 18 Oneida (West) Reservation, WI . . . . . . . . 711 526 73.9 $816 27 3.7 158 22.2 1 4 13 Osage Reservation, OK . . . . . . . . . . . . . . 1,944 1,683 86.5 $575 35 1.8 226 11.6 1 3 11 Papago Reservation, AZ . . . . . . . . . . . . . 2,100 674 32.0 $478 46 2.1 1,380 65.7 1 4 23 Pascua Yaqui Reservation, AZ . . . . . . . . 526 484 92.0 $454 14 2.6 28 5.3 1 4 18 Pine Ridge Reservation and Trust Lands, NE-SD . . . . . . . . . . . . . . . . . . . . . . . . 2,302 1,744 75.7 $805 53 2.3 505 21.9 1 6 24 Red Lake Reservation, MN . . . . . . . . . . . 917 56 6.1 $424 0 0.0 861 93.8 0 2 31 Rosebud Reservation and Trust Lands, SD . . . . . . . . . . . . . . . . . . . . . . . . . . . . 1,924 1,124 58.4 $717 49 2.5 751 39.0 1 5 21 St. Regis Mohawk Reservation, NY . . . . . 628 329 52.3 $371 19 3.0 280 44.5 0 1 10 Salt River Reservation, AZ . . . . . . . . . . . . 857 291 33.9 $427 0 0.0 566 66.0 1 2 9 San Carlos Reservation, AZ . . . . . . . . . . . 1,636 1,083 66.1 $598 0 0.0 553 33.8 0 4 21 Standing Rock Reservation, ND-SD . . . . 1,135 437 38.5 $814 296 26.0 402 35.4 1 3 14 Turtle Mountain Reservation and Trust Lands, ND-SD . . . . . . . . . . . . . . . . . . 1,982 932 47.0 $751 146 7.3 904 45.6 1 4 18 Uintah and Ouray Reservation, UT . . . . . 656 409 62.3 $780 4 0.6 243 37.0 1 5 25 Warm Springs Reservation and Trust Lands, OR . . . . . . . . . . . . . . . . . . . . . 665 23 3.4 $623 0 0.0 642 96.5 1 2 6 White Earth Reservation, MN . . . . . . . . . . 833 330 39.6 $590 8 0.9 495 59.4 1 3 13 Wind River Reservation, WY . . . . . . . . . . 1,530 1,017 66.4 $735 76 4.9 437 28.5 1 4 15 Yakima Reservation and Trust Lands, WA . . . . . . . . . . . . . . . . . . . . . . . . . . . 1,544 71 4.5 $375 48 3.1 1,425 92.2 0 1 2 Zuni Pueblo, AZ-NM . . . . . . . . . . . . . . . . . 1,462 1,070 73.1 $647 15 1.0 377 25.7 1 3 9
* = Value withheld due to data quality concerns. Note: HH = Households. Source: U.S. Bureau of the Census, 1990 Decennial Census of Housing.
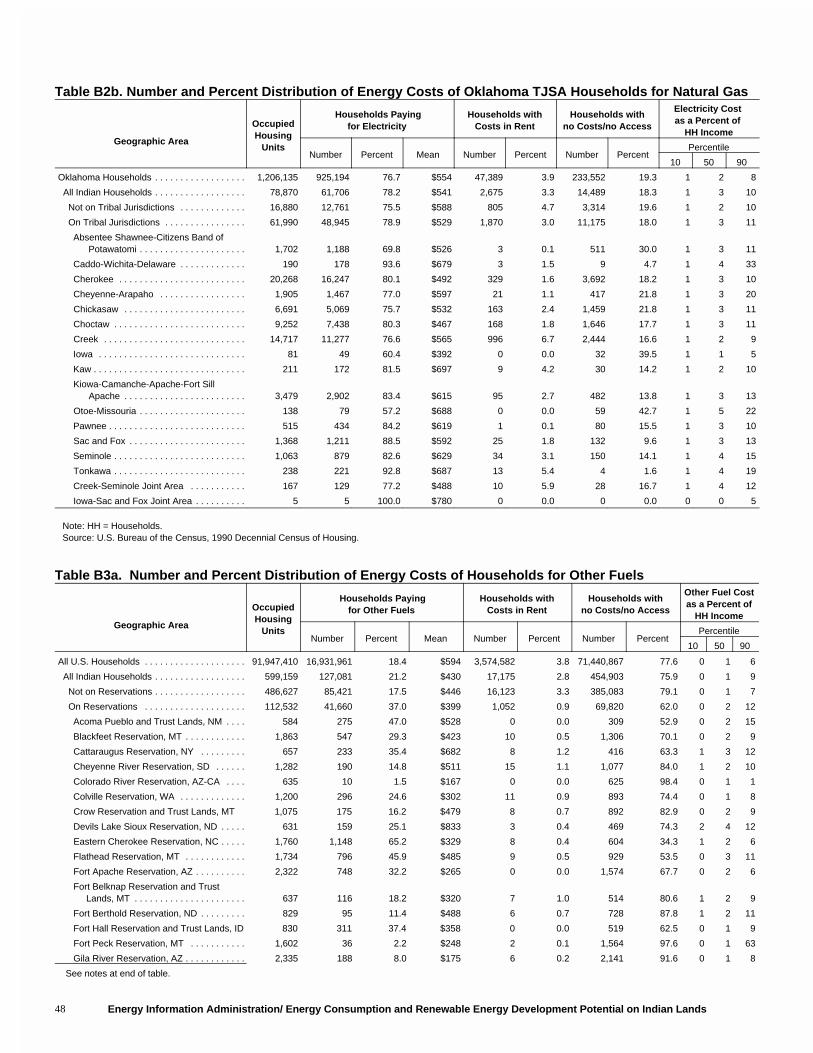
Energy Information Administration/ Energy Consumption and Renewable Energy Development Potential on Indian Lands48
Table B2b. Number and Percent Distribution of Energy Costs of Oklahoma TJSA Households for Natural Gas
Geographic Area
OccupiedHousing
Units
Households Payingfor Electricity
Households withCosts in Rent
Households withno Costs/no Access
Electricity Cost as a Percent of
HH Income
Number Percent Mean Number Percent Number PercentPercentile
10 50 90
Oklahoma Households . . . . . . . . . . . . . . . . . . 1,206,135 925,194 76.7 $554 47,389 3.9 233,552 19.3 1 2 8
All Indian Households . . . . . . . . . . . . . . . . . . 78,870 61,706 78.2 $541 2,675 3.3 14,489 18.3 1 3 10
Not on Tribal Jurisdictions . . . . . . . . . . . . . 16,880 12,761 75.5 $588 805 4.7 3,314 19.6 1 2 10
On Tribal Jurisdictions . . . . . . . . . . . . . . . . 61,990 48,945 78.9 $529 1,870 3.0 11,175 18.0 1 3 11
Absentee Shawnee-Citizens Band of Potawatomi . . . . . . . . . . . . . . . . . . . . . 1,702 1,188 69.8 $526 3 0.1 511 30.0 1 3 11
Caddo-Wichita-Delaware . . . . . . . . . . . . . 190 178 93.6 $679 3 1.5 9 4.7 1 4 33
Cherokee . . . . . . . . . . . . . . . . . . . . . . . . . 20,268 16,247 80.1 $492 329 1.6 3,692 18.2 1 3 10
Cheyenne-Arapaho . . . . . . . . . . . . . . . . . 1,905 1,467 77.0 $597 21 1.1 417 21.8 1 3 20
Chickasaw . . . . . . . . . . . . . . . . . . . . . . . . 6,691 5,069 75.7 $532 163 2.4 1,459 21.8 1 3 11
Choctaw . . . . . . . . . . . . . . . . . . . . . . . . . . 9,252 7,438 80.3 $467 168 1.8 1,646 17.7 1 3 11
Creek . . . . . . . . . . . . . . . . . . . . . . . . . . . . 14,717 11,277 76.6 $565 996 6.7 2,444 16.6 1 2 9
Iowa . . . . . . . . . . . . . . . . . . . . . . . . . . . . . 81 49 60.4 $392 0 0.0 32 39.5 1 1 5
Kaw . . . . . . . . . . . . . . . . . . . . . . . . . . . . . . 211 172 81.5 $697 9 4.2 30 14.2 1 2 10
Kiowa-Camanche-Apache-Fort Sill Apache . . . . . . . . . . . . . . . . . . . . . . . . 3,479 2,902 83.4 $615 95 2.7 482 13.8 1 3 13
Otoe-Missouria . . . . . . . . . . . . . . . . . . . . . 138 79 57.2 $688 0 0.0 59 42.7 1 5 22
Pawnee . . . . . . . . . . . . . . . . . . . . . . . . . . . 515 434 84.2 $619 1 0.1 80 15.5 1 3 10
Sac and Fox . . . . . . . . . . . . . . . . . . . . . . . 1,368 1,211 88.5 $592 25 1.8 132 9.6 1 3 13
Seminole . . . . . . . . . . . . . . . . . . . . . . . . . . 1,063 879 82.6 $629 34 3.1 150 14.1 1 4 15
Tonkawa . . . . . . . . . . . . . . . . . . . . . . . . . . 238 221 92.8 $687 13 5.4 4 1.6 1 4 19
Creek-Seminole Joint Area . . . . . . . . . . . 167 129 77.2 $488 10 5.9 28 16.7 1 4 12
Iowa-Sac and Fox Joint Area . . . . . . . . . . 5 5 100.0 $780 0 0.0 0 0.0 0 0 5
Note: HH = Households. Source: U.S. Bureau of the Census, 1990 Decennial Census of Housing.
Table B3a. Number and Percent Distribution of Energy Costs of Households for Other Fuels
Geographic Area
OccupiedHousing
Units
Households Payingfor Other Fuels
Households withCosts in Rent
Households withno Costs/no Access
Other Fuel Costas a Percent of
HH Income
Number Percent Mean Number Percent Number PercentPercentile
10 50 90
All U.S. Households . . . . . . . . . . . . . . . . . . . . 91,947,410 16,931,961 18.4 $594 3,574,582 3.8 71,440,867 77.6 0 1 6
All Indian Households . . . . . . . . . . . . . . . . . . 599,159 127,081 21.2 $430 17,175 2.8 454,903 75.9 0 1 9
Not on Reservations . . . . . . . . . . . . . . . . . . 486,627 85,421 17.5 $446 16,123 3.3 385,083 79.1 0 1 7
On Reservations . . . . . . . . . . . . . . . . . . . . 112,532 41,660 37.0 $399 1,052 0.9 69,820 62.0 0 2 12
Acoma Pueblo and Trust Lands, NM . . . . 584 275 47.0 $528 0 0.0 309 52.9 0 2 15
Blackfeet Reservation, MT . . . . . . . . . . . . 1,863 547 29.3 $423 10 0.5 1,306 70.1 0 2 9
Cattaraugus Reservation, NY . . . . . . . . . 657 233 35.4 $682 8 1.2 416 63.3 1 3 12
Cheyenne River Reservation, SD . . . . . . 1,282 190 14.8 $511 15 1.1 1,077 84.0 1 2 10
Colorado River Reservation, AZ-CA . . . . 635 10 1.5 $167 0 0.0 625 98.4 0 1 1
Colville Reservation, WA . . . . . . . . . . . . . 1,200 296 24.6 $302 11 0.9 893 74.4 0 1 8
Crow Reservation and Trust Lands, MT 1,075 175 16.2 $479 8 0.7 892 82.9 0 2 9
Devils Lake Sioux Reservation, ND . . . . . 631 159 25.1 $833 3 0.4 469 74.3 2 4 12
Eastern Cherokee Reservation, NC . . . . . 1,760 1,148 65.2 $329 8 0.4 604 34.3 1 2 6
Flathead Reservation, MT . . . . . . . . . . . . 1,734 796 45.9 $485 9 0.5 929 53.5 0 3 11
Fort Apache Reservation, AZ . . . . . . . . . . 2,322 748 32.2 $265 0 0.0 1,574 67.7 0 2 6
Fort Belknap Reservation and Trust Lands, MT . . . . . . . . . . . . . . . . . . . . . . 637 116 18.2 $320 7 1.0 514 80.6 1 2 9
Fort Berthold Reservation, ND . . . . . . . . . 829 95 11.4 $488 6 0.7 728 87.8 1 2 11
Fort Hall Reservation and Trust Lands, ID 830 311 37.4 $358 0 0.0 519 62.5 0 1 9
Fort Peck Reservation, MT . . . . . . . . . . . 1,602 36 2.2 $248 2 0.1 1,564 97.6 0 1 63
Gila River Reservation, AZ . . . . . . . . . . . . 2,335 188 8.0 $175 6 0.2 2,141 91.6 0 1 8
See notes at end of table.
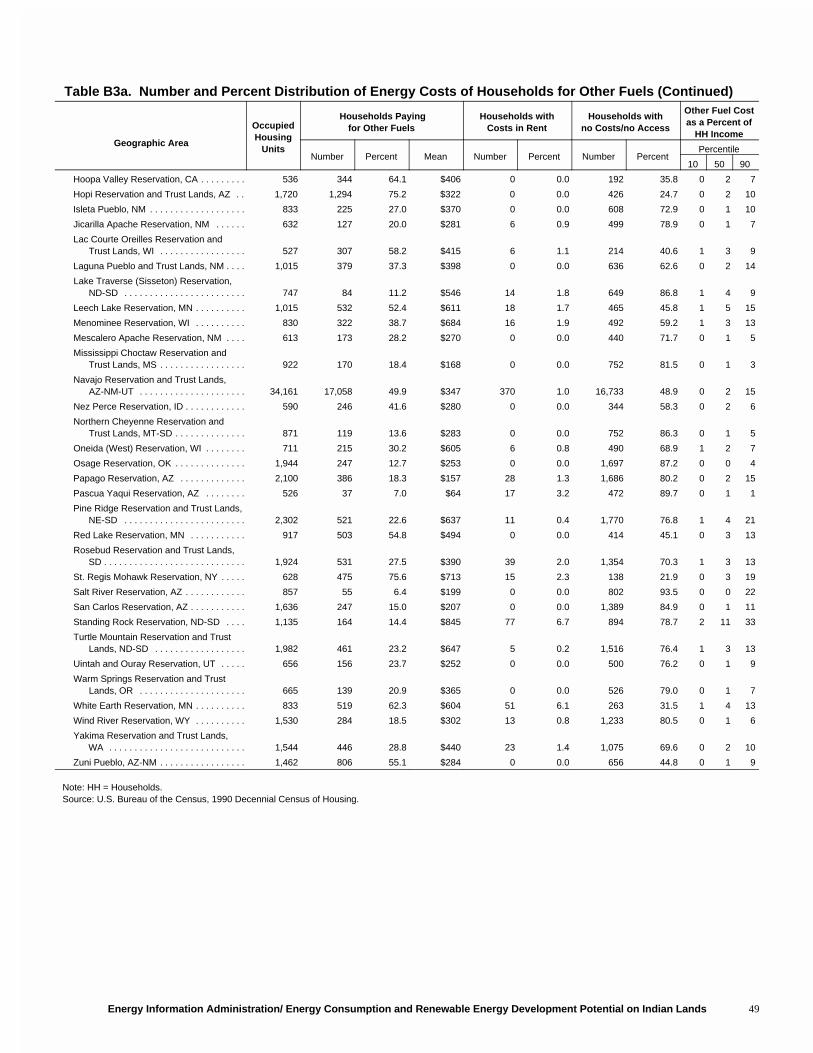
Table B3a. Number and Percent Distribution of Energy Costs of Households for Other Fuels (Continued)
Geographic Area
OccupiedHousing
Units
Households Payingfor Other Fuels
Households withCosts in Rent
Households withno Costs/no Access
Other Fuel Costas a Percent of
HH Income
Number Percent Mean Number Percent Number PercentPercentile
10 50 90
Energy Information Administration/ Energy Consumption and Renewable Energy Development Potential on Indian Lands 49
Hoopa Valley Reservation, CA . . . . . . . . . 536 344 64.1 $406 0 0.0 192 35.8 0 2 7
Hopi Reservation and Trust Lands, AZ . . 1,720 1,294 75.2 $322 0 0.0 426 24.7 0 2 10
Isleta Pueblo, NM . . . . . . . . . . . . . . . . . . . 833 225 27.0 $370 0 0.0 608 72.9 0 1 10
Jicarilla Apache Reservation, NM . . . . . . 632 127 20.0 $281 6 0.9 499 78.9 0 1 7
Lac Courte Oreilles Reservation and Trust Lands, WI . . . . . . . . . . . . . . . . . 527 307 58.2 $415 6 1.1 214 40.6 1 3 9
Laguna Pueblo and Trust Lands, NM . . . . 1,015 379 37.3 $398 0 0.0 636 62.6 0 2 14
Lake Traverse (Sisseton) Reservation, ND-SD . . . . . . . . . . . . . . . . . . . . . . . . 747 84 11.2 $546 14 1.8 649 86.8 1 4 9
Leech Lake Reservation, MN . . . . . . . . . . 1,015 532 52.4 $611 18 1.7 465 45.8 1 5 15
Menominee Reservation, WI . . . . . . . . . . 830 322 38.7 $684 16 1.9 492 59.2 1 3 13
Mescalero Apache Reservation, NM . . . . 613 173 28.2 $270 0 0.0 440 71.7 0 1 5
Mississippi Choctaw Reservation and Trust Lands, MS . . . . . . . . . . . . . . . . . 922 170 18.4 $168 0 0.0 752 81.5 0 1 3
Navajo Reservation and Trust Lands, AZ-NM-UT . . . . . . . . . . . . . . . . . . . . . 34,161 17,058 49.9 $347 370 1.0 16,733 48.9 0 2 15
Nez Perce Reservation, ID . . . . . . . . . . . . 590 246 41.6 $280 0 0.0 344 58.3 0 2 6
Northern Cheyenne Reservation and Trust Lands, MT-SD . . . . . . . . . . . . . . 871 119 13.6 $283 0 0.0 752 86.3 0 1 5
Oneida (West) Reservation, WI . . . . . . . . 711 215 30.2 $605 6 0.8 490 68.9 1 2 7
Osage Reservation, OK . . . . . . . . . . . . . . 1,944 247 12.7 $253 0 0.0 1,697 87.2 0 0 4
Papago Reservation, AZ . . . . . . . . . . . . . 2,100 386 18.3 $157 28 1.3 1,686 80.2 0 2 15
Pascua Yaqui Reservation, AZ . . . . . . . . 526 37 7.0 $64 17 3.2 472 89.7 0 1 1
Pine Ridge Reservation and Trust Lands, NE-SD . . . . . . . . . . . . . . . . . . . . . . . . 2,302 521 22.6 $637 11 0.4 1,770 76.8 1 4 21
Red Lake Reservation, MN . . . . . . . . . . . 917 503 54.8 $494 0 0.0 414 45.1 0 3 13
Rosebud Reservation and Trust Lands, SD . . . . . . . . . . . . . . . . . . . . . . . . . . . . 1,924 531 27.5 $390 39 2.0 1,354 70.3 1 3 13
St. Regis Mohawk Reservation, NY . . . . . 628 475 75.6 $713 15 2.3 138 21.9 0 3 19
Salt River Reservation, AZ . . . . . . . . . . . . 857 55 6.4 $199 0 0.0 802 93.5 0 0 22
San Carlos Reservation, AZ . . . . . . . . . . . 1,636 247 15.0 $207 0 0.0 1,389 84.9 0 1 11
Standing Rock Reservation, ND-SD . . . . 1,135 164 14.4 $845 77 6.7 894 78.7 2 11 33
Turtle Mountain Reservation and Trust Lands, ND-SD . . . . . . . . . . . . . . . . . . 1,982 461 23.2 $647 5 0.2 1,516 76.4 1 3 13
Uintah and Ouray Reservation, UT . . . . . 656 156 23.7 $252 0 0.0 500 76.2 0 1 9
Warm Springs Reservation and Trust Lands, OR . . . . . . . . . . . . . . . . . . . . . 665 139 20.9 $365 0 0.0 526 79.0 0 1 7
White Earth Reservation, MN . . . . . . . . . . 833 519 62.3 $604 51 6.1 263 31.5 1 4 13
Wind River Reservation, WY . . . . . . . . . . 1,530 284 18.5 $302 13 0.8 1,233 80.5 0 1 6
Yakima Reservation and Trust Lands, WA . . . . . . . . . . . . . . . . . . . . . . . . . . . 1,544 446 28.8 $440 23 1.4 1,075 69.6 0 2 10
Zuni Pueblo, AZ-NM . . . . . . . . . . . . . . . . . 1,462 806 55.1 $284 0 0.0 656 44.8 0 1 9
Note: HH = Households. Source: U.S. Bureau of the Census, 1990 Decennial Census of Housing.
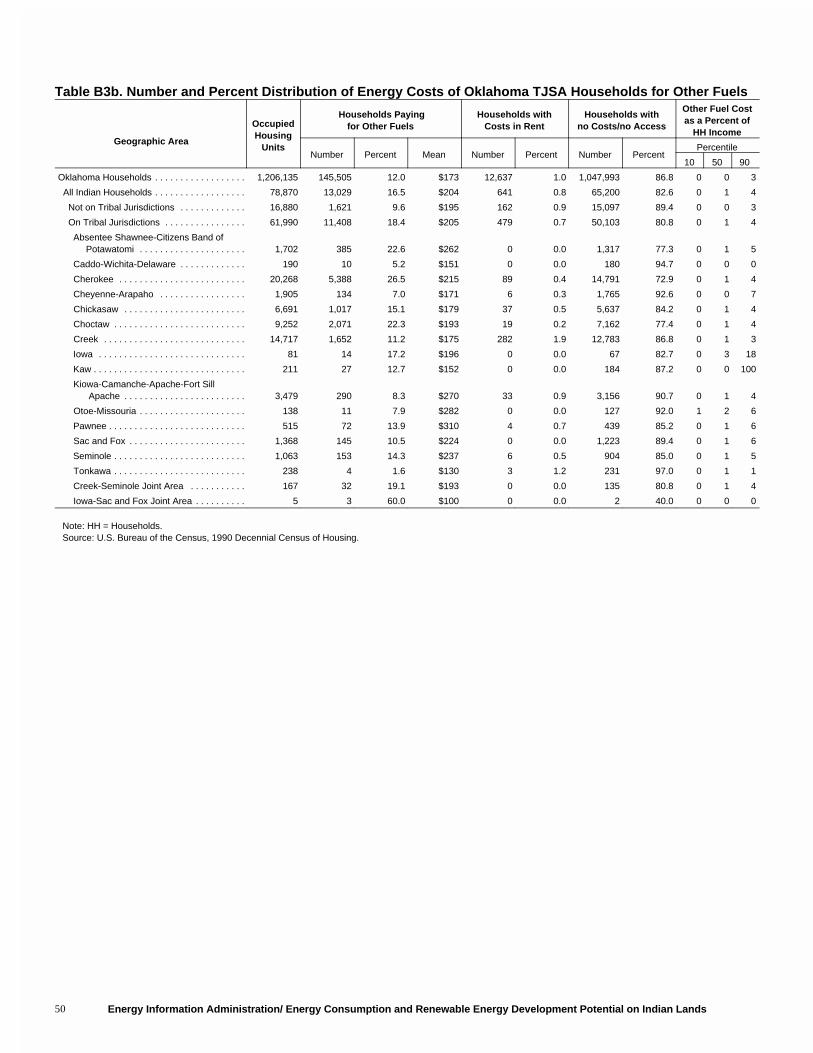
Energy Information Administration/ Energy Consumption and Renewable Energy Development Potential on Indian Lands50
Table B3b. Number and Percent Distribution of Energy Costs of Oklahoma TJSA Households for Other Fuels
Geographic Area
OccupiedHousing
Units
Households Payingfor Other Fuels
Households withCosts in Rent
Households withno Costs/no Access
Other Fuel Costas a Percent of
HH Income
Number Percent Mean Number Percent Number PercentPercentile
10 50 90
Oklahoma Households . . . . . . . . . . . . . . . . . . 1,206,135 145,505 12.0 $173 12,637 1.0 1,047,993 86.8 0 0 3
All Indian Households . . . . . . . . . . . . . . . . . . 78,870 13,029 16.5 $204 641 0.8 65,200 82.6 0 1 4
Not on Tribal Jurisdictions . . . . . . . . . . . . . 16,880 1,621 9.6 $195 162 0.9 15,097 89.4 0 0 3
On Tribal Jurisdictions . . . . . . . . . . . . . . . . 61,990 11,408 18.4 $205 479 0.7 50,103 80.8 0 1 4
Absentee Shawnee-Citizens Band of Potawatomi . . . . . . . . . . . . . . . . . . . . . 1,702 385 22.6 $262 0 0.0 1,317 77.3 0 1 5
Caddo-Wichita-Delaware . . . . . . . . . . . . . 190 10 5.2 $151 0 0.0 180 94.7 0 0 0
Cherokee . . . . . . . . . . . . . . . . . . . . . . . . . 20,268 5,388 26.5 $215 89 0.4 14,791 72.9 0 1 4
Cheyenne-Arapaho . . . . . . . . . . . . . . . . . 1,905 134 7.0 $171 6 0.3 1,765 92.6 0 0 7
Chickasaw . . . . . . . . . . . . . . . . . . . . . . . . 6,691 1,017 15.1 $179 37 0.5 5,637 84.2 0 1 4
Choctaw . . . . . . . . . . . . . . . . . . . . . . . . . . 9,252 2,071 22.3 $193 19 0.2 7,162 77.4 0 1 4
Creek . . . . . . . . . . . . . . . . . . . . . . . . . . . . 14,717 1,652 11.2 $175 282 1.9 12,783 86.8 0 1 3
Iowa . . . . . . . . . . . . . . . . . . . . . . . . . . . . . 81 14 17.2 $196 0 0.0 67 82.7 0 3 18
Kaw . . . . . . . . . . . . . . . . . . . . . . . . . . . . . . 211 27 12.7 $152 0 0.0 184 87.2 0 0 100
Kiowa-Camanche-Apache-Fort Sill Apache . . . . . . . . . . . . . . . . . . . . . . . . 3,479 290 8.3 $270 33 0.9 3,156 90.7 0 1 4
Otoe-Missouria . . . . . . . . . . . . . . . . . . . . . 138 11 7.9 $282 0 0.0 127 92.0 1 2 6
Pawnee . . . . . . . . . . . . . . . . . . . . . . . . . . . 515 72 13.9 $310 4 0.7 439 85.2 0 1 6
Sac and Fox . . . . . . . . . . . . . . . . . . . . . . . 1,368 145 10.5 $224 0 0.0 1,223 89.4 0 1 6
Seminole . . . . . . . . . . . . . . . . . . . . . . . . . . 1,063 153 14.3 $237 6 0.5 904 85.0 0 1 5
Tonkawa . . . . . . . . . . . . . . . . . . . . . . . . . . 238 4 1.6 $130 3 1.2 231 97.0 0 1 1
Creek-Seminole Joint Area . . . . . . . . . . . 167 32 19.1 $193 0 0.0 135 80.8 0 1 4
Iowa-Sac and Fox Joint Area . . . . . . . . . . 5 3 60.0 $100 0 0.0 2 40.0 0 0 0
Note: HH = Households. Source: U.S. Bureau of the Census, 1990 Decennial Census of Housing.
51Energy Information Administration/ Energy Consumption and Renewable Energy Development Potential on Indian Lands
Appendix C
Dynamic Maps ofRenewable Resource Potential on Indian Lands
In addition to the hard-copy maps shown in Chapter 3,maps of renewable resources on Indian lands and theU.S. transmission grid are available electronically at thefollowing National Renewable Energy Laboratory(NREL) website:
http://maps.nrel.gov/gis.html .
These maps are dynamic in the sense that one canexamine the maps in greater or lesser detail. One canalso include or exclude major geographic features fromthe maps, such as Interstate highways and metropolitanareas. Obtain information on how to use the map serverby clicking the button "Map Server Info" in the lowerleft-hand corner of the screen.
The maps shown are the result of overlaying the Indianlands map with resource and transmission grid maps.As a result, it is not possible to manipulate any dataused to build the maps (e.g., create a list of all Indianlands with wind resource class greater than or equal to4). It is possible to develop such a capability, however,because NREL created the maps using the Arc Viewgeographic information system (GIS). Further capabilityexists to develop map-based links to non-map data (e.g.,electricity generator data by longitude-latitude, countyCensus data) and use Arc View GIS techniques todevelop downloadable spreadsheets with both map- andnonmap-based data. This would permit one to developa user-friendly tool that both policymakers and projectproposers could use, based upon a common set of data.
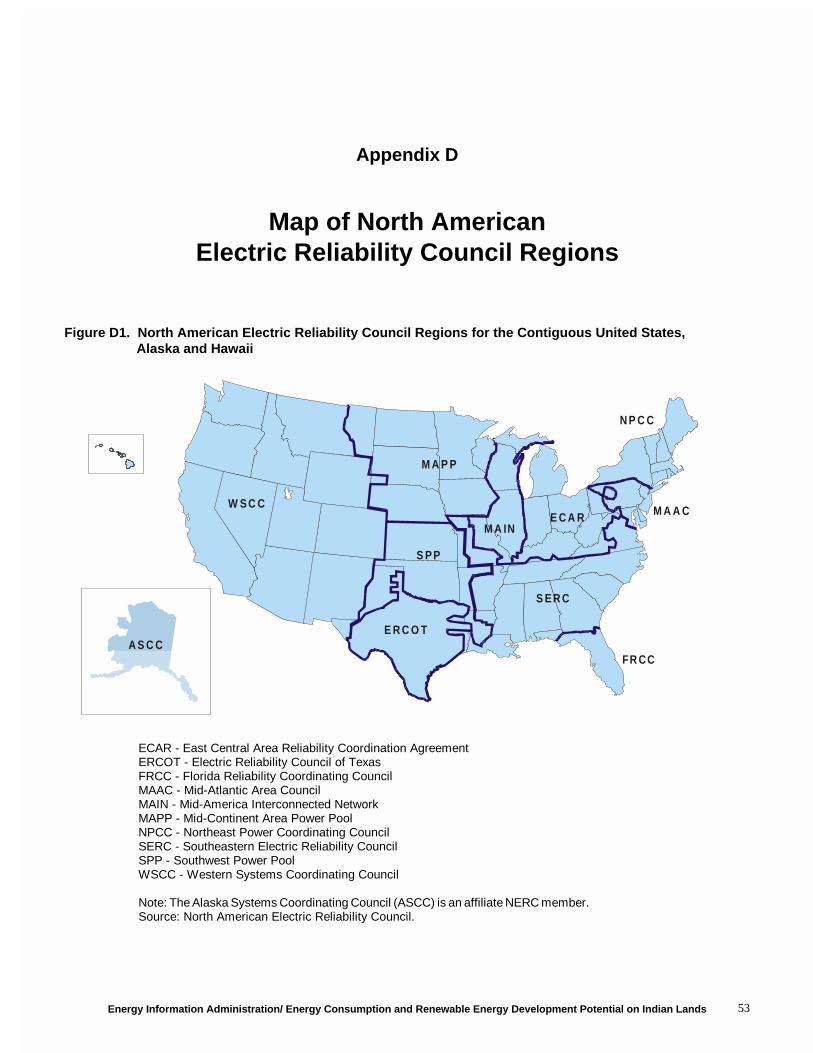
53Energy Information Administration/ Energy Consumption and Renewable Energy Development Potential on Indian Lands
W S C C
M A P P
M A IN
N P C C
S E R C
M A A C
S P P
E C A R
FR CC
E R C O TE R C O T
A S C C
Figure D1. North American Electric Reliability Council Regions for the Contiguous United States,Alaska and Hawaii
Appendix D
Map of North AmericanElectric Reliability Council Regions
ECAR - East Central Area Reliability Coordination AgreementERCOT - Electric Reliability Council of TexasFRCC - Florida Reliability Coordinating CouncilMAAC - Mid-Atlantic Area CouncilMAIN - Mid-America Interconnected NetworkMAPP - Mid-Continent Area Power PoolNPCC - Northeast Power Coordinating CouncilSERC - Southeastern Electric Reliability CouncilSPP - Southwest Power PoolWSCC - Western Systems Coordinating Council
Note: The Alaska Systems Coordinating Council (ASCC) is an affiliate NERC member.Source: North American Electric Reliability Council.
Energy Information Administration/ Energy Consumption and Renewable Energy Development Potential on Indian Lands 55
Glossary
Alternating Current: An electric current that reverses itsdirection at regularly recurring intervals, usually 50 or60 times per second.
Amorphous Silicon: An alloy of silica and hydrogen,with a disordered, noncrystalline internal atomicarrangement, that can be deposited in thin-layers (a fewmicrometers in thickness) by a number of depositionmethods to produce thin-film photovoltaic cells onglass, metal, or plastic substrates.
Annualized Growth Rates: Calculated as follows:
(xn / x1) 1/n ,
where x is the value under consideration and n is thenumber of periods.
Aquifer: A subsurface rock unit from which water canbe produced.
ARI: Air-Conditioning and Refrigeration Institute
Availability Factor: A percentage representing thenumber of hours a generating unit is available toproduce power (regardless of the amount of power) ina given period, compared to the number of hours in theperiod.
Biodiesel: A renewable fuel synthesized from soy beans,other oil crops, or animal tallow which can substitute forpetroleum diesel fuel.
Biomass: Organic nonfossil material of biological originconstituting a renewable energy source.
Black Liquor: A byproduct of the paper productionprocess that can be used as a source of energy.
British Thermal Unit (Btu):The quantity of heat neededto raise the temperature of 1 pound of water by 1(F at ornear 39.2(F.
Capacity Factor: The ratio of the electrical energyproduced by a generating unit for the period of timeconsidered to the electrical energy that could have beenproduced at continuous full-power operation during thesame period.
Capacity, Gross: The full-load continuous rating of agenerator, prime mover, or other electric equipmentunder specified conditions as designated by the manu-facturer. It is usually indicated on a nameplate attachedto the equipment.
Capital Cost: The cost of field development and plantconstruction and the equipment required for thegeneration of electricity.
Cast Silicon: Crystalline silicon obtained by pouringpure molten silicon into a vertical mold and adjustingthe temperature gradient along the mold volume duringcooling to obtain slow, vertically-advancing crystal-lization of the silicon. The polycrystalline ingot thusformed is composed of large, relatively parallel,interlocking crystals. The cast ingots are sawed intowafers for further fabrication into photovoltaic cells.Cast-silicon wafers and ribbon-silicon sheets fabricatedinto cells are usually referred to as polycrystallinephotovoltaic cells.
Climate Change (Greenhouse Effect): The increasingmean global surface temperature of the Earth caused bygases in the atmosphere (including carbon dioxide,methane, nitrous oxide, ozone, and chlorofluoro-carbons). The greenhouse effect allows solar radiation topenetrate the Earth's atmosphere but absorbs theinfrared radiation returning to space.
Cogeneration: The production of electrical energy andanother form of useful energy (such as heat or steam)through the sequential use of energy.
Combined Cycle: An electric generating technology inwhich electricity is produced from otherwise lost wasteheat exiting from one or more gas (combustion) turbines.The exiting heat is routed to a conventional boiler or toa heat recovery steam generator for utilization by asteam turbine in the production of electricity. Suchdesigns increase the efficiency of the electric generatingunit.
Concentrator: A reflective or refractive device thatfocuses incident insolation onto an area smaller than thereflective or refractive surface, resulting in increasedinsolation at the point of focus.
Energy Information Administration/ Energy Consumption and Renewable Energy Development Potential on Indian Lands56
Cull Wood: Wood logs, chips, or wood products thatare burned.
Direct Current: An electric current that flows in aconstant direction. The magnitude of the current doesnot vary or has a slight variation.
Electric Utility Restructuring: With some notableexceptions, the electric power industry historically hasbeen composed primarily of investor-owned utilities.These utilities have been predominantly vertically inte-grated monopolies (combining electricity generation,transmission, and distribution), whose prices have beenregulated by State and Federal government agencies.Restructuring the industry entails the introduction ofcompetition into at least the generation phase of elec-tricity production, with a corresponding decrease inregulatory control. Restructuring may also modify oreliminate other traditional aspects of investor-ownedutilities, including their exclusive franchise to serve agiven geographical area, assured rates of return, andvertical integration of the production process.
Emission: The release or discharge of a substance intothe environment; generally refers to the release of gasesor particulates into the air.
Evacuated Tube: In a solar thermal collector, an absorb-er tube, which is contained in an evacuated glasscylinder, through which collector fluids flows.
Exempt Wholesale Generator (EWG): A nonutilityelectricity generator that is not a qualifying facilityunder the Public Utility Regulatory Policies Act of 1978.
Externalities: Benefits or costs, generated as a by-product of an economic activity, that do not accrue tothe parties involved in the activity. Environmental exter-nalities are benefits or costs that manifest themselvesthrough changes in the physical or biological envi-ronment.
Flat Plate Pumped: A medium-temperature solarthermal collector that typically consists of a metal frame,glazing, absorbers (usually metal), and insulation andthat uses a pump liquid as the heat-transfer medium:predominant use is in water heating applications.
Flow Control: The laws, regulations, and economicincentives or disincentives used by waste managers todirect waste generated in a specific geographic area toa designated landfill, recycling, or waste-to-energyfacility.
Fuel Cells: One or more cells capable of generating anelectrical current by converting the chemical energy of afuel directly into electrical energy. Fuel cells differ fromconventional electrical cells in that the active materialssuch as fuel and oxygen are not contained within the cellbut are supplied from outside.
Fuelwood: Wood and wood products, possibly includ-ing coppices, scrubs, branches, etc., bought or gathered,and used by direct combustion.
Fumarole: A vent from which steam or gases issue; ageyser or spring that emits gases.
Generation (Electricity): The process of producingelectric energy from other forms of energy; also, theamount of electric energy produced, expressed inwatthours (Wh).
Geopressured: A type of geothermal resource occurringin deep basins in which the fluid is under very highpressure.
Geothermal Energy: As used at electric utilities, hotwater or steam extracted from geothermal reservoirs inthe Earth's crust that is supplied to steam turbines atelectric utilities that drive generators to produce elec-tricity.
Geothermal Plant: A plant in which a turbine is driveneither from hot water or by natural steam that derives itsenergy from heat found in rocks or fluids at variousdepths beneath the surface of the earth. The fluids areextracted by drilling and/or pumping.
Geyser: A special type of thermal spring that periodi-cally ejects water with great force.
Giga: One billion.
Green Pricing: In the case of renewable electricity,green pricing represents a market solution to thevarious problems associated with regulatory valuationof the nonmarket benefits of renewables. Greenpricing programs allow electricity customers to expresstheir willingness to pay for renewable energydevelopment through direct payments on their monthlyutility bills.
Grid: The layout of an electrical distribution system.
Groundwater: Water occurring in the subsurface zonewhere all spaces are filled with water under pressuregreater than that of the atmosphere.
Energy Information Administration/ Energy Consumption and Renewable Energy Development Potential on Indian Lands 57
Heat Pump: A year-round heating and air-conditioningsystem employing a refrigeration cycle. In a refriger-ation cycle, a refrigerant is compressed (as aliquid) andexpanded (as a vapor) to absorb and reject heat. Theheat pump transfers heat to a space to be heated duringthe winter period and by reversing the operationextracts (absorbs) heat from the same space to be cooledduring the summer period. The refrigerant within theheat pump in the heating mode absorbs the heat to besupplied to the space to be heated from an outsidemedium (air, ground or ground water) and in thecooling mode absorbs heat from the space to be cooledto be rejected to the outside medium. Heat Pump (Air Source): An air-source heat pump isthe most common type of heat pump. The heat pumpabsorbs heat from the outside air and transfers the heatto the space to be heated in the heating mode. In thecooling mode the heat pump absorbs heat from thespace to be cooled and rejects the heat to the outside air.In the heating mode when the outside air approaches32o F or less, air-source heat pumps loose efficiency andgenerally require a back-up (resistance) heating system.
Heat Pump (Geothermal): A heat pump in which therefrigerant exchanges heat (in a heat exchanger) with afluid circulating through an earth connection medium(ground or ground water). The fluid is contained in avariety of loop (pipe) configurations depending on thetemperature of the ground and the ground areaavailable. Loops may be installed horizontally or vert-ically in the ground or submersed in a body of water.
Heat Pump (efficiency): The efficiency of a heat pump,that is, the electrical energy to operate it, is directlyrelated to temperatures between which it operates.Geothermal heat pumps are more efficient than conven-tional heat pumps or air conditioners that use theoutdoor air since the ground or ground water a few feetbelow the earth's surface remains relatively constantthroughout the year. It is more efficient in the winter todraw heat from the relatively warm ground than fromthe atmosphere where the air temperature is muchcolder, and in summer transfer waste heat to therelatively cool ground than to hotter air. Geothermalheat pumps are generally more expensive($2,000-$5,000) to install than outside air heat pumps.However, depending on the location geothermal heatpumps can reduce energy consumption (operating cost)and correspondingly, emissions by more than 20 percentcompared to high-efficiency outside air heat pumps.Geothermal heat pumps also use the waste heat fromair-conditioning to provide free hot water heating in thesummer.
High-Temperature Collector: A solar thermal collectordesigned to operate at a temperature of 180 degreesFahrenheit or higher.
Hot Dry Rock: Heat energy residing in impermeable,crystalline rock. Hydraulic fracturing may be used tocreate permeability to enable circulation of water andremoval of the heat.
Hub Height: In a horizontal-axis wind turbine, thedistance from the turbine platform to the rotor shaft.
Hydraulic Fracturing: Fracturing of rock at depth withfluid pressure. Hydraulic fracturing at depth may beaccomplished by pumping water into a well at very highpressures. Under natural conditions, vapor pressuremay rise high enough to cause fracturing in a processknown as hydrothermal brecciation.
Independent Power Producer (IPP): A wholesaleelectricity producer (other than a qualifying facilityunder the Public Utility Regulatory Policies Act of 1978),that is unaffiliated with franchised utilities in the area inwhich the IPP is selling power and that lacks significantmarketing power. Unlike traditional utilities, IPPs do notpossess transmission facilities that are essential to theircustomers and do not sell power in any retail serviceterritory where they have a franchise.
Internal Collector Storage (ICS): A solar thermalcollector in which incident solar radiation is absorbed bythe storage medium.
Kilowatt (kW): One thousand watts of electricity (SeeWatt).
Kilowatthour (kWh): One thousand watthours.
Levelized Cost: The present value of the total cost ofbuilding and operating a generating plant over itseconomic life, converted to equal annual payments.Costs are levelized in real dollars (i.e., adjusted toremove the impact of inflation).
Liquid Collector: A medium-temperature solar thermalcollector, employed predominantly in water heating,which uses pumped liquid as the heat-transfer medium.
Low-Temperature Collectors: Metallic or nonmetallicsolar thermal collectors that generally operate attemperatures below 110 degrees Fahrenheit and usepumped liquid or air as the heat transfer medium. Theyusually contain no glazing and no insulation, and they
Energy Information Administration/ Energy Consumption and Renewable Energy Development Potential on Indian Lands58
are often made of plastic or rubber, although some aremade of metal.
Magma: Naturally occurring molten rock, generatedwithin the earth and capable of intrusion and extrusion,from which igneous rocks are thought to have beenderived through solidification and related processes. Itmay or may not contain suspended solids (such ascrystals and rock fragments) and/or gas phases.
Marginal Cost: The change in cost associated with a unitchange in quantity supplied or produced.
Medium-Temperature Collectors: Solar thermalcollectors designed to operate in the temperature rangeof 140 degrees to 180 degrees Fahrenheit, but that canalso operate at a temperature as low as 110 degreesFahrenheit. The collector typically consists of a metalframe, metal absorption panels with integral flowchannels (attached tubing for liquid collectors orintegral ducting for air collectors), and glazing andinsulation on the sides and back.
Megawatt (MW): One million watts of electricity (SeeWatt).
Merchant Facilities: High-risk, high-profit facilities thatoperate, at least partially, at the whims of the market, asopposed to those facilities that are constructed withclose cooperation of municipalities and have significantamounts of waste supply guaranteed.
Net Photovoltaic Cell Shipment: The differencebetween photovoltaic cell shipments and photovoltaiccell purchases.
Net Photovoltaic Module Shipment: The differencebetween photovoltaic module shipments and photo-voltaic module purchases.
Nonutility Generation: Electric generation by nonutilitypower producers to supply electric power for industrial,commercial, and military operations, or sales to electricutilities. See Nonutility Power Producer.
Nonutility Power Producer: A corporation, person,agency, authority, or other legal entity or instru-mentality that owns electric generating capacity and isnot an electric utility. Nonutility power producersinclude qualifying cogenerators, qualifying small powerproducers, and other nonutility generators (includingindependent power producers) without a designated,
franchised service area that do not file forms listed in theCode of Federal Regulations, Title 18, Part 141.
Operation and Maintenance (O&M) Cost: Operatingexpenses are associated with operating a facility (i.e.,supervising and engineering expenses). Maintenanceexpenses are that portion of expenses consisting of labor,materials, and other direct and indirect expensesincurred for preserving the operating efficiency orphysical condition of utility plants that are used forpower production, transmission, and distribution ofenergy.
Parabolic Dish: A high-temperature (above 180 degreesFahrenheit) solar thermal concentrator, generally bowl-shaped, with two-axis tracking.
Parabolic Trough: A high-temperature (above 180degrees Fahrenheit) solar thermal concentrator with thecapacity for tracking the sun using one axis of rotation.
Passive Solar: A system in which solar energy alone isused for the transfer of thermal energy. Pumps, blowers,or other heat transfer devices that use energy other thansolar are not used.
Peak Watt: A manufacturer's unit indicating the amountof power a photovoltaic cell or module will produce atstandard test conditions (normally 1,000 watts persquare meter and 25 degrees Celsius).
Photovoltaic Cell: An electronic device consisting oflayers of semiconductor materials fabricated to form ajunction (adjacent layers of materials with differentelectronic characteristics) and electrical contacts andbeing capable of converting incident light directly intoelectricity (direct current).
Photovoltaic Module: An integrated assembly ofinterconnected photovoltaic cells designed to deliver aselected level of working voltage and current at itsoutput terminals, packaged for protection againstenvironment degradation, and suited for incorporationin photovoltaic power systems.
Public Utility Regulatory Policies Act of 1978(PURPA): One part of the National Energy Act, PURPAcontains measures designed to encourage the conserva-tion of energy, more efficient use of resources, andequitable rates. Principal among these were suggestedretail rate reforms and new incentives for production ofelectricity by cogenerators and users of renewableresources.
Energy Information Administration/ Energy Consumption and Renewable Energy Development Potential on Indian Lands 59
Pulpwood: Roundwood, whole-tree chips, or woodresidues.
Quadrillion Btu: Equivalent to 10 to the 15th powerBtu.
Qualifying Facility (QF): A cogeneration or smallpower production facility that meets certain ownership,operating, and efficiency criteria established by theFederal Energy Regulatory Commission (FERC) pursu-ant to the Public Utility Regulatory Policies Act of 1978(PURPA). (See the Code of Federal Regulations, Title 18,Part 292.)
Refuse-Derived Fuel (RDF): Fuel processed frommunicipal solid waste that can be in shredded, fluff, ordensified pellet forms.
Renewable Energy Source: An energy source that isregenerative or virtually inexhaustible. Typical exam-ples are wind, geothermal, and water power.
Ribbon Silicon: Single-crystal silicon derived by meansof fabricating processes that produce sheets or ribbonsof single-crystal silicon. These processes include edge-defined film-fed growth, dendritic web growth, andribbon-to-ribbon growth.
Roundwood: Logs, bolts, and other round timbergenerated from the harvesting of trees.
Silicon: A semiconductor material made from silica,purified for photovoltaic applications.
Single Crystal Silicon (Czochralski): An extremelypure form of crystalline silicon produced by theCzochralski method of dipping a single crystal seed intoa pool of molten silicon under high vacuum conditionsand slowly withdrawing a solidifying single crystalboule rod of silicon. The boule is sawed into thin wafersand fabricated into single-crystal photovoltaic cells.
Solar Energy: The radiant energy of the sun, which canbe converted into other forms of energy, such as heat orelectricity.
Solar Thermal Collector: A device designed to receivesolar radiation and convert it into thermal energy.Normally, a solar thermal collector includes a frame,glazing, and an absorber, together with the appropriateinsulation. The heat collected by the solar thermal col-lector may be used immediately or stored for later use.
Solar Thermal Collector, Special: An evacuated tubecollector or a concentrating (focusing) collector. Special
collectors operate in the temperature (low concentrationfor pool heating) to several hundred degrees Fahrenheit(high concentration for air conditioning and specializedindustrial processes).
Thermosiphon System: A solar collector system forwater heating in which circulation of the collectionfluid through the storage loop is provided solely by thetemperature and density difference between the hotand cold fluids.
Tipping Fee: Price charged to deliver municipal solidwaste to a landfill, waste-to-energy facility, or recyclingfacility.
Transmission System (Electric): An interconnectedgroup of electric transmission lines and associatedequipment for moving or transferring electric energy inbulk between points of supply and points at which it istransformed for delivery over the distribution systemlines to consumers, or is delivered to other electricsystems.
Turbine: A machine for generating rotary mechanicalpower from the energy of a stream of fluid (such aswater, steam, or hot gas). Turbines convert the kineticenergy of fluids to mechanical energy through the prin-ciples of impulse and reaction, or a mixture of the two.
Vapor-Dominated Geothermal System: A conceptualmodel of a hydrothermal system where steam pervadesthe rock and is the pressure-controlling fluid phase.
Watt (Electric): The electrical unit of power. The rate ofenergy transfer equivalent to 1 ampere of electric currentflowing under a pressure of 1 volt at unity power factor.
Watt (Thermal): A unit of power in the metric system,expressed in terms of energy per second, equal to thework done at a rate of 1 joule per second.
Watthour (Wh): The electrical energy unit of measureequal to 1 watt of power supplied to, or taken from, anelectric circuit steadily for 1 hour.
Wheeling: The use of the transmission facilities of onesystem to transmit power and energy by agreement ofand for, another system with a corresponding wheelingcharge (e.g., the transmission of electricity for compen-sation over a system that is received from one systemand delivered to another system).
Wood Pellets: Fuel manufactured from finely groundwood fiber and used in pellet stoves.