rc-1580 - evaluating the financial cost and impact on long ... · delay costs, road construction...
TRANSCRIPT

i
Evaluating the Financial Cost and Impact on Long-Term Pavement
Performance of Expediting Michigan’s Road Construction Work
Submitted by
Mohamed El-Gafy, Ph.D., P.E. Michigan State University
201G Human Ecology Building
552 W. Circle Dr.
East Lansing, MI 48824
Submitted to
Michigan Department of Transportation Research Administration
8885 Ricks Rd.
P.O. Box 30049
Lansing MI 48909
February, 2014
RC-1580

ii
Abstract 1. Report No.
RC-1580 2. Government Accession No.
N/A 3. MDOT Project Manager
Mark Grazioli
4. Title and Subtitle
EVALUATING THE FINANCIAL COST AND IMPACT
ON LONG-TERM PAVEMENT PERFORMANCE OF
EXPEDITING MICHIGAN’S ROAD CONSTRUCTION
WORK
5. Report Date
6. Performing Organization Code
N/A
7. Author(s)
Mohamed El-Gafy, Ph.D., P.E. 8. Performing Org. Report No.
N/A
9. Performing Organization Name and Address
Michigan State University
201 G Human Ecology Building
East Lansing, MI 48824
10. Work Unit No. (TRAIS) N/A
11. Contract No. 2010-0294
11(a). Authorization No. Z8
12. Sponsoring Agency Name and Address
Michigan Department of Transportation
Research Administration
8885 Ricks Rd.
Lansing MI 48909
13. Type of Report & Period Covered
Final Report
10/1/2011 to 10/30/2013
14. Sponsoring Agency Code
N/A
15. Supplementary Notes
16. Abstract
The Michigan Department of Transportation (MDOT) has been using monetary incentive payments for many
years to accelerate highway construction work, resulting in reduced delays to the traveling public. It was
envisioned that incentive/disincentive (I/D) payments/penalties would capture the true cost (user delay savings
vs. actual I/D dollars) and would have positive impacts on the long-term pavement performance by extending
its expected life. Therefore, MDOT sponsored this research study to determine whether the I/D for expediting
construction captures the true cost and identify its impacts on the long-term pavement performance for projects
that have been expedited vs. conventional scheduling. The analyzed data statistically supports an improvement
in the long term project performance for the incentive projects. Also, identified data suggests a trend that incentive
clauses accelerate project schedules. Additionally, data analysis statistically supports the idea that incentive
clauses increase project cost but further analysis finds that the avoided user delay was higher than the additional
paid cost for some incentive clauses. The analysis results highlight the effectiveness of Accepted for Traffic and
Interim Completion incentive/ Disincentive clauses; they also debate the effectiveness of the lane rental incentive/
disincentive clauses, in achieving their goal by accelerating project schedules and reducing user delay cost. Also,
the report calls for little modification to the listed “Advantages and Disadvantages” and “Recommendations for
Use” of each acceleration technique in the 2013 MDOT Innovative Construction Contracting document.
17. Key Words
Pavement performance, Michigan, Incentives, User
delay costs, Road construction, Costs
18. Distribution Statement
No restrictions. This document is available to the
public through the Michigan Department of
Transportation.
19. Security Classification
Unclassified 20. Security Classification Unclassified
21. No. of Pages
80 22. Price
N/A

iii
Research Report Disclaimer
“This publication is disseminated in the interest of information exchange. The Michigan
Department of Transportation (hereinafter referred to as MDOT) expressly disclaims any liability,
of any kind, or for any reason, that might otherwise arise out of any use of this publication or the
information or data provided in the publication. MDOT further disclaims any responsibility for
typographical errors or accuracy of the information provided or contained within this information.
MDOT makes no warranties or representations whatsoever regarding the quality, content,
completeness, suitability, adequacy, sequence, accuracy or timeliness of the information and data
provided, or that the contents represent standards, specifications, or regulations.”
iv
Table of Contents
Contents Abstract ......................................................................................................................................................... ii
Research Report Disclaimer ........................................................................................................................ iii
Table of Contents ......................................................................................................................................... iv
List of Tables ............................................................................................................................................... vi
List of Figures ............................................................................................................................................. vii
List of Acronyms and Abbreviations used in This Report ......................................................................... viii
Executive Summary ..................................................................................................................................... ix
Chapter 1- Introduction ................................................................................................................................. 1
Problem Statement ................................................................................................................................ 1
Background ........................................................................................................................................... 1
Research Objectives .............................................................................................................................. 2
Statement of Hypotheses ....................................................................................................................... 2
Chapter 2- Literature Review ........................................................................................................................ 3
Introduction ........................................................................................................................................... 3
Role of Acceleration Techniques in Accelerating Construction Progress and Reducing User Delay .. 4
Selection Criteria for Acceleration Techniques .................................................................................... 5
Determination of Incentive Amount ..................................................................................................... 5
Determination of Incentive Time .......................................................................................................... 6
Acceleration Techniques Used in Michigan ......................................................................................... 6
Chapter 3- Methodology ............................................................................................................................... 8
Task 1: Data Collection......................................................................................................................... 8
Modification of Task 1 .......................................................................................................................... 8
Task 2: Data Classification ................................................................................................................... 9
Task 3: Data Analyses........................................................................................................................... 9
Task 4: Recommendations on Each Acceleration Technique ............................................................. 10
Chapter 4- Findings ..................................................................................................................................... 11
Summary of Data ................................................................................................................................ 11

v
Method of Analysis ............................................................................................................................. 13
Presentation of the Results .................................................................................................................. 18
Chapter 5- Conclusions ............................................................................................................................... 38
Conclusions from the Study ................................................................................................................ 38
Recommendations for Further Research ............................................................................................. 39
Recommendations for Implementation ............................................................................................... 39
References ................................................................................................................................................... 39
Bibliography ............................................................................................................................................... 41
Appendix 1: List of MDOT Projects Built Via Acceleration Techniques Using I/D Methods Mentioned in
the MDOT Innovative Construction Contracting Document ...................................................................... 49
Appendix 2: List of MDOT Projects Built via Acceleration Techniques vs. Similar MDOT Projects
Constructed without Acceleration Techniques ........................................................................................... 53
Appendix 3: Original Time Performance Index.......................................................................................... 58
Appendix 4: Present Time Performance Index ........................................................................................... 59
Appendix 5: Present Time Performance Index for Incentive Projects and the Paid Incentives .................. 61
Appendix 6: Cost Performance Index ......................................................................................................... 63
Appendix 7: Cost Performance Index for Incentive Projects and the Paid Incentives ............................... 65
Appendix 8: Present Time Performance Index, Cost Performance Index and the Paid Incentives
Percentage ................................................................................................................................................... 68
Appendix 9: Modified Remaining Service Life (RSL) Calculations .......................................................... 70

vi
List of Tables
Table 1: Ranking of Acceleration Technique Objectives (Source: Arditi and Yasamis 1998) ...... 4
Table 2: Data Collection Summary for Incentive Projects ........................................................... 11 Table 3: The Authorized Contract Amounts for Incentive Projects ............................................. 12 Table 4: The Paired Samples T-Test Results Based on OTPI ..................................................... 21 Table 5: The Paired Samples T-Test Results Based on PTPI ....................................................... 21 Table 6: The Paired Samples T-Test Results Based on CPI ......................................................... 25
Table 7: Average Maximum Offered Incentive versus the Average Paid Incentive for Each Type
of Incentive ................................................................................................................................... 26 Table 8: Variables of the Correlation between PTPI and CPI ...................................................... 26 Table 9: Analysis of Variance of the Correlated Model ............................................................... 27 Table 10: Interim Completion Incentives vs. Calculated User Delay Avoided. ........................... 28
Table 11: Accepted for Traffic Incentives vs. Calculated User Delay Avoided .......................... 30
Table 12: Lane Rental Charge and the Hourly User Delay Rate for the Lane Rental Incentive
Projects .......................................................................................................................................... 31
Table 13: Modified Remaining Service Life for Incentive Projects vs. Non-Incentive Projects . 33 Table 14: The Paired Samples T-Test Results Based on Modified RSL ...................................... 34 Table 15: Recommendations on Interim Completion Date Incentives ......................................... 34
Table 16: Recommendations on Accepted for Traffic Incentive/Disincentive ............................ 35 Table 17: Recommendations on Lane Rental Incentive ............................................................... 36

vii
List of Figures
Figure 1: Polynomial Best Fit Curve for Accelerated Projects..................................................... 16
Figure 2: Polynomial Best Fit Curve for Non-Accelerated Projects ............................................ 17 Figure 3: PTPI Data Summary for different types of Incentives .................................................. 18 Figure 4: Time Performance Index vs. Paid Incentive/Disincentive Percentage .......................... 19 Figure 5: Frequencies of PTPI for Incentive Projects vs. Normal Distribution Curve ................. 19 Figure 6: Frequencies of PTPI for Non-Incentive Projects vs. Normal Distribution Curve......... 20
Figure 7: PTPI for Each Incentive Project with the Corresponding Non-Accelerated Project .... 20 Figure 8: CPI Data Summary for different types of Incentives .................................................... 22 Figure 9: Cost Performance Index vs. Paid Incentive/ Disincentive Percentages ........................ 23 Figure 10: CPI Frequencies for Incentive Projects vs. Normal Distribution curve ...................... 23 Figure 11: CPI Frequencies for Non-Incentive Projects vs. Normal Distribution curve .............. 24
Figure 12: CPI for Each Incentive Project with the Corresponding Non-Accelerated Project .... 24
Figure 13: Average Maximum Offered Incentive versus the Average Paid Incentive for Each
Type of Incentive .......................................................................................................................... 26
Figure 14: Correlation between PTPI and CPI ............................................................................. 27 Figure 15 : Interim Completion Paid Incentives vs. Calculated User Delay Avoided ................. 28 Figure 16: Benefit of Interim Completion Incentives (# of days completed in advance)............. 28
Figure 17: Accepted for Traffic Paid Incentives vs. Calculated User Delay Avoided ................. 29 Figure 18: Benefit of Accepted for Traffic Incentives (# of days completed in advance) ........... 29
Figure 19: DI Progress for Incentive and non-Incentive Projects ................................................. 32 Figure 20: Modified RSL for Each Incentive Project with the Corresponding Non-Accelerated
Project ........................................................................................................................................... 32

viii
List of Acronyms and Abbreviations used in This Report
14-Sep FHWA Special Experimental Project No. 14
AASHTO American Association of State Highway and Transportation Officials
AFT Accepted For Traffic Incentive/Disincentive
BCON Bridge Construction
BMP Beginning Mileage Post
BREC Bridge Reconstruction
BREH Bridge Rehabilitation
CO3 Construction Congestion Cost System
CPI Cost Performance Index
CPM Critical Path Method
DI Distress Index
DOT Department of Transportation
DTMB Department of Technology Management and Budget
EMP Ending Mileage Post
FDOT Florida Department of Transportation
FHWA Federal Highway Administration
I/D Incentive/Disincentive
JPCP Jointed Plain Concrete Pavement
JRCP Jointed Reinforced Concrete Pavement
MDOT Michigan Department of Transportation
MISC Miscellaneous
NCON New Reconstruction
OQI Office of Quality Initiatives
OTPI Original Time Performance Index
PMAI Maintenance
PMS Pavement Management System
PTPI Present Time Performance Index
RESU Resurfacing
RREC Reconstruction
RREH Rehabilitation
RSL Remaining Service Life
RUC Road Users Costs
SFTY Safety
SHA State Highway Agencies
VE Value Engineering
ix
Executive Summary
The Michigan Department of Transportation (MDOT) has been using monetary incentive
payments for many years to accelerate highway construction work, resulting in reduced delays to
the traveling public. It was envisioned that incentive/disincentive (I/D) payments/penalties would
capture the true cost (user delay savings vs. actual I/D dollars) and would have positive impacts
on the long-term pavement performance by extending its expected life. However, these impacts
have not been quantified nor qualified. Therefore, MDOT sponsored this research study to
determine whether the I/D for expediting construction captures the true cost (user delay savings
vs. actual I/D dollars), and identify its impacts on the long-term pavement performance for
projects that have been expedited vs. conventional scheduling.
During the course of the study, the research team reviewed and synthesized the literature on
Innovative Construction Contracting and its role in accelerating construction progress and
reducing user delay. The literature supports the need for this study and highlights the lack of a
process for reviewing the effectiveness of incentive/ disincentive clauses.
The research team navigated through multiple data sources to identify a list of all MDOT
projects built via acceleration techniques using I/D methods mentioned in MDOT’s Innovative
Construction Contracting document. Additionally, a matching criteria was developed and used
to identify a list of similar work type and vintage MDOT projects that were constructed under
non I/D means.
Various hypotheses were proposed regarding the effect of different acceleration techniques on
different project performances, including project schedule, cost, and long-term pavement
performance. Different data analysis techniques were used to test these hypothesis and examine
whether the additional project cost has captured the avoided user delay cost. Data analysis did not
support the assertion that incentive clauses adversely impact long term project performance. To the
contrary, the analyzed data statistically supported an improvement in the long term project
performance for the incentive projects over their comparable non-incentive projects. Also, identified
data suggests a trend that incentive clauses accelerate project schedules. A strong trend has been
identified that the incentive projects’ schedules were accelerated compared to their similar non-
incentive projects. Additionally, data analysis statistically support the idea that incentive clauses
increase project cost but further analysis finds that avoided user delay was higher than the additional
paid cost for Accepted for Traffic and Interim Completion incentive/ disincentive clauses except for
Lane Rental Incentive clauses.
The results confirm the effectiveness of Accepted for Traffic and Interim Completion incentive/
disincentive clauses, as well as open a debate on the effectiveness of the lane rental incentive/
disincentive clauses, in achieving their goal by accelerating project schedules and reducing the user
delay cost. Also, this report calls for little modification to the listed “Advantages and Disadvantages”
and “Recommendations for Use” of each acceleration technique in the 2013 MDOT Innovative
Construction Contracting document.

x
The objectives of the study were satisfied and specific recommendations have been proposed:
Maintain a database of current and previous approved special provisions, along with project
performance indicators, to systematically measure the performance of I/D clauses and
benchmark the effectiveness of any new project. This will allow MDOT to assess the value
and practices of these incentives and will help in fulfilling the new incentive reporting
requirement as required by the State of Michigan Act 200, Public Acts of 2012.
Request both the construction engineer and the contractor receiving the incentive to submit a
summary report providing lessons learned that can be implemented in future project designs
and specifications.
Examine the consistency of the currently developed procedure for calculating the incentive
amount (especially for the lane rental incentive/disincentive) state-wide.

1
Chapter 1- Introduction
Problem Statement
Since transportation infrastructure in the United States has substantially deteriorated and is in
emergent need of large-scale renewal, many State Highway Agencies (SHA) are now facing the
dual challenge of repairing aging infrastructure systems while trying to minimize traffic
inconvenience to the traveling public. In completing their projects, the Michigan Department of
Transportation (MDOT) has considerable experience with the application of innovative
construction contracting methods, including monetary incentive payments, which are targeted to
accelerate construction progress and reduce user delay. However, little is known about their impact
on various aspects of project performance such as project true cost (user delay savings vs. actual
Incentive/Disincentive [I/D] dollars), and schedule, as well as their long-term impact on pavement
performance vs. similar MDOT projects constructed under non-incentive methods. The purpose
of this research project is to provide systematic studies on these strategies and proper
analytical/assessment tools to allow MDOT to identify the most effective contractual method/tool
for expediting construction projects and budget them accurately and realistically when they are
considered for implementation.
Background
The United States transportation sector remains the most conservative segment of the construction
industry. Projects are awarded to the lowest bidders. Recently, SHAs, including MDOT, have
started to respond to limited budgetary needs and explore cost effective construction means. In the
meanwhile, they have been pressured to reduce congestion and urban traffic disruptions by
changing their focus from building new roads to maintaining and renewing the current network
(Herbsman et al., 1995; MDOT, 1997). These improvement projects usually require high quality
products that need to be completed in a timely manner to minimize the negative effects on the
traveling public such as severe congestions or safety problems (Lee and Choi, 2006). To mitigate
these problems, the Federal Highway Administration (FHWA) has recommended experimenting
with innovative approaches that could lead to reduced construction time as well as diminish traffic
disruption during construction (Herbsman and Glagola 1998).
Lee and Choi (2006) reported that traveling public and affected businesses are willing to pay higher
construction prices when they anticipate a shortened project duration that mitigates their
inconvenience. Jaraiedi et al. (1995) recommended offering contractors an incentive bonus for
early completion that meets an accelerated schedule in exchange for the additional resources
needed to accomplish the work faster. In 1990, FHWA Special Experimental Project No. 14 (SEP-
14) Innovative Contracting, which was revised to Alternate Contracting in 2002, allowed agencies
to use cost plus time bidding (A+B), Lane Rental, Design-Build contracting, and warranty clauses.
No Excuse Incentives were allowed in 1996. Currently, the I/D contracting clauses are a common
alternative strategy to motive contractors to finish projects early in order to meet the public’s
expectations.

2
Research Objectives
The objectives of this study are to:
1. Review, synthesize, and document the literature on Innovative Construction Contracting and
its role in accelerating construction progress and reducing user delay.
2. Prepare a list of all MDOT projects built via acceleration techniques using I/D methods
mentioned in the MDOT’s Innovative Construction Contracting document.
3. Research and prepare a list of similar (work type and vintage) MDOT projects that were
constructed under standard contract means.
4. Analyze all MDOT projects built via acceleration techniques to identify their impact on
aspects of project performance such as project true cost, schedule, and their long-term impact
on pavement performance vs. similar MDOT projects constructed under standard contract
means.
5. Compare analysis results to the listed “Advantages and Disadvantages” and
“Recommendations for Use” of each acceleration technique in the 2013 MDOT Innovative
Construction Contracting document.
Statement of Hypotheses
A set of hypotheses was formulated for this research. The hypotheses were evaluated through
statistical analysis techniques using SPSS® statistical program and they are discussed in Chapter
4. The discussion of results from such evaluations led to several findings and formed the basis for
conclusions and recommendations provided in this study.

3
Chapter 2- Literature Review
A review of pertinent literature on the subject of Innovative Construction Contracting was
conducted to gain insight into its role in accelerating construction progress and reducing user delay.
The following six sections introduces various acceleration techniques, their role in accelerating
construction progress and reducing user delay, their selection criteria, the determination of
incentive amount and incentive time, and the different acceleration techniques used in Michigan.
Introduction
Innovative construction contracting is a well-known technique in accelerating construction
progress and reducing user delay by minimizing the disruption of traffic flow in highway
construction projects. Project planners have used these acceleration techniques as their
management tools to achieve their objectives for a project. Motivated contractors accept the
emphasized goals in the contract and try to achieve them in return for monetary incentives
(Workman 1985). At the same time, a contractor is also subject to disincentives agreed upon with
the agency, if the contractor fails to achieve those goals (Federal Highway Administration
[FHWA] 1989).
Acceleration techniques may be grouped as follows: schedule-based incentives for early
completion of work, cost-based incentives for reducing project cost, and performance-based
incentives for improving project quality, safety, productivity, and so on. Among them, the
incentive contract for early completion has been the most popular acceleration technique in
highway construction projects because both the design and the implementation of schedule-based
incentives are comparatively easy and inexpensive (Abu-Hijileh and Ibbs 1989). Cost-based
incentives are designed to reduce project cost through financial ratios shared between the owners
and contractors. One form of cost performance incentive is Value Engineering (VE). VE savings
is usually split evenly between owners and contractors. State and federal transportation agencies
have implemented the VE technique and reported surprisingly large monetary savings (FHWA
2003). Jaraiedi et al. (1995) stated that a performance-based incentive employs certain parameters
of the contractors' project performance as a basis for the use of the incentive such as: safety,
quality, responsiveness, and utilization of resources and craft labor productivity. In order to
determine a contractor’s incentive, the agency generally assigns a score based on the relative
achievement of the performance standards (Stukhart 1984).
It should be noted that DOT and contractor perceptions of the acceleration technique objective
could be misaligned. Arditi and Yasamis (1998) studied goal alignment between Illinois DOT
engineers’ perceptions and contractors’ perceptions of I/D contract provisions using a survey
conducted on a sample of I/D contract projects in Illinois highway construction. Resident engineers
indicated that schedule was the most important objective. However, contractors indicated that cost
was the most important target, as shown in Table 1.

4
Table 1: Ranking of Acceleration Technique Objectives (Source: Arditi and Yasamis 1998)
Superintendent’s
Objective
Ranking
Score*
Resident Engineer’s
Objective
Ranking
Score*
Cost 2.11 Schedule 2.14
Safety 2.44 Quality 2.36
Quality 2.67 Safety 3.07
Schedule 2.73 Cost 3.64
Management 4.33 Management 4.86
Technology 4.44 Technology 4.93 *
The lower ranking score means more important objective.
Role of Acceleration Techniques in Accelerating Construction
Progress and Reducing User Delay
Arditi et al. (1997) have reported that 28 highway construction projects in Illinois, from 1989-
1993, have used time-based I/D provisions and were completed ahead of schedule. About 79% of
the contractors for these projects received the maximum incentive payment, which represented an
average of 4.71% of the contract amount.
In 1999, the Florida Department of Transportation (FDOT) Office of Quality Initiatives (OQI)
published a report entitled Alternative Contracting Program Preliminary Evaluation for July 1,
1996 – June 30, 1999 (FDOT 1999). In this report, the OQI performed a cost analysis and a time
analysis for 16 completed I/D projects. The report also summarized survey responses from two
contractors, three consultants, and eight DOT project engineers. The survey on the impact of I/D
contracts on project acceleration indicated that contractors thought that I/D contracts reduced
project duration, while most consultants did not; the DOT respondents’ opinions were divided on
this topic. However, the majority of respondents indicated that contractors working on I/D projects
were more willing to cooperate in project coordination.
In February 2000, MDOT completed an evaluation of the use of early completion clauses on 26
projects let and completed in 1998 and 1999 (AASHTO 2006). The average I/D pay amount for
these 26 projects was $18,500 (about 1.5% of the contract amount) and the average project user
delay savings was estimated at $610,500. Results of the evaluation indicated that 65% of the 26
projects were completed early, 12% were completed on time and 23% were completed late. MDOT
found that the average completion time of pavement projects with early completion incentives was
19% less than similar projects without I/D provisions for early completion, although the contracts
for the latter projects included an expedited schedule clause requiring the contractor to work a six
calendar-day week. Special I/D provisions for ride quality were included in some MDOT project
contracts.
In 2007, MDOT initiated and sponsored an exploratory study to search the MDOT data files and
project records to identify data availability that are related to the I/D program and perform
preliminary data assessment to determine whether or not the available data could support analyses

5
of the costs and benefits of the MDOT I/D program (Baladi and Leveret, 2009). Because of the
exploratory nature of the study, the original research plan was modified several times. It was
concluded that the available data elements of the project files and records could be used to conduct
the required analysis but low numbers of projects were identified.
Selection Criteria for Acceleration Techniques
FHWA (1989) recommended that acceleration techniques should be limited to the projects that
severely disrupt highway traffic, significantly increase road user costs, and have a significant
impact on adjacent neighborhoods or businesses, or close a gap, thereby providing a major
improvement in the highway system. Several studies contain information on the selection criteria
for determining whether or not to apply acceleration techniques (Christiansen, 1987; Plummer et
al., 1992; Jaraiedi et al., 1995; NYSDOT, 1999; Livingston, 2002; Rister and Wang, 2004; Shr and
Chen, 2004). In addition, Capuro and Seon (1996) developed project selection criteria for the South
Dakota Department of Transportation as guidelines of time-based innovative contracting methods,
A+B, I/D, and Lane Rental. The stepwise criteria for selecting innovative contracting are as
follows:
1) Identify candidate projects for expedited completion and estimate road user cost (RUC),
2) Identify potential impacts,
3) Re-evaluate project, finalize RUC, estimate time, and choose a contract method, and
4) Develop special provisions.
Determination of Incentive Amount
Although there is no standard for setting incentive amounts, FHWA (1989) outlined the
determination of the I/D amount as follows:
The dollar amount must be of sufficient benefit to the contractor to encourage his/her interest,
stimulate innovative ideas, and increase the profitability of meeting tight schedules so as to be
effective and accomplish the objectives of I/D Provisions.
If the incentive payment is not sufficient to cover the contractor's cost for the extra work, then
there is little incentive to accelerate production, and the I/D provisions will not produce the
intended results. (FHWA 1989)
According to the literature, most DOTs have developed their own procedures or methods to
determine incentive and disincentive amounts based on the daily RUC. An array of computer
applications is available for use in estimating road user delay cost such as CO3 (Carr 2000);
RealCost (NJDOT 2001); Quickzone, QUEWZ, Alternat (FHWA 2006); HCS, MicroBENCOST
(Gillespie 1998); FREWAY, QUADRO2, CARHOP, CORQ-CORCON, INTRAS, FREQ, and
FRECON2 (Olguin et al. 1995). These I/D contracting clauses are usually attached to the typical

6
low bid method. DOT pays an incentive fee if the work is completed ahead of schedule but assesses
a disincentive fee if the work is completed beyond the expected completion date. Most DOTs set
a cap for the total incentive fee as a certain percentage of the contract amount, a certain dollar
amount, or a set number of days that will be paid (Sillars 2007). Most DOTs choose a cap of five
percent of the total contract amount. The FHWA Technical Advisory does not recommend setting
equal cap amounts for both the incentive and disincentive (FHWA 1989; Anderson and Russell
2001).
Determination of Incentive Time
FHWA (1989) and Gillespie (1998) emphasized that the determination of I/D time is one of the
most important issues when developing an I/D project. According to FHWA (1989), most SHAs
usually employ either past performance or a Critical Path Method (CPM) schedule in order to
determine I/D time. A reasonable completion date must be set by answering the following
question: To what extent and at what cost could a normal construction schedule be accelerated? It
is important not to discourage the contractors by setting an impossible-to-meet completion date or
to have them benefit with no extra efforts on the contractors’ part.
Acceleration Techniques Used in Michigan
In 2013, MDOT published a document containing fundamental information on various innovative
construction contracting methods that could be used to enhance the implementation and delivery
of MDOT construction projects. This Innovative Construction Contracting Guide (2010) defines
these methods as follows:
Standard Incentive/Disincentive (I/D): Incentive/Disincentive is a method used to
motivate the contractor to complete work or open-to-traffic a portion of the work on or
ahead of schedule by providing a bonus for early completion or open-to-traffic. It is also
used as a penalty for late project completion or for lanes not open-to-traffic. The bonus or
penalty is based on road user delay costs, but the bonus is limited to a maximum of 5% of
the project costs. Progress clauses list any additional liquidated damages in conjunction
with Section 108 of the 2012 Standard Specifications for Construction.
A+B Incentive/Disincentive: A+B Bidding is a cost-plus-time bidding procedure that
selects the low bidder based on a monetary combination of the contract bid items (“A”
portion) and the time (“B” portion) needed to complete the project or a critical portion of
the project. The rate of incentive/disincentive for the “B” portion is typically based on
estimated road user delay costs.
No Excuse Incentive: A No Excuse Incentive can reduce contract time by tying an
incentive to the completion of specific construction activities by a set date, which may or
may not be the contract completion date. The completion date(s) cannot be changed for
any reason and a penalty is not applied, if the contractor fails to meet the completion
date(s). The amount of incentive is based on estimated road user delay costs.

7
Accepted for Traffic Incentive/Disincentive (AFT): The department will pay the
contractor a lump sum incentive, if the work in the contract is accepted for traffic on or
before the AFT incentive date(s). The contractor would be assessed a penalty if they failed
to meet the AFT date(s). The rate of incentive/disincentive is based on estimated road user
delay costs.
Lane Rental: The contractor is charged a fee for occupying lanes or shoulders to complete
contract work and can earn an incentive or disincentive based on the number of days they
occupy the lane or shoulder versus the original Lane Rental lump sum bid. The hourly
assessment is charged by the hour and is based on estimated road user delay cost.
Interim Completion Date Incentive/Disincentive: Similar to the Standard
Incentive/Disincentive, the contractor is paid an incentive for completing a specified
amount of work on or before the interim completion date(s). A penalty is applied if the
work is not completed by the interim completion date(s). The incentive/disincentive is
typically based on the rate of liquidated damages specified in the MDOT Standard
Specifications for Construction.

8
Chapter 3- Methodology
The purpose of this chapter is to illustrate the methodology utilized to collect project data and its
classification in order to achieve the second and third objectives of the project. It also highlights
the modification of the proposed research method to accommodate the project circumstances.
Additionally, a reflection of the list of all MDOT projects built via acceleration techniques using
I/D methods as well as the list of similar (work type and vintage) MDOT projects is presented.
Finally, the data analysis method is discussed.
Task 1: Data Collection
The research team compiled a list of pavement projects that have used any of the accelerated
contracting methods via “Field Manager” software and conversations with DOT personnel. After
identifying these projects, the research team requested available project records and data files.
Also, similar MDOT projects that were constructed under standard contract means in the work
type and vintage were collected.
Modification of Task 1
Task 1 yielded a very small number of projects to add to the projects identified in a previous study
(Baladi and Leveret 2009). The research team tried to identify additional projects through the
Michigan FHWA office by obtaining their SEP14 project list for Michigan. It was found that the
FHWA office maintains a list of only design-build projects prior to 2003 and that they do not have
a record of any other types of projects that may have received SEP14 approval.
The research team worked with different personnel from MDOT’s Department of Technology
Management and Budget (DTMB) to identify additional potential projects. The DTMB houses two
databases for MDOT: Construction Database and Pre-construction Database. Neither of them has
a column to represent the basis for accelerating contract payments directly. The team employed
“fuzzy” search criteria for all possible combinations of the following key words: Standard
Incentive/Disincentive, Permanent Pavement Markings, Hot Mix Asphalt, Portland Cement
Concrete, A+B Incentive/Disincentive, No Excuse Incentive/Disincentive, Accepted for Traffic
Incentive/Disincentive, Lane Rental, and Interim Completion Date Incentives. The search was set
to report all possible columns found for every pay item such as Contract ID, Project, Project Item,
Line No, Control Section, Route, Longitude of Midpoint, Latitude of Midpoint, Type of Work,
Letting Date, Project Desc, Item Desc, Item Suppl Desc, and any other data such as planned
quantities, actual quantities, planned cost, and actual cost, etc.
The research team manually filtered the query data and identified the pay item numbers associated
with incentive pay items. A second search query was performed on the Construction Database and
the Pre-construction Database to identify all projects that contained these pay items. Again, the
search was set to report all possible columns found for every pay item. Both lists were merged and
project data were filtered manually by the research team.

9
For every project identified, the construction contract inquiry page
(http://mdotcf.state.mi.us/public/trnsport/) was used to identify the paid incentive and schedule
and cost data of the project. Some schedule data for projects starting before 2003 were missing
and the data were requested. Projectwise software was used to collect the project drawings,
proposals, and any special provisions documents associated with the project. The Pavement
Management System specialists were contacted to grant the research team access to the Pavement
Management System (PMS) data files associated with the targeted projects. A historical and
detailed distress data and distress index for each 0.1 mile of pavement were collected for years
1997 to 2011 and linked with the target projects using the control section, Beginning Mileage Post
(BMP), and Ending Mileage Post (EMP). The data were used to determine the types of distress
along the project, the distribution of Distress Index (DI), and the average DI for the entire project.
Task 2: Data Classification
Different project data lists were identified based on different attributes (such as project type,
functional class, pavement type, and route) and assessed with different matching algorithms to
create matching criteria for the projects in order to create an unbiased data sample which could be
then utilized in the next step of the project, i.e. data analysis.
Three major matching criteria were identified for the classification procedure-
1. Route of the project: Freeway and Non-freeway,
2. Category of work: Resurfacing (RESU), Rehabilitation (RREH), Maintenance (PMAI),
Bridge Reconstruction (BREC), Bridge Rehabilitation (BREH), Safety (SFTY), and
Miscellaneous (MISC); and
3. Type of Material: Flexible, Composite, Jointed Plain Concrete Pavement (JPCP), and
Jointed Reinforced Concrete Pavement (JRCP)
The outcome of this task is two project lists; a list of all MDOT projects built via acceleration
techniques using I/D methods and a list of similar (work type and vintage) MDOT projects that
were constructed without I/D methods.
Task 3: Data Analyses
In this task, the research team determined that the data obtained in tasks 1and 2 were sufficient to
conduct further analysis. The acceptable matching lists (MDOT projects built via acceleration
techniques matched with similar MDOT projects constructed under similar contract means but not
using the acceleration technique) were analyzed to identify their impact on aspects of project
performance. The following performance criteria were investigated.

10
Effect of acceleration techniques on project schedule
For each of the innovative acceleration techniques, two performance indices for each project on
the matching list were determined based on original contract duration and present contract
duration: Original Time Performance Index (OTPI) and Present Time Performance Index
(PTPI), which included time extensions and supplemental agreement days. A statistical analysis
was performed to examine where the actual contract duration was affected by the presence of
different acceleration techniques and to determine whether certain acceleration techniques
shortened the project duration below the levels observed in the conventional projects.
Effect of acceleration techniques on project cost
Similarly, a project Cost Performance Index (CPI) for each project on the matching list was
determined based on original contract cost and the authorized contract cost, which included total
work order amount, supplemental agreement amount, incentives paid, and other contract
adjustments. Finally, a statistical analysis was performed to investigate: (1) How much project
cost is affected by the presence of accelerating contracting techniques; (2) How much
accelerating contracting techniques actually increase project cost; and, (3) Whether there is
significant evidence to prove the research hypothesis that accelerating contracting techniques
increase project costs significantly compared to conventionally contracted projects.
Cost and time-value savings (user delay cost savings)
The research team used the Construction Congestion Cost System (CO3) to estimate user delay
cost. The additional cost increase for the acceleration technique was compared with the
estimated user delay cost.
Effect of acceleration techniques on project long-term pavement performance
In this sub-task, the research team investigated aggregated project performance data to analyze
an appropriate prediction model for pavement distress to estimate the Modified RSL for these
projects. Statistical analysis was performed on each of the innovative acceleration techniques to
determine whether or not the acceleration techniques significantly impact pavement
performance (pavement life).
Task 4: Recommendations on Each Acceleration Technique
In this task, the quantitative results acquired from task 3 were used to quantitatively analyze the
listed “Advantages and Disadvantages” and “Recommendations for Use” of each acceleration
technique in the 2013 MDOT Innovative Construction Contracting document.

11
Chapter 4- Findings
The purpose of this chapter is to present a summary of the collected data, illustrate the method of
data analysis employed, and present the results of the analysis.
Summary of Data
The aforementioned methodology was used to prepare a list of all MDOT projects built via
acceleration techniques using I/D methods mentioned in the MDOT’s Innovative Construction
Contracting document as presented in Appendix 1. Table 2 presents a summary of the number of
identified projects for each type of incentive.
Table 2: Data Collection Summary for Incentive Projects
A+
B
Acc
epte
d
for
Tra
ffic
Inte
rim
Com
ple
tion
Lan
e
Ren
tal
No E
xcu
se
Acc
eler
ate
d
Sch
edu
les
Sta
nd
ard
Ince
nti
ves
Bridge Construction (BCON) 1
No
t In
clu
ded
No
t In
clu
ded
Bridge Reconstruction (BREC) 1 1 12
Bridge Rehabilitation (BREH) 4
Miscellaneous (MISC) 5
New Reconstruction (NCON) 1 3
Maintenance (PMAI) 2 1 8
Resurfacing (RESU) 1 7 14
Reconstruction (RREC) 1 3 5
Rehabilitation (RREH) 5 4 19 1
Safety (SFTY) 3 2 5 1
Total Number of Projects 1 15 16 76 2
It should be noted that:
1. In most of the projects identified, each I/D technique was presented in any project
concurrently with one or more types of the Standard Quality Incentive/Disincentive. This
finding required the research team to change their classification method in order to achieve
objective 3 of the project.

12
2. The collection of project distress data reduced the number of projects. The research team
considered projects with at least 3 years of project distress data (increased distress over
years) for the calculation of the Modified Remaining Service Life (RSL), and to estimate
pavement performance in term of pavement life.
3. The list included no Accelerated Schedules techniques. The research team and project
manager has attributed this to the timing of applying this incentive during design. This
could be hardly identified in the project data collected; therefore, it was decided to exclude
this acceleration technique from the project scope.
4. The list included a very small number of projects that utilized A+B Incentive/Disincentive
and No Excuse Incentive/Disincentive. The research team repeated the search for these two
techniques but was not able to identify any additional projects.
Table 3 illustrates the authorized contract amounts for the identified projects.
Table 3: The Authorized Contract Amounts for Incentive Projects
A+
B
Acc
epte
d f
or
Tra
ffic
Inte
rim
Co
mp
leti
on
La
ne
Ren
tal
No
Ex
cuse
1998 $19,351,482 $55,705,045
1999 $8,970,860 $90,937,723
2000 $236,928,448
2001 $109,668,802 $27,279,743
2002 $171,411,133
2003 $1,728,721 $60,429,980
2004 $81,768,474 $2,349,126 $42,647,291
2005 $111,894,865 $5,734,031 $126,184,813 $2,128,003
2006 $65,773,608 $58,626,666
2007 $173,764,968 $13,236,925 $27,347,539
2008 $6,405,881 $34,998,425 $105,707,836
2009 $31,878,804 $53,529,608
2010 $14,293,371
2011 $20,296,685 $8,156,446
2012 $2,730,094 $5,098,731 2685483.92
Total $19,351,482 $474,216,694 $92,413,507 $1,164,260,188 $29,407,746
Different non-incentive projects were identified based on different attributes (such as project type,
functional class, pavement type, and route) and assessed with different matching algorithms to
create matching criteria for these projects vs. the incentive projects in order to create an unbiased
data sample which could be utilized for data analysis.

13
Three matching criteria were identified for the classification procedure:
1. Route of the project: Freeway and Non-freeway,
2. Category of the work: Resurfacing (RESU), Rehabilitation (RREH), Maintenance (PMAI),
Bridge Reconstruction (BREC), Bridge Rehabilitation (BREH), Safety (SFTY), and
Miscellaneous (MISC);
3. Type of Material: Flexible, Composite, Jointed Plain Concrete Pavement (JPCP), and
Jointed Reinforced Concrete Pavement (JRCP); and
4. Matching projects should include the same type of Standard Quality
Incentive/Disincentive.
Appendix 2 presents the matching list of the MDOT projects built via acceleration techniques with
similar projects. It should be noted that in some cases multiple similar projects have been identified
for non-incentive projects. Based on data availability, one similar project has been identified for
the analysis at any instance.
Method of Analysis
Four different performance criteria were analyzed using statistical analyses; schedule, time, cost-
time savings (user delays), and long-term performance.
Effect of acceleration techniques on project schedule
For each innovative acceleration technique, two performance indices for each project on the
matching list were determined based on original contract duration and present contract duration:
Original Time Performance Index (OTPI) and Present Time Performance Index (PTPI), which
included time extensions and supplemental agreement days. These indices were calculated as:
OTPI = ((Actual Duration Used − Original Contract Duration)/ Original Contract
Duration)
PTPI = ((Actual Duration Used − Present Contract Duration)/ Present Contract Duration)
Where
Actual Duration Used = Actual Work Completed - Actual Work Began
Original Contract Duration = Expected Completion Date per Progress Schedule - Start
Date per Progress Schedule
Present Contract Duration = Current Completion Date - Actual Work Began
A negative value of OTPI or PTPI means time savings and a positive value means time overruns.
The time performance indices for each project are calculated in Appendices 3 and 4 respectively.
It was assumed that contractors’ individual production performance and work experience were
identical. Additionally, contractors’ productivity during daytime and night times was assumed to

14
be equivalent. Finally, it was assumed that these performance indicators follow a normal
distribution.
It should be noted that Original Starting Date and Expected Finish Date were only available for
projects after 2003. The research team and the project manager tried requesting this data but it
was not accessible.
In addition to descriptive statistics, statistical analysis was performed to examine if the contract
duration was affected by the presence of different acceleration techniques. The projects were
grouped into two groups (i.e., MDOT projects built via acceleration techniques and similar MDOT
projects that were constructed without the acceleration techniques). The Paired-Samples T-Test
procedure was used to compare the means of the two groups and to test the effect of acceleration
techniques on project time performance.
Hypothesis 1: Acceleration Techniques and Project Duration Performance
H0: The mean difference of the OTPI or PTPI between the paired observations
(i.e., OTPI or PTPI for MDOT projects built via acceleration techniques and
OTPI or PTPI for similar MDOT projects that were constructed without the
acceleration techniques) is zero. Ha: The mean difference of the OTPI or PTPI between the paired observations
(i.e., OTPI or PTPI for MDOT projects built via acceleration techniques and
OTPI or PTPI for similar MDOT projects that were constructed without the
acceleration techniques) is not zero.
SPSS was used to perform the Paired-Samples T-Test procedure using the two performance indices
(OTPI and PTPI). The procedure was performed on the data as an aggregate group and then
separately for each type of acceleration technique. When the number of data points was less than
30, boot strapping was performed to compensate for the sample size. No additional analysis was
performed when the sample size was less than 5 paired projects.
Effect of acceleration techniques on project cost
Similarly, a project Cost Performance Index (CPI) for each project on the matching list was
determined based on original contract cost and the authorized contract cost, which included total
work order amount, supplemental agreement amount, incentives paid, and other contract
adjustments. This index was calculated as:
CPI = ([Authorized Contractor Cost − Original Contract Cost]/ Original
Contract Cost)
Where a negative value of CPI means cost savings and a positive value of CPI means cost overruns.
For example, a value of CPI = -0.10 means project cost savings of 10%, while a value of CPI =
0.10 means a 10% cost overrun. Additionally, it was assumed that the cost performance index
follows a normal distribution.

15
In addition to descriptive statistics, statistical analysis was performed to examine if the project cost
is affected by the presence of accelerating contracting techniques and whether there is significant
evidence to prove that accelerating contracting techniques increase project costs significantly
compared to conventionally contracted projects. The Paired-Samples T-Test procedure was used
to compare the means of the two groups and to test the effect of acceleration techniques on project
time performance.
Hypothesis 2: Acceleration Techniques and Project Cost Performance
H0: The mean difference of the CPI between the paired observations (i.e., CPI
for MDOT projects built via acceleration techniques and CPI for similar
MDOT projects that were constructed without the acceleration techniques) is
zero.
Ha: The mean difference of the CPI between the paired observations (i.e., CPI
for MDOT projects built via acceleration techniques and CPI for similar
MDOT projects that were constructed without the acceleration techniques) is
not zero.
SPSS was used to perform the Paired-Samples T-Test procedure using CPI. The procedure was
performed on the data as an aggregate group and then separately for each type of acceleration
technique. When the numbers of data points were less than 30, boot strapping was performed to
compensate for the sample size. No additional analysis was performed when the sample size was
less than 5 paired projects.
Additionally, the actual increase in project costs were identified for every project built via
acceleration techniques and descriptive statistics were performed to explore how much
accelerating contracting techniques actually increased project costs.
Finally, a correlation analysis was performed between the Present Time Performance Index (PTPI)
and Cost Performance Index (PCI) to explore the relationship between cost overruns and project
schedule improvement.
Additional project cost and time-value savings
For every additional project cost identified (based on an acceleration technique and its project data
accessible via Projectwise software), the Construction Congestion Cost System (CO3) (Carr 2000)
was used to estimate the expected user delay cost, if this acceleration technique was not
implemented. CO3 was selected because MDOT currently uses it to estimate user delay costs. The
Expected Gain/Savings were materialized when the Expected User Delay is more than the
Additional Project Cost based on the acceleration technique.
Because of the special nature of lane rental incentives and the complexity of materializing the lane
rental incentive amounts, projects were evaluated based on the lane rental assessment rate.
Expected Gain/ Savings were materialized when the lane rental assessment rate was greater than
the calculated hourly user delay for the project.
16
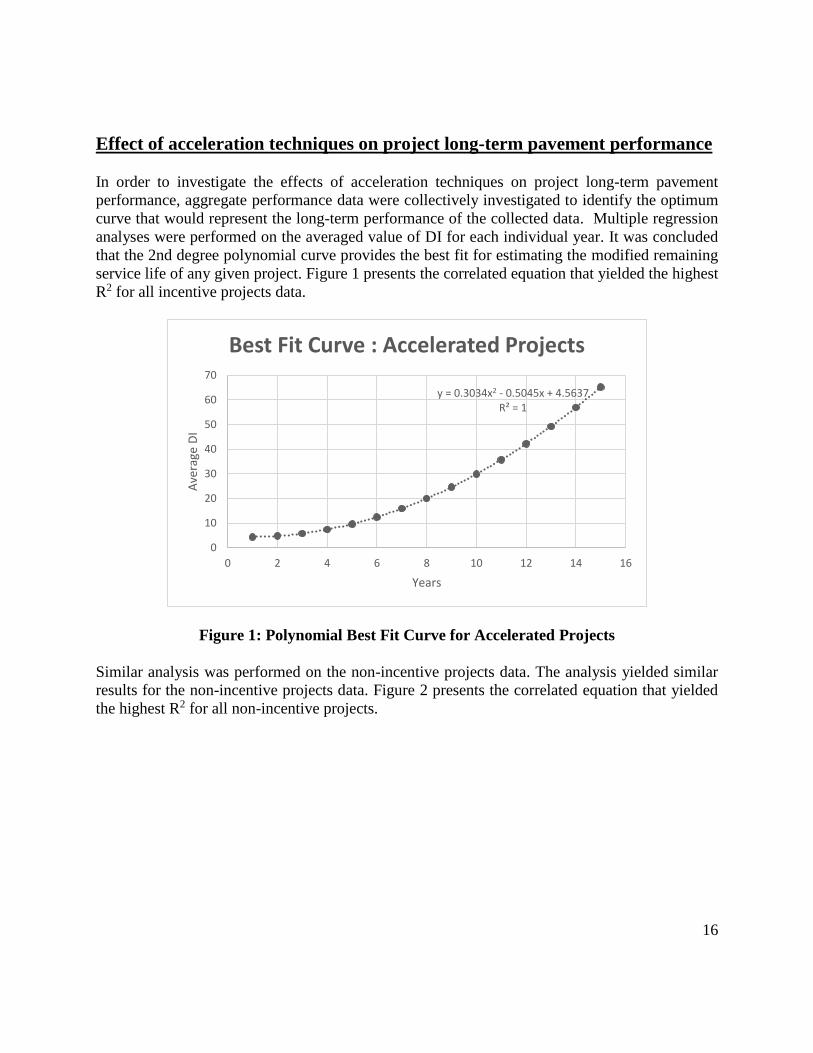
Effect of acceleration techniques on project long-term pavement performance
In order to investigate the effects of acceleration techniques on project long-term pavement
performance, aggregate performance data were collectively investigated to identify the optimum
curve that would represent the long-term performance of the collected data. Multiple regression
analyses were performed on the averaged value of DI for each individual year. It was concluded
that the 2nd degree polynomial curve provides the best fit for estimating the modified remaining
service life of any given project. Figure 1 presents the correlated equation that yielded the highest
R2 for all incentive projects data.
Figure 1: Polynomial Best Fit Curve for Accelerated Projects
Similar analysis was performed on the non-incentive projects data. The analysis yielded similar
results for the non-incentive projects data. Figure 2 presents the correlated equation that yielded
the highest R2 for all non-incentive projects.
y = 0.3034x2 - 0.5045x + 4.5637R² = 1
0
10
20
30
40
50
60
70
0 2 4 6 8 10 12 14 16
Ave
rage
DI
Years
Best Fit Curve : Accelerated Projects

17
Figure 2: Polynomial Best Fit Curve for Non-Accelerated Projects
For each project in the different acceleration groups, the average DI data were calculated and the
best fit curves between the average DI and time (T) in year were obtained using polynomial
functions. The resulting correlation equations were used to estimate the modified remaining
service life. This was accomplished by solving each equation for the time "T" for which the DI
value equalled 50 distress points (the MDOT DI threshold value defining pavement life [PL]).
Appendix 9 presents the average DI data for the projects with different acceleration groups and the
calculations of the modified remaining service life respectively.
Statistical analysis was performed to examine if project long-term performance is affected by the
presence of accelerating contracting techniques. The Paired-Samples T Test procedure was used
to compare the means of the two groups and to test the effect of acceleration techniques on project
long-term performance.
Hypothesis 3: Acceleration Techniques and Long-Term Pavement Performance
H0: The mean difference of the Modified Remaining Service Life (RSL) between
the paired observations (i.e., RSL for MDOT projects built via acceleration
techniques and RSL for similar MDOT projects that were constructed without the
acceleration techniques) is zero.
Ha: The mean difference of the Modified Remaining Service Life (RSL) between
the paired observations (i.e., RSL for MDOT projects built via acceleration
techniques and RSL for similar MDOT projects that were constructed without the
acceleration techniques) is not zero.
SPSS was used to perform the Paired-Samples T Test procedure using the modified RSL. The
procedure was performed on the data as an aggregate group and then separately for each type of
acceleration technique. When the numbers of data points were less than 30, boot strapping was
performed to compensate for the sample size. No additional analysis was performed when the
sample size was less than 5 paired projects.
y = 0.5236x2 - 1.0034x + 7.7525R² = 1
0
10
20
30
40
50
60
0 2 4 6 8 10 12
Ave
rage
DI
Years
Best Fit Curve : Non-Accelerated Projects

18
Recommendations on each acceleration technique
The quantitative results acquired from task 3 were used to quantitatively analyze the listed
“Advantages and Disadvantages” and “Recommendations for Use” of each acceleration technique
in the 2013 MDOT Innovative Construction Contracting document.
Presentation of the Results
Effect of acceleration techniques on project schedule
Based on the Present Time Performance Index (PTPI), 39 incentive projects were identified.
Their project time and performance were found as follows:
37% of I/D projects were completed earlier than expected
51% were completed on time
12% were completed late
Figure 3: PTPI Data Summary for different types of Incentives
Figure 3 illustrates the project time performance for the different types of incentives. Accepted
for traffic projects and interim completion incentive projects have shown great project control
over the project duration completed on the expected time or earlier. Lane rental incentive project
shows that 38.10% were completed ahead of schedule, 47.8% were completed on time, and
14.29% were completed late.
-40.00%
-20.00%
0.00%
20.00%
40.00%
60.00%
80.00%
100.00%
Early Completion On-time Completion Late Completion
Pe
rce
nta
ge
PTPI Groups
Accepted for Traffic Interim Completion Lane Rental

19
Figure 4 illustrates the PTPI vs. the paid incentive/disincentive. Most data identified for the
incentive projects were located in the 3rd quadrant on the positive side of the time performance.
The plotted data indicated, with few exceptions, that paying an incentive will assist the project
in achieving its schedule goal or outperforming its project time target. Figure 5 and Figure 6 plot
the frequencies of time performance index frequencies for incentive projects and non-incentive
projects, respectively, vs. the normal distribution curve. Figure 7 plots the PTPI for each
incentive project with the corresponding non-accelerated project. Most projects tend to have
time savings when incentive clauses are included in the project.
Figure 4: Time Performance Index vs. Paid Incentive/Disincentive Percentage
Figure 5: Frequencies of PTPI for Incentive Projects vs. Normal Distribution Curve
-100%-80%-60%-40%-20%
0%20%40%60%80%
100%
-10% -5% 0% 5% 10% 15% PTP
I
Incentive/ Disincentive %
Present Time Performance Index

20
Figure 6: Frequencies of PTPI for Non-Incentive Projects vs. Normal Distribution Curve
Figure 7: PTPI for Each Incentive Project with the Corresponding Non-Accelerated
Project
In performing the paired samples t-tests and based on the OTPI, Table 4 illustrates the Paired
Samples T-Test Results. There was no significant difference in the scores for incentive project
group (M=0.39, SD=0.67) and non-incentive project group (M=0.19, SD=0.59) conditions; t (10)
=0.69, p =0.51. There was no significant difference in the scores for Accepted for Traffic incentive
-100.00%
-80.00%
-60.00%
-40.00%
-20.00%
0.00%
20.00%
40.00%
60.00%
80.00%
100.00%
1 3 5 7 9 11 13 15 17 19 21 23 25 27 29 31 33 35 37
PTP
I
Projects
Incentive Projects Non-Incentive Projects
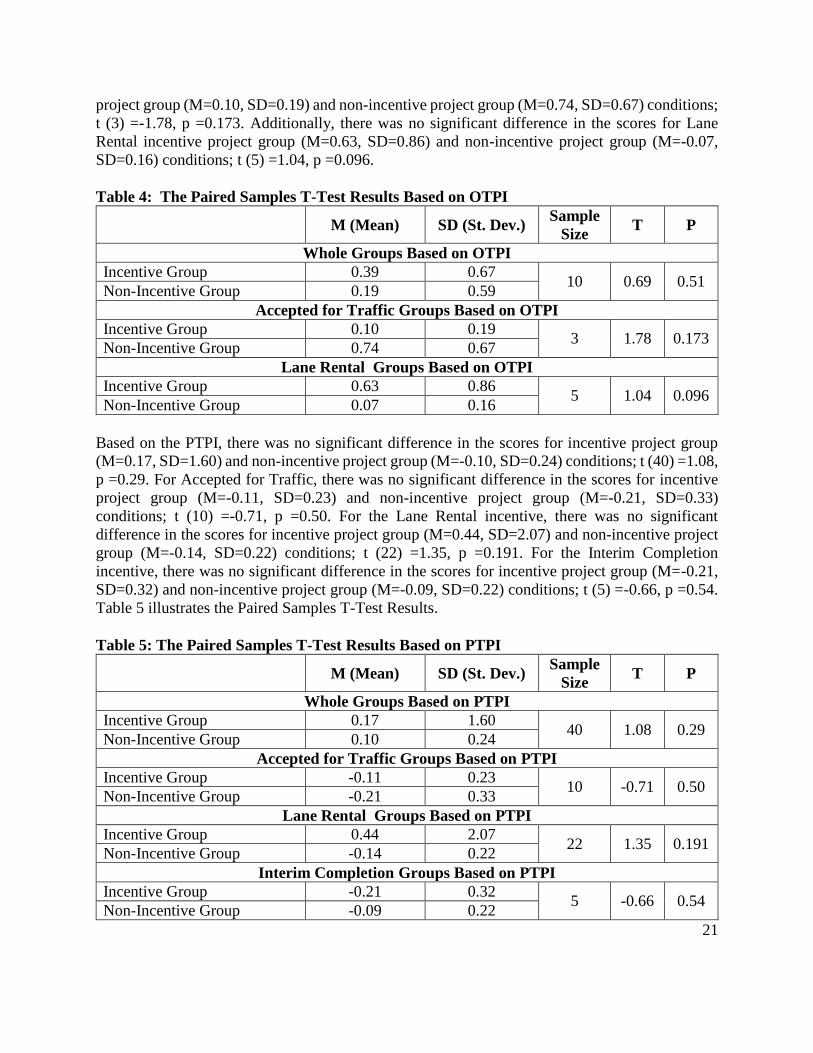
21
project group (M=0.10, SD=0.19) and non-incentive project group (M=0.74, SD=0.67) conditions;
t (3) =-1.78, p =0.173. Additionally, there was no significant difference in the scores for Lane
Rental incentive project group (M=0.63, SD=0.86) and non-incentive project group (M=-0.07,
SD=0.16) conditions; t (5) =1.04, p =0.096.
Table 4: The Paired Samples T-Test Results Based on OTPI
M (Mean) SD (St. Dev.)
Sample
Size T P
Whole Groups Based on OTPI
Incentive Group 0.39 0.67 10 0.69 0.51
Non-Incentive Group 0.19 0.59
Accepted for Traffic Groups Based on OTPI
Incentive Group 0.10 0.19 3 1.78 0.173
Non-Incentive Group 0.74 0.67
Lane Rental Groups Based on OTPI
Incentive Group 0.63 0.86 5 1.04 0.096
Non-Incentive Group 0.07 0.16
Based on the PTPI, there was no significant difference in the scores for incentive project group
(M=0.17, SD=1.60) and non-incentive project group (M=-0.10, SD=0.24) conditions; t (40) =1.08,
p =0.29. For Accepted for Traffic, there was no significant difference in the scores for incentive
project group (M=-0.11, SD=0.23) and non-incentive project group (M=-0.21, SD=0.33)
conditions; t (10) =-0.71, p =0.50. For the Lane Rental incentive, there was no significant
difference in the scores for incentive project group (M=0.44, SD=2.07) and non-incentive project
group (M=-0.14, SD=0.22) conditions; t (22) =1.35, p =0.191. For the Interim Completion
incentive, there was no significant difference in the scores for incentive project group (M=-0.21,
SD=0.32) and non-incentive project group (M=-0.09, SD=0.22) conditions; t (5) =-0.66, p =0.54.
Table 5 illustrates the Paired Samples T-Test Results.
Table 5: The Paired Samples T-Test Results Based on PTPI
M (Mean) SD (St. Dev.)
Sample
Size T P
Whole Groups Based on PTPI
Incentive Group 0.17 1.60 40 1.08 0.29
Non-Incentive Group 0.10 0.24
Accepted for Traffic Groups Based on PTPI
Incentive Group -0.11 0.23 10 -0.71 0.50
Non-Incentive Group -0.21 0.33
Lane Rental Groups Based on PTPI
Incentive Group 0.44 2.07 22 1.35 0.191
Non-Incentive Group -0.14 0.22
Interim Completion Groups Based on PTPI
Incentive Group -0.21 0.32 5 -0.66 0.54
Non-Incentive Group -0.09 0.22

22
Although the collected data does not statistically support our hypothesis that projects with
incentives would have better time performance than projects with no incentive, this could be
attributed to the limited number of projects available for the analysis. The current descriptive
statistics shows the trend that most projects tend to have time savings when incentive clauses
are included in the project.
Effect of acceleration techniques on project cost
Based on the Cost Performance data, 53 incentive projects were identified. About 50% of the
projects outperformed the expected cost performance and 50% underperformed when incentive
clauses were included in the project. Figure 8 illustrates the project cost performance for the
different types of incentives. It was found that most of the Accepted for Traffic incentive projects
underperformed the expected cost. While the Interim Completion projects split equally, 50% of
the projects outperformed expected cost performance and 50% underperformed. For the Lane
Rental incentive projects, 64% of the projects outperformed the expected cost, and 36%
underperformed cost expectations.
Figure 8: CPI Data Summary for different types of Incentives
Figure 9 illustrates the cost performance index vs. the paid incentive percentage. Unlike the trend
shown in PTPI, the plotted CPI data is speared over the two quadrants with positive CPI and does
not suggest any relation between the incentive paid and the project cost outcome. Figures 10 and
11 confirm the previous hypothesis’ suggestion by plotting the CPI frequencies for incentive
projects and non-incentive projects, respectively, vs. the normal distribution curve. Figure 12 plots
the CPI for each incentive project with the corresponding non-accelerated project.
-20.00%
0.00%
20.00%
40.00%
60.00%
80.00%
100.00%
120.00%
Accepted for Traffic Interim Completion Lane Rental
Pe
rce
nta
ges
CPI Groups
Outperfomed CPI Underperformed CPI

23
Figure 9: Cost Performance Index vs. Paid Incentive/ Disincentive Percentages
Figure 10: CPI Frequencies for Incentive Projects vs. Normal Distribution curve
-25%
-20%
-15%
-10%
-5%
0%
5%
10%
15%
20%
25%
-10% -5% 0% 5% 10% 15%
Co
st P
erf
orm
ance
Ind
ex
Incentive/ Disincentive %

24
Figure 11: CPI Frequencies for Non-Incentive Projects vs. Normal Distribution curve
Figure 12: CPI for Each Incentive Project with the Corresponding Non-Accelerated
Project
-30.00%
-20.00%
-10.00%
0.00%
10.00%
20.00%
30.00%
40.00%
1 3 5 7 9 11 13 15 17 19 21 23 25 27 29 31 33 35 37 39 41 43 45 47 49 51 53
CP
I
Projects
Incentive Projects Non-Incentive Projects

25
In performing the paired samples t-tests and based on the cost performance index, there was a
significant difference in the scores for incentive project group (M=-0.03, SD=0.07) and non-
incentive project group (M=0.04, SD=0.10) conditions; t (52) =-2.6, p =0.012. This indicates that
the projects with incentives tend to have better cost control over similar projects with no incentive.
This could be attributed to the additional staffing/requirements required for the projects with
incentives. However, when breaking the groups into type of incentive, the difference was not
statistically significant. This might be attributed to the smaller sample size number. There was no
significant difference in the scores for Accepted for Traffic incentive project group (M=0.05,
SD=0.05) and non-incentive project group (M=0.03, SD=0.09) conditions; t (10) =0.69, p =0.51.
Additionally, there was no significant difference in the scores for Lane Rental incentive project
group (M=0.06, SD=0.05) and non-incentive project group (M=0.03, SD=0.09) conditions; t (32)
=1.24, p =0.23. Last, there was no significant difference in the scores for Interim Completion
incentive project group (M=0.01, SD=0.10) and non-incentive project group (M=-0.02, SD=0.04)
conditions; t (7) =0.99, p =0.36. Table 6 illustrates the Paired Samples T-Test Results.
Table 6: The Paired Samples T-Test Results Based on CPI
M (Mean) SD (St. Dev.)
Sample
Size T P
Whole Groups Based on PTPI
Incentive Group -0.03 0.07 52 -2.6 0.012
Non-Incentive Group 0.04 0.10
Accepted for Traffic Groups Based on PTPI
Incentive Group 0.05 0.05 10 0.69 0.51
Non-Incentive Group 0.03 0.09
Lane Rental Groups Based on PTPI
Incentive Group 0.06 0.05 32 1.24 0.23
Non-Incentive Group 0.03 0.09
Interim Completion Groups Based on PTPI
Incentive Group 0.01 0.10 7 0.99 0.36
Non-Incentive Group -0.02 0.04
To evaluate the project cost increase due to incentive and to measure the control over this incentive,
a comparative analysis was done between the maximum offered incentive and the actual paid
incentive for each incentive type. Table 7 and Figure 13 present the results of this comparative
analysis. Most of the accepted for traffic project paid incentive was almost the maximum offered
incentive in the project. Better cost controls were established for interim completion and lane rental
incentive projects.

26
Table 7: Average Maximum Offered Incentive versus the Average Paid Incentive for Each
Type of Incentive
Type of
Incentive/Distinctive
Average Maximum offered
Incentive/Distinctive
Average Paid
Incentive/Distinctive
Interim Completion $109,286 $36,787
Accepted for Traffic $736,923 $729,231
Lane Rental $534,427 $269,536
Figure 13: Average Maximum Offered Incentive versus the Average Paid Incentive for
Each Type of Incentive
Finally, a series of linear, log and nonlinear regression models were run to establish a relationship
between CPI and PTPI. Table 8 and Figure 14 illustrate the nonlinear model that resulted in the
highest R2.
Table 8: Variables of the Correlation between PTPI and CPI
Model Summary
R R Square Adjusted R Square Std. Error of the Estimate
.462 .213 .161 .074
The independent variable is PTPI.
$0
$100,000
$200,000
$300,000
$400,000
$500,000
$600,000
$700,000
$800,000
Interim Completion Accepted for Traffic Lane Rental
Average Maximum offered Incentive/Distinctive
Average Paid Incentive/Distinctive

27
Figure 14: Correlation between PTPI and CPI
Table 9 summarizes the analysis of variance result. In this analysis, CPI was considered a
dependent variable. The final model yielded an R2 value of 0.213, indicating that the model has
the ability to explain 21.3 percent variability in the data.
Table 9: Analysis of Variance of the Correlated Model
ANOVA
Sum of Squares df Mean Square F Sig.
Regression .044 2 .022 4.062 .027
Residual .164 30 .005
Total .209 32
The independent variable is PTPI.
Additional project cost and time-value savings
The Co3 calculations yielded following results for Interim Completion incentives, Accepted for
Traffic incentives and Lane Rental incentives. Table 10 presents for every project the max
offered incentives, the actual paid incentives and the calculated user delay avoided because of
the Interim Completion incentive. As shown in Figure 15, with the exception of one project, all
interim completion incentive projects yielded a user delay savings that exceeded the paid
incentives. Figure 16 shows that these projects were completed on average of 10 days earlier
than expected.
-0.30
-0.20
-0.10
0.00
0.10
0.20
-1.00 -0.80 -0.60 -0.40 -0.20 0.00 0.20 0.40P
TPI
CPI
Cost Performance Index

28
Figure 15 : Interim Completion Paid Incentives vs. Calculated User Delay Avoided
Figure 16: Benefit of Interim Completion Incentives (# of days completed in advance)
Table 10: Interim Completion Incentives vs. Calculated User Delay Avoided.
# Contract No Letting
Year
Maximum
Offered
Incentive
Paid
Incentive
Calculated
User Delay
Benefit (# of
days completed
in advance)
1 25032-60481 2007 $45,000 $45,000 $52,492 10
2 38072-79005 2012 $240,000 $240,000 $471,968 15
3 39405_83201 2008 $100,000 $100,000 $428,364 20
4 65033-103442 2011 $100,000 $100,000 $67,524 8
5 38103-100001 2011 $150,000 $56,250 $180,100 2
6 46161-87522 2012 $250,000 $175,000 $243,873 7
$0
$50,000
$100,000
$150,000
$200,000
$250,000
$300,000
$350,000
$400,000
$450,000
$500,000
1 2 3 4 5 6
Projects
Paid Incentive Calculated User Delay
0
5
10
15
20
25
1 2 3 4 5 6
Be
ne
fit
(# o
f d
ays
com
ple
ted
in
adva
nce
)
Projects

29
Table 11 presents for every project the maximum offered incentive, the actual paid incentive and
the calculated user delay avoided because of the Accepted for Traffic incentive. Figure 17
illustrates that 100% of the Accepted for Traffic incentive projects reviewed showed user delay
savings that exceeded the paid incentives. Figure 18 shows that all projects were completed early
with an average of 32 days early.
All projects have yielded a user delay savings that exceeded the paid incentives.
Figure 17: Accepted for Traffic Paid Incentives vs. Calculated User Delay Avoided
Figure 18: Benefit of Accepted for Traffic Incentives (# of days completed in advance)
$0
$50,000
$100,000
$150,000
$200,000
$250,000
$300,000
$350,000
$400,000
$450,000
$500,000
1 2 3 4 5 6
Projects
Paid Incentive Avoided User Delay
0
10
20
30
40
50
60
70
80
90
1 2 3 4 5 6
Be
ne
fit
(# o
f d
ays
com
ple
ted
in a
dva
nce
)
Projects

30
Table 11: Accepted for Traffic Incentives vs. Calculated User Delay Avoided
# Contract No Letting
Year
Maximum
Offered
Incentive
Paid
Incentive
Calculated
User Delay
Benefit (# of
days completed
in advance)
1 41025-82763 2008 $100,000 $100,000 $458,108 25
2 41051-90161(1) 2008 $40,000 $40,000 $60,860 40
3 41051-90161(2) 2008 $60,000 $60,000 $91,080 85
4 41062-75080 2008 $130,000 $130,000 $192,312 30
5 82195-79177 2006 $75,000 $75,000 $143,916 3
6 82194-110565 2012 $100,000 $100,000 $187,056 10
The project data analyses have highlighted the effectiveness of Accepted for Traffic and Interim
Completion incentive/disincentive contracting methods. The paid incentives for the above two
methods were easily justified by calculating the avoided user delay that could have been
encountered if the incentive were not included. This was not the case for Lane Rental incentive.
Table 12 presents lane rental charge per hour and the hourly user delay rate for the lane rental
incentive projects, as well as the maximum offered incentive and the paid incentive. It was found
that in some projects the calculated user delay per hour is higher than what MDOT charges for
lane rental assessment charge. To confirm these results, the calculations were reviewed with the
MDOT pavement performance and selection engineer, as well as explored through a series of
interviews with several regional project/construction engineers and the system operations
engineer. It was found that MDOT does not have a standard process or guideline for developing
lane rental incentive costs. Few interviewees mentioned using Co3 to calculate the expected user
delay as a starting point but these numbers get adjusted by the project engineer later based on
different factors such as the incentive not to exceed 5% of the allocated budget, what is left in the
budget, which rates will motivate the contractor to open the road faster but not scare the contractor
from bidding the job, etc.
Additionally, it should be noted that for all projects with lane rental charge lower than the
calculated user delay, the actual paid incentives were substantially lower than the maximum
offered incentive or a distinctive amount imposed on the contractor. This would questions the lane
rental incentive/disincentive accelerating technique for these projects.

31
Table 12: Lane Rental Charge and the Hourly User Delay Rate for the Lane Rental
Incentive Projects
# Contract No. Year Maximum Incentive
Paid Incentive
Item
Lane Rental Charge per hr
User Delay Cost/ hr
1 25132-44785 2009 $100,000 $95,010
One lane I 475
N or S $230 $456
Detoured Nor
S $600 $3,075
2 34044-102316 2008 $100,000 $50,000
EB I 96 $750 $206
WB I 96 $750 $461
Saturdays $750 $543
3 41024-75091 2007 $100,000 $97,675 One lane
I-96 $700 $94
4 41131-79462 2008 $100,000 $0 one lane US
131 $1,000 $9,273
5 77011-75169 2007 $20,000 ($6,420) one lane M-19 $60 $14
6 77011-87392 2008 $50,000 ($9,650) one lane M-19 $100 $972
7 77023-51506 2007 $10,000 ($225,650)
one lane I-69 $150 $160
Entrance
Ramp $100 $148
Exit Ramp $100 $285
8 77024-74766 2008 $800,000 $260,222
One lane I-69 $412.53 $412.53
Ramp Exit $861.95/
$440.49
$861.95/
$440.49
Ramp Ent. $752.04/
$510.45
$752.04/
$510.45
9 77032-104088 2010 $80,000 $10,000 One Lane $75 $103
Two Lane $200 $206
10 77052-81292 2007 $5,000 $4,300
one lane I-94
BL $100 $111
one lane M29 $100 $52
11 77052-89456 2007 $5,000 $5,000 One Lane $100 $20
12 77111-100701 2008 $500,000 $388,740 One Lane I-94 $200 $584
13 77111-101386 2009 $20,000 $19,100 One Lane I-94 $200 $202
14 77111-76906 2008 $500,000 ($946,920)
one lane I-69 $200 $160
one lane Road $100 $27
Entrance
Ramp $100 $148
15 77111-78488 2008 $28,000 $28,000 EB I 96 $200 $404
WB I 96 $200 $550
16 77111-80911 2009 $400,000 $399,318
One lane I-94 $559.57 $559.57
Two lane $526.20 $526.20
Exit Ramp (A) $805.28 $805.28
17 77111-89733 2007 $10,000 $5,000 One lane I-94 $150 $614

32
Effect of acceleration techniques on project long-term pavement performance
Although polynomial curves were used to calculate the DI progress for these projects, it should be
advised that the actual project long term performance is different as the projects tend to deteriorate
faster when they have higher DI values. Figures 1 and 2 illustrate the best fit curves for all incentive
projects and non-incentive projects. It should be noted that the incentive projects took longer to
reach Average DI of 50. The same results were obtained when the DI values were calculated for
the 15 pair projects identified for the study analysis as illustrated in Figure 19. The incentive
projects tend to deteriorate slower than the non-incentive projects for the identified pair-projects.
Figure 19: DI Progress for Incentive and non-Incentive Projects
Table 13 illustrates the Modified RSL right after construction in years for the incentive group
projects and its paired non-incentive group. It should be noted that these numbers tends to be higher
than usual as polynomial regression modeling was used to calculate these numbers. Actual projects
tend to deteriorate faster as the project gets older. The DI performance data and calculations of
Modified RSL are presented in Appendix 9.
Figure 20: Modified RSL for Each Incentive Project with the Corresponding Non-
Accelerated Project
0
5
10
15
20
25
0 2 4 6 8 10
DI
Project Age
Incentive Projects
Non-Incentive Projects
Poly. (Incentive Projects)
Poly. (Non-IncentiveProjects)
0
10
20
30
40
1 2 3 4 5 6 7 8 9 10 11 12 13 14 15
Mo
dif
ied
RSL
Project
Incentive Projects Non-Incentive Projects

33
Figure 20 plots the Modified RSL for each incentive project with the corresponding non-
accelerated project. The plotted Modified RSL data also suggests a strong positive relation
between the incentive paid and project long-term pavement performance.
Table 13: Modified Remaining Service Life for Incentive Projects vs. Non-Incentive Projects
No Contract ID RSL*
(Yrs) Incentive Contract ID
RSL*
(Yrs)
1 41043-45783 23.7 Interim Completion 41043-45786 20.3
2 61153-45782 18.98 Interim Completion 61151-45809 9
3 62031-32352 10.82 Interim Completion 62031-32342 10.12
4 82123-52803 32.26 Accepted for Traffic 41026-53377 10.58
5 03112-48577 6.6 Lane Rental 83031-80235 8.67
6 06111-55125 17.84 Lane Rental 65041-45865 20.22
7 26011-43817 22.93 Lane Rental 26011-45415 9.01
8 39014-38097 9.06 Lane Rental 41131-44778 8.96
9 39022-45837 18.12 Lane Rental 11017-106483 10
10 41131-53766 14.5 Lane Rental 39051-49430 28.25
11 50111-43941 21.32 Lane Rental 39041-90224 4.14**
12 63071-49287 10.67 Lane Rental 79031-45850 20.4
13 82024-82589 28.61 Lane Rental 11013-51197 9.99
14 82112-48379 13.26 Lane Rental 82111-75706 11
15 63052-50291 25.8 Lane Rental 82053-45693 8.17
* It should be noted that the Modified RSL numbers tends to be higher than usual as the projects deteriorate faster later in their life **This is an actual number as the project reached DI of 58.22 in Year 5
In performing the paired samples t-tests for the expected Modified RSL performance index, there
was a significant difference in the scores for incentive project group (M=18.30, SD=7.53) and non-
incentive project group (M=12.59, SD=6.50) conditions; t (15) =-2.067, p =0.05. However, there
was no significant difference in the scores for Lane Rental incentive project group (M=17.16,
SD=7.07) and non-incentive project group (M=12.62, SD=7.16) conditions; t (11) = 1.327, p
=0.214. Table 14 illustrates the Paired Samples T-Test Results.

34
Table 14: The Paired Samples T-Test Results Based on Modified RSL
M (Mean) SD (St. Dev.)
Sample
Size T P
Whole Groups Based on Modified RSL
Incentive Group 18.30 7.53 15 -2.067 0.05
Non-Incentive Group 12.59 6.5
Lane Rental Groups Based on Modified RSL
Incentive Group 17.16 7.07 11 1.327 0.214
Non-Incentive Group 12.62 7.16
Recommendations on each acceleration technique
Based on the limited results provided in task 3, the results support a few of the listed “Advantages
and Disadvantages” and “Recommendations for Use” of each acceleration technique in the 2013
MDOT Innovative Construction Contracting document. Tables 15, 16, and 17 illustrate all the
“Advantages and Disadvantages” and “Recommendations for Use” for Interim Completion Date
Incentives, Accepted for Traffic Incentives, and Lane Rental incentives, respectively, along with
a supporting statement, if the data analysis support this statement.
Table 15: Recommendations on Interim Completion Date Incentives
Item Supporting statement
Advantages- Interim Completion Date Incentives
Earlier completion or open-to-traffic date for
critical phases of a project
Table 10 supports the second half of the
statement “Open-to- traffic for…” (Appendix
4 partially supports the first half of this
statement)
Minimizes impacts to motorists and/or
community
Because of the earlier completion, the user
delay cost was less (Table 10)
Reduces road user delay costs Table 10 supports this statement
Better scheduling by contractors for
construction activities
Appendix 4 partially supports this statement
Disadvantages - Interim Completion Date Incentives
Increased project costs may require additional
funding
Table 10 supports this statement. MDOT had
to pay additional incentive cost that was not
considered in the comparable non-incentive
projects.
Potential for increased bid costs Table 10 supports this statement. Contractors
will increase bid in case they feel that they
cannot meet the required interim completion
date.
Potential for increased costs for construction
oversight
The project did not consider this factor
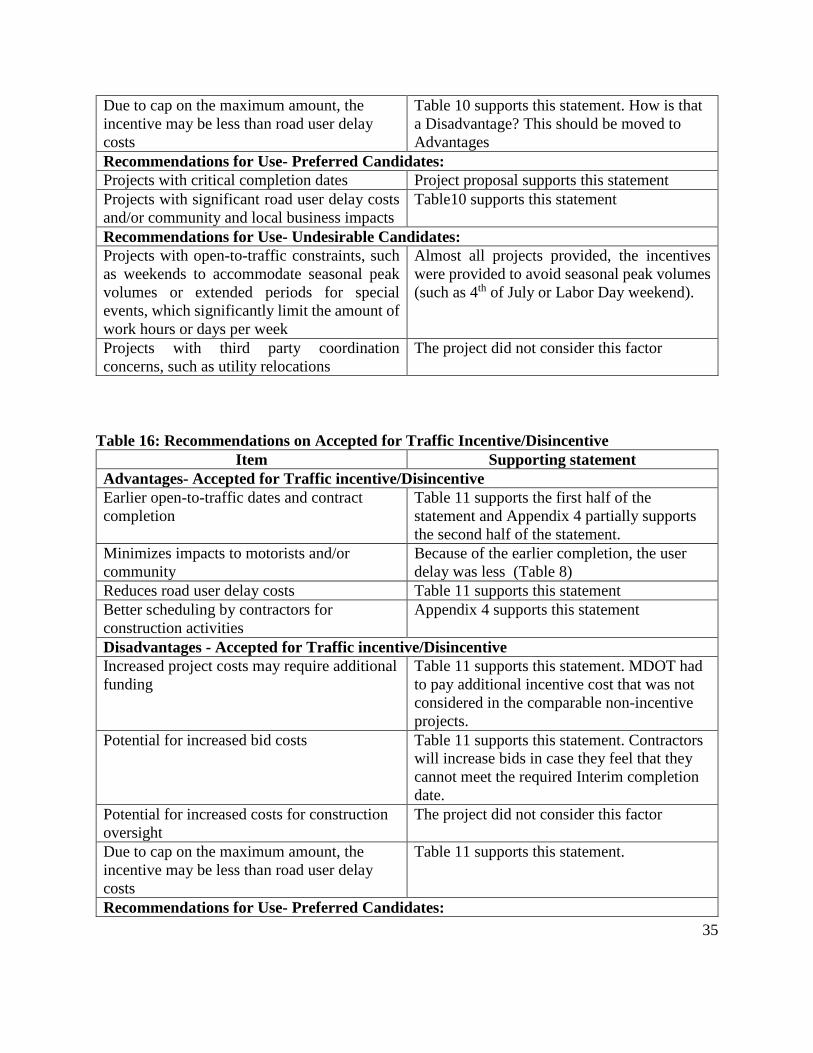
35
Due to cap on the maximum amount, the
incentive may be less than road user delay
costs
Table 10 supports this statement. How is that
a Disadvantage? This should be moved to
Advantages
Recommendations for Use- Preferred Candidates:
Projects with critical completion dates Project proposal supports this statement
Projects with significant road user delay costs
and/or community and local business impacts
Table10 supports this statement
Recommendations for Use- Undesirable Candidates:
Projects with open-to-traffic constraints, such
as weekends to accommodate seasonal peak
volumes or extended periods for special
events, which significantly limit the amount of
work hours or days per week
Almost all projects provided, the incentives
were provided to avoid seasonal peak volumes
(such as 4th of July or Labor Day weekend).
Projects with third party coordination
concerns, such as utility relocations
The project did not consider this factor
Table 16: Recommendations on Accepted for Traffic Incentive/Disincentive
Item Supporting statement
Advantages- Accepted for Traffic incentive/Disincentive
Earlier open-to-traffic dates and contract
completion
Table 11 supports the first half of the
statement and Appendix 4 partially supports
the second half of the statement.
Minimizes impacts to motorists and/or
community
Because of the earlier completion, the user
delay was less (Table 8)
Reduces road user delay costs Table 11 supports this statement
Better scheduling by contractors for
construction activities
Appendix 4 supports this statement
Disadvantages - Accepted for Traffic incentive/Disincentive
Increased project costs may require additional
funding
Table 11 supports this statement. MDOT had
to pay additional incentive cost that was not
considered in the comparable non-incentive
projects.
Potential for increased bid costs Table 11 supports this statement. Contractors
will increase bids in case they feel that they
cannot meet the required Interim completion
date.
Potential for increased costs for construction
oversight
The project did not consider this factor
Due to cap on the maximum amount, the
incentive may be less than road user delay
costs
Table 11 supports this statement.
Recommendations for Use- Preferred Candidates:

36
Projects with critical open-to-traffic dates Project proposal supports this statement
Projects with significant road user delay costs
and/or community and local business impacts
Table 11 supports this statement
Recommendations for Use- Undesirable Candidates:
Projects with third party coordination
concerns, such as utility relocations
The project did not consider this factor
Table 17: Recommendations on Lane Rental Incentive
Item Supporting statement
Advantages- Lane Rental Incentive
Earlier contract completion or open-
to-traffic date
Neither data in Table 13 nor Appendix 4 supports this
statement. Table 13 indicates that in most projects, the
contractor was paid less than the full incentive amount.
This means that road lanes were closed more than
expected and Appendix 4 shows in the following graph
that the non-incentive projects show better
performance in earlier contract completion compared
with the lane rental incentive projects.
Minimizes impacts to motorists
and/or community
Conceptually, the numbers do not support this
statement
Better scheduling by contractors for
construction activities
Appendix 4 does not support this statement. Appendix
4 indicates that non-incentive projects have a better
performance in earlier contract completion compared
with lane rental incentive projects.
Disincentives for exceeding the
estimated lane rental amounts.
Table 13 supports this statement. Lane rental charges
(disincentives) were assessed when the lanes were
closed more than expected.
Disadvantages - Lane Rental Incentive
Increased project costs may require
additional funding
Although this statement could be supported
conceptually, Table 13 indicated that for most projects
identified, contractors were assessed disincentives
more than expected when the incentive was calculated.
Potential for increased bid costs Table 12 supports this statement. Contractors will
increase bids in case they feel that they cannot meet the
required lane rental charges.
Potential for increased costs for
construction oversight
The special provision template supports this statement.
The construction engineer and the contractors must
meet biweekly to agree on the lane rental assessed
hours.
Tracking of lane rental charges The special provision template supports this statement.
The construction engineer and the contractors have to

37
meet biweekly to agree on the lane rental assessed
hours.
Recommendations for Use- Preferred Candidates:
Projects with critical completion
dates
The proposal justification for lane rental supports this
statement.
Projects with significant road user
delay costs and/or community and
local business impacts
The proposal justification for lane rental supports this
statement.
Recommendations for Use- Undesirable Candidates:
Projects with open-to-traffic
constraints, such as weekends to
accommodate seasonal peak volumes
or extended periods for special
events, which significantly limit the
amount of work hours or days per
week
The project did not consider this factor.
Projects with third party coordination
concerns, such as utility relocations
The project did not consider this factor.

38
Chapter 5- Conclusions
Conclusions from the Study
The research team provides the following conclusions from the study
1. The literature supports the need for this study and highlights the lack of a process for
reviewing the effectiveness of incentive/ disincentive clauses.
2. Data was scarce and fragmented. The team spent considerable time identifying the required
projects, locating their records and connecting these records with long-term performance data.
3. Limited data was identified and used to carry the analysis.
4. Data analysis did not support the notion that incentive clauses adversely impact long term
project performance. The analyzed data statistically supports an improvement in the long term
project performance for the incentive projects over their comparable non-incentive projects.
5. Identified data suggest a trend that incentive clauses accelerate project schedules. A strong
trend has been identified that the incentive projects schedules were accelerated compared to
their similar non-incentive projects.
6. Data analysis statistically supports the assertion that incentive clauses increase project cost
but further analysis finds that the avoided user delay was higher than the additional paid cost
for Accepted for Traffic and Interim Completion incentive/ disincentive clauses but not for
Lane Rental incentive clauses.
7. The analysis results highlight the effectiveness of Accepted for Traffic and Interim
Completion incentive/ Disincentive clauses in achieving their goals by accelerating project
schedules and reducing user delay cost.
8. The analysis results debate the effectiveness of the Lane Rental incentive/ disincentive clause
in achieving their goals and calls for an in-depth future study to investigate this issue.
9. The results call for little modification to the listed “Advantages and Disadvantages” and
“Recommendations for Use” of each acceleration technique in the 2013 MDOT Innovative
Construction Contracting document.
a. For interim completion date incentives, remove “Projects with open-to-traffic
constraints, such as weekends to accommodate seasonal peak volumes or extended

39
periods for special events, which significantly limit the amount of work hours or days
per week” from Recommendations for Use-Undesirable Candidates list.
b. For the lane rental incentive, remove “Earlier contract completion or open-to-traffic
date” and “Better scheduling by contractors for construction activities” from
“Advantages” list of Recommendations for Further Research.
Recommendations for Further Research
1. Initiate a research study to develop a state-wide guidebook and best management practices for
estimating the amount of incentive/ disincentive clauses. The study should include a national
survey of the current practices of states that are known to sponsor more I/D clauses in their
contracts (such as Florida, South Carolina, and Ohio).
Recommendations for Implementation
The following recommendations are provided for implementation by MDOT.
1. Maintain a database of current and previous approved special provisions along with project
performance indicators to systematically measure the performance of I/D clauses and
benchmark the effectiveness of any new project. This will allow MDOT to assess the value
and practices of these incentives and will help in fulfilling the new incentive reporting
requirement as required by the State of Michigan Act 200, Public Acts of 2012.
2. Request that both the construction engineer and the contractor receiving the incentive submit
a summary report providing lessons learned that can be implemented in future project designs
and specifications.
3. Examine the consistency of the currently developed procedures for calculating the incentive
amount (especially for the lane rental incentive/disincentive) state-wide.
References
Arditi, D., Khisty, C. J., and Yasamis, F. (1997). "Incentive/Disincentive provisions in highway
contracts." Journal of Construction Engineering and Management 123(3): 302-307.

40
Baladi, G. Y. and Leveret, B. (2009). Value Affect of Construction Incentive Payments on
Pavement Performance: Final Report, Michigan State University, Dept. of Civil and
Environmental Engineering.
Choi, K. (2008). "A new decision-support model for innovative contracting strategies through a
quantitative analysis on aspects of project performance." PhD thesis, University of
California, Berkeley.
Christiansen, D. L. (1987). "An Analysis of the Use of Incentive/Disincentive Contracting
Provisions for Early Project Completion." Transportation Research Board, Special Report
212: 69-76.
Herbsman, Z. J. (1995). "Time is money: innovative contracting methods in highway
construction." Journal of Construction Engineering and Management 121(3): 273-281.
Herbsman, Z. J. and Glagola, C. R. (1998). "Lane rental—Innovative way to reduce road
construction time." Journal of Construction Engineering and Management 124: 411.
Ibarra, C., Trietsch, G., and Dudek, C. (2002). "Strategies Used by State DOT’s to Accelerate
Highway Construction Projects." Texas A&M University-Department of Civil
Engineering.
Jaraiedi, M., Plummer, R. W., and Aber, M. S. (1995). "Incentive/ Disincentive Guidelines for
Highway Construction Contracts." Journal of Construction Engineering and
Management 121: 112.
Lee, E. B., Choi, K., and Lim, S. (2008). "Streamlined Strategies for Faster, Less Traffic-
Disruptive Highway Rehabilitation in Urban Networks." Transportation Research
Record: Journal of the Transportation Research Board 2081(-1): 38-45.
Michigan Department of Transportation (MDOT) (1997). "Business Plan."
<www.modot.state.mi.us/acrobatfiles/businessplan.pdf>
Shr, J. F. and Chen, W. T. (2004). "Setting maximum incentive for incentive/disincentive
contracts for highway projects." Journal of Construction Engineering and Management
130: 84.
Federal Highway Administration (FHWA). (1989). “Incentive/Disincentive for Early Contract Completion.” FHWA Technical Advisory T5080.10, Washington, D.C.
<http://www.fhwa.dot.gov/legsregs/directives/techadvs/t508010.htm>
Federal Highway Administration (FHWA). (2003). “Summary of Past VE Savings.” Value Engineering and Federal Highway Administration, Washington, D.C.

41
<http://www.fhwa.dot.gov/ve/index.htm>
Florida Department of Transportation (FDOT). (1999). “Alternative Contracting Program Preliminary Evaluation for July 1, 1996 – June 30, 1999.” Report, Office of Quality
Initiatives, Tallahassee, Florida.
American Association of State Highway and Transportation Officials AASHTO (2006), “ Primer on Contracting for the Twenty-first Century”, A Report of the Contract Administration task Force of the AASHTO Subcommittee on Construction, 5th ed. , Washington, DC. Federal Highway Administration. Contract Administration Core Curriculum Participant’s Manual and Reference Guide. U. S. Department of Transportation, Washington, DC, 2006.
Bibliography
Abu-Hijleh, S. F., and Ibbs, C.W. Schedule-Based Construction Incentives. Journal of Construction
Engineering and Management, Vol. 115, No. 3, 1989, pp. 430–443.
Allen, R. K. Estimation of Construction Contract Liquidated Damages. Civil Engineering Practice,
10(1), 1995, p. 7.
Anderson, S. NCHRP Guidelines Detail Innovative Contracting Methods. Texas Transportation
Researcher. Vol. 36, No. 2, 2000, p. 7.
Anderson, S., and Russell, J.S. NCHRP Report 451: Guidelines for Warranty, Multi-Parameter, and
Best-Value Contracting. TRB, National Research Council, Washington, DC, 2001.
Arditi, D., Khisty, C. J., and Yasamis, F. Incentive/Disincentive Provisions in Highway Contracts.
Journal of Construction Engineering and Management, Vol. 123, No. 3, 1997, pp. 302–307.
Arditi, D., and Yasamis, F. Incentive/Disincentive Contracts: Perceptions of Owners and Contractors.
Journal of Construction Engineering and Management, Vol. 124, No. 5, 1998, pp. 361–373.
Baladi, G. Y. and Leveret, B. Value Affect of Construction Incentive Payments on Pavement
Performance: Final Report, Michigan State University, Dept. of Civil and Environmental
Engineering, 2009.
Bierbaum, R.R. Incentive/Disincentive Clauses: Do They Accelerate Highway Construction Projects
in Iowa? Creative Component for Matters of Science in Transportation Engineering, Iowa State
University, Ames, 1991.
British Columbia Ministry of Transportation. MicroBENCOST Guidebook: Guidelines for the
Benefit Cost Analysis of Highway Projects in British Columbia. Vancouver, Canada, 2005.
Buffington, J. L, Chui, M. K., and Memmot, J. L. Effects of Freeway Stage Construction on Nearby
Land Uses and Vehicle User Costs. Transportation Research Record 1046, TRB, National
Research Council, Washington, DC, 1985, pp. 62–69.

42
California Department of Transportation. Work Plan Special Experimental Project #14 Innovative
Contracting Techniques Cost-Plus-Time (A+B) Bidding Method. Sacramento, CA, 1994.
California Department of Transportation. Innovative Contracting Test and Evaluation. Sacramento,
CA, 1993.
California Department of Transportation. Summary Initial Report for Innovative Contracting
Practices. Sacramento, CA, 1993.
California Department of Transportation. The Lessons Learned from the Northridge Earthquake.
Sacramento, CA, 1995.
California Department of Transportation Division of Construction. Initial Report for A+B Pilot
Contract 06-354504. Test & Evaluation #014 (A+B), Sacramento, 1993.
California Department of Transportation Division of Construction. Initial Report for Warranty Pilot
Contract 02-26404. Test & Evaluation Project #014 Innovative Contracting Practices (Warranty),
Sacramento, 1996.
California Department of Transportation Division of Construction. Summary Initial Report for A+B
Pile Contracts: 06-354503, 09-211504, and 11-085974. Sacramento, CA, 1993.
Capuro, F., and Seon, S. Criteria and Guidelines for Innovative Contracting. South Dakota
Department of Transportation: Office of Research. Study SD95-07, Pierre,1996.
Carr, R. I. Construction Congestion (CO3) Basic Model. Journal of Construction Engineering and
Management, Vol. 126, No. 2, 2000, pp. 105–113.
Cervarich, M. B. Timing Delays Like Relays: State DOTs Study New Ways to Speed Construction
in Consideration of Cost to Commuters. Roads & Bridges, Vol. 40, No. 1, 2002, pp. 32–35.
Christiansen, D.L. An Analysis of the Use of Incentive/Disincentive Contracting Provisions for Early
Project Completion. In Special Report 212: Transportation Management for Major Highway
Reconstruction, TRB, National Research Council, Washington, DC, 1987, pp. 69–76.
Colorado Department of Transportation. Special Experimental Project No. 14: Colorado A+B
Contract Summary. Denver, CO (undated).
Colorado Department of Transportation. Revision of Section 102: Bidding Requirements and
Conditions. Colorado Project No. FC NB(CX)CY 040-5(13), Denver, 1993.
Daniels, G., Stockton, W. R., and Hundley, R. Estimating Road User Costs Associated with Highway
Construction Projects: Simplified Method. Transportation Research Record: Journal of the
Transportation Research Board, No. 1732, TRB, National Research Council, Washington, DC,
2000, pp. 70–79.
Dutta and Patel (2012). “Innovative Contracting Methods and Construction Traffic Congestion,
Report No: MIOH UTC TS42 2012-Final, Michigan Ohio University Transportation Center
El-Rayes, K. Optimum Planning of a Highway Construction Under A+B Bidding Method. Journal of
Construction Engineering and Management, Vol. 127, No. 4, 2001, pp. 261–269.

43
Elias, A. M. Development of a Systematic Approach for the Inclusion of Accident Risk Factors in the
Calculation of Road User Costs for Construction Zones. PhD dissertation, University of Florida,
Gainesville, 1998.
Ellis, R. D., and Herbsman, Z. J. Cost-Time Bidding Concept: An Innovative Approach.
Transportation Research Record 1282, TRB, National Research Council, Washington, DC, 1990,
pp. 89–94.
Ellis, R., Pyeon, J-H., Herbsman, Z., Minchin, E., Molenaar, K. Evaluation of Alternative Contracting
Techniques on FDOT Construction Projects. RFP-DOT-05/06-9024-JP, Tallahassee, FL, 2007.
Federal Highway Administration. Briefing FHWA Initiatives to Encourage Quality Through
Innovative Contracting Practices Special Experimental Project No. 14. U. S. Department of
Transportation, Washington, DC, September 1996.
Federal Highway Administration. Briefing FHWA Initiatives to Encourage Quality Through
Innovative Contracting Practices Special Experimental Project No. 14, U. S. Department of
Transportation, Washington, DC, January 1998.
Federal Highway Administration. Briefing on FHWA Innovative Contracting Practices, Special
Experimental Project No. 14 (SEP-14): Innovative Contracting. Table of Innovative Contracting
Use by State. <http://www.fhwa.dot.gov/construction/cqit/sep14.cfm> (Accessed Sep 24, 2013).
Federal Highway Administration. Intelligent Transportation Systems in Work Zones. A Case Study:
Work Zone Travel Time System: Reducing Congestion with the Use of a Traffic Management
Contract Incentive During the Reconstruction of Arizona State Route 68. U. S. Department of
Transportation, Washington, DC, 2004.
Federal Highway Administration. Road User Cost Determination Methods in Use for Innovative
Contracting Projects. U.S. Department of Transportation, Washington, DC (undated).
Felker, B. Guidelines for Use of A+B Bidding Provisions. California Department of Transportation
Memorandum. Sacramento, 2002.
Ferragut, T. Transportation Research Circular, Number E-C059 Accelerated Highway Construction:
Workshop Series Summary. Transportation Research Board of the National Academies,
Washington, DC, 2003.
Fick et al (2010). “Time-Related Incentive and Disincentive Provisions in Highway Construction
Contracts”, Report 652, National Cooperative Highway Research program
Finch, O. F. Legal Implications in the Use of Penalty and Bonus Provisions of Highway Construction
Contracts: The Use of Incentive and Dis- incentive Clauses as Liquidated Damages for Quality
Control and for Early Completion. Selected Studies in Highway Law, 1998, Vol. 3.
Florida Department of Transportation. Alternative Contracting User’s Guide Draft. Tallahassee,
1997.
Florida Department of Transportation (FDOT). Alternative Contracting Program Preliminary
Evaluation for July 1, 1996 – June 30, 1999. Report, Office of Quality Initiatives, Tallahassee,
Florida, 1999.

44
Florida Department of Transportation. Construction Project Administration Manual: Contract
Duration and Alternative Contracting Techniques, Section 1.2: Establishing Construction
Contract Durations. Topic No. 700-000-000. Tallahassee, 2003.
Gaj, S. J. Lane Rental: An Innovative Contracting Practice. TR News, No. 162, 1992, pp. 7–9.
Gendell, D.S. Contracting and Contract Issues. In Special Report 212: Transportation Management
for Major Highway Reconstruction. TRB, National Research Council, Washington, DC, 1987,
pp. 77–81.
Georgia Department of Transportation. Department of Transportation State of Georgia Special
Provision Project NH-IM-95-1(23), Bryan County P. I. No. 511150 Project Design Requirements.
Savannah, 1999.
Gillespie, J. S. Estimating Road User Costs as a Basis for Incentive/ Disincentive Amounts in
Highway Construction Contracts. Virginia Transportation Research Council, VTRC 98-12.
Charlottesville, 1998.
Gorman, T. Benefits of Redefining the Term “Completion Date.” Transportation Builder, Vol. 11,
No. 4, 1999, p. 26.
Herbsman, Z. J. A+B Bidding Method-Hidden Success Story for Highway Construction. Journal of
Construction Engineering and Management, Vol. 121, No. 4, 1995, pp. 430–437.
Herbsman, Z. J., Chen, W. T., and Epstein, W. C. Time Is Money: Innovative Contracting Methods
in Highway Construction. Journal of Construction Engineering and Management, Vol. 121, No.
3, 1995, pp. 273–281.
Herbsman, Z., Glagola, J., and Charles, R. Lane Rental—Innovative Way to Reduce Road
Construction Time. Journal of Construction Engineering and Management, Vol. 124, No. 5, 1998,
pp. 411–417.
Ibarra, C. Strategies Used by State DOTs to Accelerate Highway Construction Projects. 2002 Mentors
Program. Papers on Advanced Surface Transportation Systems, Presented at 2002 Mentors
Program Advanced Surface Transportation Systems, College Station, TX, 2002, pp. 83–125.
Jaafari, A. Twinning Time and Cost in Incentive-Based Contracts. Journal of Management in
Engineering, Vol. 12, No. 4, 1996, pp. 62–72.
Jaraiedi, M., Plummer, R. W., and Aber, M. S. Incentive/Disincentive Guidelines for Highway
Construction Contracts. Journal of Construction Engineering and Management, Vol. 121, No. 1,
1995, pp. 112–120.
Jones, L., and Vargas, R. A+B Contracting. California Department of Transportation Journal, Vol. 2,
No. 4, 2002, pp. 22–25.
Karan, M., and Haas, R.C.G. User Delay Cost Model for Highway Rehabilitation. Transportation
Research Record 554, TRB, National Research Council, Washington, DC, 1975, pp. 38–50.
Kent, D. Lane Rental Status Report and Issues. NYSDOT Memorandum, April 8, 1997.
Kent, D. Making Work Zones Work Better: Innovations in Technologies, Practices, and Products
Workshop; Innovative Contracting Techniques That Consider Driver Impacts: Use of A+B
45
Bidding. Springfield, IL, 2003.
<http://ops.fhwa.dot.gov/wz/workshops/accessible/Kent_MWZWB.htm> (accessed September
24, 2013).
Lee, E.B., and Choi, K.H. Dynamic approach in minimizing traffic inconvenience in urban highway
rehabilitation. Preprints of the transportation research board 85th annual meeting, no. 06-1817,
TRB, National Research Council, Washington, D.C, 2006.
Livingston, J. Lessons Learned from a Travel Time Incentive/Disincentive on State Route 68 in
Arizona. 2002 Mentors Program: Papers on Advanced Surface Transportation Systems, Presented
at 2002 Mentors Program Advanced Surface Transportation Systems, College Station, TX, 2002,
pp. 127–139.
Loulakis, M.C., and Mclaughlin, L.P. Enforcing Liquidated Damages: How Much Is Too Much?
Civil Engineering, Vol. 74, No. 9, 2004, p. 96.
Maryland State Highway Agency. Maryland State Highway Authority Guidelines for the Use of
Bidding Procedures, Liquidated Damages, Road User Benefit Cost, Incentive/Disincentives,
Special Bidding Methods, A+B Bidding Methods. Baltimore, 1994.
McCormick, C.R. Make Liquidated Damages Work. AACE International Transactions of the Annual
Meeting, CDR151-CDR157, Orlando, FL, 2003.
McFarland, W.F., Kabat, R.J., and Krammes, R.A. Comparison of Contracting Strategies for
Reducing Project Construction Time. Final Report. Texas Transportation Institute, Research
Report 1310-1F. FHWA/TX-94/1310-1F, 1994.
McFarland, W.F., Rollins, J.B., Drammes, R.A., Buffington, J.L., and Memmott, J.L. Project
Completion Times and Evaluation of Bidding Strategies with Bonuses and Liquidated Damages.
Final Report. Texas Transportation Institute, Research Report 41, 1987.
Michigan Department of Transportation “Innovative Construction Contracting”, Draft Report, June
2010.
Michigan Department of Transportation. Special Experimental Project No. 14: A+B Bidding, I-696/I-
94 Interchange. Memorandum, Lansing, 1994.
Michigan Department of Transportation. User Cost Analysis During Lane Closures Replacement of
Continuously Reinforced Concrete and Safety Upgrading of the I-696/I-94 Interchange. Lansing,
1994.
Minnesota Department of Transportation. Innovative Contracting in Minnesota 2000 to 2005. Office
of Construction and Innovative Contracting, St. Paul, 2005.
New Jersey Department of Transportation. Road User Cost Manual, Trenton, 2001.
New York State Department of Transportation. Guidelines for the Use of Time-Related Contract
Provision. Albany, NY, 1999.
New York State Department of Transportation. Implementation Guidelines for A+B Bidding. Albany
(undated).
46
New York State Department of Transportation. Implementation Guidelines for Lane Rental and A+B
Projects. Albany (undated).
North Carolina Department of Transportation. Cost/Time (A+B) Bidding. Raleigh, 1993.
North Dakota Department of Transportation. Evaluation of Innovative Contracting Practices ‘A+B’
Bidding Method. Bismarck, 1996.
Ohio Department of Transportation. Innovative Contracting Manual. Cleveland, 2006.
Olguin, E.T., Allison, B.T., and McCullough, B.F. Effectiveness of Accelerating Highway
Rehabilitation in Urban Areas. Research Report SWUTC 60058-1, SWUTC/95/60058-1. Center
for Transportation Research. The University of Texas at Austin, 1995.
Petring, J., and Helgeson, B. A+B Process Review Report. Albuquerque, NM, 1999.
Pinnacle One. Summary Level Study of A+B Bidding. California Department of Transportation,
Sacramento, CA, 2005.
Plummer, R. W., Jaraiedi, M., and Aber, M. S. Development of Criteria for Incentives/Disincentives
in Highway Construction Contracts. Final Report, Department of Industrial Engineering, West
Virginia University, Morgantown, West Virginia, 1992.
Pyeon, J.-H. Development of a Simulation Model to Predict the Impact of Incentive Contracts on
Transportation Construction Project Time Performance. PhD dissertation, University of Florida,
Gainesville, 2005.
Riffkin, M., McMurty, T., Heath, S., and Saito, M. Variable Speed Limit Signs Effects on Speed and
Speed Variation in Work Zones. Utah Department of Transportation Research and Innovation
Division. UT-08.01, Salt Lake City, 2008.
Rister, B. W., and Wang, Y. Evaluation of Current Incentive/Disincentive Procedures in
Construction. Report, Kentucky Transportation Center, University of Kentucky, Lexington,
Kentucky, 2004.
Ryan, J. T., and Carson, J. Valuation of Temporary Transportation Facility Use Losses. Research
Bureau—Montana Department of Transportation, FHWA/MT-02-005/8117-16, Helena, 2002.
Salem, O., Ashraf, G. Improved Models for User Costs Analysis. Ohio Department of Transportation,
Office of Research and Development, Columbus, 2007.
Schnabel, R.S. Literature Review of Methods to Determine Road User Costs In Construction Zones.
MS thesis, University of Florida, Gainesville, 1997.
Shr, J.F. Model Development for Cost-Plus-Time Bidding Applied to Florida Department of
Transportation Highway Construction. PhD dissertation, University of Wisconsin-Madison,
1999.
Shr, J.F., and Chen, W.T. A Method to Determine Minimum Contract Bids for Incentive Highway
Projects. International Journal of Project Management, Vol. 21, No. 8, 2003, pp. 601–615.
Shr, J.F., and Chen, W.T. Setting Maximum Incentive for Incentive/ Disincentive Contracts for
Highway Construction Projects. Journal of Construction Engineering and Management, Vol. 130,
No. 1, 2004, pp. 84–93.
47
Shr, J.R., Ran, B., and Sung, C.W. Method to Determine Minimum Contract Bid for A+B+I/D
Highway Projects. Journal of Construction Engineering and Management, Vol. 130, No. 4, 2004,
pp. 509–516.
Shr, J.R., Thompson, B.P., Russell, J.S., Ran, B., and Tserng, H.P. Determining Minimum Contract
Time for Highway Projects. Transportation Research Record: Journal of the Transportation
Research Board, No. 1712, TRB, National Research Council, Washington, DC, 2000, pp. 196–
201.
Sillars, D.N. Establishing Guidelines for Incentive/Disincentive Contracting at ODOT. Oregon
Department of Transportation, Salem, OR, 2007.
Strong, K. Performance Effectiveness of Design-Build, Lane Rental, and A+B Contracting
Techniques. Minnesota Department of Transportation. MN/RC-2006-09, St. Paul, 2006.
Strong, K.C., Tometich, J., and Raadt, N. Cost Effectiveness of Design- Build, Lane Rental, and A+B
Contracting Techniques. Proc., 2005Mid-Continent Transportation Research Symposium, Ames,
Iowa, 2005.
Stukhart, G. (1984). ”Contractual Incentives.” J. Constr. Eng. Manage., 110(1), 34–42.
Sukumaran, P., Mehmet, E.B., Hong, T.-H., and Hastak, M. Model for Analysis of Factors Affecting
Construction Schedule in Highway Work Zones. Journal of Transportation Engineering, Vol. 132,
No. 6, 2006, pp. 508–517.
Transportation Research Board. Innovative Contracting Practices. Transportation Research Circular
386. TRB, National Research Council, Washington, DC, 1991.
Trauner Consulting Services. Criteria and Guidelines for Innovative Contracting. South Dakota
Department of Transportation Office of Research—Study SD95-07, Philadelphia, PA, 1996.
Trimels, K.A. Lane Rental in Wyoming. Wyoming Department of Transportation, Cheyenne, WY,
2000.
Umachigi, S. Highway Construction: Improved Procedures to Overcome Challenges and Limitations.
M.S. thesis, The State University of New York at Buffalo, 2005.
Utah Department of Transportation. Lane Rental Guidelines. Salt Lake City, 2005.
Wang, Y., and Goodrum, P.M. Use of Conceptual Road User Costs for a Rapid Roadway
Construction Decision Making System. Proc., Construction Research Congress 2005: Broadening
Perspectives, 2005, pp. 979–989.
Washington State Department of Transportation. Road User Cost Computation. Olympia, WA, 1991.
Wisconsin Department of Transportation. Initial Report: A+B Bidding Method: As Part of
Experimental Work Plan for 1020-08-61/72; IM 94-1(114), St. Croix River Bridge IH 94, St.
Croix County. Madison, 1994.
Willett, T. O., Incentive/Disincentive (I/D) for Early Completion, Technical Advisory T 5080.10,
Federal Highway Administration, dated February 8, 1989.
Workman, B. W. Incentives in Construction Contracts. Master's Thesis. The University of Texas,
Austin, Texas, 1985.

48
World Health Organization. Speed management: a road safety manual for decision-makers and
practitioners. Global Road Safety Partnership. Geneva, Switzerland, 2008.
Yang, J.-B. and Wang, W.-C. Contractor Selection by the Most Advantageous Tendering Approach
in Taiwan. Journal of the Chinese Institute of Engineers, Transactions of the Chinese Institute of
Engineers, Vol. 26, No. 3, 2003, pp. 381–387.

49
Appendix 1: List of MDOT Projects Built Via Acceleration Techniques Using I/D Methods
Mentioned in the MDOT Innovative Construction Contracting Document
No Contract ID Letting Year Route Work Type
A+B Incentive/Disincentive
1 09034-46575-2 2001 I-75 RREC
No Excuse Incentive/Disincentive
1 38111-43497 2001 US-127 RREH
2 39405-76303 2005 SFTY
Accepted for Traffic I/D
1 41025-82763 2008 M-44, M-37, I-96 PMAI
2 41027-51883 2009 I-196 RREH
3 41029-45086 2006 I-196 PMAI
4 41051-90161 2008 M-37 SFTY
5 41062-75080 2008 M11 RREC
6 63022-76051 2005 I-96 SFTY
7 63081-45715 2006 M-10 RREH
8 63101-54301 2006 I-696 RREC
9 82022-45684 2004 I-94 RREH
10 82053-58175 2006 US-24 RESU
11 82123-45199 2005 I-96 RREH
82123-45199 2005 I-96 RREH
12 82123-52803 2005 I-96 RREH
13 82194-110565 2012 I-75 SFTY
14 82194-37795 2007 I-75 I-96 I-94 RREC
15 82195-79177 2006 I-75 BREC
Lane Rental
1 03112-48577 2002 US-131 RESU
2 06111-55125 2005 I-75 RESU
3 18024-75774 2004 US-10 RESU
4 25032-100664 2010 I-75 PMAI
5 25132-44785 2009 I-475 RREC
6 26011-43817 2001 M18/M61 RREH
7 34043-87157 2011 I-96 PMAI
8 34044-102316 2008 I-96 SFTY
9 34044-109045 2012 I-96 PMAI
10 39014-38097 1999 US-131 RESU
11 39014-50799-2 2001 US-131 PMAI
12 39022-45837 2000 I-94 RESU
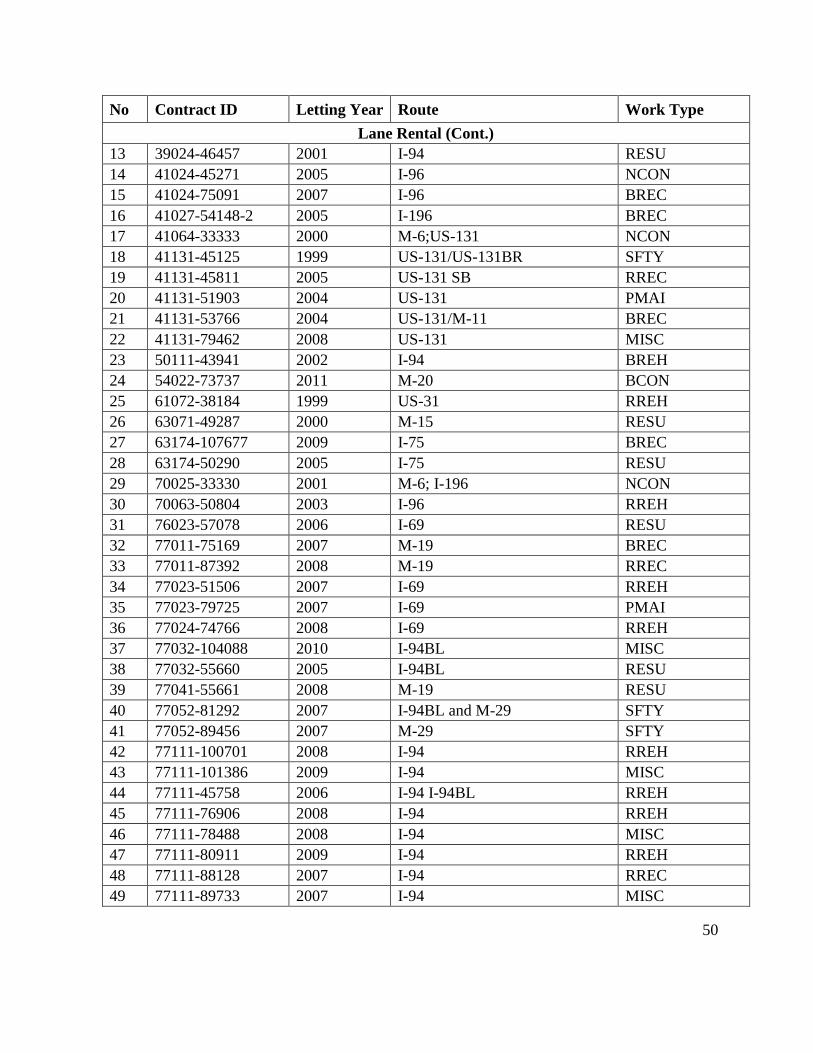
50
No Contract ID Letting Year Route Work Type
Lane Rental (Cont.)
13 39024-46457 2001 I-94 RESU
14 41024-45271 2005 I-96 NCON
15 41024-75091 2007 I-96 BREC
16 41027-54148-2 2005 I-196 BREC
17 41064-33333 2000 M-6;US-131 NCON
18 41131-45125 1999 US-131/US-131BR SFTY
19 41131-45811 2005 US-131 SB RREC
20 41131-51903 2004 US-131 PMAI
21 41131-53766 2004 US-131/M-11 BREC
22 41131-79462 2008 US-131 MISC
23 50111-43941 2002 I-94 BREH
24 54022-73737 2011 M-20 BCON
25 61072-38184 1999 US-31 RREH
26 63071-49287 2000 M-15 RESU
27 63174-107677 2009 I-75 BREC
28 63174-50290 2005 I-75 RESU
29 70025-33330 2001 M-6; I-196 NCON
30 70063-50804 2003 I-96 RREH
31 76023-57078 2006 I-69 RESU
32 77011-75169 2007 M-19 BREC
33 77011-87392 2008 M-19 RREC
34 77023-51506 2007 I-69 RREH
35 77023-79725 2007 I-69 PMAI
36 77024-74766 2008 I-69 RREH
37 77032-104088 2010 I-94BL MISC
38 77032-55660 2005 I-94BL RESU
39 77041-55661 2008 M-19 RESU
40 77052-81292 2007 I-94BL and M-29 SFTY
41 77052-89456 2007 M-29 SFTY
42 77111-100701 2008 I-94 RREH
43 77111-101386 2009 I-94 MISC
44 77111-45758 2006 I-94 I-94BL RREH
45 77111-76906 2008 I-94 RREH
46 77111-78488 2008 I-94 MISC
47 77111-80911 2009 I-94 RREH
48 77111-88128 2007 I-94 RREC
49 77111-89733 2007 I-94 MISC

51
No Contract ID Letting Year Route Work Type
Lane Rental (Cont.)
50 80024-53350 2006 I-94 RREH
51 81063-59277 2005 I-94 RREC
52 82022-34014 2003 I-94 BREC
53 82022-48345 2002 I-94 BREC
54 82023-51493-2 2004 I-94 BREC
55 82023-52802 2003 I-94 RESU
56 82024-48607 2002 I-94 RESU
57 82024-82589 2007 I-94 BREH
58 82025-46982 2000 I-94 RESU
59 82025-72419 2003 I-94 BREC
60 82052-45694 2003 US-24 RREH
61 82101-45707 2000 OLD M-14 RREH
62 82101-49401 2002 Old M-14 RREH
63 82112-48379 2000 M-10 BREC
64 82122-38079 2001 I-96/M-14/I-275 RREH
65 82123-53387 2000 I-96 BREC
66 82125-45752 1998 I-275/I-96 RREH
67 82191-45196 2000 I-75 BREH
68 82192-45702 2001 M-39 RREH
69 82192-52861 2000 M-39 BREH
70 82194-45699 2002 I-75 RREH
71 82195-53891 2000 I-75 TO I-375 RAMP RREH
72 82251-45183 2001 I-375 PMAI
73 82251-77658 2003 I-75/I-94 PMAI
74 63052-50291 2005 US 24 RREH
75 82024-43927 1999 I-94 BREC
76 25061-40906 1999 M-121 SFTY
Interim Completion
1 25032-60481 2007 I-75 RESU
2 38072-79005 2012 M-50/US-127 BREC
3 39405-83201 2008 I-94 RREH
4 41043-45783 1999 M-21 RESU
5 53555-46157 1999 RESU
6 54022-45832 2007 M-20 RREH
7 56044-60433 2008 US10 RESU
8 61153-45782 1999 US-31 BR RESU
9 62031-32352 1999 M-37 RESU

52
No Contract ID Letting Year Route Work Type
Interim Completion (Cont.)
10 65033-103442 2011 I-75 Boulevard RREH
11 84916-87518 2007 VARIES PMAI
12 38103-100001 2011 I-94 NCON
13 81406-56839 2005 RREH
14 81406-75300 2003 RESU
15 39405-56213 2004 SFTY
16 70081-48248 1999 M-104 SFTY

53
Appendix 2: List of MDOT Projects Built via Acceleration Techniques vs. Similar MDOT
Projects Constructed without Acceleration Techniques
No Type Contract I/D Lettin
g Material
Common
Route Contract I/D Letting
A+B Incentive/Disincentive
1 RREC 09034-46575-2 2001 I-75 25032-45899 2002
No Excuse Incentive/Disincentive
1 RREH 38111-43497 2001 US-127 No Match
2 SFTY 39405-76303 2005 No Match
Accepted for Traffic I/D
1 PMAI 41025-82763 2008 M-37 No Match
PMAI 41025-82763 2008 M-44 No Match
PMAI 41025-82763 2008 I-96 No Match
2 RREH 41027-51883 2009 I-196 70023-60422 2006
3 PMAI 41029-45086 2006 I-196 80013-60471 2006
4 SFTY 41051-90161 2008 Concrete M-37 No Match
5 RREC 41062-75080 2008 Concrete M-11 No Match
6 SFTY 63022-76051 2005 Concrete I-96 41025-72022 2003
47065-82603 2005
47065-53312 2001
7 RREH 63081-45715 2006 M-10 82112-45681 2006
82111-47085 2001
8 RREC 63101-54301 2006 I-696 No Match
9 RREH 82022-45684 2004 I-94 82022-34014 2003
63103-34121 1999
10 RESU 82053-58175 2006 US-24 82053-45692 2000
63052-47041 2002
11 RREH 82123-45199 2005 I-96 82122-45705 2003
82123-45199 2005
12 RREH 82123-52803 2005 I-96 82122-45705 2003
RESU 82123-52803 2005 I-96 41026-53377 20006
82122-45705 2003
13 SFTY 82194-110565 2012 I-75 No Match
14 RREC 82194-37795 2007 Concrete I-75 09034-46575-2 2001
25032-45899 2002
09034-84072 2008
73171-75246 2006
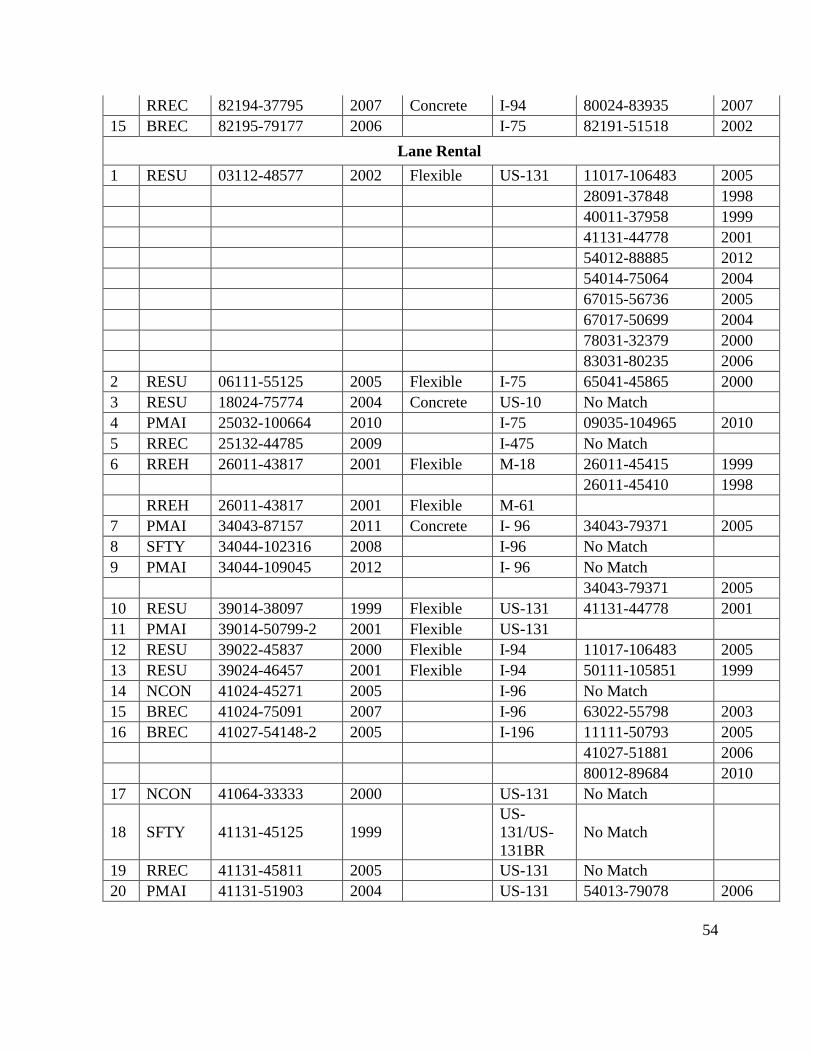
54
RREC 82194-37795 2007 Concrete I-94 80024-83935 2007
15 BREC 82195-79177 2006 I-75 82191-51518 2002
Lane Rental
1 RESU 03112-48577 2002 Flexible US-131 11017-106483 2005
28091-37848 1998
40011-37958 1999
41131-44778 2001
54012-88885 2012
54014-75064 2004
67015-56736 2005
67017-50699 2004
78031-32379 2000
83031-80235 2006
2 RESU 06111-55125 2005 Flexible I-75 65041-45865 2000
3 RESU 18024-75774 2004 Concrete US-10 No Match
4 PMAI 25032-100664 2010 I-75 09035-104965 2010
5 RREC 25132-44785 2009 I-475 No Match
6 RREH 26011-43817 2001 Flexible M-18 26011-45415 1999
26011-45410 1998
RREH 26011-43817 2001 Flexible M-61
7 PMAI 34043-87157 2011 Concrete I- 96 34043-79371 2005
8 SFTY 34044-102316 2008 I-96 No Match
9 PMAI 34044-109045 2012 I- 96 No Match
34043-79371 2005
10 RESU 39014-38097 1999 Flexible US-131 41131-44778 2001
11 PMAI 39014-50799-2 2001 Flexible US-131
12 RESU 39022-45837 2000 Flexible I-94 11017-106483 2005
13 RESU 39024-46457 2001 Flexible I-94 50111-105851 1999
14 NCON 41024-45271 2005 I-96 No Match
15 BREC 41024-75091 2007 I-96 63022-55798 2003
16 BREC 41027-54148-2 2005 I-196 11111-50793 2005
41027-51881 2006
80012-89684 2010
17 NCON 41064-33333 2000 US-131 No Match
18 SFTY 41131-45125 1999
US-
131/US-
131BR
No Match
19 RREC 41131-45811 2005 US-131 No Match
20 PMAI 41131-51903 2004 US-131 54013-79078 2006

55
21 BREC 41131-53766 2004 US-131 39014-81325 2003
41131-87156 2011
03112-47648 2000
US-131 39051-49430 2000
22 MISC 41131-79462 2008 US-131 No Match
23 BREH 50111-43941 2002 Flexible I-94 39041-90224 2003
24 BCON 54022-73737 2011 M-20 No Match
25 RREH 61072-38184 1999 US-31 11056-50757 2005
26 RESU 63071-49287 2000 Flexible M-15 25091-45841 1999
09071-33925 1998
79031-45850 2000
27 BREC 63174-107677 2009 I-75
28 RESU 63174-50290 2005 Flexible I-75 63173-51472 2003
29 NCON 70025-33330 2001 M-6; I-
196 No Match
30 RREH 70063-50804 2003 I-96 23152-45640 2001
82122-45705 2003
31 RESU 76023-57078 2006 Flexible I-69 No Match RESU
32 BREC 77011-75169 2007 M-19 77011-60338 2005
33 RREC 77011-87392 2008 M-19 No Match
34 RREH 77023-51506 2007 I-69 No Match
35 PMAI 77023-79725 2007 I-69 No Match
36 RREH 77024-74766 2008 Concrete I-69 12033-49921 2001
37 MISC 77032-104088 2010 Concrete I-94 No Match
38 RESU 77032-55660 2005 Flexible I-94
39 RESU 77041-55661 2008 Flexible M-19 50091-45731 2000
74031-45847 2000
40 SFTY 77052-81292 2007 I-94 No Match SFTY
41 SFTY 77052-89456 2007 M-29 No Match
42 RREH 77111-100701 2008 I-94 No Match
43 MISC 77111-101386 2009 I-94 No Match
44 RREH 77111-45758 2006 I-94 I-
94BL 82022-45686 2004
45 RREH 77111-76906 2008 I-94 82022-45686 2004
46 MISC 77111-78488 2008 I-94 No Match
47 RREH 77111-80911 2009 I-94 82022-45686 2004
48 RREC 77111-88128 2007 I-94 No Match
49 MISC 77111-89733 2007 I-94 No Match
50 RREH 80024-53350 2006 I-94 82022-45686 2004
51 RREC 81063-59277 2005 I-94 No Match

56
52 BREC 82022-34014 2003 I-94 77111-51508 2003
11015-50795
11015-50782 2004
53 BREC 82022-48345 2002 I-94 No Match
54 BREC 82023-51493-2 2004 I-94 No Match
55 RESU 82023-52802 2003 Flexible I-94 No Match
56 RESU 82024-48607 2002 Flexible I-94 11016-46460 2001
57 BREH 82024-82589 2007 I-94 11013-51197 2002
58 RESU 82025-46982 2000 I-94 13121-45999 2000
77032-47050 2001
81063-38034 1999
59 BREC 82025-72419 2003 I-94 77111-51508 2003
77111-51507 2003
11015-50782 2004
60 RREH 82052-45694 2003 Flexible US-24 No Match RREH
61 RREH 82101-45707 2000 OLD M-
14 No Match
62 RREH 82101-49401 2002 OLD M-
14 No Match
63 BREC 82112-48379 2000 M-10 82112-89273 2009
64 RREH 82122-38079 2001 I-96/M-
14/I-275 82122-45705 2003
65 BREC 82123-53387 2000 I-96 47064-78200 2008
66 RREH 82125-45752 1998 I-275/I-96 No Match
67 BREH 82191-45196 2000 I-75 No Match
68 RREH 82192-45702 2001 M-39 82193-76902 2004
69 BREH 82192-52861 2000 M-39 No Match
70 RREH 82194-45699 2002 I-75 82052-47061 2001
71 RREH 82195-53891 2000 I-375 No Match
72 PMAI 82251-45183 2001 I-375 No Match
73 PMAI 82251-77658 2003 I-75/I-94 No Match
74 RREH 63052-50291 2005 US 24 63031-45714 2000
82053-45693 2002
75 BREC 82024-43927 1999 I-94 77111-51508 2003
76 SFTY 25061-40906 1999 M-121 No Match
Interim completion
1 RESU 25032-60481 2007 Flexible I-75 09111-60467 2005

57
RESU I-75 49026-84211 2009
RESU I-75 20052-48557
RESU I-75 49025-45609 2003
RESU I-75 63173-51472 2003
RESU I-75 25031-45446 2000
2 BREC 38072-79005 2012 Flexible M-50/US-
127 2012
3 RREH 39405-83201 2008 Flexible I-94 50111-105851 2009
4 RESU 41043-45783 1999 Flexible M-21 41043-45786
RESU M-21 34061-60415 2004
RESU M-21 25081-48543 2004
RESU M-21 25081-73150 2003
5 RESU 53555-46157 1999 Flexible
6 RREH 54022-45832 2007 Flexible M-20 62015-53767 2003
RREH M-20 62015-56914 2004
RREH M-20 62015-60572 2005
7 RESU 56044-60433 2008 Concrete US10 56051-45789 1999
RESU US10 53022-45162 1998
RESU US10 67022-44987 2001
8 RESU 61153-45782 1999 Flexible US-31 BR 61151-45809 2002
RESU US-31 BR 15012-48535 2002
RESU US-31 BR 53034-45826 2000
RESU US-31 BR 10032-44113 1999
RESU US-31 BR 10032-45121 2000
RESU US-31 BR 64012-45805 2000
RESU US-31 BR 28012-45834 2001
RESU US-31 BR 61073-30127 2000
9 RESU 62031-32352 1999 Flexible M-37 62031-32342 2003
RESU M-37 62032-45802 2002
RESU M-37 13011-38086 2001
M-37 43012-79565 2006
10 RREH 65033-103442 2011 Flexible I-75
Boulevard 17034-53932-2 2001
11 PMAI 84916-87518 2007 Flexible I-94
12 NCON 38103-100001 2011 I-94
13 RREH 81406-56839 2005
14 RESU 81406-75300 2003
15 SFTY 39405-56213 2004
16 SFTY 70081-48248 1999 Flexible M-104

58
Appendix 3: Original Time Performance Index
Incentive Type Incentive
Contract I/D OTPI Non-Incentive
Contract I/D OTPI
Accepted for Traffic 41027-51883 0.00% 70023-60422 80.73%
Accepted for Traffic 41029-45086 38.28% 80013-60471 57.95%
Accepted for Traffic 63022-76051 0.00% 47065-82603 -2.56%
Accepted for Traffic 63081-45715 -3.72% 82112-45681 241.40%
Accepted for Traffic 82123-45199 126.90% 82123-45199 126.90%
Accepted for Traffic 82123-52803 75.17% 41026-53377 108.49%
Accepted for Traffic 82194-37795 2.23% 09034-84072 159.28%
Lane Rental 34043-87157 152.55% 34043-79371 -15.00%
Lane Rental 34044-109045 0.00% 34043-79371 -15.00%
Lane Rental 41027-54148-2 97.80% 11111-50793 -0.49%
Lane Rental 41131-51903 165.28% 54013-79078 4.41%
Lane Rental 41131-53766 -22.27% 39014-81325 -30.38%
Lane Rental 77011-75169 -14.74% 77011-60338 14.06%
Interim Completion 25032-60481 14.43% 09111-60467 -41.61%

59
Appendix 4: Present Time Performance Index
Incentive Type Incentive
Contract I/D PTPI
Non-Incentive
Contract I/D PTPI
A+B Incentive/
Distinctive 09034-46575-2 -71.57% 25032-45899 2.59%
Accepted for Traffic 41027-51883 0.00% 70023-60422 74.34%
Accepted for Traffic 41029-45086 -52.67% 80013-60471 0.00%
Accepted for Traffic 41062-75080 0.00% 41063-74453-2 0.00%
Accepted for Traffic 63022-76051 0.00% 47065-82603 0.00%
Accepted for Traffic 63081-45715 0.00% 82112-45681 -0.10%
Accepted for Traffic 82022-45684 -59.05% 82022-34014 0.00%
Accepted for Traffic 82053-58175 0.00% 82053-45692 -62.20%
Accepted for Traffic 82123-45199 0.00% 82123-45199 0.00%
Accepted for Traffic 82123-52803 0.00% 41026-53377 0.00%
Accepted for Traffic 82194-37795 0.00% 09034-84072 -35.91%
Accepted for Traffic 82195-79177 -4.76% 82191-51518 0.65%
Lane Rental 03112-48577 -65.87% 28091-37848 17.57%
Lane Rental 06111-55125 -32.55% 65041-45865 -61.95%
Lane Rental 34043-87157 0.00% 34043-79371 -15.00%
Lane Rental 34044-109045 0.00% 34043-79371 -15.00%
Lane Rental 41024-75091 0.00% 63022-55798 0.00%
Lane Rental 41027-54148-2 -2.44% 11111-50793 -3.82%
Lane Rental 41131-51903 0.00% 54013-79078 0.00%
Lane Rental 50111-43941 210.18% 39041-90224 0.00%
Lane Rental 61072-38184 0.00% 11056-50757 -61.75%
Lane Rental 63071-49287 5.53% 25091-45841 1.67%
Lane Rental 63174-50290 0.00% 63173-51472 -35.31%
Lane Rental 70063-50804 961.40% 23152-45640 -11.45%
Lane Rental 77011-75169 0.00% 77011-60338 0.00%
Lane Rental 77024-74766 -43.32% 12033-49921 0.00%
Lane Rental 77111-45758 -42.97% 82022-45686 0.00%
Lane Rental 77111-76906 0.00% 82022-45686 0.00%
Lane Rental 80024-53350 -40.38% 82022-45686 0.00%
Lane Rental 82022-34014 0.00% 11015-50782 -22.47%
Lane Rental 82024-48607 20.54% 11016-46460 -44.59%
Lane Rental 82024-82589 -26.80% 11013-51197 -45.92%
Lane Rental 82025-72419 0.00% 11015-50782 -22.47%
Lane Rental 63052-50291 84.30% 63031-45714 0.53%
Lane Rental 82024-43927 -4.67% 77111-51508 1.27%

60
Interim Completion 25032-60481 0.00% 09111-60467 0.00%
Interim Completion 39405-83201 -77.24% 50111-105851 0.00%
Interim Completion 54022-45832 -3.79% 62015-60572 -52.95%
Interim Completion 56044-60433 -43.67% 56051-45789 -3.33%
Interim Completion 61153-45782 0.00% 61151-45809 0.00%
Interim Completion 62031-32352 0.00% 62031-32342 0.00%

61
Appendix 5: Present Time Performance Index for Incentive Projects and the Paid Incentives
Incentive Type Incentive Contract
I/D PTPI
Letting
Year Route Type
Authorized
Contract Amount Incentive Incentive %
A+B Incentive/
Distinctive 09034-46575-2 -71.57% 2001 I-75 RREC $19,351,482 $150,000 0.78%
Accepted for Traffic 82022-45684 -59.05% 2004 I-94 RREH $81,768,474 $4,000,000 4.89%
Accepted for Traffic 41029-45086 -52.67% 2006 I-196 PMAI $1,631,086 $200,000 12.26%
Accepted for Traffic 82195-79177 -4.76% 2006 I-75 BREC $4,331,253 $75,000 1.73%
Accepted for Traffic 41027-51883 0.00% 2009 I-196 RREH $31,878,804 $700,000 2.20%
Accepted for Traffic 41062-75080 0.00% 2008 M11 RREC $2,895,502 $130,000 4.49%
Accepted for Traffic 63022-76051 0.00% 2005 I-96 SFTY $709,340 $50,000 7.05%
Accepted for Traffic 63081-45715 0.00% 2006 M-10 RREH $27,956,395 $2,400,000 8.58%
Accepted for Traffic 82053-58175 0.00% 2006 US-24 RESU $16,099,727 $200,000 1.24%
Accepted for Traffic 82123-45199 0.00% 2005 I-96 RREH $28,652,579 $500,000 1.75%
Accepted for Traffic 82123-52803 0.00% 2005 I-96 RREH $82,532,946 $600,000 0.73%
Accepted for Traffic 82194-37795 0.00% 2007 Multiple RREC $173,764,968 $3,675,000 2.11%
Interim Completion 39405-83201 -77.24% 2008 I-94 RREH $2,868,784 $100,000 3.49%
Interim Completion 56044-60433 -43.67% 2008 US10 RESU $32,129,641 ($41,132) -0.13%
Interim Completion 54022-45832 -3.79% 2007 M-20 RREH $4,699,233 $20,000 0.43%
Interim Completion 25032-60481 0.00% 2007 I-75 RESU $8,345,520 $45,000 0.54%
Interim Completion 61153-45782 0.00% 1999 US-31
BR RESU $1,921,195 ($5,200) -0.27%

62
Interim Completion 62031-32352 0.00% 1999 M-37 RESU $1,790,570 ($62,000) -3.46%
Lane Rental 03112-48577 -65.87% 2002 US-131 RESU $6,071,832 ($12) 0.00%
Lane Rental 77024-74766 -43.32% 2008 I-69 RREH $35,348,348 $260,222 0.74%
Lane Rental 77111-45758 -42.97% 2006 I-94BL RREH $25,906,027 $50,000 0.19%
Lane Rental 80024-53350 -40.38% 2006 I-94 RREH $16,173,424 $349,495 2.16%
Lane Rental 06111-55125 -32.55% 2005 I-75 RESU $32,615,930 $200,000 0.61%
Lane Rental 82024-82589 -26.80% 2007 I-94 BREH $7,755,114 $400,000 5.16%
Lane Rental 82024-43927 -4.67% 1999 I-94 BREC $57,620,339 $765,000 1.33%
Lane Rental 41027-54148-2 -2.44% 2005 I-196 BREC $3,443,756 ($279,200) -8.11%
Lane Rental 34043-87157 0.00% 2011 I-96 PMAI $1,064,896 $15,750 1.48%
Lane Rental 34044-109045 0.00% 2012 I-96 PMAI $2,685,484 $50,000 1.86%
Lane Rental 41024-75091 0.00% 2007 I-96 BREC $2,409,374 $97,675 4.05%
Lane Rental 41131-51903 0.00% 2004 US-131 PMAI $4,178,770 $300,000 7.18%
Lane Rental 61072-38184 0.00% 1999 US-31 RREH $12,847,099 $0 0.00%
Lane Rental 63174-50290 0.00% 2005 I-75 RESU $8,860,899 $333,500 3.76%
Lane Rental 77011-75169 0.00% 2007 M-19 BREC $755,423 ($6,420) -0.85%
Lane Rental 77111-76906 0.00% 2008 I-94 RREH $25,388,933 ($946,920) -3.73%
Lane Rental 82022-34014 0.00% 2003 I-94 BREC $14,490,204 $200,000 1.38%
Lane Rental 82025-72419 0.00% 2003 I-94 BREC $4,006,695 $97,250 2.43%
Lane Rental 63071-49287 5.53% 2000 M-15 RESU $5,545,924 $315,778 5.69%
Lane Rental 82024-48607 20.54% 2002 I-94 RESU $20,611,173 $1,311,000 6.36%
Lane Rental 63052-50291 84.30% 2005 US 24 RREH $13,788,041 $500,000 3.63%

63
Appendix 6: Cost Performance Index
Incentive Type Incentive
Contract I/D CPI
Non-Incentive
Contract I/D CPI
A+B Incentive/
Distinctive 09034-46575-2 -4.89% 25032-45899 19.31%
Accepted for Traffic 41027-51883 1.62% 70023-60422 -5.36%
Accepted for Traffic 41029-45086 3.52% 80013-60471 0.83%
Accepted for Traffic 41062-75080 4.18% 41063-74453-2 -3.41%
Accepted for Traffic 63022-76051 -2.84% 41025-72022 -7.19%
Accepted for Traffic 63081-45715 6.06% 82112-45681 0.77%
Accepted for Traffic 82022-45684 8.10% 82022-34014 3.27%
Accepted for Traffic 82053-58175 9.51% 82053-45692 -3.40%
Accepted for Traffic 82123-45199 10.49% 82122-45705 16.36%
Accepted for Traffic 82123-52803 2.49% 82122-45705 16.36%
Accepted for Traffic 82194-37795 3.11% 25032-45899 19.31%
Accepted for Traffic 82195-79177 15.18% 82191-51518 0.02%
Lane Rental 03112-48577 -4.45% 41131-44778 5.92%
Lane Rental 06111-55125 12.12% 65041-45865 -6.32%
Lane Rental 25032-100664 -0.18% 09035-104965 8.29%
Lane Rental 26011-43817 -1.59% 26011-45415 36.68%
Lane Rental 34043-87157 -4.32% 34043-79371 -4.37%
Lane Rental 39014-38097 -2.52% 41131-44778 5.92%
Lane Rental 39022-45837 -9.62% 11017-106483 -1.71%
Lane Rental 39024-46457 -10.41% 50111-105851 -3.55%
Lane Rental 41024-75091 0.95% 63022-55798 0.89%
Lane Rental 41027-54148-2 -13.08% 11111-50793 0.84%
Lane Rental 41131-51903 -4.81% 54013-79078 12.94%
Lane Rental 41131-53766 4.21% 39014-81325 9.28%
Lane Rental 50111-43941 -4.71% 39041-90224 -5.32%
Lane Rental 61072-38184 -5.92% 11056-50757 6.22%
Lane Rental 63071-49287 -18.14% 25091-45841 -8.33%
Lane Rental 63174-50290 -21.18% 63173-51472 3.38%
Lane Rental 70063-50804 0.95% 23152-45640 6.24%
Lane Rental 77011-75169 -0.13% 77011-60338 4.82%
Lane Rental 77024-74766 -1.65% 12033-49921 -1.69%
Lane Rental 77041-55661 5.08% 50091-45731 -3.18%
Lane Rental 77111-45758 -0.90% 82022-45686 17.80%

64
Lane Rental 77111-76906 -5.90% 82022-45686 17.80%
Lane Rental 77111-80911 -0.20% 82022-45686 17.80%
Lane Rental 80024-53350 2.47% 82022-45686 17.80%
Lane Rental 82022-34014 3.27% 11015-50795 4.77%
Lane Rental 82024-48607 -8.67% 11016-46460 1.80%
Lane Rental 82024-82589 -4.85% 11013-51197 12.77%
Lane Rental 82025-46982 -0.64% 13121-45999 9.80%
Lane Rental 82025-72419 2.98% 77111-51507 3.70%
Lane Rental 82122-38079 3.07% 82122-45705 16.36%
Lane Rental 82123-53387 2.60% 47064-78200 -2.87%
Lane Rental 82192-45702 1.21% 82193-76902 4.82%
Lane Rental 82194-45699 2.16% 82052-47061 -17.78%
Interim Completion 25032-60481 -2.01% 63173-51472 3.38%
Interim Completion 39405-83201 1.17% 50111-105851 -3.55%
Interim Completion 41043-45783 -3.67% 41043-45786 -9.36%
Interim Completion 54022-45832 21.84% 62015-60572 -1.89%
Interim Completion 56044-60433 6.31% 67022-44987 -2.22%
Interim Completion 61153-45782 -1.99% 15012-48535 2.85%
Interim Completion 62031-32352 -11.10% 62031-32342 -3.80%
Interim Completion 65033-103442 0.77% 17034-53932-2 -2.39%

65
Appendix 7: Cost Performance Index for Incentive Projects and the Paid Incentives
Incentive Type Incentive
Contract I/D CPI
Letting
Year Route Type
Authorized
Contract
Amount
Incentive Incentive
%
A+B Incentive/
Distinctive
09034-
46575-2 -4.89% 2001 I-75 RREC $19,351,482 $150,000 0.78%
Accepted for Traffic 41027-51883 1.62% 2009 I-196 RREH $31,878,804 $700,000 2.20%
Accepted for Traffic 41029-45086 3.52% 2006 I-196 PMAI $1,631,086 $200,000 12.26%
Accepted for Traffic 41062-75080 4.18% 2008 M11 RREC $2,895,502 $130,000 4.49%
Accepted for Traffic 63022-76051 -2.84% 2005 I-96 SFTY $709,340 $50,000 7.05%
Accepted for Traffic 63081-45715 6.06% 2006 M-10 RREH $27,956,395 $2,400,000 8.58%
Accepted for Traffic 82022-45684 8.10% 2004 I-94 RREH $81,768,474 $4,000,000 4.89%
Accepted for Traffic 82053-58175 9.51% 2006 US-24 RESU $16,099,727 $200,000 1.24%
Accepted for Traffic 82123-45199 10.49% 2005 I-96 RREH $28,652,579 $500,000 1.75%
Accepted for Traffic 82123-52803 2.49% 2005 I-96 RREH $82,532,946 $600,000 0.73%
Accepted for Traffic 82194-37795 3.11% 2007 Multiple RREC $173,764,968 $3,675,000 2.11%
Accepted for Traffic 82195-79177 15.18% 2006 I-75 BREC $4,331,253 $75,000 1.73%
Interim Completion 25032-60481 -2.01% 2007 I-75 RESU $8,345,520 $45,000 0.54%
Interim Completion 39405-83201 1.17% 2008 I-94 RREH $2,868,784 $100,000 3.49%
Interim Completion 41043-45783 -3.67% 1999 M-21 RESU $4,937,849 $950 0.02%
Interim Completion 54022-45832 21.84% 2007 M-20 RREH $4,699,233 $20,000 0.43%
Interim Completion 56044-60433 6.31% 2008 US10 RESU $32,129,641 ($41,132) -0.13%
Interim Completion 61153-45782 -1.99% 2007 M-20 RREH $4,699,233 $20,000 0.43%

66
Interim Completion 62031-32352 -11.10% 1999 M-37 RESU $1,790,570 ($62,000) -3.46%
Interim Completion 65033-
103442 0.77% 2011
I-75
Boulevard RREH $7,224,670 $100,000 1.38%
Lane Rental 03112-48577 -4.45% 2002 US-131 RESU $6,071,832 ($12) 0.00%
Lane Rental 06111-55125 12.12% 2005 I-75 RESU $32,615,930 $200,000 0.61%
Lane Rental 25032-
100664 -0.18% 2010 I-75 PMAI $10,714,471 $38,155 0.36%
Lane Rental 26011-43817 -1.59% 2001 M18/M61 RREH $4,475,341 $450,000 10.06%
Lane Rental 34043-87157 -4.32% 2011 I-96 PMAI $1,064,896 $15,750 1.48%
Lane Rental 39014-38097 -2.52% 1999 US-131 RESU $5,429,208 ($4,000) -0.07%
Lane Rental 39022-45837 -9.62% 2000 I-94 RESU $4,266,756 ($32,000) -0.75%
Lane Rental 39024-46457 -10.41% 2001 I-94 RESU $3,939,016 $220,800 5.61%
Lane Rental 41024-75091 0.95% 2007 I-96 BREC $2,409,374 $97,675 4.05%
Lane Rental 41027-
54148-2 -13.08% 2005 I-196 BREC $3,443,756 ($279,200) -8.11%
Lane Rental 41131-51903 -4.81% 2004 US-131 PMAI $4,178,770 $300,000 7.18%
Lane Rental 41131-53766 4.21% 2004 US-131/M-11 BREC $6,195,691 $50,000 0.81%
Lane Rental 50111-43941 -4.71% 2002 I-94 BREH $43,806,921 $300,000 0.68%
Lane Rental 61072-38184 -5.92% 1999 US-31 RREH $12,847,099 $0 0.00%
Lane Rental 63071-49287 -18.14% 2005 US 24 RREH $13,788,041 $500,000 3.63%
Lane Rental 63174-50290 -21.18% 2000 M-15 RESU $5,545,924 $315,778 5.69%
Lane Rental 70063-50804 0.95% 2003 I-96 RREH $19,739,241 $63,000 0.32%
Lane Rental 77011-75169 -0.13% 2007 M-19 BREC $755,423 ($6,420) -0.85%
Lane Rental 77024-74766 -1.65% 2008 I-69 RREH $35,348,348 $260,222 0.74%
Lane Rental 77041-55661 5.08% 2008 M-19 RESU $9,526,207 $100,000 1.05%

67
Lane Rental 77111-45758 -0.90% 2006 I-94BL RREH $25,906,027 $50,000 0.19%
Lane Rental 77111-76906 -5.90% 2008 I-94 RREH $25,388,933 ($946,920) -3.73%
Lane Rental 77111-80911 -0.20% 2009 I-94 RREH $23,036,598 $399,318 1.73%
Lane Rental 80024-53350 2.47% 2006 I-94 RREH $16,173,424 $349,495 2.16%
Lane Rental 82022-34014 3.27% 2003 I-94 BREC $14,490,204 $200,000 1.38%
Lane Rental 82024-48607 -8.67% 2002 I-94 RESU $20,611,173 $1,311,000 6.36%
Lane Rental 82024-82589 -4.85% 2007 I-94 BREH $7,755,114 $400,000 5.16%
Lane Rental 82025-46982 -0.64% 2000 I-94 RESU $40,672,181 $3,287,500 8.08%
Lane Rental 82025-72419 2.98% 2003 I-94 BREC $4,006,695 $97,250 2.43%
Lane Rental 82122-38079 3.07% 2001 I-96/M-14/I-
275 RREH $46,094,595 $81,200 0.18%
Lane Rental 82123-53387 2.60% 2000 I-96 BREC $2,048,601 $70,000 3.42%
Lane Rental 82192-45702 1.21% 2001 M-39 RREH $32,041,475 $21,000 0.07%
Lane Rental 82194-45699 2.16% 2002 I-75 RREH $84,340,400 $50,250 0.06%
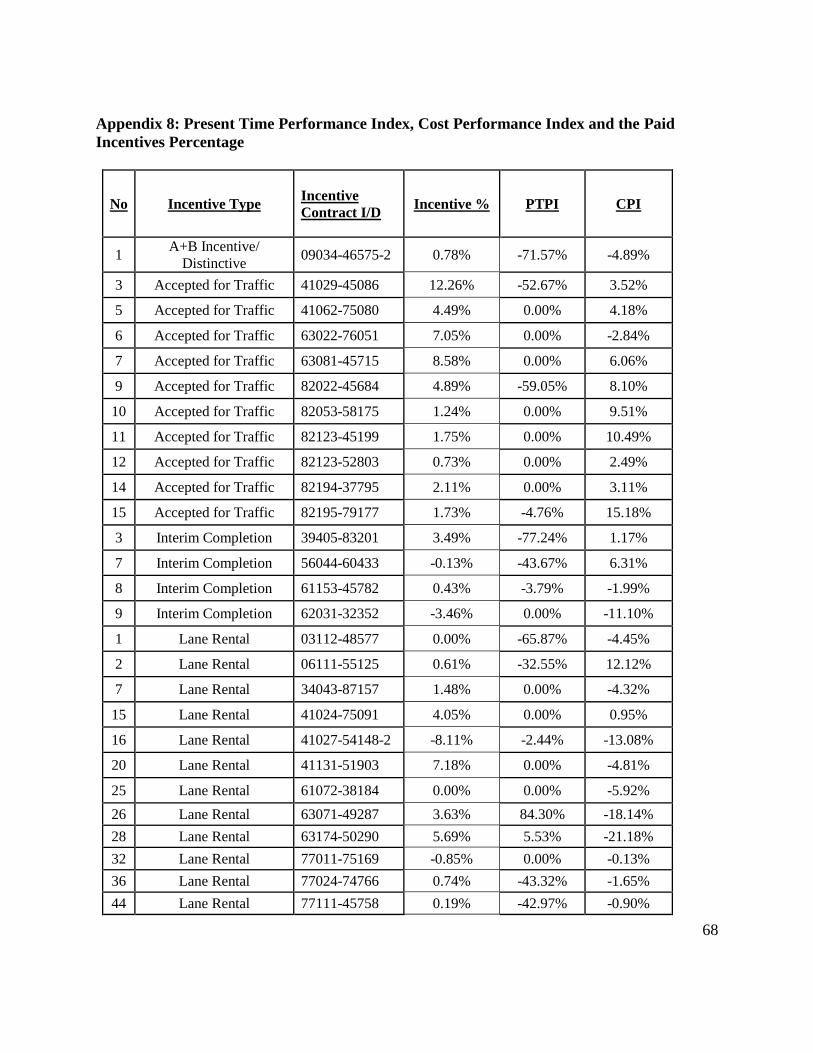
68
Appendix 8: Present Time Performance Index, Cost Performance Index and the Paid
Incentives Percentage
No Incentive Type Incentive
Contract I/D Incentive % PTPI CPI
1 A+B Incentive/
Distinctive 09034-46575-2 0.78% -71.57% -4.89%
3 Accepted for Traffic 41029-45086 12.26% -52.67% 3.52%
5 Accepted for Traffic 41062-75080 4.49% 0.00% 4.18%
6 Accepted for Traffic 63022-76051 7.05% 0.00% -2.84%
7 Accepted for Traffic 63081-45715 8.58% 0.00% 6.06%
9 Accepted for Traffic 82022-45684 4.89% -59.05% 8.10%
10 Accepted for Traffic 82053-58175 1.24% 0.00% 9.51%
11 Accepted for Traffic 82123-45199 1.75% 0.00% 10.49%
12 Accepted for Traffic 82123-52803 0.73% 0.00% 2.49%
14 Accepted for Traffic 82194-37795 2.11% 0.00% 3.11%
15 Accepted for Traffic 82195-79177 1.73% -4.76% 15.18%
3 Interim Completion 39405-83201 3.49% -77.24% 1.17%
7 Interim Completion 56044-60433 -0.13% -43.67% 6.31%
8 Interim Completion 61153-45782 0.43% -3.79% -1.99%
9 Interim Completion 62031-32352 -3.46% 0.00% -11.10%
1 Lane Rental 03112-48577 0.00% -65.87% -4.45%
2 Lane Rental 06111-55125 0.61% -32.55% 12.12%
7 Lane Rental 34043-87157 1.48% 0.00% -4.32%
15 Lane Rental 41024-75091 4.05% 0.00% 0.95%
16 Lane Rental 41027-54148-2 -8.11% -2.44% -13.08%
20 Lane Rental 41131-51903 7.18% 0.00% -4.81%
25 Lane Rental 61072-38184 0.00% 0.00% -5.92%
26 Lane Rental 63071-49287 3.63% 84.30% -18.14%
28 Lane Rental 63174-50290 5.69% 5.53% -21.18%
32 Lane Rental 77011-75169 -0.85% 0.00% -0.13%
36 Lane Rental 77024-74766 0.74% -43.32% -1.65%
44 Lane Rental 77111-45758 0.19% -42.97% -0.90%

69
45 Lane Rental 77111-76906 -3.73% 0.00% -5.90%
50 Lane Rental 80024-53350 2.16% -40.38% 2.47%
52 Lane Rental 82022-34014 1.38% 0.00% 3.27%
56 Lane Rental 82024-48607 6.36% 20.54% -8.67%
57 Lane Rental 82024-82589 5.16% -26.80% -4.85%
59 Lane Rental 82025-72419 2.43% 0.00% 2.98%
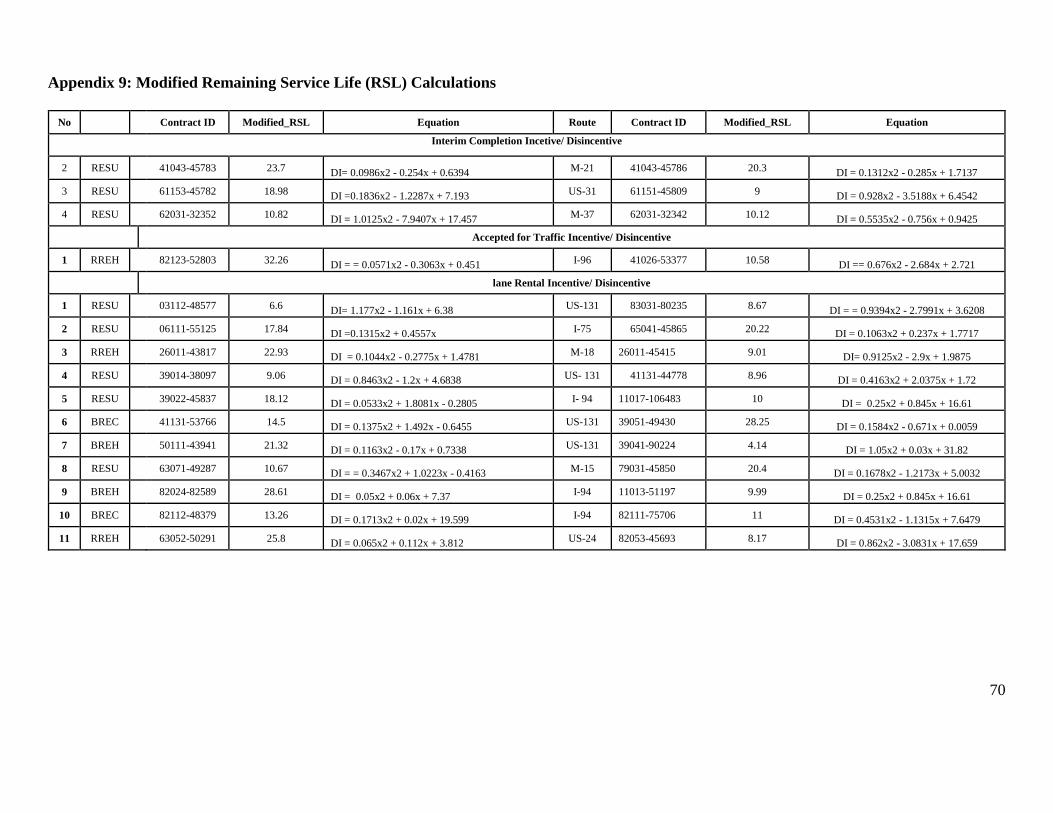
70
Appendix 9: Modified Remaining Service Life (RSL) Calculations
No
Contract ID Modified_RSL Equation Route Contract ID Modified_RSL Equation
Interim Completion Incetive/ Disincentive
2 RESU
41043-45783 23.7 DI= 0.0986x2 - 0.254x + 0.6394 M-21 41043-45786 20.3 DI = 0.1312x2 - 0.285x + 1.7137
3 RESU
61153-45782 18.98 DI =0.1836x2 - 1.2287x + 7.193 US-31 61151-45809 9 DI = 0.928x2 - 3.5188x + 6.4542
4 RESU 62031-32352 10.82 DI = 1.0125x2 - 7.9407x + 17.457
M-37 62031-32342 10.12 DI = 0.5535x2 - 0.756x + 0.9425
Accepted for Traffic Incentive/ Disincentive
1 RREH
82123-52803 32.26 DI = = 0.0571x2 - 0.3063x + 0.451 I-96 41026-53377 10.58 DI == 0.676x2 - 2.684x + 2.721
lane Rental Incentive/ Disincentive
1 RESU 03112-48577 6.6 DI= 1.177x2 - 1.161x + 6.38
US-131 83031-80235 8.67 DI = = 0.9394x2 - 2.7991x + 3.6208
2 RESU 06111-55125 17.84 DI =0.1315x2 + 0.4557x I-75 65041-45865 20.22 DI = 0.1063x2 + 0.237x + 1.7717
3 RREH
26011-43817 22.93 DI = 0.1044x2 - 0.2775x + 1.4781 M-18 26011-45415 9.01 DI= 0.9125x2 - 2.9x + 1.9875
4 RESU
39014-38097 9.06 DI = 0.8463x2 - 1.2x + 4.6838 US- 131 41131-44778 8.96 DI = 0.4163x2 + 2.0375x + 1.72
5 RESU
39022-45837 18.12 DI = 0.0533x2 + 1.8081x - 0.2805 I- 94 11017-106483 10 DI = 0.25x2 + 0.845x + 16.61
6 BREC 41131-53766 14.5 DI = 0.1375x2 + 1.492x - 0.6455
US-131 39051-49430 28.25 DI = 0.1584x2 - 0.671x + 0.0059
7 BREH 50111-43941 21.32 DI = 0.1163x2 - 0.17x + 0.7338
US-131 39041-90224 4.14 DI = 1.05x2 + 0.03x + 31.82
8 RESU 63071-49287 10.67 DI = = 0.3467x2 + 1.0223x - 0.4163 M-15 79031-45850 20.4 DI = 0.1678x2 - 1.2173x + 5.0032
9 BREH
82024-82589 28.61 DI = 0.05x2 + 0.06x + 7.37 I-94 11013-51197 9.99 DI = 0.25x2 + 0.845x + 16.61
10 BREC
82112-48379 13.26 DI = 0.1713x2 + 0.02x + 19.599 I-94 82111-75706 11 DI = 0.4531x2 - 1.1315x + 7.6479
11 RREH
63052-50291 25.8 DI = 0.065x2 + 0.112x + 3.812 US-24 82053-45693 8.17 DI = 0.862x2 - 3.0831x + 17.659