race and homelessness - destination: home
TRANSCRIPT

IN SANTA CLARA COUNTY, CALIFORNIAJANUARY 2020
This project is a collaboration between
&
with generous support from
SPARC
RACE AND HOMELESSNESS

2 | Race and Homelessness in Santa Clara County, California
ACKNOWLEDGEMENTSThis report is part of a year-long initiative on racial equity and homelessness in Santa Clara County, California. The initiative is a partnership between Destination: Home, a public-private partnership dedicated to ending homelessness in Santa Clara County, and SPARC (Supporting Partnerships for Anti-Racist Communities, a national initiative examining structural racism and homelessness. SPARC is a project of Boston-based C4 Innovations.
This report was authored by the SPARC Team: Jeff Olivet, Regina Cannon, Caty Wilkey, and Nastacia’ Moore and made possible through the financial support and thought leadership of Cisco, as part ofits larger efforts to address homelessness in Santa Clara County.
Acknowledgements

Race and Homelessness in Santa Clara County, California | 1
This report is about helping our community improve and expand services for homeless men, women and children who are disproportionately people of color. Homelessness is an extreme manifestation of poverty. Along the continuum of safety-net services, our supportive housing system is at the end of the line. This report is about making sure that supportive housing services do not exacerbate or perpetuate the racial and social disparities in our community.
This report is also a lens through which we begin to perceive our circumstances more clearly. In a March 2018 report, SPARC (Supporting Partnerships for Anti-Racist Communities), wrote: “People of color are dramatically more likely than White people to experience homelessness in the United States. This is no accident; it is the result of centuries of structural racism that have excluded historically oppressed people—particularly Black and Native Americans—from equal access to housing, community supports, and oppor-tunities for economic mobility.” To an extent, homelessness is the result of policy choices we’ve made.
We asked SPARC to help bring a racial equity lens to the valiant and amazing work that so many social workers, property managers, volunteers, doctors, nurses, and public servants are performing each day. From this effort, two things have become apparent. One, homelessness in Santa Clara County is character-ized by many of the same racial and ethnic disparities seen in communities across the country. And two, we are only beginning to scratch the surface when it comes to understanding and addressing the underlying causes that are pushing individuals and families – especially people of color – into homelessness. We hope this report serves as a jumping off point for the challenging, yet vital, work to eliminate these disparities in our community. By acknowledging the negative consequences of some of our policies, choic-es, and attitudes, and by embracing the core values and strategies outlined in this report, we can begin to undo the negative and detrimental impacts of decades of systemic racism for our most vulnerable neighbors.
Sincerely,
INTRODUCTION
Pastor Paul Bains, Project WeHOPE / Dignity on Wheels
Poncho Guevara, Sacred Heart Community Services
Consuelo Hernandez, County of Santa Clara, Office of Supportive Housing
Jennifer Kelleher,Law Foundation of Silicon Valley
Anthony King, Lived Experience Advisory Board
Dontae Lartigue, Lived Experience Advisory Board
Camille Llanes-Fontanilla, SOMOS Mayfair
Jennifer Loving, Destination: Home
Miguel Márquez, County of Santa Clara, Office of the County Executive
Jacky Morales-Ferrand, City of San Jose, Department of Housing
Kelly Petrich,Cisco
Nicole Taylor, Silicon Valley Community Foundation
Introduction

2 | Race and Homelessness in Santa Clara County, California
TABLE OF CONTENTS
Executive Summary 3
Approach 5
Race and Homelessness in Santa Clara County 8
Theme 1: Disproportionately high rates of 9 homelessness among specific racial/ethnic groups
Theme 2: Racial/ethnic variation in experiences of 11 homelessness
Theme 3: Structural barriers, including lack of 14 affordable housing and economic opportunity
Underlying Values 15
Next Steps: Strategies to Address Racial Inequity 16
Conclusion 17
Table of Contents

Race and Homelessness in Santa Clara County, California | 3
People of color are dramatically more likely than their white counterparts to become homeless in the United States. Recent national research has shown that such racial disproportionality is not limited to any partic-ular geographical area or region of the country, but instead that patterns of racial disproportionality play out in community after community across the country.1 Further, this is not simply an issue of poverty: people of color experience homelessness at rates significantly higher than the proportion of those living in poverty.2 Indeed, the legacy of historical and contemporary structural racism is at the root of who becomes home-less.
Against this backdrop, Destination: Home partnered with the national SPARC Initiative (Supporting Partner-ships for Anti-Racist Communities) to examine the link between racial inequity and homelessness in Santa Clara County.
Launched in February 2019, the initiative involves:
• Establishment of a Racial Equity Advisory Group to guide the process
• Assessment of the current state of race and homelessness in Santa Clara County through quantitative and qualitative approaches, includ-ing Homeless Management Information System (HMIS) and Annual Homelessness Assessment Report (AHAR) data; listening sessions with peo-ple of color experiencing homelessness; and stakeholder interviews
• Work with Destination: Home’s Lived Experience Advisory Board to center racial equity
• Racial equity training for homeless service provid-ers and city/county government staff
• Action planning to implement racial equity strategies within the Community Plan to End Homelessness
This report presents an assessment of the intersection of race and homelessness in Santa Clara County and offers recommendations for next steps. Three major themes emerged:
1. Disproportionately high rates of homelessness among specific racial and ethnic groups
2. Racial/ethnic variation in experiences of home-lessnes
3. Structural barriers, including lack of affordable housing and economic opportunity
Specific findings in each of these three areas create a preliminary understanding of the state of race and homelessness in the county.
DisproportionalityOverall, Santa Clara County is generally similar to other communities across the U.S., with high rates of homelessness among people of color:
• Black/African Americans are disproportionately represented in the homeless population (16.9%) compared to their numbers in the general popu-lation (2.5%). This ratio is significantly higher than other communities in which SPARC has conduct-ed research.
• Similarly, American Indian/Native Alaskans expe-rience homelessness in Santa Clara County at a ratio of 7:1 compared to their general population numbers (7.4% of homeless population com-pared to <1% of general population).
• Unique to Santa Clara County, people who identify as Hispanic/Latinx comprise 43.7% of the homeless (HMIS) population, compared to 27% of the general population; 65% of families presenting to the Coordinated Entry System are Hispanic/Latinx.
EXECUTIVE SUMMARY
Executive Summary
1 Olivet, J., Dones, M., Richard, M., Wilkey, C., Yampolskaya, S., Beit-Arie, M. and Joseph, L. (2018). Supporting Partnerships for Anti-Racist Communities: Phase One Findings. Center for Social Innovation.2 Carter, G. (2011). From Exclusion to Destitution: Race, Affordable Housing, and Homelessness. Cityscape: A Journal of Policy Development and Research • Volume 13, Number 1

4 | Race and Homelessness in Santa Clara County, California
• Non-Hispanic people and those who identify as Asian/Asian American are both significantly un-derrepresented in the homeless population.
Racial/ethnic variation in experiences of homelessness Our analysis found racial and ethnic disparities for some (but not all) HMIS data sets related to a person’s homelessness experiences.
• Prior homeless experiences are generally propor-tionate by race and ethnicity to the HMIS popu-lation.
• Race is a statistically significant predictor of exit-ing into homelessness for American Indian/Alas-ka Native, who were 35% more likely to exit into homelessness.
• When assessed for vulnerability and housing need, a higher percentage of Non-Hispanic/Latinx families (45.7%) are assessed as needing Permanent Supportive Housing than Hispanic/Latinx families (39%).
Structural barriersStakeholders across the community cited systemic and structural inequities as a significant driver of housing insecurity and poverty in people of color.
• While housing affordability is an issue that affects people of all racial and ethnic background, peo-ple of color may be most severely impacted.
• The persistent wealth gap and lack of economic opportunity put communities of color at risk of homelessness.
• Disproportionately high rates of homelessness among people of color in the county mirror dis-proportionality in other safety net systems.
In addition to these major themes, we identified three underlying values to ground Destination: Home’s racial equity work going forward. These include:
1. Integrating people of color with lived experience of homelessness in all program, policy, and fund-ing decisions
2. Aligning racial equity work in the homelessness sector with other racial equity initiatives in Santa Clara County
3. Using a racial equity lens and data-driven deci-sion making in the homelessness system and across other systems.
Based on the findings of this assessment, Destination: Home is poised to shift its work from analysis to planning and implementation of racial equity-based strategies in Santa Clara County’s homelessness response system. An implementation strategy, as outlined in the recommendations of this report, should address inflow, crisis response and outflow. Through this work, Santa Clara County has the potential to address structural racism as a root cause of homelessness, and, in doing so, create a roadmap for other communities across the country.
Executive Summary

Race and Homelessness in Santa Clara County, California | 5
In 2016, C4 Innovations launched the SPARC Initiative (Supporting Partnerships for Anti-Racist Communities), a multi-city effort to examine the connections between structural racism and homelessness across the United States. The project documented disproportionately high rates of homelessness among African Americans and Native Americans, with risk of homelessness es-pecially high among families and youth of color.3 As SPARC communities have continued to examine their data and to shift from understanding the problem to developing equity-based strategies to reduce home-lessness among people of color, various key compo-nents of racial equity implementation have emerged. These include: upstream prevention, cross-sector col-laboration, organizational training and capacity build-ing, targeted programming for specific at-risk groups, and long-term commitment to affordable housing and economic opportunities for communities of color.
To understand any potential racial disproportionality among people experiencing homelessness in Santa Clara County, California, Destination: Home partnered with the national SPARC Initiative. Initiated in Feb-ruary 2019, the collaborative effort includes three phases of work:
1. Assessment
2. Planning
3. Implementation
Throughout these phases, SPARC and Destination: Home (DH) are also focused on community engage-ment and buy-in, a recognition that tackling the important work of racial equity cannot be done in isola-tion, but instead in partnership and solidarity with partners across the community, including:
• People of color with lived experience of homelessness
• Homeless service providers
• City and County officials
• Advocates for specific racial and ethnic groups
• Faith community leaders
• Private sector/business leaders
• Philanthropy
APPROACH
3 Olivet, J., Dones, M., Richard, M., Wilkey, C., Yampolskaya, S., Beit-Arie, M. and Joseph, L. (2018). Supporting Partnerships for Anti-Racist Communities: Phase One Findings. Center for Social Innovation.
Approach

6 | Race and Homelessness in Santa Clara County, California
As a first stage of the work, SPARC led an assessment process that occurred between February and May 2019, and included a number of key activities:
1. Strategy meeting with the Racial Equity Advisory Group (REAG), which was formed to guide this project
2. Meetings with the Destination: Home Lived Experience Advisory Board (LEAB), DH Governing Board and other community partners
3. Listening sessions with people of color experiencing homelessness at four homeless service pro-grams:
• HomeFirst Boccardo Reception Center homeless shelter
• Recovery Café
• CityTeam Men’s Program
• Life Moves Family Shelter
4. Stakeholder interviews with individuals representing a wide range of perspectives:
NAME TITLE ORGANIZATION
Ariel Blume Executive Director County of Santa Clara Office of Cultural Competence
Analilia P. Garcia Racial & Health Equity Program Manager County of Santa Clara Department of Public Health
Jermaine Hardy Adult Services Division, Deputy Chief Probation Officer
County of Santa Clara Probation Department
Maritza Maldonado Executive Director Amigos de Guadalupe Center for Justice and Empowerment
Debra Porchia-Usher Chief Deputy Director County of Santa Clara Social Services Agency
Elena Rivera Board Member Lived Experience Advisory Board
Amber Siddle-Manas Health Planning Specialist County of Santa Clara Department of Public Health
Shari Slate Vice President, Chief Inclusion & Collaboration Officer
Cisco
Toni Tullys Behavioral Health Director County of Santa Clara Department of Health and Human Services
Approach

Race and Homelessness in Santa Clara County, California | 7
4 Some data dating back to 1998 were included in the dataset and analysis; however, the bulk of cases were from 2014 onward.
5. Analysis of Homeless Management Information System (HMIS) data
Our team used Santa Clara County Homeless Management Information System (HMIS) and Coordi-nated Entry System (CES) data to analyze the current state of racial inequities among the population experiencing homelessness and to better understand the role of race in determining outcomes relat-ed to housing and homelessness. This analysis was guided by five research questions:
1. What is the current state of disproportionality by race and ethnic group?
2. What is the experience of Black, Indigenous, and People of Color (BIPOC) in previous homeless experience compared to Whites?
3. What are the differences by race in VI-SPDAT (Vulnerability Index-Service Prioritization Decision Assistance Tool) score and prioritization for permanent housing and other housing resources?
4. What role does race play in recidivism into homelessness?
5. What role does household type (i.e., family, single adults, youth) play in understanding inequities in the homeless service system?
Quantitative data from years 2014-20194 were collected from the San Jose/Santa Clara City and County CoC HMIS system and Coordinated Entry System (specifically, VI-SPDAT). Data were cleaned, deduplicated, and analyzed using SPSS. The HMIS sample includes cases from 24,746 individuals and the VI-SPDAT sample included cases from 14,818 individuals and families. We conducted univariate and bivariate analyses to understand the demographics of this client sample and to describe the general nature of over- and under-representation by racial groups in certain circumstances. To better understand outcomes experienced by clients, we analyzed information pertaining to the most recent homeless event and entry in the HMIS system. Where possible, data were analyzed by household type to specifically understand the differences in experience and outcomes of clients presenting to the system as individuals (both single adults and youth) versus clients presenting as part of a house-hold or family. Data on household type was extrapolated using the categories “Household without Children,” “Households with only Children,” and “Households with Children”. The category “young adults” were defined as those under 25 and who were included in the category of “Household without Children”; however, it is unknown whether or not these individuals presented to the system alone. For CES data, to determine whether people of color differed from White clients on prioritization score, a one-way ANOVA was conducted. Pearson chi-square analysis was used to determine whether there is a statistically significant association between race and being classified into a specific vulnerability group (i.e., no housing intervention is needed, Rapid Re-Housing, or Permanent Supportive Housing/Housing First).
From these sources of information, the SPARC team documented the current state of race and homeless-ness in Santa Clara County. This report presents the findings from this assessment and offers potential directions forward as Destination: Home works to center racial equity in its county-wide homelessness response.
Approach

8 | Race and Homelessness in Santa Clara County, California
Through the assessment process, three themes of findings emerged:
• Disproportionately high rates of homelessness among specific racial and ethnic groups
• Racial/ethnic variation in experiences of homelessness
• Structural barriers, including lack of affordable housing and economic opportunity
In addition to these major themes, the assessment unearthed the need for three important cross-cutting values:
1. Integrate people of color with lived experience of homelessness in all program, policy, and funding decisions
2. Align racial equity work in the homelessness sector with other racial equity initiatives in Santa Clara County
3. Use a racial equity lens and data-driven decision making in the homelessness system and across other systems.
RACE AND HOMELESSNESS IN SANTA CLARA COUNTY
Race and Homelessness in Santa Clara County

Race and Homelessness in Santa Clara County, California | 9
Disproportionately high rates of homelessness among specific racial/ethnic groupsFigure 1 below presents a racial and ethnic breakdown of American Community Survey (ACS) data for Santa Clara County CoC (general population), poverty data, HMIS sample, and Annual Homelessness Assessment Report (AHAR) data. As Figure 1 shows, a simple comparison of the general population in the CoC with the population presenting to the homeless service system (HMIS) shows that Black/African Americans are dramatically overrepresented in the homeless service system (16.9% compared to 2.5% of the local population). This is almost seven (6.76) times greater than would be expected based on this group’s presence in the general population. AHAR data also reflects this inequity with 18.3% identifying as Black/African American. Also shown in Figure 1 is the overrepresentation of the American Indian/Alaskan Native population, which accounts for 7.4% of the HMIS population and 7.1% of the AHAR data, despite making up only 0.5% of the general population. This is almost 15 (14.8) times greater than would be expected based on their presence in the general population.
By comparison, Asians are underrepresented in HMIS and AHAR, accounting for 5.0% and 2.8%, respectively, of populations experiencing homelessness, while accounting for more than a third (34.4%) of the general population. This representation is almost seven (6.89) times less than would be expected based on their presence in the general population.
IMPORTANT FINDINGS• Black/African Americans are
dramatically overrepresented in the homeless populations (16.9% compared to 2.5% of the general population).
• Hispanic/Latinx individuals represent 43.7% of the HMIS sample compared to 27% of the general population.
• High rates of Hispanic/Latinx family homelessness—65% of families experiencing homelessness.
• American Indian/Alaskan Natives are 0.5% of the general population but 7.4% of the homeless population.
• Poverty alone does not explain high rates of homelessness among people of color.
0%
20%
40%
60%
80%
Homeless Pop.(HMIS, 2016)
Poverty Pop.(ACD Data, 2011-2015)
0%10%20%30%40%50%60%70%
46.9%45.0%
63.2%
44.0%
2.5% 5.0%
16.9%16.9%18.3%18.3%
0.5%0.5% 1.0%1.0%7.4%7.4% 7.1%7.1%
34.4%34.4%27.0%27.0%
5.0% 2.8% 0.4% 0% 2.3% 1.5%
15.4%15.4%23.0%23.0%
5.1%5.1%
26.3%26.3%
FIGURE 1. General Population, Poverty, HMIS, and AHAR Data by Race
White Black or AfricanAmerican
American Indian & Alaska Native
Asian (&NHOPI for Poverty data)
Native Hawaiian & Other Pacific
Islander
Two or More Races
General Pop.(CoC ACS, 2016)
Homeless Pop.(AHAR, 2016)
Hispanic / Latinx (of any race) Non Hispanic/Latinx
FIGURE 2. General Population, Poverty, HMIS, and AHAR Data by Ethnicity
Homeless Pop.(HMIS, 2016)
Poverty Pop.(ACS Data, 2011-2015)
General Pop.(CoC ACS, 2016)
Homeless Pop.(AHAR, 2016)
27.0%27.0%
44.0%44.0% 43.7%43.7% 40.1%40.1%
73.0%73.0%
56.0%56.0% 56.3%56.3% 59.9%59.9%
THEME 1:
Race and Homelessness in Santa Clara County

10 | Race and Homelessness in Santa Clara County, California
0%
20%
40%
60%
80%
Homeless Pop.(HMIS, 2016)
Poverty Pop.(ACD Data, 2011-2015)
0%10%20%30%40%50%60%70%
46.9%45.0%
63.2%
44.0%
2.5% 5.0%
16.9%16.9%18.3%18.3%
0.5%0.5% 1.0%1.0%7.4%7.4% 7.1%7.1%
34.4%34.4%27.0%27.0%
5.0% 2.8% 0.4% 0% 2.3% 1.5%
15.4%15.4%23.0%23.0%
5.1%5.1%
26.3%26.3%
FIGURE 1. General Population, Poverty, HMIS, and AHAR Data by Race
White Black or AfricanAmerican
American Indian & Alaska Native
Asian (&NHOPI for Poverty data)
Native Hawaiian & Other Pacific
Islander
Two or More Races
General Pop.(CoC ACS, 2016)
Homeless Pop.(AHAR, 2016)
Hispanic / Latinx (of any race) Non Hispanic/Latinx
FIGURE 2. General Population, Poverty, HMIS, and AHAR Data by Ethnicity
Homeless Pop.(HMIS, 2016)
Poverty Pop.(ACS Data, 2011-2015)
General Pop.(CoC ACS, 2016)
Homeless Pop.(AHAR, 2016)
27.0%27.0%
44.0%44.0% 43.7%43.7% 40.1%40.1%
73.0%73.0%
56.0%56.0% 56.3%56.3% 59.9%59.9%
Whites are also overrepresented in the HMIS data, accounting for 63.2% of HMIS population compared to 46.9% in the general population. However, the magnitude of overrepresentation is not as great for Whites as it is for Black/AA and AI/AN race groups. Specifically, representation of Whites in HMIS is 1.34 times greater than what you would expect based on their presence in the general population. It’s also worth noting that AHAR data was generally proportional to the general population for Whites.
Also notable is the inequity for Hispanic/Latinx individuals, who represent 43.7% of the HMIS sample compared to 27% of the general population (see Figure 2). This overrepresentation is reflected in the AHAR data as well (40.1%).
Table 1 also shows that poverty cannot explain for racial and ethnic disproportionality in the homeless system (especially given that the percentage of Black/African Americans in poverty in this community is not dramatically disproportionate to the general population).
The data for Hispanic/Latinx families with children show similar disparities, representing 43% of the overall homeless population but 65% of families experiencing homelessness. Stakeholders described numerous issues facing this group, including language barriers, lack of culturally competent services, and gentrifica-tion that drives Hispanic/Latinx people out of their neighborhoods.
TABLE 1. Race & Ethnicity Breakdown Across General Population, Poverty, CES, HMIS, and PITCOC ACS* (2016) POVERTY (2011-2015)** HMIS (2016)*** AHAR (2016)****
White 46.9% 45.0% 63.2% 44.0%
Black/AA 2.5% 5.0% 16.9% 18.3%
AI/AN 0.5% 1.0% 7.4% 7.1%
Asian (& NHOPI for poverty data) 34.4% 27.0% 5.0% 2.8%
NHOPI 0.4% -- 2.3% 1.5%
Two or More Races 15.4% 23.0% 5.1% 26.3%
Hispanic/Latinx 27.0% 44.0% 43.7% 40.1%
* “CoC ACS” refers to the general population numbers (according to the U.S. Census Bureau’s American Community Survey) for the geo-graphical areas covered by the Santa Clara County Continuum of Care. ** The poverty numbers in this table are also drawn from ACS data*** Homeless Management Information System (HMIS) data include all individuals served by the homeless services system in the county over the course of a year.**** Annual Homelessness Assessment Report (AHAR) data represents the total unsheltered and sheltered residents in Santa Clara County, as measured by a standardized count methodology required by the federal government to document the scope of homelessness on an annual basis.
Race and Homelessness in Santa Clara County
Race and Homelessness in Santa Clara County, California | 11
TABLE 2. Prior Location by RaceWHITE BLACK/AA AI/AN ASIAN NHOPI TWO OR
MORE RACES
Homeless 61.6% 17.1% 7.2% 4.6% 2.5% 7.1%
Permanent Housing/ Renting w/ subsidy
59.4% 22.9% 4.1% 4.3% 1.4% 7.8%
Permanent Housing/ Renting without subsidy
63.1% 16.6% 4.5% 5.5% 2.4% 7.9%
Institutionalized care 69.5% 14.6% 3.4% 5.0% 1.5% 5.9%
Correctional facility 64.4% 16.9% 5.4% 3.7% 2.4% 7.2%
Doubled up 63.8% 15.9% 6.2% 5.4% 2.2% 6.6%
Transitional care 62.3% 18.2% 5.5% 4.6% 2.6% 6.8%
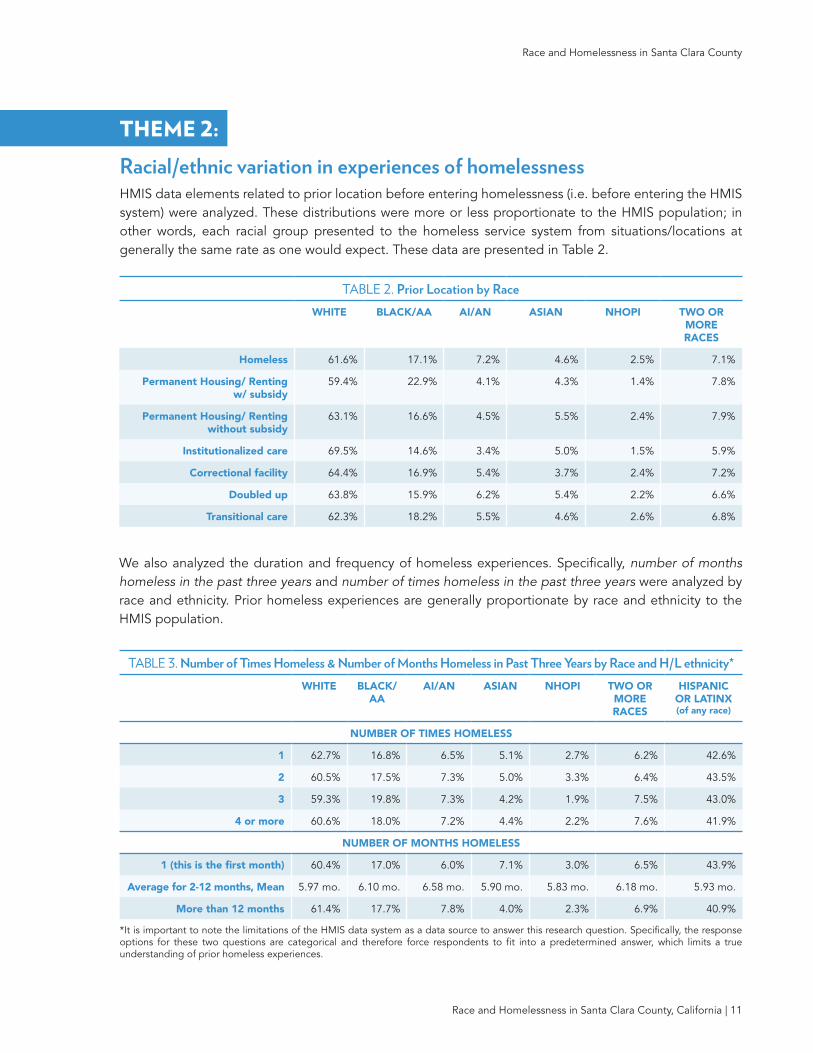
We also analyzed the duration and frequency of homeless experiences. Specifically, number of months homeless in the past three years and number of times homeless in the past three years were analyzed by race and ethnicity. Prior homeless experiences are generally proportionate by race and ethnicity to the HMIS population.
Racial/ethnic variation in experiences of homelessnessHMIS data elements related to prior location before entering homelessness (i.e. before entering the HMIS system) were analyzed. These distributions were more or less proportionate to the HMIS population; in other words, each racial group presented to the homeless service system from situations/locations at generally the same rate as one would expect. These data are presented in Table 2.
TABLE 3. Number of Times Homeless & Number of Months Homeless in Past Three Years by Race and H/L ethnicity*WHITE BLACK/
AAAI/AN ASIAN NHOPI TWO OR
MORERACES
HISPANIC OR LATINX (of any race)
NUMBER OF TIMES HOMELESS
1 62.7% 16.8% 6.5% 5.1% 2.7% 6.2% 42.6%
2 60.5% 17.5% 7.3% 5.0% 3.3% 6.4% 43.5%
3 59.3% 19.8% 7.3% 4.2% 1.9% 7.5% 43.0%
4 or more 60.6% 18.0% 7.2% 4.4% 2.2% 7.6% 41.9%
NUMBER OF MONTHS HOMELESS
1 (this is the first month) 60.4% 17.0% 6.0% 7.1% 3.0% 6.5% 43.9%
Average for 2-12 months, Mean 5.97 mo. 6.10 mo. 6.58 mo. 5.90 mo. 5.83 mo. 6.18 mo. 5.93 mo.
More than 12 months 61.4% 17.7% 7.8% 4.0% 2.3% 6.9% 40.9%
*It is important to note the limitations of the HMIS data system as a data source to answer this research question. Specifically, the response options for these two questions are categorical and therefore force respondents to fit into a predetermined answer, which limits a true understanding of prior homeless experiences.
THEME 2:
Race and Homelessness in Santa Clara County

12 | Race and Homelessness in Santa Clara County, California
We examined whether or not race was a predictor of exiting from programs back into homelessness. Race is a statistically significant predictor of exiting into home-lessness for American Indian/Alaska Native, who were 35% more likely to exit into homelessness. Gender is a significant predictor, with females 29% less likely to exit into homelessness than males.
We also examined whether or not race and other factors were predictors of exiting back into homelessness for dif-ferent age/household groups. For young adults (single, aged 18-24), black youth were 2 times more likely (p<.05, OR 2.05) to exit back into homelessness than were their white counterparts. This was also true for Native Hawai-ian and Other Pacific Islander youth, who were almost four times as likely (p<.05, OR 3.98). Also statistically significant for this age group was gender, where females were over two times less likely to exit into homelessness than males (p<.01, OR 0.46). For older single adults, the American Indian/Alaska Native population were 35% more likely to exit into homelessness (p<.05, OR 1.35) than whites, and Hispanic/Latinx individuals were 13% more likely than their non-Hispanic/Latinx counterparts (of any race) (p<.05, OR 1.13). Females in this age group were 37% less likely to exit into homelessness (p<.05, OR 0.73). Neither race nor gender were statistically signifi-cant in the models for family members.
An examination of VI-SPDAT data helps to understand how individuals and families are prioritized for housing services and whether there are any inequities by race or ethnicity. We examined mean final scores and service referral categorization. Figure 2 shows the variability in mean scores across race and ethnicity. One-way ANOVA found that for both individual and family samples, there was a statistically significant difference between race groups and ethnicity groups of final scores. However, scores were somewhat higher for non-White race groups in the family dataset, with AI/AN and individuals identifying as Two or More Races receiving higher prioritization scores.
IMPORTANT FINDINGS• Prior homeless experiences are generally
proportionate by race and ethnicity to the HMIS population.
• Race is a statistically significant predictor of exiting into homelessness for Ameri-can Indian/Alaska Native, who were 35% more likely to exit into homelessness.
• Black youth were two times more likely to exit back into homelessness than their white counterparts.
• When assessed for vulnerability and housing need, a higher percentage of Non-Hispanic/Latinx families (45.7%) are assessed as needing Permanent Support-ive Housing than Hispanic/Latinx families (39%).
• Gender is a significant predictor of re-turns to homelessness, with females 29% less likely than males to exit programs back into homelessness.
Race and Homelessness in Santa Clara County

Race and Homelessness in Santa Clara County, California | 13
0%5%
10%15%20%25%30%35%40%45%50%
FIGURE 2. VI-SPDAT Mean Score by Race & H/L Ethnicity
0123456789
WHITE BLACK/AA AI/AA ASIAN NHOPI TWO+ HISPANIC/LATINX
SINGLE ADULTS
6.137.06
6.887.18 6.73
7.256.88
FAMILIES
7.457.14
8.24
7.306.35
8.097.16
0%5%
10%15%20%25%30%35%40%45%50%
16.5%17.8%12.4%
8.9%
42.9%43.2%47.6% 47.3%
40.6%38.9%40%43.8%
17.3% 17%
9.9%11.7%
42.4%44.6%44.3%
49.3%
40.6%38.4%
45.7%
39%
FIGURE 3. Race and Prioritization Category FIGURE 4. Ethnicity & Prioritization Category
No HousingIntervention
Rapid Re-Housing
Permanent SupportiveHousing/Housing First
White Single Adults
BIPOC Single Adults
White Families
BIPOC Families
No HousingIntervention
Rapid Re-Housing
Permanent SupportiveHousing/Housing First
NonHispanic/Latinx Single Adults
Hispanic/Latinx Single Adults
NonHispanic/Latinx Families
Hispanic/Latinx Families
The rate at which non-White individuals and families receive prioritization for Permanent Housing/Housing First following a VI-SPDAT assessment is important in understanding the inequities in the Coordinated Entry System. Figures 3 and 4 shows the distribution of prioritization category by race (BIPOC represents all com-bined non-White race groups) and ethnicity, respectively. Pearson chi-square analyses showed a statistically significant (p<.05) association between race and prioritization category for families only, and a statistically significant (p<.05) association between ethnicity and prioritization for both single adults and families.
Race and Homelessness in Santa Clara County

14 | Race and Homelessness in Santa Clara County, California
Structural barriers, including lack of affordable housing and economic opportunityLack of access to affordable housing was a major area of focus in the listening sessions. The following direct quotes from people of color with lived experience of homelessness who participated in one of four listening sessions illustrate barriers to housing and perceptions on the part of participants about the need for more housing. One participant connected housing stability with sobriety: “They need to give us more access to [set aside] units. People get frustrated and relapse and forget about the process.” Another said simply, “Ev-erything is so expensive, you can’t do it alone.”
The stakeholder interviews echoed this theme of lack of affordable housing. The county’s public health de-partment has conducted multiple community needs assessments in recent years, each of which, without exception, identified housing as one of the most pressing public health issues facing the county. Inter-viewees described people living in their cars, doubled up with friends and family, and renting couches, floor-space, or subdivided living rooms for a few hours a day. They talked about people who have lived in Santa Clara County their whole lives, but who have been pushed out by skyrocketing rents, only to drive more than an hour each way to get to work in the county or to keep their children in their schools of origin. As one stakeholder succinctly put it: “You can’t have luxury housing for everyone and not have sufficient housing for low-income individuals.”
While housing affordability is an issue that affects people of all racial and ethnic backgrounds, several of key stakeholders interviewed stated that people of color were more severely impacted. One reason for this may be the persistent racial wealth gap and lack of economic opportunity for people of color. Next to housing, economic inequality was the most regularly reported challenge named in the interviews. This focus is captured well in the words of one respondent: “We have to think about systemic structures that have not
worked for people of color…Disinvestment from com-munities of color places them at a great disadvantage. When we talk about community violence and trauma, we come back to economic opportunity.”
While other issues were raised, including language barriers, criminalization of homelessness, behavioral health, education, and multi-generational homeless-ness, stakeholders continually brought the conversa-tion back to housing and economic inequality as major drivers of homelessness among people of color in Santa Clara County.
The disproportionately high rates of homelessness among people of color in the county mirror dispropor-tionality in other Safety Net systems. For example, one interviewee described similarities between dis-proportionately high rates of foster care and criminal justice involvement among Black and Hispanic/Latinx people—with both groups disproportionately repre-sented compared to their general population numbers. Involvement in the child welfare and criminal justice system increases the risk of homelessness and may be creating pipelines into homelessness for people of col-or. An important area of future work will be to further analyze data across multiple systems to determine not just disproportionality, but also to understand patterns of cross-system involvement (e.g., someone who is ex-
IMPORTANT FINDINGS• While housing affordability is an issue
that affects people of all racial and eth-nic background, people of color may be most severely impacted.
• The persistent wealth gap and lack of economic opportunity put communities of color at risk of homelessness.
• Disproportionately high rates of home-lessness among people of color in the county mirror disproportionality in other Safety Net systems.
THEME 3:
Race and Homelessness in Santa Clara County

Race and Homelessness in Santa Clara County, California | 15
periencing homelessness and has also been involved in foster care, criminal justice, or eviction systems). To date, such involvement is generally documented by self-report rather than data-sharing and analysis across multiple data sets.
Underlying Values to Guide Destination: Home’s Racial Equity WorkIn addition to these three major findings themes, three cross-cutting values emerged from the assessment process:
1. Integrate people of color with lived experience of homelessness in all program, policy, and funding decisions
The stakeholder interviews revealed a wide-spread belief that people with lived experience of homelessness should be included more in shaping policy and system responses to home-lessness. “The mistake we make in housing,” stated one stakeholder, “is that we’re talking to people who are housed…I would challenge us to bring authentic voices to the table.” Another not-ed that their agency is “designing programs that target specific communities. We are working on listening to those communities so that we have an impact…partnerships with individuals most impacted by the issue.”
2. Align racial equity work in the homelessness sector with other racial equity initiatives in Santa Clara County
Multiple stakeholders identified the importance of aligning efforts to promote racial equity. One stated that “a coordinated, cross-departmental aligned effort” is essential to address racial ineq-uities in homelessness, and that agencies work-ing on racial equity need to “align and advance toward a common goal with something we can measure and truly evaluate our efforts.” In the course of the interviews, several existing racial equity initiatives were underway in the county. These include:
1. GARE: The Government Alliance for Racial Equity, in which multiple city/county depart-ments and staff are participating
2. A race equity committee in the justice system that has been meeting regularly for a number of years
3. A subcommittee on the school to prison pipe-line
4. A committee within the Department of Health and Human Services focused on culture and diversity
As some stakeholders indicated, it will be im-portant to develop a full catalog of such existing efforts, then determine the most effective strate-gies for aligning and coordinating these efforts.
3. Use a racial equity lens and data-driven deci-sion making in the homelessness system and across other systems.
Across all of this work, interviewees, listening session participants, and members of the Racial Equity Advisory Group and DH’s Lived Experi-ence Advisory Board noted the importance of bringing racial equity into all of the organization’s work to end homelessness. This suggests that a racial equity initiative should not exist in parallel to other efforts, but should instead permeate all of Destination: Home’s work. The upcoming plan-ning process to develop a five-year community plan to address homelessness offers an important opportunity to embed racial equity across multi-ple activities.
Race and Homelessness in Santa Clara County

16 | Race and Homelessness in Santa Clara County, California
The quantitative and qualitative findings outlined in this report confirms that significant racial dispropor-tionality exists within the homeless population in Santa Clara County, especially for Black/African American, Native American people and Hispanic/Latinx individ-uals and families, pointing perhaps to similar levels of disproportionality in upstream safety net and criminal justice systems. It also paints a picture of the acute challenges and structural barriers, including lack of affordable housing and economic opportunity, present for the most vulnerable people in the community.
With these initial findings complete, Destination: Home and its partners now enter the second phase of work to leverage the data and information provided to identify and adopt a set of structural change objectives. To do so, Destination: Home will propose formally adding racial equity action items to the new Community Plan to End Homelessness. The plan, as well as the commu-nity engagement sessions leading up to it, will provide a formal adoption and planning process with a range of county stakeholders, creating the accountability to meaningfully move the racial equity work forward for this community.
Based on this report, we propose incorporating the following action items into the current Community Plan to End Homelessness:
1. Center and raise the voice of people of color who have experienced homelessness in the policy and program decisions of the supportive housing system.
Our community has a vibrant Lived Experience Advisory Board (LEAB), and two of its mem-bers serve on the Racial Equity Advisory Group that guides this initiative. The next step is to ensure that people with lived experience of homelessness are included in a decision-mak-ing capacity around major policy and program design in concerted and consistent manner.
2. Partner with the safety net system to better understand and address the systemic causes of poverty and inequity.
Based on some of the key findings in Theme 3 of this report, it is critical to fully understand which policies or practices constrain our safety-net sys-tems and the extent to which our policies and institutions exacerbate the crisis of homelessness.
A comprehensive data study should be conducted that focuses on all systems that serve individuals with housing instability. The study should help pol-icy makers understand housing instability of indi-viduals and families as they interact with safety-net programs and the justice system, the housing out-comes associated with those programs and institu-tions, and all the resources available to individuals and families to end or prevent their homelessness.
The findings of this work should help to inform safety net system improvements that could even-tually lead to an overall decrease of inflow into homelessness and a reduction in the current dis-proportionality found in the homeless population.
3. Adopt new housing and land use policies that help reverse longstanding housing disparities that have negatively impacted people of color.
As noted earlier, numerous racial equity efforts are already underway in Santa Clara County, including work on affordable housing dispersion policies, anti-displacement, tenant protections, and local resident preferences. Significant involvement by staff across multiple city and county departments provides a strong foundation for bringing Desti-nation: Home’s equity work into alignment with other efforts. One approach would be to develop shared outcomes and strategies for measure-ment. Additionally, committees and task forces working on displacement, criminal justice, public health, and cultural competence across sectors offer the possibility of joint work, cross-sector pilot projects, and representation of a homeless-ness focus at those tables.
NEXT STEPS: STRATEGIES TO ADDRESS RACIAL EQUITY
Next Steps: Strategies to Address Racial Equality

Race and Homelessness in Santa Clara County, California | 17
This report is a first step in documenting the intersection of race and homelessness in Santa Clara Coun-ty. The findings begin to shed light on racial disparities as they related to housing and homelessness. Santa Clara County is not alone, as the SPARC Initiative has documented similar patterns in communities across the United States. This report provides a baseline assessment from which Destination: Home and its partners can develop and implement racial equity strategies to prevent and end homelessness. It takes courage to look candidly at the lasting impact of racism in this country, and to connect its legacy with the current epidemic of homelessness. Destination: Home has begun that courageous work.
CONCLUSION
Conclusion
