probabilistic safety and optimal control · probabilistic safety and optimal control for survival...
TRANSCRIPT

Probabilistic Safety and Optimal Controlfor Survival Analysis of Bacillus subtilisI
Alessandro Abatea, John Lygerosb, Shankar S. Sastryc
aDepartment of Aeronautics and AstronauticsStanford University, USA
bAutomatic Control LaboratoryETH Zurich, Switzerland
cDepartment of Electrical Engineering and Computer SciencesUniversity of California, Berkeley, USA
Abstract
We introduce a methodological framework based on the concepts ofsafety and optimality to interpret organismal strategies that are intrinsicallyrelated to survival behaviors. We focus on the production of the antibioticsubtilin by the bacterium Bacillus subtilis, which is one among a set of pos-sible responses to environmental stress that are elicited by the bacterium,and we investigate the activation strategies over the genes involved in theprocess. We argue that these activation strategies can be synthesized as theoutcome of an optimal control problem that yields a survival probability.This optimization procedure is generated from a probabilistic safety prob-lem, which is formally related to the survival probability. We claim that aproper choice of the value function for the optimization problem that en-codes the survival analysis can be related to the activation mechanisms forsubtilin production.
Key words: Stress response network, Survival analysis, Safety analysis,Optimal control, Stochastic hybrid systems.
IResearch supported by the project HYGEIA, FP6-NEST-004995 (European Commis-sion), and by the US NSF grant CCR-0225610. The first author is currently at the DelftCenter for Systems and Control, TU Delft, The Netherlands.
Email addresses: [email protected] (Alessandro Abate),[email protected] (John Lygeros), [email protected] (Shankar S.Sastry)
Preprint submitted to Systems & Control Letters December 19, 2009

1. Introduction
Bacillus subtilis has been the object of much experimental work. Theinvestigation of its stress response network offers a detailed explanation ofhow the bacterium reacts to adverse environmental conditions [19]. Oneof the many options available to B. subtilis cells is the production of theantibiotic subtilin. The subtilin production pathway has been studied bothin its genetics as well as at its signaling level. As a result, the biologicalmechanisms underlying the generation of the antibiotic subtilin are fairlywell understood. The activation/deactivation of the genes involved in theprocess and the abrupt increase/decrease in the level of the correspondingproteins, which initiate the production of the antibiotic, are often interpretedand modeled by the presence of switching behaviors [18, 24, 25]. Theseswitching mechanisms are associated to stress factors [2, 19], and have beenexplained through structural [4, 14, 22, 27] and survival arguments [13].
The concept of optimum is common and shared between engineeringand biological systems [3]. The biology literature offers numerous exampleswhere optimality appears to regulate a certain function, or to explain theproperties of a particular entity. [21] represents possibly the first attemptto systematically frame the concept of optimality in biology. An optimalityinterpretation in the context of metabolic networks is used in [23], whereas[29] looks at dynamical game theory as a means of optimality in the contextof evolution, both at the population level and at the cell level. In [17]optimality is related to the notion of stability of a strategy. On the otherhand, many notable instances from the same biological domain also cautionabout the abuse of this notion [10].
Motivated by a recently developed dynamical model [12] for the geneticnetwork that describes the biosynthesis of the antibiotic subtilin by the bac-terium B. subtilis, the goal of this work is to revisit the concept of optimalityand to investigate its use in the study of survival for the bacterium. We putforward a new approach to study and understand the control mechanismsfor the production of subtilin, and interpret these mechanisms in terms ofan optimization problem.
We first propose a few improvements and modifications to the model in[12], to bring it in line with newer evidence reported in the literature [24,25, 28]. The overall dynamical model describing the antibiotic productionis framed in the context of a Stochastic Hybrid System (SHS) [1]. Our aimis not to shed new light into the actual dynamics of the antibiotic pathway,but rather, given a model, to propose a new approach to study the controlmechanisms for the production of subtilin in terms of certain optimality
2

criteria. The methodology to attain the objective is developed in three
Figure 1: Schematic representation of the methodology. The biology is introduced in Sec-tion 1; the mathematical models in Sections 2,3.1; safety analysis and its related optimalcontrol problem in Sections 3.2, 3.3; and the results are discussed in Sections 4 and 5.
steps (Figure 1):
1. We interpret survival analysis as a probabilistic safety analysis problem
2. We deploy optimal control theory tools to solve the safety problem
3. We elucidate its outcomes in relationship to survival analysis
The formal techniques developed in Section 3.2 and based on the SHS modelin [1] allow to reinterpret and study the survival analysis, through its con-nection with probabilistic safety, as a stochastic optimal control problem.In the model the available controls are feedback functions of the state-spaceand encode the subtilin production strategies: under a proper choice ofthe survival function, the solution of this optimal control problem obtainswhat we associate with the location and the structure of the switching (ac-tivation/deactivation) behaviors that characterize the subtilin productionmechanism. We furthermore draw some comparisons on the outcomes ofthe above procedure using different survival functions.
This methodological approach, summarized in Figure 1, allows a quanti-tative study of survival analysis for B. subtilis and proposes a procedure tounderstand its survival strategies. More generally, the study suggests thatcertain functions in a biological network may be synthesized as solutionsof optimization problems, which are based on quantitative models of thedynamics and encode the specific behaviors that the functions elicit.
3

The article is structured as follows: Section 2 describes the dynamicalmodel for the production biosynthesis of subtilin by Bacillus subtilis. Section3 develops the details of the proposed approach: Section 3.1 reinterprets themodel as a Stochastic Hybrid System, Section 3.2 develops a probabilisticsafety verification procedure for the introduced model, and Section 3.3 inter-prets the concept of survival as a safety specification, relating survival to theverification procedure of Section 3.2. Section 4 presents and discusses somenumerical results that associate the outcomes of the optimization problemwith certain survival strategies. Section 5 outlines a number of directionsfor future studies.
2. A Model for Antibiotic Biosynthesis
Many biological systems with interacting continuous and discrete com-ponents are naturally captured by Hybrid Systems models [7, 9]. The useof such models has indeed been recently advocated in the Systems Biologyliterature [5, 7, 9, 11, 16, 20]. Along these lines, we introduce in this Sectiona model for the system under study and interpret it as a SHS in Section3.1, to further develop some analysis on it in Section 3.2. For a thoroughpresentation of the SHS framework, the reader is referred to [6].
The model for the antibiotic synthesis is a refinement of that appeared in[12], according to additional evidence on B. subtilis [24, 25, 28]. The subtilinbiosynthesis network is expressed with two classes of variables (see Figure2): global/macroscopic variables (population density D and nutrient levelX) and local/microscopic ones (the concentration of the sigma factor SigH,denoted with [SigH], and that of the protein SpaS, denoted with [SpaS]).The macro- and microscopic variables interact through the average value ofSpaS within the population (denoted as [SpaS]) and through an activationfunction (identified with u) to be defined shortly (Figure 2). For the sake ofsimplicity the scheme disregards some of the components in the otherwisecomplex subtilin biosynthesis pathway, as well as some ancillary behaviorthat is only tangentially of interest at this level. For instance, we disregardthe presence of a few peptides that play a role in the immunity response[15, 26, 27], and use the presence of the peptide SpaS to represent the actualantibiotic subtilin. In addition, unlike [12], we do not include the influenceof SpaRK, an additional protein in the biosynthesis pathway.
At the microscopic level, we start with the dynamics of SigH, which isthought to be the initiator of the subtilin production pathway. The literatureon antibiotic synthesis as a stress response for B. subtilis suggests that theactivation/deactivation of subtilin production follows a “switching” profile
4

Figure 2: The decentralized structure of the model under study. The top layer (dashed redbox above) refers to the population dynamics (nutrient level and population size), whichare deterministic. The bottom layer (dashed red box below) refers to the dynamics of asingle cell, which are stochastic and hybrid. Pointed arrows (→) denote direct positiveinfluence, whereas tagged arrows (a) denote negative effect. Blue connectors indicate aglobal influence on the control structure (represented as a light blue box), while greenones the local effect on the control. The control influences (positively or negatively–hencethe use of a specific arrow) the concentration of the sigma factor SigH.
[12, 24, 25, 28]. Motivated by this observation, we consider general switchingrules of the form:
d[SigH]
dt= −λ1[SigH] + k3u, (1)
where the control u takes binary values as
u = f(D,X, [SigH], [SpaS]) : D → {0, 1}, (2)
with D = [0, DM ]× [0, XM ]× R2+ ⊂ R4, and where the quantities DM , XM
represent saturation levels and will be formally introduced shortly. Noticethat we have implicitly assumed a causal and memory-less structure for thecontrols: to the best of our knowledge, anticipativity (non-causal behavior)has not been observed as of yet in biological systems at that scale, andmemory-dependent policies would require an understanding of some sort ofmemory structure, which the literature presently does not support.
The sigma factor SigH influences the dynamics of the peptide SpaS: thehigher the concentration level of SigH, the more likely it is that SpaS is pro-duced. This influence is established through a discrete switching mechanism[12], namely a two-state Markov chain S1, and influences the continuous dy-
5

namics of SpaS as follows:
d[SpaS]
dt=
{−λ3[SpaS] if S1 is OFF−λ3[SpaS] + k5 if S1 is ON.
(3)
S1 = {OFF,ON} is assumed to be a Markov chain evolving at constant timeinterval ∆ > 0, and endowed with the following transition probability ma-
trix: P1 =
[1− b0 b01− b0 b0
]. The coefficient b0 depends directly on [SigH] as
b0([SigH]) = e−∆Grk/RT [SigH]
1+e−∆Grk/RT [SigH]. The quantity ∆Grk represents the Gibbs
free energy of the molecular configuration, R is a gas constant and T the envi-ronment temperature in Kelvin. This choice of P1 as a transition probabilitymatrix makes S1 a reversible Markov chain with a stationary distribution[πOFF , πON ]T = [1 − b0, b0]T . Intuitively, SigH promotes the production ofSpaS by increasing the probability of S1 to be in the ON state, where theconcentration of SpaS grows.
At the macroscopic level of the model, the dynamics of both the pop-ulation size and the nutrient level are influenced by the average amount ofsubtilin currently present in the environment. The variation in the popula-tion size is modeled by a logistic equation:
dD
dt= rD
(1− D
D∞
), r > 0. (4)
The non-trivial equilibrium depends on the quantity D∞ (the carrying ca-pacity), taken to be equal to D∞ = X
XMDM , where DM and XM represent
the maximal values for the population and the nutrient levels in the envi-ronment. The nutrient level dynamics are:
dX
dt= −k1DX + k2[SpaS]. (5)
The nutrient level decreases at a rate proportional to its present level andto the population density. It furthermore increases at a rate proportionalto the average production of subtilin, which is due to the indirect negativeinfluence of the antibiotic on the population level. The average concentrationof antibiotic is modeled by:
[SpaS] =D
DM
(1− X
XM
)k5λ3b0h(X), (6)
where b0 has been defined above and h(X) is equal to 1 if X > 0, and to 0 ifX = 0. The relation in (6) stresses two separate influences: a dependence on
6

the “competition” in the environment, modeled by the term DDM
(1− X
XM
);
and one on the steady state dynamics for [SpaS] (fraction k5/λ3), which inturn depends on the state of SigH (πON = b0(k3u/λ1), from (1),(3)). In thiswork the quantity [SpaS] has a structure which is more complex than theproportional relation used in [12].
Notice that the macroscopic level of the model, which encompasses thepopulation and nutrient levels, is deterministic and based on average dynam-ics. The microscopic one, involving the protein and sigma factor concentra-tion levels, describes cellular processes and is made up of stochastic andswitching dynamics (concentrated on the switching structure of the Markovchain S1).
From the dynamical relations in (4),(5) and (6), the steady state [Deq, Xeq]T
of the population and nutrient level is going to be either
[Deq, Xeq]T = [0, β]T , β ∈ [0, XM ], or
[Deq, Xeq]T = [αDM , αXM ]T , where 0 < α ≤ k2k3k5
k2k3k5 + k1λ1λ3DMXM≤ 1.
It is easy to see that the first equilibrium is unstable, whereas the second islocally stable for any combination of the model parameters. It can be shownthat the dynamics belong to the positive quadrant and are upper boundedby the extrema DM , XM .
3. Survival Analysis
We recast the above dynamics as a control-dependent SHS model inSection 3.1. The SHS model will enable the application of a control synthesisprocedure, described in Section 3.2. We then originally relate such controlsynthesis to the problem of interest (survival analysis) in Section 3.3.
3.1. Stochastic Hybrid System Model
In order to relate the model in Section 2 to the SHS framework [1], fromnow on we shall work in discrete time, assuming that the dynamics havebeen properly approximated, for instance with a first-order forward-Eulertime-discretization method with fixed sampling time ∆ > 0.
The state space S of the SHS is made up of a discrete component q ∈{OFF,ON} (the state of S1), and a continuous one x ∈ D ⊂ R4, as in (2).We use the product S = {OFF,ON} × D to denote the hybrid state space.The dynamics of the continuous variables are characterized by the relations
7

in (1),(3),(4), and (5). In particular, SigH depends on a binary functionthat expresses, according to (2), a general feedback contribution from thehybrid state space S.
The solution of the above SHS model over a time horizon [0, N ] is astochastic process with two components s(k) = (q(k),x(k)), k ∈ [0, N ]1 [1,Def. 3]. Given an initial condition at time k = 0, the solution evolvesin either of the two discrete modes until a mode switch is verified (whichreduces to sampling, along the evolution of the trajectory, from the non-homogeneous probability distribution of the Markov chain S1). Once atransition is triggered, the discrete state changes mode and the continuousevolution proceeds from unaltered initial conditions within the new mode.By construction, given the structure of the binary control and its sole de-pendence on the present state at each time step, once a control function isselected the solution process is Markovian (that is, memory-less).
The discrete and finite control space is denoted with U = {0, 1}. Asin [1, Section 4.2], we call a strategy, or a policy, a control profile over acertain finite time horizon [0, N ], that is a sequence of N mappings µ =(u0, u1, . . . , uN−1) ∈ UN , uk : D → U , as in (2).
Finally, to be able to formally state the technical result in Theorem 1 onpage 9, let us introduce a stochastic kernel Ts : B(S)× S × U → [0, 1] on Sgiven S × U , which assigns to any point s = (q, x) ∈ S and control u ∈ U , aprobability measure on the Borel space B(S), according to the dynamics ofthe SHS. The kernel Ts defines the dynamical behavior of the SHS, and thismapping is probabilistic because of the presence of the Markov chain S1.
3.2. Safety Verification for Stochastic Hybrid Systems
The safety verification analysis in this Section relates the SHS model ofSection 3.1 with the issue of survival analysis discussed in Section 3.3.
In general terms, in a stochastic setting a safety verification problemconsists in evaluating the probability that the state of the system remainsinside a certain set deemed to be safe during a given time horizon, startingfrom some initial conditions within that set. More formally, for a giveninitial state s0 ∈ S, a Markov policy µ ∈ UN , and a (safe) set A ⊆ S, it is ofinterest to compute the probability that the execution associated with thepolicy µ and with initialization in s0 stays within A during the time [0, N ]:
pµs0(A) := P(s(k) ∈ A, for all k ∈ [0, N ]|s(0) = s0). (7)
1Bold symbols are used to denote processes, whereas normal typeset to denote pointsor sample values in the (hybrid) state space.
8

The set Sµ(ε) of initial conditions guaranteeing a safety level ε ∈ [0, 1],when the control policy µ ∈ UN is assigned, Sµ(ε) = {s ∈ S : pµs (A) ≥ ε}, isreferred to as the probabilistic safe set with safety level ε. Notice that the setSµ(ε) depends on a particular policy µ ∈ UN . It is then of interest to pick an“optimal” policy leading to the set S?(ε) = {s ∈ S : maxµ∈UN pµs (A) ≥ ε},called the maximal probabilistic safe set. A policy µ? ∈ UN is maximallysafe if pµ
?
s (A) = maxµ∈UN pµs (A), ∀s ∈ A. The maximal probabilistic safeset and the maximally safe policy can be computed using tools from optimalcontrol (see [1] for a complete treatment).
Let 1A : S → {0, 1} denote the indicator function of set A ⊆ S. Regarda given set of N + 1 points {sk} to be a realization of the process s(·),according to a particular policy µ ∈ UN and with initialization in s0 ∈ S.Observe that
N∏k=0
1A(sk) =
{1, if sk ∈ A, for all k ∈ [0, N ]
0, otherwise.
It follows that
pµs0(A) = P
(N∏k=0
1A(s(k)) = 1| s(0) = s0
)= E
[N∏k=0
1A(s(k))| s(0) = s0
].
This expression suggests that the quantity pµs0(A) can be computed througha backward iterative procedure, as detailed in the following. For each k ∈[0, N ], define the map V µ
k : S → [0, 1] by:
V µk (s) = E
[N∏l=k
1A(s(l))| s(k) = s
],
with V µN (s) = 1A(s). This map denotes the probability of remaining inside
A during the (residual) time horizon [k,N ] starting from a specific s ∈ Sat time k, under the relevant part of the policy µ. It follows that, forany s ∈ S,pµs (A) = V µ
0 (s). The following theorem describes an algorithmto compute the quantity maxµ∈UN pµs (A) and ensures the existence of a
maximally safe policy µ? ∈ UN .
Theorem 1 ([1], Theorem 1). Define the maps V ?k : S → [0, 1], k =
0, 1, . . . , N , with s ∈ S, by the backward recursion:
V ?k (s) = max
u∈U1A(s)
∫SV ?k+1(sk+1)Ts(dsk+1|s, u),
9

initialized with V ?N (s) = 1A(s). Then, V ?
0 (s) = maxµ∈UN pµs (A),∀s ∈ S.Moreover, there exists a maximally safe policy µ? = (u?0, . . . , u
?N−1), with
u?k : S → U , k ∈ [0, N − 1], given ∀s ∈ S by
u?k(s) = arg maxµ∈U
1A(s)
∫SV ?k+1(sk+1)Ts(dsk+1|s, u).
�
The procedure in Theorem 1 can be implemented via a dynamic program-ming algorithm on a discretization of the state space, as discussed in [1].
3.3. Survival Analysis as a Probabilistic Safety Verification
According to the biological interpretation discussed in Section 1 and tosupport from the literature on B. subtilis [13, 19], it is assumed that anorganism activates or deactivates the “production pipeline” for the antibi-otic subtilin with the main objective of maximizing its own probability ofsurvival. It is possible to reinterpret the survival objective as a safety speci-fication by introducing appropriate safety regions within the state space andusing the machinery developed in Section 3.2 to compute and maximize theassociated safety probabilities. The validity of this procedure, schematicallyrecapitulated in Figure 1, clearly hinges on the relationship between survivaland safety. If the survival mechanism is expressed in terms of the variablesof the model, this connection is immediate. A number of educated guesseson the proper relationship between survival and safety for the instance understudy are introduced below and tested numerically in Section 4.
Interpreting the survival mechanism that leads to the production of theantibiotic subtilin as a stress response (as discussed in the Introductionand in Section 2), we can regard safety as the verification of the followingcondition:
“ safe if [SpaS] > [SpaS] ” (8)
Informally, (8) says that if the subtilin production level for a cell is higherthan the average level of antibiotic present in the environment, then theorganism is deemed to be safe: (8) encodes a higher probability for theorganism to kill other bacteria, rather than being killed by their antibioticproduction. By (6) and (8), the associated safe region, called A1, is then:
A1 =
{s ∈ S : [SpaS] >
D
DM
(1− X
XM
)k5λ3b0h(X)
}.
We additionally designate a second survival mechanism, which depends ona simple feedback structure that accounts for the competition coming from
10

the environment. This second feedback corresponds to the observation thatthe bacterium adjusts its behavior according to quorum sensing [12, 28],that is according to a global measure of population or nutrient level:
“ safe if nutrient level is high or if population density is low ” (9)
Accordingly, the second safe region A2 is defined to be the set of points:
A2 =
{s ∈ S :
D
DM
(1− X
XM
)< thresh
}, 0 ≤ thresh ≤ 1.
Recall that the subtilin level influences the nutrient level and indirectly alsothe population level. Finally, let us consider a safety condition defined overthe nutrient level, as suggested in [12]:
“ safe if nutrient level is higher than threshold ” (10)
Accordingly, the third safe set A3 has the following shape:
A3 =
{s ∈ S :
X
XM> thresh
}, 0 ≤ thresh ≤ 1.
The application of the procedure described in Theorem 1 computes theoptimal policies for the safety sets selected above. This output representsthe synthesized control feedback functions for the relation in (1). We expectto be able to associate the presence of activation/deactivation thresholds(which represent a “switching” behavior) for the production of subtilin to aparticular survival mechanism.
4. Numerical Results and Discussion
We have selected the following parameters for the dynamics introducedin Section 2: r = 0.8, k1 = 2, k2 = 4, k3 = 2.5, k5 = 0.8, λ1 = 0.5, λ3 =0.2,∆Grk/RT = 1.1. The time horizon for the optimization problem hasbeen set to N = 40, which allows to assess the dynamics and the structureof the synthesized controls in their steady state. We have first consideredthe safety condition expressed in (8), its corresponding safety set A1, andperformed the computations as in Theorem 1 after discretizing uniformlythe state space. In Figure 3, the plots of the maximal probabilistic safetylevel sets, with safety level ε = 0.95, are shown for a few different timesamples (initial time on the left, transient centrally, steady state on theright). Colored hues have been added only to enhance the perspective and
11

Figure 3: Maximal probabilistic safety level set corresponding to ε = 0.95 for differenttime samples (initial time on the left, transient centrally, steady state on the right). Thepoints above the level surfaces are safe with a probability of at least 95%. The sigmafactor level has been fixed to [SigH] = 1, the discrete state is in the OFF mode. Thecoordinates represent horizontally the nutrient level X and the population density D, andvertically the level of subtilin [SpaS].
the height of the level curves. The maximal probabilistic safe sets are thusmade up of the points above the plotted level curves. More precisely, giventhe choice of the safety level ε, all the points in the plots above the levelsurfaces are considered to be safe with a probability of at least 95%. For thesake of visualization (being the continuous state space four-dimensional),we plotted the results corresponding to a fixed value of the sigma factor[SigH] = 1 (the three dimensions represent the nutrient level X ∈ [0, XM ]and the population level D ∈ [0, DM ] on the horizontal plane, and thelevel of subtilin [SpaS] ≥ 0 on the vertical axis), and the discrete statebeing in the OFF mode. Results that are similar to those displayed, inthat they single out a distinct partition of the state space, are obtained forother choices of coordinates, and analogous outputs are displayed for theON mode. In Figure 3 notice that, as expected, the safe set shrinks (thatis, the curve raises) as we proceed backwards in time (towards the steadystate condition): this in fact translates to a longer safety requirement forthe trajectories of the system.
Figure 4 shows the different maximal probabilistic safety level sets atsteady state for a few values of the safety probability ε (decreasing towardsthe right). As expected, the lower the probabilistic safety level, the lowerthe level surface, and the larger the safety region.
Finally, Figure 5 represents vertical pairs of plots referring to maximalprobabilistic safety level sets (for ε = 0.95, in the top row) and correspondingoptimal actions (bottom row), for a few different time samples (initial timeon the left, transient in the center, and steady state on the right). Moreprecisely, the plots on the top row are obtained similarly as Figure 3, whereasthe plots on the bottom row represent the regions in the state space that
12
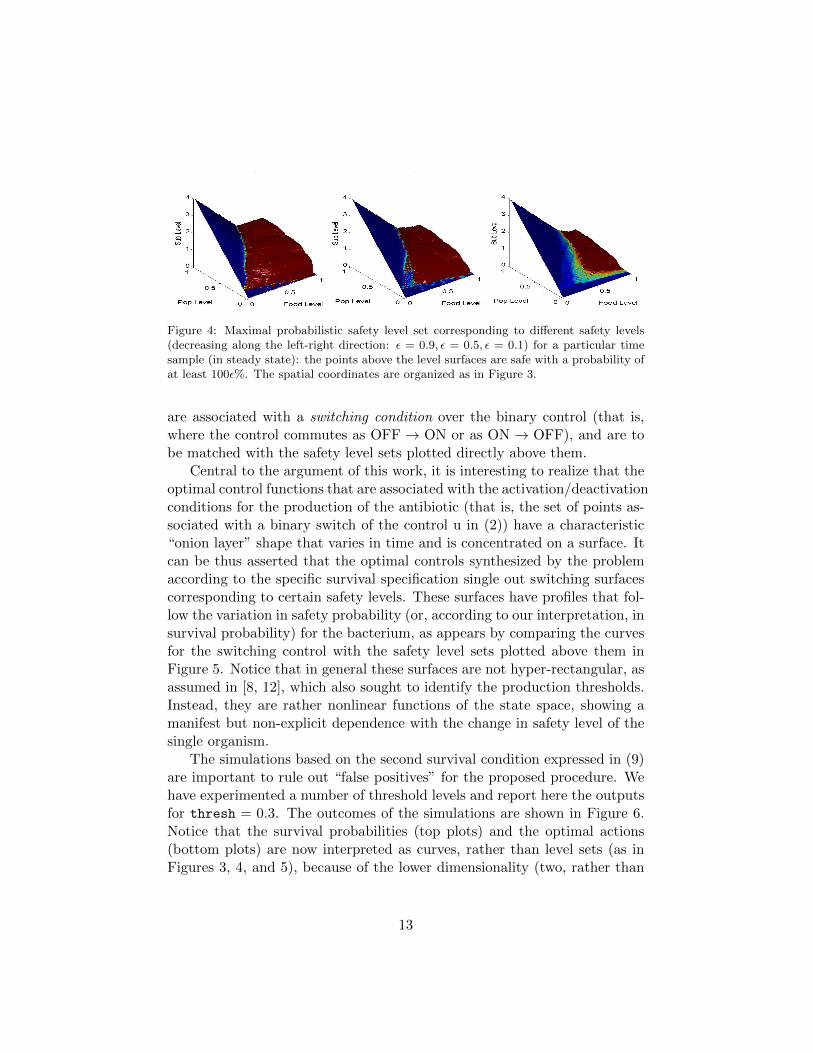
Figure 4: Maximal probabilistic safety level set corresponding to different safety levels(decreasing along the left-right direction: ε = 0.9, ε = 0.5, ε = 0.1) for a particular timesample (in steady state): the points above the level surfaces are safe with a probability ofat least 100ε%. The spatial coordinates are organized as in Figure 3.
are associated with a switching condition over the binary control (that is,where the control commutes as OFF → ON or as ON → OFF), and are tobe matched with the safety level sets plotted directly above them.
Central to the argument of this work, it is interesting to realize that theoptimal control functions that are associated with the activation/deactivationconditions for the production of the antibiotic (that is, the set of points as-sociated with a binary switch of the control u in (2)) have a characteristic“onion layer” shape that varies in time and is concentrated on a surface. Itcan be thus asserted that the optimal controls synthesized by the problemaccording to the specific survival specification single out switching surfacescorresponding to certain safety levels. These surfaces have profiles that fol-low the variation in safety probability (or, according to our interpretation, insurvival probability) for the bacterium, as appears by comparing the curvesfor the switching control with the safety level sets plotted above them inFigure 5. Notice that in general these surfaces are not hyper-rectangular, asassumed in [8, 12], which also sought to identify the production thresholds.Instead, they are rather nonlinear functions of the state space, showing amanifest but non-explicit dependence with the change in safety level of thesingle organism.
The simulations based on the second survival condition expressed in (9)are important to rule out “false positives” for the proposed procedure. Wehave experimented a number of threshold levels and report here the outputsfor thresh = 0.3. The outcomes of the simulations are shown in Figure 6.Notice that the survival probabilities (top plots) and the optimal actions(bottom plots) are now interpreted as curves, rather than level sets (as inFigures 3, 4, and 5), because of the lower dimensionality (two, rather than
13

Figure 5: Maximal probabilistic safety level sets and optimal switching control, for a fewtime samples (initial time on the left, transient centrally, steady state on the right) anda safety level ε = 0.95. On the top row, the points above the level surfaces are safe witha probability of at least 95%. On the bottom row, the curves represents points in thestate space that are associated with a switching condition. The spatial coordinates areorganized as in Figure 3.
four) of the figure of merit in A2. While the safety levels appear to remainsimilar in time to the initial safe set A2, the outputs do not seem to yieldany activation/deactivation threshold for the production mechanism (i.e.,the points in the space associated to an optimal control that commutes donot result in a specific curve).
Similarly, experiments performed by considering the safe set A3, definedon the food coordinate as per (10), did not show any particular threshold forthe optimal controls, thus suggesting that a condition along that coordinatemay not be the actual discriminant for the subtilin production mechanism.
These observations stress that, as expected, a meaningful outcome ofthe proposed interpretation and associated technique critically hinges on acorrect choice of the survival function. For the problem under study andthe developed dynamical model, the survival criterion in (8) has producedthe most reasonable outcomes.
5. Conclusions and Future Work
This article suggests that the problem of survival of an organism, whosedynamics are described by a quantitative model, can be investigated via asafety analysis study, and that the strategies related to this problem can be
14

Figure 6: Maximal probabilistic safety level sets (top plots) and optimal controls (bottomplots), backwards in time (from left to right), based on a survival condition encoding com-petition in the environment. The horizontal coordinates denote nutrient and populationlevel, whereas the vertical coordinate respectively survival probability (top) and optimalcontrol (bottom).
synthesized by an optimal control approach. The mathematical frameworkof Stochastic Hybrid Systems, which is proposed in this work and formalizedin [1], is endowed with generality and can be potentially applied to numerousother models in the literature.
For the specific study of the production mechanisms of the antibioticsubtilin as a stress-related response elicited by Bacillus subtilis, the ar-gument developed in this work leads to conclude that the observed acti-vation/deactivation mechanism displays a threshold feature over the statespace, which is expected from the literature. This behavior is specificallyassociated with a condition on the organism and its environment, which isto be interpreted in terms of a particular level of its survival probability.
The wider applicability of the present study and the validity of the con-cept of optimality must of course raise a few caveats worthy of attention.Clearly, this approach subsumes the ability to define a meaningful survivalfunction (and a corresponding safety region) for the system under study. Ingeneral, the figures of merit related to survival in (8), (9), and (10) oughtto incorporate some energy-related term at the cellular level. Since we areinterested in focusing on the possible presence of thresholds to be associatedwith the switching production mechanisms, rather than in the understandingtheir complete structure, this limitation plays a second role in the presentcontribution. However, it is critical to understand that a wrong choice for
15

this function may result in misleading conclusions, as discussed in Section4.
From a biological perspective, it is necessary to understand what the ex-ogenous “signals” are that the organism is able to sense, and which signalscan presumably build up the survival function. Our choice of an averagefeedback signal from the environment may not be valid in general. Further-more, the present study assumes that each cell independently maximizes itssurvival chances, thus ruling out any possible cooperative behavior.
As an extension to the present work, it would be instructive to under-stand what is the critical safety level that corresponds to the activation andthe deactivation of the production of subtilin. Considering a more complexstress response network is also desirable, provided this trades off properlywith the computational overhead and that modeling generality does not hidethe understanding of the particular function under study. Furthermore, theuse of randomized control structures, as suggested in other biological work[29], may make biological sense and can be accommodated within the pre-sented SHS framework [1]. Finally, an ad hoc experimental study couldactually verify the correctness of the predictions for the activation thresh-olds obtained by the presented methodology.
References
[1] A. Abate, M. Prandini, J. Lygeros, and S. Sastry. Probabilistic reacha-bility and safety for controlled discrete time stochastic hybrid systems.Automatica, 44(11):2724–2734, Nov 2008.
[2] U. Alon. An Introduction to Systems Biology: design principles of bio-logical circuits. Chapman and Hall/CRC Press, 2007.
[3] A. Arkin and J. Doyle. Appreciation of the machinations of the blindwatchmaker. IEEE Transactions on Circuits and Systems I – IEEETransactions on Automatic Control, pages 8–9, 2008. Special issue onSystems Biology.
[4] S. Banerjee and J. Hansen. Structure and expression of a gene encodingthe precursor of subtilin, a small proteic antibiotic. Journal of BiologicalChemistry, 263-19:9508–9514, 1988.
[5] G. Batt, D. Ropers, H. de Jong, J. Geiselmann, M. Page, and D. Schnei-der. Qualitative analysis and verification of hybrid models of geneticregulatory networks: Nutritional stress response in Escherichia coli. In
16

M. Morari and L. Thiele, editors, Hybrid Systems: Computation andControl, LNCIS 3414, pages 134–150. Springer Verlag, 2005.
[6] C.G. Cassandras and J. Lygeros. Stochastic hybrid systems. Automa-tion and Control Engineering Series 24. Taylor & Francis Group/CRCPress, 2006.
[7] K.H. Cho, K.H. Johansson, and O. Wolkenhauer. A hybrid systemsframework for cellular processes. BioSystems, 80:273–282, 2005.
[8] E. Cinquemani, R. Porreca, G. Ferrari-Trecate, and J. Lygeros. Subtilinproduction by Bacillus subtilis: Stochastic hybrid models and param-eter identification. IEEE Transactions on Circuits and Systems I –IEEE Transactions on Automatic Control, pages 38–50, 2008. Specialissue on Systems Biology.
[9] H. De Jong. Modeling and simulation of genetic regulatory systems: Aliterature review. Journal of Computational Biology, 9(1):67–103, 2002.
[10] J. Dupre. The Latest on the Best: Essays on Evolution and Optimality.MIT Press, Cambridge, MA, 1987.
[11] R. Ghosh, A. Tiwari, and C.J. Tomlin. Approximate symbolic reach-ability analysis with application to delta-notch signaling automata.In O. Maler and A. Pnueli, editors, Hybrid Systems: Computationand Control, Lecture Notes in Computer Science 2623, pages 233–248.Springer Verlag, 2003.
[12] J. Hu, W.-C. Wu, and S. Sastry. Modeling subtilin production in bacil-lus subtilis using stochastic hybrid systems. In R. Alur and G. J. Pap-pas, editors, Hybrid Systems: Computation and Control, Lecture Notesin Computer Science 2993, pages 417–431. Springer Verlag, 2004.
[13] E. Katz and A.L. Demain. The peptide antibiotics of Bacillus:Chemistry, biogenesis, and possible functions. Bacteriological Reviews,41(2):449–474, June 1977.
[14] P. Kiesau, U. Eikmanns, Z. Eckel, S. Weber, M. Hammelmann, andK. Entian. Evidence for a multimeric subtilin synthetase complex. Jour-nal of Bacteriology, 179-5:1475–1481, 1997.
[15] C. Klein and K. Entian. Genes involved in self-protection against thelantibiotic subtilin produced by Bacillus subtilis atcc 6633. Applied andEnvironmental Microbiology, 60(8):2793–2801, 1994.
17

[16] P. Lincoln and A. Tiwari. Symbolic systems biology: hybrid modelingand analysis of biological networks. In R. Alur and G. J. Pappas,editors, Hybrid Systems: Computation and Control, Lecture Notes inComputer Science 2993, pages 660–672. Springer Verlag, 2004.
[17] J. Maynard Smith. Evolution and the Theory of Games. CambridgeUniversity Press, New York, 1982.
[18] S. Mehra, S. Charaniya, E. Takano, and W.-S. Hu. A bistable geneswitch for antibiotic biosynthesis: The butyrolactone regulon in Strep-tomyces coelicolor. PLoS ONE, 3(8):e2724, 2008.
[19] T. Msadek. When the going gets tough: survival strategies and environ-mental signaling networks in bacillus subtilis. Trends in Microbiology,7(5):201–207, 1999.
[20] C. Rao and A. Arkin. Control motifs for intracellular regulatory net-works. Annu. Rev. Biomed. Eng., pages 391–419, 2001.
[21] R. Rosen. Optimality Principles in Biology. Plenum Press, New York,1967.
[22] F. Schueller, R. Benz, and H.G. Sahl. The peptide antibiotic subtilinacts by formation of voltage-dependent multi-stage pores in bacterialand artificial membranes. European Journal of Biochemistry, 182:181–186, 1989.
[23] D. Segre, D. Vitkup, and G.M. Church. Analysis of optimality in nat-ural and perturbed metabolic networks. PNAS, 99-33:15112–15117,2002.
[24] T. Stein. Bacillus subtilis antibiotics: structures, syntheses and specificfunctions. Molecular Microbiology, 56-4:845–857, 2005.
[25] T. Stein, S. Borchert, P. Kiesau, S. Heinzmann, S. Kloss, C. Klein,M. Helfrich, and K. Entian. Dual control of subtilin biosynthesis andimmunity in bacillus subtilis. Molecular Microbiology, 44-2:403–416,2002.
[26] T. Stein, S. Heinzmann, S. Dusterhus, S. Borchert, and K. Entian. Ex-pression and functional analysis of the subtilin immunity genes spaIFEGin the subtilin-sensitive host Bacillus subtilis mo1099. Bacteriology,187(3):822–828, 2005.
18

[27] T. Stein, S. Heinzmann, P. Kiesau, B. Himmel, and K. Entian. The spa-box for transcriptional activation of subtilin biosynthesis and immunityin Bacillus subtilis. Molecular Microbiology, 47(6):1627–1836, 2003.
[28] H. Tjalsma, E. Koetje, R. Kiewet, O. Kuipers, M. Kolman, J. vander Laan, R. Daskin, E. Ferrari, and S. Bron. Engineering of quorum-sensing systems for improved production of alkaline protease by bacillussubtilis. Journal of Applied Microbiology, 96:569–578, 2004.
[29] D. Wolf, V. Vazirani, and A.Arkin. Diversity in times of adversity:probabilistic strategies in microbial survival games. J. theor. biol.,234(2):227–253, 2005.
19