advances in reliability analysis and probabilistic safety
TRANSCRIPT

IAEA-TECDOC-737
Advances inreliability analysis and
probabilistic safety assessmentfor nuclear power reactors
Report of a Technical Committee meetingheld in Budapest, 7-11 September 1992
INTERNATIONAL ATOMIC ENERGY AGENCY

The IAEA does not normally maintain stocks of reports in this series.However, microfiche copies of these reports can be obtained from
IN IS ClearinghouseInternational Atomic Energy AgencyWagramerstrasse 5P.O. Box 100A-1400 Vienna, Austria
Orders should be accompanied by prepayment of Austrian Schillings 100,-in the form of a cheque or in the form of IAEA microfiche service couponswhich may be ordered separately from the INIS Clearinghouse.

The originating Section of this document in the IAEA was:Nuclear Safety Section
International Atomic Energy AgencyWagramerstrasse 5
P.O. Box 100A-1400 Vienna, Austria
ADVANCES IN RELIABILITY ANALYSIS AND PROBABILISTIC SAFETY ASSESSMENTFOR NUCLEAR POWER REACTORS
IAEA, VIENNA, 1994IAEA-TECDOC-737
ISSN 1011-4289
Printed by the IAEA in AustriaMarch 1994

PLEASE BE AWARE THATALL OF THE MISSING PAGES IN THIS DOCUMENT
WERE ORIGINALLY BLANK

FOREWORD
Over the last ten years, there has been considerable growth in the use of probabilistic safetyassessment (PS A) for assessing the safety of nuclear power plants. PS As are increasingly beingperformed, to complement deterministic analyses, both in the industrial and the regulatoryenvironment, to address almost every aspect of the nuclear power plant life cycle.
The benefits of PSA have been recognized in many countries that are not well advanced in usingPS A techniques. Recently, efforts have been made to apply PSA techniques in central and easternEuropean countries and in the newly independent states of the former USSR. The results of PSAsfor some specific reactor types (such as WWERs) are now becoming available.
Although most plant specific PSAs have been performed to assess overall plant safety (or risk)and to identify specific weaknesses in design and operation, the comprehensive logical modelling ina PSA make it desirable for use in optimizing various operational tasks.
Recently, attention has been paid to other kinds of PSA applications, including risk basedregulation and inspection, plant configuration control and operator training. Many such applicationshave the potential for providing guidance on the optimal use of resources and reduction of the burdenon the operating organization. These different PSA applications set new requirements on the scopeof PSAs, the necessary level of detail, quality and coverage of data, and the capabilities of computertools used to run the models.
In order to promote the use of risk and reliability techniques in this important and fast developingarea, the IAEA convened a Technical Committee Meeting (TCM) on Advances in Reliability Analysisand Probabilistic Safety Assessment in Budapest from 7 to 11 September 1992. The meeting wasorganized with the co-operation of the Hungarian Institute for Electrical Power Research (VEIKI).The TCM was attended by 79 participants from 23 countries. The 41 papers presented at the meetingaddress recent developments in the area of PSA applications as well as advanced techniques/methodsfor various applications. In addition, comprehensive information was presented concerning PSAprogrammes in central and eastern European countries (CEEC) and the newly independent states (NIS)of the former USSR.
This TECDOC, which was prepared by the participants in the TCM, summarizes insights fromthe papers presented at the meeting and from the plenary discussions. The most important topicsrelated to PSA methods and to various applications of PSA technique that were discussed during theworking group sessions are also presented.

EDITORIAL NOTE
In preparing this document for press, staff of the IAEA have made up the pages from theoriginal manuscripts as submitted by the authors. The views expressed do not necessarily reflect thoseof the governments of the nominating Member States or of the nominating organizations.
Throughout the text names of Member States are retained as they were when the text wascompiled.
The use of particular designations of countries or territories does not imply any judgement bythe publisher, the IAEA, as to the legal status of such countries or territories, of their authorities andinstitutions or of the delimitation of their boundaries.
The mention of names of specific companies or products (whether or not indicated as registered)does not imply any intention to infringe proprietary rights, nor should it be construed as anendorsement or recommendation on the part of the IAEA.
The authors are responsible for having obtained the necessary permission for the IAEA toreproduce, translate or use material from sources already protected by copyrights.
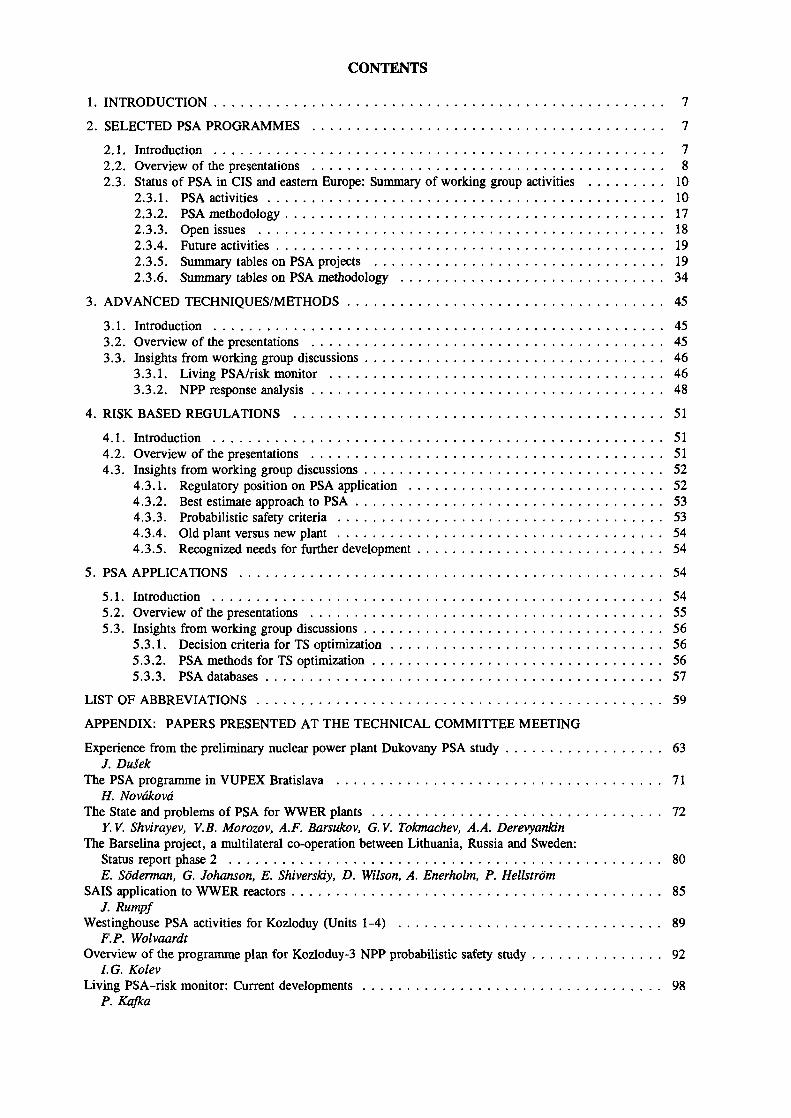
CONTENTS
1. INTRODUCTION . . . . . . . . . . . . . . . . . . . . . . . . . . . . . . . . . . . . . . . . . . . . . . . . . . . 7
2. SELECTED PSA PROGRAMMES . . . . . . . . . . . . . . . . . . . . . . . . . . . . . . . . . . . . . . . . 7
2.1. Introduction . . . . . . . . . . . . . . . . . . . . . . . . . . . . . . . . . . . . . . . . . . . . . . . . . . . 72.2. Overview of the presentations . . . . . . . . . . . . . . . . . . . . . . . . . . . . . . . . . . . . . . . . 82.3. Status of PSA in CIS and eastern Europe: Summary of working group activities . . . . . . . . . 10
2.3.1. PSA activities . . . . . . . . . . . . . . . . . . . . . . . . . . . . . . . . . . . . . . . . . . . . . 102.3.2. PSA methodology . . . . . . . . . . . . . . . . . . . . . . . . . . . . . . . . . . . . . . . . . . . 172.3.3. Open issues . . . . . . . . . . . . . . . . . . . . . . . . . . . . . . . . . . . . . . . . . . . . . . 182.3.4. Future activities . . . . . . . . . . . . . . . . . . . . . . . . . . . . . . . . . . . . . . . . . . . . 192.3.5. Summary tables on PSA projects . . . . . . . . . . . . . . . . . . . . . . . . . . . . . . . . . 192.3.6. Summary tables on PSA methodology . . . . . . . . . . . . . . . . . . . . . . . . . . . . . . 34
3. ADVANCED TECHNIQUES/METHODS . . . . . . . . . . . . . . . . . . . . . . . . . . . . . . . . . . . . 45
3.1. Introduction . . . . . . . . . . . . . . . . . . . . . . . . . . . . . . . . . . . . . . . . . . . . . . . . . . . 453.2. Overview of the presentations . . . . . . . . . . . . . . . . . . . . . . . . . . . . . . . . . . . . . . . . 453.3. Insights from working group discussions . . . . . . . . . . . . . . . . . . . . . . . . . . . . . . . . . . 46
3.3.1. Living PSA/risk monitor . . . . . . . . . . . . . . . . . . . . . . . . . . . . . . . . . . . . . . 463.3.2. NPP response analysis . . . . . . . . . . . . . . . . . . . . . . . . . . . . . . . . . . . . . . . . 48
4. RISK BASED REGULATIONS . . . . . . . . . . . . . . . . . . . . . . . . . . . . . . . . . . . . . . . . . . 51
4.1. Introduction . . . . . . . . . . . . . . . . . . . . . . . . . . . . . . . . . . . . . . . . . . . . . . . . . . . 514.2. Overview of the presentations . . . . . . . . . . . . . . . . . . . . . . . . . . . . . . . . . . . . . . . . 514.3. Insights from working group discussions . . . . . . . . . . . . . . . . . . . . . . . . . . . . . . . . . . 52
4.3.1. Regulatory position on PSA application . . . . . . . . . . . . . . . . . . . . . . . . . . . . . 524.3.2. Best estimate approach to PSA . . . . . . . . . . . . . . . . . . . . . . . . . . . . . . . . . . . 534.3.3. Probabilistic safety criteria . . . . . . . . . . . . . . . . . . . . . . . . . . . . . . . . . . . . . 534.3.4. Old plant versus new plant . . . . . . . . . . . . . . . . . . . . . . . . . . . . . . . . . . . . . 544.3.5. Recognized needs for further development . . . . . . . . . . . . . . . . . . . . . . . . . . . . 54
5. PSA APPLICATIONS . . . . . . . . . . . . . . . . . . . . . . . . . . . . . . . . . . . . . . . . . . . . . . . . 54
5.1. Introduction . . . . . . . . . . . . . . . . . . . . . . . . . . . . . . . . . . . . . . . . . . . . . . . . . . . 545.2. Overview of the presentations . . . . . . . . . . . . . . . . . . . . . . . . . . . . . . . . . . . . . . . . 555.3. Insights from working group discussions . . . . . . . . . . . . . . . . . . . . . . . . . . . . . . . . . . 56
5.3.1. Decision criteria for TS optimization . . . . . . . . . . . . . . . . . . . . . . . . . . . . . . . 565.3.2. PSA methods for TS optimization . . . . . . . . . . . . . . . . . . . . . . . . . . . . . . . . . 565.3.3. PSA databases . . . . . . . . . . . . . . . . . . . . . . . . . . . . . . . . . . . . . . . . . . . . . 57
LIST OF ABBREVIATIONS . . . . . . . . . . . . . . . . . . . . . . . . . . . . . . . . . . . . . . . . . . . . . . 59
APPENDIX: PAPERS PRESENTED AT THE TECHNICAL COMMITTEE MEETING
Experience from the preliminary nuclear power plant Dukovany PSA study . . . . . . . . . . . . . . . . . . 63J. DuSek
The PSA programme in VUPEX Bratislava . . . . . . . . . . . . . . . . . . . . . . . . . . . . . . . . . . . . . 71H. Novâkovâ
The State and problems of PSA for WWER plants . . . . . . . . . . . . . . . . . . . . . . . . . . . . . . . . . 72Y.V. Shvirayev, V.B. Morozov, A.F. Barsukov, G.V. Tokmachev, A.A. Derevyankin
The Barselina project, a multilateral co-operation between Lithuania, Russia and Sweden:Status report phase 2 . . . . . . . . . . . . . . . . . . . . . . . . . . . . . . . . . . . . . . . . . . . . . . . . . 80E. Söderman, G. Johanson, E. Shiverskiy, D. Wilson, A. Enerholm, P. Hellström
SAIS application to WWER reactors . . . . . . . . . . . . . . . . . . . . . . . . . . . . . . . . . . . . . . . . . . 85J. Rumpf
Westinghouse PSA activities for Kozloduy (Units 1-4) . . . . . . . . . . . . . . . . . . . . . . . . . . . . . . 89P.P. Wolvaardt
Overview of the programme plan for Kozloduy-3 NPP probabilistic safety study . . . . . . . . . . . . . . . 92I.G. Kolev
Living PSA-risk monitor: Current developments . . . . . . . . . . . . . . . . . . . . . . . . . . . . . . . . . . 98P. Kafka

The living PSA concept for the Cernavoda NPP . . . . . . . . . . . . . . . . . . . . . . . . . . . . . . . . . 102/. Turcu, G. Georgescu
Presentation and basic applications of PSA results . . . . . . . . . . . . . . . . . . . . . . . . . . . . . . . . 105V. Hojny
Internal event analysis for the Laguna Verde NPP: Core vulnerable sequence evaluation, applicationsand interface with containment analysis . . . . . . . . . . . . . . . . . . . . . . . . . . . . . . . . . . . . . 113A. Nunez, A. Huerta
Relationship between safety culture and PSA . . . . . . . . . . . . . . . . . . . . . . . . . . . . . . . . . . . 119V. Joksimovich
Research activities for probabilistic safety assessment at the Korea Atomic Energy Research Institute . 124Kil-Yoo Kirn, Chang K. Park
The importance of risk-based regulation to developing nations . . . . . . . . . . . . . . . . . . . . . . . . . 128H. Specter
The role of probabilistic safety assessment in the licensing of Angra-I nuclear power plant . . . . . . . 133S.M. Orlando Gibelli
Survey of German PSA investigations for nuclear power plants . . . . . . . . . . . . . . . . . . . . . . . . 139H.P. Berg, U. Hauptmanns, P.M. Herttrich
Use of PSA hi a regulatory framework . . . . . . . . . . . . . . . . . . . . . . . . . . . . . . . . . . . . . . . 145P.J. Ross
Status and future prospects of regulatory issues of PSA application in the Ukraine . . . . . . . . . . . . . 151G. Gromov
Role of PSA in licensing, regulation and design as applied in the Netherlands . . . . . . . . . . . . . . . 155M.F. Versteeg
PSA software and utilization experience hi reactor plant design . . . . . . . . . . . . . . . . . . . . . . . . 159O.E. Samoilov, E.V. Frolov, A.M. Bakhmetiev
Influence of PSA methodology on NPP data collection . . . . . . . . . . . . . . . . . . . . . . . . . . . . . 166/. Cillik, B. Markech
WER severe accident modeling wih MAAP4 . . . . . . . . . . . . . . . . . . . . . . . . . . . . . . . . . . . 173M.G. Plys
Recent advances in PSA-oriented thermal-hydraulic analyses for WWER-440 NPPs . . . . . . . . . . . . 178M.J. Kulig, J. Szczurek, W. Kowalik, Z. Bazso
Lessons learned hi applying PSA methods to technical specification optimization . . . . . . . . . . . . . 185K.N. Fleming, R.P. Murphy
Test strategies for standby diesel generators . . . . . . . . . . . . . . . . . . . . . . . . . . . . . . . . . . . . 192T. Mankamo
Stepwise approach to risk-based technical specifications . . . . . . . . . . . . . . . . . . . . . . . . . . . . . 200J.A. Becerra, J.L. Delgado
Probabilistic analysis of the interaction between allowed outage time and surveillancetest interval requirements . . . . . . . . . . . . . . . . . . . . . . . . . . . . . . . . . . . . . . . . . . . . . . 204S. Martorell, V. Serradell, G. Verdu, P. Samanta
Application of PSA techniques for evaluation of proposed changes to DG maintenance atKozloduy-3 NPP . . . . . . . . . . . . . . . . . . . . . . . . . . . . . . . . . . . . . . . . . . . . . . . . . . . 213I.G. Kolev
Risk-based evaluation of allowed outage times (AOTs): Considering risk of shutdown . . . . . . . . . . 216T. Mankamo, I.S. Kim, P.K. Samanta
Impact of shutdown risk on risk-based assessment of technical specifications . . . . . . . . . . . . . . . . 223S. Deriot
Refuelling PSA for TVO I/II . . . . . . . . . . . . . . . . . . . . . . . . . . . . . . . . . . . . . . . . . . . . . 230J. Pesonen, R. Himanen, H. Sjövall, P. Pyy
PSA applications on a Swedish BWR with the aid of risk spectrum . . . . . . . . . . . . . . . . . . . . . . 234/. Sandstedt
Almaraz probabilistic safety analysis application . . . . . . . . . . . . . . . . . . . . . . . . . . . . . . . . . 246M.D. Morales, E. Gutiérrez, I. Fuente
Lessons learned in applying PSA technology to diverse risk management applications . . . . . . . . . . . 250K.N. Fleming
A computer tool for systems configuration management based on PSA models and techniques . . . . . 259G. Georgescu
List of Participants . . . . . . . . . . . . . . . . . . . . . . . . . . . . . . . . . . . . . . . . . . . . . . . . . . . 262

1. INTRODUCTION
The purpose of the Technical Committee Meeting (TCM) on Advances in Reliability Analysis andProbabilistic Safety Assessment held in Budapest from 7 to 11 September 1992 was to exchangeexperience in the area of PS A and in particular of PS A applications, and to promote international co-operation in this area. Plant specific PSAs as well as experience and trends in applying insights fromPS A to optimize plant tasks were discussed at the meeting.
This TECDOC is a documentation of the meeting. The document reviews the present status andthe aims of PS A efforts in different countries and related international activities; it includes anoverview of the presentations and insights from the working group discussions on selected topicsrelated to both methods and applications and papers presented at the meeting. The main text isdivided into several sections, each devoted to a separate subject. This structure reflects the divisionof the meeting into working sessions.
The status of PS A in the former USSR and eastern European countries is presented in Section 2.It includes an overview of presentations as well as the results of the working group discussions. Briefinformation on PSA programmes is provided and PSA methods used in each country or organizationare described. Open issues that require further consideration and/or external assistance are alsodiscussed.
Section 3 is devoted to advances in the area of PSA methods and new applications. Two topicscovered by the presentations are highlighted. 'Living PSA' and Risk Monitor is addressed as one ofthe subjects that has recently attracted significant interest, in the context of both methods and practicalapplications. The second topic covered in Section 3 is related to PSA oriented plant responseanalysis.
Section 4 is devoted to risk based regulation. In addition to an overview of the presentations,some insights from the working group discussions are given. Selected issues are addressed to presenta regulatory perspective on PSA applications.
Section 5 provides brief information on selected PSA applications. A variety of practicalapplications in the area of plant operation are discussed. Risk based Technical Specifications arespecifically addressed as one of the most important and promising areas of application.
The appendix reproduces a selection of papers presented at the meeting. A list of participantsis included.
2. SELECTED PSA PROGRAMMES
2.1. INTRODUCTION
Over the last few years extensive training for and transfer of technology on PSA and relatedtopics have been provided to eastern European and CIS countries, mainly for WWER type reactors(e.g. within the framework of the IAEA Regional Programme RER/9/005, PSA for WWER TypeReactors). As a result, all WWER users now have sizable PSA programmes aimed at developing aPSA for each operating reactor in the region. The first PSA activities in this region focused primarilyon identification of possible design weaknesses, but other potential applications are being consideredor are already being implemented.
A separate technical session of the TCM was devoted to PSA programmes in countries of theCommonwealth of Independent States and eastern European countries. In addition to this generalsession, a closed session was organized especially to address IAEA TC Project RER/9/005.

An overview of the presentations related to PSA activities in Bulgaria, the former CSFR,Hungary, the Russian Federation and Lithuania is given in Section 2.2.
More detailed information concerning the status of PSA in CIS and eastern European countriesis provided in Section 2.3. The material prepared by the working group addresses both PSA relatedactivities and the status of PSA methods. Some open issues that need further consideration or thatrequire the transfer of expertise or assistance are also discussed. Information is also given on futureactivities and related IAEA assistance.
2.2. OVERVIEW OF THE PRESENTATIONS
There were ten presentations devoted to PSA programmes (one in written form only). Fourreviewed PSA activities in Hungary, the Russian Federation, Bulgaria and the CSFR; the fifth paperexpanded on information presented in the CSFR overview. All these contributions served as a basicmaterial for the preparation of working material from this session (working group) and gave a goodpicture of PSA activities in the four countries.
The Hungarian presentation was oriented mainly to the AGNES project/Level 1 PSA whichaccounts for the main activities. The main aims, targets and tasks of the project scheduled for 1993and 1994 were presented. The preliminary list of 65 initiating events for the PSA of Paks NPP Unit 3and a detailed plan of tasks with a time schedule are included.
In the Russian paper, several items were pointed out:
- PSA studies are included in SARs for all new NPPs;
PSA studies for the NPPs in operation are obligatory for further operation of these NPPs (bydecision of the regulatory body);
- Methods and software have been adopted for Level 1 PSA;
- Several preliminary studies have been performed for the WWER-1000 reactor (related results andcomments are presented):
(a) standardized V-320 (Rostov plus Unit 4 Balakovo);(b) backfitting design V-320 (Unit 5, 6 Balakovo);(c) V-392 (Loviisa);(d) new design V-392 (NPP-92 project).
A list of initiators was presented (eight groups of initiators). Analyses were performed for fullpower operation. A generic database was used. Common cause failures (CCFs), human errors (HEs)and accident management measures were taken into account.
The goals of these PSA analyses include:
- contribution of studied IE groups to core damage frequency (CMF);- dominant contributors to CDF identification;- development of measures for improving safety;- evaluation and verification of new designs.
The conclusions of this paper address several problems that have to be solved in order to performfull scale PS As.
The Bulgarian contribution gave a project background of the PSA study for Units 5 and 6 of theKozloduy NPP. This study will provide input for FSAR upgrading (Level 1). Accident sequences

from internal events, including fires, and accident sequences from earthquakes are in the projectscope. It is intended to use the computer code PSAPACK (version 4.2) for the analysis. The overallperiod of this study is 26 months from 1 June 1992. The project organization and quality assurancewere also presented.
The background to the preparation of the Dukovany NPP probabilistic safety assessment study,its goals and its programme are mentioned in the CSFR contribution. This study was done in co-operation with almost all Czechoslovak institutions working in the field of PSA. Fourteen initiatingevents were chosen and analysed for the preliminary PSA study and reviewed by the CzechoslovakPSA team and by the Dukovany NPP staff in early 1992. The Risk Spectrum FT PLUS code wasused for analyses of 21 front line and support system fault trees. The course of the project,assumptions, methods used, database, common cause failures and human factor analyses are brieflydescribed. Some experiences in the preparation of this study and comments on its results are alsopresented. The expected course of additional analyses for the final version of the PSA study and PSAactivities for 1992 and the near future in Czechoslovakia are added in conclusion. References inreliability analysis and PSA analysis in Czechoslovakia are included. The fifth contribution extendedinformation given in the CSFR 'overview paper'; further information concerning a reliability analysiswith Tree Master code for Bohunice NPP which has a V-230 reactor was provided.
The next three contributions comprise information on a co-operation between western and easternspecialists devoted to NPPs in eastern European countries. In addition, this contribution providedinformation on the status and the scope of the PSA activities in eastern Europe.
The first of these contributions is devoted to the UK-Russian collaboration on PSA for RBMKreactors. It presented urgent steps which were taken after the Chernobyl accident to prevent anyrecurrence of such an accident on the RBMK reactors and subsequent improvements in the longerterm which have further reduced the probabilities of severe accident. As the older reactors arereconstructed, major improvements in safety systems are made possible. Preliminary results of safetyassessments suggest that RBMK safety may become comparable with that of many older westernplants, which have also been subject to requirements to improve safety.
The next contribution, from RELCON, Sweden concerned the Barselina project, which wasinitiated in mid-1991. The project is a multinational co-operation between Lithuania, Russia andSweden, with the long range objective of establishing common perspectives and unified bases for theassessment of severe accident risks and needs for remedial measures for the RBMK reactors. TheSwedish BWR Barsebäck is used as reference plant and the Lithuanian RBMK Ignalina as applicationplant. The Barselina project cannot be looked upon as a traditional PSA; the scope and objectives ofthe PSA activities were modified according to the general objective. PSA is in this context used asa tool to achieve this common understanding between the project parties. This report constituted astatus report for Phase 2 of the project prepared in August 1992. The project will last until October1993; the qualitative part of the initiating event analysis and the qualitative part of the accidentsequence analysis have already been performed.
The last contribution in this group concerns the participation of Westinghouse in the WANO SixMonth Programme for Kozloduy. The project is in four parts:
Part 1 : To assess the applicability of the Greifswald PSA to the Kozloduy plant (to identify initiatingevents that could lead to pressurized thermal shock to the reactor vessel).
Part 2: Reliability analysis of the safety injection system, the confinement system and the emergencyfeedwater system (fault tree, generic data, recommendations for improvements).
Part 3: Probabilistic pressurized thermal shock evaluation.

Part 4: Preparation of the Kozloduy specific MAAP input parameter file (for large steamline breakand station blackout analyses).
The last contribution of this session was prepared by the utility operating Temelin NPP in theCSFR. Construction of Temelin NPP was started in 1986 and four units of the Soviet WWER type1000 were planned originally. In 1989 the construction of Units 3 and 4 was canceled and Units 1and 2 became the subject of several reviews and many important design changes. The goal of thisprocess is the so-called 'westernization' of the plant (i.e. the NPP should be able to meet licensingrequirements assumed to apply in western countries in the mid-1990s). A formal tendering processto perform a PSA study was started in February 1992. The general purpose of this task is to providesystematic examination of Temelin NPP Unit 1 for severe accident vulnerability resulting from aLevel 2 PSA. The scope includes both internal and external hazards.
2.3. STATUS OF PSA IN CIS AND EASTERN EUROPE: SUMMARY OF WORKING GROUPACTIVITIES
2.3.1. PSA activities
The status of PSA related activities that are carried out in eastern Europe and in the CIS countriesis presented on the basis of information made available during the TCM, either in the paperspresented or in the course of working group discussions. Since not all countries in the region thatoperate NPPs were represented at the meeting, the information is not complete. All availableinformation concerning PSA related activities is presented in the form of project information sheetsand summary tables. Project information sheets give the operating country, the plant name and type,project schedule, sponsors and organizations in charge, and the project objectives and the scope.Further comments are included.
A summary of information is provided in tabular form. Table I includes brief information onNPPs operated in the region. Tables II-VI present basic information on PSA projects carried out(or performed recently) in the region. Various types of NPPs are addressed. Information includedis limited to plant name, PSA scope and the project objectives. Reference to specific presentationsis also made where applicable.
Text cont. on p. 17.

TABLE I. NPPs OPERATED IN CIS AND EASTERN EUROPEAN COUNTRIES
COUNTRY
CZECHOSLOVAKIA
ROMANIA
LITHUANIA
HUNGARY
SLOVENIA
POLAND
FINLAND
BULGARIA
UKRAINE
RUSSIA
PLANT
VI - BOHUNICEV2 - BOHUNICEDUKOVANYMOCHOVCETEMELIN
CERNAVODA
IGNALINA
PAKS
KRSKO
ZARNOWIEC
LOVIISA
KOZLODUY
ROVENSKAYA
CHERNOBYL
ZAPOROZHSKAYAKOLA
NOVO-VORONEZHBALAKOSKAYAKALININSKAYAVORONEZHNIZHNYNOVGOROD
LENINGRADSMOLENSKKURSK
BELOYRSKAYA[DESIGN]
REACTOR TYPE
WWER - V230 X 2WWER - V213 X 2
WWER - V213 x 4WWER - V213 X 4WWER - V320 x 2
CANDU 600
RBMK - 1500 X 2
WWER - V213 X 4
PWR W
WWER - V213 x 2
WWER - V230 x 2
WWER - V230 X 4
WWER - V213 x 2WWER - V320 X 2
RBMK 1000 x 2
WWER - V320 X 5WWER - V213 X 2WWER - V230 X 2WWER - V230 X 2WWER - V320 x 4WWER - V320 X 1NDHP AST-500 X 2NDHP AST-500 X 2
RBMK X 1000 X 4RBMK x 1000 x 3RBMK x 1000 x 4
BN 600 BREEDER600 MWe

TABLE II. PSA PROJECTS CARRIED OUT FOR RBMK NPPs
PLANT
IGNALINA 1&2(LITHUANIA)
CHERNOBYL 1&3(UKRAINE)
LENINGRAD l^t(RUSSIA)
SMOLENSK 1-2-3(RUSSIA)
KURSK 1, 2, 3, 4(RUSSIA)
TOTAL
No.
2
2
4
3
4
15(in operation)
PSA SCOPE
LEVEL 1. NO. EEs,LIMITED TREATMENTOF THE HUMANFACTOR
PRELIMINARY Level 1MADE FOR UNIT 1 WILLSOON BE COMPLETED
OBJECTIVES
ASSESSMENT OFTHE RISK OF THERBMK
ASSESS THEEFFICIENCY OF THECHERNOBYLIMPROVEMENTS
COMMENTS
RBMK 1500REF: PAPER OF Mr.D. WILSON
PAPER OFMR. HOLLOWAY
12

TABLE III. PS A PROJECTS CARRIED OUT FOR WWER-320 NPPs
PLANT
TEMELIN 1.2(CZECH)
KOZLODUY 5.6(BULGARIA)
ZAPOROZHKAYA(UKRAINE 1 TO 5)
ROVENSKAYA 3(UKRAINE)
BALAKOSKAYA(RUSSIA)
KALINISKAYA
TOTAL
No. OFUNITS
2'
2
5
,
4
1'
PSA SCOPE
LEVEL 2 - + EEs PARTIALSHUTDOWN LIVING PSA
LEVEL 1 + FIRE + SEISMIC
FULL SCALE LEVEL 2 +ESTIMATED DOSES ATDIFFERENT DISTANCE OF NPP.ffisANDEEs.
FULL SCALE LEVEL 2+ ESTIMATED DOSES ATDIFFERENT DISTANCE OF NPP.I Es and EEs.
PRELIMINARY MADE FOR UNIT 4MODIFICATION OF THESTANDARDIZED DESIGN, SOMEIBs FULL POWER OPERATIONONLY
OBJECTIVES
I. FULFILL IAEARECOMMENDATIONS
2. ASSESS ANDUNDERSTAND PLANTRESPONSE
3. TRANSPORT PSA TOEVERYDAY USE
EVALUATE THECONTRIBUTION OF IBs.IDENTIFY MAINCONTRIBUTIONS.EVALUATE MAINMODIFICATIONSEVERE ACCIDENTMANAGEMENT
COMMENTS
PAPER OFMR.FERJENCIK
MAYBEBROADENEDTO INCLUDEALL CCI ANDEE. REF:PAPER OF MR.KOLEV
INCLUDEDCOLDSHUTDOWNAND FUELOPERATION
INCLUDEDCOLDSHUTDOWNAND FUELOPERATION
* In construction.
For the Russian reactors, see reference paper of Mr. Shvyrayev.
13

TABLE IV. PSA PROJECTS CARRIED OUT FOR WWER 213 NPPs
PLANT
BOHUNICE 3&4(CZECH)
DUKOVANY 1-2-3-4(CZECH)
MOCHOVCE 1-2-3-4(CZECH)
PAKS 1-2-3-4(HUNGARY)
KOLA 3&4(RUSSIA)
ROVENSKAYA 1&2(UKRAINE)
ZARNOWIEC 1&2(POLAND)
TOTAL
No. OF UNITS
2
4
4*
4
2
2
2"
PSA's SCOPE
LEVEL 1SEISMIC
LEVEL 1 + FIRE
LEVEL 1
LEVEL 1 + IBs
NOT FORESEENAT THEPRESENT TIME
FULL SCALELEVEL 2 IBsAND EEsSHUTDOWNCONDITIONSAND FUELTRANSPORTOPERATION
LEVEL 1.LIMITEDNUMBER OFIBs (6). LIMITEDTREATMENT OFHEs
OBJECTIVES
RE-EVALUATION OF FSAR
SAFETY ANALYSESMODIFICATION SAFETYASSESSMENT
QUANTIFICATION OF CDF
IDENTIFICATION OFWEAKNESS SUPPORT OFINSPECTIONS AND HQPROCESS
COMMENTS
FOLLOWSDUKOVANY PSA
INTENTION ATTHE PRESENTTIME
REF: PAPER OFMR. HOLLO
20 14 IN +2 LOVIISA 213 MODIFIED(+2) OPERATION LEVEL 1 COMPLETED + IE
4 UNDER DEVELOPMENT: LEVEL 2CONSTRUCTION LIVING PSA2 CANCELLED
* Under construction.** Cancelled.
14

TABLE V. PSA PROJECTS CARRIED OUT FOR WWER 230 NPPs
PLANT
BOHUNICE 1&2(CZECH)
KOZLODUY 1-4(BULGARIA)
KOLA 1&2(RUSSIA)
NOVO-VORONEZH3&4(RUSSIA)
TOTAL
No. OFUNITS
2
4
2
2
10(in operation)
4 units(Greifswald)
2 units(Armenia, out
of service)
PSA SCOPE
LEVEL 1 + IBs(FIRE ANDFLOOD)
(1) TOP LEVELRISK
STUDY
(2) 6-MONTHWANOPROGRAMME
OBJECTIVES
SAFETYEVALUATION OFTHEMODIFICATION
SAFETYASSESSMENT OFTHEMODIFICATION
EVALUATE BYPSATECHNIQUESTHE MOSTPRESSINGISSUESDETECTEDDURING WANOMISSIONS
COMMENTS
MADE BYELECTRO-WATT
15

TABLE VI. PSA PROJECTS CARRIED OUT FOR OTHER TYPES OF NPPs
PLANT
CERNAVODA(ROMANIA)
KRSKO(SLOVENIA)
VORONEZH
NIZHNYNOVGOROD
BELOYRSKAYA
[DESIGN]
No.OF
UNITS
1
1
2
2
1
X
PS A' s SCOPE
FULL SCOPELEVEL 1 - 1994 +LEVEL 2,3 +LIVING PSA
LEVEL 1 (92-93)LEVEL 2PRELIMINARY(93-94)
LEVEL 1 - IBs
LEVEL 1
LEVEL 1 - SOMETASKS OFLEVEL 2 (92- 94)
OBJECTIVES
- FOR LICENSINGPURPOSE
- DESIGNEVALUATION
QUANTIFICATIONOFCDF
QUANTIFICATIONOFCDF
QUANTIFICATIONOFCDF
COMMENTS
CANDU
PWR W
NDHP AST-500
BREEDER
600 MWeENHANCEDSAFETY PLANT
16
Based on the information provided during the TCM, some general observations can be madeconcerning PSA activities carried out in the region.
It may be concluded that PSA work on relatively new designs/plants (WWER-1000/V320,WWER-440/V213) is relatively well advanced. With very few exceptions these plants are the subjectof PSA analysis (5 out of 6 listed NPPs of the V320-type and 6 out of 7 listed NPPs of the V213-typewere addressed).
However, the scope of PSA projects (completed or under way) is limited. All these projectscover Level 1 analyses. Shutdown risk and detailed external event analyses have not been performed.Some methodological shortcomings are also observed (see Sections 2.3.2 and 2.3.3).
Older designs/plants are not well covered by current PSA activities. For WWER-440/V230 NPPsonly a few projects were reported:
- A full scope (internal events) PSA study for Bohunice 1 and 2 (Level 1) has just been started(performed by EWI, United Kingdom, financed by PHARE). It is expected to be ready within14 months.
- The Kola PSA is not complete; it was done by a relatively inexperienced team without any PSAbackground (to be reviewed by the IAEA soon).
- The Greifswald PSA is not complete; no cut-sets were generated and the results are not usefulfor any other plant.
- A full scope PSA study for Kozloduy 1-4 has not been started yet (a six months WANOprogramme which was started after the change of TS is not leading to a PSA study).
No project for PSA for Novovoronezh 3-4 is reported to be carried out or planned.
- There are only very limited activities concerning PSA for RBMK NPPs.
- A Level 1 PSA (for internal events only and with limited treatment of HEs) is carried out withinthe framework of the Ignalina project and a preliminary Level 1 study will be completed soon forLeningrad (Unit 1).
2.3.2. PSA methodology
Detailed information concerning the status of PSA methodology gathered from countriesparticipating in the TCM was arranged in the form of information sheets. The most importantelements of PSA modelling were addressed, including:
- accident sequence modelling;system analysis;
- data assessment;- treatment of dependencies;- treatment of human errors;
accident sequence quantification;external events modelling;
- living PSA.
The following general observations were made concerning the PSA methodological approach asimplemented in eastern Europe and CIS countries:
17
Methodological framework for Level 1 PSA is adopted, practically in all countries of the region.It includes procedural/methodological aspects and computer software as well as some practicalexperience in performing Level 1 PSA;
Not all capabilities and expertise has been implemented in plant specific PSA, completed so far.However, PSA practitioners are aware of existing limitations. Appropriate improvements areunder way;
Certain PSA areas need more consideration. Some assistance in providing the out-of-regionexpertise will be needed for completion of the current PSA projects and their extension to satisfythe world's standard, and to establish the basis for use of PSA results in safety related decisionmaking. More detailed information concerning open issues in PSA methodology is provided inSection 2.3.3.
2.3.3. Open issues
Based on the information provided during the meeting on PSA methodological status and thestatus of PSA projects carried out in various countries a number of issues was identified, that requiresome more attention in the future. These issues are related to both methodological aspects of existingPS As and to the status of PSA activities in the countries. The following general issues have beenidentified:
Data assessment
Credibility of existing and future PSAs should be increased by improving the data assessmentprocess. Existing PSAs are based mainly on generic sources. WWER specific data for IBs do notexist either.
There are no systematic component reliability data collection systems in NPPs, so that thefeasibility of plant specific data is generally limited. The exchange of available reliability data isalmost inevitable. This data exchange is supposed to be done in the framework of RER/9/005.
Plant specific data gathering systems established in some plants are not always appropriate forPSA use. The problem is even more severe in case of future applications (e.g. optimization ofoperational strategies) where more advanced data analysis techniques should be implemented.
Plant response evidence
Available plant response evidence has been found to be insufficient to support PSA models inmost of the existing PSAs. This shortcoming is related to both IE grouping and to ET logic. Forsome types of plants the situation is very unsatisfactory (e.g. RBMK, WWER/V230).
Analyses are being done for major accidents under the six month WANO programme forKozloduy but PSA related scenarios are not covered.
Additional analyses has been made for Bohunice 1 and 2 (VUJE, Trnava) but may not besufficient for realistic ET modelling (additional clarification is necessary).
More effort should be made to clarify LOCA categorization and to define best estimate successcriteria. In some cases a more precise modelling of core behaviour is also required, e.g. calculationof core asymmetry in order to determine possible local criticality or even core damage.
18

2.3.4. Future activities
The future activities in the region should be directed to the following major areas:
- Improvement in quality of PSA;- Broadening range of PSA applications;- Increasing practical implementation to address every operating plant in the region.
Improvement in quality of PSA should concentrate on specific topics discussed in Section 2.3.3,i.e. data assessment, initiating events, plant response thermal hydraulic analysis, human reliability andincorporation of external hazards analysis.
The scope of PSA should be extended to consider shutdown risk. Extension of PSA from Level 1to Level 2 is also very advisable, since it establishes the basis for accident management measures anddevelopment of emergency procedures.
In order to establish risk oriented safety management, the PSA extension directed to optimizationof operational tasks, risk based regulation, and assessment of operational experience is of particularinterest.
Majority of topics mentioned above are covered by the Regional Programme RER/9/005 "PSAfor WWER type Reactors" that is extended for the years 1993-1994.
The work plan for this project for 1993 was discussed during the special session of the TCM.
2.3.5. Summary tables on PSA projects
Country
Plant(s)
Type
Schedule
Sponsor(s)
Organization(s) in charge
Objective(s)
Scope
Comment(s)
Bulgaria.
Kozloduy 1 and 2 (Units 1-4).
WWER/440-230.
November 1991 - March 1992.
Bulgarian Government.
EQE International.
Logical approach to identify the modification significantly increasingthe plant safety by assessment of qualitative risks.
Adopted western type fault schedule.
ET model based on plant response knowledge.
Quantification based on engineering judgement and data from theavailable analyses.
Simplified risk model and comparative analyses of existing andmodified configuration including associated costs.
Top level risk study (not a PSA).
19

Country
Plant(s)
Type
Schedule
Sponsor(s)
Organization(s) in charge
Objective(s)
Scope
Comment(s)
Bulgaria.
Kozloduy 1 & 2 (units 1-4).
WWER/440-230.
June-November 1992.
PHARE PR-ME of CEC.
West ESI, Belgium Branch.
Evaluate by PSA techniques the most pressing issues identified duringWANO and IAEA missions to Kozloduy.
Review of Greifswald PSA and its applicabilities to Kozloduy.
SRA for three safety systems.
To identify IBs and sequences leading to excessive cooldown (PTS)ofRPV.
Preparation of MAAP parameter file and test runs.
WANO six month programme for Kozloduy (item 4 PSA); it may becontinued to a Level 1 PSA.
20

Country
Plant(s)
Type
Schedule
Sponsor(s)
Organization(s) in charge
Objective(s)
Scope
Comment(s)
Bulgaria.
Kozloduy 3 (Units 5 and 6).
WWER-1000.
June 1992-September 1994.
Utility.
Risk Engineering Ltd.
Provide support for upgrading FSAR.
Provide assess of plant safety.
Provide base for the use of PS A for plant operational issues.
Through analysis, grouping of IBs and corresponding frequency.
Accident sequence and for all internal independent initiators.
Analysis of fire risk as dominating CCI.
Seismic risk and dominating external initiators.
Kozloduy 3 PS A project; it may be broadened to include all CCI andexternal events.
21

Country
Plant(s)
Type
Schedule
Sponsor(s) :
Organization(s) in charge
Objective(s)
Scope
Comment(s)
Hungary.
Paks NPP.
V213 X 4.
1991-1993.
Hungarian Atomic Energy Commission — Level 1 PS A.Paks Utility — PSA application.
VEIKI — co-ordination.EROTERV Design Company.Budapest Technical University.KFKI AEKI.
Quantification of core damage frequency by analysis of eventsequences.
Level 1 PSA for internal IBs.
The Level 1 PSA of Paks NPP is part of the AGNES project. Theprimary objective of AGNES is to assess the safety level of PAKSNPP by the use of up-to-date techniques (see also paper by E. Hollo,Hungary). All PSA activities in AGNES are co-ordinated by VEIKIbut other national and foreign institutions are involved in the analysestoo. The future goal is to extend the PSA to external events andshutdown risk. These activities are planned for the second half of1993.
Not all the necessary thermal hydraulic calculations have beenperformed so far to support event developments and accident sequencemodelling.
22

Country
Plant(s)
Type
Schedule
Sponsor(s)
Organization^) in charge
Objective(s)
Scope
Comment(s)
Reference(s)
Czechoslovakia.
Temelin.
WWER-V320 x 2 under construction + core design replacement.
Level 1 is to start in the first half of 1993.
CEZ a.s. (Czech Electricity Board).
Is being selected.
To fulfill IAEA recommendations.
To assess and understand plant response.
To transfer PSA to everyday use.
Levels 1 and 2 + external events.
Partial shutdown.
Living PSA model.
Paper by Mr. Ferjencik.
23

Country :
Plant(s) :
Type :
Schedule :
Sponsor(s) :
Organization(s) in charge :
Objective(s) :
Scope :
Comment(s) :
Czechoslovakia.
Mochovce.
WWER-V213 x 4 under construction.
Start in 1994.
Level 1.
Is intended.
Country
Plant(s)
Type
Schedule
Sponsor(s)
Organization(s) in charge
Objective(s)
Living PSA
Scope
Comment(s)
Reference(s)
Czechoslovakia.
Dukovany.
WWER-V213 x 4.
Preliminary, 1989-1991.Provisional, 1992-06.1993.Final, 06.1993-12.1993.Living PSA model, 1992-1994.
CSAEC (CSKAE) - Czechoslovak Regulatory Body.
NRI (UJV) Rez.
Tool to safety analyses to assess safety problems in NPP operation todetermine usefulness of possible modifications.
Risk based technical specifications assessment.
Results of the above mentioned Dukovany Unit 1 PSA will beinvolved.
Level 1 + internal fires.
Reference study for next specific studies for V-213.
Basis for living PSA.
Papers by Mr. Dusek, Ms. Novakova, Mr. Stanicek, Mr. Hojny andMr. Cillik.
24

Country
Plant(s)
Type
Schedule
Sponsor(s)
Organization(s) in charge
Objective(s)
Scope
Comment(s)
Reference(s)
Czechoslovakia.
V2-Bohunice.
WWER-V213 2x2 under construction.
Start in 1993.Duration: 18 months.
Slovak Government.
NPPRI (VUJE) Trnava.
Re-evaluation of FSAR.
Level 1 + external events (seismic).
In frame of after years period re-evaluation of FSAR.
Results of PS A for Dukovany will be extensively used.
Paper by Mr. Cillfk.
Country
Plant(s)
Type
Schedule
Sponsor(s)
Organization(s) in charge
Objective(s)
Scope
Comment(s)
Czechoslovakia.
Vl-Bohunice.
WWER-V230 x 2.
Start August 1992.Duration: 16 months.
PHARE (CEC).
Electrowatt with assistance from VUPEX and VUJE.
Level 1 PS A of plant (as of July 1991) and evaluation of proposedmodifications of safety systems.
Level 1 + internal events (includes fires and floods).
This analysis is in the initial phase with the main activities being thoseof documentation collection and plant familiarization.
25

Country
Plant(s)
Type
Schedule
Sponsor(s)
Organization(s) in charge
Object! ve(s)
Scope
Comments(s)
Finland (more details from Reino Virolainen (STUK), Jussi Vaurio(IVO).
Loviisa 1/11.
WWER-440.
Level 1, completed 1991 — (internal events) including humanreliability.
Imatran Voima Oy (IVO).
Imatran Voima Oy (IVO).
Assess the safety of the plant and detect the weak points.
Improve plant operation training.
Level 1 - internal events.
Fire analysis completed recently.
Refuelling analysis in planning.
Level 2 analysis in planning.
Living PS A development started.
26

Country
Plant(s)
Type
Schedule
Sponsor(s)
Organization(s) in charge
Objective(s)
Scope
Comment(s)
Lithuania.
Ignalina.
RBMK-1500 MW.
Phase 1 (mini-PSA), October 1991 - April 1992.Phase 2 (limited Level 1), April 1992 - December 1992.Phase 3 (extension Level 1), December 1992 - October 1993.
Multilateral co-operation between Lithuania, Russia and Sweden.
Sweden — ES-Konsult AB, IPS AB, RELCON AB, Sydkraft KonsultAB, ABB Atom AB, Studsvik AB.
Russia — Research and Development Institute of Power Engineering,RDIPE, Kurchatov Institute, Russian Federation Regulatory Body.
Lithuania — Ignalina NPP, Lithuanian Energy Institute of Kaunas.
General: Establish common perspectives and unified bases forassessment of severe accident risks and needs for remedial measuresfor the RBMK reactors.
Phase 2: Limited Level 1 PSA excluding external events and limitedtreatment of human factors.
Phase 3: Extension of the Level 1 PSA in areas selected in Phase 2.
The project includes the training of the Russian and Lithuanian PSAteams in Sweden and at the Ignalina NPP.
27

Country
Plant(s)
Type
Schedule
Sponsor(s)
Organization(s) in charge
Objective(s)
Scope
Comment(s)
Poland.
Zarnowiec.
WWER-440/V213.
1988/1991.
Regulatory Authorities.
Institute of Atomic Energy, Swierk and Central Lab. for RadiologicalProtection.
Understanding of safety implication of plant design details,identification of weak points, supporting inspections and qualityassurance process.
Level 1, limited number of IBs (6), limited treatment of HEs.
The PS A was terminated due to cancellation of NPP project in 1991.Some activities are continued as an exercise in creating and perfectingmethodological framework and in preserving existing expertise. PS Awork is also continued with relation to off-site emergencypreparedness, geared to an accident in foreign installation.
28

Country
Plant(s)
Type
Schedule
Sponsor(s)
Organization(s) in charge
Objective(s)
Scope
Comment(s)
Romania.
Cernavoda. Under construction.Planned operation 1994 (first unit).
CANDU-600.
CPSE (Cernavoda Probabilistic Safety Evaluation).Limited scope CPSE Level 1, 1991.Full scope CPSE Level 1, 1994.Data collection system, 1994.Living CPSE, 1995.Levels 2 & 3 CPSE, 1994.
Romanian Power Utility (RENEL).Technical Assistance: IAEA.
Institute for Power Studies and Design, Nuclear Department.Institute for Nuclear Research.Cernavoda Nuclear Safety Group.
Develop the probabilistic model of Cernavoda plant and applicationsin order to be used for providing the PSA study required for licensing(as support documentation); early design evaluation; nuclear safetyevaluations during plant operation.
Full scope Level 1 PSA.
Levels 2 and 3.
Limited scope CPSE Level 1 (about 50% of full scope CPSE) wascompleted in 1991. An IAEA IPERS mission reviewed the study atthe end of 1990.
29

Country :
Plant(s) :
Type :
Schedule :
Sponsor(s) :
Organization(s) in charge :
Objective(s)
Russia.
Zapozozhskaya.
WWER-320 X 5.
1992-1994.
Zapozozhskaya NPP.
Atomenergoprojekt, OCB Hydropress, Kurchatov Institute.
Full scale Level 2 PSA with estimated population dose commitmentsat different distances from NPP.
Internal and external IBs (involved seismic, air crash, internal fire andflooding).
Operational mode:- power operation,- cold shutdown (refuelling),- fuel transport operation into containment.
Radioactive sources:- core,- spent fuel pool.
Specific database on IE and component reliability.
30

Country
Plant(s)
Type
Schedule
Sponsor(s)
Organization(s) in charge
Objective(s)
Scope
Comments
Russia.
Beloyzskaya NPP (Unit 3) Ekaterinburg.
Fast reactor (breeder) 5H-600.
1992-1994.
Beloyzskaya NPP.
OKB Mechanical Engineering Physical Power Institute (Obninsk).Beloyzskaya NPP.
Quantification of core damage frequency by analysis of event treessequences (internal events).
Level 1 PSA.
Country
Plant(s)
Type
Schedule
Sponsor(s)
Organization(s) in charge
Object! ve(s)
Scope
Comment(s)
Russia.
Nuclear District Heating Plant (NDHP), Voronezh.
AST-500 (reactor with enhanced safety).
1992-1994 (Level 1).1993-1994 (Level 2 preliminary).
Voronezh NDHP.
OKB Mechanical Engineering N. Novgozod Atomenergoprojekt.
Quantification of core damage frequency by analysis of event treessequences (internal, some external events).
Level 1 PSA.
Level 2 PSA (preliminary).
Operational mode:- power operation,- fuel transport operation.
PSA is used in confirmation of the achieved enhanced safety level.
31

Country
Plant(s)
Type
Schedule
Sponsor(s)
Organizations) in charge
Objective(s)
Scope
Comment(s)
Russia.
Nuclear District Heating Plant (NDHP), Nizhuy Novgorod .
AST-500 2 x 500 (enhanced safety reactor).
1992.
Government.
OKB Mechanical Engineering (N. Novgozod).
Quantification of core damage frequency by analysis of event treessequences (internal events).
Level 1 PS A for internal events.
Operational mode:- power operation,- fuel transport operation.
PS A is used in confirmation of the achieved enhanced safety level.
Country
Plant(s)
Type
Schedule
Sponsor(s)
Organization(s) in charge
Objective(s)
Scope
Comment(s)
Russia.
(Design).
Water enhanced safety power reactor, 600 MWe [WPBER-600], (newgeneration reactor with enhanced safety).
1992-1994.
Government.
OKB Mechanical Engineering, N. Novgozod Atomenergoprojekt.
Quantification of core damage frequency by analysis of event treessequences (internal and external events).
Level 1 PSA .
Some tasks of Level 2 PSA.
PSA is used for engineering decisions choice (at early stages) and inconformation of the achieved safety level.
32
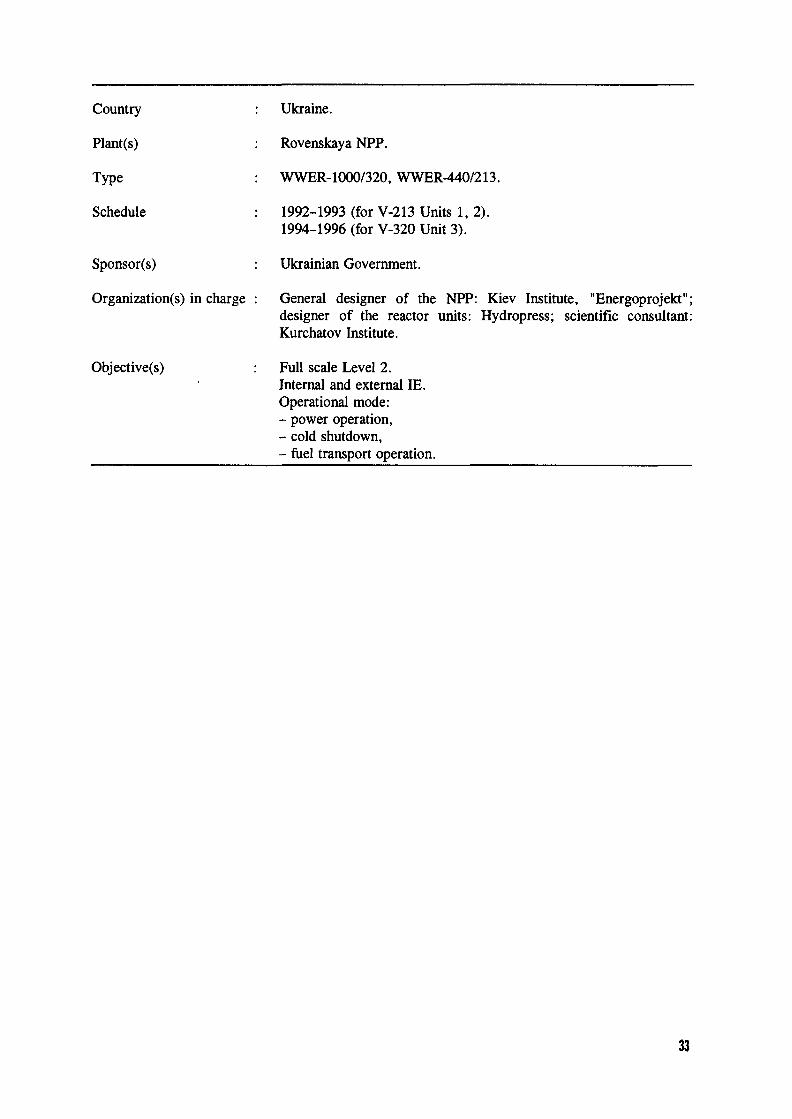
Country
Plant(s)
Type
Schedule
Sponsor(s)
Organization(s) in charge
Objective(s)
Ukraine.
Rovenskaya NPP.
WWER-1000/320, WWER-440/213.
1992-1993 (for V-213 Units 1, 2).1994-1996 (for V-320 Unit 3).
Ukrainian Government.
General designer of the NPP: Kiev Institute, "Energoprojekt";designer of the reactor units: Hydropress; scientific consultant:Kurchatov Institute.
Full scale Level 2.Internal and external IE.Operational mode:- power operation,- cold shutdown,- fuel transport operation.
33

2.3.6. Summary tables on PSA methodology
____________STATUS OF PSA METHODOLOGY IN BULGARIA____________
Accident sequence modelling
- due to lack of T/H analyses, ETs often based on engineering judgement;
for Kozloduy-3 PSS, extensive T/H analyses would be done for ET modelling and plant successcriteria (MAAP code is planned to be used);
core damage states' definitions depend on Level 2 methodology and are not sufficiently clear.
System reliability analysis
number of systems for Kozloduy 1 and 2 analysed;
- problems exist with some aspects of modelling, when there are complex functional dependenciesbetween components and/or subsystems, especially in C&I circuitry.
Data
generic data used up to now;
- operational data not sufficient for plant specific database. Additional guidance necessary on theuse of Bayesian analysis for combining generic data with plant evidence;
component unavailability processed using PSAPACK options; they are not flexible enough.
Dependent events
MGL and B-factor methods used with generic data;- CCF explicitly modelled on FT level.
Human factors
Swain-Guttmann methodology used with different level of complexity;- use of full scope S-G Handbook impossible because of lack of data.
Quantification
PSAPACK version 4.2 (problems exist in both user interface and inter-module interfaces. Theresults often cannot be documented in a convenient way).
Living PSA and risk monitoring
no base-risk study is ready yet;
- methodologically, risk monitoring tools have to be prepared in advance.
External events
- Internal CCI: fire hazard methodology available, but not computer codes.EQs: seismic risk integration methods necessary.
34

STATUS OF PSA METHODOLOGY IN HUNGARY
Accident sequence modelling
Over 60 event trees have been developed for Paks PSA until now. These event trees are based oncurrently available thermohydraulic analysis results (limited scope) and simulator experience. Theupgrading of event trees is planned for 1993. Presently it is an open issue whether all the necessaryplant response calculations can be carried out to verify existing accident sequences within thistimeframe.
System analysis
PSA related system analyses have been carried out in close co-operation with four national institutionsincluding the utility itself. The only open issue related to this topic is the level of detail to which C& I subsystems should be modelled. It should be noted that this problem is strongly linked with theissue of available failure data (see below).
Data assessment
A combined plant specific and generic database is going to be used for component as well as forinitiating event data. The PSA oriented data collection system has been in use at Paks NPP since1989. The analysis of collected plant specific data is currently going on. The compilation andfeasibility of generic database (in the sense of WWER type specific data) is of real concern. WWERtype specific data are planned to be gathered by the help of the IAEA and GRS, Germany.
Treatment of dependencies
The analysis of dependencies is going in parallel with fault tree and event tree modelling. The maindeficiency here is the input data again for common cause failures. This problem arises whatevermodel is used for quantification of CCFs because currently available type specific data doesn't supportCCF analysis. At this stage it seems to be more beneficial to get some qualitative insights concerningthe impact of CCFs in overall risk of the plant.
Treatment of human errors
Human errors are broken down to three categories in the Paks PSA as follows:
- human errors as initiators;- pre-accident human errors;
post-accident human errors.
The human errors as initiators are taken into account in the frequency of initiating events by analysisof available data. Pre-accident human errors are analyzed according to the ASEP HRA ProcedureGuide (plant specific data are also processed to quantify HE probabilities). For the modelling of post-accident human errors and analysis of user performance during accident conditions a sequence ofoperator reliability experiments will be carried out using the full scope simulator at Paks NPP.
Accident sequence quantification
According to the time schedule of Paks PSA, this task is planned for 1993. RISK SPECTRUM PSAcode is to be used for quantification.
35

STATUS OF PSA METHODOLOGY IN HUNGARY (cont.)
External events and shutdown risk
Concerning the PSA in the AGNES project the continuation of current activity will be the extensionof Level 1 PSA to the analysis of external events and plant shutdown conditions. These activities areplanned to be performed from the second half of 1993. No prioritization has been set up for theseanalyses (i.e. shutdown risk versus external events). No practical experience exists in treatment ofexternal events nor shutdown risk.
PSA applications
PSA results will be used depending on the needs of the utility. This statement applies to living PSA,Technical Specification evaluation, AOT and STI optimization as well. Some experience exists in thearea of technical specification evaluation.
STATUS OF PSA METHODOLOGY IN CZECHOSLOVAKIA
Accident sequence modelling
State of the art: -
Problems:
System analysis
State of the art: -
Problems:
the conventional event tree method was used for 14 initiating events (PSANPP Dukovany) - RISK SPECTRUM PSA code;
conservative approach — interval 24 hours was accepted as a maximum timeinterval for development of accident sequences; no recovery action wasconsidered (NPP Dukovany);
some events were analysed by two independent groups of analysts (PSADukovany);
analysis was reviewed during the spring 1992 by all members of the PSADukovany team.
best estimate assessment criteria;
ET modelling versus lack of thermohydraulic analyses.
21 safety significant systems were analysed by the fault tree method — RISKSPECTRUM PSA code (NPP Dukovany PSA study).
boundary of systems, modularization;
transfer of FT from other ET;
level of detail of FT analysis is unbalanced in some ET models.
36

STATUS OF PSA METHODOLOGY IN CZECHOSLOVAKIA (cont.)
Data assessment (including initiators)
State of the art: - data for preliminary PSA study (draft) of NPP Dukovany was prepared step-by-step from generic to specific data; three versions of database weredeveloped gradually. NPP Dukovany staff will prepare and verify databasefor final version of PSA study.
Problems: - collection and verification of data in NPPs for PSA user;expression of real duration of maintenance and repair;boundary of components;a lack of data for initiators;completeness of initiators.
Treatment of dependencies
State of the art: - CCF methodology was compiled from different approach;B-factor was used for quantification (generic B-factor or based on engineeringjudgement);structural dependencies = priority events;a refinement of CCF consideration.
Problems: - common cause initiators;B-factor for more than two redundant components.HRA modelling according to its importance and frequency of operationalactions.
Treatment of human error
State of the art: - ASEP-HRA methodology (Swain, A.D., NUREG/CR-4772) partiallymodified by some procedures from the THERP methodology (Swain, A.D.,Guttmann, H.E., NUREG/CR-1278), expert recommendations providedwithin the framework of IAEA Regional Project RER/9/005 (J.K. Vaurio);human errors related to normal operational conditions before an accident andhuman errors made after event (only prescribed activities) were taken intoaccount.
Problems: - human error quantification;conservatism of recovery actions.
Accident sequence quantification
State of the art: - RISK SPECTRUM PSA code is used.
Living PSA
State of the art: - no experience exists.Problems: - choice of software, transfer of 'know-how'.
External events
State of the art: - fire (internal) initiating events were analyzed in preliminary NPP DukovanyPSA study.
37
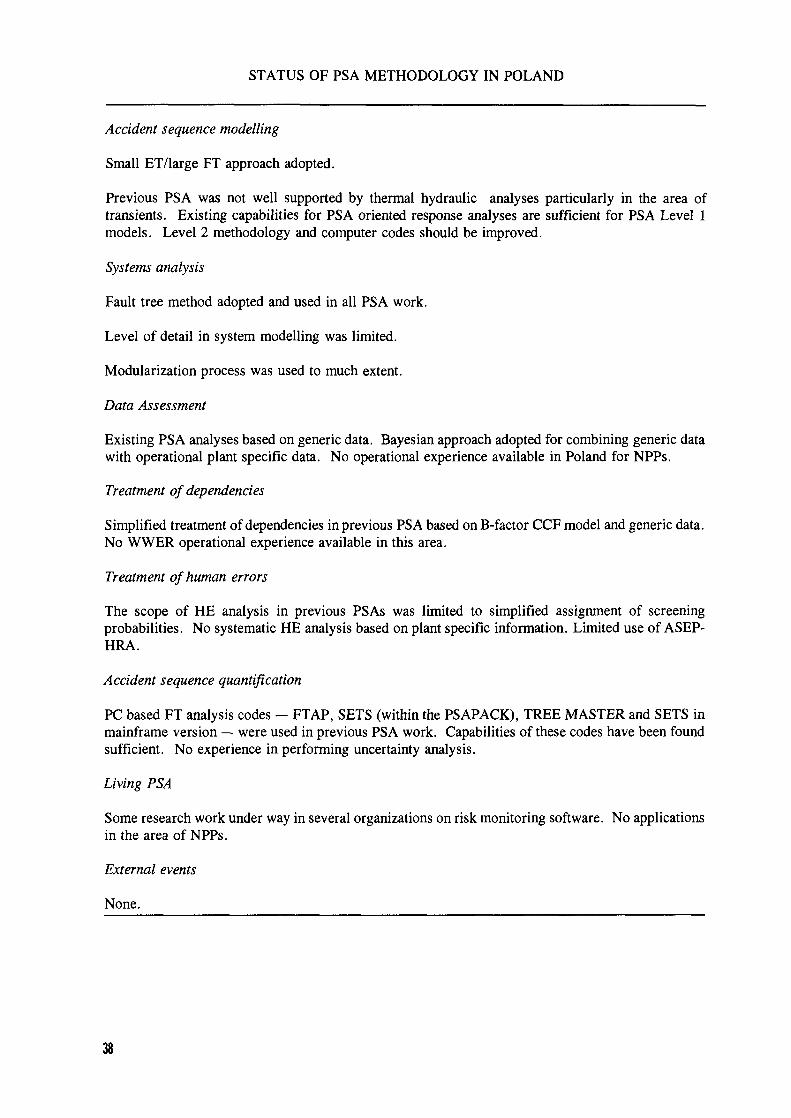
STATUS OF PSA METHODOLOGY IN POLAND
Accident sequence modelling
Small ET/large FT approach adopted.
Previous PSA was not well supported by thermal hydraulic analyses particularly in the area oftransients. Existing capabilities for PSA oriented response analyses are sufficient for PSA Level 1models. Level 2 methodology and computer codes should be improved.
Systems analysis
Fault tree method adopted and used in all PSA work.
Level of detail in system modelling was limited.
Modularization process was used to much extent.
Data Assessment
Existing PSA analyses based on generic data. Bayesian approach adopted for combining generic datawith operational plant specific data. No operational experience available in Poland for NPPs.
Treatment of dependencies
Simplified treatment of dependencies in previous PSA based on B-factor CCF model and generic data.No WWER operational experience available in this area.
Treatment of human errors
The scope of HE analysis in previous PSAs was limited to simplified assignment of screeningprobabilities. No systematic HE analysis based on plant specific information. Limited use of ASEP-HRA.
Accident sequence quantification
PC based FT analysis codes — FTAP, SETS (within the PSAPACK), TREE MASTER and SETS inmainframe version — were used in previous PSA work. Capabilities of these codes have been foundsufficient. No experience in performing uncertainty analysis.
Living PSA
Some research work under way in several organizations on risk monitoring software. No applicationsin the area of NPPs.
External events
None.
38

STATUS OF PSA METHODOLOGY - OKB MECHANICAL ENGINEERING,NIZHY NOVGOROD, RUSSIA
Accident sequence modelling
event tree approach;- thermohydraulic support analysis;- accident management measures included;- unfavourable states criteria used in modelling.
System analysis
component's independent failures, common cause failures of the same type of equipment andpersonnel errors taken into account;
- MCS method;normally monitored and non-monitored components taken into account.system's serviceability success criteria condition are presented as sequential-parallel diagram (orfault tree);
- using of high effectiveness MCS generation (modularization FT, convolution of cut-sets, etc.);- reliability calculations with the account of CCF (BFR model, B-factor model).
Data assessment
statistical data based on the analogs operational experience from NPP's with WWER reactors andnuclear ice-breakers are used;IAEA data bank;specific data for every NPP.
Treatment of dependencies
Different types of dependencies are analysed:(1) dependence upon initial event;(2) structural-functional dependencies due to common structural elements or auxiliary systems;(3) dependencies due to equipment design similarity and personnel errors.
- Two first types of dependencies were taken into account in accident sequence model.BFR model is used for dependencies due to equipment design similarity and personnel errors.
Treatment of human errors
Following personnel errors types were taken into account:(a) personnel errors made before accident initiation;(b) personnel errors, initiating the accident situation;(c) personnel errors related to emergency control of the plant.errors of the first group were analysed in the course of safety systems reliability assessment;
- errors of the second group were taken into account in the assessment of initiating eventoccurrence rate;errors of the third group were taken into account at event trees level;
- human reliability analysis is based on THERP method (personnel error probability depending onavailable time margin);
- multiparameter dependence model ('time-personnel reliability') is developed taking into accountthe following factors: relationship between available and necessary time for action performance,personnel qualification, stress level, available means for process and system state control; typeof the problem under consideration;
39

STATUS OF PSA METHODOLOGY - OKB MECHANICAL ENGINEERING,NIZHY NOVGOROD, RUSSIA (cont.)
operator actions were analyzed using operator actions trees and various home and foreign databanks for quantification of errors probability (both foreign and country developed).
Accident sequence quantification
computer code TREES developed in OKBM was used;TREES consists of two independent programmes, one applied for safety systems reliabilityanalysis, the other one - for event tree development and analysis;TREES code is suitable for large fault tree analysis (safety systems combinations) and formingemergency sequences in the event tree;
- event tree is constructed based on:- matrix of dependencies between safety systems;- matrix of consequences for accident sequences.TREES code capabilities include importance, sensitivity and uncertainty analysis;Monte-Carlo method is used in uncertainty analysis.
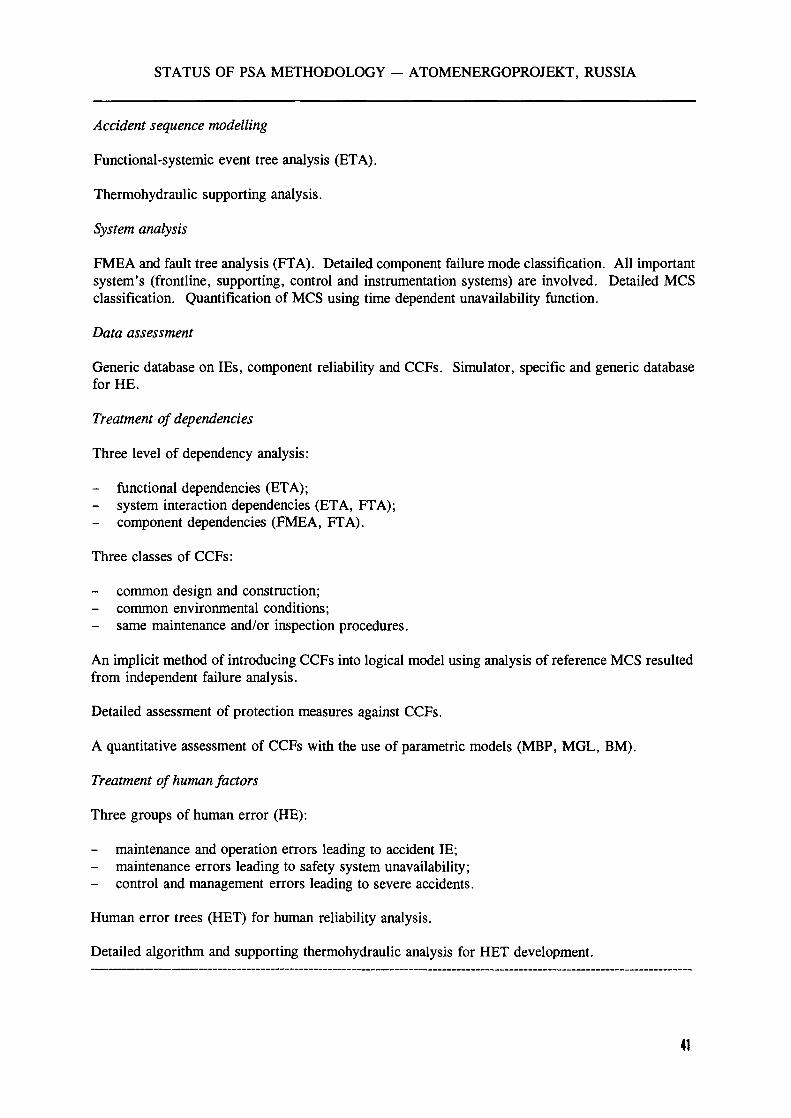
STATUS OF PSA METHODOLOGY - ATOMENERGOPROJEKT, RUSSIA
Accident sequence modelling
Functional-systemic event tree analysis (ETA).
Thermohydraulic supporting analysis.
System analysis
FMEA and fault tree analysis (FTA). Detailed component failure mode classification. All importantsystem's (frontline, supporting, control and instrumentation systems) are involved. Detailed MCSclassification. Quantification of MCS using time dependent unavailability function.
Data assessment
Generic database on IBs, component reliability and CCFs. Simulator, specific and generic databasefor HE.
Treatment of dependencies
Three level of dependency analysis:
- functional dependencies (ETA);system interaction dependencies (ETA, FT A);component dependencies (FMEA, FT A).
Three classes of CCFs:
- common design and construction;- common environmental conditions;- same maintenance and/or inspection procedures.
An implicit method of introducing CCFs into logical model using analysis of reference MCS resultedfrom independent failure analysis.
Detailed assessment of protection measures against CCFs.
A quantitative assessment of CCFs with the use of parametric models (MBP, MGL, BM).
Treatment of human factors
Three groups of human error (HE):
- maintenance and operation errors leading to accident IE;- maintenance errors leading to safety system unavailability;
control and management errors leading to severe accidents.
Human error trees (HET) for human reliability analysis.
Detailed algorithm and supporting thermohydraulic analysis for HET development.
41

STATUS OF PSA METHODOLOGY - ATOMENERGOPROJEKT, RUSSIA (cont.)
Accident sequence quantification
Detailed (large) FT for each accident sequence (AS) developed. Separate quantification assessmentof independent failures (IF), CCFs, HEs, accident management measures and test/maintenancestrategies, involving allowed outage time.
Importance, sensitivity and uncertainty analysis.
Atomenergoprojekt PSA software package for AS quantification involves the following codes:
APRA and VNF codes for evaluation of AS conditional probabilities with account of IPs, CCFs,HEs and maintenance/test strategies;
ANTES code for HE probability evaluation;
UNAS code for uncertainty evaluation.
External events
ETA, FTA and probabilistic fracture mechanics strength modelling for external events (seismic, aircrash , internal fire and flooding).
42
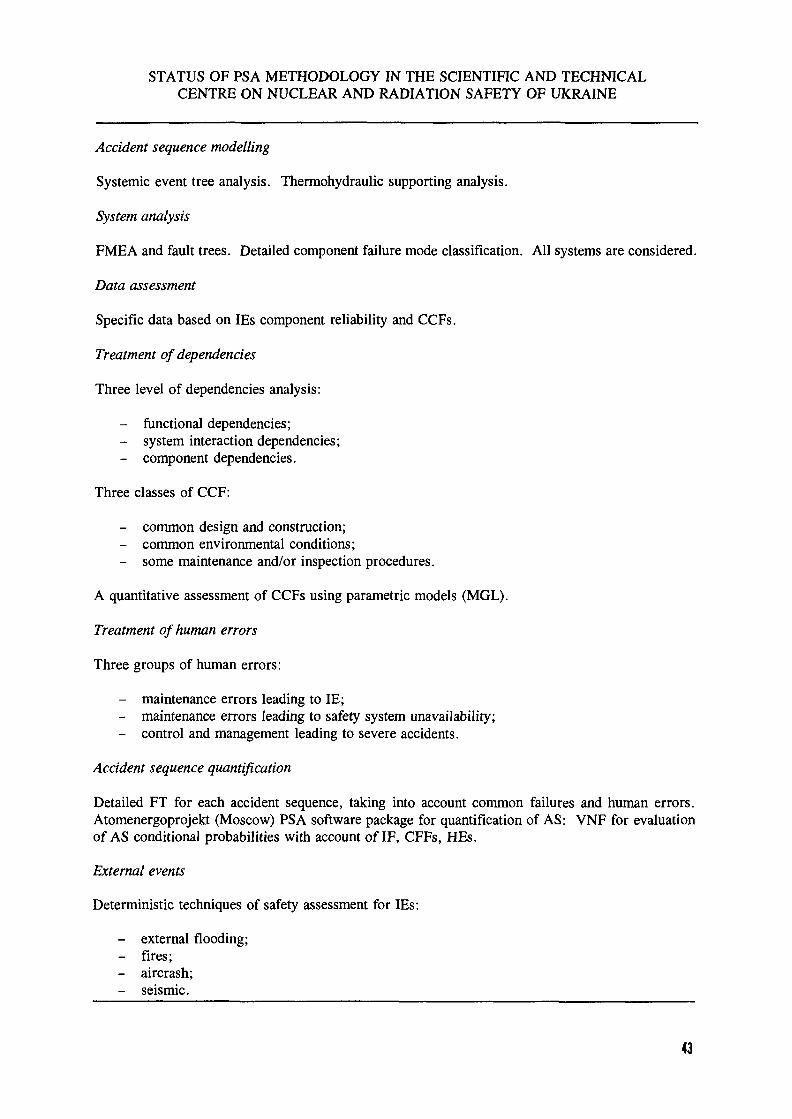
STATUS OF PSA METHODOLOGY IN THE SCIENTIFIC AND TECHNICALCENTRE ON NUCLEAR AND RADIATION SAFETY OF UKRAINE
Accident sequence modelling
Systemic event tree analysis. Thermohydraulic supporting analysis.
System analysis
FMEA and fault trees. Detailed component failure mode classification. All systems are considered.
Data assessment
Specific data based on IBs component reliability and CCFs.
Treatment of dependencies
Three level of dependencies analysis:
- functional dependencies;- system interaction dependencies;- component dependencies.
Three classes of CCF:
- common design and construction;- common environmental conditions;- some maintenance and/or inspection procedures.
A quantitative assessment of CCFs using parametric models (MGL).
Treatment of human errors
Three groups of human errors:
- maintenance errors leading to IE;- maintenance errors leading to safety system unavailability;- control and management leading to severe accidents.
Accident sequence quantification
Detailed FT for each accident sequence, taking into account common failures and human errors.Atomenergoprojekt (Moscow) PSA software package for quantification of AS: VNF for evaluationof AS conditional probabilities with account of IF, CFFs, HEs.
External events
Deterministic techniques of safety assessment for IBs:
- external flooding;- fires;- aircrash;- seismic.
43

______STATUS OF PSA METHODOLOGY AT IGNALINA NPP, LITHUANIA______
Accident sequence modelling
Identification of the safety function (SF).
Relationship between S F and systems:
- front line systems,- support systems.
Definition of 4 core damage categories.
System analysis
Performed by using fault tree technique.
Project report written to specify the procedures and requirement.
Data (initiating events frequency and component reliability)
Plant specific or RBMK type specific data are not available yet. If not available when needed,Swedish data will be used.
Treatment of dependencies
Analysis in progress to identify functional, physical and human interaction dependencies. This workis made in close co-operation with plant personnel.
Treatment of human errors
Task limited to screening analysis to identify dominant contributors. Five categories of humaninteraction will be modelled.
Accident sequence quantification
Use of RISK SPECTRUM code.
Living PSA
Not included.
External events
None. (Internal events: only fire.)
44

3. ADVANCED TECHNIQUES/METHODS
3.1. INTRODUCTION
A separate session (Session 2) was devoted to THE latest advancements in PSA methodology.The topics covered by the presentations focus on ongoing investigations related to methodologyimprovements concerning both the existing methodological framework and those associated with newapplications. A more detailed overview of the presentations is provided in Section 3.2.
Working group activities concentrated on the survey of the methodology and activities carried outin the field, identification of open issues and future activities, as well as information on somesuggestions for international co-operation. More detailed information on working group conclusionsis given in Section 3.3.
3.2. OVERVIEW OF THE PRESENTATIONS
The papers presented in Session 2 focus on current, ongoing investigations in the field andreference relevant supporting material.
The papers can be grouped under three topics:
(1) Computerized models/programmes for living PSA application, risk monitoring and data handling;(2) Plant response calculations and tools;(3) Special issues in PSA including interface Level 1-Level 2 PSA, relationship between safety
culture-PSA.
Observations and insights from the material presented and the discussions are summarized below:
Topic 1
There is increasing interest in the use of a PSA model not only for design improvements andbalancing but also for operational support concerning risk configuration management and maintenance,test and repair strategies in the plants, etc. Trending of safety/risk indicators versus plant lifetimeis also of great interest.
A distinction between Living PSA and Risk Monitor is pointed out. Living PSA is an update(trending) versus longer time periods; a monitor is an approach to provide quick response supportingactual operational decisions related to plant safety. To solve the latter problem an intelligentcomputerization of the PSA model is needed, capable of handling the large number of data andinformation contained in a PSA. Computerized systems/models are also needed to store raw data andto aggregate it to statistically meaningful reliability characteristics for PSA applications. The mainideas for living PSA and a risk monitor shown by the various authors are similar; tricky detailsapplied in a specific project may have some spin-off for other projects in the future.
Topic 2
Ongoing code developments on MAAP4 and initial tests on WWERs show the capability to useMAAP4 for severe accident modelling. There is a trend to simulate for an initiator the variousaccident sequences differing with the containment response, the operator response and safety systemfunctions within one PC session. System response calculations for LOCAs and transients on WWER-440 plants are more and more refined with respect to the various initiator categories and the successcriteria for the various system functions. Relatively large matrices of calculated cases agreed byexperts in different countries operating WWERs are available. There is a tendency to cover thevarious plant response possibilities using relatively small event trees.
45

Topic 3
Concerning the extension of Level 1 PS A to Level 2, respective containment responseinvestigations are shown based on the event tree approach. In this context the various accidentsequences from Level 1 are linked with the relevant event trees describing the various possibilitiesof containment response. No other modelling techniques, e.g. Markov models, are considered by theauthor for comparisons.
Safety culture and managerial aspects become one of the most interesting issues which should beconsidered and treated within the process of a PS A. The human role appears to be dominant in theloop representing plant operation and management activities. It is shown through historical evidenceas well as the dominant contributions identified in precursor and PS A studies. An integrated riskmanagement (IRM) is strongly recommended to account for organizational factors. If incorporated,it provides a well established knowledge and instruments to understand and to analyse key issues.Interdisciplinary initiatives are needed to bridge the practice of PS A and the IRM technology.
3.3. INSIGHTS FROM WORKING GROUP DISCUSSIONS
3.3.1. Living PS A/risk monitor
Related definitions
Living PSA and risk monitoring are to be differentiated from the point of view of the objectives.
Living PSA - investigation of safety status for a given plant after a given time interval,based on an updated plant specific PSA;is to be used for periodic safety evaluation by the utility (as it is required inGermany, the United Kingdom, etc.).
Risk monitor - investigation of safety impact of specific parameters for a given plant at agiven time, based on real time re-calculation of specific values using a plantspecific PSA;is to be used for both short term and long term safety decisions by the utilityas well as PSA analysts.
Risk monitoring and living PSA can be helpful for defining measures to re-assess abnormal eventsand to define additional safety measures (off-line diagnostic tool).
Risk monitors and living PSA as defined here are not intended to assist in real time accidentmanagement. A specific development for these needs should be investigated on the basis of PSAtechnology.
Recent activities
In general, the same thinking on living PSA and risk monitor methodology and ways ofapplication were found to be pursued in all countries that are developing and/or applying PSA.
Living PSA and risk monitors are based on an integrated software package that combines dataprocessing, fault trees, event trees calculations and importance calculations.
For risk monitors an expert system shell software is useful.
Examples of risk monitor systems are:
RISK MONITOR (Germany, under development);
46

ESSM (United Kingdom, under operation);LIPSAS (Japan, under development);PRISIM (USA, under operation);PEPSI (Rep. of Korea, under development).
Examples of living PSA tools are:
SAIS (Germany, under development);LESSEPS/FIGARO (France, under operation);IRRAS (USA, under development);RISK SPECTRUM (Sweden, under development).
Methodological issues
Risk monitor calculates risk changes (measured as frequencies on different levels — component,system function, sequence, core damage level) caused by changes of input parameters (e.g. changecomponents, parameters of components, etc.).
To cope with the operational requirements of NPP risk monitor calculations should be performedin a short time scale (a couple of minutes).
For risk monitor and living PSA calculations full PSA (Level 1,1+) must be available. PSAinput should be user friendly to assure fast response.
To assure correct evaluation of plant risk all plant states have to be taken into account (e.g. hotand cold shutdown states are recommended to be included).
Risk monitor and living PSA calculations have to be based on the current plant status and data.For risk monitoring an updating of plant models and data is recommended in the period of every sixmonths.
Open issues and future activities
The following issues were found important for further development:
Development of software for automatic fault tree calculations to minimize the routine work isconsidered to be useful (long term issue).
Risk monitoring and living PSA require a specific data collection and treatment that is to beimplemented in the NPP. Data update should not be automatic.
Time dependent effects associated with component and system functions should be taken intoaccount (e.g. ageing of components).
There is a need for providing guidance on the use of risk monitor and living PSA tools in thedecision making process (experience for the operators).
Risk monitoring and living PSA are based on Levels 1,1 + . They calculate valuable results thatcan be used for operational safety decisions. However, for the future a step-by-step extension of thePSA based on Levels 2 and 3 is recommended.
There is a need to define clearly which information and in what form the results of riskmonitoring and living PSA should be displayed.
47

WARNING: Information supplied from risk monitors must not contradict other information suchas technical specifications or licensing requirements available to the operator (this may indicate a needto re-assess deterministic technical specifications).
There is a need to define very clearly the role of risk monitoring with respect to the technicalspecifications.
The use of risk monitors and living PSA for operational decisions has to be licensed by theregulatory body.
Desired assistance
The following activities of the IAEA would be valuable to promote the progress in the field:
To prepare guidelines on the utilization of living PSA and risk monitors.
To prepare functional requirements for risk monitors and living PSA systems.
To organize a meeting on the use of risk monitors and living PSA to support the use by theutilities (operators and systems analysts). The meeting should be intended to give a specialsupport to eastern utilities. In organization of such a meeting the French experience should betaken into account.
3.3.2. NPP response analysis
Methodology issues
Large and small event trees — the specific approach depends on available code capability. Inprinciple, both strategies can be used in the PSA process. In practice, a small event tree/large faulttree approach seems to be preferred.
Macro-components in fault tree — they are possible to be used provided that there are nodependencies among them. Their use also depends on availability of data.
It is necessary to use the best estimate procedures and data in a PSA Level 1 to be realistic.Design basis parameter values such as the maximum clad temperature are usually conservative.Either revised values or new parameters should be applied. Best estimate cases must include realisticoperator actions. Time delays and improper actions should also be considered.
In sequence calculations the effect of assuming minimum success versus full success of the systemfunction should be clarified.
Computer codes
The use of any code for plant response calculations in Level 1 analyses encounters a common listof requirements and issues:
Accuracy. Has the code been validated? Is it being used properly by a trained user? RELAP,TRAC, CATHARE, etc. are widely regarded as adequate for transient analyses. MAAP modelsare less sophisticated for transients thermal hydraulics, but they can be used for the majority oftransients (as shown by the US experience).
Sensitivity. Even sophisticated codes have model uncertainty. It should be possible to investigatecode sensitivity to model assumptions. For example, the void fraction describing the amount ofliquid carried over during feed and bleed cooling is important but potentially an uncertain parameter.
48

TABLE VII. EXAMPLES OF CODES USED IN PSAs FOR THE SYSTEMS RESPONSE ANDSUCCESS CRITERIA
COUNTRY RELIABILITY CODES THERMOHYDRAULIC CODES
GERMANY RISK SPECTRUM, RALLY ATHLET, RELAP, CATHARE,MELCOR
CSFR RISK SPECTRUM LOCA, RELAP5, Transients - D4,Reactivity initial accidents,REPAID - CSFR codes
ROMANIA(CANDU reactor)
PSA B (Romanian code)PSAPACKTHPSAFRANTIC
Canadian codes:FIREBIRD (for LOCA)FORSIM (dynamic problems)HYDNA (for fuel channel)
UNITED KINGDOM RISK SPECTRUM MAAP, RELAPS, MELCOR
KOREA, REP. OF KIRAP MAAP, SCDAP/RELAP, CONTAIN
MEXICO PSAPACK, SETS, FTRAP,TEMAC
STCP, TRAC, RELAPS
HUNGARY FRANTIC, RISK SPECTRUM RELAPS, STCP (WWER mode),MELCOR, ATHLET
UNITED STATES OFAMERICA
MAAP3, RELAP, RETRAN,MELCOR
CANADA SETS, CAFTA,TREEMASTER
FIREBIRD III, SOPHT, CATHENA,TUF
49

Open issues/future activities
Verification is required for western codes before their use in WWER analyses. RELAPS andSTCP have been adopted already.
Feed and bleed mode of the WWER-440 core cooling has not been sufficiently analysed. Forfuture needs some computations are planned to be performed. It should be clarified whether the feedand bleed cooling is associated with WWER design limitations (e.g. set points) or represents onlymodelling problems related to the code.
Required assistance
Computer codes
3-D code for hexagonal core physics computation is needed for certain type of transients.
Shutdown risk
The following issues were discussed and found to require further investigation:
- boron dilution in the start-up phase of PWR (limited analyses have been performed by EGPPrague for the reconnection of an isolated steam generator loop at 80% power level);
- LOG A frequencies — different frequencies of pipe break for different reactor states.
External events
Few full scope seismic PSAs exist. Scoping seismic analyses of varying degrees of detail havebeen performed on many western reactors. Seismic experience of WWER plants is limited. It isrecommended that earthquake analyses should be considered in consistent way within PSA analysis.The guidelines for systematic analysis taking into account the site relevant external events should beprovided.
Fire and flood analyses
Fire and flood analyses should be included within PSA Level 1. Specific recommendations areexpected as a result of the Fire Risk Analysis Workshop in VUPEX, Bratislava, 21-25 September1992.
50

4. RISK BASED REGULATIONS
4.1. INTRODUCTION
A separate session (Session 3) was devoted to the use of PS A in regulatory activities. The topicscovered by the presentations are related mostly to specific examples of regulatory orientedapplications but some more general concepts of risk based regulations were also discussed. Detailedoverview of the presentations is given in Section 4.2.
The working group discussions concentrated on selected topics related to risk based regulation.They address the regulatory point of view in using PSA both for design and operation, use of bestestimate approach in the PSA, probabilistic safety criteria (PSC) and others. Detailed informationon working group conclusions is provided in Section 4.3.
4.2. OVERVIEW OF THE PRESENTATIONS
Six papers were presented in Session 3. The concept of risk based regulation (RBR) wasdiscussed in the first paper. It was considered that RBR could make plants safer and more economic,and thus satisfy both the regulator and the utility.
It was noted that the uncertainty of the PSA results, usually about 1/2-1 order of magnitude,could be small compared to the changes due to actual plant operation where the core melt frequency(CMF) may have orders of magnitude greater in certain plant configurations.
The number of components which had a significant effect on CMF was thought to be of the orderof 100, less than 1 % of the components on a plant. Currently the technical specifications do notrequire different levels of surveillance according to the component importance. It was thought thatmore attention could be paid to some components and less to others.
It was recognized that RBR would need to be phased in (if it were adopted) over a period of time.
The role of PSA in the licensing of Angra 1 NPP was discussed in the second paper. Angra 1is a two loop Westinghouse designed PWR. A PSA was requested by the regulator, ComissâoNacional de Energia Nuclear (CNEN) in the early 1980s. This was performed with generic data.The PSA identified the need for further analysis of the anticipated transient without scram (ATWS)condition. Subsequently, a further PSA has been requested which will more correctly model the plant(in particular model design changes more fully). This more up-to-date PSA will be used by CNENto identify if any 'backfits' are required or technical specification procedures need to be changed.
The utility will also use the results of the PSA to help it further develop the emergency operatingprocedures.
A Survey of German PSA investigations for nuclear power plants was provided in the next paper.A number of projects are under way in Germany related to the subject of PSA. These cover thefollowing areas:
PSA comparisons: The comparison of PS As from many countries was being performed to providea guideline to be used for reviewers of PSAs.
Special projects under way: - Fire analysis;- External events;- Precursor reports proposal;- PSA for low power and shutdown states.
51

Development of methods: - Common cause failure;- human reliability analysis;- time dependence effects in PS A;- Data collection.
PS A guideline used to: - Evaluate plant modifications;- Optimize backfits;- Optimize technical specifications;- Evaluate actual operating experience.
It was noted that PSA was a powerful tool and was used in Germany although risk basedregulation was not being promoted.
Use of PSA in a regulatory framework in Nuclear Electric, UK, was the subject of the nextpaper. It was noted that PSA had been used in the licensing of the Sizewell 'B' PWR from the veryearly stages. A preliminary PSA had been performed to support the application to begin constructionof Sizewell 'B'. That PSA had been subject to review by the regulatory authorities.
At that time the utility agreed to expand the scope of the PSA in an attempt to be 'complete' andto justify the assumptions behind the PSA. This led to a significant increase in the amount of analysisand the complexity of the PSA. In order to reduce the amount of work required many pessimistic andboarding assumptions had been made. This in turn led to some very pessimistic results which hadthemselves been reviewed to identify the 'real lessons' from the PSA.
Although the work was extensive and highly complex many significant lessons had been learned— principally that the use of conservative assumptions could be very misleading and thatquantification was not really possible for all contributors to risk. The work had, however, left NuclearElectric with a much greater undertaking of the plant and the systems interactions.
The status and future prospects of regulatory issues in the Ukraine were presented in the nextpaper. PSAs have been performed for the various WWER units currently operating in the Ukraine.Although such PSAs have been performed the use of generic data is thought to limit their usefulness.However, some minor design changes have been proposed to improve the safety of the plants. Alsothe PSA has been used to provide a case for relaxation of certain insignificant operating restrictions.
The role of PSA in licensing, regulation and design as applied in the Netherlands was the subjectof the next presentation. Before the Chernobyl accident the regulatory authorities had proposed somePSA based criteria for new reactors. The proposal was that the individual risk of early death wouldbe unacceptable more frequently than 10~8/year. Between these values some consideration of designimprovements would be needed.
Since the Chernobyl accident no nuclear plants are to be built and so attention has turned to thetwo existing BWRs in the Netherlands. Level 1 + PSAs have been performed with an assessment ofthe containment loadings and responses.
These PSAs have been used to identify: the dominant accident sequences and components; weakpoints in the designs; dependencies in the designs (spatial, functional and human). The intention isto develop these PSAs into living PSAs and to use these as operational tools to evaluate futuremodifications to the plant and procedures.
4.3. INSIGHTS FROM WORKING GROUP DISCUSSIONS
4.3.1. Regulatory position on PSA application
Some opinions have been expressed by the working group concerning acceptability of risk basedregulations. It was stated that PSA is a useful tool and is one element in the decision making process.
52

Design by a good engineering/deterministic practice preceded PSA development and use. Decisionsbased on determinism (single failure, diversity, separatism, etc.) can be more onerous than thoserequired to meet risk criteria. PSA is therefore regarded as necessary in the decision making process,but it is not sufficient in itself.
The use of a risk monitor tool at a NPP can assist in reducing plant risk levels inplanning/scheduling for maintenance and outage activities.
Development of a risk monitor is still in its infancy and therefore there are many dangers inplacing too much reliance upon the risk monitor tool. In particular the dangers perceived are:
- the status of the monitor may not coincide with the status of the plant (due to human error). Thisis particularly true during the busy outage periods;
- the monitor could be applied to a configuration of the plant for which the monitor was notdesigned.
Nevertheless, the development of risk monitors is to be supported but it is judged too early toplace regulatory controls or criteria upon the utility in a formal sense.
4.3.2. Best estimate approach to PSA
It is accepted that PSA generally involves a degree of conservatism in some aspects of itsapplication. It is judged, however, that PSA is most useful when applied in a best estimate modeconsistently throughout all aspects of the PSA. 'Best estimate' includes not only numerical data butalso best estimate calculation for determination of the success criteria and best estimate radiologicalanalyses for consequence calculation. It is recognized that cost or technical difficulties may result inthe use of a bounding or conservative approach and this can, under certain circumstances, beacceptable.
The use of bounding PSA, while acceptable for comparison with a prescribed risk target, placesa burden upon utility and regulator alike should su! sequent plant modifications be proposed. Thisburden arises because the existing PSA may neither clearly identify the true risk dominator, andbecause the true benefits proposed by the utility may be disguised by the conservatism in the analysis.Best estimate PSA should be supplemented by some measure of uncertainty or sensitivity analyses asthis allows a judgement to be formed on the acceptability of the analyses.
4.3.3. Probabilistic safety criteria
PSA is a useful tool for both the regulatory bodies and the utilities. However, both must realizethe limitations of their analyses when used in an absolute sense. Incompleteness, which is sometimessubjective in nature, especially in those areas depending on expert judgement, lack of standardizationof approach, make that comparison with probabilistic safety criteria (PSC) or the outcomes/resultsof another PSA cannot be made in an absolute sense. The final PSA outcomes are no more than anindicator and need to be considered along with the underlying assumptions.
In the case of comparison with PSC, one should keep in mind that the PSC are only meaningfulif there is a consistency between the PSC and the scope, definitions, assumptions being made and theboundary conditions of the PSC.
It has been recognized that the role of PSAs in relation to PSC does not only have its value foroperational plants but also for new and/or conceptual designs. Even a generic PSA of a conceptualdesign can, in principle, be used to help to demonstrate the acceptability of that design, provided allthe limitations of doing so are recognized.
53

Absolute quantitative safety goals and/or criteria (PSC) are useful as a yardstick in assessing therisk of a nuclear power plant (NPP). It has been recognized that PSC are increasingly used indifferent countries. However, some countries, especially those which are depending on NPPs of an'older' design for their electricity generation, are not yet in a position to adopt PSC. Therefore, theuse of PSC should be promoted; in addition, some external guidance to those countries which stillhave difficulties in adopting those should be provided.
4.3.4. Old plant versus new plant
The issue is whether there should be differing probabilistic requirements to address new and oldplants.
Old plant needs to be assessed against current criteria using state of the art techniques andexceptions need to be addressed in some way. The use of PS A should identify dominant contributorsand acceptable solutions found where there is a need for risk reduction. Such measures may includebackfit, accident management actions, further probabilistic analyses, deterministic argument, etc.
All plants need to be assessed on an individual basis.
4.3.5. Recognized needs for further development
Several topics related to risk based regulation have been pointed out as requiring furtherdevelopment and possible assistance from the IAEA. They include:
Development of PSC and associated methods with appropriate databases for research reactors,fuel cycle facilities and decommissioning facilities;Development/promotion of risk monitor tools.
5. PSA APPLICATIONS
5.1. INTRODUCTION
A separate session (Session 4) was devoted to various PSA applications. The majority of papersaddressed topics related to evaluation of operational activities. However, other topics were alsocovered, such as simplified PSA for research reactors, the way of better communication of PSAresults, etc. Detailed overview of the presentations is given in Section 5.2.
The working group has reviewed the following technical topics:
- Application of PSA techniques to technical specification (TS) optimization, particularly tooptimize AOTs and STIs;
Application of PSA techniques to maintenance planning;
Review of IAEA draft report on TS optimization.
The working group discussed the general issues of the use of PSA techniques to TS optimizationand how TS are defined and used in different countries, especially in France, Germany, Hungary,the Czech Republic, the Slovak Republic, the Nordic Countries and the USA. From this discussionemerged a number of technical and regulatory issues and recommendations associated with this PSAapplication. In addition, a limited review was made at the IAEA report on this topic. The resultsof these activities are summarized below (Section 5.3).
54

5.2. OVERVIEW OF THE PRESENTATIONS
Session 4 covered the following topics:
- use of PS A to optimize AOTs and STIs with full power PSA considerations;- TS optimization with considerations of alternate modes and shutdown events PSA;- diverse PSA applications;- simplified PSA of research and non-power reactors;- better communication of PSA results.
In general, the papers demonstrated strong interest in a very large number of PSA applications.In addition, the papers on technical specification optimization indicated a relatively mature state ofthe art for this particular application.
PSA application to technical specifications
The papers on TS optimization highlighted both common points and different approaches to thesame issue in different countries such as France, Sweden, Finland, Bulgaria, Spain, Mexico,Germany, the Czech Republic, the Slovak Republic and the USA. Some of the highlights of thetechnical aspects and issues are itemized below.
Different countries are using or proposing three or perhaps four different types of risk acceptancecriteria that are used to decide the acceptability of TS changes. These include:
(a) percentage of annual average CM frequency with plant specific baseline (USA);(b) absolute risk level for each separate maintenance event (France);(c) instantaneous risk level during maintenance event;(d) annual unavailability budget (hours/year of downtime).
AOTs and STIs can be specified at different levels including component, system, subsystem ortrain level.
PSA models employ various parameters to model AOT and STI changes. These include: standbyand shock failure rates, frequencies of preventative and corrective maintenance, mean repair times,maintenance out of service times and common cause parameters.
Papers on alternate modes/shutdown models, especially the contribution from EOF, stressed theimportance of considering whether in fact a plant shutdown at the end of an AOT usually results ina higher margin of safety as assumed in traditional technical specifications.
Different approaches are being used to establish the baseline risk profile against which either timedependent risk or risk changes are compared. One is to equate the baseline with a nominal plantalignment with no test and maintenance in progress and another incorporates contributors from allalignments with average probability weights.
Additional PSA applications
The papers in Session 4 included a number of examples of PSA applications other than technicalspecifications such as:
use of simplified PS As for non power reactors;- diverse applications in design, regulation, accident management, emergency planning and
communicating PSA results to non-PS A practitioners.
55

5.3. INSIGHTS FROM WORKING GROUP DISCUSSIONS
A variety of methods for applying PSA models for TS optimization have been proposed andemployed in actual proposals that have been submitted and reviewed by various regulatory bodies.The working group supports this application of PSA techniques and offers the following commentsand recommendations.
5.3.1. Decision criteria for TS optimization
The success of TS optimization via PSA methods hinges on the use of appropriate decision criteriato decide the acceptability of changes to AOTs and STIs. While the actual decision criteria must beresolved for each country separately, the working group identified several qualities of the decisioncriteria that should be considered.
Risk importance
AOTs and STIs should be established related to the risk importance level.
Absolute versus relative risk level
Each of these approaches has advantages and disadvantages that need to be appreciated. Absolutelevels are based on a numerical value of risk in absolute terms while the relative approach refers tosome variable baseline risk profile for each plant.
Cumulative versus discrete criteria
Current deterministic AOT criteria and the French PSA criteria are expressed separately for eachmaintenance event. Cumulative criteria such as the Nordic approach for preventive maintenance andthe US approach based on annual average CM frequency account for cumulative unavailability ofmultiple maintenance events.
Shutdown risk
A complete treatment of the risk aspect of maintenance requires consideration of shutdown risk;sometimes, plant shutdown at the end of an AOT period creates increased risk state.
Practicality of utility personnel
Revised technical specifications based on PSA must be uncomplicated and easy to use by theutility personnel. For different plants AOTs and STIs may be fixed at the system, subsystem or trainlevels. Unique AOTs for each component may not be practical nor advisable due to their transientnature.
5.3.2. PSA methods for TS optimization
The working group made the following comments on the use of PSA methods for TSoptimization:
Ideally, the evaluation should include alternative operating modes/shutdown PSA;
- PSA models must have explicit dependence on AOTs and STIs, i.e. need to model maintenanceunavailability separate from failures;
- STIs must consider shock failures as well as standby failures. Better databases and analyses areneeded to address this issue;
56

- Maintenance frequencies must not be confused with failure rates;
- AOTs must not be confused with actual maintenance durations; actual maintenance durations arenot the same as repair times;
- PS A model simplifications should be reviewed for application to TS;
- PS A models must be extended to Level 2 to address certain TS issues;
- Time dependent models used for AOT and STI evaluations do not adequately treat special testingand maintenance considerations for common cause failures;
Some questions regarding the validity of STI dependent models should be answered.
5.3.3. PSA databases
All countries have varying degrees of problems with inadequate PSA databases, such as:
incomplete generic database;- inapplicability of generic data;- little or no plant specific data;
shock versus standby failures;common cause failures;
- maintenance data not distinguished from failure data.
The above mentioned problems should be solved to provide appropriate input for TS optimization.
57

LIST OF ABBREVIATIONS
AOT Allowable outage timeAS Accident sequenceBWR Boiling water reactorCCI Common cause initiatorCCF Common cause failureCDF Core damage frequencyCMF Core melt frequencyET Event treeFMEA Failure mode and effect analysisFSAR Failure safety analysis reportFTA Fault tree analysisHE Human errorHRA Human reliability analysisIE Initiating eventIPERS International Peer Review ServiceLOCA Loss of coolant accidentNPP Nuclear power plantPSC Probabilistic safety criteriaPWR Pressurized water reactorPRA Probabilistic risk assessmentPSA Probabilistic safety assessmentRBR Risk based regulationRBMK Soviet designed graphite moderated, water cooled reactorRPV Reactor pressure vesselSAR Safety analysis reportSTI Surveillance test intervalTS Technical specificationsWWER Soviet designed PWR (water moderated, water cooled reactor)
59

Appendix
PAPERS PRESENTED AT THETECHNICAL COMMITTEE MEETING

EXPERIENCE FROM THE PRELIMINARYNUCLEAR POWER PLANT DUKOVANY PSA STUDY
J. DUSEKNuclear Research Institute,Rez, Czechoslovakia
Abstract
d kackqnaand of the. Nucléon 'Pausen. PlantPoo&a&t&xOttc tfafety Auueu&nent Ittjjdy pnepanatcon and it*>and <to pnoqnamme one mentioned Jhu> -aiudv AOÛ teen beuiq donein coopération utUti atmoot alt Sxechaotoiak coototuito/Ki utoikcnq.on the field o{ ??&
&ou/iteen initiating. etsento loene chosen and analyzed (01 thepneliirunany J"fA. Ptudtj. and iewceu»ed 4^ the &zechoutcM)ak ¥!fA teamand Ay the tTFP Dukouany otaff duruna the. opmnq of 1992. 'She. Hu&
f!£U!f cade utao aoed [on analyoeo o( 21 fnont-line andfault t/ieeo.
3Vie couooe of the pnofect, oooumpt«HV>, uoed methods,data&a&e, conunon cau&e failures and human factoi analyoeo one
de&crü&ed Pome eacpenience with a pnepanaUan of thu*and commenta ta tt» leoutto one. atta pne&ented.
fn conclusion an expected, couooc of additional analyoeû foifinal venoion of the ¥!TA ytudy and f!fA actuuitiec, foi 1992 andneed futusie ta iStcechoGlotsakia aae added. Jhe lu>t ofto letiafatitÂj. and T!fA anatyxMX» tn T&xechooloisatuA. to attached.
Many of these proposals were in the Czechoslovak nuclearpower plants accepted and realized
International activities in the domain of PSA for powerreactors and research reactor have been mainly developed incooperation with the IAEA ([20] - [26]).
Our first IAEA Contract was started in 1985 in the frameworkof a coordinated research programme "Development of Risk Criteriafor the Whole Nuclear Fuel Cycle". The cooperation with IAEA inthis domain has continued in the research programmes"Probabilistic Modeling of a Small LOCA" and in the IAEA RegionalProgramme RER/9/005 "PSA for WER-Type Reactors".
Apart from studies for Czechoslovak nuclear power plants,also PSA analyses for research reactor LVR-15 have been carriedout in the framework of an IAEA coordinated research programme"PSA for Research Reactors" and later this cooperation hascontinued in the IAEA research programme "Data Acquisition forResearch Reactor PSA Studies" .
The year 1989 is possible to understand as a milestone forPSA analyses in Czechoslovakia. Since this year a full-scopeprobabilistic safety assessment of the nuclear power plant (NPP)Dukovany with WER-440 type 213 reactors is being done inCzechoslovakia with the Nuclear Research Institute (NRI) in Rezbeing a coordinator of it.
This contribution is based on [56] and extended, thecomprehensive list of references to reliability and PSA analysisin Czechoslovakia is attached. More next information is includedin [60] - [65].
63
1. INTRODUCTIONIn eighties the reliability and PSA analyses (e.g. [7] -
[19]) were carried out in several Czechoslovak organizationsunder a number of sponsors and, therefore, also in anuncoordinated manner.Outcomes of this research can be observed in:
good acquaintance with the systems,possibility to compare the results and the procedures ofparticular analyses,recognizing and developing methods and computation programs([1] - [6]) for these analyses,marking some important problems to be solved in the domain ofthermal hydraulic analyses,establishing weak points of the designsetting proposals of technical and organization measures foran increase of reliability of the systems.
2. NPP DUKOVANY PSA STUDY2.1. Background
The PSA analyses of the NPP Dukovany were started with theaim to complete a full-scope PSA level-1 safety study for thisplant to the end of 1993. The PSA is being done in cooperationwith almost all Czechoslovak institutions working in the field ofprobabilistic safety analyses and the NRI Rez coordinatesresearch carried out in other five Czechoslovak organizations:
VÛJE Trnava (Nuclear Power Plant Research Institute),VUPEX BratislavaEGP Prague (Energoprojekt)EGO Prague (Power Institute in Bêchovice)Skoda Works, Plzen.
2.2. GoalsThe main goal of this study is to create a tool to safety
analyses. This tool make it possible to assess safety problems in

Cl NPP s operation and to determine usefulness of possiblemodification There were several next reasons and advantages ofthis study It means for example
- design weaknesses- operating technical specifications and operating procedures- scheduled tests and in-service maintenance- identifying areas of next research- reference study for next specific NPP PSA Studies in CSFR- forming of one PSA team in CSFR (with one "reliability andPSA language")
- tools for preparing of "living PSA" (for the NPP and theCzechoslovak Regulatory Body uses)
2 3. The Study programmeThe planned work on the NPP Dukovany PSA Study has taken
place between 1989 and 1993 in three main phases:Preliminary phase (1989 to 1991)It consists of initial analysis of the system and accidentsequences. Purpose of this phase was to determine the scope ofthe additional studies required. The Preliminary PSA Study wasprepared and used as a working material for the PSA team [27] -[48]).Provisional phase (1992 to June 1993)It includs a full in-depth review of the preliminary study byexperts from other organizations of the PSA team and by the staffof the NPP Dukovany. This part a provisional phase was finishedin June of this year.During this period a preparation of a final version of databaseand performing of additional thermal hydraulic analyses will beexpected.A final product of this period should consider all technicalimprovements and take into account changes which are deadlined bythe end of March 1993. Main efforts will also be concentrated toa criticism of conservative approach used in the preliminarystudy. Some parts of this study will be subjected to an review byan external specialists (e.g IAEA Mission "Fire Risk AnalysisSeminar", Bratislava, September 21-25, 1992).Final phase (July 1993 to December 1993)During this phase the final quantification will be established,and the final documents will be drafted. During second and thirdphases a preparation of a "living PSA" model is also expected forthe NPP Dukovany staff and the Regulatory Body needs and uses.
2.4. Performing of the PSA analyses2.4 1. Initiating events
Several documents were used to prepare a list of initiatingevents for the preliminary NPP Dukovany PSA Study [49].
- a list of lEs which are analyzed in the Czechoslovak SafetyAnalyses Reports (Preliminary and Pre-operational SARs)
- a list of lEs recommended for SARs by the USNRC (RegulatoryGuide 1 70)
- a list of lEs presented in the PRA Procedures Guide (NUREG,CR-2300)
Eight groups of initiators has been chosen in the beginningSeven of them were events of internal origin and last onecontained internal fires and floods events which areoften classified as events of external originA. Reactivity initiated accidents
A number of events were taken into account, for example'a) uncontrolled withdrawal of a group of control assembliesb) Fast withdrawal of a control assemblyc) Inlet of cold water into the cored) Uncontrolled reducing of a boron acid concentratione) Spurious boron sediments releasing from a core
constructionf) Holding of a working group of control assemblies in an
upper or a lower positiong) Holding of the most effective control assembly in an
upper position during scramOnly first two events were included to the NPP Dukovany lEs
list. All other events were excluded because of their existencewas connected with a sabotage (c) or their course was similar asin case a) (d) and b) (e) or a positive reactivity was notinserted in the active core (f,g).B. Loss of coolant accident
These accident were chosen on the base of thermal hydraulicanalyses in accordance with success criteria of safety systems.Original six events were reduced during a preliminary phase ofthe PSA Study to four according additional analyses.
The workshop on Plant Response for WER-440 NPPs was held inTrnava, CSFR (4-6 May 1992) in frame of the IAEA TC ProjectRER/9/005 - PSA for WER-440 Type Reactors. Existing differencesin LOCA accident sequence modeling were discussed there andclarified basing on currently available thermal hydraulicanalyses. The proposed System Success Criteria for LOCAs aresummarized in the TAB.l. It is expected to accept six LOCAcategories in the final NPP Dukovany PSA Study after confirmingof this recommendation by next analyses.
The initiating event "Rupture of one steam generator tube" isnot very meaningful for WER reactors (main valve in primarycircuit) and it was not included to the preliminary lEs list Butthis one will be added to the list of IBs for the final PSAStudy [53].

TAB.l. System Success Criteria for LOCAs accepted at theWorkshop held in Trnava, CSFR, 4-6 May 1992IAEA TC Project RER/9/005 - PSA for WER-440 Type Reactors
LOCAcateg.
LI
L2
L3
L4
L5L6
Break size rangemm
10<D<20
20<D<(50-70)
(50-70)<D<(120-150)
(120-150)<D<200
200<D<300300<D<500
System success criteriaHPI11
11
1111
1
HPR
1
1
1
1
LPI
1
1
1
1
1
LPR11
11
1
1111
1
CFS
0-4"
0-4*
1+1
1+11+1
EFS11
1
sesPMPMHR
HR
65
HPI - High Pressure Injection SystemHPR - High Pressure Recirculation SystemLPI - Low Pressure Injection SysteaLPR - Low Pressure Rectrculatton SysteaHPR - High Pressure Recirculation SysteaEFS - Emergency/Auxiliary Feedwater SysteaCFS - Core Flooding System (Hydroaccumulators)SCS - Secondary Pressure Control SysteaPH - Pressure Maintenance nodeHR - Heat rénovai mode (30K/h>»ÏAvallability of CFS affects timing requirements for secondary
cooling Initiation and related probability of the operator error
C. Great loss of steam from secondary circuitFor this group was take into account next events :a) Spurious opening of steam dump system to the condenser
(blocking)b) Spurious opening of steam dump system to the atmosphere
(blocking)c) Break of the line between header of steam generator and
fast quick-acting valved) Break of the line between fast quick-acting valve and
steam generatore) Opening of steam generator safety valve (blocking)f) Break of the main steam header
On the base of analyses of parameters and a response ofsystems was decided to take into account two groups. The firstone involved a), b), c) and f) events, as a representative ofthis group an event f) was chosen. The second one consisted oftwo d) and e) events and an event e) was chosen.D. Great loss of feedwater from secondary circuit
Three events were considered:a) Break of the main feeding headerb) Break of water feeding piping between main feeding header
and check valvec) Break of water feeding piping between steam generator and
check valveEvents a) and b) were grouped to one event a).
E. Loss of service water systemThis event conditions a function of safety systems and its
importance was assessed.F. Failure of both turbogenerators, the causes of failure are
consideredThe reason for choice of this event was its very high
frequency (experience from the NPP).
G. Collapse of the grid with both turbogenerators out ofcontrol for power plant internal loadDuring this event all circulating pumps and most of systems
of a nominal operation are lost and cooling of the active core isgoing down. This event also covers all loss of flow combinations.H. Fires and floods in the NPP
It was not supposed to consider internal and external hazardsin the beginning but fires was incorporated to the IBs list forits importance.
During a preliminary phase the original IBs list of 18initiating events was reduced to current 14 which are analyzed indetail in the Preliminary PSA Study (TAB.2,).
2.4.2. Accident sequencesThe accident sequences were determine using the conventional
event tree method. Analysis of the sequences has been conductedeither to the point of core meltdown or to state in which risk canbe considered to be negligible. The interval of twenty four hourswas accepted as a maximum time interval for development ofaccident sequences. All considerations were based on aconservative approach (e.g. no recovery action).

66 TAB.2. List of initiating events selectedfor the Preliminary NPP Dukovany PSA Study
TAB.3. Safety significant systems of NPP Dukovany
1. Uncontrolled withdrawal of a group of control assemblies2. Fast withdrawal of a control assembly3. Coolant leakage through the rupture of an equivalent
diameter up to 20 mm - small LOCA4. Same for the range 20-200 mm - medium LOCA5. Same for the range 200-300 mm - large LOCA6. Same for the range for the diameter greater than 300 mm
(max. 2x500 mm) - large LOCA7. Break, of the line between header of steam generator and
fast quick-acting valve8. Break of the main steam header9. Break of water feeding piping between steam generator
and check valve10. Break of the main feeding header11. Loss of service water system12. Failure of both turbogenerators, the causes of failure
are considered13. Collapse of the grid with both turbogenerators out of
control for power plant internal load14. Fires in nuclear power plant
Each initiating event was analyzed separately, some of eventswere analyzed by two independent groups of analysts (large andmedium LOCA, [29] - [32]).2.4.3. Systems analysis
System analysis was carried out using a fault tree model.Familiarization with systems was based on the design andcorrected and reviewed by the NPP staff. Several fault trees wereprepared independently for different initiating events.
For this purpose RISK SPECTRUM FT Plus code has beenpurchased and it has been used for the evaluation of all trees inthis PSA study. The list of main fault trees for safetysignificant systems (they were prepared in English version),which were necessary for the analysis of the initiating eventsset, is in the TAB.3.
From the beginning of 1992 the new version RISK SPECTRUM PSAis used for description and quantification of fault trees andevent trees.
2.4.4. Reliability dataA collection of data for the preliminary NPP Dukovany PSA
Study has been going step by step from generic to specific data.Three version of database were prepared gradually and permanentlycommented, checked and developed by members of the PSA team and
1. Reactor building pressure suppression system2. Core flooding system3. Low-pressure injection and recirculation system (LPIS)4. High-pressure injection and recirculation system (HPIS)5. Spray system6. Intermediate component cooling system7. Technological compartment cooling system8. Uninterruptible power system (1st category)9. Essential power system (2nd category)10. Service water system11. Unit protection system12. Gradual start-up automatics13. Emergency feedwater system (steam generators)14. Auxiliary feedwater system (steam generators)15. Steam dump station (blow-off into atmosphere of
technological condenser)
also by the NPP Dukovany personnel. The third version of thisdatabase set was used for Preliminary Study. The gradual systemspecific NPP Dukovany data, specific NPP Bohunice data, genericWER data, generic data and engineering judgment was preferred.
The preparation of a database for a final version of PSAstudy is going now in cooperation with the NPP Dukovany staff.The NPP Dukovany will be responsible for verification of thisset.
2.4.S. Common cause failuresThe methodology of the CCF was compiled from different
approach used abroad which were adapted to contemporaryCzechoslovak conditions. The beta-factor was used for thequantification of the CCF.
In this methodology structural dependencies were taken intoaccount on principle as usual primary events. For specific CCF(i.e. common cause failures of a statistical nature which affectcomponents which are not identical) quantification with the helpof a beta-factor method using a base beta factor value andengineering judgment was used.
CCF's of redundant components were considered for allprincipal components of front-line and support systems (on thecomponent level, quantification with the help of a beta-factormethod using generic values - TAB.4.). An refinement of CCFconsideration after the PSA quantification was also considered.

TAB.4. Generic beta factor valuesComponent TypePump
Safety Injection SystemResidual Heat Removal SystemContainment Spray SystemAuxiliary Feedwater SystemService Water System
Motor-Operated ValveCheck ValveSafety/Relief ValveDiesel GeneratorFanChillerReactor Trip BreakerBase Value (average component)
Beta Factor
0. 170. 110. 050.030.030. 080.060.070.050. 130. 110. 190. 10
2.4.6. Human factorThe methodology of human factor for the preliminary NPP
Dukovany PSA Study was based on the ASEP-HRA methodology (SwainA.D., NUREG/CR-4772) and it was partly modified by someprocedures from the THERP methodology (Swain A.D., Guttmann H.E. ,NUREG/CR-1278) and Mr. J.K.Vaurio recommendations (IAEA RegionalProject RER/9/005).
Human errors during a nominal operation before an accidentand human errors after accident (only prescribed activity) weretaken into account.
2.5. Some experience with the PSA StudyThe project PSA Study has started as "research project" and
it has been financed by a central budget. In the beginning it wasconcentrated on the methodology and familiarization with the PSAtechniques and nuclear power plant systems. There were severalpeople in several Czechoslovak organizations who were interestedin reliability analysis and had started with the PSA methods.In this first period the WER-440 reactor type 213 was chosen asa representative for a reference study.
Some "old analyses" were also finished during this period inall engaged institutes (e.g. reliability analyses for NPP VIJaslovské Bohunice). One team was being formed during first year
with one goal. Later the NPP Dukovany was elected for a specificPSA Study. In this time the NPP Dukovany staff was not engagedvery much in this project.
Second year of the project is possible to characterize as"one team - one methodology - one language" year. The task of onelanguage was solved by a purchase of the RISK SPECTRUM code.
The third year is possible to designate as a "preliminary PSAStudy" year. This decision was accepted additionally during apreparation of the Study and helped very much because of foundingof many lacks in time before the end of this Study. During thisperiod a cooperation with the NPP Dukovany staff has become muchmore better and it is a necessary condition for a successfulfinishing of this study.
The results of the preliminary Study showed very conservativepresumptions, a lack of reliable data (mainly for initiatingevents), a lack of thermal hydraulic analyses and faults in theproject (e.g. some descriptions of systems, in someconsiderations). This is also a main reason not publishing andnot releasing of- this study and accepting of it as a "workingversion". During this period was appeared a necessity to have avery compact team for such purposes and meetings of this teamwith very low frequency has helped to overcome a little bit thisproblem.
3. PSA ACTIVITIES FOR 1992 AND NEXT FUTURE IN CSFRThe work on the Final NPP Dukovany PSA Study will continue
during 1992 on the base of the Preliminary report. The RiskSpectrum PSA version will be used for evaluation. Some activitiesfor a preparation of a "living PSA model" for the NPP Dukovanyhas been started.
In September 1992 is expected to start with PSA Study - firstlevel for the NPP Jaslovské Bohunice (first two units withWER-440 type 230 reactors). These activities will be supervisedby foreign experts in frame of the CEC PHARE Programme. Thecompetition was finished the Electrowatt company from England waspointed as a leader of this project. The final version of thisStudy has been planned to release very soon, the middle of 1993has been expected (but beginning of a start was postponed roughly6 months)
The tender for PSA Study of our NPP Temelin with VVER-1000reactors was prepared several weeks ago (moreinformation see in [66]). Six foreign organizations have takenpart in this competition and decision about the start of it andthe scope of it (probably the second level will be asked) will beclear during this year.
67

gg REFERENCES
[I] Bris R., Ferjencik M., Hojny V., Cyrâniovâ J., Dusek J. :Comparison of codes which are used in NRI Rez for NPPsafety system reliability analyses. Report ÜJV 7411 A, Rez,June 1985 (in Czech), 60 p.
[2] Holy J.: SIGASEN - the Code for Sensitivity Analysis,Report ÛJV 8839 A, Rez, January 1987 (in Czech),
[3] Patrik M. : FRANTIC-Code modified according to the NRIneeds. Report ÜJV 8500 A, Rez, May 1988 (in Czech), 43 p.
[4] Hojny V.: CRAFT - user's guide. Report ÜJV 8938 A, Rez,October 1989 (in Czech), 75 p.
[5] Holy J.: Program COSMOS (analysis of fault treeuncertainty propagation), Report ÛJV 8839 A, Rez, June 1989(in Czech),
[6] Patrik M. : Verification of function and modification of theintegrated PC package for PSA - PSAPACK. Report ÛJV 8951 A,Rez, October 1989 (in Czech), 38 p.
[7] Krett V., Dach K., Dusek J.: Application of fault treeanalysis to bubbling depressurization system of the nuclearpower plant with the WWER-440 reactor. In: Proceedings ofthe International Workshop on Technological Risk in ModernSociety, Laxenburg (Austria), March 1987, 26 p.
[8] Dach K., Dusek J., Hojny V.: Investigation of independentand dependent human error to reactor WWER-440 safetyrelated systems reliability. In: Proceedings of the SecondInternational Workshop on Advances in RA and PSA,Seregélyes (Hungary), September 1987, 25 p.
[9] Holy J.: Input Data Uncertainties in Reliability Analysisof the Low Pressure ECCS System of the WWER-440 Reactor inNPP Dukovany and NPP Mochovce, Report ÛJV 8505 T, Rez, May1988, (in Czech)
[10] Dusek J.: Reliability analysis of the WWER-440 type 213safety systems, In: Proceedings of the Czechoslovak -British Seminar on Nuclear Power, Brno (Czechoslovakia),Nov. 8-9, 1988, pp. 193-214
[II] Najih A.M. Al-Kaisi, Dusek J. , HPIS-ECCS PSA of Paks -Hungary NPP, Rep. NRI, Éez, Nov.1989, 48 p.
[12] Kaspar J.: Probabilistic Safety Analysis of the NPPWWER-440 and the LVR-15 Research Reactor with Modelling ofAccident Sequences. Ph.D. Thesis, Moscow 1991 (in Russian)
[13] Dusek J. , Dach K.: Application of reliability analyses ofWWER NPP safety systems to PSA. In: Proceedings of thePSA'87 - International Topical Conference on ProbabilisticSafety Assessment and Risk Management, Zurich(Switzerland), Aug. 30 - Sept.4, 1987, pp. 395-399
[14] Dach K., Dusek J., Investigation of human action influenceon Czechoslovak WWER-440 NPP with LPIS-ECCS reliability forPSA study, In: Proceedings of the PSA 89 - InternationalTopical Meeting on Probability, Reliability and SafetyAssessment, Pittsburgh (USA), April 1989, 8p.
[15] Dusek J. , Use of PSA and its development and trends inCzechoslovakia, In: Proceedings of the PSA 91International Symposium on the Use of PSA for OperationalSafety, IAEA-SM-321/67P, Vienna (Austria), June 1991
[16] Holy J.: Uncertainty analysis in the process of reliabilityestimation. In: Proceedings of the IAEA Technical CommitteeMeeting on the Use of Probabilistic Safety Analysis toEvaluate Nuclear Power Plants' Technical Specifications,Vienna (Austria), June 18 - 22, 1990
[17] Dusek J. , Probabilistic safety assessment in Czechoslo-vakia, American Nuclear Society - Czech and Slovak NuclearSociety Seminar on PWR Safety, Prague, April 1991, 25 p.
[18] Holy J. : Numerical Evaluation of Uncertainty Propagationthrough Fault Tree, NRI Rez - NUS Corporation Seminar onPSA and its Application, Rez (Rep. NRI 9417 T), May 1991
[19] Dusek J. , Probabilistic safety assessment study of NPPDukovany, NRI Rez - NUS Corporation Seminar on PSA and itsApplication, Rez, May 1991, 7 p.
[20] Dach K., Dusek J., Hojny V., Holy J., Patrik M., VitâzkovâJ. , Babic P., Final report of the IAEA research contractno. 4032/RB Importance of Independent and Dependent HumanError to System Reliability and Plant Safety (a part of theIAEA coordinated programme on development of risk criteriafor the whole nuclear fuel cycle), Time Period: Dec.1984 toDec. 1987, 72. p
[21] Hron M., Dusek J., Kaspar J., Macek J., Holy J., Malacka M.Horyna J. , Listik E. , Pittermann P. : Final report of theIAEA research contract no. 4355/RB - Probabilistic SafetyAssessment for Research Reactor LVR-15 (a part of the IAEAcoordinated programme on PSA for research reactors), Timeperiod: March 1986 to March 1989, 147 p.
[22] Kaspar J., Hojny V., Najih Al-Kaisi, Samal V., Patrik M. ,Dusek J. , Aldorf R. , Hustâk S. : Progress reports of theIAEA research contract no.5045/RB Modelling of a Small LOCAAccident (a part of the IAEA coordinated programme onreference studies on probabilistic modelling of accidentsequences) - summary report, Time period: July 1988 toMarch 1991 , 182 p.
[23] Kaspar J. : Experience from International Participation inIAEA CRP "Reference Studies on Probabilistic Modelling ofAccident Sequences" for WWER-440 Reactor and its using inApplication of PSA in Czechoslovakia, réf. na TechnicalCommittee Meeting on PSA Requirements for Use in SafetyManagement, 16-20 September 1991, Stockholm

[24] Dach K., Hojny V., Patrik M., Samal V., Hâjek R.,Aldorf R. , Antes M. : Final report. IAEA Regional ProgrammeRER/9/005 "PSA for'WER-Type Reactor", March 1990, 148 p.
[25] Hojny V., Patrik M., Aldorf R., Hustäk S.: PSA of the NPPDukovany - Large Break LOCA Initiating Event, Summaryreport prepared for the purpose of the peer review carriedout on April 15-19, 1991. IAEA Regional ProgrammeRER/9/005, NRI Rez, January 1991, 42 p.
[26] Dusek J. , Stépânek V., Kaspar J. , Holy J. , Rysavy J. :Progress report of the IAEA research contract no. 5686/RBData Acquisition for the LVR-15 Research Reactor (a part ofthe IAEA coordinated programme on data acquisition forresearch reactor PSA study ), Time period: June 1990 toJuly 1991, 55 p.
[27] Hojny V. : Human error in fault tree methodics, NRI Rez,August 1991, 8 p. (In Czech)
[28] Stanicek J. , Tinka I.: Preliminary NPP Dukovany PSA Study -Appendix C - Reactivity initiating events, Report EGPPrague No. 221-6-910958, November 1991, 25 p. (In Czech)
[29] Kovâcs Z. et al.: Project EDU for first unit NPP DukovanyPSA Study purposes, VUPEK Report No. 823-001-003-4/1,Bratislava, Dec. 1991, 17 p. + 400 p.(suppl.), (In Slovak)
[30] Kovâcs. Z. et al.: Preliminary first unit NPP Dukovany PSAStudy - Appendix D - LOCA, part 1, System description,VUPEK Report, Bratislava, March 1992, 223 p. (In Slovak)
[31] Hojny V., Patrik M. , Hustâk S. , Âldorf R. : Preliminary NPPDukovany PSA Study - Appendix E - LOCA with the rupture ofan equivalent diameter greater than 300 mm, NRI ReportNo. 9630 T, Rez, February 1992, 147 p. ( + supplement No.l,July 1992, 39 p. )
[32] Babiè P., Adamec P.: Preliminary analysis of first unit NPPDukovany response to medium LOCA accident - Appendix F,Supplement No.l to the EGO Prague Report No. 21511230,Béchovice, December 1991, 285 p. (two volume), (In Czech)
[33] Stanièek J. , Borsky M. , Kreim R. , : Preliminary NPP DukovanyPSA Study - Appendix G - Leakage from secondary circuitaccident, Report EGP Prague No. 221-6-911000, December 1991,72 p. (In Czech)
[34] Pospïèil B. , Halada P.: Event trees development for thePreliminary NPP Dukovany PSA Study, VÛJE Report No. 224/91,Trnava, December 1991, 81 p., (In Slovak)
[35] Markech B. et al.: Assessment of initiating events"Collapse of the grid with both TG out of control for theNPP internal load" and "Loss of service water system", VÜJEReport No. 248/91, Trnava, December 1991, 114 p. + 126 p.(two volumes), (In Slovak)
[37]
[39]
[45]
Borsky M. , Dolejsi J. , Kreim R. , Stanicek J. : PreliminaryNPP Dukovany PSA Study - Appendix I - Failure of bothturbogenerators, the causes of failure are considered,Report EGP Prague No.221-6-911001, Dec.1991, 41 p. (InCzech)Kandrâè J. et al.: Fire as an initiating event of firstunit NPP Dukovany accidents (second part), report VUPEK823-001-003-4/2, Bratislava, November 1991, 36 p. (InSlovak)Kandrâè J. et al.: Preliminary first unit NPP Dukovany PSAStudy - Appendix K - Fire as an initiating event of firstunit NPP Dukovany accidents, report VUPEK 823-001-003-4/3,Bratislava, March 1992, 52 p. (In Slovak)Baszô Z. , Misâk J. , Vâclav E. : Small and medium LOCAanalyses of WWER 440/213 with HPIS failure - app.Ll, VÛJEReport No.283/90, Trnava, December 1990, 102 p. (In Slovak)Dienstbier J., Hojny V.: Influence of pressure suppresionsystem failures on LOCA mitigation in a NPP woth theWER-440 type reactor - App.L2, NRI Report NO.9307-T, Rez,December 1990Kovâcs Z. , Sopira V., Charvât L. : Internal floods asinitiating events of accidents - App.LS, VUPEK Report,Bratislava, December 1989, 8 p. (In Slovak)Petrlik J, Stanicek J., Nägl J. : Preliminary NPP DukovanyPSA Study - Appendix L4 - Leakage from secondary circuitaccident, failure of both turbogenerators. Thermalhydraulic analyses, Report EGP Prague No.221-6-911002,December 1991, 85 p. (In Czech)Patrik M.: Reliability of the Electric Power Supply Systemusing GSA and DG starts during an Accident in Comparisonwith Reliability of the Electric Power Supply System usingSafety Pump starts by UPS and Offsite Power Supplying -App.Ml, Report ÛJV 9344 T, Rez, April 1991, (in Czech)Hustak S.: The Analysis of Performed Modifications in theSignal Paths for Formation HO-1 and HO-3 Signals FollowingTurbine Quick-acting Valves Closing and in the Signal Pathsof HO-1 Signal to Turbine Quick-acting Valves Closing- App.M2, Report ÜJV 9476 P, Rez, July 1991 (in Czech),76 p.Aldorf R. , Hâjek R. : Reliability Analysis of DG in NPPswith WER Reactors - App.M3, Report ÛJV 9478 P, Rez, July1991 (in Czech), 36 p.Hustak S. : Reliability Analysis of the Level RegulationSystem in the Heat Exchanger - App.M4, Report ÛJV 9477 T,Rez, August 1991 (in Czech), 83 p.
69

70 [47] Hep J., Smutny V., Valenta V.: IDE computations forsurrounding of the NPP Dukovany during fast withdrawal ofa control assembly accident, Skoda Report No.Ae 7555/Dok.,Plzen, August 1991, 77 p. (In Czech)
[48] Valenta V., Hep J. : NPP Dukovany PSA Study - Appendix N -Possibilities of third level PSA analyses inCzechoslovakia, Skoda Report, Plzen, November 1991, 97 p.(In Czech)
[49] Stanicek J.: Personal communication[50] Babic P.: Engineering safety features taking place after
long time from an accident initiation and possibilities ofdecreasing of conservatism of the model, Report EGO PragueNo.21511230, December 1991, 29 p.(In Czech)
[51] Holy J.: New suggestion for uncertainty analysis methodics,NRI Report No.9264 T, Rez, January 1992, 131 p. (In Czech)
[52] Babié P.: LOCA computations for NPP Dukovany with specificdata, Supplement No.2 to the EGO Prague Report No.21511230,Bèchovice, April 1992, 45 p. (In Czech)
[53] Borsky M., Kreim R., Petrlik J, Stanicek J.: Rupture of onesteam generator tube, EGP Prague Report No.40-0832-71-004,June 1992, 63 p. (In Czech)
[54] Hustâk S.: Internal floods as initiating events ofaccidents, NRI Report No. 9706 T, Rez, July 1992, 12 p. (InCzech)
[55] Holy L. : Some Interesting Problems Connected withuncertainty Analysis Performance as a Part of PSA,Multilateral Symposium on Safety Research for WER,7.-9.7.1992, Cologne, Germany
[56] Dusek J.: Acquired Experience during the NPP Dukovany PSAStudy Preparation, Multilateral Symposium on SafetyResearch for WER, 7.-9.7.1992, Cologne, Germany
[57] Hojny V.: Large Break LOCA Initiating Event in the NPPDukovany PSA Study, Multilateral Symposium on SafetyResearch for WER, 7.-9.7.1992, Cologne, Germany
[58] Patrik M. : Prospect for PSA Application in the NRIRez, Multilateral Symposium on Safety Research for WER,7.-9.7.1992, Cologne, Germany
[59] Aldorf R. : DG Start-up Reliability Analysis for the NPPDukovany, Multilateral Symposium on Safety Research forWER, 7.-9.7.1992, Cologne, Germany
[60] Novâkovâ H.: PSA programme in VUPEX Bratislava (thismeeting)
[61] Cillik I.: Basckward influence of PSA Methodology onspecific data collection on NPP (this meeting)
[62] Stanicek J.: Analysis of transients for PSA of Dukovany NPP(this meeting)
[63] Hojny V.: Presentation and basic application of PSA results(this meeting)
[64] Valenta V.: Probabilistic and safety assessment in SKODA(this meeting)
[65] Sedlâk J.: Probabilistic reliability and safety assessmentin SKODA (this meeting)
[66] Ferjencik M. : PSA activity of the NPP Temelin (thismeeting)

THE PSA PROGRAMME IN VUPEX BRATISLAVA
H. NOVÄKOVÄVUPEX, J.S. Co.,Bratislava, Czechoslovakia
Abstract
The areas in which VUPEX is active reflect problems arising in the nuclear power plant operation.Main fields of activities are systems analyses which include reliability analyses of safety systems,probabilistic safety assessment and fire protection for WER 440s.
The system reliability analyses are concentrated on the front-line and support systems of V213 andV230 type reactors. Examples are the high pressure safety system and reactor building spray system ofV230 type reactors and numerous single system studies sponsored by utility for design, review andreconstruction purposes. The fault tree method by TREE MASTER code has been used for analyses.
VUPEX performs research into Probabilistic Safety Assessment within the Level I PSA study of theunit 1 of Dukovany Nuclear Power Plant. The work was started in 1989 and the Level 1 study will befinished in 1993. The systems analysed in VUPEX are those V213 type front-line systems identified inevent trees. Also analysed are the support systems whose action is required by the front-line systemsduring the course of an accident. The RISK SPECTRUM-PSA code is used for analyses.
Introduction
Main fields of activities are system analyses which Include re-liability analysis of safety systems, probabilistic safety as-sessment and fire protection.
System Reliability Analyses
The system reliability analyses are concentrated on thefront-line and support systems of V 213 and V 230 type reactors.Examples are the emergency core cooling system, reactor buildingspray system, load sequencing system, emergency power supplysystem, serwice Water system, auxiliary feed water system, reac-tor protection system of V 230 type reactors, technical specifi-cation evaluation for reactor protection system of V 213 typereactors and numerous single system studies sponsored by utilityfor design, review and reconstruction purposes. The fault treemethod has been used for analyses. At the present time the TREEMASTER code ( version TM2 ) is used for it. This is a commercialcode for personal computers developed by Mr. Antonin Wild fromCanada.
71
Two nuclear power plants, located in Jaslovské Bohunice andDukovany, are in operation in our country. Both are equiped withWWER 440 reactors. The Jaslovské Sohunice plant consists of twoV 230 type units and two V 213 type units. Dukovany plant hasfour identical V 213 type reactors.
The first generation WWER 440s, designated as model V 230,have few features to mitigate the effects of a severe accident.Safety related additions to the basic design were incorporatedinto the second generation, designated as model V 213. These ad-ditions include an emergency core cooling system with high pres-sure and low pressure pumps, core flooding system, cladding onthe interior of the reactor vessel, reactor building pressuresuppression system to reduce compartment pressures in the eventof a loss of coolant accident, etc.
The areas in which VUPEX Bratislava is active reflect prob-lems arising in the operation of these nuclear power plants.
Probabilistic Safety Assessment
VUPEX performs research into Probabilistic Safety Assess-ment within the level 1 PSA study of the unit 1 of Dukovany Nu-clear Power Station. The work was started in 1989 and the level1 study will be finished in the end 1993. It is coordinated byMr. DuSek, ÜJV REZ.
In VUPEX the following works are being performed:- fault tree construction and reliability analyses for front-
line and support systems,- functional and systemic event tree construction for loss of
coolant accidents using results of thermal-hydraulic analysesfrom VÜJE Trnava (Nuclear Power Plant Station Research Institu-te),
- event tree accident sequence quantification for LOCAs andtransients.

The system indlyzed in VUPEX are those V^13 type front-l ine
^.y^tefn^ id p n L i f t e d in p v en t t r e e s Thet^e include the hjgh près
sur e system, low pressure system and reactor building sprfiy sys
tern in injection and recirculation mode, the reactor protection
system, core flooding system, emergency feedwater system, auxil-
liary emergency feedwater system and the secondary side heat re-
moval system
Also the support systems are analyzed whose action is requ-
ired by the front-line systems during the course of an accident
Those support systems are load sequencing system, engineered sa-
feguards actuation system, uninterruptible and essential emerg-
ency power supply system, serwice water system, intermediate
component cooling system, technological compartment cooling sys-
tem and demineralized water system.
Common cause contributors and human errors associated with
the testing, maintenance or operation are included in the system
models. Component data used in the analyses are generic WWER 440
data and plant specific data.
The RISK SPECTRUM - PSA code is used for these analyses
The success criteria of the front-line systems were obtain-
ed from thermal-hydraulic analyses performed in VUJE Trnava.
Fire and Flood Safety Analyses
The VUPEX fire analyses consist of:
- fire hazard analyses with identification of critical plant
location and evaluation of fire occurence,
- fire propagation analyses in critical areas with use of mat-
hematical simulation, the computer code COMPBRN III is used for
modelling of compartment fire behaviour
All this works was based on the plant system analyses, whe-
re cable routes for safety important systems were analyzed for
V 213 and V 23O units
The flood analyses for Dukovany are at an early stage, but
the important flood sources havp been identified
THE STATE AND PROBLEMS OF PSA FOR WWER PLANTS
Y V SHVIRAYEV, V B MOROZOV, A F BARSUKOV,G V TOKMACHEV, A A DEREVYANKINAtomenergoprojekt,Moscow, Russian Federation
Abstract
In compliance with the current regulatory documents issued bythe State Supervisory Authority of the Russian Federation PSAsshall be incorporated in the WPP design process. PSA resultsshall demonstrate that the estimated values of core damagefrequencies and excessive releases do not exceed the set targetvalues of l-OE-5 and l-OE-7 per reactor/year, respectively. Anexcessive release is a release that may require populationevacuation from the areas located at certain distances from thesite set in the MPP Siting Rules.
Thus MPP design shall incorporate level 2 PSA (withelements of the third level) that shall define a completevariety of possible MPP radiation incidents (when the setexcessive release values are exceeded) and evaluate theirfrequencies of occurrence i amounts and consequences (dosecommitments). Consequently! a PSA is an integral part of a MPPdesign required for licensing. Moreover« presently PSAs alongwith deterministic analyses have become the main tool fordecision-making in the field of safety improvement of the MPPsoperating and being designed.
The report tackles the following issues:
1- The status of methodology (procedures and codes) for PSAs.
2. PSA results for the WWER plants and their application foroptimizing the design solutions and developing safety measuresfor the operating WWEH-1OOO plants located in the CIS coun-tries.
3- Major problems of further PSA development and application forthe WWER plants in the Russian Federation.

73
1. PSA Status
In compliance with the major Russian regulatory document on NPPsafety "General Safety Provisions for NPP Design, Constructionand Operation" (OÏÏB-88) /!/ the estimated values of core damagefrequencies and excessive releases incorporated in the plantdesign basis should not exceed the OIÏÏ3 -88 values of 1 OE-5 andl.OE-7 per reactor/year, respectively. An excessive release is arelease that may require population evacuation from the areaslocated at certain distances from the site specified in the NPPSiting Rules. In practice, these distances correspond to NPPdistances from major populated areas with the population ofseveral tens of thousands people.
Similar target values for core damage frequencies are specifiedin th" IAEA recommendations /2/ - l.OE-4 and l.OE-5 pei reactor/year for operating plants and plants being designed,respectively. According to /2/ the frequencies of severeaccidents requiring immediate off-site countermeasures shall beat least 10 times less core damage frequencies due to the use ofaccident management measures.
The DB-SS requirements mean that NPP design shall incorporatelevel 2 PSAs with estimated population do--;© committments atdifferent distances from the NPP. As a result of PSA core damageand ey-essive release frequences, total for all accidentsequences (AS), shall be estimated, and these frequences shallbe proved to be lower than OIIB-88 targets. PSAs are mcoiporatedin NPP designs because they are essential for licensing
It should be noted that PSA performance entails certaindifficulties related to the application of targets listed in /!/and /2/. They stem from the fact that neithei /1/, nor /2/describe the procedures used for correlating the obtainedpioject-specific PSA lesults witli targets In patticu^r, it isnot clear whether targets have the meanings of nedian, average
value.> or of the values obtained for certain pio!>ahilisticconfidence levels Neither is it ol«ar whetlvi PSA shall accountfor internal initiating events (lEs) only, 01 for exteinal IDsas well We thin!, that "Gosatometiei gona-trni " of th<> RussianFederation and IAEA should make appropriate additions, commentsor explanations in order to avoid these major uncertainties.
2. The statfi of PSA technology
Atomenergoproekt has developed a PSA-1 technology consisting ofa package of procedures and computer codes for IBM PC AT. Basedon this technology a Guide has been prepared the scope of whichi ncludes:
2.1. Probabilisitic modelling aimed at defining core damagestates. Functional event trees (FET) used as models arebuilt similarly to the Western ones.
2.2. Systems reliability analysisThe reliability analysis technique based on fault trees (FT)accounts for almost all reliability-important features of thesystems, such as: structure, operation modes, status monitoring,maintenance and repair strategy. A reliability analysis consistsof two stages: 1) failure mode and effect analysis (FMEA) isperfonred with a detailed failure mode classification dependingon the above-mentioned features of system components, and asystem fault tree is built; 2) a set of minimal cut secs (M2S)is defined on the basis of the fault tree and their quantitativeassessment is made based on time-dependent unavailabilityfunctions for each MCS with a subsequent averaging for thestudied time periods. This technique allows for a detailedassessment of different factors affecting system reliability
2 3. CCF modellingCharacteristic of the methodology is an implicit, reflect-ion ofcommon-~ause failures (CCFs) in a logical nodel and detailed

74 qualitative and quantitative modellingcharacteristics of individual events.
of different
An implicit method of introducing CCFs into the logical modelimplies an analysis of reference MCS made up of independentfailures only. If such a MCS contains failures of at least twocomponents susceptible to a CCF, additional NTS are generatedcontaining CCFs instead of independent failures of therespective components. Also the so called "enveloping" M2S aregenerated that contain the following event: a CCF of thereference MC5 components along with other components included inthe CCF group. The procedure of generating addit ion-il MTC w i t hCCFs envisages their check for uniqueness and screening.
Detailed modelling of OCFs is accomplished by:
1) defining probabilities or occurrence rates of CCF; tltroughseparate modelling of the events with sources of differentorigines. A quantitative assessment of these characten sties ismade W means or reference parameter models: binominal, greekletter, -factor or -factor models. All groupe of componentssusceptible to CCFs are divided into three classes. The criteriafor placing the groups of elements into this or that class areas follows:
class 1 - common designclcos 2 - common Environmental conditionsclass 3 - *-ame maintenance and/or inspection procedures;
2, i'it-litifving the mode and monitoring frequency of CfTs withcons at ion for hie monitoring type, frquency an<l -trategv ofIP'J: idual compcivn'i failures,
3) calculating a mean time period of PCF removal with iégard orthe °trategv arid aveiage time or recovery for individual failedcomponents, their effect on tlie system opt-iation. ^plimita ions
The '(.tailed modelling allows to make a quantitative predictionof the failure impact on probabilistic safety paiametfis with aslow uncertainty as possible, as well a~> to use vai iou- cle-sunisolut • us aimed at mpiovmg protection or tlv -ar> tv sv-U-mequipment.
2.4. Personnel i el lability modelling
Personnel relia). ility analysis i-, based on human - 1 ' or tree-(MET). Tiie following three groups of human t-nois aiv ''onsidervd.
- maintenance errors leading to accident initiating events (IE);- maintenance ei rors leading to cafetv system iiiirtvnilnl.ilitv;- 3\ ik"'!' control ti i or -. during ace i dent l ,- ,< | \ . ,.r- \<sequei ces with coie dai
HET are based on the detailed algorythms of personnel actions(jev iop d en the basis of design and operation documents oinlaccident analysis results.
In the- course of HET quantification the human errorprobn* ;lities are determined with consideration for the timeon decision- making and act ion- taking, for stress leveJ-s. etc.Later on they are used for evaluating conditional prob rn 1 1 1 1 esof AS occurrences or probabilities of los1; of safety ^unctionsas a result of human errors.
2.5. Quantitative assessment of accident sequences (AG)
AS quantification is hased on the development of detailedflarpe) fault trees (FTs) for each AS or or functional eventtrees ith subsequent modelling and quant irving independentfaillies, CCFs, and human errors. The milling di.dquantification results serve as a basis rot determiningconditional probabilities of AS occuirence^

2.6. Assessment of PSA results - ANTES, intended for human reliability calculations-,
The assessment of PSA results consists in:
- defining core danvige frequencies (total roi all Afi and thencori «• ! it i on witl tht target values:
del« eu it contributor0 to cor t k-iiiair** ti t/i|Ue-nci«-5and "weak points" of the project;
- analysing significance and sensitivitv;
- analysing uncertainties;
- evaluating the project and giving reconnue! «t-it ion, » rit|i respectto safety improvement.
Software package for PSA
PSA software package comprises: It computation modules forcalculating AS probabilities by means or MCS; ?) graphicseditors (used to generate the required imtidl data on faulttrees and event trees), and 3) a component jvli ability database.The software package permits to calculate AS probabilities notonly -or compon-îiiT independent failures but for CVF and humanerrors as well.
The software package incorporates the following computer codesrun on PC AT:
- APRA. intended to estimate AS probabilities with coasiderationfoi data omndependent failures, CCFs and human error-;
- VNF. intended for verification of AS probabilities withaccou1 ' of the maintenance strategy features;
75
- UNAS, intended to analyse the uncertainties of PSA-1 resultsas a function of component reliability uncertainties.
3. PSA results for WWER-type NPPs
3.1. Preliminary PSAs have been performed for t lu- followingdesign? of nuclear power plants with WWER-1000 reactors:
1. Standardized B-320 NPP design used for the- Rostovskaya NPP,unit No 4 of the Balakovskava NPP (Russia), the "Temelin" NPP,(Chechoslovakia). This design is implemented in tlv operatingunits of the Balakovskaya NPP (Units 1-3), Zaporozhye,Khmelnitskaya, Rovno NPPs arid "Kozloduy" NPP, Bulgaria It isbased on the application of three-train active sarttv vy-stenuperforming core heat removal functions «luring accidentswith/without primary coolant losses, and or a full-pressuiereinforced concrete containment.
2. A backfitted design of B-320 HPP used for Units 5 and 6 ofthe Balakovskaya NPP, which besides the active safety systemssimilar to those of the standardized design, incorporates apassive system of heat removal through the secondary circuit(PHRS) and an emergency boron injection system. Also hydrogendischarge system and a filtered containment vent system areprovided.
3. B-392 NPP design for the LoviiEa NPP, Finland. It is leased onthe use of four-train active safety systems and a full-pressuredoublé containment with a filtered atmospheric exhaust system.
4. A new design of the B-392 NPP of improved saret v' (NPP 32Project), Mutually redundant multy-train active an<l passivesafety s/stems are provided to fulfil major saretv function--- in
pi eject.

76 The function of making and maintaining the reactor 3til<critieal'S accomplished bv one of the following mutually mlependentsyste- -
- mechanical reactor protection system with 121 contiol rods;- fluid emergency boron injection system.
The function of long-term core heat removal during accidentswithout primary coolant losses can be performed hv one thefollowing mutually independent systems:
- passive system of heat removal from SGs;- four-train active system of heat removal m the. secondarycircu, , 4 x 100%.
Each of the these systems is capable of SG heat removal duringan unlimited time period. Therefore, thev are <ompletelvmutually redundant as regards the long-term heal removalfunction.
The function of maintaining the core coolant inventory duringLOCAï> can be accomplished by the following mutually independentsystems:
- pas-=- ve ECCS with level-1 and 2 storage tatiki. that cmi performits prescribed functions during 24 hours following thy accidentinitiation;- four-train act we ECC3, 4 x 100%, that <_an peuorm iU>prescribed functions during the whole period or Lime- inquired tomake the unit safe.
The use of a passive EOCS must ensure enhanced t eligibility oflong-term core coolant maintenance due to t lie margin of ?4 hoursfor implementing accident management act i v i L u » ( r < i <-xan£>l<?,for , '•oring functionabilitv of the active Q'CJ in <_o. - or itstotal railuiv).
The u- of diverse mutually redundant passive and active safetysvstf> a better protection against CCFs because such systemseither do not have components similar or identical in design ortheir number is minimal. As a result, the impact of CCFs isgreatly reduced and the reliability of major safety funofionb isdrastically improved.
The use of passive systems and an active heat removal system ofthe secondary circuit (CAP) capable of long-term functioningafter the accident initiation practically eliminates theneed for the personnel to operate safety systems duringaccid£> ts.
To increase the active safety system availability their trainscan be used for normal operation with the reactor operating onpower. The majority of components of these trains (pumps,valves, heat exchangers, etc.) are in the state similar to thatduring the accident. This allows to avoid complete latentfailures and reduce the effect of CCFs. It also leads to asubstantial reduction of the equipment arid components used insafety systems and normal operation systems and, hence, toincreased technical and economic parameters.
The containment system is a full-pressure reinfoiccd concretecontainment equipped with a hydrogen discharge system, maltedcore trap and containment atmospheric dump system for beyond thedesign basis accidents. The safety concept imbedded m theNPP-92 project is based on the evolutionary principles whichimply the use of well-proven, verified and supported by along-term operational experience decisions and r^ w decisionsbased on obvious and well-studied physical and technologicalprocesses. This concept may serve as a basi^ for nuclear powerdeveioL nient for the nearest 15-20 years.
3 2 PSAs for t lit1 projects listed above were p*-rroi n«.<l foi Alimited numbei of majoi groups of internal IPs inclu<hnf

- NPP de-energization, i.e. loss of on-site normal i-ower and off-site A.C. power during various periods of time (LOOP):
- less than an hour;- within 10 hours;- within 24 hours;- within 72 hours;- within 720 hours;
- long-term normal heat removal failures in the secondarycircuit requiring cold shut-down of the Unit without loss ofpower and secondary piping ruptures (LONHRS on ss);
- main steam header rupture (M3HR);
- rupt :res of SG steamlines and feedwater lines in the non-isolated parts (SGTR);
- small-break LOCAs (SBLOCA) in the primary circuit;
- medium-break LOCAs (MBLOCA) in the primary circuit;
- large-break LOCAs (LBLOCA) in the primary circuit;
- leak from the primary into the secondary circuit (SGHR).
3.3. PSAs were performed only for one operating mode, namely forthe full power operation of NPP.
3.4. Mainly a general database on component reliability /3/, aswell as data from /4/, personnel reliability data available at"Atonienergoproekt", and CCF model parameters from /5/ were usedfor PSA Finnish data were used for a number of components(diesel-generators, fast-acting atmospheric exhaust system) mthe course of PSA for the "Lovnza" NPP.
3 5. Cere damage frequencies for each AS were estimatedseparately for indeoendent failures (IE), IE+CCF, and IE+CCF-HIE(human errors).
3.6. Accident-management measures for beyond DBAs were takeninto consideration in PSAs for the "Lovnza" NPP, Unit 4 of theBalakov-skaya NPP and NPP-92 Project.
3.7. PSAs were performed to reach the following mam purposes:
- to evaluate the contribution of the studied groups of lEsinto core damage frequencies;
- to identify dominant contributors to core damagefrequencies (IE, functions, ssystems and components, CCF, HE);
- to develop safety improving measures, including accidentmanagement measures, optimization of design solutions onstructure, mechanical systems and maintenance;
- to evaluate and verify major design solutions on NPPswith improved safety.3.9. Table 3.1. contains PSA results for the standardized B-320NPP exemplified by Unit 4 of the Balakovskaya NPP. The values ofcore damage frequencies, total for all AS, for the reviewed listof major internal JEs are 1.9E-5 and 4.2E-4 per reactor/yearwith and without accident management activities, respectively. Onthe basis of PSA results a variant incorporating the recommendedbeyond DBA management measures was selected as a basic design.Such measures include:
1. The use of feed and bleed mode.
2. Water supply from the emergency service water system intoA-ater inventory tanks of the SG emergency feedwater system,so tha*- the latter is able to operate over 10 hours

78 TABLE 3 1 CONTRIBUTION TO CD FREQUENCY FOR WWER 320 NPP
IF
i MU ni n
i KHI IK nj i ni (ira4. M;IIR
5. I O O P5.1. (OOP in 7? h
Ti. 2. LOOP in 720 h
fi. I.ONIIR on SS( i . l . H i t h lu« of TC
n . P . H i t h o u t loss ofTC
/. M.FR
II HMIK
n i l I F
:E frequencyI/year
3.PE-3
l.OE-1
3.0E-4
l .OE-3
7.0E-3
l .OE-4
3.0E-2
7.0E-2
l .OE-4
l.OE-3
CD frequency, I/year
Hithout flM
I/year
3.3E-0
1.8E-7
1.3E-6
1.1E-6
9.8E-5
2.2E-6
2.9E-4
4.5E-6
4.0E-7
1.4E-S
4.2E-4
'/.
0.8
<i
<1
<1
23
<1
69
1
<1
3
With flH
I/year
9.4E-7
1.8E-7
1.3E-6
l.iE-6
1.3E-5
7.BE-7
7.3E-7
1.7E-7
4.0E-7
4.6E-7
1.9E-5
7.
"5
"1
~6, n
~G
"68
~4
"4
"4
~2
"?
The introduction of these accident management measures permitsto reduce core damage frequency more than 20 times.
In the basic design the largest contribution to the core damagefrequency (68%) is made by IEs with long-term loss of power,followed b/ failures of all three diesel-generators
U was also found that CCFs are the mam contributor to the coredamage frequency.
3.10 Taole 3.2. gwes PSA results for the "Lovuza" NPP(NPP-91) and NPP-92 designs. Core damage frequencies areestimated only for the 24-hour operation of safety systemsfollowing the accident initiation, while for NPP-92 they areestimated both for 24 and 720 hours. For NPP-91 core damagefrequencies were estimated with and without the allowance foraccident management measures. Table 3.2. gives the results forNPP-91 with allowance made for such measures, including the useof feed and bleed mode and of auxiliary feed pumps connected toadditional diesel-generators in the secondary circuit.The above measures are performed by the personnel in both thiï>and B-320 NPP designs. The introduction of accident managementmeasures into the NPP-91 design allows to reduce core damagefrequencies more than 15 times. While evaluating core damagefrequencies in the NPP-91 PSA it vas assumed sufficient to buyequipment items similar in working principle and de-sign fdiesel-generators, pumps) from different manufactures in order to avoidCCFs.
For NF?-91 the main contribution to the core damage frequenciesis made by lEs with normal lieat removal failures on thesecondary side (66%) and de-energization (157.) resulting fromCCFs in emergency heat removal systems of the secondary circuitand human errors during accident management activities, arid byI Es with large leaks due to CCFs in ECCS (.15%). Human errorscontribute appr. 66%, while CCFs - 28%. into eort damagefrequencies.
The use of mutually redundant and diverse activt ^nd passivesafety ^/sterns m tht NPP-92 pioject allows to itJuee coredamait rrequencies by more that two orders of magmtuJe for 24hours following the accident initiation as compared to theNPP-91 project based on the use of active system^.

TABLE 3 2 CONTRIBUTION TO CORE DAMAGE FREQUENCY
IF
l
i -;u/x:/\
mi'* A
: 1 1 1 ' < '<
M '> I IP
•> U10P
o inrfliR«1 SK
All l | -
F frc-Tiiriiry,/vc.ii
?
1 PI- i
1 . 01- i
t (M 1
1 (P1 T
'i IF p
1. IK ?
7 OF ^
\ <>K l<P1 11)I.W.-l(p'l to5 (r ,•(1, I II)
NTP
^/-C-91
AC-9?
ff, 91
H~.-<)?.
AC. 9t
fr.-'R
re 9i
AC-98
AC 91
AC-9?
«: 91
w-92
AT 01
AC 9?
W 91AC-OP
Dorolrvinl -Safelyfunction
1raw on ss
Q1R on !SrocR)U
ECCnocROC
nr.cEOCniR on SS
RR ori SSHIR on SSHBf oil S3
SIR on SSH1R on SSHR on SS
HIR on SS
nu? on .1"
?'l II
7PO ti
i_ - __ - _
CD frequency . I/year
IF
59. 9E-11
1 CE-13
a IE-8
2. GE-10
S. IE- 17
7. 5E-9
9. 3E-0
1.7E-17
ar«'91.8E-9
1. 3E-10
1. 3E-10
3. 3E-9
1. 8E-10
l.OE-S
3.0F-9
l.PJE-15
7. r,E-15
1 IE-7
3. (iE-10
-
'i.'iE-e
IF*CCF
0
0. 7E-9
B 8E-11
1.4E-7
B.7E-8
S. 'IE-12
1.EE-8
3. ?J5-7
1.7E-13
1. IE-8
3.0E-8
7.9E-10
7. 9E-10
1. 3E-8
3.3E-9
7.0E-8
1. GE-7
t. 5E-13
z. iiE-ia
5 9E-7
3. CE-9
-
2.TF.-7
IF»OCF*P
7
8. 8E-9
8. 8E-11
1.1E-7«)
a.TE-8
5. 3E-1E
9.KE 8»)
3. 2E-7
t. 7E- IK
LIE «»)
1.7E-8
7. 9E-10
7. 9E-10«)
3.2E-7
2.3E-9
7.0E-8«)
1. 3E-G
1.4E-11
o. aE-ia»)
8.1E-6
3.2E-9
-
a. 7E-7
X
8
<1
i7
K
1.3
<1
15 0
15
<1r> ?
r
25
<1
15
7£
26
00
<1
<1
100
1CK)
-
100
i-"i<>!) i in«- 7rn i
As is shown in Table 3.2. core damage frequencies for the NPP-92project do not depend on human errors during accident managementactivities because of the use of active and passive systems that
do rot require personnel actions. Table 3.2. also shows thatcore damage frequencies for the NPP-92 project increase almostby two orders of magrntude with the increase or opération timefollowing the accident from 24 to 720 hours. This is explainedby the fact that during this period of time core collantinventory is maintained by active systems in case oi primarycircuit leaks.
In conclusion it should be noted that preliminary PSA-1 for WWER-1000 NPPs that have been performed by now show thecontributions of major IEs to the cumulative core damage freq-uency for all Power units. Full-scale PSAs are required toevaluate the actual values of these parameters.
4. PSA Problems
The following problems have to be solvedfull-scale PSAs:
in order to perform
4.1. Reactor-specific databases on component reliability, CCFmodel parameters and personnel reliability shall be developed onthe basis of collected and processed data from the operatingNPPs.
4.2. Complete lists of internal and external I Es for thestandardized nuclear power units under operation and designshall be prepared.
4.3. Russian advanced technologies shall be developed or Westernones shall be acquired and mastered, including:
4.3.1. PSA procedure for external lEs (seismic effects,aircrash, etc. );
4.3.2. Procedure for modelling civil structure and containmentreliability for various conditions, including severe accidents.

4.3.3 Combined PSA- 2 and 3 procedures.
4.3.4. F3A procedures for on-site fires and
4.5.0. Procedure for the reliability analysis oi passivecomponents (pipelines, vessels, heat exchangers).
4.3.0 Digital process control system reliability analysis,including sof twai e reliability analysis and CCF analysis.
The majority of the above problems are beginning to Iv solvedand further progress in these spheres requires lielp and suppoj tfrom the World Community. We think that certain support can besupplied by IAEA in the form of materials on t lie ribovt topicsthat are available or being prepared now, and wide involvenßntof Russian organizations in IAEA PSA programs.
REFERENCES
06mne nojiOMSHMH oöecneqeHHH öeaonacHocTH aïOMHux CTamjHß npHCOOPVJKPHHH H 3KcnJiyaTaunH (OIIE-88) IÏÏI A3r-l-011-89.
2. OcHOBHbie npHHUjmti öesonacHocTH aTOMHHXKOHcyjn>TaTH8Hoft rpynnbi no Hflepuofi GeaonacHOCTH. CepHH
ßeaonacHocTH N 75 INSAG-3. MATAT3, Bena, $eBpani) 1988 ro^a.
3. IEAE-TEC DOC-508. Survey of ranges of componentdate for use m probabilistic safety assessment. 1989.
reliability
4. A.D. Swam and H. E. Guttemann. Handbook of Human ReliabilityAnalisis with Emphasis on Nuclear Power Plant Applications.NUREG/CR-1278, US. Nuclear Regulator Commission, 1983.
5. J. k. Vaurio. A procedure for parametric common cause failureassessment proposed for IAEA project RER/9/005. IAEA, Vienna, 1990.
THE BARSELINA PROJECT, A MULTILATERALCOOPERATION BETWEEN LITHUANIA,RUSSIA AND SWEDENStatus report phase 2
E SÖDERMANES-Konsult AB,Stockholm, SwedenG. JOHANSONIPS AB,Stockholm, Sweden
E. SHIVERSKIYRDIPE,Moscow, Russian Federation
D. WILSON, A. ENERHOLM, P. HELLSTRÖMRELCON AB,Solna, Sweden
Abstract
The Barsehna Project was initiated in the summer 1991 The project is amultilateral cooperation between Lithuania, Russia and Sweden with the longrange objective to establish common perspectives and unified bases forassessment of severe accident risks and needs for remedial measures for theRBMK reactors. The Swedish BWR Barseback is used as reference plant and theLithuanian RBMK Ignakna as application plant The Barselina project cannot belooked upon as a traditional PSA, scope and objectives of the PSA activities aremodified according to the general objectives PSA is in this context used as a toolto achieve this common understanding between the project parties. This reportconstitute a status report for phase 2 of the Project prepared in August, 1992, tobe presented at the IAEA Technical Committee Meeting in BudapestSeptember 7-11, 1992
PROJECT OBJECTIVES AND GENERAL DESCRIPTION
General project objectives
The long range objective is
to establish common perspectives and unified bases for assessment of severeaccident risks and needs for remedial measures

Immediate task Objectives are
to carry out a pilot study providing preliminary, scoping assessments of riskand a proposal for additional stages in achieving above long range objective
to evaluate currently employed general approaches, methodology andavailable data bases, related to the reliability of RBMK components andsystems, in regard of weaknesses as well as of usefulness for the purpose ofRBMK safety analysis
Specific Russian and Lithuanian objectives
The primary objective with conducting PSA, the Ignalma 2 PSA, is to assess thelevel of plant safety and to identify the most effective areas for safetyimprovement In more specific terms this objective include the following activities
I Identification of dominant accident sequencesII Identification of systems, components, human interaction important to safetyIII Assessment of important dependenciesIV Identification and evaluation of (new and old) safety issuesV Decision support on backfittmg of generic and plant specific items
Specific Swedish objectives
On the Swedish side additional objectives can be formulated as follows
to enhance the knowledge and understanding of RBMK features so as toallow own independent evaluations of safety issues and operational eventsof RBMK reactors
to enhance the knowledge and understanding of RBMK features so as tocontribute to the international project "Safety of Design Solutions andOperation of NPPs with RBMK Reactors"
to develop Swedish PSA analysis competence and to document principles ofquality assurance for PSA implementation
81
Project Plan
The project plan is generated based on the IAEA Guidelines for conducting PSA
The parties participating in the project are
- From Sweden ES KONSULT AB, IPS AB, RELCON AB, Sydkraft KonsultAB, ABB Atom AB and Studsvik AB
From Russia The Research and Development Institute of PowerEngineering RDIPE The Kurcrntov Institute and the Russun FederationRegulatory Body
From Lithuania The Ignalma Nucle.ir Power Plant and The LithuanianEnergy Institute of Kaunas (former Institute for Physical and EngineeringProblems of Energy Research, IPEPER)
In general the methodology of the I2/PSA follow the format of a Swedish PSAThis approach ii based on small event tree and large f mit trees
Definition of Scope
In brief terms the scope can be defined as
The source of radioactivityThe reactor core
Final consequence of accidentCore damage (local or global)
Operational states includedFull power
Initiating events includedInternal initiating events (transients and LOCA)Internal hazards (fire)
Special issuesThe human interaction modelling will be performed in detail and the maincategories of human interaction will be include in the plant models Howeverthe quantification will be limited to conservative screening and the use ofbest estimates will be kmited to a few important actions
The dependency analysis will include a ngor analysis of all types ofdependencies
Uncertainty and sensitivity analysis will be performed in both a qualitativeand quantitative manner The use of conservatism will be evaluated andcontrolled through the sensitivity analysis
The time duration of the analysis following the initiating event will initiallybe one (1) day This limitation will be evaluated and removed if shownnecessary
The project will run for a period of two years and be split into three phases
Phase 1 Familiarization and Mmi-PSA
This phase will include the familiarization and structuring of a limited numberof safety systems and one single initiating event October 1991 to end march1992, closing with Working Group Meeting in Ignalin i March 31 to april 4th1992

J2 Phase 2 Limited level 1 PSA
This phase will include principal System Analysis for all important safety systemsand extension to several ini tnt ing events but excluding exterml events indlimited treatment of human factors April to december 1992 closing wuh aseminar in Stockholm scheduled to early december
Phase 3 PSA Level 1 extended in selected areas
This phase will extend the Level l PSA m areas selected during phase 2 Evenfor this phase the aim is not to perform a full scope PSA analysis December1992 - October 1993, closing with a joint seminar place and date to be decided
PSA Team Training
Training of the Russian and Lithuanian PSA teams will be performed at theIgnauna plant m the project PSA course, in Sweden by Russian and Lithuanianengineers participating in the Swedish working groups for periods of two to sixweeks The training consist of work with the Ignalma plant modelling, the RiskSpectrum Code and the TSEBA code for parameter estimation under supervisionof senior staff
PLANT MODEL GENERATION
Initiating Event Selection
The definition and categorization of initiating events includes three major tasksThe work preformed up till this point deal with the first two of these tasks
to review the plant design to determine what failure and transient events thatcan occur that could possibly lead to severe core damage
to determine plant specific conditions created by the failure or transientevent
The initiating transient event screening analysis has been presented The listingcomprises events covered in EPRI s list of both BWR and PWR transients andalso contains the events listed by Polyakov and Shiversky as RBMK type reactorinitiating events
The initiating event screening cover the following mam areas
LOCA event screeningPrimary circuit event screeningPower conversion system event screeningProtection and reactivity control event screeningElectric posvcr event screeningExterml and support sjstem event screening
The end product of this task is a list of initiating events (lEs) that is as completeas possible
Grouping of I n i t i a t i n g Events
When the plant system requirements has been assessed the Initiating Events canbe grouped in such way that all events m the group impose essentially the samesuccess criteria on the systems as well as the same special conditions (operatorchallenge, automatic plant response e t c ) and thus can be modelled using thesame event/fault tree analysis
A set of initiating events are suggested for event tree analysis The initiatingevent list below define 6 transient events 3 blockage events and 15 LOCA events(if S3 are excluded or collapsed with S2) At this point are the CCI events notincluded
Transients
TM Manual Shutdown with all main functions availableTSA2 Normal Scram with all Mam Functions availableTSFAS Fast acting Scram with all Mam Functions availableTTA2 Normal Scram with Turbine trip and by pass failure or steam
dump to condesersTFAZ Normal Scram with Loss of feed WaterTEA2 Normal Scram with Loss off-Site Power
Circulation blockage
PCBj Primary circuit blockage One to three pressure tube riserPCB2 Primary circuit blockage Four or more pressure tubesPCB3 Primary circuit blockage Blockage of GDH upstream ECCS
mixer i e blockage by pass is possible
Loss of Coolant Accidents
The categorization of LOCA events reflect guillotine ruptures characterized byfour different sizes The size categories are then represented by 5 different zonesthat characterize the LOCA event by the location of the rupture
A Large LOCA (d> 300mm)A1 Zone 1 Inside the primary circuit confinement before
(upstream of) the Group Distribution Header checkvalve
A 2 Zone 2 Inside the prirmry circuit confinement after(downstream of) the GDH check valve
A 3 Zone 3 Inside the reactor cavityA4 Zone 4 Outside the prirmry circuit confinement on the
primary circuit side of isol ition check vilve;,

A.5 Zone 5: Outside the primary circuit confinement, on thesecondary side or interfacing system side of isolationcheck valves.
SI: Medium LOCA (100<d<300mm)Sl.l, S1.2, S1.3, S1.4 and S1.5 defined with the same zones as above.
S2: Small LOCA (50<d< 100mm)S2.1, S2.2, S2.3, S2.4 and S2.5 defined with the same zones as above.
S3: Very small LOCA (d<50mm)S3.1, S3.2, S3.3, S3.4 and S3.5 defined with the same zones as above.
Common cause initiators:
Common cause initiators are not included at this stage, a CCI screening analysiswill be performed when a plant model exists.
83
Accident Sequence Modelling
As first step is it necessary to identify all safety functions needed for preventingcore damage. The safety functions of the Ignalina NPP has been identified.Normally, in Swedish PSAs, the plant model is concentrated on the mainfunctions, i e front line systems functions and include these as main headings inthe event trees. All support functions, including alarm signal generation andpower supply are normally modeled with fault trees which are transferred tofrom the front line system (the safety systems) fault trees. Presented in Table 1are the proposal for safety functions and system relationship to be used for theIgnalina NPP PSA model. The relationship applies between the main safetyfunctions identified above and the systems available for performing thesefunctions:
The required safety function has been illustrated by functional block diagrams forsuccessful accident protection. For each IE the safety functions that need to beperformed in order to prevent core damage are identified. A preliminary set ofplant function block diagrams for successful event response has been generatedin the first phase. This work will be an object for plant operator review of theplant behaviour as modelled.
Qualitative accident sequence analysis, event trees, has been performed. Thiswork presents event descriptions for the functional events contained in theaccident sequence analysis and their success criteria.
A Level 1 PSA usually implies the assessment of plant failures leading to severecore damage and of corresponding frequencies. Additional events, however, thatmay be appropriately included in a Level 1 PSA are those that involve partialcore damage or potential, conservatively assumed, core damage. There areseveral possible "degrees" of core damage. It should he emphasized that the finalresult greatly depends on the definition of what constitutes a core damage.
Table 1
Safety function
Reactivity control
Confinement and core cavityintegrity
Primary circuit pressure control
Core cooling - core injection, drumseparator makeup and heat removal
Residual Heat Removal
Front
1)
2)
1)-
2)
1)
2)
3)
I)
2)3)
4)
1)
line system
Reactor Control andProtection SystemControl Rods
Pressure SuppressionSystemCore Cavity PressureRelief System
Condenser and the BRU-K Valves (turbinebypass)BRU-B valves(condensation pool reliefvalves)Main Steam ReliefValves
Pressurized Tanks(ECCS)ECCS PumpsAuxiliary FeedwaterSystemMain Feedwater System
Slowdown and CoolingSystem
The following definitions of hazards states are proposed for this phase. Theanalysis carried out at this point include detailed investigations, including severeaccident process analyses, of define the RBMK core hazard states to use in theanalysis. Four core damage categories has been defined with their correspondingprobabilistic safety indices (PSls):
1) Safe heat removal conditions (category S) when the safe operating levels arenot violated.
2) Violation of the reactor heat removal conditions (category V). The conditionsmean an achievement of such a temperature of fuel elements and theircladding (of one Technical Channel or equivalent number in the core) atwhich the cladding failure and fission product release into the coolant arepossible. One pressure tube rupture or blockage is also included into thiscategory. At the same time there is no transition to catastrophic accidentalprocesses, the geometry of the reactor components and the core is preserved.This category can be treated as a "mild consequence".

3) Reactor core damage (category D, or "medium" consequence) Theseconditions are characterized by the severe accidental processes caused bytheir significant deviation from the design scenario The final reactor statescan lead to partial fuel melting, fuel/cladding damage m 1 2 GDHtechnological channels, several pressure tube rupture at low pressure
4) Reactor core severe accident (category A) accompanied by multiple pressuretube rupture (MPTR) at high pressure or core fuel melting This category ischaracterized by multiple PT rupture leading to raising of reactor upperplate at high pressure or melting of a part or all the core (the most heavyconsequence)
For the hazard states of type V and D radiation consequences must be estimatedwith account of accident localization system (ALS) operation For the categoryA ALS will turn out be ineffective
Correspondence between RBMK core hazard categories and InternationalNuclear Event Scale (INES) Levels can be presented approximately as followscategory V can be referred to Levels 3-4, category D corresponds to Levels 5-6and category A - to Levels 6 7
The core hazard states due to the development of accident event sequencesresulting in conditions of V, D and A type, were determined by process analysis(within the framework of design safety analysis and special PSA 1 RBMKinvestigations) including the extrapolation of obtained relationships as well as byexpert estimation method with a required margin
Proposed criteria to assign consequence hazard categories on the base of processanalysis results are presented in Table 2
Systems Modelling
System analysis will be performed using fault tree technique A project reportspecify the specific procedures and requirement to fulfil this task Ademonstration of the system analysis for the Auxiliary Feedwater System,Emergency Core Cooling System, Main Relief Valve System and EmergencyPower Supply System has been carried out in the first phase This work will bea major task to continue in the second phase Currently a number of systemanalyzes are in progress and there are still more systems to initiate
Human Performance Analysis
This task will be limited to screening analysis The PSA model will concentrateon identifying the critical element of hurmn interaction Five categories/types ofHuman Interaction will be addressed and modelled separately in the plantmodels The complexity and difficulties of addressing the Tvpe 4 ictions may leadto that these will not be addressed properlv
Table 2 Critenas to assign core hazard slates
ChannelPower
MWt
29 20
<20
First criteria
t(PTwall) >600°C
Low Pr
S
V
High Pr
V
A
Second criteria
t(claddmg)
^1200°C
S
S
>1200°C
V
D
>1500°C
D
A
Notes1 S safe state
2.
3
V core cooling violationD core damageA severe accidentt temperaturePr pressureWhen two criteria are applicable, the more severemust be assignedChannel power range shows a number of technologicalchannels that are undergoing identical conditions
Type 1 Operator inadvertently disable equipment maintenance, testingor calibration errors
Type 2 By committing error plant personnel initiate an accidentType 3 Operator fads to terminate the accident by following procedures
and operating stand by equipmentType 4 Operator aggravates the situation by making errors when
attempting to following procedures and operating stand-byequipment
Type 5 Plant personnel fads to improvise or restore and operate initiallyunavadable equipment to terminate the accident
In the quantitative screening evaluation will conservative values (0,1 0,01) beassigned For dominating human interactions identified in the screening, canadditional analysis be performed in a third phase to create a balance in theaccident sequence results
Qualitative Dependence Analysis
The qualitative dependence analysis shall identify dependencies for the maintypes of dependencies Functional Physical and Hum in interaction dependencies

1 Functional dependencies due to shared equipment or process couplings.
2 Physical dependencies.a) Caused by the initiating event, CCI.b) Caused by environmental stresses.
3 Human Interaction dependencies.a) Cognitive behavioral induced.b) Procedural behavioral induced, multiple maintenance errors.
Preparation for plant visit done, qualitative dependency forms have been filledout, additional questions necessary.
Initiating Events Frequency Assessment and Component Reliability Assessment
The IE frequency assessment will follow that of the Swedish I-book, including aplausible learning model. Available data sources are currently reviewed. If plantspecific component reliability data, or RBMK specific, can be obtained the dataassessment will be based on this data. The assessment procedure will follow thatof the Swedish T-book.
SUMMARY
A number of systems are by today modeled but still remain several centralsystems to model. A larger portion of the system analysis task than initiallyplanned has been performed in Moscow and Ignalina/Kaunas. The qualitativepart of the initiating event analysis and the qualitative part of the accidentsequence analysis has been performed and are presented in draft project reports.This work will be an object for plant operator review and is a central part of theAugust project meeting agenda.
Even if no quantitative results exist a this point the work is proceeding asplanned. The possibilities seems good that during this year or early next year theobjective to make initial plant applications using a basic PSA model will befulfilled.
85
SAIS APPLICATION TO WWER REACTORS
J. RUMPFTÜV Norddeutschland e.V.,Hamburg, Germany
Abstract
The paper presents recent developments in the area of computer information system SAIS to be used inpreparing PSA as well as to provide aid in safety related operational decision making. The basic aims,methodology and applications of the system are briefly described. Specific practical applications toWWER reactors including Greifswald , Kola, Stendal and Zaporozje NPPs are mentioned. Capabilities ofthe SAIS to be available by the end of 1993, at its final state, are also described.
1. IntroductionThe Safety Analysis and Information System - SAIS - has beendeveloped since 1989. The following overall objectives ofSAIS were defined:
to provide an adequate tool that can be used to preparePSA, ecspecially "living PSA"
- to aid operators with safety information that can be usedto make their operational decision more reliable.Based on these objectives several reference applications ofSAIS are under work. The aimes of these analyses are:- to develop SAIS methodology as well as to demonstrate its
applicability to different types of NPPto prepare safety information needed for PSA
- to give insights in the safety status of NPPs.Special WER applications were started to Greifswald(WER-440/V213), Kola (WER-440/V213), Stendal (WER-1000)and Saporoshje NPP (WER-1000).This paper presents
shortly the main features of SAIS anda description of the subjects of SAIS application toWER reactors.
As general results of applying SAIS to WER-440/V213 re-actors it was found that
SAIS methodology is able to map WER structure and safetyinformation very well and

jjjj - because of its special features SAIS is able to provideaid not only on what information is needed to perform PSAbut also on what information is necessary to operate theplant and how this information can be appropriatelystructured and displayed.
2. SAIS methodologySAIS, applied to a NPP, comprises
a data base that combines all features of a NPP that areimportant to safety as well asa plant-specific probabilistic safety assessment based onthe current plant status (living PSA).
The data base includesa definition of safety important features,the possibility to appropriately select safety relevantinformation,
- a computer-aided structuring, processing and displayingof this information.
The living PSA tool allows the user to conveniently performperiodic safety evaluation as it is required for everyGerman NPP about every ten years.In addition processing of information within SAIS makes thePSA and its results more transparent compared to known PSAdocumentation.SAIS is based on a data form approach. It is structured infive information levels:
event tree data level,event tree functions data level,system data level,component data level,event data/probabilistic data level.
(As an example three typical data forms are attached to thispaper.)For a more detailed description of SAIS methodology see e.g.
3 . WER applicationSAIS WER application started in 1991.A first analysis of Greifswald unit 5 NPP (GermanyWER-440/V213, shut down state) demonstrated the applicabili-ty of SAIS to WER reactors.
Other applications were started for Stendal NPP (Germany,WER-1000, taken out of construction) and Saporoshje NPP(Russia, WER-1000, in operation).As a main part of the project SAIS is being applied to KolaNPP (Russia, WER-440/V213, in operation).A working group of specialists from Kola NPP and TÜV Nord-deutschland was founded to perform the analysis. It wasagreed upon that the main part of the analysis has to bedone by the plant personel.The following objectives were defined for SAIS WER appli-cation:
development and testing of SAIS with respect to specificWER featuresutilization of SAIS to improve the operational proceduresand safety documentation of WER reactorstrainig of the operators to improve their comprehensionon what is important to safety, to enable them to selectthe appropriate safety information and to adequately useSAIS soft- and hardwarepreparation of generic information that can be used byother WER plant personel.
The SAIS WER project is based on experiences gained fromWER construction and operation in both Russia and Germany.The following institutions take part in SAIS cooperation:international: Kola NPP (Russia)
0KB Hydropress, Podolsk (Russia)Scientific nad Engineering Centre of the regu-latory body, Moscow (Russia)
national: TÜV Norddeutschland, HamburgGesellschaft für Anlagen- und Reaktorsicher-heit (GRS), Berlin/Cologne/MunichIngenieurgesellschaft für technische Sicher-heit (IGTS), BerlinRISA GmbH, Berlin.
The subjects covered by the Kola project can be seen fromthe table.As a first reference example a SBLOCA was chosen.In addition the following initiating events are being analy-sed for Kola NPP:
steam generator tube rupture (more than one tube)orsteam generator collector breakloss of off-site power

leakage of connection lines to the primary circuit fromoutside the confinment.
SAIS will be applied at a full-scope level for these initia-ting events (PSA level 1) includung all information levelsof the system
Table: SAIS Kola project
Application ofSAIS to Kola NPP(WER-440/V213)
Reference: SBLOCA
other initiatingevents
data base ofplant-specificdata
software and hard-ware training ofRussian specia-listsestablishment ofnecessary hard-ware conditionsin Kola NPP
Genric resultsapplicable to otherWER NPP
establishment of ageneral data base
reference list ofinitiating events
generally applicableresults
Compariosn ofsafety documen-tation
exchange of safetydocumentation ofKola and BrokdorfNPPcomparison ofscope, contentsand depth of bothsafety documen-tationssafety documen-tation require-ments from SAIS
In additon to these analyses a comparison of operationalprocedures and safety documentation of Kola and Brokdorf NPPis being performed. The concept for this task is given bySAIS methodology.
4. Final remarksThe SAIS WER project will be finished by the end of 1993.At the final state SAIS application to WER reactors willprovide- a computer tool that is able to perform PSA level 1 for
WER reactors based on an updated plant status as well asto aid operators in their operational decisionsinformation on the safety status of Kola and SaporoshjeNPPinformation on operational procedures and safety documen-tation of Kola NPP with respect to safetygeneric safety information on WER reactors that can beused by other utilities (e.g. probabilistic data, refe-rence list of initiating events, success criteria ofsafety systems).
REFERENCE/!/ Experiences from the Development and Application of theComputer Code System "Safety Analysis and Information Sy-stem" (SAIS)Balfanz, H.-P. and Musekamp, W. ; 3rd TÜV-Workshop on LivingPSA Application, Hamburg 11-12 May 1992
87
A generic reliability data base for WER-440/V213 is plannedto be established based on the following data sources:- plant-specific data of Kola NPP- data of Greifswald NPP
other sources, e.g.other Russian NPP andinternational WER data bases.

S A I S System Specification SSSystem code: System name:
01 Hicrh pressure infection02 Hiqh pressure in1. switch off03 Accumulator inlection04 Accumulator switch off05 Low pressure in lection06 Low pressure recirculati'on07 Pressure decrease, sorav svstem08 Pressure decrease, condenser09 Pressure barrier acrainst P. c.10 Confinement
E.T.heading
relatedmin. red.
Important system parametersnormal min max
levelHP-tankAccumulatorLP-tank
flow ratesHP-pumpLP-pumpSpray pumpSystem interfaces
AOT referen-ces
Refe-rences
mmmmm'/hra'/hm'/h
System functions
Tüy-N.Revision:
worked out:modified:
verified:verified:
S A I S Component Specification Valves, general KS SA
Name:Group code: Fault tree name:System code:YC
System functions01 HP-in lection(2 Switch off HP-in-iection13 Accumulator inlection)4 Accumulator switch off)5 LP-in1ection)6 LP-recirculation)7 Pressure decrease, sprav svstem)8 Pressure decrease, condenser)9 Pressure barrier aaainst p.c.10 Confinsment isolation
System relateddesign dataandfeatures
Componentrelateddesign data andfeatures
Operationalmode
ope-ningAl
keepopenA9
clo-singA2
keepclosdAO
cageinte-grityM3
AS : Pressure /bar/:Nom.diam. : Temperature I'd:
Accident proved:Valve housing protection: _ yes _ noValve locking:Position:Room :
Valve type: ND:Name:Manufacturer: Material:Pressure/bar: Temp./°C/:
Actuator type:Name:Manufacturer: Travel time /s/:Control mode / torque/Mm/Open: _torque _limit switchClosed: _torque _limit switch
Basic position:Operating cycles:
con-trolA3
TÜV-N.revision: worked out:
modified:verified:verified:

S A I S FMEA Description I KM 1/2
! 1 1 1Kämet FT denotation iComponent group code:
Systemfunc-tioncode
Failu-recode
Failu-reeffect
Ascription of the failure effect with respect tothe system function
89 TÜV-N.Revision:made by:
modified by:verified by:verified by:
WESTINGHOUSE PSA ACTIVITIESFOR KOZLODUY (UNITS 1-4)
P.P. WOLVAARDTWestinghouse Electric Nuclear Energy Systems,Brussels, Belgium
Abstract
Brief overview of current PSA activities carried out by Westinghouse for Kozloduy (units 1-4) withinthe framework of "WANO Six-Month Programme for Kozloduy". The main project tasks are describedand the methodology followed in the study is presented. The project covers several areas. It includesreview of the Greifswald PSA with respect to applicability of the models and the results of this study toKozloduy NPP. Some work is also discussed concerning reliability analysis for some safety systems thatmay contribute to overall plant safety. Another important task addresses probabilistic evaluation ofpressurized thermal shock. Recent developments on WWER-related model for the MAAP code severeaccident analysis programme are also mentioned.
Introduction
Westinghouse PSA activities for Kozloduy are performed as part of the first WANOSix Months Programme for Kozloduy. As the work is still in progress, the purposeof this paper is to give an overview of the activities and the methodology followed,without any presentation of results. Westinghouse is acting as overall project leader,while use is made of Eastern European subcontractors. The project consists of fourmain parts :
review of the Greifswald PSA,
reliability study of critical safety systems for Kozloduy,
initial steps toward a probabilistic Pressurized Thermal Shock evaluation, and
the preparation of an input parameter file representing Kozloduy for MAAPsevere accident analysis program.
Each of these items are discussed in more detail below.
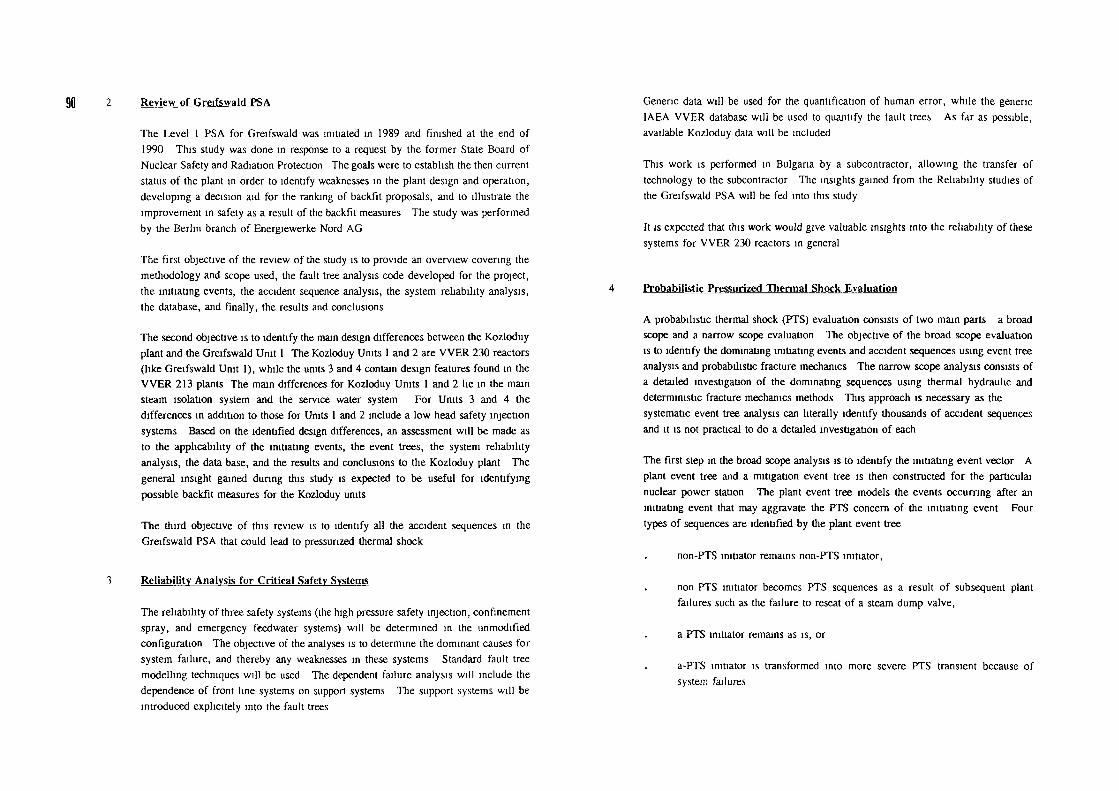
90 Review of Greifswald PSA
The Level 1 PSA for Greifswald was initiated in 1989 and finished at the end of1990 This study was done in response to a request by the former State Board ofNuclear Safety and Radiation Protection The goals were to establish the then currentstatus of the plant in order to identify weaknesses in the plant design and operation,developing a decision aid for the ranking of backfit proposals, and to illustrate theimprovement in safety as a result of the backfit measures The study was performedby the Berlin branch of Energiewerke Nord AG
The first objective of the review of the study is to provide an overview covering themethodology and scope used, the fault tree analysis code developed for the project,the initiating events, the accident sequence analysis, the system reliability analysis,the database, and finally, the results and conclusions
The second objective is to identify the main design differences between the Kozloduyplant and the Greifswald Unit 1 The Kozloduy Units 1 and 2 are WER 230 reactors(like Greifswald Unit 1), while the units 3 and 4 contain design features found in theWER 213 plants The main differences for Kozloduy Units 1 and 2 he in the mainsteam isolation system and the service water system For Units 3 and 4 thedifferences in addition to those for Units 1 and 2 include a low head safety injectionsystems Based on the identified design differences, an assessment will be made asto the applicability of the initiating events, the event trees, the system reliabilityanalysis, the data base, and the results and conclusions to the Kozloduy plant Thegeneral insight gained during this study is expected to be useful for identifyingpossible backfit measures for the Kozloduy units
The third objective of this review is to identify all the accident sequences in theGreifswald PSA that could lead to pressurized thermal shock
Reliability Analysis for Critical Safety Systems
The reliability of three safety systems (the high pressure safety injection, confinementspray, and emergency feedwater systems) will be determined in the unmodifiedconfiguration The objective of the analyses is to determine the dominant causes forsystem failure, and thereby any weaknesses in these systems Standard fault treemodelling techniques will be used The dependent failure analysis will include thedependence of front line systems on support systems The support systems will beintroduced exphcitely into the fault trees
Generic data will be used for the quantification of human error, while the genericIAEA WER database will be used to quantify the fault trees As far as possible,available Kozloduy data will be included
This work is performed in Bulgaria by a subcontractor, allowing the transfer oftechnology to the subcontractor The msights gained from the Reliability studies ofthe Greifswald PSA will be fed into this study
It is expected that this work would give valuable insights into the reliability of thesesystems for WER 230 reactors in general
Probabilistic Pressurized Thermal Shock Evaluation
A probabilistic thermal shock (PTS) evaluation consists of two main parts a broadscope and a narrow scope evaluation The objective of the broad scope evaluationis to identify the dominating initiating events and accident sequences using event treeanalysis and probabilistic fracture mechanics The narrow scope analysis consists ofa detailed investigation of the dominating sequences using thermal hydraulic anddeterministic fracture mechanics methods This approach is necessary as thesystematic event tree analysis can literally identify thousands of accident sequencesand it is not practical to do a detailed investigation of each
The first step in the broad scope analysis is to identify the initiating event vector Aplant event tree and a mitigation event tree is then constructed for the particularnuclear power station The plant event tree models the events occurring after aninitiating event that may aggravate the PTS concern of the initiating event Fourtypes of sequences are identified by the plant event tree
non-PTS initiator remains non-PTS initiator,
non PTS initiator becomes PTS sequences as a result of subsequent plantfailures such as the failure to reseat of a steam dump valve,
a PTS initiator remains as is, or
a-PTS initiator is transformed into more severe PTS transient because ofsystem failures

The PTS accident sequences are grouped together in cooldown states. This representsthe first "pinch point" in the analysis.
The next step in the broad scope analysis is to construct the mitigation event tree forthe plant. The mitigation event tree represents those operator actions and automaticplant responses that can mitigate the consequences of the cooldown sequencesidentified in the plant event tree (this could be for example the isolation of a steamgenerator experiencing blowdown). The sequences resulting from the mitigationevent tree are grouped together in end states.
The overall process is illustrated in figure 1. The event tree approach is the onlysystematic approach for identifying all the possible cooldown transients.
The next step in the broadscope analysis is to determine the frequency of each endstate, and to characterize each end state using a characteristic final temperature, finalpressure, and cooldown rate. Probabilistic fracture mechanics is used to determinethe conditional probability for vessel failure given each end state. This allows theidentification of the dominating end states for the narrow scope analysis.
The project for Kozloduy involves determining the initiating event vector and andconstruction of the plant and mitigation event trees in unquantified form. Theaccident sequences and end states will be identified by qualifying the plant/mitigationevent trees for each initiating event.
As no quantification is done, the qualitative results will be valid for WER 230reactors in general.
5. MAAP Parameter File Preparation
Westinghouse has developed a model of VVER type reactors for the MAAP severeaccident analysis program. The objective of this task is to develop a Kozloduyspecific input parameter file. Two test runs (such as a cooldown transient, or a sta-tion blackout accident) will be modeled for Kozloduy. A more detailed descriptionof this task can be found in reference [1], a paper presented in the second technicalsession of this conference.
Reference
Plys, M. G., "WER Severe Accident Modeling with MAAP 4", IAEA TechnicalCommitte Meeting on Advances in Reliability Analysis and Probabilistic SafetyAssessment, Budapest, 1992.
PinchPoints:
SegmentModels
IE,InitiatingEvent
CooldownState End State
[-»-Plant Model-»-]Plant _j— =Event [-<Tree ^
«••• ••»B
•••«•
[^ Mitigation »I1 Model ^
Mitigation [ [_^ZEvent Tree! f —
91 FIGURE 1. : OVERVIEW OF THE ASSEMBLY PROCESS

92 OVERVIEW OF THE PROGRAMME PLAN FORKOZLODUY-3 NPP PROBABILISTIC SAFETY STUDY
IG KOLEVRisk Engineering Limited,Sofia, Bulgaria
Abstract
This paper describes the background, objectives and scope, organisation andtime-table of the Kozloduy-3 NPP Probabilistic Safety Study, financed by theKozloduy NPP Branch of the Bulgarian National Electric Company, and beingcurrently performed by Risk Engineering LtdThe study is essentially a tevel-1 PSA with fire hazard and seismic hazard analy-ses included, as well as extensive thermal hydraulic analysts of plant behaviourunder accident conditions for determination of realistic success criteria The orga-nisational scheme includes a site team for gathering of the necessary informationin a PSA format and investigation of plant experience and operational practicesA brief outlines of the proposed methodological basis as well as quality assuranceaspects are also included The paper ends with the current status of the study
Kozloduy 3 units' mam features include• WER 1000 reactors, designed by Russian OKB "GIDROPRESS" in early 70-s (reactor pressure
vessels produced by SKODA plants in Chehoslovakia) without burnable poisons in the core,• standardised plant layout, common for most VVER-1000 plants, designed by Russian
ATOMENERGOPROEKT.
• four reactor cooling loops (without isolation valves) with horizontal SGs,
• one TG of 1000 MWe,• 3 independent trains of all active safety feature systems (HPIS and LPIS trains does not have
100% capacity for all LOCA sizes), hydroaccumulators available for core flooding in case ofLOCA,
• large dry containment made of pre-stressed concrete with internal steel layer,• design-basis accidents cover all LOCA sizes and a limited spectrum of transients but feed-and
bleed procedures are not explicitly included for accidents with loss of secondary side cooling, nomeans are explicitly provided for management of severe accidents, FSAR is far from being fulland complete according to Western standards,
• nuclear island structures and systems are seismically designed, not all of the balance of the plantis seismically qualified
The operational experience of unit 5 shows quite unreliable operation with low annual load factorsand a big number of small incidents Most of the latter may be associated with the initial period ofoperation but may also be treated as pointers to design deficienciesThe operational documentation management is somewhat better than on older units and someassessment of operational experience is possible for updating of generic data However, the plantdesign documentation is in formats that require substantial efforts for compilation of the informationnecessary for PSA system notebooks
1. Project Background
1.1. Kozloduy-3 NPP
Kozloduy-3 NPP is the newest double-unit plant (units 5 and 6) with VVER-1000 reactors at Kozloduysite, that also accommodates four other units (units 1-4) of older WER-440 type (see Fig 1) Thereare no major differences between the two units of Kozloduy-3, accept on component level (some ofthe equipment is from different suppliers, but of the same design) Unlike the older part of the plant,Kozloduy-3 units are practically stand-atone units with only chemical and some other services beingcommon to both units However, all units at the site share common switchyard attached to threedifferent grids (400, 220 and 110 kV) and common heat sink in the form of inlet and outlet waterchannels from/to Danube river This do not apply to Kozloduy-3 Essential Service Water Systems,that are provided with spray poolsThe plant has been supplied by Russian ATOMENERGOEXPORT and built in 1981-1990 by severalBulgarian organisations under the supervision of ATOMENERGO1NVEST - branch of the NationalElectric Company of Bulgaria (NEC) The plant is operated by EP-2 Directorate of the Kozloduy NPPBranch of NEC Unit 5 is officially m operation since the spring of 1989 (with the average annual loadfactor of about 0 35) and unit 6 is undergoing the final tests before full-power operation (unit 6 isactually in operation on 50, than 75% power levels since 1990) The total number of reactor-years ofpower operation is 5, including initial lower level operation
Swichyard 400,220,110 kV
Fig. 1 Layout of the Kozloduy site.

1.2. Project Initialisation
Most of the PSA activities in Bulgaria m past years has been devoted to older units forunderstandable reasons Recently, the PSA activities for older units are on-going under WANO Six-Months Programme for Kozloduy, sponsored by PHARE Programme of the CEC At the same time,the unreliable operation of unit 5, as well as obvious deficiencies of Kozloduy-3 FSAR leaded toregulatory requirements for upgrading of the existing FSAR, including probabilistic analysesAn important argument for the initialisation of a full-scope level 1 study for Kozloduy-3 has been thefact, that similar plant, that was built in Belene, was cancelled due to public criticism and after anextensive evaluation of the project, done by Bulgarian Academy of Sciences Naturally, the concernsabout Belene project were transferred to Kozloduy-3 units There was an obvious necessity forevaluation of plant safety
1.3. Project Financing
Kozloduy-3 PSA has been ordered by the utility, namely the Kozloduy NPP Branch of the NationalElectric Company of Bulgaria The general specifications and scope, as well as the general time-frame of the study has been initially cleared with the regulatory body - the Committee for Use ofAtomic Energy for Peaceful Purposes, as well as with NEC top managementBids for the study were presented by ENERGOPROECT State-Owned Company., a consortium ofRussian organizations, and the newly established private Bulgarian company RISK ENGINEERINGLTD (REL) Bids were discussed in detail by a the Technical and Economic Expert Council of theUtility, and the contract was placed with REL for professional rather than financial reasons Thecontract placement procedure has been thoroughly checked by a special commission from NECheadquartersThe contract provides for a teveM PSA as described below, and a special annex is devoted toeventual continuation of the study to cover other important issues, as well as to extend it to level-2and tevel-3 PSA
2. Objectives and Scope of the Study
• the study has to identify any serious plant deficiencies that would eventually requiremodernizations during next years
• the study has to provide an assessment of the available operational data regarding system andcomponent operation as well as data on incidents
The study objectives have to be achieved m a situation when little is known about the plant behaviourunder accident conditions and in multiple failures situations There is no thermohydraulic evidencefor realistic accident sequence modelling, nor exact emergency procedures In this situation, most ofthe necessary thermohydraulic analyses will have tor be done within the study, and expert panels areto assess the operator behaviour for realistic resultsThe study objectives, as defined, cover a broad area, that includes both exact technical analysesand top-level assessments to be communicated to the public, the analyses are to be conservativeenough to be acceptable for the no-nuclear-option organizations, and in the same time to providerealistic assessment of system reliability and plant safety, that is later to be used for evaluations ofeventual plant modifications
2.2. Scope
The initial scope of Kozloduy-3 PSA has been determined by the regulatory requirements for theupgrading ot plant FSAR In addition, specific PSA issues has been included, as well as therequirements of the Utility The present scope includes the level-1 PSA tasks, as follows• analysis, categorization, grouping and quantification of initiating events,• analysis of accident sequences from internal initiators,• fire hazard analysis and modelling of fire-induced sequences,• seismic hazard analysis and modelling of seismic-induced sequences,• thermohydraulic analysis to support accident sequence modelling,• processing of the available operational experience data,• quantification of CDF and corresponding fractions associated with lEs, systems etc,• evaluation of eventual changes in the technical specifications made during the study period
93
2.1. Objectives
General objectives of the Kozloduy-3 Probabilistic Safety Study reflect the reasons for studyinitialisation as described earlier, and may be formulated m the following way• the study have to provide input for the upgrading of plant FSAR, according to regulatory
requirements,• a safety assessment of the plant, that is to be used for evaluation of risks and decision making for
the operation of this plant and eventually for continuation of Belene project, public concerns haveto be answered with an acceptable assessment of the risk,
• the complete study is to serve as a basis for evaluation of different operational issues• the study is to be used as a base for system reliability improvement as well as for reduction of
initiators frequencies,
This scope of the study may be extended during the Study period, depending on additionalregulatory requirements and agreements with the utility, as described in Section 2 4
2.3. Limitations
The limitations of Kozloduy-3 PSA correspond to the study objectives, to the international practices inperforming of level 1 NPP PSA, as well as to the limited time available to perform the study, limitedresources, provided by the utility and the limited man-power available in Bulgaria in the PSA fieldGeneral limitations are as follows• the only source of radioactivity considered as potential danger is the reactor core, consecutively,
only core damage frequencies (CDFs) will be evaluated as measure of risk,• only the normal power level operation considered for initiators application (this includes a
spectrum of power levels with normal-operation configuration of plant systems)

(M • thermohydraulic analyses are to be performed with relatively simple process analysis codes orwith simple models to allow for broader coverage of different accident sequences, includingthose with multiple failures or with different operator action options following the initiator
• a stand alone unit is to be considered (unit 5 chosen as reference), a simplified screeninganalysis of interdependences between the two units is to be made and only those dependenciesfound to be important, are to be included explicitfy in the models,
• generally, the possible interdependences with other plants at the site are not to be consideredunless sufficient evidence provided for their importance,
• only fires are to be considered as internal common-cause initiators (CCIs) this do not apply toCCIs in connection with malfunctions of power supply systems,
• only earthquakes are to be considered as external eventsSome of the limitations listed will be eventually re-considered during the sudy period as mentionedbelow
2.4. Project Perspectives
During the study period, especially after the completion of task 1, devoted to preliminary analyses,some modificatons are possible in the study Programme-Plan to broaden the spectrum ofinvestigations done within the study They will depend on the posision of the regulatory body, whichis to review the task reports, as well as on the position of international institutions that will beeventually controlling the quality of analyses The modifications may also depend on the resourcesavailable to the utility As mentioned in previous sections, such modifications may include• coverage of all relevant internal CCIs, such as internal floods, missiles etc.• full analysis of all applicable external hazards, imposed by the near-by industrial activity, severe
weather conditions, loss of the ultimate heat sink etc (a non-probabilistic investigation of suchhazards has been done last year)
In addition to this modifications, a continuation of the study is possible, according to a special annexto the contract, that describes the tasks for a full-scope PSA (up to level 3) and tasks for a fullutilization of PSA results In addition to the tasks, that are part of the present study, the followingtasks are also included in that annex• level-2 accident progression analysis,• level-3 analysis of societal risks (depending on the availability of PSA studies for older units, this
may be done for the site, rather then for Kozloduy-3 plant),• development of risk-monitoring systems for utility and for the regulatory body,• compilation of plant-specific data base and re-quantification of the models
According to the recent international interest to the issues of PSA analysis for cold-shutdown andtransition power level situations, this issues will be proposed to the utility for inclusion in the presentlevel-1 study
3. Methodology Overview
3.1. General Outlines
The Kozloduy-3 PSA is to be the first WER 1000 PSA study that intends to follow the existingWestern-type PSA methodology The general methodological framework of the study will follow asmuch as possible the recommendations of the well known NRC publications
•Interim Reliability Evaluation Program Procedures Guide', NUREG/CR 2728,1983•Probabilistic Risk Assessment (PRA) Reference Document", NUREG 1050, 1984
•PRA Procedures Guide', NUREG/CR 2300, 1983
with the special attention payd to the more recent"Severe Accident Risks An Assessment for Five U S Nuclear Power Plants",NUREG-1150,1990,
and to the recommendations of IAEA in"Procedures for conducting of Probabilistic Safety Assessments of Nuclear PowerPlants", IAEA Safety Practice Series
Compliance with the general recommendations for conducting a level-1 PSA contained in the abovedocuments has been requested by both utility and the regulator in connection with this studyThe actual methodological bass for each task is to be developed as part of the study, in accordancewith the state-of-the-art in PSA and with study resource and time-frame limitations However, themethodological basis considered initially for different aspects of the study, is briefly described in thefollowing section
3.2. Specific Topics
3.2.1. Analysis of Initiating EventsThe lEs analysis started with compilation of generic list of initiators, which has been screened as totheir applicability to Kozloduy-3, as well as updated to include specific initiators, found to beimportant or on request from the regulator The updated list is to be quantified with generic data, andthen updated according to the experience in Kozloduy and in other similar plants in Russia andUkraineThe LOCA initiators have to be initially divided into categories depending on the success criteria andspecific WER 1000 features, including operating instructions and practices The categorisation ofLOCAs has also to reflect the possibilities for quantification of the defined categoriesThe final list of transients after quantification has to underpass a logical procedure for grouping of lEsinto categories for further modelling The logical procedure has to reflect the plant success criteriaand the safety functions challenged by the IE

3.2.2. Analysis of Accident SequencesThe Accident Sequence Analysis has to be performed by the Event Tree (ET) - Fault Tree (FT)methodology with time-independent yearly-averaged quantification, using small ET - big FT approachwhenever possible The ETs are not to be too conservative by inclusion of realistic assumptionsbased on expert panel (udgements, about operator behaviour The operator interactions includingrecovery actions, will be included in the ETs headings and modelled, depending on their definitionsindependently, or in combination with the associated hardware faultsThe ET headings have to reflect the actual safety functions and system success criteria, rather thengeneralised system functions This generally leads to several FTs for different functions of the samehardware, and require combining and Boolean reduction of accident sequences to be performedprior to their quantificationThe general approach to hardware FTs will be to start with the functional output of the system andmove in the direction contrary to the fluid flow for fluid systems or in the direction of power source forelectrical chains, and systematically investigating the possible sources of failures in thecorresponding system segmentsThe safety function unavailability models are to include a full-scope investigation of all supportsystems, including automatics logic and control and instrumentation circuits The FT models willexplicitly include different component unavailability contributors as basic events, including thosecaused by pre-accident human errors or failures to buck-up the automatics signalsThe described extensive modelling approach require the corresponding level of detail in theinformation on systems and their operation and maintenance A PSA-oriented format for systemnotebooks has been developed and has to be filled with information that is normally located indifferent departments of Kozloduy-3 plantThe quantification of basic events has to be done with generic data, because of small operatingexperience in Kozloduy-3, and unavailability of any firm data from similar plants in Russia andUkraine However, all available data will be used for Bayesian adaptation of generic data, wheneverpossible
325 Fire Hazard AnalysisDue to the time and resources constrains, initially only screening Fire Hazard Analysis will be doneThe fire locations or fire development nodes found to be important for safety in regard to their impactor their probability of occurrence, will be further analysed and quantified to provide input formodification of accident sequences modelled for independent initiators The fire related accidentsequences will be modelled as combination of internal ETs and both ETs and FTs are to be modifiedto reflect the fire-related system and component unavailability
3.2.6. Seismic Hazard AnalysisThe Seismic Hazard Analysis is to be performed in parallel with the analysis of accident sequencesfrom internal initiators It will start with the development of the methodological basis, based on thesimplified Seismic PRA procedures (NUREG/CR-4331) The earthquake-related analysis is then to bedone and the results used for modification and combination of ETs developed for internal initiatorsThe simplified procedures are to be used because of the time constrains for study completionimposed by the regulatory requirements, that in the same time require a seismic hazard to bequantified due to the public discussion over the level of seismic vulnerability of Kozloduy 3 plant
3.2.7. Results IntegrationThe results of accident sequence modelling and quantification from all lEs have to be processed fordeterminations of CDF fractions attributed to different lEs, systems, failure modes etc The resultshave to be presented according to recommendations of NUREG-1150, as well as in a form, thatwould be more suitable for the general public The importance of lEs, systems, components etc hasto be evaluated, as well as uncertainties In addition, the core damage states have to be defined andcategorised to prepare input for the eventual continuation of the study to level-2 PSA
95
3.2.3. Analysis of CCFsThe analysis of Common Cause Failures (CCFs) will be performed for all similar components locatedin one or in different trains The CCF are to be quantified with generic data, and the data availabilitywill be the factor to choose between a beta-factor or MGL methods However, the same approachwill be used throughout the study The investigation of available documentation on CCF modellingwill be done to provide the methodological basis
3.2.4 Human Reliability AnalysisThe human interactions, defined on ET or on FT level, as described earlier, will be analysed by thewell known Swam-Guttman methodology in one of its simplified versions in order to fit in the time andresource limitations A more extensive investigation including Human Error Trees will be done on finalstages of the study of those human interactions, found to contribute significantly to CDFGenerally, the Operator Action Trees are to be modelled for post accident operator actions, leadingto sequence change and included in ETs The post accident actions in connection with back up ofthe automatics will be included in the FTs and investigated in combination with hardware faults as tothe availability of sufficient indications for any back up actions A screening investigation is to bedone for pre-accident errors leading to component or system unavailability and only those actions willbe quantified that would be found to affect the whole system operation or that are not subject ofmultiple verification by independent personnel
3.3. Computer Codes
The available software prior to the study implementation included number of computer codes for FTprocessing and two public domain integrated ET/FT packages, namely PSAPACK v 4 2, developedby a team of experts for the IAEA and IRRAS v 2 5, developed by EG&G Idaho, Inc for USNRC(NUREG/CR-2300) The use of the latter one for this study have still to be cleared with NRC The useof PSAPACK is desirable, because of some of its unique features as well as the unique way of itsdevelopment through the international co-operation PSAPACK features include integratedFT/ET/Data-Base environment, SETS code as FT analyser. Boolean reduction of accidentsequences' cut sets, numerous importance measures calculation and many other useful featuresSome problems has been encountered with the use of the package, but REL intentions are to solvethe existing problems, as well as to produce a Cyrillic-letters adapted version before the use of thePSAPACK in the context of this study, which is foreseen for the next year This task can beaccomplished because REL have the support of PSAPACK authorsThe extensive thermohydraulic analyses that nave to be done, as well as the short time period, doesnot allow the full-scope use of RELAP5/Mod2 code, that is available This code will mainly be used forcalculations with simplified models, as well as for verification of results in some cases The otheravailable software includes MARCH-3 code, specially modified with the IAEA assistance to describethe WER peculiarities Problems with this code are in the time-consuming user interface the overconservative results and that this code has been basically developed for level 2 calculationsAnyway the MAAP code that is currently widely used for this type of PSA specific analyses up tonow can not be provided for the study due to financial reasons
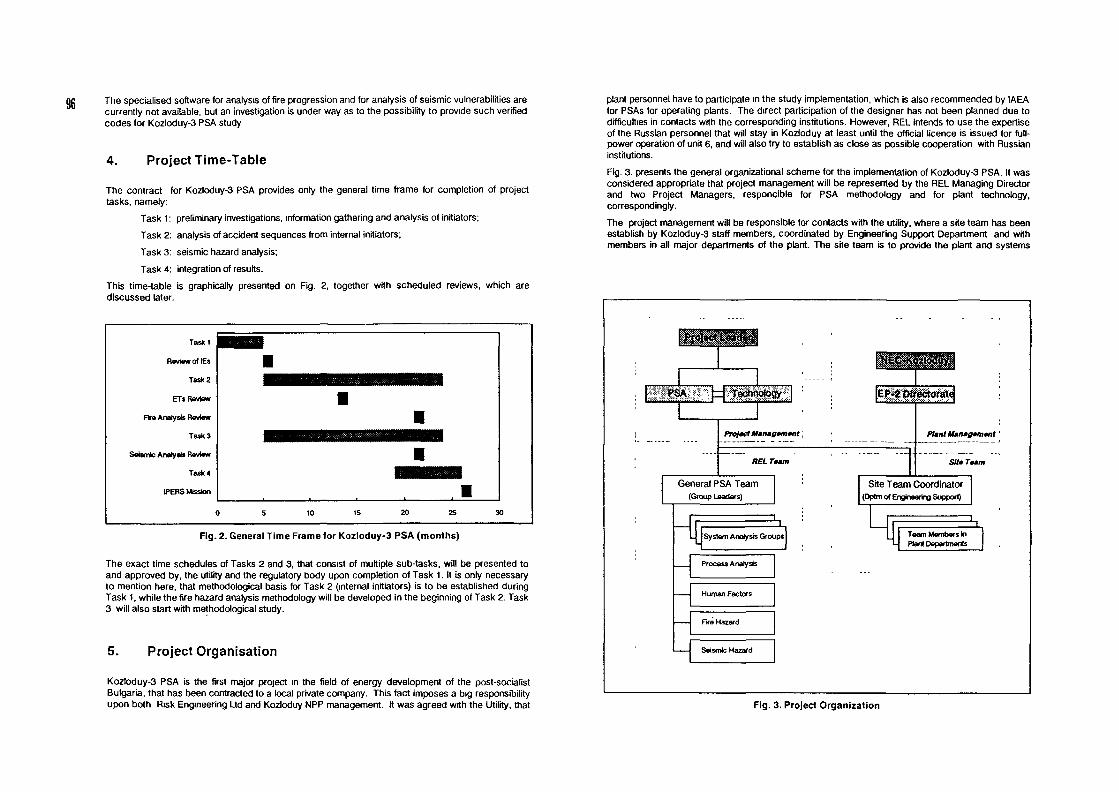
gc The specialised software for analysis of fire progression and for analysis of seismic vulnerabilities arecurrently not available, but an investigation is under way as to the possibility to provide such verifiedcodes for Kozloduy-3 PSA study
4. Project Time-Table
The contract for Kozloduy-3 PSA provides only the general time frame for completion of projecttasks, namely:
Task 1: preliminary investigations, information gathering and analysis of initiators;Task 2: analysis of accident sequences from internal initiators;
Task 3: seismic hazard analysis;Task 4: integration of results.
This time-table is graphically presented on Fig. 2, together with scheduled reviews, which arediscussed later.
Tastet
RavwwoflEs
Task 2
ETs Review
FM Analysis Review
Task 3
Seismic Analyji» Review
Task«
IPERS Mission
Fig. 2. General Time Frame for Kozloduy-3 PSA (months)
The exact time schedules of Tasks 2 and 3, that consist of multiple sub-tasks, will be presented toand approved by, the utility and the regulatory body upon completion of Task 1. It is only necessaryto mention here, that methodological basis for Task 2 (internal initiators) is to be established duringTask 1, while the fire hazard analysis methodology will be developed in the beginning of Task 2. Task3 will also start with methodological study.
5. Project Organisation
Kozloduy-3 PSA is the first major project in the field of energy development of the post-socialistBulgaria, that has been contracted to a local private company. This fact imposes a big responsibilityupon both Risk Engineering Ltd and Kozloduy NPP management. It was agreed with the Utility, that
plant personnel have to participate in the study implementation, which is also recommended by IAEAfor PSAs for operating plants. The direct participation of the designer has not been planned due todifficulties in contacts with the corresponding institutions. However, PEL intends to use the expertiseof the Russian personnel that will stay in Kozloduy at least until the official licence is issued for full-power operation of unit 6, and will also try to establish as close as possible cooperation with Russianinstitutions.Fig. 3. presents the general organizational scheme for the implementation of Kozloduy-3 PSA. It wasconsidered appropriate that project management will be represented by the REL Managing Directorand two Project Managers, responcible for PSA methodology and for plant technology,correspondingly.
The project management will be responsible for contacts with the utility, where a site team has beenestablish by Kozloduy-3 staff members, coordinated by Engineering Support Department and withmembers in all major departments of the plant. The site team is to provide the plant and systems
Pro/trf M«n«0«m«nr ;
General PSA Team(Group Leaders)
Pt*ntMin*gfm*nt '
Sit* Tftrn
Site Team Coordinator(Dptm of Engineering Support)
Fig. 3. Project Organization

97
information in the formats, suitable for PSA related system notebooks, as well as the preliminaryprocessing of operational data on incidents and on component failures The site team is also toreview the analyses being done by REL and to provide the necessary technological supportThe REL team will be splitted in several subteams, so that the work will be done in parallel This sub-teams include 3 system modelling groups, process analysis group, as well as human reliability groupand fire hazard analysis group Later a seismic hazard analysts group will be formed Each group isto consist of 2 3 engineers, with leaders of all groups forming the general PSA team whose task willbe to provide ET modelling and definitions of safety functions and success criteria, as well as toassure the same modelling approaches and assumtions of all groupsRisk Engineering Ltd is the mam Contractor for this study, but other organisations are to be involvedas sub-contractors depending on the needs (and upon approval by the Utility) The actualorganisations have not been included m the project bids because of the many organisationalchanges that are being currently done in Bulgaria in most state-owned institutions and companiesThe parts to be sub-contracted may include some thermohydraulic analysis tasks, deterministic fireprogression analyses and seismic hazard analysis tasks
6. Quality Assurance
The quality assurance of Koztoduy-3 PSA project s a major issue because this is the first project ofsuch significance that is undertaken by Risk Engineering Ltd since its foundation in 1989The quality assurance is to be organised on several levels• REL quality assurance procedures,• utility participation and reviews,• reviews by the regulatory body,• reviews by foreign expertsThe REL internal quality assurance organisation for this project includes• use of well-established and internationally recognised methodological basis and well-known
software,• development of written methodological documents for all major tasks as well as System Analysis
Manual to assure unified approach of all groups,• reviews of all documents developed within a working group by members of another group and
approval by project management, in some cases reviews by external specialists are foreseenbefore approval
The utility participation in the verification of initial information and modelling assumptions isconsidered to be important especially in cases where information about plant response is scarce ormissing Expert panels are to be organised in such cases with REL specialists and utility personnelAll partial reports are to be reviewed by the site team, passing through the major departments of theplant, and reports approval is planned by the Technical and Economic Expert Council of the utilityThe initial technical specifications of the project tasks as well as any eventual changes are beapproved by the Regulatory body In addition, regulatory personnel is to review the partial reportsThe regulatory body is also to organise the foreign assistance for project implementation by IAEAThe foreign assistance for the project is to consist of two separate types of activities Firstmethodological seminars that are not directly related to the project are to assist both project staffand regulatory and utility staff in gaining deeper knowledge of the up-to-date methodological
procedures and developments Second, as pan of the reviewing process for each of the major taskreviews are to be organised by the regulatory body and IAEA to provide foreign expertise forassurance of the international acceptance of methodological procedures and modelling approachesand assumptions The approximate time schedule of the reviewing process is included in Fig 2 Thefinal report of the study is to underpass an IPERS (International Peer Review Service) missionorganised by IAEA
7. Status of Task 1
The Kozloduy-3 Probabilistic Safety Study started at the beginning of June 1992 The Task 1 of thestudy is to be performed for 5 month, thus the results will be available for review in the beginning ofNovember The status of Task 1 in the end of August 1992 is described below, as well as the resultsthat are expected at the completion of Task 1• site, plant, and system information formats developed and supplied to the Site Team for
information gathering,• several component information forms developed, reviewed and approved by the Site Team, then
integrated in a computerised procedure and supplied to the Site Team (these are eventually to beintegrated later with the plant information system that is to be developed under other projects),tasks defined for the Site Team for gathering of component failures data,
• preliminary generic let of lEs compiled, screened, adapted to KozkxJuy peculiarities andpresented for review to the Site Team,
• investigation of plant experience under way for lEs quantification for frequent initiators, contactsmade with Russian and Ukrainian organisations for quantification of internal equipment-dependent initiators,
• investigation for LOCAs categorisation under way, tasks are defined for thermohydraulicanalyses for clarification of some LOCA issues,
• logical procedure developed for grouping of transient initiators,• development of a System Analysis Manual (to include an aspects of system analysis) under way,
as well as development of documents describing general PSA methodology and defining ETanalysis approaches, preliminary work started for development of methodological basis for FireHazard and Seismic Hazard analyses (this work is to continue at the beginning of Task 2)
The final full list of initiators will be supplied to the regulatory body for review and approval in thebeginning of October By the end of October, the categories of lEs to be modelled with ETs are to bedefined, as well as Methodology Overview prepared The site and plant information is to be compiled,including general system dependencies matrix and general plant success criteria as well as thesystem notebooks basic information, so that this documents would be extensively reviewed beforethe ET modelling startsThe first draft of the System Analysis Manual, which part of REL internal QA procedures, rather thenof the PSA contract, is also to be completed by the end of October, so that the final version,reviewed and approved by REL and project management, will be available in the beginning of 1993The review of Task 1 report and supporting documentation by the site team and the regulatory bodywill be done m the beginning of November and final approval of the report by the utility is expectedin the middle of November, after that external review is planned by IAEA which is to take placepresumably in the beginning of 1993

98 LIVING PSA-RISK MONITOR:CURRENT DEVELOPMENTS
P KAFKAGesellschaft fur Anlagen- und Reaktorsicherheit (GRS) mbH,Garchmg, Germany
Abstract
The paper discusses the use of PSA model for various types of operational support A distinctionbetween Living PSA and Risk Monitor is highlighted Some examples of such PSA applications aredescribed Specific requirements in the area of computerization are discussed in the context of RiskMonitor tools
1. IntroductionSince the Seventies, Probabilistic Safety Assessment (PSA) has been used increas-ingly as an important tool in various industries PSA has made enormous strides,and it is clear to e g the nuclear industry, that it provides a beneficial framework withwhich an analyst can systematically identify specific event scenarios and can quanti-fy the likelihood and consequences of these scenarios Theoretically all scenarios ofinterest to safety and risk will be considered and can be quantitatively ranked byvarious importance measures From these ranked measures designers, vendors,utilities and safety assessors are provided with a real basis to balance the differentelements contributing to the two mam risk components i e likelihood and conse-quences IM These insights are also essential for all type of facilities to minimize in-vestments and operating costs and to maximize plant availability.PSA strengths are that it is mtegrative and quantitative, integrative in that it has theability to consider in one large model the whole system including design, manufac-turing and operating elements and quantitative in that sense of addressing in ascientific way consequences, likelihood, and uncertainties associated with the quan-tification of these risk componentsPSA s historical way starts from quantification of the risk level of typical NPPs(WASH 1400) In the mean time PSAs are more and more used to analyze a givenplant with respect to a well balanced safety respective risk profile and if needed toeliminate by system changes and/or backfitts the identified weaknesses (NUREG1150./2/)Today, there is a consistent interest to use PSAs as a tool for trending the safetyand risk status during the plant operation period and to balance actions during theplant operation with respect to a minimal risk contribution /3/ Operator actions arebased on tech specs and manuals which were focussed traditionally uncorrelatedon safety and operating aspects only and therefore the plant operation does not fol-low risk-minimal strategies For these advanced utilization of PSAs additional model-ings and a meaningful computerization of a plant specific PSA is needed
Convinced by these summarized benefits the US NRC has been decided to go to-wards to risk-based regulations In a transition phase all deterministic regulations willbe revised in accordance to this new strategy /4/ /5/
2 Living PSA - Risk Monitor - How we should define these key words?Living PSA and Risk Monitor should be differentiated regarding their objectivesLiving PSA Investigation of the Safety/Risk status for a given plant after a giventime interval (e g 6 month, year/s) based on an updated plant-specific PSARisk Monitor Investigation of the Safety/Risk impact of specific parameters for a giv-en plant at a given time, based on an on-line recalculation of specific values of anupdated plant specific PSAThe Living PSA concept does not needs necessarily a fully computerized modelTraditional working procedures based on a package of advanced computer codes(e g for event tree/fault tree calculation, data treatment and handling) and an inter-active step by step use of these codes can be sufficientIn contrast, the Risk Monitor concept needs definitely a fully computerized model togenerate answers for questions interactively at one computer session in a few min-utes Its evident, as many as questions raised, as more complex the computerizedmodel would beLiving PSA has the potential to be used for Periodic Safety Evaluation (PSE) by theutility A Risk Monitor has the potential to support safety decisions ad-hoc by the util-ity and safety assessors It strength is also the potential to study the impact of pa-rameter changes practically on-line and to use this tool as "Safety Optimizer'For both concepts we need transparent computerized models, an accepted plant-specific PSA and agreed calculation procedures at the computerThe following graphic (Fig. 1) should illuminate the definitionsThe main principles of the two concepts are shown in the Appendix, (burimoS andbunmo9)
PSA Indicators> k
Living PSA
PSA Indicators
Risk Monitor
Trend
HSnapshoot
Trend
up date (6m iy?) Plant Life-time Curremqi.es en Plant Life time
Fig 1 Basic graphic regarding Living PSA and Risk Monitor

3.
3.1
ExamplesLiving PSA
The main aims are to support the safety assessors and the utilities in Periodic SafetyEvaluation (PSE). Based on the definition, as stated in paragraph 1, the main objec-tives are:Trending of:
• System changes and system improvements• Backfrtting
• Changes in operating procedures• Changes in test, maintenance, and repair strategies• Aging and wear-out of components
In the specification of the SAIS (Safety Analysis and Information System) System,sponsored by BMU in Germany, it is lead down that this system will be finally a toolfor Living PSA application /6/. The main project runs from 1990 till 1992. A feasibilitystudy and a test phase for a specific plant application (Brockdorf, Greifswald,WWER) showed success 111. The generation of SAIS is supported by utilities, be-cause a great bulk of the stored information will be used directly by the utility forgeneral safety and operating questions at the plant. SAIS runs on a Sun Workstationincluding full graphic editors for text, flow diagrams, event and fault trees. Conven-tional programs for fault tree evaluation (e.g. RISA) are integrated.
3.2 Risk MonitorThe main aim is finally the support of plant personnel to take risk-optimal decisions/8/. Development and the initial use for préfabrication of risk-based result can be inthe hands of safety analysts and assessors. As defined in paragraph 1, the main ob-jectives are :Monitoring of:
• Component outages• System configuration management• Changes of operating procedures (e.g. AOTs)• Changes in repair and maintenance strategies (e.g. STIs)• Aging and wear-out of components
In the framework of the so called "Störfallberatungssystem" (SBB), sponsored byBMFT, a Risk Monitor is under development at GRS. The Risk Monitor will be astand-alone as well as an integrated module within the SBB. The development willbe realized in two steps:
• Risk Monitor without PSA tool box (A)
• Risk Monitor with a PSA tool box (B)
The version (A) will be split up into a DEMO version and a full version. A commercialExpert System Shell (RT Works) on a DEC workstation is used. The development isplant specific; starting on Level 1 ; based on the PSA for Biblis B121. The PSA inputshould be realized as general as possible to allow the use of the monitor concept forvarious PSAs. Questioned output (e.g. Importance values /9/) will be calculated onthree levels i.e. system function, sequence, and core damage level.Problems are expected from the facts that the typical PSA work structure, used byPSA analysts (e.g. coding, data handling), is not as consistent as needed in goodinformative structures for computerization. Therefore many transcodings and inter-faces are needed.Some details coming from the développer" s workbench are shown in the Appendix,(burimolO, burimo11, burimo18)
3.3 Other ExamplesLooking into literature /10/ and considering program demonstrations personallyseen, one can observe a wide spectrum of activities in the mentioned field, (see also5. Literature). Some of the available codes or the developments are multi-purposepackages and some of them are more specialized for specific users and their ownpurposes.Examples focussed mainly for Living PSA applications are e.g. IRRAS /11/, LES-SEPS/12/, RISKMAN /13/, Risk Spectrum /14/, SUPERNET/15/,Examples of used Risk Monitors are PRISIM /16/ and ESSM /17A More advanceddevelopments are PEPSI /18/ and LIPSAS /19/.Additional examples see /10/ and para. 5. LiteratureOne of the unresolved key issue for Risk Monitor development is the interactive gen-eration of fault trees based on the flow diagram input. First examples of such tools1201 - successful tested in-house for smaller systems (approx. 50 components) - areavailable. Thus, it seems to be realistic that in a few years a Risk Monitor will sup-port also the system configuration management on-line with risk-minimal recom-mendation. In-depth discussion of other issues see also /21/, /19/.
4. Concluding RemarksIn this last paragraph some important issues and statements are summarized:
• For future discussions and developments a distinctions between Living PSAand Risk Monitor would be recommended
• Aims, objectives, utilization and the relevant potential user group should beclearly defined and perhaps by international organisations (e.g. IAEA) guided.It looks plausible that specific aims, e.g. Accident Management Support, needa specific computerized systems. A common basis would be the plant specificPSA

100 * To practice Living PSA is a consequent ongoing action to support during thewhole plant life-time various decision making processes by actual PSA state-ments
• The strength of a Risk Monitor is the possibility to support practically on-linealso plant personnel during plant operation in risk-minimal decision making.Optimization of AOTs (Allowable Outage Times,) or STIs (Surveillance Test In-tervals) with respect to minimal risk impact are examples. It is evident that suchoptimizations can be also "prefabricated" by a Risk Monitor. Shut-down riskshould be considered, if such optimizations will take place
• Two examples from Germany are described in more details and examples fromother countries are referenced (see 5. Literature)
• Experiences from the ongoing Risk Monitor development show that a comput-erization of a PSA, performing the Risk Monitor, should go hand in hand. Thisprocedure will be finally more efficient and of higher input quality
• Common for all computerized systems are the facts that acceptance, transpar-ency, easy handling, guidance for input and use and a quality control system isneeded.
ACKNOWLEDGEMENTS
The author is greatful to Mr. Lupas, Seel, Wu, Zimmermann wihin the Risk MonitorTeam for their useful ideas supporting this paper.
REFERENCES
/1/ P. KafkaProbabilistic Safety Assessment - Quantitative Process to Balance Design, Manufac-ture and Operation for Safety of Plant Structures and SystemsSMiRT-11, Transactions, Vol. M, Tokyo, August 18-23,199112] Gesellschaft für Reaktorsicherhert (GRS) mbHDeutsche Risikostudie Kernkraftwerke, Phase B,Verlag TÜV Rheinland 1990/3/ P. KafkaRisikomanagement des AnlagenbetriebsAtomwirtschaft, atw August/September 1991, p 421-424/4/ H. Specter7776 importance of risk-based regulations to developing nationsIAEA, TCM Meeting Budapest, 7-11 September 1992
151 El Bassionipersonal communications atIAEA, TCM Meeting Budapest, 7-11 September 1992IS! H.-P. Balfanz, D. Böhme, S. Dinsmore, W. MusekampSafety analysis and information system (SAIS): a software system to support NPP -safety managementPaper, 2nd TÜV-Workshop on Living PSA application, Hamburg, 7-8 May 1990fil J. RumpfSAIS Application to WER ReactorsIAEA, TCM Meeting Budapest, 7-11 September 1992/8/ G.I. SchuellerEntwicklung auf dem Gebiet rechnergestützter probabilistischer SicherheitsanalysenAtomwirtschaft, Februar 1989, P. 91-92/9/ W.E. Vesely, T.C. Davis, R.S. Denning, N. SaltosMeasures of risk importance and their applicationsNUREG/CR-3385, Battelle Columbus Laboratories, Columbus, 1983/10/ D. llberg, D. LedermanA Review of Computer Programs applied in Levell Probabilistic Safety AssessmentPaper, PSA '91, Vienna, 1991/11/ M.B. Sattison, H.J. ReillyFrom PFtlSIM to IRRAS/SARA; Lessons Learned in Living PSA,Paper, 2nd TÜV-Workshop on Living PSA application, Hamburg, 7-8 May. 1990/10/ C. Ancelin, A. Dubreuil ChambardelFrom LESSEPS 1300 to the Application of Computerized PSAs to Operational Safe-tyPaper, PSA '91 Vienna. IAEA-SM-321/62/13/ PLGRiskman; The Power in PSAPR Material. PLG. 2260 University Drive, Newport Beach, CA 926607147 U. BergRealization of true living PSA: A challenging software development taskPaper, 2nd TÜV-Workshop on Living PSA application, Hamburg, 7-8 May, 19907151 S. HirschbergApplications and implications of the living PSA conceptProceedings of the 2nd TÜV-Workshop on Living PSA application, Hamburg, 7-8May 1990/16/ J.K. Kirkman, J.B. Fussel, D.J. CampbellPRISIM at Arkansas Nuclear One-Unit 1: Daily in-plant use of PSA InformationReliability Engineering and Safety System, 22 (1988), p 441-454

101
mi B.E. HornThe Essential System Status Monitor for Heysham 2 Nuclear Power StationTCM, IAEA, Vienna 17-21 October, 1988/18/ K-J. Kim, J. ParkResearch Activities for PSA in Korea Atomic Energy Research InstituteIAEA, TCM Meeting Budapest, 7-11 September 1992/19/ P. Kafka, H. KunitzThe Use of PC-based Probabilistic Safety Assessment (PSA) ModelsPaper, PSA "91, Vienna, 1991I2QI K. GüllenPC-FTAAECL Research, Chalk River, CanadaI2M G. Apostolakis, P. Kafka, Edts.The Role and Use of Personal Computers in Probabilistic Safety Assessment andDecision MakingElsevier, 19901221 C. Ancelin, M. Bouissuo, P. Le, S. De Saint-Quentin, N. VillateA Living PSA Based on Use of Expert SystemsPaper, PSA '89, Pittsburgh, 19891231 D.L. Batt, Ph.E. MacDonald. M.B. Sattison, W.E. VeselyOrganization of risk analysis codes for living evaluations (ORACLE)Paper, PSA "87, Zurich, Vol. 2, TÜV Rheinland (1987) p 698/24/ H.P. BalfanzSafety information system SAIS, to support NPP safety managementPaper, TüV-Workshop on: Program Systems and Computer Codes for Living PSAApplication, Hamburg, September 19881251 J.A.G. Johanson, L. Gunsell, K. Laakso, P. HellströmSafety Evaluation by use of living PSA and Safety Indicators - current Status and fu-ture Development of Models and Tools within the Nordic Project Safety Evaluation,NKS/SIK-1Paper, PSA'91, Vienna, IAEA-SM-321/591261 J. Holmberg, K. Laakso, E. Lehtinen, G. Johanson, S. BjöreNordic Survey on Safety Evaluation by Use of Living PSA and Safety Indicators(NKS/SIK-1), SKI Tech. Rep. 91:3, NKS/SIK-1 (90)13 (1991)/27/ C. AncelinAn artificial intelligence-based workstation for reliability studiesPaper, 3rd Int. Conf. on Industrial and Engineering Applications of Artificial Intelli-gence and Expert Systems, IEA/AIE 90, Charleston, July 1990/28/ A. Mille, E. Niel, S. RametAn Expert System for Monitoring Safety of an Automated Production CellPaper, Reliability'92, Copenhagen, Elsevier, 1992
/29/ Esko Lehtinen, Pentti SaarelainenMonitoring of a safety system's unavailability and maintenance performance usingLOTI information system and operational safety indicatorsPaper, Reliability'92, Copenhagen, Elsevier, 1992/30/ Jan Holmberg, Gunnar JohansonDefinition of a concept for safety evaluation by use of Living PSA - the nordic project"safety evaluation, NKS/SIK-1"Paper, Reliability'92, Copenhagen, Elsevier, 1992/31/ U.-K Erhardsson, Y. FlodinMomentaneous risk level. PM-project for living PSAReport PK-79/81, NKS/SIK-1 (91)30, Vattenfall, Vällingby, October 19911321 R. VirolainenLiving PSA - A communication tool between regulator and utilitiesPaper, 2nd TÜV-Workshop on Living PSA application, Hamburg, 7-8 May, 1990/33/ Richard G. Parker, Stephen J. DennissTowards to knowledge-based support for reliability analysis: the ADVISE systemPaper, Reliability'91, London, Elsevier, 1991/34/ F.A. Patterson-Hine, B.V. KoenObject Oriented Fault Tree Evaluation for Quantitative AnalysisIn Fourth Conference on Artificial Intelligence for Space Applications, NASA Conf.Publ. 3013/35/ Sally J. Mennell, David P. Raymond, Alan B. ReevesProbabilistic Safety Assessment (PSA) Applications using Knowledge Based Sys-tems TechniquesPaper, Reliability'91, London, Elsevier, 1991/36/ P. Christensen, L Smith-Hansen, P. Heino, G. Passera, A. PoucetThe use of Knowledge Bases in Advanced Computer Aided Safety AnalysisPaper, Reliability'91, London, Elsevier, 1991/37/ A. PoucetKnowledge Based Tools for Safety and Reliability Analysis.Paper, Reliability Engineering and Safety System, Vol. 30, P. 379-397/38/ J.L. PaulsenA Continuous Decision Support System for Reliability Centered Maintenance Plan-ningPaper, Reliability'91 London, Elsevier, 1991

102 THE LIVING PSA CONCEPTFOR THE CERNAVODA NPP
I. TURCU, G. GEORGESCUInstitute for Nuclear Research,Pitesti, Romania
- Risk-based operation applications; The applications that we intend toimplement in the system are:
-risk based configurat ion management;-risk-focused data collection;-precursor evaluation;-risk-based maintenance prioritization;
Abstract
Beginning with 1987, in the Institute for Nuclear Research the full scope PSA activityfor Cernavoda NPP, unit no. 1 was started. The final goal (the end of 1994) of the studyconsist of the "living PSA" implementation as an operator-aid computerized system. Thesystem will be used by both plant operation and regulatory, and can be used also by thedesigner as a design checking tool. The system named computerized Risk Assessmentsystem -"CORA", will be developed using expert system and management informationsystems techniques, the top-level design being already done. The system will be im-plemented on a IBM RISC 6000 workstation, UNIX environment.
I. Background
In Romania a CANDU-600 type NPP is under construction in Cernavoda, the targetdate for operation starting being 1994. Beginning with 1987 the PSA activity was startedfor the first NPP unit using the license documentation. The PSA main objectives are: earlydesign improvements, emergency procedures development, technical specifications devel-opment and finally the "living PSA" computerized implementation as an operator aid tool.
Up to now the "limited scope PSA" is finished, e. g. 10 E/Ts and about 17 F/Fs, thefull scope PSA being under development. The "CORA" top-level prototype design wasalready done, and is in our intention to use the limited scope PSA model to test it, for thebeginning on a PC computer.
II. "CORA" functions
The system basic functions consist of:
- Plant risk knowledge monitoring and systematization: This function mainlyconsist of : accident sequence description and contributions; system, component, humanerror, test/maintenance and common cause failures .
- Risk-based accident management: The accident management consist of :identify and rank the success paths for the initiating event, ranking the paths according tooperator requirements and success likelihood; select the success paths to define accidentmitigating actions;
III. Main features of "CORA" package
The software features include:
-user friendly interface;-separate evaluation modules for Event/Trees, Fault/Trees, Basic
Event Data;-evaluation/ranking of contributions;-success paths determination;-re-evaluation of MCS;-Event/Tree, Fault/Tree modification;-report generation;
IV. "CORA" top-level design
Based on defined "CORA" functions and requirements the principle modules andinterconnections are:
- interfaces modules with the NPP Dual Computer and Data Collectioncomputers (a), (b) - which automatically update the Plant Status Data Base - PSDB (c) (Seefig-1)-
- PSDB - contains information about the plant components that areincluded in the PSA model and also plant data that are used to define different plant states( pressures, temperatures, etc.).
- interface module between the PSDB and functional modules (e), initiateautomatically the proper functional modules for accident management in case of plantincident.
- interface module between PSDB and PSA model - automatically updatethe PSA model according to the plant status (f).

DUALCOMPUTER
DATACOLECT10NCOMPUTER
PRINTER
W
INTERFACEMODULE
1+
— «— L
INTERFACEMODULE
——— 1 flit m^f '-] N |
INTERFACEMODULE
"CS(
—— 4 ————
M
1
— » ———
PLANT STATUSDATA BASE
TINTERFACEMODULE
1
— U-
(fl
PSAMODEL
•
FUNCMOD
ORA"JFTWARE
r i
mONALULES
M<
, 19)
I ,
RESULTSMODULE«DATA BASE
i
^
^
1 ——
0)
**r '"CORA"OPERATOR[SAFETY
(d) EGINEERJ
DISPLAY PLANT OPERATOR
103
FIG. 1 "CORA" CONCEPTUAL TOJH£VEL DESIGN
- PSA model - Data Base structure containing the PSA model, including Fuit Treesmodel, components and human error data, accident sequences, etc.
- functional modules - modules that accomplish the "CORA" functions accordingwith the operator requirements (i) and the plant status, using the updated PSA model (g):
-risk - monitoring modules;-accident mitigating modules;-PSA applications modules;
- interface module for "CORA" operator - provide facilities for on-line changes ofPSDB, PSA model or switch the functions to be executed (d).
- Results module & Data Base - provides results and history storage, shows theprocessed results on the display or on the printer (h).
V. Operation
The system will be implemented on a IBM RISC 6000 workstation, UNIX environ-ment, being used for operators guiding in plant normal state operation and in case of plantincidents. The system uses on-line data from the plant dual computers and from datacolection computers, the PSDB being on-line up-dated.
In normal state, the system monitors the plant global risk and contributions andcan be used for risk based configuration management, risk-focused data collection, precur-sor evaluation and/or risk-based maintenance prioritization.
In case of incidents the system will automatically switch on accident manage-ment functions, computing the path-sets and all derived informations, for the givinginitiating event and plant status.
The plant operator will be able only to select the proper function according withhis necessities, the "CORA" deep level changes being possible only from the "CORA"operator console.
VI. Development
The "CORA" development is part of the CPSE (Cernavoda Probabilistic SafetyEvaluation) programme.
The main development steps are presented in fig. no. 2.
1. Principle top-level design, modules design.
2. Implementation of the "CORA" prototype on a PC.

104PROTOTYPEDESIGN
IMPLEMENTATIONON "PC-
PROTOTYPETESTING
PRESENTATION «DISCUTIONS
IMPLEMENTATIONON RISC-6000
TESTING
PRESENTATION &DISCUTIONS
IMPLEMENTATION
RG. 2 " CORA" DEVELOPMENT STEPS
3 Intensive testing of the prototype using the limited scope CPSE model.
4. Presentation and discussions with the operating team, regulatory and plantdesigner.
5. "CORA" interfaces development using the full-scope CPSE model (definingthe data necessities and the ways to provide them), final design of the system.
6. Implementation on the RISC 6000.
7. Intensive testing of the system using the full scope CPSE model.
8. Presentation and discussions with the operating team, regulatory body andplant designer.
9. Documentation, validation, operators training and plant site implementa-tion of the system.
REFERENCES
1. *** , CERNAVODA PROBABILISTIC SAFETY EVALUATION- A LEVEL IPSA STUDY, WORKING DOCUMENT FOR IPERS EXPERTS TEAM, OCTOBER1990.
2. ***, USE OF EXPERT SYSTEM IN NUCLEAR SAFETY, IAEA-TECDOC-542,IAEA, VIENNA, 1990.
3. *", EXPERT SYSTEMS IN THE NUCLEAR INDUSTRY, IAEA-TECDOC-660, IAEA, JULY 1992.

PRESENTATION AND BASIC APPLICATIONSOF PSA RESULTS
V. HOJNYNuclear Research Institute,Rez, Czechoslovakia
Abstract
Main, esp. graphical ways of the PSA results presentation,which make the results more user-friendly to plant personnel, areshown in the paper. There is described, namely, a utilization ofdifferent importance measures for determination of plant featureswhich should be backfitted or maintained when seeking a decreaseof the plant risk. Also the basic use of the importance measuresfor a risk-based improvement of technical specifications isdiscussed. The practical utilization of the techniques isillustrated on concrete results of the PSA Level-1 BenchmarkExercise carried out at the Nuclear Research Institute within theNPP Dukovany PSA.
1. INTRODUCTIONProbabilistic Safety Assessment (PSA) has already reached a
full acknowledgement in nuclear community and there is a numberof guidelines for proper conducting the PSA - e.g. [1]. Typicalcontent of PSA reports as it is recommended in the guidelines is,however, aimed mainly at an insurance of proper documentation ofthe assessment process. The results presented in such a way canbe sometimes understood and accepted in assessed plant with somedifficulties.
Nevertheless, contemporary computer software - both PSA andgeneral graphics oriented - enables to present the results inmuch more user-friendly way. The results can be, namely,presented in a form of different importance measures which makesthem directly usable for considerations aimed at an improvementof plant safety. The considerations which are well supported bythe importance measures include possible changes in plant designand/or procedures, and also in component technicalspecifications.
The paper presents some general ideas which can serve as aninspiration for ensuring better understanding of the PSA resultsby a plant personnel. As an illustration there are presented someresults of the PSA Level-1 Benchmark Exercise ( referred to as"Exercise" from here on ) within which a complete assessment of
the large loss of coolant accident (LLOCA) has been performed[2]. The Exercise has been carried out at the Nuclear ResearchInstitute within a full-scope level-1 PSA of the Nuclear PowerPlant Dukovany, Czechoslovakia ( equipped with the WER-440V213-type reactors ) which is currently being done.
2. MAIN RESULTS PRESENTATION
The main results of the PSA include generally plenty of rawnumbers which characterize core melt frequencies for variousplant emergency situations. The numbers alone are not, however,too illustrative and a graphical form of presentation is highlyrecommended. In addition to it, there is also an uncertainty inthe absolute numbers and so some relative comparisons are morerealistic.
Basic information obtained from the PSA is a comparison ofcontributions of different initiating events to the total coremelt frequency. It is very useful for the plant as it identifiesthe accidents on which a special watch should be kept and forwhich good accident-oriented emergency procedures could be reallyhelpful - one of the many ways how to present this information isshown in Figure 1 ( the Harvard Graphics has been used to preparethis and all the following Figures ), As there are no suchresults available for the Dukovany plant yet, Figure 1 presentsinstead the results of a Level 1 PSA of the Loviisa 1 nuclearpower plant ( also equipped with the WER reactors ) processed onthe basis of the data given in [3].
Another piece of information which can be of some use for theplant is a comparison of contributions of individual sequences tothe total core melt frequency for given initiating event ( or toany other risk measure associated to the initiating event ). Arather trivial example is given in Figure 2 where such acomparison is presented for the conditional probabilities of thecore melt of the possible event sequences given the LLOCA( Figure 2 and all the following Figures are based on the resultsof the Exercise [2] ). The comparison helps to identify accidentscenarios which are especially dangerous and for which a propertraining is essential.
Contributions of different types of events considered in thePSA to the risk can be also interesting to the plant personnel( and, after all, to the analysts too, as they assess theinfluence of some aspects of the methodology used ). The eventtypes considered may include, e.g., the influence of common causefailures (CCF) or human errors (HE). As an example, thecontribution of the CCF's to the total LLOCA risk is presented inFigure 3. The same information can be derived using someimportance measures as it is discussed in the next section of thepaper.
105

J05 The result of the PSA may depend quite substantially on thesuccess criteria used when modeling operation of individualsafety-related systems of the plant. The criteria should bedetermined on the basis of thermal-hydraulic calculations but anumber of these calculations has not been performed yet. Theproblem is usually solved by using conservative assumptions inthe model but this policy casts some doubts on the results whichcan easily over-estimate the core melt frequency. An elegant wayhow to address the problem is to recalculate the PSA with the
conservative assumptions replaced by the opposite, optimisticones. Hopefully, a small difference in the resulting risk in bothcalculations enables us to persuade the plant personnel about a.low influence of the conservative assumptions used ( it may alsosave a lot of money spent normally on the thermal-hydrauliccalculations ). When addressing individual assumptionsseparately, quite a good recognition of the situation can bereached - see Figure 4.
SLOCA l 6E-OSALOCA 8 7E-O7
LLOCA 3 IE-0«
VLOCA 2 3E-OA
SOTB 7 8E-O«
Total conditional probability = 00679
sequence 30.0009 1%
MLOCA l3E-05 PLSW 1ÔE-05
LMFW B OE-O7
LOOP SOE-OS
LOCA's Transients
sequence 200670 99%
Fig. 2 - Sequence contributions( LLOCA - Dukovany PSA )
Fig. 1 - Initiating events contributions( Loviisa PSA )
( CMF « 2.3 x10"* per year )
Sequence description:2 - failure of the low pressure ECCS3 - failure of the core flooding system

CCF's0,0170
CONDITIONAL PROBABILITY
5.35E-02
0.0509
Total conditional probability = 0.0679
INDIVIDUAL ASSUMPTIONS INFLUENCE
A — 2.0E-04
B -- 7 2E-0350%
1.44E-02
C -- 7.0E-0349%
Fig. 4 - Success criteria influence( LLOCA - Dukovany PSA )
Total condi t ional probabi l i ty - 0.0679
Fig. 3 - CCF's contribution( LLOCA - Dukovany PSA )
A - CFS delivery to both reactor plenumsB - LPS delivery to both reactor plenumsC - closed LPS recirculation piping
107
3. IMPORTANCE MEASURES AND THEIR UTILIZATIONThe risk importance measures are very useful tool of
quantification of worth of various plant features impacting riskas design characteristics or human actions - in both
controlling and reducing risk. They can be used to help focus andprioritize efforts in backfitting, reliability assurance,inspection, and general risk management programs. Latest computercodes used for conducting the PSA commonly offer a calculation ofsome importance measures [4] - other measures can be usuallyderived quite easily from those known as they are based on thesame parameters. The importance measures may be calculated notonly for individual primary events but also for selected groupsof events addressing thus whole systems and/or safety functions.As an example, some importance measures of the most influentialcomponent failures identified in the Exercise are given inTable 1. Besides of importance measures calculation, a
sensitivity analysis can be also performed which determines thesensitivity of the results to input data used for primary eventquantification; nevertheless, the importance measures andsensitivity are closely correlated and the features with a highimportance also display the high sensitivity,3.1. Risk Control Importance Measures
The risk control importance measures quantify an importanceof the feature in controlling the risk level achieved; i.e. thefeature with a high value of this measure are of particularinterest for risk assurance programs, quality assurance programs,and inspection activities. The measure is generally calculated asthe increase in plant risk level if the feature is removed.
Of the absolute measures, a Birnbaum Importance ( also calledRisk Importance ) is widely used. The Birnbaum Importance of

108 Table 1 - Component importance measures( LLOCA - Dukovany PSA )
Baseline risk =6.79 xlO
HO.
12345678910
Event Name
LPR3PMR-TH61D01PES3KEV-LPPER3DGR-QXPES3DGS-QXPEI3DGR-QXLPS3PMS-TH61D01PES3KBC-QM1LP03VME-TH61S09LP03VMO-TQ63S01LSS3SIF-QM1
Risk Control Imp.B
1.27 XlO"11.23 XlO 11.36 XlO 11.36 XlO"11.34 XlO"11.21 XlO"11.34 X10"11.19 XlO"11.19 XlO"11.34 XlO 1
RCI2.732.732.932.942.932.732.942.732.732.96
Risk Reduction Imp.FV
1.44 xlO"18.07 XlO"27.75 XlO"26.01 xlO"24.88 XlO 24.73 XlO"23.54 XlO"21.88 XlO 21.87 XlO"21.36 XlO"2
RRI1.171.091.081.061.051.051.041.021.021.01
Note: The events are ranked by their Fussel-Vesely Importances
certain feature simply tells what is the difference in the riskwhen the feature is removed and when it is optimized, i.e. it canbe expressed as:
where BB = Ri - Ro
Birnbaum Importance of the feature,Ri = risk level when the feature is removed, i.e. the risk
recalculated when the unavailability of the feature isset to 1,
Ro = risk level when the feature is optimized, i.e. therisk recalculated when the unavailability of thefeature is set to 0.
The parameter Ro can be usually replaced by a baseline risk( i.e. the original risk value ) as their values are normallyboth much lower than the value of Ri - it is valid especially forthe features with the high Birnbaum Importances which we areinterested in. In connection with the PSA calculations, theBirnbaum Importance of the feature can be directly calculated asa sum of unavailabilities of the minimal cut sets which containevents related to the feature with the unavailabilities of theseevents set to 1. There is an important consequence of this
relation which should not be forgotten: if the feature addressedis a group of primary events, the importances of different groupscannot be normally just summed up when seeking the importance ofa. union of the groups because each minimal cut set may containthe events of more than one group. The Birnbaum Importance isespecially useful when performing a risk-based optimization ofplant technical specifications which is discussed in the nextsection of the paper.
Of the relative measures, a Risk Control Importance ( alsocalled Risk Achievement Worth or Risk Increase Factor ) is wellknown:
RCI = Ri~rwhere RCI = Risk Control Importance of the feature,
Ri = risk level when the feature is removed, i.e. the riskrecalculated when the unavailability of the featureis set to 1,
R = baseline risk, i.e.calculated by the PSA.
the original risk value
The Risk Control Importance is very helpful when looking for thefeatures which should be subject of a quality control asmaintenance or testing. According to an expert opinion [5], thefeatures with the Risk Control Importance higher than 10 are wellworth being concerned about.
As the Exercise has analyzed only one initiating event, it isnot a good illustration of the risk control importance measuresutilization - the operation of almost all systems involved in anaccident mitigation is equally necessary and so no considerabledifferences in the importances can be observed ( cf. Table 1 ).3.2. Risk Reduction Importance Measures
The risk reduction importance measures quantify theimportance of the feature in further reducing of the contemporaryrisk level; i.e. the feature with a high value of this measureare of particular interest for risk reduction efforts. Themeasure is generally calculated as the decrease in the risk levelif the feature is optimized.
Of the absolute measures, a Fussel-Vesely Importance ( alsocalled Fractional Contribution ) is used. The Fussel-VeselyImportance of the feature tells what is a relative contributionof the feature to the total risk. It is calculated as:
FV = R - Ro
where FV Fussel-Vesely Importance of the feature,R = baseline risk, i.e. the original risk value calculated
by the PSA,

109
Ro = risk level when the feature is optimized, i.e. therisk recalculated when the unavailability of thefeature is set to 0.
In connection with the PSA calculations, the Fussel-VeselyImportance of the feature can be calculated as a sum ofunavailabilities of the minimal cut sets which contain eventsrelated to the feature, divided by the baseline risk value.Again, if the feature addressed is a group of primary events, theimportances of different groups cannot be normally just summed upwhen seeking the importance of a union of the groups as theminimal cut sets may contain the events of more than onegroup.The Fussel-Vesely Importances are very useful whencomparing the influence of different features on the total risk.Examples of some uses of the Fussel-Vesely Importance for the PSAresults presentation are shown in Figures 5 through 8. Worthnoticing is Figure 6 where the Fussel-Vesely Importances forindividual systems involved in the accident mitigation arepresented - the aggregate Fussel-Vesely Importance of each systemcan be divided into two parts representing the influences ofsingle and CCF-type events respectively because the CCF'sconsidered always cause a failure of the accident mitigation andso these two groups never overlaps.
Of the relative measures, a Risk Reduction Importance ( alsocalled Risk Reduction Worth or Risk Decrease Factor ) is wellknown:
RRI = -^where RRI = Risk Reduction Importance of the feature,
R = baseline risk, i.e. the original risk valuecalculated by the PSA,
Ro = risk level when the feature is optimized, i.e. therisk recalculated when the unavailability of thefeature is set to 0.
The Risk Reduction Importance is generally less nice indistinguishing the importance of the features than theFussel-Vesely Importance. It is, however, very helpful whenseeking a reduction of the risk and looking for the featureswhich should be improved; according to the expert opinion [5],the features with the Risk Reduction Importance higher than 3 aregood candidates for some backfitting.4. RISK-BASED OPTIMIZATION OF TECHNICAL SPECIFICATIONS
When a component of the plant goes down the plant risk levelgenerally increases because of the loss of component function. Tokeep level of the plant risk, an allowed downtime for each plantcomponent has to be set in plant technical specifications( Tech-Specs ). The Tech-Specs control the plant risk by assuringsafety-related systems reliability, namely by defining AllowedOutage Times and surveillance test strategies for theircomponents.
4.1. Risk-Based CriteriaUsing the PSA results a downtime risk associated with the
component outage can be calculated. An integral risk from onedowntime of the component called a Single Downtime Risk ( i.e. anincrease in the plant core melt probability accumulated over thesingle component downtime ), is:
= ( Ri - Ro ) B x dwhere Rs = Single Downtime Risk,
Ri = risk level when the component is down, i.e. the riskrecalculated when the unavailability of the componentis set to 1,
Ro = risk level when the component is up, i.e. the riskrecalculated when the unavailability of the componentis set to 0,
d = component downtime,B = Birnbaum Importance of the component.
The Single Downtime Risk calculated with the help of thisequation is somewhat conservative because it includes in thecalculated risk levels also the contributions from testing andmaintenance of the components which cannot be tested ormaintained when the component considered is down even accordingto the existing Tech-Specs - the error is, however, not too bigand can be usually accepted similarly as in PSA studies.
In a "risk-based" approach to the Tech-Specs optimization,some limiting value/values of the Single Downtime Risk have to beset to serve as Criteria for acceptance of an additional riskfrom the component outage. The simplest possibility is to use aconcept of the constant value of this Criterion for allcomponents; this concept is based on the reasoning that anincrease in the plant risk would be tolerable for only a limitedperiod of time, while the higher the risk increase the less timethe plant could be allowed to continue operation. The absolutevalue of the Criterion could be easily derived from risk-basedquantitative safety goals if they are set for the plant [6],Nevertheless, there are no such goals prescribed for any of theplants with the WER reactors yet. A simple solution of theproblem was suggested by the expert opinion [5]: to set arelative, plant-specific value of the Criterion at a 10 per centof the baseline plant risk.4.2. Allowed Outage Time Optimization
The Allowed Outage Time (AOT) is a maximum time during whichthe component can be down and its repair or maintenance can beperformed. If the component is not brought back to function inthe AOT then the plant must take an appropriate action definedat the Tech-Specs - usually go to a shutdown state.

SINGLE EVENTS
•CCF' TYPE EVENTS
HUMAN ERRORS
DEP. HUMAN ERRORS
1.48E-03
1.16E-04
2.00E-01 4.00E-01 6 .00E-01 8 . 0 0 E - 0 1
VESELY-FUSSEL IMPORTANCE
Fig. 5 - Event type importances( LLOCA - Dukovany PSA )
LPS
Main AC Power
Load Sequencing Aut.
CPS
Vital DC/AC Power
6-kV Undervoltage P.
0.4-kV Undervolt. P.
Service Water
I & C ] 0-007
0.054
CCF-Type Events.
Single Events
0.2 0.4 0.6
VESELY-FUSSEL IMPORTANCE
Fig. 6 - System importances( LLOCA - Dukovany PSA )

LPR1PMR-TH61D01
L P R 3 P M R - T H 2 1 D 0 1
L P R 2 P M R - T H 4 1 D 0 1
PES1KEV-LP
P E S 3 K E V - L P
P E S 2 K E V - L P
PER1DQR-QV
P E R 3 D G R - Q X
P E R 2 D G R - O W
PES1DGS-QV
PES3DGS-QX
P E S 2 D G S - Q W
L P R X P M R - T H « D 0 1
PEI1DGR-OV
PEI3DGR-QX
PEI2DGH-QW
1.44E-01
1.44E-01
9 .68E-02
- 8.07E-02
7.79E-02
r .7»E-02
7.7SE-02
6.22E-02
8.04E-02
6. OIE-02
4.91E-02
4.88E-02
O.OOE»00 5.00E-02 1.00E-01VESELY-FUSSEL IMPORTANCE
1.50E-01
Fig. 7 - Train importances( LLOCA - Dukovany PSA )
LPH3PMH-TH81D01P E S 3 K E V - L PP E R 3 D S R - Q XP E S 3 D G S - Q XP E I 3 D O R - O X
LPS3PMS-TH61D01P E S 3 K B C - O M 1
L P 0 3 V M E - T H 6 1 S O SL P 0 3 V U O - T Q 6 3 S 0 1
LSS3SIF-OM1C F O O V C O - T H 1 2 S 0 3CFOOVCO-TH13S03LP03VCO-TH61S07L P 0 3 V C O - T H 6 1 S O BL P 0 3 V C O - T H 8 1 S 0 2
A L S 3 R W L - K L 3A H S 3 R W L - K L 3
LPI3PMR-TH61D01L P 0 3 R T C - K T 1
L 3 S 3 R W L - K C C 4U S S 3 R W L - K T 7L S S 3 R W L - K T 2
LS$3RWC-KT2-1L S 5 3 R W L - K L 6
L P 0 3 R W L - K M L 1L P 0 3 R T L - K T 1
L P 0 3 H W L - K M T 1 - T H S 0 9L P 0 3 B W L - K M C 1 - T Q S 0 1
- 8 .07E-027.75E-02
6.01E-024.86E-02
4.73E-023.54E-OÎ
—— 1.88E-02—— 1.87E-02— 1.386-02
1.13E-021.13E-021.07E-021.07E-021.OIE-02
- 7 .21E-03- 7.21E-03
S.S4E-03— 6.00E-03
3.42E-032.67E-032.67E-032.EBE-032.41E-032.39E-032.39E-032.39E-03
- 2.39E-03
0.006-00 5.00E-02 1.OOE-01 1.SOE-01
VESELY-FUSSEL IMPORTANCE
Fig. 8 - Component influences( LLOCA - Dukovany PSA )
( components of the systems train No.3 )

Ill Using the approach described in the previous section and therelative Criterion based on the baseline plant risk, the value ofthe AOT can be calculated, e.g., in the following ways:
AOT10 B 10 ( RCI -
where AOT = Allowed Outage Time of the component,R = baseline risk, i.e. the original risk value
calculated by the PSA,B = Birnbaum Importance of the component,RCI = Risk Control Importance of the component,RRI = Risk Reduction Importance of the component.
The risk-based approach makes the calculated AOT's correlatedwith the component importances minimizing thus the risk andburden associated to the downtimes. If the calculated AOT islonger than the original AOT set in the Tech-Specs, then there isa sufficient time for component repair. If, on the contrary, thecalculated AOT is substantially shorter than the component repairtime expected, some steps for improving the plant design shouldbe taken to decrease plant's vulnerability to outages of thecomponent. Unfortunately, as the Exercise has analyzed only oneinitiating event, it cannot be used as an illustration of therisk-based AOT's setting because almost all the componentsconsidered are equally important and their calculated AOT's aretoo short - the approach can be used effectively just when acomplete PSA is performed.4.3. Surveillance Test Interval Optimization
In order to keep the plant risk under control, the individualstandby components of the plant are periodically put tosurveillance tests when the plant is in operation. When theperiodically tested component fails between tests, its functionis lost until the next test and the plant risk increases. Thesize of the risk increase generally depends on the' importance ofthe component and on the probability that the component isfailed. A time period between two consecutive tests is called aSurveillance Test Interval (STI).
According to the expert opinion [5] a simplified approach canbe used when determining the optimal STI for the component. Theapproach employs the same relative Criterion which is used forthe AOT calculation; a risk increase associated with a testedcomponent failure between the tests is compared to the Criterion.The value of the STI can be then calculated, e.g., in thefollowing ways:
STI = R5 A B 5 \ ( RCI - RRÏ
where STI = Surveillance Test Interval of the component,R = baseline risk, i.e. the original risk value
calculated by the PSA,\ = failure rate of the component,B = Birnbaum Importance of the component,RCI = Risk Control Importance of the component,RRI = Risk Reduction Importance of the component.
The calculated STI is correlated with the componentimportance and minimizes the burden associated with thesurveillance tests while keeping the risk on a tolerable level.The described way of the risk-based STI optimization can be,however, used only when time-dependent causes of the componentfailure are separated from the causes associated with componentfailures on demand in the PSA. Besides of the approach describedhere, some other approaches can be also used enabling, e.g.,prioritization of the test activities according to their risk,and/or determination of a test risk-effectiveness [7].
5. CONCLUSION
Results of the PSA can be a very useful tool for theimprovement of the safety of nuclear power plants. A properprocessing of the results is, however, necessary to make themmore ready for a direct use and/or further utilization inconsequent calculations. The different importance measuresappear to be especially helpful in this respect.
Besides of the simple prioritization of the control andbackfitting efforts, the importances are also an essential basefor the risk-based improvement of the plant technicalspecifications. Just the simplest ways of the technicalspecifications optimization are described in the paper whichenable the optimization of technical specifications only forsingle components. In addition to them namely a risk-basedconfiguration control is highly recommended; it enables to defineconfigurations of component outages which are tolerable when theplant is in operation, and the Allowed Outage Times for theseconfigurations [8]. A benefit from the risk-based approach to thetechnical specifications is twofold: an assurance that no riskyplant state is underestimated, and a minimization of the burdenassociated with surveillance tests and short time windows forcomponent repairs.
REFERENCES
[1] Safety series report; Procedures for conductingprobabilistic safety assessments of nuclear power plants.IAEA, Vienna, 1992.

[2] Hojny V.: PSA level-1 benchmark exercise. Paper on theMultilateral Symposium on Safety Research for WERReactors. Cologne, Germany, July 7-9, 1992.
[3] Andsten R.S., Vaurio J.K.: Sensitivity, uncertainty andimportance analysis of a risk assessment. NuclearTechnology 98 (1992), pp. 160-170.
[4] Computer codes for level 1 probabilistic safety assessment.IAEA-TECDOC-553, IAEA, Vienna, 1990.
[5] Vesely W.E.: Lectures at the Workshop on the Risk-BasedOptimization of Tasks and Procedures in Nuclear Power PlantOperation. Paks, Hungary, March 9-13, 1992.
[6] Atefi B., Gallagher D.W.: Feasibility assessment of arisk-based approach to technical specifications.NUREG/CR-5742, U.S. NRC, Washington D.C., 1991.
[7] Kim I.S., Martorell S., Vesely W.E., Samanta P.K.:Quantitative evaluation of surveillance test intervalsincluding test-caused risks. NUREG/CR-5775, U.S. NRC,Washington D.C., 1991.
[8] Samanta P.K., Vesely W.E., Kim I.S.:. Toward risk-basedcontrol of nuclear power plant configurations. NuclearEngineering and Design 134 (1992), pp. 355-370.
INTERNAL EVENT ANALYSIS FOR THELACUNA VERDE NPP: CORE VULNERABLESEQUENCE EVALUATION, APPLICATIONSAND INTERFACE WITH CONTAINMENT ANALYSIS
A. NUNEZ, A. HUERTAComision National de Seguridad Nuclear y Salvaguardias,Mexico City, Mexico
Abstract
In this paper ve present the general methodology used tocarry on the Internal Event Analysis for Laguna Verde NuclearPover Plant (LVNPP), special emphasis vas put on the method usedto evaluate certain accident sequences. These sequences are the socalled "core vulnerable" sequences and are the result Of accidentsequences vhere core coling is vorking but the containment heatremoval has failed. In order to preserve the containment integritythe operator is instructed by the emergency procedures to initiatethe containment venting. Due to containment venting, a harshenvironment vill be generated in the reactor building and in somesequences in the turbine building. Simplified boolean equationsvere constructed for the emergency systems to evaluate theinteractions between primary containment venting or failure andcontinued core cooling injection.
The sequences considerated in this vorh are the result of theinternal event analysis for LVNPP that is under way by the MexicanRegulatory Agency.
We briefly present some forseeable applications for the studyand finally, ve stress the importance of explicity displayed andcovered systems success and failure beyond successful containmentventing or containment failure to more easily perform theinterface between PSA level 1 and level 2, and the subsequentcontainment response analysis.
I. INTRODUCTION
113
The Mexican Regulatory Agency (CNSNS) is carrying on theInternal Event Analysis or LNVPP [1]. The objective of this studyis the identification and evaluation of the accident sequencesthat most contribute to the total core damage frequency. Themethodology employed is based on the guides developed in theaccident sequences evaluation program (ASEP) as support to

NUREG-1150 [2]. The methodology is focused in areas important torisk and uses simplified techniques in other areas, however, twomajor expansions of previous BWR event tree work were included inthe Internal Event Analysis for LVNPP. The first improvementrelates to the formal analysis performed for more systems capableof core and containment cooling. Credit was given for alternatesystems which can be used for long term core cooling in someaccident sequences. The primary containment venting procedure wasalso analyzed and included at the event tree level. The second,and more important, improvement relates with the analysis ofpossible system success or failure paths beyond successfulcontainment venting or containment failure. Therefore, the successor failure probabilities associated with continued core coolingwere explicitly and formally analyzed rather than assumed. Thissecond improvement trys to resolve the so called core vulnerablesequences.
In this paper we present a briefly description of LagunaVerde Nuclear Power Plant with emphasis on the safety features ofthe plant. We also present the major task performed for theInternal Event Analysis for Laguna Verde NPP along with themethodology used to evaluate the core vulnerable sequences.Simplified boolean equations were constructed to evaluate thesurvivability of injection systems to harsh environment generatedin the reactor building as a result of primary containment ventingor failure. Finally, we present the way the results andinformation from the front-end analysis are passed to the back-endanalysis through the definition and evaluation of the Plant DamageStates, along with the possible applications that we foresee forthe Internal Event Analysis for Laguna Verde Nuclear Power Plant.
2. LAGUNA VERDE NUCLEAR POWER PLANT (LVNPP)
The Laguna Verde Nuclear Power plant has two boiling waterreactor (BWR-5) units of 1931 Mwt capacity each and is located inVeracruz, Mexico [3]. The plant has several systems capables tosupply coolant injection to the core. Two independent cooling
methods (flooding and spraying) are provided to cool the core. Thehigh pressure core spray system (HPCS) and the reactor coreisolation cooling system (RCIC) are designed to provide coolant tothe reactor vessel during accidents in which reactor pressureremains high, on the other hand, the low pressure core spraysystem (LPCS) and the low pressure coolant injection system (LPCI)cool the reactor vessel when the pressure is low. The automaticdepressurization system (ADS) is designed to depressurize thereactor vessel to allow the low pressure emergency core coolingsystems inject water to the vessel.
The reactor is housed in a MARK II containment. Thecontainment is a steel-lined reinforced concrete structure. Duringan accident, steam from the vessel is directed through the SRV sto the suppression pool and to suppress the pressure in thecontainment, two trains of containment spray are used. Thecontainment spray system is one mode of residual heat removalsystem (RHR) . In the event that RHR fails the containment can bevented.
3. METHODOLOGY USED
The Mexican Nuclear Regulatory Agency (CNSNS) is conductingthe Analysis of Internal Event for LVNPP. The methodology used inthis study for the estimation of the total core damage frequencyis based on the guidelines developed by the Accident SequencesEvaluation Program (ASEP). The first task was the identificationof the important initiating events and the plant systems requiredto respond to these events. The initiating events groups for LVNPPare given in the table I. The next task is the identification ofthe possible accident sequences for each initiator, this was doneusing event trees. The philosophy behind the event tree analysisfor LVNPP was to depict systems success and failure until it wasresolved whether or not core damage occurred, and display thestatus of other systems sufficiently to describe the PDS. Theevent tree analyzed display and cover possible systems success andfailure paths beyond containment venting or containment failure

TABLE ILACUNA VERDE INITIATING EVENTS AND FREQUENCIES
DESCRIPTION
L A R G E L O C AI N T E R K ED I A TE LOCAS M A L L L O C AI N A D V E R T E N T OPEN RELIEF VALVELOSS O F F E E D WATERLOSS OF O F F S I TE POWERT R A N S I E N T W I T H THE POWER CONVERSION SYSTEMU N A V A I L A B L ET R A N S I E N T W I T H THE POWER CONVERSION SYSTEMI N I T I A L L Y U N A V A I L A B L E
MEAN FREQUENCY(PER YEAR)
133000
4
1
0 x 1 00 x 1 00 x 1 01 41 6135
6 3 4
658
- 4- 4
-3
115
and evaluate the possible failures due to harsh environmentgenerated. The success associated with continued core cooling,shutdown cooling (SDC), suppression pool cooling (SPC) andcontainment spray (CSC) modes of the Residual Heat Removal (RHR)were explicitly analyzed. The typical event tree for the InternalEvent Analysis for LVNPP is shown in figure 1.
The next task is the systems analysis, which is used toestimate the failure probability of the front line systemsidentified in the event tree headings and the support systemsrequired to operate the front line systems. For LVNPP study thereare 21 systems models for front line systems and support systems.In this step the analyst selected the appropriate type of modelfor each system. Four different kind of models were used: detailedfault trees where the modeling was performed at the component withall possible failure modes according with the data base,simplified fault tree where the modeling was performed at thecomponent level but the possible failure were comprised,simplified boolean expression focusing on major failure, andfinally for those systems where fault trees were not constructed,actual generic data were used to represent the dominant failure ofthe systems. The table II shows the systems included in LagunaVerde study along with the type of model used.
Fault trees and event trees were quantified using SETS [4]and TEMAC [5] computer codes. The quantification of the accidentsequences was performed using a step-by-step screening approach.Those sequences not eliminated in the screening were fullyquantified. The quantification of the survive of systems aftercontainment venting or failures is described in next section.
wnuTim:KVZNT
s
REACTORPROTECCWKSYSTEM
C
INJECTIONSYSTEMS
RHRSYSTEM
ALTERNATESYSTEMS
COtTTUNVSmVENTINO
Y
:ONTAINUCNTLEAK
R
SYSTEMSSURVIVAL
SUR
ATWS
OUTCOMEOF
SEQUENCE
OK
OK
CD
OK
CD
OK
CD
CD
CD
FIGURE 1 - TYPICAL EVENT TREE FOR INTERNAL EVENT ANALYSIS FOR LVNPP

116 TABLE IISYSTEMS INCLUDED IN THE LVNPP STUDY
SYSTEM TYPE OF MODEL
HIGH PRESSURE C O R E SPRAY SYSTEM ( H P C S )LOW PRESSURE C O R E SPRAY SYSTEM ( L P C S )L O H PRESSURE C O O L A K T INJECTION S Y S T E M ( L P C I )REACTOR CORE I S O L A T I O N COOLING S Y S T E M ( L P C I )AUTOMATIC D E S S P R E S S U R I Z A T I O K S Y S T E M ( A D S )SUPPRESSION POOL COOLING SYSTEM ( S P C )SHUTDOWN C O O L I N G SYSTEM (SDC )CONTAINMENT S P R A Y COOLING S Y S T E M ( C S C )CONDENSATE S Y S T E M ( C O N D )FIREWATER SYSTEM ( F I R E )STANDBY LIQUID CONTROL (SLC)PRIMARY C O N T A I N M E N T VENTING S Y S T E M ( P C T S )(NSULPCI)NUCLEAR SERVICE W A T E R CROSS T I E W I T H L P C IAC POWER SYSTEM ( A C )DC POWER SYSTEM ( D C )HEATING, V E N T I L A T ION I. AIR CO N D I T I 0 N I N GSYSTEM (HVAC)NUCLEAR SERVICE W A T E R (NSW)NUCLEAR CLOSED C O O L I N G WATER ( N C C W )REACTOR P R O T E C T I O N SYSTEM ( R P S )POWER CONVERSI ON SYSTEM (PCS)STEAM S U P P R E S S I O N SYSTEM <SV)
D E T A I L E D F A U L T TREED E T A I L E D F A U L T TREED E T A I L E D F A U L T TREED E T A I L E D F A U L T TREES I M P L I F I E D F A U L T TREED E T A I L E D F A U L T TREED E T A I L E D F A U L T TREED E T A I L E D F A U L T TREEB O O L E A N E X P R E S S I O ND E T A I L E D F A U L T TREE
D E T A I L E D F A U L T TREED E T A I L E D F A U L T TREE
D E T A I L E D F A U L T TREED E T A I L E D F A U L T TREED E T A I L E D F A U L T TREED E T A I L E D F A U L T TREE
D E T A I L E D F A U L T TREED E T A I L E D F A U L T TREEG E N E R I C D A T AG E N E R I C D A T AG E N E R I C D A T A
4. CORE VULNERABLE SEQUENCES EVALUATION
Those accident sequences where core cooling is working butthe containment heat removal has failed are the so called "corevulnerable" sequences. The failure of the containment heat removalfunction results in the heat up and pressurization of the primarycontainment. Containment venting or failure can occur and steammay be release into reactor building and subsequently in to theturbine building. Boolean equation were constructed for theemergency systems in order to evaluate the survival probability ofsystems to harsh environment due to steam release. These equationswere constructed by examining the systems cut sets with supportsystems attached, and identifying the dominant cut sets whichinclude those components that could fail to remain operating, for
example, motor operated pumps that fail to run, motor valves thatfail to remain closed or open, and some associated electricalcomponents. These equations can be used to evaluate the survivalof the systems to harsh environment due to containment vented,rupture or leaked. The table III shows the containment failuresprobabilities, these generic values have been taken of plant whitsimilar design.
TABLE III
CONTAINMENT FAILURE PROBABILITIES
WET WELL LEAKAGE ABOVE WATERWET WELL LEAKAGE BELOW WATERDRY WELL LEAKAGEDRY WELL HEAD LEAKAGEWET WELL RUPTURE ABOUT WATERWET WELL RUPTURE BELOW WATERDRY WELL RUPTUREDRY WELL HEAD RUPTURELEAK TO REFUELING FLOORLEAK TO REACTOR BUILDINGLEAK IN THE CONTAINMENTRUPTURE IN THE REFUELING FLOORRUTPURE IN THE REACTOR BUILDINGRUPTURE IN THE CONTAINMENT
PROBABILITY(WWLAW) 0.1094(WWLBW) 0.0156(DWL) 0.0746(DWHL) 0.5487(WWRAW) 0.1111(WWRBW) 0.0105(DWR) 0.0858(DWHR) 0.0442(LEAKTORF)* 0.5487(LEAKTORB)* 0.1996(LEAK)* 0.7484(RUPTURETORF)* 0.0442(RUPTURETORB)* 0.2074(RUPTURE)* 0.2515
* THESE VALUES ARE OBTAINED BY THE FOLLOWING RELATIONS.LEAKTORF = DWHLLEAKTORB = WWLAW + WWLBW + BWLLEAK = LEAKTORF/LEAK OR LEAKTORB/LEAKRUPTURETORF = DWHRRUPTURETORB = WWRAW + WWRBW + DWRRUPTURE = RUPTURETORF/RUPTURE OR RUPTURETORB/RUPTURE

In order to estimate the probability of each term in theboolean equation it is necessary to generate a set of possibleenvironments at the reactor building, calculating the peak andaverage temperature in each room, containing the equipment subjectto harsh environment for scenarios involving containment venting,rupture and leaked. With the temperature calculated using areactor building model, for example with MELCOR code, and makinguse of expert judgment it is possible to determine the failureprobability to remaining operating for equipment such as motorpumps, motor valves and associated electric components.
At the present time, we do not have the possibility to use areactor building model, so we make use of some results for a plantwith similar design for the estimation of the probability of eachterm in the boolean equation.
LPCIA-SUR = AMP01AFR-SUR + AT0004FR-SUR + EFN01AFR-SUR +MTR4A1FR-SUR + ECC01AFR-SUR + NBU125FR-SUR +NBUOC5FR-SUR + NBUB32FR-SUR .
LPCIB-SUR = BMP01BFR-SUR + BT0004FR-SUR + EFN01BFR-SUR +PBO1B1FR-SUR -H PTR4B1FR-SUR + ECC01BFR-SUR +QBUB26FR-SUR + QBÜB26FR-SUR 4- QBU125FR-SUR +QBUOC6FR-SUR .
LPCIC-SUR = CMP01CFR-SUR + CT0004FR-SUR + EFN01CFR-SUR +PBU1B1FR-SUR + PTR4B1FR-SUR + ECC01CFR-SUR +QBU125FR-SUR + QBUB26FR-SUR + QBUB06FR-SUR .
FOR RUPTURE:
The boolean equations for the core cooling systems are thefollowing:
FOR VENTING:
HPCS-SUR = KMP004FR-SUR + HMP001FR-SUR + EFN002FR-SUR +HT0089FR-SUR + HT0077FR-SUR + SBU1C1FR-SUR +STR4C1FR-SUR + ECC002FR-SUR + TBUB18FR-SUR +TBU125FR-SUR .
RCIC-SUR = RTP001FR-SUR + RCR600FR-SUR + MTR4A1FR-SUR +ECC004FR-SUR + NBU125FR-SUR + XBU250FR-SUR +NBUB30FR-SUR + NBU110FR-SUR + NBUOC5FR-SUR +NMC125FR-SUR .
LPCS-SUR = LMP001FR-SUR + EFN003FR-SUR + LT0061FR-SUR +LT0061FR-SUR + MTR4A1FR-SUR + ECC003FR-SUR +NBU065FR-SUR + NBU125FR-SUR + NBUB32FR-SUR .
HPCS-SÜR-RUP =RCIC-SUR-RUP =LPCS-SUR-RUP =LPCIA-SUR-RUP =LPCIB-SUR-SUP =LPCIC-SUR-SUP =
(HPCS-SUR)(RCIC-SUR)(LPCS-SUR)(LPCIA-SUR)(LPCIB-SUR)(LPCIC-SUR)
* RUPTURETRB* RUPTURETRB* RUPTURETRB* RUPTURETRB* RUPTURETRB* RUPTURETRB
FOR LEAK:
HPCS-SUR-LEAK =RCIC-SUR-LEAK =LPCS-SUR-LEAK =LPCIA-SUR-LEAK =LPCIB-SUR-LEAK =LPCIC-SUR-LEAK =
(HPCS-SUR) * LEAKTRB(RCIC-SUR) * LEAKTRB(LPCS-SUR) * LEAKTRB(LPCIA-SUR) * LEAKTRB(LPCIB-SUR) * LEAKTRB(LPCIC-SUR) * LEAKTRB

110 5. APPLICATIONS AND INTERFACE BETWEEN PSA LEVEL 1 AND LEVEL 2
In recent years a number of countries have successfully beenusing the PSA as a tool that provides guidance to safety relateddecision-making. As we know plant specific test and maintenanceschedule, human errors and common cause failure are considered inthe probabilistic models, therefore, the PSA can be applied inmany areas.
Among future applications for the Internal Events Analysisfor LVNPP are a review of the technical specification (TS) . The TSare mostly based in deterministic analysis and engineeringjudgment. The experience has indicated operational and safetyconcerns with some of these requirements. Some elements of theserequirements may be considered unnecessary or may not be conduciveto the safety of the plant.
Other applications for the study will be the risk management.The Internal Event Analysis for LVNPP will provide an integratedframework effective in the evaluating the efficacy of current riskmanagement practices at Laguna Verde. These practices includehardware improvements already made and operating procedures inplace. The study also allows the treatment and evaluation offuture risk management strategies.
Is important remark the the Internal Event for LVNPP willprovide the initial conditions for the subsequent containmentresponse analysis through the definition and evaluation of theplant damage state. The methodology used in the development of theevent trees for Laguna Verde provide enough information of thestatus of the systems in order to properly define the interface ofthe PRA level 1 and level 2. The interface between the front-endanalysis and back-end analysis is performed by grouping of theaccident sequences cut sets that have similar characteristics suchas vessel pressure, timing and systems availability, thus, thesame containment response and radiological consequences areexpected [6]. In order to perform the grouping, the back-endanalysis develop questions about systems and physical parameters
at the onset of core damage. The questions address certainback-end concerns, for instance, coolant make up, releases andretention.
The accident progression analysis starts with informationreceived from the accident frequency analysis (level 1). Theresults of the accident progressions analysis are passed to thesource term analysis (level 2) , and consequences analysis (level3) , so it is very important to employ the most appropriatemethodology to assure that the information and results from oneanalysis clarity are received in the next stage.
6. CONCLUSIONS
One of the main purposes of the Internal Event Analysis forLVNPP is to provide the initial conditions for the subsequentcontainment response analysis. In order to fulfill the above, theaccident sequences are followed until the end state is resolvedinto no core damage or core damage. It is important to remark,that we can not warranty the functioning of the systems subject toharsh environment, so, it is necessary to determine the failureprobability of the equipment in order to resolve the accidentsequences in all the way to the core damage. In this paper wepresented one way to resolve the core vulnerable sequences. Theevent trees for LVNPP include the feedback effects on the coreheat removal systems as result of the containment phenomenology inorder to predict if core damage will occur given failure of thecontainment heat removal systems and the subsequent containmentphenomenology.
The above expansion at the event tree level provides in anatural way all the necessary information to define the interfacebetween the front-end analysis and the back-end analysis, andalso provides an integrated framework to perform PRA applicationssuch as risk management, evaluation of plant technicalspecifications and limiting conditions of operations,prioritization of inspection/testing activities, evaluation ofoperating experience, so on and so for.

REFERENCES
[1] Huerta Alejandro, et. al. "Anâlisis de Eventos Internes parala Central Nucleoeléctrica de Laguna Verde", ComisionNacional de Seguridad Nuclear y Salvaguardias, Mexico, to bepublished.
[2] U.S. Nuclear Regulatory Commission, "Severe Accident Risk: AnAssessment for five U.S. Nuclear Power Plant", Final Report,NUREG-1150, January 1991.
[3] Laguna Verde Power Plant Station Final Safety AnalysisReport, Comision Federal de Electricidad, Mexico, 1989.
[4] Worrell R. B., "SETS Reference Manual", NUREG/CR-4213,SAND-2675, Sandia National Laboratories, Albuquerque NM, May1985.
[5] Iman R. L. and Shortencarier M. J., "A user guide for the TopEvent Matrix Analysis Code (TEMAC)", NUREG/CR-5498,SAND86-0960, Sandia National Laboratories, Albuquerque NM,August 1986.
[6] Payne A. C. et. al. "Evaluation of Severe Accident Risk:Peach Bottom, unit 2 ", NUREG/CR-4551, Vol 4, SAND86-1309,Sandia National Laboratories, Albuquerque NM, December 1990.
119
RELATIONSHIP BETWEENSAFETY CULTURE AND PSA
V. JOKSIMOVICHAccident Prevention Group,San Diego, California,United States of America
Abstract
A primary focus of nuclear safety is prevention of large releases of radioactivity in the case of lowprobability severe accidents. An analysis of the anatomy of nuclear (Chemobyl, TMI-2) and non-nuclear(Challenger, Bhopal, Piper Alpha, etc.) severe accidents yields four broad categories of root causes, or 4M(abbreviated 4M): man (operating crew response), machine (design with its basic flaws), media (naturalphenomena, operational considerations, political environment, commercial pressures, etc.) providingtriggering events and management (basic organization safety culture flaws). A strong management canminimize contributions of man, machine and media to the risk arising from operation of hazardousfacilities. One way management can have powerful positive influence is through the establishment of aproper safety culture. Hie term safety culture is defined by virtue of employing IAEA's InternationalSafety Advisory Group (INSAG) and APG's (arrived through work sponsored by the Nuclear RegulatoryCommission) definitions. An example of U.S. Nuclear Utility safety culture is discussed. Like any otherhuman endeavor, the manner in which people act is conditioned by requirements set at a top level, i.e.,CEO. Policies promoted at the CEO level create the working environment and condition behavior ofindividuals in the trenches. A summary of the safety culture initiatives within the nuclear utilityillustrates commitment to the safety culture. Other powerful examples are the existence of independentsafety oversight or risk group directly reported to the CEO and a requirement for submittal of annualnuclear safety assurance reports. The paper concludes by virtue of claiming that an integrated riskmanagement program imbedded in an effective safety culture will lead management of a nuclear utility toachieve both economic and safety goals while reducing strain on management personnel and operatingbudgets, primarily through an effective integration process.
INTRODUCTION
As a prelude, in setting the stage, it seems appropriate to convey two fundamental APGmessages arising from some rétrospective examinations; one dealing with the state-of-the-art innuclear safety and the other dealing with lessons learned from analyses of catastrophic accidents.APG's fundamental message regarding the state-of-the-art in nuclear safety is:
• There is enough hardware in existing Western plants (the failure at TMI was notso much with hardware, as with how the hardware was used).
• The plants are well designed against natural phenomena, such as earthquakes.
• Fire protection standards are adequate in the aftermath of Browns Ferry fire.
• Since TMI accident, readiness of operating crews to handle complex accidentscenarios has been greatly enhanced, although more needs to be done.

120 • The issue remaining is that of Safety Culture (the last frontier in nuclear powerplant safety).
• Globally, in the case of Eastern Europe, the issue is how to build a safety culture.For the U.S., Western Europe and Japan, the issue is how to maintain andenhance the existing culture.
Accidents do not "just happen", but are multi-causal or composite events. They are notacts of God, but acts of people, consisting of actions, decisions or omissions. Because they areacts of people, accidents are highly preventable.. Virtually every major accident had a precursorwhich should have alerted the responsible parties not only with regard to the potential forrecurrence, but also that the consequences may become much more serious, e.g., the Davis-Bessc incident in 1978 served as a precursor for TMI-2 accident.
Analyses of catastrophic accidents (such as Chemobyl, Bhopal, Challenger, AmocoCadiz, Piper Alpha, and Exxon Valdez) have been performed by several (e.g., papers byCamino, Zebroski, Joksimovich presented in Risk Management [1], A.M. Jenkins, et al. [2]).By and large, the analyses led to similar conclusions regarding the accident anatomy. APG Ükesto classify contributions of causes to catastrophic accidents in four broad categories, abbreviatedas "4M":
• Man (operating crew response),• Machine (design with its basic flaws),• Milieux (natural phenomena, operational considerations, political environment,
commercial pressures, etc,) providing triggering events, and• Management (basic organizational safety culture flaws).
The "Man" category to a lesser extent, and "Management" to a greater degree, playeddominant roles in all of the above mentioned accidents. Some salient organizational ingredientswere: lack of accident analyses, lack of risk analyses, lack of accident procedures, lack oftraining, procedure violations, operator errors, no operating experience feedback, no accidentmanagement training, no emergency planning, etc.
A strong management can minimize contributions of man, machine and milieux to therisk arising from operation of hazardous facilities. One way management can have this powerfulpositive influence is through the establishment of a proper safety culture.
NUCLEAR SAFETY CULTURE
IAEA's International Safety Advisory Group (INSAG) has used the term "Safety Culture"prolifically in its summary report related to the post-accident review meeting on the Chemobylaccident published as INSAG-1 in 1986 [3]. It was further expanded in INSAG-3 issued in 1988[4]. Safety culture was highlighted as a fundamental management principle. In 1991 the agencyissued the report titled "Safety Culture" (INSAG-4) [5] intended for use by governmentauthorities and by the nuclear industry and its supporting organizations.
INSAG-4 offers the following definition: "Safety culture is that assembly ofcharacteristics and attitudes in organizations and individuals which establishes that, as anoverriding priority, nuclear plant safety issues receive the attention warranted by theirsignificance". INSAG considers that safety culture has two major components: frameworkcreated within which the individuals work and the attitude and response of individuals.Recently, with APG participation, IAEA issued guidelines when conducting an ASCOT(Assessment of Safety Culture in Organizations Team) mission.
The U.S. Nuclear Regulatory Commission (NRC) has an ongoing comprehensiveprogram in human factors [6]. One area of research is directed towards assessing the influenceof organizational factors (OFs) and management on nuclear power plant performance. APG wascontracted in the Fall of 1990.
APG's research [7] corroborates the IAEA definition; however, our research leads us toconclude that safety culture is a product of a larger concept of organizational culture. Whatdetermines an organizational culture is a unique blend of policies, values, attitudes, practices,myths, history, self-image, which simply becomes: "the way things are done" or the "waybusiness is conducted" in a particular organization. What differentiates most one organizationfrom another is organizational culture and ability to permeate this culture down through thewhole organization. Our research leads us, amongst other things, to conclude the following:
• Safety culture is predicated on a composite of key individuals which make up anuclear utility organization.
• Within a nuclear utility there exist organizational and individual variables whichinteract to produce safe or, in an extreme case, accident-prone plant operation.
• External influences (i.e., Nuclear Regulatory Commission, Institute of NuclearPower Operations, Public Utility Commissions, business climate and publicrelations policies) shape heavily utility corporate policies, thus as an end result,provide a powerful determinant of employee actions and management/employeerelationships.
While no one openly disputes that nuclear safety issues should receive "overridingpriority", it still remains a challenge to persuade some executives in the nuclear industryregarding how their actions or lack thereof influence performance at the plant and corporatelevel. Thirteen years of fundamentally accident-free operation in the U.S. seems to be creatingcomplacency in some segments of the industry. As J.L. Nicolet [8] points out, men are verypoor at estimating risk, even those aware of accidents that have befallen others believe it cannothappen to them or that the probability is too low to worry about. This applies not only totechnical in-plant personnel, but even more so to the management decision makers. Another,and perhaps more significant, reason for organizational attitudes toward prioritization of safetyis that the feedback from the corporation for achieving production goals is positive, tangible andreinforcing, while feedback from achieving safety goals appears to be somehow expected.

121
While in the past, primary reliance was placed upon engineered fission product transportbarriers, i.e. fuel cladding, primary coolant system and containment, it is perceived that thesafety culture is now probably the most effective barrier against releases of radioactivity.
A U.S. UTILITY'S SAFETY CULTURE
Safety culture, being pan of the organizational culture within a utility can be brokendown into corporate culture, nuclear operations culture, nuclear plant culture and employeeattitudes. In the case of a strictly nuclear utility, corporate culture and nuclear operations cultureare one and the same. This is of fundamental.importance because there is no screen betweenthe two.
In any human endeavor the manner in which people act is conditioned by requirementsset at a top level, i.e., Chief Executive Officer (CEO). Policies promoted at a CEO level createthe working environment and condition behavior of individuals in the trenches. A safety policystatement can declare a commitment and constant focus to excellent performance in all areasimportant for nuclear safety, making it abundantly clear to all employees that nuclear safety hasthe utmost priority, overriding if necessary the demands of production and schedules.
An effective way of communicating the CEO's message is via clearly defining thecompany's mission/objectives/core values and maintaining consistent emphasis on safety as thehighest priority, and remaining constant and unchanging with time. The set of core valuesconsisting of, say, the following components: integrity and trust, respect for nuclear technology,accountability, teamwork, cost effectiveness, respect for the individual and excellence, clearlydemonstrate publicly asserted commitments and stance of corporate management in relation tothe social responsibilities and willingness to be open in nuclear safety matters.
In addition to ensuring that reward system stresses safely, procuring sufficient fundingfor all safety related tasks such as necessary equipment, facilities, supportive technicalinfrastructure and creating the work environment conducive to the effective performance ofsafety duties, the CEO needs to explicitly endorse and be active in various safety cultureinitiatives.
Powerful examples of a commitment to nuclear safety are the existence of an independentsafety oversight or risk management group directly reporting to the CEO, and a requirement forsubmittal of annual nuclear safety assurance reports. Such a report typically consists of threeparts:
1) Nuclear safety performance indicators,2) Each corporate division's assessment of operations, including organization,
people, design configuration, operational features, operating experience andhuman performance.
3) Independent safety oversight group assessment of the affairs and scrutiny ofdivision reports from the standpoint of both positive and negative trends, coupledwith their assessment of plant and corporate performance from a human,equipment and organizational perspective.
EVOLUTION OF PSA
Pioneering contributions in the late 'Sixties and large generic studies conducted in the'Seventies (e.g., Wash-1400, AIPA, DRS)[9] focused primarily on modeling and quantificationof the plant hardware configurations aspects. This could be characterized as Phase I, or themachine phase in the evolution of PSA. AIPA study led the field in realistic modeling of HTGRsevere accidents.
A profound impact of dependent failures, and in particular major common cause initiatorssuch as earthquakes and fires, was recognized but not adequately dealt with until Phase II, orthe milieux phase in the evolution of PSA, which took place primarily in the early 'Eighties,(e.g., Shoreham Study [10]). Realistic modeling of LWR degraded core accidents wasaccomplished in this phase as well.
A second profound innovation was explicit modeling of operating crew actions in accidentsequences. This was primarily accomplished in the decade of the 'Eighties and constitutes thePhase ffl, Human Reliability or the man phase, in the evolution of PSA.
Human reliability is a complex subject, which does not lend itself to relativelystraightforward models like those for component and system reliability. Typically, everyaccident sequence consists of an initiating event, plant hardware response(s) and human action(s)required to terminate a sequence. In order to perform a credible HRA, one needs hard data onhuman contributions to the frequency of initiating events, plant system unavailabilities andoperating crew responses to a spectrum of accident scenarios. For the first two items sufficientstatistical information is typically available, while the data and insights on operating crewresponses can only be obtained through simulator exercises. The ORE (Operator ReliabilityExperiments) project [11], jointly sponsored by EPRI and six U.S. nuclear utilities, and executedby APG, NUS and General Physics, collected data at six full-scope control room simulators.The project encompassed simulation of 43 plant-specific accident scenarios, involved 93operating crews, focused on 117 human interactions, and resulted in more than 1,000 datapoints. Subsequently, EPRI sponsored development of an application of ORE methodology forplant-specific PSAs or IPEs [12].
In order to facilitate simulator data collection, a tool named OPERAS (OperatorReliability Assessment System)[13], was developed. OPERAS represents automation of the OREproject developed simulator data collection and interpretation methodology. It should be notedthat in parallel, a tool named COP AS was developed at the PAKS training center in Hungary,showing a commonality of need. COPAS is currently being used for operating crew datacollection responding to WER 440 model 213 accident scenarios.
Phase IV, or the management phase, in the evolution of PSA is underway, with the NRC-sponsored research into organizational factors currently leading the field. Figure 1 illustrateshow organization factors (OFs) connect to PSA and HRA analyses. The left-hand portion of thechart represents the areas where organizational factors (behavioral science) come into play in thecomplex interactions of organizational units and people (organizational variables and individualvariables). External influences of regulatory pressures and business climate on a nuclear utility
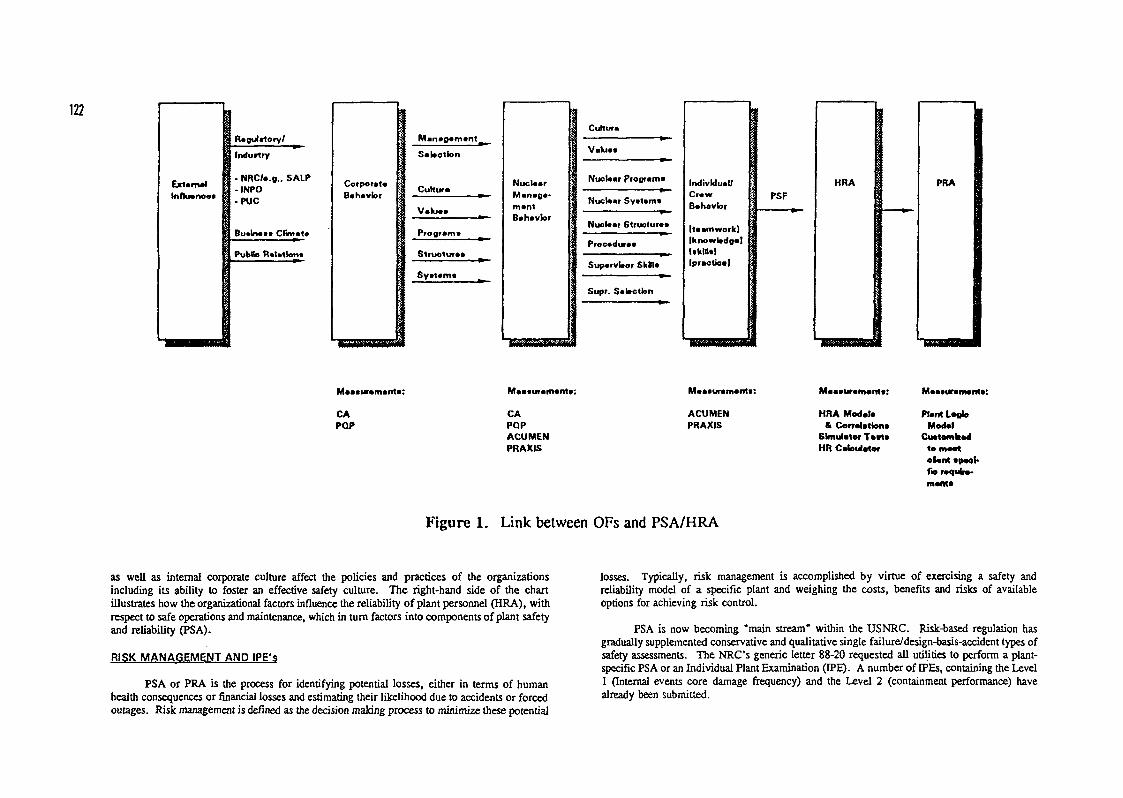
122
Extern«!Influença«
Regulatory/
Industry
- NRC/a.g., SKLf-INPO-PUC
Business Climat*
Pubfto Relation«
Corporal«Behavior
Management ib^
Selection
Culture
Vekie«
Program«
Structurée
Sy«t«m«
NuclearManage-mentBehavior
Culture
Vekie«
Nuclear Program«
Nuclear Sy«t«m«
Nuoleer Structurée
Procedure«
Supervisor Skll»
Supr. Selection
Individual/CrawBehavior
(teamwork)Iknowbdga]
(practice)
PSFHRA
WMNWHmHpjNpjwaipK MalalelHIttlslsivlMl
PRA
M«««uram«nta:
CAPOP
Measurement«:
CAPOPACUMENPRAXIS
Measurement«:
ACUMENPRAXIS
Measurement«:
HRA Modal«& Correlation«
Simulator TestsHR CeJouiafor
Measurement«:
Plant LogJoModal
Cuatamfctaalto m*at«tent «p*or-fio rmant*
Figure 1. Link between OFs and PSA/HRA
as well as internal corporate culture affect the policies and practices of the organizationsincluding its ability to foster an effective safety culture. The right-hand side of the chartillustrates how the organizational factors influence the reliability of plant personnel (HRA), withrespect to safe operations and maintenance, which in turn factors into components of plant safetyand reliability (PSA).
RISK MANAGEMENT AND IPE's
PSA or PRA is the process for identifying potential losses, either in terms of humanhealth consequences or financial losses and estimating their likelihood due to accidents or forcedoutages. Risk management is defined as the decision making process to minimize these potential
losses. Typically, risk management is accomplished by virtue of exercising a safety andreliability model of a specific plant and weighing the costs, benefits and risks of availableoptions for achieving risk control.
PSA is now becoming "main stream" within the USNRC. Risk-based regulation hasgradually supplemented conservative and qualitative single failure/design-basis-accident types ofsafety assessments. The NRC's generic letter 88-20 requested all utilities to perform a plant-specific PSA or an Individual Plant Examination (IPE). A number of IPEs, containing the Level1 (Internal events core damage frequency) and the Level 2 (containment performance) havealready been submitted.

123
Conduct of PSAs/IPEs, and living ones in particular, relies heavily on the existence ofefficient computer tools. Advances in the field of personal computers have led to thedevelopment of PSA workstations [14] which have been used invariably in the IPE process. Asan example, EPRI, Texas Utilities and APG sponsored development of a Human ReliabilityCalculator [15] for inclusion into the workstations such as CAFTA [16]. TU Electric has notonly applied the EPRI-sponsored HRA methodology, but has made full use of the Calculator inthe development of the Comanche Peak D?E just submitted to the NRC.
Nuclear utilities appear to be mixed in their views on the usefulness of PSA as a riskmanagement tool. Enlightened utilities find many practical uses of PSA and have developed riskmanagement programs. To our knowledge, Yankee Atomic has probably the most advancedprogram in the industry [17]. The referenced report was written to describe numerousapplications of PSA techniques beyond those typically found in PSAs/IPEs as a sample ofbenefits. A striking example is its use in closure of NRC's severe accident policy issues, i.e.,IPE, IPE for External Events (IPEEE), Containment Performance Improvements (CPI) andAccident Management (AM). The report concludes with the following statement: "By pursuinga proactive program in risk assessment, a utility can influence the NRC process for issueresolution. By proposing an integrated solution that meets the intent of the NRC's multi-elementprogram, a utility may be able to avoid need for costly responses to the individual elements".
Some utilities seem to be performing IPEs purely as a licensing necessity. As aconsequence, IPEs are not being used as a powerful risk management tool to ferret out not onlypotential plant configuration vulnerabilities, but also to address the operational issues. Some ofthese IPEs end up modeling the plant configuration adequately, leading to proper identificationof plant hardware vulnerabilities, but do not adequately account for the plant operational history.Nor do they account for the actual measured readiness of plant specific operating crews tohandle analyzed accident scenarios. The treatment of human reliability by "handbook"methodology fails to capture actual operating crew performance.
INTEGRATED RISK MANAGEMENT
Risk management process is incomplete unless it accounts for organizational factors;therefore APG has developed the concept of Integrated Risk Management (IRM). It representsa fusing of 1) engineering technology including a) probabilistic risk assessment (PRA) and itssub-discipline of human reliability analysis (HRA) and associated engineering disciplines ofreliability, availability and maintainability and b) nuclear power operations, maintenance andengineering support with 2) the science of organizational factors which embraces elements ofmodern management theory and behavioral science. Figure 1 represents the framework forIRM.
Once properly identified, incorporating organizational influences into PSA as a categoryis relatively straightforward! On examination of constituents of core damage sequences, onenotes cutsets made up of: a) initiating event frequency and one or more of terms representinga) unavailability of hardware and b) reliability of various human actions. Since an NPP isoperated and maintained by humans who are influenced by the organization for which they work,good or bad organizational factors should be represented in the quantification of each term in
the sequence cutsets. Similar to the treatment of "performance shaping factors" in HRA or"environmental factors" in reliability engineering, organizational influences may be treated asmultiplicative factors for each cutset term, e.g., on equipment failure rates and human failurerates. However, a very important aspect of treating organizational influences is theirimportance as common-cause factors; i.e., a given organizational influence may adversely affectseveral terms in the same or other cutsets.
The difficult part of the analysis is to a) identify the specific organizational factors that havesignificant influence on the various cutset events and their interdependence and b) quantify theeffect of each factor on cutset probabilities. For example, APG is pursuing research to extractfactors for organizational influences on operator reliability i.e., operator reliability factors fromsimulator measurements at various NPPs can be correlated to measures of organizational factors(based on suitable instruments of behavioral and management sciences) to derive the appropriatefactors.
There are several programs in effect at every nuclear utility that have a direct or indirectinfluence on plant safety and productivity. Several of the programs are the result of regulatoryimperatives and others are the result of "good practice". Our experience in working with manynuclear utilities is that there is a tremendous degree of fragmentation among such programs witha lack of appreciation of the interrelation of one program to the other, especially with respectto nuclear safety. A good example being a lack of integration between PSA, human factors andtraining activities. In our strong view, the IRM concept represents the best safety assuranceprogram the contemporary state-of-the-art risk assessment technology provides. An IRMprogram imbedded in an effective safety culture, will lead management to achieve both economicand safety goals while reducing strain on management personnel and operating budgets primarilythrough an effective integration process.
ACKNOWLEDGEMENT
The author wishes to acknowledge the contributions of his colleagues at APG; DougOrvis and Tony Spurgin, in particular.
REFERENCES
[1] Ronald A. Knief, Editor, Risk Management: Expanding Horizons in Nuclear Power andOther Industries. Symposium of September 6th, 1989, sponsored by GPU NuclearCorporation, Hemisphere Publishing Corporation, New York, 1991.
[2] A.M. Jenkins, et al., Management at Risk. RDA-R3, 1992.
[3] International Nuclear Safety Advisory Group, Summary Report on the Post-AccidentReview Meeting on the Chernobvl Accident. Safety Series No. 75-INSAG-l, IAEA,Vienna, 1986.
[4] International Nuclear Safety Advisory Group, Basic Safety Principles for Nuclear PowerPlants. Safety Series No. 75-INSAG-3, IAEA, Vienna, 1988.
124 PI International Nuclear Safety Advisory Group, Safety Culture. Safety Series No. 75-INSAG-4, IAEA, Vienna, 1951
[6] F. Coffman, et al., Human Factors Regulatory Research Program Plan. NUREG-1384,U.S. Nuclear Regulatory Commission, Washington, D.C., 1989.
[7] V. Joksimovich, P. Moieni and D. Orvis, Organizational and Management Influences onSafety of Nuclear Power Plants: Modeling Hypotheses Using PRA Techniques, U.S.Nuclear Regulatory Commission, Draft NUREG/CR-5752, 1991
[8] A. Camino, J.L. Nicolet and J.C. Wanner, Man and Risks: Technological and HumanRisk Prevention. Marcel Dekker, Inc., New York, 1990.
[9] V. Joksimovich, "An Overview of Insights Gained and Lessons Learned From U.S.Plant-Specific PRA Studies" Nuclear Safety, Volume 27, No. 1, Jan-March, 1986.
[10] V. Joksimovich, R. Paccioni, "Overview of Results and Perspectives From ShorehamMajor Common Cause Initiating Events Study", ANS/ENS Topical Meeting on NuclearReactor Safety. San Diego, 1986.
[11] A.J. Spurgin, et.al., Operator Reliability Approach Using Power Plant Simulators,Volumes 1, 2 and 3, EPRI NP-6937 and NP-6937L, Electric Power Research Institute,1990 and 1991.
[12] A.J. Spurgin, P. Moieni, and G.W. Parry, A Human Reliability Approach UsingMeasurements for Individual Plant Examinations. EPRI NP-6560L, Electric PowerResearch Institute, 1989.
[13] A.J. Spurgin, J. Hallam and J.P. Spurgin, Operator Reliability Assessment System(OPERAS). Volumes 1, 2, and 3, EPRI RP-3082-01, Electric Power Research Institute,1992.
[14] "The Role and Use of Personal Computers in Probabilistic Safety Assessment andDecision Making", Journal of Reliability Engineering or Systems Safety. Volume 30,Nos. 1-3, 1990.
[15] P. Moieni, et.al., "A PC-Based Human Reliability Analysis (HRA) Calculator", preparedfor American Nuclear Society Probabilistic Safety Assessment International TopicalMeeting. PSA '93. Clearwater, Florida, January 26-29, 1993.
[16] Science Applications International Corporation, CAFTA: A Fault Tree DevelopmentWork Station. Los Altos, CA 9189.
[17] Yankee Atomic Electric Company, "Applications of Probabilistic Risk Assessment",Electric Power Research Institute, NP-7315, 1991.
RESEARCH ACTIVITIES FORPROBABILISTIC SAFETY ASSESSMENT AT THEKOREA ATOMIC ENERGY RESEARCH INSTITUTE
Kil-Yoo KIM, Chang K. PARKReactor Safety Assessment Department,Korea Atomic Energy Research Institute,Daeduk, Republic of Korea
Abstract
In Korea Atomic Energy Research Institute (KAERI), there are two kinds of activities inprobabilistic safety assessment (PSA) area. One of them is PSA for Nuclear Power Plants(NPPs). Several Probabilistic Safety Assessments (PSAs) for NPPs under construction or inoperation are carried out. The other activity is PSA methodology development. In this paper, thePSA methodology development activity is mainly introduced, especially for Level-1 PSA.
1. INTRODUCTION
In KAERI, there are two kinds of activities in PSA area. One of them is PSA for NuclearPower Plants NPPs. Several PSAs for NPPs under construction or in operation are carried out,and more PSA projects for new NPPs and for the remaining plants in operation will continue.There are two major organizations which can perform PSA for NPPs in Korea which are KAERIand KOPEC (Korea Power Engineering Company). Each organiztion specialized in differentfield. For example, KAERI is performing internal Level I PSA and most part of Level U. On theother hand, KOPEC is performing external Level I PSA.
The other activity of KAERI is PSA methodology development, which again can be classified asPSA tool development and PSA technique application. As a PSA tool development, KIRAP-IIcomputer code was developed. As PSA technique applications, PEPSI, ROMAS and COSMOSwere developed. In the following sections, those computer codes are described. Also, futureresearch areas which KAERI is going to study are described.
2. PSA for NPPs
KAERI has finished or is performing several PSAs for NPPs. Table 1 is a list of PSA projects inwhich KAERI is involved. In Table 1, PSA for Wolsung 3,4 is not mentioned, but the projectwill start next year. In every PSA project, KAERI always uses KIRAP code for level I PSA.

Table l. List of PS A Projects Performed by KAERI
PLANT NAME
Kon 3.4 &Yonggwang 1,2
Yonggwang 3,4
Wolsung 2
Ulchin 3.4
PERIOD
'89.9 - '92.8
'87.8 - '89.3'90.7 - '92.12
•9 1.4 -'94.2
'91 4 -'95.3
'91.7 -'97.10
SCOPE
Level I
Level ILevel I
Level H
Level I
Level I, II
REMARK
Indep't Peer Review
PreliminaryFinal
IPE
AECL/KAER1
KAERI
125
3. KIRAP-n
A PC-based Level-1 PS A Code Package, KIRAP-n (KAERI Integrated Reliability AnalysisCode Package H), was developed and is used in PSAs for NPPs. KIRAP-II provides functionsthat range from graphical fault tree and event tree construction to cut set generation andquantification. It also can do importance, uncertainty and sensitivity analyses.
KIRAP-n consists of two parts. One is KIRAP-I and the other is reliability data analysispan. As shown in Figure 1, KIRAP-I consists of 7 independent computer codes : namelyKERAP-TREE (fault tree editor), KBRAP-ET (event tree editor), KIRAP-TDBEDIT (event datamanager), KIRAP-CUT (cut set generator), KIRAP-UNCERT (uncertainty analysis module),and KIRAP-CONVERT (fault tree data conversion utility). Fault trees are constructedinteractively on a character-based graphic screen by using KIRAP-TREE. KIRAP-TREEgenerates the fault tree in the form of Boolean equations, which are stored in the CUT fileEvent trees are built interactively on a graphic screen using KIRAP-ET and Booleanequations for event sequences are stored on USR files. These files are automaticallytransferred to KIRAP-CUT or KIRAP-RESULT. KIRAP-TDBEDIT collects events data ofseveral system fault trees and build a total event data base. It supports reliability data forKIRAP-CUT, RESULT, and UNCERT codes Cut sets are generated using KIRAP-CUT orRESULT KIRAP-CUT runs in the batch mode like the old computer codes, and can run onIBM-PCs and workstations. KIRAP-CUT for workstations would be used to generate cut
sets for large fault trees and event sequences . KIRAP-RESULT can generate cut sets andedit cut sets in an interactive mode on PCs. Cut sets generated by KIRAP-CUT or KIRAP-RESULT are stored in files and can be reused in another run. Uncertainty analysis can bedone using KIRAP-UNCERT code. Fault trees and event trees can be plotted on HP-GLcompatible plotter or HP Laser Jet lu printer.
KIRAP-CUT/RESULT- Cut Set Generation- Importance Analysts- Sensittvtty Analysis
\KIRAP-UNCERT
UncertaintyAnalysts
Figure 1. Overview of KIRAP-U
The reliability data analysis pan consists of 3 programs HREP, PET-CCF, and KNRDSHREP (Human Reliability Evaluation Program) is developed to evaluate human errorprobabilities It provides simplicity in HRA (Human Reliability Analysis) and consistency inthe obtained results.
PET-CCF is developed to provide parameters of common cause failure (CCF) based on theMGL (Multiple Greek Letter) or the Alpha Factor model

KNRDS is developed to generate reliability data for Korean nuclear power plant (NPP). InKNRDS, the data analysis is performed by using Two-Stage Bayesian (TSB) procedure toincorporate the foreign generic data and similar plant's data. This KNRDS system is used toprovide hardware failure rates and initiating event frequencies reflecting Korean specificexperience.
The KIRAP-U will be modified to be used in X-Window and in MS- Window environment toprovide better user interface and to avoid memory limitation problem.
As a "living" PSA application tool for operation, a code, called PEPSI ( Probabilistic EvaluatedPlant Safety Indicator), was developed.
PEPSI can updates the plant risk continuously according to the change of system/componentconfiguration. As shown in Figure 2, whenever plant configuration changes, PEPSI re-evaluatethe plant risk based on the PSA results of a baseline plant configuration. And it shows new plantrisk relative to baseline risk level. The basic purpose of PEPSI is to help to identify the earlysignals of deteriorating plant safety and to trace relative changes of plant risk. In the case ofmultiple component outage, PEPSI suggests maintenance priorities according to the importanceof each component from the viewpoint of the plant safety.
PEPSI : Current Plant Safety bv KAERI S.CJaneRISK: 25.0 timesSTATUS : SAFE
MAINTENANCE PRIORITY :1) AFWS PUMP (TOP) 019C2) RHRS PUMP 024A3) SIS PUMP 091A
Type any key...
As a "living" PSA application tool for maintenance, a code, called ROMAS (Reliability OrientedMaintenance Advisory System) was developed. If a component is selected on a P & ID shownon a computer screen, and if an input such as "fail to start", or "fail to open", etc., is entered,then an increased core melt frequency shows up.
Actually, ROMAS is similar to PEPSI, since ROMAS was developed based on PEPSI. The bigdifferences between two are the user interface and the purpose of usage. In ROMAS, componentstatus can be inputted on the P&ID shown on the computer screen. Also, ROMAS is intended tobe used mainly in maintenance work. The other functions and concepts are borrowed fromPEPSI.
In ROMAS, the plant CDF is used as a measure for the plant risk level which is calculateddynamically from the present component reliability. The current risk level is calculated from theminimal cut sets (MCSs) with the consideration of the component status at that time. TheROMAS can also suggest the maintenance priorities for failed components so as to minimize therisk level. The overall structure of the ROMAS is shown in Figure 3 with the information flow.
Input(Knowledge Base)
Plant Information(System SuucturcWomvuion : P&ID)
PSA Results
Buic EventImportance]
MimnulCutSell
Ü
Main(Inference Engine)
IdentifyDowned/Compon
JwFailed;nts
Re-Calculate theCurrent RiskLTT-i
1Determine theMaintenancePriority
~-
--
Output(Conclusion)
f Disnliv the "\w Downed/Failed \\ Components with IV P&IDs. J
KDisplay the Current ARisk Level _J
K Display the Risk "\History J
' Display the \Maintenance 1Priority I
Figure 2 Display of Current Plant Safety Figure 3. Information Flow of ROMAS

127
Finally, the history of risk level change is stored as the proposed system is used for many timesThis history is also used to retrieve the plant operation experience, and this can help the operatorfor grasping the operating history ROMAS is written in PROLOG language and is built in aworkstation with color display
Since ROMAS is based on the change of component status, it can be used as a tool forindicating the current risk level and an advisory system for the nsk management and thecomponent maintenance policy In addition, it can be utilized for the study on flexible technicalspecification monitoring
COSMOS ( Computerized Success path Monitoring System) was developed by KAERF in orderto support emergency operation of nuclear power plants
COSMOS assists operators by providing the present status of critical safety functions (CSFs),and by suggesting necessary operator's action items to restore challenged CSFs COSMOSconsists of two pans one is to identify CSFs status and to determine the overall responsestrategy and the other to generate the success path which restores the challenged CSFs TheCSFs status is identified by the rule based reasoning The rules are derived from the CSFsStatus Tree provided m ERG's (Emergency Response Guidelines) The overall responsestrategy is inferred according to the identified CSFs status The knowledge base for this panis based on the analyzed results of FRG s (Functional Restoration Guidelines) The actionsof FRG s are classified and standardized according to their functions Based on the currentplant state, appropriate response actions are inferred.
Success paths are generated by the given structure descriptions and the general generationalgorithm The structure descriptions of systems are based on the piping and instrumentdiagrams (P&IDs) Generated success paths are ranked according to either us respectivereliability or the number of manual operator's actions required to complete each successpath A prototype COSMOS was built on a workstation
Tötest COSMOS, a hypothetical scenario is assumed for Loss of Secondary Heat SinkAt first, it is assumed that Loss of Secondary Heat Sink" occurs due to 'Loss of MainFeedwater, ' and then a CSF, i e , Heat Sink is assumed to be challenged The status of CSFsis displayed as shown in Figure 4 In this case, the level 1 acuon item, Establish
Secondary Heat Sink," and the level 2 action item with the highest priority, "EstablishAFW Flow" are inferred Hence, the auxiliary feedwater system (AFWS) is selected as anappropriate safety system for this situation Among the generated success paths, the mostoperable success path is displayed as shown in Figure 5, and all the operator's action items of thethree levels are also displayed
Preienl CSF« Sutni
Siibcnocality
Power Genenuon/ATWSLots of Core Shutdown
Integrity
Imminent FIS ConditionAnticipated PTS
Condition
CoreCoohnj
Inadequate Core CoolingDegraded Core CoolingSaturated Core Cooling
Contunmcm
High Cone PrejîtireCoot HoodingHigh Cont Rad Level
1////ffiPP//////* VxyiiMAÀUd KcA^âV/
S/G OvcrprewureS/G High LevelS/G Low Level
lavcaunyHi«h PRZR LevelLow PRZR LevelVoid> in Rx Vessel
HeuSink LOM of 2aduy Heit Sink
Figure 4 Display of CSFs status
Sifety System
AFWS
„,RÏ»« I
,Q .*-i
-«*•
lih-c-J M i- - i•i t -i n i &
Operators Action Item
Level 1Establish SecondaryHeat Sink
Level 2Establish AFW Flow
Level 3Open valve V030
Figure 5 Success path display for AFWS
128 The intended function by an initially selected level 2 action item may not be achieved due tovarious reasons. When a selected item cannot perform its function, an alternative level 2action item will be suggested. The status of CSFs can be changed by the actuated successpath(s). If the status of CSFs are still challenged, a new appropriate system is chosen. Forinstance, if it is confirmed that AFWS does not perform its function, then "Establish Bleed andFeed (PORV and HPSI)" will be suggested as an alternative level 2 action item by the rulesfor level 2 and a new set of success paths to complete this action item will be generated forthe respective safety systems.
7. FUTURE RESEARCH AREAS
From the next year, several new projects will begin. One of them is to develop a PSA tool usingartificial intelligence, which can automatically generate fault tree and event tree, and canmanage the whole PSA work to do a "living" PSA.
Another one is to develop an accident management expert system, which will be used to monitorand evaluate the status of the containment during a severe reactor accident The system will alsoprovide information on the time, rate, and magnitude of release of important radioactive isotopesgiven a loss of containment integrity.
IPAM(Integrated Plant Analysis and Management System) also will be developed. IP AMconsists of 3 modules : 1) knowledge base module which is a collection of commonly usedknowledge organized in object libraries, 2) generic problem solver module which can be usedrepeatedly in solving certain generic type problems, and 3) integrated user interface module. Theobject-oriented reusable architecture of IPAM will make the development of many computerapplication programs manageable, expandable and modifiable easily. Since the capability ofpersonal computer (PC) increases, PC is a target platform of IPAM, and MS-Window NT andC++ will be used.
Also, the following research areas will be emphasized in KAERI :1) level in PSA methodology and its computer codes2) level II PSA methodology including containment event tree.
ACKNOWLEDGEMENT
The authors wish to acknowledge the contribution of Dr. J. O. Yang, Y. Choi, K.S. Chung, S.H.Han, S.C. Chang, and Dr. J.J. Ha of Reactor Safety Assessment Department, KAERI inpreparing this paper.
THE IMPORTANCE OF RISK-BASEDREGULATION TO DEVELOPING NATIONS
H. SPECTERNew York Power Authority,White Plains, N.Y.,United States of America
Abstract
The paper discussed the present status of risk-based regulation (RBR) in the United States. RBRpotential of both improving NPP safety while reducing plant operating costs and the workload of theregulatory staff has been pointed out. Recent efforts involving both utilities and regulatory organizationsare briefly described.
RBR can be particularly valuable to developing nations, since it assures more economic way ofachieving high level of nuclear safety.
IntroductionThis paper discusses the present status of risk-based
regulation in the united States. It then describes the specialimportance this emerging regulatory process can have todeveloping nations.
BackgroundNuclear power plants in the united States are regulated
today on the basis of demonstrating that they can meet a numberof very conservative deterministic criteria. A number of designbasis accidents are postulated and it must be shown that aplant's design must be able to place the plant into a safecondition for each of these design basis accidents. While suchan approach has been quite effective in the past, i.e., no memberof the U. S. public has ever been subject to fatal doses ofradiation from any plant operation or accident, the presentregulatory process is not an economically efficient one.

Further, some potentially serious events, which may occur morefrequently than some design basis accidents, appear to have beenoverlooked.
An alternative way of evaluating the adequacy of a plant'sdesign and operation is to use Probabilistic Safety Assessment[PSA] techniques. Although such methodologies have beenavailable since the mid-1970's, the use of PSA as a regulatorytool has dramatically advanced in the recent past. Not only hasthe technology evolved over the past twenty years, as well as theoperational data base, a major turning point occurred whenvirtually all U.S. operating commercial nuclear power plantscommitted to producing plant-specific PSAs. This greatlyexpanded the body of plant-specific knowledge and set the stagefor even further developments. Increasingly, PSA considerationshave been incorporated into the regulatory process as thesestudies advanced to their level one [core melt frequency] andlevel two [containment failure frequency, source terms] results.
Another milestone in the utilization of PSA technologyoccurred on March 10, 1992. On that date three members of theU.S. nuclear industry* came before all five NRC Commissioners ina public briefing to recommend that major portions of the presentdeterministic regulatory process be replaced, over time, with arisk-based approach. A transition strategy to bring about thischange in the regulatory process was offered at thispresentation.
»Messrs. John C. Brons and Herschel Specter of the New York Power129 Authority and Mr. William Rasin of NUMARC.
Risk-based regulation [RBR] is the utilization of a moderntechnology, PSA, to better distribute the resources of both theregulator and the nuclear industry. More specifically, resourceswould be distributed according to risk significance. Those itemsor events that have high risk significance would receive the mostattention, while those with little risk content would commandfewer resources.
RBR has the potential of both improving nuclear power plantsafety while reducing plant operating costs and the workload ofthe regulatory staff. If applied, the public could then receivea double benefit: safer nuclear plants and lower nucleargenerated electricity costs. This modern form of regulationcould be applied to present operating plants and to advanceddesigns. In fact, it would help quantify the safety improvementsof advanced designs.
It is anticipated that even should application of the RBRprocess expand over time, that a deterministic approach tocertain portions of the overall regulatory process could still beof value. For example, various on-site normal operations such asthe handling and storage of nuclear fuel and wastes, ALARAactivities and routine plant emissions may be efficientlyregulated by a deterministic process. Characteristically, suchdeterministically regulated processes would not lead to exceedingoffsite PAG (Protective Action Guides) levels, if there were sometype of failure. RBR lends itself more to severe accidentsituations where core damage or loss of containment integrity ispossible. Thus an appropriate blend of deterministic normal

130 operations regulation and risk-based severe accident regulationcould yield an optimum overall regulatory process.
Present StatusRBR is developing at a rapid rate. In industry, the New
York Power Authority (NYPA) has offered to fund an RBR pilotprogram using its J. A. FitzPatrick plant. Interest in this NYPAactivity is growing. The Empire State Electric Energy ResearchCompany, ESEERCO, is now sponsoring a portion of the NYPAprogram. About eight utilities within the New York area compriseESEERCO and a number of other utilities outside of New York arealso associated. This ESEERCO effort started in August, 1992.EPRI, the Electric Power Research Institute is conducting RBRresearch and its utility members recently overwhelmingly voted tosupport a multimillion dollar effort. The BWROG, the BoilingWater Reactor Owner's Group, established an ad hoc committee onRBR in early 1992. The long tern scope and funding level of thisBWROG committee is now under review. The Btw Owner's group andthe Edison Electric Institute conducted meetings on thisregulatory concept in June, 1992. Both of these groups see greatpotential in RBR. Presentations on RBR are also planned for INPOin the near future.
The American Nuclear Society has also been active inadvancing RBR. Of most significance is a June, 1992 decision bythe ANS Public Policy Committee to develop a public policystatement in support of RBR. Several RBR technical papers havealready been presented at ANS conferences and a technical sessiondevoted to RBR is planned for the June, 1993 ANS annual meeting.
RBR will also be a key topic at the ANS Executive Conference tobe held in October, 1992.
In March, 1993 the Second International Conference onNuclear Engineering, ICONE-2, will have a technical session onRBR. This conference is co-sponsored by the American Society ofMechanical Engineers and the Japan Society of MechanicalEngineers.
NUMARC, the Nuclear Management and Resources Council, whowith NYPA, participated in the March 10, 1992 Commissionpresentation, has offered to take a leadership role in thismodernization of the regulatory process if a similar level ofactivity is demonstrated by the NRC. NUMARC recently created anAd Hoc Advisory Committee on- RBR to guide its activities on thissubject. NUMARC and NYPA have also worked together to address anumber of Commission questions that arose after the March 10,1992 presentation.
The NRC is in the process of putting a staff team togetherto respond to this industry initiative. Interest on the part ofthe NRC Commissioners is high. It is expected that a number ofNRC/industry meetings will take place in 1992 to define atransition strategy more precisely.
Lastly, the International Atomic Energy Agency (IAEA) isquite interested in RBR. This subject was discussed at theLaguna Verde Plant in Mexico in November, 1991 and again at anIAEA sponsored PSA training course at Argonne National Laboratorylast February. Our meeting today shows this continuing IAEAinterest and an IAEA document on RBR will be drafted in November,1992.

RBR and Developing NationsRBR can be especially valuable to developing nations,
particularly those with regulatory processes which are in theirformative stages. Two reasons for this are improved safety andthe best use of national resources.
With regard to improved safety, a number of importantobservations have already been made. As discussed during theMarch, 1992 NRC briefing, analyses show that significantvariations in risk levels can occur during actual plant operationas plant configurations change from time-to-time (see FigureOne)*. Operational risk levels can, at times, be orders ofmagnitude higher than typical tine-averaged PSA results.Additionally, certain combinations of components, simultaneouslyunavailable, can result in core melt frequency "spikes" [SeeFigure Two]*. Even more important, analyses indicate that thereis a strong correlation between such "spikes" and precursorevents, i.e., situations approaching a severe accident. Sinceall of the high risk configurations shown in these figures wereallowed by present plant technical specifications, there is aclear need to improve these specifications. This can beaccomplished by using RBR to minimize such operational risks.RBR efforts now underway, e.g. the ESEERCO program, wouldidentify high risk plant configurations for HYPA's FitzPatrickplant and would develop strategies to minimize such risks.Results of these ESEERCO efforts will be published.
*The author wishes to acknowledge to very valuable work of131 Dr. William Vesely in producing these figures.
1.SÊ-04
, l.OE-04
5.1Ê-05
1.0E-06 1 I I I12 14 16 18 20 22 24 26 28 30 32 34 36 38 40
Recording period (months)
FIG. 1. Core damage frequency versus time.
t.OE-00
1.0E-01
1.0E-02•c-5.1.0E-03
Iu. 1.0E-O4O
1.0E-05
1.0E-06
1.0E-07
Base case
95% -Upper bound
5%-Lowet bound
Single Double Triple QuadrupleOutage configuration
FIG. 2. Range of CMF levels.
Other observations, based on recent PSA studies are nowsurfacing. For example, in one boiling water reactor analysis itwas shown that should certain plant systems fail, it would besafer to continue power operation than to shutdown, as called forby the plant's present technical specifications. Observations,such as this, means that a more sophisticated approach to plantoperation is needed than is presently employed. RBR, whichemphasizes such operational risk issues, as compared totraditional,static "bottom line" PSA results, will lead to thesesafety improvements.
On a broader scale of considerations, should RBR be used onan international basis, safety technology could be more readilyexchanged among nations, even though design and operationalpractices differences may exist. Simply stated, the mathematicalbasis of RBR lends itself to all nations, since mathematics knowsno borders. The exchange of safety technology among nationsenhances safety for all. RBR facilitates this exchange process.
There are also profound resource benefits for developingnations which use RBR technology. First, if a developing nationwishes to purchase a new nuclear power plant, it may choose toestablish design requirements, expressed in RBR or PSA language,that all reactor vendors would have to meet. For example,maximum mean core melt frequencies and maximum mean severerelease frequencies might be established as design requirementsfor all reactor vendors bidding on a contract. By using suchrequirements, an importing nation would be able to judge if aproposed plant achieves an adequate level of protection for agiven financial investment.
With regard to the actual plant design and construction, RBRteaches us that only a select few systems, structures, andcomponents (SSCs) are truly important to the public'sradiological safety. If a typical nuclear plant contains 100,000SSCs + 20%, then a rule-of-thumb is that only about 1/2 to 1% ofthese components are risk relevant. One major implication ofthis observation is that since a great number of the plantcomponents are not safety related, their initial purchase costsand later, replacement costs, will be much lower than typicalsafety related components are today. Furthermore, it may bepossible to manufacture many of these non-safety relatedcomponents within the country that purchased the nuclear plant.Some importing developing nations today may not be able tolocally manufacture safety related components, and are forced toimport expensive equipment. Much of this could change as thelist of safety related SSCs is minimized through RBR. By carefullabeling of which components are safety significant and which arenot, precious national currency could be conserved whilesupporting domestic industries that manufacture components forthe nuclear plants.
Further savings, both to the developing nation's regulatorand to the plant operator, would occur over the lifetime of aplant if its license is based on RBR. We already know today thatmany of the surveillance tests, maintenance actions, limitingconditions of operation that exist in present technicalspecifications are not risk significant. Their removal wouldgreatly reduce costs, as well as inadvertent reactor scramsintroduced by human error during such actions. RBR leads to more

cost effective regulatory inspections, tests, and operatortraining programs. Perhaps most important, it encourages theregulator and the plant operator to make safety decisions on amore technically justified basis. RBR technology also permits arisk ranking of SSCs. Once such rankings are established,resources could be expended more efficiently by concentrating onthe highly ranked SSCs.
ConclusionNuclear power is a necessary part of the energy future of
many nations. However, a modern technology needs a modernregulatory process. RBR is well suited to this task. It can beparticularly valuable to developing nations who can chose to"leap frog" over the present deterministic regulatory methodologyused elsewhere, to enjoy both higher levels of nuclear safety andmuch more economical nuclear power.
THE ROLE OF PROBABILISTIC SAFETYASSESSMENT IN THE LICENSING OFANGRA-I NUCLEAR POWER PLANT
S.M. ORLANDO GIBELLIDivision of Safety Assessment,Comissäo National de Energia Nuclear,Rio de Janeiro, Brazil
Abstract
The Licensing of Nuclear Power Plants, in Brazil, is carried outby the Regulatory Body, the National Nuclear Energy Commission (CNEN), andit has been based on deterministic approach.
However, aiming the issuance of the Authorization for PermanentOperation to Angra-I Nuclear Power Plant, which is expected to occur afterthe next refueling, the Regulatory Body decided to include, in the terms ofthe Authorization, requirements related to the most important aspects of theuse of Probabilistic Safety Assessment (PSA) as a complementary tool toenhance plant safety.
In order to accomplish those measures and enable theirimplementation, the Regulatory Body will request the Utility (FURNAS) toprovide a PSA of Angra-I to be used as a reference study.
Taking into account that a PSA level 1 of Angra-I was performed inBrazil, from 1982 to 1985, under an IAEA Research Contract, the Utility hasshown the intention to consider this original study as a starting point onwhich a rigorous review will be conducted.
The objective of the present paper is to describe the BrazilianRegulatory Body position concerning the Role of the Probabilistic SafetyAssessment in the Licensing of Angra-I NPP. The main PSA related topics tobe potentially implemented by the Utility are also presented.
133
1. INTRODUCTION
The Licensing of Nuclear Power Plants, in Brazil, is carried outby the Regulatory Body, the National Nuclear Energy Commission (CNEN), and

134 'las been based on deterministic approach. Nevertheless, with a view to issuethe Authorization for Permanent Operation of Angra-I, which is expected tooccur after the next refueling outage time, the Regulatory Body decided toinclude in the terms of the Authorization, the main aspects of the use ofPSA as a complementary tool to enhance plant safety, mostly concerning thepossibility of occurrence of events beyond design basis. In order to
accomplish those measures and enable their implementation, CNEN will requestthe Utility (FURNAS) to provide a Probabilistic Safety Analysis (PSA) ofAngra-I to be used as a reference study.
Basic principles of safety point out to design and operationalrelevant aspects which need to be considered and are not necessarilyincluded in a conventional deterministic safety assessment as, for instance,questions related to accidents beyond design basis and severe accidents.These accidents can be identified through a systematic analysis of theaccident sequences resulting from a PSA. Additionally, PSA providesqualitative and quantitative information and insights into plant design,which can help to improve operational practices and conditions. Therefore,the Probabilistic Safety Assessment plays a complementary role to theDeterministic Assessment.
Nowadays, the development of a plant specific PSA is aninternational trend, either from Utility initiative or from Regulatory Bodyrequirement. The relevance of these studies is directly connected to theutilization of plant specific data base in their elaboration in order toobtain reliable results which could be put into practice.
The objective of the present paper is to present and discuss therelevant aspects of the possible uses of PSA (1) which should be taken asstarting points to the formulation of a programme to be implemented by theUtility to enhance Angra-I NPP safety.
Due to resource limitations in the Brazilian nuclear field, theestablishment of a prioritization of potential uses for the above mentionedaspects is also discussed.
2. ANGRA-I BACKGROUND INFORMATION
The Brazilian Nuclear Power Plant Angra-I, a two-loop pressurizedwater reactor of 626 MWe, Westinghouse design, turn key contract, has beenin operation from 1981 to 1987 under an Authorization for ProvisoryOperation. The Authorization for Initial Operation was issued in 1987, byCNEN.
The safety assessment for the issuance of the Angra-I License hasbeen performed according to Brazilian standards [2] and based on the U.S.NRC 1OCFR [31, which considers deterministic assumptions to preserve plantintegrity and public health during the different operational conditions andin case of occurrence of a set of postulated accidents, the most severebeing the design basis Loss of Primary Coolant Accident (LOCA).
In order to accumulate more experience concerning the use ofprobabilistic techniques and to produce a probabilistic model of Angra-I tobe used by CNEN and FURNAS in the safety and operational plant analysis, aProbabilistic Safety Study (PSS) Level 1 [4] was carried out. This was thefirst work of the PSA type performed in Brazil, from 1982 to 1985, under anIAEA Research Contract.
The methodology used in the study was one of those recommended inthe PRA Procedures Guide (51, called small fault tree/large event treeapproach. In addition, to reduce event tree complexity and processingeffort, the impact vector concept was adopted. Due to limited plant specificfailure data available, in most of the cases, a generic data base was usedto quantify system unavailabilities and the likelihood of accidentscenarios.
Sixteen dominant accident sequences were selected, representing acontribution of 837. to the total core melt frequency, whose final value was1.18E-03/year. It is important to remark that those PSS results should becarefully utilized, for this study has many limitations mostly due to thefact that it did neither adopt a plant specific failure data base norperform an adequate data uncertainty treatment. Furthermore, this study nolonger reflects the real plant design, since Angra-1 was submitted later to

many design modifications. Additionally, the last report version of thestudy was presented in a very draft form. Nevertheless, it represents asource of information on plant behavior in case of occurrence of a beyonddesign basis accident, as far as its results constitute if not quantitative,at least qualitative indicators of plant safety level.
In april 1992, the Utility submitted a report to CNEN as anaddendum to the Angra-I PSS [6], in which a decrease in the core meltfrequency was claimed (3.8E-05/year).
This addendum was examined by CNEN and considered very limited,since an adequate PSA review should follow a systematic process onassumptions and models adopting, as far as possible, plant specific database and being presented as a report following a PSA standard format asrecommended by a PRA Procedures Guide.
The existence of a limited version of Angra-I PSS report, led theUtility to consider it as a starting point on which a rigorous and completereview should be conducted, instead developing a new study.
Progress reports on the Angra-I PSA study review, as well as itsexpected final version, will be submitted to CNEN for further evaluation inthe future.
To initially accomplish those activities, CNEN will be supportedby an IAEA technical assistance mission covering, basically, the followingitems:
- to review the Regulatory Body position concerning the use of PSA in theLicensing of Angra-I NPP.
- to advise CNEN on the formulation of the regulatory requirements for theAuthorization for Permanent Operation of Angra-I NPP, concerning PSA.
- to establish priorities with respect to a proposal of a complete reviewfor the Angra-I PSS.
3. USING PSA TO ENHANCE ANGRA-I SAFETY
In Angra-I, the assessment of proposed backfits has been carriedout without taking into account any probabilistic aspect, such as, forinstance, system or function reliability calculation.
After a review of the PSS level 1 is completed, CNEN shall requestthe Utility to consider the use of PSA methods in the analysis of futuredesign backfittings (71, which will help to justify the selectedalternative, mostly concerning the achievement of the desired plant safetylevel.
As a consequence of the Angra-I PSS level 1 results, CNEN hasalready requested the Utility to perform supplementary safety analysis.Additionally to requirements established in the US 10CFR part 50.62, relatedto protection against Anticipated Transients Without Scram (ATWS) forWestinghouse type PWR reactors, CNEN requested the Utility to carry out theanalysis of Angra-I response to the most limiting ATWS case, namely TotalLoss of Feedwater [8]. According to the Angra-I PSS results, scenariosobtained from initiating events involving ATWS are the major contributors tothe total core damage frequency (31.47.). The request of this study had theintention to verify whether the generic recommendations were sufficient tocover the specific case of Angra-I. As soon as the reviewed PSA version isfinalized, the same treatment should be recommend by CNEN to similar cases,if they arise.
Concerning safety assessment, one of the most frequent taskswithin the Regulatory Body is the evaluation of Utility requirements ofAOT's (Allowed Outage Time) extensions/exemptions and STI's (SurveillanceTest Interval) modifications to be implemented on the already approvedTechnical Specifications.
Angra-I Technical Specifications [91 present a lack ofcompleteness in the formulation of some of the technical basis aswell as some inadequate specifications.
135

11C Due to this fact, various specifications have very often beenmodified, but without following any uniform criterion or standard procedure.The justification for some of AOT's extensions/exemptions or STPsmodification requirements presented by the Utility either makes use of theweakness associated with the technical basis or evokes a comparison with theWestinghouse Standard Technical Specifications [101, in case the latter isless restrictive.
Technical Specification modification requirements have beensubmitted to CNEN based on either engineering judgment or quantitative andqualitative considerations without taking into account any probabilisticaspect. Yet, PSA methods can be utilized to improve AOT's and STI's 111].After adopting a PSA as a reference study, CNEN shall include PSA techniquesin the assessment of Technical Specification modification requirementspresented by the Utility.
Another application of PSA techniques is the identification of themost important precursors of significant accident sequences associated withincident reporting analysis (121. The basic objective is to obtain, startingfrom the occurrence of an incident, a probability value which represents howclose has the plant been to a core melt situation. In this sense, a work hasbeen carried out by the Regulatory Body 113] to identify the most importantprecursors of significant accident sequences through a systematic analysisof the operational incidents which occurred in Angra-I during the years of1984 and 1985. This was performed utilizing the dominant accident sequencesobtained in the already mentioned PSS of Angra-I.
As a consequence of this work, the weaknesses of the currentreporting criteria as well as the incompletenesses of the report contentsappeared. The incident reporting criterion follows a CNEN standard [141,which is expected to be reviewed to include concepts of the root causemethodology. Within the Regulatory Body the systematic evaluation ofincident report has just been modified to incorporate concepts of themethodology proposed by the IAEA (ASSET) (15), which recommends the use ofPSA to assess the potential significance to safety of occurrences related tothe event under analysis. Concerning this matter, no PSA application hasbeen performed to the present date.
Regarding Accident Management, within the Regulatory Body, no planto address severe accident issues for Angra-I has been developed up tillnow. However, the adoption of concepts from the U.S. NRC document on "PolicyStatement on Severe Reactor Accidents", is under discussion. If thoseconcepts are adopted, their implementation should follow guidelines ofNUREG-1335 (16) and an Individual Plant Examination for Angra-I, using PSAmethodology, should be performed by the Utility and submitted to be reviewedand evaluated by CNEN.
The current Angra-I emergency operating procedures are based on anWOG (Westinghouse Owners Group) programme [171, which includes a systematicevaluation of generic event sequences using Probabilistic Risk Assessmenttechniques. The results of this evaluation, presented in WCAP-9691 [181,indicate that the proposed Emergency Operating Instructions fully cover thegeneric Westinghouse type design basis events. Moreover, those EmergencyOperating Instructions address a number of events beyond design basis.Therefore, plant-specific accident sequences, as results of an Angra-I PSA,shall be considered by the Utility to review the current status of theemergency operating procedures, to verify whether they cover the actualAngra-I response to severe accident.
The current Angra-I Emergency Plan follows US NRC Criteria [19J.Although the adopted planning basis is independent of specific accidentsequences, a number of accident descriptions are considered, including thecore melt accident release categories of the Reactor Safety Study [201.
The regulatory position is being reviewed within CNEN [211,concerning the definition of intervention levels and the correspondingprotective measures, following IAEA recommendations [221, which requires acoherent revaluation of the considered release categories and associatedrisks.
The results of an Angra-I PSA shall be used to improve the currentoff-site emergency planning. Recommendations of corresponding protectiveactions to different emergency type situations should consider plantspecific accident scenarios and consequences.

137
3. CONCLUSIONS
Although the relevance of the use of PSA concepts to enhance plantsafety is internationally recognized, due to limited available resources tocarry out this matter, a prioritization of the implementation of those
measures should be considered.
A great effort is needed to perform the implementation of allpossible PSA applications. Concerning the -difficulties faced by the nuclearfield in Brazil, it is expected that a long time will be necessary until afinal version of a full scope PSA study is completed. However, some of thepresented PSA uses can be put into practice by having only results of a PSAlevel 1.
Considering that Angra-I is under operation for more than tenyears, priorities should stay with the implementation of matters related tothe operational uses of PSA. Moreover, to support operational decisions, PSAlevel 1 is already sufficient, since it provides system and functioninformation.
Among the priorities related to the use of PSA to improveoperational issues, a complete review of the current Angra-I TechnicalSpecifications should be carried out the first place. Some technical basisand surveillance requirements of Angra-I Technical Specifications weredeveloped using concepts from generic Westinghouse operational experience.Moreover, some of the specifications have been modified, mostly after TMI-2accident, but without following any systematic procedures or criteria toproduce a coherent set of specifications. The way to implement a programmeto improve the review of Technical Specifications is expected to be includedin the terms of the Authorization for Permanent Operation of Angra-I, to beissued by CNEN.
Secondly, the priorities should be concentrated on the review ofthe emergency operational procedures to verify whether the existing Angra-Istrategies of accident management are consistent with the plant specificresponse to severe accidents.
The use of PSA in the assessment of accident sequence precursorsis dependent on the improvement of the incident reporting criteria. To
accomplish that, CNEN intends to perform a review on the concerningregulation to obtain more accuracy and completeness in the reports presentedby FURNAS.
Lower priority is given to the use of PSA to improve Angra-Iemergency planning, mostly due to the fact that a complete PSA is requiredto conduct a review of the considered release categories and associatedrisks.
Safety related design changes, which are internationallyrecommended, have been incorporated to Angra-I without the help of PSAtechniques (with the exception of the ATWS case), nor utilizing anyprobabilistic criterion for the decision making process. However, sinceAngra-I design is a very typical standard Westinghouse two-loop PWR, fromthe point of view of safety, design modifications take no priority to theabove mentioned operational applications.
REFERENCES
til. INTERNATIONAL ATOMIC ENERGY AGENCY, The role of Probabilistic SafetyAssessment and Probabilistic Safety Criteria in Nuclear Power PlantSafety, Safety Series No. 106. IAEA, Vienna 1992.
12). COMISSÄO NACIONAL DE ENERGIA NUCLEAR, Licenciamento de InstalacoesNucleares, CNEN-NE-1.04, Outubro 1984.
[31. USA, Code of Federal Regulations, Title 10: Energy, Part 50 -
10 CFR 50, Office of Federal Register, January 1989.
(41. COMISSÄO NACIONAL DE ENERGIA NUCLEAR, Estudo Probabilfstico deSegurança da Central Nuclear Almirante Alvaro Alberto, Unidade I, FaseA, CNEN, DR-127/85, GAS-01/85. Rio de Janeiro, Abril 1985.
[5). U.S. NUCLEAR REGULATORY COMMISSION, PRA Procedures Guide,NUREG/CR-2300, January 1983.
(6). FURNAS CENTRAIS ELÉTRICAS S.A., Revisäo da Anälise Probabilistica deSegurança da Angra-I - Nivel l, R-DEN.N.0003.92/R-DNTC.N.OO28.91, Rio
de Janeiro, Fevereiro 1992.

(7l. INTERNATIONAL ATOMIC ENERGY AGENCY, Case study on the use of PSA
methods: Backfitting decisions, IAEA-TECDOC-591, Vienna, April 1991.
[81. FURNAS CENTRAIS ELÉTRICAS S.A., Anälise de Transitörios sem Desarme do
Reator (ATWS) para Angra-I, Nota Técnica DCS.N.0026.86, Setembro 1986.
[91. FURNAS CENTRAIS ELETRICAS S.A., Final Safety Analysis Report, Central
Almirante Alvaro Alberto, Chapter 16, Technical Specifications.
110]. U.S. NUCLEAR REGULATORY COMMISSION. Standard Technical Specifications
for Westinghouse Pressurized Water Reactors, Draft, NUREG-0452,Revision 5, October 1984.
111]. INTERNATIONAL ATOMIC ENERGY AGENCY, Use of probabilistic SafetyAssessment to evaluate Nuclear Power Plant Technical Specifications,IAEA-TECDOC-599, Vienna, April 1991.
1121. INTERNATIONAL ATOMIC ENERGY AGENCY, Use of Plant Specific PSA to
evaluate Incidents at Nuclear Power Plants, IAEA-TECDOC-611, Vienna.June 1991.
(13). FERNANDES FILHO T. L., GIBELLI S.M.O., Angra-I Probabilistic Safety
Study, Phase B. CNEN, DR-NT-GAPS-N502/88, Rio de Janeiro, Maio 1988.
(14J. COMISSÄO NACIONAL DE ENERGIA NUCLEAR, Relatôrios de Operaçâo de UsinasNucleoelétricas, CNEN-NE.1.14, Janeiro 1983.
[15]. INTERNATIONAL ATOMIC ENERGY AGENCY, ASSET Guidelines Revised 1991
Edition, IAEA-TECDOC-632, Vienna, December 1991.
(16). U.S. NUCLEAR REGULATORY COMMISSION, Individual Plant Examination:Submittal Guidance, Final Report, NUREG-1335, August 1989.
[17]. WESTINGHOUSE OWNERS GROUP, Emergency Response Guidelines, September1983.
118]. WESTINGHOUSE ELETRIC CORPORATION, Transient and Accident Analysis,
(NUREG-0578 2.1.9.C), WCAP-9691, March 1980.
1191. U.S. NUCLEAR REGULATORY COMMISSION, Criteria for Preparation and
Evaluation of Radiological Emergency Response Plans and Preparednessin Support of Nuclear Power Plants, NUREG-0654, FEMA-REP-1, Rev. 1,October 1980.
1201. U.S. NUCLEAR REGULATORY COMMISSION, Reactor Safety Study, An
Assessment of Accident Risks in The U.S. Commercial Nuclear PowerPlants, WASH-1400. NUREG-75/014, October 1975.
[21]. COMMISSÄO NACIONAL DE ENERGIA NUCLEAR, Diretrizes para Registro eAtendimento a Emergências Radiolôgicas ou Acidentes Nucleares.
122). INTERNATIONAL ATOMIC ENERGY AGENCY, Techniques and Decision Making inthe Assessment of Off-Site Consequences of an Accident in a NuclearFacility, Safety Series No. 86, Vienna, 1987.

139
SURVEY OF GERMAN PSA INVESTIGATIONSFOR NUCLEAR POWER PLANTS
H.P. BERGBundesamt für Strahlenschutz,SalzgitterU. HAUPTMANNS, P.M. HERTTRICHGesellschaft für Anlagen- und Reaktorsicherheit,KölnGermanyAbstract
One major topic of the Nuclear Regulatory Research Programmeestablished by the supreme regulating authority is the probabili-stic safety assessment (PSA) which constitutes at present anindispensible tool in the German nuclear safety work. Hence, forthe further development of PSA a comprehensive research programmehas been defined by BfS and BMU in 1991. The main issues of theseactivities are discussed, in particular the actual state of theGerman PSA-guideline and the supplementary chapters on specialtopics like human factors.
1. INTRODUCTION
In the Federal Republic of Germany both the construction and theoperation of nuclear power plants are subject to comprehensivelicensing and supervising procedures enforced by the respectiveFederal State Authority on behalf of the Federation. The primeresponsibility for the safe nuclear power plant operation isassigned to the operating organisation. All necessary proceduresare determined in the operating license in order to ensure thesafe control of the plant under all conditions including investi-gations into operational experiences and systematic evaluation ofadvances in research and development for further safety improve-ments .
Because nuclear regulatory procedures must be tied as closely aspossible to the actual state of scientific and technologicalknowledge, the Bundesministerium für Umwelt, Naturschutz undReaktorsicherheit (Federal Ministry for the Environment, NatureProtection and Nuclear Safety - BMU) has established in itsresponsibility as the supreme regulating authority a comprehensi-ve Nuclear Regulatory Research Programme. This programme is inits main part now implemented at the Bundesamt für Strahlenschutz(Federal Office for Radiation Protection - BfS) which was foundedin November 1989 as an autonomous Superior Federal Authoritywithin the portfolio of the BMU.
One major topic of this programme is the probabilistic safetyassessment (PSA) which constitutes at present an indispensibletool in the German nuclear safety work. Hence, for the furtherdevelopment of PSA a major investigative programme has beendefined by BfS and BMU which has started at the end of 1991 andthe beginning of 1992. The main issues of these activities arediscussed in the following.
Because of the German approach - in analogy to the internationalunderstanding and development of PSA - towards a high standard ofPSA, the creation of a PSA guideline for narrower analysis justi-fication and its acceptibility has appeared to be adequate andrecommendable. This guide should, in particular, contribute tothe use of uniform analyses as a working tool. A first version ofsuch a PSA procedure guide - developed by a group of expertshas been published in 1990 by the supreme regulatory authority.Additional guidance on human factors, common cause failures, anddata collection is supplemented. The main aspects of these addi-tional subjects are presented.
2. ACTUAL RESEARCH PROJECTS ON PSA
The complexity of nuclear power plants, the requirements fortheir efficient and safe operations, the occurrence of majoraccidents, and the resulting attention of the public to the
safety of these facilities have accelerated the development anduse of models that accurately represent these plants. The develo-ped PSA-procedure has made it very clear that the events ofinterest are rare and any decision-making process that involvesthese events must account for the large uncertainties that areassociated with their analysis.
Therefore, at national and international level comprehensive in-vestigations have been performed concerning the PSA methodology.Nevertheless, the potential of PSA in practice is still far frombeing exhausted and the methodology is subject to continueddevelopment as well as promotion in various fields of applicati-on. The extension of PSA application - for example in the contextof reevaluating and optimizing surveillance and test procedures -requires additional or new methods, models and, in particular, adifferent kind of data base.
For the further development of PSA in the Federal Republic ofGermany, a major regulatory research programme has been definedby BfS and BMU. Main topics of this programme are:
- comparison of different international PSA studies with respectto methodology, models and results in order to gain insightsfor further investigations and developments in the Federal Re-public of Germany; this comparison takes into account - amongothers - initiating events, plant status, event sequence analy-sis, and accident management procedures.
- PSA for fire events including a proposal for a guideline forthis specific type of PSA,
- containment performance related to severe accidents,
- evaluation of existing computer codes based on explicit eventsequences and fault trees of real plants comparing the results,calculation rules, input parameters and techniques to determinethe cut-sets; development of a procedure for the qualificationof PSA-codes,
- evaluation of existing PSA applications for passive and inhe-rent safety features; resulting proposals shall be checked onthe basis of examples,
- contribution to an integral risk management approach investiga-ting different energy supplying systems,
- further investigations for providing a living PSA tool,
- improvements and further development of the PSA guideline basedon experiences of the users and new scientific knowledge aswell as
- a first approach to a guideline for the review of PSAs whichare performed within the framework of periodic safety reassess-ments .
characterisations of the state of safety technology by usingqualitative and quantitative PSA results,
improvement of methods for special issues like human factor de-pendencies, low power and shutdown operation as well as uncer-tainties.
As recommended by the German Reactor Safety Commission in Novem-ber 1988, every nuclear power plant would be made subject to atleast three complete safety reviews during their lifetime. Inpractice, this recommendation leads to a periodic safety reas-sessment of nuclear power plants in operation about every tenyears.
- development of a proposal for a periodical precursor reportsystem taking into account international experiences,
Essential elements of this periodic safety reassessment are theanalysis and evaluation of the overall status including the

141
operational experience of the respective plant and a probabili-stic safety assessment.
Concerning the probabilistic safety assessments, an examinationof balance of the safety concept of the plant is planned usingprobabilistic methods.
3. MOTIVATION OF A PSA GUIDELINE FOR NUCLEAR POWER PLANTS
The safety concept of nuclear power plants in the Federal Repu-blic of Germany is at present mainly based on deterministicprinciples like
- safety features to prevent or control operational disturbancesand incidents,
- reactor containment as a passive barrier against radioactivityreleases in case of an incident,
- redundant and diverse safety systems to ensure high system re-liability.
Safety decision making during design and licensing is essentiallyreduced to a verification of compliance with predescribed techni-cal requirements as laid down in the standards.
However, these safety principles have steadily been improved andmade more precise by the increase of conventional safety analysesand, in particular, of systematic PSAs which are supported to alarge extent by plant-operational experience.
Using the analytical tool of a PSA, the safety design of a plantcould be better balanced preventing both over and underdesign ofsafety features.
Such plant-specific PSAs offer an additional and different toolfor evaluating a safety concept of a plant based on deterministicprinciples. Furthermore PSA delivers explicit results on theactual safety standard of a plant.
The use of PSA for designing a new nuclear power plant is areasonable way to optimize - for example - mitigation measuresfor beyond design accidents during the planning phase of therespective plant. At the moment, this aspect of PSA is of minorimportance in the Federal Republic of Germany because at presentthere is no application of a new nuclear power plant in Germany.The only important activity is the common project NPI of Germanyand France where deterministic and probabilistic aspects form thebasis for the design.
Until now, PSA in Germany is developed and mainly used for eva-luating all system safety functions with respect to a spectrum ofpossible incidents resulting in sequences of a core-melt accident(level-1 analysis).
The broad application of level-1 PSAs justifies the exact defini-tion of the PSA tool in a guideline.
Setting up such a guideline corresponds to German safety stan-dards where in several regulations statements are given referringon the necessity of highly reliable safety systems.
For plants in operation such a PSA guideline can be applied for
- evaluating desired plant and system modifications,- optimizing backfitting measures,- reevaluating and optimizing surveillance and test proceduresand safety related operational procedures,
- evaluating actual operational experience.
Moreover, as described above, a level 1+ PSA (level 1 plus activecontainment related systems) is required as one part of theperiodic safety reassessment of nuclear power plants in operati-on.
A first version of a PSA procedure guide has been published in1990 by the supreme regulatory authority, developed by a group of

|42 experts and taking into account the statements of the federalstates. This version has been discussed in the Reactor SafetyCommission and its application has been recommended.
The contents of the PSA guideline and the structure of the docu-mentation of a PSA are shown in Table 1 and 2 respectively.
4. ADDITIONAL ISSUES OF THE PSA.GUIDELINE
The PSA guideline of 1990 only contains short statements on humanfactors, common cause failures and reliability data collectionfor technical systems. Therefore, additional guidance on thesetopics shall be supplemented; drafts of the amendments concerninghuman factors, reliability data acquisition and evaluation andcommon cause failures exist as proposals of a technical committeewhich have to be discussed with the federal state authorities.This procedure may start at the end of this year.
Table 1 : Structure of the German PSA-guideline
Table 2: Requirements on the documentation of the PSA results
1. Place and objective of the Guideline
2. Overview of the probabilistic safety analysis (PSA)
3. Input information for the PSA
4. Probabilistic Analysis
5. Data for quantifying event sequence diagrams and fault trees
6. Quantification of fault trees
7. Valuation and review
8. Documentation of the results of the analysis
- Jist of documents used
- description of the events and event sequences analysed
. success criteria used
- fault and event trees elaborated
- reliability data used including their sources
- indication of the component models for independent andcommon cause failures
- indication of fault tree simplifications made before theirevaluation (e.g. modularization, super-components etc.)
-indication of the method used for evaluating the fault trees(analytical or simulation) including parameters characterizingthe quality of the final result
- indication of the type of documentation used for the results ofthe analysis (e.g. storage of computer output, microfiche etc.)including an appropriate codification
- results and their valuation
4.1 Approach to human factors
The general procedure is based on the well-known Swain and Gutt-man reliability handbook including ASEP for screening and asfinal result for less important human interventions.
Types of interventions which have to be treated are for exampleactions during stand-by, actions during an incident as prescribed

by the operational manual or accident management actions.like sabotage are excluded.
Acts
Data for rule-based and skill-based behaviour can be taken - asfar as available - from the above mentioned handbook while datafor knowledge-based behaviour have to be estimated. The use ofplant-specific data would be very helpful.
Uncertainties are described by log-normal distributions, but theuncertainty factors recommended are larger compared with the dataof the handbook (cf. Table 3).
4.2 Approach to the treatment of common cause failures
The basis of the evaluation of common cause failures are therelevant national (for example BEVOR data bank of the Gesell-schaft für Anlagen- und Reaktorsicherheit) and international (forexample 1RS data bank of the OECD) data banks.
Concerning the relevance of observed failures engineering judge-ment is required. In order to give a guideline for this procedu-
re, some criteria for the engineering judgement are developedlike comparability of systems or distinction between immediateand underlying cause of failure. An observed failure shall beconsidered as a relevant failure if the immediate cause is appli-cable to the investigated system.
The probability assessment is based on a modified binomial-failu-re-rate model (BFR-model) as used in the German Risk Study PhaseB with estimated error bounds; nevertheless, the need for animproved method of evaluation going beyond the BFR-model isrecognized.
4.3 Approach to reliability data collection
Concerning the reliability data collection for technical compo-nents, main emphasis is laid on the use of plant-specific relia-bility data.
The detailed plant inventory, incident reports, maintenance re-cords and records on time of operation or number of demands formthe basis for such a reliability data collection.
Table 3: Recommended uncertainty factors for human factors eva-luation
143
Uncertainty factor ofSwain
235
1030
Uncertainty factor inGerman PSA-guideline
56,28,7
15,240,4
Types of events which have to be taken into account are forexample instantaneous failures, failures in .the long term and un-availabilities. Important aspects are the type of repair and theway of discovery.
Systems which must be included are all safety systems, safetyrelevant operational systems and additionally operational systemswhich are part of the plant model.
For the evaluation of failure rates and unavailabilities theBayesian approach is recommended. The results are approximated bylog-normal distribution and multplied with a corrective distribu-tion taking into account uncertainties due to extrapolation intothe future or/and to other plants.

J44 5. THE STATUS OF THE PSA GUIDELINE
The PSA guideline is, in particular, useful as a description ofan accepted methodology including both methods and boundaryconditions.
An example of methods is the use of the THERP method for humanerror quantification.
Examples of boundary conditions are the list of initiating eventscontained in the PSA guideline - which must, of course, be modi-fied taking into account the respective plant-specific designand the considerations of test and maintenance activities beforean initiating event.
If the methodology of the PSA guideline is used in a specificPSA, the guideline can be referred to. If other methods or boun-dary conditions are used, they have to be described in detail inthe documentation of the PSA.
Since an important goal is to have comparable PSAs as far aspossible, a common source of guidance is desirable as to how toperform a PSA and how to obtain results with a comparable qualitylevel. This is necessary due to the fact that different utili-ties, different authorities depending on the Federal State wherethe nuclear power plant is located and different expert institu-tions are involved in performing and reviewing the respectivePSA.
On the other hand, the possibility to address special situationsor use newer techniques is, however, also desirable. If thesedeviations prove generally useful and acceptable, their documen-tation could eventually support the inclusion of the new methodsor new boundary conditions in the guideline.
This procedure implies the fact that the PSA-guideline is aliving document. This is, indeed, planned and depends on results
of the further development of PSA-methodology at national and in-ternational level on the one hand side and on experiences of theusers of the PSA guideline and their suggestions for improve-ments .
Due to the fact that different institutions are involved in thereview process of the PSAs provided by the utilities, a conceptfor a unified procedure of reviewing PSAs shall be performed.First results are expected by the end of this year.
6. CONCLUSION AND OUTLOOKPSA is a very powerful tool to investigate, veri?ly and improvesafety practices. Therefore, the regulatory authorities areincreasingly making use of PSA in safety evaluations of nuclearpower plants and other kinds of nuclear facilities.
The results of the ongoing PSA projects in the Federal Republicof Germany described above should provide deeper insight into PSAmethods. They will be evaluated with respect to their importancein order to prepare a basis for the decision if certain resultsshould be implemented in a further version of the PSA-guideline.
There is an important linkage between PSA and detei'aiinisticcriteria which are described in an annex of the PSA guidelinecalled "probabilistic requirements in the regulatory franework".It is an impressive collection which appears as though it couldindeed serve as a basis for setting analysis boundary conditionsand identifying a large number of potential quantitative safetygoals.
Nevertheless, for the time being, the deterministic and probabi-listic methodologies have to be kept separately. It is in a firststep necessary to interpret all the deterministic rules from aPSA point of view. In a further step, the results have to beintegrated into a consistent and realistic framework. This iscertainly a major task (involving a large number of judgements)which may be started in the future.

Considerations on possible probabilistic (i.e. quantitative)safety goals are not performed with high emphasis at the present
moment, but they may become more important with the further pro-gress of the NPI project.
In particular', a risk-based procedure in the regulatory frameworkof the Federal Republic of Germany as envisaged by the USNRC isnot part of the planned revision of the German Atomic Energy Actor relevant existing ordinances and safety criteria in nearfuture.
USE OF PSA IN A REGULATORY FRAMEWORK
P.J. ROSSNuclear Electric pic,Knutsford, Cheshire,United Kingdom
Abstract
The paper will briefly describe the use of PSA in the licensing process for the Sizewell 'B'PWR Power Station currently under construction in the U.K. There are two distinct phasesin the licensing process -
(i) A PSA has been performed to support the application to construct Sizewell 'B'. Atthat stage the PSA was used as a design tool (along with deterministic designrequirements) for Sizewell 'B' and as such lead to a number of significant designchanges in the early design process.
(ii) A PSA is currently being performed to support the application to operateSizewell 'B'. The PSA is required to support the claim that the design has includedall reasonably practicable measures to prevent and mitigate accidents.
The comprehensive PSA being produced for the second phase of the licensing process willbe described.
The way the regulators/designers/analysts have interacted over the years has affected thescope, complexity, detail and bias of the comprehensive PSA. The paper will discuss theseissues and highlight some of the more significant ones. The benefits and drawbacks ofproviding a PSA in a regulatory framework will be discussed.
One of the conclusions of the paper is that the use of true "best-estimates" in the PSA isdifficult to achieve in a regulatory framework where persistent bias to the conservative sideis apparent in the designers, analysts and regulators judgements. The usefulness of the PSAis therefore, potentially, compromised by giving misleading outputs or diverting resourcesto unnecessary areas.
145
INTRODUCTION
In the late 70's, the Central Electricity Generating Board (CEGB), Nuclear Electric'spredecessor, set itself probabilistic targets for new nuclear power plants for thefrequency of various levels of radiological release. These targets were to be used bydesigners to help in the preliminary and detailed design phases of new nuclearreactors. This meant that a Probabilistic Safety Assessment (PSA) was required tobe performed even at the preliminary design stage for the Sizewell 'B' PWR powerstation. Although this was a self imposed requirement of the utility it was discussed

146 with the regulator the Nuclear Installations Inspectorate (Nu). The NH ultimatelyadopted the CEGB's presentation of these targets.
As a consequence, the licensing of Sizewell 'B' has been linked to the PSA for theplant. This is performed in two fundamental stages - i) clearance for constructionof Sizewell 'B' and ii) having constructed Sizewell 'B' clearance to operate it -consequently there have been two significantly different PSAs performed.
The Pre-Construction Safety Report (PCSR) was first issued in 1982 and containeda preliminary level 1 PSA. This was sent to the Nil in support of the application tobegin construction of Sizewell 'B'. At that time, however, the Secretary of State forEnergy called for a Public Inquiry to be held into the application to build a PWRPower Station at Sizewell. The Public Inquiry which ran from late 1982 to early1985 (the longest ever in the UK history) dealt with all aspects of the applicationincluding safety and the PSA. Consequently throughout 1982-1985 the preliminaryPSA was discussed and addressed with both the regulator and at the Public Inquiry.
In 1986, the Inspector published his report that gave the go ahead for Sizewell 'B'subject to the normal licensing process and requirements of the Nu. A licence toconstruct Sizewell 'B' was given in 1987 based on the information in thePre-Construction Safety Report and supporting references. However, as the detaileddesign was not finalised and following discussions with NU, CEGB entered into anumber of additional committments to be addressed within a subsequent PSA to beperformed for the Pre-Operational Safety Report (POSR).
This paper goes on to discuss the PSA performed for the PCSR and the commitmentsfor further more detailed work referred to above. This led to the highly detailed,complex and comprehensive analysis, currently nearing completion, that is beingcarried out for the POSR. Having been through this process it is clear there aremany lessons to be learnt in attempting to develop a highly complex andcomprehensive PSA; this paper attempts to highlight the more significant ones.
Although a large part of the PSAs performed addressed the large releases (in our casethis translates not to a core melt but to a release equivalent to a whole body dose of100 mSv or greater at the site fence) there are also targets for smaller releases. Thetargets set were as follows:
Dose Band
0.1 - 1.0 mSv1.0 - 10 mSv10 - 100 mSv> 100 mSv
Summated Frequency for all Faults
lO-'/year10-VyearKrVyearKrVyear
Note that these were set as targets to be aimed for pot acceptance criteria.
The following sections go on to discuss the preliminary PSA performed for theconstruction licence, the regulators review of that preliminary PSA, the final PSA andthe overall impact of using PSA in a regulatory environment.
2. PSA FOR THE PRE-CONSTRUCTION SAFETY REPORT
i) Releases leading ^o doses < 100 niSv
To determine the release frequencies for releases leading to a dose < 100 mSvthe fault schedule was reviewed to identify faults which could lead to apotential increase in radioactivity released to the environment (e.g. would thefault lead to failed fuel; would the fault lead to relief valves opening). Thenthe barriers between that increased release and the environment were reviewedto estimate the failure probability of the barriers and thus produce an estimateof the frequency of releases to the environment. The actual releases were thenassessed to determine which dose band each release should belong to.
Specific, more detailed, analyses were performed for certain significant faultssuch as Loss of Coolant Accidents (LOCA) and Steam Generator TubeRuptures (SGTR).
The results of this preliminary analysis showed the targets to be met. It wasrecognised that the analysis was not "complete" but it did give confidence thatthe basic design was acceptable and that no significant design changes wouldbe required.
ii) Releases leading to doses > 100 mSv
Because the analysis was addressing releases leading to doses of greater than100 mSv the analysis was required to address two sets of conditions:
Degraded Core
Conditions arising, for example due to the failure of decay heatremoval systems, such that coolable geometry of the core may not bemaintained.
Containment Bypass
The uncontrolled discharge of RCS inventory into the containment dueto an initiating or consequential LOCA, with failure of the containmentsystems to maintain the containment within design basis conditions, orfailure of the isolation valves to close to prevent leakage to theenvironment. This covers non-degraded core conditions.

Fault Tree Analysis was performed to derive the probability of each of theabove conditions given an initiating fault. In principle such fault trees arerequired for each initiating foult however, for this analysis the initiating faultswere grouped together on a judgemental basis; thus reducing the amount ofanalysis necessary.
A functional fault tree was drawn for each initiating fault group. Thefunctional fault tree modelled the way in which safeguards system failurescombined to produce one of the conditions defined above. System fault treeswere drawn for each of the systems that appeared on the functional fault trees.The system fault trees modelled the way in which component failures combineto produce system failure. The system fault trees included inputs from theservice systems on which operation of the system is dependent e.g. electricaland cooling water supplies.
For each initiating fault, the functional fault tree and associated system faulttrees were combined to produce one overall fault tree which was then analysedto derive the failure probability.
The results of this preliminary analysis showed for the faults analysed thefrequency of releases greater than 100 mSv was about 5 x 10"Vyear. Therewere some significant omissions from the analysis which are discussed below.
iii) Omissions from the analysis
The preliminary analysis described above was not a "complete" analysis andareas which had not been addressed were identified, these included:
Faults during shutdown and refuelling
Modelling of failures in the Reactor Protection System (reactor tripand safeguards actuation)
Modelling control systems
- - Internal and External Hazards (e.g. seismic, fire, turbine disintegrationetc.).
Operator Errors
Beyond Design Basis Initiating Faults (BDBIFs)
Work was put in hand to address these areas for the PSA in support of thePOSR.
iv) Overall Conclusions from the Preliminary PSA
Judgements were made that for the releases < 100 mSv the preliminaryanalysis had shown the targets could be met.
For the releases > 100 mSv the fault tree analysis performed had shown afrequency of about 5 x 10^/year. Furthermore, judgements were made thatthe omissions from the analysis would contribute about 2 x 10*/year thusleading to an estimated frequency for releases > 100 mSv of 7 x 10*/year.
Numerous pessimisms in the analysis were noted and the conclusion made thatthe 10~*/year target could be met. However, the analysis performed (and thejudgements about the analysis not performed) had confirmed that a targetfrequency for releases > 100 mSv was very stringent. Consequently inpresenting the case to the regulators it was stated that if this target was notmet the analysis would be extended to ensure that the risk of death to anyindividual member of the public was less than 10*/year. This was thefundamental criterion that had led to the setting of the targets discussed in theintroduction.
3. THE REGULATORS REVIEW OF THE PRELIMINARY PSA
The review of the Preliminary PSA was a part of the review of the PCSR as a whole.Consequently as with the rest of the safety case there was a reluctance to acceptjudgements of a best-estimate nature without justification. The emphasis requiredfrom the Nil was to demonstrate and justify the completeness and acceptability of thesafety case (including the PSA).
The Nil did however welcome the considerable effort which had been devoted toproducing the PSA in support of the safety case and. the attempt made to show thatthe design met the probabilistic targets. They commented that the analysis had madea valuable contribution to the safety case, but that the analysis also had limitations inthat it excluded many contributors.
Taking into account the reviews of the preliminary PSA the CEGB recognised theneed to develop the PSA in a number of areas and the following are significant inrelation to this paper:
The identification of all sequences leading to releases < lOOmSv and thedemonstration of consistency with the transient analysis performed.
The inclusion of greater detail in the PSA, i.e. address all initiating faults, alloperating states.
147

148 The identification of contributors from other sources (e.g. External Hazards,Beyond Design Basis Initiating Faults).
These commitments have led to a greatly increased scope of the PSA for the POSR.The next section briefly reviews the effect of these commitments on the scope of thework performed.
PSA FOR THE PRE-OPERATIONAL SAFETY REPORT
i) Releases leading to doses < 10Q m$»
The requirement to identify all sequences leading to releases < lOOmSv wasof itself quite onerous. It led to the use of large event trees to model post-tripbehaviour of the pressuriser relief system, condensers, turbine trip, secondarycircuit relief system and other anciUaries (the event trees do not model thesuccess or failure of decay heat removal). These event trees led to manyhundreds of sequences for each event tree analysed which had to be shown tobe within the design basis and lead to doses < lOOmSv. The requirement todemonstrate consistency with the transient analysis led to an even greatercomplication.
The transient analysis that had been performed was based on the designtransients and contained generic pessimistic assumptions throughout the datasets and in the modelling (i.e. in the computer analysis codes). Also thestructural integrity limits for the plant had been conservatively set. The aimof the use of pessimistic assumptions was originally conceived for thedeterministic transient analysis work to allow for margins associated withother unknown effects. However, the output from the event tree analysis wasa list of thousands of very specific sequences and their associated frequencies.To allow for transient analysis of these sequences, they were reduced to a setof Limiting sequences for each event tree analysed. They were then furtherreduced to a set of Bounding Limiting sequences covering a number of eventtrees. Consequently the type of sequence analysed by transient analysis hada large number of failures included in it. (Note: at this stage successfuloperation of Auxiliary feedwater, safety injection etc. is based on theminimum safeguards requirements; typically one pump out of 4 only isassumed to work successfully). An example of a bounding limiting sequence
Unisolated Feed Line Break:
+ Slowdown of water at zero quality
+ RCS over pressure transient, up to 4 pressuriser relief valvesfail to open.
+ Failure of the Primary Protection System
+ Loss of off-site power.
Condensers assumed unavailable
Loss of Reactor Coolant Pumps at any time in transient(including pre-trip).
Loss of main feed.
+ Loss of auxiliary feed control.
+ Failure of 2 RCCAs to insert on reactor trip.
+ SG overpressure on more than 1 SG.
The failures noted above are largely independent events and an estimate of thesequence frequency suggests a value less than ICT'Vyear! Because of the wayall sequences bounded by this are included in the bounding sequencefrequency the above is associated with a sequence frequency of2.9 x ICf/year. The above is then shown by (pessimistic) transient andradiological analysis to lead to releases < 100 mSv.
The amount by which the pessimisms are compounded at each stage of theanalysis is apparent.
The analysis involved in the generation of the event tree sequences was furthercompounded by the large number of initiating faults (-170) on the faultschedule and the need to address all operating, states.
Releases leading to doses > 100 mSv
The commitment to include greater detail in the PSA led to an extensive faultschedule and an even more extensive safeguard schedule (i.e. the list ofsuccess criteria for feedwater, safety injection, boration etc.) because thefailures from the event tree analysis could affect the safeguard systemrequirements.
Thrs allied with the requirement for more detail in the fault tree supportsystem modelling and the need to address all operating states, has led to anenormously complex fault tree analysis( the fault tree analysis primarilyaddresses the failure of decay heat removal). Although faults have beenbounded to reduce the amount of analysis required (and therefore introducedthe sort of conservatisms discussed above) there are still some

iii)
149
61 fault trees to be analysed58 systems modelled in the fault trees
each fault tree typically consists of
1500 components900 gates10 inputs from event trees to fault trees
With cut-off frequencies set very.low (~ 10"'°/year) there are typically 5000cut-sets per fault tree.
Because of the complexity of the analysis it became apparent that manybounding assumptions and the associated success criteria were grosslypessimising the results from the fault tree analysis. For example the FeedLine Break fault described above is assessed as requiring 3 oo4 EmergencyBoration Tanks injecting boron into the RCS. This requirement is, however,associated with the Feed Line Break fault with no further failures; but thesequence frequency from which the 3 oo4 requirement came from is alreadyless than 10~'s/year! The real requirement is probably Ooo4 (no other PWRplant has an Emergency Boration system).
As the data derived for the probabilistic analysis was being derived in aregulatory framework claims of data being "best-estimate" were oftenquestioned. This led to a generic bias in the data to the pessimistic sidebecause such data could be more readily justified in a licensing submission.Likewise the modelling was also biassed to the pessimistic side by countingfailures in the data base which the modelling would assume to lead to loss offunctionality whereas the actual failure recorded in the data did not lead tototal loss of functionality.
The complexity of the analysis makes it less flexible than we would haveliked. However, to remove the worst of the pessimisms we are currentlyreviewing the individual cut-sets to identify and correct the types of grosspessimism noted above.
Contributions not previously assessed
Following the commitment to identify all possible sources which maycontribute to releases > 100 mSv the following have been included in theanalysis.
Beyond Design Basis Initiating Faults (BDBIFs)
BDBIFs are faults where no specific protection has been designed intothe plant (these include the incredible initiating faults such as Reactor
5.
Pressure Vessel and Steam Generator Failures). This does not mean,however, that a BDBIF would always lead to plant damage. A list ofBDBIFs has been produced (about 80 such faults have been identified)and case by case assessments made of the likelihood of plant damage(if any) and the frequency of each fault.
Operator Errors (not covered elsewhere)
It was recognised during the analysis that there may be contributions(albeit few) from operator errors that could lead to plant damagewhich had not been included in the event tree or fault tree or otheranalyses. Therefore a further route for the inclusion of othersignificant operator errors has been incorporated into the analysis.This 'direct estimation' route (largely based on reviews of OperatingInstructions) extends the coverage of the quantification of operatorerrors beyond the normal coverage of a fault tree analysis.
Internal and External Hazards
Hazards have been addressed by various combinations of techniquessuch as event and foult trees and the extensive use of engineeringjudgement In outline the analysis consisted of a three stage process:
i) Production of a comprehensive list of possible hazards (about60 such hazards were identified).
ii) Use of a screening process to eliminate hazards not possible atSizewell, or of very low frequency or bounded by another faultor hazard being analysed.
iii) Quantification of the hazards not screened out.
Contributions to the frequency of plant damage are being incorporatedin the PSA.
Non-reactor Core Sources of Radioactivity
These include contributions from the radwaste plant and the fuelbuilding/handling faults. These faults have generally been addressedusing event tree and fault tree techniques, although simpler analyseswere performed than those performed for the faults associated with thereactor core. These contributions are being incorporated in the PSA.
IMPACT OF THE USE OF PSA IN A REGULATORY FRAMEWORK
The previous section has highlighted the way the PSA has been greatly increased inscope to provide as complete a PSA as practicable. The highly complex and

150 exhaustive analysis now nearing completion has led Nuclear Electric to think aboutthe benefits and drawbacks of such a highly complex PSA. This section tries tohighlight such lessons learnt.
i) Benefits
The detailed review of the results of the PSA, which is primarily aimed atremoving the worst of the pessimisms, has also led to a much greaterunderstanding of the types of failure sequence that can lead to a significantrelease. Indeed the reviews of individual cut-sets has led Nuclear Electric toidentify (among other things) :
- The types of sequences that are leading to releases > 100 mSv andhence if a particular type is dominant- If there are any other safeguards systems which could be used(whether in it's intended role or in an off-normal role) to prevent thedamage occurring- Any further Operator actions that may prevent the damage occurring- If more frequent testing of equipment could significantly reduce thefrequency of releases > 100 mSv
The use of detailed analysis overcomes the uncertainty associated with grossjudgements. For example at the PCSR stage the effects of Shutdownconditions and Hazards were presumed to be secondary to the "traditional*internal plant faults at power. The complex analysis is now beginning: to show(once gross pessimisms are removed) that the shutdown conditions and hazardsare significant; indeed hazards occurring while at shutdown may provide thelargest contribution to the results.
The need to systematically identify and consider, in some way, all possibleroutes to a release greater than 100 mSv means that failures other than coremelt have to be considered. One significant contributor to risk comes froma series of isolated 'V sequence LOCAs (i.e. where the Operators havesuccessfully closed an isolation valve within 1 hour). These types ofsequences would be missed if an analysis was based on core melt only.
The analysis performed has put Nuclear Electric into a position where it hasan unprecedented understanding of the Sizewell 'B' design and the way thesystems interact. This places us in an excellent position for any future workin assessing the potential benefits and limitations of future designs.
ii) Drawbacks
The driving aim behind the commitments entered into by the CEGB was todemonstrate completeness and to quantify contributions wherever possible.This has been a major reason for the extremely complex analysis performed.That analysis is so complex that even simple re-runs of it are a major resourceundertaking. It would have been far better to qualitatively review the faultschedule and safeguard schedule to identify the potentially significant initiatingfaults and their associated success criteria. Only the reduced set of suchpotentially significant faults need be analysed.
In a similar manner, the extensive analysis for releases < 100 mSv could bedramatically curtailed. More importantly the use of detailed event treeanalysis to derive hundreds of sequences for each event tree which are thenreduced to Bounding Limiting sequences which in turn are addressed bypessimistic transient analysis is not necessary for a PSA. The potentiallysignificant sequences should be identified and analysed using best estimatedata and modelling. Pessimistic transient analysis should be reserved fordeterministic analysis of design transients where it has a useful role to play.The use of conservative transient analysis of the Bounding Limiting sequencesto justify the success criteria leads to a blurring of the distinction between thedeterministic design basis analysis and the 'best estimate" probabilisticanalysis (as well as introducing excessive conservatism in the latter).
The success criteria to prevent releases > 100 mSv should be based on bestestimate transient analysis data and modelling. The use of pessimistic analystshad directly led to gross over-complication of the analysis. Also it is clearthat many of the failures identified are not real failures; the reviews of cut-sets currently being undertaken highlight the potentially misleading resultsfrom such pessimistically set success criteria. .Similarly the use of pessimisticdata in the probabilistic modelling should be avoided. The way thepessimistic analysis could distort the results and lead a utility into expendingresource unnecessarily concerns the regulators as well as the utilities.

6. CONCLUSIONS
This paper has discussed the impact of the use of PSA in the regulatory frameworkfor Sizewell 'B'. As one of the most complex and comprehensive PSAs currentlybeing performed there are many lessons to be learnt. There have been many benefitsand drawbacks that nave been identified from the analysis, this paper has tried tohighlight the more significant ones.
The analysis performed has put Nuclear Electric into a position where it has anunprecedented understanding of the Sizewell 'B' design and the way the systemsinteract. This places us in an excellent position for any future work in assessing thepotential benefits and limitations of future designs.
In summary, an ideal PSA will:
consider, but not quantify, all possible routes to a radioactive release,
consider, but not quantify all, possible ways of leading to a core melt.
identify those faults and fault sequences which are potentially majorcontributors and quantify those.
use best estimate analyses at all stages (probabilistic, transient and radiologicalanalyses).
keep the resultant logical models small enough to allow simple re-runs of theanalysis; this is how many significant insights into the reactors safetycharacteristics can be gained.
151
STATUS AND FUTURE PROSPECTS OFREGULATORY ISSUES OF PSA APPLICATIONIN THE UKRAINE
G. GROMOVUkrainian State Committee for Nuclear and Radiation Safety,Kiev, Ukraine
Abstract
From the regulatory point of view safety assessment means the safety analysis that should be submittedto the licensing authority for review and getting relevant license. That implies existence of acomprehensive system of regulatory criteria and requirements in compliance to which the submitted safetycase should be assessed.
Nowadays the Probabilistic Safety Assessment (PSA) is becoming one of the obligatory components ofthe safety substantiating materials to be submitted to the regulatory body for review within standardlicensing procedure. So it requires a definite and sophisticated system of regulatory requirements andPSA acceptance criteria to be elaborated and established within the general safety assessment regulatoryframework.
The paper briefly outlines probabilistic and quantitative criteria elaborated earlier in the USSR, whichnow are included in the safety regulations and standards in force in the Ukraine. Those regulations arevalid until introduction of a new nuclear legislation and safety regulations in the Ukraine.
General principles of DANU standpoint concerning future prospects of PSA regulation in the Ukraineare following:
1. Probabilistic techniques and approaches should be used to determine and demonstrate thesufficiency of established deterministic safety requirements.
2. Mostly appreciated are optimizational applications of PSA concerning safety:achieving a smooth risk profile across the plant level;
expansion of a radiation protection principles to the risk-oriented criteria (e.g. application ofALARA principle to the calculated risk characteristics of the plant at the design stage).
3. The regulatory body decision making criteria should be differed for every definite kind of PSAapplication.
4. As for absolute quantitative probabilistic criteria, it is intended to replace the only core melt andRPV destruction frequencies for risk acceptance criteria/correlations for whole range of possibleradiological consequences of PIEs, thus giving classification base for different modes of operations.
Taking into account the need for clear correlation and inter-connection of regulatory deterministic andprobabilistic criteria, initial revisions of the upper level safety regulations is intended to avoid thepostulation of any absolute quantitative risk-oriented criteria. Such definite regulatory requirements isreasonable to place into special PSA guidelines.
An important aspect of risk-oriented safety assessment approaches regulation is an appropriateorganizational structure of the regulatory body and its sub-divisions. So the paper also describes therelevant functional distribution between different laboratories of the Scientific & Research Center of theUkrainian State Committee for Nuclear & Radiation Safety.
152 In present in Ukraine 1— units are in operation on fiveNPPs- These are 1O units VVER-1QOG/~20 and 2 units WER-44O/213and the other 3 units of the type WER-100O/320 are now underconstruction and they wi l l be put into operation soon.
The three units of Chernofavl NPP are to be put out ofoperation on the decision of Ukrainian Goverment in the year1993-
In the nearest future we plan to run operation of theexisting NPPs only and we do not plan to build new NPPs. Inthis respect it is interesting to have a closer look at the NPPsof the type WER-1OOO/32O and WER-440/213.
Chernobyl NPP and "Ukrytiye" ( Shelter ) constructionconstitute another specific problem that needs furtherinvestigation, because there has not been complete understanding!and no programme of investigation has been adopted yet-
Dershatonmagl i ad as an independent organization exists justa little more than half a year therefore it is quiteunderstandable that we have to use at this stage the sets ofregulations that were in use in the former USSR.
That is first of all the set of regulations OPB-88 (GeneralSafety Régulâtions-88) and a number of other regulations on thelower level- These regulations specify probabilistic safetytechniques and in OPB-88» in particular» required safetycriteria are presented» that is! frequensy of core melting andthe probabitity of out of design releases of radionuclides.
In the new set of regulations that are being developed nowthe stress would evidently shift to the deterministic approach,that is, besides probabilistic parameters, deterministicprinciples would be tal-en into account.
First of all it can be ascribed to the fact that theexisting database far probabilistic analysis is not thorough andreliable* bccanse n<> int^c/rc*! approach for data collection aridfor r>rnf t-^ r-1 n« i<( th<? primary information on MP1J operation.= = c=C!-?' " "or common failures anc1 operator? failures las beer.fooD^ec- These shortages in the database are copecf with *~.be he t p-if fors!3T! sources.
The existing database (table 1) does r.ot tale into accounti-he =p<=c'f'.c = of the equipment and its operational conditionsfor different NPPs it is one and the same for all NPPs. Thus the"~=n'-= of the probabilistic analysis, r'cr example. forvV£p-1OOO/7.2O of different units and plants are practical Iv
equivalent- Therefore the existing probabilistic analysiscarried out for VVER-1OOO/7.2O and VVEP.-44O/21" do not reflectlife cycle changes in the equipment.
I would like to dwell upon PSft for VVEP-1OOG/32O.In the analysis several variants has been considered, one
of them corresponds to the existing technological regulationsand design, in the rest of the variants there are variations inorganisation of the operation of the safety systems duringcapacity operation of the unit and some insignificant changes inthe design have been proposed- The aim of these changes is tocope with design safety drawbacks-
The analysis has been done for practically all initialinternal events of the accident:
- small leakage (dia 30) of the first circuit;- medium leakage <dia ISO) of the first circuit;- large leakage (dia 8OO> of the first circuit;- leakage from the first circuit to the second dia-lOO
(blowing up of the lig of the steam generator);- leakage of the second circuit in the dumping part;- leakage of the second circuit in the nondumping part;- disruption of normal heat removal in the second circuit
without loss of integrity!- power failure for up to 1 hour and 72 hour»
and with taking into account common failures and human errors.We stick to conservative assumption in the analysis- The
essence of this assumption is the following! when the fuelreaches the second design threshold, that Is, the temperature ofthe fuel surface increases up to 12OO C, further destruction ofthe core with the subsequent destruction of the containmenttakes p läse as the result of its melting through with themaximum radionuc1 ides release.
The results of this ana I vs is are a t ven in the table 2. Theweal point of this proiect is ! ow r e l i a b i l i t y of the function r.fcc-nt i n-'nifr liest- removal from the ci-.r*».
TV. = r-r"-M-'O<=e. ( Tr-:f»^'tr~' i^ M-u^ fc f t -t-Ji:"i^ 't=-:?r.-^* ; - n -• i t hr>•'"nc-'-n ?« acro<mt c-t minor des ; «TO changes <.ri the safetv5v=rem^ of the second circuit, permits to significantly increaser e l i a b i l i t y of the unit- it allowed us to Qive recommendationson oDerstion directed at "liberalisation" of periodicitv and *-Pe•rtr^rea-/ o* con*rci cf =otne safe~v =vsfems which are MC*cr-fica! 'n *-hi= project.

TABLET
1 NNIn/n
101
02
0304
05
06
07
11 Denomination
2Emergency feed-water pump(UH-15O-90)High pressure1 injection
1 <UH-130-110)Low pressurei n o ec t i on(UHP-800-230)TanfcFan, cooling air
Motor
Air operatedvalveMotor operatedvalve
08 Safety valve
09 Heat exchangerlOl Check valve
11
12
1314
! 151617IBl
192021
22l
Relief valve
Diesel generator
Battery
Distributingelectric circuit
Recti fier
TransformerSwitch (all types)System of properneeds provisionMain steam 1 meisolation valve
Type of failure
3Failure to startFai lure to runDamageFailure to startFai lure to runDamage
1 eakageFailure to startFailure to runDamageFailure to startFai lure to runFailure to openFailure to cloa*Failure to openFailure to closeFailure to closeFa i 1 ure to rema > nin positionFailure to openFailure to closeFailure to remainin positionLeakageFailure to openFailure to closeFailure to openFailure to closeFailure to remainin pos i t i onFailure to start1 Failure to run2 Failure to runDamageTailure to functionFailure to function
^allure to function
Failure to functionFailure to functionFailure to run
'ailure to functionai lure to function'ailure to function
Failure to open
Intensiv! ty of failure I/hourMedium
43. OE-630. OE-621.0E-6B.3E-650.0E-646.0E-6
0.01E-61O.OE-61O.OE-6130.0E-69.0E-73.0E-63.0E-63. OE-65.OE-63.0E-63.0E-3/D
6.OE-71.OE-2/D
1 .OE-60.3Œ-63. OE-69. OE-62.OE-2/D
5.BE-31 .SE- 31.5E-31.3E-4l.OE-61 .OE-6
3. OE-6
l.OE-5l.OE-6l.OE-7
6.0E-78. OE-65. OE-6
l.OE-6
MaximumS
9. OE-690. OE-684. OE-625. OE-6ISO. OE-677. OE-6
0.1E-630. OE-630. OE-6300. OE-620.0E-725. OE-611 .OE-69. OE-613- OE-61 3. OE-66.OE-3/D
36.OE-73-OE-2/D
5. OE-63. OE-69. OB-690. OE-64.OE-2/D
9.1E-54 . SE-34.5E-31.5E-43. OE-65- OE-6
IS. OE-6
8.0E-56. OE-620.OE-7
30.0E-724. OE-611.4E-6
-
Minimum6
0.9E-6/H7.SE-63. OE-61 .7E-6
24. OE-6
-
_0-6E-7l.OE-61 . 4E-61.4E-6l.OE-61 -OE-6
0.9E-72.3E-3/D
-O.O6E-6O-6E-60.9E-6O-2E-2/D
3-3E-53-OE-45.0E-40-7E-4O-lE-60-3E-6
-
0-25E-50.5E-60.02E-7
1.5E-70-8E-6
-
-
Time of
7363611363to5
24
-
22-
\
|
-1O
24
162306--
10
---
-2410
-

154 TABLE D.
INN i n i t i a l events ofIri/n the accident
1 li-MKaRe of the secondIcircuit in the nondum-Iping part
;' ll^aKase of the secondIctrant in the rturapin«I part
.1 I Disruption of normalI heat removal In theI second circuit withoutI loss of integrity andItechnol. condenser (TC)
1 Disruption of normalhedt removal In the
Isecond circuit without1 loss of integrity andIwith of TC
b I-aree leaKage of theIflrst circuit
6 Medium leaKaee of thefirst circuit
Y ara n leaKage of thefirst circuit
8 1 LeaKage from the firstIcircuit to the second
9 (Power failure for UPIto 72 hour
ilO Power failure for UPIto 7ao hour
Proba-bili tyof IRA
l/year
l.OOE-4
l.OOE-3
7. OOE-2
3. OOE-2
3. 20E-1
l.OOE-3
3. 20E-3
l.OOE-3
7. OOE-3
l.OOE-4
Total
Probability of core damaye
Var. 1 1 Var. Zabs.l/year8. 47E-7
1.45E-5
5. 46E-6
2. 37E-4
0. 60E-7
4. 50E-8
E. 06E-5
6. 37E-6
1. 25E-4
2. 97E-6
3. 95E-4
relat.X
<1
3.67
1.35
60.00
<1
<1
0.52
1.61
31.65
0.75
100
abs.I/year8. 42E-7
1. 35K-5
4. 76E-6
E.05E-JI
9. OOE-7
4. 70E-8
1. 88E-6
6. 50E-6
i.oeE-i
a.6tE-6
3. 36E-1
relat.•f.<1
3.99
1.11
60.65
<1
<1
0.56
1.92
30. 18
0.78
100
Var. 3 i Var. tabs.l/year8. 51E-7
1. 65E-5
5. 70K-6
£. 51E-1
1. 80E-6
1. 30E-7
2.fl3E-6
1.05E-5
1. 18E-1
2.88E-6
1. lOE-t
relat.X
<l
'1. OP
1.11
61. ?.l
<1
<1
0.59
2.55
28.78
0.70
100
abs.l/year8. 42E-7
1. 35E-S
1. 76K-6
———————?.. 05E-1
9. OOR-7
l. 32E-7
2.22E-6
1.09E-5
1. ORE-1
2. ME-6
3. IRE-4
relat.y.< l
3. VI
1.39
59.9
<1
<1
0. b
3. 18
29.8
0.77
100
Var. b
dbs.l/yoaj-8. 42|.: -7
4. 56IV-6
9. 99K-7
.1 14lî-h
9. OOK-Ï
I.3RK-7
2.22E-6
1. 09E-5
?.. 39E-5
1.21E-6
ß. QOK-fi
n;lal.X
1
*>. Y
1.2
43
1. 12
<1
a TI
13.6
30
1.5 1
100 ]

ROLE OF PSA IN LICENSING, REGULATIONAND DESIGN AS APPLIED IN THE NETHERLANDS
M.F. VERSTEEGNuclear Safety Department,The Hague, Netherlands
Abstract
A historical perspective of PSA applications in the Netherlands is provided in the paper. PSAprogrammes for existing NPPs are briefly overviewed. An information concerning future PSA activities isalso provided. Regulatory guidance and pre-conditions related to PSA applications are discussed.Regulatory use of PSAs in licensing process is briefly described. Current PSA activities for new andadvanced NPPs are also presented.
I. PSA APPLICATIONS IN THE NETHERLANDS;A HISTORICAL PERSPECTIVE.
155
Although, there are only two operating nuclear power plants (NPP's) in theNetherlands and a further expansion of this small program is still undeci-ded. Probabilistic Safety Assessments (PSA's) play a major role in NPPlicensing and regulation. PSA's are necessary for obtaining a constructionlicense for a new NPP, as well as in the required periodic safety review ofan existing NPP. It is evident that in both cases the results will havedesign implications.Before Chernobyl two new nuclear power plants were foreseen in the Nether-lands. To show compliance with the at that time newly postulated environ-mental safety goals for nev hazardous installations, a level-3 PSA wasforeseen to be part of the siting and licensing procedure. Such a PSAshould aim at a more global/integrated assessment of the plant safety. Itshould contain an element of overall adequacy, in that it is deemeddesirable to be able to compare the assessed safety-related capabilities ofa NPP against the probabilistic safety criteria and objectives (PSC)1' 2
which were formulated by the Dutch government at that time.In the mid-eighties the Dutch government had adopted a more general andintegrated safety policy regarding potential hazardous industries andactivities (not only nuclear). This 'external* safety policy explicitlyreferred to the safety of each single individual in the vicinity of ahazardous plant and of the population as a whole. Explicitly a verificationstep in relation to pre-set probabilistic risk criteria was included inthis policy.
Because of the aforesaid 'external' safety policy, a PSA would not onlyplay a role in identification of weak spots in the prevention and mitigati-on of severe accidents, but also a leading role in a verification process.Although these probabilistic safety criteria have been developed to createa yardstick for proper assessing the risk of new hazardous industries,these criteria have recently been declared to be applicable to existingNPPs as well.
One application would be the use of the PSA for siting. It can be used tojudge the acceptability of a proposed site or to compare the alternativesin this respect.
After Chernobyl the decision to expand the nuclear power capability waspostponed. The government decided to reconsider the nuclear option. Severalstudies were initiated to help them with this decision-making process. Amajor part of these studies was devoted to safety related issues of theexisting Dutch NPP's. One of these studies was about the possible accidentmanagement measures of the nuclear power plants Borssele and Dodewaard.This study, performed by GRS, recommended to perform at least a level-1 PSAfor both these plants with the purpose to optimize plant improvements.Thus, identification of the 'weaknesses' and 'imbalance* in the design andoperation features that could be improved (e.g. by backfitting, accidentmanagement or changes in the conceptual design). In other words, the PSAshould give a clear picture of the various scenarios leading to core melt,the relative frequency contribution to the core melt frequency of eachinitiating event group, and the spectrum of resulting plant damage states.The PSA's had to give guidance to the development of possible risk reducingmeasures for preventing and/or reducing accident scenarios as well as formitigating the consequences of accidents.Recently both utilities have been asked to extend their PSA's to a fullscope level-3 PSA. A comparison of the results with the aforesaid PSC willbe inevitable. Also in this case results may lead to design changes.Although, the present policy of the Dutch government is not to expand thenuclear option during the current governmental period, there is an incenti-ve to keep the nuclear option open for the future. This incentive causedthe start of a four-year research program with two supplementary objecti-ves. The first objective is to intensify the nuclear know-how and skills inthe Netherlands, whilst the second objective is to look if the licensing ofany evolutionary light water reactor and/or advanced reactor is feasible inthe Netherlands. PSA tasks were envisaged to be an integral part of thisresearch program.II. PSA's FOE EXISTING NPP's.
II. 1 PROGRAMMES OF PLANT SPECIFIC PSAs.
After Chernobyl the decision to expand the nuclear power capacity waspostponed. The government decided to reconsider the nuclear option. Severalstudies were initiated to help them with this decision-making process. Oneof these studies was about the possible accident management measures of thenuclear power plants Borssele and Dodewaard. This study, performed by GRS,recommended to perform at least a level-1 PSA for both plants with thepurpose to optimize plant improvements.For Borssele, a. 472 MWe KWU-PWR, both the licensee and the licensingauthorities agreed with this proposal. This resulted in a bid specificationfor a level-2 minus PSA. This PSA-project was awarded to the combinationKWU and NUS.
Early 1990 bid specifications for a level 2 minus PSA of the Dodewaardplant (58 MWe BWR) were send out by GKN (utility which operates the

ice Dodewaard nuclear power plant) and KEMA. The study was awarded to ScienceApplications International Corp. (SAIC) from the USA.
II.2. OBJECTIVES.
After Chernobyl the Dutch regulatory body asked in 1988 both nuclear powerplants to perform a level-1* PSA. This means a level-1 analysis pluscontainment analysis. In formal discussions with the licensee some guidancewas given regarding the objectives, scope and boundary conditions of thesePSAs.As indicated above, the main objectives of the PSAs should be the asses-sment of the relative weaker points in the design and operation of thepower plants, in order to support the design of accident managementmeasures, and to support backfitting. An assessment of source terms, publichealth risks, etc., was regarded as unnecessary at that time. Mainly,because it was feared that the focus would only be on the final number(s).But even without these additional source term and level-3 analyses, thetendency to produce only numbers for whatever political reasons, and no in-sights, had to be avoided.Although, these PSA's will be used to identify those safety issues withsome significance, their resolution will be based on more conservative anddeterministic assessments.Recently, this one-time ad hoc request for a PSA has even got a moreofficial and legal basis by the requirement of a periodic 10-year safetyreview. This requirement is included in the operating permits of bothplants. On basis of this periodic 10-year safety reviews (including a PSA)backfitting is required if safety can be improved significantly at reasona-ble costs, and the design of the measure fits in the total existing designand/or operation. The reasonableness of the costs should be viewed inrelation to the next 'long' period of operation (10-years). However, designor operational features which are regarded as shortcomings or violationswith respect to the original safety level as assumed during granting thecurrent license for operation, need to be resolved immediately.The regulatory requirements as well as the wishes of the licensees themsel-ves regarding the objectives of the PSAs were translated by the licenseesin their respective bid specifications:- To identify and analyze accident sequences, initiated by internal andarea events, that may contribute to core damage and quantify thefrequency of core damage.
- To identify those components or plant systems whose unavailability mostsignificantly contribute to core damage and to isolate the underlyingcauses for their significance.
- To identify weak spots in the operating, test, maintenance and emergencyprocedures which contribute significantly to the core damage frequency.
- To identify any functional, spatial and human induced dependencies withinthe plant configuration which contribute significantly to the core damagefrequency.
- To rank the weak spots according their relative importance and to easilydetermine the effectiveness of potential plant modifications,(both backfitting and accident management)
- To provide a computerized level -1 PSA to support other living PSAactivities like optimization of Tech Specs, Maintenance Planning, etc.
- To transfer technology and expertise to the licensee to make them fullycapable to evaluate future changes in system design, operatingprocedures and to incorporate these changes in the 'Living' PSA.
11.3 CURRENT STATUS OF PLANT SPECIFIC PSAs.
The actual PSA-work for the Borssele Nuclear Power Plant started 1 Septem-ber 1989. The study was finished in february 1992 after most of thecomments and remarks of the last out of a series IAEA reviews(IPERS-review)were processed by the contractors.In april 1990 SAIC started with the analyses for the Dodewaard NuclearPower Plant. The study was finished in april 1992 after processing theremarks and comments of an IPERS-review.
11.4 ADDITIONAL FORTHCOMING STUDIES.
During the first IAEA IPERS review of the Borssele PSA several suggestionswere made for inclusion in the PSA, or as an extra additional study after-wards. Because, the main purpose of this IAEA IPERS review was to look ifthe bid specification, contract proposal and regulatory wishes were, moreor less, in good agreement, the recommendations being made were veryimportant for the follow up of the studies and for getting a better feelingof the state-of-the-art. The review emphasized the need to pay attention tothe so called human errors of commission, to include shut-down states andtransition states in the operating states being analyzed. These recommenda-tions were translated by the regulatory body as a requirement for lateradditional studies.Recently these requirements were expanded by asking for an analysis of thenon-power states. Apart from this expansion, the Dutch government asked toexpand these studies to a full scope level-3 PSA. That a comparison withthe aforesaid probabilistic risk criteria will be made is obvious.Also, recently a requirement for a periodic 10-year safety review isincluded in the operating permits of both plants. On basis of this periodic10-year safety reviews (including a PSA) backfitting is required if safetycan be improved significantly at reasonable costs, and the design of themeasure fits in the total existing design and/or operation. The reasonable-ness of the costs should be viewed in relation to the next 'long' period ofoperation (10-years). However, design or operational features which areregarded as shortcomings or violations with respect to the original safetylevel as assumed during granting the current license for operation, need tobe resolved immediately.
11.5 REGULATORY GUIDANCE AND PRECONDITIONS.
Primarily the PSAs should be state-of-the-art and in broad accordance withNUREG/CR-2300 "PRA Procedures Guide" (ch. 3 to 6) and NUREG/CR-2815 "PSAProcedures Guide". For the containment analysis the restriction was giventhat the computer code MAAP would be unacceptable as the prime analyzingtool, due to the discussions between the US-NRC and EPRI at that time(1988). However, for sensitivity studies and interpolation between results

157
from other codes, like the Source Term Code Package (STCP) or MELPROG, noobjections remained for the use of MAAP. In the human reliability analysisemphasis should be put on the so called cognitive errors.It was also communicated to the licensees that the assumptions being mademust be realistic, state-of-the-art and traceable. This means that CCFlimits must be realistic (ß-factors < 10"* are unrealistic!), that operatorrecovery actions can only be claimed when written procedures exist, thatavailable time-scales for performing human actions must be large enough tobe realistic. This means also that the data being used must be plantspecific as much as possible. The assumptions being made (e.g. systemsuccess criteria) should be based on plausible and consensus assumptions.These assumptions however, should be backed up by uncertainty and sensiti-vity analyses for a more confident interpretation of the significance ofthe results.
A FMEA was recommended, but not required. However for the Borssele PSAFMEAs have been carried out for the system modeling of the support systems(e.g. instrument air or component cooling water).
II.6 FSA REVIEW PRACTISES.
Both PSAs were characterised by a large involvement of plant staff. Animportant aspect of this involvement was the review by the licenseestogether with the research institute of the electric utilities, KEMA. Apartfrom these reviews, the regulatory body monitored and reviewed the PSAactivities. Last but not least, the IAEA reviewed both PSAs via the socalled IPERS program (International Peer Review Service).For Borssele the first phase of a peer review by the IAEA took place in thelast week of August 1989. This review involved the scope of the project andhow this scope was translated into a project proposal by the contractor.The review was conducted by a team of PSA specialists under the IAEA'srecently initiated International Peer Review Services (IPERS). The peerreview was split into three phases. A second review was conducted in June'90, approximately halfway the project. The last review took place inOctober 1991 after 95Z completion of the PSA. In combination with the firstpeer review a training course on the review of PSA's was given by the teammembers of the IPERS-team for staff and consultants of the Dutch regulatoryauthorities.For Dodewaard the first phase of an IPERS Peer Review took place in May '91after approximately 60Î completion. The second and last review took placein February '92 after 100Z completion.
III. PSA's FOR HEW NPP's.
III.l LICENSING; SHOWING COMPLIANCE WITH PSC.
Because PSA's play an essential and central role in the aforesaid 'exter-nal1 safety policy, a PSA is nowadays part of the licensing procedure.Before the construction licence can be granted, compliance has to be shownwith the aforesaid risk criteria3. This means that the calculated risk
should be well below the criteria for both individual fatality risk andsocietal prompt fatality risk. During the construction phase this pre-construction PSA has to be updated with more precise data and detaileddesign information to obtain the commissioning and operation permit.In case of comparison with probabilistic safety criteria/objectives, oneshould keep in mind that the criteria and objectives are only meaningful ifthere is a consistency between the PSC and the scope, definitions, assump-tions being made and the boundary conditions of the PSA.
III.2 LIMITATIONS OF • SHOWING COMPLIANCE".
However, a warning must be given here. It may look that 'best estimates'remove some of the uncertainties involved by using consensus for what ishoped to be the most likely combination of inputs and phenomenology. But,even 'best estimate' assumptions, are sometimes subjective. Best estimaterisk values may be the most likely outcomes for the consensus assumptions,but may at the same time present an overly false picture of the risk. Alsothe assessment of the associated uncertainties is subjective. What oneanalyst might consider quite reasonable as representing the range ofuncertainties, might be totally unreasonable to others. But an uncertaintyanalysis, as well as a sensitivity analysis based on consensus and plausi-ble assumptions are highly valuable for identification of the most sensiti-ve contributors to the risk and to provide a plausible guess of theirlikelihood. There is no guarantee that a true answer will lie within theband of uncertainty which has been assessed.In practice all internal and external events and all operating states whichare safety relevant are to be included in the PSA. This is because in thiscase the PSA is an integral assessment of the nuclear power plant (NPP) asit is located in its environment. On the other hand there are still a lotof problems in showing compliance with the aforementioned risk criteria andgoals. In assessing the risk of a nuclear power plant one should be awareof these difficulties.The most important insights provided by a PSA ate engineering ones, i.e.those related to identification of potential plant vulnerabilities. Suchresults of PSA's are usually not undermined by the uncertainties involved,given that the PSA has a relevant scope, uses state-of-the-art approachesto modelling topics and has been subject to an adequate review process. Assuch, PSA's constitute a necessary supplement to traditional deterministicstudies. In addition to the quantitative perspective on plant safety, thePSA's provide in many cases a more balanced and realistic picture than thepredominately conservative deterministic analyses. Both types of analysesare subject to uncertainties, but the PSA approach makes them in,a certainextend visible. However, incompleteness as well as some elusive contribu-tors to risk cannot be quantified. Therefore, the most appropriate way touse the quantitative results of a PSA is in a relative sense and not as anabsolute yardstick, as this is less sensitive to the uncertainties invol-ved. This fact has been recognized by both experts in the nuclear communityas by experts which can be characterized as critical opponents of nuclearenergy. They both agree4' 5l ' that PSA techniques are not yet developed tothe point that it can be used as a definitive means of determining whetherthe numerical target has been met. The range of uncertainty is still toolarge for use of PSA in 'bottom line' evaluation. Both parties agree that
j Ijjj PSA - if its limitations are kept in mind - has a number of useful applica-tions. However, to what extend PSA's are useful is strongly disputedbetween the two groups.
111.3 OTHER PSA REQUIREMENTS IN LICENSING.
Also in the more traditional deterministic licensing approach some implicitprobabilistic aspects play a major role. Since several years the Nether-lands have adopted the IAEA safety codes (as well as the underlying safetyguides) as a legal basis for their regulatory work. Especially the SafetyCode for Nuclear Power Plant Design (IAEA Safety Series 50-C-D) has to bementioned here. In this safety code the postulated iniating events (PIEs)play a central role. These PIEs are those postulated and/or identifiedanomalous but credible events (or combination of events) with a potentialfor serious consequences which have to be accommodated by the design. It isin the selection of the PIEs that implicitly probabilities are used todecide if an event (or combination of events) is credible.The design basis of a NPP needs to specify those safety requirements forthe plant design that, by an adequate implementation of these requirements,the sensitivity to PIEs will be reasonably low, and that the resultingaccident conditions will fulfil the defined radiation protection require-ments. To confirm the design both traditional safety analysis and PSA arerequired. The selection as well as the consequences of event sequencesresulting from a PIE have to be analyzed and evaluated in a conservativeand deterministic way to check if those consequences fall within theradiological acceptance criteria. On the other hand a PSA is required todemonstrate that the NPP is designed against PIEs that the probability of alarge release is not greater than 10"6/reactor-year, and that there is nosharp increase of risk just below the probability of 10'6/reactoryear.Traditionally PSAs were used to provide better insights in the risksassociated with the beyond design basis area of a NPP. However, the undeni-able offspin as well as the powerful potential for assissing the designbasis area have been recognized. Therefore, a PSA will increasingly be usedas a tool for design confirmation.
111.4 STUDIES; CURRENT PSA ACTIVITIES FOR NEW AND ADVANCED NPP's.
The aforesaid four-year governmental sponsored research program was dividedin several sub-programs. The first sub-program was carried out jointly bythe Netherlands Energy Research Foundation (ECN), the research laboratoryof the electric utilities (KEMA) and a Dutch engineering and contractingcompany NUCON. It started with an extensive review of the SBWR, AP600, SIRand Candu3 reactor designs. This review included an analysis of PSA resultsand insights as far as these were available. Also the possibility if theresults could be used for comparison with the Dutch PSC was part of thisreview. Because at the time of the project initiation only preliminaryPSA's were performed for all four reactors due to their early design stage,the outcomes could only be used in a very limited and indicative mannerregarding a comparison with PSC. The third stage reactor-designs (sometimesreferred to as inherently safe) MHTGR, PRISM, SAFR and PIUS were reviewedlast year. For these latter reactor designs no preliminary PSA's wereavailable.
The second sub-program is structured around a participation of the abovementioned institutions in the development of the SBWR design. A specialcooperation agreement with General Electric was signed, whereby theseinstitutions were allotted tasks in accordance with their specific capabi-lities and GE's need for support. In this sub-program PSA activities forman important part of the total Dutch input. Because the SBWR is still inthe design stage, an interaction between PSA and design might be expected.Especially, the assessment of transient process behaviour inside thereactor coolant system as well as the containment with RELAP-SCDAP (ECN),MELCOR (ECN) and TRAC (KEMA) has to be mentioned, as well as the assessmentof some containment issues. These assessments will undoubdly be used forthe resolution of some severe accident issues for the SBWR. Especially thestructural analysis of the RPV and RPV internals (ECN) under core degrada-tion conditions will benefit from these analyses. Where GE uses MAAP, usesECN MELCOR. The resulting different insights, e.g. in MELCOR is the debrisnot always coolable, highlight the uncertainties regarding the specificSBWR safety issues. Also a consequence analysis based on the afore-mentio-ned containment analyses and some generic core melt scenario's will beperformed within the scope of this sub-program by means of the COSYMA codeto assess the consequenses of large releases.
IV. REGULATORY USE OF PSA1 s
The regulatory body uses the current PSA as a common basis of understandingin discussions regarding plant modifications, backfitting, etc. In thiscase the PSA is not a replacement of regulatory work; it only assesses andguides this work.Another use is to provide staff personnel of the regulatory body analternative and complementary look on safety issues and safety decisions.Because, traditionally many safety decisions were made solely on the basisof deterministic studies and/or engineering judgement, the probabilisticaspects were often overlooked. But the PSA offers an extensive set ofdeterministic analyses as well.The PSA can also optimise the various areas for attention within theregulatory body regarding safety issues, and indicating priorities withinthese areas for attention.Because, the regulatory body has besides the traditional controlling andinspection tasks, a stimulating and initiating role as well, an importanttask of the regulatory body is to promote the use of the PSA as an operati-onal tool for the licensee. Because a PSA has so many potentials forhelping to improve the safety of a plant, that it would be a waste if theoperating organization would not make use of the full range of capabilitiesof a PSA. Optimization of Techspecs, maintenance strategies, test inter-vals, etc. are possibilities to think of.For future PSA activities PSA-guidelines are in preparation. The guidelineswill be structured around the drafted IAEA PSA guidelines 'Procedures forConducting Probabilistic Safety Assessments of Nuclear Power Plants". An

introductory document has been written by the regulatory body. The possibleobjectives, scopes and their relation is given in this document. Because,in the Netherlands risk criteria have been formulated and will be used forreasons of comparison in the external safety policy of the Dutch govern-ment, this document describe some pitfalls in comparing PSA results withthese risk criteria and objectives. Therefore some guidance is given in howto deal with uncertainties and very low probability numbers. Especially, inwhich circumstances it is allowed to cutoff the frequencies of accidentsequences and single events in the extreme low probability domain withoutcausing a significant underestimation of the risk, and how to do it.
PSA SOFTWARE AND UTILIZATION EXPERIENCEIN REACTOR PLANT DESIGN
O.B. SAMOILOV, E.V. FROLOV, A.M. BAKHMETIEVOKB Mechanical Engineering,Nizhny Novgorod, Russian Federation
Abstract
REFERENCES
1. M.F.VERSTEEG, External Safety Policy in the Netherlands; an Approach toRisk Management, Journal of Hazardous Materials 17, page 215-222, 1988.
2. M.F.VERSTEEG, The Practice of Zoning; how PSA's can be used as aDecision-making Tool in City and Regional Planning, ReliabilityEngineering and System Safety 26, page 107-118, 1989.
3. M.F.VERSTEEG, Showing compliance with probabilistic safety criteria andobjectives. Reliability Engineering and System Safety 35, page 39-48,1992.
4. OECD-NEA, Applications and Limitations of Probabilistic Assessment; Noteon the Outcome of a Workshop held in Santa Fe, New Mexico, USA,4-6 September 1990, NEAlCSNIlR(91)2, Paris, 1991.
5. GREENPEACE, IAEA Safety Targets and Probabilistic Risk Assessment; Stateof the Art, Merits and Shortcomings of Probabilistic Risk Assessment, AReport prepared for Greenpeace International by the Gesellschaft Fürökologische Forschung und Beratung mbH, Hannover, 1989.
6. INSAG, A Review of the Report "IAEA Safety Targets and ProbabilisticRisk Assessment, prepared for Greenpeace International, A Report by theInternational Nuclear Safety Advisory Group, INSAG Technical Hote No. 3,IAEA, Vienna, 1991.
The report presents information concerning methodology and computer software used in PSA in thearea of reactor plant design in OKB Mechanical Engineering, Russian Federation Basic elements of PSAmodelling are described, including unacceptable plant state criteria, system reliability techniques, dataassessment, dependency analysis and human reliability analysis Information is also provided oncomputer software used m accident model quantification
Some practical PSA results related to AST-500 district heating plant are briefly presented
159
INTRODUCTION
Methodology, software and experience of probabilistic safety analysis(PSA) utilization in practice of the designing by OKB Mechanical Engineeringof enhanced safety WWERs for nuclear district heating plants (NDHP) andnuclear power plants (NPP) are discussed in the report.
At the designing stages PSA is used for the attainment of the followinggoals:
- choice and optimization of the basic engineering decisions on systems importantfor safety;
provision of safety design decisions balance due to the revealingand exclusion of "weak points" in the design ;
- working out of accident control procedures ;- corroboration of the reached in the project safety levé! of the plant, basing
on the core damage probability assessment.Probabilistic safety analysis is based on lieienninist.c analysis of
thermophysicaî processes in all the er cogencies and accidents with the loss of normalheat removal, primary circuit loss-of-tig -ness and inadvertent positive reactivity insertion.
To perform PSA in OKB Mech.'-"cal Engineering a software system TREESwas developed which allows to an., vze safety systems reliability, to constructand analyze event trees in accordance with the recommended by IAEAmethods of PSA performance.
Main PSA results are presented for AST-500 reactor - a new generationnuclear district heating plant developed in OKB Mechanical Engineering.

160 I. UNFAVOURABLE STATES CRITERIA 3. DATA BASES ON EQUIPMENT RELIABILITY
In course of the analysis was evaluated the probability of unfavourablereactor states, aggravation of which can lead to the core damage. The following criteriaof unfavourable states were used :
- coolant level reaches the upper core boundary in course of its leakage fromthe reactor ;
- primary circuit pressure rises up to the values, correspondingto the pressure of reactor vessel break down at realization of hypothetic defect,the size of which is 0,25 from the wall thickness and the worst characteristics ofthe material.
It is obvious that the aforementioned criteria are conservative enough for thefollowing reason. Coolant level decrease in the reactor do not sure lead tounfavourable consequences with the core damage. Even at partial core uncoveringthe fuel element's cooling by steam is kept which prevents from their overheating.Timely coolant level recovering excludes fuel elements failure. The second criterionis also conservative because the realization of the given size defect and ofthe worst mechanical characteristics is low probable; for defect-free vesselthe ultimate pressure is considerably higher than the value chosen by the stated criterion.Nevertheless, direction of attention toward more strict criteria at the developmentof balanced design decisions on safety, utilization of which gives the upperassessment for the core failure probability, is justified in the opinion of the reactorplant designers.
2. SAFETY SYSTEMS RELIABILITY ASSESSMENT
When analyzing safety systems reliability, elements' independent failures,common-cause failures of the same type equipment and personnel errors wereconsidered.Systems elements were contro;!ed id non-controlled at reactor poweroperation. Cotrolled elements had apparent nd latent failures. Latent failuresare revealed at periodic control of s\ em's serviceability. Apparent failuresare revealed at the moment of their e.-tergence or at the instruments readingscontrol by personnel.
It was assumed that the element's time to failure was distributed byexponential law in the calculations of safety systems reliability.
System's serviceability success criteria condition was presented as sequential-parallel logical diagram. Analogous to the fault tree in the logical diagramare shown different combinations of the failed elements leading to the system'sfailure. Calculations of safety systems failure probability wen- made using known methodof minimal cut-sets.
As data on equipment reliability are used statistic data on the analogs operationexperience on NPPs with WWER reactors and on nuclear ice-breakers. If there wereno national data on separate elements, data from IAEA/1/data bank were used.When choosing equipment reliability characteristics basing on IAEA data bank,conservative approach was used, which allowed to obtain assessments indesign margin.
The aforementioned approach is:- if in the bank are given different values of reliability for one and the same
element, the worst value was used for calculations;- if there is one val of failure rate or probability of failure on demand,
for the calculations is used value increased by a factor of three (characteristicvalue of error factor).
4. COMMON-CAUSE FAILURES
When evaluating safety sy ';ms reliability and determining emergency sequencesprobability, all types of potem .. y possible dependences between the elements,channels and systems are analyzed :
- dependence upon initial event ;- structural-functional dependence, conditioned by presence of common structural
elements or auxiliary systems ;- dependence, conditioned by equipment design uniformity including due
to the personnel errors.Two first types of dependences were taken into account when making emergency
sequences and determining safety systems serviceability conditions basing on thedeterministic account of the existing dependences betweçn systems and elements.
To take into account the dependences, conditioned by equipment design uniformityand personnel errors, together with the elements of qualitative, deterministic analysis wasused the probabilistic model of binominal failure rate (BFR-model) .
For the system, consisting of "m" uniform elements in accordance with BFR-model three types of failures are considered :
- independent elements failures with rate X ;- failures because of non-lethal shock, if its appearance rate is M , each of the
elements independently of others can fail with P probability;- failure because of lethal shock, if it's appearance rate is (J , all systems elements
fail by common cause.In reliability calculations conservative assessment is used for common-cause failure
probability Q ^k (t) of "k" or more elements in the system, consisting of "m" elementsin (0,t) interval

161
Models parameiers were determined basing on data on national experience ofanalogs operation, from literature /2,3/ and some other sources
The given approach to common-cause failures taking into account is conservativeenough especially for the elements, actuation of which do not need an v external powersources and is performed due to potential spring energy or its own weight
5 PERSONNEL ERRORS
When performing probabilistic safetv analysis the following personnel errorstvpes were taken into account
- personnel errors, made before accident beginning ,- personnel errors.initiatmg the emergency situation ,- personnel errors at the emergency control of the plant
Errors of the first group were analyzed in course of safen systems reliabilityassessment and personnel error was <. >nsi red as an arbitrary element of logicaldiagram, which is able by himself or together with equipment failures to formminimal cut-sets
Errors of the second group were taken into account at the assessment ofthe considered initial events occurence rate. Personnel errors of the third groupwere taken into account at event trees making and analysis.
When analyzing errors, made by personnel after the initial event occurence,the stages of the emergency situation detection and diagnosis setting up as well asoperator actions trees were analyzed. Personnel's reliability was determined usingmodels of personnel error probability dependence on available time realized withinTHERP method /4/. Utilization of these dependences allowed to realize multiparameterdependence model "time-personnel reliability", taking into account the following factors
- relationship between available and necessary time for action performance,- personnel qualification;- stress level;- means for processes and systems state control,- type of the problem under solving
Operator actions undertaken by him in accordance with the chosen methodof situation control were analyzed using operator actions trees and home andforeign data banks on errors probability.
6 SOFTWARE TREES
To perform probabilistic safety analysis of the designed plants in OKBM wasd=\ eloped software system TREES.
It consists of two independent programs, one of which is intended forsafety systems reliability analysis, the other one - for the event tree making and analysis(Fig 1)
Software allows to anahze large failure trees, including safety systemscombinations, forming emergency sequences in the event tree
INITIAL DATA INPUTINITIAL DATA INPUT
SYSTEMS RELIABI-LITY DATA BASE
INITIAL DATABASE FOR ET
FTBASICEVENTS
ET FORMATION
CALCULATION OFtl
PLOTTING
ANALYSIS OFIMPORTANCE ANDSENSITIVITY
RESULTS OUTPUT RESULTS OUTPUT
FIG 1 TREES code block diagram
Failure tree can include up to 2000 base events and up to 1000 logic operatorsDifferent methods for provision of high effectiveness of minimal cut-sets generationalgorithm for failure tree are: modularization, convolution of cut-sets sifting out byprobabilistic criterion To perform safety systems reliability calculations with theaccount of common-cause failures BFR-model and - factor model were realized
Svstem event tree is cons-ucted b sing on- matrix of dependences oetween safety systems ;- consequences matrixes for emergency sequencesSoftware allows to analyze up to 30 event trees, each of which may include
up to 1000 emergency sequencesFig 2 gives event tree structure and includes initial event, saferv svstems set
influencing the accident s development together with their rehabilitv assessmentaccident's development wa\s and the results table

162 IE
o —A«
A
QA
B
Q,
QA.
D
QD
Q«.Q.
KOC
C,
S
c,
s
TKOC
T,
T,
T,
T.
T,
PC
P,
P,
P,
P,
P.
P,
QKOÄ
Q,Q,
Q,Q,
Q,Q.
Q,
PKOC
P,
P,
P,
P,
P.
P,
N
1
2
3
4
5
6
7
In the conditions of separate systems failure, the designed enhanced
IE - initial event
A, B, D - systems, influencing emergency situation development; solid line iswithout branching-system's states do not influence the cousequences forthe given chain; dotted line - dependent failure of the system due tothe failure of preceding systems.
Q - probability of partial or complete system's failure
KOC - classes of the determined states
TKOC - time for corresponding states reaching
QKOfl - probability of correcting personnel actions non-execution
PKOC and PC - rate of chains of accidents realization with the account or withoutthe account of correcting personnel actions
N - chain number (event tree branches)
FIG 2 Structure of event tree
safety plants (especially NDHP)time reserves for the accidents controltime reserves is included m the resulting
Software's capabilities allow touncertainty To analyze uncertainty Mon'e
Software TREES system was developedusing mode of dialog with user
are characterized by relatively largeTKOC parameter, characterizing these
table of the event tree (see Fig. 2)analvze importance, sensimity andCarlo method is used,
as applied 10 the computer of EC type
7. AST-500 PLANT PROBABILISTIC SAFETY ANALYSIS RESULTS
AST-500 reactor plant has been developed in OKB Mechanical Engineering fornuclear district heating plants proceeding from the requirements of the enhanced safetyprovision of such plants in comparison with nuclear power plant.
Fundamental engineering decisions of AST-500 (see Fig. 3) were published widelyenough /5/. High level of the reactor plant's safety is conditioned by thefollowing main design decisions (Fig.4) :
- integral layout of the reactor with low coolant parameters (temperature -200 °C, pressure - 2,0 MPa) and its large inventory over the core ;
- absence of large diameter primary circuit pipelines ;- use of the reactor guard vessel as localizing and protective system ;
- all-conditions natural circulation of primary coolant ;- low fuel rating of the core, possessing the property of fission chain reaction
self-suppression at high circuits accumulating ability ;- organization of the emergency heat removal from the core at natural coolant
circulation over all circuits up to the ultimate heat sink;- low fluence on the reactor vessel ;- redundancy, physical channels separation and safety systems passivity, use
of self-actuating devices.Within the performed PSA for AST-500 plant the reliability of systems, important
for safety, was analyzed. Table 1 gives reliability assessments for some reactorsystems, obtained using conservative models of taking into account of common-cause failures of the same type elements.
AST-500 probabilistic safety analysis has been performed conformablyto the internal initial events. Unfavourable core states probability was estimated basingon fault trees making and on the analysis of numerous emergency sequences (ES).Calculation results of some most important ESs probability are given in Table 2.
It is important to note, that the base of NDHP safety concept is self-protectiveness, which is provided by nherent reactor properties, thereby largetime reserves are formed for taking cor -ting actions on the accident's control bypersonnel. As appears from the analysis the majority of determining ESs, time reservesfor personnel corrective actions (grace oenod) exceed 14 hours (see Table 2)
Table 3 gives concluding results of PSA for AST-500 plant. Point assessementof probability of unfavoured core states realization (for internal initial events)

FIG. 3. Schematic diagram of the ACT-500 reactor plant. 1 - primary circuit make-up system; 2 - boron solution tank; 3 - safety valve; 4 - emergency residual heatremoval system tank; 5 - district heating circuit; 6 - secondary circuit make-upsystem; 7 - secondary circuit loops; 8 - reactor; 9 - guard vessel; 10 - primarycircuit purification system.
Lawpower
potential,no boron
in ject ion
Integralreactorlay-out
Naturalreactorcoolant
circulation
Passive andself-actuated
safety-relateddevices
Safetysystems
r e l i a b i l i t y
»low coolantparameters<T=200°C,P = 2.0 MPa)
»low core powerdensity(27 kw/1)
»powerself —régulât ion
»no accidentswith borond i l u t i o n
»no largediameterpiping
«highaccumulatingcapacity»low RV fluence»no transientswith rapid RVcooldown
»no accidentewithpump's failure
•»self regulationof coolantflowrate
«guard vessel»emergency heatremoval undernaturalcirculation
»insertion of EPcontrol rodsunder gravity
«opening of ERHRSvalves underspring action
»closing oflocalizationvalves underspring action
»redundancy»diversi ty«separation»principle ofsafe failure
FIG. 4. Key decisions used to provide ACT-500 safety.

164 TABLE 1.
RELIABILITY ANALYSIS RESULTS FOR SOMESYSTEMS. IMPORTANT FOR SAFETY
Svstem Probability of failureon demand
ERHRS (3 channels failure)
IAC
PORD (failure of 5 from 6)
MS 2 (3 channels failure)
EP (failure of 12 rods or more)
EBIS (2 channels failure)
RPSS (2 channels failure)
EBDS (1 channels failure)
RVJ
6.6 'E-4
5.6 'E-2
7«E-4
1.05 -E-4
2-E-6
2.1-E-2
3.9 «E-3
4,4« E-2
l-E-2
ERHRS - emergency residual heat removal system
IAC - intermediate auxiliary circuit
PORD - power operated relief device
MS 2 - secondary circuit make-up system
EP - emergency protection system of the reactor (control members)
EBIS - emergency boron injection system
RPSS - reliable power supply system (diesel)
EBDS - emergency blow-down system
RVJ - reactor vessel joint
TABLE 2.
REALIZATION PROBABILITY AND TIME RESERVES FOR SOME MOSTIMPORTANT EMERGENCY SEQUENCES
N
1.
2.
3.
4.
5.
Emergency Sequence
"Stop-grid" + 3 channels of ERHRS +IAC + (5-6) PORD
"Stop-grid" + 3 channels of ERHRS +IAC + 3 channels of MS 2 + 1 channelof EBDS + RVJ
"Stop-drid" + EP + 2 channels of EBIS +3 channels of MS 2
LOSPS + 3 channels of ERHRS +IAC + (5-6) PORD
LOSPS + EP + 3 RPSS
Probability(point evaluation)
I/year
0,4- E-9
0.1- E-9
0.5-E-10
0.15-E-9
0.1- E-9
Timereserve
(grace-period)hours
17
15
14
17
14
"Stop-grid" - loss of heat removal to district heating grid
LOSPS - loss off-site power suplay

TABLE 3.
PROBABILITY OF UNFAVOURABLEREACTOR STATES
is ~0,3-10'4 I/year and is a conservative assessment of the core damage probability.Basing on uncertainty analysis assessments of 5% and 95% boundary
for the given safety index, which are 2 lO'12 and 0,6 10'8 I/year respectively, havebeen obtained.
TYPE OF ACCIDENT
LOCA
* PIPING RUPTURE* REACTOR VESSEL
LOSS -OF -INTEGRITY
MAIN HEAT EXCHANGERLEAKAGE
• HEADER RUPTURE• PIPE RUPTURE
LOSS OP HEAT REMOVALTO GRID CIRCUIT
LOSS OF OFF-SITE POWER
ATWS
INADVERTENT CONTROLRODS WITHDRAWAL
FOR ALL ACCIDENTS
INITIALEVENTRATE,1/R-YEAR
< 10'3
< lO'7
3MQ-4
< ID'1
3,5
0.13
0.8MO-S
< IO'1
ACCIDENTPROBABI-LITY PERR-YEAR
< 10-"
< 2*10-'°
4* ! O-io
< io-'°
ID-»
0.73*10-»
0.74*10-»
< 3*10-"
3,2*10-»
RELATIVECONTRIBU-
TION, %
0.3
6.2
12,53
31
23
23
1
100
CONCLUSION
1. Probabilistic safety analysis is used widely enough logether with deterministicanalysis in the design works on the development of enhanced safety reactor plants.
At early stages of the designing the probabilistic analysis is used for engineeringdecisions choice and optimization and at final stages of NPPs construction in confirmationof the achieved safety level.
2. To perform probabilistic analysis methodology is used which takes into accountIAEA recommendations on all aspects, determining PSA results, such aschoice and classification of initial events, choice of initial data on equipment reliability,taking into account common cause failures and personnel errors. Direction of attentiontoward "strict", conservative approach as for some methodic aspects allows to obtainthe upper estimate of the core damage probability.
3. The results of the performed PSA of AST-500 reactor plant for the nucleardistrict heating plants are presented here. The obtained results are evidence ofthe fact, that due to the developed self-protectiveness properties and use of passivesafety systems, the probability of serious core damage over the whole range of initialevents is not higher than 10"11 per reactor year.
REFERENCES
1. Component Reliability Data for Use in Probabilistic Safety Assessment. IAEA-TECDOC -478, Vienna, 1988.
2. Atwood C.Land Steverson J.A. Common Cause Fault Rates for Valves.NUREG/CR - 1770, February 1983.
Meachum T.R. and Atwood C.L. Common Cause Fault Rates for InstrumentationControl Assemblies. NUREG/CR - 3289, May 1983.Swain A.D. and Gurtmann H.E. Handbook of Human Reliability Analysis
Emphasis on Nuclear Power Plant Applications. NUREG/CR - 1278, August
3.and
4.with1983.
5. Mitenkov P.M.,District Heating Plant275.
Egorov V.V.,Kuul V.S. and others. Safety Concept ofReactor. - Nuclear Energy, 1988, volume 64, N 4, pp 267-
165

166 INFLUENCE OF PSA METHODOLOGYON NPP DATA COLLECTION
I. CILLI'K, B. MARKECHNuclear Power Plant Research Institute,Trnava, Czechoslovakia
Abstract
Present activities in the field of PSA in the CSFR lead to improvement of the reliability informationsystem (RIS) of all NPP equipment. The creation of a suitable specific reliability database for each NPPwith WWER on the basis of existing databases focussing on specific topics is one of the main tasks onNPPs to solve the basis problems of safety improvements.
The first part of the article describes the basis aspects and description of the RIS in the innovatedversion which involved following collection of primary data from the NPP:
- record about the equipment failure;record about the equipment defect;
- record about the equipment maintenance;- record about the safety system tests;
record about the operation and outages of the unit and turbo generators;record about the operation and outages of the systems.
This data are filled on the NPP by its staff and are elaborated by software "Complex programme of thefollowing and evaluation of the operational reliability and lifetime of the NPP with WWER selectedsystems and components".
In the second part of the presented article is showed me preparation and the way of elaborating theData Base of the Reliability Characteristics for the specific NPP during the PSA project for NPPDukovany. It is the presentation of the interesting progressive steps of the creation of a Data Base for thePSA project according to the requirements of the safety analytic staff on the basis of present situation inthe data collection by the operational staff on an NPP. In the end there is the positive backward influenceof PSA project upon practical approach of the operational staff to the operational and maintenance datacollection on NPP.
The basic assumption for a systematic assuring of the necessarylevel of the NPP technological equipment reliability is theexistence of a suitable operational reliability informationsystem (RIS).
The first system of such a kind in the field of energy implantedin the seventies in CSFR for the following and evaluation of theconventional power plant operating reliability - Electric PowerSystem Rules No. 4 "Unit evidence, reporting and evaluation ofexploatation reliability of conventional power plants", IX. 1972was elaborated, which was than modified for following of theoperational reliability of the NPP with WWER reactors.
On the basis of requirements of the equipment manufacturersdesigners, research institutes and other organizations, theproblems of the innovation proposal of the given RIS wasperforming in the Nuclear Power Plants Research Institute (NPPRI).A basic aspect of the innovation was the requirement of a wideuse of the personal computers for the collection, registration,keeping, elaboration and evaluation of the NPP equipmentreliability data. A proposal of this innovated RIS (IRIS)considered a unified way of designation of the equipment in thepower plant project documentation and provisions of theCzecho-Slovak state norms, of INTERATOMENERGO and also of IAEA.
The IRIS proposal principally issued from the above mentioned RISwhich was valid up to this time. All data comparised in this RISwere included also in the proposed IRIS, even though IRIS usesthe data gained from the NPP operation substantially broadly.
1. INTRODUCTION 2. BASIC ASPECTS OF IRIS
In this paper I would like to demonstrate the positive influenceof the performance of PSA Level 1 on the problem of thecollection, registration, keeping, elaboration and evaluation ofoperation data for the creation of sufficient reliabilityinformation system.
In the NPP operation it is necessary to keep a lot or databecause of the various reasons resulting from fulling of the NPPown activity and from keeping of its operation. These data arefollowed and kept in a diverse operational documentation. It isa fact that only a small part of these interesting and from the

point of view of the equipment reliability also useful data havebeen used for the purpose of the creation of RIS up to now.
For instant, there were some different types of data bases whichwere used for different purposes. One of them was automaticsystem of the C S I equipment maintenance on NPP V-l and V-2 inJ. Bohunice (in the function from year 1980) and on NPP Dukovany(in the function from year 1988),. which was used for establishingand keeping of the sufficient maintenance strategy andreliability of C & I equipments on NPP's. Other type of thecollection of the exploatation and reliability data was used forthe creation of data base according to "Rules No. 4" to giverequested information for governmental organization, electricutilities and different international organizations. Both typesof data base had the similar background of the collection of datato give the sufficient information to créât data base ofreliability characteristics of operational equipment for systemmodelling analysis. The specific type of data of stand-by state,common cause failures and human errors had to be found in thecorresponding records of tests, maintenance, training and so on.
It means, that the operational data collected on NPP's, such as- failures- maintenance (planned, unplanned, preventive)- repairs- tests (especially of the most important NPP systems)- operational loads of the main NPP components- destructive and non-destructive tests- chemical regimesand data gained from the diagnostic systems, could not bedirectly used for PSA and reliability analysis and had to beelaborated carefully.
The given informations, which have already been followed and keptin the NPP operation - it must be emphasized - mostly
unsystereatically and non-uniformly, provide sources of the mostcurrent input data used in the calculations of reliabilityparameters as follows:- failure rate (of the particular followed systems and components)- frequency of the tests and maintenance- duration of the tests and maintenance, etc.
By using all data from the NPP which the operation can offer, itis possible to gain information which is very interesting fromthe point of view of reliability for all organization whichparticipate on the design, construction, operation, supervisionand research in the field of the production and supply ofelectric power.
RIS was first experiment to establish serviceable data base andwas focused namely on data collection about the equipmentfailures, to provide detail evaluation of the equipmentmaintenance strategy and to prepare some data for the equipmentmanufacturers. Primary data were collected and kept in six socalled reliability reports. The filled reports were furtherchecked and elaborated. In the RIS used to now, elements of theequipment were encoded by a five figure code while some data wererepeated in the reports and on the other hand many interestingdata was not appeared. The said RIS reports-are as follows:Report NO. 1 - Monthly survey of the NPP equipment failuresReport No. 2 - Analysis of NPP equipment failuresReport No. 3 - Monthly survey of operation and outage of
particular NPP unitsReport No. 4 - Monthly survey of operation and outage of the
namely followed NPP equipmentsReport No. 5 - Monthly survey of the NPP supplementary data -
- part AReport No. 6 - Monthly survey of the NPP supplementary data -
- part B
167

168 3. DESCRIPTION OF THE IRIS
The IRIS proposal contains 10 forms for the collection of primarydata from the NPP operation and maintenance.
Form No. 1 - "Record of the equipment failures", which serves forfollowing the failure and repairs of the NPP equipment with WWER440 reactors which:a ) caused loss or decrease of the electrical energy and heat
productionb) are significant from the point of safetyc) were performed in the frame of preventive power decrease or in
the frame of preventive outage required by the operatingorganization to prevent a failure occurence.
The form serves as the basis for:- elaboration of the separated specialized analyses of the NPPtechnological equipment failure rates
- proposals of the most convenient correction measures forincreasing the operational reliability of the NPP equipmentwhich are performed by suppliers
- analysis elaboration of the NPP events significant from thepoint of view of safety.
Data of the equipment failures during the whole period ofoperation of the NPP with WWER reactors are available in theNPPRI.
Form No. 2 - "Record of the equipment defects", which serves asthe basis for following and evaluation of the NPP equipmentfaults or defects which did not cause loss of the energyproduction and which are not significant from the point of viewof safety and are not kept in the form No. 1.
The data of defects or faults kept and elaborated at theparticular NPP.
Partially elaborated data are provided to the NPPRI centralreliability data base. There is only a part of these data fromthe NPP V-l and V-2 Bohunice in the NPPRI.
Form No. 3 - "Record of the equipment maintenance", which servesas the basis for following, keeping and evaluation of theequipment maintenance data. The data are elaborated at theparticular NPP. Partially elaborated data are provided to thecentral reliability data base. "Working order" serves as thebasis for filling this form. Working order is filled in beforebeginning of the work and it is completed after finishing of thework.
Considering that the working orders have not been registered,kept and evaluated by computers up to now, these data are notsuitable for using at the reliability parameter calculations.
Form No. 4 - "Record of the safety system tests", which servesfor following of the safety system tests, which are notpermanently under operation, but their operating ability isverified in the regular intervals. The data serve fordetermination of the testing optimum intervals. Part of thesedata from NPP V-l, v-2 Bohunice and NPP Dukovany is elaborated inthe NPPRI.
Form No. 5 - "Record of the operation and outage of unit andturbogenerators", which serves as the basis for following of theperiods of particular modes of operation and of particular modesof outage of units and turbogenerators. The electric energyproduction, heat production, losses of the electric energy andheat production caused by the equipment failures, by theequipment maintenance, by the electric network failures and so onare followed by this form. The data necessary for calculation ofthe unit technico-economic parameters are provided by this form.Part of these data is in the NPPRI in the elaborated form.
169
Form No. 6 - "Record of the operation and outage of systems",which serves for keeping of the periods of equipment operationand outage which are the most important from the point of view ofthe NPP reliability. The fail-safe operation, preventive outage,maintenance outage and failure outage are followed. Part of thesedata is in the NPPRI in the elaborated form.
Considering that the data, which are kept the aid of the formsNo. 7-=-10, have relation to the equipment lifetime, they are notcomparised in this paper.
All mentioned forms are filled on the NPP by operational staff ofNPP. Staff of NPP is responsibile for the data correctness, forcomplying with the terms of filling and for their storage on thecomputer media.
It was necessary to create a computer programme which wouldcomprise all necessary activities and mutual links-up for apermanent following and evaluation of the equipment reliabilityparameters, to provide valide reliability and safety analysis forNPP's.
Such software was elaborated by the NPPRI: "Complex programme ofthe following and evaluation of the operational reliability andlifetime of the NPP (with WWER reactors) selected systems andcomponents" according to the agreements with utilities CEZ andSEP so that, this guiding provision for a systematic followingand evaluation of the NPP equipment operational reliability mustbe improved into live.
4 . THE PREPARATION AND THE WAY OF ELABORATION OF THE "DATA BASEOF THE RELIABILITY CHARACTERISTICS FOR THE NPP WITH WWER440/V 213 REACTORS" (FURTHER ONLY DATA BASE)
There was given a task to performed the Data Base of thereliability characteristics in January 1991 with assumption touse all available information and experience.
As the preliminary draft, the survey of the most importantelements of the safety systems (emergency high pressure injectionsystem, emergency low pressure injection system, spray system,service water system, auxiliary and emergency feedwater systemand intermediate cooling circuits of safety systems) with giventypes of failures and their reliability characteristics (failurerate and time of the repair) was elaborated. The survey wascomplemented with a brief description of the electric equipmentfailures (transformers, diesel generators, cables, connections,penetrations, inverters, rectifiers, breakers and switchboards)including given causes and consequences of failures. Data weretaken especially from IRIS in the NPPRI (failure reports of theNPP Bohunice, Dukovany) and consulted with the operational staff.
It is necessary to emphasize some substantial facts whichconsiderably influenced and in many cases still influence on thequality of reached characteristics:a) Data collection, registration and keeping system of there
failures and faults of the NPP systems and equipment wasunsufficient to cover fully the requirements of thereliability analyses.
b) The menace of a possible penalty for contingent mistakes ornon-professional manipulations of NPP's personnel considerablyinfluenced on true clarifying of the causes and courses of thefailures and therefore some failures from this reason were notmentioned.
c) Regarding to the fact of (in some cases) the individualfilling of the forms (the long period of activity withoutusing the personal computers) as an unnecessary work and thework over labour duties, the staff did not realize a commonway of failure registration and in some case they even refusedway of information record proposed in IRIS.
d) IRIS did not take advantage of a full use and it was not fullyrealized in the nuclear power plants. On the basis of thissituation only failure report forms were followed andelaborated.Failures and faults which were significant from thepoint of view of safety and the ones which led to a production

lin decrease or loss, were only registered in these failure reportforms. It was necessary to gain information from theoperational notebooks and records. Regarding to the extent andamount of the necessary information this possibility wascontinually reduced. It means that only the information fromfailure reports are completely registered and elaborated.
Except these essential lacks .there were inaccuracies in thecreating of information files from the following causes:- activities and reports leading to a system readiness increaseare performed mainly during examinations, tests and maintenanceand these activities are not registered in the IRIS and thereare only a few available information of this kind for thestand-by and safety systems which are in a waiting regime
- inaccurate registration of the real time of repair, mainlyduring general maintenance and overhaulting is relevant lack atthe mean time of repair. In many cases the time of repair wasgiven by the value of some days (regarding to the maximumallowed outage time), although a real repair activity lastedonly some hours
- during examinations and tests some unsuccessful starts of thesystems were not registered as failures. The examination or testlasted until a successful start. This occured mainly in thepast, present situation is a little better. There are somediscussible questions in this area too. Tests of the systemsand equipment must be performed after each bigger maintenanceand outage. It is truth that these tests were unsuccessful inmany cases because of a non-professional manipulation oractivity which caused an unsuccessful tests.
From these facts result simple conclusions that if we requirehigh-quality information for reliability analyses responding to areal state of the operation, it is necessary to gain or consult abig part of information with the operational staff and to providethe verification of the quality of elaborated data.
The following presentation presents as the main steps for thecreation of the Data Base for PSA according to the requests andneeds of the analysts participated in this study.
DATA BASE - FIRST DRAFT
As a base of the first draft was taken "the preliminary Data Basedraft", complemented by the information from the Soviet data baseand research report and informations of EGU Prague, which dealtwith the evaluation of some elements and systems data collectedon NPP Dukovany - EDU.
The Data Base was arranged in the table form and contained thetechnological designation, name and types of failures of theparticular equipments, data sources and reliabilitycharacteristics (the demand failure probability, failure rate anda mean time of repair). Types of the failures were selected fromreal failures of the given equipments and some failures did nottake into account the need of the analyst for the reliabilityanalyses and probabilistic safety assessment.
The most of the comments dealt with detailed specification of thefailure types where the equivocations concerning of some termsoccured. The relevant comment was said to -the determination ofthe element boundaries and conditions. Other comments concernedof the data base incompleteness. It was necessary to complementespecially electric elements (fuses, elements of the loadsequencing system, of the quick reactor protection system and soon) to divide circuit breakers and relays into more types, todisinguish cables into power cables and control cables and tomake more accurate the failure types at armatures, relays,contactors and circuit breakers.
DATA BASE - SECOND DRAFT
The second draft of the Data Base was performed by incorporatingmost of comments of the particular organizations, which

171
participate on PSA Level 1 for NPP Dukovany. The basic structureof this draft was not changed in comparison with the first draft.Number of the elements was substantially extended andcomplemented by missing elements according to the comments of theparticular organizations (elements of the load sequencing system,emergency protection, safety systems, safety valves and so on).Control circuits were separated and inserted just behind anelement to which they belong. Only the elements which directlyparticipate on the control were included into the control circuitgroup. Electric elements (relays, circuit breakers, contactors,pickups,...) were divided into the concrete types according toreal state on the NPP Bohunice and NPP Dukovany. Commencing withthe second draft of the Data Base type designation of theelectric elements (relays, circuit breakers, contactors and soon) is without to their function in the electric scheme. The sametypes of elements with different reliability characteristics,regarding to their placement in a diverse working environment(control circuits, emergency protections, load sequencing systemand so on), were considered. Data from the Soviet Data Base werenot clear and substantiated and therefore they were continuallysubstituted by data from our NPP's.
DATA BASE - THIRD DRAFT
The effort of the organizations participating on PSA Dukovany wasto incorporate their opposers' comments and to create theaccepted system of event designations in this third draft of theData Base. This structure of the Data Base was conceptionallydifferent from the second draft. Information and reliabilitycharacteristics were ranked in the following way:- identification code (accepted system of the primary eventdesignations)
- name of an element (name and type of an element)- kind of an element (way of verifying its functional ability,where PK means periodically checked, M - monitored, N- unrepairable during the operation)
- the demand failure probability- failure rate- time till the failure revealing (for periodically checkedelements of the stand-by and safety systems which are in awaiting regime-testing interval)
- time of maintenance/operation (mean repair time, resp. requiredtime of operation during the service of an element).
We assumed that there would be enough high-quality data for theparticular systems in future,so that it would not be necessary todetermine a value of one system as an average value of severalsubsystems, but every subsystem would have another value given byunique working conditions and material properties of eachelement.
During selection of the failure types of single elements, suchfailure types, which would be necessary for analysts duringreliablity system analysis were emphasized. Codes of failuretypes of the single elements took into account possible failuresaccording to the kind of an element (PK, M, N) in the dependenceon a regime (waiting regime of the stand-by and safety systems,operation, injection and recirculation phase) in which they canoccured. Technological systems, which are periodically checked,have an enumerated total contribution to the unpreparedness of agiven subsystem for a test with a given duration of test.
The third draft of the Data Base need some comments. Sources ofdata are not mentioned for each element, a manual for using ofthe Data Base misses, some data of identic system are uselesslyrepeated. Unaccuracies of the designation of some electricelements in the operation of the NPP Dukovany 1st unit waspointed out.
The problem of element boundaries was open again, it was pointedout that there are not disconnectors in the control circuitswhich were mentioned in another part of the Data Base.

172 Tables in the Data Base are incomplete, mean times of repairsmiss at many elements. Used failure types of relays and circuitbreakers are incomplete. The models and ways of gaining of thetotal unpreparedness from the tables, together with giving modelexamples, are not mentioned in this draft.
Error coefficients, numerical values of the initial events andcommon cause failures miss in the third draft. Components of theemergency protections (neutron pickups, pressure and powerrelays, units BKU and BKV) and data for cable contacts aremissing. The possible types of failures are simple defined forthe circuit breakers.
PROPOSAL OF THE DATA BASE STRUCTURAL CHANGE
All drafts of the Data Base have been performed by unsuitable wayup to now, which requires a tremendous mass of work and time. Itwould be necessary to come through the whole NPP, each system andall important components with necessary information in this way.It is also necessary to determine the component boundaries.
The consequences of the neglecting of component boundaries areconfusing in construction of the fault trees and also inevaluation of specific values.
After evaluation of all these facts we elaborated "Proposal ofa structural change of the Data Base of reliabilitycharacteristics of the NPP's with WWER 440 reactors type V 213",where all requirements of analyst of PSA Dukovany andoperational staff of NPP's and some IAEA materials were takeninto account. Content of the Proposal is divided into particularcomponents (pumps, armatures, tanks, heat exchangers and so on).For each component the regime which can be found and theresponding reliability characteristics are distinguished. The
proposal is aimed at component types on NPP and an appurtenancesof a certain technological or electric systems are not presented.The use of the error coefficients, differences of the componentdata for various working environment and various ways of theappropriate system operation, will be presented. The importantfact is that the table in this proposal contains determination ofthe component boundaries and all presented parts of thecomponents, concerning the data in table, will be defined. Thefirst responses of the organizations on this submitted Proposalwere favourable.
During the further work (fourth draft) we assume re-elaborationof third draft according to a new approved proposal:1. Overtaking the information from the third draft and their re-
evaluation2. Complementing the missing informations, determination of the
component boundary, completing the so called "background" ofthe presented characteristics
3. By validisation and use of the information and experiencegained up to now, to elaborate the Data Base for the NPP'swith TWER 440 reators type V 213.
It is possible that so as reliability system modelling in PSA isin evolution and knowledgies of analysts about the componentmodelling will not be final, the modelling of suitable Data Basewill be also particulary modified according to theirrequirements. But the main problem is to find the compromisebetween the PSA requirements on reliability characteristics and"status quo" on NPP, where on the first place are operationalaimes. Than it is necessary to show the positive influence of PSAnot only on exploatation reliability and safety, but also onoperational economy and only really positive results can you open"door" of NPP to meet the operational staff to help you to findthis compromise.

WER SEVERE ACCIDENTMODELING WITH MAAP4
M.G. PLYSFauske and Associates, Inc.,c/o Westinghouse Electric Nuclear Energy Systems,Brussels, Belgium
Abstract
The MAAP 4 code for integrated severe accident analysis, its modifica-tions for WER plants, and its applications to PSA are described here. MAAP4 contains thermal-hydraulic and fission product models to simulate plantresponse including operator actions and time dependent availability ofequipment throughout a severe accident. MAAP 4 can be used to determinewhich accidents lead to fuel damage and which accidents are successfullyterminated, as well as the potential for mitigation of consequences viaactions. It is easy to run hundreds of cases with MAAP 4 for a PSA toquantify plant damage states, fission product release, recovery potential,and operating conditions for equipment, and to observe the impact of cur-rent or proposed plant design features, systens and setpoints, andprocedures. MAAP 4 is the newest version of MAAP offered by the ElectricPower Research Institute (EPRI) and developed by Fauske and Associates, Inc.(FAI).
1.0 IHTROPacTIOH
This paper also introduces the WER capability of MAAP 4, whichprovides a vital link in PSA between the accident frequency and overall riskevaluations.
1.2 Background
MAAP 4 is an advanced and improved code in the Modular AccidentAnalysis (MAAP) family of codes. MAAP was originally developed during theIndustry Degraded Core Rulemaking (IDCOR) program in the early 1980's, andit is now property of the Electric Power Research Institute (EPRI). Fauskeand Associates, Inc. (FAI) has been the prime contractor for all versions ofMAAP. MAAP is licensed to utilities and other organizations by EPRI.
Currently, HAAP 3.OB is the practically exclusive tool of choice forIndividual Plant Analyses (IPE's) and PSA's performed by utilities. It isfavored over alternative codes or code systens because of its rapid simula-tion time (about 2 to 4 hours on a PC are required for a 40 hour accident),its ability to consider operator actions, its capacity for sensitivitystudies, and general ease of use.
Interest in severe accident management (SAM), the recovery of plantsbefore and after core damage, the study of operator actions, and generaladvances in our understanding of severe accident phenomena have motivatedthe development of MAAP 4. Its capabilities make it much better suited toWER analyses than MAAP 3.OB.
1.1 Purpose 1.3 Philosophy
173
MAAP 4 is a general tool for light water reactor Pröbabalistic SafetyAssessment (PSA). It can be used for Level 1 analyses to determine coredamage frequency (given initiating event specification) and Level 2 analysesto determine containment response and fission product release. This paperdescribes the general content of MAAP 4 and how it can be used for PSA's.Further applications for simulating the impact of current and proposed plantdesign features, systems and setpoints, and operating procedures are dis-cussed.
MAAP 4 combines in one package models for heat transfer, fluid flow,fission product release and transport, plant system operation and perfor-mance, and operator actions. Physical models exist for processes that areimportant during transients that lead to and go beyond fuel damage, and allmodels are coupled at every timestep. This concept of model integration isessential because of the strong influence of processes on one another or onplant systems, and the strong role that operators can have on the outcome ofan accident.

174 The level of model detail is sufficient to acceptably match experimen-tal data but simple enough to allow rapid simulation on ordinary computers.It is therefore inexpensive and easy to make hundreds of HAAP runs for aPSA, and the Level 1 analyses benefit greatly from information concerningconditions that affect equipment and the overall sequence and timing ofevents.
The models are validated against experimental data and evaluated by aDesign Review Group of experts independently convened by EPRI; these topicsare beyond the present paper scope.
including the recirculation piping, if any). The containment/accidentlocalization regions and any auxiliary and turbine rooms are simulated bythe user with up to 30 nodes that nay be arbitrarily connected. The connec-tions can include normal openings, leakage paths, ventilation ducts, andfailures.
MAAP uses "smart nodes" that contain gradients or "sub-node physics" tosimulate certain processes in otherwise well-mixed control volumes. Forexample, fluid-structure heat transfer in the hot leg and steam generatorpiping considers gradients in temperature along the flowpath.
2.0 GENERAL CODE FEATURES
.2.1 Architecture
Plant simulation is a dynamic process which begins with a picture ofthe plant state and then predicts the time evolution of the state. Realstate variables are masses and energies in control volumes plus equipmentstatus, while observable quantities such as pressure, temperature, and waterlevel are derived. To begin the prediction of the evolution, conditions forautomatic equipment function (or impairment) and operator actions arescanned, and the appropriate equipment and operator response is taken.Then, rates of change due to individual processes are evaluated and summedfor each state quantity. For example, the water mass in a WER vessel lowerplenum may be influenced by heat transfer to structures, decay power ofmovable control assemblies, flashing, inflow, etc. Last, total rates areintegrated over a timestep to yield the next state, and its observablequantities are derived. This process is repeated until the end of thesimulation.
Typical plant equipment is represented with standard input for systemsetpoints and performance curves. In addition, users may partly or com-pletely redefine system logic. WER systems are easily represented withinthis framework. Generalized injection and spray systems including suctionlocations, pumps and heat exchanger characteristics, and destinations may bespecified.
2.3 Core Models
Each core node has separate temperatures for the fuel, cladding, con-trol material, and fuel channel, if any. Heat transfer to water and gases,hydrogen generation, core-upper plenum natural circulation, clad ballooningand failure, fission product release, and radiative energy transport aremodeled. The U-Zr-0 phase diagram is used for fuel-cladding interactionsand melt progression, and a molten pool model is used for highly degradedgeometry. Recovery of a damaged core considers the effects of porosity andcritical heat flux.
2.2 Plant Representation
The entire plant is divided into control volumes for conservation ofmass and energy. Core nodalization is flexible (up to 7 radial and 25 axialnodes), while primary system nodalization is fixed per reactor type (18nodes for the PWR and WER including the steam generators and 8 for the BWR
2.4 Primary System Models
BWR natural circulation and PWR phase separation are considered, thoughthe primary system models are most detailed for cases with limited waterinventories. Gas phase natural circulation and countercurrent circulation,reflux condensation, and stratification of noncondensible gases are allowed.Fission product transport, deposition, and revaporization occur.
175
Also considered are the temperature response of the vessel, piping, andcomponents, including creep rupture at elevated temperatures, Insulation,heat losses to containment, possible vessel submergence, and interactions ofcore debris in the lower plenum.
2.5 Containment and Auxiliary Building Models
Pressure-driven gas flows, counter-current flows induced by temperaturegradients, flow of water and core debris, and entrainment of water and coredebris are allowed between nodes. Debris-water interactions, debris -concrete interactions, fission product release, transport, deposition, andrevaporization, flammability and combustion of general H2-CO-air-H20-C02-N2mixtures, and direct containment heating phenomena are considered.Structures with temperature gradients (walls), lumped heat capacities (cabletrays, etc.), and engineered safeguards like sprays, fan coolers, simplefans, and fire suppression are included.
2.6 Uijer Interface
A "parameter file" is constructed that contains a complete plantdescription independent of any accident. The parameter file contains con-tainment geometry and topology, primary system and core geometry, equipmentlogic and performance data, and initial conditions. Special "modelparameters" for sensitivity analysis are grouped together in the parameterfile, such as aerosol shape factors or the choice of fission product releasecorrelations.
An "input deck" is used to describe an accident and control a simula-tion. The input deck considers accident initiators such as pipe breaks,loss of power, or equipment failures, and degraded system response such asrevised pump curves.
"Intervention conditions" can be specified to represent plant statesthat will lead to either operator actions, equipment automatic function, orsome other equipment status change. "Action blocks" are linked to theconditions and contain the commands for equipment operation and performance.
Detailed system logic, operator procedures, and event trees can beeasily represented and understood using the Intervention/Action structure.Interventions may occur for reasons (equipment automatic setpoints oroperating limits may be reached, or the operator may notice a combination ofcontainment and primary system conditions that cause him to enter a proce-dure) or arbitrarily (a failure is defined at a time or upon transitionbetween system modes). Actions basically consist of turning equipment on oroff, controlling pumps or valves, or adjusting performance curves. Sets ofthese conditions and actions may be logically linked to describe entiresystems or procedures.
3.0 WER FEATURES
MAAP 4 represents the WER core like a Western PWR but with fuel chan-nels and borated steel absorber. Movable control assemblies that are partlybelow the normal bottom of active fuel are considered in the lower plenumcontrol volume. The displacement of water, production of decay power, heattransfer to lower plenum water (and gas when present), and melting areincluded.
The water level calculation in the horizontal steam generators con-siders the circular cross section and structures such as the primaryheaders, tubes, and supports. Appropriate correlations are used forhorizontal tube heat transfer. No countercurrent gas exchanges with thevessel are possible due to the hot leg loop seal. Hydrogen preferentiallyfills the primary side from the top down and thus reduces heat transfer areafor reflux condensation.
The bubble tower is represented by placing the inlet structure andtrays in separate control volumes linked by a junction that is normallysubmerged in the tray water. MAAP considers vent clearing of any junctionbased on the difference in pressures across the junction compared to thestatic head required for uncovery. Condensation may be degraded for shallowpools or high pool temperature.

176 4.0 CODE APPLICATIOH
4.1 Single Accidents
A simple MAAP simulation can be made by specification of systems thatare unavailable or impaired at the beginning of an accident. The end timefor the simulation, a title, and print control are the only other essentialinput. MAAP will then simulate plant response. A "success" is typicallydefined as a plant state at the end of the simulation in which temperatures,pressures, and water levels are steady, and decay heat is being removed.Success cases may also have unsteady levels, but either the core is stillcovered, or at least no fuel damage has been sustained during the definedtime interval. Otherwise, either some fuel damage has already occurred, orthis damage may be presumed inevitable. Success may also be defined asrecovery of a safe, stable state after fuel damage.
The simple simulation described above is a typical PSA application ofMAAP in which equipment availability is predefined and we seek to determinea resulting plant damage state. A related simulation could be made usingadditional input that redefines some plant characteristics, such as anincreased flow capacity of an emergency system or the existence of a con-tainment heat removal system qualified for LOCA environments. In this casethe simulation is part of a study to determine the most effective andeconomical plant modifications.
When a simple simulation is run for every sequence specified in all theevent trees of a Level 1 PSA, the results constitute a simple Level 2 study.Such simulations may include input that control specific phenomena models toconsider sensitivity.
4.2 Operator Actions
A simple simulation may be extended by specification of pairs of inter-vention conditions and operator actions. As far as the code is concerned,"conditions" may be either observable plant variables such as water levels,or they may be quantities used during a simulation such as the amount ofhydrogen evolved by clad reaction. "Actions" may either be actions taken by
an operator, equipment functions that are normally automatic, or inputchanges redefining the operating characteristics of equipment.
A typical application of these intervention/action inputs is the deter-mination of the recovery potential when operators take actions at specifiedtimes, after specified plant conditions are known, or after some postulateddelay. This input structure also allows equipment availability to be deter-mined naturally by the evolution of the transient itself instead of beingspecified in advance (and possible incorrectly) by a Level 1 study.
More generally, this application tests the effectiveness of procedures.Finally, and most important for a PSA, this application can demonstrate thereduction in core damage frequency achievable by considering operator ac-tions.
A thorough Level 2 study should use operator actions in this manner forthe event trees specified in a Level 1 study in order to more realisticallyassess overall frequency of plant damage states and release categories.
4.3 Event Trees and Accident Groups
When pairs of intervention conditions and actions are placed in theinput, it is often unknown whether the conditions will actually be achievedand the actions taken. The power of conditional, execution of actions liesIn this fact. Enough conditions and actions may be input to simulate anentire set of operator procedures. This may remain a constant input for alarge number of transient simulations in which only the initially unavail-able systems are varied. A single input deck, with only minor changes, thencan be used to test the impact of current or revised procedures for avariety of sequences.
Similarly, input may be created so that some conditions are neverachieved, on purpose, during a simulation. Any number of such condition/action pairs may be input with no Impact on a simulation. These conditionsmay be choices for equipment availability or phenomena paths which takentogether constitute an event tree for a given accident initiator. Simplechanges to the input deck can "activate" and "deactivate" conditions from

being physically achievable. In this manner, all the sequences representedby a single event tree may be entered into a single input deck. Minorvariations on this input deck cause specific paths of the event tree to befollowed. Alternately, groups of accidents with similar initiating condi-tions or time dependent availability histories may be grouped into the saneinput deck.
The beauty of this input structure is that there may be a true one-to-one correspondence between Level 1 and Level 2 studies in which the Level 1event trees or accident sequence categories are correctly converted to MAAPinput.
5.0 CONCUJDISG RMARKS
A WER Level 2 PSA may be conducted using MAAP 4 as the tool for quan-tification of plant response to prescribed system failures. Existing andproposed WER systems and operator procedures may be evaluated. MAAP 4 canbe used to determine which accidents lead to fuel damage and which accidentsare successfully terminated, as well as the potential for mitigation ofconsequences via actions.
4.4 Accident Management
Accident management applications of MAAP 4 include: Training ofoperators, support staff, engineering staff and upper management, accidentmanagement planning support, and support of personnel in the EmergencyOffsite Facility (EOF), Technical Support Center (TSC), and RegulatoryEmergency Response Centers during drills or emergencies. The emergencyresponse application is enhanced by the additional use of the MAAP AccidentResponse System (MARS), as described below.
The MARS software (developed by FAI) uses the MAAP codes as its basisto calculate the thermal-hydraulic and fission product response under acci-dent conditions, and adds the following features, beyond those available inMAAP: 1) The ability to use actual on-line plant data to initialize MAAPunder accident conditions; 2) The ability to diagnose incoming plant datato validate plant instrumentation readings and to determine the plantstatus; 3) The ability to assess a root cause of the accident; 4) Theability to track the evolving plant status; and 5) The ability to performpredictions of potential future plant states based upon no operator actions,operator actions based upon procedures, and operator actions that employaccident management guidelines.
177
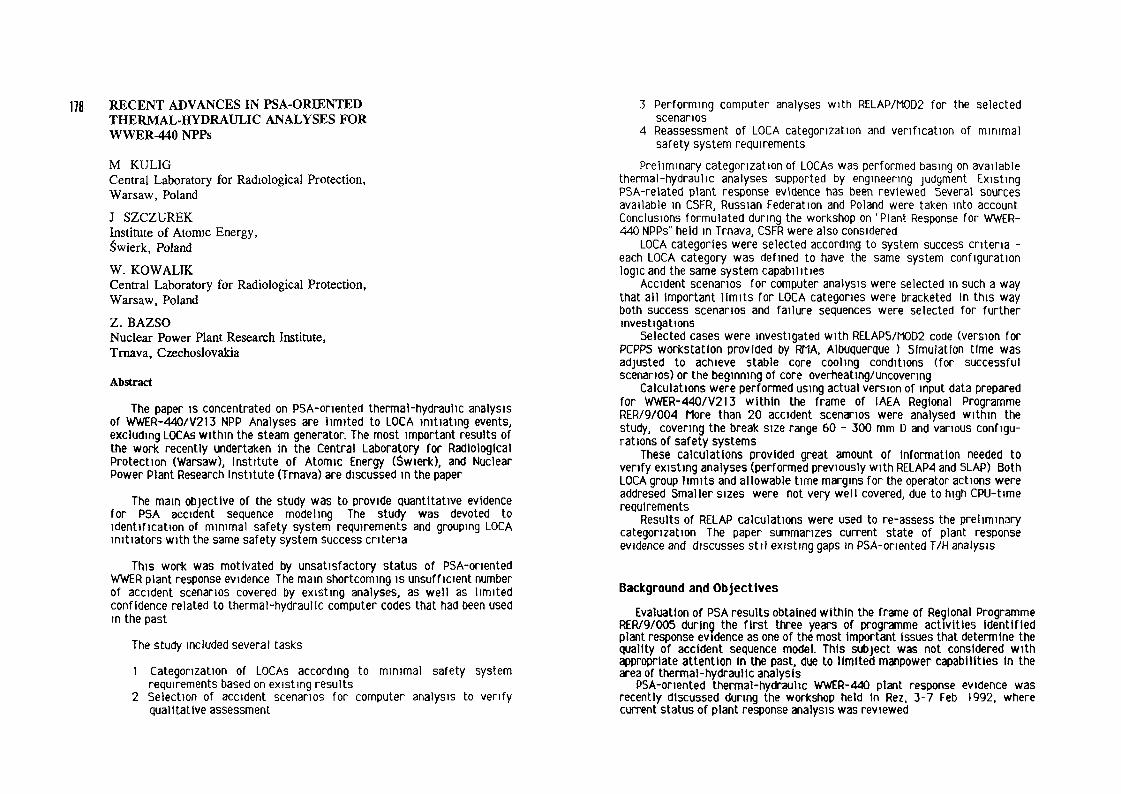
178 RECENT ADVANCES IN PSA-ORIENTEDTHERMAL-HYDRAULIC ANALYSES FORWWER^WO NPPs
M KULIGCentral Laboratory for Radiological Protection,Warsaw, Poland
J SZCZUREKInstitute of Atomic Energy,Swierk, PolandW. KOWALIKCentral Laboratory for Radiological Protection,Warsaw, PolandZ. BAZSONuclear Power Plant Research Institute,Trnava, Czechoslovakia
Abstract
The paper is concentrated on PSA-onented thermal-hydraulic analysisof WWER-440/V2I3 NPP Analyses are limited to LOCA initiating events,excluding LOCAs within the steam generator. The most important results ofthe work recently undertaken In the Central Laboratory for RadiologicalProtection (Warsaw), Institute of Atomic Energy (ewierk), and NuclearPower Plant Research Institute (Tmava) are discussed in the paper
The mam objective of the study was to provide quantitative evidencefor P5A accident sequence modeling The study was devoted toidentification of minimal safety system requirements and grouping LOCAinitiators with the same safety system success criteria
This work was motivated by unsatisfactory status of PSA-onentedWWER plant response evidence The main shortcoming is unsufficient numberof accident scenarios covered by existing analyses, as well as limitedconfidence related to thermal-hydraulic computer codes that had been usedin the past
The study included several tasks
1 Categorization of LOCAs according to minimal safety systemrequirements based on existing results
2 Selection of accident scenarios for computer analysis to verifyqualitative assessment
3 Performing computer analyses with RELAP/MOD2 for the selectedscenarios
4 Reassessment of LOCA categorization and verification of minimalsafety system requirements
Preliminary categorization of LOCAs was performed basing on availablethermal-hydraulic analyses supported by engineering judgment ExistingPSA-related plant response evidence has been reviewed Several sourcesavailable in CSFR, Russian Federation and Poland were taken into accountConclusions formulated during the workshop on 'Plant Response for WWER-440 NPPs" held in Trnava, CSFR were also considered
LOCA categories were selected according to system success criteria -each LOCA category was defined to have the same system configurationlogic and the same system capabilities
Accident scenarios for computer analysis were selected in such a waythat all important limits for LOCA categories were bracketed in this wayboth success scenarios and failure sequences were selected for furtherinvestigations
Selected cases were investigated with RELAP5/MOD2 code (version forPCPP5 workstation provided by RNA, Albuquerque ) simulation time wasadjusted to achieve stable core cooling conditions (for successfulscenarios) or the beginning of core overheating/uncovering
Calculations were performed using actual version of input data preparedfor WWER-440/V213 within the frame of IAEA Regional ProgrammeRER/9/004 More than 20 accident scenarios were analysed within thestudy, covering the break size range 60 - 300 mm D and various configu-rations of safety systems
These calculations provided great amount of Information needed toverify existing analyses (performed previously with RELAP4 and SLAP) BothLOCA group limits and allowable time margins for the operator actions wereaddresed Smaller sizes were not very well covered, due to high CPU-timerequirements
Results of RELAP calculations were used to re-assess the preliminarycategorization The paper summarizes current state of plant responseevidence and discusses stil existing gaps in PSA-onented T/H analysis
Background and Objectives
Evaluation of PSA results obtained within the frame of Regional ProgrammeRER/9/005 during the first three years of programme activities Identifiedplant response evidence as one of the most Important issues that determine thequality of accident sequence model. This subject was not considered withappropriate attention In the past, due to limited manpower capabilities In thearea of thermal-hydraulic analysis
PSA-onented thermal-hydraulic WWER-440 plant response evidence wasrecently discussed during the workshop held In Rez, 3-7 Feb 1992, wherecurrent status of plant response analysis was reviewed
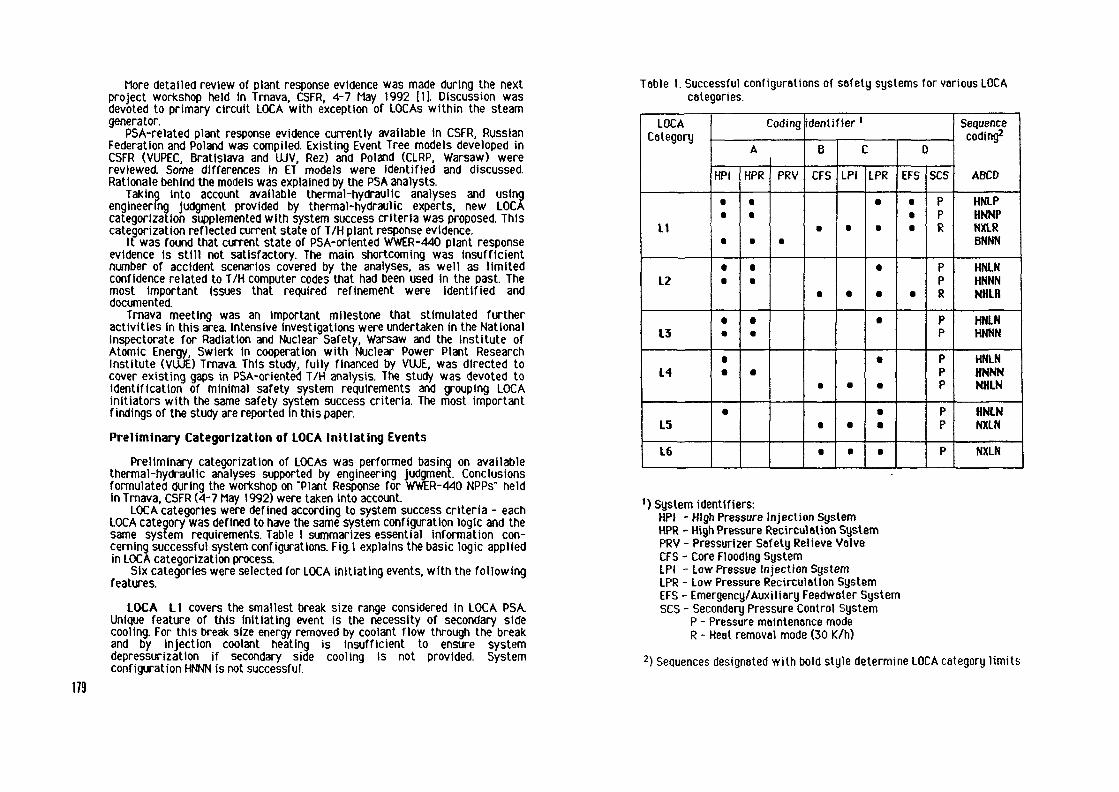
More detailed review of plant response evidence was made during the nextproject workshop held In Trnava, CSFR, 4-7 May 1992 HI Discussion wasdevoted to primary circuit LOCA with exception of LOCAs within the steamgenerator.
PSA-related plant response evidence currently available in CSFR, RussianFederation and Poland was compiled. Existing Event Tree models developed inCSFR (VUPEC, Bratislava and UJV, Rez) and Poland (CLRP. Warsaw) werereviewed. Some differences in ET models were identified and discussed.Rationale behind the models was explained by the P5A analysts.
Taking into account available thermal-hydraulic analyses and usingengineering judgment provided by thermal-hydraulic experts, new LOCAcategorization supplemented with system success criteria was proposed. Thiscategorization reflected current state of T/H plant response evidence.
It was found that current state of PSA-oriented WWER-440 plant responseevidence is still not satisfactory. The main shortcoming was insufficientnumber of accident scenarios covered by the analyses, as well as limitedconfidence related to T/H computer codes that had been used In the past. Themost important Issues that required refinement were identified anddocumented.
Trnava meeting was an important milestone that stimulated furtheractivities in this area Intensive investigations were undertaken in the NationalInspectorate for Radiation and Nuclear Safety, Warsaw and the Institute ofAtomic Energy, Swierk in cooperation with Nuclear Power Plant ResearchInstitute (VUJE) Trnava. This study, fully financed by VUJE, was directed tocover existing gaps in PSA-oriented T/H analysis. The study was devoted toIdentification of minimal safety system requirements and grouping LOCAinitiators with the same safety system success criteria. The most importantfindings of the study are reported in this paper.
Preliminary Categorization of LOCA Initiating Events
Preliminary categorization of LOCAs was performed basing on availablethermal-hydraulic analyses supported by engineering judgment. Conclusionsformulated during the workshop on "Plant Response for WWER-440 NPPs" heldin Tmava, CSFR (4-7 May 1992) were taken Into account.
LOCA categories were defined according to system success criteria - eachLOCA category was defined to have the same system configuration logic and thesame system requirements. Table I summarizes essential information con-cerning successful system configurations. Fig.l explains the basic logic appliedin LOCA categorization process.
Six categories were selected for LOCA initiating events, with the followingfeatures.
LOCA LI covers the smallest break size range considered in LOCA PSA.Unique feature of this initiating event is the necessity of secondary sidecooling. For this break size energy removed by coolant flow through the breakand by injection coolant heating is insufficient to ensure systemdepressurization if secondary side cooling is not provided. Systemconfiguration HNNN is not successful.
Table 1. Successful configurations of safety systems for various LOCAcategories.
LOCACategory
LI
L2
13
14
L5
L6
Coding
A
HPI
t
:
J
*
'
HPR
.
:
*
•
PRV
,
identifier '
B
CFS
•
.
.
•
•
C
LPI
•
•
.
•
*
LPR
•
.
*
:j•
0
EFS
t
.
sesppR
PPR
PP
PPP
PP
P
Sequencecoding2
ABCD
HNLPHNNPNXLR6NNN
HNLNHNNNNXLR
HNLNHNNN
HNLNHNNNNHLN
HNLNNXLN
NXLN
') System identifiers:HPI -High Pressure Injection SystemHPR - High Pressure Recirculation SystemPRV - Pressurizer Safety Relieve ValveCFS - Core Flooding SystemLPI - Low Pressue Injection SystemLPR - Low Pressure Recirculation SystemEFS - Emergency/Auxiliary Feedwater SystemSCS - Secondary Pressure Control System
P - Pressure maintenance modeR - Heat removal mode (30 K/h)
2) Sequences designated with bold style determine LOCA category limits
179

180 SequencecodingHBCD
HNNP
HNNN
BNNN
HNLN
NHLR
NHLN
2
•™.,UU,.,,,,
, I .
LOCH break size0 30 60 100 20U 300 500
i i ,.:,....... ............... i
•i i i i H i i-i-i i-i-i f • ( l • i i-i i *•« i i i i
>,*,»>,«.> . ,' not applicable ,>,> . , > .^ .&,',«. >i»4 .>.".»>,>. ",»>»
t l i i«t»itHHl'('t'ti|'i'"
? ' "^ i t
i - s ' t * it*!«l«l*t*l»l*l'«« 'l'l'l'l' 'l'i'l; 'itl'rt'i'l'lH'l'i'HtVt»!*!; (««I'rt'l't*!'!*!*» 1 ^ * \ f_ 1 1. s X
Core ouerheating | | Stable core cooling conditions
Core cooling conditions depend on number of HRs auailable
System configuration coding - RBCD
A - High Pressure Injectlon/Reclrculation SystemN - system unavailable. H - single HPS train availableB - Primary Feed and Bleed ( HPI/HPR + PSRV)
B - Core Flooding SystemN - system unavailable, X - number of HAs available
C - Low Pressure Injection/ Recirculation SystemN - system unavailable, L - single train available
D - Secondary Side Cooling SystemP - Pressure maintenance mode ( single EFW troin + single dumper)R - Heat removal mode -30 K/h (single EFW train + single damper)N - EFW unavailable, single dumper operable
Fig. I. Logic used in LOCH categorization process.
Lower limit for this group was estimated as the largest break sizecompensated by normal make up system
Preferable mitigation measures for this accident Include High PressureInjectlon/Reclrculation System (HPI/HPR) for the Initial phase of accident andLow Pressure Recirculation System (LPR) for long-term cooling In case of LPSfailure HPS may be used alternatively for long-term cooling, but it involvessome manual operator actions to control the process In both cases secondarycooling is required in addition to ECC5
For scenarios with HPS operable and failure of secondary side cooling,primary feed and bleed Is the only mean of accident mitigation Primary feedand bleed requires operation of HPS and Pressunzer Safety Relief Valves(controlled manually)
For scenarios with HPS failure in the very early phase of accidentdepressurization of RCS by the use of secondary feed and bleed and LPS forlong-term cooling is acceptable mean of accident mitigation Time margin forthe operator to Initiate depressurization (manually) depends on availability ofCore Flooding System (Hydro-accumulators) If CF5 Is operable this timemargin is proved to be relatively large for this LOCA category
Lower limit for this LOCA category was estimated as 10 mm D, upper limitwas assessed as 20 mmm D
Lower limit for LOCA L2 category is related to secondary side coolingrequirements For break sizes larger than this limiting value HP5 is sufficientto achieve stable core cooling conditions, even If secondary side cooling is notestablished
Upper limit for LOCA L2 is related to practical acceptability of secondaryfeed and bleed, followed by LPS operation for long-term cooling, as analternative way to HPI operation Limiting value is selected m such a way thatsufficient time margin for correct plant state diagnosis and for manualalignment of secondary side cooling system is assured One hour is consideredas practically acceptable time margin to allow correct operator behaviour
Mitigation of the accident is similar to LI except that secondary sidecooling is not needed, if HPS is operable Preferable mitigation measure forthis accident Is operation of High Pressure Injectlon/Reclrculation System(HPI/HPR) for the initial phase of accident and Low Pressure RecirculationSystem (LPR) for long-term cooling In case of LPS failure HPS may be usedalternatively for long term cooling
Respective upper limit for this LOCA category was estimated as 50-70 mmD It depends on success criterion adopted In ÉT model for CF5
For LOCA L3 category the HPS is the only mean to establish stable corecooling conditions in the Initial phase of accident and to depressurize RCSbelow LPS operational limit If only CFS (Hydro-Accumulators) is available coreuncovering and overheating occur at the RCS pressure exceeding the LPSoperational limit Depressurization of RCS by the use of secondary feed andbleed is not practically achievable, because of timing requirements
Mitigation of the accident Is similar to L2 except that in case of HPSfailure, secondary feed and bleed (with subsequent use of LPS) Is not takeninto account
Upper limit for this LOCA category was estimated as 120-150 mm D

For LOCA L4 category operation of CFS and LPS is an alternative way toassure successful mitigation of accident in addition to mitigation measuresapplicable to LOCA L3. For the break size range considered, depressurization ofthe RCS occurs at such a rate that long term cooling may be taken over by LPS,and HPS is not needed.
For this LOCA category operation of HPS followed by LPS is preferablemitigation measure (similarly to LOCAs LI-L3). HPS is also acceptablemitigation measure for long term cooling In case of LPS failure.
Upper limit for this LOCA category was estimated as 200 mm D.
For LOCA L5 category CFS or HPS are required for early phase of theaccident and LPR for long term-cooling. For the break size range considered theHPS alone Is not sufficient, as it Is the case for LOCA L4
Upper limit for this LOCA category was estimated as 300 mm D.
For LOCA L6 category simultaneous operation of CFS and LPS is the onlymeasure for successful mitigation of accident. Operation of HPS followed byLPS is not sufficient to prevent core uncovering and subsequent overheating.
All breaks larger than 300 mm D are covered by this category (up to double-sided break of primary loop piping).
Selection of Accident Scenarios for Computer Analysis
Selection of accident scenarios to be Investigated by computer analysiswas based on the results of preliminary categorization. Selected scenariosdiffered by system configuration and break size. Localization of the break sizewas not investigated. In all calculations cold log break was selected as thebasic case.
The main effort was concentrated on verification of LOCA grouping ranges.The most important system configurations that determine limits for LOCAgroups were identified, as shown in Fig.I. For each system configuration atleast two LOCA break sizes were selected In such a way that all importantlimits for LOCa categories were bracketed.
LOCA categories LI and L2 were not well covered by he analyses, due tovery high CPU-time requirements. However, some attempt has been made toverify the existing results, obtained for this LOCA categories in the past withRELAP4, SLAP and other less sophisticated codes. For scenarios with HPI/HPRsystem operable ( HNNP, HNNN, HNLP ) three break sizes were investigated -160, 200, 300 mm D. For scenarios with HPI/HPR unavailable (scenarios NXLR,NXLN) smaller sizes were included - 60, 90, 120, 160 mm.
In all calculations capability of High Pressure Injection/Recirculationsystem was limited to single train (not degraded). In majority of cases thatinvolve Low Pressure Injection/Recirculation System, its capability wasassumed to be limited to single train (degraded to 50X and supplying coolant toupper plenum of the RPV).
In the whole break size range considered in the study (60-300 mmD) thesecondary circuit was assumed to operate in Its automatic mode (pressuremaintenance mode) with single EFS pump and single steam dumper (BRU-A).
For scenarios NXLN various numbers of Hydro-Accumulators (designated inthe coding system as 'X') were considered (In the range 0-3). In case of X»3 twoHA were connected to down-comer (DC) and one HA to upper plenum (UP). ForX=2, two cases were considered - two HA connected to DC, as well as one HAconnected to DC and one connected to UP. In case of X=l both cases - HAconnected to UP and HA connected to DC - were analysed.
Detailed specification of calculatlonal cases is given in graphical form InFlg.2.
RELAP5 CalculationsCalculations were performed using RELAP5/MOD2 code (version for PCPPS
workstation supplied by Risk Management Associates Co., Albuquerque, USA)and present version of input data prepared for WWER-440/V213 within theframe of IAEA Regional Programme RER/9/004
Simulation time was adjusted to achieve stable core cooling conditions(for successful scenarios) or the beginning of core overheating/uncovering. Incase of successful scenarios simulation was terminated when ECCS flow washigher than leak flow, the RCS inventory acceptably high and core temperaturesstabilized or decreasing. In case of failure sequences maximum claddingtemperature in average channel equal to 1200 K was adopted as terminationcriterion.
The results obtained from RELAPS calculations provided some new evidencefor re-assessing the categorization of LOCA and related success criteria. Inaddition, relatively detailed information on timing of accident progression wasaccumulated, particularly for sequences with degraded Core Flood System (3-1Hydro-accumulators) and for sequences with no ECC5 at all.
To large extent the new results are in good agreement with previouscalculations. However, in some cases slight re-evaluation of LOCA categorylimits was needed.
The results of calculations are briefly disscussed below with respect toeach of the six categories mentioned above. More detailed information is givenin [31
Refinement of LOCA Categorization
LOCA LIThis category was not investigated within the study and no new evidence
was brought up to verify previous assumptions. The calculations for 'this breaksize range are very CPU-time consumming. From the point of view of LOCA PSAthese investigations are not the highest priority tasks. In some WWER-440P5As 12], It was found that dominant contributors for LOCA category Ll arevery close to those for category L2.
181
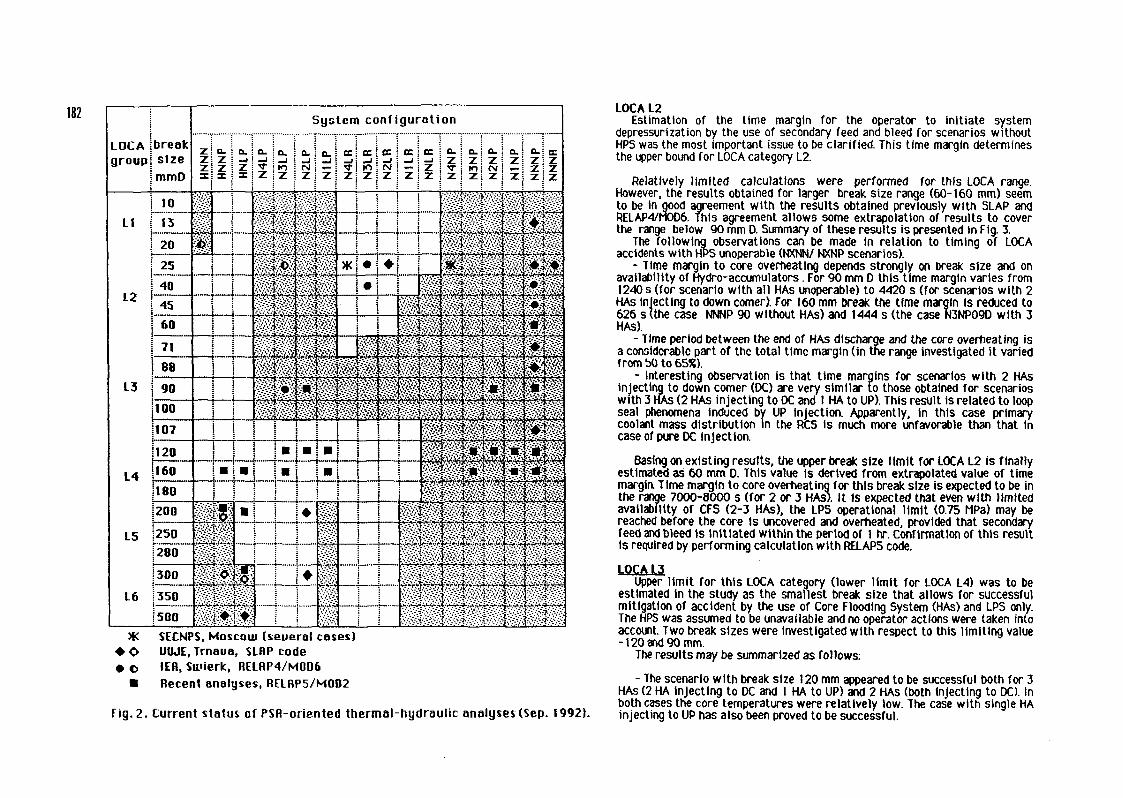
182 System configuration
: • 'fi'f'.-Sf i".- -?&j .••»*.: f i".-•
SECNPS, Moscow (seueral cases)+ O UUJE, Trnaua, SLHP code• o 1ER, Suiierk, RELRP4/MOD6
• Recent analyses, RELHP5/MOD2
Fig. 2. Current status of PSR-otiented thermal-hydraulic analyses (Sep. 1992).
LOCA L2Estimation of the time margin for the operator to initiate system
depressuhzation by the use of secondary feed and bleed for scenarios withoutHPS was the most important Issue to be clarified. This time margin determinesthe upper bound for LOCA category L2.
Relatively limited calculations were performed for this LOCA range.However, the results obtained for larger break size range (60-160 mm) seemto be in good agreement with the results obtained previously with SLAP andRELAP4/MOD6. This agreement allows some extrapolation of results to coverthe range below 90 mm D. Summary of these results is presented in Fig. 3.
The following observations can be made in relation to timing of LOCAaccidents with HPS unoperable (NXNN/ NXNP scenarios).
- Time margin to core overheating depends strongly on break size and onavailability of Hydro-accumulators. For 90 mm D this time margin varies from1240 s (for scenario with all HAs unoperable) to 4420 s (for scenarios with 2HAS injecting to down comer). For 160 mm break the time margin Is reduced to626 s (the case NNNP 90 without HAs) and 1444 s (the case N3NP09D with 3HAs).
- Time period between the end of HAs discharge and the core overheating isa considerable part of the total time margin (in the range investigated it variedfrom bO to 65%).
- Interesting observation is that time margins for scenarios with 2 HAsinjecting to down comer (DC) are very similar to those obtained for scenarioswith 3 HAs (2 HAs injecting to DC and 1 HA to UP). This result is related to loopseal phenomena Induced by UP injection. Apparently, in this case primarycoolant mass distribution in the PCS is much more unfavorable than that incase of pure DC Injection.
Basing on existing results, the upper break size limit for LOCA L2 is finallyestimated as 60 mm D. This value is derived from extrapolated value of timemargin. Time margin to core overheating for this break size is expected to be inthe range 7000-8000 s (for 2 or 3 HAS), it is expected that even with limitedavailability of CFS (2-3 HAs), the LPS operational limit (0.75 MPa) may bereached before the core is uncovered and overheated, provided that secondaryfeed and bleed is Initiated within the period of l hr. confirmation of this resultis required by performing calculation with RELAPS code.
LOCA 13Upper limit for this LOCA category (lower limit for LOCA L4) was to be
estimated in the study as the smallest break size that allows for successfulmitigation of accident by the use of Core Flooding System (HAs) and LPS only.The HPS was assumed to be unavailable and no operator actions were taken intoaccount. Two break sizes were Investigated with respect to this limiting value-120 and 90 mm.
The results may be summarized as follows:
- The scenario with break size 120 mm appeared to be successful both for 3HAs (2 HA Injecting to DC and I HA to UP) and 2 HAS (both Injecting to DC). Inboth cases the core temperatures were relatively low. The case with single HAinjecting to UP has also been proved to be successful.

14000
13000
12000
1 i 000
10000
9000
8000
7000
6000
5000
4000
3000
2000
1000
RELAP4/H3HM
A Core overheating
• End of HAs discharge
O Cladding temperaturestarts increasing
SLAP/3555.
20 40 60 80 100 120 140 160 mm D
183 Flg.3. Timing characteristics for accident sequences NHLP
- The scenarios with break size 90 mm should be considered as limiting forthis LOCA category The PCS pressure was decreased to the IPS operationallevel (in 4000 s) and the IPS started to inject coolant Operation of the LPSwas found to be periodical The RPS pressure oscillated at the level of LPSinitiation (075 MPa) up to 4900 s (the end of simulation period) It alsoappeared that at the beginning of LPS initiation the RCS was relatively close tocore overheating (without LPS initiation the core overheating occured in "420s)
- Taking into account these results it seems reasonable to increase limitingvalue for this LOCA category to 100 mm D (as intermediate value in the range90-120 mm)
- Success criterion for CFS may be relaxed to a single HA. if this limitingvalue is increased to 120 mm Accident scenario NNNP 120 mm, with no HAsavailable, appeared to be very close to reach the LPS operational limit (075MPa) before the core overheating In these conditions operation of a single HAis sufficient (this was proved for both 120 mm as well as 160 mm break)
LOCAL4Upper limit for this LOCA category (lower limit for LOCA L5) was to be
estimated as the largest break size that allows successful mitigation ofaccident by the use of HPS only Two break sizes were investigated withrespect to this limiting value - 200 mm and 160 mm D The results may besummarized as follows
The break size 200 mm D, previously considered as the limiting value forLOCA L4, appeared to lead to core overheating The break size 160 mm Dpermits successful mitigation of the accident Taking Into account a/m resultsintermediate break size 160 mm seems to be reasonable limiting value for thisgroup
LOCALSUpper limit for this LOCA category was to be estimated as the highest break
size that allows successful mitigation of the accident by the use of HPS andLPS only (without operation of HAs) Scenarios HNLP 300 and HNLP 200 wereinvestigated for this LOCA category Calculations were performed for partialcapability of LPS (50%, Injecting to UP through HA-1 surge line)
The results may be summarized as follows
- The accident scenario with 300 mm break should be classified as leadingto core damage Maximum cladding temperature in hot channel (1518 K)exceeds 1200 °C considered as a limit for zirconium cladding oxidationMaximum cladding temperature in average channel reached maximum 1080 KSlightly lower temperature may be expected for the case with full LPScapacity, however, this scenario was not investigated Basing on previousresult obtained by VUJE with SLAP code this scenario was assumed assuccessful

184 - Maximum cladding temperatures reached in the core for the scenario HNLP200 (covered by the LOCA L5 category) are considerably lower - 833 K inaverage channel and -HOOK in the hot channel
- Taking into account the results for 300 mm break slightly lower limit isproposed for LOCA LA The limiting value 280 mm is adopted basing onengineering judgment Success criteria for this category may be relaxed topartial capability of the IPS (508)
LOCA L6Very limited Investigations were carried out for this LOCA category
Analyses covered lower limiting break size 300 mm 0 No Investigation wasundertaken to verify success criterion for CFS (the number and location ofHAs)
Issues for further investigation
• The smallest size LOCA category L l should be investigated, particularly withthe respect to upper limit for this category
• Some additional calculations would be advisable to investigate timing ofaccident scenarios NXNN m the break size range 40-90 mm Extrapolationsmade for 40 and 60 mm breaks should be verified Some additional cases with asingle hydro-accumulator should also be included for the range 40 - 90 mm D
• Scenario NXLR for 60 mm break should be calculated to investigate allowabletime margin for starting the operator actions (initiating secondary feed andbleed) and to confirm assumption related to selection of this break size as theupper limit for LOCA L2
• Relaxation of success criteria for HPS for LOCAs L1-L3 is very likely(capability of HPS tram reduced to 50-60X) Some investigations with respectto this Issue would be valuable In PSA modeling.
• Relaxation of success criteria for LOCA L4 scenarios, with LPS and CFSonly, is likely (capability of CFS tram reduced to single HA)
• Scenario HNLN 300 should be Investigated for full capability of LPS
• Necessity to supply coolant from HAs and LPS to both lower and upper plenumof the RPV should be investigated for large LOCAs (L6)
• Some analyses would be needed to investigate effect of different breaklocations LOCAs within the steam generator comprises the separate categorythat should also be covered
References
[1] "Workshop on Plant Response for WWER-440 NPPs", Trnava, CSFR, 4-5May 1992, IAEA, TC Project RER/9/005, Consultant Report
[2] M Kullg, W Stçplert Rudzka, R Guzlk - "LOCA PSA for WWER-440 NPPs",RER/9/005 Final Report, Central Laboratory for Radiological Protection,Warsaw, January 1992
13) M Kullg, J Szczurek, W Kowallk, Z Bazso - "PSA-Oriented Thermal-Hydraulic Analyses for LOCA Accident m WWER-440 V213NPP", workunder the contract for VUJE, Science and Engineering International Ltd,
June 1992

185
LESSONS LEARNED IN APPLYING PSA METHODSTO TECHNICAL SPECIFICATION OPTIMIZATION
K N FLEMINGPLG, Inc.,Newport Beach, CaliforniaR P MURPHYHouston Lighting & Power Company,Wadsworth, TexasUnited States of America
Abstract
The paper presents some results of PSA application in the evaluation of Technical Specifications Twoplant-specific studies are addressed in relation to Seabrook NPP and South Texas Project plantsTechnical approach to TS evaluation is highlighted Some insights and lessons learned are presented
1. INTRODUCTION
PLG has been involved in a number of projects in which probabilistic safetyassessment (PSA) techniques were used to address Technical Specification issues Theseprojects have addressed a range of applications including proposals to make permanentchanges to specifications regarding surveillance testing and allowed outage times forequipment maintenance as well as one-time proposals to gain temporary relief on specificoccasions In a few cases, use was made of completed PSA models to support acomprehensive set of revisions to the plant Technical Specifications The object of suchplant-level evaluations is to determine the full plant-level risk impacts of proposed changes toconditions under which component testing and maintenance are performed during plantoperations In this paper, some of the results and lessons learned from such applications ofPSA on the Seabrook and South Texas Project plants in the United States are highlighted
2. SEABROOK STATION
The first full plant level assessment of Technical Specification changes that was performed byPLG was performed for the Seabrook plant (Reference 1) following the completion of afull-scope Level 3 PSA for that plant (Reference 2) In this study proposed changes toallowed outage times and surveillance test intervals were evaluated for several systemsincluding the component cooling, service water emergency feedwater electric power andemergency core cooling systems In addition changes to the amount of time that thecontainment purge isolation valves are permitted to be open with the plant in operation were
also evaluated The proposed changes were evaluated with respect to their impact onsystem unavailability, average annual core damage frequency, and conditional core damagefrequency given selected action statements within limiting conditions of operation (LCO)
Of all of the proposed changes to the Technical Specifications that were evaluated, only theproposed change to the allowed outage time of the diesel generators from 3 days to 7 dayswas found to have significant impacts to the average annual core damage frequency, and thisimpact was small The greatest impact of faking equipment out of service for maintenancewas observed for the component cooling water system whose conditional frequency of coredamage, given that one of its two trains is out of service for maintenance, was found to beabout a factor of 25 above the baseline average annual core damage frequency value of27 X 10" per year
One of the most significant results of the Seabrook study was that the relationship betweenTechnical Specification changes and plant-level risk as measured by core damage frequencywas established This required two features of the risk model One was the explicitmodeling of the impact of allowed outage times (AOT) and surveillance test intervals (STI) onsystem performance, and the other was the modeling of the impact of system-level changesbrought about by AOT and STI changes on the core damage frequency The latter wasaddressed by using the full plant PSA models that were available from the completed PSAThe former was addressed using the modeling approaches described in the next section
The Seabrook study was submitted for review by the U S Nuclear RegulatoryCommission (NRC), and a limited number of the proposed Technical Specification changeswere accepted However, the utility and NRC resources that were originally assigned to thisissue were subsequently diverted to address the emergency planning issues that greatlydelayed the licensing of that plant Currently, as part of the Seabrook Station living PSAprogram, the effort to pursue a risk-based approach to optimizing Technical Specifications atSeabrook Station is being reexammed
3. SOUTH TEXAS PROJECT
The most ambitious project that PLG has supported in the area of risk-based TechnicalSpecification optimization was a major study performed for the South Texas Project PWRPlant in Bay City, Texas, that proposed substantial changes to the AOTs and STIs(Reference 3) of that plant Like the case with Seabrook, the owners of the South Texas planthad made a unilateral decision to perform a PSA as the initiation of a risk managementprogram The PSA was performed by a team from HL&P and PLG, and the transfer of PSAtechnology to HL&P was given a heavy emphasis The South Texas PSA was completed in1989 as a full-scope Level 1 PSA with external events and a full treatment of plant damagestate bins (Reference 4) This particular PSA scope is sometimes referred to as a Level 1 5PSA because all active systems needed to support the containment safety functions wereincluded as well as those needed to protect the reactor core
The mean core damage frequency obtained in the PSA was 1 7 X 10 * per year, with largecontributions to CDF from support systems needed to protect the reactor coolant pump sealsand to maintain adequate core cooling A number of significant design and operationalfeatures of the plant were changed as a result of the PSA including a change of containmentisolation valves in the containment purge system from motor-operated to air-operated valves

186 '° reduce 'ne likelihood of containment isolation failure a similar change in the primarycoolant letdown isolation system to reduce the likelihood of loss of coolant during a stationblackout a new capability to provide reactor coolant pump (RCP) seal injection cooling that isindependent of the need for safety-grade electric power, and new procedures and training toreduce the likelihood of critical damage to electrical switchgear following a loss of electricalauxiliary building ventilation
While the PSA was in progress, HL&P notified the NRC that it intended to propose changes tothe Technical Specifications based on an evaluation using the models that were developedduring the PSA There were a number of motivations for this request that made this aparticularly important issue for the South Texas plant These motivations included
• There was no definitive basis for the original Technical Specifications that weregenencally developed for Westmghouse pressurized water reactor (PWR) plants
• The original generic Technical Specifications were developed for a plant with tworedundant trains for safety-related systems South Texas has at least three redundanttrains for all safety-related equipment With a few and only rarely occurring exceptions,only one train is needed to provide basic safety functions
• As a three-train plant, the frequency of events requiring maintenance or testing is at least50% greater at South Texas compared with a two-tram plant
• There was a desire to achieve a better balance m the maintenance program between theconflicting goals of reducing the frequency of component failures via preventativemaintenance and the undesirable consequences of maintenance unavailability Similarly,there was a desire to obtain a stronger payoff from the heavy investment into plantmaintenance
• There was the usual desire to reduce operation and maintenance costs and to reduce theamount of lost eiectncal generation due to unfavorable interactions between test andmaintenance activities and plant operations
NRC agreed to proceed with the review of the requested changes following an m-depthreview of the original PSA in which the baseline core damage frequency and the PSA modelsthat would be used in the Technical Specification evaluation could be approved by the NRCas a valid basis for the acceptability of the Technical Specification changes The TechnicalSpecification evaluation was performed by HL&P personnel who provided a realdemonstration of the skills in PSA technology that they acquired in the PSA such that only amodest amount of consultant support was needed The NRC review of the original PSA wasperformed and was supported by its contractors, Sandia National Laboratories, and theresults of that review were published in a safety evaluation report (Reference 5) Tosummarize the results of its review the NRC found the STP PSA to be a state-of-the-art studyand accepted the estimated core damage frequency and the PSA models to be a valid basisfor completing its review of the Technical Specification study According to current U S law,the NRC review of the PSA and the Technical Specification evaluation, albeit independent,was paid for by the plant owner, HL&P The results of the Technical Specification evaluationthat was performed after the PSA are discussed in Section 5
4. TECHNICAL APPROACH TO EVALUATION
4.1 OVERALL APPROACH
The technical approach to evaluation of Technical Specifications in the South Texas studywas patterned after the approach pioneered for Seabrook and included the basic elementslisted in Figure 1 Following the formation of proposed changes to AOTs and STIs with inputfrom the operations and maintenance departments, the impacts of these changes wereevaluated in two stages to determine the impact of the changes on core damage frequencyThis two stage process was natural because of the particular PSA methodology that wasemployed in the original PSA, which features the use of large linked and modularized eventtrees In this approach, the event trees are quantified numerically with input provided by theresults of system fault tree analyses separately performed Rather than using a single eventtree, a set of modularized and linked event trees was used, as illustrated in Figure 2 In thecurrent form of the models, the entire risk modeling effort is performed within the PC-basedrisk analysis and risk management software system known as R IS KM AN (References 6and 7)
To understand the way in which changes in AOTs and STIs were evaluated within theRISKMAN technology, it is useful to review the basic steps employed in this methodology forevent sequence quantification
CURRENTPSA RESULTS/IMPORTANCE
MEASURES
Figure 1. Two-Stage Process for Evaluating AOT and STI Changes

INITIATINGEVENT GROUPS
( INTERNAL ^"\1 EVENTS ) ———
f INTERNAL ~N
V FLOODS J
( SEISMIC ^EVENTS I — *"
X"~ OTHER ~N
V EVENTS y
/" 1NTEHFACINO "\
EVENT TREE MODULES
SEISMICDAMAGEEVENT TREE r
SUPPORT
EVENT TREE
+-
-»-
-*•
TRANSIENT/SLOCAEVENT TREE
MLOCAEVENT TREE
LARGELOCAEVENT TREE
EXCESSIVELOCAEVENT TREE
SGTREVENT TREE
ATWSEVENT TREE
•>•
*-
GT/RECIROEVENT TREE
SGTRmECIHCEVENT TREE
-*•
*-
LEV6
L 1
SEQ
UENC
ES W
/O R
ECO
VERY
END
STATES
j 1
_ RECOVERY -1 ( .NT„* ———TREE ——— H %£
\^
Figure 2. Modularized Event Tree Structure for South Texas Level 1 PSA
187
Event sequences are constructed via computer software and logic rules that transformthe set of event tree modules into a set of large event trees that trace sequenceprogression from initiating events to sequence end states including successfultermination and plant damage states
Event sequences are quantified in terms of initiating event frequencies and branchingfrequencies for each event tree node These event tree branching ratios are referred toas split fractions The numerical values of those split fractions associated with systemperformance are developed from the results of systems analysis models that includeexplicit treatment of initial system alignments, fault tree minimal cutsets, common causefailure models, and simple probability models that relate the fault tree basic eventprobabilities to parameters whose values are estimated from data
Each split fraction related to system performance along an accident sequence isexpanded to consider any number of initial system alignments according to the followingequation
where
F(Aj)
F(SF,|Ap
N
= fraction of time that the system is in alignment Aj
= conditional frequency of split fraction SF,, given that the system isin alignment A(
= total number of different alignments
Equation (1) is exact as long as the set of alignments considered is both mutuallyexclusive and complete The approach to implementing the alignment concept in theRISKMAN software is to first develop a fault tree for the "normal alignment" in which notest or maintenance is in progress Then, the models for the separate alignments aredeveloped as special cases of the fault tree, and each one is analyzed separatelythrough Boolean reduction and quantification The separate models are integrated
automatically by RISKMAN which applies Equation (1) to construct the split fractionmodel from the individual alignment models
This equation is extremely important in modeling of the impact of Technical Specificationchanges on risk for the following reasons Separate system alignments are normallyspecified for testing and maintenance Using this approach, basic events associatedwith unavailability for test or maintenance are removed from the fault tree and used toquantify the terms F(Aj) As a result, dependencies created by the TechnicalSpecifications that prohibit maintenance of one tram of equipment while a redundantcounterpart train is also being maintained can be handled without the problem ofintroducing "complement events" or NOT gates into the fault trees There are no validfault tree solution schemes that can properly handle such fault trees Any alignment thatcould result from a combination of possible concurrent maintenance or test activities issimply treated by enumerating the proper set of alignments
4 The impacts of each alignment on the performance of the system are modeled byapplying a 'house" event to the fault tree to model the resulting functionalunavailabilities introduced by the alignment conditions Separate Boolean reductionsmust be made of the fault tree for each alignment Common cause events are applied tothe system fault tree prior to Boolean reduction to take care of the concerns flagged inthe common cause analysis procedures guide in Reference 8 regarding the impacts thatcommon cause events have on the determination of minimal cutsets
5 The initial alignment probabilities F(A) and the fault tree basic event probabilities arequantified using probability models that are derived in terms of parameters that arequantified from available data These probability models account for the followingcauses of degradations to system performance
« Initial unavailability due to being removed from service for testing or maintenance
• Misalignment due to human errors following test or maintenance
• Independent or common cause failures to start on demand
• Independent or common cause failures to continue operation during the systemmission
6 Bayesian updating is employed to synthesize data from other plants and other sourcesof data to produce generic uncertainty distributions for model parameters such as failurerates maintenance frequencies and durations, and common cause failures parametersBayesian updating is also used to incorporate plant specific data from the plant beingevaluated using the generic distribution as priors
4 2 MODELING ALLOWED OUTAGE TIMES
As with many issues that are modeled in a PSA the treatment of AOTs uses the principle ofusing models that make the most effective use of the available data In the treatment ofAOTs at Seabrook and South Texas use was made of the PSA database at PLG that includesthe plant specific databases that have been developed in 22 plants in the U S and m Europethat had accumulated at least 5 years of experience (Reference 9) This database includessufficient experience to be able to estimate reasonably well the relationship between AOTsand maintenance unavailability
With reference to Equation (1), each unavailability of equipment in a system due tomaintenance is modeled by defining an appropriate set of maintenance alignments, one foreach unique system configuration created during the maintenance of equipment Forexample, suppose the one such alignment is defined for maintenance of a pump tram within asystem
Let Aj = alignment for pump maintenance
F(A ) = F 7 T «- Fmp ' Tmp
where Fmp = frequency of pump maintenance (per hour)
Tmp = duration of pump maintenance (hours) while the plant isoperating at full-power for a full power PSA, or while the plantis in an alternate mode for an alternate mode PSA
The maintenance frequency can include contributions from both preventive or correctivemaintenance, or, alternatively, separate alignments may be specified for each if the separatemaintenance frequencies are known Note that neither the total maintenance frequency northe corrective maintenance frequency should be confused with the failure rate because thereare many examples of corrective maintenance being performed when actual failures have notoccurred Please also note that maintenance duration is the total time that the component isout of service for maintenance and not equivalent to the so called mean time to repair whichmay be a small fraction of the actual out of service time
Upon careful review of actual plant data from the above mentioned 22 plants 2 observationshave been made that have guided our approach to modeling the impact of AOTs on systemperformance One observation is that the database includes many generic components thatare subjected to widely varying AOTs in their respective plants Thus, we can actuallymeasure the impact of the AOTs The second is that the principal way in which the AOTcomes into play is to determine the possible range of maintenance durations By sorting thegeneric database on maintenance durations by AOT at the respective plants, a clearcorrelation is observed, as illustrated quite graphically in Figure 3 for pumps
As can be seen in Figure 3, which presents the values of the maintenance duration in theform of an uncertainty distribution that accounts for data sparsity and plant-to-plant variability,the duration of maintenance distributions is bounded at levels that are slightly higher than theAOT values This figure is derived from operating plant data none of which were ever inviolation of the given Technical Specifications or exceeded their limits The upper tails of thedistributions that lie in the regions outside the limiting conditions are an artifact of using alognormal model (or the prior These upper bounds however are not completely erroneousbut reflect the fact that the respective Technical Specifications normally provide a few hoursafter the AOT has expired to affect the appropriate shutdown procedure These results reflectnot only the impact of the AOT in constraining the operation of the plant when an actionstatement is entered but also the fact that the lovel of AOT will influence the priority given towhen the actual repair activity will begin
In the case of the South Texas Project study the generic maintenance frequency and durationdistributions were adjusted to reflect the preventive maintenance program of that plant aswell as its equipment tag out procedures which set a lower hound on the durations to permitadministrative processing of the tag out

AOT = 24 HOURSAOT = 72 HOURS
mO
'NEW
NO TECHNICAL SPECIFICATIONS
10*1 10*2 10+3
DURATION (HOURS)
to*4 io*s
189
Figure 3. Impact of Allowed Outage Time on Maintenance Duration of Pumps
4.3 MODELING SURVEILLANCE TEST INTERVALS
As with the AOTs, the approach to modeling the STIs is rooted in a firm understanding of thecharacteristics of the underlying PSA database From elementary reliability modeling, it iswell known that periodic testing of standby equipment helps to reduce the probability that theequipment would be unavailable at some random point in time when a demand for operationoccurs due to some latent condition from a failure in standby that occurred and remainedundetected since the last test In addition to these standby failures, standby components canalso be subject to failures that occur at the time of demand due to the stress of bringing thecomponent into service from the standby state This is especially important for mechanicalcomponents such as diesel generators
Unfortunately, in putting together the current PSA database, the data for standby componentsare only segregated to the extent that failures to operate on demand are distinguished fromfailures that occur during operation The demand failures had not been broken down intoseparate contributions from undetected standby failures and stress-related failures
Moreover, even if the need to address this issue had been foreseen when the data wereoriginally collected, in most cases, plant records were inadequate to be able to distinguishthe two failure types for particular component types
To treat the question of STI changes the failure rates for standby equipment for failure tooperate on demand are decomposed according to the following simple formula
Shock InducedFailures
Standby Failures
Qd = failure rate per demand from data
fs = fraction of demand failures that occur in standby
Tre, = effective or average STI for demand failures in database
TNEW = proposed new STI for Technical Specification changes
Then, special studies were performed to estimate the values of the factor fs for genericcomponent types For example, the mean value of fs for standby diesel generators wasestimated to be about 57, i e , 57% of the failures on demand were estimated to be trulystandby failures, and the remaining 43% were determined to be stress induced
Equation (2) permits the prediction of changes to the effective standby failure rate due tochanges in the test interval that only impact the true standby failure contribution There is animportant implication of the stress-induced failures that sheds light on the dubious wisdom ofanother frequently encountered facet of the Technical Specifications Plants such asSeabrook and South Texas have a Technical Specification requirement to performconfirmatory tests on components in a system when a redundant component is taken out ofservice and a corresponding action statement is entered To the extent that the parameter fs
is less than 1 0, such testing would increase the likelihood of multiple componentunavailabilities from the test itself It was found in the Seabrook study that by replacing sucha confirmatory test for the diesel generators with an alternative requirement for a visualinspection to ensure proper lineup of the redundant diesel generator that a net reduction incore damage frequency would result
A final implication of the stress-induced component to the demand failure rate is that, unlessthe value of fs is known, it is not possible to know the optimum testing frequency There isintroduced a tradeoff that occurs when testing frequency is increased in that the reduction inthe unavailability due to undetected standby failures is offset by the increase in the likelihoodof a failure caused by the test itself
5. RESULTS OF SOUTH TEXAS EVALUATION
The Technical Specification evaluation of Reference 3 is currently being reviewed by the NRCIn this evaluation. Technical Specifications covering AOTs and STIs in 22 different systemsare proposed For 5 of these systems, changes were proposed for both the AOTs and STIs,for 4 systems, only the STI was changed, and, for the remaining 13 systems only the AOTwas proposed for a change Although the evaluation showed that most proposed changeshave little or no impact on either system performance or core damage frequency theproposed changes that werf found to have the relatively gréâtes! impact are summarized inTable 1 As can be seen in this table in many cases the AOT of 3 days was evaluated for

extension to 10 days and in a few cases, monthly or bimonthly testing was evaluated forextension to quarterly testing In general, changes were only proposed when considered tobe beneficial from an operations or maintenance point of view
The 22 changes that were proposed for consideration by the NRC were evaluated bothindividually and in combinations, including the combination where all 22 changes areaccepted The results of the evaluation for the changes listed in Table 1, analyzedindividually, and the collective results for all 22 changes are illustrated m Figure 4 Theremaining 12 changes that were evaluated were found to have essentially no impact oneither system-level or plant-level performance The individual results are not additivebecause individual sequences contributing to core damage frequency may contain splitfractions from any number of different systems The results in terms of core damagefrequency for individual systems ranged from essentially no increase to less than 30%increase, with the combined effect of all 22 changes found to have about 70% increase incore damage frequency At the system level, the changes are seen to be amplified becauseno single system really dominates core damage frequency
Based on preliminary discussions with the NRC, there has been an indication that coredamage frequency impacts of more than 10% for individual changes may not be accepted,and, conversely, that changes less than this value are acceptably low There were threesystems whose changes were found to individually increase the CDF by more than thesuggested 10% criterion auxiliary feedwater, essential raw cooling (service) water, andemergency diesel generators
Table 1 Technical Specification Changes with Greatest Risk Impact
System
Reactor Protection
Accumulators
ECCS
Auxiliary Feedwater
Component Cooling Water
Essential Cooling Water
Control Room HVAC
Essential Chilled Water
Diesel Generators
DC PowerBatteriesChannel I IV ChargersChannel II IV Chargers
Allowed Outage, Time
No Change
1 Hour -» 6 Hours
3 Days -> 10 Days
3 Days -> 10 Days
3 Days -* 10 Days
3 Days -» 10 Days
First Train 7 Days -» 10 DaysSecond Tram 1 Day -» 3 Days
3 Days -* 10 Days
First Train 3 Days -» 10 DaysSecond Train 2 Hours -» 12 Hours
2 Hours ~> 24 Hours24 Hours -» 72 Hours2 Hours -> 72 Hours
Surveillance TestInterval (Days)
62 -+ 92
No Change
No Change
31 -» 92
No Change
No Change
31 -» 92
No Change
No Change
No Change
Recently, HL&P and PLG performed an update of the PSA as it was extended to Level 2 forthe purpose of meeting the individual plant examination requirements that have beenimposed for U S plants The Level 1 portion of the PSA was updated to match up themodels with recent upgrades to the RISKMAN software and to incorporate system changes,plant-specific operating experience, and PSA modeling refinements As a result of thesechanges and the mutual desire to keep the proposed changes within the unofficial 10%criterion, the NRC and HL&P are currently evaluating the implications on the TechnicalSpecification evaluation Thus, it is not unlikely that there may be a revision to the actualTechnical Specification changes that will be proposed and accepted To support this effort,NRC and its contractors at Brookhaven National Laboratories are planning to performindependent analyses using the PSA models developed by HL&P and the RISKMAN softwaredeveloped by PLG
6. INSIGHTS AND LESSONS LEARNED
The applied PSA studies for Seabrook and South Texas Project have provided a number ofimportant insights and lessons learned regarding the use of PSA techniques to address theimpact of changes to the plant Technical Specifications These insights and lessons learnedinclude
• The importance of modeling the maintenance unavailability in sufficient detail so that theeffects of varying maintenance durations can be addressed
• The need to distinguish between the mean time to repair and the actual duration of amaintenance outage
• The need to identify the impact of Technical Specifications on the observed generic datafor maintenance duration
• The important need to distinguish between standby failures and failures induced by theshock of putting a standby component into service and the implications that this has onconclusions regarding the optimum testing interval and confirmatory testing
• The need to be able to view the relationship between Technical Specifications andplant level risk and the misleading conclusions that can be reached from system levelevaluations
• The importance of a full scenario perspective on the risk significance of a change inTechnical Specifications and the fact that a given change may increase the risk of oneclass of sequences while decreasing the risk of others
• The use and interpretation of risk importance measures to guide decisions regardingtesting and maintenance

1000%
100%
INCREASE IN SF / CDF
10% -—m
TOTAL RPS ACCUM ECCS AFWS CCW ERCW CR ECW DG DCCDF HVAC TRAIN
I SYSTEM UNAVAILABILITY • CORE DAMAGE FREQUENCY
Figure 4. Comparison of System and Plant Level Impacts of Technical Specification Changes at STP
191
REFERENCES
Fleming, K N et al , "Risk-Based Evaluation of Technical Specifications for SeabrookStation," prepared for New Hampshire Yankee by Pickard, Löwe and Garrick, Inc ,PLG 0431, August 1985
Pickard, Löwe and Garrick, Inc , "Seabrook Station Probabilistic Safety Assessment,"prepared for Public Service Company of New Hampshire, PLG-0300, December 1983
Houston Lighting & Power Company, "Proposed Amendment to the Dm! 1 and Unit 2Technical Specifications Based on Probabilistic Risk Analyses—South Texas ProjectElectnr Generating Station, Docket Nos STN 50-498 and STN 50-499," Letter fromG E Vaughn to USNRC, ST-HL-AE-3283, February 1, 1990
Pickard, Löwe and Garrick, Inc , "South Texas Project Probabilistic Safety Assessment,'prepared for Houston Lighting & Power Company, PLG-0675, May 1989
Dick, G F, U S Nuclear Regulatory Commission letter to D P Hall, Houston Lighting &Power Company, "Safety Evaluation by the Office of Nuclear Regulation Related to theProbabilistic Safety Analysis Evaluation, South Texas Project, Units I and E," (DocketNos 50-498 and 40 499), January 21, 1992
PLG, Inc , "RISKMAN—PRA Workstation Software," User Manuals I-IV, Version 3 0(Proprietary), 1992
Epstem, S A , RISKMAN® A System for PSA," presented at Third Workshop on LivingPSA Applications, Hamburg, Federal Republic of Germany, May 11 and 12, 1992
Mosleh, A , et al , "Procedures for Treating Common Cause Failures in Safety andReliability Studies," Pickard, Lowe and Garrick, Inc , prepared for U S NuclearRegulatory Commission and Electric Power Research Institute, NUREG/CR-4780,EPRI NP-5613, PLG-0547, Vols 1 and 2, January 1988
PLG, Inc Database (or Probabilistic Risk Assessment of Light Water Nuclear PowerPlants," PLG 0500 (Proprietary) Volumes 1-9, 1991

192 TEST STRATEGIES FOR STANDBYDIESEL GENERATORS*
T MANKAMOAvaplan Oy,Espoo, Finland
Abstract
Diesel generators (DG) have been selected as the object for a pilotstudy, with the aim to address plant specific defensive measuresagainst CCFs, and to generate representative CCF data which takeinto account such defences . As a part of this venture, thesurveillance test arrangements were considered with specialemphasis on the detection and removal of latent CCF mechanisms.A comprehensive data base for the DCs of the Swedish plants and TVOI/II plant was collected and analysed in regard to the CCFmechanisms. 418 DG years were covered, including 49 monitoredcritical (shortly revealed), and 83 latent critical faults detectedat startup from standby and 40 during DG operation. This data basewas further supplemented with a closer interpretation of failuremode, and detectability by different test methods. The informationprovided a good basis in order to draw conclusions about theefficiency of different test types, and to evaluate test intervalinfluence and to compare alternative test strategies for a group ofredundant DCs.
1 INTRODUCTION
These considerations for test strategies constitute a part of thejoint effort, conducted by ABB Atom AB and Avaplan Oy, within theresearch program of the Swedish Nuclear Power Inspectorate (SKI),with the aim to address plant-specific defensive measures againstCCFs and to generate representative CCF data which properly takeinto account such defences [RFC 89-60].Diesel generators have been selected as the object for the pilotstudy. A comprehensive data base for the diesel generators of theSwedish plants and TVO I/II plant, covering the years 1980-89, wascollected and analysed in regard to CCF mechanisms [RFC 91-76]This data base was further supplemented with a closerinterpretation of the failure mode and detectability by differenttest methods [NDGDB_LC] This information base covers 418 DG yearsand includes 172 critical failures of mode
* Work performed under the auspices of the Swedish Nuclear Power Inspectorate (SKI) The viewsexpressed are those by the author and do not reflect any position or policy of the SKI
49 monitored critical (shortly revealed )83 latent critical faults detected at startup from standby40 critical failures during DG operation,providing useful input to investigate the test efficiency, withspecial emphasis on an early capture of CCF mechanisms The testinterval and test scheme, i.e. relative placing of tests inredundant subsystems, varies among the plants, which gives a goodpossibility to investigate their influence as well.This work builds upon the earlier related work, specially theearlier DG studies [FS_DG82, F12_DGS], as well as on the moregeneral developments for test arrangement considerations [NKA/RAS-450] .The main results and new insights from the test strategyconsiderations will be summarised in this paper. A more completetechnical documentation can be obtained from the SKI [NDGDB_LC,DG Tests]. ~
2 FAILURE MODES OF A STANDBY DIESEL GENERATOR
For a standby safety component like a DG, the failure modes whichare relevant for the operability of the component when called uponfrom the standby state, divide up into two main categories
so called monitored faults, which are promptly or shortlyrevealed, although being in standby state, by instrumentation,alarms or frequent walk-aroundslatent faults, or more generally hidden faults, revealed onlyat a demand and required mission period, or by an effectivetest
A proper distinction shall be done between these categories due tothe principally different unavailability contributions, as alreadydiscussed in more detail in Ref.[TI_Opt88]. It should be noted,that the monitored critical failures contribute only during therepair downtime, while the latent/hidden critical failures have amore extensive contribution through the standby unavailabilityThe latent/hidden faults shall still be divided up in regard towhether they are revealed at start or during mission periodFailures affecting a DG after a long load running period may haveown characteristics- they may be correlated only to cumulativerunning time but not to time being in standby state or testproperties. In this context this kind of further classification isnot implemented, because mean load operation time is only about onehour per pest. The failure modes detected at startup and duringtest running time, are classified separately in the data analysis,but lumped together in unavailability modellingFaults can be either critical in regard to safety function, or socalled noncritical faults, which do not directly imply

193
unavailability, but need to be repaired in order to prevent theirescalation into critical state, and impose unavailability duringthe active repair time.A definition scheme of failure modes, following the aboveprinciples, is presented in Table 1, specifically applicable toDCs. Table 1 also shows the number of events for the failure modesaccording to the updated DG data base
3 TEST TYPES, DETECTION OF FAILURES
The detection methods of failure mechanisms can be structured inthe way presented in Table 2. These detection methods are arrangedaccording to the expected efficiency in the detection of latentfaults. They are specific to DG, but still reflect the differencein test/demand efficiency for standby equipment in general. Thecontent of the different test/demand types are discussed in moredetail in Refs.[F12_DGS, DGJTestS]For diesel generators, the continuously monitored parametersinclude start air pressure, lube oil and cooling waterlevel/temperature/pressure, and base state of various components.The monitored variables or properties sum up to about one hundredper DG aggregate. About half of these are monitored continuously orat frequent time points during the standby time, while the otherhalf are relevant for the startup and loading phases. As a neteffect, a relatively large part of faults fall into the category ofmonitored ones, Table 1. This reduces the standby unavailability.
4 TEST SCHEMES, CCF DETECTABILITY
The detection of a latent CCF depends on the test method but alsoon the relative placement of test times in the redundant DCs.4 .1 Basic test schemesThe periodic tests ST/LT are performed with intervals varying fromone to four weeks per DG aggregate. Different type of schemes areused to place these tests in redundant aggregates Selectedstandard schemes are illustrated in Fig.l, for the case of fourredundant DGs, and preserving the frequency of LTs as once per fourweeks per DG aggregate, while varying the frequency of STs as wellas the relative placement of ST/LTs There are included
two sequential schemes SEQ1 and SEQ2, with ST/LT interval of 1and 2 weeks, respectively
- pairwise staggered scheme PST2, where ST and LT are performedalternatelyevenly staggered scheme EST4, including mere LTs
These schemes were considered as alternatives in the earlier testarrangement study [F12_DGS], and their comparison will be discussedin Section 6, based on updated data
Table 1 Definition of functional failure modes for a standbydiesel generator Division of the experienced faults forfailure modes, Swedish NPPs and TVO I/II, 1980-89[NDGDB LC] .
FUNCTIONAL CONSEQUENCE
Component state at faultoccurrence/detection
NONCRITICALPrevents operation onlydunng active repair
CRITICALComponent Inoperabledirectly
MONITOREDIN STANDBYDetected viainstrumentation,walkarounds, etc
LATENTIN STANDBYDetected at startupfrom standby orat Initial loading
FAILURE DURINGOPERATIONFault occursafter startup
HIDDENIN STANDBYHx = Lx + Fx
Number of eventsaltogetherAx = MX + Hx
= MX + Lx + Fx
MN MC
Monitored noncrttical Monitored critical
67 51% 49 28%
LN LC
Latent noncntical Latent critical
59 45% 83 48%
FN FC
Fault during operation, Failure to run, criticalnoncntical6 5 % 4 0 2 3 %
HN HC
Fault at startup or Failure to start/run, criticaldunng running period65 49% 123 72%
132 100% 172 100%
î îRelative contributionRelative contribution
Number of events

194 Table 2 Detection methods of faults in a standby DG, arranged inthe general order of efficiency [DGJTestS].
first detection, because after the completed repair, theunavailability of the repaired aggregates is independent fromthe possible remaining CCF in the other aggregates
MO Monitoring measures
PM Preventive maintenance
ST Start test
Detection by instrumentation, alarms, visualinspections at walk-arounds etc
Includes post-maintenance tests prior toreconnectai
Starting and running over about half an hourwithout load
SEQ1
Week
T = 1 week
SubiSub 2Sub 3Sub 4
LSSS
SL
Ss
ssLS
sssL
LSss
sL
SS
SS
-'L'S
sssL
LT Load test
AT Annual subsystem test
DE Demand event
In addition to start test, the generator is phasedwith and loaded to power bus, with load runningover 1-2 hours.Also more detailed controls and checks arecarried out as compared to a start test
The loss of voltage is simulated in one bus at atime.
The loss of voltage occurs at a random timepoint, and loading is controlled by automation.Also Isolation transients, where DGs areautomatically started but not necessarily loadedare Included In this category.
The current schemes at the Swedish plants and TVO I/II plantclosely follow the basic schemes in Fig.l. At some plants, allperiodic test include loading, i.e. no mere STs are performed. Mainpart of periodic tests utilise so called soft starting, where fuelinjection is reduced in the first beginning resulting on a slower,and less stressing startup of the engine. In part of the tests,cold rush starts are performed.4.2 CCF detectionThe sequential scheme is clear with regard to CCF detection as theredundant aggregates are tested consecutively by the same persons(mostly).In pairwise and evenly staggered test schemes, the CCF detectiondepends further on whether in case of fault detection, additionaltests are done for the other redundant aggregates:
if no additional tests are done, the multiple unavailabilitysituation may be revealed only afterwards; nevertheless, it isbeneficial that part of the faults are repaired due to the
SEQ2 | T = 2weeks———— >
SubiSub 2Sub 3Sub 4
-L, SJjJ' S
Ss
ff S-7« ~-r-$l e
sWeek 1 2 3 4 5 6 7 8
PST2
SubiSub 2Sub 3Sub 4
T = 2 weeks
s*L*\ Sc't'f S
s 8tt|2s Ci?
'•v'ï ®fi B gs m
S iSliWeek 1 2 3 4 5 6 7 8
EST4
SubiSub 2Sub 3Sub 4
T = 4 weeksf
s; L-PL ;.
LL
,L ,•UL "*
?LL
Week 1 2 3 4 5 6 7 8
S Start testL Load testT Test interval
Figure 1. Basic test schemes for a group of four DCs.

if additional tests are done in staggered scheme in faultdetection situation, this scheme as a whole becomes mostefficient with regard to high order CCF detection, becausethere are shorter intervals of detection possibilities ascompared to sequential scheme (with equal test interval persubsystem, compare with Fig.l).
There are additional influences of the test scheme. In staggeredscheme, the risk of systematic errors introduced in test, and testrelated maintenance actions may be significantly lower as comparedto sequential scheme, where the actions are consecutively done bythe same persons on the same day. In the opposite direction, instaggered scheme, it is more difficult to get an alert from earlysymptoms of developing CCF in redundant aggregates, specially ifthe consecutive test actions in the redundant subsystem are done bydifferent shifts (as usual).
5 COMPONENT UNAVAILABILITY AND CCF MODEL
This chapter shortly summarises main concepts of the unavailabilityand CCF model for a standby component. The more detailedpresentation can be found in Ref.[TI_Opt88].
5.1 Simple a_±esS modelThe main characteristics of the latent failures of a standbycomponent is that their presence is not known during the standbystate. They are described by a probability, called instantaneousunavailability. The following simple model is usually applied:
u(t)=q-t-X(t-tLastTest) (51)whereq = Timeindependent part of the unavailabilityX = Standby failure rate (timedependent part)t|_astTest = Last test/demand time point
The timeindependent part constitutes of failures introduced intests and remaining unnoticed up to next test or demand, andfailure mechanisms progressing merely in test/demand operations butbeing "frozen" during standby time. The timedependent partdescribes generally failure mechanisms progressing during standbystatePart of the latent faults may not be detected in normal componenttests, but only in annual system tests or actual demands The q + A.tmodel can be extended to these cases by modelling the failuremechanisms distinctly by different test/demand schemes and specificunavailability parts This will be done for DCs in regard to faultsdetectable in ST, LT and AT/DE, respectively, will be discussed inthe following sections
4.2 Modelling approach to CCF mechanismsThe CCF mechanisms can in the first approximation, be described ina similar fashion as component failure mechanisms above: the CCFbasic events affecting different combinations of redundantcomponents are modelled by a simple linear model constituting oftimeindependent and tirnedependent part as in Eq (4.1) The point oflast test/demand is associated to the time point where some of thecomponents in a given combination have been tested or demanded lasttime (i.e. the last possibility to reveal a common fault) Themodelling of CCF mechanisms, and their interference with tests areof central importance for the consideration of test schemes forredundant components. A more detailed treatment of this area ispresented in Réf.(TDep_CCF).
6 RESULTS ON TEST EFFICIENCY, TEST INTERVAL INFLUENCE
6.1 Relative contribution of failure modesThe number of events (NE) when classified according to the faultdetectability are summarised in Table 3, and the fractionalcontributions illustrated in Fig.2. In addition, there are shownthe corresponding contributions in the mean unavailability (Un) ofa single DG aggregate with 1 week test interval, every 4th testbeing LT, while other tests during power operation are mere STs.About the efficiency of the test methods, the results show that therole of mere STs is limited. Although the number on faults revealedonly by ATs is small, their unavailability contribution issignificant due to the long latent time. Thus, ATs have animportant role to complete ST/LTs, which are not 100% efficient.
Table 3 The number of events (NE), classified according to thefault detectability, and the corresponding contributionsin the mean unavailability (Un) of a single DGaggregate. Swedish plants and Finnish TVO I/II plant1980-90.
f [1/h]___ UnIB" 2E-7 ~ "dödäF " "20% "~td=o 4 a46E-6 00049 38% T = 4W1 3E-5 00043 33% T=1W1 3E-5 00003 2% a=20 h
Failure mode/Detectability ClassLatent AT/DEcritical LT
STMonitored criticalNoncritlcal, all modes
HCDHCLHCSMCAN
NE3378349
J.?2
304
q f1% (12% 30E-3 i27% 23E-3 116% 143% Î3 6E 5 0 0009
"001297% a = 24h
195

196
GAN
D MC
MHC.S
DHC.L
HHC.D
NENumber of events Unavailability contribution
Figure 2 Relative fractional contributions from Table 3.
The contribution of HC.D is nevertheless smaller than what can beinferred from foreign data [CCF_DGRD]. This is presumably relatedmainly to an enhanced physical and process separation of DCs andtheir supports systems, as well as of the AC/DC buses for safetysystems, at the plants of ABB Atom AB design (valid also forRinghals 2-4 units, Westinghouse PWRs).It should be pointed out, that the unavailability estimatespresented here lack the downtime contribution of preventivemaintenance, which is usually about IE-2 per DG aggregate, i.e. atthe same level as the contribution of random faults/repairs.6.2 Aggregate part versus failure modeIt was of interest to investigate, where the different failuremodes are localised in respect to DG aggregate parts, in order tosee, how this information compares with the statisticalconsideration of test efficiency. The following conclusions can bedrawn [DG_TestS]:
noncritical faults (AN) concentrate on cooling system and fueloil system, being mostly leakage eventsMonitored critical faults (MC) are quite evenly distributed,being most frequent in engine, cooling system and lube oilsystem: continuous monitoring is mainly focused in thesesubsystemsLatent/hidden critical faults, detectable by starting (HC.S)are dominant for start system and governor, as well asimportant to engine and fuel oil system: this is natural asthese subsystems play major role in startup
Latent/hidden critical faults, detectable by loading (HC.L)concentrate on exciter/voltage regulator; they are importantalso to cooling system, being detected only after running sometime under load, which is also natural; but the other half ofthis failure type is quite evenly distributed over otheraggregate parts indicating the more challenging nature of LT ascompared to STLatent/hidden critical faults, detectable by annual test oractual demand (HC.D) affected start system (1 event) and auto-start equipment (2 events), all being components, which areactually tested only in AT/DE
6.3 Timedependence of latent faultsThe reactor units in the data base fall in different categories inrespect to ST/LT interval per DG train. The correlation of expectednumber of latent critical faults per ST/LT, i.e. HC.S and HC.Lfailure modes respectively, is presented in Fig.4. It shows a clearlinear relationship, which means that the latent failure mechanismsare to a part of timedependent type. It is of special importance tonotice, that lumping failure modes together produces a distortedcorrelation, because then for the joined 1 weekinterval category about 75% periodic tests are STs, but for 2 weekinterval category the opposite holds, as about 75% tests are theremore efficient LTs. (The joined class of failure modes HC.S andHC.L is denoted by postfix "P", standing for periodic test duringpower cycle.) Generally, the result is compatible with earlierinvestigations about the relative portions of timeindependent andtimedepedent parts of the q + X.t -model, compare with Section 5.6.4 General influence of the start/load test intervalThe standard consideration of the test interval influence, such aspresented in Refs.[TI_Opt88, F12_DGS], is shown in Fig.5. Also withthe updated data, the optimum is rather broad, confirming theearlier conclusions, that the test interval can be decided, in therange of 1-4 weeks, by technical/operational factors.
7 RESULTS ON TEST STAGGERING, CCF DEFENCES
The data base included several latent CCF mechanisms givingvaluable insight about their development and detectabilitycharacteristics. Model comparisons of the alternative test schemesproved, that the staggered scheme is strongly recommendablé ascompared with sequential. By staggering, the test frequency per DGaggregate can be reduced while still maintaining control over CCFmechanisms. Also other means of breaking the operational symmetryand simultaneous ageing should be used whenever feasible, forexample, in preventive maintenance and advance replacement ofageing components.

7.1 Test scheme sensitivity modelThe consideration made earlier for Forsmark 1/2 [F12_DGS], for thealternative test schemes shown in Fig.l, were updated according tothe new data. The results are shown in Fig.6.To this aim, a sensitivity analysis model was constructed at thecore damage frequency level by using the importance measureinformation from Forsmark 1/2 PSA study. The sensitivityconsideration could be confined to the sequences initiated by theloss of external grid (ATE), because the DCs were primarily
Point estimate of parameters
qs_S
fs_S
2.30E-3
1.33E-5 /h
qs_L
fs_L
2.96E-3
4.63E-6 /h
qs_P
fs_P
7.77E-4
2.96E-5 /h
9 C/>C 9
2.00E-2 -
1 t%nP 9
1.00E-2
5.00E-3
O.OOE+0
(
,'
//
y's
//
>/ ..---'/ .--
---- ' """"
1 1 2 3 4
Standby time t [weeks]
- -*- - u_P
— ^ — u S
—— o —— uj_
————
Figure 4 Fitting timedependent model to HC.S and HC.L failure|8/ modes separately, and as lumped together into class "P"
1.0E+0 -r
1.0E-1 -
1.0E-2 -
1.0E-3 -(
1.0E-4
1
:: - :::: .:
„ _ *
r\„r^ •vx -.
xx?
/4 1/2
|
data range!-. • •.._ „ ....._ ... _ ,# .* •> . ^_..____ —..-..^-^^fr .
t-e^^s?* : _ -_ _ .———————————— •; ————————— ™: ________
,
-l —— l —— l —— l —— l —— l ——1 2 4 8 16 32 6
Test interval T [weeks]
i
A
— * — Total
- - - « - - - HC/Hid
— * — HC/Tto
— û — HC/Tsb
— x — HC/Tre
—— ° — HC/Test
— -°— - MC
— - o— - NC
UnavaSability contributionsTotal All contributions In totalHC/Hid Latent and operation critical, detected only in annual test/actual demandHC/TTo Latent and operation critical, detected in ST/LT, sum contributionHC/Tsb Latent and operation critical, detected in ST/LT, standby periodHC/Tre Latent and operation critical, detected in ST/LT, repair periodHC/Test Latent and operation critical, detected in ST/LT, test contributionMC Monitored critical, repair periodNC Noncritical, repair/disconnection period
Figure 5 Influence of the start/load test interval on the meanunavailability of a DG. With overall test interval lessthan 4 weeks, load test is done once in 4 weeks, othertests are start tests. With longer test intervals alltests are load tests.

T INT U TT ( other DG Low DG Upp ATE Low ATE UppSEQ1 7.01E-3 7.98E-7 1.97E-7 2.69E-7 9.95E-7 1.07E-6SEQ2 7.92E-3 7.98E-7 2.22E-7 2.94E-7 1.02E-6 1.09E-6PST2 S.86E-3 7.98E-7 1.64E-7 2.36E-7 9.62E-7 1.03E-6EST4 5.86E-3 7.98E-7 1.64E-7 2.36E-7 9.62E-7 1.03E-6
1.00E-5 -r
1.00E-6 i
1.00E-7
1.00E-8 -, —————————— , —————————— , —————————— ,
——— — .- — . - —— _—_.- ._- ——— —————— -_.. _. . —— . . ——— - —— . —————— . __.. .
— , —— _.. ———————————— . ._. ———— .. _.
3 1 0 ———— ==CH
_ . _-o... ——— * ————————— -
—— * — ATEJJpp
—— o — ATE_Low
— *— DGJJpp
— -o-- - DGJJJw
- - - * • - - f_other
SEQ1 SEQ2 PST2 EST4
Contributions
ATE_Upp LoEPS sequences In totalATE_Low -•-DGJJpp DG failure sequencesDG Low -'-
HC/Hid includedHC/Htd excludedHC/Hld indudedHC/Hid excluded
f_other Sequences not Including DG failures
Figure 6 Influence of the alternative test schemes, as applied toForsmark 1/2, core damage frequency contribution of lossof external power supply sequences [F12_DGS].
important only for that scenario. The ATE frequency was divided upinto two parts
UTE =fMCS(DG) +fdther (7-1)The DG influences are collected in the first term covering thecontribution of just those MCS, which contain multiple DG failuresat demand (effectively this term is composed of the meanunavailability of the DG function and its importance measure inregard to ATE end event frequency). This term is shown in Fig. 6 bythe band DG_Low/upp. In the upper bound case, the LC.D contributionis based on three, somewhat conservatively interpreted events, asdiscussed earlier. In the lower bound case all latent faults areassumed to be detected in LT, i.e. LC.D term is effectivelyneglected. The sensitivity band thus shows the influence of thelatent unavailability, which is hidden in normal periodic testsST/LT.The influences in ATE frequency is presented by the correspondingsensitivity band ATE_Low/Upp in Fig.6. The influences are masked bythe other MCS not containig multiple DG failure at demand. Theseare collected in term f_0ther, and they include failures todisconnect secondary loads from buses at loss of offsite power, andalso the contribution of DG failures to run after 30 min from thestartup, which is considered independent from ST/LT interval andscheme. (The DG failures during the first 30 min running time arecombined with the demand unavailability. Effectively, this meansthat only the early phase failures of the running time are assumeddetectable in the periodic tests ST/LT.)7.2 Comparing alternative test schemesThe sensitivity study results show that scheme SEQ2 is somewhatdisadvantageous in comparison with scheme SEQ1, the base scheme forForsmark 1/2. This is explained by the increasing 'contribution ofthe latent critical faults with the longer ST/LT interval, otherfactors being same.The pairwise staggered scheme PST2 is somewhat advantageouscompared with the base scheme SEQ1, although the ST interval isincreased. Due to staggering, two DCs are still tested every weekin scheme PST2. The latent time of CCFs of order 3 and 4, whichdominate the DG system unavailability, is at most 1 week as in thebase scheme SEQ1. On the other hand, staggering of both ST and LTon different weeks is estimated to decrease the likelihood ofsystematic errors in test actions and test related maintenance,which as a net effect results in a slightly lower totalunavailability for scheme PST2 as compared to the base scheme SEQ1.The evenly staggered scheme EST4, with only LT preserved, is nearto scheme PST2, because the quadruple CCFs are the maincontributor, and one DG is still tested every week in scheme EST4.(The maximum latent time of the quadruple CCFs is same in schemesSEQ1, PST2 and EST4, therefore they are so close to each other inregard to the plant level influence.)The influences are rather small at the plant level, especially ifother initiating events than ATE are also considered. Due to the

small calculated risk significance, even, when taking into accountthe identified uncertainties, the final recommendations canprimarily be based on technical argumentsThe earlier conclusions of Forsmark 1/2 test arrangement study seemto be valid in light of the updated and extended data base Thealternative scheme PST2 was then proposed as an optimal resolution.The pairwise staggered scheme was believed to decrease the risk ofsystematic errors in testing/maintenance actions compared to thebase scheme SEQ1, where all DGs are subject to actions by the samepersons(s) on the same day. In the proposed scheme PST2, two DCsare still tested every week, which gives a reasonable control overthe risk of latent multiple CCFs. There are many other technicalfactors like soot buildup in ST, oil film dryout during standbytime etc., which were deemed to be in proper balance in theproposed scheme [F12_DGS]. Based on the results, the relaxation ofSTs is currently under trial in one subsystem at the Forsmarkplant, in order to verify the technical influences prior to a finalimplementation for all redundancies.
8 SUMMARIZING CONCLUSIONS
The reliability of DGs were found relatively good, and thefrequency of CCF mechanisms rather low. The considerations abouttest strategies resulted in the following conclusions andsuggestions for maintaining the current status, and towards furtherimprovements :
1) Staggered test scheme is strongly recommendable as compared tosequential; by staggering the test frequency per aggregate canbe reduced, while still maintaining control over CCFmechanisms.
2) The frequency of the mere start tests without loading could berelaxed, specially in the case of weekly testing.
3) Leading DG rule should be implemented; desirable operation timeoverhead is in the range of 500 hours.
4) Other means for breaking symmetry and simultaneous ageingshould be used whenever feasible (in preventive maintenance,advance replacement of ageing components etc.).
5) Interface of DG aggregates with support systems, electricalbuses and auto-start/sequencing equipment should be checked inregard to coverage and efficiency of surveillance tests, andwith respect to integral functions.
6) Improvements towards more efficient root cause eliminationshould be encouraged; specially with staggered test scheme andreduced test frequency, proper emphasis should be paid on thesynthesis of test outcomes, evaluation of symptoms and trendfollowup over the redundant aggregates' status
In conclusion, the thorough analysis of the operating experiencesof the diesel generators produced a very useful information base,
199 both in qualitative and quantitative terms
ACKNOWLEDGEMENTSThis study is conducted within the research program of the SwedishNuclear Power Inspectorate (SKI), subsponsored by the powerutilities The author will express the contribution of thereference group for generating ideas and guiding the work, as wellas for providing input information from the plants Specially, thecontributions by Gunnar Johansson (SKI project coordinator),Staffan Bjore (ABB Atom AB) and Fritiof Schwartz (OKG powercompany) are acknowledged
ReferencesCCFD_DGP Bjore, S. et.al.. Defences against CCFs and generation of CCF
~ data, a pilot study for diesel generators. SKI Technicalreport, under preparation by ABB Atom AB and Avaplan Oy, Draft20 March 1992.
DG_TestS Mankamo, T., Test strategies for standby diesel generators.Work report under preparation within SKI/CCF/DG pilot study.Draft 17 February 1992.
RPC 91-76 Qualitative CCF analysis and Cause-Defence matrices, pilotstudy for diesel generators. Technical report prepared byLennart Bons, RPC 91-76, ABB Atom AB, October 1991 (in Swedish)
RPC 91-57 Defences against CCFs and generating CCF data, pilot study forDGs, quantitative analysis. Technical report prepared byStaffan Björe, RPC 91-57, ABB Atom AB, October 1991 (inSwedish).
NDGDB_LC DG data base: latent critical faults, Swedish and TVO I/IIexperience 1980-89. SKI/CCF/DG pilot study, Work report,prepared by T. Mankamo, Avaplan Oy, 5 June 1992.
CCF_DGRD Specific CCF mechanisms of DGs at real demands. SKI/CCF/DGpilot study, Work report, prepared by T. Mankamo, Avaplan Oy,29 May 1991.
FS_DG82 Pulkkinen, U., Huovinen, T., Mankamo, T., Norros, L. 5 Vanhala,J-, Reliability of diesel generators in the Finnish and Swedishnuclear power plants. Technical Research Centre of Finland,Report SAH 7/82, June 1982. (Enhanced version published as VTTResearch Notes 1070, 1989)
F12_DGS Engqvist, A. & Mankamo, T., Test scheme rearrangement fordiesel generators at Forsmark 1/2. PSA 89 Interna-tionalTopical Meeting on Probability, Reliability and SafetyAssessment, Pittsburgh, April 2-7, 1989.
NKA/RAS-450 Optimization of technical specifications by use ofprobabilistic methods - a Nordic perspective Final report ofthe NKA project RAS-450. Ed K Laakso. Prepared by a teamconsisting of K Laakso, M Knochenhauer, T. Mankamo & K.Porn.Nord Series 1990:33, May 1990
TI_Opt88 Mankamo, T. S Pulkkinen, U , Test interval optimization ofstandby equipment, Technical Research Centre of Finland,Research notes 892, September 1988
TDep_CCF Mankamo, T , A timedependent model of dependent failures -Application to a pairwise symmetric structure of fourcomponents Report manuscript NKS/SIK-1(92)13, 30 March 1992.

200 STEPWISE APPROACH TO RISK-BASEDTECHNICAL SPECIFICATIONS
J.A. BECERRA, J.L. DELGADOComision Nacional de Seguridad Nuclear y Salvaguardias,Mexico City, Mexico
Abstract
A PSA application program is being developed by the mexican regulatory body (CNSNS) and the nationalutility (CFE) for the Laguna Verde NPP. Several alternatives have been selected for PSA applicationamong them: importance priorilization, assessment of technical specifications, maintenance assessmentand prioritization, risk configuration management and reliability focused maintenance.
In this paper a number of specific applications are described by present examples of modifications onLaguna Verde Technical Spécifications in allowed outage time (AOTS) and surveillance test intervals(STI'S).
The risk based allowed outage time and surveillance test intervals have been calculated for most importantcontributors to core melt frequency and categorized in three risk importance classes. Risk Class 1contributors are significant risk contributors; Risk Class 2 contributors are moderate to marginal riskcontributors and Risk Class 3 contributors are marginal to insignificant risk contributors.
After categorizing contributors by risk classes, several issues on safely and operation are being discussedfrom probabilistic and deterministic point of view. Among these issues are; probabilistic safety criteria forrisk classification; condition for granting extended AOTs; surveillance frequency, wear-out andoperational burden; shutdown as an option and risk increase; cumulative risk; and unbalance safety design.
Implementation of risk based surveillance test intervals and allowed outage times are not direct, but astructured program to review and potentially to modify current regulations and Technical Specifications.
I. INTRODUCTION.
For the Laguna Verde Nuclear Power Plant, a Probabilistic Safety Assessment (level 1)was developed and after that the national utility (CFE) and the regulatory body(CNSNS), have been engaged in a PSA application program, as well as a review andupdate of the Laguna Verde PSA original effort.
At Laguna Verde, probabilistic risk evaluations are being used to develop deterministiccriteria for applications to operations and Technical Specifications. The Laguna Verdeimplementations of risk based evaluations are interesting and are important since theyshow how Probabilistic Safely Analysis (PSA Results) can be used to obtain workable,deterministic guidelines and deterministic regulations for implementations.
Inside the PSA study it was developed a risk importance p r io r i t i z a t i on for components,front line systems, and some support systems ;it'ter the review and update. If is expectedto improve the risk importance prior i t izat ion.
Importance models used in the PSA were.
Vesely-Fussell Importance ;,Vfr ri = (àR/àPi)Pi/R
Birnbaum Importance ;
1B =ÖR
Risk Achievement Worth Increment
Risk Reduction Worth Increment
= R-R
At present, a Risk-Importance prioritizations for optional activities, is in process inorder to optimize resources. For the regulatory body point of view, regulations areexpected to be risk-optimized in correlation with the risk importance of thecontributors.
A risk-based regulations would redirect resources from the risk unimportant to the riskimportant contributors, and the resources would be thus, most effectively utilized. Someother benefits would be a total risk reduction by focusing control on the risk importantcontributors. A burden reduction is expected by relaxing control on the riskunimportant contributors; optimizing resources for test and maintenance activitiesduring operation for the utility point of view and during inspection and enforcementactivities.
A risk-based regulation is expected to address the regulatory and utility concerns in ahobjective manner, identify effective risk reductions and burden reductions, and providean objective basis for communication and interfacing between the utility and theregulatory body.
Three risk importance classes are defined: Risk Class I for risk importance significantcontributors, Risk Class 2 for moderate to marginal risk contributors and Risk Class 3for marginal to insignificant risk contributors.
The risk classes have been defined as a fraction of the Baseline Risk for Laguna Verde,the point value for the core damage frequency is reported as 1.97E-04.
A criteria for determining risk important failures and component going down have beenselected; as those components with significant risk impact (risk increase). Significantrisk increase RI, it is defined to be 10 times baseline of core damage frequency, forLaguna Verde risk significant or risk critical failures are those which have a riskincrease R > l .OE-03/vr .

RISK BASED TECHNICAL SPECIFICATIONS
The Operational Technical Specifications (OTE s) are considered, most of the time, asto restrictive nevertheless, the objective ot OTE'i is to minimize the total risk duringplant operation by setting the lowest functional capability level of equipment requiredfor safe operation ot the nuclear power plant, by the Limiting Conditions for Operation,which do not allow the plant to be placed in an unsafe condition
The OTE's control the risk of the plant by assuring that required safety function shouldbe fulfilled by the required safety systems availability, through controlling the timelyrepair, detection of failures and determination of operabihty and the actionrequirements to reduce risk vulnerability
General problems with technical specifications are, the lack of adequate technicalbases, difficult to be changed, unnecessary restriction, and there is no credit forrisk-effective practices
Engineering judgment and common sense have been used most of the time forimplementing changes in allowed outage times (AOTs) and Surveillance Test Intervals(STI'S) and operabihty requirements
Allowed outage time (AOTS) and Surveillance Test Intervals (STI'S) are problems inTechnical Specifications For AOTS the risk is not explicitly considered, as a result,inadequate outage times are assigned, and their stringency it is not consistent with theirrisk importance On Surveillance Test Intervals (STI'S) also, the risk is not explicitlyconsidered and unnecessary surveillance are required, and their stringency it is notconsistent with their risk importance
RISK-BASED AOTS
The allowed outage times (AOTs) are defined at the standard technical specificationsfor all the safety systems Components may be inoperable because is failed and is underrepair, or the component is taken out of service for scheduled testing or maintenanceWhen a component is down, during a AOT, the risk level increases due to loss offunction of the component, and the increased risk level depends on the risk importanceof the component
At Laguna Verde NPP, as any other plant, extensions to AOTs, are request and areevaluated case-by-case Traditional assessment of AOTs extensions were hard toimplement otherwise risk-based AOTs and risk unpoi tance priontization can be useddur ing the opt imizat ion process
The down time risk associated w i t h a component outage can be calculated bv aprobabilistic safetv anaKsis The component is assumed to be down and the new coredamage frequency is calculated bv using the risk increase (RI ) importance The newcore melt frequency is then m u l t i p l i e d bv the downtime or <\OT and the singledowntime is determined
AOT RISK METHODOLOGY FOR LAGLNA VERDE
Using the Laguna Verde, level 1, Probabilistic Safety Assessment (PSA), allcomponents related with AOTs in the technical specifications and used in the PSAmodels are identified
For each component identified is determined the present AOT and converted to unitsof years, d (YEARS) = TR / 8760, and using the risk increase (RI ) , RI = R+- R, andthe contribution associated with the AOT (ACd) is calculated ACd= d * RI
The risk-based AOTs are calculated by assuming the risk contributor (ACd) as 1% ofthe base line,
AQ *= [%of 10E-04
AQ * = 1 OE-06
d ' (YEARS) = 1 OE-06RI
201
d * (Airy) = d ' (YEARS) * 8760
These process has been carry out for almost 600 components out of a thousandidentified in the 300,000 most significant minimal cut sets (94% of the total CMF) forthe Laguna Verde PSA
At table 1, a sample of the results can be found, the component in the table have beenranked according to the maximum permissible, risk-based, AOT (HR)
It should be pointed out that critical components are ansed tor risk increase (RI) valuesgreater than 1 OE-03 and risk contributions associated \\ ith the AOT ( Cd) greater than1 OE-06
Three risk importance ot demned component are defined hg l
a) Class 1, are risk significant contributors and focus AOT control is requiredSuggested options for these components would be, tightened AOT, accidentrecovery plan, additional test requirement and a reliability program
b) Class 2, contributors are moderate to marginal risk contributors, the AOTsoptimization process should aim to increase risk Class 2 and decrease any otherClass For Laguna Verde Class 2 contr ibutors are defined between 1 0 E-08 to1 OE-06, with 271 contributors out ot a thousand

202
O 200
l_i_0 150ceu_im3 100
CLASS 3
CE-13 a E-08) C< £-08 a £-06) (< E-06 a E-03>
AOT RISK CONTRIBUTON
FIG. 1. Risk contributors.
TABLE 1
ACV49AMAKXV23-MADSVA3LOBEBCR2-NFBXV — 5PCIMV100AAAPV225MADPVP4BPAEBU4B1CCBMV202AABCV13BAAAHX001MIBHX001MIHMV184MAHMV177MI
W&S^v**?!?.1?11* SETRHR-V Check valv
SLC-V Manual valv
S-RV Obstructed valvBattery Charger
HR-V Failed keep closCIC-nv Failed keep ope
B-PCV Fai led keep op
IA-PCV Fa i led keep ope
AC-BUS Short Ci rcu i t
RHR-HV Fa l l to open
R H R - V F a i l to open
R Heat Exchanger Hain
R Heat Exchanger Ham
HPCS-HV Hotovalv open
HPCS-HV Hotovalv Haint
l.OE-013.0E-051.4E-034. IE-031.3E-053.7E-032.2E-025.7E-012.4E-073.3E-032.5E-044.7E-034.7E-032. IE-042. IE-04
44
3363361683368
3368
168168168168
44
Risk Increase •• - OT*^«!
4.4E-102.4E-092.5E-083. IE-083.2E-071.3E-061.5E-061.6E-058.5E-041. IE-031. IE-031.6E-031.7E-031.8E-031.8E-03
2.0E-131. IE-129.6E-101.2E-096. IE-095.0E-081.4E-096. IE-077.8E-072. IE-052. IE-053. IE-053.3E-058.2E-078.2E-07
f twk-toedÄ»«teÄ
199090913650000350400282581273756738584054810885555
c) Class 3 are marginal to insignificant risk contributors. Unneeded Burden can bereduced by loosening AOT control.
Risk-Based AOT Conclusions
Significant risk variations exist for contributor of the same system, present AOTs arenot correlated with their risk importance, PSA/PRA.S can be easily used todeterminerisk-based AOTs, risk -based AOTs control dowtime , and are correlatedwith risk importance and burden can be minimized.Some risk-based AOTs are dificultto appply because they are uncorrelated with present AOT.as the operationalexperience; that ids the case of the AOT for the RHR heat exchanger (AHXOO1MI);some other components could be from the Technical Specifications and verified atshutdown like the manual valve, XV23, for the standby liquid control systems.
RISK-BASED STI'S
Surveillance tests are required to detect failures in standby equipments as a mean ofassuring their availability and satisfies manufacturer recommendations to preventdegradation. A total Risk assessment associated with the test (Rij it is the sum of riskcontribution that is detected by the test (Ro) and the risk contribution that is caused bythe test (Re). For an effective test RD > Re or RD / Re > i-
Among the adverse risk impacts caused by the test are: (1) Trips caused by the test; (2)Equipment wear-out.
The risk associated with u surveillance test is caused when the component fails betweentests, when the component fails, the component's function is lost until recovered at thenext test and the loss of the component function causes a subsequent risk increase.
The surveillance test risk is standardly calculated as a contribution in a PSA/PRA, andthe surveillance test risk can be extracted for every test carried out and included in thePSA. To evaluate the risk from different interval.»., component failure rates per hourmust be used in the PSA. For the Laguna Verde PSA; a failure rate model wasimplement in the data base.
STI's RISK METHODOLOG\ FOR LACUNA VERDE.
For every test carry out and included in the Laguna Verde PSA line standby periodicallytested failure modes, and unavailability for miscalibration.
The risk contribution associated with the test can be calculated by considering; a) riskfrom test-caused trips, b) risk from test-caused equipment wears, c) risk from testmisconfigurations, and d) risk associated w i t h test down time in carrying out the test.

By using the Laguna Verde PSA, all components related with STIs, in the technicalSpecifications and used in the PSA models are identified. The document importance forthe component tested is calculated (Rl ) and the risk contribution associated with thetest ( Ct) is calculated.
Rl = R + - RAr ,AC,-— 2——
TS = actual downtime; Surveillance Test IntervalA= component failure rate
Finally, the risk-base STI is calculated by assuming 1% of the base line.
Ci = 1% OF BASE LINE ; Ct = I.OE-06„ . 2.0 £-06T =
This process has been carry out for 262 contributors of risk from significant eventsidentified in 300,000 most significant cut sets for de (94% of the total CMF) of LagunaVerde PSA.
In table 2, a sample are shown, and the components in the table have been rankedaccording to the maximum permissible, risk based, STI.
Three risk importance for document components are also defined;
TABLE 2
203
ACV208AAXV-3APAMV209AAMV200PAMV221AAMV210AHMV187AAMV255PEBCR2-NARO217NHAS001NDCV18AAIOV100PBPV225PPRV13CNDAV22-PHMV189AITB001AKOV — 9A
A Description
RHR-AV Fail to openRHR-V Fail keep openRHR-HV Fail to openHR-HV Fail keep closRKR-MV Fail to open
HR-MV Fail keep clos«PCS Fail keep closeHR-MV Fail keep closattery charger Falle
RHR-ROOrifice ObstrcHPCS Sprinkler FailedCIA-V Fail keep close
RCIC Fail let openRHR Fail keep closeValve Neunatic Fat 1C1A Fail keep openHPCS Fai t to openRCIC Bo* Failed
SIC Manual Valve
Actualtsnfcda
2.06-072.0E-072.6E-06l.OE-072.6E-062.6E-062.66-061.0E-076.0E-07l.OE-071.0E-102.0E-064.6E-04
9.5E-067.7E-06l.OE-052.6E-062.4E-05l.JE-03
SU
4,380
12.9604,3802,2032,2082,2082,2082,20812,96012,96012,960
350,400744
12,9601,2503,7544,3802,208
744
-><*fslr8ssiKl , STI ' -, ''••N .J)fes -*->
666,664.666.007666,666,666,66748,076,923,07714.285.714.2863,496,503,4971,831,501,832274,725,275208.333,333107,526,88215,384,6151t, 111,1113,571,429
7,199
13.1581,2371,1114059722
,V JSBUt,.. ,
7.61E»077.61E*075.49E*061.63E*063.99E*052.09E*053.14E*042.38E-041.23E«041.76E-03
1.27E->034.08E*028.22E-01
1.50E*001.41E-011.27E-014.62E-021. HE-022.47E-03
"SlteJtt&k,:,,Ï!,%if,< ï
6.66-151.9E-149. IE- 141.5E-136.3E-131.2E-128.0E-121. IE-111.2E-108.4E-101.2E-099.8E-08t.0£-079.8E-07
t.OE-063.4E-061.1E-052.3E-053.4E-05
a) STI risk Class 1, are high contributors 10 risk, some alternatives are; focus on QualityAssurance program, review recovery procedures, reliability focused maintenance,and root cause analysis.
b) STls, risk Class 2 are moderate to marginal contributors and the STIs optimizationprocess should aim to increase risk Class 2 ami decrease any other class. At LagunaVerde they are 48f'<: of all STI contributors to risk.
c) STIs, Risk Class 3 are contributors to risk which are candidates to be removed fortest and they should be m observation.
RISK-BASED STI CONCLUSIONS
Significant risk variations exist in present STIs for Laguna Verde TechnicalSpecifications. Present STIs are not correlated with their risk importance and it hasbeen shown that a PSA/PRA can be used to determine risk based STIs. Risk-basedSTIs, control the test risk and are correlated with risk importance, and can minimizeburden.
REFERENCES
1. W. E. Vesely, T. C. Davis; evaluations and Utilizations of risk importances,NUREG/CR-4377, U. S. Nuclear Regulatory Commission: 1985.
2. W. E. Vesely; evaluations of allowed outage times (AOTs) from a risk and reliabilitystandpoint, NUREG/CR-5425, U. S. Nuclear Regulatory Commission; 1989.
3. I. S. Kim, S. Martorell, W. E. Vesely, P. K. Samanta; quantitative evaluation ofsurveillance test instervals including test-caused risk; NUREG/CR-5775, U. S. NuclearRegulatory Commission; 1992.
KO T
6-15 a E-08 < E-08 a E-06
STI RISK CONTRIBUTION
< E-06 a E-05
FIG. 2. Present STI risk for Laguna Verde

204 PROBABILISTIC ANALYSIS OF THE INTERACTIONBETWEEN ALLOWED OUTAGE TIME ANDSURVEILLANCE TEST INTERVAL REQUIREMENTS
S. MARTORELL, V. SERRADELL, G. VERDUDepartamento de Ingeniena Quimica y Nuclear,Universidad Politécnica de Valencia,Valencia, SpainP. SAMANTARisk and Reliability Analysis Group,Brookhaven National Laboratory,Upton, New York,United States of America
Abstract
Technical Specifications (TS) define the limits and conditions for safe plantoperation. In Spain they are divided into five categories, and two of them, LimitingConditions for Operations (LCO) and Surveillance Requirements (SR), have beenselected as the main items to be evaluated using probabilistic methods. The LCO willassure that the safety systems are either ready for use on demand. The action statementsrequire the plant to be brought into a safer operational state if faulty equipment cannotbe restored within its Allowed Outage Time (AOT). The SR prescribe periodic tests fordetection of faults and verification of operability of safety equipment. The time intervalbetween two consecutive tests is called the Surveillance Test Interval (STI).
At this time a significant operating and design experience has been accumulatedand a number of problems appeared which require modifications in some TS rules. Thegoal of the modifications is to further improve the nuclear safety and also to enhance theeffectiveness and flexibility of plant operation, maintenance and testing.
Developments in PSA have made possible the evaluation of effects due to AOTand STI modifications from a risk point of view. Thus, some changes have already beenadopted in some cases, but AOT or STI modifications have been independently analyzedso far and the acceptance criteria have been based on the constraint that there was nosignificant reduction in plant safety when the proposed changes were incorporated. Thelack of a methodology for evaluating and optimizing the combined effect of several AOTand STI changes, i.e. through their interaction, has limited the benefits of the changes andhas not allowed to analyze several problems.
This paper presents the main results of the study on AOT and STI interactionswhich led to one of the authors to conclude his PhD Thesis. The presentation encompasswith the following parts:
definition of AOT and STI interactions and their main reasons,
quantification of interaction in terms of risk using PSA methods as a tool,approach for evaluating simultaneous AOT and STI modifications through theireffects on the risk level,sensitivity analysis involving the main parameters, andassessment of strategies for giving flexibility to the plant operation throughsimultaneous changes on AOT and STI, using the trade-off based risk criteria.
1. INTRODUCTION.
1.1 Background.
Introduction to Technical Specifications.
Technical Specifications (TS) define the limits and conditions for safe plantoperation. Therefore, TS can be seen as a set of operational safety rules and criteria,which defines the allowed operational range for the nuclear power plant from the safetypoint of view. The ultimate goal of the TS is to prevent radiological accidents in theplant, and thereby to protect the health and safety of the public and plant personnel.These rules were originally formulated with margins on the safe side, mainly on the basisof:
1. deterministic analysis prepared for the FSAR of the plant, and2. engineering judgement.
In Spain the TS depend on the plant origin, and because the most of them comefrom the USA, they are divided - the same as in this country - into five categories. TheLimiting Conditions for Operations (LCO) and Surveillance Requirements (SR), bothgiven in the TS, have been selected from the beginning as the main two items to beevaluated using probabilistic methods.
The LCO will assure that the safety systems are either ready for use on demand.The action statements require the plant to be brought into a safer operational state iffaulty equipment cannot be restored within its Allowed Outage Time (AOT). The SR

prescribe periodic tests for detection of faults and verification of operability of safetyequipment. The time interval between two consecutive tests is called the SurveillanceTest Interval (STI).
Risk and reliability methodology.
Technical Specifications are safety concerned and thereby they are related tosystems reliability and plant risk. Both of them can be assessed using the probabilisticmethodology, then several topics in TS can be evaluated using this methodology. Forinstance, it is only needed an approach to model AOT and STI requirements from a riskpoint of view. In this way AOT and STI modifications can be evaluated in terms of theireffect on risk level.
increases may be involuntary - repairs - or voluntary - tests (every STI given in the TS),
preventive maintenance, etc -, with the AOT, also given in the TS, as the maximumlength of involuntary component outages during which the power operation is allowed.Temporary risk increases may also be due to planned, or not, plant shutdowns.
The total risk as calculated in PSA is the average risk over the baseline andtemporary risk increases states, and it is known as an unconditional risk. The riskassociated to each component outage is known either as a conditional risk. In order tocontrol AOT and STI modifications it is only necessary to control both the unconditionaland conditional risks.
Definition of the problem.
205
With that sense the Probabilistic Safety Analysis (PSA) models are an importanttool to be used for evaluating AOT and STI requirements. In Spain every plant have tocomplete its own PSA, and the next development stage of the PSA studies would be touse it within a living PSA concept for TS evaluation, in particular AOT and STIrequirements. The overall task of evaluating TS with probabilistic methods circles aroundtwo main issues:
1. the baseline risk of the plant, and2. temporary risk increases.
The first one is the risk level during power operation assuming no failures aredetected and no subsystems are intentionally isolated for test or maintenance. Obviously,systems unavailability and thereby plant risk would continuously increase as a functionof the time, at least that some measures were taken, for example surveillance tests andscheduled maintenance.
The second one is concerned to component outages in standby safety systemswhich will temporarily increase the total plant risk above the baseline level. These
At this time a significant operating and design experience has been accumulatedand a number of problems have appeared which require modifications in some TS rules.Thus, it is well known that operating plants have had several problems in theimplementation of AOT and STI requirements. These problems are related to forcedoutages within surveillance testing with forced plant shutdowns in some cases due tosystem exceeding its allowed downtime. In addition, human errors due to inadequatetime to complete equipment repairs or due to inadequate test intervals, too much largeor short, have been identified. In several cases, plant availability and plant safety marginhave been reduced. So, it is not sure that AOT and STI are optimized from a risk pointof view and the desirability of several changes on them is recognized.
The goal of the modifications is to further improve the nuclear safety and also toenhance the effectiveness and flexibility of plant operation, maintenance and testing.
Developments in PSA have made the evaluation of effects due to AOT and STI
modifications from a risk point of view possible. Thus, some changes have already beenadopted in some cases, but AOT or STI modifications have been independently analyzedand the acceptance criteria used in their analysis have been based on the constraint that

2Qg there was no significant reduction in plant safety when the proposed changes wereincorporated. In this way, several changes with large effect on the risk level could not beaccepted. Furthermore, lack of a method to evaluate and optimize the combined effectof several AOT and STI changes, for example through their interaction, has limited thebenefits of the changes and has not allowed to analyze several problems that result oftheir interaction when only one of them is modified.
Among the benefits, we can improve plant safety and give flexibility to plantoperation, maintenance and test. Among the problems that it is necessary to addresswhen one change is required we can find the common cause failures and the test afterfailure problems and their relation with AOT and STI requirements.
1.2 Objective of this paper.
The main results from the developed study concerning the AOT and STIrequirements interaction problem, which finally led to one of the authors to conclude hisPhD Thesis1, are briefly presented in this paper.
Firstly, the AOT and STI interaction is defined, and the main reasons are pointedup together with advantages of considering such an interaction. Then the interaction isquantified in terms of risk using the risk and reliability methodology taking into accountthe PSA methods as a tool. Thus, an approach to model AOT and STI modifications andtheir effects on the risk level, which considers their interaction, is derived.
Then using above model several sensitivity studies involving the main parametersare conducted, and finally several strategies to control the risk which allow us to giveflexibility to the plant operation and optimize the risk level are assessed.
This new approach has been divided into several steps. It ranges from thecomponent unavailability to the core melt frequency assessment. Here only thecomponent level will be treated in depth.
2. AOT AND STI INTERACTION.
2.1 Sources of interaction.
With a general sense, the AOT and STT requirements interaction can be seen interms of their common effect on the risk level and it becomes from two main sources:
1. TS requirements definitions, and2. safety related components and systems disposition or function in the plant.
Firstly, both requirements have been established in order to intent to control theplant risk, both the risk due to detected component downtimes (concerned to AOT) andthe risk due to undetected ones -failures- (concerned to STI). In this way, TS relate AOTand STI requirements for a component or a set of them (system, function, etc), andtherefore the interaction becomes from the intent to control both risks.
Secondly, due to the safety criteria that have been adopted in designing nuclearpower plants, there is a lot of redundancies among the components into a safety systemor function, and among safety systems to prevent different accidental sequences followingan initiating event. For instance, there are several Support systems which are shared bydifferent Front-line ones, and in some cases more than one system or component isnecessary to carry out a safety function or instead one system or component can berequired to carry out different functions. That means it exists an interaction amongseveral components and systems to preserve plant safety, and in this way the interactionbecomes among their AOT and STI requirements, firstly preserving componentsavailability, then system or function reliability and as the final goal preserving the plantsafety. The common cause failures and test strategies play an important role in theinteraction in this source.

2.2 Advantages of considering interaction.
As we have already said the AOT and STI interaction approach provides us witha method to evaluate and optimize the combined effect of several AOT and STImodifications from a risk point of view, where the risk contributions due to both detectedand undetected component outages can be trade off - by means of AOT and STI tradingoff - in order to control and in some cases .to minimize the risk level, and this for acomponent, system, function, and so on.
At the same time using the different effects of AOT or STI modifications on theunconditional risk - normally both have opposite effects - it is possible to give flexibilityto the plant operation by means of allowing AOT and STI to have a tolerance which canbe controlled within a small variation in terms of their effect on risk level, using theAOT and STI interaction approach as a tool.
It is also worth noting that both AOT and STI modifications affect, because theirinteraction, both unconditional and conditional risk, and thereby the average andinstantaneous plant vulnerability is affected in the same way. Other items which alsohave significant effect on the plant vulnerability concern the test strategies and commoncause failures and test after failure problems. Using the AOT and STI interactionapproach it is possible to manage successfully both problems, improving in this way theplant vulnerability.
3. COMPONENT LEVEL ANALYSIS OF INTERACTION.
The component level is important because: 1) most of the AOT and STIrequirements directly affect to safety components of the plant, and 2) since we use thePSA methods as a tool, the component unavailability approach forms the basis of the riskapproach at higher levels, such as system, function, sequence, and so on.
At the same time when studying the component approach it is possible to focuson the most important parameters into the model to be taken into account to establishthe criteria for controlling the risk at component level and similarly at higher ones.
3.1 Risk evaluation model.
As we have previously pointed up the total risk is the average risk over thebaseline and temporary risk increases states, which at component level becomes theaverage component unavailability. For a component periodically tested this unconditionalrisk between two consecutive tests can be distributed in several contributions, eitherrelated to one period in the average test cycle, which length is given by:
L = T + C + D (!)
where C is the test duration, D is the maximum length allowed for a repair following afailure detected by the test - also called AOT - and T is the period not included withinboth other ones which is usually called STI.
According to expression (1) the component average unavailability can beevaluated through the following contributions:
qm=qT+qc + qD (2)
In obtaining above expression for every contribution it must be addressed subjectsrelated to component standby or on demand failures, human errors, test-caused failuresor degradations, test override capability, test inefficiencies, test duration, correctiveand/or preventive maintenance and their average duration, AOT and STI.
3.2 Definition of interaction.
At component level only the first source is possible when analyzing the AOT andSTI interaction. Both requirements have been established to control both the risk due
207

20J to detected component downtimes -represented by q^ and the risk due to undetectedones -represented by qr. The term qc represents the risk introduced by the test whichhas the benefit of detecting component failures to be repaired.
Studying above expression it can be found out that T mainly affects qT
contribution in the sense that increasing T means this contribution also increases, but hasa smaller opposite effect on qD. On the other hand, D only affects Oj, contribution. WhenD increases also qD contribution increases. The term qc only depends on T in a similarmanner as q^ Thus, expression (2) model the AOT and STI interaction.
This simple relationship have to be well known because other effects, such as Tor D initial values, component characteristics, test and repair conditions, can change theimportance of every contribution to q„ and thereby the sense of such an interaction. Atthe same time a well knowledge of (2) and above mentioned influences could reduce thecomplexity of next studies by adopting several approaches without losing the validity ofthe method.
3.3 Dominant component characteristics.
Using above expression (2) sensitivity studies have been developed to account fordifferent influence of each parameter in the AOT and STI interaction. As a final resultfrom this step it has finally been concluded that the test contribution and thereby theirassociated parameters - test degradation, inefficiency, duration, and so on - have noimportant effect on interaction, and the other contributions can be evaluated using thefollowing simplified expressions:
qr = P + ^T (3)
(4)
where X is the failure rate associated to standby failures and p is the on demand relatedfailure.
Expressions (3) and (4) have to be carefully used because both have importantconstraints. Thus, when T is too small the qc contribution becomes as important as otherones and it has to be taken into account. On the other hand, the constraint XT < 0,1 hasto be satisfied when T becomes larger. Furthermore, in obtaining expression (4) theaverage repair time has been bounded by the AOT.
3.4 Approach to incorporate AOT and STI interaction.
In developing the methodology several approaches was assessed using the previousexpressions as a tool to incorporate AOT and STI interaction. These approaches dependon the risk criteria adopted to control the risk. Finally, one of them was selected, wherethe risk critérium was that the component average unavailability should keep constantwhen an AOT or STI modification is required. That means for a given risk level q,,,(related to TS requirements), T and D are tied in the sense that if a D or T modificationis studied, it is required to trade-off their contributions to keep the same risk level. Thus,increasing D, that increases qD contribution, must be balanced by decreasing T to anappropriate qT level.
From a mathematical point of view above relation can be expressed in terms ofthe D and T relation for a given qm, which is obtained by substituting (3) and (4) into (2)and then rearranging terms, to yield:
(5)p + x r
Fjqoression (5) is known as the interaction function at component level and itdepends on the risk level q„ and component characteristics (p,X). The general expressionfor AOT and STI interaction, or D and T relation, is:
D = (6)
At component level it exists more dependencies than these observed in expression(6), which have been studied through our work, but above dependencies are the mostimportant ones.

Expression (6) is represented for a safety component in Ilustr. 1 for a constant risklevel (q„ value), where above relation, dependencies and constraints are shown.
CONSTANT RISK APPROACH(Component unconditional unavailability)
160
140
120
100
80
60
40
20
D(hr)
4<lm = 0
BASE RISK(constant q )
(T.D) Tech Spec
0 100 200 300 400 500 600 700 800 900 1000T(hr)
Ilustr. 1: Interaction function at component level.
SENSITIVITY STUDY ON INTERACTIONFUNCTION AT COMPONENT LEVEL
300
250
200
150
100
50
D (hr)time-dependent.failures only
(couUDt «lope = - 1/2)
both time-dependentand on demand failures
0 100 200 300 400 500 600 700 800 900 1000T(hr)
Ilustr. 2: Sensitivity studies on component characteristics.
In Ilustr. 2 sensitivity studies of the interaction function on A. and p are plotted,where the importance of both parameters becomes significant
3.5 Implementation choices in defining APT and STI considering interaction.
Above expression (6) as shown in Ilustr. 1 can be used to find pairs (T,D) on thetrade-off criteria, which satisfy that the risk is kept constant when one requirement in acouple (T,D) - set up by Technical Specifications - is intended to be modified.
In addition, expression (6) can be used to optimize AOT and STI requirements,given by TS, at least in the component level. For instance, (T,D)TS is not a optimizedcouple from a risk point of view. Here, optimization means to change the STI
209 requirement in order to minimize the risk level for an AOT given.
Thus, the top of the curve represents a couple (T„, D) which minimize the risk fora D value given. To find T0 value using expression (2) it has to satisfy the followingrestriction:
dq—£• = 0 (constant D value)di
(7)
where, using expressions (3) and (4) yield:
r„ = 2pD (8)

2JO The couple (T,D)TS satisfies the Base Risk curve while the couple (T^D) satisfiesthe Minimum Risk curve, which represents expression (5) when q„ becomes theminimum risk q0, which is given by expression (2) using the pair T0 and D.
Furthermore, an important application of the interaction function approach is togive flexibility to plant operation by means of giving some flexibility to AOT and STIrequirements. In this way AOT and STI could be implemented into TechnicalSpecifications taking into account the component importance and their impact on risk.Two possibilities was analyzed which have been represented in Ilustr. 3:
Area of tolerance:AOT and STI should be set up witha tolerance (permanent), in such asense that the risk level shouldalways keep within an acceptablerisk tolerance around a base risk.This possibility suppose that bothAOT and STI will be able to takethis tolerance simultaneously andpermanently.
Range of tolerance:AOT and STI should be set upwithout a tolerance, but a variationin only one of them could beeventually accepted as long as therisk level kept within and acceptablerisk range or margin around a baserisk. This possibility suppose thatonly one of them will be able totake a variation or tolerance wherethe risk level keeps into anadmissible tolerance.
TRADE-OFF CRITERIA(Component level)
1- Area of tolerance
2.- Range of tolerance
Ilustr. 3: Strategies to give flexibility to the plantthrough AOT and STI requirements.
Both strategies are adequate to propose AOT and STI modifications on theunconditional risk point of view. However, time-dependent risk and conditional risks dueto component unavailabilities can not be controlled using this approach. It is possible tohandle both problems at system or higher levels where tolerances on risk at componentlevel must satisfy those set up at higher ones.
4. INTERACTION-BASED APPROACH EXTENSION TO SYSTEMAND HIGHER LEVELS.
Despite being worth the component approach and its analysis, it became necessarythat the methodology presented herein was able to handle simultaneously severalcomponents and requirements because the following reasons:
1. to consider several items, i.e. to include test strategies and common cause failureseffects on risk, which could not be addressed at component level,
2. there are more AOT and STI requirements to be modified and thereby it existsa larger range of possibilities for giving flexibility to the plant, and
3. the risk assessment have to be placed at system or higher levels very often.
The system level is important because the risk-based approach which incorporatesAOT and STI interactions is similar to those derived at higher levels, i.e. function,sequence and core melt. These approach are founded on the component approach andon the relation among several components, that is modelled through the minimal cut sets(MCS) obtained for the system, function, sequence, and so on, using the PSA study forthe plant.
4.1 Definition of interaction.
At these levels the second source of interaction have to be taken into account inaddition to the first one. Thus, the relation among several components together with

their characteristics and requirements have to be considered. This relation becomes fromthe component disposition in the plant, test strategies, common cause failures andstrategies for test after failure. It can be modelled through fault or even trees logicstructures obtained from the PSA study, or in terms of MCS.
4.2 Approach to incorporate AOT and STI interactions.
Two identical components MCS.
Now, the risk evaluation model will represent the average MCS unavailability.Using this model under the trade-off criteria a relation between D and T can be derivedin a similar way as it was obtained at component level, which yield:
D = (9)
211
known as the interaction function at MCS level, where Qm is the average MCSunavailability, and p and A. are well known from previous study.
In expression (9) can be see how D and T relation has others dependencies thanthose seen at component level (see expression (6)). These concern to test strategies(represented by S) and common cause failure probability (represented by ß).Unfortunately expression (9) can not be obtained analytically -as expression (5)- and ithas to be solve numerically. It will be always the same at levels higher than component.
Now expression (9) can be used to analyze test strategies and common causefailures effects in the light of AOT and STI interaction, or instead to studyimplementation choices in defining AOT and STI considering above dependencies, as itwas done in the whole work1.
System level.
The interaction-based approach extension to system and higher levels can beeasily understood taking into account that the component approach forms the basis of
the approach at higher levels. Extension consists in defining all existent sort of relationsamong components which will be modelled through the MCS that lead to the Top eventon each situation.
Now, the risk evaluation model will represent the system unconditionalunavailability and it will be given by a set of equations. This set will consist of:
1. a subset of expressions representing each a component unconditionalunavailability or the component approach when it is possible,
2. a subset of expressions representing each an average MCS unavailability, whichrepresents a relation among several component failures that leads together andwithout exceptions to the top event, and
3. a final expression which represents the unconditional unavailability for the topevent, that is associated to the whole combination of component failures or MCS.
4.3 Additional constraints on changes on AOT and STI requirements.
Above set of equations models AOT and STI interactions at system or higherlevels and it can be used to study changes on these requirements in the light of theunconditional risk.
However, there are other restrictions or limits on such changes which have to betaken into account. They are concerned to: AOT and STI modifications for a componentor several of them in a group (i.e. when they are tested in the same tes.1 strategy),maximum tolerance on average component unavailability, etc.
On the other hand, as we have already said in this paper (see section 1.1), inorder to control effects on risk due to AOT and STI modifications it is necessary to focusboth the unconditional and conditional risks. When considering the last ones it can be

212 obtained a set of equations - similar to the unconditional risk - which introducesconstraints on the conditional risks.
4.4 Procedure for studying changes on APT and STI requirements.
The next step after defining above restrictions to changes on AOT and STIrequirements for a system, function and so on, is to study solutions to the global set ofequations. In this set AOT and STI requirements for a subset of components togetherwith their unavailabilities will be considered variables. Solutions will be thosecombinations of changes on above requirements which satisfy above set of equations orrestrictions.
The existence, or not, of solutions for this set depends on its degrees of freedom,it is the number of variables in relation to the number of equations in the set. When fora given subset of components there is not solution it is possible to increase above subsetof components to increase in this way the variables. If there are not enough variables at
the actual level of evaluation because the limited number of components, it shouldextend the study of changes to higher level where there are more components.
In contrast, when existing more than one solution it is necessary to define anadequate strategy to find pairs (T,D), which will differ from their initial values. In ourcase the trade-off based risk criteria for both unconditional and conditional risks havebeen used.
Above set of equations constitute a non-lineal algebraic system which can not besolved analytically, so it is necessary to find pairs (T,D) using numerical methods. Tohelp to do it, a mathematic algorithm was developed and implemented into a computerprogram called ASIA1.
5. CONCLUSIONS.
A significant operation and design experience has been accumulated and anumber of problems have appeared which require modifications in some TS rules,specially in some AOT and STI requirements. The goal of the modifications is to furtherimprove the nuclear safety and to enhance flexibility of plant operation.
Using probabilistic methods, some changes have been adopted in some cases butabove goal has not fully achieved because two main reasons: 1) AOT and STImodifications have been independently analyzed, and 2) the acceptance criteria havebeen based on the constraint that there was no significant reduction in plant safety.
The above goal can be entirely achieved using the methodology presented herein.Thus, using the interaction based approach the analyst can study several changes on AOTand STI requirements which aim to optimize components and systems reliability andthereby the plant operation and safety from a risk point of view. At the same time whenadopting the trade-off based risk criteria it is possible to give flexibility to the plantoperation through several strategies which have been presented herein.
In this document the bases of such a methodology have been introduced, rangingsince the component level to system and higher ones. Further studies were conducted inthe whole work1 where this methodology was successfully used to study several changeson AOT and STI requirements for the AFWS in a PWR plant. To help to do it, amathematic algorithm was developed and implemented into a computer program (ASIA).
REFERENCE
[1] Sebastian Martorell, "Anâlisis de la Interaction entre los Requisites de TiempoMaximo Permitido de Inoperabilidad (AOT) e Intervalo entre Pruebas deVigilancia (STI) de Componentes de Sistemas de Seguridad de CentralesNucleares", PhD Thesis presented in the Chemical and Nuclear EngineeringDepartment of the Polytechnic University of Valencia, Spain, May 1991.

213
APPLICATION OF PSA TECHNIQUES FOREVALUATION OF PROPOSED CHANGES TODG MAINTENANCE AT KOZLODUY-3 NPP
I.G. KOLEVRisk Engineering Limited,Sofia, Bulgaria
Abstract
This presentation is a brief overview of a study done by Risk Engineering Ltd torEP-2 Directorate of the Kozloduy NPP Branch of the National Electric Company ofBulgaria. The complete report is contained in REL document NRI/D-06, May 1992(in Bulgarian).The PSA techniques has been applied for evaluation of the impact on CDF of theadditional maintenance of DG electrical systems and components, proposed bythe personnel of the Electrical Oept. of Kozloduy-3 NPP. The proposal included arequest to the regulatory body to allow the proposed maintenance to beperformed once per month on each DG train without starting-up of other trains,which should normally be done for all on-line maintenance of the safety systemsaccording to an action statement in the plant Technical Specifications. The studyhad to be done without an existing PSA.The study includes discussion on the applicable accident sequences and analysisof the relevant safety functions, including restoration for the existing as wed as forthe proposed maintenance practices on an yearly-averaged basis. Thecomparative character of the study allows the use of generic data, but theavailable plant statistics has also been used, and sensitivity calculations has beendone for the key modelling parameters.
1. Introduction
The Kozloduy-3 NPP is a double-unit plant (units 5 and 6 at the Kozloduy site) with WER-1000reactors. Unit 5 started official operation in 1989, and unit 6 is being operated on different powerlevels since 1990 and the licence for full-power operation is expected later this year. The overalloperational experience is about 5 reactor-years including the initial lower-level operation.The main features of each unit include 3 independent trains of all safety systems, including dieselgenerators (DG) for back-up of essential power supply system. The plant Technical Specifications(TS) does not allow any scheduled maintenance of the safety systems, while the unit is in poweroperation.The un-scheduled maintenance is mainly connected with the on-line surveillance tests of safetysystems that are being done once per month on a staggered scheme, i.e. one train each 10 days andinclude testing of all safety system's functions and all major components, including control andinstrumentation systems and electrical systems. If a failure state or malfunction of component orsystem is detected, the action statements require the restoration to be done in one-shift (8 hours)period, and the other two trains of safety systems are to be started on recirculation during therestoration period. All repairs or restoration activities are to be followed by a full-scope test prior tothe declaration of normal-operation conditions.
During the several operational years, the personnel of the Electrical Dept. of the plant observednumber of small (as described by the staff) faults in electrical equipment of the DGs, that are usuallyrevealed during the surveillance tests and the corresponding components are usually restored in avery short time (in 10-20 minutes, up to one hour in rare cases). However, the stringent requirementsof the TS had to be followed, thus imposing additional load to both personnel and safety equipment.In connection with the on-going activities for upgrading of plant Technical Specifications, theElectrical Dept. staff proposed changes to be introduced, that would allow for an on-line maintenanceactivity to be done on each DG's electrical equipment prior to each surveillance test (the overall timefor this maintenance has been assessed to about 5 hours). In the same time it was proposed that theother two trains will not be started during this maintenance, on the ground of bigger wear-out of theequipment and bigger load on the staff as well as on the ground that the corresponding DG will bedisconnected from the Emergency Safety Feature Automatics (ESFA), but will still be in hot-standbycondition.Before submittance of this proposal to the Regulatory body, the plant Management required a riskimpact study to be performed, and Risk Engineering Ltd has been commissioned for the analysis.The tasks has been defined as evaluation of the impact of proposed changes to plant safety by acomparative study. The study had to be done in a very short time to fit with the time-schedule of TSupgrading activities and had to be done in the absence of any PSA-related analyses for this plant.
2. Probabilistic Models
2.1. General Approach
The general approach to the analysis has been defined according to the task and the unavailability ofbasic PSA study. The core damage frequency (CDF) has been used as measure of the risk andyearly-averaged time-independent models and quantification has been used for assessment of CDF.The main steps of the analysis are as follows:
• qualitative determination of the applicable Initiating Events (IE) and accident sequences withmajor impact on plant safety in connection with the performance of systems and componentschallenged by the proposed change; developing of the master CDF equation;
• development of probabilistic equations for the unavailability of the safety functions in the masterCDF equation for the existing situation and for the situation after the implementation of theproposed changes;
• analysis of system unavailabilities by the Fault Tree (FT) method, quantification of other modellingparameters (maximum use of the available plant data has been requested);
• final quantification of both configurations, incl. parametric analysis with respect to the uncertainmodelling parameters.
The sections below present this items in more detail.
2.2. Accident Sequence
The proposed changes to DG maintenance would only affect the performance of DG back-up of theEssential Power Supply Systems (EPSS). This is a stand-by safety function, that only comes into

oii operation in case of toss of the two other power sources of the EPSS, namely (1) preferred powersupply from the 400 kV grid through the main and house-load transformers (the main generator isequipped with generator breakers to allow for the preferred power source to be used in case ofTurbine Generator (TG) trip) and (2) reserve power supply from 220 kV grid through the auxiliary(start-up) transformers. This layout allows us to consider that the importance of DG is bounded bythe accidents with total Loss of Off-Site Power (LOSP), thus outruling for the purposes of this studyany other Initiating Events (IE).The safety functions that are challenged in case of LOSP, are as follows:(1) reactor and TG trip: multiple independent signals are foreseen for both reactor and TG trip in
case of LOSP;(2) secondary side integrity: the toss of main condensers vacuum in case of LOSP require
opening of the Steam Dump Facilities with atmosphere discharge (SDFA), that are available oneach Steam Generator's (SG) steam line, these are backed-up by 2 SG safety valve per SG. Forthe case of stack-open situations, the steam lines are provided with fast-acting isolation valves aswell as with passive check valves, that would isolate the corresponding SG form the rest of thesteam lines system. In addition, the SG safety valves can be manually re-closed withoutdegrading of their primary function;
(3) emergency power supply is provided by Accumulator Batteries (AB) for the UninterraptablePower Supply System (UPSS) and by DG for EPSS; the UPSS is realigned to DG after their start-up;
(4) decay heat removal is provided initially by the run-down of Reactor Coolant Pumps (RCP)leading to natural circulation conditions in the primary loops and by secondary heat removal viasteam discharge form SGs; when the DCs provide power for safety systems, the Auxiliary FeedWater System (AFWS) comes into operation to keep the SG water level and steam discharge iscontinued by SDFA in SG-pressure maintenance mode. The reactor is to be kept in hot-shutdown in LOSP environment for 1 hour, then, if LOSP situation is not removed, operators haveto initiate a cool-down procedure by opening of Reactor Emergency Gases Removal (REGR)valves (or opening and rectosing of Pressuriser Safety Valves), aligning the High PressureInjection Systems (HPIS) (aï safety systems are started on recirculation by DG Gradual LoadingAutomatics (DG-GLA) to maintain reactor pressure and coolant level and to increase the coolantboron concentration while decreasing the coolant temperature by secondary side heat-removal.When the necessary cold-shutdown boron concentration is provided, the Core Flooding System(CFS) function is blocked, reactor pressure is decreased and Residual Heat Removal (RHR)configuration of the Low Pressure Injection System (LPIS) is operated for long-term maintainingof cold-shutdown state of the reactor.
For the reasons explained above, the functions (1) and (2) where considered to be lower-margincontributors to the probability of CDF in case of LOSP and were discarded from further analysis.Thus only functions (3) and (4) were considered.With the assumptions explained above, the core damage in case of LOSP would be a result of thefollowing accident progression sequences:(1) failure of the secondary decay heat removal (loss of all feed-water supply), followed by a failure
to use feed-and-bteed for primary decay heat removal as well as failure to restore preferred orauxiliary power supply in time to prevent core damage;
(2) failure of the emergency power supply (unit blackout) followed by failure to restore powersupply in time to prevent core damage.
The (1) above includes multiple failures of safety functions either by hardware or human faults. Allsystems, as well as operator actions, that provide those functions depend on the power supply for
their operation or for providing of indications for correct diagnosis of the accident progression. Thenon-power-related faults necessary to degrade those functions are multiple and independent, it wasconsidered appropriate for the purposes of this quick study to make the conclusion that the CDF willbe dominated by the blackout sequence (2). The CDF for that sequence will be expressed by:
CDF = 1 QDG POP (1)where:
/ = frequency of the Initiating Event (LOSP)(Jxa = unavailability of the power supply from OGsPOP = probability of norwestoration of off-site power within the available time
Because of the comparative nature of this study, the fact that the proposed changes do not interferewith the performance of EPSS beyond the DG electrical equipment, the EPS function has beensubstituted with the DG unavailability, which is considered to be a dominant contributor for theunavailability of EPS. The Eq. (1) is the master CDF expression used in the study.The available time for restoration of the power supply in case of blackout has been defined ratherconservatively by the following arguments:(1) the turbine-driven FWPs are not designed to work in power supply failures, thus the only source
of FW to the SGs remain the AFWS with motor-driven pumps that depend on EPSS;(2) the horizontal SG's large water inventory allows for the boil-off cooling of the reactor for at least
3-4 hours, presuming that the motor-driven SDFA (so called BRU-A) will correctly function inpressure-maintenance mode, but
(3) the capacity of ABs, that would supply SDFA in blackout, according to the design is only 30min fit is not verified, whether AB can really supply SDFA, that is a quite large consumer, for 30min);
(4) the toss of Component Cooling System (CCS) in case of blackout will eventually lead to teaksfrom RCP seals; teaks may be significant in about 1 hour since loss of CCS;
(5) rapid reactor cool-down requires additional boron injection, provided by power-dependentHPIS.
In this circumstances, the conservative assumption has been made that the AB capacity is thelimiting factor, leading to 30 min being defined as the allowable time for power restoration in case ofblackout. After 30 min, the operator will no longer control the unit due to loss of Control andInstrumentation (C&l), SDFA will be fixed in unknown position, with increasing leaks form RCP'sseals. No procedures are available for plant personnel actions in such situation, and some coredamage may be possible. The 30 min bound has been used independently of the time, when theblackout occur (immediately following LOSP or after some time due to DG run failures) because theoperator is not supposed to cool-down the reactor until 1 hour into the accident, and after that thepartial probability of non-restoration of off-site power is only a small fraction of the total andcorresponding accident progression is not expected to significantly change the results.The frequency of IE has been conservatively evaluated to be 0.2 per reactor year. This figure have tobe treated as an upper bound, because it reflects the experience with power failures in older units onthe site and is independent from the power failure periods; it also do not reflect the more reliablepreferred power scheme of the new units.

2.3. Power Restoration
The probability of non-restoration of the off-site power in the defined available time, has beenevaluated by the approach, based on the assumption for exponential distribution of restoration times.Generally, the probability of non-restoration in time f if the failure has occurred in (=0, will be
where
P = 1 - $ r • exp(-rt) dt = exp(-rf')o
r = restoration rate: r = VT, (T= mean time to restoration).
(2)
The probability of non-restoration in time <' if the accident started at t = o and the blackout conditionhas occurred at any time moment (t : 0 < t < t"), where t" is the mission time, will be
P = S exp[-r (t + t')]dt -exp(-r<')[1-exp(-rr)] =
t'exp( — ) t"- exp(— - )(3)
215
The Eq. (3) has been used for estimation of the probability for non-restoration of the off-site power.The mean time to restoration has been evaluated by expert opinion (experts from both NPP and GridControl Centre participated in the evaluation) to be in the interval 15-45 min depending on the actualreason for LOSP accident. This time is bounded by the possibility to provide temporary power linefrom other units. The probability of catastrophic external events, that may cause long-term powerfailures, is quite low in comparison with other causes for LOSP, so their weight in mean restorationtime is also low. Parametric calculations has been done to reflect the uncertainties of the off-sitepower restoration time.During the DG unavailability analysis, explained below, it was considered to include the probabilitiesfor non-restoration of DG in the specified time to prevent core damage. The quantification of thisprobability has been done by Eq. (2) above, and the mean restoration time has been evaluated fromplant records and has been found to be about 3 hours. This figure has been considered toooptimistic with respect to generic figures based on more statistical data, so a parametric calculationhas also been done for bigger times to restore power supply from DGs. The mean time to restore theDG that is in the proposed additional maintenance reflects the fact that it has to be kept in hot stand-by.
2.4. Unavailability of DGs
The unavailability of DGs that is included in Eq. (1) had to be evaluated separately for the two cases:(0) the existing situation and (1) the situation after the eventual introduction of the additional on-linemaintenance.Three different configurations of DGs were found to be relevant for this study, namely:(n) the normal on-line configuration of three trains in hot stand-by: the total unavailability have to
account for failures to start or run of three DG trains as well as for the probability of non-restoration of a failed DG in the specified time;
(m) configuration in unplanned on-line repair of one train according to existing practice to start-upthe other two trains: the total unavailability have to account for failures to run of two DG trainsand non-restoration probability (the train that would be in maintenance was not accounted for inthe model);
(a) configuration during the proposed additional maintenance with 2 trains in hot stand-by: the totalunavailability accounts for failures to start and run of the two DG trains, the probability of non-restoration of a failed train as well as the probability of non-restoration of the train inmaintenance (that is to be kept in hot standby).
Thus the DG unavailability formulas will be as follows:
0, = d-*. ~ka)Qm Pa
(4)
(5)
wherek = fractions of time when the corresponding configuration existsP - probability of non-recovery of a failed DG or DG in planned maintenance
and the indices are as denoted in the explanation above.The time fraction of the unplanned on-line maintenance has been evaluated from plant records, andthe time fraction for the planned additional maintenance - from the proposed maintenanceprogramme.The unavailabilities of DG in Eqs. (4) and (5) above have been modelled with 3 different FTs andquantified with generic data. Common cause failures for DGs have been included in the models andquantified by the Multiple Greek Letters (MGL) method using also generic data.
3. Overview of Results
The main results of the study are presented below. The Table 1 presents the results of quantificationof the FTs developed for 3 different configurations:
Table 1. Quantification of DG unavailability FTs
I ConfigurationThree trains start and runTwo trains run
Two trains start and run
Unavailability1.8E-03
2.6E-03
6.7E-03
Table 2 lists the average unavailability of DGs according to the existing and to the proposedprocedures for DG maintenance which also includes the restoration (according to Eqs. (4) and (5)).

216 Table 2. Unavailability of DCs with respect to existing andproposed maintenance procedures
Maintenance procedureExisting
Proposed
Unavailability1.10E-03
1.17 E-03
As stated earlier, several modelling parameters have been used for a parametric calculations in orderto assess the sencitivity of results to this parameters- only one of this calculations is presented here.Table 3 below presents the results of the study in terms of CDF due to blackout for 3 different valuesof the mean time to restore off-site power. The table incudes results for the existing and proposedprocedures and the percentage of CDF increase.
Table 3. Expected CDF due to blackout with respect to existingana proposed maintenance procedures
MTTRforOff-Site Power
15 min30 min45min
CDF for ExistingProcedures9.52 E-065.15E-05
1.08 E-04
CDF for ProposedProcedures
1.01 E-055.45 E-05
1.14 E-04
CDF Increase,%6.1
5.8
5.5
The results of other parametric calculations, including different combinations of the parameters,were also inside the 5.5 - 6.4 % increase of CDF for all cases considered. The results reflect theadditional DG unavailability imposed by the additional proposed maintenance in the framework of aplant that is, generally speaking, not designed to withstand a blackout situation and with quite a bigimpact of DG performance on plant safety because of small capacity of AB and dependencies ofmost safety systems on power supply. The results also reflect the relatively small unavailability of DGdue to unplanned maintenanceFollowing the study, the proposed changes has been outruled by plant management. The ElectricalDepartment personnel has been requested to prepare a new preventive maintenance programmethat would solve the existing problems but would not significantly increase DG unavailability.
RISK-BASED EVALUATION OF ALLOWED OUTAGETIMES (AOTs): CONSIDERING RISK OF SHUTDOWN*
T. MANKAMOAvaplan Oy,Espoo, Finland
I.S. KIM, P.K. SAMANTABrookhaven National Laboratory,Upton, New York,United States of America
Abstract
In failure situations of safety systems during power operation,the Technical Specifications (TS) usually limit the repair withinAllowed Outage Time (AOT). If the repair is not possible withinAOT, or if no AOT is allowed, plant is required to be shut down forthe repair. However, if the capability of removing decay heat isdegraded, shutting down the plant with a need to start up andoperate the affected decay heat removal systems, may impose asubstantial risk as compared to the continued power operation overa usual repair time.
Defining a proper AOT should thus basically be considered as arisk comparison between the repair in full power state withtemporarily increased risk level, and the alternative of shuttingdown the plant for the repair in zero power state with a specificassociated risk. Obviously, if both of these alternatives impose asmall risk, then a flexible AOT for repairs in full power state canbe accepted without a closer evaluation.
The methodology of the risk comparison approach, with a dueconsideration of the shutdown risk, has been further developed andapplied to the AOT considerations of residual heat removal andstandby service water systems of a boiling water reactor plant .Based on the completed work at this stage, a number of improvementsto the TS requirements for the systems studied can be suggested.
1 INTRODUCTION
1.1 Problem formulationDefining the Allowed Outage Time (AOT) will be considered here as arisk comparison between:CO: Continued operation alternative: repairs undertaken while at an
increased risk level, in the full power operation state
* Work performed under the auspices of the US Nuclear Regulatory Commission (USNRC). Theviews expressed are those by the authors and do not necessarily reflect any position or policy of theUSNRC.

SD: Decided shutdown alternative: a controlled shutdown undertakenin order to make repairs in a zero power state (usually coldshutdown state)
SD alternative includes a specific risk constituted by thedisturbance transients possible during power reduction andcooldown. Furthermore, if the initial failures affect the residualheat removal (RHR) function, the need to start up and operate thedegraded RHR systems in SD alternative, may impose a substantialrisk. These risks cannot be readily determined but require a closerevaluation. The operational decision alternatives, and relevantoperational flow branches for an AOT case, are illustrated inFig.l. This will be discussed in more detail in Section 2, alongwith highlighting the specialities of the approach as compared withmore conventional, risk-based AOT considerations.The uses of this kind of analysis are to• identify noncoherent requirements in the TS that may result in
increased risk as opposed to alternative, safer options» alert plant personnel about situations where quick diagnosis
and resolution of the encountered problem is important• provide basis for risk-effective, practicable action statements
and to minimise risk-impact of operational events1.2 Background and scopeThe methodology builds on the recent work and application for theresidual heat removal (RHR) and standby service water (SSW) systemsof a BWR plant in the USA [1], and on the earlier work for a BWRplant in Finland [2-3] , The basic development and criteria forrisk-based AOTs are more completely presented in Refs.[4-5].This paper will describe key features of the risk comparisonapproach, supplementing earlier publications. Especially, the riskaddition from a preset AOT on the long term risk will be handled.The interpretation and uses of the risk comparison results will bediscussed.The completed work and practical applications this far haveresulted in a number of suggestions for the improvements in the TSaction statements. These insights will also be covered.
Baseline,full power state,
SSW trainsin standby
Two SSWtrains detectedfailed
Repairs consideredalready in thebeginning too Decided plant
Jong _per AOT __ \ snutdown with"•vogains
Repairs assessedlikely to succeedwithin AOT(p~100%|AOT=2d)
\
/ Increas/ full pow\ 2 SSW\ under
t AOT>^ (quite^^ unlikely for
the exampleAOT=2d)
A| At leasti one repair
————— i ! completed i
-d risk \ !(P~94-93|-a nsK, v —— i k.c\\—')(\\er state, \ AU'-^d^
trains L -. ,. , . , . . ,repair /
Transient or forcedN t shutdown during
the repair state(p~0.6%|AOT=2d)
- ,inoperable
Repairs not successfulwithin the preset AOT,proceed to LCO/SD(p~4.5%lAOT=2d)
Transient or \forced shutdownX2 SSW trains /inoperable /
2 RISK COMPARISON APPROACH
The methods and approach will here be illustrated by the use ofexample results from the recent pilot application, for failuresituations of three redundant SSW trains [1]. These SSW trainsconstitute a part of normal RHR path, but serve also vitalcomponent cooling function of most front-line safety systems, andjacket cooling of diesel generators.
Figure 1. ESD for the operational states and flow paths in afailure situation of a standby safety system. Likelihoodof the branches are here illustrated by the use of datarelevant for SSW train failures in a BWR plant [1].
217

010 2.1 Basic operational alternativesLet us consider a failure situation covered by an AOT, and therelevant operational states and flow branches as presented inFig.l. At the instance of failure detection, the increased risk,full power state is first entered. There are three principal exits:coA Repairs or some other type of restoration is successful within
the AOT. In multiple failure cases, already the completion ofone repair usually reduces significantly the situation specificrisk, and means transfer to another, safer state (not shownexplicit in Fig.l)
coB A random transient or some critical cause forces the plantshutdown during the full power repair state
incremental influence by a preset AOT in the long term risk averageis of interest, and will be discussed later.
sd A controlled plant shutdown is undertaken because the repairsare not successful within the AOT
The likelihood of exit path coB is usually small, because theprobability of the transients and forced shutdown needs is low overthe normal mean repair time.The likelihood of exit path sd is determined by the repair timedistribution against the AOT.If no AOT is given, then the operators will promptly proceed fromthe failure detection to a controlled plant shutdown. In this case,the expected risk is constituted merely by sd branch, neglectingthe short duration risk while still in the increased risk, fullpower state. This is the principal SD alternative defined inSection 1.1.If an AOT is given, the expected risk per failure situation isconstituted of the net contribution from all the three possiblebranches above, weighted according to their likelihood. Assuminginfinite AOT, or in practice, a long AOT as compared with the meanrepair time, this corresponds with the principal CO alternativedefined in Section 1.1. (The influence of AOT in the region of themean repair time will be discussed later.)In a "conventional" AOT consideration, plant shutdown risk isassumed negligible in comparison with the temporarily increasedrisk level, and cumulated risk over a repair time, in the failuresituation concerned. This may be a reasonable assumption for thefailure cases of some specific systems, but not necessarily for theRHR systems especially needed in the plant shutdown states, asshown by the results from the recent studies.
2.2 Risk measures for comparing operational alternativesIn the SD/CO risk comparison approach, the primary risk variablesto be considered in setting AOTs, are the instantaneous riskfrequency in the failure situation, and the cumulating risk over apredicted repair time (also a situation specific risk). These areillustrated in Fig.2 by using SSW case data (1). In addition, the
I.OOÊtOO
1.00E-01
1.00E-02
1.00E-O3( CoreOn/a]
100E-04
- 1.-SD-Baseline
Tin» a [ day» 1
Figure 2a. Instantaneous risk frequency for the continued operation(CO) and plant shutdown (SD) alternatives in failuresituations of SSW trains. For example, 2:co denotes thecontinued operation alternative in the failure situationof two SSW trains being inoperable.
Cumu*lativaCor.D '
riik
4.00 6.00 8.00
Repair Um* r [day«]
10.00 12.00 14.00
Figure 2b. Cumulative risk over predicted repair time in failuresituations of the SSW/trains. For example, 2:CO denotesthe continued operation alternative in the failuresituation of two SSW trains being inoperable.

219
221 Instantaneous risk frequencyThe instantaneous risk frequency, i.e. the probability of undesiredend event per unit of time (here core damage frequency as definedin so called PSA Level 1 analysis) is shown in Fig 2a both for COand SD alternatives, over different multiplicity of failuresituations of three redundant SSW trains [1] The main interestfocuses on whether a lower risk level will be reached after plantshutdown, because this is a precondition of SD alternative beingviable at all from the risk point of view. There may exist suchextreme cases, where the risk frequency would be higher in zeropower state as opposed full power state, for example, in a totalfailure of the standby RHR systems of a BWR plant, where the normalpower conversion system/turbine condenser is unstable to be used atlow steam rates222 Cumulating risk over predicted repair timeThe cumulating risk over predicted repair time, i.e. the integralof risk frequency over a given repair time, is shown in Fig.2b,also both for CO and SD alternatives, over different multiplicityof failure situations of three redundant SSW trains [1]. The maininterest in these curves is, at what repair time do the SD/COalternatives cross? SD alternative is motivated for longer repairsthan the threshold value. Therefore, this risk variable should beconsidered most essential in the determination of a proper AOT inthe SD/CO comparison approach.Generally, the AOT should be comparable with the crossing point ofthe cumulating risk over predicted repair time. In practice often,the SD/CO curves are close to each other, and hence the crossingpoint should not be followed too strictly, specially when takinginto account the uncertainties of the risk calculations (to bediscussed later, compare with Fig 5). Practical/operational reasonsmay motivate to utilise only limited, discrete values for AOTs suchas 1, 3, 7, 14, 30 days.
2.2.3 On the concept of "baseline" state and riskThe baseline risk (compare to Fig.2a) will be used here to refer tothe risk level in case the safety systems are in their nominalstate For most safety systems this means standby state without anycomponents known to be inoperable The latent failures of thesecomponents are only detected by surveillance tests, or at demandsituations. Their likelihood is the prime ingredient of thebaseline risk. For some safety systems, or components, the nominalstate may also be operating state Consequently, failures of thosecomponents are usually directly revealed by instrumentation orprocess symptoms If an initiating event occurs during the baselinestate, the instantaneous unavailability is initially zero for thesesystems, but they may fail during the mission period, andcontribute in that way also to the baseline risk.Disconnection for testing or maintenance, and detection of criticalfaults in surveillance testing of standby components, or failure to
run of operating components etc , are deviations from the baselinestateWhen considering AOT situations for a safety system, it isimportant to carefully exclude from the baseline state allunavailability states of safety system components, which wouldinterfere with the LCD rules for the considered systems Suchinterfering combination cases should be considered explicit asdistinct AOT situations, not included "implicitly" as in PRAstudies is normally done for repair and maintenance downtimes.The long term risk is composed of the average baseline risk plusthe expected value of the increments due to all kinds of deviationsfrom the baseline In practice, this is a too tedious way ofobtaining the total average risk level. Instead, the standard PRAapproach is motivated to be used for that purpose The baselinerisk level is a dedicated concept to be used in connection to AOTconsiderations.2.3 Contributors to the shutdown riskThe risk peak in SD curve of the instantaneous risk frequency,Fig.2.a, or equivalently the nonzero starting value of cumulatingrisk for SD alternative, Fig.2.b, represents the risk associatedwith the state change of the plant in a controlled shutdown. Firstof all, it includes the risk of disturbance transients. In theexample SSW failure cases, the main contributors are• loss of normal power conversion system (PCS) during power
reduction or reactor cooldown• loss of off-site power (LOSP) caused by a shutdown transient.Besides, the risk peak may include also the risk of remaining RHRsystems failing to start. In the example SSW failure cases, thiscontribution lacks, because PCS is operating through a smoothlyproceeding controlled shutdown, and its use can be extended, if thestandby RHR systems fail to start.In SD alternative, the risk frequency decreases after powerreduction, due to diminishing decay heat level, which allows moretime to recovery, if a critical failure combination occurs laterduring the shutdown cooling mission Nevertheless, the riskfrequency may stay at a substantial level after plant shutdown. Inthe example SSW failure cases, the main contributors during theshutdown cooling mission are• loss of instrument air supply, which according to operating
experiences has a rather high failure rate in the zero powerstate
• LOSP, which is especially critical because SSW trains servealso jacket cooling of the diesel generators therefore, dieselgenerators are functionally unavailable in those subs where SSWtrains are initially detected failed

22Q In comparison, the risk frequency of the full power operation stateis in the example SSW failure cases strongly dominated by LOSP.Thus the risk profile is rather different from that of a controlledshutdown (SD alternative). It should be emphasised, that the riskfrequency of the full power operation state (CO alternative) iscomposed of initiating event frequencies and the expected risk ofthe various kind of transient and forced shutdowns associated withthe initiating events. These risk decomposition and modellingdetails are further discussed in Refs.(l,3].
2.4 Influence of APT onto expected risk additionThe instantaneous risk frequency and cumulative risk over predictedrepair time, considered in Section 2.2, are concerned withsituation specific risk. They lack control for the frequency ofrepair downtime occurrences. For this purpose it is motivated toconsider in parallel also the long term risk addition from the AOTsituations. This expected risk addition is named here as delta riskdfav, and expressed most conveniently as an increment to the annualaverage risk, i.e. in units [I/year]. It is related through
Pilot application, 2*SSW failure situations
dfavx(AOT) = Xx . rrsx(AOT) (1)with
Xx = Rate of failure situations Xrrsx(AOT) = Expected risk per failure situation X, with a given AOT
In principle, the existence of AOT influences the delta risk asshown in Fig.3, through the following two contributions (thisdecomposition will be discussed in more detail in Section 3):dfav_co The expected risk contribution of repair time while in
power state. If AOT is longer than the mean repair time,so a large part of faults will be repaired within AOT.Therefore this contribution saturates to a levelcorresponding to the risk over mean repair time.
dfav_sd The expected risk contribution of LCO shutdowns andrepair time in plant shutdown state. If AOT is short,the expected number of LCO shutdowns increases and alsothe associated expected risk contribution dfav_sd.
Summing up these contributions produces the delta risk - AOTcorrelation curve, Fig.3. It may have different detailed formsdepending on the plant specific features. In many cases, theminimum in the delta risk - AOT correlation curve proves not verypronounced. The essential conclusion then is that if AOT isreasonable in comparison with a normal repair possibility, longerthan about three times the mean repair time, the delta risk becomesinsensitive for AOT. This is based on the assumption, that nosignificant relaxation in the repair process does not happen forlong AOTs. It need to be emphasised, that the plant staff shouldhave a strong motivation to carry out repairs without unnecessarydelays, even with long AOTs, because this reduces the occurrencepossibility of complex cross combinations of failures.
3.00E-08
2.00E-08 -
1.00E-08 •
O.OOE+00
Sensitivity casedfav with x"° = 1
Delta risk for theaverage core damage
frequency [1/a]
10 15
Figure 3. Delta risk - AOT correlation for the double failure caseof SSW trains [1] .
Usually, delta risk is small for a group of components, mostlyabout one percent or less in comparison with the total risk.However, the delta risk sum over all components covered by AOTs,may become significant, and need to be especially consideredagainst acceptability criteria.The delta risk - AOT correlation is rather sensitive in regard tocalculation uncertainties, as will be discussed in more detail inSection 3. Futhermore, there may exist also indirect influences,which are harder to evaluate. For example, it could be expectedthat an AOT shorter than normally needed to complete the repair,may result in negative side effects, if faults are attempted to berepaired hastily in order to avoid plant shutdown.
3 KEY ISSUES OF THE METHODOLOGY
Main features of the developed methodology are summarised below. Asa complement to earlier presentations, we will concentrate here onparticular details of the delta risk - AOT correlation. A morecomplete methodology presentation is included in Refs.[l,3).

3.1 State modelling approachThe most essential methodological development is concerned with theuse of Extended Event Sequence Diagram (EESD) for the descriptionof event sequences, as a substitute for the traditional eventtree/fault tree approach. EESD incorporates intermediate and stableprocess states as embedded. This enhances timedependent modellingof operational scenarios and recovery paths. The latter is viablefor a realistic quantification of the decreasing risk (frequency)level while in zero power, due to diminishing decay heat production(prime motivation for a LCO shutdown). Pig.l is a simple example ofEESD, showing some flavours of the approach, especially the use ofan embedded state (compare with the state block "Increased risk,full power state, 2 SSW trains under repair") .Connected with modelling process states and recovery paths,parallel modelling of process behaviour is necessitated such as thetemperature behaviour of the suppression pool in a BWR plant, asthis is an essential heat buffer allowing substantial time torecovery in case of RHR function is lost. Besides, developmentshave also been required in order to more consistently handle repairand recovery time distributions, specially in multiple failuresituations where alternative recovery paths are available.Existing PRA models are, however, of great support for an EESDbased approach, both concerning the construction of eventscenarios, and in modelling of system details.3 . 2 Data requirementsData input needed is to an large extent similar as in a PRA study.Additional, special data are required for the likelihood ofdisturbance transients during a controlled shutdown, and for therepair and recovery time distributions.
3.3 Influence of a preset APT
A preset AOT evidently has an influence on the repair timedistribution, especially when AOT is near to the mean repair time,because the operators are then certainly looking for possibilitiesto speed up repair arrangements in order to avoid plant shutdown.These possibilities include shortening the time spent toadministrative tasks as well as giving a high priority to thecritical repair while postponing possible other, less urgent works.3.3.1 Influence onto repair time distributionInfluences observed in the early Finnish-Swedish DG study [4], arereproduced here as Fig.4. Based on these insights, the followinginfluence model is developed [6]:
quite soon after failure detection, the operators are able todetermine the severity class of the repair
severity class is described by an exponential repair timedistribution, which to a certain extent covers the variabilityand uncertainty of repair time predictionunder AOT constraint, the operators/maintenance staff are ableto shorten the repair time to a specific fraction x, from thebeginning if AOT is less than the mean time for the repairseverity class, otherwise from the time point when theremaining AOT equals to the mean repair time
Nominally, fraction x = 0.5 has been used in sensitivity analyses.
i.oo
o.io-
o.oi
^ AOT ="-^30 days
Downtime ac [h]
Figure 4. Effect of AOT on the down-time distributions forcritical faults of diesel generators [7] .
3.3.2 Delta risk - AOT correlation
The delta risk contribution dfav, for specific failure situationsX, can be derived by the use of the following breakdown (comparewith Figs.l and 3)
221
dfavx(AOT) = dfav_cox(AOT) + dfav_sdx(AOT) 'withdfav_cox(AOT) = Xx . [ 1 - pnrx(AOT) ] . rcox(AOT)dfav_sdx(AOT) = Xx . pnrx(AOT) . rsdx(AOT)rcox(AOT) = P{CoreD| Initiating event occurs during full power repair state}
j0AOTdafcox(a).pnrx(a)1 -pnrx(AOT)
(2)
(

222 andrsdx(AOT) = P{CoreD| Initiating event occurs dunng a controlled LCO shutdown
or while in the cold shutdown repair state}
alternative is insensitive (the three curves overlap in Fig.5). Thecrossing point moves, with a sensitivity range from about 3 daysthrough 5 days, in this example case.
J^OTdafsdx(a)pnrx(a)pnrx(AOT)
(4) 1 OOE-04
where*xfcox(a)fsdx(a)
pnrx(a)
Rate of failure situations XInstantaneous risk frequency dunng full power repair stateInstantaneous risk frequency dunng a controlled LCO shutdownand while in the cold shutdown repair stateComplementary repair time distribution, i eprobability of nonsuccessful repair up to time a
The risk is associated here to the core damage event CoreD, asusual in the PRA Level 1 considerations. An example of thecalculated delta risk - ROT correlation is presented in Fig.3.Beside of the nominal repair reduction fraction x = 0.5, also thecase of x = 1, i.e. no credit for repair speed-up, is shown.It should be noted, that in some other applications, there isunrealistically assumed that given any AOT, it all will be used inevery repair. This results in erroneous correlation between thedelta risk and AOT. The stated assumption together with omittingshutdown risks, means that the delta risk would increase linearlyas the function of AOT. A more detailed comparison is included inRef.[6].The consideration of AOT influence in this way was earlierpresented by Kam, et.al. [8]. In our approach, the shutdown riskand repair time distribution of the initial failure state are moreprecisely quantified.
3.4 Sensitivities with regard to uncertaintiesThe uncertainties in the AOT considerations, and in the riskcomparison approach described here especially, are similar to PRAstudies and other risk-based applications. Additional difficultiesmay be connected to the specific modelling features and datarequirements discussed in Sections 3.1-2: i.e. in obtainingprobability estimates for disturbance transients, and repair orrecovery time distributions.Fortunately, in the AOT considerations using risk comparisonapproach, the relative results matter, and they are often to alarge part not very sensitive in regard to uncertainties. For thepart of important uncertainties, systematic sensitivity analysiscan then be used in order to verify conclusions. An example of atypical sensitivity analysis is shown in Fig.5. In the upper boundalternative, the likelihood of disturbance trips in increased by afactor of 2, and in the lower bound alternative decreased by afactor of 3 This affects directly SD alternative, but CO
1 OOE-05
1 OOE-06 - a
1.00E-07000 400 800
Predicted repair time a. [days]1200
Figure 5. Sensitivity for the likelihood of disturbance transientsin a controlled SD. Cumulative risk over predictedrepair time in the double failure case of SSW trains isshown [1].
4 SUMMARIZING CONCLUSIONS
This kind of approach and methodology is needed in order toproperly infer, how the predicted risk of the plant shutdownalternative compares with making repairs in full power operationstate. It proves especially important when determining AOTs for thesystems related to RHR function, because the plant shutdown withdegraded RHR capability proves to be a substantial risk, based onthe results from practical case studies this far.Insights obtained lead also to suggestions about operationaldetails of TS action statements. In many failure situations, theadditional condition check or prior test of the redundant operationpaths is recommendable for proper operational decisions. Also the
timing and desired end state of the LCD shutdown (i.e., the statewhere to undertake the bulk work of repairs) may be betteroptimised.Experiences show that the results of risk-based AOT considerationsdepend on many plant specific features, such as vulnerability todisturbance transients during a controlled shutdown, and theoperational reliability of the systems to be used while in zeropower state. It need hence to be emphasised, that the exampleresults from the pilot study, shown here in order to illustrate theapproach and methodology, should not be regarded generallyapplicable.
IMPACT OF SHUTDOWN RISK ON RISK-BASEDASSESSMENT OF TECHNICAL SPECIFICATIONS
S. DERIOTDirection des études et recherches,Electricité de France,Clamart, France
Abstract
223
REFERENCES
1. Risk-based improvement of Technical Specification actionstatements requiring shutdown: Pilot application to the RHR/SSWsystems of a BWR. Prepared for U.S. Nuclear RegulatoryCommission by T. Mankamo, I.S. Kirn and P.K. Samanta, to bepublished in 1993.
2. Mankamo, T. and Kosonen, M, Operational decision alternativesin failure situations of standby safety systems. IAEA TechnicalCommittee Meeting on The Use of PSA to Evaluate NPP's Technicalspecifications, Vienna, 18-22 June 1990.
3. Mankamo, T. 4 Kosonen, M., Continued plant operation versusshutdown in failure situations of standby safety systems,application of risk analysis methods for the evaluation andbalancing of AOTs for the RHR systems at TVO I/II plant.IAEA/TechSpec Pilot Study Programme, NKS/SIK-1(91) 4, August1991.
4. Vesely W. & Samantha P.K., Risk Criteria Considerations inEvaluating Risks from Technical Specification Modifications.Technical Report, BNL & SAIC, Draft, January 1989.
5. Optimization of technical specifications by use ofprobabilistic methods - a Nordic perspective. Final report ofthe NKA project RAS-450. Ed. K.Laakso. Prepared by a teamconsisting of K.Laakso, M. Knochenhauer, T. Mankamo & K.Pörn.Nord Series 1990:33, May 1990.
6. Work notes: Delta risk - AOT correlation. T. Mankamo, 25 June1991.
7. Pulkkinen, U., Huovinen, T., Mankarao, T., Norros, L. & Vanhala,J., Reliability of diesel generators in the Finnish and Swedishnuclear power plants. Technical Research Centre of Finland,Report SAH 7/82, June 1982. (Enhanced version published as VTTResearch Notes 1070, 1989)
8. Hioki, K. 4 Kani, Y.,Risk based evaluation of technicalspecifications for a decay heat removal system of an LMFBRplant. IAEA Technical Committee Meeting on The Use of PSA toEvaluate NPP's Technical specifications, Vienna, 18-22 June1990.
This paper describes the current work performed by the Research andDevelopment Division of EOF concerning risk-based assessment of Operating TechnicalSpecifications (OTS).
One of the objectives of the OTS is to determine what actions have to be takenwhen a component or set of components is unavailable. In France, many AllowedOutage Times (AOTs) have been evaluated a few years ago based on a probabilisticcriterion used in agreement with French Safety Authorities: "the additional occurrenceprobability of a serious accident (leading to core melt) while the nuclear plant is operatingat full power during the authorized time period, given the partial unavailability of thesafety system, must not exceed 10~7 ".
In addition, EOF conducted the project PSA 1300 (level 1 Probabilistic SafetyAssessment of the Paluel nuclear power plant). A computerized knowledge base calledLESSEPS 1300, which is a set of reliability models, computation methods and computertools, was developed in the framework of this project.
One of the main lessons of the PSA 1300 is that the shutdown states largelycontribute to the core damage risk. As a result, the following question becomes relevant:does the shutdown really lead to minimizing the increase of risk due to the unavailabilityof a safety-related component ?
In the PSA 1300, the partial or total unavailibilities of safety systems are generallyintroduced in the form of a "balloon" (all the components rendered inoperable duringmaintenance) for which outage rate is calculated on the basis of feedback from operatingexperience on the Paluel power plants. By performing sensitivity studies to the outagerates associated with each balloon, LESSEPS 1300 allows to measure the "new" hourlyrisk in each reactor state.
A case study is presented. It shows that:- a hot shutdown could be preferable (from a core melt probability point of view)
to an intermediate shutdown with the Residual Heat Removal System valved-out, whichis the most frequent safe shutdown condition,
- the increase of risk can be higher than 10'7, whatever the present managementsof the operations may be.
Therefore, taking into account shutdown risk suggests that the present OTSshould be modified.
By considering different kinds of accidents in different reactor states, the PSA1300 helps to determine not only the AOT, but also the "real" safe shutdown conditionand the method for shutting down. The main outline of this new method for risk-basedassessment of OTS is also presented.

224 1 INTRODUCTION Figure 1 describes this relationship
This paper describes the current work performed by the Research andDevelopment Division of EOF concerning risk-based assessment of Operating TechnicalSpecifications (OTS)
The current nsk-based assessment of OTS at EDF is presented Then, the level 1Probabilistic Safety Assessment of unit 3 of the Paluel nuclear power station (called PSA1300) is described It is fully computerized and takes into account the nsk in shutdownstates
A case study is presented It shows that the fact of considering shutdown nsksuggests that the current OTS should be modified.
I, CONTEXT
At EDF, one of the objectives of the OTS is to determine what actions have to betaken when a component or set of components is unavailable Many Allowed OutageTimes (AOTs) have been evaluated a few years ago based on a probabilistic criterion usedin agreement with French Safety Authorities "the additional occurrence probability of aserious accident (leading to core melt) while the nuclear plant is operating at full powerduring the authorized urne period, given the partial unavailability of the safety system,must not exceed 10-? " The AOT is the duration of time that the component or systemcan remain out of service before the plant has to shut down
Then, the AOT associated with the unavailability of a component or system can becalculated using the following relationship
whereA R . T = 10-7
A R is the increase in plant's core melt hourly nsk as result of theunavailability of a component or systemT is the suggested AOT (in hours), which is afterwards debated betweenEDF and the safety authorities
core mensk at ft
t hourly11 power
i
A R
\
1
T•^ ——————— *-
10 7
ibeginning of UK end of theunavailability unavailability
time
Figure 1
Since we consider the increase of nsk as a result of the unavailability of acomponent or system in a reactor state (in this case, full power), only the accidentsrelevant to this unavailability and this reactor slate recuire to be studied
3. PRESENTATION OF THE PSA 1300
EDF conducted the project PSA 1300 from 1986 to the end of 1989 (1) (2)
Two aims have been assigned to the PSA 1300 project- evaluation of the probability of damage to the core of reactor unit 3 m the Paluelnuclear power plant, in all reactor states and with a degree of detail as high aspossible,- provision of a computer program for the performance of this evaluation, theLESSEPS software package, in order to produce a PSA with scope fordevelopment (3)
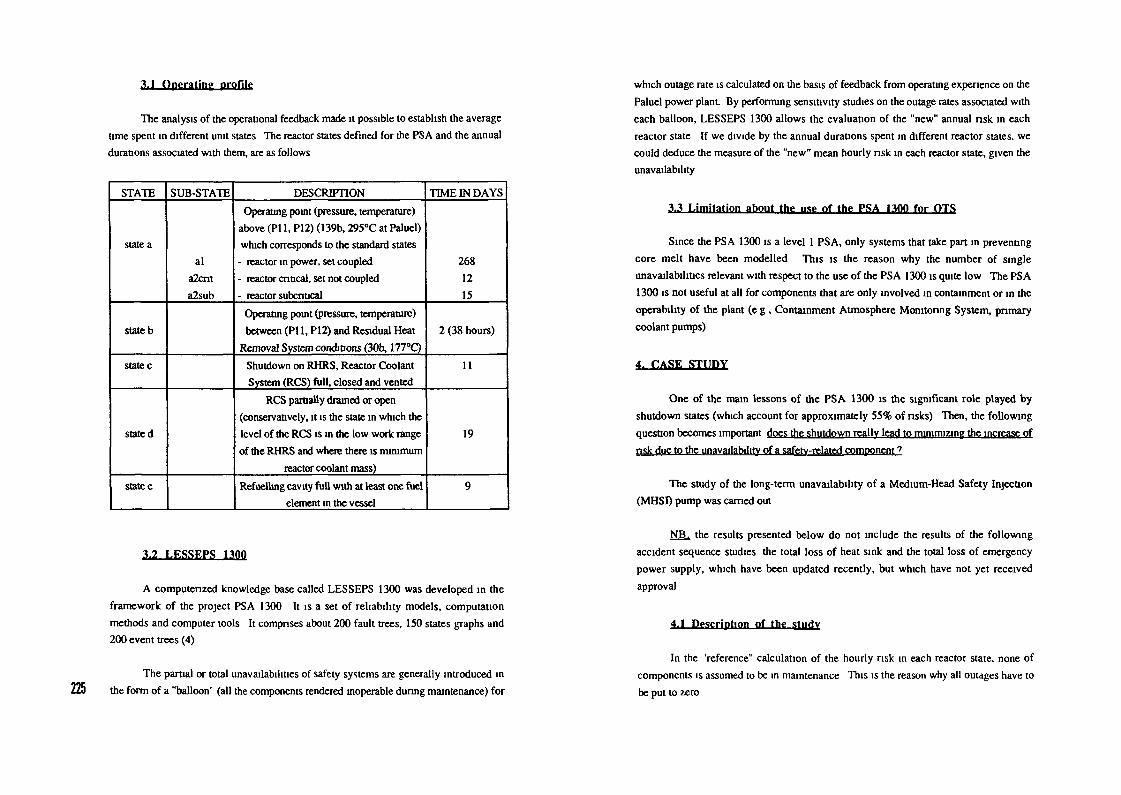
3.1 Operating profile
The analysis of the operational feedback made it possible to establish the averagetime spent in different unit states The reactor states defined for the PSA and the annualdurations associated with them, are as follows
STATE
state a
state b
state c
stated
state e
SUB-STATE
ala2cnta2sub
DESCRIPTIONOperating point (pressure, temperature)
above (PI 1, P12) (139b, 295°C at Paluel)which corresponds to the standard states
- reactor in power, set coupled- reactor critical, set not coupled- reactor subcntical
Operating point (pressure, temperature)between (Pli, P12) and Residual Heat
Removal System conditions (30b, 177°C)Shutdown on RHRS, Reactor CoolantSystem (RCS) full, closed and vented
RCS partially drained or open(conservatively, it is the state in which thelevel of the RCS is in the low work rangeof the RHRS and where there is minimum
reactor coolant mass)Refuelling cavity full with at least one fuel
element m the vessel
TIME IN DAYS
2681215
2 (38 hours)
11
19
9
3.2 LESSEPS 1300
225
A computenzed knowledge base called LESSEPS 1300 was developed in theframework of the project PSA 1300 It is a set of reliability models, computationmethods and computer tools It comprises about 200 fault trees, 150 states graphs and200 event trees (4)
The partial or total unavailabilities of safety systems are generally introduced inthe form of a "balloon' (all the components rendered inoperable during maintenance) for
which outage rate is calculated on the basis of feedback from operating experience on thePaluel power plant. By performing sensitivity studies on the outage rates associated witheach balloon, LESSEPS 1300 allows the evaluation of the "new" annual nsk in eachreactor state If we divide by the annual durations spent in different reactor states, wecould deduce the measure of the "new" mean hourly nsk in each reactor state, given theunavailability
3.3 Limitation about the use of the PSA 1300 for OTS
Since the PSA 1300 is a level 1 PSA, only systems that take part in preventingcore melt have been modelled This is the reason why the number of singleunavailabilities relevant with respect to the use of the PSA 1300 is quite low The PSA1300 is not useful at all for components that are only involved in containment or in theoperability of the plant (e g , Containment Atmosphere Monitoring System, pnmarycoolant pumps)
4. CASE STUDY
One of the mam lessons of the PSA 1300 is the significant role played byshutdown states (which account for approximately 55% of nsks) Then, the followingQuestion becomes important does the shutdown really lead to minimizing the increase ofnsk due to the unavailability of a safety-related component7
The study of the long-term unavailability of a Medium-Head Safety Injection(MHS!) pump was earned out
NB. the results presented below do not include the results of the followingaccident sequence studies the total loss of heat sink and the total loss of emergencypower supply, which have been updated recently, but which have not yet receivedapproval
4.1 Description of the study
In the 'reference" calculation of the hourly risk in each reactor state, none ofcomponents is assumed to be in maintenance This is the reason why all outages have tobe put to zero

22ß However, the impact of outages on the results is almost negligible: for example,the risk at full power with the basic outages of the PSA 1300 is about 5.8E-10 /h, whilethe same one without any unavailability is about 5.6E-10 /h.
For each event tree, we calculate the hourly risk for all reactor states associatedwith this event tree.
Particular attention has to be paid to one dilution sequence. For this dilutionsequence, the initiating event is the loss of the main electric power supply (leading to theloss of the primary pumps) during dilution related to the criticallity search after ashutdown.
This criticallity search occurs after a refueling shutdown, or after a hot shutdownor after a cold shutdown if it is the beginning of cycle. Its duration depends on the kindof shutdown. Then, the annual risk associated with this sequence depends on both theannual number and the kind of shutdowns. Moreover, the hourly risk due to thissequence is not the division of the annual risk by the annual duradon of the state "reactorsubcritical".
The hourly result of this sequence is then subtracted from the hourly risk in thestate "reactor subcritical" and put aside.
Supposing the unavailability of a MHSI pump, and putting to one the outage ratesassociated with the balloon of the pump, a sensitivity calculation can be performed.Figure 2 shows the comparison of the results of the "reference" calculation with theresults of this sensitivity study.
COMPARISON OF HOURLY RISKS
IE-7
IE-8
1E-9
IE-10aZcnt aZsub
O reference I MSI pump unavailable
Figure 2
The AOT associated with the unavailability of a MHSI pump can then becalculated using the following relationship:
T = 10-? / (R'al - Ra i)where:T is the suggested AOTR'al is the hourly risk at full power, given the unavailability of a MHSI pumpRai is the hourly risk at full power without any unavailability
T = 10-7 / (1.67E-9 - S.6E-10) = 90 hours
Thus, the AOT associated with the unavailability of a MHSI pump and calculatedwith the current method seems to be about 4 days.
Suppose that the failure of the MHSI pump requires 5 days to be repaired. Thecurrent safe shutdown condition is the intermediate shutdown with the Residual HeatRemoval System (RHRS) valved-out (30b, 177°C). Figure 3 shows the distribution ofthe hourly risks in different reactor states and the evolution of the primary pressure whenthe current OTS are enforced. The specific sequence occurring during a phase of dilutionis included; here, after a hot shutdown, the duration of this phase of dilution is about 2.5hours.
DISTRIBUTION OF HOURLY RISKS FOR OPERATIONS ASSOCIATEDWITH THE UNAVAILABILITY OF A MSI PUMP
powef powef hot ntwnwdsundby shutdown shutdown shutdown shutdown (t- 2 Sh) standby
Figure 3

We can easily notice that, whatever the duration of the unavailability of the MHSIpump may be, the increase of risk associated with operating until the "safe" shutdowncondition is far higher than that associated with remaining at full power or shutting downuntil hot standby. As a matter of fact, by operating until the intermediate shutdown:
- one denies oneself the automatic start-up of the Safety Injection System (SIS)for most of LOCAs, even if this system is partially unavailable;- one increases the frequency of the accident for which the unavailable componentis principally designed, because the isolation valves on the relief lines ofpressurizer are forced open.
4.2 Discussion about results
The PS A 1300 was conducted in order to evaluate the probability of damage to thecore per unit and per year. Thus, some conservative assumptions were kept because theyhad no impact on the annual probability. Here, for risk-based assessment of OTS, weargue about hourly risks. This is the reason why some of those assumptions have had tobe reviewed.
Concerning the case study, the main assumptions are the following ones:
- The rate of primary breaks per hour has been assumed to be equal to that applied at thenominal temperature and pressure. Although this might seem to be a conservativeestimate, most breaks are caused by erosion or corrosion, and are more likely to ariseunder transient conditions than under normal operating conditions. In this respect, therehas been no proof that failure rates are substantially lower at low pressure or lowtemperature than under nominal conditions.
- The success criteria of SIS for a small LOCA are the same during the wholeintermediate shutdown; while in the intermediate shutdown state with the RHRS valved-out, one MHSI pump is not absolutely necessary to mitigate a small LOCA: one out ofthe four safety injection pumps (low-head or medium-head) is adequate to prevent coredamage. Therefore, the failure probability of SIS in the safe shutdown condition is lowerthan in the rest of the intermediate shutdown state.
227
- The time t after which the operators have to start-up the safety injection system inresponse to a break in a steam line of the pressurizer was assumed to be unique in the
whole intermediate shutdown state (i.e., the minimal time corresponding to the upper partof the intermediate shutdown state). Therefore, the probability p of this operator error islower in the intermediate shutdown state with the RHRS valved-out (30b, 177°C: t=2hand p=1.4E-3) than at the upper part of the intermediate shutdown state (139b, 295°C:t=lhandp=4.2E-3).
The previous distribution of hourly risks takes into account the modificationsconcerning the last two assumptions, which are related to the construction of reliabilitymodels.
4.3 Towards a new management of operations ?
For the long-term unavailability considered (5 days), and whatever the currentmanagements of the operations may be (i.e., remaining at full power or shutting downuntil 30b), the probabilistic criterion of 10~7 cannot be respected. The solution could be achange in the way of shutting down.
Using very simplified event trees, let us compare the accident "small LOCA" inthe "safe" shutdown condition and in reactor state a, given the unavailability of a MHSIpump:
initiating event
2.7E-7/H
human error:inadvertent
shutdown of SIS
2.1E-4 (mean value
consequencesfailure of SIS paSLy
i 2F-"* unacceptable3.2E-ÏO/ÏI
unacceptable
Small LOCA in reactor state a
Adding breaks on a steam line of the pressurizer. the overall risk related to a smallLOCA in reactor state a is about 4.2E-10 /h.

228 initiating event breakon a steam line of the
pressunzer(the other small LOCAs
are negligible)
29E-6/h
Small L(
human errorfailure to
operate SIS
14E-3
consequencesfailureofSIS ^^
oc_5 unacceptable* 22E-10A)
unacceptable
)CA in the safe shutdown condition (30b, 177°C)
The overall risk related to a small LOCA in the intermediate shutdown state withthe RHRS valved-out is about 4.3E-9 /h. It is higher than at full power, although thereliability of SIS is better.
Supposing that a Low-Head Safety Injection (LHSI) pump was manually started-up as soon as the reactor is in state b. The risk in the "safe" shutdown condition due tothe accident "small LOCA" would be approximately of the order 10~10 /h. This newmanagement of operations would permit.
- to avoid the non-automatic start-up of SIS,- to profit by the redundancy of the four safety injection pumps.
Thus, the intermediate shutdown state with the RHRS valved-out would be the"real" safe shutdown condition.
4.4 Comparison between the different managements of operations
The duration of the unavailability of the MHSI pump is supposed to be 5 days.
The increase of nsk associated with remaining at full power isSi = ( R ' a l - R a l ) 120
whereR'ai is the hourly nsk at full power, given the unavailability of a MHSI pumpRal is the hourly nsk at full power, MHSI pump available120 is the duration of the unavailability in hours
Si = 1.3E-7
The nsk associated with operating until the return to the initial state (and throughthe current "safe" shutdown condition) is.
82 = £i R'j tj + Ej Rj tj - Rai ( 120 + Zj tj )wherei is the reactor state from power until the safe shutdown conditionR'i is the hourly nsk in state i, given the unavailability of the MHSI pumptj is the duration of nme in state ij is the state from the safe shutdown condition (not included) to return to powerRJ is the hourly nsk in state j, MHSI pump repairedtj is the duration of time in state j
The calculation gives 82 = 8.5E-7
As was planned in figure 3, the current management is not the best one.
Supposing that one LHSI pump was manually started-up as soon as the reactor isin state b. Another calculation gives the increase of risk associated with this arrangement'it is about IE-7 We can notice that the gain (with regard to remaining at full power) isnot very important for this duration of the unavailability of a MHSI pump. This is due tothe nsk during the transient states. The gain would be higher for a longer duration of theunavailability.
S. CONCLUSION
This paper is aimed at demonstrating that the PS A 1300, which is fullycomputenzed and which takes into account nsk in shutdown states, is a powerful tool fornsk-based assessment of Operating Technical Specifications (OTS)
The PS A 1300 emphasized the importance of risk in shutdown states Thecurrent design of reactor units is, m fact, based on the premise that there will be little nskansing in shutdown states Consequently, the majonty of analyses carried out anddesign considerations adopted for systems and automatic equipment have been based onreactors under operating conditions It is therefore essential to consider the increase ofnsk associated with operating from the occurrence of the unavailability of a componentuntil the return to initial condition People involved in PSA area become more and moreaware of this necessity (5) (6)

The computerized PSA represents an overall view of safety of the plant, and not a"system view" of safety. When we consider the increase of risk at full power, only theaccidents at full power impacted by the partial or total unavailability of a safety systemrequire to be studied. But it becomes essential to take into account all the accidents whenwe consider a change of reactor state. For example, considering the unavailability of adiesel generator and the accidents impacted by this component, i.e., essentially stationblackout, the "safe" shutdown condition seems to be the intermediate shutdown. Thus,we "forget" that the unit is, in this reactor state, quite vulnerable towards primary breaks.The computerized PSA does not "forget"...
Thus, it appears that a risk-based assessment of OTS has the potential to bettercontrol plant operational risk compared to a deterministic assessment Nevertheless, it isnecessary to remain modest: there are many factors, physical and operating, that a purelyprobabilistic approach cannot take into account. Moreover, the use of this tool isconfined to a limited number of safety components.
In this paper, a new method, developing at Electricité de France, for risk-basedassessment of OTS has been presented through a case study. The main outlines of thismethod are an evaluation of the core melt hourly risk (due to all types of accidents) indifferent reactor states and an interpretation of results. It can help to determine not onlythe Allowed Outage Time, but also the "real" safe shutdown condition and in some casesthe way of shutting down. However, some improvements in the reliabilistic models inshutdown states have to be made.
REFERENCES
(1) Villemeur, A., Berger, J.P., Dubreuil-Chambardel, A., Moroni, J.M., "LivingProbabilistic Safety Assessment of a French 1300 PWR NPP Unit: Methodology,Results and Teachings", 2nd TÜV-Workshop on Living PSA Application, Hamburg,7th-8th May, 1990.
(2) Berger, J.P., Villemeur, A., De Guio, J.M., "PSA 1300; Results and FutureProspects", International Symposium on the Use of Probabilistic Safety Assessment forOperational Safety, PSA'91, Vienna, Austria (3-7 June 1991).
(3) Ancelin, C., Lucas, J.Y., Magne, L, Bouissou, M., Molinero, J., "LESSEPS or aComputerized Management of Reliability Studies", 7th International Conference
229 Reliability & Maintenability, Brest, France (June 1990).
(4) Ancelin, C., Dubreuil-Chambardel, A., "From LESSEPS 1300 to the Application ofComputerized PSAs to Operational Safety", International Symposium on the Use ofProbabilistic Safety Assessment for Operational Safety, PSA'91, Vienna, Austria (3-7June 1991).
(5) Sandstedt, J., Berg, U., "Living-PSA Applications for a Swedish BWR with the Aidof RISK SPECTRUM", 3rd TÜV-Workshop on Living PSA Application, Hamburg,llth-12thMay, 1992.
(6) Nakai, R., "Application of a Living PSA system to LMFBR", 3rd TÜV-Workshopon Living PSA Application, Hamburg, 1 lth-12th May, 1992.

230 REFUELLING PSA FOR TVO I/II
J PESONEN, R HIMANEN, H SJOVALLTeolhsuuden Voima Oy,OlkiluotoP PYYTechnical Research Centre of Finland,EspooFinland
Abstract
The utility TVO is conducting a comprehensive PSA programme for us two 710 MWe BWRs Theprogramme was initiated by the utility in the year 1984 and the level 1 PSA was taken intoliving use in 1992 including internal transients LOCAs and fires during power operationIn the year 1990 the utility decided to extend the PSA study by the analysts of refuelling, shutdown and start up One reason for the decision was the good operating experience of both unitsThey have continuously exceeded 90 per cent annual capacity factor due to short and effectiverefuelling outages and suffered only a few unplanned shut downsThe Shut-down event PRA (SePRA) required development and application of new methodsbecause the human factors are the main contributor both to the initiating events and the loss ofsafety functions The few studies published were used as a starting point for SePRA The SePRAteam consists mainly of the utility's own personnel completed with an external human errorspecialist
A remarkable effort was put to reveal risks, le. to the qualitative analysis The regularpreventive maintenance tasks in refuelling outages were analyzed and the important tasks wereselected for further studies SePRA team's view a that this is the only way to guarantee adequatecomprehensiveness of the results Besides the severe nuclear risks the utility was interested in theeconomic risks causing significant extension of outagesThe plant spécifie screening of initiators consisted of a study on the incident history and of inter-viewing the plant personnel on selected tasks The incident statistics mainly from Olkiluoto andquasi similar ABB delivered plants were classified according to a draft initiator list The list waslater used in the assessment of initiator frequencies The operating experience from other BWRsreceived, e g , from NEAIIRS reports was found to be less useful due to different design of theplants
The qualitative analysts produced three types of initiators LUCs Leakages Under Core topLOCs Leakages Over Core top and LRHRs Loss of Residual Heat Removal Apart from these,special studies were carried oui for the unwanted local criticality events for the over-pressurisation of the reactor when steam lines filled with waler for the heavy loadtransportation in the reactor hall and for the transients during short periods with not mertedcontainment The annual core damage risk from the refuelling outage is of the same order ofmagnitude as the risk from the power operation The dominant risks ranked by SePRA weredecreased in several ways For example the preparedness to close the lower personnel accessduring the main circulation pump overhaul was increased by two specially trained guards Themodifications decreased the core damage frequency during refuelling by about 70 per cent It isforeseen that the SePRA will form a basis of the procedure enhancement for the low powerstales
I Introduction
Teolhsuuden Voima Oy (TVO) operates two 710 MW ABB Atom type BWRunits on the west coast of Finland TVO I was connected to the national gnd in1978 and TVO II m 1980The utility is conducting a comprehensive PSA programme for its two plants /I/The programme was initiated by the utility in the year 1984, and the level 1 PSAwas taken into living use in 1992 /2/ including internal transients, LOCAs andfires during power operation In the year 1990 the utility decided to extend thePSA study by the analysis of refuelling, shut down and start up One reason forthe decision was the good operating experience of both units They havecontinuously exceeded 90 per cent annual capacity factor due to short andeffective refuelling outages and suffered only a few unplanned shut downsConducting the refuelling in almost m minimum time requires tight coordinationbetween parallel activities going on in three shifts During the refuelling periodnumerous subcontractors, overtime and reduced safety barners on the plant itselfare assumed to be nsk increasing factors The Shut down event PRA (SePRA)required development and application of new methods because the human factorsare the main contributor both to the initiating events and the loss of safetyfunctions The few studies published were used as a starting point for SePRA,e g, /3, 4/ The SePRA team consists mainly of the utility's own personnelcompleted with an external human error specialistSePRA consists of operating modes lower than 8 % of nominal power Theseoperating modes are
1 Cold shut-down2 Hot shut-down3 Start-up4 Hot standby7 Refuelling
( reactor unpressurized, T < 100 °C)(reactor pressurized or T > 100 °C)( reactor pressure < 70 bar)( reactor pressure 70 bar)
The time duration for these modes has been evaluated as average value throughyears 1986-92, which correspond best at the present state Average refuellingduration is about 400 hours
2. Mam tasks
SePRA was made according to the project plan and procedure /5/ written by theutility and accepted by the Finnish regulatory body (STUK) Project was startedin May 1990 and it will be completed in autumn 1992 The total work done isabout 3 man years The main tasks are in the project are as following
2 1 Background material collection
The background material collection included documents, which are needed indifferent tasks during refuelling, for example TVO s operation, test and maintenance procedures, time tables for refuelling etc

2.2 Assessment of operation experience
The plant specific screening of initiators consisted of a study on the incident his-tory and of interviewing the plant personnel on selected tasks. The incident statis-tics mainly from OIkiluoto and quasi similar ABB delivered plants were classifiedaccording to a draft initiator list. The list was later used in the assessment of ini-tiator frequencies. The operating experience from other BWRs received, e.g.,from NEA/IRS reports was found to be less useful due to different design of theplants.
2.3 Analysis of operational, test and maintenance procedures
The utility's maintenance specialists skimmed through the regular preventivemaintenance tasks in refuelling outages and selected 16 groups of tasks to be fur-ther studied by interviewing techniques. A thorough step by step analysis of eachtask was performed using a structured questioning form called the "Human ActionDeviation Analysis' (HADA). Special attention was paid to potential confusion ofcertain task steps and of different tasks, to ways to detect the deviations, to conse-quences and to remarks mainly dealing with difficulties in the coordination andwith possible measures to reduce the risks. Another questioning technique calledthe 'Analysis of Test Influence' (ATI) was developed for the analysis of tests.Apart from the points included in the HADA, the ATI technique emphasises alsothe overriding of safety device, the restoration process and the completeness di-mension of a test. A remarkable effort was put to reveal risks, i.e., to the qualita-tive analysis. The SePRA team's view is that this is the only way to guaranteeadequate comprehensiveness of the results.
231
2.4 Determining initiating events, event trees, success criteria and modelling
Besides the severe nuclear risks the utility was interested in the economic riskscausing significant extension of outages. Therefore six plant damage states weredefined:
1) Mechanical fuel damages2) Local criticality3) Overheating of concrete constructions4) Core uncovery5) Spent fuel uncovery6) Severe core damage.
The qualitative analysis produced three types of initiators: LUCs Leakages UnderCore top, LOCs Leakages Over Core top and LRHRs Loss of Residual HeatRemoval. External initiators were not included to the analysis at this stage.The LOCs and LUCs were divided into five classes according to thecompensating water pump capacity available, see Table 1. Physical analyses weremade for determining the mass flow of water in different type of leakages.
Table 1. Classified leakage diameters ( LUCs and LOCs).
Leakages under core (LUC)
LUCOLUC1LUC2LUC3LUC4
140 mm < D <89 mm < D <59 mm < D <42 mm < D <
D <
198mm140mm89mm59mm42mm
Leakages over core (LOG)
LOCOLOCILOC2LOC3LOC4
234 mm< D <149 mm < D <100 mm < D <70 mm < D <
D <
332mm234mm149mm100mm70 mm
Available systems for supporting water inventory in the reactor and fuel pools ascompensating water are presented in Table 2.
Table 2. Additional water capacity.
System
323,core spray system
327.auxiliary feed water system
861,firewater system
733,demineralized water system
Total capacitykg/sec
4x125
4 x 22,5
100
5 + 60
Reservoir capacitywithout additional water
1700
900
2500
420 - 570
The LRHRs were classified according to the required compensating decay heatremoval capacity. Fig.l. illustrates different stages for residual heat removalduring low power operation and refuelling. Shut-down cooling system and poolcooling system are available for residual heat removal. Shut-down cooling systemis used in the beginning of refuelling. Pool cooling system has been modifiedmore efficient by adding extra heat exchanger line. This enables taking of poolcooling system earlier in operation, about for days after shut-down and to beginthe maintenance of shut-down cooling system .

232 A
BCL
A :
B :
cDE :
FGH
F G
Plant shut-down, power operation PSAPlant shut-down, low power operation,Refuelling, pool cooling not available,Refuelling, decay heat production high,Refuelling, decay heat production lower,Refuelling, pool cooling not available,Plant start up, low power operation.Plant start up, power operation PSA
TIME
(LRHRO)(LRHR1, LRHRla)(LRHR2, LUCs and LOCs)(LRHR3)(LRHR1)(LRHR4)
Fig 1 RHR stages during low power operation and refuelling
The decay heat rate, the configuration of the safety systems and the potential toloss the safety systems vary in the course of the refuelling outage Therefore thelow power period was divided into sub phases and the safety function successcriteria were defined for each of them The low power incidents allow enoughtime for manual operations and thorough planning of recovery actions with onlysome exceptions- In case of largest possible LUCs during the Primary CirculationPump overhaul there is less than one minute time to close the lower containmentpersonnel access
The SePRA initiating event frequencies are low, see Table 3, when comparedwith transients in power operation mode but the weaker safety barriers cause aless narrow safety marginal, too Initiators for LUC1 and LUC2 were notidentified
Apart from these, special studies were earned out for the unwanted local cnti-cality events, for the overpressunsaüon of the reactor when steam lines filled withwater, for the heavy load transportation in the reactor hall and for the transientsduring short periods with not inerted containment
Event tree technique was used for leakages under and over core and losses ofresidual heat removal Similarly, the explicit modelling of, eg, the sequencesleading to unwanted local cnticahty required different modelling perspective
Table 3
Leakaçes under core
Leakages over core
(H)(H)(L)(H)(L)(H)(H)
Loss of residual heat removal
CodeLUCOLUC1LUC2LUC3LUC4
Code
LOCOLOC1HLOC1LLOC2HLOC2LLOC3LOC4
CodeLRHROLRHRlaLRHR1LRHR2LRHR3LRHR4,
Freauencv fl/al18E-6
49E-433E-3
Frequencv U /a)
2 4 E 45 5 E 320E-331E-24 0 E 324E-487E-4
Frequency fl/al47E-22 9 E 212E-236E-264E-2
includes to LRHRO
H = leakage over 2 2 m of core gndL = leakage under 2 2 m of core gnd
Task interaction matrix was used to identify coordination errors and to manifesttheir nsk contribution Its is similar to the confusion matrix approach but thethinking is extended to maintenance tasks Barrier model illustrates the dif-ferences in the safety barriers during different plant operational modes In therefuelling outage the human initiated safety function is often the only bamerwhile neither containment nor automated functions do existChronological phase diagram can be used to illustrate explicitly latent errorsequences and accelerating event courses /6/ Physical parameters and real timescale can be used at the same image to clarify the situation The diagram wasutilised in the analyses of unwanted cnticahty events, see Fig 2 Method is stillunder development

CHRONO1X3GICXL PHASE MODEL
Control tod replacement
O.OOE-0LOCAl CBTNCAUrYatom
Loading old fuel
O.OOE-0
Loading ol new fuel
0.r(0.rx-Y)
Refueling vef ificciion
Deviation0.1'XT O.OOE-0
OJOOE-O ^ FUEL BUNDLEVERIFICATION
OJOOE-O orx-YLOCAL OBTlCAUrrEKVUUD
flat deviation: Second deviationA control rod remains A reloading error inunloaded Into core me same aperce»
0.9- OO.rx-Y)
Normal operation:The super eel boding isfinished normaly withnew fuel
Time
vérification:No more refuellingoperations
Fig. 2. Chronological phase model.
2.5 System analysis and fault tree modelling
The main difficulty encountered in the drafting of event tree models was the lackof written emergency procedures for refuelling period. Fault trees made for poweroperation were used as starting point for modelling. However extensive modifi-cations were required before linking in low power operation event trees, becausetheir initial conditions and use are different in shut-down state. For example,stand-by systems may be already operating in a RHR state and nearly all the au-tomated functions are overridden. These observations led to an extensive modifi-cation of system models. Also the CCF model of 4-train systems with 2 trainsprohibited during refuelling requires further investigation.
233
2.6 Reliability data
Human reliability data was based on operating statistics and engineeringjudgement. Unfortunately, the plant simulator does not give opportunities forlarge scale utilisation in a refuelling state and cannot be used to generate humandeviation probabilities. Thus, the idea was to use plant specific historical data,when available, and subjective consistent screening values. The principle wasfollowed when assessing human action probabilities for both initiating events andfor recovery actions.
For each quantified human act, a verbal description highlighting thoseperformance shaping factors mostly affecting the case is provided. Thebackground of the used estimate can, thus, be in each case checked and argued.This is an important aspect that should be included in every human error analysis.
Equipment failure rates are based mainly on the same source (T-Book) /?/ aspower operation. The T-Book contains plant spesific data of TVO NPP.
2.7 Quantitative analysis
Small event tree - large fault tree technique was used to describe and calculatedesired sequences. Altogether 15 event trees were made, three for leakages undercore 1, seven for leakages over core and five for losses of residual heat removal.Sensitivity and uncertainty studies are not yet finished. The SPSA /8/ code onPC (386) is used for calculations.
2.8 Analyzing the results, modifications, reporting
The human deviations dominate all other initiating event classes, except the smallLOG. The annual core damage risk from the refuelling outage is of the same orderof magnitude as the risk from the power operation. The dominant risks ranked bySePRA were decreased in several ways. The preparedness to close the lowerpersonnel access during the main circulation pump overhaul was increased by twospecially trained guards. Mechanical cotter pin was installed at the maincirculation pump propeller plugs to prohibit inadvertent lifting of the plug. Theuse of auxiliary feed water piston pumps for reactor filling is no morerecommended to prohibit cold overpressurization. Pool cooling capacity wasincreased, capping of S/R-valves was given up and the inspection routine ofcontrol rods was modified in parallel with the SePRA but initiated earlier. Themodifications decreased the core damage frequency during refuelling by about 70per cent. The final report of refuelling is in preparation and it will be finalised inthe end of September 1992.
3. Conclusions
The Shut-down event PRA (SePRA) study has contributed to the reassessment ofoutage safety level at the TVO NPP. The study demonstrates the position ofhuman actions, which form the largest accident sequence initiator group. Sincethere are very few automated safety systems for an outage, the human actionforms an important part of barriers between an initiator and unwantedconsequences. The results of the PRA study have already resulted in actions andthey may further lead to procedural changes and completition of the shutdownTechSpecs.

234 REFERENCES
/!/ Himanen, R Toivola A , PRA Program on NPP TVO PSAM, Los Angeles, February 1991
121 Himanen, R , Vauno, J , Virolamen, R Introduction of Living PSA in Finland - Cooperationbetween Utilities and Authorities 3rd TuV-Workshop on Living PSA Application, Hamburg,May 1992
/3/ Kiper & al, Seabrook Station Probabilistic Safety Study Shutdown (Modes 4, 5, and 6) NewHampshire Yankee, May 1988
/4/ Bnsbois & al, Probabilistic Safety Assessment of French 900 and 1,300 MWe Nuclear PlantsRevue Général Nucléaire, International Edition - Vol B - December 1990
151 Himanen, R, Project Procedure for SePRA (in Finnish), Teolhsuuden Voima Oy, 1990
161 Pyy, P, Human Factors m Scheduled Production Outages, 7th Symposium in Loss Preventionand Safety Promotion m the Process Industries, Taormma, Italy, May 1992
HI ATV-kanshet, Studsvik AB, Tillfbrhghetsdata for komponenter i nordiska kraftreaktorer (inSwedish)
/8/ I Niemela, STUK living PSA code (SPSA), International Symposium of Use of ProbabilisticSafety Assesment for Operational Safety, PSA'91, Vienna 3-7 June 1991
PSA APPLICATIONS ON A SWEDISH BWRWITH THE AID OF RISK SPECTRUM
J SANDSTEDTRELCON AB,Solna, Sweden
Abstract
This paper describes a part of the work conducted within the joint Nordic project"Safety Evaluation, NKS/SIK-1" The project deals with Living PSA (LPSA) andSafety Indicators
An LPSA model has been developed for the Oskarshamn 2 BWR, and the PSAsoftware Risk Spectrum has been used to build the event tree and fault tree modelsand to perform all calculations This LPSA model has been used in several differentapplications
Risk follow-up with the operating year 1987 as an exampleEvaluation of Allowed Outage Times (AOT) and comparison with existingLimiting Conditions of Operation (LCO)Evaluation of test intervals and comparison with existing TechnicalSpecifications (TS)
The different applications are described including assumptions, methods and results
The results show that the LPSA methods are useful within the application areasthat have been studied
In all types of LPSA applications, the following items have been found to beimportant
The completeness and realism of the model and data are very important,much more so than in regular PSAsThe software is very important for the possibility to perform the calculationsinvolved in various applications It must allow modifications of model anddata that reflects the changes in plant configuration and status and it must besufficient!) powerful to allow calculations within a reasonable time frame andwithout simplifications that could invalidité the results
1 INTRODUCTION
This report describes a pin of the work conducted w i t h i n the joint Nordic projectSafety Evaluation NKS/SIK 1" The project deals with Living PSA (LPSA) and
Safety Indicators

Under a contract with the Swedish Nuclear Power Inspectorate (SKI) and OKG(the utility), RELCOM has developed a plant specific LPSA model for theOskarshamn 2 BWR using the existing level 1 PSA as a basis This LPSA modelhas been used in conducting several application studies These applications are
Risk follow-upEvaluation of allowed outage timesEvaluation of test intervals
The report consists of the following parts
Description of the LPSA model (section 2)Presentation of the different applications (sections 3-5)Description of model limitations (section 6)Conclusions and recommendations (section 7)
2 MODEL DESCRIPTION
The following description deals only with the modifications and additions that havebeen made in the LPSA model compared to the normal PSA model
2.1 THE EXTENT OF THE MODEL
The extent of the LPSA model is roughly the same as for the normal PSA modelThe model is developed with the aid of the PSA software Risk Spectrum PSA /!/
The initiating events considered are LOCAs, transients and inadvertent isolationsFor each initiating event, an event tree has been developed The function events ofthe event tree are directly connected to fault trees in the Risk Spectrum model,which allows direct evaluation of sequences by the fault tree linking method
The system level modelling is somewhat more comprehensive than in a regular PSAmodel The main reason for this is to remove unnecessary conservatism due tomodel simplifications, and thereby creating a more realistic model also for caseswhere components are already out of service
Each system is modelled by a single system fault tree These "generic" system faulttrees include house e\ents (also called boundary conditions in Risk Spectrum),which can be used to modify the fault tree logic for different situations These houseevents are, e g, used to activate variations of the system fault tree to be used fordifferent initiating events They are also used to "switch in and "switch out"components or trains in a system to model different system configurations pipealignments etc The house events and the wa> thev can be controlled in RiskSpectrum makes it possible to build very flexible fault tree/event tree models whereU is easy to "trigger" a particular set of house events to reflect a particular plantconfiguration a particuhr initiating event etc
235
2.2 SPECIFIC MODELLING IN Tilt I I'SA
The models that are used in the regular PSA need to be modified to lake intoaccount the possibility to change system configurations The following sectionsdescribe the model modifications made on the component, system, and initiatingevent levels, respectively
2.2.1 Component Level Modelling
The component models in the LPSA should take into account the effect of varioustypes of events and actions such as tests, actual demands, failures and maintenance
Tests
Tests are made to verify the operability of components, sub-systems or systems Atest will reveal the failures that have occurred after the last time the component wasoperated To model the unavailability of periodically tested stand-by components,the following model is used
q(t) = Unavailability for periodically tested componentq0 = Tune-independent failure probability per demandXrt, = Stand-by failure rateth = Last test moment
The unavailability thus has one. time-dependent part, and one part which isindependent of time The unavailability immediately after a test is equal to thetune-independent part, q„
The failure data used in the study are mainly taken from the T-Book", theReliability Data Book for Nordic Nuclear Power Plants /2/ The data in thisreference are estimated to fit to a model such as the one described above
A simplification in this model is that the test efficiency is assumed to be 100% (i eall failures are revealed by the test) This is not entirely realistic, but anotherassumption would make the model more complicated and there is also a lack ofdata regarding test efficiency
In the Risk Spectrum model the periodically tested components are modelled by"Reliability model 4 (fixed mission time) where the parameter TM (mission time)is used to represent the time since last test It should be noted that this type ofmodelling is used because it provides a simple way of implementing a parameterthat direct!) represents time since last test Normall) in Risk Spectrum there isanother special model for periodically tested components

236 To prepare for a quantification of core damage frequency (CDF) at a particulartime point the time since last test has to be specified for all tested component (orrather for the basic events representing those components) This maj seem to be anextensive task but the parameter treatment in Risk Spectrum makes it relativelyeasy to carry out such a chance The components (basic e\ents) are grouped if theyare always tested at the same time (e g if they are in the same train) All of thebasic events in the s ime "test group" are assigned the sime TM p.ir imeter Tochange the time since last test for the group, only one parameter needs to bechanged, instead of updating many individual basic event data sets
In a regular PSA, periodically tested components are often modelled with a constant(average) unavailability The advantage with the time-dependent modelling is thateffect of tests can be evaluated m any given situation
Actual Demands
An "actual demand" means that the components/systems are activated to fulfil amission It could be the intermittent, but completely normal, operation of a coolingsystem or the operation of a safety system after the occurrence of transient in theplant
The actual demands are credited as tests of systems and components in the LPSAmodel This provides for a realistic modelling of intermittently operating systemsand for systems where the configuration is changed periodically
The probability of failure during operation after a transient - must also beconsidered for stand-by components to make the model realistic This probability iscalculated according to the following formula
q = 1 - exp(-X.*7M)
q = Probability of failure during operationim = Failure rate in operationTM = Mission time
Failures and Maintenance
In LPSA applications there is often a need to model failed components
For components modelled with a time independent probability per demand, theprobability is set to 1, in risk follow-up applications for the entire time period thecomponent has been unavailable (or has been assumed to be unavailable) This isnormally the time interval from last successful test until completed repair
For components modelled with a time dependent unavailability the unavailability iscalculated according to the following formulas in risk follow up applications
9(0 -
q(t) = Probability of an existing failureq0 = Probability per demandAsb = Stand by failure ratet, = Time since last testTl = Test interval
For risk monitoring/risk control applications failures are modelled by setting theprobability to 1 for the time period the f ulure has been known i e norm illy fromthe lime the failure is discovered until completed repair
Maintenance activities are modelled by setting the probability to 1 for the"maintenance basic events" during the time interval where there is ongoingmaintenance These "maintenance basic events" have a probability of 0 at all othertimes
In a regular PSA, there are normally no assumed states of components ormaintenance activities All of these possible events are modelled by basic eventswith different types of probabilistic models
One problem with the different types of models described above for LPSAapplications is that if the current risk results are plotted in a diagram and the curveis used to calculate "integrated" risk measures, these integrated results will besystematically overestimated The reason for this overestimation is that the failuresare "double-counted", both as normal unavailabilities (when the component is notknown to be failed) and by setting the unavailability to 1 when the component isknown to be failed
222 System Level Modelling
While the previous section focused on individual component modelling, this sectionfocuses more on system level aspects There are two important modelling featuresthat will be covered CCF modelling and modelling of system configuration changes
CCF Modelling
In the current LPSA applications, a modified version of the MGL method /3/ hasbeen used This modification is called "the minimum-value variation" /4/ and itworks in the following way
Each CCF event involves two or more components Of all the components in aparticular CCF event, the one with the lowest independent failure probability isused as a basis for calculation of the probability for the CCF event An exception tothis rule is the situation where a failure exists, or may have existed (in risk follow-up) among the components involved in the CCF event If this is the case it is theprobability of the existing failure that is the basis for the CCF probability Forexample, if one component is known to be failed (probability = 1) the probability ofa second component failure is p until the state of those other components havebeen verified

One result of this modelling is that when a test is made for one component in aCCF group, the probability for all CCF events involving the component becomeequal to the time independent CCF probability
System Configuration Changes
In the plant which has been studied there are a number of systems which areincluded in the PSA model and for which there are different possible configurationsE g, there are systems with two redundant trams and normally one tram is inoperation and one is in stand-by To get a model that accurately reflects the currentCDF, there must be a way to "switch" between variations of the model that reflectthe various possible tonligurations.
This is accomplished by modelling all possible system configurations in the faulttrees, and then using house events that can be switched on or off (TRUE orFALSE) to control which configuration is currently used The implementation ofhouse events and the ways they can be controlled in Risk Spectrum allows this to bemade easily
This can be compared with the modelling in a regular PSA, where it is mostcommon to model only a single configuration alternative (the most usual one or theone that leads to the most conservative model.
2.23 Initiating Event Modelling
All initiating events are modelled with basic events where the quantitative data is interms of frequency An exception to this is in risk follow-up studies when aparticular initiating event has occurred In such a case, the current core damageprobability (CDP) is calculated given the occurrence of that initiating event
In the same way, and for the same reason, as described for component modelling(section 221) this initiating event modelling leads to an overestimation ofintegrated risk measures
3 RISK FOLLOW-UP
The purpose of conducting a risk follow-up study is to evaluate the risk significanceof events that have occurred in order to improve the experience feed-back
Four different methods to carry out risk follow-up have been identified within theNKS/SIK-1 project These methods are
Off-line risk monitoringRisk follow-up with failure memory onlySafety margin follow-upAccident sequence precursor follow-up
These methods are described in the report "Risk measures in living-PSA23/ applications" /5/
The application presented here is carried out according to the method "Risk follow-up with failure memory only", a method which is quite similar to "Accidentsequence precursor follow-up" The risk follow-up study covers an entire operatingyear(1987)
3.1 DATA SOURCES
To carry out a risk foUow-up study over a time-period there is a need to ha\e dataabout failures, disturbances, tests etc th.it have an influence on the current risklevel The data sources used in this LPSA are described below
3.1.1 Licensee Excnt Reports (LERs)
The LERs is one of the most important sources of data in risk follow-up studiesDuring 1987, the year that was studied, there were 43 LERs reported for the plantunder consideration, and 11 of those affect the core damage sequences included inthe LPSA model The year 1987 was selected because it seemed to be an"interesting" year from this point of view with more significant occurrences than anormal year.
3.12 Disturbance Records
To get information about plant shut-downs, both planned and caused by transients,the plant disturbance records have been used During 1987, there were 3 plannedshut-downs and 3 scrams.
3.13 Test Records
The test records is another important data source All tests that are requiredaccording to the plant's Technical Specifications are documented in test recordsThose records contain information about which test was made, at what time-pointthe test was made and the outcome of the test
3.1.4 Plant Operating Procedures
The plant operating procedures contain information about test procedures, i ewhich components are activated at each test Instead of going through the plantoperating records to find information about the exact time-points for systemreconfigurations, the operating procedures were also used to find out how and whensuch reconfigurations are normally made (sufficient for this example application)
3.2 ASSUMPTIONS
The assumptions made specifically in risk follow-up studies mainly have to do withinterpretations of LERs One example of a problem is to conclude whether acertain failure may potentially have been a CCF or not

238 33 METHODS
Since the LPSA is modelled with the PSA software Risk Spectrum this section willmainly discuss how the Risk Spectrum modelling and analysis features were used incarrying out the risk follow up
The description of methods is divided into the two sub sections modelmodifications and "analysis"
33 1 Model Modifications
Step 1 System confieuration modelling
The first step is to specify the house events that are to be set to TRUE to "switchin" the model variation that covers the particular plant configuration at a giventime point Only the house events that should be TRUE need to be specified, allothers are set to FALSE by default
Step 2 Test modelling
The second step is to update the "time since last test" value (the TM parameters)for all periodically tested components The model for those components is accordingto section 221 When determining the tune since last test, also real demands andother activations of components beside the scheduled tests, are regarded as tests mthe sense that they verify the operability of the component
The functions in Risk Spectrum make it easy to update the time since last test forall components affected by a certain test as a group
For components involved in CCF groups, and for which tests of all components inthe group are not made at the same time (staggered testing), the TM-value used isthe shortest of the TMs for the individual components involved in each CCF eventIn other words, each successful test of individual components in a CCF group isconsidered as a successful test against all CCFs involving that component
Step 3 Failure and maintenance modelling
The third step includes modifications due to components that are out of service,either because of failures or because of maintenance
The modification is made by updating the probabilities for all events for whichinformation about failures or maintenance activities is available Some failures canaffect probabilities both for individual component failures and for CCFs involvingthat component If a failure has been discovered at a later time-point this may alsoaffect the estimation of the failure probability for this component at time pointsbefore the failure was discovered See sections 2 2 1 and 222
Ongoing maintenance is modelled by setting the probability to 1 for the basic eventsthat represent maintenance unavailability
33.2 Analysis
Two types of analyses are made in the risk follow up stud) depending on the typeof situation that is analyzed One t)pe of analysis is to cilcuUte the CDF in poweroperation, and the other type u> to calculate the CDP given t h i t an initialing eventalready has occurred
The CDF is calculated by using a top event in Risk Spectrum which analyses allcore damage sequences in all event trees The only data required in the top eventdefinition is to specify the consequence" (plant damage state) to be analyzed (hereit is "core damage") and a cutoff probability (all cut sets wi th a probability belowthis value are truncated)
The CDP given that an initiating event already has occurred is ctlculued byanalyzing all core damage sequences in the event tree for this initiating event Theprobability for this initiating event is first set to 1 The top event definition is thesame as described above, but in this case it is specified that only one particularevent tree is to be included in the analysis
3 4 RESULTS
Diagram 1 shows the CDF (fn = 4 IE 6/year) for the part of 1987 when nocomponent failures occurred Each point in the diagram represents the CDF eitherdirectly before or directly after a test or a system re configuration
RISK FOLLOW-UP OSKARSHAMN 2(TIME WITH NO
f(t)/fn2 ——————————
1,5
1
0,5
yfe jft //'0 ——— • — - —— ———
0 SO 100
jf/
-1987COMPONENT FAILURES)
/$ tA
150 200 250
DAY
/ f!/300
1t l350
Diagram 1

Diagram 2 shows the CDF for the part of 1987 when component failures did occur
RISK FOLLOW-UP OSKARSHAMN 2-1987(TIME WITH COMPONENT FAILURES)
I12
10
8
6
4
2
0(
(t)/fn
-
I 50
fllni ! 1
100 150 200 250
DAY
I 1
•
300 350
Diagram 2
Table 1
239
Component failure
661DG212
661DG212
641SG6
666G222
649G13
649T13
713P1
733P23
661DG212
Date
870121 (10h)
870204 (3h)
870319 (6h)
870714 (16h)
870904 - 870924
870925 - 870930
871009 (8h)
871130- 871203
871208 (16h)
CDP
4.9E-8
1.6E-8
9.0E-9
8.1E-9
9.1E-7
2.2E-7
3.9E-9
48E-8
6 7 E 8
Table 1 present the CDP for each component failure event thai occurred during1987
Diagram 3 shows the CDF during the time-period September 4-24 1987 The CDFis at an increased level during the entire time-period The reason for this is that agas turbine failure \\.is discovered in .1 test September 10 The pre\ious test, \\hichwas successful, for this gas turbine was made August 26 The failure thus occurredbetween August 26 and September 10 The probability that the failure existed at anytime-point between those dates is calculated by using the model described in section2 2 1 (Failures and Maintenance) The failure was repaired on September 10, butthe redundant gas turbine was not tested until September 15 Therefore, the failureprobability for the second gas turbine was modified during this period to include theprobability of CCF given the knowledge that one failure has already occurred Thetest of the second gas turbine September 15 was successful September 24, the firstgas turbine was tested again and failed This time the cause was a failure tocorrectly restore the gas turbine after the previous repair The nature of this failurewas such that it was not judged to be a potential CCF
RISK FOLLOW-UP OSKARSHAMN 2870904 - 870925
f(t)/fn
246 248 250 252 254 256 258 260 262 264 266DAY
Diagram 3
The CDF due to these two failures is 3 5 times higher than normal for a period of20 days The experience feedback from the evaluation of this period could be
Always test the gas turbines after completed maintenanceAlways test the redundant gas turbine directly when a gas turbine has beenfound to be failed

240 'f these ruies had been followed the risk increase would have been only 30% of theincrease that actually occurred
Table 2
Initiating event
TT
TF
TP
TP
TP
TP
Uate
870224
870713
87071S
870731
871009
871227
CDP
1.5E7
3.2E-6
6.0E-8
7.1E-8
6.8E-8
S.4E-8
Table 2 presents the CDP for each initiating event occurrence during 1987
Table 3
Component failure/Initiating event
TF
649G13
649T13
TT
TP
TP
661DG212
TP
TP
733P23
Date
870713
870904 - 870924
870925 - 870930
870224
870731
871009
871009 (16h)
870715
871227
871130 - 871203
Risk contribution (%)
64
18
4
3
1
1
1
1
1
1
Table 3 presents the contribution to risk from the different component failureevents and initiating events that occurred during 1987
EVALUATION OF ALLOWED OUTAGE TIMES
The second LPSA application involves evaluation of alloued outage times (AOTs)according to Limiting Conditions of Operation (LCO) The AOT is the time the
component is allowed to be out of service If the component is not restored duringthis time, the plant must be shut down
When a failure covered by LCO occurs the repair can be rmde with the plant stillin power operation or the repair can be made after shut down ot the plant Whendeciding on the optimum strategy the risk exposure for the t\\o cises should becompared Such calculations can be made for all components cohered b> LCOsBasically, these calculations are made using the same model and the same type ofmodel modifications that were described for the risk follow up calculations insection 3
4.1 ASSUMPTIONS
The assumptions made in this type of application concerns limits on shut-down risk,acceptable risk in continued operation, and acceptable risk per failure
4.1.1 Shut-Down Risk
The two different situations, and associated risks, that are compared in AOTevaluations are
Continued operationShut-down
In both cases the component under consideration is unavailable The shut-down riskhas three components Rjsk at shut-down, risk during the shut down period, andrisk at power-up It is assumed that the shut-down is similar to a manual shut-downfor which an event tree exists in the LPSA model, and only the shut-down itself isconsidered in the quantification This results m shorter calculated AOTs than if allthree phases of a shut-down were to be considered
4.1,2 Acceptable Risk In Power Operation
When the risk in continued operation is compared with the shut down risk oneshould also consider the risk accepted in normal operation (with no known existingfailures and no ongoing maintenance) According to our calculations, the normalCDF varies between 0 51*f„ and l 7*f„ (f„ = 4 lE-6/year) In this application it istherefore assumed that a CDF of 17*f„ is acceptable It should be emphasized thatthis is purely an assumption made for demonstration purposes during this project,and it does not reflect the official view of any involved party regarding what is"acceptable "
4.2 METHOD
The same model modification steps are carried out when analvzmg allowed outagetime (AOT) as in the risk folio« up application (section 3 3 1 ) The only difference

is that here the calculations are always made for one (assumed) component failureat a time
Note that the results from the AOT calculations depend on the current plant statusand configuration If tests are performed or if systems are re-configured the resultscan be different This also means that there are measures available to actively affectthe risk level or, possibly to prolong an AOT m a given situation without having anincreased risk
The AOT calculation is based on the formula
'"t
'«1
AOTff,
PPUX
Allowed outage timeCDF in continued power operationAcceptable CDF in power operation (l 7*f„)CDP for manual shut-downCDP for shut-down periodCDP for power-upPlant configuration
Only the probability of one initiating event shall be considered during the timeperiod AOT when calculating the CDF in continued power operation
The formula is simplified to
AOT-17*/„
4.3 RESULTS
241
The two first diagrams visualizes the operating time that provides an equilibriumbetween the CDF that exceeds the acceptable level, l 7*f„ (f„ = 4 IE 6/year), andthe CDP for a manual shut-down
Diagram 4 shows how the CDF increases from 0 62*f„ to 2 25*fn when a gas turbinefails at day 0 (September 10 1987) The CDf of 2 25*ln assumes that the redundantgas turbine is successfully tested
A manual shut-down given one failed gas turbine and a second redundant onewhich has just passed a successful test, results in a CDP of 6 OE-8
The data above yields the following results
60£-8AOT -(225 - 17)*41£-6
= 2 7£-2 years = 83 days
EVALUATION OF AOT OSKARSHAMN 2FAILURE OF 649G13 (870910)
2.5
2
1.5
1
0,5
0
f(t)/fn
4 -2 0 2 4 6 8 10 12
DAY
Diagram 4
The area in the diagram bounded by the CDF of 17*f„ to 2 25*fq and by 0 to 8 3days represents the same total CDP as the manual shut-down
Diagram 5 shows how the CDF increases from 0 77*f0 to 128*f„ when a battery-backed bus-bar fads (at day 0)
EVALUATION OF AOT OSKARSHAMN 2FAILURE OF BUS BAR G75BL01
140
120
100
80
60
40
20
«t)/fn
» - 2 0 2 4 6 8 10 12 14 16 18
DAY
Diagram 5

242 A manual shut-down, given the same bus-bar failure, results in a CDP of 2 30E-5.
The data presented above yields
AOT 2.30£-5(128 - 1.7
= 44E-2 years = 14 days
The area in the diagram bounded by the CDF of l 7*f„ to 128*f„ and by 0 to 14days represents the same total CDP as the manual shut-down
Table 4 presents a comparison between calculated AOT and the AOT according tothe present LCOs for four different components
Table 4
Component failure
Core cooling pump 323P1
Gas turbine 649G23
Diesel generator 661DG212
Battery-backed bus-bar 675BL01
AOT (days)Living PSA
6
83
4
14
AOT (days)TS
2
302
1
The AOTs according to present LCOs are shorter than the calculated AOTs, exceptfor the gas turbine.
For the auxiliary feedwater system, a failure of single pump resulted in a calculatedCDF that did not exceed 1.7*fn. This leads to unlimited calculated AOTs and ARTs.Another analysis was performed where both auxiliary feedwater pumps failed due toCCF. According to LCO, the plant must be shut-down in this case.
Table 5 present the calculated AOT and the mean repair time (MTTR) for thesepumps. The calculated AOT is longer than the MTTR. A manual shut-down istherefore questionable in the case of failure of both auxiliary feedwater pumps
Table 5
Component failure
CCF auxiliary feedwater pumps 327P1/P2
AOT (hours)Living PSA
6.1
MTTR (hours)
6
4.4 RISK CONTROL
Of primary concern is the possibility to actively control risk in cases where a failurehas occurred, and thereby possibly prolong the AOT. Examples of possible measurethat can be taken to control risk are:
Perform different types of testsTake systems into operationChange system configurations/pipe alignmentsComplete ongoing maintenance activities
4.4.1 Method
The method used when increasing the AOT, given a particular situation, means thatone further step is carried out to identify the most effective risk control measure.The most optimal risk measure is identified by studying the risk reduction worth(RRW) for TM parameters calculated by Risk Spectrum The TM parameters areused to model the time since last test or the time since last re-configuration Thismeans that their RRW values will reflect the possible risk reductions that could beachieved by performing tests or making re-configurations The most optimal actionis selected, and when this action has been accomplished and fed into the model anew calculation is made to find the optimal risk reduction measure in this situation
4.4.2 Results
Diagram 6 presents an example of prolonging the AOT. This example is based onthe gas turbine failure September 10 1987, which has been discussed previously.
EVALUATION OF AOT OSKARSHAMN 2649G13 FAILURE (870910)
AOT (DAYS)
-
*
*
*
16
14
1210
8
.642
5
H
10
— CDF * AOT
Diagram 6

The CDF increases from 0 62*f„ to 3 83*f„ when the gas turbine failure occurs (athour 2). Calculated AOT, according to section 4 2, is in this situation 2 7 days, withno particular measures taken to reduce risk
When the redundant gas turbine is tested, the CDF is reduced to 2 25*fn (shown athour 4 in the figure). The calculated AOT in this situation is 8 3 days In otherwords, the time available for repair of the gas turbine increases by about a factor of3 if the redundant gas turbine is successfully tested
Further selection of the next optimal risk reduction measure results in a test of adiesel generator. If this test is made also, the AOT will be 13 days
Depending on the status of the plant, the optimal risk control measures may bedifferent and the amount of risk reduction possible can also vary E g, if the samegas turbine failure were to occur in the end of an operating year, i e shortly beforerefuelling rather than shortly after refuelling, the results would be that AOT can beincreased from 2.9 days to 7.2 days The reason for this difference is that somecomponents in the plant are tested only at refuelling which leads to a changing riskprofile for the plant over the operating year
243
5 TEST INTERVAL EVALUATIONSThe fourth application conducted during this project was to evaluate the testintervals that are specified in the plant's Technical Specifications and thereconfiguration intervals according to the plant operating procedures The mainpurpose of such an evaluation was to find a way to decrease the number of testsand reconfigurations without affecting the average risk
First, an upper bound of risk level in normal power operation (with no existing{ailures and no ongoing maintenance) is decided. This risk level is selected in such away that the average risk (see below) becomes approximately equal to the averagerisk when tests are performed according to the present Technical Specifications.
5.1 ASSUMPTIONS
In the studied plant the CDF varies between 0.51*f„ and l 7*f„ (f„ = 4 IE-6/year) iftests and reconfigurations are performed according to Technical Specifications (seediagram 7). If the upper bound of CDF is set to l I5*f„, and the proceduredescribed above is followed, the resulting average risk becomes the same as in thecase when tests and reconfigurations are made according to TechnicalSpecifications.
5.2 METHOD
The procedure that was used in this application involve the following steps
I Starting in the beginning of an operating year (after refuelling), the CDF iscalculated each day until it reaches the predetermined upper bound (itincreases due to the time-dependent part of the unavailability for stand-bycomponents, see section 221)
EVALUATION OF TEST INTERVAL OSKARSHAMN 2
f(t)/fn1.8
1.4
0.6
0,250 100 150 200 250 300
DAY
Diagram 7
2. At this time-point, find the test or reconfiguration that has the highest riskreduction worth, and perform this test.
Steps 1 and 2 are repeated through the entire operating year.
It is also possible to change the procedure in different ways, such as.
Acceptance of an increasing average risk over the operating year, to get moreeven distribution of tests over time.Fixed (not varying) test and reconfiguration intervals.One or more test- and/or reconfiguration intervals are fixed at a certainlength regardless of evaluation results
S3 RESULTS
Diagram 8 shows the fluctuation of the CDF when the procedure described above isused.
When following this procedure, the total number of tests and reconfigurations madeduring an operating year is 67 This can be compared with the 117 tests andreconfigurations thai need to be made according to Technical Specifications Thenumber of tests has thus decreased bj -43%, but the average risk is maintained atthe same level

244EVALUATION OF TEST INTERVAL OSKARSHAMN 2
f(t)/fn
50 100 150 200 250 300
Diagram 8
Table 6 present the number of tests according to the described procedure comparedwith the number of tests according to Technical Specifications for a number ofdifferent components and systems.
Table 6
System
Depressurization system 314
Core cooling system 323
Auxiliary feedwater system 327
Gas turbine 649G13
Gas turbine 649G23
Diesel generator 661DG211
Diesel generator 661DG212
Total
Number of testsLiving-PSA
2
13
7
10
9
13
13
67
Number of testsTS
1
10
10
24
24
24
24
117
Table 7 present the variation of test interval lengths over the operating year for thesame components. These values are also compared with the test intervals accordingto Technical Specifications
Table 7
System
Depressurization system 314
Core cooling system 323
Auxiliary feedwater system 327
Gas turbine 649G13
Gas turbine 649G23
Diesel generator 661DG211
Diesel generator 661DG212
Test interval,Max (days)Living-PSA
127
35
54
38
40
30
31
Test interval,Min (days)Living-PSA
115
14
39
30
33
22
18
Test interval(days)TS
170
35
35
14
14
14
14
6 LIMITATIONS
Even though an extensive work has been made to improve the fault tree and eventtree models to make them more complete and to remove conservatism, there arestill many remaining deficiencies and uncertainties
6.1 INCOMPLETENESS
The incompleteness problem has to do with missing parts of the model, i e theentire risk is not covered by the model These can be either known, but excluded forone reason or another, or unknown
The incompletenesses identified so far are all such that it is possible to remove thedeficiencies in the future
Incompletenesses may not only result in anerroneous absolute risk level, it may alsoresult in wrong relative importance for individual failures This may in turn lead towrong decisions based on the LPSA application results It is therefore important toremove as much as possible of all incompletenesses
One very important incompleteness in the LPSA model used currently in thisproject is that it only includes a sub-set of all possible initiating eventsExamples of excluded initiating events that may be significant are fires, internalflooding, different types of common cause initiators, initiating events in otheroperating modes than full power operation

A number of incompleteness issues arise around component failure modes: Somefailure modes are missing, possible dependencies are not modelled, the testefficiency is not 100% as assumed, etc.
62 CONSERVATISM
In many cases, normal PSA models are made with conservatisms built into themodel and data. The reason is usually to simplify the model while at the same timemaking errors on the conservative side. This is acceptable in situations where themain purpose of the calculations is to verify a certain absolute risk level.
In many LPSA applications, however, the conservatisms may lead to wrong relativeimportance and wrong decisions, and thereby in the end leading to non-conservativeactions.
The success criteria used for the different safety functions in the event trees are inmany cases conservative. The conservatisms are of various types. In some casescredit is not taken for safety functions or support functions. Another example is thatrecoveries are not taken into account properly.
245
7 CONCLUSIONS AND RECOMMENDATIONS
The results obtained show that LPSA methods are useful in the applications thathave been investigated:
Risk follow-upEvaluation of allowed outage timeRisk monitoring/risk controlTest interval evaluations
In all types of LPSA applications the following items have been found to beimportant.
The completeness and realism of the model and data are very important,much more so than in regular PSAs. This is due to the fact that an LPSAmodel should cover, and be quantitatively accurate in many differentsituations (e.g. when failures have occurred), and not only in "average". Also,in some cases conservatism in the model may lead to wrong (and possiblyunconservative) decisions.The software is very important for the possibility to perform the calculationsinvolved in various applications. It must allow modifications of model anddata that reflects the changes in plant configuration and status, and it must besufficiently powerful to allow recalculations of all core damage sequenceswithin a reasonable time-frame and without simplifications that couldinvalidate the results. This project has been carried out successfully by usingthe Risk Spectrum PSA software. In the future, it may be even better todevelop a specialized software with functions tailored to allow quick andsimple modelling and quantification. Such a software could use Risk
Spectrum's models, data bases and calculation "engines", but with a userinterface that is tailored to the particular tasks performed in LPSAapplications.
REFERENCES
1 Risk Spectrum PSA Users Manual, RELCON Teknik AB, March 1992.
2 T-book, Reliability Data Book for components in Nordic nuclear powerplants, Version 3, Prepared by ATV-kansliet and Studsvik AB, 1992.
3 Mosleh, A. et al., Procedures for Treating Common Cause Failures in Safetyand Reliability Studies. NUREG/CR-4780, 1988
4 Erhardsson, U-K., Test av nâgra tidsberoende CCF-modeller. Report PK-168/90, VattenfaU, October 1990. (In Swedish)
5 Holmberg, J., Johanson, G. and Niemelä, I., Risk measures in living PSAapplications. Report NKS/SIK-1 (91)38, Swedish Nuclear Power Inspectorate,1992.

246 ALMARAZ PROBABILISTIC SAFETYANALYSIS APPLICATION
M.D. MORALESCN AlmarazE. GUTIERREZUITESA,MadridI. FUENTEE. AgrupadosSpain
Abstract
In December 1990, Almaraz Nuclear Power Plant submitted to the Consejo de Seguridad Nuclear(C.S.N., Spanish Regulatory Body), the review 1 of the Level 1 Probabilistic Safety Analysis (PSA),including a fire analysis. This review included all the C.S.N. comments to the review 0 delivered inNovember 1989, achieving in this way the regulatory body requirements. Some months later, in April1991, die C.S.N. expressed their final approval to the analysis performed.
In this way, a new working tool is now available at the Almaraz Nuclear Power Plant in the safetyfield, complementary to the ones which were already being used in a deterministic way. The new toolincludes a very detailed and systematic analysis of all the feasible initiating events in the plant that mayoccur, together with the response of the mitigating systems against those incidents, taking intoconsideration all kind of potential human mistakes, component failures, unavailability derived from testand maintenance and, dependencies and common cause failures. All this is documented in a systematicand exhaustive way, which allows not only to easily reproduce the whole study, but also to change anyaspect and to review its impact into the results of the core frequency damage, towards to improve thesafety of the plant.
According to the above, this study has been applied at the Almaraz Nuclear Power Plant on a broadway since the conclusion of the PSA, trying to integrate it to the organizational structure and to makegood use of its possibilities as a support tool for decision making in the different aspects concerning tothe safety of the plant.
Nevertheless, the spectrum of potential applications for the probabilistic analysis of safety is verybroad, therefore the possibility of its future increase in number and type is being considered, as far as it isuseful and convenient to the plant.
The most significant applications carried out at the Almaraz Nuclear Power Plant up to now, aredeveloped in the following areas:
Training seminar.Procedure improvements.New preventive maintenance procedures.Data collection.Optimization of Technical Specifications.Setting priorities and optimization of test and maintenance.
Fire analysis.Definition of strategies for safety improvement.
Each application is described in detail in the paper.
1.-INTRODUCTION
In December 1990, Almaraz Nuclear Power Plant submitted to theConsejo de Seguridad Nuclear (C.S.N., Spanish Regulatory Body), the review1 of the Level 1 Probabilistic Safety Analysis (P.S.A.), including a fire analysis.This review included all the C.S.N. comments to the review 0 delivered inNovember 1989, achieving in this way the regulatory body requirements.Some months later, in April 1991, the C.S.N. expressed their final approval tothe analysis performed.
In this way, a new working tool is now available at the Almaraz NuclearPower Plant in the safety field, complementary to the ones which were alreadybeing used in a deterministic way. The new tool includes a very detailed andsystematic analysis of all the feasible initiating events in the plant that mayoccur, together with the response of the mitigating systems against thoseincidents, taking into consideration all kind of potential human mistakes,component failures, unavailability derived from test and maintenance and,dependencies and common cause .failures. All this is documented in asystematic and exhaustive way, which allows not only to easily reproduce thewhole study, but also to change any aspect and to review its impact into theresults of the core frequency damage, towards to improve the safety of theplant.
According to the above, this study has been applied at the AlmarazNuclear Power Plant on a broad way since the conclusion of the PSA, trying tointegrate it to the organizational structure and to make good use of itspossibilities as a support tool for decision making in the different aspectsconcerning to the safety of the plant.

Nevertheless, the spectrum of potential applications for the probabilisticanalysis of safety is very broad, therefore the possibility of its future increase innumber and type is being considered, as far as it is useful and convenient tothe plant.
The most significant applications carried out at the Almaraz NuclearPower Plant up to now, are pointed out in the following pages.
2.- APPLICATIONS PERFORMED
The basic areas in which the applications have been performed at theAlmaraz Nuclear Power Plant are the following:
- Training Seminar.- Procedure improvements.- New preventive maintenance procedures.- Data collection.- Optimization of Technical Specifications.- Setting priorities and optimization of test and maintenance.- Fire analysis.- Definition of Strategies for Safety improvement.
Each application is described in detail in the next paragraphs.
2.1.- Training Seminar
A course has been given to personnel with license upon human actionswith short available time. The purpose of the course was to draw theoperators' attention in relation to the fast performance needed from them Inthese cases.
247
Some illustrating examples are, among others, actions taken forchanges from injection to recirculation of the charging pumps in small LOCA,feed & bleed in small LOCA and realignment from injection to recirculation ofthe RH and SP systems in large LOCA.
Additionally, the most important results and conclusions from the fireanalysis developed have been included in the seminars to the fire brigades,and there is an intention to take into account those results in future firesimulations.
2.2.- Procedure improvements
During the development of the PSA, a systematic review of theprocedures associated to safety related systems and function has beencarried out in order to fit the systems and accident sequence models to theplant's actual operation. Likewise, comments have been made to the initialreviews (rev. A and rev. 0) on symptoms based emergency operationprocedures (EOP's).
As a result of this systematic review of procedures, some of them havebeen altered regarding the following reasons:
* To improve the performance of certain periodical tests, widening itsobjectives (16 cases).
* To guarantee the systems' operability under specific operationalcircumstances (12 cases).
* To correct mistakes and errors regarding equipment denomination, valvealignment, etc. (22 cases).
2.3.- New preventive maintenance procedures
Hie convenience of guaranteeing the periodic test of certaincomponents has been observed in the detailed analysis of systems carriedout. Therefore, new types of maintenance procedures have been designed (6cases).

248 24- Data collection
In the area of data collection and analysis, support has been given tothe definition of different criteria for the development of the Spanish data base(DACNE), regarding the number and type of components to be included asmuch as its physical limits and the failure definition, operation timing and thenumber of demands over such components
Additionally, some accurate comments have been made to certaincriteria established in the SAMO (Operation Aids Computerized System) Thesystem's availability analysis, performed by GE, has been also reviewed
2 5 - Optimization of Technical Specifications
Some applications already carried out as has been the evaluation of theproposal of changes coming from the licensing area and PSA itself, in order toanalyze its impact to the core damage frequency, to determine its feasibilityfrom a safety point of view Some of those applications has been evaluatedand accepted by the regulatory body (C S N )
Examples
* Decrease to a minimum the time needed to put in service the derivation lineof the BIT in case of necessity because of injection failure through the standardpath of injection
* Possibility of mainlining out or service an inverter during 72 hours, if thecritical bus gets energized within a 2 hour period, or two inverters from a samenon operating chain during 24 hours
* Possibility of operating during 72 hours with switchgear room emergencycooling unit, provided that the air temperature in the rooms, measured every 4hours, does not exceed 402 C
26 - Setting priorities and optimization of tests and maintenance
The impact of the unavailability derived from tests and/or maintenanceof the different components, to the global core damage frequency can be veryimportant In this way, as consequence of the PSA results, differentrecommendations have been given to the plant personnel
Among those advices, we should remark the following
To set priorities and to reduce the impact of the motor operated valve testsbased on the importance given to the different valves (Generic Letter 89-10)
- To optimize the maintenances of the turbine driven pump of the AuxiliaryFeedwater System, reducing as much as possible both its frequency and itsrequired maintenance time
27 Fire analysis
Has been performed an analysis supporting the study of fulfilment withthe Appendix R of the 10CFR50, which compnsed the setting of prioritiesamong the fire zones, according to its importance from the PSA point of view,and reanalysis such zones to combine the deterministic and probabilisticcriteria in order to define the fire protection measures that are required to beinstalled in order to fulfil the regulation and to improve the safety of the plant
The analysis has been divided in three parts
The reanalysis of the most critical fire zones from the PSA point of view, withinthe ones involved in the deterministic study of fulfilment with Appendix R
The reanalysis of the rest of the fire zones involved at the above mentioneddeterministic study, and which do not appear as critical in the probabilisticanalysis of fires This analysis justifies the reasons because of which the zonesare not considered as significant from a safety point of view

- The reanalysis of the fires zones not considered in the deterministic study forthe fulfilment with the Appendix R, and which appear to be important accordingto the results of the probabilistic analysis of fires
According to the above considerations, several specific proposals forthe installation of fire protection measures in different zones have been made,which has been reviewed now by the regulatory body (C S N )
2 8 Definition of strategies tor safety improvement
Bearing in mind that the Almaraz Nuclear Power Plant owns two similarunits at the same site, the advantage of this situation could be seizedTherefore, the project has been started defining the strategies for safetyimprovement This has come about with the modification of some procedureswhich allows the use of shared resources between both units or the use ofsimilar equipment between each other, in certain emergency situations
In fact, modifications have been made to the OP1-IF-40 and OP1-IF-41procedures to allow the recovery of water from essential services and ofcomponents cooling water, aligning a pump from one unit to another Thisconsideration has been included into the models developed in the PSA andhas been taken into account for core damage frequency cuantification
249
SUMMARY AND CONCLUSIONS
The probabilistic safety analysis constitute a complete, systematic,detailed and reproducible study of the evolution of transitory events andaccidents in the plant, as well as of the behaviour and importance of themitigating systems in each case, all documented in a precise and consistentway
As explained before, we consider all that to be a very useful tool to bearin mind in the decision making processes, which may affect the safety of theplant for they allow to evaluate the impact of any modification made in the
design or in the procedures, in a global and systematic way, thus analyzing itsincidence at a component level as much as at system level, its sequence ofaccident and its potential damage to the core
Under this prospect, the Almaraz Nuclear Power Plant has alreadydeveloped a number of applications from its Probabilistic Safety Analysis -Level 1-, currently concluded and approved by the C S N These applicationsare expected to continue in the future and to be of use as a support tool toimprove the availability and safety of the plant
Up to now, the most outstanding areas where applications from PSAhave been performed are the following
- Training seminar- Procedure improvements- New preventive maintenance procedures- Data collection- Optimization of technical specifications- Setting priorities and optimizing of test and maintenance- Fire analysis- Definition of strategies for safety improvement
The evaluation of the changes in design has been limited at the momentto the consideration of those modifications that have emerged as aconsequence of the PSA results themselves, without discarding the fact that inthe future some other modifications proposed by different departments withinthe plant may be evaluated from the PSA point of view In this way, theprobabilistic evaluation of safety will be an additional aspect to be taken intoaccount in the decision making process

250 LESSONS LEARNED IN APPLYING PSA TECHNOLOGYTO DIVERSE RISK MANAGEMENT APPLICATIONS
K.N. FLEMINGPLG, Inc.,Newport Beach, California,United States of America
Abstract
Brief overview of various PSAs performed by PLG, Inc. during the last two decades is given. Selectedcase studies in PSA applications are presented. Broad number of specific applications are described.Information related to PSA scope and modelling requirements is also given. The use of dynamic decisionaids for plant operators is pointed out as one of the most promising new developments.
1. INTRODUCTION
During the past two decades, PLG has been deeply involved in the development and applicationof probabilistic methods for safety assessment and risk management of nuclear reactor plants.During this time, PLG has been involved with 33 major probabilistic safety assessment (PSA)projects that have provided opportunities to apply PSA methods to solve real problems. Theseprojects involved mostly commercial light water reactor (LWR) nuclear power plants in theUnited States, but they also included plants in Europe, Japan, and the Republic of China(Taiwan) as well as nonpower reactors at U.S. Department of Energy facilities. The associatedplants spanned a spectrum of different designs and a full coverage of commercial LWR reactortypes that have been designed in Western countries, as indicated in the table below:
Reactor TypePressurized Water Reactor (PWR)• Siemens KWU• Westinghouse• Babcock & Wilcox• Combustion Engineering
Boiling Water Reactor (BWR)Nonpower Reactors
Total
Number
11442
10
233
Each of these projects presented a set of unique problems and challenges to the PSA projectbecause each plant's detailed design and siting features were unique, and each project was
performed for a different purpose. For example, almost half of the PSAs were performed onWestinghouse PWRs with large, dry containments, yet each set of PSA results in this and everyother group revealed plant and specific risk controlling factors. The surprisingly high degreeof plant-to-plant (and reactor unit-to-reactor unit) variability that we have observed in the resultshas shaped our approach to performing the PSAs and has taught us the importance of developingan in-depth understanding of the details of the plant design, the way in which it is operated andmaintained, and the impact that these factors have on the way in which accident sequences caninitiate, progress, and be terminated. As PSA methods and tools have matured, there has beenprogressively less reliance on generic models and databases, and an increased ability to modelthe way they were actually built and to define accident sequences the way they would reallyoccur.
The original purposes of performing these PSAs were essentially unique. Most were unilaterallyinitiated by the plant owners, some were performed to meet a variety of regulatory requirements,but each was required to address a unique set of problems. As a result, the work scopes andlevels of completeness that were required varied. Most of the PSAs included a full treatmentof internal and external events and the development of a plant-specific database. Nearly all wereeventually extended to Level 2 to address containment performance and source terms, and abouttwo-thirds were extended to Level 3 to address offsite consequences of severe accidents. PLGperformed the first PSA of accidents initiated at shutdown (Reference 1), the only full-scopeLevel 3 PSA of shutdown accidents that has been completed to date (Reference 2), and iscurrently involved with shutdown PSA projects on three other plants.
Although each PSA project has been initiated for a different purpose, the vast majority of themhave culminated in a decision by the plant owner to pursue some sort of a 'living PSA"program. The original purposes and the ultimate PSA applications of these programs span avery large number of end uses. Virtually any type of decision making that could impact safeoperation of the plants can potentially benefit from information obtained from a completed PSAor by exercising, in some way, the PSA models and databases developed for the plant.
Listed in Table 1 are major categories of PSA applications that have been or are beingaddressed, specific examples of each category, and some of the implications that theseapplications have on the requirements for the PSA scope and the capabilities of the PSA models.These requirements have shaped PLG's technical approach to performing a PSA as well as thecomputer software that was developed to help implement this approach. This software is knownas RISKMAN*, and is the subject of a companion paper presented at this workshop(Reference 3).
Although many PSA projects were originally performed to address a specific need or decision,a common goal among owners of PSA models is to implement the so-called "living PSAconcept." To achieve "living PSA" status, the transition is made from a one-time assessmentto address a specific issue at a snapshot in time to a dynamic model of risk that is always currentand able to support essentially all decision making during plant lifetime that could impact plantsafety. There are some general requirements that a "living PSA" model must meet to beeffective. These include:
• Up-to-date configuration management.

Ease and speed of update.Flexibility and adaptability.Ability to measure risk significance of decision options.Ability to communicate risk information to decision makers.
With these capabilities in place and in constant use, a greater awareness is achieved of the risksignificance of all activities in reactor design, maintenance, and operations. The most importantresult is an enhanced safety culture among all of those who are involved in the management ofthe plant.
Table 1. PSA Applications and Requirements for PSA Methods
251
PSAApplication
Type
PSAUpdating
DesignEvaluation
MaintenanceOptimization
PerformanceMonitoring
OperationsSupport
EmergencyPlanning
Licensing/Regulatory
Specific Applications
• Plant Experience Update• Design and Procedures Update• Precursor Evaluation• Vulnerability Evaluation• Backfit Optimization* Safety Enhancement
• Technical Specification Changes• Maintenance Prioritization• Root Cause Diagnostics• Outage Risk Management
• "Risk Meter" Concept• System/Component Trending• Plant Scenario Diagnostics• Emergency Procedure
Evaluation• Accident Management• Operator Training• Emergency Planning Zone
Determination• Emergency Action Level
Evaluation• Emergency Plan Evaluation• Seismic Siting Issues• Postaccident Restart Issues• Individual Plant Examinations
PSA Scope and ModelingRequirements
• Ease/Speed of Update• Bayesian Treatment of Data• PSA Configuration Management• Design Visibility in Models• Modularized PSA Models• Ability To Analyze Risk-
Controlling Factors• Explicit Treatment of Test and
Maintenance Impact on Risk• Use of Risk Importance Factors• Treatment of Shutdown Events• Expert Diagnostics Systems• Tie-in to Plant Computer• Graphical Interfaces to PSA• Expert Diagnostics Systems• Adequate Scenario Definition• Explicit Model of Procedures• Extension of PSA to Level 2
• Extension of PSA to Level 3• Explicit Model of Evacuation• Three-Dimensional Dispersion
Models
• Realistic and BalancedTreatment of Seismic Events
• Ability To Identify Weaknesses• Documentation To Support
Successful Regulatory Review
2. SELECTED CASE STUDIES IN PSA APPLICATIONS
To provide a clearer picture of what has been and can be accomplished through effective use ofPSA models and results, we turn our attention to a number of case studies in which PSA hasbeen used to solve real problems. A summary of the plants that provide these examples, somebrief information about the respective PSA models, and a listing of actual PSA applications arepresented in Table 2. Several of the applications that were made for these plants are discussedmore fully in the balance of this paper.
2.1 ZION AND INDIAN POINT PSAS
The purpose of these projects (References 4 and 5) was to provide a basis for the plant owners'response to a petition by the Union of Concerned Scientists to permanently shut down the tworeactor units at each plant due to concerns that they were sited too dose to the metropolitanareas of Chicago and New York City, respectively. At issue in the Atomic Safety and LicensingBoard hearings that were conducted in response to this petition were the following: whether theplant should be permitted to continue operation and whether costly backfits should be installedto reduce the risk of severe accidents. These backfits, which had been proposed from what cannow be safely described as a naive perspective of the nature of severe core damage accidents,included:
• A filtered, vented containment backfit.• A refractory core ladle backfit.• A hydrogen recombiner backfit.
These PSAs were specifically done to determine the safety adequacy of the as-built design ofthese plants in light of the claims made in the petition and to quantify the risk reduction benefitsof the proposed backfits. Due the large stakes involved, it was necessary to advance the stateof the art in PSA of the mid-1970s by incorporating external events and by extending the PSAmethods that were developed in the Reactor Safety Study (Reference 6) to address the risk ofthe industry at large to address plant- and site-specific issues.
The end results of the hearings that followed the completion of these PSAs were quite favorablefor the plant owners as well as for the rest of the nuclear industry. First, the PSA results wereaccepted as a basis to justify continued operation of these plants without the need for .backfits.Second, the PSA results showed that these costly backfits would have a negligible impact onrisk. In fact, after these PSAs, the lively discussion about the merits of such exotic backfits as"core catchers" was largely silenced in the United States. Finally, the precedent was set in thesehearings that PSA results provided a legal basis to resolve regulatory issues. One such issue ondecay heat removal was addressed in a subsequent extension of the Zion PSA by performing thefirst PSA of accidents initiated at shutdown (Reference 1).

252 2.2 SEABROOK STATION PSA
The Seabrook Station PSA (Reference 7) was originally performed as an independent safetyassessment to help resolve a hotly contested licensing issue for this plant, which seemed to bethe focus of intervenor efforts to stop nuclear power after the resolution of the Zion and IndianPoint hearings. At the late stages of the licensing proceedings, the Governor of Massachusetts
Table 2. PSA Applications at Selected Nuclear Power Plants
Plant Name/Description
Zion Unit I/Indian Point
• Westinghouse PWR• Large, Dry ContainmentSeabrook Station
• Westinghouse PWR• Large, Dry Containment
Beznau
• Westinghouse PWR• Large, Dry ContainmentDiablo Canyon
• Westinghouse PWR• Large, Dry ContainmentBeaver Valley
• Westinghouse PWR• Subatmospheric
ContainmentSouth Texas Project
« Westinghouse PWR• Large, Dry Containment
Kuosheng (Taiwan)
• General Electric BWR• Mark ni Containment
PSA Model and Scope(Reference)
• Level 3 PSA (4,5)• External Events• Multiple Designs
Modeled• Level 3 PSA (7,8,9)• External Events• Extended To Shutdown
Modes (3)
• Level 2 PSA (10)• External Events• Multiple Designs
Modeled• Level 2 PSA (11)• External Events with
Extensive SeismicTreatment (IPEEE)
• Level 2 PSA (12)• External Events Planned
in Individual PlantExamination for ExternalEvents (IPEEE)
• Level 2 PSA (13, 14)• External Events• Detailed Test and
Maintenance Models
« Level 3 PSA (15,16,17)• External Events• Three-Dimensional
Dispersion Model
PSA ApplicationsIssues Addressed
• Shutdown Petition Denied« Cosdy Backfits Rejected• PSA Results Accepted in
Legal Proceedings• Emergency Planning Risk• Accident Management• Outage Risk Management• Individual Plant Examination
(IPE) Requirements• Technical Specification
Changes• Guided Major Backfits• Cost of Meeting Backfits
Greatly Reduced
• Resolved Earthquake SitingIssue
• IPE Requirements
• Risk Prioritization ofEquipment Maintenance
• IPE Requirements• Precursor Evaluation
• Design Enhancement• Complete Overhaul of
Technical Specifications« Graphical Interface for Risk
Management• Baseline Risk Profile• Determine Emergency
Planning Zones for TaiwanNuclear Power Plants
effectively blocked the issuance of a license by refusing to participate in the development ofemergency plans for this plant. At issue was the ability to safely evacuate a nearby beachpopulation as well as Massachusetts towns within the 10-mile emergency planning zone (EPZ)that was imposed after the Three Mile Island accident. The emergency planning requirementshad changed during construction of the plant. Ironically, the owners had invested in a costlydouble containment concept to avoid the need to plan for a beach evacuation or for the need toinvolve the state of Massachusetts in the licensing process using the ground rules in effect whenthe site was selected.
An early application of the PSA was an emergency planning study (Reference 8) that wasperformed to quantify the risk reduction benefits of the protective actions covered in theemergency plan such as evacuation and sheltering. As illustrated in Figure 1, this study showedthat, due to an exceptionally strong containment determined in the PSA, the risk of offsiteconsequences at Seabrook with no evacuation was lower than that assessed by the U.S. NuclearRegulatory Commission (NRC) when it set the EPZ requirement to 10 miles. This applicationof the PSA was instrumental in resolving concerns regarding emergency planning at Seabrook,and the plant was subsequently licensed.
Because of the focus on the risk of severe accidents that was made in the licensing of this plant,Seabrook was responsible for identifying some of the first accident management procedures thathave been identified for U.S. plants. The event sequence diagrams that were originallydeveloped to support the PSA were extended, as illustrated in Figure 2, to identify key accidentmanagement strategies to cope with station blackout sequences that progress beyond the pointassumed by the existing emergency operating procedures (Reference 9). The strategies includedintentional primary system depressurization using the pressurizer power-operated reliefvalves (PORV), fire water supply to the steam generators, and special DC load sheddingprocedures. These actions were specifically identified to minimize the risk of early containmentfailure or bypass due to direct containment heating and induced thermal creep rupture of thesteam generator tubes.
2.3 BEZNAUPSA
The Beznau PSA (Reference 10) was a good example of the application of PSA techniques asa design evaluation tool. The purpose of this study was to provide guidance to a major backfitconstruction project that was required by the safety authorities to bring this relatively older plantup to meet more rigorous safety requirements that were devised after plant construction. Thebackfit consisted of a new decay heat removal and safety system to augment the safety systemsoriginally provided in the plant. Separate PSAs were performed with and without the safetybackfits to help ensure that the backfits had the intended benefit. An unexpected result of thePSA was a justification for saving a large fraction of the backfit construction budget withoutcompromising the safety benefits of the new system. The PSA results showed that the two-traindesign of the backfit system could be reduced to a single train with about the same impact onrisk. These results were accepted, and the cost of the backfits were reduced. The cost savingsto the plant owner, in excess of $100 million, were far in excess of the cost of the PSA.

«r4
10"s
10-«oX
u.o
a
2
WASH -1400 MEAN (METHOD 1 )
Iff,-7
ID'8
10,-9
EV-EVACUATIONSH-SHELTERING
10° 101 102 103
EARLY FATALITIES
104 105
Figure 1. Impact of Different Emergency Planning Optionson Risk of Early Fatalities at Seabrook Station
Figure 2. Operator Action Sequence Diagram — Station Blackout
253

254 2.4 DIABLO CANYON PRÄ
This PRÄ (Reference 11) provides another example of a regulatory issue that was resolved whenthe deterministic requirements had resulted in a licensing impasse. This impasse was createdwhen an earthquake fault was discovered in the vicinity of the Diablo Canyon plant during its.construction. As a condition to obtain another strongly contested license, the plant owners wererequired to conduct a seismic research program. This program included the most comprehensiverisk analyses of seismic events ever conducted. Significant advances were made to the state ofthe art of seismic risk analysis in order to obtain a reasonable balance and comparability ofresults for seismic and nonseismic contributors. Previous seismic PRAs could afford to leavein conservatisms because the seismic risk contributions was still very low. An important partof these advancements was the development of techniques that address the risk of relay chattercaused by the earthquake. Specific procedures were devised in this PRA for operator actionsto recover the plant from particular relay chatter events found to be risk significant.
The final results of this PRA for core damage frequency, as illustrated in Figure 3, showed thatseismic events made a significant contribution to core damage frequency but not the kind ofdominant contribution that some may have expected. On a relative basis, the uncertainties forseismic events were much larger than for other contributors. On the basis of these results andthe other elements of the seismic research program, the licensing impasse was resolved, and the
plant investment was saved. This was an excellent example of how a specific problem ofapplication addressed in a PRA had a great deal of impact on the way in which the project wasconducted and the balance of resources and level of detail allocated to a specific part of the PRAmodels.
2.5 BEAVER VALLEY PRA
The Beaver Valley PRA (Reference 12) was the first such project completed by PLG that wasoriginally intended to meet the individual plant examination requirements imposed by the NRC.After the project was started, however, a decision was made to perform the study in such amanner that an ongoing risk management program could be supported. This was also the firstPSA project completed at PLG that was initially performed using the PC-based RISKMANworkstation software (Reference 3).
In addition to meeting the IPE requirements, there have been two PRA applications that havealready been demonstrated using the Beaver Valley models that the authors would like tomention. The first was the use of the risk importance measures provided by the RISKMANsoftware to set priorities for equipment maintenance and operator actions in the emergencyoperating procedures. One set of results from this application is presented in Table 3. The risk
TOTAL CORE DAMAGE
1xt(T6 1x10~5
CORE DAMAGE FREQUENCY (PER YEAR)
1x1(T4 1x10"'
Figure 3. Core Damage Frequency Results of the Diablo Canyon PRA

Table 3. Risk Importance of Major Systems and Equipment
System or Equipment (Initiating Event, Top Event,and Split Fraction Designators in FRA Model)
Emergency Switehgear Rooms HVAC System (BVX)
Onrite AC Power System (AOX, BPX)Offsite AC Power System (LOSP, OG)Pressurizer Safety and Relief Valves (SLOCI, PA, PI,PK, PR)Service Water System (WBX, ISFL, VPFL, ABFL,WAX, WXB)Auxiliary Feedwater System (AF)Turbine, Steam, and Feedwater Systems (SGTR,PLMFW, TT, EXFW, TLMFW. LCV, TT, MS, MF)
High Head Safety Injection System (HH, HC)
Refueling Water Storage Tank (SGFL1, SGFL2, RW)RCS Piping and Vessel (SLOCA, MLOCA, LLOCA,ELOCA)Solid State Protection System (SA, SB)Black (ERF) Diesel Generator (BK)Secondary Component Cooling Water System (CS)
Risk Importance FactorsInitiating
EventCause.406
.059
.223
.10
.082
-.077
-
.043
.041
-
-
—
Responseto Initiating
Event.083
.315
.028
.175
.086
.136
.001
.061
< .001
—
.031
.031
.013
OverallImportance
Factor.489
.374
.251
.185
.168
.136
.078
.061
.043
.041
.031
.031
.013
Key Components and Failure Modes
Dampers Close; Supply and Exhaust FansFailDiesel Generators Fail To Start and RunLoss of Offsite PowerPORVs Failing to Reclose during Transient
Source of Floods, Pump and Valve Failures
Turbine-Driven AFW Pump during BlackoutTransient Initiating Events
Operator Prematurely Terminates HHSI afterSmall LOCASource of FloodsSource of a LOCA Initiator
System FailuresFails To Start or RunFailure of Unit 1 Filtered Water Pump afterLoss of Offsite Power
255
importance factor used here is the fraction of the total core damage frequency associated withsequences in which specific hardware were failed or unavailable. These results reflect a largeimportance of support systems such as the switchgear room cooling systems, electric power, andservice water systems. A high importance was also ascribed to the pressurizer PORVs due toa large contribution from sequences in which these valves lift during transients and fail toreclose. The identification of such sequences requires a detailed definition of event sequencesand an explicit treatment of the support systems in this definition process. Conspicuous in theirabsence and low ranking in Table 3 are frontline safety systems that are normally emphasizedin safety analyses. The scenario-based approach employed in RISKMAN always definesequipment importance only in the context of specific scenarios.
The second application demonstrated with the Beaver Valley models was the use of the existingmodels on RISKMAN to evaluate the safety significance of accident precursors that haveoccurred at other plants. A flow chart for this process is presented in Figure 4. To evaluatea precursor event using this procedure, the first step is to make use of the current results that,in many cases, can be used to bound the potential risk impacts. Then, if this is not successful,
progressive steps are taken to update the current risk models to the extent needed to address theevent. Only on rare occasions is a full event tree quantification needed to determine the risksignificance of the event. This procedure is currently in use at Beaver Valley to evaluate therelevant precursor events.
2.6 SOUTH TEXAS PROJECT PSAThe PSA project for this plant (Reference 13) was unilaterally initiated by the plant owner tobegin a comprehensive living PSA program, which is now in its ninth year of existence and isvery active with numerous PSA applications. The first application was the identification ofdesign improvements and procedure enhancements to improve safety. The design improvementsthat were identified and implemented from the PSA included conversion of motor-operatedcontainment isolation valves in the seal return and purge lines to air-operated valves. Thischange reduced the likelihood of containment isolation and bypass failure and loss of primarycoolant during station blackout sequences. There were also hardware changes to reduce thelikelihood of the conditions for reactor coolant pump seal loss of coolant accidents. These

256
VAURCSMCUIK HUOW/UK un HUMN aura
Figure 4. Flow Chart for Use of RISKMAN PSA Models To Evaluate Precursor Events
changes included the ability to line up the technical support center diesel generator to a positivedisplacement charging pump that was independent of the electrically driven component coolingwater system. In addition, the procedures were enhanced to reduce the likelihood that electricalbuilding room cooling systems problems could result in damage to essential electrical systemcomponents. Substantial reductions in the frequency of core damage were obtained from theseenhancements, and the effectiveness of the containment was also enhanced.
The next major PSA application at this plant was the use of the PSA to justify a completeoverhaul of the plant technical specifications governing the periodic testing frequencies andallowed outage times for component maintenance. To provide a basis for justifying thesechanges from the PSA, Houston Lighting & Power Company arranged for a detailed review ofthe PSA with the NRC staff and its contractors that was much more detailed than will be neededfor the IPE submittals. The NRC has completed this review and has accepted the results of thePSA to base line the technical specification review (Reference 14). A decision criterion wasdefined for technical specification changes: individual changes that increase core damagefrequency by no more than 5 % will be accepted. The plant owners anticipated major changesto the testing intervals and allowed outage times when the review is completed.
A new application that will support a more complete integration of the PSA models into thedesign and operations support organization at the plant is in progress. The event sequencediagrams that were produced in the PSA as a means of documenting key information necessaryto define accident sequences properly are being converted to a computerized, three-dimensionalgraphical interface, as conceptually illustrated in Figure 5. These diagrams contain all of thesequences modeled in the PSA, explicit representation of key steps in the emergency operatingprocedures, emergency action levels, and a graphical link between the PSA and the configurationmanagement system at the plant. These graphical "safety sequence diagrams" will become thesingular source of information regarding event sequences at the plant. Once this interface is inplace, additional applications to support the accident management program and to meet the new"maintenance rule" imposed by the NRC will be developed through the graphical interface.
2.7 REPUBLIC OF CHINA (TAIWAN) EMERGENCY PLANNING STUDY
The final application to be discussed in this paper is an extension of the emergency planningapplication that was discussed above for the Seabrook plant. Taiwan has two existing nuclearpower plant sites on the northern coast of the island within the vicinity of Taipei and very close

SAFE SHUTDOWN SEQUENCE DIAGRAM: GENERAL TRANSIENT
TRIPSCALLYALLY
•*
8.0ESFAS ON tMAIN STE
FLOW
3.0TURBINE TRIPS
AUTOMATICAU.OR MANUALLY
1
IQHAM
tM
CLO
.0
SURE
17.0 1REACTOR IVESSEL 1
INTEQRITY fMAINTAINEO 1
*
4.0PRIMARY ANDSECONDARY
SYSTEMSPRESSURE
CONTROLLED
/SMAU\
1 ——
-*
»
S.OAUXILI
FEEDWJPROVIOfONE OR
SO,
k
HHh
111
12.0ADEQUATEBORATEO
WATERAVAILABLE
FROMRWST
^f LOSS OP '•ISECONOAR
anITER
MORE
10.0OPERATOR RE-ESTABLISHES
MAINFEEDWATER
nwl
Jr-
—— I
-J
RC
Mfr
«.0»FLOW ANDVTE6WTYAINTAINEO
/RCPSE,^ LETO
13.0 |_ESFAS ON LOW |RCS PRESSURE 1
18.0OPERATORWITUTEI
CO«. DOW«———
— »
'
ALANDOWN
7.0PLANT
RETURNED TOPOWER
OPERATION
*
<
:
14.0HIGH
PRESSURESAFETY
INJECTION
]
OPERATORDEPRECSUMZtS RCS VIA CO
PORVl
r"ÎÎÎO* I
DECAY HEATREMOVAL
VIA J
CHARGINGPUMPS
1
11.0HOT
>HUTOOW
- -»
N
ts.oOPERATORREDUCES
RCSPRESSURE TORHR ENTRY
f
20.0IOW H
SAFE!INJECT
w^^m
=AD
ON
r
18.0* RHRSYST
24.0HIGH HEAD
SAFETYINJECTION
i '
to
J f
21.0fteciR-CULATION
i
[DECAY HEAT!1 REMOVAL 1
M VIA RHR L
l T' -J-1-13.0
DECAY HEAT_ REMOVAL <» VIASQiOR
RCFCi
1
».0STABLE
CONDITION
figure 5. Graphical Interface for South Texas PSA Scenarios
257
to a substantial volcanic mountain more than 3,000 meters high. The issue addressed in thisstudy is how to develop a basis for defining emergency planning zones for protective actions ofsheltering and prompt evacuation around these plants. Because PSAs had already beenperformed for the Taiwan nuclear plants, there was a desire to make appropriate use of the PSAinformation on severe core damage sequences. In this PLG project, decision criteria forselecting the size of the EPZ were developed (References 15 and 16) and applied to one of theseplants. The decision criteria addressed the need to control the frequency versus distance overwhich protective action guideline doses were expected to be exceeded, and the need to obtainan optimum benefit of the emergency plan in terms of the risk averted through protective actionssuch as evacuation and sheltering. To demonstrate the application of these criteria, an existing
Level 2 PSA for Kuosheng was updated to account for a reassessment of severe accidentphenomena and source terms, and was extended to Level 3 so that the risk aspects of emergencyplanning could be addressed.
As illustrated in Figure 6, the risk reduction benefits of evacuation and sheltering were foundto be almost fully realized within 5 km of the plant. Extensions to further distances were foundto be of marginal benefit. A by-product of this study was the development of a newconsequence model called CRACEZ (Reference 17) that models the three-dimensional dispersioneffects of terrain that were found to be very important to obtain realistic consequence estimates.

258
.O
LEGEND
PROTECTIVEACTION
STRATEGY
01234S6
. 7e9
DISTANCE (KM) ASSUMEDFOR
EVACUATION000022255
10
SHELTERING025
1005
100
100
EVACUATIONONLYSTRATEGIES
PROTECTIVE ACTION DISTANCE (KM)
figure 6. Risk Reduction for Alternative Protection Action Strategies
3. CONCLUSIONS
As can be seen in the examples discussed in this paper, there have already been a number ofsuccessful applications of PSA in which issues were resolved and better decisions were made.On a number of occasions, the direct benefits of the PSA were immediately realized and werefar in excess of the costs associated with performing the studies. Because PSA can be used toaddress virtually any issue regarding safety, the number and diversity of future applications areexpected to grow substantially in the future. One of the most exciting, new developments thatwe expect to see is the use of dynamic decision aids for plant operators that keep track of theactual configuration impacts on risk and that provide diagnostic aids to deduce the causes ofaccident sequences and provide guidance to implement the appropriate accident managementstrategies.
REFERENCES
1. Bley, D. C., et al., "Zion Nuclear Plant Residual Heat Removal PRÄ," Pickard, Löweand Garrick, Inc., prepared for Electric Power Research Institute, NSAC-84, My 1985.
1. Moody, J. H., et al., "Seabrook Station Probabilistic Safety Study—Shutdown(Modes 4, 5 and 6)," New Hampshire Yankee, Vols. 1-2, May 1988.
3. Epstein, S. A., "RISKMAN®: A System for PSA," presented at Third Workshop onLiving-PSA-Applications, Hamburg, Federal Republic of Germany, May 11-12, 1992.
4. Pickard, Lowe and Garrick, Inc., Westinghouse Electric Corporation, and Fauske& Associates, Inc., "Zion Probabilistic Safety Study," prepared for CommonwealthEdison Company, Vols. 1-10, September 1981.
5. Pickard, Lowe and Garrick, Inc., Westinghouse Electric Corporation, and Fauske& Associates, Inc., "Indian Point Probabilistic Safety Study," prepared for PowerAuthority of the State of New York and Consolidated Edison Company of New York,Inc., Vols. I-12, March 1982.
6. U.S. Nuclear Regulatory Commission, "Reactor Safety Study—An Assessment ofAccident Risks in U.S. Commercial Nuclear Power Plants," WASH-1400,NUREG-75/014, October 1975.
7. Pickard, Lowe and Garrick, Inc., "Seabrook Station Probabilistic Safety Assessment,"prepared for Public Service Company of New Hampshire and Yankee Atomic ElectricCompany, PLG-0300, Vols. 1-6, December 1983.
8. Fleming, K. N., et al., "Seabrook Station Risk Management and Emergency •PlanningStudy," Pickard, Lowe and Garrick, Inc., prepared for New Hampshire. YankeeDivision, Public Service Company of New Hampshire, PLG-0432, December 1985.
9. Fleming, K.N.,etal., "Risk Management Actions To Assure Containment Effectivenessat Seabrook Station," Pickard, Lowe and Garrick, Inc., prepared for New HampshireYankee Division, Public Service Company of New Hampshire, PLG-0550, July 1987.
10. PLG, Inc., "Beznau Station Risk Assessment—Plant with NANO," prepared forNordostschweizerische Kraftwerke AG, PLG-0511, Vols. 1-5, December 1989.
11. PLG, Inc., "Diablo Canyon Probabilistic Risk Assessment," prepared for Pacific Gasand Electric Company, PLG-0637, Vols. 1-9, July 1988.
12. Duquesne Light Company, "Beaver Valley Unit 2 Probabilistic Risk Assessment,Revision (2)," March 1992.
13. Pickard, Lowe and Garrick, Inc., "South Texas Project Probabilistic Safety Assessment, "prepared for Houston Lighting & Power Company, PLG-0675, Vols. 1-9, May 1989.

14. Letter from G. F. Dick, U.S. Nuclear Regulatory Commission, to D. P. Hall, HoustonLighting & Power Company, "Safety Evaluation by the Office of Nuclear Regulationrelated to the Probabilistic Safety Analysis Evaluation, South Texas Project, Units 1and 2 (Docket Nos. 50-498 and 50-499)," January 21, 1992.
15. Fleming, K. N., et al., "EPZ Determination for Republic of China," PLG, Inc.,prepared for Republic of China Atomic Energy Council, PLG-0767, Vols. 1-2, June1990.
16. Fleming, K. N., and C. Yang, "Risk-Based Approach To Determination of EmergencyPlanning Zones for the Republic of China, " Proceedings of the International Conferenceon Probabilistic Safety Assessment and Management (PSAM), Beverly Hills, California,pp. 97-102, February 4-7, 1991.
17. Woodard, K., et al., "CRACEZ: A Radiological Consequence Model with ImprovedModeling of Dispersion and Evacuation," Proceedings of the International Conferenceon Probabilistic Safety Assessment and Management (PSAM), Beverly Hills, California,pp. 747-751, February 4-7, 1991.
A COMPUTER TOOL FOR SYSTEMSCONFIGURATION MANAGEMENT BASED ONPSA MODELS AND TECHNIQUES
G. GEORGESCUInstitute for Nuclear Research,Pitesti, Romania
Abstract
In the frame of the IAEA coordinated research programme for expert systemsdevelopment, in the Institute for Nuclear Research, a PSA based computer tool for systemsconfiguration management is in progress. The system is designed to be integrated in thefuture living PSA" system under development now. The design of the system is mainlybased on the PSA model for Cernavoda NPP and the risk-based configuration managementmethods, taking into account the user requirements.
The system will be developed taking into account the expert systems tech-niques, specific PSA methods (MCS and path-sets generation, etc.) and friendly userinterface features. The work done up to now for the system mainly consist of the usersrequirements identification, development techniques choosing and top-level system de-sign.
259
1. Configuration management based on PSA techniques
During the plant operation some of the components can be out of operation due totesting or preventive/ corrective maintenance. If that happened for some critical compo-nents in the same time, the global risk can be significantly affected. Even that the outagetime is very short the level of risk can be with a few orders of magnitude over the normalyearly level of risk.
The method consist of identification of those components for which the simulta-neous outage must be avoided. For this reason the whole PSA model must be requantifiedconsidering certain groups of components are down in the same time. To identify all criticalcomponents combinations, a systematically approach is necessary:
1. The RAW importances are computed and ranked for all components.
2. The RAW importances are computed and ranked for groups of two components,following the rules:
-Components that are in the same MCS.-Components that are part of different trains in the same system or from
different systems.

2gQ 3. The same procedure taking combinations of three components. Generally is notnecessary to consider groups with more then three components.
The cut-off criteria must be checked to ensure that the combinations are not lost. If yes,the MCS must be regenerated.
The general criteria to define a certain combination of components as critical is the riskincrease factor - 1/X over the normal risk level X.
It is considered that a certain combination is not critical.but is significant if the increasefactor is over 1/XV4.
If a combination is critical that must be avoided during operation.If a combination is significant and that happened it is necessary to compute the riskcompensating allowed downtime.
The risk compensating downtime determination take into account the riskrelative variations. The method consists of the following steps:
a. Compute the risk increase factor:
If:
Fl - the risk if the combinations of components failures happened.
FO - the normal level of risk
Fl = f'FO, where f - the risk increase factor,
f is the BIRNBAUM or RAW value.
Rd = dFl = d*f*FO - the risk due to components failures during time d.
d is the downtime express in years equivalent with Rd over 1 year,
b. Compute the allowed downtime to compensate the risk increase.
The risk Rd is expressed using the tolerance factor V, so that the risk increaseis under the normal level.
Rd = FO/n;
Rd = d'f*FO = F O / n ;
d = 1 / (f * n) - the allowed downtime.
2. System design.
In the present version the system is not designed to be used for the whole plantconfiguration management, no more than 1000 components being possible to be includedin the fault tree model. The system can be used for one plant system configurationmanagement, considering as the normal level of risk the required system unavailability orfailures frequency.
The main parts of the system consist of:
- Fault Trees library - contains the F/Ts model for the plant system of interest;
- Components Data library - contains the components and human error dataaccording with the F/T model;
- Processor module - contains the main part of the system, designed for riskcompensating configuration management and allowed downtime processing. The moduleis containing three submodules:
- Fault tree processor - provides the qualitative and quantitativeevaluation of F/T, including importances evaluation, according with the ConfiguratiManagement Processor requirements.
ion
-MCS, RAW, Intermediate results module - library containingthe F/T processor results and Configuration Management Processor requirements;
-Configuration Management Processor - according with theabove described methodology determines the critical component combinations and theallowed downtime for significantly component combinations.
- Control center module - smart module providing the F/T library consistencywith the Components Data Library, the consistency of the activity inside the ProcessorModule and the user interaction with the above modules.
- User Interface Module - interactive user interface allowing user to modifyF/T and Components Data, processing requirements as well as the results presentation.
- Results Processor - provide the results presentation according with the userrequirements on the screen or/and on the printer.
The ways that the system modules interact are presented in fig. 1.

FAULT TREESLIBRARY
COMPONENTSDATA LIBRARY
CONTROL CENTERMODULE
USERINTERFACE
MODULE
FAULT TREEPROCESSOR
MCS, RAW,INTERMEDIATERESULTS MODULE
CONFIGURATIONMANAGEMENTPROCESSOR
PROCESSORMODULE
Figure 1
261
The system is designed to be implemented on a PC and to be used by:-plant operators for safety systems configuration management;-plant designer for safety improvements;-regulatory for normal and emergency operating procedures and tech-
nical specifications development;
The top-level design as well as the module detaliated design is almost done.
The methodology was tested using some modules prototypes implemented on PC.
The experience and also some of the models will be included in the "living PSA" systemwhich is under development.
REFERENCES
1. W. Vesely - Workshop on PSA applications, IEAE-INR, Sinaia oct. 1990
2. *** -"Measures of risk importance and their applications", NUREG/CR-3243,1985
3 ... ."Evaluations and utilizations of risk importance", NUREG/CR - 4377,1985
4.*** -"Measures of the risk impacts of testing and maintenance activities",NUREG/CR-3541

262BELGIUM
Plys, M G
Wolvaardt, F P
BRAZIL
Orlando Gibelh, S M
Vieira, A S
BULGARIA
Kichev, E
Kolev, I
CANADA
Ballingall, N M
CROATIA
Valcic, I
CZECHOSLOVAKIA
Brocko, P
Cillîk, I
Dusek, J
Ferjencik, M
LIST OF PARTICIPANTS
Fauske and Associates, Inc ,c/o Westmghouse Energy Systems International,Rue de Stalle 73, B-1180 Brussels
Westmghouse Energy Systems International,Rue de Stalle, 73, B-1180 Brussels
Comissäo Nacional de Energia Nuclear (CNEN),Rua General Sevenano, 90 - Sala 412,22294-900 Rio de Janeiro, RJ
Institute de Pesquisas Energeticas e Nucleares,Travessa R no 400, Cidade Umversitaria - SP,05422-970 Sâo Paulo
Division of Technical Support, Power Production 1,Kozloduy NPP, BG-Kozloduy 3321
Risk Engineering Ltd,ul Srebarna 21, BG-1407 Sofia
Atomic Energy Control Board,280 Slater Street, P O Box 1046, Station 'B',Ottawa KIP 5S9
Ministry of Energy and Industry,Av Vukovar 78, 41000 Zagreb
SEP-Atômové Elektrârne, Mochovce, o z ,CS-935 39 Mochovce
Nuclear Power Plant Research Institute,CS-Okruzna 5, 918 64 Trnava
Nuclear Research Institute,CS-ftez near Prague 250 68
NPP Temelm, CEZ, a s , JE Temehn,CS-373 05 Temelm Elektrama
CZECHOSLOVAKIA (cont )
Hojny, V
Novakova, H
Patnk, M
Rehâcek, R
Sedlâk, J
Stam'cek, J
Stvân, F
Svâb,M
Valenta, V
FINLAND
Mankamo, T
Pesonen, J M A
FRANCE
Denot, S M F
Reynes, L
Rmgot, C
Nuclear Research Institute,CS-Rez near Prague 250 68
VUPEX,Bajkalski 27, 827 52 Bratislava
Nuclear Research Institute,CS-Rez near Prague 250 68
State Office for Nuclear Safety,NPP Dukovany, CS-67550 Dukovany
Skoda Prague, Comp Ltd,Bezrucova 15, CS-316 00 Plzen
Energoprojekt,Bubenska 1, CS-170 05 Praha
Skoda Prague, Comp Ltd,Bezrucova 15, CS-316 00 Plzen
State Office for Nuclear Safety,Slezska 9, CS-120 29 Prague
Skoda Concern, Plzen, Nuclear Machinery Plant,Research and Development Centre Bolevec,CS-316 00 Plzen
Avaplan Oy,Kuunsade 2 DE, SF-02210 Espoo
Teolhsuuden Voima Oy,SF-27160 Olkiluoto
Direction des etudes et Recherches,Electricité de France,1, avenue du Général de Gaulle,F-92141 Clamait
Electricité de France, IGSN Direction générale,32, rue de Monceau, F-75008 Paris
COGEMA/NUSYS, EURISYS Consultants14, rue du Printemps, F-750017 Paris

263
GERMANY
Berg, H-P
Kafka, P
Koban, I
Rumpf, J
HUNGARY
Bareith, A
Czako,S
Dobo, J
Énekes, B
Fichtinger, G
Gergely, J
Hollo, E(Chairman)
Karsa, Z
Kretschmann, E
Levai, F
Macsuga, G
Ordogh, M
Bundesamt für Strahlenschutz,Postfach 10 01 49, D-3320 Salzgitter l
Gesellschaft für Anlagen-und Reaktorsicherheit (GRS) mbH,Forschungsgelande, D-8046 Garching
Siemens AG, ÜB KWU,Berliner Str 295-303, D-6050 Offenbach/M
TUV Norddeutschland e V ,Große Bahnstr 31, Postfach 540220D-2000 Hamburg 54
Institute for Electrical Power Research (VEIKI),Zrinyi utca l. H-1051 Budapest
Institute for Electrical Power Research (VEIKI),Zrinyi utca l, H-1051 Budapest
Paks Nuclear Power Plant,PO Box71,H-7031 Paks
Paks Nuclear Power Plant,P O Box 71, H-7031 Paks
National Atomic Energy Commission, Nuclear Safety Inspectorate,Logodi u 38-40, H-1012 Budapest
Paks Nuclear Power Plant,P O Box 71, H-7031 Paks
Institute for Electrical Power Research (VEUCI),Zrinyi utca 1, H-1051 Budapest
Institute for Electrical Power Research (VEIKI),Zrmyi utca 1, H-1051 Budapest
Committee for Technological Development (OMFB),Szervita ter 8, H-1052 Budapest
Technical University of Budapest, Institute of Nuclear Techniques,Mucgyetem rkp 9, H-l 111 Budapest
Atomenergia Kutatô Intézet,H-l525 Budapest, Pf 49
Power Station and Network Engineering Co ,Szechenyi rkp 3, H-1054 Budapest
HUNGARY (cont )
Siklossy, P
Szabô, A
Szikszai, T
Szonyi, Z
Vöröss, L
ISRAEL
Brand, D
KOREA, REPUBLIC OF
Kil-Yoo, K
LITHUANIA
Bagdonas, A
Uspuras, E
MEXICO
Becerra Perez, J A
Nunez Carrera, A
NETHERLANDS
Preyssl, C
Versteeg, M F
POLAND
Kuhg, M J
Institute for Electrical Power Research (VEIKI),Zrinyi utca 1, H-1051 Budapest
Power Station and Network Engineering Co ,Szechenyi rkp 3, H-1054 Budapest
Paks Nuclear Power Plant,PO Box 71, H-7031 Paks
National Atomic Energy Commission, Nuclear Safety Inspectorate,Logodi u 38-40, H-1012 Budapest
Institute for Electrical Power Research (VEIKI),Zrinyi utca 1, H-1051 Budapest
Soreq Nuclear Research Center,Yavne 70600
Korea Atomic Energy Research Institute,P O Box 7, Daeduk-Danji, Taejon 305-606
Lithuanian Energy Institute,Aukstadvario 3, Kaunas 3035
Lithuanian Energy Institute,Aukstadvano 3, Kaunas 3035
Common Nacional de Seguridad Nuclear y Salvaguardias,Dr Barragan No 779, Col Narvarte, 03020 Mexico, D F
Comisiôn Nacional de Seguridad Nuclear y Salvaguardias,Dr Barragan No 779, Col Narvarte, 03020 Mexico, D F
ESA/ESTEC,Postbus 299, NL-2200 AG Noordwyk
Nuclear Safety Department,P O Box 90804, NL-2509 LV Den Haag
National Inspectorate for Radiation and Nuclear SafetyKonwahowa 7, PL-03 194 Warsaw
ROMANIA
Georgescu, G S
Turcu, I
RUSSIAN FEDERATION
Frolov, E V
Shvyryaev, J V
SLOVENIA
Jordan, R
SPAIN
Gutierrez, E
Martorell, S
SWEDEN
Sandstedt, K J
Wilson, D G
UKRAINE
Gromov, G
UNITED KINGDOM
Andrews, R M
Holioway, N J93 05080
Institute for Nuclear Research,P O Box 78, RO-Pitesti
Institute for Nuclear Research,P O Box 78, RO-Pitesti
Opitno-Konstrukcioni Biro,Burnakovsky proezd 15, 603603 Nizhny Novgorod 74, Moscow
Atomenergoprojekt,Bakumnskaya Str 7, Moscow 107815
"Jozef Stefan" Institute,Jamova 39, 61111 Ljubljana
UITESA,Juan Bravo 49 Dupl ,E-28006 Madrid
Departamento de Ingemeria Nuclear,Umversidad Politecmca de Valencia,P O Box 22012, E-46071 Valencia
RELCON AB,Box 2057, S-171 02 Solna
RELCON AB,Box 2057, S-171 02 Solna
Ukrainian State Committee for Nuclear & Radiation Safety,St Observatornay 11/1, Kiev 254053
Nuclear Installations Inspectorate,St Peters House, Stanley Precinct,Bootle, Merseyside L20 3LZ
UK Atomic Energy Authority, SRD Culham Laboratory,Culham Abmgdon, Oxon OX 14 3DB
UNITED KINGDOM (cont.)
Preston, J F
Ross, P J
Stewart, J A
Tilstone, A J
Electrowatt Engineering Services Ltd,Electrowatt House, North Street, Horsham,West Sussex, RH12 IRF
Nuclear Electric,Booths Hall, Knutsford, Cheshire WA16 8QG
BEQE Ltd,500 Longbarn Boulevard, Birchwood,Warnngton WA2 OXF
British Nuclear Fuels pic,Risley, Warnngton, Cheshire WA3 61A4
UNITED STATES OF AMERICA
El-Bassiom, A A
Fleming, K N
Joksimovich, V
Singh, B K
Specter, H
van Erp, J B
US Nuclear Regulatory Commission,Washington, DC 20555
PLG, Inc,4590 MacArthur Boulevard, Suite 400,Newport Beach, CA 92660
Accident Prevention Group,16980 Via Tazon, Suite 110,San Diego, CA 92127
US Department of Energy, NE-74,Washington, DC 20585
New York Power Authority,123 Main Street, White Plains,New York 10601
Argonne National Laboratory,Bldg 223, 9700 South Cass Avenue,Argonne, IL 60439
INTERNATIONAL ATOMIC ENERGY AGENCY
Tomic, B(Scientific Secretary)
Safety Assessment Section, Division of Nuclear Safety,International Atomic Energy Agency,Wagramerstraße 5, P O Box 100,A-1400 Vienna, Austria