preparing for genocide: community work in rwanda
TRANSCRIPT

Stockholm Institute of Transition Economics (SITE) ⋅ Stockholm School of Economics ⋅ Box 6501 ⋅ SE-113 83 Stockholm ⋅ Sweden
Stockholm Institute of Transition Economics
WORKING PAPER
January 2015
No. 31
Preparing for Genocide: Community Work in Rwanda
Evelina Bonnier, Jonas Poulsen, Thorsten Rogall and Miri Stryjan
Working papers from Stockholm Institute of Transition Economics (SITE) are preliminary by nature, and are circulated to promote discussion and critical comment. The views expressed here are the authors’ own and not necessarily those of the Institute or any other organization or institution.

Preparing for Genocide:Community Work in Rwanda∗
Evelina Bonnier† Jonas Poulsen‡ Thorsten Rogall§ Miri Stryjan¶
January 2015
Abstract
How do political elites prepare the civilian population for participation in violent conflict? We empir-ically investigate this question using village-level data from the Rwandan Genocide in 1994. EverySaturday before 1994, Rwandan villagers had to meet to work on community infrastructure, a prac-tice called Umuganda. This practice was highly politicized and, in the years before the genocide,regularly used for spreading political propaganda. To establish causality, we exploit cross-sectionalvariation in meeting intensity induced by exogenous weather fluctuations. We find that an additionalrainy Saturday resulted in a five percent lower civilian participation rate in genocide violence. Theseresults pass a number of indirect tests of the exclusion restriction as well as other robustness checksand placebo tests.
JEL classification: D74, N47Keywords: Conflict, Rainfall
∗We thank Tom Cunningham, Jonas Hjort, Juanna Joensen, Magnus Johannesson, Erik Lindqvist, Eva Mork, Suresh Naidu,Torsten Persson, Cristian Pop-Eleches, David Stromberg, Jakob Svensson, Erik Verhoogen and Miguel Urquiola, as well asseminar participants at SUDSWEc 2013, the Aswede Conference on Development Economics, the Stockholm School of Eco-nomics, and the Columbia Development Colloquium for many helpful comments.
†Stockholm School of Economics, [email protected]‡Uppsala University, [email protected]§Stockholm University, IIES, [email protected]¶Stockholm University, IIES, [email protected]
1
1 Introduction
In many civil wars and conflicts, ordinary civilians choose to participate in violent activities. During
the Rwandan Genocide in 1994, around 430,000 Hutu civilians joined the army and militiamen in vio-
lent activities killing an estimated 800,000 Tutsis and moderate Hutus in only 100 days. 1 In light of
this high death rate and the large number of civilian perpetrators, it is crucial to understand the causes
of the civilian participation in the Rwandan genocide. Anecdotal evidence suggests that in the years
prior to the Rwandan genocide, the weekly-held community meetings called Umuganda were used to
sensitize and mobilize the civilian Hutu population, and believed to have been one of the reasons why
the genocide could be carried out so quickly. While Umuganda was originally designed as mandatory
work meetings to improve village infrastructure, earlier research suggests that in the early 1990s these
meetings were abused by the political elites to spread anti-Tutsi sentiments and prepare the population
for genocide (Cook 2004, Straus 2006, Thomson 2009, Verwimp 2013). Despite the specific focus of
this paper, we argue that examining the possibly negative effect of these meetings is of more general
importance. There is a widely held notion that community meetings have a beneficial effect on foster-
ing social capital (Knack and Keefer 1997; Putnam 2000; Grootaert and van Bastelaer, 2002; Guiso,
Sapienza and Zingalez, 2008), by providing arenas for people to meet, exchange ideas, solve free-rider
problems, and create public goods. This notion has considerable influence on the work of important
developing agencies, expressed in their increasing focus on ‘community driven’ development projects in
which deliberative forums and grassroot participation pay a central role (see Mansuri and Rao, 2012 for
a recent overview). We investigate whether there is a ‘dark side’ to Umuganda where social capital does
not bridge the societal divides but rather enforces bonding within the Hutu population (see Satyanath,
Voigtlaender and Voth, 2013). Understanding this process is even more important since the practice of
Umuganda was formally reintroduced in Rwanda in 2008, and similar practices have been installed in
Burundi and discussed in the Democratic Republic of Congo (DRC).
This paper provides the first empirical analysis of how important local Umuganda meetings might have
been in inducing the civilian population to participate in genocide. Identifying the causal effect of these
meetings on participation in genocide is difficult for two reasons. First, we lack data on the number
of people participating in Umuganda or the number of meetings taking place in a given locality. Sec-
ond, even if data existed our estimates would likely suffer from omitted variable bias. On the one hand,
village-specific unobservable characteristics that affect both genocide violence and Umuganda intensity,
for instance local leader quality, could produce a spurious positive correlation between the two, biasing
the estimate upwards. On the other hand, if Umuganda meetings were strategically used in areas where
1In 1990, Rwanda had 7.1 million inhabitants out of which 6 million were Hutus.
1

genocide participation would have been unobservably low, the estimate would be downward biased.
To overcome these data and endogeneity issues, we use exogenous rainfall variation to estimate the ef-
fect of Umuganda meetings on participation in civil conflict. The idea is simple: we expect the meetings
to be less enjoyable when it rains and furthermore to be cancelled altogether in the case of heavy rain
(Madestam et al., 2013; Madestam and Yanagizawa-Drott, 2011). The fact that the community-work
took place on every Saturday makes it possible to isolate the effect of Umuganda from general rainfall
effects (e.g. affecting income through agriculture) by only using variation in Saturday rainfall while
controlling for average daily rainfall during our period of interest.
We use the number of Saturdays with heavy rainfall during the pre-genocide period as our variable of in-
terest. After the outbreak of the civil war in October 1990, tensions between Hutus and Tutsis intensified
and the approach of the Hutu-dominated government became more aggressive. Therefore, we will focus
on the period from October 1990 up until the outbreak of the genocide in April 1994.
To control for local characteristics we include 142 commune indicators. Furthermore, we can provide a
strong placebo check by controlling for heavy rainfall on the other six weekdays. We thus ensure that
identification only stems from local variation in rainfall on Saturdays, which is arguably exogenous and
should only affect genocide participation through its effect on Umuganda meeting intensity.
There is, however, one major concern regarding the exclusion restriction. In particular, the effect we
estimate might not be due to the political element of Umuganda per se, but merely a consequence of
people getting together in general. We devote an ample amount of care to corroborate that this concern
is unwarranted. In particular, we will show that neither rainfall on Sundays, a church day where people
traditionally meet, nor rainfall on public holidays, affect participation. Moreover, the estimates are robust
to excluding Kigali, the Rwandan capital.
We proxy for genocide violence by the number of people prosecuted in the Gacaca courts, normalized by
village Hutu population in 1991. There were about 10,000 of these local courts set up all over the country
to prosecute the crimes committed during the genocide. Using prosecution instead of actual participation
rates might introduce some bias. However, as shown in Friedman (2013), the Gacaca data is strongly
correlated with other measures of violence from other various sources. Moreover, we take into account
that the Gacaca courts potentially prosecuted not only genocide perpetrators, but also perpetrators who
committed violence during the preceding civil war, by excluding communes where major violent events
2
took place during that period. We also show that the results are robust to dropping areas where mass
graves were discovered after the genocide (indicating high death rates).
Our reduced-form results indicate a negative relationship between Umuganda intensity and civilian par-
ticipation in genocide: one additional rainy Saturday is associated with a 5 percent decrease in the civilian
participation rate. The results are robust to controlling for rainfall on all other weekdays. Importantly, the
coefficients for the other weekdays are small and insignificant. The effect is similar although smaller and
statistically weaker for organized participation. This is not surprising since militia and army men often
came from outside the village where they committed crimes, and should thus not have been affected by
pre-genocide rainfall in the village.
Our results have important policy implications and are also relevant for other cases. In 2008, the Rwan-
dan government reintroduced Umuganda. Our results show that these meetings can easily be abused
and that caution is warranted, in particular since tension between the Tutsi and the Hutu is still present
in Rwanda. Furthermore, similar practices have been installed in Burundi and are being discussed in
the Democratic Republic of Congo (DRC). Both Burundi and the DRC have a long history of violent
conflict along ethnic lines, which calls for caution when establishing an authoritarian institution such as
mandatory community meetings.
Our paper contributes to the literature in several ways. First of all, it adds to the vast conflict litera-
ture. Blattman and Miguel (2010) give an excellent review of this literature, vehemently calling for
well-identified studies on the roots of individual participation in violent conflict. This paper adds to the
conflict literature by providing novel evidence on the strong effects local community meetings, controlled
by the political elite, can have on preparing a population for genocide. Recent studies on the determinants
of conflict and participation in violence consider institutions, government policy, income, foreign aid and
propaganda (Besley and Persson, 2011; Dell, 2012; Dube and Vargas, 2013; Mitra and Ray, forthcoming;
Nunn and Qian, forthcoming; Yanagizawa-Drott, 2013, respectively). Furthermore, our paper comple-
ments the literature on the Rwandan Genocide (Straus, 2004; Verpoorten, 2012a-c; Verwimp, 2003,
2005, 2006; Yanagizawa-Drott, 2013) by providing novel evidence on its careful preparation. Thus, the
study adds to results showing how Hutu unemployment and education (Friedman, 2013), propaganda
through the RTLM hate radio (Yanagizawa-Drott, 2014), local state capacity (Heldring, 2014), and elite-
supported armed groups (Rogall, 2014) affected civilian participation in the genocide.
On the methodology side, our findings speak to the recent discussion on the effects of rainfall on conflict
3

other than through the income channel (Iyer and Topalova, 2014; Rogall, 2014; Sarsons, 2011). Promi-
nent studies that use rainfall as an instrument for income in Africa include Bruckner and Ciccone (2010),
Chaney (2013) and Miguel, Satyanath and Sergenti (2004). Our results suggest that rainfall might have
negative direct effects on conflict. Moreover, the estimation strategy we use is similar to the ones used
in Madestam et al. (2013) and Madestam and Yanagizawa-Drott (2011), who also use rainfall as a proxy
or instrument for participation in outdoor events.
Finally, our results are in line with Satyanath, Voigtlaender and Voth (2013) who speak for a ”dark side”
of social capital, in contrast to several contributions highlighting its positive effects (Knack and Keefer,
1997; Grootaert and van Bastelaer, 2002; Guiso, Sapienza and Zingalez, 2008).
The remainder of the paper is organized as follows. Section 2 provides some background information
on the Rwandan genocide. Section 3 presents the data used for the analysis and Section 4 lays out our
empirical strategy. Section 5 presents the results and tests their robustness. Section 6 concludes with
possible policy implications.
2 Background
2.1 A History of Conflict
A long chain of events lead up to the 1994 Rwandan genocide.2 German and Belgian colonizers pro-
moted the Tutsi minority and gave them supremacy over the Hutu majority.3 This division created a
strong tension between the two groups and culminated in the Rwandan revolution, or the Social revo-
lution of 1959, where the Tutsi monarchy was dissolved in favor of a republic led by the Hutus. Many
Tutsi civilians were killed; others fled Rwanda for neighboring countries such as Burundi, Tanzania and,
in particular, Uganda. Thus, after gaining independence in 1962, Rwanda was ruled by a Hutu govern-
ment. During the following decade the country faced several attacks from exiled Tutsi rebel groups with
following Hutu retaliation.
In 1974 - paramount to the introduction of a modern version of Umuganda - Juvenal Habyarimana took
power in Rwanda through a coup d’etat. His subsequent rule was based on a pro-Hutu ideology (”Hutu
power”), further discussed in the next section. During the same period, a rebel group called the Rwandan
2For insightful accounts of this period, see for example Prunier (1995), Gouveritch (1998), Des Forges (1999), Dallaire(2003), Hatzfeld (2005, 2006) and Straus (2006).
3In the 1991 census data used in this paper, the average reported share of Hutus per commune is 87%
4
Patriotic Front (RPF) had emerged in exile, mostly comprised of Tutsi refugees. In October 1990, the
RPF invaded Rwanda from Uganda, starting the Rwandan civil war. Fighting between the Hutu-led gov-
ernment and the Tutsi rebels continued until the Arusha Accords were signed in August 1993.4 While a
multi-party system had been installed in the early phase of the peace talks, this had little (or no) effect
on reducing societal tension and conflict. In April 1994, President Habyarimana’s plane was shot down
over Kigali. This event is widely seen as the starting point of the Rwandan genocide, which was carried
out during approximately 100 days, with the result of around 800,000 Tutsis and moderate Hutus being
killed.
A vast number of civilian Hutus took part in the genocide violence, directed by the interim government
(Dallaire, 2005). In our sample, there are approximately 416,000 civilian perpetrators.
2.2 Umuganda
The practice of Umuganda dates back to pre-colonial times. During a day of community service, vil-
lagers would get together to build houses for those not able to, or help each other out on the fields in
times of economic hardship such as sickness or death within families (Mukarubuga, 2006). Rather than
being mandatory, Umuganda was initially considered a social obligation (Melvern, 2000). This changed
during the the colonial period, when the Belgian colonizers used Umuganda for organizing compulsory
work. Consistently, the local term for Umuganda was now uburetwa, or forced labor (IRDP 2003). All
men had to provide communal work 60 days per year. Most of the manual labor was hereby carried out
by members of the ethnic majority (Hutu) under the supervision of Tutsi chiefs (Pottier 2006): a first
sign of Umuganda’s potential to create a division between the two ethnic groups.
During the post-colonial era from 1974 and onwards, the meaning of Umuganda changed again when the
newly elected Hutu president Habyarimana turned it into a political doctrine (Mamdani, 2001). Verwimp
(2000, pp. 344) cites Habyarimana:
The doctrine of our movement [Movement for Development, MRND] is that Rwanda will
only be developed by the sum of the efforts of its people. That is why it has judged the
collective work for development a necessary obligation for all inhabitants of the country.
The program combined a practical motivation - achieving development objectives with weak state fi-
nances - with a strong ideological element. Participation was again compulsory through government
4The essence of this treaty was a power-sharing government, including representatives from both sides of the conflict.
5

coercion, and failure to participate usually involved paying a fine.5 The local leaders of the neighbor-
hood who preceded over a group of ten households were responsible for the weekly Umugandas and
had the power to decide who were to participate and to demand fines from those failing to participate
(Verwimp, 2000). The state chose the projects on which at least one adult male per family had to work
on every Saturday morning (Uvin, 1998). According to a report from 1986: 56% of the work performed
during Umuganda was concerned with various types of anti-erosion measures, such as terracing and
digging ditches; 15% was construction of communal buildings; 21% consisted in maintenance work of
communal roads; 3% was related to construction of water supply systems, and another 3% was related
to agriculture. In this period, Umuganda substantially contributed to Rwanda’s GDP (Guichaoua 1991).
Habyarimana’s ideology stressed the importance of the cultivator as the true Rwandan (Straus, 2006).
This view clearly embraced the Hutu population with their history as cultivators, as opposed to the
Tutsi who were said to be pastoralists. In fact, during the period leading up to the genocide, Umu-
ganda was used to strengthen group cohesion within the ”indigenous” ba-Hutu and marginalize the
”non-indigenous” ba-Tutsi (Lawrence & Uwimbabazi 2013). The patriotic focus of Umuganda became
particularly salient in the early 1990’s when ”government propaganda gave no choice to Rwandans other
than to attend Umuganda for political mobilization” (Lawrence & Uwimbabazi 2013, pp. 253). Further-
more, ”..those who could not attend were regarded as enemies of the country who ran the risk of being
brutalised and killed” (ibid.).
Although little is known about the link between participation in Umuganda before the genocide and
participation in violence during the genocide - a link which we hope to shed new light on in this paper
- anecdotal evidence speaks to the importance of Umuganda as an instrument for local party and state
officials to mobilize the peasant population. The fact that all Rwandans of working age, be it farmers or
intellectuals, were required to participate in Umuganda (Guichaoua ,1991) made it a potential arena for
reaching out broadly to the entire population. Verwimp (2013, pp. 40) notes:
Umuganda gave the local party and state officials knowledge and experience in the mobi-
lization and control of the labor of the peasant population. A skill that [would] prove deadly
during the genocide.
Although a correlation, Straus (2006) shows that 88 percent of the perpetrators he interviewed took part
in Umuganda on a regular basis before the genocide broke out. The practice of Umuganda was also used
during the genocide itself but it was then replaced by gukorn akazi, or ”do the work”, which meant the
5In today’s Rwanda, the fine for not participating in Umuganda is slightly less than $10.
6

killing of Tutsis (Verwimp, 2013). Other slogans related to Umuganda used before the genocide such
as ”clearing bushes and removing bad weeds” now had a completely altered connotation (Lawrence &
Uwimbabazi, 2013). By equating the participation in genocide violence with participation in Umuganda,
the Hutu elite could signal that participation in genocide violence, just like participation in Umuganda,
was a social obligation for all ’true’ Rwandans.
In 2008, the Tutsi-led government re-introduced Umuganda in Rwanda with the general aim to promote
development and reduce poverty in the aftermath of the genocide (Uwimbabazi, 2012). Participation
is again mandatory for all able-bodied individuals between 18 and 65 years of age, and typical tasks
include cleaning streets, cutting grass and trimming bushes along roads, repairing public facilities or
building houses for vulnerable persons on the last Saturday of every month.
3 Data
We combine several datasets from different sources to construct our final dataset, which comprises 1433
Rwandan sectors. Sectors are the second smallest administrative level, and the level for which the out-
come data on perpetrators is available.6
3.1 Participation Rates
Our two key measures are participation in civilian violence and organized violence. Since no direct
measure of participation rates is available, we use prosecution rates for crimes committed during the
genocide as a proxy (Yanagizawa-Drott, 2014; Friedman, 2013; Heldring, 2014; Rogall, 2014). These
data are taken from a nation-wide sector-level dataset, provided by the government agency ”National
Service of Gacaca Jurisdiction”, which records the outcome of the almost 10.000 Gacaca courts set up
all over the country. Depending on the role played by the accused and on the severity of the crime, two
different categories of perpetrators are identified.
The first category which we refer to as ”organized participants” concerns: (i) planners, organizers, insti-
gators, supervisors of the genocide; (ii) leaders at the national, provincial or district level, within political
parties, army, religious denominations or militia; (iii) the well-known murderer who distinguished him-
self because of the zeal which characterized him in the killings or the excessive wickedness with which
killings were carried out; (iv) people who committed rape or acts of sexual torture. These perpetrators
mostly belonged to army and militia or were local leaders. There were approximately 77.000 people
6See Section 3.3 for a further discussion on matching the data.
7

prosecuted in this category.7
The second category which we refer to as ”civilian participants” concerns: (i) authors, co-authors, ac-
complices of deliberate homicides, or of serious attacks that caused someone’s death; (ii) the person who
- with intention of killing - caused injuries or committed other serious violence, but without actually
causing death; (iii) the person who committed criminal acts or became accomplice of serious attacks,
without the intention of causing death. People accused in this category are not members of any of the
organized groups listed for the first category and are thus considered to be civilians in this paper. Ap-
proximately 430.000 people were prosecuted in this category. As mentioned, the second category is our
main outcome variable since civilian participation in the killings is more likely to have been affected by
Umuganda than organized participation.
The reliability of the prosecution data is a key issue for the analysis. One concern when using pros-
ecution data instead of actual participation is the presence of survival bias: in those sectors with high
participation rates, the violence might have been so widespread that no witnesses were left, or the few
remaining too scared to identify and accuse the perpetrators, resulting in low prosecution rates. This
concern is, however, unlikely to be warranted: Friedman (2013) shows that the Gacaca data is positively
correlated with several other measures of violence from three different sources.8 Furthermore, Friedman
(2013, pp. 19-20) notes that ”the Gacaca courts have been very thorough in investigating, and reports
of those afraid to speak are rare, so this data is likely to be a good proxy for the number of participants
in each area”. Nevertheless, to be cautious, in the following analysis we will show that our results are
robust to dropping those sectors with mass graves (an indication of high death rates).
Another concern is that some of those prosecuted in the Gacaca courts committed their crimes not during
the genocide, but rather during the period of civil war preceding the genocide (October 1990 until August
1993). Although the bulk of the crimes treated in the Gacaca courts concerns acts committed during the
genocide, we cannot rule out that (a) some perpetrators may in fact have been accused for participation
in massacres and other violence during the civil war (and not during the genocide), and (b) that individ-
uals who had previously participated in violent acts during the civil war were more likely to have been
recognized and trialled for genocide crimes than individuals who participated ”only” in the genocide. In
order to mitigate this concern, we also present results where we exclude communes where major violent
7Since we lose some observations for category 1 and cateogory 2 in the matching process, our sample consists of 415,935category 2 perpetrators and 74,168 category 1 perpetrators.
8These sources are a 1996 report from the Ministry of Higher Education, Scientific Research, and Culture (Kapiteni, 2006);the PRIO/Uppsala data on violent conflicts (Gleditsch et al, 2002); and a database of timing and lethality of conflict fromDavenport and Stam (2007).
8
events occurred during Oct 1990-Mar 1994 (Viret, 2010). We use only the acts of violence directed
toward Tutsis since violent crimes by Tutsis directed toward Hutus were not trialled in the Gacaca courts
(Human Rights Watch, 2011; Longman, 2009).
3.2 Rainfall Data
We use the recently released National Oceanic and Atmospheric Administration (NOAA) database of
daily rainfall estimates, which stretches back to 1983, as a source of exogenous weather variation. The
NOAA data relies on a combination of actual weather station gauge measures and satellite information
on the density of cloud cover to derive rainfall estimates at 0.1-degree (∼ 11 kilometers at the equator)
latitude-longitude intervals. Considering the small size of Rwanda this high spatial resolution data, to
our knowledge the only one available, is crucial to obtaining reasonable rainfall variation. Furthermore,
the high temporal resolution, i.e. daily estimates, allows us to confine variation in rainfall to the exact
days of Umuganda. Since Rwanda is a very hilly country there is considerable local variation in rainfall.
Also, these sectors criss cross the various rainfall grids and each sector polygon is thus likely to overlap
with more than one rainfall grid. The overall rainfall in each sector is thus obtained through a weighted
average of the grids, where the weights are given by the relative areas covered by each grid.
The true functional form relating rainfall to attendance and participation in mandatory community work
is unknown. However, we argue that it is reasonable to assume that in the case of heavy rainfall it is
difficult to perform outdoor work such as terracing and road construction, and we will therefore use the
number of Saturdays with heavy rainfall to capture the relationship between rainfall and participation in
Umuganda. This is a similar approach to that used in Madestam et al. (2013) where they argue that areas
with more than 0.1 inches (2.5 millimeter) of rainfall had lower attendance in the Tea Party Tax Day
rally held in the U.S. on April 15, 2009. While a 2.5 mm threshold may be appropriate to capture lower
participation in a voluntary rally in the U.S., we believe that our context requires a higher threshold,
which corresponds to heavy rainfall rather than a light drizzle.9 We will therefore use the number of
Saturdays (and all other weekdays), in October 1990 through March 1994, each sector received more than
10 mm of rainfall as a our main explanatory variable.10 The choice of 10 mm as our rainfall threshold
is based on the definition for extreme weather shocks used in Harari and La Ferrera (2013), where an
9Madestam et al. (2013) also use 0.35 inches (≈ 9 mm) as a robustness check for a higher threshold of rainfall. In Table 2,we show that our results are robust to using this threshold as well.
10Our results are robust to controlling for the sum of all weekdays (Sun-Sat) with rainfall above 10 mm, instead of, as in ourmain specification, controlling separately for each weekday. The effect of heavy rainfall on Saturdays is then slightly larger.These results are available upon request. In Appendix, Table 11, we show that our results are also robust to estimating a linearspecification with average daily rainfall on Saturdays and all other weekdays as our main explanatory variables.
9
extreme weather shock is defined as two standard deviations from the long-term average.11 However, as
a robustness check, we will also examine other thresholds. More specifically, we will present our main
results and sensitivity checks using the number of Saturdays and all other weekdays with rainfall above
6 mm, 8 mm and 12 mm, respectively. In addition to this, Figure 2 in Appendix shows the sensitivity of
the point estimate in our main specification as we change the threshold from 5 mm to 15 mm.12
3.3 Matching of data and summary statistics
The different data sets are matched by sector names within communes. Unfortunately, the matching
is imperfect, since some sectors either have different names in different data sources, or use alternate
spelling. It is not uncommon for two or more sectors within a commune to have identical names, and this
prevents successful matching. However, overall only about 5 percent of the sectors cannot be correctly
matched across all sources. Furthermore, as these issues are idiosyncratic, the main implication for our
analysis is lower precision in the estimates than otherwise would have been the case. Table 6 in the
Appendix reports the summary statistics for our variables.
4 Empirical Strategy
To identify the effect of Umuganda meetings on participation in genocide violence, we use local variation
in rainfall as a proxy. Since we lack data on the number of people participating in Umuganda, we will
focus on the reduced form effect.
4.1 Identifying assumptions
Our identification strategy rests on two assumptions. First, sectors with heavier rainfall on Saturdays
experienced fewer or less intensive Umuganda meetings (first stage). Second, conditional on our control
variables, rainfall on Saturdays does not have a direct effect on genocide violence other than through the
Umuganda meetings (exclusion restriction).
11The long-term average daily rainfall in Rwanda, 1984-1994, was 2.6 mm with a standard deviation of 3.8 mm. This iscalculated taking the average across all sectors in Rwanda for each day, and then taking the average across all days in 1984-1994. Two standard deviations from the long-term average corresponds to 10.24 mm.
12The thresholds 8 mm and 12 mm correspond to the average of the 95th and the 99th value of daily rainfall in Rwanda overthe period 1984-1994. This follows the methodology used by Dyson (2009) who, in order to understand the characteristics ofheavy rainfall over the Guateng province in South Africa, defines heavy and very heavy rainfall as the average of the 95th and99th value of daily rainfall, respectively.
10

4.1.1 First Stage
Ideally, we would like to directly test a first stage relationship using data on the number of people partici-
pating in Umuganda before the genocide. Since such data does not exist, we will instead provide indirect
evidence for expecting a strong first stage.
Several other studies have documented and exploited negative relationships between rainfall and par-
ticipation in open-air events. The estimation strategy used in this paper is similar to the ones used in
Madestam et al. (2013), and Madestam and Yanagizawa-Drott (2011). The first of these two studies
evaluates the effect of the Tea Party movement’s protests during Tax Day in the US on several policy
outcomes, and instruments for lower participation using rainfall on that particular day. The second study
uses rainfall during 4th of July in the US as a proxy for lower participation in the celebrations and esti-
mates the effect of participation on political values and voting behavior later in life. In a similar vein,
Collins and Margo (2007) use rainfall in April 1968 as an instrument for participation in the riots that
erupted in the US after Martin Luther King was murdered. Moreover, there are many studies which use
rainfall and other weather phenomena for exogenous variation in voter turnout on election days (Gomez
et al., 2007; Horiuchi and Saito, 2009; Hansford and Gomez, 2010; Fraga and Hersh, 2011; Eisinga et al.,
2012). However, in these cases, rain has an effect both on the direct cost of voting and on the opportunity
cost of voting. Lind (2014) for example finds that voter turnout in Norway increases due to rain on the
election day, explained by the lower opportunity cost of going to the polling station when weather is bad.
The presence of such a mechanism is however highly unlikely when it comes to Umuganda due to its
mandatory nature. Rather, rainfall would make the meetings and the work less productive, or even lead
to cancellations. Furthermore, the typical tasks carried out during Umuganda would have been hard to
perform during heavy rainfall. The meetings, as well as the work, took place outside, and as mentioned
above, the bulk of the tasks were related to landscaping, road maintenance, construction, and agriculture
(Guichaoua, 1991).
Since we cannot know whether rainfall affected the extensive or the intensive margin of Umuganda
meetings, we account for these possible nonlinearities by counting the number of Saturdays for which
total rainfall was above a certain threshold. Varying these thresholds will give us an indication of whether
rainfall lead to cancellations or rather made the meetings less enjoyable. On the one hand, if we see
effects at low thresholds, it speaks to less enjoyable meetings. If, on the other hand, the effects set in
only at higher levels, cancellations are more likely to be driving the results.13 Average daily rainfall
13Figure 2 in Appendix shows the sensitivity of the point estimate in our main specification as we change the threshold from5 mm to 15 mm.
11

in Rwanda is however low (see Table 6 in Appendix), which means that for very high thresholds, the
variation will be too small to detect any effects.
4.1.2 Exclusion Restriction
Our empirical strategy relies on the counterfactual assumption that, absent the Umuganda meetings,
rainfall on Saturdays had no effect on genocide violence. This is unlikely to be true without further
precautions. Since rainfall affects agricultural output and this in turn has an important impact on socio-
economic outcomes in a context like Rwanda where the vast majority of the population is subsistence
farmers, our proxy is likely to be correlated with household income which Friedman (2013) showed to
be correlated with genocide participation. In addition to affecting agricultural outcomes, heavy rainfall
might destroy infrastructure such as roads or housing, which is also likely to affect households’ economic
well-being. Income, in return, potentially affects genocide participation as reasons for participating were
often driven by material incentives and genocide perpetrators were given an opportunity to loot the prop-
erty of the victims, or through enabling people to bribe themselves out of participating (Hatzfeld, 2005).
To address this problem, and to solely isolate the Saturday rainfall effect, we control for average daily
rainfall during January 1984 through September 1990, and our period of interest: October 1990 - March
1994. Furthermore, we also control for rainfall on the other six weekdays. The absence of systematic,
significant effects for other days than Saturdays would be a strong placebo test. To account for local
characteristics we also add 142 commune indicators. Thus, the results shown only use local variation.
At this point, we still need to argue that no other events potentially happening parallel to Umuganda on
Saturdays could be driving our results. In particular, one might worry that people meeting and interacting
in general might affect participation in genocide violence. In the results section below, we will provide
several tests alleviating this concern. First, we will show that neither heavy rainfall on Sundays, the
weekday when people traditionally meet in church, nor heavy rainfall on public holidays, have an effect
on genocide violence. Second, we will show that our results are robust to excluding the province Kigali
Ville, where the capital is located. This is the most densely populated area of Rwanda and the economic
and political center of the country, and therefore likely to have seen more public events.
12
4.2 Specifications
We run the following reduced-form regression to estimate the effect of Umuganda meetings on partici-
pation in genocide violence
(1)Pic
Hic= α +β #Saturdays(rain > t mm)+Xicπ + γc + εic
where Pic/Hic is the share of Hutu prosecuted in either category 1 or category 2, i.e. our proxy for geno-
cide violence in sector i in commune c. #Saturdays(rain > t mm) is our explanatory variable of interest:
the number of Saturdays in October 1990-March 1994 with total rainfall above t mm. Xic is a vector
of sector-specific controls, including average daily rainfall January 1984-September 1990, average daily
rainfall October 1990-March 1994, and the number of all other weekdays with rainfall above t mm dur-
ing October 1990-March 1994. Finally, γc are commune indicators, and εic is the error term. We allow
the error terms to be correlated across sectors within the same commune by clustering the standard errors
on commune level, and also use specifications where we allow for correlation across sectors within a 25,
50 and 75 km radius, following Conley (1999). Moreover, since the prosecution rates are heavily skewed
to the right, we weight our observations based on total sector population size before the genocide, but
our results do not rely on this weighting scheme.
Running a weighted least squares (WLS) regression, with the share of prosecuted Hutus as the dependent
variable and population size as weights, the coefficient β will capture the percentage point change in
genocide participation following an additional Saturday with rainfall above t mm. Our main specification
uses 10 mm as a measure of heavy rainfall, but our results are robust to using other rainfall thresholds.
5 Results
5.1 Main Effects
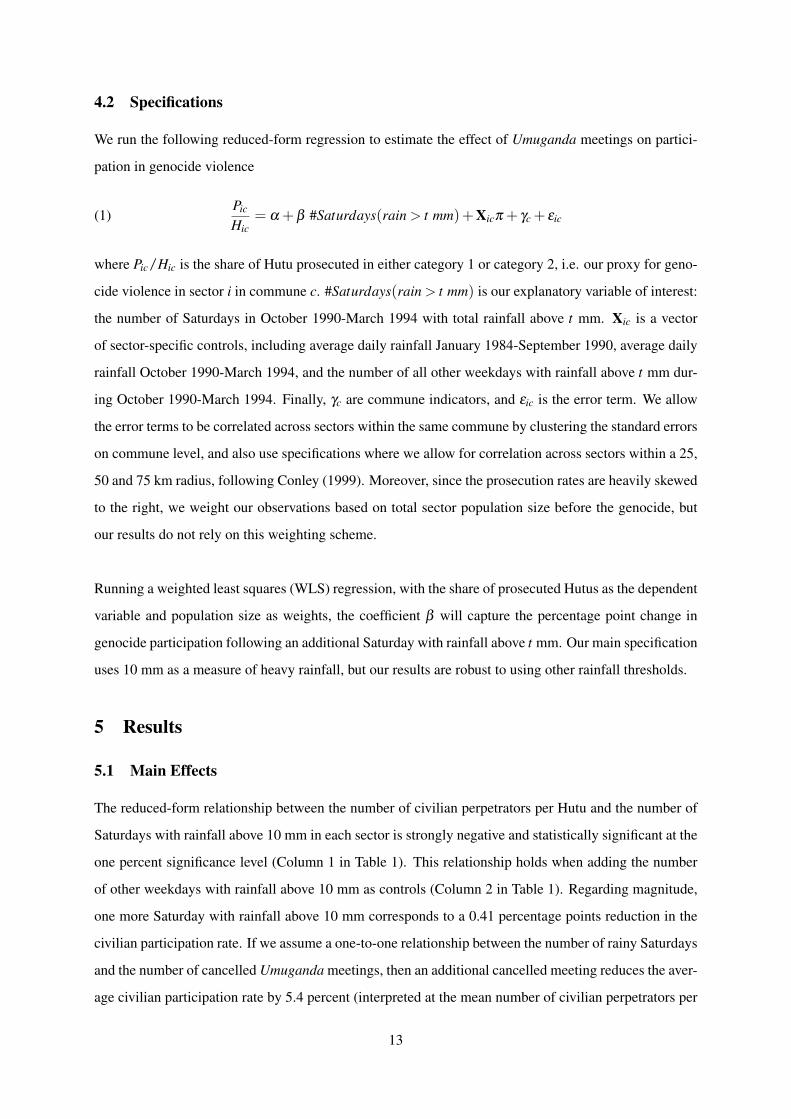
The reduced-form relationship between the number of civilian perpetrators per Hutu and the number of
Saturdays with rainfall above 10 mm in each sector is strongly negative and statistically significant at the
one percent significance level (Column 1 in Table 1). This relationship holds when adding the number
of other weekdays with rainfall above 10 mm as controls (Column 2 in Table 1). Regarding magnitude,
one more Saturday with rainfall above 10 mm corresponds to a 0.41 percentage points reduction in the
civilian participation rate. If we assume a one-to-one relationship between the number of rainy Saturdays
and the number of cancelled Umuganda meetings, then an additional cancelled meeting reduces the aver-
age civilian participation rate by 5.4 percent (interpreted at the mean number of civilian perpetrators per
13
Hutu, which is 7.7 percent). Reassuringly, none of the other weekdays is systematically and significantly
related to violence, and an F-test confirm the hypothesis that all other weekdays are jointly equal to zero.
The p-value of this F-test is equal to 0.937, indicating that the other weekdays explain very little of the
variation in civilian participation.
The results for organized perpetrators are weaker. This is not surprising. Since this category (organized
perpetrators) to a large extent consists of members of the militia, it is not clear that the sector where they
committed their genocide crimes (and were subsequently prosecuted in) is the same sector as the one
where they lived before the genocide (October 1990-March 1994). This would then mean that they will
not have been exposed to the same number of Umugandas as the inhabitants of that sector. If this is the
case, it will have the same effect on our analysis as if our rainfall variables were measured with error and
our estimate would suffer from attenuation bias.14
Table 1: Main Specification
Dependent variable: Cat 2 per Hutu Cat 1 per Hutu
(1) (2) (3) (4)
Number Sat>10 -0.00426*** -0.00410*** -0.00067** -0.00059**(0.00126) (0.00128) (0.00033) (0.00030)
Number Sun>10 0.00037 -0.00040(0.00104) (0.00031)
Number Mon>10 0.00079 0.00096***(0.00110) (0.00031)
Number Tue>10 0.00019 -0.00049*(0.00085) (0.00029)
Number Wed>10 0.00030 0.00003(0.00114) (0.00028)
Number Thu>10 -0.00011 -0.00065(0.00134) (0.00041)
Number Fri>10 -0.00056 0.00003(0.00096) (0.00026)
Standard controls yes yes yes yesCommune FE yes yes yes yes
R2 0.52 0.52 0.36 0.37N 1433 1433 1433 1433
* p<0.10, ** p<0.05, *** p<0.01.Notes: Results from weighted least squares (WLS) estimation use population sizeas weights, and the number of perpetrators per Hutu as the dependent variable.All models include average daily rainfall Jan 1984-Sep 1990, average daily rain-fall Oct 1990-Mar 1994, and 142 commune indicators. Robust standard errors inparentheses are adjusted for clustering at the commune level.
14Since our main focus in this paper is to examine if Umuganda can explain local variation in civilian violence, we willfocus on this category in our following sensitivity analysis. We will however, report the corresponding results for organizedperpetrators in the Appendix.
14

5.1.1 Sensitivity Check of Rainfall Threshold
To understand whether rainfall lead to cancellations, or rather made the Umuganda meetings less enjoy-
able, we vary the threshold in increments of 2 mm; from 6 mm to 12 mm. Following Madestam et al.
(2013), we also use 0.35 inches (which corresponds to 9 mm) as a threshold. Table 2 reports the results
for civilian participation. Heavy rainfall on Saturdays is negatively related to civilian participation and
significant on at least the 5 percent significance level for all thresholds above 6 mm, suggesting that it
was rather cancellation that lead to a decrease in violence. Again, we find no other significant effects
for other weekdays. The p-value of the F-test that the coefficients of all other weekdays are equal to
zero ranges from 0.34 to 0.97, i.e. we cannot reject that they are jointly equal to zero for all different
thresholds.
Table 2: Robustness - Different Rain Thresholds - Category 2
Dependent variable: Cat 2 per Hutu
Number rainy days above: 6 mm 8 mm 9 mm 10 mm 12 mm
(1) (2) (3) (4) (5)
Saturday -0.00142 -0.00241* -0.00250* -0.00409*** -0.00385***(0.00115) (0.00140) (0.00141) (0.00128) (0.00132)
Sunday 0.00080 0.00068 0.00073 0.00041 -0.00043(0.00084) (0.00124) (0.00117) (0.00102) (0.00137)
Monday 0.00069 0.00009 0.00079 0.00080 -0.00053(0.00088) (0.00118) (0.00117) (0.00112) (0.00120)
Tuesday -0.00020 0.00000 0.00069 0.00023 0.00135(0.00128) (0.00123) (0.00099) (0.00084) (0.00123)
Wednesday 0.00003 0.00043 -0.00065 0.00031 -0.00058(0.00093) (0.00111) (0.00106) (0.00111) (0.00118)
Thursday 0.00129 0.00004 0.00140 -0.00007 -0.00233**(0.00096) (0.00107) (0.00123) (0.00134) (0.00107)
Friday -0.00048 0.00106 -0.00079 -0.00057 -0.00216(0.00086) (0.00094) (0.00086) (0.00099) (0.00137)
Standard controls yes yes yes yes yesCommune FE yes yes yes yes yes
R2 0.51 0.51 0.51 0.52 0.52N 1433 1433 1433 1433 1433
* p<0.10, ** p<0.05, *** p<0.01.
Notes: Results from weighted least squares (WLS) estimation use population size as weights, andthe number of category 2 perpetrators per Hutu as the dependent variable. All models includeaverage daily rainfall Jan 1984-Sep 1990, average daily rainfall Oct 1990-Mar 1994, and communeindicators. Main explanatory variables are number of weekdays in Oct 1990-Mar 1994 with rainfallabove 6, 8, 9, 10, and 12 mm, respectively. Robust standard errors in parentheses are adjusted forclustering at the commune level.
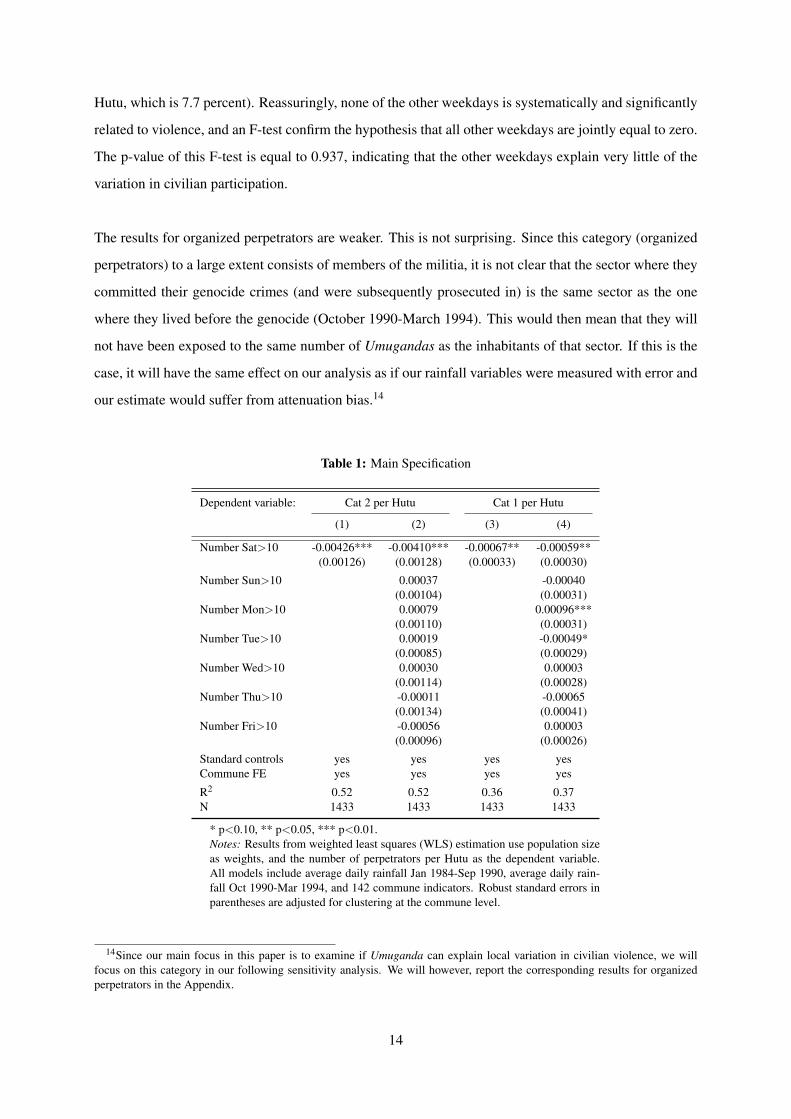
5.2 Exclusion Restriction
Throughout our period of interest (1990-94), violent acts targeted at Tutsis and moderate Hutus were
already taking place. If these pre-genocide perpetrators are included in the Gacaca data, and there is a
15

relationship between rainfall before the genocide and targeted violence during this period, our estimates
might be biased. To rule out that the estimates are not picking up the effects of rainfall in 1990-94 on
violent events during the same time period, we exclude communes where targeted violence took place
before the genocide, identified from Viret (2010). Reassuringly, our results for civilian participation are
robust to excluding these pre-violence communes (Column 1 in Table 3).
In addition to this, there is a concern that our estimate is picking up other events that potentially also
take place on Saturdays. While we cannot perfectly test this concern, we perform several robustness
checks aiming to exclude this possibility. First, as seen in Table 1, we find no significant effect for
Sunday rainfall. Since people traditionally attend church on Sundays, this rules out that our effect is
solely the result of people meeting and thus driven by events other than Umuganda. Second, in similar
vein, when we rerun our main specification, but also control for the number of public holidays (excluding
Saturdays since these might still be subject to Umuganda) with rainfall above 10 mm, the coefficient on
Saturday rainfall remain significant and none of the coefficients on public holiday rainfall are statistically
significant. This is true both when adding the total number of public holidays (column 2 in Table 3)
and public holidays separated into religious and non-religious holidays (column 3 in Table 3). The
estimated coefficients might appear large at first, however when expressed in term of standard-deviations
the numbers are small. While a one-standard deviation increase in the number of rainy Saturdays reduces
civilian violence by 1.7 percentage points, a one standard-deviation increase in the number of rainy public
holidays reduces civilian violence only by 0.1 percentage points.
16
Table 3: Exclusion Restriction
Dependent variable: Cat 2 per Hutu
Sample: Excl. Pre-Violence Full Sample
(1) (2) (3)
Number Sat>10 -0.00483*** -0.00408*** -0.00391***(0.00148) (0.00124) (0.00121)
Number Sun>10 0.00051 0.00040 0.00045(0.00123) (0.00105) (0.00107)
Number Mon>10 0.00117 0.00081 0.00076(0.00127) (0.00107) (0.00107)
Number Tue>10 0.00002 0.00026 0.00036(0.00098) (0.00097) (0.00095)
Number Wed>10 -0.00023 0.00029 0.00030(0.00122) (0.00115) (0.00113)
Number Thu>10 0.00121 -0.00010 -0.00004(0.00153) (0.00134) (0.00134)
Number Fri>10 -0.00013 -0.00049 0.00007(0.00113) (0.00115) (0.00132)
Num Public Holidays >10 -0.00541(0.02395)
Num Non-Religious Public Holidays >10 -0.01340(0.01768)
Num Religious Public Holidays >10 -0.05314(0.03878)
Standard controls yes yes yesCommune FE yes yes yes
R2 0.49 0.52 0.52N 1213 1433 1433
* p<0.10, ** p<0.05, *** p<0.01.Notes: Results from weighted least squares (WLS) estimation use population size as weights,and the number of perpetrators per Hutu as dependent variable. All models include average dailyrainfall Jan 1984-Sep 1990, average daily rainfall Oct 1990-Mar 1994, and commune indicators.Column 1 and 3 control for number of public holidays with rainfall above 10 mm, excludingpublic holidays that fell on a Saturday. Column 1 excludes communes where violent acts havebeen reported for the period Oct 1990-Mar 1994. Column 2 includes number of public holidayswith rainfall above 10 mm during the same period, excluding those on a Saturday. Column 3separately controls for the number of religious and non-religious public holidays with rainfallabove 10 mm. Robust standard errors in parentheses are adjusted for clustering at the communelevel.
5.3 Robustness Checks
Next, we perform a number of robustness checks, all reported in Table 4. To make sure that our re-
sults are not driven by potential survival bias in the prosecution data, we exclude villages where mass
graves have been found (since this is an indication of high death rates). We also exclude the sectors in
Kigali Ville. This is the province where the capital city of Rwanda, Kigali, is located. The coefficients
on Saturday rainfall are virtually identical to our baseline results and similarly significant at 99 percent
confidence (Columns 2-3 in Table 4).
17

Table 4: Robustness - Excl. Massgraves and Kigali Ville
Dependent variable: Cat 2 per Hutu
Sample: Full Sample Excl. Mass graves Excl. Kigali Ville
(1) (2) (3)
Number Sat>10 -0.00410*** -0.00403*** -0.00419***(0.00128) (0.00130) (0.00128)
Number Sun>10 0.00037 0.00051 0.00031(0.00104) (0.00105) (0.00104)
Number Mon>10 0.00079 0.00056 0.00078(0.00110) (0.00106) (0.00111)
Number Tue>10 0.00019 0.00072 0.00021(0.00085) (0.00086) (0.00086)
Number Wed>10 0.00030 0.00028 0.00019(0.00114) (0.00109) (0.00120)
Number Thu>10 -0.00011 -0.00013 0.00011(0.00134) (0.00128) (0.00128)
Number Fri>10 -0.00056 -0.00013 -0.00037(0.00096) (0.00094) (0.00099)
Standard controls yes yes yesCommune FE yes yes yesR2 0.52 0.51 0.52N 1433 1367 1422
* p<0.10, ** p<0.05, *** p<0.01.Notes: Results from weighted least squares (WLS) estimation use populationsize as weights, and the number of perpetrators per Hutu as the dependent vari-able. All models include average daily rainfall Jan 1984-Sep 1990, averagedaily rainfall Oct 1990-Mar 1994, and commune indicators. Column 1 is ourmain specification for category 2 per Hutu. Column 2 excludes 66 sectorswhere at least one mass grave has been found. Column 3 excludes the 11 sec-tors in the province Kigali Ville. Robust standard errors in parentheses areadjusted for clustering at the commune level.
Finally, as a placebo check, we re-estimate the reduced-form regressions by replacing pre-genocide rain-
fall with rainfall in the period of October 1994-March 1998 (from here on denoted post-genocide period),
and by adding the post-genocide rainfall to our main specification. To account for possible seasonality
in the rainfall data, we have chosen the exact same calendar period as our period of interest (i.e. October
1, 1990 until March 31, 1994). Table 5 reports the results. Reassuringly, we see that the coefficients on
Saturdays are small and insignificant throughout.
18

Table 5: Placebo Rainfall Oct 1994-Mar 1998
Dependent variable: Cat 2 per Hutu
(1) (2) (3)
Number Sat>10 -0.00410*** -0.00449***(0.00128) (0.00126)
Number Sun>10 0.00037 0.00050(0.00104) (0.00112)
Number Mon>10 0.00079 0.00111(0.00110) (0.00101)
Number Tue>10 0.00019 0.00062(0.00085) (0.00087)
Number Wed>10 0.00030 0.00058(0.00114) (0.00136)
Number Thu>10 -0.00011 0.00054(0.00134) (0.00144)
Number Fri>10 -0.00056 -0.00031(0.00096) (0.00102)
Number Sat> 10 1994-1998 -0.00017 0.00002(0.00105) (0.00109)
Number Sun> 10 1994-1998 0.00122 0.00101(0.00111) (0.00109)
Number Mon> 10 1994-1998 -0.00275** -0.00317**(0.00119) (0.00140)
Number Tue> 10 1994-1998 -0.00155 -0.00101(0.00110) (0.00106)
Number Wed> 10 1994-1998 -0.00173 -0.00237(0.00153) (0.00156)
Number Thu> 10 1994-1998 -0.00125 -0.00115(0.00125) (0.00129)
Number Fri> 10 1994-1998 0.00121 0.00197*(0.00110) (0.00102)
Standard controls yes yes yesCommune FE yes yes yesR2 0.52 0.51 0.52N 1433 1433 1433
* p<0.10, ** p<0.05, *** p<0.01.Notes: Results from weighted least squares (WLS) estimation use populationsize as weights, and the number of perpetrators per Hutu as the dependentvariable. All models include average daily rainfall Jan 1984-Sep 1990, av-erage daily rainfall Oct 1990-Mar 1994, and commune indicators. Column1 is our main specification for category 2. Column 2 instead uses numberof weekdays with rainfall above 10 mm during Oct 1994-Mar 1998 as themain explanatory variables. Column 3 adds the number of weekdays withrainfall above 10 mm during Oct 1994-Mar 1998 as additional control to ourmain specification. Robust standard errors in parentheses are adjusted forclustering at the commune level.
6 Discussion and Conclusion
Using heavy rainfall on the day of the mandatory community-work meeting, Umuganda, as a proxy for
lower intensity in the meetings at the sector level, we find that less intensity in the community work
decreased the share of civilian perpetrators in the Rwandan genocide by around 5 percent. Our results
19

suggest that the political elites in Rwanda used these local-level community meetings to make civilians
participate in extraordinary violence. This finding is important for several reasons.
First, a large number of civilians took part in the killings during the Rwandan genocide. It is a common
understanding that the genocide was centrally planned and organized. The link between the planning and
the wide acceptance of the genocide among the civilian population has however not been much explored,
and our paper sheds new light on an important channel.
Second, people getting together to create public goods would foster a sense of belonging and create
social capital, generally viewed as positive for development and community building (see for example
Knack and Keefer, 1997; Grootaert and van Bastelaer, 2002; Guiso, Sapienza and Zingalez, 2008). As
emphasized by Putnam (2000), social capital can bridge the divides in a society. However, similar to
Satyanath, Voigtlaender and Voth (2013) who find that a higher density of civic associations in interwar
German cities lead to a faster entry by the Nazi Party, we also show evidence of a ‘dark side’ of social
capital. Thus, although the institution of Umuganda may have the potential to act as a community build-
ing force, our results show that when placed in the wrong hands its effects could become disastrous.
The more optimistic view of this institution might explain why the current Rwandan government rein-
stalled Umuganda in 2008. Indeed, the official statements about Umuganda emphasize values such as
”solidarity” and ”reconciliation”, and the practice is said to contribute to fostering a sense of commu-
nity. These mandatory work days are now held monthly, on the last Saturday of every month. A similar
practice is also present in Burundi and is being discussed in DR Congo. Our analysis clearly shows that
caution is warranted, perhaps especially in countries with a long history of ethnic tension.
20
References
[1] Besley, T. and T. Persson. 2011. The Logic of Political Violence, Quarterly Journal of Economics,
126(3): 1411-1445.
[2] Blattman, C. and E. Miguel. 2010. Civil War, Journal of Economic Literature, 48(1), 3-57.
[3] Bruckner M. and A. Ciccone. 2010. Rain and the Democratic Window of Opportunity, Economet-
rica, 79(3): 923-947.
[4] Chaney, E. 2013. Revolt on the Nile: Economic Shocks, Religion, and Political Power, Economet-
rica, 81(5): 2033-2053.
[5] Collins W. J. and R. A. Margo. 2007. The Economic Aftermath of the 1960s Riots in American
Cities: Evidence from Property Values. The Journal of Economic History, 67, 849-883
[6] Conley, T. G. 1999. GMM Estimation with cross sectional Dependence, Journal of Econometrics,
92(1):1-45.
[7] Dallaire, R. 2003. Shake hands with the devil, Random House Canada.
[8] Davenport, C. and A. Stam. 2009. Rwandan Political Violence in Space and Time, mimeo
[9] Dell, M. 2011. Trafficking Networks and the Mexican Drug War, mimeo.
[10] Des Forges, A. 1999. Leave None to Tell the Story: Genocide in Rwanda, Human Rights
Watch and the International Federation of Human Rights Leagues, New York, NY, USA.
www.hrw.org/legacy/reports/1999/rwanda/
[11] Dube, O. and J. F. Vargas. 2013. Commodity Price Shocks and Civil Conflict: Evidence from
Colombia, Review of Economic Studies, 80(4): 1384-1421.
[12] Dyson, L. L. 2009. Heavy Daily Rainfall Characteristics in the Guateng Province, Water Research
Council, 2009-10.
[13] Eisinga, R., M. Grotenhuis and B. Pelzer 2012. Weather Conditions and Political Party Vote
Share in Dutch National Parliament Election, 1971-2010, International Journal of Biometeorology,
56, 1161-1165.
[14] Fraga, B. and E. Hersh 2011. Voting Costs and Voter Turnout in Competitive Elections, Quarterly
Journal of Political Science, 5, 339-356.
21

[15] Friedman, W. 2013. Local Economic Conditions and Participation in the Rwandan Genocide,
mimeo.
[16] Gleditsch, N. P., P. Wallensteen, M. Eriksson, M. Sollenberg, and H. Strand. 2002. Armed
Conflict 1946-2001: A New Dataset, Journal of Peace Research, 29(5), 615-637.
[17] Gomez D. P., P. M. Aronow & M.C. McGrath. 2012. Field Experiments and the Study of Voter
Turnout, Journal of Elections, Public Opinion & Parties.
[18] Gourevitch, P. 1998. We wish to inform you that tomorrow we will be killed with our families,
Farrar, Straus & Giroux, New York
[19] Frontline, 1999. The triumph of evil, Interview with Philip Gourevitch,
http://www.pbs.org/wgbh/pages/frontline/shows/evil/interviews/gourevitch.html and
http://www.pbs.org/wgbh/pages/frontline/shows/evil/warning/
[20] Grootaert, C. and T. van Bastelaer. 2002. Understanding and Measuring Social Capital: A Multi-
Disciplinary Tool for Practitioners, Washington, World Bank.
[21] Guichaoua, A. 1991. Les Travaux Communautaires en Afrique Centrale, Revue Tiers Monde,
t.XXXII, n. 127, July-September, p.551-573.
[22] Guiso, L., P. Sapienza and L. Zingales. 2008. Alfred Marshall Lecture: Social Capital as Good
Culture, Journal of the European Economic Association, 6(2-3), 295-320.
[23] Hansford, T. G. and B. T. Gomez. 2010. Estimating the Electoral Effects of Voter Turnout, Amer-
ican Political Science Review, 104, 268-288.
[24] Harari, M. and E. La Ferrara. 2013. Conflict, Climate and Cells: A Disaggregated Analysis,
C.E.P.R. Discussion Papers, 9277.
[25] Hatzfeld, J. 2005. Machete season: The Killers in Rwanda speak, Picador, New York.
[26] Hatzfeld, J. 2006. Life laid bare: The Survivors in Rwanda speak, Other Press, New York.
[27] Heldring, L. 2014. State Capacity and Violence: Evidence form the Rwandan Genocide, CSAE
Working Paper, WPS/2014-08.
[28] Horiuchi, Y. and J. Saito. 2009. Rain, Election, and Money: The Impact of Voter Turnout on
Distributive Policy Outcomes, Yale, mimeo
22
[29] Human Rights Watch 2011. Justice Compromised The Legacy of Rwanda’s Community-Based
Gacaca Courts, Report, May 2011.
[30] IRDP 2003. Sustaining Peace in Rwanda: Voice of the People, Institut de Recherche et de Dialogue
pour la Paix.
[31] Iyer, L. and P. Topalova. 2014. Poverty and Crime: Evidence from Rainfall and Trade Shocks in
India, mimeo.
[32] Kapiteni, A. 1996. La Premiere Estimation du Homre des Victims du GA©nocide du Rwanda de
1994 Commune par Commune en Fev 1996, Report of the Ministry of Higher Education, Scientific
Research, and Culture.
[33] Kirschke, L. 1996. Broadcasting genocide: censorship, propaganda & state-sponsored violence in
Rwanda 1990-1994, Article 19.
[34] Knack, S. and P. Keefer. 1997. Does Social Capital Have an Economic Payoff? A Cross-Country
Investigation, Quarterly Journal of Economics, Vol. 112, No. 4.
[35] Lawrence, R. and P. Uwimbabazi. 2013. Indigenous Practice, Power and Social Control: The
Paradox of the Practice of Umuganda in Rwanda in Race, Power and Indigenous Knowledge Sys-
tems, Interdisciplinary Journal for the Study of the Arts and Humanities in Southern Africa, Vol 20,
No 1.
[36] Lind, J. T. 2014. Rainy Day Politics: An Instrumental Variables Approach to the Effect of Parties
on Political Outcomes, University of Oslo, mimeo
[37] Longman, T. 2009. An Assessment of Rwanda’s Gacaca Courts, Peace Review, 21(3), 304-312.
[38] Maass, P. 1996. Love Thy Neighbor: A Story of War, London Papermac.
[39] Madestam A., D. Shoag, Veuger S. and D. Yanagizawa-Drott. 2013. Do Political Protests Mat-
ter? Evidence from the Tea Party Movement, Quarterly Journal of Economics, 128(4): 1633-1685.
[40] Madestam A. and D. Yanagizawa-Drott. 2011. Shaping the Nation: The Effect of Fourth of July
on Political Preferences and Behavior in the United States, mimeo.
[41] Mamdani, M. 2001. When Victims Become Killers: Colonialism, Nativism, and the Genocide in
Rwanda, Kampala, Fountain.
[42] Mansuri, G. and Rao, V. 2012. Localizing development: does participation work?. World Bank
Publications.
23

[43] Melvern, L. 2000. A People Betrayed: The Role of the West in Rwanda’s Genocide, Cape Town.
[44] Miguel, E., Satyanath, S. and E. Sergenti. 2004. Economic Shocks and Civil Conflict: An Instru-
mental Variables Approach, Journal of Political Economy, 112(4):725-53.
[45] Mitra, A. and D. Ray. 2014. Implications of an Economic Theory of Conflict: Hindu-Muslim
Violence in India, Journal of Political Economy, 122(4): 719-765.
[46] Mueller, J. 1999. The Banality of Ethnic War, International Security, Vol. 25, No. 1 (Summer
2000), pp. 4270
[47] Mukarubuga, C. 2006. The Experience of Social Forums Against Poverty: The Case of Rwanda,
Agency for Co-Operation and Research in Development.
[48] Presidence de MRND 1990. L’Umuganda dans le Developpement national, Affaires Economique,
Paris.
[49] Nunn, N. and N. Qian. 2014. Aiding Conflict: The Impact of U.S. Food Aid on Civil War, Ameri-
can Economic Review, 104(6): 1630-1666.
[50] Putnam, R. D. 2000. Bowling Alone, New York, Free Press.
[51] Uwimbabazi, P. 2012. An Analysis of Umuganda: The Policy and Practice of Community Work
in Rwanda, College of Humanities, KwaZulu-Natal, South Africa, September.
[52] Pottier, J. 2006. Land Reform for Peace: Rwanda’s 2005 Land Law in Context, Journal of Agrarian
Change, Vol. 6.
[53] Prunier, G. 1995. The Rwanda Crisis: History of a Genocide, London, Hurst and Company.
[54] Rogall, T. 2014. Mobilizing the Masses for Genocide, IIES, Stockholm University, mimeo.
[55] Rwandan government’s website, http://www.rgb.rw/main-menu/innovation/umuganda.
html, accessed December 4th, 2013.
[56] Rwandan Government’s webpage,
http://www.gov.rw/Umuganda-takes-place-across-Rwanda-marking-20-years-of-Liberation,
accessed October 29, 2014.
[57] Sarsons, H. 2011. Rainfall and Conflict, mimeo.
[58] Satyanath, S., N. Voigtlaender and H-J. Voth. 2014. Bowling for Fascism, NBER Working Paper.
24

[59] Straus, S. 2004. How Many Perpetrators Were There in the Rwandan Genocide? An Estimate,
Journal of Genocide Research, 6(1):85-98.
[60] Straus, S. 2006. The Order of Genocide: Race, Power, And War in Rwanda, Cambridge University
Press, 1 edition.
[61] Thomson, S. M. 2009. Resisting Reconciliation: State Power and Everyday Life in Post-Genocide
Rwanda, PhD dissertation, Halifax, Nova Scotia, Dalhousie University.
[62] Uvin, P. 1998. Aiding Violence: the Development Enterprise in Rwanda, Kumarian Press.
[63] Verpoorten, M. 2012. The intensity of the Rwandan genocide: Fine measures from the gacaca
records, Peace Economics, Peace Science and Public Policy, 18(1).
[64] Verpoorten, M. 2012. Leave None to Claim the Land: A Malthusian Catastrophe in Rwanda?,
Journal of Peace Research, 49 (4): 547-563.
[65] Verpoorten, M. 2012. Detecting Hidden Violence: The Spatial Distribution of Excess Mortality in
Rwanda. Political Geography. 31 (1): 44 - 56.
[66] Verwimp, P. 2000. Development Ideology, the Peasantry, and Genocide: Rwanda Represented in
Habyarimana’s Speeches, Journal of Genocide Research, Vol. 2, No 2.
[67] Verwimp, P. 2003. Testing the Double-Genocide Thesis for Central and Southern Rwanda, Journal
of Conflict Resolution, 47(4): 423-442.
[68] Verwimp, P. 2005. An Economic Profile of Peasant Perpetrators of Genocide: Micro-level Evi-
dence from Rwanda, Journal of Development Economics, 77(2):297- 323.
[69] Verwimp, P. 2006. Machetes and Firearms: the Organization of Massacres in Rwanda, Journal of
Peace Research, 43(1):5-22.
[70] Verwimp, P. 2013. Peasants in Power: The Political Economy of Development and Genocide in
Rwanda, Springer, Heidelberg.
[71] Viret E. 2010. Rwanda - A Chronology (1867-1994), Online Encyclopedia of Mass Violence,
published on 1 March 2010, accessed 27 October 2014, http://www.massviolence.org/
Rwanda-A-Chronology, ISSN 1961-9898.
[72] Yanagizawa-Drott, D. 2014. Propaganda and Conflict: Evidence from the Rwandan Genocide,
Quarterly Journal of Economics, 129(4), Forthcoming.
25

7 Appendix
7.1 Summary Statistics
Table 6: Summary Statistics
Mean Std. Dev Min Max
Perpetrators
Number of Category 2 290 286 0 2807
Number of Category 1 52 71 0 1145
Category 2 per Hutu 0.08 0.079 0 0.946
Category 1 per Hutu 0.01 0.021 0 0.274
Zero Perpetrators (=1) 0.05 0.223 0 1
Zero Category 2 Perpetrators (=1) 0.06 0.231 0 1
Zero Category 1 Perpetrators (=1) 0.11 0.318 0 1
Population
Population in Sector 1991 4880 2481 555 32686
Hutu share in Commune (pct) 1991 0.87 0.087 0.49 0.98
Violence
Pre-Genocide violence (=1) 0.15 0.361 0 1
Massgrave in Sector (=1) 0.05 0.210 0 1
Rainfall
Avg Daily Rain Jan 1984-Sep 1990 (mm) 2.55 0.480 1.72 4.07
Avg Daily Rain Oct 1990-Mar 1994 (mm) 2.44 0.546 1.48 4.05
Number Sat Rain >10 mm 18.25 4.244 11 32
Number Sun Rain >10 mm 15.14 5.192 5 33
Number Mon Rain >10 mm 15.13 4.216 6 29
Number Tue Rain >10 mm 18.10 3.523 9 31
Number Wed Rain >10 mm 20.51 4.760 12 35
Number Thu Rain >10 mm 21.53 3.972 15 37
Number Fri Rain >10 mm 17.02 4.755 5 32
Num Public Holidays Rain >10 mm 0.85 0.197 0.556 1.369
Num Non-Religious Public Holidays Rain >10 mm 1.56 0.208 1.2 2.2
Num Religious Public Holidays Rain >10 mm 0.10 0.115 0.8 1.4
Administration
Num of Sectors in Commune 11 3.7 6 27
ObservationsSectors 1433Communes 142Provinces 11
26

Figure 1: Distribution of Perpetrators per Hutu
Notes: The left hand panel shows the distribution of our main dependent variable: civilian perpetrators
per Hutu. This variable is defined as Category 2 perpetrators divided by the number of Hutus in 1991.
The share of Hutus is only available on commune level. Hence, an implicit assumption that we make
here is that the share of Hutus is the same in each sector within a commune. The right hand panel
shows the distribution of organized perpetrators per Hutu.
27
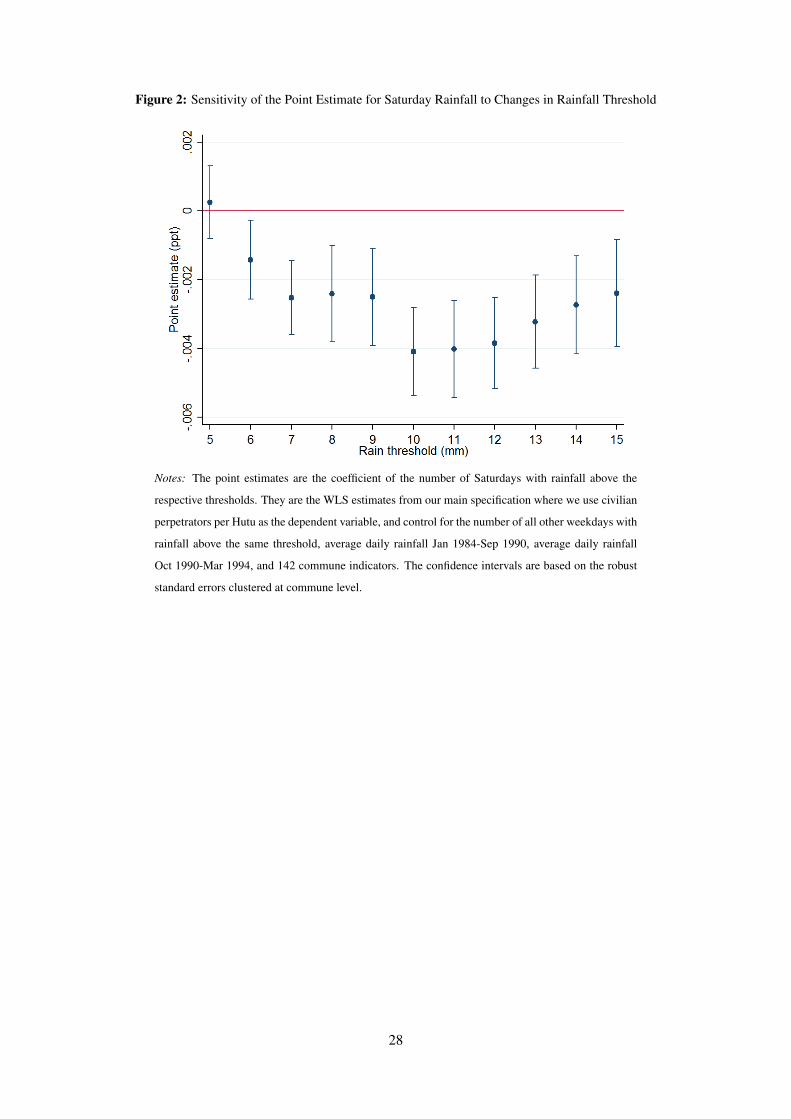
Figure 2: Sensitivity of the Point Estimate for Saturday Rainfall to Changes in Rainfall Threshold
Notes: The point estimates are the coefficient of the number of Saturdays with rainfall above the
respective thresholds. They are the WLS estimates from our main specification where we use civilian
perpetrators per Hutu as the dependent variable, and control for the number of all other weekdays with
rainfall above the same threshold, average daily rainfall Jan 1984-Sep 1990, average daily rainfall
Oct 1990-Mar 1994, and 142 commune indicators. The confidence intervals are based on the robust
standard errors clustered at commune level.
28
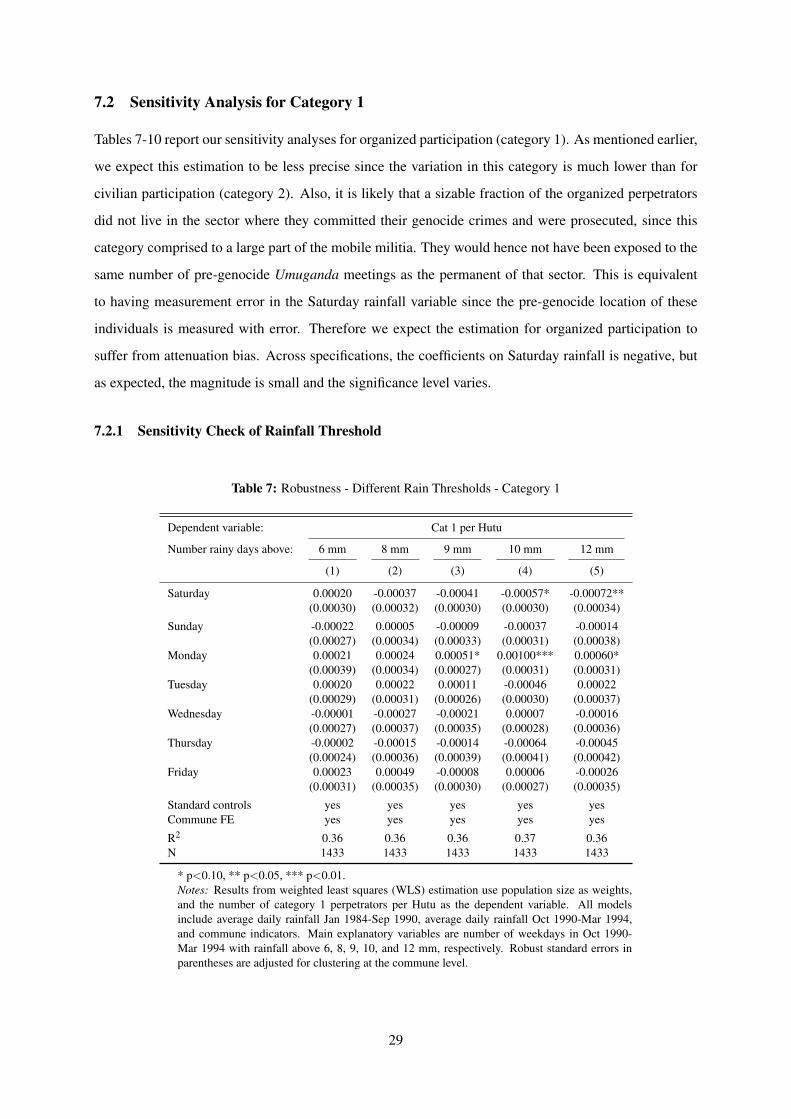
7.2 Sensitivity Analysis for Category 1
Tables 7-10 report our sensitivity analyses for organized participation (category 1). As mentioned earlier,
we expect this estimation to be less precise since the variation in this category is much lower than for
civilian participation (category 2). Also, it is likely that a sizable fraction of the organized perpetrators
did not live in the sector where they committed their genocide crimes and were prosecuted, since this
category comprised to a large part of the mobile militia. They would hence not have been exposed to the
same number of pre-genocide Umuganda meetings as the permanent of that sector. This is equivalent
to having measurement error in the Saturday rainfall variable since the pre-genocide location of these
individuals is measured with error. Therefore we expect the estimation for organized participation to
suffer from attenuation bias. Across specifications, the coefficients on Saturday rainfall is negative, but
as expected, the magnitude is small and the significance level varies.
7.2.1 Sensitivity Check of Rainfall Threshold
Table 7: Robustness - Different Rain Thresholds - Category 1
Dependent variable: Cat 1 per Hutu
Number rainy days above: 6 mm 8 mm 9 mm 10 mm 12 mm
(1) (2) (3) (4) (5)
Saturday 0.00020 -0.00037 -0.00041 -0.00057* -0.00072**(0.00030) (0.00032) (0.00030) (0.00030) (0.00034)
Sunday -0.00022 0.00005 -0.00009 -0.00037 -0.00014(0.00027) (0.00034) (0.00033) (0.00031) (0.00038)
Monday 0.00021 0.00024 0.00051* 0.00100*** 0.00060*(0.00039) (0.00034) (0.00027) (0.00031) (0.00031)
Tuesday 0.00020 0.00022 0.00011 -0.00046 0.00022(0.00029) (0.00031) (0.00026) (0.00030) (0.00037)
Wednesday -0.00001 -0.00027 -0.00021 0.00007 -0.00016(0.00027) (0.00037) (0.00035) (0.00028) (0.00036)
Thursday -0.00002 -0.00015 -0.00014 -0.00064 -0.00045(0.00024) (0.00036) (0.00039) (0.00041) (0.00042)
Friday 0.00023 0.00049 -0.00008 0.00006 -0.00026(0.00031) (0.00035) (0.00030) (0.00027) (0.00035)
Standard controls yes yes yes yes yesCommune FE yes yes yes yes yes
R2 0.36 0.36 0.36 0.37 0.36N 1433 1433 1433 1433 1433
* p<0.10, ** p<0.05, *** p<0.01.Notes: Results from weighted least squares (WLS) estimation use population size as weights,and the number of category 1 perpetrators per Hutu as the dependent variable. All modelsinclude average daily rainfall Jan 1984-Sep 1990, average daily rainfall Oct 1990-Mar 1994,and commune indicators. Main explanatory variables are number of weekdays in Oct 1990-Mar 1994 with rainfall above 6, 8, 9, 10, and 12 mm, respectively. Robust standard errors inparentheses are adjusted for clustering at the commune level.
29

7.2.2 Exclusion Restriction
Table 8: Exclusion Restriction
Dependent variable: Cat 1 per Hutu
Sample: Excl. Pre-Violence Full Sample
(1) (2) (3)
Number Sat>10 -0.00051 -0.00054* -0.00055*(0.00032) (0.00028) (0.00029)
Number Sun>10 -0.00023 -0.00033 -0.00036(0.00038) (0.00031) (0.00030)
Number Mon>10 0.00103*** 0.00101*** 0.00101***(0.00032) (0.00031) (0.00031)
Number Tue>10 -0.00061* -0.00035 -0.00035(0.00031) (0.00029) (0.00031)
Number Wed>10 0.00002 0.00001 0.00002(0.00029) (0.00029) (0.00029)
Number Thu>10 -0.00032 -0.00063 -0.00062(0.00040) (0.00043) (0.00041)
Number Fri>10 0.00031 0.00016 0.00025(0.00026) (0.00028) (0.00030)
Num Public Holidays >10 -0.01045*(0.00556)
Num Non-Religious Public Holidays >10 -0.00773**(0.00357)
Num Religious Public Holidays >10 -0.00829(0.00872)
Standard controls yes yes yesCommune FE yes yes yes
R2 0.36 0.37 0.37N 1213 1433 1433
* p<0.10, ** p<0.05, *** p<0.01.Notes: Results from weighted least squares (WLS) estimation use population size as weights,and the number of perpetrators per Hutu as dependent variable. All models include averagedaily rainfall Jan 1984-Sep 1990, average daily rainfall Oct 1990-Mar 1994, and communeindicators. Column 1 and 3 control for number of public holidays with rainfall above 10 mm,excluding public holidays that fell on a Saturday. Column 1 exclude communes where violentacts have been reported for the period Oct 1990-Mar 1994. Column 2 includes number of publicholidays with rainfall above 10 mm during the same period, excluding those on a Saturday.Column 3 separately controls for the number of religious and non-religious public holidayswith rainfall above 10 mm. Robust standard errors in parentheses are adjusted for clustering atthe commune level.
30

7.2.3 Robustness check
Table 9: Robustness - Excl. Massgraves and Kigali Ville
Dependent variable: Cat 1 per Hutu
Sample: Full Sample Excl. Massgraves Excl. Kigali Ville
(1) (2) (3)
Number Sat>10 -0.00059** -0.00048* -0.00061**(0.00030) (0.00028) (0.00030)
Number Sun>10 -0.00040 -0.00030 -0.00041(0.00031) (0.00031) (0.00032)
Number Mon>10 0.00096*** 0.00084*** 0.00096***(0.00031) (0.00028) (0.00031)
Number Tue>10 -0.00049* -0.00039 -0.00049(0.00029) (0.00030) (0.00030)
Number Wed>10 0.00003 0.00007 0.00002(0.00028) (0.00028) (0.00030)
Number Thu>10 -0.00065 -0.00063 -0.00062(0.00041) (0.00041) (0.00040)
Number Fri>10 0.00003 0.00012 0.00006(0.00026) (0.00025) (0.00027)
Standard controls yes yes yesCommune FE yes yes yesR2 0.37 0.37 0.37N 1433 1367 1422
* p<0.10, ** p<0.05, *** p<0.01.Notes: Results from weighted least squares (WLS) estimation use populationsize as weights, and the number of perpetrators per Hutu as the dependentvariable. All models include average daily rainfall Jan 1984-Sep 1990, av-erage daily rainfall Oct 1990-Mar 1994, and commune indicators. Column1 is our main specification for category 1 per Hutu. Column 2 excludes 66sectors where at least one mass-grave has been found. Column 3 excludes the11 sectors in the province Kigali Ville. Robust standard errors in parenthesesare adjusted for clustering at the commune level.
31

7.2.4 Placebo check
Table 10: Placebo Rainfall Oct 1994-Mar 1998
Dependent variable: Cat 1 per Hutu
(1) (2) (3)
Number Sat>10 -0.00059** -0.00070**(0.00030) (0.00030)
Number Sun>10 -0.00040 -0.00035(0.00031) (0.00030)
Number Mon>10 0.00096*** 0.00102***(0.00031) (0.00032)
Number Tue>10 -0.00049* -0.00040(0.00029) (0.00030)
Number Wed>10 0.00003 0.00008(0.00028) (0.00027)
Number Thu>10 -0.00065 -0.00054(0.00041) (0.00040)
Number Fri>10 0.00003 0.00016(0.00026) (0.00026)
Number Sat> 10 1994-1998 0.00000 0.00013(0.00027) (0.00028)
Number Sun> 10 1994-1998 0.00076** 0.00073**(0.00033) (0.00031)
Number Mon> 10 1994-1998 -0.00062* -0.00060**(0.00033) (0.00030)
Number Tue> 10 1994-1998 0.00038 0.00042(0.00040) (0.00036)
Number Wed> 10 1994-1998 -0.00024 -0.00034(0.00037) (0.00034)
Number Thu> 10 1994-1998 -0.00023 -0.00027(0.00034) (0.00034)
Number Fri> 10 1994-1998 0.00037 0.00048*(0.00027) (0.00025)
Standard controls yes yes yesCommune FE yes yes yesR2 0.37 0.36 0.38N 1433 1433 1433
* p<0.10, ** p<0.05, *** p<0.01.Notes: Results from weighted least squares (WLS) estimation use popu-lation size as weights, and the number of perpetrators per Hutu as the de-pendent variable. All models include average daily rainfall Jan 1984-Sep1990, average daily rainfall Oct 1990-Mar 1994, and commune indicators.Column 1 is our main specification for category 1 per Hutu. Column 2uses number of weekdays with rainfall above 10 mm during Oct 1994-Mar1998 as main explanatory variables. Column 3 adds the number of week-days with rainfall above 10 mm during Oct 1994-Mar 1998 as additionalcontrols to our main specification. Robust standard errors in parenthesesare adjusted for clustering at the commune level.
32
7.3 Additional Sensitivity Analysis for Category 1 and 2
Table 11 shows the result of a linear specification using average daily rainfall on Saturdays October 1990-
March 1994 as the main explanatory variable, controlling for average daily rainfall on all other weekdays
during the same period, average daily rainfall in January 1984-September 1990, and 142 commune indi-
cators. The point estimate on Saturday rainfall for civilian violence suggests that the participation rate,
on average, decreased by 4.1 percentage points for each additional mm of rainfall. This effect is larger
than the estimated effect in our main specification: a one standard deviation increase in average rainfall
on Saturdays is estimated to reduce the average civilian participation rate by 2.5 percentage points, while
a one standard deviation increase in the number of Saturdays with rain above 10 mm is estimated to
reduce the average civilian participation rate by 1.7 percentage points.
Table 12 reports the results from unweighted OLS regressions with clustered standard errors on com-
mune level (column 1-2), and with standard errors allowing for spatial correlation within a certain radius
of the sector following Conley (1999) (column 3-8). Results are presented using a radius of 25 km, 50
km, and 75 km, respectively. The statistical significance of the coefficient on Saturday rainfall is stronger
for civilian participation for all three radii compared to using robust standard errors adjusted for cluster-
ing on commune level. For organized participation, the statistical significance of the point estimate of
Saturday rainfall is more sensitive to the choice of radius.
Table 13 reports the results of estimating our main specifications for civilian and organized participation
using unweighted OLS, with and without clustered standard errors. The results are basically unchanged.
As a final robustness check, Table 14-16 report the results of separately excluding areas with pre-
genocide violence (column 2), including public holidays (column 3), excluding areas with mass graves
(column 4), and excluding the sectors in Kigali Ville (column 5), using the number of weekdays with
rainfall above 8 mm, 9 mm, and 12 mm, respectively, as the main explanatory and control variables. The
point estimates for the number of Saturdays with rainfall above these different thresholds are basically
the same across all thresholds and robustness checks.
33

Table 11: Linear Specification
Dependent variable: Cat 2 per Hutu Cat 1 per Hutu
(1) (2)
Avg rain Sat -0.04088** -0.00562(0.01604) (0.00353)
Avg rain Sun 0.00522 -0.00181(0.01863) (0.00475)
Avg rain Mon 0.00296 0.00500(0.01534) (0.00434)
Avg rain Tue 0.01357 0.00277(0.01321) (0.00427)
Avg rain Wed 0.01707 -0.00100(0.01437) (0.00300)
Avg rain Thu -0.00091 -0.00056(0.01071) (0.00279)
Avg rain Fri 0.00250 -0.00007(0.01010) (0.00233)
Standard controls yes yesCommune FE yes yes
R2 0.51 0.36N 1433 1433
* p<0.10, ** p<0.05, *** p<0.01.Notes: Results from weighted least squares (WLS) es-timation use population size as weights, and the num-ber of perpetrators per Hutu as the dependent variable.All models include average daily rainfall Jan 1984-Sep1990, and 142 commune indicators. Robust standarderrors in parentheses are adjusted for clustering at thecommune level.
34

Table 12: Robustness check - Conley Standard Errors
Model: OLS with Clustered SE OLS with Conley SE
Dependent variable: Cat 2 per Hutu Cat 1 per Hutu Cat 2 per Hutu Cat1 per Hutu
(1) (2) (3) (4) (5) (6) (7) (8)
Number Sat>10 -0.00382** -0.00055 -0.00382*** -0.00382*** -0.00382*** -0.00055 -0.00055* -0.00055**(0.00153) (0.00038) (0.00129) (0.00135) (0.00135) (0.00035) (0.00030) (0.00027)
Number Sun>10 0.00052 -0.00035 0.00052 0.00052 0.00052 -0.00035 -0.00035 -0.00035(0.00124) (0.00036) (0.00099) (0.00090) (0.00082) (0.00032) (0.00033) (0.00031)
Number Mon>10 0.00139 0.00117*** 0.00139 0.00139 0.00139 0.00117*** 0.00117*** 0.00117***(0.00117) (0.00036) (0.00097) (0.00109) (0.00110) (0.00034) (0.00038) (0.00041)
Number Tue>10 0.00063 -0.00053 0.00063 0.00063 0.00063 -0.00053* -0.00053* -0.00053**(0.00092) (0.00033) (0.00105) (0.00119) (0.00114) (0.00029) (0.00028) (0.00026)
Number Wed>10 0.00078 0.00005 0.00078 0.00078 0.00078 0.00005 0.00005 0.00005(0.00128) (0.00037) (0.00108) (0.00093) (0.00088) (0.00029) (0.00024) (0.00021)
Number Thu>10 0.00018 -0.00048 0.00018 0.00018 0.00018 -0.00048 -0.00048 -0.00048(0.00152) (0.00049) (0.00126) (0.00136) (0.00150) (0.00036) (0.00036) (0.00034)
Number Fri>10 -0.00047 0.00000 -0.00047 -0.00047 -0.00047 0.00000 0.00000 0.00000(0.00118) (0.00032) (0.00112) (0.00105) (0.00091) (0.00027) (0.00029) (0.00029)
Standard controls yes yes yes yes yes yes yes yesCommune FE yes yes yes yes yes yes yes yesRadius 25 km 50 km 75 km 25 km 50 km 75 kmN 1433 1433 1433 1433 1433 1433 1433 1433
*significant at 10 percent, **significant at 5 percent, ***significant at 1 percent.Notes: Column 2-3 report the results from ordinary least squares (OLS) estimation without population weights, using the number of perpetrators perHutu as dependent variable, and robust standard errors in parentheses are adjusted for clustering at the commune level. Column 4-6 report the resultsfrom OLS estimation with Conley standard errors allowing for spatial correlation within a radius of 25, 50 and 75 km respectively, using Cat 2 perHutu as the dependent variable. Column 7-9 report the results from OLS estimation with Conley standard errors for the same three radii, using Cat 1per Hutu as the dependent variable. All models include average daily rainfall Jan 1984-Sep 1990, average daily rainfall Oct 1990-Mar 1994, and 142commune indicators.
35

Table 13: Robustness check - Unweighted OLS with and without Clustered SE
Model: Unweighted OLS Unweighted OLS no clustering
Dependent variable: Cat 2 per Hutu Cat 1 per Hutu Cat 2 per Hutu Cat 1 per Hutu
(1) (2) (3) (4)
Number Sat>10 -0.00382** -0.00055 -0.00382*** -0.00055(0.00153) (0.00038) (0.00126) (0.00035)
Number Sun>10 0.00052 -0.00035 0.00052 -0.00035(0.00124) (0.00036) (0.00111) (0.00031)
Number Mon>10 0.00139 0.00117*** 0.00139 0.00117***(0.00117) (0.00036) (0.00100) (0.00034)
Number Tue>10 0.00063 -0.00053 0.00063 -0.00053*(0.00092) (0.00033) (0.00090) (0.00031)
Number Wed>10 0.00078 0.00005 0.00078 0.00005(0.00128) (0.00037) (0.00107) (0.00033)
Number Thu>10 0.00018 -0.00048 0.00018 -0.00048(0.00152) (0.00049) (0.00104) (0.00034)
Number Fri>10 -0.00047 0.00000 -0.00047 0.00000(0.00118) (0.00032) (0.00103) (0.00027)
Standard controls yes yes yes yesCommune FE yes yes yes yes
R2 0.48 0.37 0.48 0.37N 1433 1433 1433 1433
* p<0.10, ** p<0.05, *** p<0.01.Notes: Column 2-3 report the results from ordinary least squares (OLS) estimation withoutpopulation weights, using the number of perpetrators per Hutu as the dependent variable.Robust standard errors are adjusted for clustering at commune level. Column 3-4 reportthe same results as in Column 1-2 with the only difference that the robust standard errorsin parentheses are not adjusted for clustering at the commune level. All models includeaverage daily rainfall Jan 1984-Sep 1990, average daily rainfall Oct 1990-Mar 1994, and 142commune indicators.
36

Table 14: Robustness checks for threshold 8 mm
Dependent variable: Cat 2 per Hutu
Full Sample Excl. pre-vio Incl. pub. hol. Excl. mass grave Excl. Kigali Ville
(1) (2) (3) (4) (5)
Number Sat>8 -0.00241* -0.00261 -0.00245* -0.00249* -0.00240*(0.00140) (0.00171) (0.00134) (0.00138) (0.00140)
Number Sun>8 0.00068 0.00018 0.00064 0.00080 0.00071(0.00124) (0.00152) (0.00124) (0.00126) (0.00127)
Number Mon>8 0.00009 0.00074 0.00007 -0.00022 0.00025(0.00118) (0.00142) (0.00116) (0.00115) (0.00119)
Number Tue>8 0.00000 0.00007 -0.00000 0.00055 -0.00003(0.00123) (0.00145) (0.00123) (0.00120) (0.00123)
Number Wed>8 0.00043 0.00061 0.00041 0.00065 0.00058(0.00111) (0.00131) (0.00112) (0.00109) (0.00113)
Number Thu>8 0.00004 0.00110 0.00004 -0.00013 0.00001(0.00107) (0.00128) (0.00107) (0.00106) (0.00109)
Number Fri>8 0.00106 0.00140 0.00101 0.00119 0.00117(0.00094) (0.00113) (0.00098) (0.00095) (0.00094)
Num Public Holidays >8 0.00491(0.01629)
Standard controls yes yes yes yes yesCommune FE yes yes yes yes yes
R2 0.51 0.48 0.51 0.51 0.51N 1433 1213 1433 1367 1422
* p<0.10, ** p<0.05, *** p<0.01.Notes: Results from weighted least squares (WLS) estimation use population size as weights, and the number ofcategory 2 perpetrators per Hutu as the dependent variable. The rainfall measures are the number of weekdays withdaily rainfall above 8 mm in the period Oct 1990-Mar 1994. All models include average daily rainfall Jan 1984-Sep1990, average daily rainfall Oct 1990-Mar 1994, and 142 commune indicators. Robust standard errors in parenthesesare adjusted for clustering at the commune level.
37

Table 15: Robustness checks for threshold 9 mm
Dependent variable: Cat 2 per Hutu
Full Sample Excl. pre-vio Incl. pub. hol. Excl. mass grave Excl. Kigali Ville
(1) (2) (3) (4) (5)
Number Sat>9 -0.00250* -0.00250 -0.00248* -0.00251* -0.00259*(0.00141) (0.00178) (0.00139) (0.00139) (0.00143)
Number Sun>9 0.00073 -0.00006 0.00078 0.00099 0.00082(0.00117) (0.00136) (0.00119) (0.00118) (0.00120)
Number Mon>9 0.00079 0.00113 0.00080 0.00034 0.00083(0.00117) (0.00137) (0.00115) (0.00122) (0.00119)
Number Tue>9 0.00069 0.00085 0.00075 0.00122 0.00078(0.00099) (0.00118) (0.00099) (0.00102) (0.00101)
Number Wed>9 -0.00065 -0.00124 -0.00063 -0.00081 -0.00063(0.00106) (0.00121) (0.00105) (0.00105) (0.00107)
Number Thu>9 0.00140 0.00271* 0.00141 0.00141 0.00135(0.00123) (0.00149) (0.00124) (0.00122) (0.00123)
Number Fri>9 -0.00079 -0.00054 -0.00074 -0.00047 -0.00070(0.00086) (0.00105) (0.00095) (0.00089) (0.00089)
Num Public Holidays >9 -0.00649(0.02057)
Standard controls yes yes yes yes yesCommune FE yes yes yes yes yes
R2 0.51 0.49 0.51 0.51 0.51N 1433 1213 1433 1367 1422
* p<0.10, ** p<0.05, *** p<0.01.Notes: Results from weighted least squares (WLS) estimation use population size as weights, and the number ofcategory 2 perpetrators per Hutu as the dependent variable. The rainfall measures are the number of weekdays withdaily rainfall above 9 mm in the period Oct 1990-Mar 1994. All models include average daily rainfall Jan 1984-Sep1990, average daily rainfall Oct 1990-Mar 1994, and 142 commune indicators. Robust standard errors in parenthesesare adjusted for clustering at the commune level.
38

Table 16: Robustness checks for threshold 12 mm
Dependent variable: Cat 2 per Hutu
Full Sample Excl. pre-vio Incl. pub. hol. Excl. mass grave Excl. Kigali Ville
(1) (2) (3) (4) (5)
Number Sat>12 -0.00385*** -0.00403** -0.00387*** -0.00375*** -0.00390***(0.00132) (0.00165) (0.00129) (0.00135) (0.00133)
Number Sun>12 -0.00043 -0.00061 -0.00050 -0.00027 -0.00066(0.00137) (0.00157) (0.00146) (0.00139) (0.00148)
Number Mon>12 -0.00053 -0.00072 -0.00054 -0.00044 -0.00040(0.00120) (0.00141) (0.00119) (0.00112) (0.00121)
Number Tue>12 0.00135 0.00071 0.00131 0.00180 0.00147(0.00123) (0.00139) (0.00123) (0.00126) (0.00122)
Number Wed>12 -0.00058 -0.00093 -0.00061 -0.00050 -0.00091(0.00118) (0.00138) (0.00115) (0.00117) (0.00135)
Number Thu>12 -0.00233** -0.00186 -0.00236** -0.00235** -0.00234**(0.00107) (0.00113) (0.00108) (0.00112) (0.00111)
Number Fri>12 -0.00216 -0.00229 -0.00224 -0.00189 -0.00232*(0.00137) (0.00184) (0.00153) (0.00133) (0.00137)
Num Public Holidays >12 0.00487(0.02632)
Standard controls yes yes yes yes yesCommune FE yes yes yes yes yes
R2 0.52 0.49 0.52 0.51 0.52N 1433 1213 1433 1367 1422
* p<0.10, ** p<0.05, *** p<0.01.Notes: Results from weighted least squares (WLS) estimation use population size as weights, and the number ofcategory 2 perpetrators per Hutu as the dependent variable. The rainfall measures are the number of weekdays withdaily rainfall above 12 mm in the period Oct 1990-Mar 1994. All models include average daily rainfall Jan 1984-Sep1990, average daily rainfall Oct 1990-Mar 1994, and 142 commune indicators. Robust standard errors in parenthesesare adjusted for clustering at the commune level.
39