predictive modeling: basics and beyond - global health · pdf filepredictive modeling: basics...
TRANSCRIPT
SCIOinspire Corp Proprietary & confidential. Copyright 2010
Predictive Modeling:Predictive Modeling:Basics and BeyondBasics and Beyond
June 2009June 2009
SCIOinspire Corp Proprietary & confidential. Copyright 2010
2
AgendaAgenda
1. What is Predictive Modeling?
2. Types of predictive models.
3. Data and Data Preparation.
4. Applications – case studies.
SCIOinspire Corp Proprietary & confidential. Copyright 2010
3
IntroductionsIntroductionsIan Duncan FSA FIA FCIA MAAA. President, Solucia Consulting, A SCIOinspire Company.
Actuarial Consulting company founded in 1998. A leader in managed care, disease management and predictive modeling applications.
4 healthcare actuaries; 4 PhDs; healthcare analytics team.
Four main business segments:
• Disease and Care Management consulting (operations; ROI; outcomes; predictive modeling).
• Actuarial Consulting (start‐up health insurers in NY and IN; state Medicaid plans; Massachusetts Healthcare Connector Board Member).
• Wellness and Care Management Operations Support Services (analytics, data management, risk assessment, outreach, fulfillment).
• Analytics and Reporting Software Applications.
Strong research foundation: we have always supported a strong research function to inform our recommendations.
SCIOinspire Corp Proprietary & confidential. Copyright 2010
4
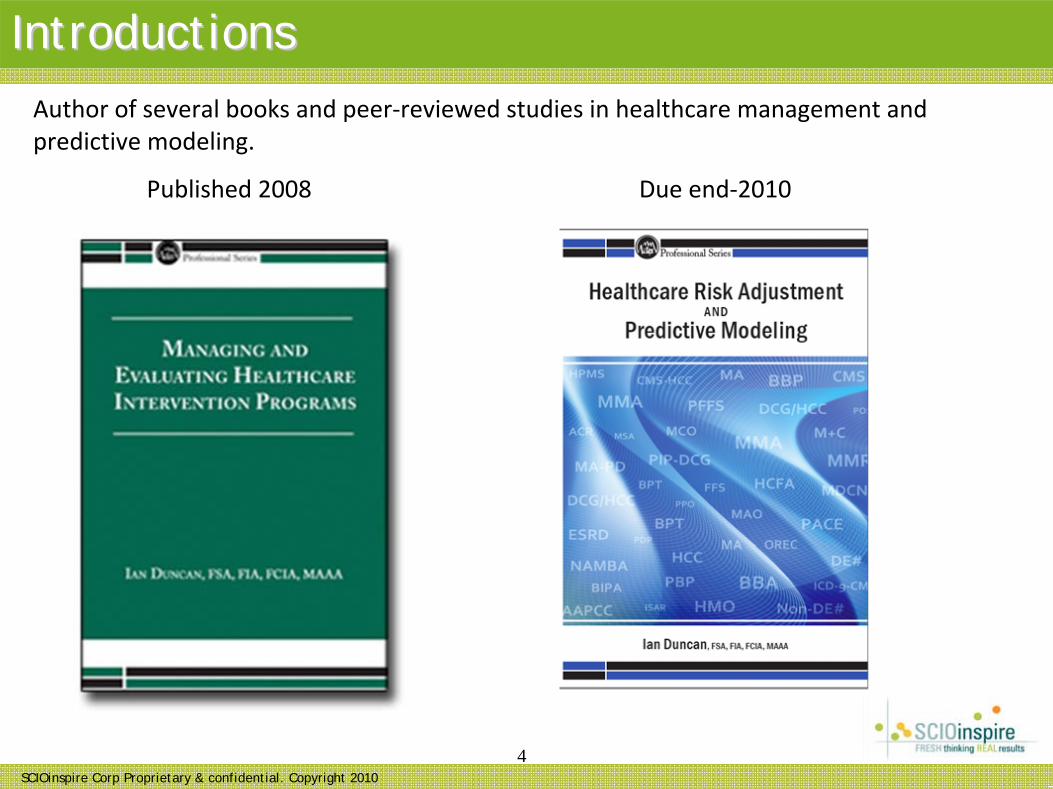
IntroductionsIntroductionsAuthor of several books and peer‐reviewed studies in healthcare management and predictive modeling.
Published 2008 Due end‐2010
SCIOinspire Corp Proprietary & confidential. Copyright 2010
5
Predictive Modeling: A Review of the Basics
SCIOinspire Corp Proprietary & confidential. Copyright 2010
6
Definition of Predictive ModelingDefinition of Predictive Modeling
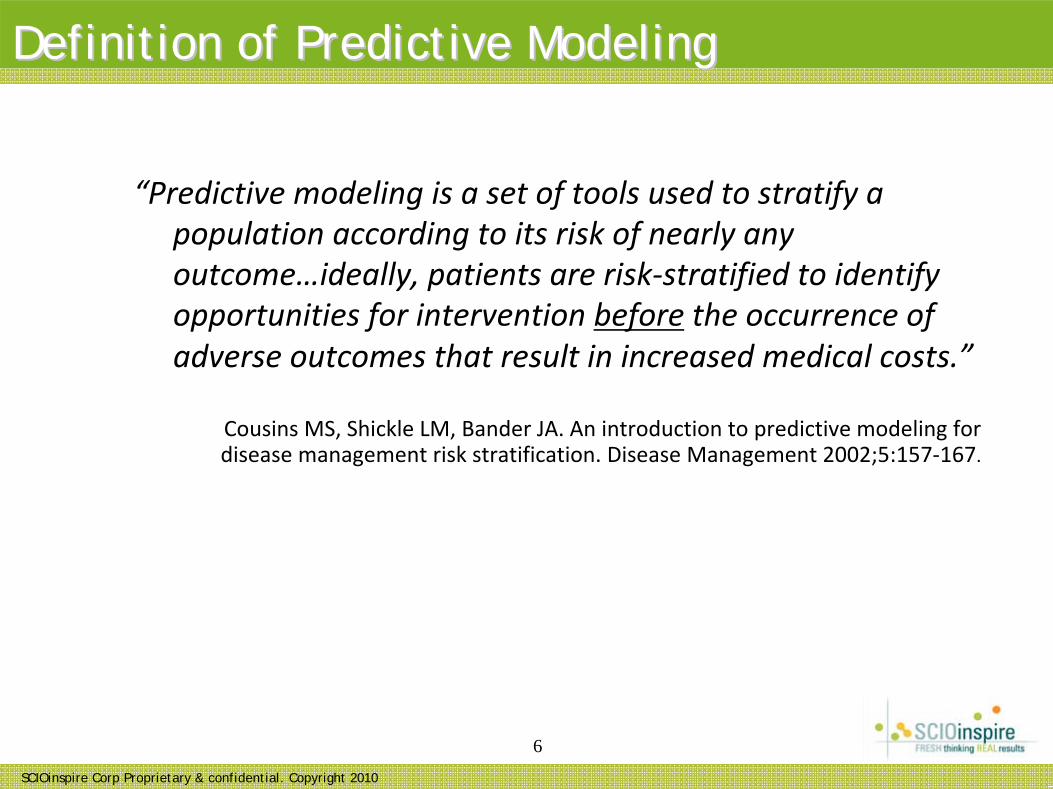
“Predictive modeling is a set of tools used to stratify a population according to its risk of nearly any outcome…ideally, patients are risk‐stratified to identify opportunities for intervention before the occurrence of adverse outcomes that result in increased medical costs.”
Cousins MS, Shickle LM, Bander JA. An introduction to predictive modeling for disease management risk stratification. Disease Management 2002;5:157‐167.
SCIOinspire Corp Proprietary & confidential. Copyright 2010
7
Predictive Modeling is about Predictive Modeling is about RiskRisk
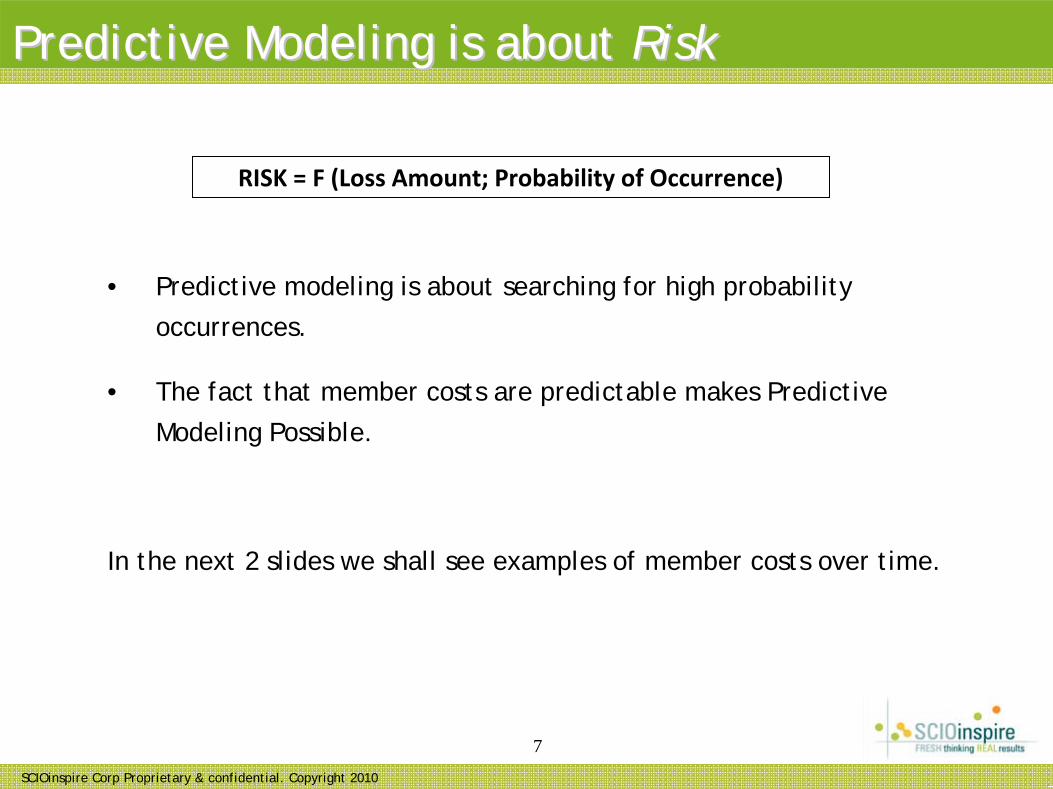
RISK = F (Loss Amount; Probability of Occurrence)
• Predictive modeling is about searching for high probability
occurrences.
• The fact that member costs are predictable makes Predictive
Modeling Possible.
In the next 2 slides we shall see examples of member costs over time.
SCIOinspire Corp Proprietary & confidential. Copyright 2010
8
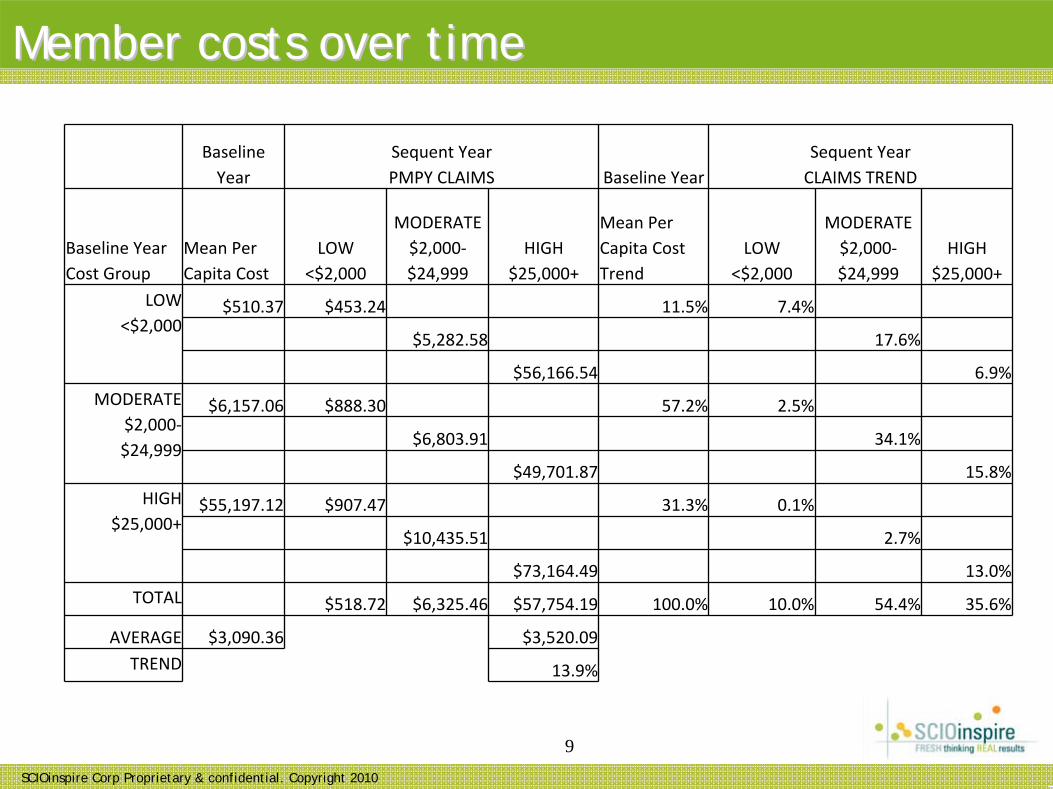
Member costs over timeMember costs over time
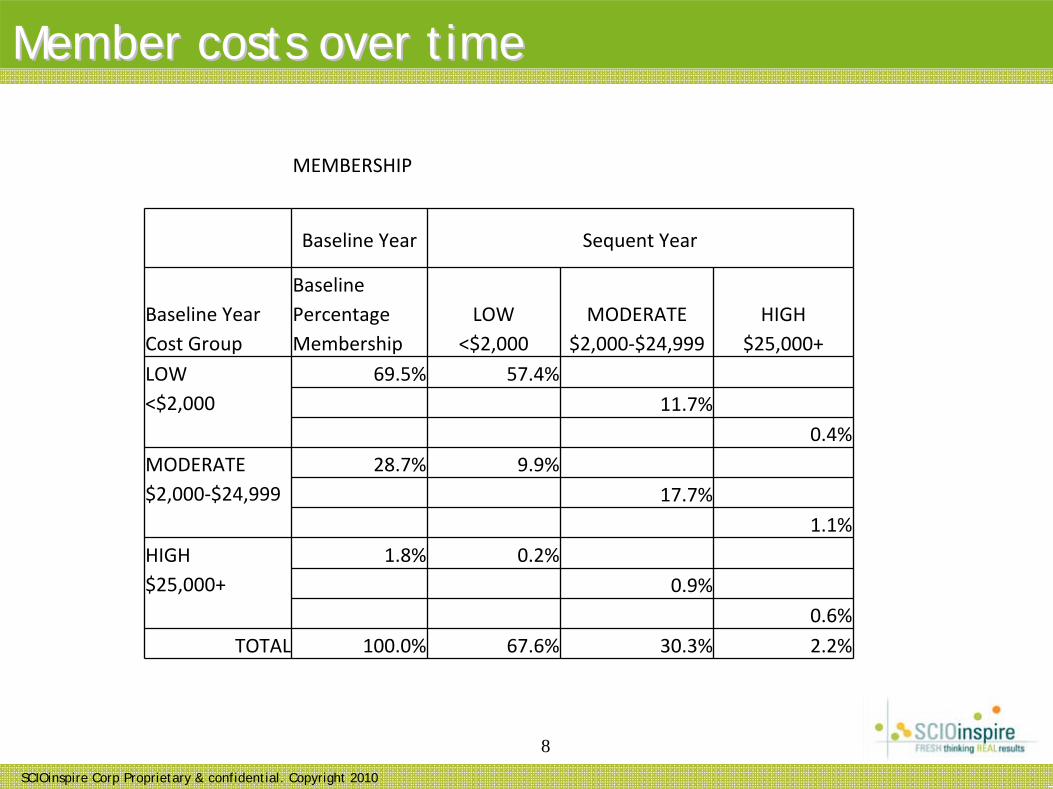
MEMBERSHIP
Baseline Year Sequent Year
Baseline Year Cost Group
Baseline Percentage Membership
LOW <$2,000
MODERATE $2,000‐$24,999
HIGH $25,000+
LOW <$2,000
69.5% 57.4%11.7%
0.4%MODERATE $2,000‐$24,999
28.7% 9.9%17.7%
1.1%HIGH $25,000+
1.8% 0.2%0.9%
0.6%TOTAL 100.0% 67.6% 30.3% 2.2%
SCIOinspire Corp Proprietary & confidential. Copyright 2010
9
Member costs over timeMember costs over time
Baseline Year
Sequent Year PMPY CLAIMS Baseline Year
Sequent Year CLAIMS TREND
Baseline Year Cost Group
Mean Per Capita Cost
LOW <$2,000
MODERATE $2,000‐ $24,999
HIGH $25,000+
Mean Per Capita Cost Trend
LOW <$2,000
MODERATE $2,000‐ $24,999
HIGH $25,000+
LOW <$2,000
$510.37 $453.24 11.5% 7.4%
$5,282.58 17.6%
$56,166.54 6.9%MODERATE
$2,000‐ $24,999
$6,157.06 $888.30 57.2% 2.5%
$6,803.91 34.1%
$49,701.87 15.8%HIGH
$25,000+$55,197.12 $907.47 31.3% 0.1%
$10,435.51 2.7%
$73,164.49 13.0%TOTAL $518.72 $6,325.46 $57,754.19 100.0% 10.0% 54.4% 35.6%
AVERAGE $3,090.36 $3,520.09TREND 13.9%
SCIOinspire Corp Proprietary & confidential. Copyright 2010
10
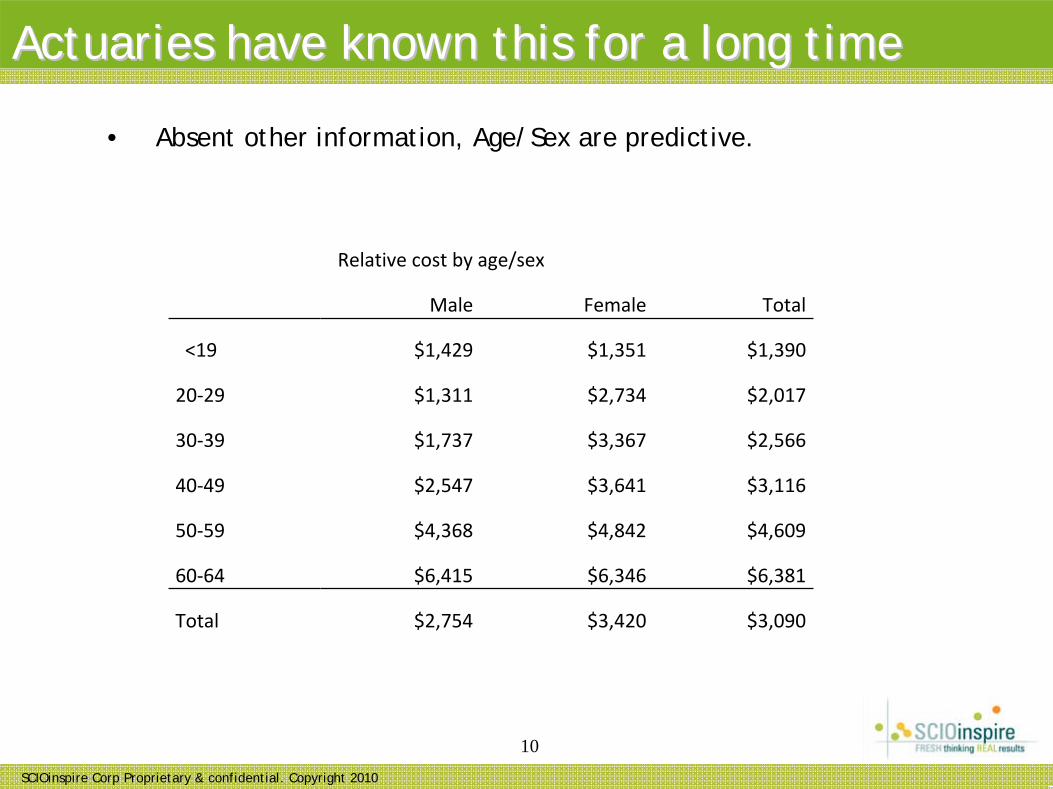
Actuaries have known this for a long timeActuaries have known this for a long time
Relative cost by age/sex
Male Female Total
<19 $1,429 $1,351 $1,390
20‐29 $1,311 $2,734 $2,017
30‐39 $1,737 $3,367 $2,566
40‐49 $2,547 $3,641 $3,116
50‐59 $4,368 $4,842 $4,609
60‐64 $6,415 $6,346 $6,381
Total $2,754 $3,420 $3,090
• Absent other information, Age/Sex are predictive.
SCIOinspire Corp Proprietary & confidential. Copyright 2010
11
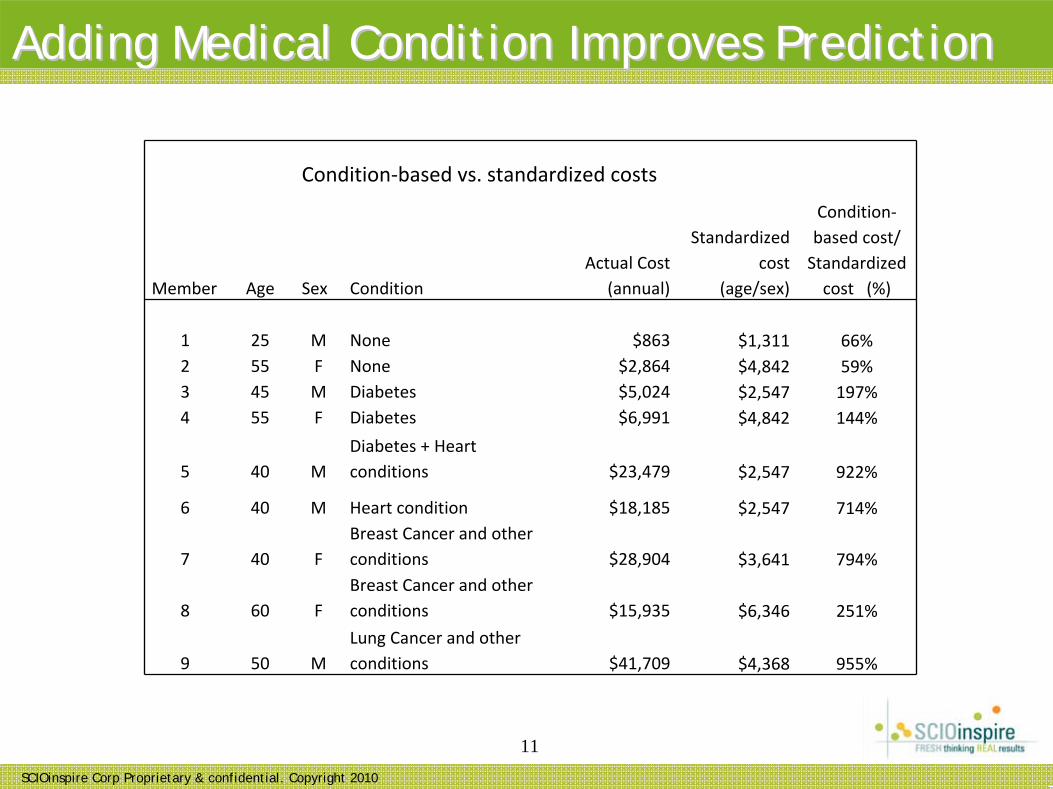
Adding Medical Condition Improves PredictionAdding Medical Condition Improves Prediction
Condition‐based vs. standardized costs
Member Age Sex ConditionActual Cost
(annual)
Standardized cost
(age/sex)
Condition‐ based cost/ Standardized cost (%)
1 25 M None $863 $1,311 66%2 55 F None $2,864 $4,842 59%3 45 M Diabetes $5,024 $2,547 197%4 55 F Diabetes $6,991 $4,842 144%
5 40 MDiabetes + Heart conditions $23,479 $2,547 922%
6 40 M Heart condition $18,185 $2,547 714%
7 40 FBreast Cancer and other conditions $28,904 $3,641 794%
8 60 FBreast Cancer and other conditions $15,935 $6,346 251%
9 50 MLung Cancer and other conditions $41,709 $4,368 955%
SCIOinspire Corp Proprietary & confidential. Copyright 2010
12
Identification Identification –– how?how?
• At the heart of predictive modeling!
• Who?
• What common characteristics?
• What are the implications of those characteristics?
• There are many different algorithms for identifying member conditions. THERE IS NO SINGLE AGREED FORMULA.
• Condition identification often requires careful balancing of sensitivity and specificity.
SCIOinspire Corp Proprietary & confidential. Copyright 2010
13
A word about codes and groupersA word about codes and groupers
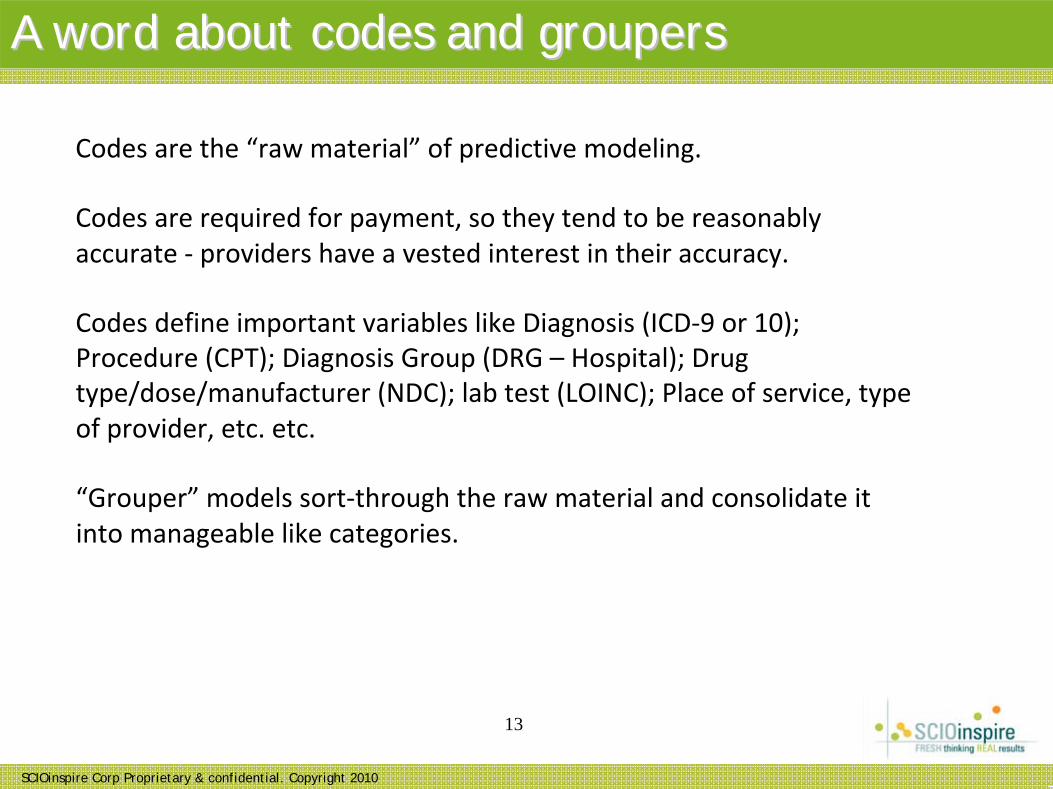
Codes are the “raw material” of predictive modeling.
Codes are required for payment, so they tend to be reasonably accurate ‐ providers have a vested interest in their accuracy.
Codes define important variables like Diagnosis (ICD‐9 or 10); Procedure (CPT); Diagnosis Group (DRG – Hospital); Drug type/dose/manufacturer (NDC); lab test (LOINC); Place of service, type of provider, etc. etc.
“Grouper” models sort‐through the raw material and consolidate it into manageable like categories.
SCIOinspire Corp Proprietary & confidential. Copyright 2010
14
Identification Identification –– example (Diabetes)example (Diabetes)
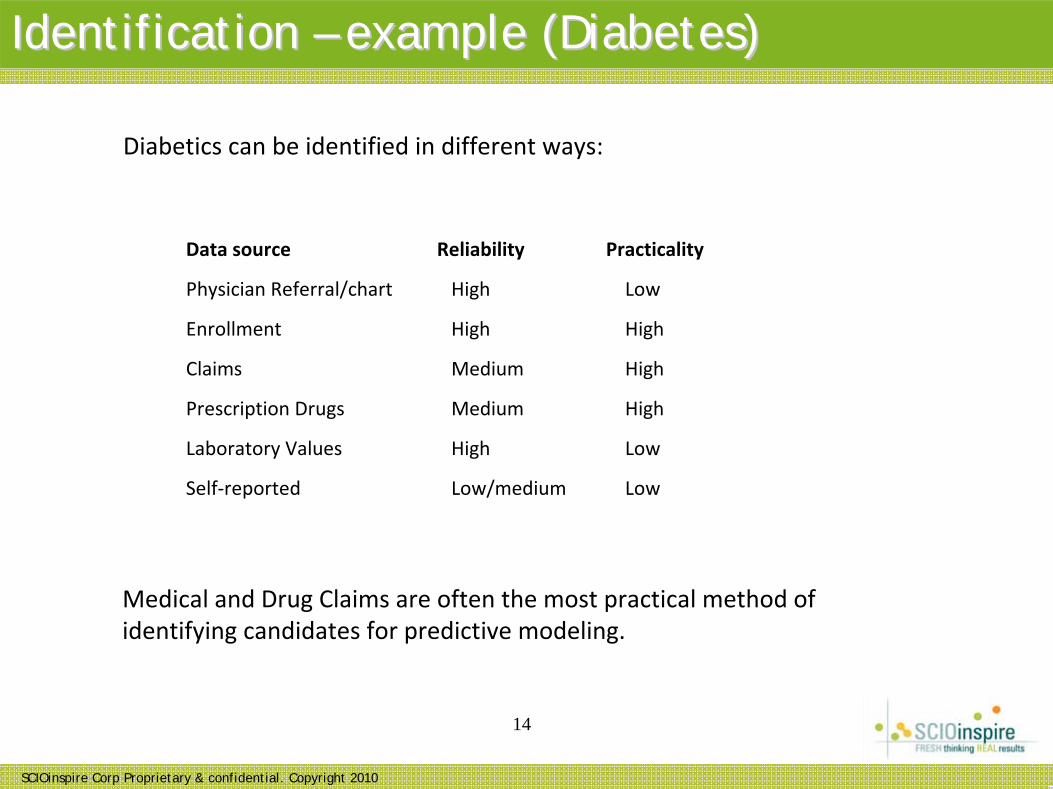
Diabetics can be identified in different ways:
Medical and Drug Claims are often the most practical method of identifying candidates for predictive modeling.
Data source Reliability Practicality
Physician Referral/chart High Low
Enrollment High High
Claims Medium High
Prescription Drugs Medium High
Laboratory Values High Low
Self‐reported Low/medium Low
SCIOinspire Corp Proprietary & confidential. Copyright 2010
15
Identification Identification –– example (Diabetes)example (Diabetes)
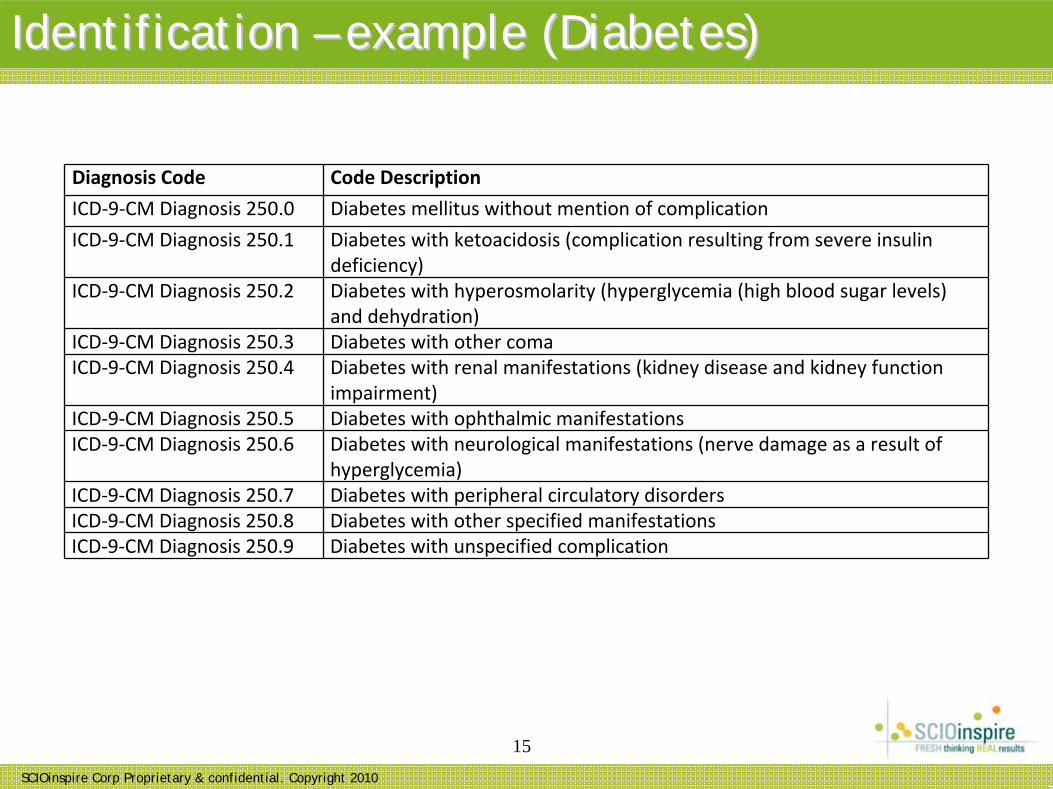
Diagnosis Code Code Description
ICD‐9‐CM Diagnosis 250.0 Diabetes mellitus without mention of complication
ICD‐9‐CM Diagnosis 250.1 Diabetes with ketoacidosis (complication resulting from severe insulin deficiency)
ICD‐9‐CM Diagnosis 250.2 Diabetes with hyperosmolarity (hyperglycemia (high blood sugar levels) and dehydration)
ICD‐9‐CM Diagnosis 250.3 Diabetes with other comaICD‐9‐CM Diagnosis 250.4 Diabetes with renal manifestations (kidney disease and kidney function
impairment)ICD‐9‐CM Diagnosis 250.5 Diabetes with ophthalmic manifestationsICD‐9‐CM Diagnosis 250.6 Diabetes with neurological manifestations (nerve damage as a result of
hyperglycemia)ICD‐9‐CM Diagnosis 250.7 Diabetes with peripheral circulatory disordersICD‐9‐CM Diagnosis 250.8 Diabetes with other specified manifestationsICD‐9‐CM Diagnosis 250.9 Diabetes with unspecified complication
SCIOinspire Corp Proprietary & confidential. Copyright 2010
16
Diabetes Diabetes –– additional codesadditional codes
CODES
DIABETES;
CODE TYPE
DESCRIPTION - ADDITIONAL
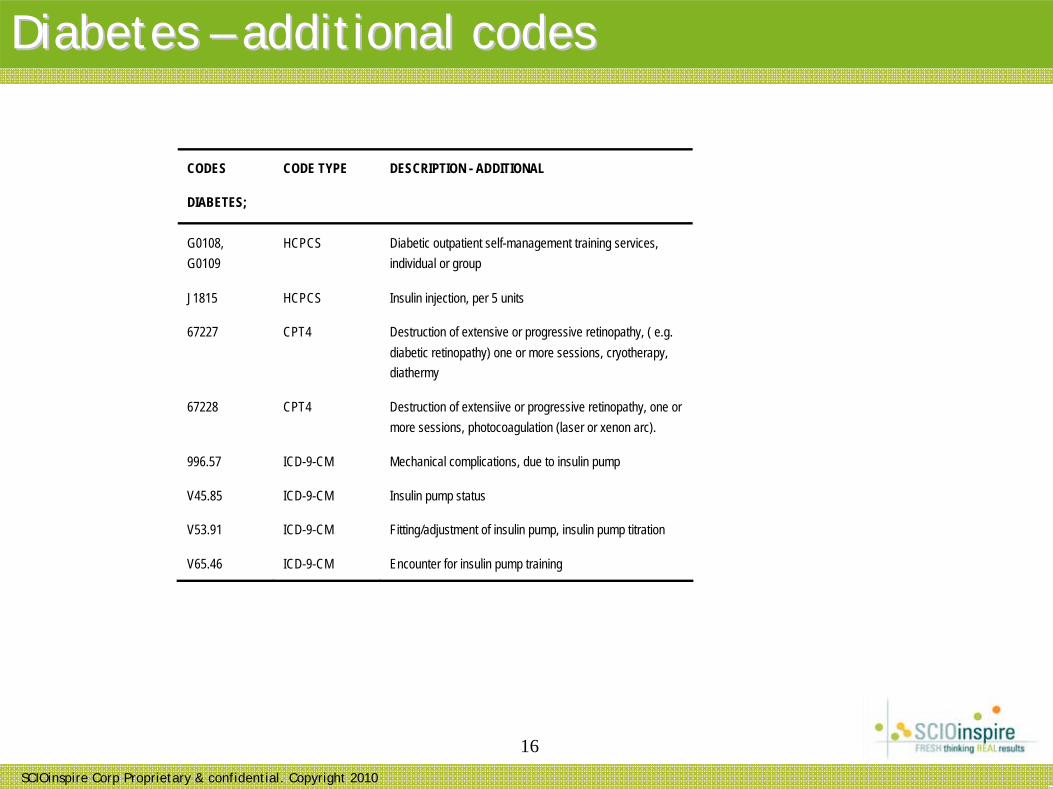
G0108, G0109
HCPCS Diabetic outpatient self-management training services, individual or group
J1815 HCPCS Insulin injection, per 5 units
67227 CPT4 Destruction of extensive or progressive retinopathy, ( e.g. diabetic retinopathy) one or more sessions, cryotherapy, diathermy
67228 CPT4 Destruction of extensiive or progressive retinopathy, one or more sessions, photocoagulation (laser or xenon arc).
996.57 ICD-9-CM Mechanical complications, due to insulin pump
V45.85 ICD-9-CM Insulin pump status
V53.91 ICD-9-CM Fitting/adjustment of insulin pump, insulin pump titration
V65.46 ICD-9-CM Encounter for insulin pump training
SCIOinspire Corp Proprietary & confidential. Copyright 2010
17
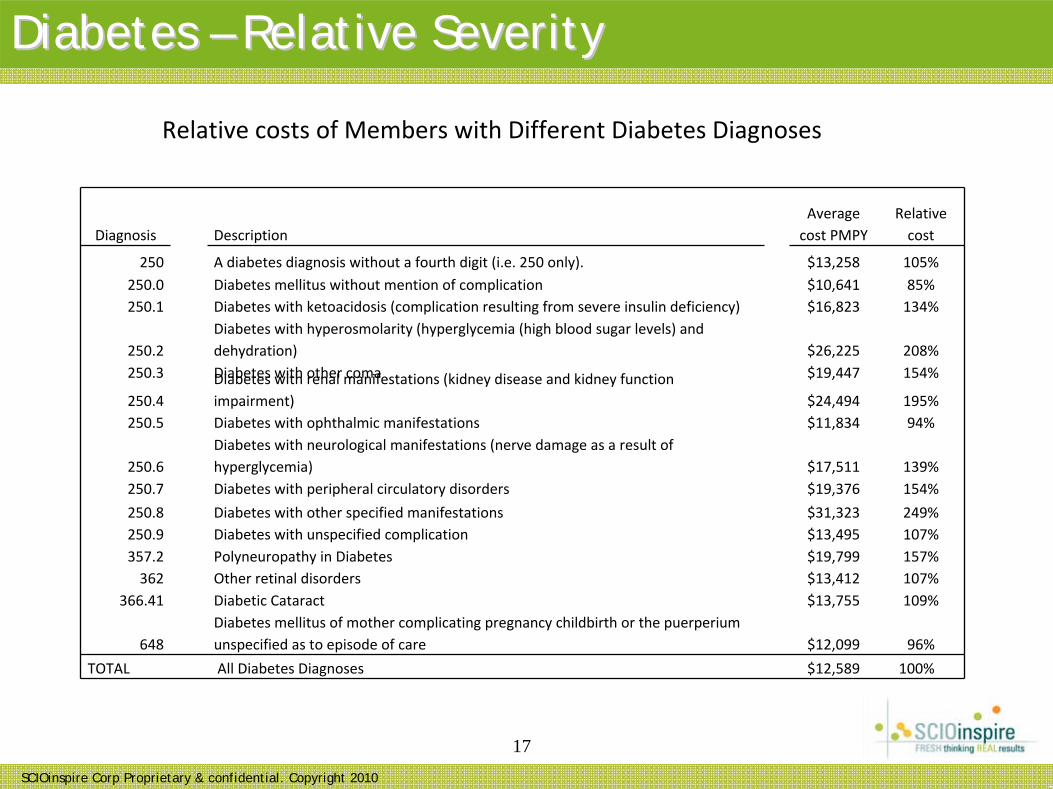
Diabetes Diabetes –– Relative SeverityRelative Severity
Diagnosis DescriptionAverage
cost PMPY
Relative
cost
250 A diabetes diagnosis without a fourth digit (i.e. 250 only). $13,258 105%250.0 Diabetes mellitus without mention of complication $10,641 85%250.1 Diabetes with ketoacidosis (complication resulting from severe insulin deficiency) $16,823 134%
250.2Diabetes with hyperosmolarity (hyperglycemia (high blood sugar levels) and
dehydration) $26,225 208%
250.3 Diabetes with other coma $19,447 154%
250.4Diabetes with renal manifestations (kidney disease and kidney function
impairment) $24,494 195%
250.5 Diabetes with ophthalmic manifestations $11,834 94%
250.6Diabetes with neurological manifestations (nerve damage as a result of
hyperglycemia) $17,511 139%
250.7 Diabetes with peripheral circulatory disorders $19,376 154%
250.8 Diabetes with other specified manifestations $31,323 249%250.9 Diabetes with unspecified complication $13,495 107%357.2 Polyneuropathy in Diabetes $19,799 157%362 Other retinal disorders $13,412 107%
366.41 Diabetic Cataract $13,755 109%
648Diabetes mellitus of mother complicating pregnancy childbirth or
the puerperium
unspecified as to episode of care $12,099 96%
TOTAL All Diabetes Diagnoses $12,589 100%
Relative costs of Members with Different Diabetes Diagnoses
SCIOinspire Corp Proprietary & confidential. Copyright 2010
18
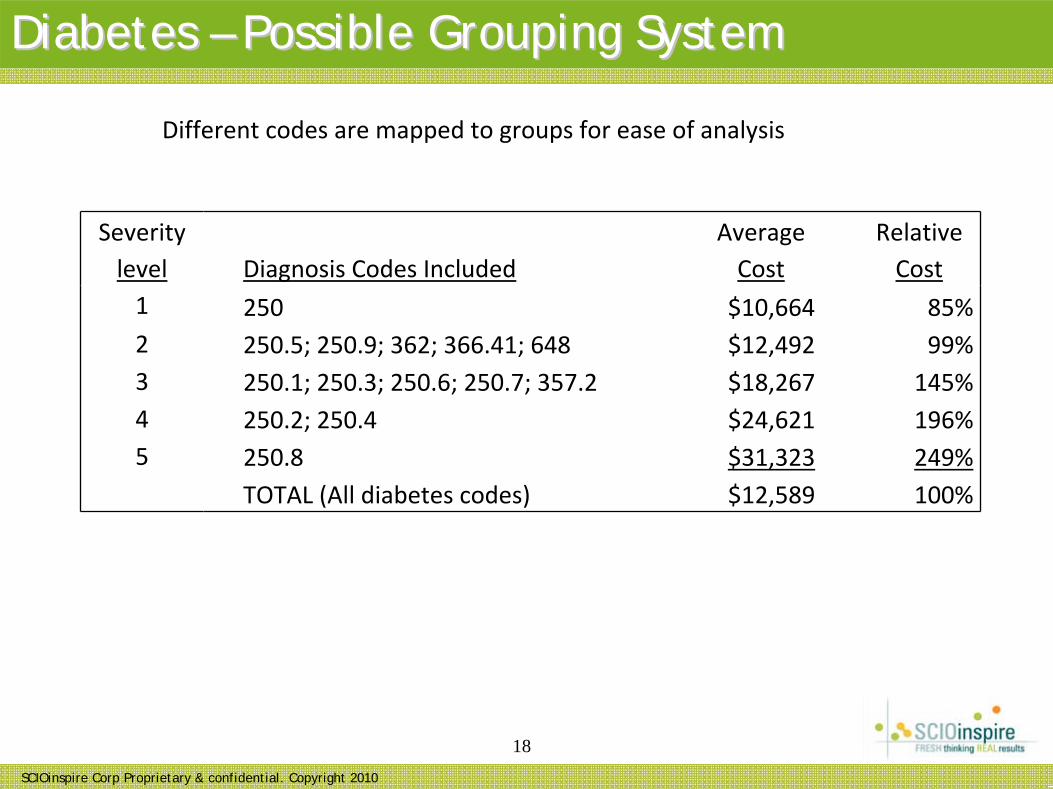
Diabetes Diabetes –– Possible Grouping SystemPossible Grouping System
Different codes are mapped to groups for ease of analysis
Severity level Diagnosis Codes Included
Average Cost
Relative Cost
1 250 $10,664 85%2 250.5; 250.9; 362; 366.41; 648 $12,492 99%3 250.1; 250.3; 250.6; 250.7; 357.2 $18,267 145%4 250.2; 250.4 $24,621 196%5 250.8 $31,323 249%
TOTAL (All diabetes codes) $12,589 100%
SCIOinspire Corp Proprietary & confidential. Copyright 2010
19
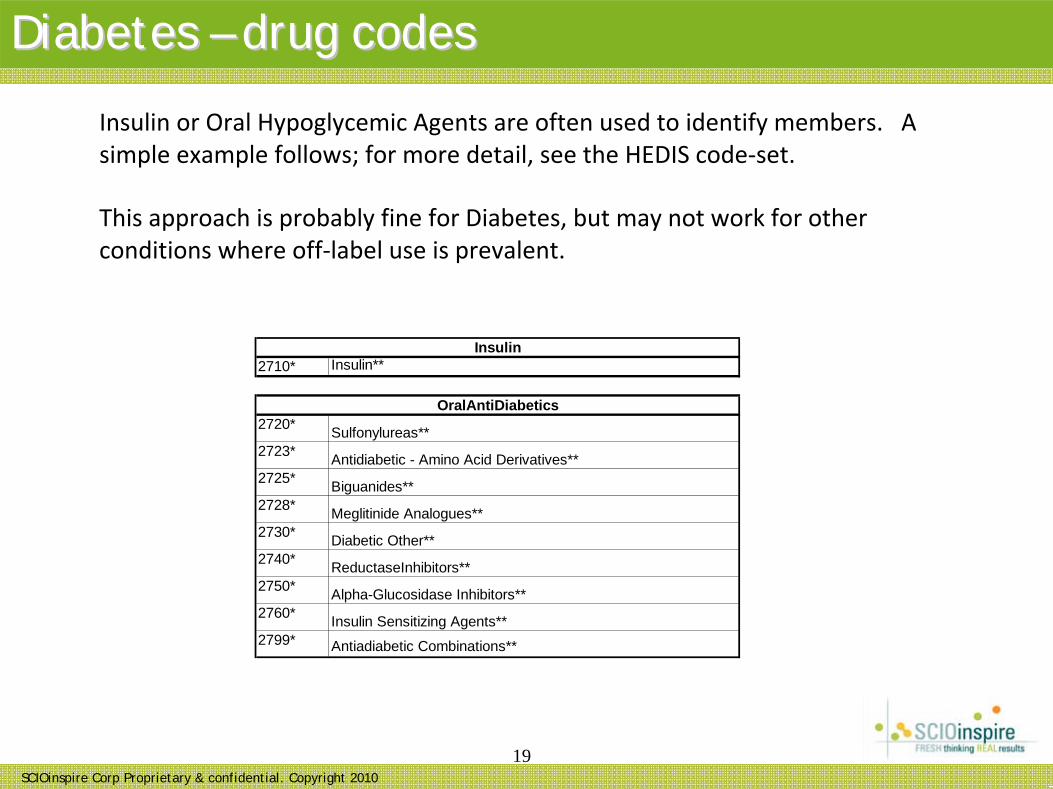
Diabetes Diabetes –– drug codesdrug codes
Insulin or Oral Hypoglycemic Agents are often used to identify members. A simple example follows; for more detail, see the HEDIS code‐set.
This approach is probably fine for Diabetes, but may not work for other conditions where off‐label use is prevalent.
2710* Insulin**
2720* Sulfonylureas**2723* Antidiabetic - Amino Acid Derivatives**2725* Biguanides**2728* Meglitinide Analogues**2730* Diabetic Other**2740* ReductaseInhibitors**2750* Alpha-Glucosidase Inhibitors**2760* Insulin Sensitizing Agents**2799* Antiadiabetic Combinations**
OralAntiDiabetics
Insulin
SCIOinspire Corp Proprietary & confidential. Copyright 2010
20
More about Grouper ModelsMore about Grouper Models
Grouper models address several problems inherent in identification from claims (medical and/or drug):
•What “recipe” or algorithm to apply?•How to keep the algorithm up‐to‐date?•How to achieve consistency among users (important, for example, in physician reimbursement or program assessment).
They also have draw‐backs:•Someone else’s definitions;•Lack of transparency;•You can’t control sensitivity/specificity trade‐off.
SCIOinspire Corp Proprietary & confidential. Copyright 2010
21
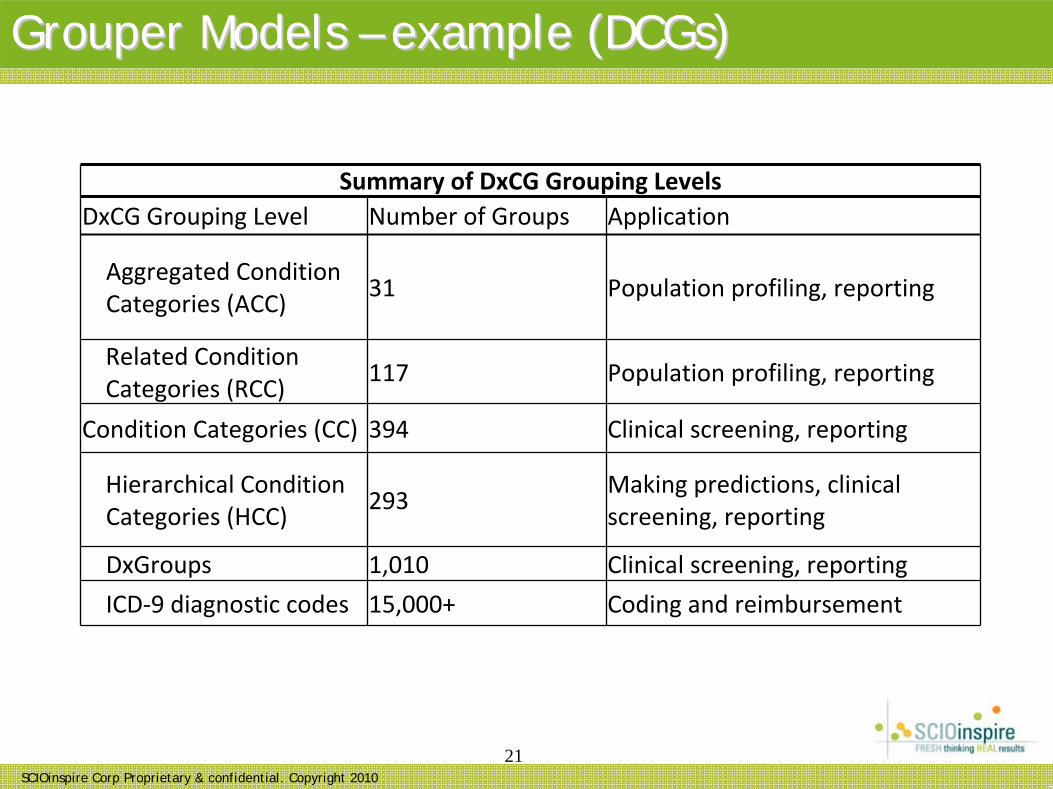
Grouper Models Grouper Models –– example (DCGs)example (DCGs)
Summary of DxCG Grouping LevelsDxCG Grouping Level Number of Groups Application
Aggregated Condition Categories (ACC)
31 Population profiling, reporting
Related Condition Categories (RCC)
117 Population profiling, reporting
Condition Categories (CC) 394 Clinical screening, reporting
Hierarchical Condition Categories (HCC)
293Making predictions, clinical screening, reporting
DxGroups 1,010 Clinical screening, reporting
ICD‐9 diagnostic codes 15,000+ Coding and reimbursement
SCIOinspire Corp Proprietary & confidential. Copyright 2010
22
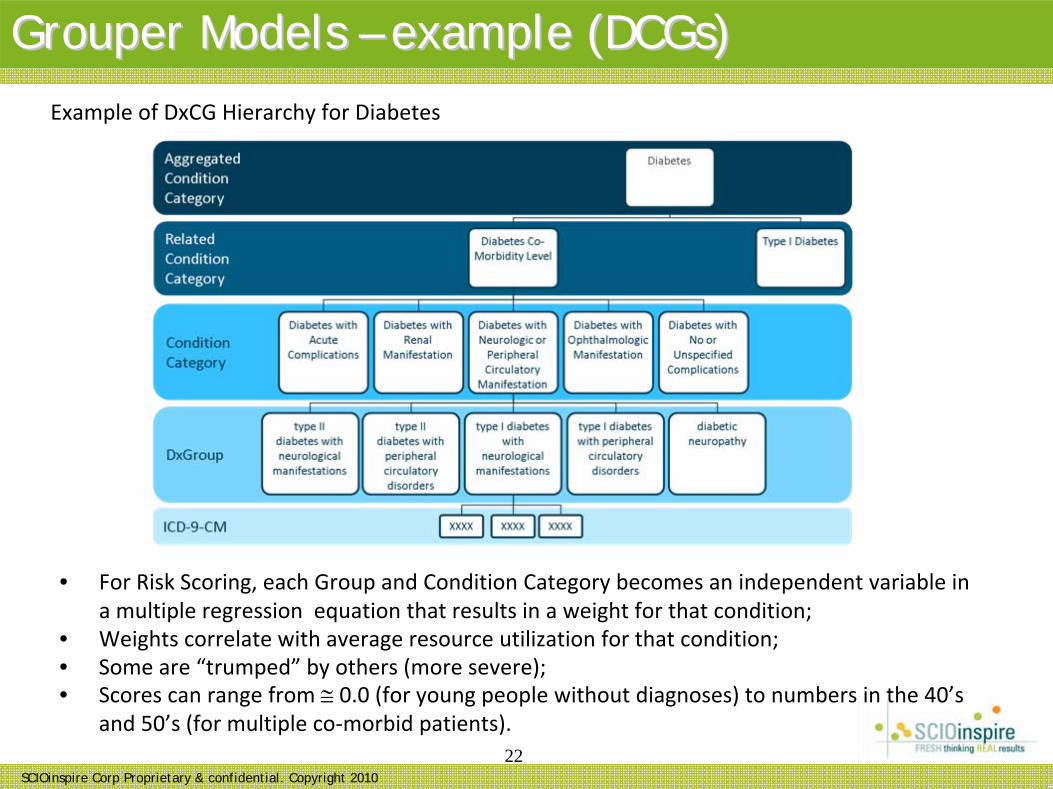
Grouper Models Grouper Models –– example (DCGs)example (DCGs)
• For Risk Scoring, each Group and Condition Category becomes an independent variable in a multiple regression equation that results in a weight for that condition;
• Weights correlate with average resource utilization for that condition;• Some are “trumped” by others (more severe);• Scores can range from ≅ 0.0 (for young people without diagnoses) to numbers in the 40’s
and 50’s (for multiple co‐morbid patients).
Example of DxCG Hierarchy for Diabetes

SCIOinspire Corp Proprietary & confidential. Copyright 2010
23
Construction of a model*Construction of a model*
* From Ian Duncan: “Healthcare Risk Adjustment and Predictive Modeling” (Actex, forthcoming)
Condition Category Risk Score Contribution Notes
Diabetes with No or Unspecified ComplicationsDiabetes with Renal ManifestationHypertensionCongestive Heart Failure (CHF)Drug DependenceAge‐SexTotal Risk Score
0.0
2.1
0.01.5
0.60.44.6
Trumped by Diabetes with Renal Manifestation
Trumped by CHF
SCIOinspire Corp Proprietary & confidential. Copyright 2010
24
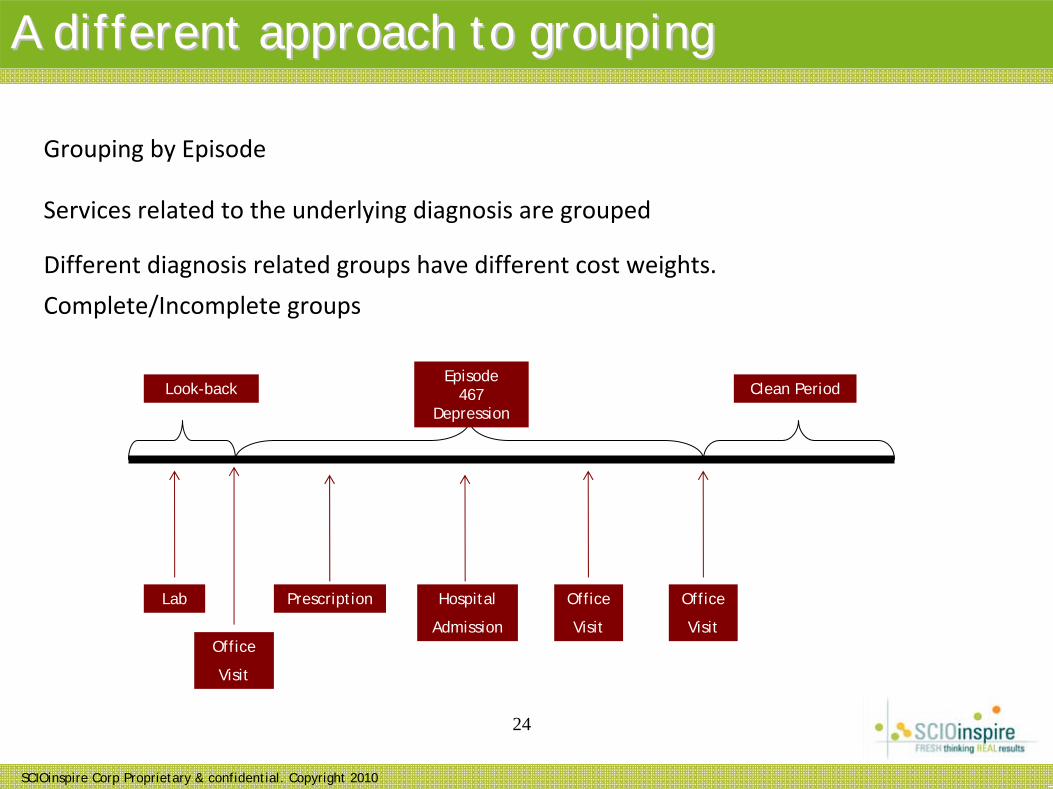
Grouping by Episode
Services related to the underlying diagnosis are grouped
A different approach to groupingA different approach to grouping
Different diagnosis related groups have different cost weights.
Complete/Incomplete groups
Look-backEpisode
467Depression
Clean Period
Office
Visit
PrescriptionLab Hospital
Admission
Office
VisitOffice
Visit
SCIOinspire Corp Proprietary & confidential. Copyright 2010
25
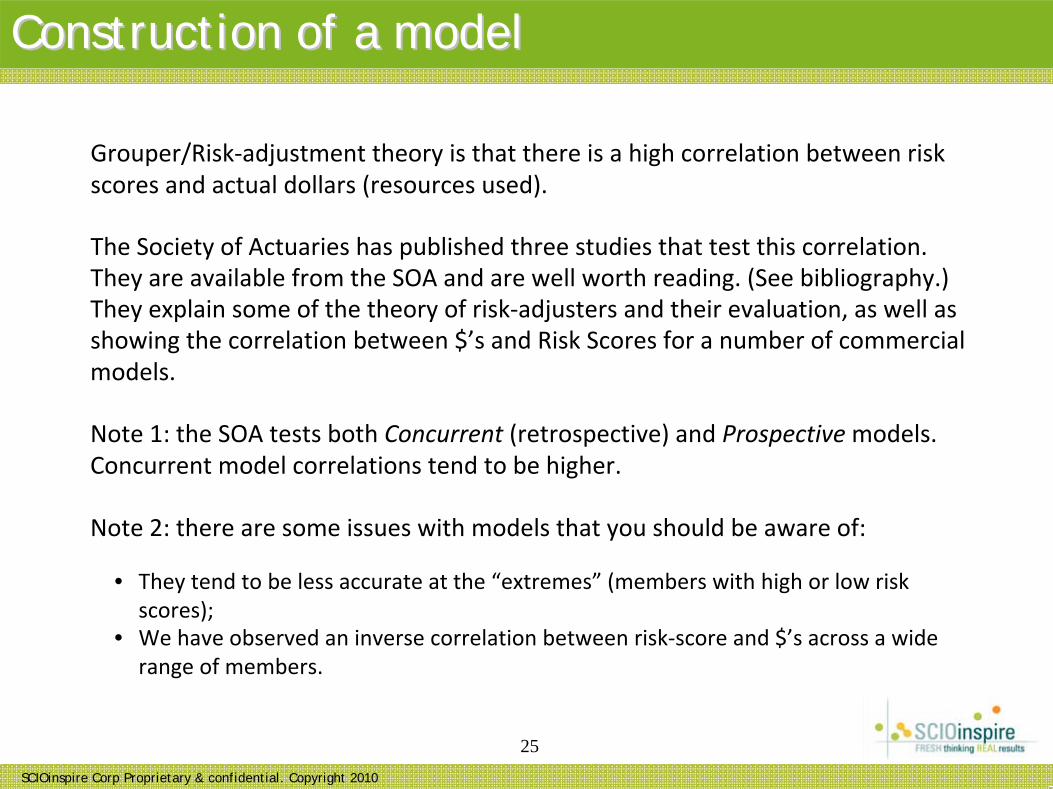
Construction of a modelConstruction of a model
Grouper/Risk‐adjustment theory is that there is a high correlation between risk scores and actual dollars (resources used).
The Society of Actuaries has published three studies that test this correlation. They are available from the SOA and are well worth reading. (See bibliography.) They explain some of the theory of risk‐adjusters and their evaluation, as well as showing the correlation between $’s and Risk Scores for a number of commercial models.
Note 1: the SOA tests both Concurrent (retrospective) and Prospective models. Concurrent model correlations tend to be higher.
Note 2: there are some issues with models that you should be aware of:
• They tend to be less accurate at the “extremes” (members with high or low risk scores);
• We have observed an inverse correlation between risk‐score and $’s across a wide range of members.
SCIOinspire Corp Proprietary & confidential. Copyright 2010
26
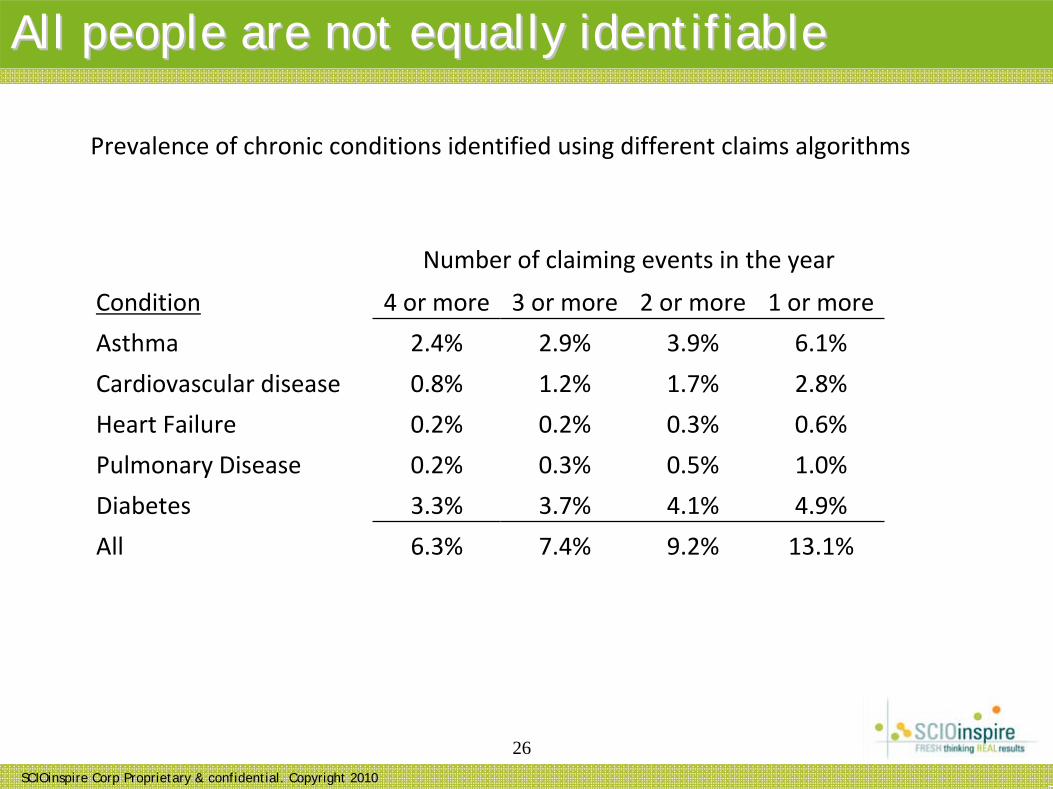
All people are not equally identifiableAll people are not equally identifiable
Number of claiming events in the year
Condition 4 or more 3 or more 2 or more 1 or more
Asthma 2.4% 2.9% 3.9% 6.1%
Cardiovascular disease 0.8% 1.2% 1.7% 2.8%
Heart Failure 0.2% 0.2% 0.3% 0.6%
Pulmonary Disease 0.2% 0.3% 0.5% 1.0%
Diabetes 3.3% 3.7% 4.1% 4.9%
All 6.3% 7.4% 9.2% 13.1%
Prevalence of chronic conditions identified using different claims algorithms
SCIOinspire Corp Proprietary & confidential. Copyright 2010
27
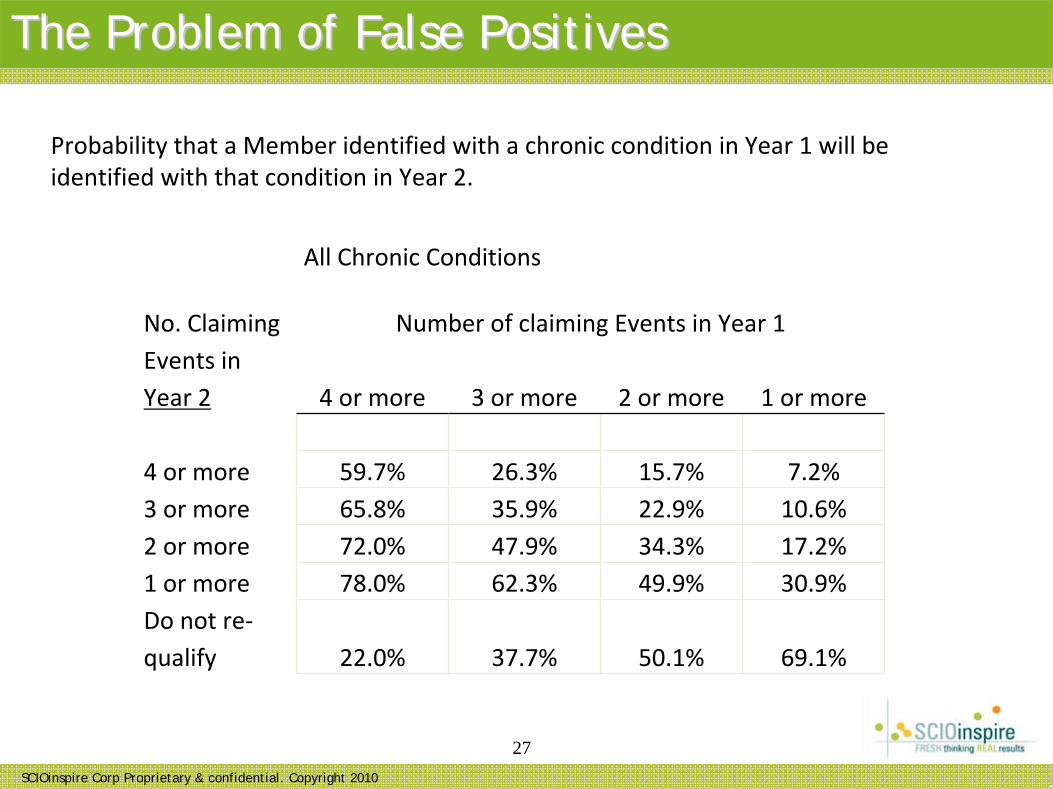
The Problem of False PositivesThe Problem of False Positives
All Chronic Conditions
No. Claiming Number of claiming Events in Year 1Events in Year 2 4 or more 3 or more 2 or more 1 or more
4 or more 59.7% 26.3% 15.7% 7.2%3 or more 65.8% 35.9% 22.9% 10.6%2 or more 72.0% 47.9% 34.3% 17.2%1 or more 78.0% 62.3% 49.9% 30.9%Do not re‐ qualify 22.0% 37.7% 50.1% 69.1%
Probability that a Member identified with a chronic condition in Year 1 will be identified with that condition in Year 2.
SCIOinspire Corp Proprietary & confidential. Copyright 2010
28
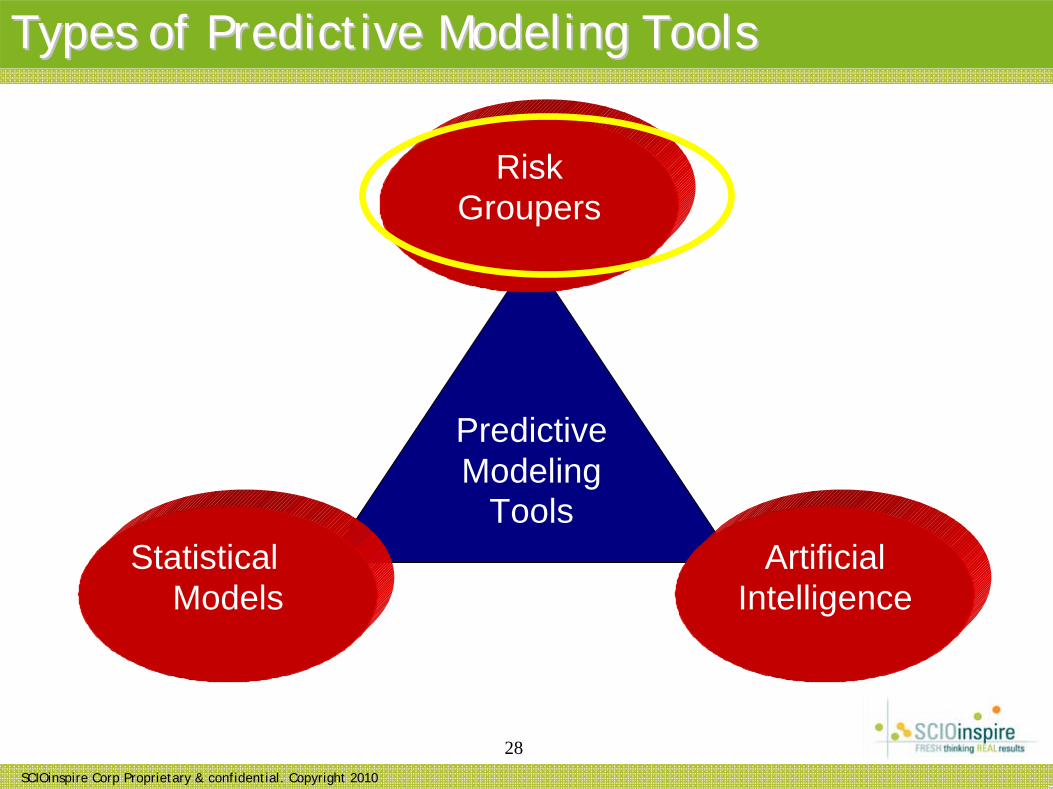
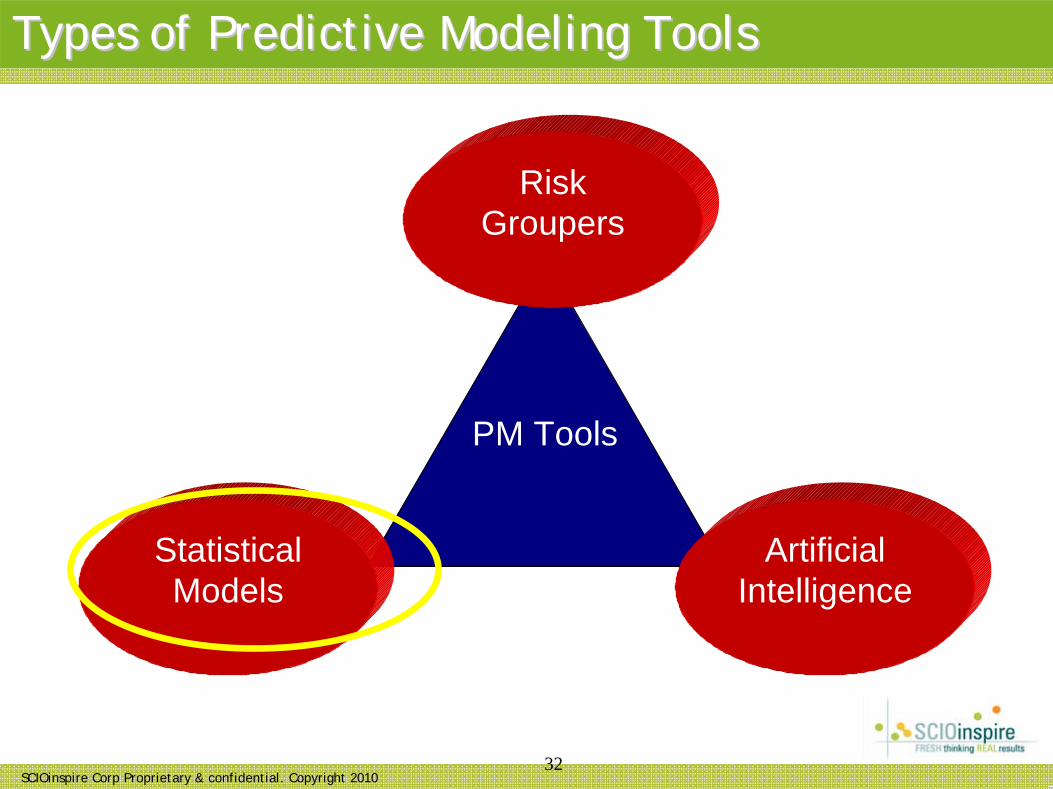
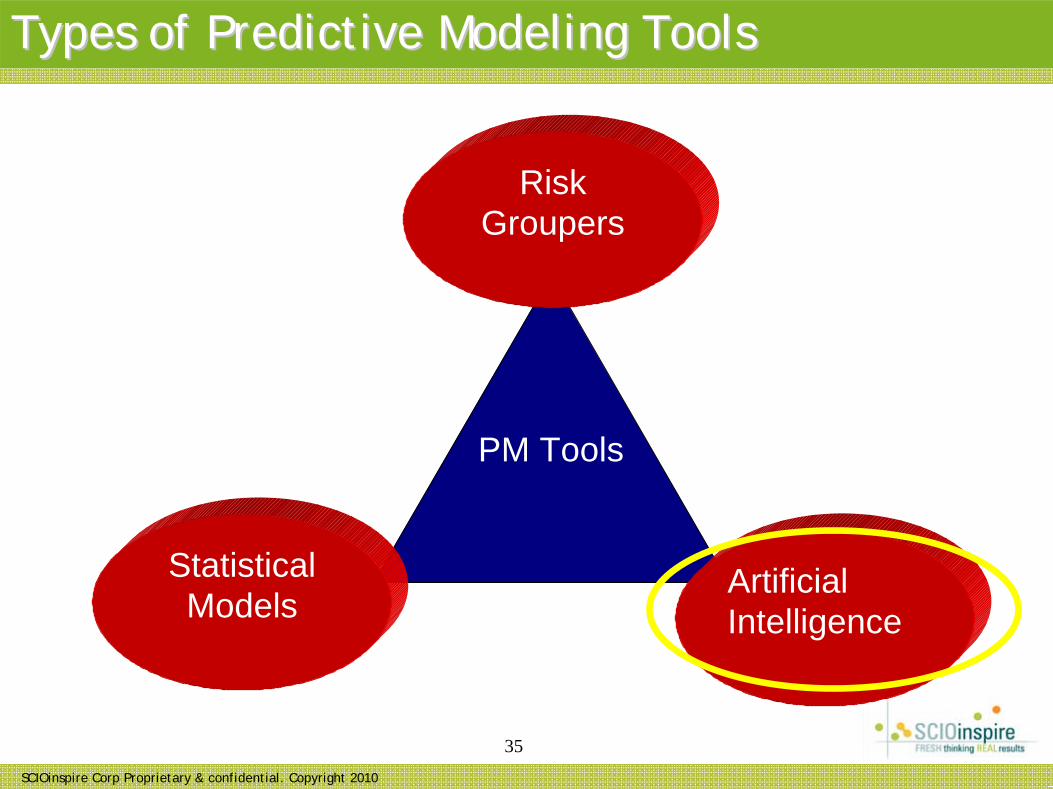
Types of Predictive Modeling ToolsTypes of Predictive Modeling Tools
Predictive Modeling
ToolsStatistical
Models
RiskGroupers
ArtificialIntelligence
SCIOinspire Corp Proprietary & confidential. Copyright 2010
29
Risk GroupersRisk Groupers
What are the different types of risk groupers?
SCIOinspire Corp Proprietary & confidential. Copyright 2010
30
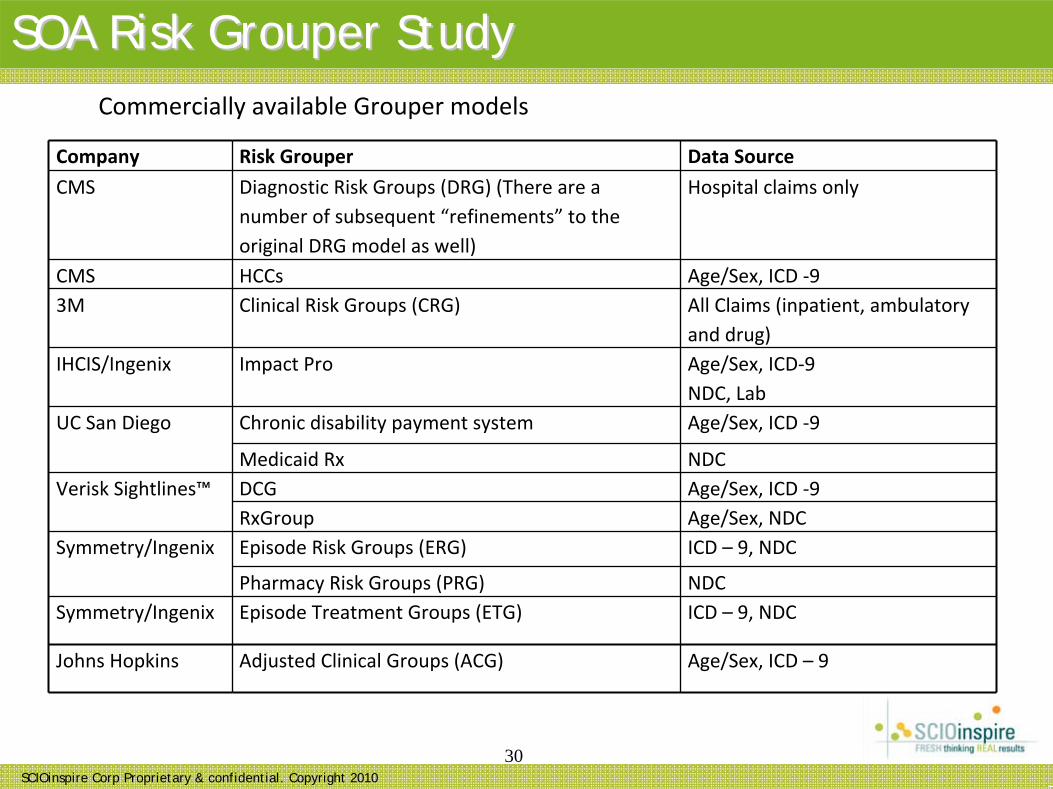
SOA Risk Grouper Study SOA Risk Grouper Study
Company Risk Grouper Data Source
CMS Diagnostic Risk Groups (DRG) (There are a number of subsequent “refinements” to the original DRG model as well)
Hospital claims only
CMS HCCs Age/Sex, ICD ‐93M Clinical Risk Groups (CRG) All Claims (inpatient, ambulatory
and drug) IHCIS/Ingenix Impact Pro Age/Sex, ICD‐9
NDC, LabUC San Diego Chronic disability payment system Age/Sex, ICD ‐9
Medicaid Rx NDCVerisk Sightlines™ DCG Age/Sex, ICD ‐9
RxGroup Age/Sex, NDCSymmetry/Ingenix Episode Risk Groups (ERG) ICD – 9, NDC
Pharmacy Risk Groups (PRG) NDCSymmetry/Ingenix Episode Treatment Groups (ETG) ICD – 9, NDC
Johns Hopkins Adjusted Clinical Groups (ACG) Age/Sex, ICD – 9
Commercially available Grouper models
SCIOinspire Corp Proprietary & confidential. Copyright 2010
31
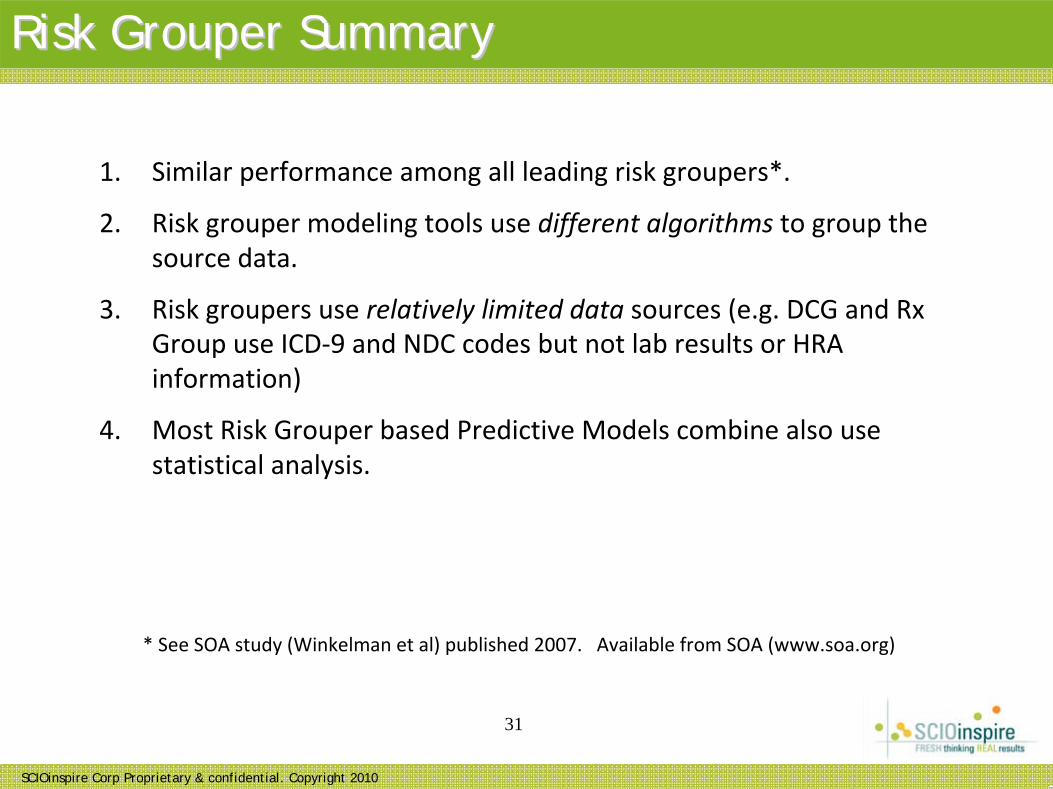
Risk Grouper SummaryRisk Grouper Summary
1. Similar performance among all leading risk groupers*.
2. Risk grouper modeling tools use different algorithms to group the source data.
3. Risk groupers use relatively limited data sources (e.g. DCG and Rx Group use ICD‐9 and NDC codes but not lab results or HRA information)
4. Most Risk Grouper based Predictive Models combine also use statistical analysis.
* See SOA study (Winkelman et al) published 2007. Available from SOA (www.soa.org)
SCIOinspire Corp Proprietary & confidential. Copyright 201032
Types of Predictive Modeling ToolsTypes of Predictive Modeling Tools
PM Tools
StatisticalModels
RiskGroupers
ArtificialIntelligence
SCIOinspire Corp Proprietary & confidential. Copyright 2010
33
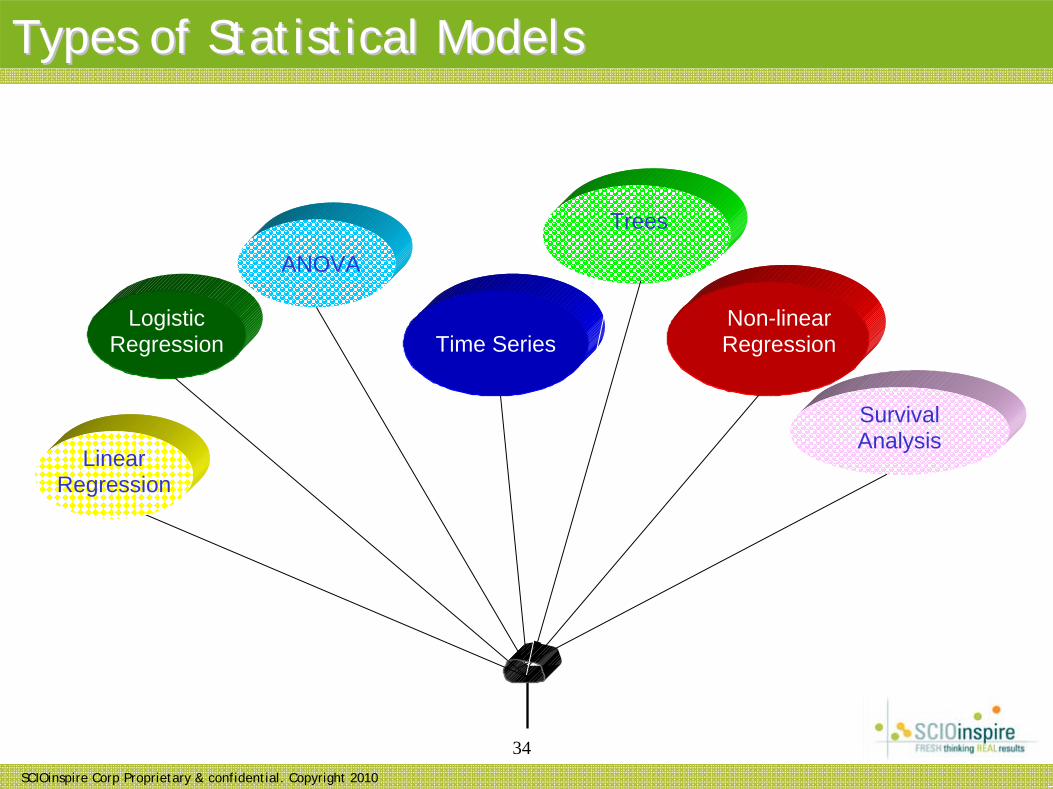
Statistical ModelsStatistical Models
What are the different types of statistical models?
SCIOinspire Corp Proprietary & confidential. Copyright 2010
34
Logistic Regression
ANOVA
Time Series
Survival Analysis
Non-linear Regression
Linear Regression
Trees
Types of Statistical ModelsTypes of Statistical Models
SCIOinspire Corp Proprietary & confidential. Copyright 2010
35
Types of Predictive Modeling ToolsTypes of Predictive Modeling Tools
PM Tools
StatisticalModels
RiskGroupers
ArtificialIntelligence
SCIOinspire Corp Proprietary & confidential. Copyright 2010
36
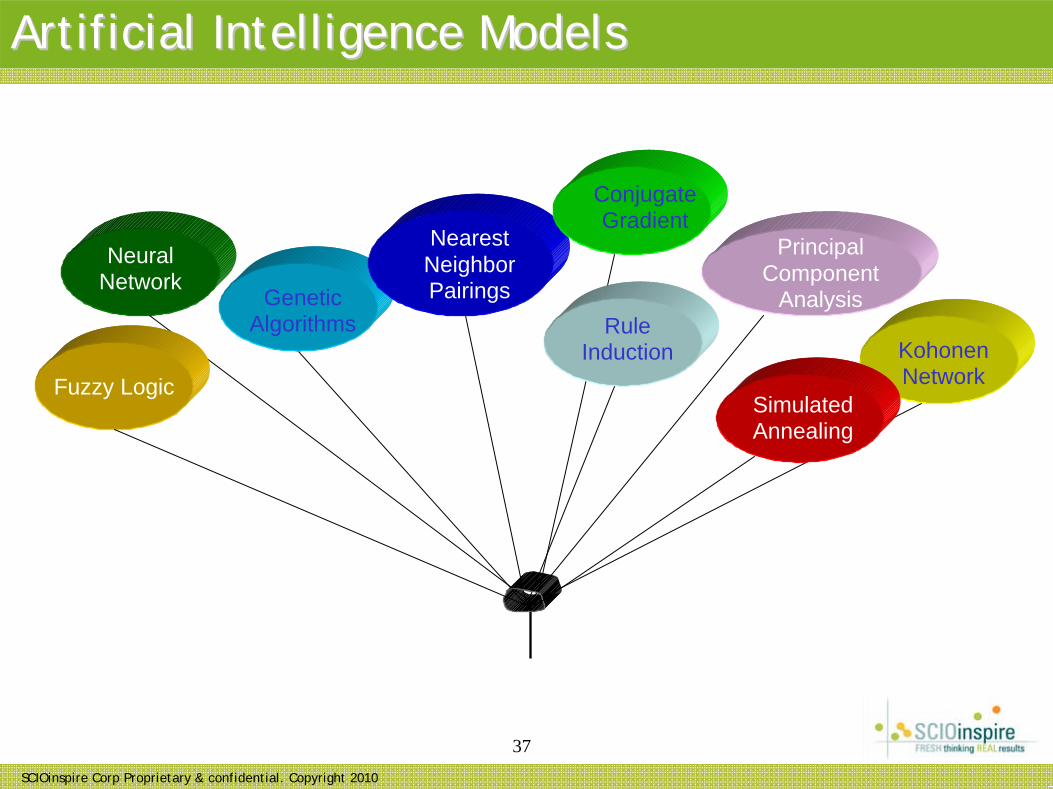
Artificial Intelligence ModelsArtificial Intelligence Models
What are the different types of artificial intelligence models?
SCIOinspire Corp Proprietary & confidential. Copyright 2010
37
Neural Network
Genetic Algorithms
Nearest Neighbor Pairings
Principal Component
AnalysisRule
Induction Kohonen NetworkFuzzy Logic
Conjugate Gradient
Simulated Annealing
Artificial Intelligence ModelsArtificial Intelligence Models
SCIOinspire Corp Proprietary & confidential. Copyright 2010
38
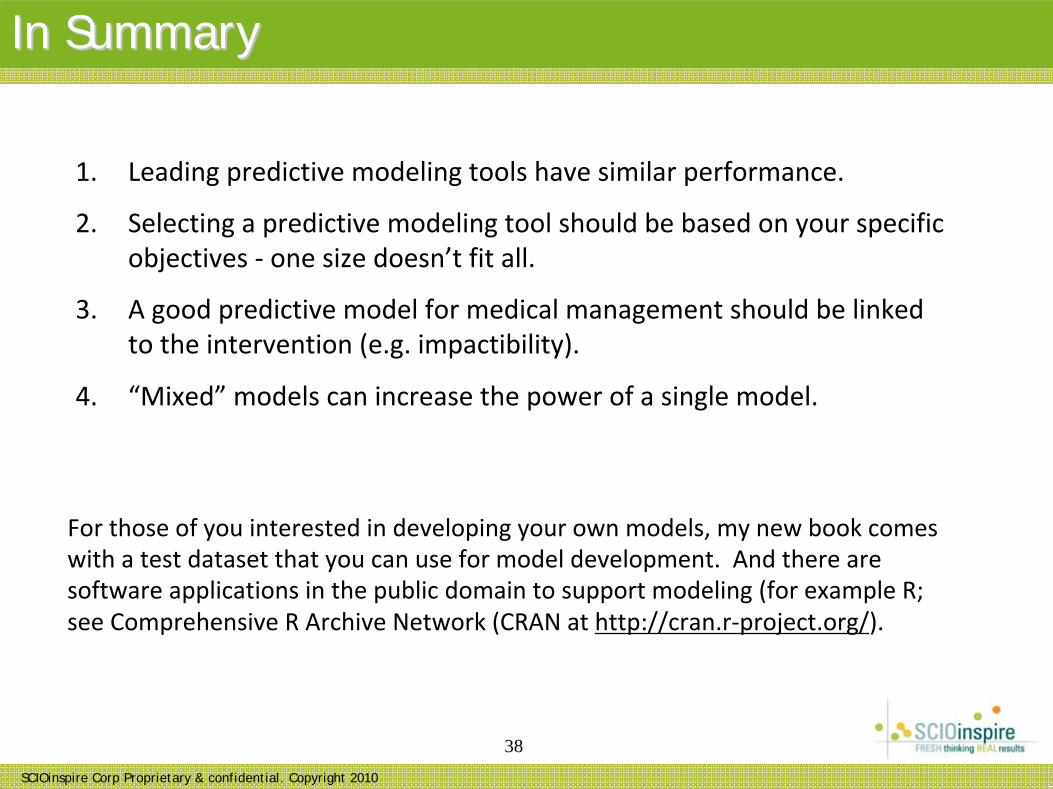
In SummaryIn Summary
1. Leading predictive modeling tools have similar performance.
2. Selecting a predictive modeling tool should be based on your specific objectives ‐ one size doesn’t fit all.
3. A good predictive model for medical management should be linked to the intervention (e.g. impactibility).
4. “Mixed” models can increase the power of a single model.
For those of you interested in developing your own models, my new book comes with a test dataset that you can use for model development. And there are software applications in the public domain to support modeling (for example R; see Comprehensive R Archive Network (CRAN at http://cran.r‐project.org/).
SCIOinspire Corp Proprietary & confidential. Copyright 2010
39
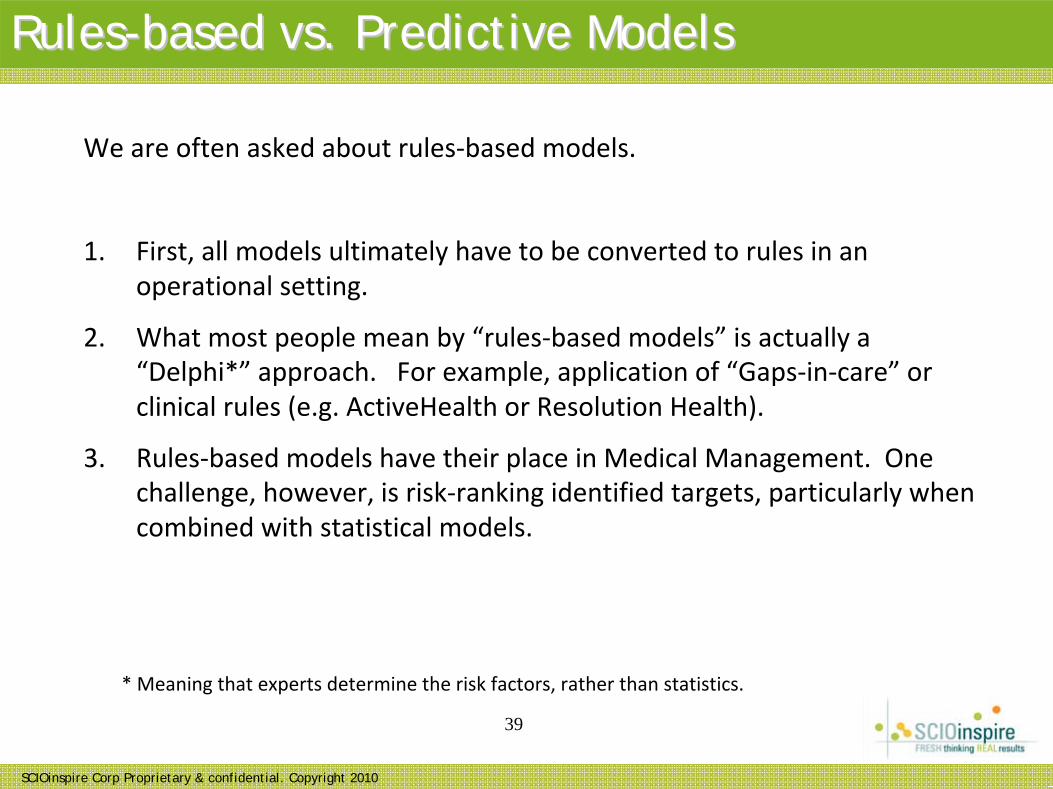
RulesRules--based vs. Predictive Modelsbased vs. Predictive Models
We are often asked about rules‐based models.
1. First, all models ultimately have to be converted to rules in an operational setting.
2. What most people mean by “rules‐based models” is actually a “Delphi*” approach. For example, application of “Gaps‐in‐care” or clinical rules (e.g. ActiveHealth or Resolution Health).
3. Rules‐based models have their place in Medical Management. One challenge, however, is risk‐ranking identified targets, particularly when combined with statistical models.
* Meaning that experts determine the risk factors, rather than statistics.

SCIOinspire Corp Proprietary & confidential. Copyright 2010
40
Practical Example of Model- Building
SCIOinspire Corp Proprietary & confidential. Copyright 201041
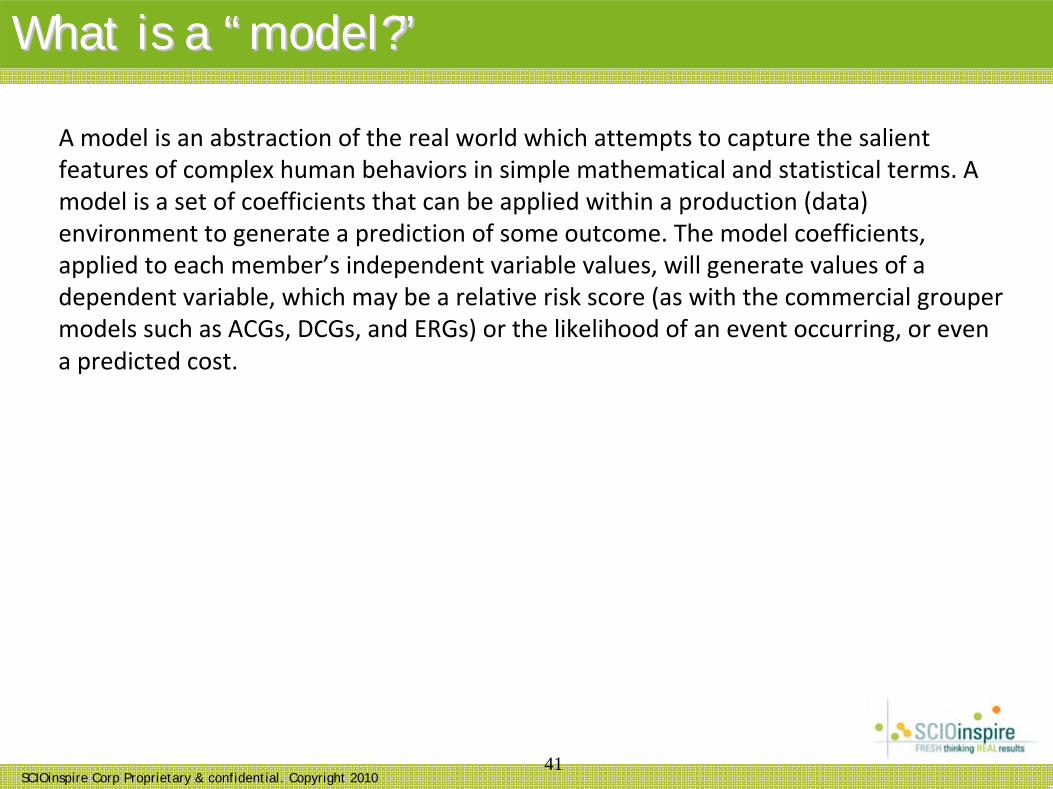
What is a What is a ““model?model?””
A model is an abstraction of the real world which attempts to capture the salient features of complex human behaviors in simple mathematical and statistical terms. A model is a set of coefficients that can be applied within a production (data) environment to generate a prediction of some outcome. The model coefficients, applied to each member’s independent variable values, will generate values of a dependent variable, which may be a relative risk score (as with the commercial grouper models such as ACGs, DCGs, and ERGs) or the likelihood of an event occurring, or even a predicted cost.
SCIOinspire Corp Proprietary & confidential. Copyright 201042
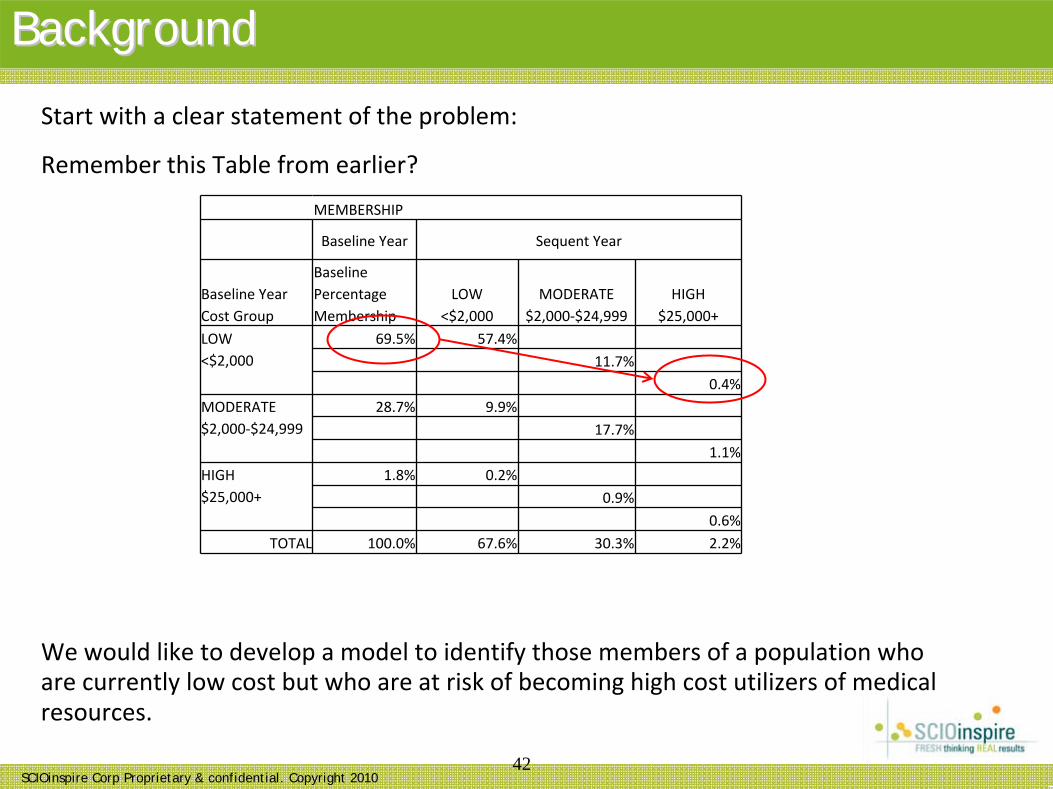
Start with a clear statement of the problem:
Remember this Table from earlier?
We would like to develop a model to identify those members of a population who are currently low cost but who are at risk of becoming high cost utilizers of medical resources.
BackgroundBackground
MEMBERSHIP
Baseline Year Sequent Year
Baseline Year
Cost Group
Baseline
Percentage
MembershipLOW
<$2,000
MODERATE
$2,000‐$24,999HIGH
$25,000+
LOW
<$2,00069.5% 57.4%
11.7%0.4%
MODERATE
$2,000‐$24,99928.7% 9.9%
17.7%1.1%
HIGH
$25,000+1.8% 0.2%
0.9%0.6%
TOTAL 100.0% 67.6% 30.3% 2.2%
SCIOinspire Corp Proprietary & confidential. Copyright 2010
43
Available data for creating the model included the following:
• Eligibility/demographics
• Rx claims
• Medical claims
For this project, several data mining techniques were considered: neural net, CHAID decision tree, and regression. The regression was chosen for the following reasons:
• With proper data selection and transformation, the regression was very effective, more so than the tree.
• The results are easily understood by all stake‐holders (everyone understands Regression!).
BackgroundBackground
SCIOinspire Corp Proprietary & confidential. Copyright 2010
44
1. Split the dataset randomly into halves1. Split the dataset randomly into halves
Test Dataset
Analysis Dataset
Master Dataset
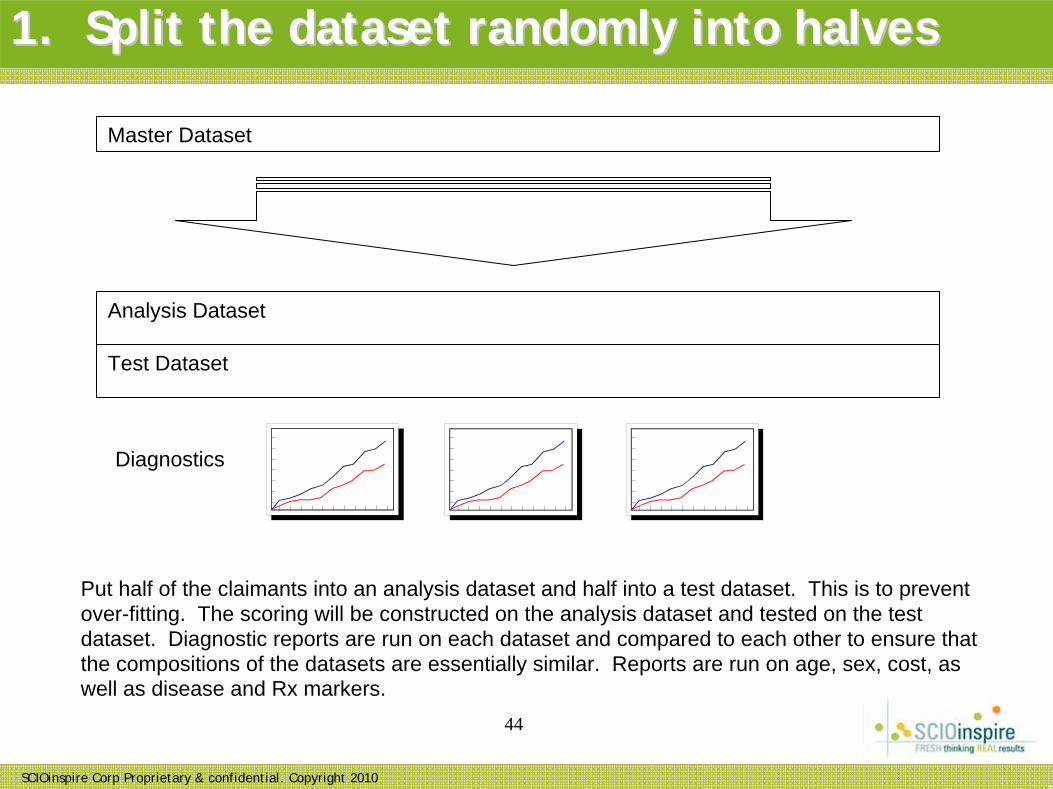
Put half of the claimants into an analysis dataset and half into a test dataset. This is to prevent over-fitting. The scoring will be constructed on the analysis dataset and tested on the test dataset. Diagnostic reports are run on each dataset and compared to each other to ensure that the compositions of the datasets are essentially similar. Reports are run on age, sex, cost, as well as disease and Rx markers.
Diagnostics
SCIOinspire Corp Proprietary & confidential. Copyright 2010
45
• In any data‐mining project, the output is only as good as the input.
• Most of the time and resources in a data mining project are actually used for variable preparation and evaluation, rather than generation of the actual “recipe”.
• In our test dataset (provided with the forthcoming book) we provide a number of independent variables, as well as “derived” flags, for example:
• Age group;• Condition Categories (using the HCC Grouper);• Urban/Rural residence;• No. Admissions;• Etc.
• Of course, the analyst should consider the needs of the project and create his/her own variables.
2. Build and Transform independent variables2. Build and Transform independent variables
SCIOinspire Corp Proprietary & confidential. Copyright 2010
46
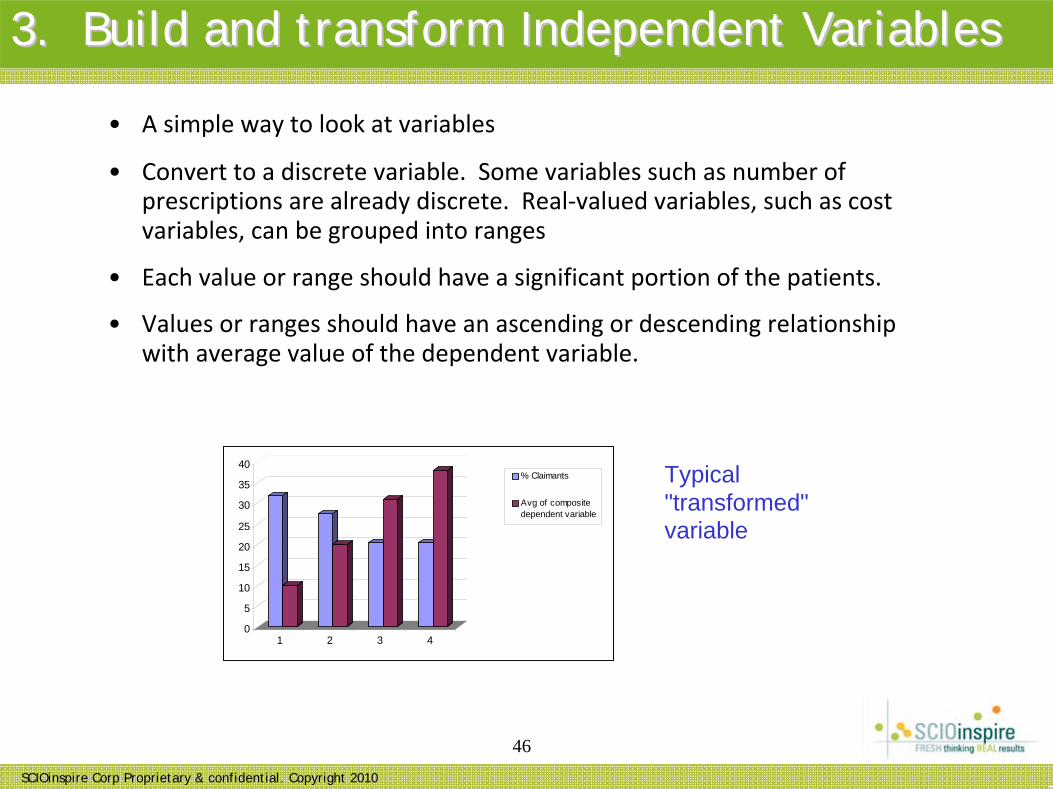
• A simple way to look at variables
• Convert to a discrete variable. Some variables such as number of prescriptions are already discrete. Real‐valued variables, such as cost variables, can be grouped into ranges
• Each value or range should have a significant portion of the patients.
• Values or ranges should have an ascending or descending relationship with average value of the dependent variable.
Typical "transformed" variable
3. Build and transform Independent Variables3. Build and transform Independent Variables
0
5
10
15
20
25
30
35
40
1 2 3 4
% Claimants
Avg of compositedependent variable
SCIOinspire Corp Proprietary & confidential. Copyright 2010
47
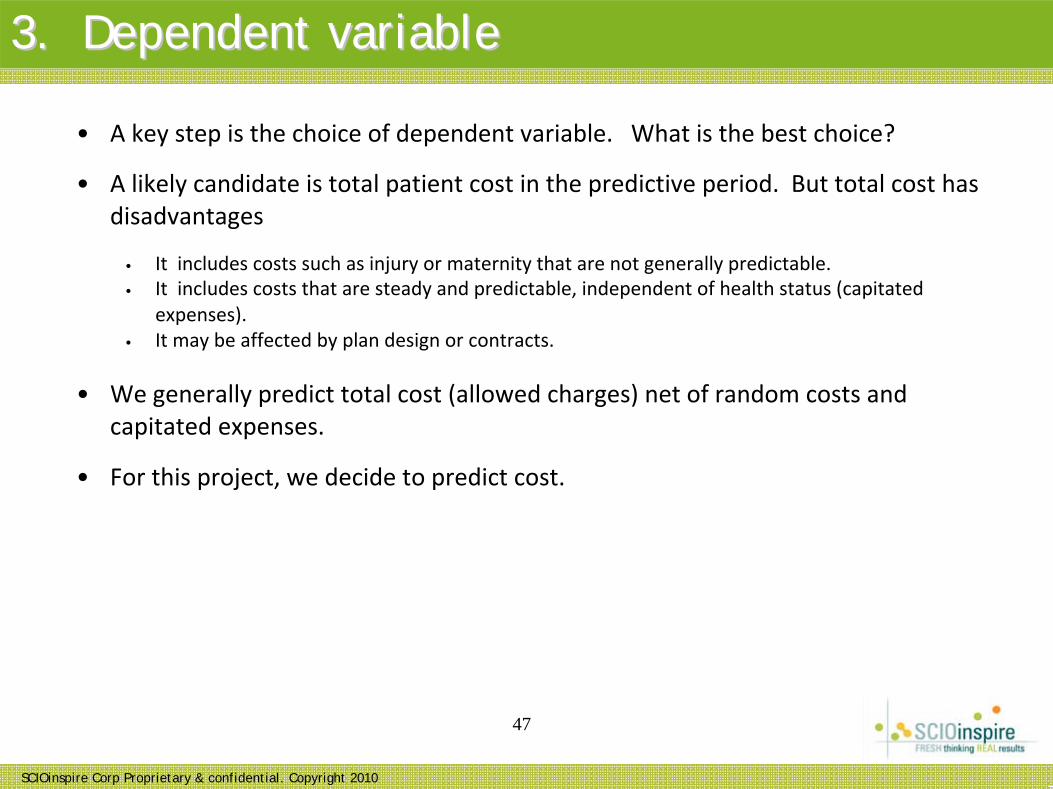
3. Dependent variable3. Dependent variable
• A key step is the choice of dependent variable. What is the best choice?
• A likely candidate is total patient cost in the predictive period. But total cost has disadvantages
•
It includes costs such as injury or maternity that are not generally predictable.•
It includes costs that are steady and predictable, independent of health status (capitated expenses).
•
It may be affected by plan design or contracts.
• We generally predict total cost (allowed charges) net of random costs and capitated expenses.
• For this project, we decide to predict cost.
SCIOinspire Corp Proprietary & confidential. Copyright 2010
48
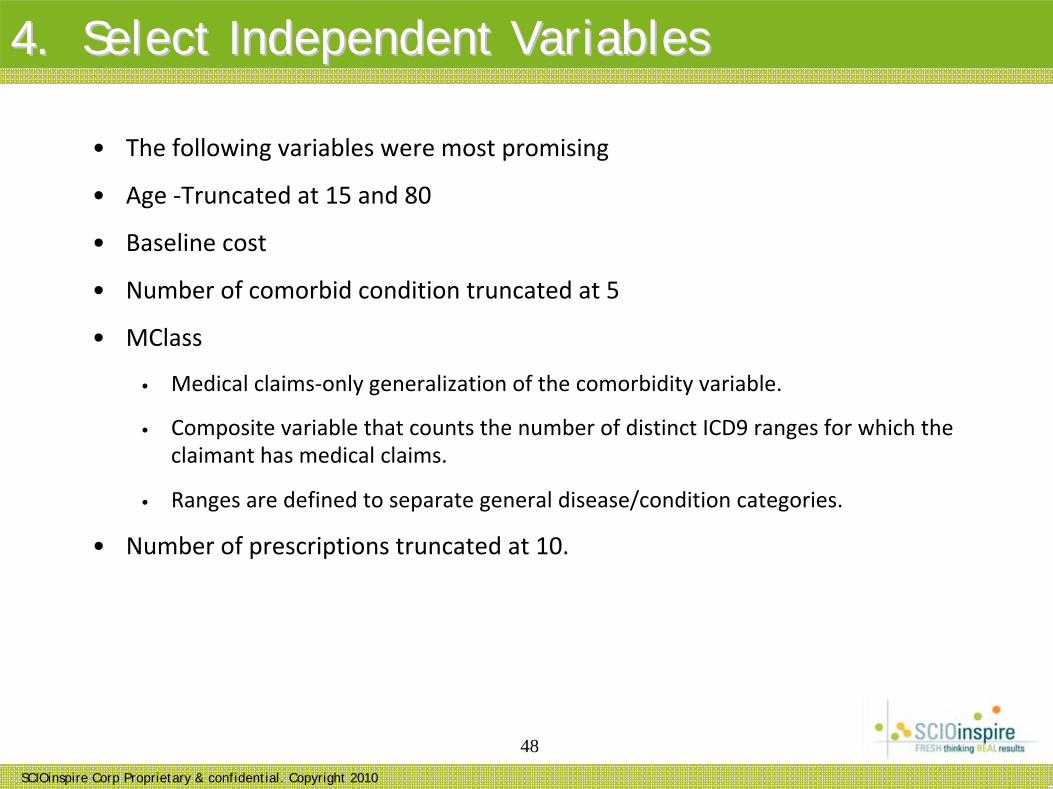
• The following variables were most promising
• Age ‐Truncated at 15 and 80
• Baseline cost
• Number of comorbid condition truncated at 5
• MClass
• Medical claims‐only generalization of the comorbidity variable.
• Composite variable that counts the number of distinct ICD9 ranges for which the claimant has medical claims.
• Ranges are defined to separate general disease/condition categories.
• Number of prescriptions truncated at 10.
4. Select Independent Variables4. Select Independent Variables
SCIOinspire Corp Proprietary & confidential. Copyright 2010
49
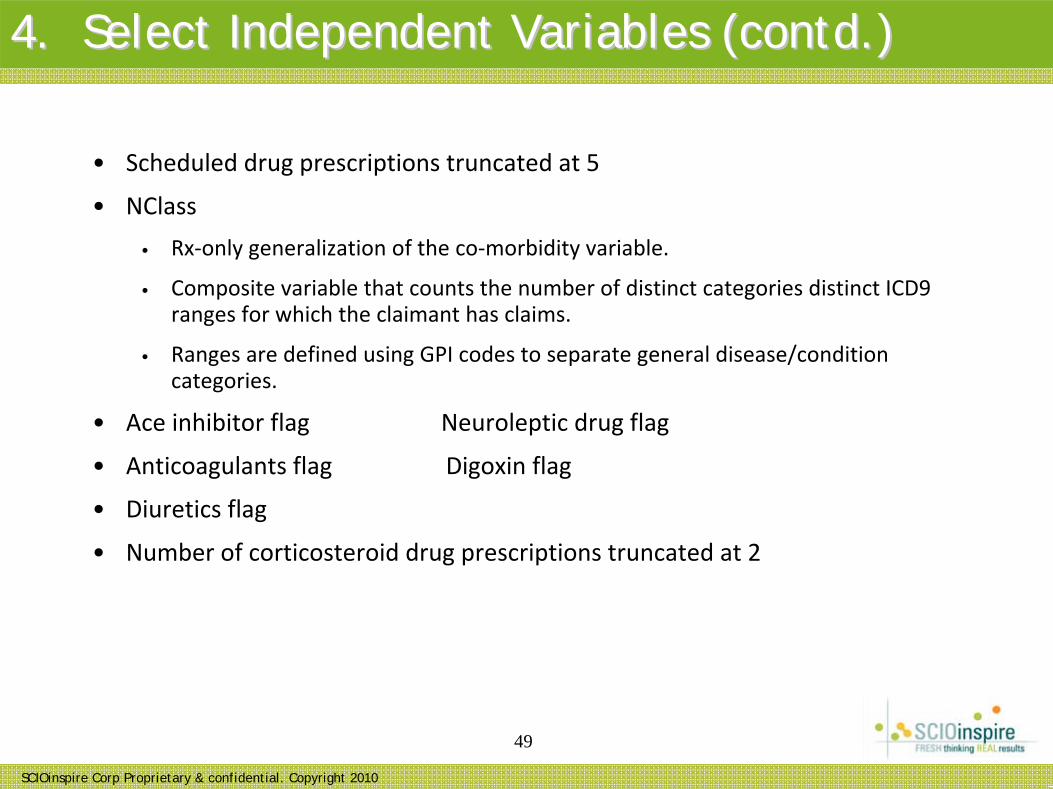
• Scheduled drug prescriptions truncated at 5
• NClass
• Rx‐only generalization of the co‐morbidity variable.
• Composite variable that counts the number of distinct categories distinct ICD9 ranges for which the claimant has claims.
• Ranges are defined using GPI codes to separate general disease/condition categories.
• Ace inhibitor flag Neuroleptic drug flag
• Anticoagulants flag Digoxin flag
• Diuretics flag
• Number of corticosteroid drug prescriptions truncated at 2
4. Select Independent Variables (contd.)4. Select Independent Variables (contd.)

SCIOinspire Corp Proprietary & confidential. Copyright 2010
50
5. Run Stepwise Linear Regression5. Run Stepwise Linear Regression
An ordinary linear regression is simply a formula for determining a best‐possible linear equation describing a dependent variable as a function of the independent variables. But this pre‐supposes the selection of a best‐possible set of independent variables. How is this best‐possible set of independent variables chosen?
One method is a stepwise regression. This is an algorithm that determines both a set of variables and a regression. Variables are selected in order according to their contribution to incremental R2.
SCIOinspire Corp Proprietary & confidential. Copyright 2010
51
5. Run Stepwise Linear Regression (continued)5. Run Stepwise Linear Regression (continued)
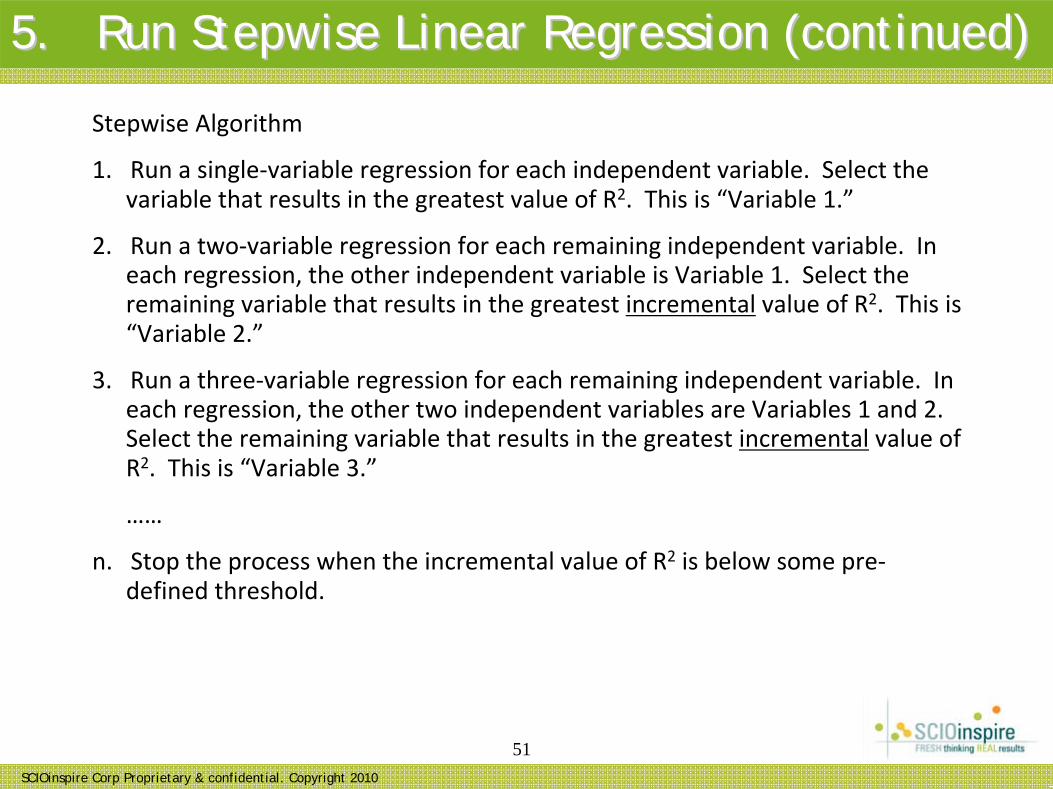
Stepwise Algorithm
1. Run a single‐variable regression for each independent variable. Select the variable that results in the greatest value of R2. This is “Variable 1.”
2. Run a two‐variable regression for each remaining independent variable. In each regression, the other independent variable is Variable 1. Select the remaining variable that results in the greatest incremental value of R
2. This is “Variable 2.”
3. Run a three‐variable regression for each remaining independent variable. In each regression, the other two independent variables are Variables 1 and 2. Select the remaining variable that results in the greatest incremental value of R2. This is “Variable 3.”
……
n. Stop the process when the incremental value of R2 is below some pre‐
defined threshold.
SCIOinspire Corp Proprietary & confidential. Copyright 2010
52
6. Results 6. Results -- ExamplesExamples
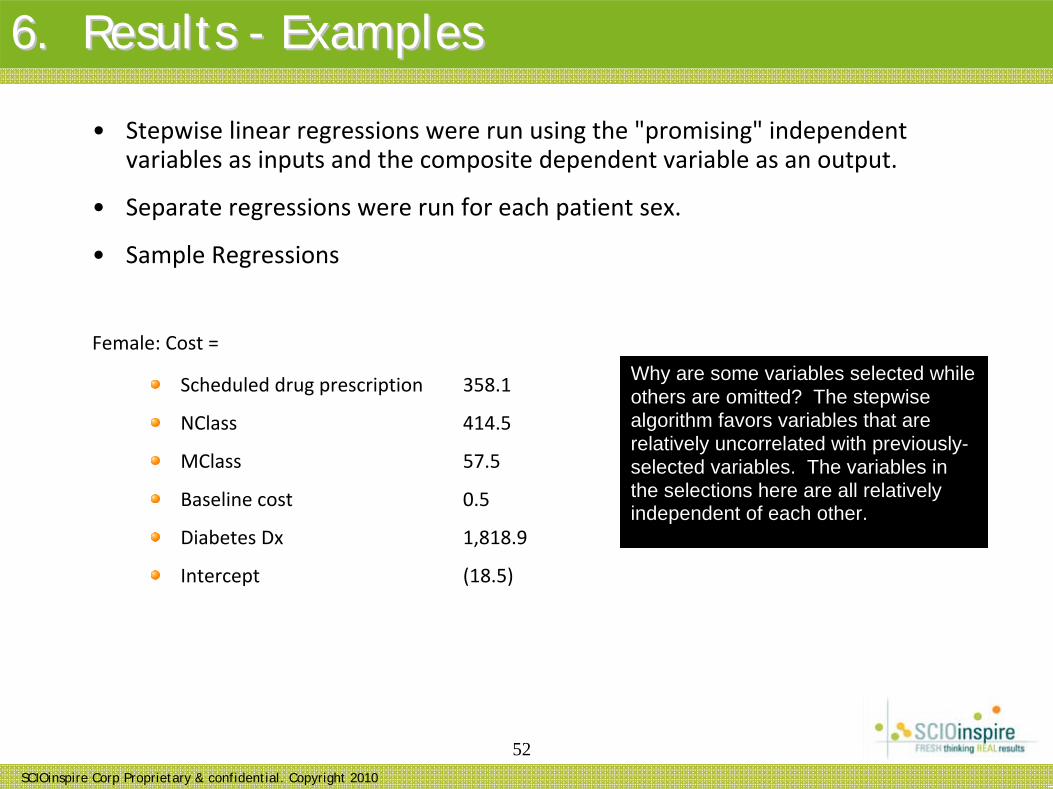
• Stepwise linear regressions were run using the "promising" independent variables as inputs and the composite dependent variable as an output.
• Separate regressions were run for each patient sex.
• Sample Regressions
Female: Cost =
Scheduled drug prescription 358.1
NClass 414.5
MClass 57.5
Baseline cost 0.5
Diabetes Dx 1,818.9
Intercept (18.5)
Why are some variables selected while others are omitted? The stepwise algorithm favors variables that are relatively uncorrelated with previously- selected variables. The variables in the selections here are all relatively independent of each other.
SCIOinspire Corp Proprietary & confidential. Copyright 201053
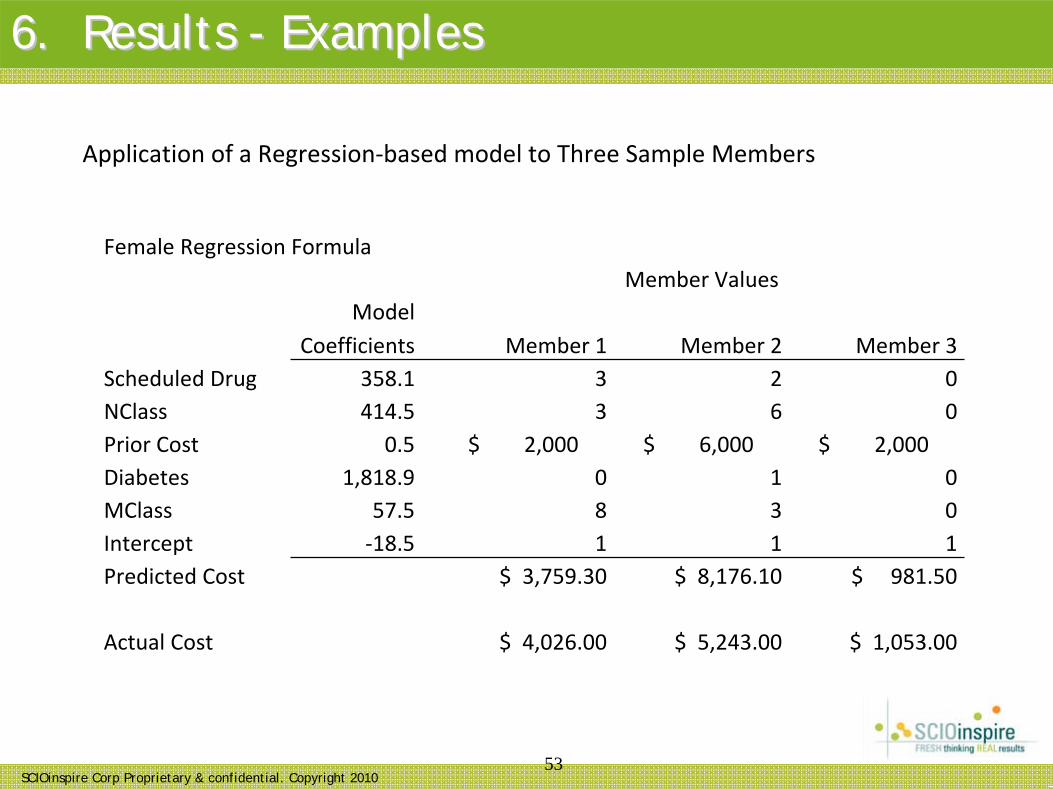
Female Regression FormulaMember Values
Model Coefficients Member 1 Member 2 Member 3
Scheduled Drug 358.1 3 2 0NClass 414.5 3 6 0Prior Cost 0.5 $ 2,000 $ 6,000 $ 2,000 Diabetes 1,818.9 0 1 0MClass 57.5 8 3 0Intercept ‐18.5 1 1 1Predicted Cost $ 3,759.30 $ 8,176.10 $ 981.50
Actual Cost $ 4,026.00 $ 5,243.00 $ 1,053.00
Application of a Regression‐based model to Three Sample Members
6. Results 6. Results -- ExamplesExamples
SCIOinspire Corp Proprietary & confidential. Copyright 2010
54
…..it IS about resource allocation.
PM is PM is NOTNOT always about always about Cost Cost PredictionPrediction……....
• Where/how should you allocate resources?
• Who is intervenable or impactable?
• What can you expect for outcomes?
• How can you manage the key drivers of the economic model for better outcomes?
SCIOinspire Corp Proprietary & confidential. Copyright 2010
55
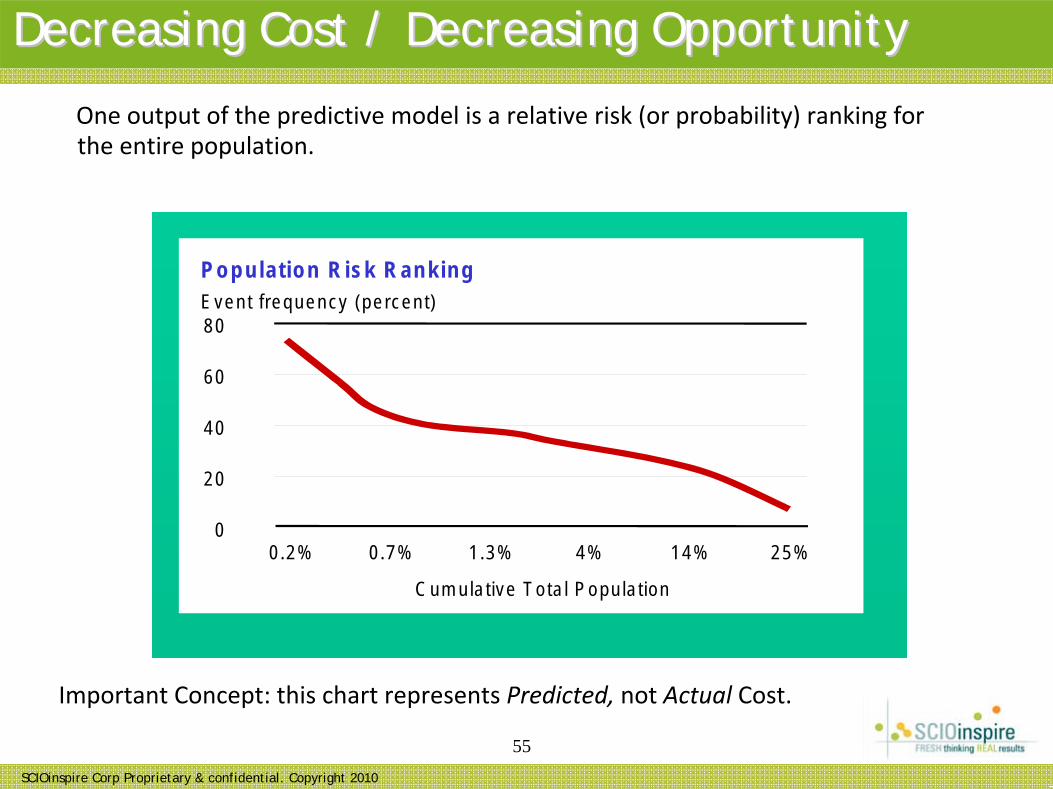
Decreasing Cost / Decreasing OpportunityDecreasing Cost / Decreasing Opportunity
P o p u la tio n R is k R a n k in g
0
2 0
4 0
6 0
8 0
0 .2 % 0 .7 % 1 .3 % 4 % 1 4 % 2 5 %
C u m u la tive T o ta l P o p u la tio n
E ve n t fre q u e n cy (p e rce n t)
Important Concept: this chart represents Predicted, not Actual Cost.
One output of the predictive model is a relative risk (or probability) ranking for the entire population.
SCIOinspire Corp Proprietary & confidential. Copyright 201056
The Economic Model and Program PlanningThe Economic Model and Program Planning
• As the Population Risk Ranking slide shows, all people do not represent equal opportunity.
• The difference in opportunity means that programs need to be well planned.
• It also gives you an opportunity to test the accuracy of different models.
SCIOinspire Corp Proprietary & confidential. Copyright 2010
57
Economic Model: Simple exampleEconomic Model: Simple example
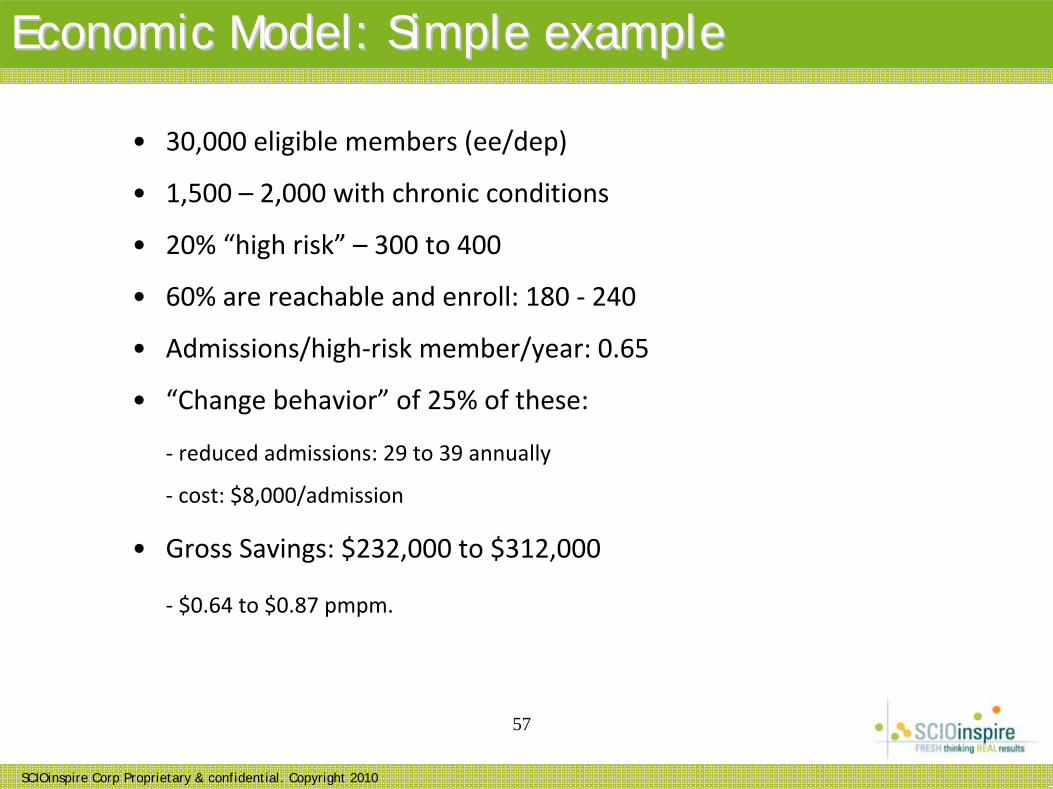
• 30,000 eligible members (ee/dep)
• 1,500 – 2,000 with chronic conditions
• 20% “high risk” – 300 to 400
• 60% are reachable and enroll: 180 ‐ 240
• Admissions/high‐risk member/year: 0.65
• “Change behavior” of 25% of these:
‐ reduced admissions: 29 to 39 annually
‐ cost: $8,000/admission
• Gross Savings: $232,000 to $312,000
‐ $0.64 to $0.87 pmpm.
SCIOinspire Corp Proprietary & confidential. Copyright 2010
58
Key drivers of the economic modelKey drivers of the economic model
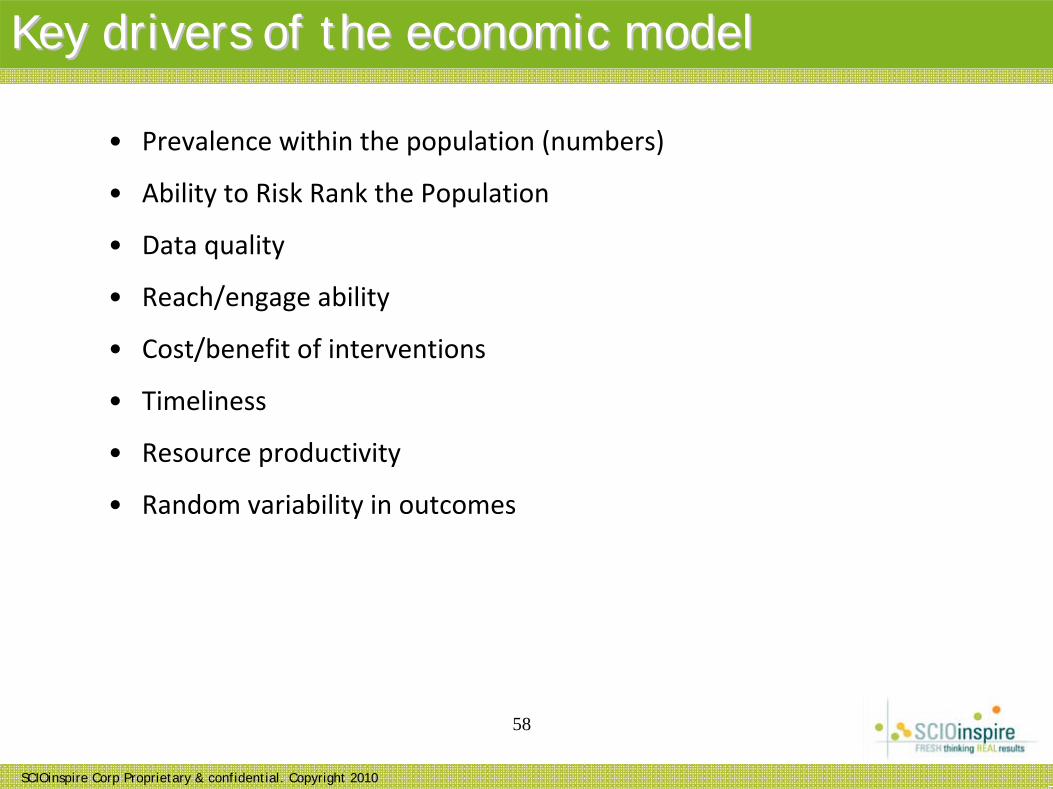
• Prevalence within the population (numbers)
• Ability to Risk Rank the Population
• Data quality
• Reach/engage ability
• Cost/benefit of interventions
• Timeliness
• Resource productivity
• Random variability in outcomes
SCIOinspire Corp Proprietary & confidential. Copyright 2010
59
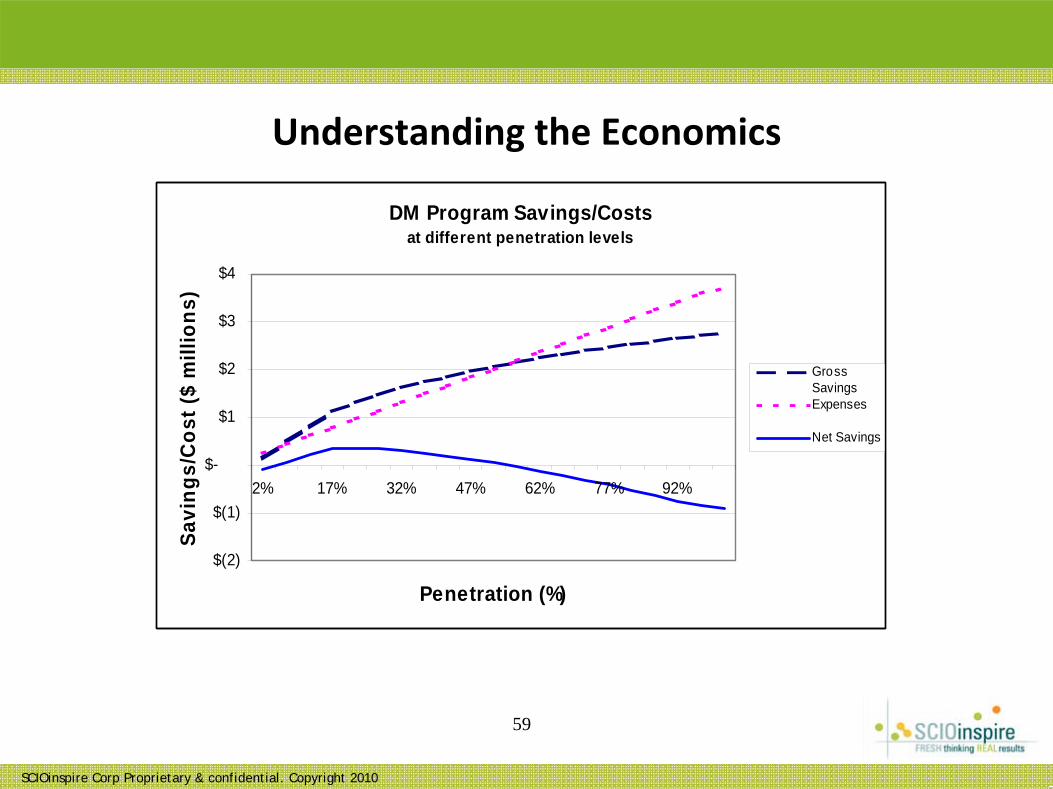
DM Program Savings/Costsat different penetration levels
$(2)
$(1)
$-
$1
$2
$3
$4
2% 17% 32% 47% 62% 77% 92%
Penetration (%)
Savi
ngs/
Cos
t ($
mill
ions
)
GrossSavingsExpenses
Net Savings
Understanding the Economics
SCIOinspire Corp Proprietary & confidential. Copyright 2010
60
Evaluation – Case Examples
SCIOinspire Corp Proprietary & confidential. Copyright 2010
61
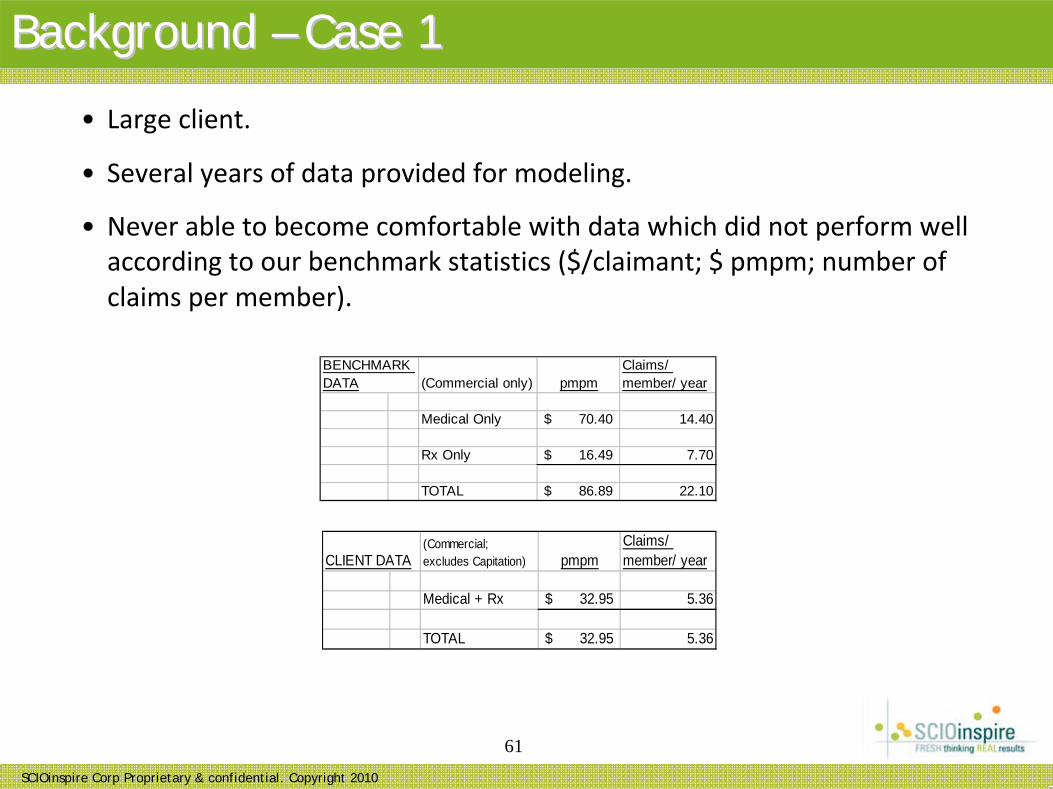
• Large client.
• Several years of data provided for modeling.
• Never able to become comfortable with data which did not perform well according to our benchmark statistics ($/claimant; $ pmpm; number of claims per member).
Background Background –– Case 1Case 1
(Commercial only) pmpmClaims/ member/ year
Medical Only 70.40$ 14.40
Rx Only 16.49$ 7.70
TOTAL 86.89$ 22.10
BENCHMARK DATA
(Commercial; excludes Capitation) pmpm
Claims/ member/ year
Medical + Rx 32.95$ 5.36
TOTAL 32.95$ 5.36
CLIENT DATA
SCIOinspire Corp Proprietary & confidential. Copyright 2010
62
• Built models to predict cost in year 2 from year 1.
• Now for the hard part: evaluating the results.
Background Background –– Case 1Case 1
SCIOinspire Corp Proprietary & confidential. Copyright 2010
63
How well does the model perform?How well does the model perform?
All Groups
0
20
40
60
80
100
120
140
-100%
+
-90% to
-99%
-80% to
-89%
-70% to
-79%
-60% to
-69%
-50% to
-59%
-40% to
-49%
-30% to
-39%
-20% to
-29%
-10% to
-19%
0% to
-9%
0% to
9%10
% to 19
%20
% to 29
%30
% to 39
%40
% to 49
%50
% to 59
%60
% to 69
%70
% to 79
%80
% to 89
%90
% to 99
%
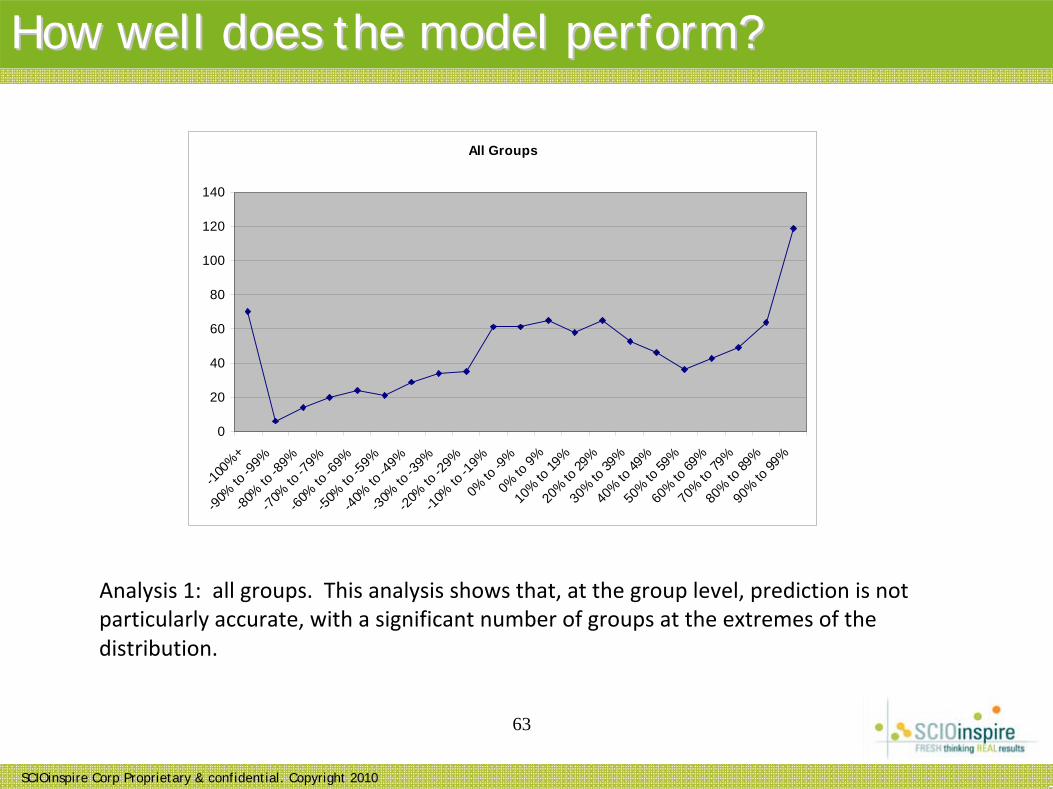
Analysis 1: all groups. This analysis shows that, at the group level, prediction is not particularly accurate, with a significant number of groups at the extremes of the distribution.

SCIOinspire Corp Proprietary & confidential. Copyright 2010
64
Min 50 per group
0
10
20
30
40
50
60
-100%+
-90% to
-99%
-80% to
-89%
-70% to
-79%
-60% to
-69%
-50% to
-59%
-40% to
-49%
-30% to
-39%
-20% to
-29%
-10% to
-19%
0% to
-9%
0% to
9%10
% to 19
%20
% to 29
%30
% to 39
%40
% to 49
%50
% to 59
%60
% to 69
%70
% to 79
%80
% to 89
%90
% to 99
%
Analysis 2: Omitting small groups (under 50 lives) significantly improves the actual/ predicted outcomes.
How well does the model perform?How well does the model perform?
SCIOinspire Corp Proprietary & confidential. Copyright 2010
65
All Groups - Weighted
0
5000
10000
15000
20000
25000
30000
-100%
+
-90% to
-99%
-80% to
-89%
-70% to
-79%
-60% to
-69%
-50% to
-59%
-40% to
-49%
-30% to
-39%
-20% to
-29%
-10% to
-19%
0% to
-9%
0% to
9%10
% to 19
%20
% to 29
%30
% to 39
%40
% to 49
%50
% to 59
%60
% to 69
%70
% to 79
%80
% to 89
%90
% to 99
%
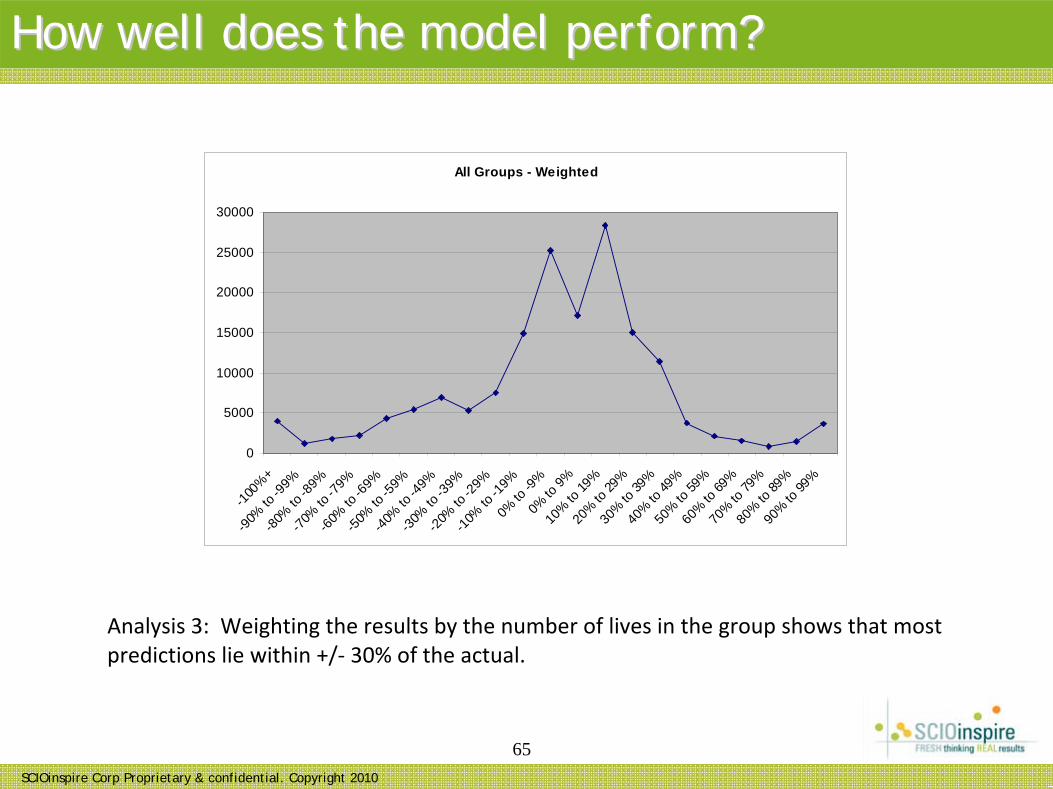
Analysis 3: Weighting the results by the number of lives in the group shows that most predictions lie within +/‐ 30% of the actual.
How well does the model perform?How well does the model perform?
SCIOinspire Corp Proprietary & confidential. Copyright 2010
66
• Significant data issues were identified and not resolved.
• This was a large group carrier who had many groups “re‐classified” during the period. They were unable to provide good data that “matched” re‐classified groups to their previous numbers.
• Conclusions:
This case study Illustrates 2 things:
• The importance of data evaluation (and if necessary, correction).
• Evaluation of a model is more than simply looking at the statistics (R2, etc.). The implications of the model for the business problem must also be evaluated.
ConclusionConclusion
SCIOinspire Corp Proprietary & confidential. Copyright 2010
67
• Client uses a manual rate basis for rating small cases. Client believes that case selection/ assignment may result in case assignment to rating classes that is not optimal.
• A predictive model may add further accuracy to the class assignment process and enable more accurate rating and underwriting to be done.
Background Background –– Case 2.Case 2.
SCIOinspire Corp Proprietary & confidential. Copyright 2010
68
• A number of different tree models were built (at client’s request).
• Technically, an optimal model was chosen.
Problem: how to convince Underwriting that:
• Adding the predictive model to the underwriting process produces more accurate results; and
• They need to change their processes to incorporate the predictive model.
BackgroundBackground
SCIOinspire Corp Proprietary & confidential. Copyright 2010
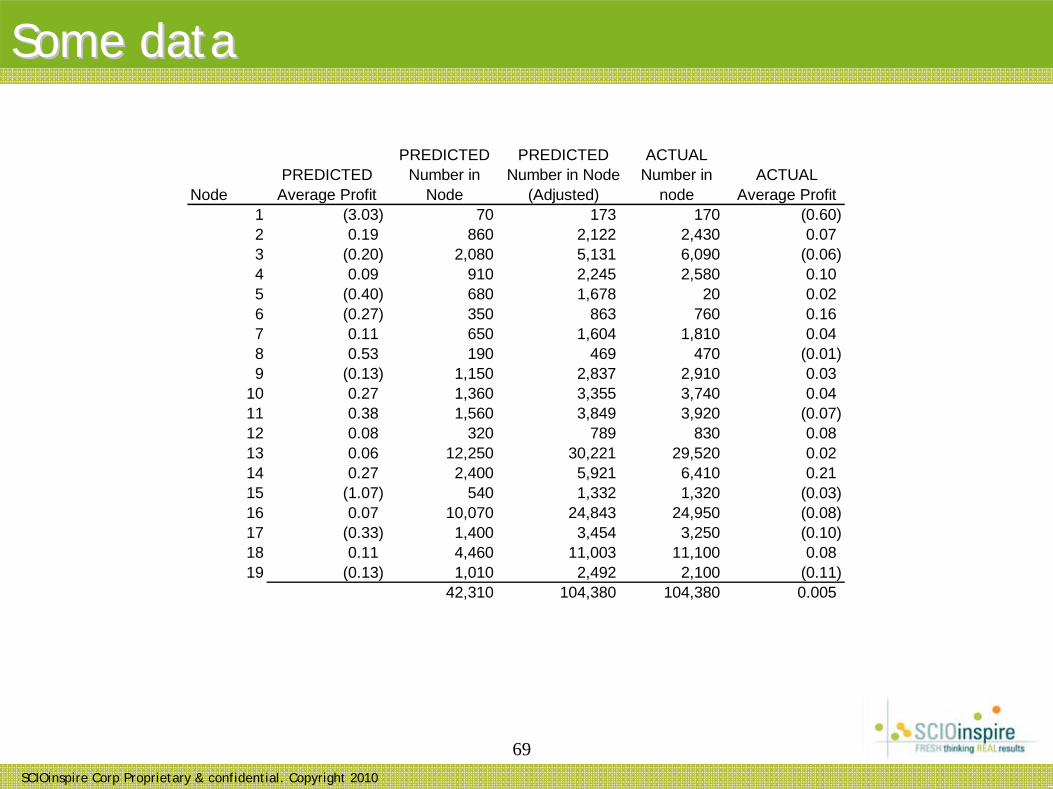
69
Some dataSome data
NodePREDICTED
Average Profit
PREDICTED Number in
Node
PREDICTED Number in Node
(Adjusted)
ACTUAL Number in
nodeACTUAL
Average Profit1 (3.03) 70 173 170 (0.60) 2 0.19 860 2,122 2,430 0.07 3 (0.20) 2,080 5,131 6,090 (0.06) 4 0.09 910 2,245 2,580 0.10 5 (0.40) 680 1,678 20 0.02 6 (0.27) 350 863 760 0.16 7 0.11 650 1,604 1,810 0.04 8 0.53 190 469 470 (0.01) 9 (0.13) 1,150 2,837 2,910 0.03
10 0.27 1,360 3,355 3,740 0.04 11 0.38 1,560 3,849 3,920 (0.07) 12 0.08 320 789 830 0.08 13 0.06 12,250 30,221 29,520 0.02 14 0.27 2,400 5,921 6,410 0.21 15 (1.07) 540 1,332 1,320 (0.03) 16 0.07 10,070 24,843 24,950 (0.08) 17 (0.33) 1,400 3,454 3,250 (0.10) 18 0.11 4,460 11,003 11,100 0.08 19 (0.13) 1,010 2,492 2,100 (0.11)
42,310 104,380 104,380 0.005
SCIOinspire Corp Proprietary & confidential. Copyright 2010
70
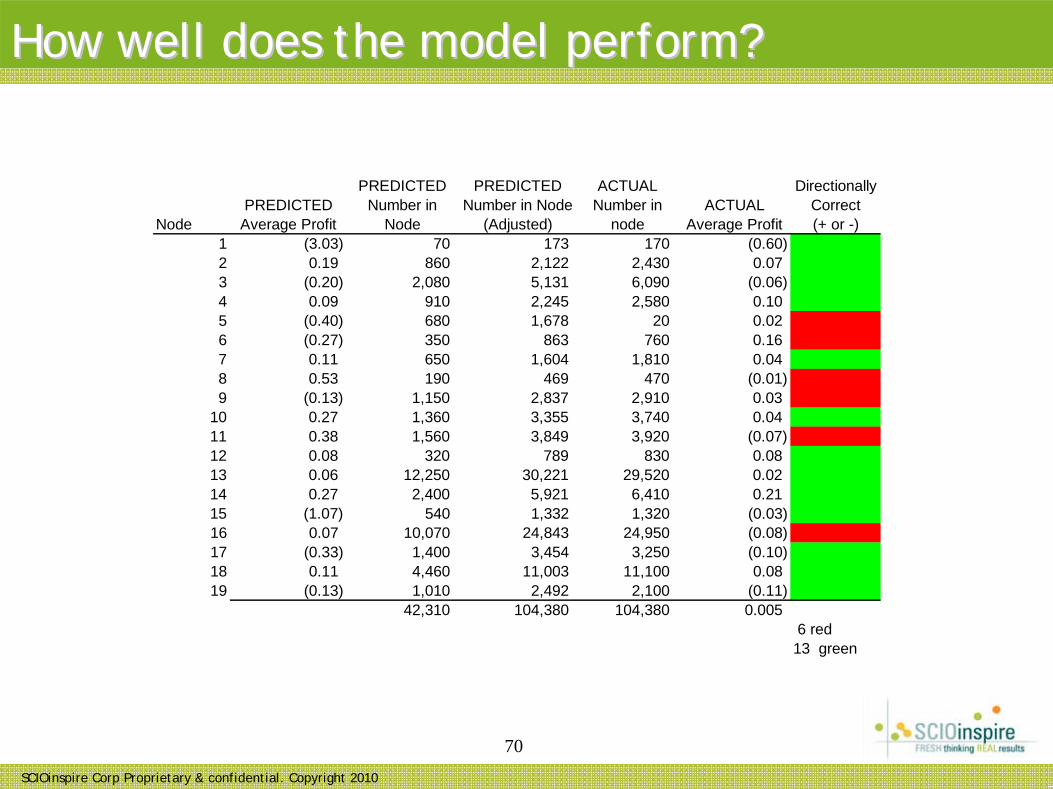
How well does the model perform?How well does the model perform?
NodePREDICTED
Average Profit
PREDICTED Number in
Node
PREDICTED Number in Node
(Adjusted)
ACTUAL Number in
nodeACTUAL
Average Profit
Directionally Correct (+ or -)
1 (3.03) 70 173 170 (0.60) 2 0.19 860 2,122 2,430 0.07 3 (0.20) 2,080 5,131 6,090 (0.06) 4 0.09 910 2,245 2,580 0.10 5 (0.40) 680 1,678 20 0.02 6 (0.27) 350 863 760 0.16 7 0.11 650 1,604 1,810 0.04 8 0.53 190 469 470 (0.01) 9 (0.13) 1,150 2,837 2,910 0.03
10 0.27 1,360 3,355 3,740 0.04 11 0.38 1,560 3,849 3,920 (0.07) 12 0.08 320 789 830 0.08 13 0.06 12,250 30,221 29,520 0.02 14 0.27 2,400 5,921 6,410 0.21 15 (1.07) 540 1,332 1,320 (0.03) 16 0.07 10,070 24,843 24,950 (0.08) 17 (0.33) 1,400 3,454 3,250 (0.10) 18 0.11 4,460 11,003 11,100 0.08 19 (0.13) 1,010 2,492 2,100 (0.11)
42,310 104,380 104,380 0.005 6 red13 green
SCIOinspire Corp Proprietary & confidential. Copyright 2010
71
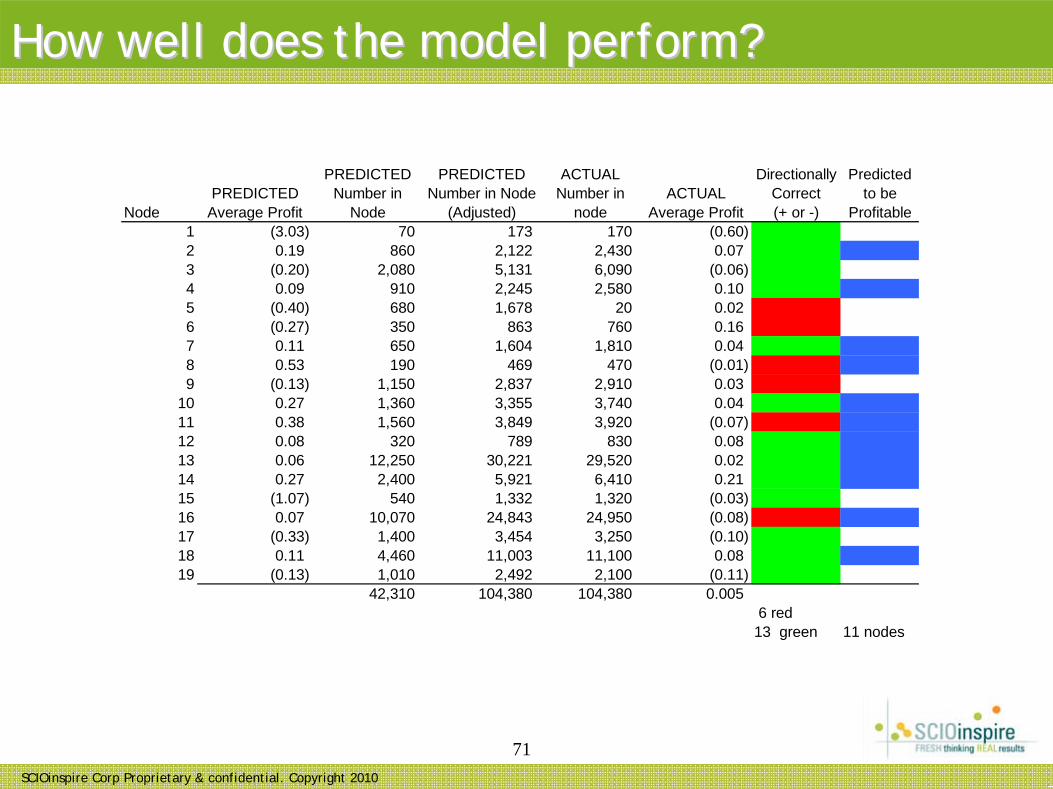
How well does the model perform?How well does the model perform?
NodePREDICTED
Average Profit
PREDICTED Number in
Node
PREDICTED Number in Node
(Adjusted)
ACTUAL Number in
nodeACTUAL
Average Profit
Directionally Correct (+ or -)
Predicted to be
Profitable1 (3.03) 70 173 170 (0.60) 2 0.19 860 2,122 2,430 0.07 3 (0.20) 2,080 5,131 6,090 (0.06) 4 0.09 910 2,245 2,580 0.10 5 (0.40) 680 1,678 20 0.02 6 (0.27) 350 863 760 0.16 7 0.11 650 1,604 1,810 0.04 8 0.53 190 469 470 (0.01) 9 (0.13) 1,150 2,837 2,910 0.03
10 0.27 1,360 3,355 3,740 0.04 11 0.38 1,560 3,849 3,920 (0.07) 12 0.08 320 789 830 0.08 13 0.06 12,250 30,221 29,520 0.02 14 0.27 2,400 5,921 6,410 0.21 15 (1.07) 540 1,332 1,320 (0.03) 16 0.07 10,070 24,843 24,950 (0.08) 17 (0.33) 1,400 3,454 3,250 (0.10) 18 0.11 4,460 11,003 11,100 0.08 19 (0.13) 1,010 2,492 2,100 (0.11)
42,310 104,380 104,380 0.005 6 red13 green 11 nodes
SCIOinspire Corp Proprietary & confidential. Copyright 2010
72
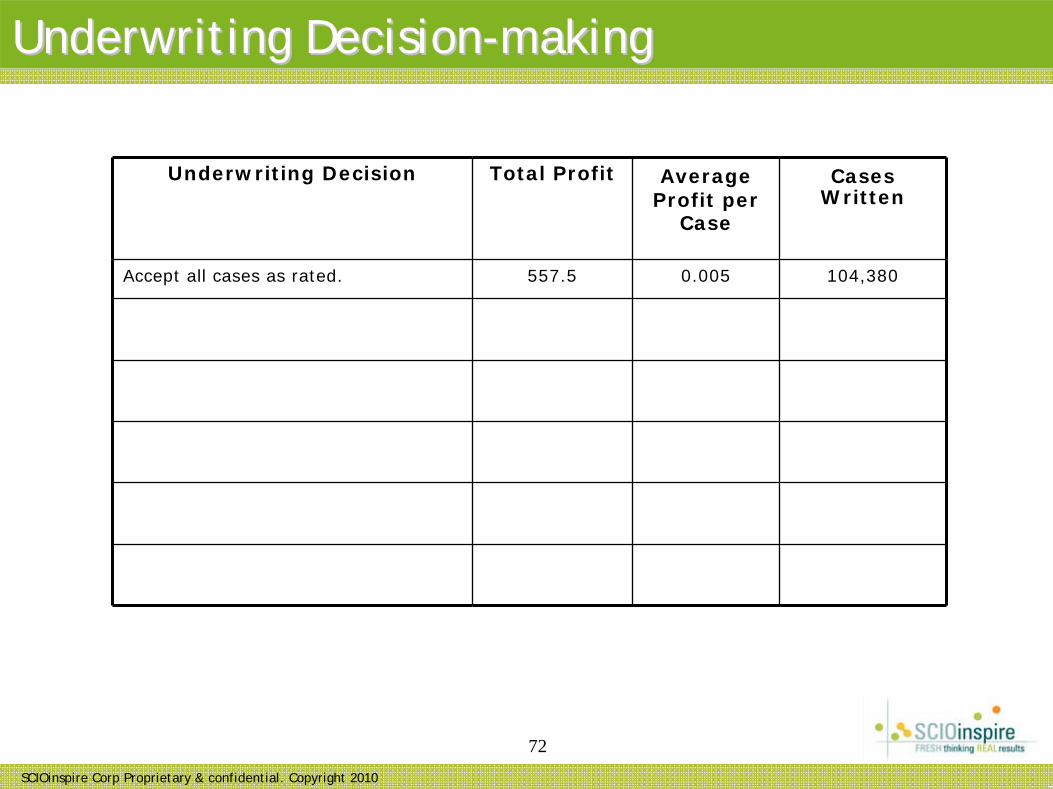
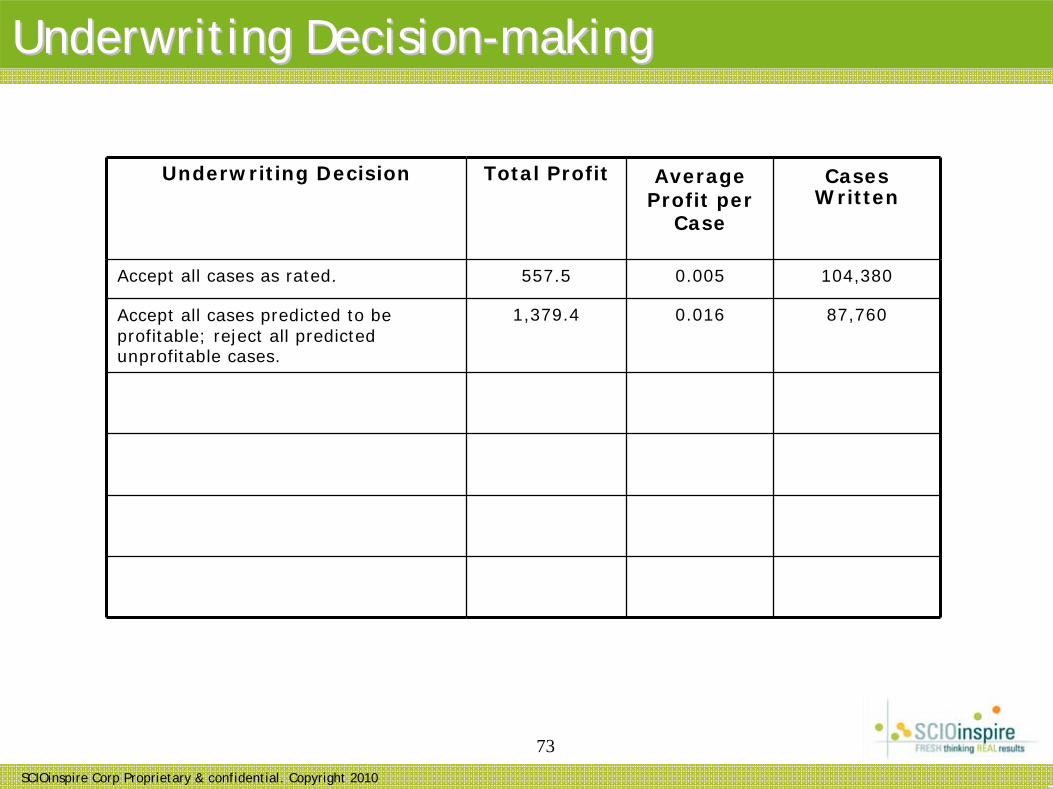
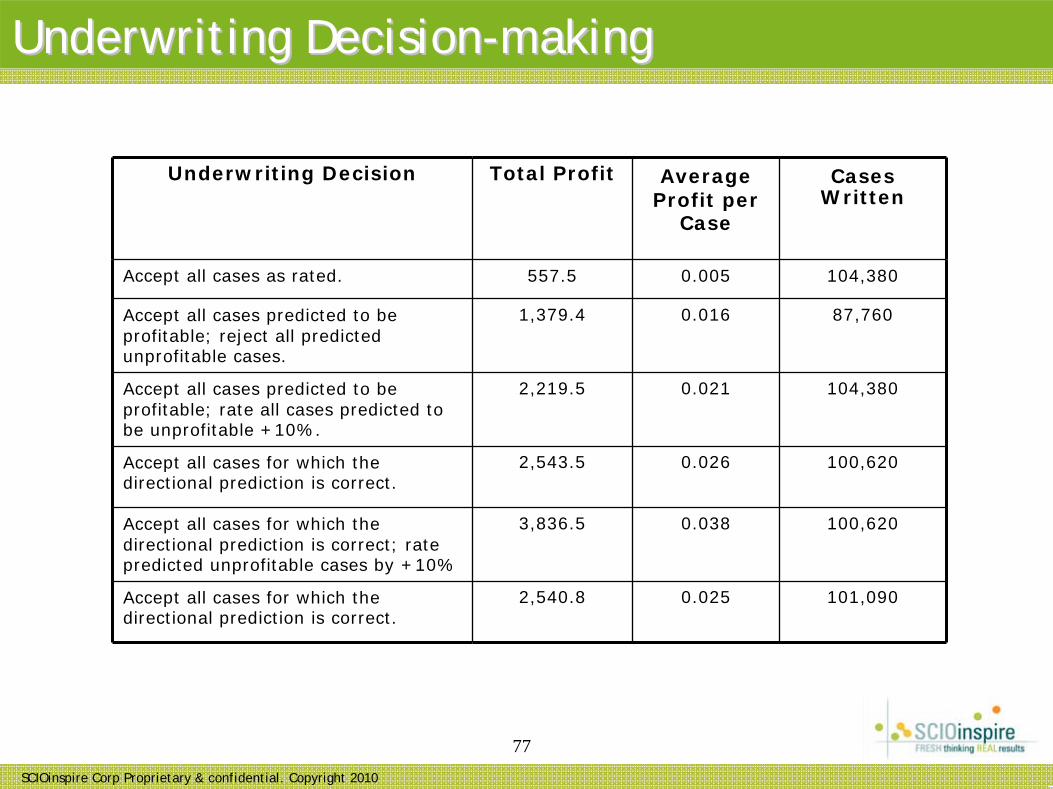
Underwriting DecisionUnderwriting Decision--makingmaking
Underwriting Decision Total Profit Average Profit per
Case
Cases Written
Accept all cases as rated. 557.5 0.005 104,380
SCIOinspire Corp Proprietary & confidential. Copyright 2010
73
Underwriting Decision Total Profit Average Profit per
Case
Cases Written
Accept all cases as rated. 557.5 0.005 104,380
Accept all cases predicted to be profitable; reject all predicted unprofitable cases.
1,379.4 0.016 87,760
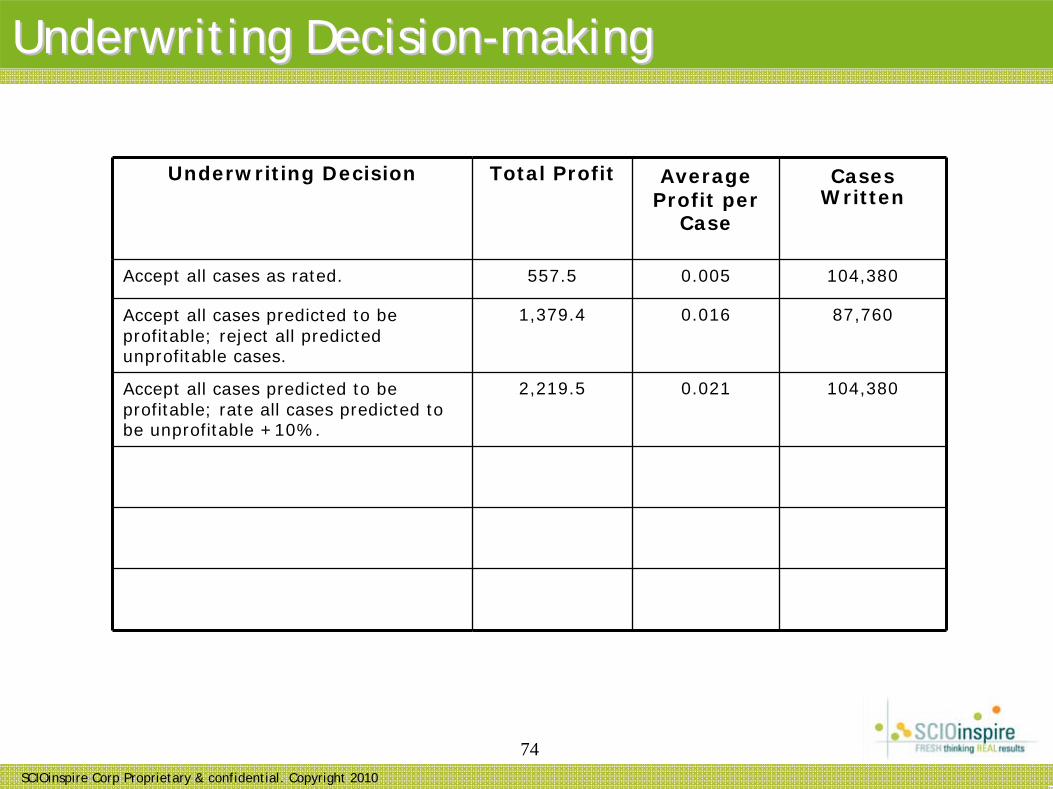
Underwriting DecisionUnderwriting Decision--makingmaking
SCIOinspire Corp Proprietary & confidential. Copyright 2010
74
Underwriting Decision Total Profit Average Profit per
Case
Cases Written
Accept all cases as rated. 557.5 0.005 104,380
Accept all cases predicted to be profitable; reject all predicted unprofitable cases.
1,379.4 0.016 87,760
Accept all cases predicted to be profitable; rate all cases predicted to be unprofitable +10%.
2,219.5 0.021 104,380
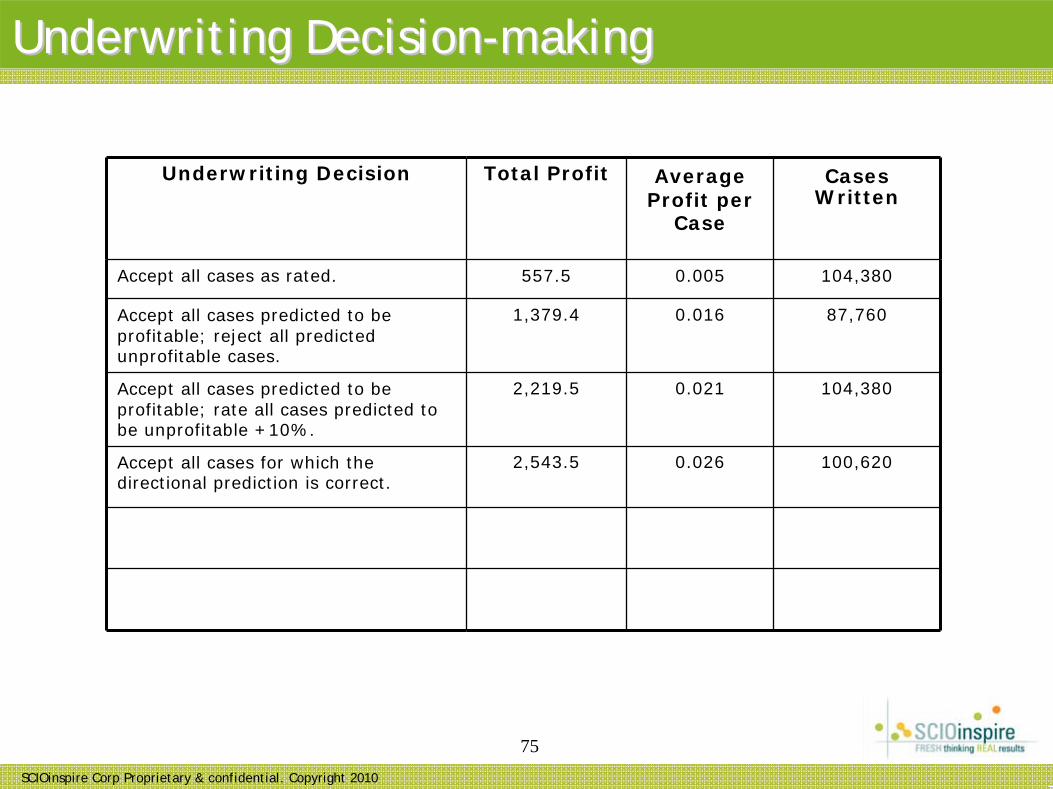
Underwriting DecisionUnderwriting Decision--makingmaking
SCIOinspire Corp Proprietary & confidential. Copyright 2010
75
Underwriting Decision Total Profit Average Profit per
Case
Cases Written
Accept all cases as rated. 557.5 0.005 104,380
Accept all cases predicted to be profitable; reject all predicted unprofitable cases.
1,379.4 0.016 87,760
Accept all cases predicted to be profitable; rate all cases predicted to be unprofitable +10%.
2,219.5 0.021 104,380
Accept all cases for which the directional prediction is correct.
2,543.5 0.026 100,620
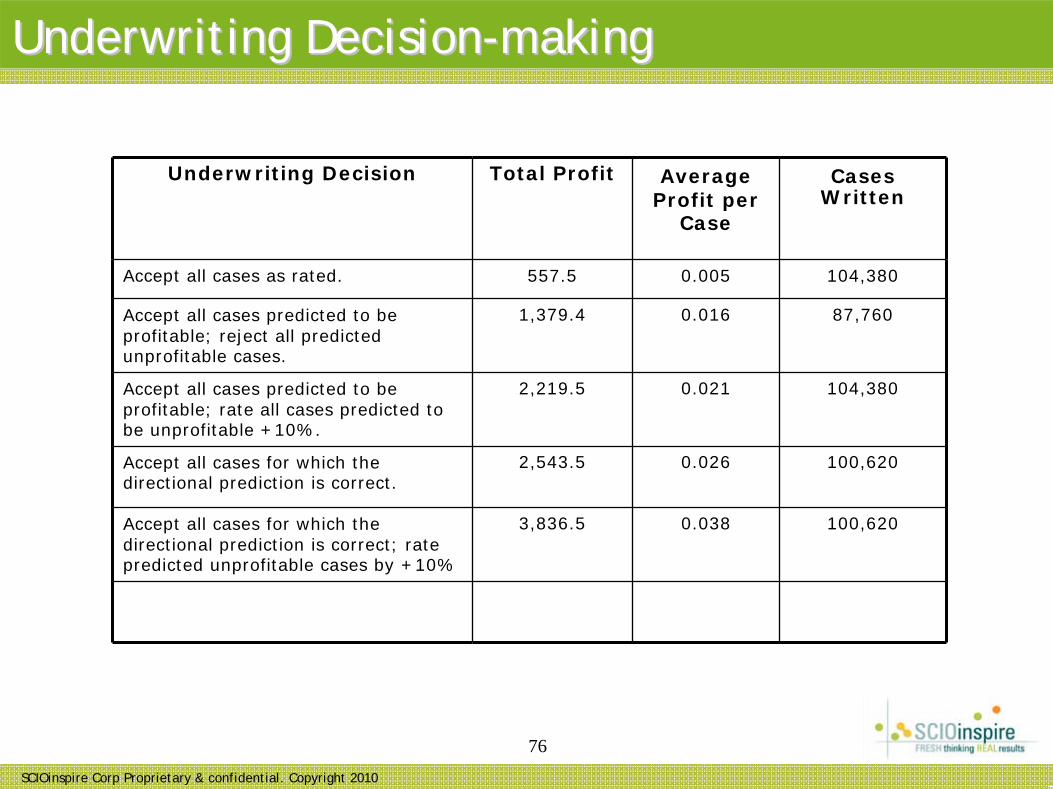
Underwriting DecisionUnderwriting Decision--makingmaking
SCIOinspire Corp Proprietary & confidential. Copyright 2010
76
Underwriting Decision Total Profit Average Profit per
Case
Cases Written
Accept all cases as rated. 557.5 0.005 104,380
Accept all cases predicted to be profitable; reject all predicted unprofitable cases.
1,379.4 0.016 87,760
Accept all cases predicted to be profitable; rate all cases predicted to be unprofitable +10%.
2,219.5 0.021 104,380
Accept all cases for which the directional prediction is correct.
2,543.5 0.026 100,620
Accept all cases for which the directional prediction is correct; rate predicted unprofitable cases by +10%
3,836.5 0.038 100,620
Underwriting DecisionUnderwriting Decision--makingmaking
SCIOinspire Corp Proprietary & confidential. Copyright 2010
77
Underwriting Decision Total Profit Average Profit per
Case
Cases Written
Accept all cases as rated. 557.5 0.005 104,380
Accept all cases predicted to be profitable; reject all predicted unprofitable cases.
1,379.4 0.016 87,760
Accept all cases predicted to be profitable; rate all cases predicted to be unprofitable +10%.
2,219.5 0.021 104,380
Accept all cases for which the directional prediction is correct.
2,543.5 0.026 100,620
Accept all cases for which the directional prediction is correct; rate predicted unprofitable cases by +10%
3,836.5 0.038 100,620
Accept all cases for which the directional prediction is correct.
2,540.8 0.025 101,090
Underwriting DecisionUnderwriting Decision--makingmaking

SCIOinspire Corp Proprietary & confidential. Copyright 2010
78
Example 3: evaluating a highExample 3: evaluating a high--risk modelrisk model
SCIOinspire Corp Proprietary & confidential. Copyright 2010
79
• Large health plan client seeking a model to improve case identification for case management.
• Considered two commercially‐available models:
•
Version 1: vendor’s typical predictive model based on conditions only. Model is more typically used for risk‐adjustment (producing equivalent populations).
•
Version 2: vendor’s high‐risk predictive model that predicts the probability of a member having an event in the next 6‐12 months.
• Client initially rejected model 2 as not adding sufficient value compared with model 1. (Vendor’s pricing strategy was to charge additional fees for model 2) based on cumulative predictions.
BackgroundBackground
SCIOinspire Corp Proprietary & confidential. Copyright 2010
80
0.0% 10.0% 20.0% 30.0% 40.0% 50.0% 60.0% 70.0% 80.0% 90.0%
100.0%
99 96 93 90 87 84 81 78 75 72 69 66 63 60 57 54 51 48 45 42 39 36 33 30 27 24 21 18 15 12 9 6 3 0
Model Percentile
Percent of Members w/ Hospitalization Identified
Model 2 Model 1
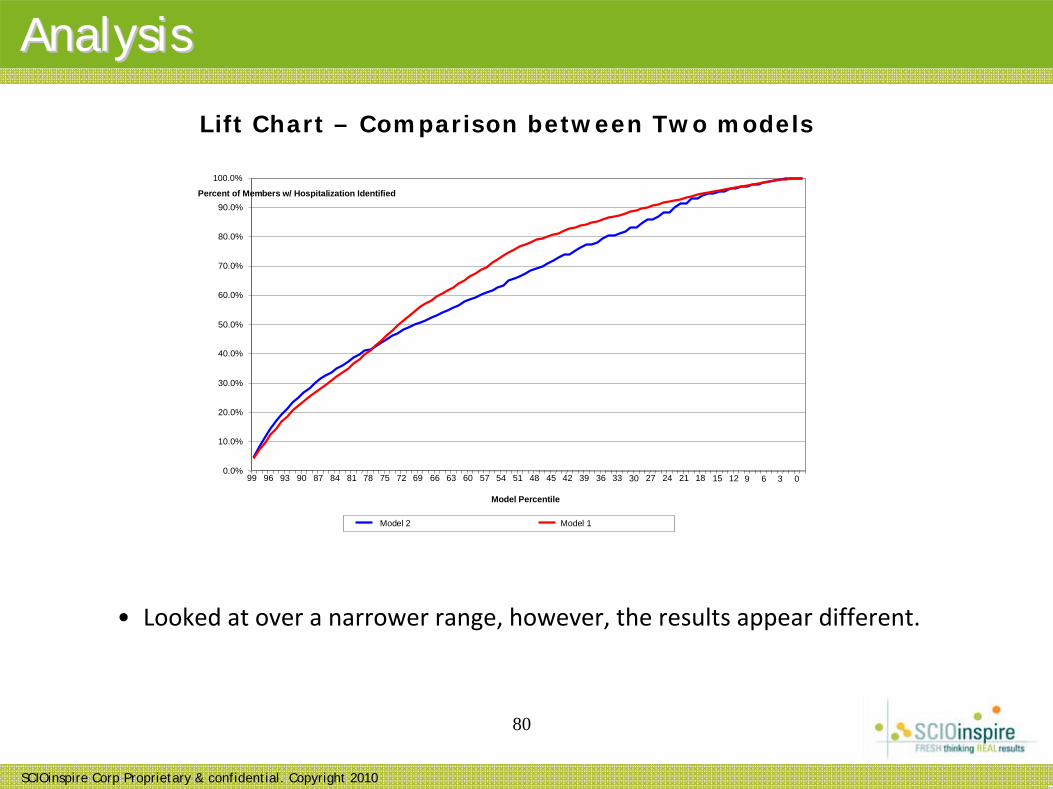
Lift Chart – Comparison between Two models
AnalysisAnalysis
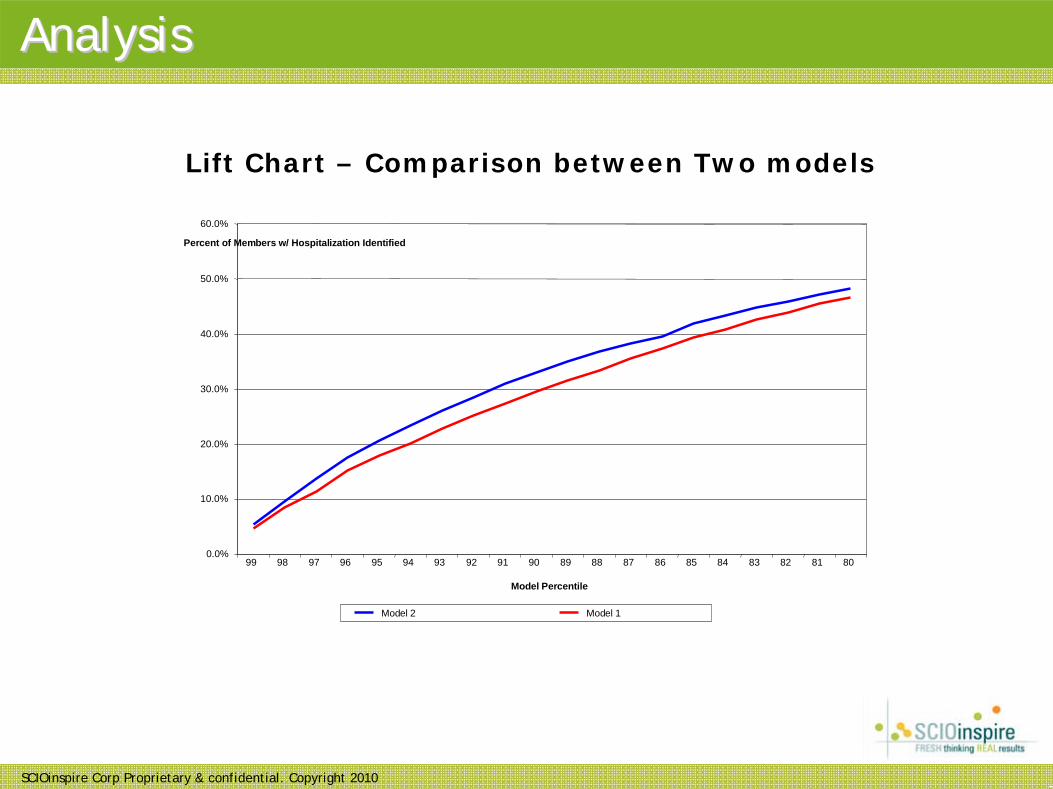
• Looked at over a narrower range, however, the results appear different.
SCIOinspire Corp Proprietary & confidential. Copyright 2010
0.0%
10.0%
20.0%
30.0%
40.0%
50.0%
60.0%
99 98 97 96 95 94 93 92 91 90 89 88 87 86 85 84 83 82 81 80
Model Percentile
Percent of Members w/ Hospitalization Identified
Model 2 Model 1
Lift Chart – Comparison between Two models
AnalysisAnalysis
SCIOinspire Corp Proprietary & confidential. Copyright 2010
82
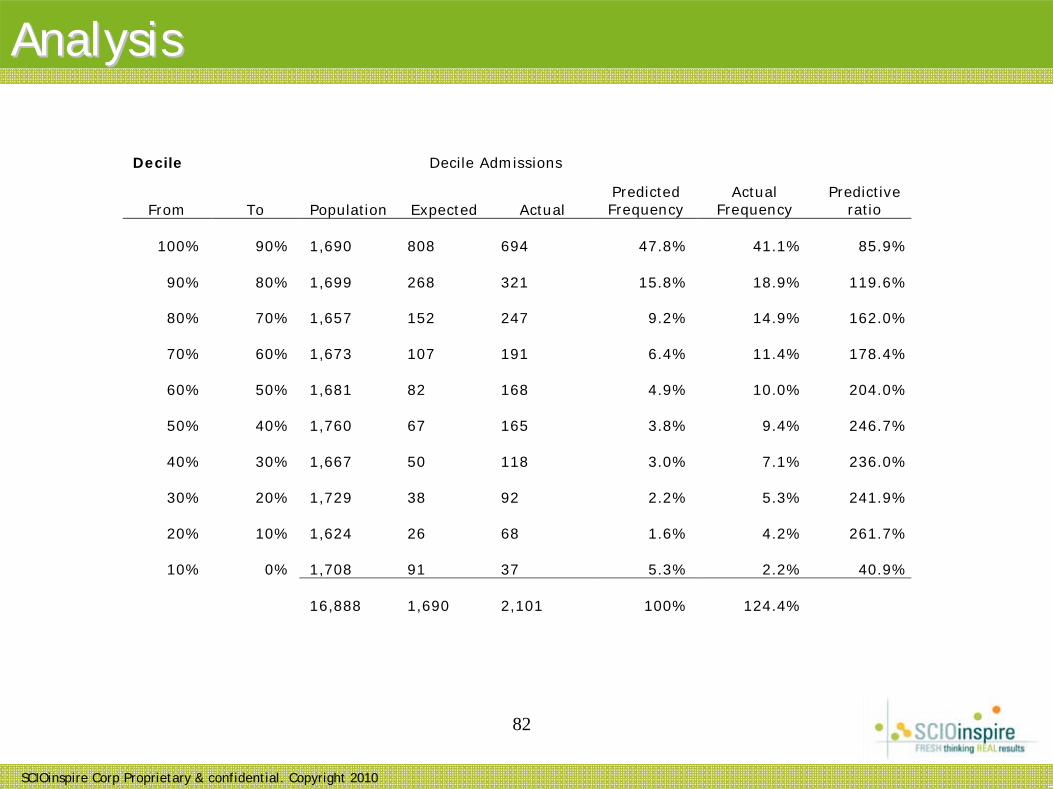
AnalysisAnalysis
Decile Decile Admissions
From To Population Expected Actual Predicted Frequency
Actual Frequency
Predictive ratio
100% 90% 1,690
808
694 47.8% 41.1% 85.9%
90% 80% 1,699
268
321 15.8% 18.9% 119.6%
80% 70% 1,657
152
247 9.2% 14.9% 162.0%
70% 60% 1,673
107
191 6.4% 11.4% 178.4%
60% 50% 1,681
82
168 4.9% 10.0% 204.0%
50% 40% 1,760
67
165 3.8% 9.4% 246.7%
40% 30% 1,667
50
118 3.0% 7.1% 236.0%
30% 20% 1,729
38
92 2.2% 5.3% 241.9%
20% 10% 1,624
26
68 1.6% 4.2% 261.7%
10% 0% 1,708
91
37 5.3% 2.2% 40.9%
16,888
1,690
2,101 100% 124.4%
SCIOinspire Corp Proprietary & confidential. Copyright 2010
83
Example 4: Provider EvaluationExample 4: Provider Evaluation
SCIOinspire Corp Proprietary & confidential. Copyright 2010
84
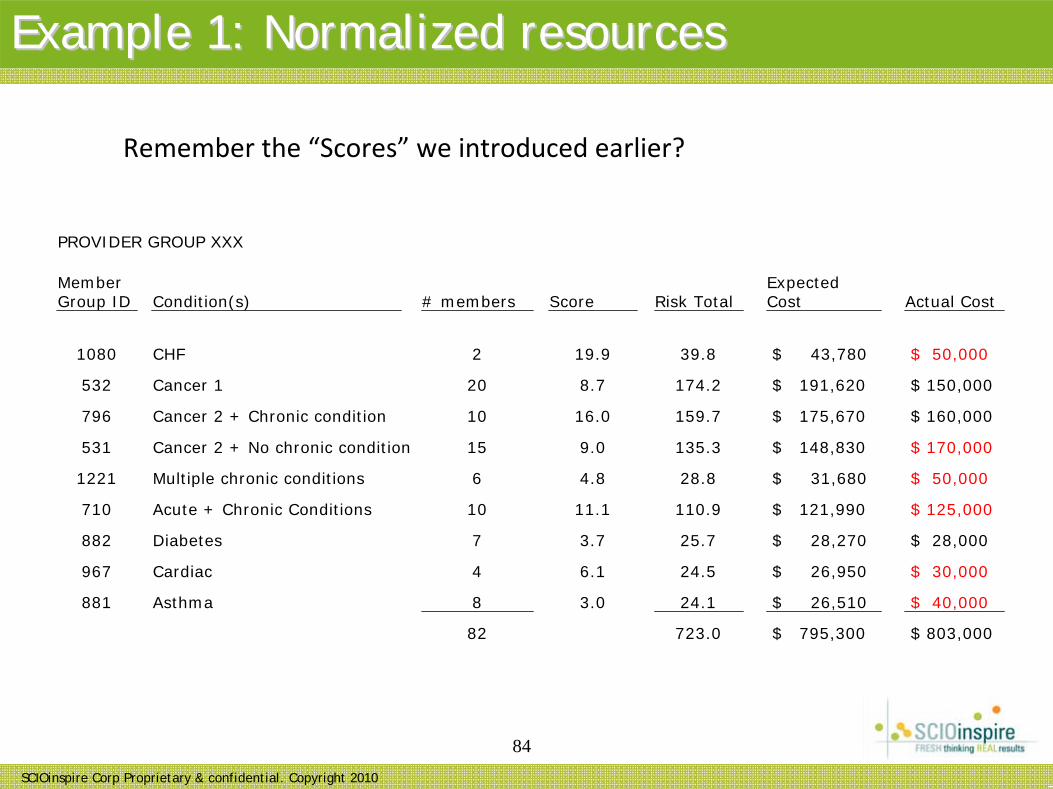
Example 1: Normalized resourcesExample 1: Normalized resources
Remember the “Scores” we introduced earlier?
PROVIDER GROUP XXX
Member Group ID Condition(s) # members Score Risk Total
Expected Cost Actual Cost
1080 CHF 2 19.9 39.8 $ 43,780 $ 50,000
532 Cancer 1 20 8.7 174.2 $ 191,620 $ 150,000
796 Cancer 2 + Chronic condition 10 16.0 159.7 $ 175,670 $ 160,000
531 Cancer 2 + No chronic condition 15 9.0 135.3 $ 148,830 $ 170,000
1221 Multiple chronic conditions 6 4.8 28.8 $ 31,680 $ 50,000
710 Acute + Chronic Conditions 10 11.1 110.9 $ 121,990 $ 125,000
882 Diabetes 7 3.7 25.7 $ 28,270 $ 28,000
967 Cardiac 4 6.1 24.5 $ 26,950 $ 30,000
881 Asthma 8 3.0 24.1 $ 26,510 $ 40,000
82 723.0 $ 795,300 $ 803,000
SCIOinspire Corp Proprietary & confidential. Copyright 2010
85
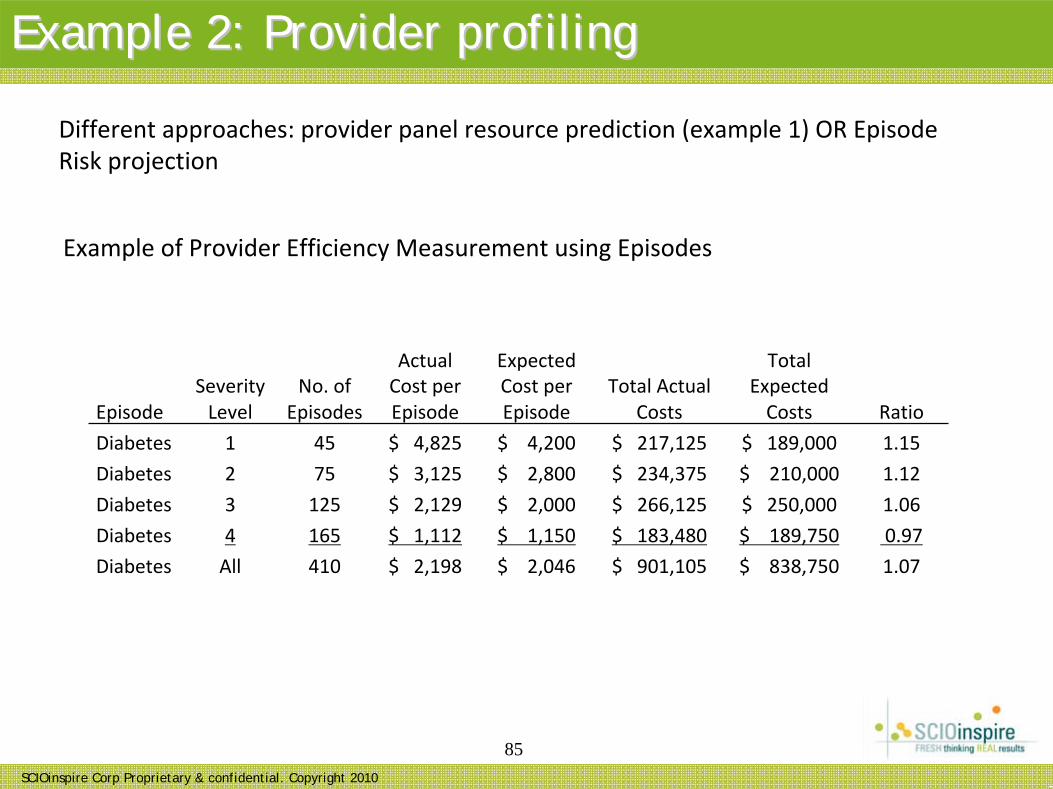
Example 2: Provider profilingExample 2: Provider profiling
Different approaches: provider panel resource prediction (example 1) OR Episode Risk projection
EpisodeSeverity Level
No. of Episodes
Actual Cost per Episode
Expected Cost per Episode
Total Actual Costs
Total Expected Costs Ratio
Diabetes 1 45 $ 4,825 $ 4,200 $ 217,125 $ 189,000 1.15
Diabetes 2 75 $ 3,125 $ 2,800 $ 234,375 $ 210,000 1.12
Diabetes 3 125 $ 2,129 $ 2,000 $ 266,125 $ 250,000 1.06
Diabetes 4 165 $ 1,112 $ 1,150 $ 183,480 $ 189,750 0.97
Diabetes All 410 $ 2,198 $ 2,046 $ 901,105 $ 838,750 1.07
Example of Provider Efficiency Measurement using Episodes
SCIOinspire Corp Proprietary & confidential. Copyright 2010
86
Example 3: Program EvaluationExample 3: Program Evaluation
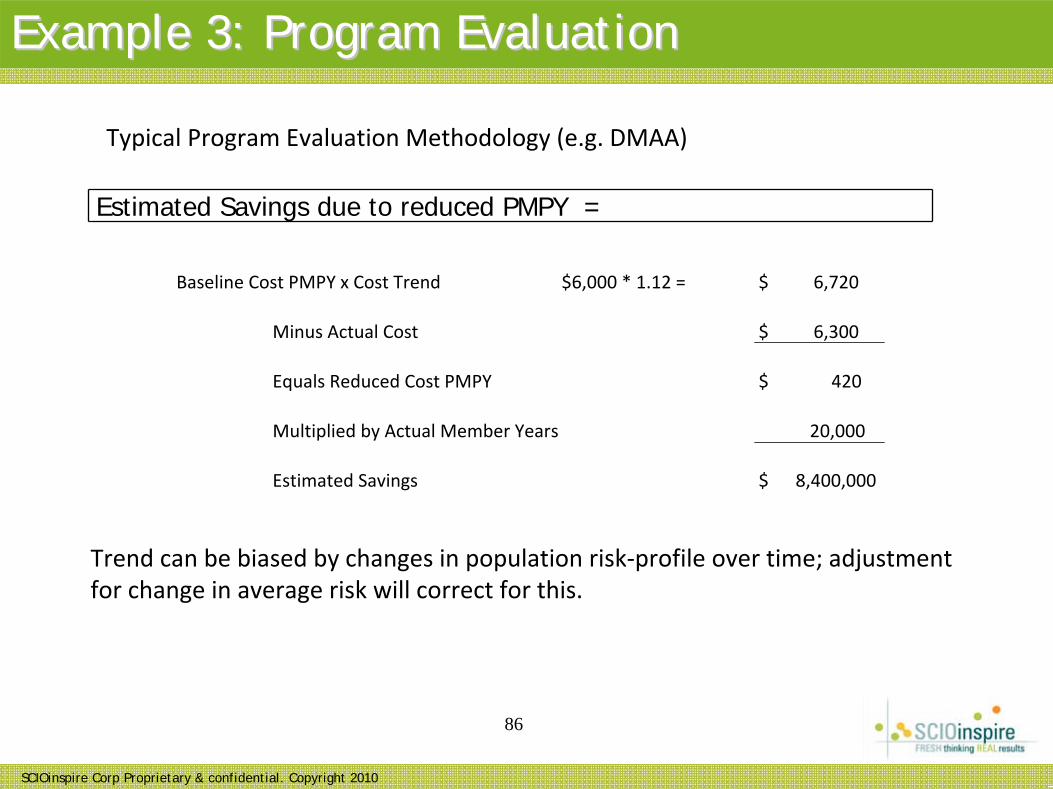
Estimated Savings due to reduced PMPY =
Typical Program Evaluation Methodology (e.g. DMAA)
Trend can be biased by changes in population risk‐profile over time; adjustment for change in average risk will correct for this.
Baseline Cost PMPY x Cost Trend $6,000 * 1.12 = $ 6,720
Minus Actual Cost $ 6,300
Equals Reduced Cost PMPY $ 420
Multiplied by Actual Member Years 20,000
Estimated Savings $ 8,400,000
SCIOinspire Corp Proprietary & confidential. Copyright 2010
87
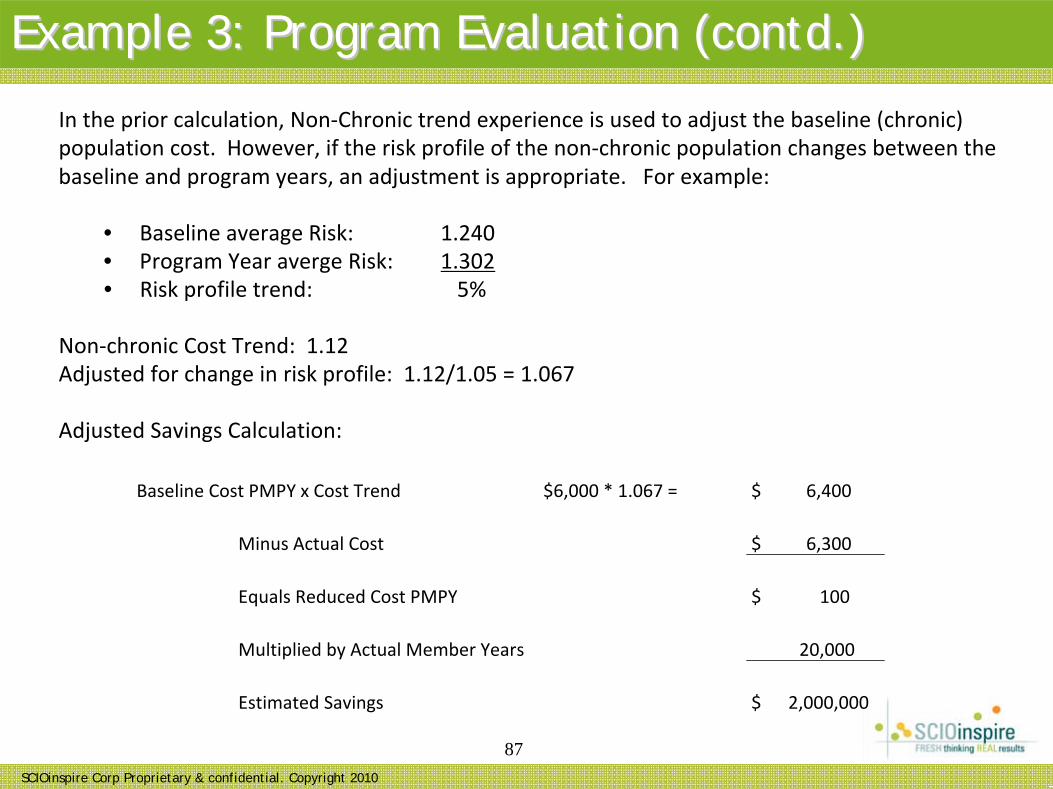
Example 3: Program Evaluation (contd.)Example 3: Program Evaluation (contd.)
In the prior calculation, Non‐Chronic trend experience is used to adjust the baseline (chronic) population cost. However, if the risk profile of the non‐chronic population changes between the baseline and program years, an adjustment is appropriate. For example:
• Baseline average Risk: 1.240• Program Year averge Risk: 1.302 • Risk profile trend: 5%
Non‐chronic Cost Trend: 1.12Adjusted for change in risk profile: 1.12/1.05 = 1.067
Adjusted Savings Calculation:
Baseline Cost PMPY x Cost Trend $6,000 * 1.067 = $ 6,400
Minus Actual Cost $ 6,300
Equals Reduced Cost PMPY $ 100
Multiplied by Actual Member Years 20,000
Estimated Savings $ 2,000,000
SCIOinspire Corp Proprietary & confidential. Copyright 2010
88
Example 5: A wellness predictive modelExample 5: A wellness predictive model
SCIOinspire Corp Proprietary & confidential. Copyright 2010
89
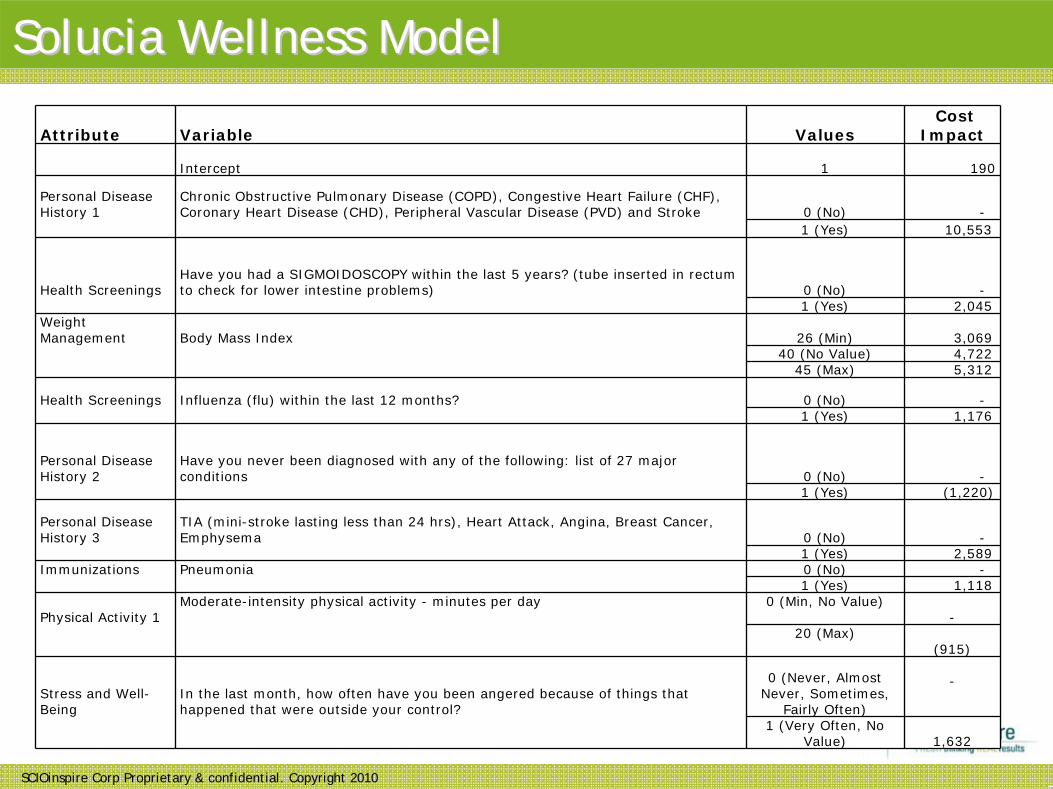
SoluciaSolucia Wellness ModelWellness Model
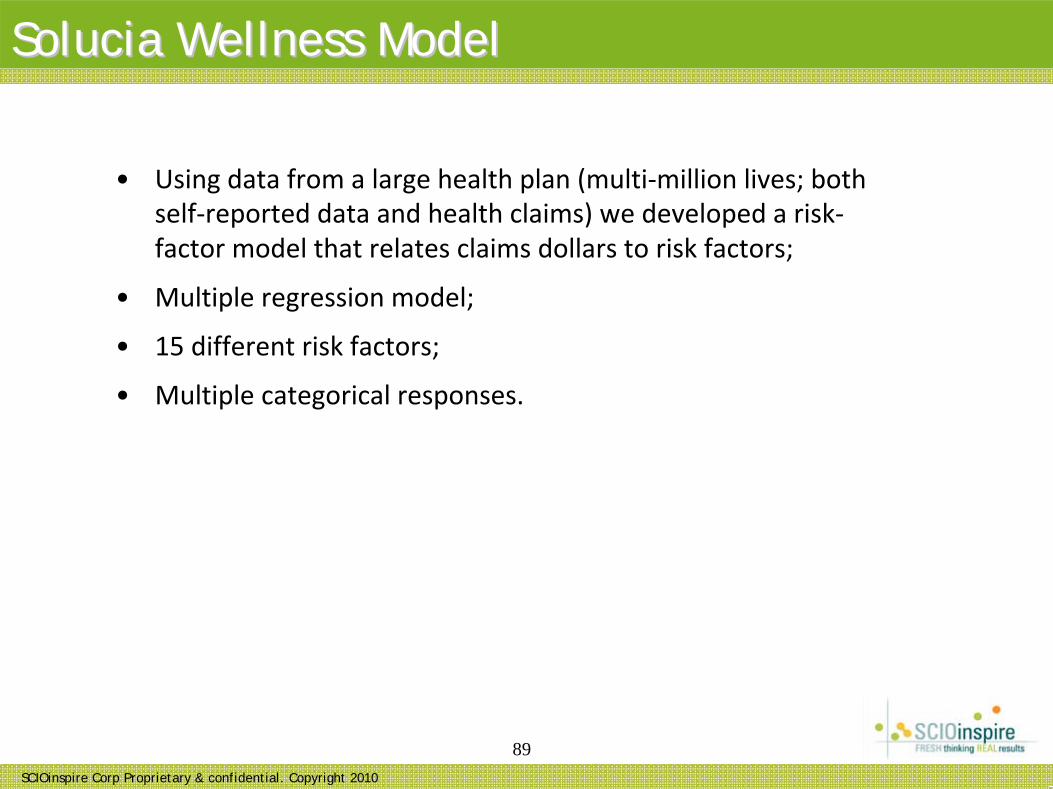
• Using data from a large health plan (multi‐million lives; both self‐reported data and health claims) we developed a risk‐ factor model that relates claims dollars to risk factors;
• Multiple regression model;
• 15 different risk factors;
• Multiple categorical responses.
SCIOinspire Corp Proprietary & confidential. Copyright 2010
90
SoluciaSolucia Wellness ModelWellness Model
Attribute Variable ValuesCost
Impact
Intercept 1 190
Personal Disease History 1
Chronic Obstructive Pulmonary Disease (COPD), Congestive Heart Failure (CHF), Coronary Heart Disease (CHD), Peripheral Vascular Disease (PVD) and Stroke 0 (No) -
1 (Yes) 10,553
Health ScreeningsHave you had a SIGMOIDOSCOPY within the last 5 years? (tube inserted in rectum to check for lower intestine problems) 0 (No) -
1 (Yes) 2,045 Weight Management Body Mass Index 26 (Min) 3,069
40 (No Value) 4,722 45 (Max) 5,312
Health Screenings Influenza (flu) within the last 12 months? 0 (No) -1 (Yes) 1,176
Personal Disease History 2
Have you never been diagnosed with any of the following: list of 27 major conditions 0 (No) -
1 (Yes) (1,220)
Personal Disease History 3
TIA (mini-stroke lasting less than 24 hrs), Heart Attack, Angina, Breast Cancer, Emphysema 0 (No) -
1 (Yes) 2,589 Immunizations Pneumonia 0 (No) -
1 (Yes) 1,118
Physical Activity 1Moderate-intensity physical activity - minutes per day 0 (Min, No Value)
-20 (Max)
(915)
Stress and Well- Being
In the last month, how often have you been angered because of things that happened that were outside your control?
0 (Never, Almost Never, Sometimes,
Fairly Often)
-
1 (Very Often, No Value) 1,632
SCIOinspire Corp Proprietary & confidential. Copyright 2010
91
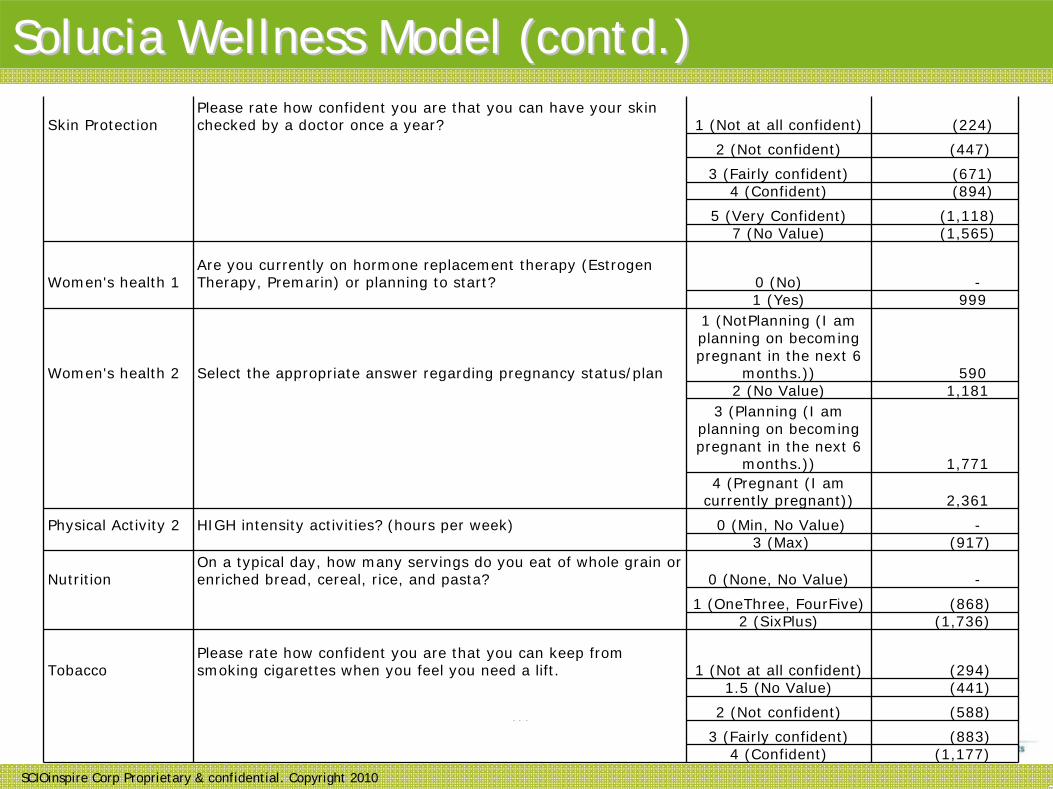
Skin ProtectionPlease rate how confident you are that you can have your skin checked by a doctor once a year? 1 (Not at all confident) (224)
2 (Not confident) (447)
3 (Fairly confident) (671)4 (Confident) (894)
5 (Very Confident) (1,118)7 (No Value) (1,565)
Women's health 1Are you currently on hormone replacement therapy (Estrogen Therapy, Premarin) or planning to start? 0 (No) -
1 (Yes) 999
Women's health 2 Select the appropriate answer regarding pregnancy status/plan
1 (NotPlanning (I am planning on becoming pregnant in the next 6
months.)) 590 2 (No Value) 1,181
3 (Planning (I am planning on becoming pregnant in the next 6
months.)) 1,771 4 (Pregnant (I am
currently pregnant)) 2,361
Physical Activity 2 HIGH intensity activities? (hours per week) 0 (Min, No Value) -3 (Max) (917)
NutritionOn a typical day, how many servings do you eat of whole grain or enriched bread, cereal, rice, and pasta? 0 (None, No Value) -
1 (OneThree, FourFive) (868)2 (SixPlus) (1,736)
Tobacco Please rate how confident you are that you can keep from smoking cigarettes when you feel you need a lift. 1 (Not at all confident) (294)
1.5 (No Value) (441)
2 (Not confident) (588)
3 (Fairly confident) (883)4 (Confident) (1,177)
Solucia Wellness Model (contd.)Solucia Wellness Model (contd.)

SCIOinspire Corp Proprietary & confidential. Copyright 2010
92
Discussion
SCIOinspire Corp Proprietary & confidential. Copyright 2010
93
Selected referencesSelected references
This is not an exhaustive bibliography. It is only a starting point for explorations.
Shapiro, A.F. and Jain, L.C. (editors); Intelligent and Other Computational Techniques in Insurance; World Scientific Publishing Company; 2003.
Dove, Henry G., Duncan, Ian, and Robb, Arthur; A Prediction Model for Targeting Low‐Cost, High‐Risk Members of Managed Care Organizations; The American Journal of Managed Care, Vol 9 No 5, 2003
Berry, Michael J. A. and Linoff, Gordon; Data Mining Techniques for Marketing, Sales and Customer Support; John Wiley and Sons, Inc; 2004
Montgomery, Douglas C., Peck, Elizabeth A., and Vining, G Geoffrey; Introduction to Linear Regression Analysis; John Wiley and Sons, Inc; 2001
Kahneman, Daniel, Slovic, Paul, and Tversky (editors); Judgment under uncertainty: Heuristics and Biases; Cambridge University Press; 1982
SCIOinspire Corp Proprietary & confidential. Copyright 2010
94
Dove, Henry G., Duncan, Ian, and others; Evaluating the Results of Care Management Interventions: Comparative Analysis of Different Outcomes Measures. The SOA study of DM evaluation, available on the web‐site at
http://www.soa.org/professional‐interests/health/hlth‐evaluating‐the‐results‐ of‐care‐management‐interventions‐comparative‐analysis‐of‐different‐ outcomes‐measures‐claims.aspx
Winkelman R. and S. Ahmed. A comparative analysis of Claims Based Methods of health risk assessment for Commercial Populations. (2007 update to the SOA Risk‐Adjuster study.) Available from the SOA; the 2002 study is on the website at: http://www.soa.org/files/pdf/_asset_id=2583046.pdf
Iezzoni, L.I. Risk Adjustment for Measuring Healthcare Outcomes. 3rd Ed. Health Administration Press, 2002.
Duncan, I. Healthcare Risk Adjustment and Predictive Modeling. Actex Publishers (forthcoming) 2010.
Selected references (contd.)Selected references (contd.)
SCIOinspire Corp Proprietary & confidential. Copyright 2010
95
Further Questions?Further Questions?
Solucia Consulting, A SCIOinspire Company220 Farmington Avenue, Suite 4Farmington, CT 06032
860‐676‐8808
www.soluciaconsulting.com